UNITED STATES
SECURITIES AND EXCHANGE COMMISSION
Washington, D.C. 20549
FORM N-CSR
CERTIFIED SHAREHOLDER REPORT OF REGISTERED MANAGEMENT INVESTMENT COMPANIES
| | |
| Investment Company Act file number: | | 811-07343 |
| |
| Exact name of registrant as specified in charter: | | The Prudential Investment Portfolios, Inc. |
| |
| Address of principal executive offices: | | 655 Broad Street, 6th Floor |
| | Newark, New Jersey 07102 |
| |
| Name and address of agent for service: | | Andrew R. French |
| | 655 Broad Street, 6th Floor |
| | Newark, New Jersey 07102 |
| |
| Registrant’s telephone number, including area code: | | 800-225-1852 |
| |
| Date of fiscal year end: | | 9/30/2023 |
| |
| Date of reporting period: | | 9/30/2023 |
Item 1 – Reports to Stockholders

PGIM BALANCED FUND
ANNUAL REPORT
SEPTEMBER 30, 2023

To enroll in e-delivery, go to pgim.com/investments/resource/edelivery
Table of Contents
This report is not authorized for distribution to prospective investors unless preceded or accompanied by a current prospectus.
The views expressed in this report and information about the Fund’s portfolio holdings are for the period covered by this report and are subject to change thereafter.
Mutual funds are distributed by Prudential Investment Management Services LLC, a Prudential Financial company and member SIPC. PGIM Fixed Income is a unit of PGIM, Inc. (PGIM), a registered investment adviser and Prudential Financial company. PGIM Quantitative Solutions LLC, a wholly owned subsidiary of PGIM, Inc. (PGIM), is a registered investment adviser and Prudential Financial company. © 2023 Prudential Financial, Inc. and its related entities. PGIM and the PGIM logo are service marks of Prudential Financial, Inc. and its related entities, registered in many jurisdictions worldwide.
2 Visit our website at pgim.com/investments
Letter from the President
| | |
 | | Dear Shareholder: We hope you find the annual report for the PGIM Balanced Fund informative and useful. The report covers performance for the 12-month period that ended September 30, 2023. Although central banks raised interest rates aggressively to tame surging inflation during the period, the global economy and financial markets demonstrated resilience. Employers continued hiring, consumers continued spending, home prices rose, and recession fears receded. |
Early in the period, stocks began a rally that eventually ended a bear market and continued to rise globally for much of 2023 as inflation cooled and the Federal Reserve (the Fed) slowed the pace of its rate hikes. However, stocks declined in September when the Fed signaled that rates may remain elevated longer than investors had expected. For the entire period, equities in both US and international markets posted gains.
Bond markets benefited during the period as the Fed moderated its rate-hiking cycle, and the higher level of interest rates offered investors an additional cushion from fixed income volatility. US and global investment-grade bonds posted small gains for the overall period, while US high yield corporate bonds and emerging-market debt rose by double digits.
Regarding your investments with PGIM, we believe it is important to maintain a diversified portfolio of funds consistent with your tolerance for risk, time horizon, and financial goals. Your financial advisor can help you create a diversified investment plan that may include funds covering all the basic asset classes and that reflects your personal investor profile and risk tolerance. However, diversification and asset allocation strategies do not assure a profit or protect against loss in declining markets.
At PGIM Investments, we provide access to active investment strategies across the global markets in the pursuit of consistent outperformance for investors. PGIM is the world’s 14th-largest investment manager with more than $1.3 trillion in assets under management. Our scale and investment expertise allow us to deliver a diversified suite of actively managed solutions across a broad spectrum of asset classes and investment styles.
Thank you for choosing our family of funds.
Sincerely,

Stuart S. Parker, President
PGIM Balanced Fund
November 15, 2023
PGIM Balanced Fund 3
Your Fund’s Performance (unaudited)
Performance data quoted represent past performance. Past performance does not guarantee future results. The investment return and principal value of an investment will fluctuate so that an investor’s shares, when redeemed, may be worth more or less than their original cost. Current performance may be lower or higher than the past performance data quoted. An investor may obtain performance data as of the most recent month-end by visiting our website at pgim.com/investments or by calling (800) 225-1852.
| | | | | | | | | | | | | | | | |
| |
| | | Average Annual Total Returns as of 9/30/23 | |
| | | | |
| | | One Year (%) | | | Five Years (%) | | | Ten Years (%) | | | Since Inception (%) | |
| | | | |
Class A | | | | | | | | | | | | | | | | |
| | | | |
(with sales charges) | | | 9.16 | | | | 3.07 | | | | 5.78 | | | | — | |
| | | | |
(without sales charges) | | | 12.83 | | | | 3.75 | | | | 6.13 | | | | — | |
| | | | |
Class C | | | | | | | | | | | | | | | | |
| | | | |
(with sales charges) | | | 10.89 | | | | 2.96 | | | | 5.35 | | | | — | |
| | | | |
(without sales charges) | | | 11.89 | | | | 2.96 | | | | 5.35 | | | | — | |
| | | | |
Class R | | | | | | | | | | | | | | | | |
| | | | |
(without sales charges) | | | 12.37 | | | | 3.28 | | | | 5.76 | | | | — | |
| | | | |
Class Z | | | | | | | | | | | | | | | | |
| | | | |
(without sales charges) | | | 13.02 | | | | 4.00 | | | | 6.41 | | | | — | |
| | | | |
Class R6 | | | | | | | | | | | | | | | | |
| | | | |
(without sales charges) | | | 13.24 | | | | 4.12 | | | | N/A | | | | 4.57 (11/28/2017) | |
| | | | |
Customized Blend Index | | | | | | | | | | | | | | | | |
| | | | |
| | | 12.44 | | | | 5.14 | | | | 6.55 | | | | — | |
| | | | |
Bloomberg US Aggregate Bond Index | | | | | | | | | | | | | | | | |
| | | | |
| | | 0.64 | | | | 0.10 | | | | 1.13 | | | | — | |
| | | | |
S&P 500 Index | | | | | | | | | | | | | | | | |
| | | | |
| | | | 21.62 | | | | 9.92 | | | | 11.91 | | | | — | |
| | |
|
| Average Annual Total Returns as of 9/30/23 Since Inception (%) |
| |
| | | Class R6 (11/28/2017) |
| |
Customized Blend Index | | 5.27 |
| |
Bloomberg US Aggregate Bond Index | | -0.11 |
| |
S&P 500 Index | | 10.53 |
Since Inception returns are provided for any share class with less than 10 fiscal years of returns. Since Inception returns for the Indexes are measured from the closest month-end to the class’s inception date.
4 Visit our website at pgim.com/investments
Growth of a $10,000 Investment (unaudited)
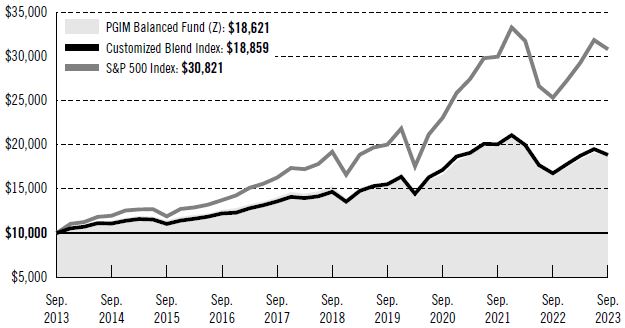
The graph compares a $10,000 investment in the Fund’s Class Z shares with a similar investment in the Customized Blend Index and the S&P 500 Index by portraying the initial account values at the beginning of the 10-year period (September 30, 2013) and the account values at the end of the current fiscal year (September 30, 2023), as measured on a quarterly basis. For purposes of the graph, and unless otherwise indicated, it has been assumed that (a) all recurring fees (including management fees) were deducted and (b) all dividends and distributions were reinvested. The line graph provides information for Class Z shares only. As indicated in the tables provided earlier, performance for other share classes will vary due to the differing fees and expenses applicable to each share class (as indicated in the following paragraphs). Without waiver of fees and/or expense reimbursements, if any, the returns would have been lower.
Past performance does not predict future performance. Total returns and the ending account values in the graph include changes in share price and reinvestment of dividends and capital gains distributions in a hypothetical investment for the periods shown. The Fund’s total returns do not reflect the deduction of income taxes on an individual’s investment. Taxes may reduce your actual investment returns on income or gains paid by the Fund or any gains you may realize if you sell your shares.
PGIM Balanced Fund 5
Your Fund’s Performance (continued)
The returns in the tables do not reflect the deduction of taxes that a shareholder would pay on Fund distributions or following the redemption of Fund shares. The average annual total returns take into account applicable sales charges, which are described for each share class in the table below.
| | | | | | | | | | |
| | | | | | |
| | | Class A | | Class C | | Class R | | Class Z | | Class R6 |
| | | | | | |
| Maximum initial sales charge | | 3.25% of the public offering price | | None | | None | | None | | None |
| Contingent deferred sales charge (CDSC) (as a percentage of the lower of the original purchase price or the net asset value at redemption) | | 1.00% on sales of $500,000 or more made within 12 months of purchase | | 1.00% on sales made within 12 months of purchase | | None | | None | | None |
| Annual distribution and service (12b-1) fees (shown as a percentage of average daily net assets) | | 0.30% | | 1.00% | | 0.75% (0.50% currently) | | None | | None |
Benchmark Definitions
Customized Blend Index*—The Customized Blend Index is unmanaged and intended to provide a theoretical comparison to the Fund’s performance based on the amounts allocated to each asset class. S&P 500 Index (44%) provides a broad indicator of domestic stock price movements in large-cap stocks; Bloomberg US Aggregate Bond Index (40%) includes investment-grade securities issued by the US government, its agencies, and by corporations with between 1 and 10 years remaining to maturity; Russell 2000 Index (4%) contains the 2,000 smallest US companies included in the Russell 3000 Index, which gives a broad look at how stock prices of smaller companies have performed; and MSCI ACWI ex US Index (12%) is a stock market index comprising of non-US stocks from 22 developed markets and 24 emerging markets.
Note: Prior to February 3, 2020, the Customized Blend Index consisted of the S&P 500 Index (50%), the Bloomberg US Aggregate Bond Index (40%), the Russell 2000 Index (5%), and the MSCI Europe, Australasia and Far East (EAFE) Net Dividend (ND) Index (5%).
Bloomberg US Aggregate Bond Index—The Bloomberg US Aggregate Bond Index is unmanaged and represents securities that are taxable and US dollar denominated. It covers the US investment-grade fixed rate bond market, with index components for government and corporate securities, mortgage pass-through securities, and asset-backed securities.
S&P 500 Index*—The S&P 500 Index is an unmanaged index of over 500 stocks of large US public companies. It gives a broad look at how stock prices in the United States have performed.
6 Visit our website at pgim.com/investments
*The S&P 500 Index is a product of S&P Dow Jones Indices LLC and/or its affiliates and has been licensed for use by PGIM, Inc. and/or its affiliates. Copyright © 2023 S&P Dow Jones Indices LLC, a division of S&P Global, Inc., and/or its affiliates. All rights reserved. Redistribution or reproduction in whole or in part are prohibited without written permission of S&P Dow Jones Indices LLC. For more information on any of S&P Dow Jones Indices LLC’s indices please visit www.spdji.com. S&P® is a registered trademark of S&P Global and Dow Jones® is a registered trademark of Dow Jones Trademark Holdings LLC.
Investors cannot invest directly in an index. The returns for the Indexes would be lower if they included the effects of sales charges, operating expenses of a mutual fund, or taxes that may be paid by an investor.
Presentation of Fund Holdings as of 9/30/23
| | | | |
| | |
| Ten Largest Holdings | | Line of Business | | % of Net Assets |
| | |
Microsoft Corp. | | Software | | 3.2% |
| | |
Apple, Inc. | | Technology Hardware, Storage & Peripherals | | 2.9% |
| | |
U.S. Treasury Bonds, 2.250%, 05/15/41 | | U.S. Treasury Obligations | | 1.6% |
| | |
NVIDIA Corp. | | Semiconductors & Semiconductor Equipment | | 1.6% |
| | |
Amazon.com, Inc. | | Broadline Retail | | 1.5% |
| | |
Alphabet, Inc. (Class A Stock) | | Interactive Media & Services | | 1.1% |
| | |
Alphabet, Inc. (Class C Stock) | | Interactive Media & Services | | 0.9% |
| | |
Meta Platforms, Inc. (Class A Stock) | | Interactive Media & Services | | 0.8% |
| | |
Tesla, Inc. | | Automobiles | | 0.8% |
| | |
Eli Lilly & Co. | | Pharmaceuticals | | 0.7% |
Holdings reflect only long-term investments and are subject to change.
PGIM Balanced Fund 7
Strategy and Performance Overview* (unaudited)
How did the Fund perform?
The PGIM Balanced Fund’s Class Z shares returned 13.02% in the 12-month reporting period that ended September 30, 2023, outperforming the 12.44% return of the Customized Blend Index (the Index). The Index consists of the S&P 500 Index (44%), the Bloomberg US Aggregate Bond Index (40%), the Russell 2000 Index (4%), and the MSCI ACWI ex US Index (12%).
What were the market conditions?
| · | | During the reporting period, despite over a year of US leading economic indicators in negative territory, an inverted yield curve, a regional banking crisis, and a historically aggressive monetary tightening campaign by the US Federal Reserve (Fed) to combat elevated inflation, the US economy continued to grow over 2% on an annual basis through the second quarter of 2023. |
| · | | Outside of the US, economic growth was mixed, with sluggish performance out of Europe and China, while Japan was a bright spot, bolstered by a more supportive central bank, as well as solid consumption and business spending. |
| · | | Despite lofty valuations, equity markets were supported by resilient economic growth, better-than-expected corporate earnings, and the hype generated by artificial intelligence (AI). For the period, the S&P 500 Index and the MSCI ACWI ex-US Index both returned over 20%, while the small-cap-focused Russell 2000 Index rose close to 9%. The Bloomberg US Aggregate Bond Index returned only 0.64%, facing headwinds such as elevated inflation, “higher for longer” messaging from the Fed, and deficit concerns well into the future. |
What worked?
| · | | The segment of the Fund invested in bonds outperformed the Bloomberg US Aggregate Bond Index during the reporting period. |
| · | | Within the fixed income segment, both sector allocation and security selection contributed positively to relative performance. Within sector allocation, overweights to high yield and collateralized loan obligations (CLOs) added value. Security selection in investment-grade corporates, non-agency mortgage-backed securities (MBS), CLOs, and emerging markets all added to returns. |
| · | | All equity segments of the Fund—US large-cap, US small-cap, and international—outperformed their respective benchmarks. |
| · | | Within the US large-cap segment, quality factors led gains. Relative performance was strongest in the communication services and utilities sectors. |
| · | | Within the US small-cap segment, value, growth, and quality factors all added value, led by quality. |
| · | | Within the international segment, value measures predominantly drove outperformance, with the cheapest and most expensive names the best and worst performers, respectively, in absolute terms. Returns particularly benefited from the Fund’s emphasis on inexpensive industrials, financials, and consumer discretionary |
8 Visit our website at pgim.com/investments
| | names over their more expensive counterparts. Outperformance was further bolstered by the general efficacy of the Fund’s growth, quality, and top-down suite of factors. In terms of countries, Japan (industrials), Taiwan (information technology), and Turkey (overweights across financials and industrials) contributed the most to relative gains. Outperformance by sector was broad, with particularly strong performance in the financials (Turkey, Canada, and the UK), information technology (Taiwan), and utilities sectors. |
What didn’t work?
| · | | Within the fixed income portion of the Fund, an underweight to investment-grade corporates detracted during the reporting period. Security selection in bank loans, Treasuries, and MBS detracted modestly. In addition, duration and yield curve positioning hurt performance slightly. (A yield curve is a line graph that illustrates the relationship between the yields and maturities of fixed income securities. It is created by plotting the yields of different maturities for the same type of bonds.) |
| · | | The growth factor detracted within the US large-cap segment. |
| · | | Stock selection was modestly negative in the energy sector within the US small-cap segment. |
| · | | Within international equities, materials and industrial sector allocations dampened results. |
| · | | Asset allocation undermined performance, mainly due to the Fund’s conservative positioning, which reflected the potential for an economic recession that failed to materialize during the period. |
Did the Fund use derivatives and how did they affect performance?
| · | | The Fund used S&P 500 equity futures to equitize cash positions and for liquidity purposes. This exposure had a small positive impact on the Fund’s performance during the reporting period. |
| · | | The US equity sleeves did not hold any derivatives. The international equity sleeve held derivatives, which were used to maintain exposure to equities and provide portfolio liquidity. The futures had minimal impact on performance. |
| · | | The Fund’s fixed income sleeve uses derivatives when they facilitate implementation of the overall investment approach. During the period, the Fund used interest rate futures, options, and swaps to help manage duration positioning and yield curve exposure. In addition, the Fund traded foreign exchange derivatives and credit default swap indices (CDX). The use of these derivatives detracted from performance. |
Current Outlook
| · | | Strong labor demand in the US is providing a buffer to household incomes and supporting private consumption, while fiscal stimulus continues to boost the economy. The most likely economic scenario is one of modest US growth in late 2023 and into 2024, with a lower risk of recession in the near term. |
PGIM Balanced Fund 9
Strategy and Performance Overview* (continued)
| · | | Europe’s post-COVID-19 recovery has already faded, with second-quarter 2023 GDP growth just barely positive in the Eurozone, UK, and Switzerland. The risks of a European recession are significant. Available hard data for the third quarter is mixed, while soft data is strikingly negative. |
| · | | Weak growth is likely to continue in China, barring significant measures by the government to jump-start the economy. Consumption spending and industrial activity remain anemic, while the real estate sector continues to struggle. |
| · | | In contrast to Europe and China, Japan is a relative bright spot, helped by a comparatively supportive central bank, and underpinned by solid consumption and business spending. |
| · | | Central banks are making progress in their fight against inflation. US headline inflation remains driven by geopolitics and supply cuts by the OPEC+ group of petroleum exporting nations, but core inflation has declined from its peak. Eurozone core inflation has moderated slightly from its recent high. |
| · | | PGIM Quantitative Solutions has adopted a more balanced overall investment view, as the incoming hard economic data in the US lessens the possibility of a near-term recession. |
| · | | The third quarter likely marked the trough in the US earnings cycle, with growth expectations for future quarters turning positive as the economy moves past the negativity of the second quarter. |
| · | | However, PGIM Quantitative Solutions remains cognizant that the high valuations of US equities already price in an optimistic scenario, making it difficult to see much further upside. |
| · | | While sector composition often explains much of the difference in valuation between the US and the rest of the world, US stocks are expensive, even after accounting for composition effects. |
| · | | Fixed income assets are attractive, especially the higher rates found in lower-duration assets. Although declining inflation and potential economic weakness on the horizon provide support, ongoing risks include persistently sticky inflation and “higher for longer” central bank rates. |
*This strategy and performance overview, which discusses what strategies or holdings (including derivatives, if applicable) affected the Fund’s performance, is compiled based on how the Fund performed relative to the Fund’s benchmark index and is viewed for performance attribution purposes at the aggregate Fund level, which in most instances will not directly correlate to the amounts disclosed in the Statement of Operations which conform to US generally accepted accounting principles.
10 Visit our website at pgim.com/investments
Fees and Expenses (unaudited)
As a shareholder of the Fund, you incur two types of costs: (1) transaction costs, including sales charges (loads) on purchase payments and redemptions, as applicable, and (2) ongoing costs, including management fees, distribution and/or service (12b-1) fees, and other Fund expenses, as applicable. This example is intended to help you understand your ongoing costs (in dollars) of investing in the Fund and to compare these costs with the ongoing costs of investing in other mutual funds.
The example is based on an investment of $1,000 held through the six-month period ended September 30, 2023. The example is for illustrative purposes only; you should consult the Prospectus for information on initial and subsequent minimum investment requirements.
Actual Expenses
The first line for each share class in the table on the following page provides information about actual account values and actual expenses. You may use the information on this line, together with the amount you invested, to estimate the expenses that you paid over the period. Simply divide your account value by $1,000 (for example, an $8,600 account value ÷ $1,000 = 8.6), then multiply the result by the number on the first line under the heading “Expenses Paid During the Six-Month Period” to estimate the expenses you paid on your account during this period.
Hypothetical Example for Comparison Purposes
The second line for each share class in the table on the following page provides information about hypothetical account values and hypothetical expenses based on the Fund’s actual expense ratio and an assumed rate of return of 5% per year before expenses, which is not the Fund’s actual return. The hypothetical account values and expenses may not be used to estimate the actual ending account balance or expenses you paid for the period. You may use this information to compare the ongoing costs of investing in the Fund and other funds. To do so, compare this 5% hypothetical example with the 5% hypothetical examples that appear in the shareholder reports of the other funds.
The Fund’s transfer agent may charge additional fees to holders of certain accounts that are not included in the expenses shown in the table on the following page. These fees apply to individual retirement accounts (IRAs) and Section 403(b) accounts. As of the close of the six-month period covered by the table, IRA fees included an annual maintenance fee of $15 per account (subject to a maximum annual maintenance fee of $25 for all accounts held by the same shareholder). Section 403(b) accounts are charged an annual $25 fiduciary maintenance fee. Some of the fees may vary in amount, or may be waived, based on your total account balance or the number of PGIM funds, including the Fund, that you own. You should consider the additional fees that were charged to your Fund account over the six-month period when you estimate the total ongoing expenses paid over the period and the impact of these fees on your ending account value, as these additional expenses are not reflected in the information
PGIM Balanced Fund 11
Fees and Expenses (continued)
provided in the expense table. Additional fees have the effect of reducing investment returns.
Please note that the expenses shown in the table are meant to highlight your ongoing costs only and do not reflect any transactional costs such as sales charges (loads). Therefore, the second line for each share class in the table is useful in comparing ongoing costs only and will not help you determine the relative total costs of owning different funds. In addition, if these transactional costs were included, your costs would have been higher.
| | | | | | | | | | |
| | | | |
| PGIM Balanced Fund | | Beginning Account Value April 1, 2023 | | Ending Account Value September 30, 2023 | | Annualized Expense Ratio Based on the Six-Month Period | | Expenses Paid During the Six-Month Period* |
| | | | | |
Class A | | Actual | | $1,000.00 | | $1,015.10 | | 1.00% | | $5.05 |
| | | | | |
| | Hypothetical | | $1,000.00 | | $1,020.05 | | 1.00% | | $5.06 |
| | | | | |
Class C | | Actual | | $1,000.00 | | $1,010.60 | | 1.82% | | $9.17 |
| | | | | |
| | Hypothetical | | $1,000.00 | | $1,015.94 | | 1.82% | | $9.20 |
| | | | | |
Class R | | Actual | | $1,000.00 | | $1,012.60 | | 1.47% | | $7.42 |
| | | | | |
| | Hypothetical | | $1,000.00 | | $1,017.70 | | 1.47% | | $7.44 |
| | | | | |
Class Z | | Actual | | $1,000.00 | | $1,016.00 | | 0.79% | | $3.99 |
| | | | | |
| | Hypothetical | | $1,000.00 | | $1,021.11 | | 0.79% | | $4.00 |
| | | | | |
Class R6 | | Actual | | $1,000.00 | | $1,016.70 | | 0.65% | | $3.29 |
| | | | | |
| | | Hypothetical | | $1,000.00 | | $1,021.81 | | 0.65% | | $3.29 |
*Fund expenses (net of fee waivers or subsidies, if any) for each share class are equal to the annualized expense ratio for each share class (provided in the table), multiplied by the average account value over the period, multiplied by the 183 days in the six-month period ended September 30, 2023, and divided by the 365 days in the Fund’s fiscal year ended September 30, 2023 (to reflect the six-month period). Expenses presented in the table include the expenses of any underlying portfolios in which the Fund may invest.
12 Visit our website at pgim.com/investments
Schedule of Investments
as of September 30, 2023
| | | | | | | | |
| | |
| Description | | Shares | | | Value | |
| | |
LONG-TERM INVESTMENTS 98.8% | | | | | | | | |
| | |
COMMON STOCKS 59.0% | | | | | | | | |
| | |
Aerospace & Defense 1.2% | | | | | | | | |
| | |
AAR Corp.* | | | 2,600 | | | $ | 154,778 | |
AeroVironment, Inc.* | | | 1,900 | | | | 211,907 | |
BAE Systems PLC (United Kingdom) | | | 13,530 | | | | 164,414 | |
Boeing Co. (The)* | | | 14,800 | | | | 2,836,864 | |
Dassault Aviation SA (France) | | | 1,497 | | | | 281,960 | |
Hindustan Aeronautics Ltd. (India) | | | 1,800 | | | | 41,703 | |
Howmet Aerospace, Inc. | | | 7,000 | | | | 323,750 | |
L3Harris Technologies, Inc. | | | 9,300 | | | | 1,619,316 | |
Lockheed Martin Corp. | | | 3,477 | | | | 1,421,954 | |
Northrop Grumman Corp. | | | 2,600 | | | | 1,144,494 | |
Rolls-Royce Holdings PLC (United Kingdom)* | | | 157,534 | | | | 422,094 | |
Textron, Inc. | | | 20,900 | | | | 1,633,126 | |
| | | | | | | | |
| | |
| | | | | | | 10,256,360 | |
| | |
Air Freight & Logistics 0.3% | | | | | | | | |
| | |
FedEx Corp. | | | 10,050 | | | | 2,662,446 | |
| | |
Automobile Components 0.2% | | | | | | | | |
| | |
Adient PLC* | | | 3,050 | | | | 111,935 | |
American Axle & Manufacturing Holdings, Inc.* | | | 6,400 | | | | 46,464 | |
Dana, Inc. | | | 3,500 | | | | 51,345 | |
Gentherm, Inc.* | | | 1,400 | | | | 75,964 | |
Hyundai Mobis Co. Ltd. (South Korea) | | | 3,930 | | | | 699,455 | |
Magna International, Inc. (Canada) | | | 1,300 | | | | 69,668 | |
Modine Manufacturing Co.* | | | 4,450 | | | | 203,588 | |
Toyota Boshoku Corp. (Japan) | | | 4,100 | | | | 74,741 | |
Visteon Corp.* | | | 1,850 | | | | 255,429 | |
| | | | | | | | |
| | |
| | | | | | | 1,588,589 | |
| | |
Automobiles 1.7% | | | | | | | | |
| | |
Bayerische Motoren Werke AG (Germany) | | | 6,972 | | | | 708,126 | |
BYD Co. Ltd. (China) (Class H Stock) | | | 21,000 | | | | 647,015 | |
Ford Motor Co. | | | 177,100 | | | | 2,199,582 | |
General Motors Co. | | | 76,600 | | | | 2,525,502 | |
Honda Motor Co. Ltd. (Japan) | | | 20,700 | | | | 232,869 | |
Hyundai Motor Co. (South Korea) | | | 1,812 | | | | 256,224 | |
Kia Corp. (South Korea) | | | 12,551 | | | | 755,448 | |
Mazda Motor Corp. (Japan) | | | 5,600 | | | | 63,585 | |
Mercedes-Benz Group AG (Germany) | | | 9,683 | | | | 673,905 | |
Stellantis NV | | | 12,660 | | | | 242,419 | |
Subaru Corp. (Japan) | | | 2,800 | | | | 54,445 | |
See Notes to Financial Statements.
PGIM Balanced Fund 13
Schedule of Investments (continued)
as of September 30, 2023
| | | | | | | | |
| | |
| Description | | Shares | | | Value | |
| | |
COMMON STOCKS (Continued) | | | | | | | | |
| | |
Automobiles (cont’d.) | | | | | | | | |
| | |
Suzuki Motor Corp. (Japan) | | | 1,600 | | | $ | 64,354 | |
Tata Motors Ltd. (India) | | | 38,375 | | | | 290,265 | |
Tesla, Inc.* | | | 27,050 | | | | 6,768,451 | |
Toyota Motor Corp. (Japan) | | | 8,270 | | | | 148,366 | |
| | | | | | | | |
| | |
| | | | | | | 15,630,556 | |
| | |
Banks 2.8% | | | | | | | | |
| | |
ABN AMRO Bank NV (Netherlands), 144A, CVA | | | 2,858 | | | | 40,391 | |
Agricultural Bank of China Ltd. (China) (Class H Stock) | | | 130,000 | | | | 48,342 | |
Amalgamated Financial Corp. | | | 5,650 | | | | 97,293 | |
Ameris Bancorp | | | 1,400 | | | | 53,746 | |
Associated Banc-Corp. | | | 7,900 | | | | 135,169 | |
Atlantic Union Bankshares Corp. | | | 3,900 | | | | 112,242 | |
Axos Financial, Inc.* | | | 500 | | | | 18,930 | |
Banc of California, Inc. | | | 3,050 | | | | 37,759 | |
Banco Bilbao Vizcaya Argentaria SA (Spain) | | | 2,970 | | | | 24,036 | |
Banco del Bajio SA (Mexico), 144A | | | 66,600 | | | | 208,695 | |
Banco do Brasil SA (Brazil) | | | 74,800 | | | | 703,126 | |
Bancorp, Inc. (The)* | | | 3,550 | | | | 122,475 | |
Bank Mandiri Persero Tbk PT (Indonesia) | | | 362,000 | | | | 140,900 | |
Bank of America Corp. | | | 77,825 | | | | 2,130,848 | |
Bank of Beijing Co. Ltd. (China) (Class A Stock) | | | 162,600 | | | | 103,253 | |
Bank of Communications Co. Ltd. (China) (Class H Stock) | | | 971,000 | | | | 586,470 | |
Bank of Georgia Group PLC (Georgia) | | | 10,319 | | | | 463,189 | |
Bank of Jiangsu Co. Ltd. (China) (Class A Stock) | | | 152,200 | | | | 150,114 | |
Bank of NT Butterfield & Son Ltd. (The) (Bermuda) | | | 1,298 | | | | 35,150 | |
Bank of Shanghai Co. Ltd. (China) (Class A Stock) | | | 125,000 | | | | 105,774 | |
BankUnited, Inc. | | | 5,300 | | | | 120,310 | |
Barclays PLC (United Kingdom) | | | 234,534 | | | | 452,048 | |
Byline Bancorp, Inc. | | | 3,400 | | | | 67,014 | |
China CITIC Bank Corp. Ltd. (China) (Class H Stock) | | | 120,000 | | | | 55,686 | |
China Construction Bank Corp. (China) (Class H Stock) | | | 1,416,000 | | | | 796,008 | |
Chongqing Rural Commercial Bank Co. Ltd. (China) (Class A Stock) | | | 220,700 | | | | 121,164 | |
Citigroup, Inc. | | | 27,100 | | | | 1,114,623 | |
Civista Bancshares, Inc. | | | 2,550 | | | | 39,525 | |
CNB Financial Corp. | | | 5,326 | | | | 96,454 | |
Credit Agricole SA (France) | | | 5,278 | | | | 64,892 | |
Customers Bancorp, Inc.* | | | 2,860 | | | | 98,527 | |
DBS Group Holdings Ltd. (Singapore) | | | 6,500 | | | | 159,638 | |
DNB Bank ASA (Norway) | | | 4,098 | | | | 82,336 | |
Emirates NBD Bank PJSC (United Arab Emirates) | | | 144,022 | | | | 697,949 | |
Erste Group Bank AG (Austria) | | | 1,160 | | | | 40,063 | |
Eurobank Ergasias Services & Holdings SA (Greece)* | | | 279,470 | | | | 429,854 | |
See Notes to Financial Statements.
14
| | | | | | | | |
| | |
| Description | | Shares | | | Value | |
| | |
COMMON STOCKS (Continued) | | | | | | | | |
| | |
Banks (cont’d.) | | | | | | | | |
| | |
Financial Institutions, Inc. | | | 3,102 | | | $ | 52,207 | |
First Foundation, Inc. | | | 13,950 | | | | 84,816 | |
First Merchants Corp. | | | 900 | | | | 25,038 | |
Flushing Financial Corp. | | | 7,500 | | | | 98,475 | |
Fulton Financial Corp. | | | 4,300 | | | | 52,073 | |
Hana Financial Group, Inc. (South Korea) | | | 21,901 | | | | 686,125 | |
Heartland Financial USA, Inc. | | | 3,830 | | | | 112,717 | |
Hope Bancorp, Inc. | | | 11,520 | | | | 101,952 | |
Horizon Bancorp, Inc. | | | 8,350 | | | | 89,178 | |
HSBC Holdings PLC (United Kingdom) | | | 90,399 | | | | 707,407 | |
Independent Bank Group, Inc. | | | 2,000 | | | | 79,100 | |
Industrial & Commercial Bank of China Ltd. (China) (Class H Stock) | | | 255,000 | | | | 122,309 | |
Industrial Bank Co. Ltd. (China) (Class A Stock) | | | 68,600 | | | | 153,620 | |
Industrial Bank of Korea (South Korea) | | | 11,880 | | | | 98,578 | |
ING Groep NV (Netherlands) | | | 38,076 | | | | 501,844 | |
Intesa Sanpaolo SpA (Italy) | | | 70,520 | | | | 180,617 | |
JB Financial Group Co. Ltd. (South Korea) | | | 7,800 | | | | 57,447 | |
JPMorgan Chase & Co. | | | 17,474 | | | | 2,534,079 | |
Karnataka Bank Ltd. (The) (India) | | | 29,350 | | | | 87,767 | |
KB Financial Group, Inc. (South Korea) | | | 16,590 | | | | 676,655 | |
Midland States Bancorp, Inc. | | | 2,700 | | | | 55,458 | |
MidWestOne Financial Group, Inc. | | | 4,433 | | | | 90,123 | |
MVB Financial Corp. | | | 1,700 | | | | 38,386 | |
National Bank of Greece SA (Greece)* | | | 17,575 | | | | 98,944 | |
Nordea Bank Abp (Finland) | | | 57,040 | | | | 625,371 | |
OFG Bancorp (Puerto Rico) | | | 1,987 | | | | 59,332 | |
Old National Bancorp | | | 4,550 | | | | 66,157 | |
Orrstown Financial Services, Inc. | | | 787 | | | | 16,535 | |
Oversea-Chinese Banking Corp. Ltd. (Singapore) | | | 73,200 | | | | 684,570 | |
Pacific Premier Bancorp, Inc. | | | 1,100 | | | | 23,936 | |
Pathward Financial, Inc. | | | 2,200 | | | | 101,398 | |
Primis Financial Corp. | | | 8,530 | | | | 69,520 | |
QCR Holdings, Inc. | | | 1,323 | | | | 64,192 | |
RBB Bancorp | | | 2,000 | | | | 25,560 | |
Renasant Corp. | | | 1,350 | | | | 35,357 | |
Sandy Spring Bancorp, Inc. | | | 1,900 | | | | 40,717 | |
Sberbank of Russia PJSC (Russia)^ | | | 202,510 | | | | — | |
Shanghai Pudong Development Bank Co. Ltd. (China) (Class A Stock) | | | 58,900 | | | | 57,495 | |
Shanghai Rural Commercial Bank Co. Ltd. (China) (Class A Stock) | | | 195,000 | | | | 161,578 | |
Simmons First National Corp. (Class A Stock) | | | 6,500 | | | | 110,240 | |
Skandinaviska Enskilda Banken AB (Sweden) (Class A Stock) | | | 27,014 | | | | 322,057 | |
Standard Chartered PLC (United Kingdom) | | | 4,600 | | | | 42,309 | |
See Notes to Financial Statements.
PGIM Balanced Fund 15
Schedule of Investments (continued)
as of September 30, 2023
| | | | | | | | |
| | |
| Description | | Shares | | | Value | |
| | |
COMMON STOCKS (Continued) | | | | | | | | |
| | |
Banks (cont’d.) | | | | | | | | |
| | |
Svenska Handelsbanken AB (Sweden) (Class A Stock) | | | 5,355 | | | $ | 47,648 | |
Swedbank AB (Sweden) (Class A Stock) | | | 23,982 | | | | 440,823 | |
Texas Capital Bancshares, Inc.* | | | 1,000 | | | | 58,900 | |
Truist Financial Corp. | | | 44,500 | | | | 1,273,145 | |
Turkiye Is Bankasi A/S (Turkey) (Class C Stock) | | | 532,644 | | | | 498,834 | |
UniCredit SpA (Italy) | | | 25,113 | | | | 598,352 | |
Univest Financial Corp. | | | 5,150 | | | | 89,507 | |
Veritex Holdings, Inc. | | | 5,300 | | | | 95,135 | |
Washington Federal, Inc. | | | 3,900 | | | | 99,918 | |
Wells Fargo & Co. | | | 69,020 | | | | 2,820,157 | |
Yapi ve Kredi Bankasi A/S (Turkey) | | | 66,117 | | | | 44,385 | |
| | | | | | | | |
| | |
| | | | | | | 25,112,036 | |
| | |
Beverages 1.0% | | | | | | | | |
| | |
Celsius Holdings, Inc.* | | | 700 | | | | 120,120 | |
Coca-Cola Co. (The) | | | 81,825 | | | | 4,580,563 | |
Coca-Cola Consolidated, Inc. | | | 330 | | | | 209,986 | |
Coca-Cola HBC AG (Italy)* | | | 975 | | | | 26,660 | |
National Beverage Corp.* | | | 460 | | | | 21,629 | |
PepsiCo, Inc. | | | 24,650 | | | | 4,176,696 | |
Primo Water Corp. | | | 13,450 | | | | 185,610 | |
| | | | | | | | |
| | |
| | | | | | | 9,321,264 | |
| | |
Biotechnology 1.0% | | | | | | | | |
| | |
3SBio, Inc. (China), 144A* | | | 44,000 | | | | 36,748 | |
AbbVie, Inc. | | | 26,930 | | | | 4,014,186 | |
ACADIA Pharmaceuticals, Inc.* | | | 9,200 | | | | 191,728 | |
Agios Pharmaceuticals, Inc.* | | | 1,500 | | | | 37,125 | |
Alkermes PLC* | | | 10,100 | | | | 282,901 | |
Amgen, Inc. | | | 8,000 | | | | 2,150,080 | |
Amicus Therapeutics, Inc.* | | | 21,250 | | | | 258,400 | |
Biogen, Inc.* | | | 2,000 | | | | 514,020 | |
Blueprint Medicines Corp.* | | | 3,700 | | | | 185,814 | |
Catalyst Pharmaceuticals, Inc.* | | | 13,570 | | | | 158,633 | |
Denali Therapeutics, Inc.* | | | 7,400 | | | | 152,662 | |
Eagle Pharmaceuticals, Inc.* | | | 780 | | | | 12,301 | |
Enanta Pharmaceuticals, Inc.* | | | 1,800 | | | | 20,106 | |
Halozyme Therapeutics, Inc.* | | | 1,600 | | | | 61,120 | |
iTeos Therapeutics, Inc.* | | | 8,450 | | | | 92,527 | |
Kiniksa Pharmaceuticals Ltd. (Class A Stock)* | | | 7,700 | | | | 133,749 | |
MannKind Corp.* | | | 2,900 | | | | 11,977 | |
MiMedx Group, Inc.* | | | 24,700 | | | | 180,063 | |
Neurocrine Biosciences, Inc.* | | | 1,000 | | | | 112,500 | |
See Notes to Financial Statements.
16
| | | | | | | | |
| | |
| Description | | Shares | | | Value | |
| | |
COMMON STOCKS (Continued) | | | | | | | | |
| | |
Biotechnology (cont’d.) | | | | | | | | |
| | |
Sangamo Therapeutics, Inc.* | | | 9,500 | | | $ | 5,698 | |
Vanda Pharmaceuticals, Inc.* | | | 28,077 | | | | 121,293 | |
Veracyte, Inc.* | | | 6,250 | | | | 139,562 | |
Vericel Corp.* | | | 1,400 | | | | 46,928 | |
Vir Biotechnology, Inc.* | | | 6,550 | | | | 61,374 | |
Y-mAbs Therapeutics, Inc.* | | | 3,600 | | | | 19,620 | |
| | | | | | | | |
| | |
| | | | | | | 9,001,115 | |
| | |
Broadline Retail 2.0% | | | | | | | | |
| | |
Alibaba Group Holding Ltd. (China)* | | | 45,000 | | | | 487,899 | |
Amazon.com, Inc.* | | | 108,490 | | | | 13,791,249 | |
Coupang, Inc. (South Korea)* | | | 114,400 | | | | 1,944,800 | |
Dollarama, Inc. (Canada) | | | 9,800 | | | | 675,195 | |
JD.com, Inc. (China) (Class A Stock) | | | 2,300 | | | | 33,462 | |
PDD Holdings, Inc. (China), ADR* | | | 9,100 | | | | 892,437 | |
Vipshop Holdings Ltd. (China), ADR* | | | 3,100 | | | | 49,631 | |
| | | | | | | | |
| | |
| | | | | | | 17,874,673 | |
| | |
Building Products 0.3% | | | | | | | | |
| | |
Armstrong World Industries, Inc. | | | 5,300 | | | | 381,600 | |
AZEK Co., Inc. (The)* | | | 41,400 | | | | 1,231,236 | |
Cie de Saint-Gobain SA (France) | | | 10,871 | | | | 650,634 | |
Gibraltar Industries, Inc.* | | | 500 | | | | 33,755 | |
Masonite International Corp.* | | | 2,200 | | | | 205,084 | |
Masterbrand, Inc.* | | | 1,700 | | | | 20,655 | |
Resideo Technologies, Inc.* | | | 14,900 | | | | 235,420 | |
Sanwa Holdings Corp. (Japan) | | | 7,500 | | | | 99,540 | |
UFP Industries, Inc. | | | 627 | | | | 64,205 | |
| | | | | | | | |
| | |
| | | | | | | 2,922,129 | |
| | |
Capital Markets 1.3% | | | | | | | | |
| | |
3i Group PLC (United Kingdom) | | | 23,052 | | | | 580,234 | |
Amundi SA (France), 144A | | | 2,051 | | | | 115,198 | |
AssetMark Financial Holdings, Inc.* | | | 900 | | | | 22,572 | |
B3 SA - Brasil Bolsa Balcao (Brazil) | | | 58,100 | | | | 141,824 | |
Bank of New York Mellon Corp. (The) | | | 56,750 | | | | 2,420,387 | |
BGC Group, Inc. (Class A Stock) | | | 48,200 | | | | 254,496 | |
Daiwa Securities Group, Inc. (Japan) | | | 93,600 | | | | 539,750 | |
Deutsche Bank AG (Germany) | | | 50,529 | | | | 555,328 | |
Hamilton Lane, Inc. (Class A Stock) | | | 2,800 | | | | 253,232 | |
Intercontinental Exchange, Inc. | | | 10,100 | | | | 1,111,202 | |
Invesco Ltd. | | | 19,600 | | | | 284,592 | |
See Notes to Financial Statements.
PGIM Balanced Fund 17
Schedule of Investments (continued)
as of September 30, 2023
| | | | | | | | |
| | |
| Description | | Shares | | | Value | |
| | |
COMMON STOCKS (Continued) | | | | | | | | |
| | |
Capital Markets (cont’d.) | | | | | | | | |
| | |
Investec PLC (United Kingdom) | | | 8,850 | | | $ | 51,692 | |
JAFCO Group Co. Ltd. (Japan) | | | 22,300 | | | | 245,299 | |
Japan Exchange Group, Inc. (Japan) | | | 1,600 | | | | 29,642 | |
LPL Financial Holdings, Inc. | | | 500 | | | | 118,825 | |
Man Group PLC (United Kingdom) | | | 79,342 | | | | 215,653 | |
Moody’s Corp. | | | 5,900 | | | | 1,865,403 | |
MSCI, Inc. | | | 1,700 | | | | 872,236 | |
Samsung Securities Co. Ltd. (South Korea) | | | 1,925 | | | | 52,374 | |
StoneX Group, Inc.* | | | 250 | | | | 24,230 | |
Victory Capital Holdings, Inc. (Class A Stock) | | | 4,750 | | | | 158,365 | |
Virtu Financial, Inc. (Class A Stock) | | | 91,925 | | | | 1,587,545 | |
Virtus Investment Partners, Inc. | | | 430 | | | | 86,856 | |
| | | | | | | | |
| | |
| | | | | | | 11,586,935 | |
| | |
Chemicals 0.6% | | | | | | | | |
| | |
AdvanSix, Inc. | | | 4,050 | | | | 125,874 | |
ASAHI YUKIZAI Corp. (Japan) | | | 1,500 | | | | 37,052 | |
Avient Corp. | | | 300 | | | | 10,596 | |
Ecolab, Inc. | | | 7,700 | | | | 1,304,380 | |
Ecovyst, Inc.* | | | 8,900 | | | | 87,576 | |
Kemira OYJ (Finland) | | | 3,406 | | | | 52,959 | |
Koppers Holdings, Inc. | | | 3,000 | | | | 118,650 | |
Livent Corp.* | | | 5,950 | | | | 109,540 | |
Lotte Chemical Titan Holding Bhd (Malaysia), 144A | | | 295,000 | | | | 72,674 | |
LOTTE Fine Chemical Co. Ltd. (South Korea) | | | 1,716 | | | | 74,331 | |
Nippon Sanso Holdings Corp. (Japan) | | | 800 | | | | 18,941 | |
OCI Holdings Co. Ltd. (South Korea) | | | 650 | | | | 46,958 | |
Orbia Advance Corp. SAB de CV (Mexico) | | | 19,800 | | | | 41,105 | |
PPG Industries, Inc. | | | 8,800 | | | | 1,142,240 | |
Rayonier Advanced Materials, Inc.* | | | 19,800 | | | | 70,092 | |
SABIC Agri-Nutrients Co. (Saudi Arabia) | | | 5,322 | | | | 188,876 | |
Sherwin-Williams Co. (The) | | | 4,700 | | | | 1,198,735 | |
Solvay SA (Belgium) | | | 2,240 | | | | 247,541 | |
Tianqi Lithium Corp. (China) (Class A Stock) | | | 6,000 | | | | 45,366 | |
Valhi, Inc. | | | 1,950 | | | | 25,857 | |
Zangge Mining Co. Ltd. (China) (Class A Stock) | | | 33,000 | | | | 103,544 | |
| | | | | | | | |
| | |
| | | | | | | 5,122,887 | |
| | |
Commercial Services & Supplies 0.1% | | | | | | | | |
| | |
ACCO Brands Corp. | | | 12,700 | | | | 72,898 | |
Brambles Ltd. (Australia) | | | 6,156 | | | | 56,552 | |
CoreCivic, Inc.* | | | 3,500 | | | | 39,375 | |
Deluxe Corp. | | | 7,850 | | | | 148,286 | |
See Notes to Financial Statements.
18
| | | | | | | | |
| | |
| Description | | Shares | | | Value | |
| | |
COMMON STOCKS (Continued) | | | | | | | | |
| | |
Commercial Services & Supplies (cont’d.) | | | | | | | | |
| | |
Enviri Corp.* | | | 11,400 | | | $ | 82,308 | |
HNI Corp. | | | 1,800 | | | | 62,334 | |
Interface, Inc. | | | 5,650 | | | | 55,427 | |
Quad/Graphics, Inc.* | | | 2,300 | | | | 11,569 | |
S-1 Corp. (South Korea) | | | 1,275 | | | | 53,510 | |
Serco Group PLC (United Kingdom) | | | 25,944 | | | | 47,055 | |
SP Plus Corp.* | | | 1,550 | | | | 55,955 | |
| | | | | | | | |
| | |
| | | | | | | 685,269 | |
| | |
Communications Equipment 0.5% | | | | | | | | |
| | |
Accton Technology Corp. (Taiwan) | | | 4,000 | | | | 61,369 | |
Arista Networks, Inc.* | | | 900 | | | | 165,537 | |
Cisco Systems, Inc. | | | 77,187 | | | | 4,149,573 | |
Extreme Networks, Inc.* | | | 10,500 | | | | 254,205 | |
NetScout Systems, Inc.* | | | 4,159 | | | | 116,535 | |
| | | | | | | | |
| | |
| | | | | | | 4,747,219 | |
| | |
Construction & Engineering 0.2% | | | | | | | | |
| | |
API Group Corp.* | | | 5,800 | | | | 150,394 | |
Arcosa, Inc. | | | 1,200 | | | | 86,280 | |
Eiffage SA (France) | | | 360 | | | | 34,170 | |
EMCOR Group, Inc. | | | 1,400 | | | | 294,546 | |
Fluor Corp.* | | | 7,600 | | | | 278,920 | |
INFRONEER Holdings, Inc. (Japan) | | | 4,900 | | | | 50,700 | |
Obayashi Corp. (Japan) | | | 5,000 | | | | 44,000 | |
Samsung Engineering Co. Ltd. (South Korea)* | | | 4,485 | | | | 100,361 | |
Sterling Infrastructure, Inc.* | | | 4,250 | | | | 312,290 | |
Vinci SA (France) | | | 7,313 | | | | 809,045 | |
| | | | | | | | |
| | |
| | | | | | | 2,160,706 | |
| | |
Construction Materials 0.6% | | | | | | | | |
| | |
Buzzi SpA (Italy) | | | 1,380 | | | | 37,712 | |
CRH PLC | | | 3,208 | | | | 176,870 | |
Heidelberg Materials AG (Germany) | | | 7,719 | | | | 597,840 | |
Holcim AG* | | | 10,898 | | | | 697,569 | |
James Hardie Industries PLC, CDI* | | | 1,326 | | | | 34,679 | |
Martin Marietta Materials, Inc. | | | 3,000 | | | | 1,231,440 | |
Summit Materials, Inc. (Class A Stock)* | | | 8,590 | | | | 267,493 | |
Vulcan Materials Co. | | | 11,100 | | | | 2,242,422 | |
| | | | | | | | |
| | |
| | | | | | | 5,286,025 | |
See Notes to Financial Statements.
PGIM Balanced Fund 19
Schedule of Investments (continued)
as of September 30, 2023
| | | | | | | | |
| | |
| Description | | Shares | | | Value | |
| | |
COMMON STOCKS (Continued) | | | | | | | | |
| | |
Consumer Finance 0.0% | | | | | | | | |
| | |
Bread Financial Holdings, Inc. | | | 2,000 | | | $ | 68,400 | |
Enova International, Inc.* | | | 4,900 | | | | 249,263 | |
PROG Holdings, Inc.* | | | 1,500 | | | | 49,815 | |
| | | | | | | | |
| | |
| | | | | | | 367,478 | |
| | |
Consumer Staples Distribution & Retail 0.8% | | | | | | | | |
| | |
Alimentation Couche-Tard, Inc. (Canada) | | | 14,200 | | | | 721,160 | |
Carrefour SA (France) | | | 6,634 | | | | 113,940 | |
Coles Group Ltd. (Australia) | | | 5,953 | | | | 59,416 | |
Costco Wholesale Corp. | | | 1,125 | | | | 635,580 | |
George Weston Ltd. (Canada) | | | 500 | | | | 55,450 | |
Koninklijke Ahold Delhaize NV (Netherlands) | | | 26,975 | | | | 813,018 | |
Kroger Co. (The) | | | 2,600 | | | | 116,350 | |
Loblaw Cos. Ltd. (Canada) | | | 6,000 | | | | 509,774 | |
Metro, Inc. (Canada) | | | 1,200 | | | | 62,321 | |
Sonae SGPS SA (Portugal) | | | 47,449 | | | | 46,083 | |
Target Corp. | | | 6,300 | | | | 696,591 | |
Tesco PLC (United Kingdom) | | | 31,875 | | | | 102,526 | |
United Natural Foods, Inc.* | | | 14,400 | | | | 203,616 | |
Walmart, Inc. | | | 16,975 | | | | 2,714,812 | |
Woolworths Group Ltd. (Australia) | | | 5,445 | | | | 130,360 | |
| | | | | | | | |
| | |
| | | | | | | 6,980,997 | |
| | |
Containers & Packaging 0.0% | | | | | | | | |
| | |
O-I Glass, Inc.* | | | 11,550 | | | | 193,231 | |
Pactiv Evergreen, Inc. | | | 8,750 | | | | 71,138 | |
Ranpak Holdings Corp.* | | | 15,400 | | | | 83,776 | |
| | | | | | | | |
| | |
| | | | | | | 348,145 | |
| | |
Distributors 0.3% | | | | | | | | |
| | |
Genuine Parts Co. | | | 9,000 | | | | 1,299,420 | |
LKQ Corp. | | | 25,100 | | | | 1,242,701 | |
| | | | | | | | |
| | |
| | | | | | | 2,542,121 | |
| | |
Diversified Consumer Services 0.1% | | | | | | | | |
| | |
Coursera, Inc.* | | | 3,600 | | | | 67,284 | |
Frontdoor, Inc.* | | | 7,600 | | | | 232,484 | |
Perdoceo Education Corp. | | | 9,200 | | | | 157,320 | |
Stride, Inc.* | | | 3,050 | | | | 137,341 | |
| | | | | | | | |
| | |
| | | | | | | 594,429 | |
See Notes to Financial Statements.
20
| | | | | | | | |
| | |
| Description | | Shares | | | Value | |
| | |
COMMON STOCKS (Continued) | | | | | | | | |
| | |
Diversified REITs 0.0% | | | | | | | | |
| | |
Alexander & Baldwin, Inc. | | | 3,100 | | | $ | 51,863 | |
Essential Properties Realty Trust, Inc. | | | 1,000 | | | | 21,630 | |
Sekisui House Reit, Inc. (Japan) | | | 447 | | | | 249,004 | |
Stockland (Australia) | | | 10,008 | | | | 25,048 | |
| | | | | | | | |
| | |
| | | | | | | 347,545 | |
| | |
Diversified Telecommunication Services 0.8% | | | | | | | | |
| | |
AT&T, Inc. | | | 210,900 | | | | 3,167,718 | |
China Tower Corp. Ltd. (China) (Class H Stock), 144A | | | 1,232,000 | | | | 117,693 | |
Chunghwa Telecom Co. Ltd. (Taiwan) | | | 18,000 | | | | 64,699 | |
Koninklijke KPN NV (Netherlands) | | | 162,119 | | | | 534,128 | |
Liberty Latin America Ltd. (Puerto Rico) (Class A Stock)* | | | 11,200 | | | | 91,392 | |
Liberty Latin America Ltd. (Puerto Rico) (Class C Stock)* | | | 15,650 | | | | 127,704 | |
Lumen Technologies, Inc.* | | | 24,300 | | | | 34,506 | |
Ooredoo QPSC (Qatar) | | | 134,810 | | | | 395,900 | |
Saudi Telecom Co. (Saudi Arabia) | | | 54,958 | | | | 551,165 | |
Telefonica Brasil SA (Brazil) | | | 62,000 | | | | 530,014 | |
Telefonica Deutschland Holding AG (Germany) | | | 15,435 | | | | 27,607 | |
Verizon Communications, Inc. | | | 56,590 | | | | 1,834,082 | |
| | | | | | | | |
| | |
| | | | | | | 7,476,608 | |
| | |
Electric Utilities 0.5% | | | | | | | | |
| | |
ALLETE, Inc. | | | 4,500 | | | | 237,600 | |
Centrais Eletricas Brasileiras SA (Brazil) | | | 5,400 | | | | 39,513 | |
CPFL Energia SA (Brazil) | | | 36,000 | | | | 242,289 | |
Endesa SA (Spain) | | | 1,000 | | | | 20,351 | |
Enel Chile SA (Chile) | | | 837,954 | | | | 50,880 | |
Enerjisa Enerji A/S (Turkey), 144A | | | 24,833 | | | | 46,781 | |
Inter RAO UES PJSC (Russia)^ | | | 4,433,000 | | | | 5 | |
NRG Energy, Inc. | | | 57,050 | | | | 2,197,566 | |
PG&E Corp.* | | | 67,200 | | | | 1,083,936 | |
Portland General Electric Co. | | | 1,200 | | | | 48,576 | |
Power Grid Corp. of India Ltd. (India) | | | 264,665 | | | | 635,275 | |
| | | | | | | | |
| | |
| | | | | | | 4,602,772 | |
| | |
Electrical Equipment 0.8% | | | | | | | | |
| | |
ABB Ltd. (Switzerland) | | | 22,408 | | | | 799,813 | |
Array Technologies, Inc.* | | | 13,650 | | | | 302,893 | |
Atkore, Inc.* | | | 910 | | | | 135,763 | |
Emerson Electric Co. | | | 24,500 | | | | 2,365,965 | |
EnerSys | | | 2,650 | | | | 250,876 | |
Fuji Electric Co. Ltd. (Japan) | | | 500 | | | | 22,518 | |
See Notes to Financial Statements.
PGIM Balanced Fund 21
Schedule of Investments (continued)
as of September 30, 2023
| | | | | | | | |
| | |
| Description | | Shares | | | Value | |
| | |
COMMON STOCKS (Continued) | | | | | | | | |
| | |
Electrical Equipment (cont’d.) | | | | | | | | |
| | |
Fujikura Ltd. (Japan) | | | 64,600 | | | $ | 519,106 | |
LSI Industries, Inc. | | | 2,200 | | | | 34,936 | |
Preformed Line Products Co. | | | 100 | | | | 16,258 | |
Vertiv Holdings Co. | | | 76,000 | | | | 2,827,200 | |
| | | | | | | | |
| | |
| | | | | | | 7,275,328 | |
| | |
Electronic Equipment, Instruments & Components 0.2% | | | | | | | | |
| | |
Advanced Energy Industries, Inc. | | | 100 | | | | 10,312 | |
Arlo Technologies, Inc.* | | | 8,500 | | | | 87,550 | |
Badger Meter, Inc. | | | 100 | | | | 14,387 | |
Belden, Inc. | | | 2,850 | | | | 275,168 | |
Celestica, Inc. (Canada)* | | | 3,800 | | | | 92,996 | |
Daktronics, Inc.* | | | 2,200 | | | | 19,624 | |
Delta Electronics, Inc. (Taiwan) | | | 12,000 | | | | 120,863 | |
FARO Technologies, Inc.* | | | 3,000 | | | | 45,690 | |
Gold Circuit Electronics Ltd. (Taiwan) | | | 38,900 | | | | 265,059 | |
Hon Hai Precision Industry Co. Ltd. (Taiwan) | | | 141,000 | | | | 454,476 | |
nLight, Inc.* | | | 5,300 | | | | 55,120 | |
Sanmina Corp.* | | | 4,430 | | | | 240,460 | |
Shimadzu Corp. (Japan) | | | 1,000 | | | | 26,525 | |
Spectris PLC (United Kingdom) | | | 4,539 | | | | 187,650 | |
Supreme Electronics Co. Ltd. (Taiwan) | | | 121,000 | | | | 206,666 | |
| | | | | | | | |
| | |
| | | | | | | 2,102,546 | |
| | |
Energy Equipment & Services 0.2% | | | | | | | | |
| | |
Baker Hughes Co. | | | 22,000 | | | | 777,040 | |
ChampionX Corp. | | | 400 | | | | 14,248 | |
DMC Global, Inc.* | | | 6,200 | | | | 151,714 | |
Helix Energy Solutions Group, Inc.* | | | 5,600 | | | | 62,552 | |
Liberty Energy, Inc. | | | 8,000 | | | | 148,160 | |
Newpark Resources, Inc.* | | | 16,150 | | | | 111,596 | |
TETRA Technologies, Inc.* | | | 23,300 | | | | 148,654 | |
Tidewater, Inc.* | | | 4,000 | | | | 284,280 | |
U.S. Silica Holdings, Inc.* | | | 2,150 | | | | 30,186 | |
Weatherford International PLC* | | | 2,900 | | | | 261,957 | |
| | | | | | | | |
| | |
| | | | | | | 1,990,387 | |
| | |
Entertainment 0.8% | | | | | | | | |
| | |
Cinemark Holdings, Inc.* | | | 5,100 | | | | 93,585 | |
Electronic Arts, Inc. | | | 8,425 | | | | 1,014,370 | |
GungHo Online Entertainment, Inc. (Japan) | | | 28,800 | | | | 454,611 | |
Lions Gate Entertainment Corp. (Class B Stock)* | | | 2,150 | | | | 16,921 | |
See Notes to Financial Statements.
22
| | | | | | | | |
| | |
| Description | | Shares | | | Value | |
| | |
COMMON STOCKS (Continued) | | | | | | | | |
| | |
Entertainment (cont’d.) | | | | | | | | |
| | |
NetEase, Inc. (China) | | | 39,500 | | | $ | 792,024 | |
Netflix, Inc.* | | | 11,550 | | | | 4,361,280 | |
Nintendo Co. Ltd. (Japan) | | | 6,200 | | | | 257,628 | |
Warner Bros Discovery, Inc.* | | | 28,200 | | | | 306,252 | |
| | | | | | | | |
| | |
| | | | | | | 7,296,671 | |
| | |
Financial Services 2.5% | | | | | | | | |
| | |
Berkshire Hathaway, Inc. (Class B Stock)* | | | 13,349 | | | | 4,676,155 | |
Cannae Holdings, Inc.* | | | 8,680 | | �� | | 161,795 | |
Element Fleet Management Corp. (Canada) | | | 44,800 | | | | 642,851 | |
Enact Holdings, Inc. | | | 7,400 | | | | 201,502 | |
Essent Group Ltd. | | | 1,550 | | | | 73,299 | |
EXOR NV (Netherlands) | | | 480 | | | | 42,455 | |
Fidelity National Information Services, Inc. | | | 40,200 | | | | 2,221,854 | |
Helia Group Ltd. (Australia) | | | 244,658 | | | | 547,997 | |
Investor AB (Sweden) (Class B Stock) | | | 11,000 | | | | 210,590 | |
Mastercard, Inc. (Class A Stock) | | | 14,175 | | | | 5,612,024 | |
Mr. Cooper Group, Inc.* | | | 2,400 | | | | 128,544 | |
Paragon Banking Group PLC (United Kingdom) | | | 8,225 | | | | 49,140 | |
Payoneer Global, Inc.* | | | 36,200 | | | | 221,544 | |
PayPal Holdings, Inc.* | | | 34,200 | | | | 1,999,332 | |
Plus500 Ltd. (Israel) | | | 2,800 | | | | 47,034 | |
Remitly Global, Inc.* | | | 1,800 | | | | 45,396 | |
Repay Holdings Corp.* | | | 2,900 | | | | 22,011 | |
StoneCo Ltd. (Brazil) (Class A Stock)* | | | 3,600 | | | | 38,412 | |
Visa, Inc. (Class A Stock) | | | 23,505 | | | | 5,406,385 | |
| | | | | | | | |
| | |
| | | | | | | 22,348,320 | |
| | |
Food Products 0.9% | | | | | | | | |
| | |
Archer-Daniels-Midland Co. | | | 31,850 | | | | 2,402,127 | |
First Pacific Co. Ltd. (Indonesia) | | | 836,000 | | | | 330,191 | |
Hain Celestial Group, Inc. (The)* | | | 11,300 | | | | 117,181 | |
Indofood Sukses Makmur Tbk PT (Indonesia) | | | 106,800 | | | | 45,719 | |
Kraft Heinz Co. (The) | | | 12,800 | | | | 430,592 | |
Mondelez International, Inc. (Class A Stock) | | | 43,000 | | | | 2,984,200 | |
Mowi ASA (Norway) | | | 1,980 | | | | 34,997 | |
Nestle SA | | | 7,423 | | | | 840,254 | |
Orkla ASA (Norway) | | | 3,396 | | | | 25,365 | |
Sovos Brands, Inc.* | | | 7,900 | | | | 178,145 | |
WH Group Ltd. (Hong Kong), 144A | | | 70,000 | | | | 36,639 | |
Wilmar International Ltd. (China) | | | 223,700 | | | | 608,753 | |
| | | | | | | | |
| | |
| | | | | | | 8,034,163 | |
See Notes to Financial Statements.
PGIM Balanced Fund 23
Schedule of Investments (continued)
as of September 30, 2023
| | | | | | | | |
| | |
| Description | | Shares | | | Value | |
| | |
COMMON STOCKS (Continued) | | | | | | | | |
| | |
Gas Utilities 0.1% | | | | | | | | |
| | |
Beijing Enterprises Holdings Ltd. (China) | | | 34,000 | | | $ | 116,942 | |
Southwest Gas Holdings, Inc. | | | 1,900 | | | | 114,779 | |
Spire, Inc. | | | 1,250 | | | | 70,725 | |
Tokyo Gas Co. Ltd. (Japan) | | | 1,700 | | | | 38,544 | |
UGI Corp. | | | 29,075 | | | | 668,725 | |
| | | | | | | | |
| | |
| | | | | | | 1,009,715 | |
| | |
Ground Transportation 0.2% | | | | | | | | |
| | |
Uber Technologies, Inc.* | | | 44,900 | | | | 2,064,951 | |
| | |
Health Care Equipment & Supplies 1.6% | | | | | | | | |
| | |
Abbott Laboratories | | | 22,345 | | | | 2,164,113 | |
AngioDynamics, Inc.* | | | 9,700 | | | | 70,907 | |
AtriCure, Inc.* | | | 4,500 | | | | 197,100 | |
Avanos Medical, Inc.* | | | 7,750 | | | | 156,705 | |
Baxter International, Inc. | | | 28,200 | | | | 1,064,268 | |
Boston Scientific Corp.* | | | 50,800 | | | | 2,682,240 | |
DENTSPLY SIRONA, Inc. | | | 36,600 | | | | 1,250,256 | |
Enovis Corp.* | | | 11,400 | | | | 601,122 | |
GE HealthCare Technologies, Inc. | | | 18,500 | | | | 1,258,740 | |
Glaukos Corp.* | | | 100 | | | | 7,525 | |
Haemonetics Corp.* | | | 3,250 | | | | 291,135 | |
Inari Medical, Inc.* | | | 3,800 | | | | 248,520 | |
Integer Holdings Corp.* | | | 2,800 | | | | 219,604 | |
Intuitive Surgical, Inc.* | | | 5,200 | | | | 1,519,908 | |
Medtronic PLC | | | 25,700 | | | | 2,013,852 | |
OraSure Technologies, Inc.* | | | 7,000 | | | | 41,510 | |
TaiDoc Technology Corp. (Taiwan) | | | 14,000 | | | | 64,599 | |
Varex Imaging Corp.* | | | 1,500 | | | | 28,185 | |
Zimmer Biomet Holdings, Inc. | | | 2,475 | | | | 277,745 | |
Zimvie, Inc.* | | | 1,200 | | | | 11,292 | |
| | | | | | | | |
| | |
| | | | | | | 14,169,326 | |
| | |
Health Care Providers & Services 1.5% | | | | | | | | |
| | |
Accolade, Inc.* | | | 5,700 | | | | 60,306 | |
Bumrungrad Hospital PCL (Thailand) | | | 55,200 | | | | 405,297 | |
Cardinal Health, Inc. | | | 26,250 | | | | 2,279,025 | |
CorVel Corp.* | | | 720 | | | | 141,588 | |
Elevance Health, Inc. | | | 4,500 | | | | 1,959,390 | |
Encompass Health Corp. | | | 12,100 | | | | 812,636 | |
Guardant Health, Inc.* | | | 5,700 | | | | 168,948 | |
HealthEquity, Inc.* | | | 4,300 | | | | 314,115 | |
Humana, Inc. | | | 5,975 | | | | 2,906,957 | |
See Notes to Financial Statements.
24
| | | | | | | | |
| | |
| Description | | Shares | | | Value | |
| | |
COMMON STOCKS (Continued) | | | | | | | | |
| | |
Health Care Providers & Services (cont’d.) | | | | | | | | |
| | |
McKesson Corp. | | | 800 | | | $ | 347,880 | |
ModivCare, Inc.* | | | 2,150 | | | | 67,747 | |
Odontoprev SA (Brazil) | | | 67,400 | | | | 147,095 | |
Option Care Health, Inc.* | | | 1,900 | | | | 61,465 | |
Patterson Cos., Inc. | | | 1,600 | | | | 47,424 | |
Pediatrix Medical Group, Inc.* | | | 5,850 | | | | 74,353 | |
Progyny, Inc.* | | | 5,300 | | | | 180,306 | |
Sinopharm Group Co. Ltd. (China) (Class H Stock) | | | 71,600 | | | | 207,591 | |
Sonic Healthcare Ltd. (Australia) | | | 1,069 | | | | 20,413 | |
Tenet Healthcare Corp.* | | | 6,300 | | | | 415,107 | |
UnitedHealth Group, Inc. | | | 5,860 | | | | 2,954,553 | |
| | | | | | | | |
| | |
| | | | | | | 13,572,196 | |
| | |
Health Care REITs 0.0% | | | | | | | | |
| | |
Diversified Healthcare Trust | | | 59,950 | | | | 116,303 | |
Sabra Health Care REIT, Inc. | | | 13,500 | | | | 188,190 | |
| | | | | | | | |
| | |
| | | | | | | 304,493 | |
| | |
Health Care Technology 0.0% | | | | | | | | |
| | |
Multiplan Corp.* | | | 19,150 | | | | 32,172 | |
NextGen Healthcare, Inc.* | | | 7,050 | | | | 167,297 | |
Teladoc Health, Inc.* | | | 8,000 | | | | 148,720 | |
| | | | | | | | |
| | |
| | | | | | | 348,189 | |
| | |
Hotel & Resort REITs 0.0% | | | | | | | | |
| | |
Hersha Hospitality Trust (Class A Stock) | | | 12,550 | | | | 123,743 | |
| | |
Hotels, Restaurants & Leisure 1.0% | | | | | | | | |
| | |
Accor SA (France) | | | 1,218 | | | | 40,967 | |
Biglari Holdings, Inc. (Class B Stock)* | | | 170 | | | | 28,220 | |
Bloomin’ Brands, Inc. | | | 5,250 | | | | 129,097 | |
Booking Holdings, Inc.* | | | 320 | | | | 986,864 | |
Carrols Restaurant Group, Inc.* | | | 12,500 | | | | 82,375 | |
Century Casinos, Inc.* | | | 5,700 | | | | 29,241 | |
Create Restaurants Holdings, Inc. (Japan) | | | 12,100 | | | | 92,395 | |
Dave & Buster’s Entertainment, Inc.* | | | 3,350 | | | | 124,184 | |
Denny’s Corp.* | | | 2,000 | | | | 16,940 | |
Hiday Hidaka Corp. (Japan) | | | 2,600 | | | | 47,182 | |
Hilton Grand Vacations, Inc.* | | | 2,250 | | | | 91,575 | |
Hilton Worldwide Holdings, Inc. | | | 14,700 | | | | 2,207,646 | |
Jack in the Box, Inc. | | | 700 | | | | 48,342 | |
Leejam Sports Co. JSC (Saudi Arabia) | | | 1,950 | | | | 73,970 | |
See Notes to Financial Statements.
PGIM Balanced Fund 25
Schedule of Investments (continued)
as of September 30, 2023
| | | | | | | | |
| | |
| Description | | Shares | | | Value | |
| | |
COMMON STOCKS (Continued) | | | | | | | | |
| | |
Hotels, Restaurants & Leisure (cont’d.) | | | | | | | | |
| | |
Marriott International, Inc. (Class A Stock) | | | 3,475 | | | $ | 683,046 | |
McDonald’s Corp. | | | 8,720 | | | | 2,297,197 | |
Meituan (China) (Class B Stock), 144A* | | | 17,000 | | | | 246,095 | |
Oriental Land Co. Ltd. (Japan) | | | 20,600 | | | | 675,838 | |
Royal Caribbean Cruises Ltd.* | | | 1,200 | | | | 110,568 | |
Scandic Hotels Group AB (Sweden), 144A* | | | 28,449 | | | | 96,502 | |
Whitbread PLC (United Kingdom) | | | 9,617 | | | | 404,807 | |
Yum China Holdings, Inc. (China) | | | 1,800 | | | | 100,296 | |
| | | | | | | | |
| | |
| | | | | | | 8,613,347 | |
| | |
Household Durables 0.2% | | | | | | | | |
| | |
Beazer Homes USA, Inc.* | | | 7,400 | | | | 184,334 | |
KB Home | | | 4,100 | | | | 189,748 | |
Lennar Corp. (Class A Stock) | | | 3,200 | | | | 359,136 | |
M/I Homes, Inc.* | | | 250 | | | | 21,010 | |
Meritage Homes Corp. | | | 1,430 | | | | 175,018 | |
Pressance Corp. (Japan) | | | 7,600 | | | | 93,074 | |
Tamron Co. Ltd. (Japan) | | | 4,000 | | | | 122,219 | |
Taylor Morrison Home Corp.* | | | 5,550 | | | | 236,486 | |
Tri Pointe Homes, Inc.* | | | 7,800 | | | | 213,330 | |
| | | | | | | | |
| | |
| | | | | | | 1,594,355 | |
| | |
Household Products 1.0% | | | | | | | | |
| | |
Colgate-Palmolive Co. | | | 36,625 | | | | 2,604,404 | |
Energizer Holdings, Inc. | | | 400 | | | | 12,816 | |
Essity AB (Sweden) (Class B Stock) | | | 22,434 | | | | 483,840 | |
Henkel AG & Co. KGaA (Germany) | | | 448 | | | | 28,247 | |
Kimberly-Clark Corp. | | | 14,100 | | | | 1,703,985 | |
Procter & Gamble Co. (The) | | | 26,604 | | | | 3,880,459 | |
| | | | | | | | |
| | |
| | | | | | | 8,713,751 | |
| | |
Independent Power & Renewable Electricity Producers 0.3% | | | | | | | | |
| | |
AES Corp. (The) | | | 50,900 | | | | 773,680 | |
Vistra Corp. | | | 43,900 | | | | 1,456,602 | |
| | | | | | | | |
| | |
| | | | | | | 2,230,282 | |
| | |
Industrial Conglomerates 0.8% | | | | | | | | |
| | |
3M Co. | | | 26,950 | | | | 2,523,059 | |
General Electric Co. | | | 30,750 | | | | 3,399,412 | |
Honeywell International, Inc. | | | 1,175 | | | | 217,070 | |
KOC Holding A/S (Turkey) | | | 22,868 | | | | 122,240 | |
See Notes to Financial Statements.
26
| | | | | | | | |
| | |
| Description | | Shares | | | Value | |
| | |
COMMON STOCKS (Continued) | | | | | | | | |
| | |
Industrial Conglomerates (cont’d.) | | | | | | | | |
| | |
Mytilineos SA (Greece) | | | 3,129 | | | $ | 115,171 | |
Samsung C&T Corp. (South Korea) | | | 7,249 | | | | 577,966 | |
Siemens AG (Germany) | | | 1,258 | | | | 179,779 | |
| | | | | | | | |
| | |
| | | | | | | 7,134,697 | |
| | |
Industrial REITs 0.5% | | | | | | | | |
| | |
Americold Realty Trust, Inc. | | | 55,250 | | | | 1,680,152 | |
Goodman Group (Australia) | | | 49,236 | | | | 674,821 | |
Innovative Industrial Properties, Inc. | | | 600 | | | | 45,396 | |
LXP Industrial Trust | | | 25,900 | | | | 230,510 | |
Prologis, Inc. | | | 17,000 | | | | 1,907,570 | |
Terreno Realty Corp. | | | 200 | | | | 11,360 | |
| | | | | | | | |
| | |
| | | | | | | 4,549,809 | |
| | |
Insurance 1.7% | | | | | | | | |
| | |
Ambac Financial Group, Inc.* | | | 3,850 | | | | 46,431 | |
American International Group, Inc. | | | 29,300 | | | | 1,775,580 | |
Assicurazioni Generali SpA (Italy) | | | 30,975 | | | | 632,274 | |
Assurant, Inc. | | | 4,200 | | | | 603,036 | |
AXA SA (France) | | | 6,361 | | | | 188,724 | |
Axis Capital Holdings Ltd. | | | 16,200 | | | | 913,194 | |
CNO Financial Group, Inc. | | | 900 | | | | 21,357 | |
Coface SA (France) | | | 44,444 | | | | 565,821 | |
Dai-ichi Life Holdings, Inc. (Japan) | | | 4,600 | | | | 94,964 | |
DB Insurance Co. Ltd. (South Korea) | | | 2,112 | | | | 139,940 | |
eHealth, Inc.* | | | 11,600 | | | | 85,840 | |
Fairfax Financial Holdings Ltd. (Canada) | | | 900 | | | | 734,690 | |
Genworth Financial, Inc. (Class A Stock)* | | | 44,500 | | | | 260,770 | |
Great-West Lifeco, Inc. (Canada) | | | 900 | | | | 25,749 | |
Japan Post Insurance Co. Ltd. (Japan) | | | 1,200 | | | | 20,182 | |
Loews Corp. | | | 9,500 | | | | 601,445 | |
Manulife Financial Corp. (Canada) | | | 38,000 | | | | 694,394 | |
Marsh & McLennan Cos., Inc. | | | 4,700 | | | | 894,410 | |
Medibank Private Ltd. (Australia) | | | 217,601 | | | | 480,274 | |
MetLife, Inc. | | | 46,250 | | | | 2,909,588 | |
Muenchener Rueckversicherungs-Gesellschaft AG in Muenchen (Germany) | | | 2,098 | | | | 817,072 | |
Oscar Health, Inc. (Class A Stock)* | | | 11,800 | | | | 65,726 | |
Poste Italiane SpA (Italy), 144A | | | 2,412 | | | | 25,329 | |
QBE Insurance Group Ltd. (Australia) | | | 6,665 | | | | 66,765 | |
Samsung Fire & Marine Insurance Co. Ltd. (South Korea) | | | 1,040 | | | | 200,019 | |
Samsung Life Insurance Co. Ltd. (South Korea) | | | 1,910 | | | | 99,360 | |
Selectquote, Inc.* | | | 26,500 | | | | 31,005 | |
See Notes to Financial Statements.
PGIM Balanced Fund 27
Schedule of Investments (continued)
as of September 30, 2023
| | | | | | | | |
| | |
| Description | | Shares | | | Value | |
| | |
COMMON STOCKS (Continued) | | | | | | | | |
| | |
Insurance (cont’d.) | | | | | | | | |
| | |
Sompo Holdings, Inc. (Japan) | | | 700 | | | $ | 30,000 | |
Sun Life Financial, Inc. (Canada) | | | 14,500 | | | | 707,466 | |
Suncorp Group Ltd. (Australia) | | | 17,602 | | | | 156,827 | |
Talanx AG (Germany) | | | 936 | | | | 59,239 | |
Unum Group | | | 28,300 | | | | 1,392,077 | |
| | | | | | | | |
| | |
| | | | | | | 15,339,548 | |
| | |
Interactive Media & Services 3.0% | | | | | | | | |
| | |
Alphabet, Inc. (Class A Stock)* | | | 71,650 | | | | 9,376,119 | |
Alphabet, Inc. (Class C Stock)* | | | 63,340 | | | | 8,351,379 | |
Baidu, Inc. (China) (Class A Stock)* | | | 25,100 | | | | 422,450 | |
Bumble, Inc. (Class A Stock)* | | | 8,900 | | | | 132,788 | |
Cargurus, Inc.* | | | 8,700 | | | | 152,424 | |
Eventbrite, Inc. (Class A Stock)* | | | 20,500 | | | | 202,130 | |
Hello Group, Inc. (China), ADR | | | 31,400 | | | | 219,172 | |
Meta Platforms, Inc. (Class A Stock)* | | | 23,669 | | | | 7,105,671 | |
Tencent Holdings Ltd. (China) | | | 18,300 | | | | 709,380 | |
TrueCar, Inc.* | | | 7,500 | | | | 15,525 | |
| | | | | | | | |
| | |
| | | | | | | 26,687,038 | |
| | |
IT Services 0.8% | | | | | | | | |
| | |
Accenture PLC (Class A Stock) | | | 430 | | | | 132,057 | |
Akamai Technologies, Inc.* | | | 14,600 | | | | 1,555,484 | |
Arabian Internet & Communications Services Co. (Saudi Arabia) | | | 660 | | | | 56,317 | |
Cognizant Technology Solutions Corp. (Class A Stock) | | | 34,400 | | | | 2,330,256 | |
Elm Co. (Saudi Arabia) | | | 440 | | | | 91,490 | |
Fastly, Inc. (Class A Stock)* | | | 4,800 | | | | 92,016 | |
International Business Machines Corp. | | | 11,594 | | | | 1,626,638 | |
NEC Corp. (Japan) | | | 7,400 | | | | 408,648 | |
Nomura Research Institute Ltd. (Japan) | | | 17,900 | | | | 465,252 | |
Obic Co. Ltd. (Japan) | | | 600 | | | | 90,912 | |
Sopra Steria Group SACA (France) | | | 1,890 | | | | 390,169 | |
Squarespace, Inc. (Class A Stock)* | | | 2,200 | | | | 63,734 | |
Wix.com Ltd. (Israel)* | | | 500 | | | | 45,900 | |
Zensar Technologies Ltd. (India) | | | 27,647 | | | | 171,708 | |
| | | | | | | | |
| | |
| | | | | | | 7,520,581 | |
| | |
Leisure Products 0.0% | | | | | | | | |
| | |
Sega Sammy Holdings, Inc. (Japan) | | | 2,800 | | | | 51,639 | |
See Notes to Financial Statements.
28
| | | | | | | | |
| | |
| Description | | Shares | | | Value | |
| | |
COMMON STOCKS (Continued) | | | | | | | | |
| | |
Leisure Products (cont’d.) | | | | | | | | |
| | |
Solo Brands, Inc. (Class A Stock)* | | | 21,500 | | | $ | 109,650 | |
Tomy Co. Ltd. (Japan) | | | 9,500 | | | | 137,190 | |
| | | | | | | | |
| | |
| | | | | | | 298,479 | |
| | |
Life Sciences Tools & Services 0.4% | | | | | | | | |
| | |
Adaptive Biotechnologies Corp.* | | | 6,050 | | | | 32,972 | |
Azenta, Inc.* | | | 9,800 | | | | 491,862 | |
Quanterix Corp.* | | | 8,400 | | | | 227,976 | |
Thermo Fisher Scientific, Inc. | | | 2,958 | | | | 1,497,251 | |
West Pharmaceutical Services, Inc. | | | 3,000 | | | | 1,125,630 | |
| | | | | | | | |
| | |
| | | | | | | 3,375,691 | |
| | |
Machinery 1.0% | | | | | | | | |
| | |
AGCO Corp. | | | 1,100 | | | | 130,108 | |
Alfa Laval AB (Sweden) | | | 1,320 | | | | 45,221 | |
Allison Transmission Holdings, Inc. | | | 25,500 | | | | 1,506,030 | |
Atlas Copco AB (Sweden) (Class A Stock) | | | 28,476 | | | | 382,452 | |
Atlas Copco AB (Sweden) (Class B Stock) | | | 8,224 | | | | 96,180 | |
Blue Bird Corp.* | | | 1,800 | | | | 38,430 | |
Caterpillar, Inc. | | | 3,950 | | | | 1,078,350 | |
CNH Industrial NV (United Kingdom) | | | 7,666 | | | | 93,063 | |
Daimler Truck Holding AG (Germany) | | | 18,980 | | | | 657,168 | |
Doosan Bobcat, Inc. (South Korea) | | | 2,739 | | | | 103,381 | |
Epiroc AB (Sweden) (Class A Stock) | | | 2,377 | | | | 45,133 | |
Epiroc AB (Sweden) (Class B Stock) | | | 1,729 | | | | 27,659 | |
FANUC Corp. (Japan) | | | 14,300 | | | | 371,906 | |
GEA Group AG (Germany) | | | 960 | | | | 35,380 | |
Hyster-Yale Materials Handling, Inc. | | | 1,600 | | | | 71,328 | |
ITT, Inc. | | | 5,600 | | | | 548,296 | |
Komatsu Ltd. (Japan) | | | 22,500 | | | | 606,851 | |
Manitowoc Co., Inc. (The)* | | | 10,000 | | | | 150,500 | |
NTN Corp. (Japan) | | | 221,000 | | | | 420,708 | |
Oshkosh Corp. | | | 8,100 | | | | 772,983 | |
Proto Labs, Inc.* | | | 4,200 | | | | 110,880 | |
Shyft Group, Inc. (The) | | | 5,100 | | | | 76,347 | |
SKF AB (Sweden) (Class B Stock) | | | 6,025 | | | | 100,024 | |
Tennant Co. | | | 2,900 | | | | 215,035 | |
Terex Corp. | | | 5,100 | | | | 293,862 | |
Volvo AB (Sweden) (Class B Stock) | | | 39,291 | | | | 809,302 | |
Wabash National Corp. | | | 8,500 | | | | 179,520 | |
Yutong Bus Co. Ltd. (China) (Class A Stock) | | | 35,200 | | | | 64,036 | |
| | | | | | | | |
| | |
| | | | | | | 9,030,133 | |
See Notes to Financial Statements.
PGIM Balanced Fund 29
Schedule of Investments (continued)
as of September 30, 2023
| | | | | | | | |
| | |
| Description | | Shares | | | Value | |
| | |
COMMON STOCKS (Continued) | | | | | | | | |
| | |
Marine Transportation 0.1% | | | | | | | | |
| | |
AP Moller - Maersk A/S (Denmark) (Class A Stock) | | | 13 | | | $ | 23,006 | |
COSCO SHIPPING Holdings Co. Ltd. (China) (Class H Stock) | | | 42,000 | | | | 42,930 | |
D/S Norden A/S (Denmark) | | | 2,345 | | | | 130,242 | |
Evergreen Marine Corp. Taiwan Ltd. (Taiwan) | | | 79,600 | | | | 286,265 | |
Kuehne + Nagel International AG (Switzerland) | | | 340 | | | | 96,604 | |
Orient Overseas International Ltd. (Hong Kong) | | | 19,000 | | | | 253,068 | |
| | | | | | | | |
| | |
| | | | | | | 832,115 | |
| | |
Media 0.2% | | | | | | | | |
| | |
Advantage Solutions, Inc.* | | | 22,900 | | | | 65,036 | |
Comcast Corp. (Class A Stock) | | | 18,543 | | | | 822,197 | |
Dentsu Group, Inc. (Japan) | | | 900 | | | | 26,471 | |
Informa PLC (United Kingdom) | | | 21,184 | | | | 193,441 | |
Publicis Groupe SA (France) | | | 9,897 | | | | 749,130 | |
| | | | | | | | |
| | |
| | | | | | | 1,856,275 | |
| | |
Metals & Mining 0.6% | | | | | | | | |
| | |
Agnico Eagle Mines Ltd. (Canada) | | | 2,200 | | | | 99,970 | |
AMG Critical Materials NV (Netherlands) | | | 3,098 | | | | 92,972 | |
ArcelorMittal SA (Luxembourg) | | | 23,457 | | | | 587,271 | |
BHP Group Ltd. (Australia) | | | 4,662 | | | | 130,959 | |
BlueScope Steel Ltd. (Australia) | | | 7,145 | | | | 88,480 | |
Carpenter Technology Corp. | | | 4,350 | | | | 292,363 | |
Commercial Metals Co. | | | 5,850 | | | | 289,049 | |
Fortescue Metals Group Ltd. (Australia) | | | 33,672 | | | | 447,604 | |
Glencore PLC (Australia) | | | 47,764 | | | | 271,993 | |
Grupo Mexico SAB de CV (Mexico) (Class B Stock) | | | 91,600 | | | | 432,889 | |
Hindalco Industries Ltd. (India) | | | 9,261 | | | | 54,664 | |
Iluka Resources Ltd. (Australia) | | | 9,175 | | | | 44,808 | |
Nippon Steel Corp. (Japan) | | | 28,500 | | | | 667,702 | |
Norsk Hydro ASA (Norway) | | | 5,625 | | | | 35,200 | |
Olympic Steel, Inc. | | | 700 | | | | 39,347 | |
Pilbara Minerals Ltd. (Australia) | | | 11,340 | | | | 30,938 | |
Polyus PJSC (Russia)*^ | | | 3,704 | | | | — | |
Rio Tinto Ltd. (Australia) | | | 1,610 | | | | 116,126 | |
Rio Tinto PLC (Australia) | | | 5,653 | | | | 354,966 | |
Schnitzer Steel Industries, Inc. (Class A Stock) | | | 3,950 | | | | 110,008 | |
SSAB AB (Sweden) (Class A Stock) | | | 47,172 | | | | 265,813 | |
TimkenSteel Corp.* | | | 2,400 | | | | 52,128 | |
Tokyo Steel Manufacturing Co. Ltd. (Japan) | | | 27,600 | | | | 310,889 | |
See Notes to Financial Statements.
30
| | | | | | | | |
| | |
| Description | | Shares | | | Value | |
| | |
COMMON STOCKS (Continued) | | | | | | | | |
| | |
Metals & Mining (cont’d.) | | | | | | | | |
| | |
Vale SA (Brazil) | | | 35,700 | | | $ | 479,333 | |
West African Resources Ltd. (Australia)* | | | 629,919 | | | | 307,906 | |
| | | | | | | | |
| | |
| | | | | | | 5,603,378 | |
| | |
Mortgage Real Estate Investment Trusts (REITs) 0.0% | | | | | | | | |
| | |
Granite Point Mortgage Trust, Inc. | | | 10,300 | | | | 50,264 | |
MFA Financial, Inc. | | | 16,900 | | | | 162,409 | |
Redwood Trust, Inc. | | | 7,400 | | | | 52,762 | |
| | | | | | | | |
| | |
| | | | | | | 265,435 | |
| | |
Multi-Utilities 0.2% | | | | | | | | |
| | |
Avista Corp. | | | 6,300 | | | | 203,931 | |
Black Hills Corp. | | | 4,650 | | | | 235,243 | |
Centrica PLC (United Kingdom) | | | 213,971 | | | | 402,461 | |
Engie SA (France) | | | 20,423 | | | | 313,211 | |
NiSource, Inc. | | | 13,600 | | | | 335,648 | |
| | | | | | | | |
| | |
| | | | | | | 1,490,494 | |
| | |
Office REITs 0.0% | | | | | | | | |
| | |
Japan Excellent, Inc. (Japan) | | | 64 | | | | 56,612 | |
Mori Hills REIT Investment Corp. (Japan) | | | 126 | | | | 119,378 | |
Office Properties Income Trust | | | 20,450 | | | | 83,845 | |
Paramount Group, Inc. | | | 22,900 | | | | 105,798 | |
Piedmont Office Realty Trust, Inc. (Class A Stock) | | | 1,960 | | | | 11,015 | |
| | | | | | | | |
| | |
| | | | | | | 376,648 | |
| | |
Oil, Gas & Consumable Fuels 2.6% | | | | | | | | |
| | |
Berry Corp. | | | 3,100 | | | | 25,420 | |
BP PLC (United Kingdom) | | | 169,442 | | | | 1,092,212 | |
BW LPG Ltd. (Singapore), 144A | | | 1,640 | | | | 20,629 | |
Callon Petroleum Co.* | | | 3,200 | | | | 125,184 | |
Chevron Corp. | | | 10,625 | | | | 1,791,587 | |
Chord Energy Corp. | | | 250 | | | | 40,518 | |
Civitas Resources, Inc. | | | 3,650 | | | | 295,176 | |
Coal India Ltd. (India) | | | 27,021 | | | | 95,833 | |
Exxon Mobil Corp. | | | 50,125 | | | | 5,893,697 | |
Great Eastern Shipping Co. Ltd. (The) (India) | | | 4,645 | | | | 47,302 | |
Gulfport Energy Corp.* | | | 900 | | | | 106,794 | |
Imperial Oil Ltd. (Canada) | | | 5,500 | | | | 338,767 | |
Indian Oil Corp. Ltd. (India) | | | 37,880 | | | | 41,431 | |
Inpex Corp. (Japan) | | | 4,200 | | | | 62,993 | |
See Notes to Financial Statements.
PGIM Balanced Fund 31
Schedule of Investments (continued)
as of September 30, 2023
| | | | | | | | |
| | |
| Description | | Shares | | | Value | |
| | |
COMMON STOCKS (Continued) | | | | | | | | |
| | |
Oil, Gas & Consumable Fuels (cont’d.) | | | | | | | | |
| | |
Kosmos Energy Ltd. (Ghana)* | | | 33,500 | | | $ | 274,030 | |
LUKOIL PJSC (Russia)^ | | | 10,297 | | | | — | |
Marathon Petroleum Corp. | | | 19,450 | | | | 2,943,563 | |
Murphy Oil Corp. | | | 4,350 | | | | 197,273 | |
Oil & Natural Gas Corp. Ltd. (India) | | | 290,820 | | | | 669,519 | |
ORLEN SA (Poland) | | | 42,570 | | | | 570,344 | |
Par Pacific Holdings, Inc.* | | | 4,800 | | | | 172,512 | |
Parex Resources, Inc. (Canada) | | | 8,200 | | | | 153,888 | |
PBF Energy, Inc. (Class A Stock) | | | 3,200 | | | | 171,296 | |
Peabody Energy Corp. | | | 11,850 | | | | 307,981 | |
PetroChina Co. Ltd. (China) (Class H Stock) | | | 696,000 | | | | 521,605 | |
Petroleo Brasileiro SA (Brazil) | | | 19,400 | | | | 145,619 | |
Phillips 66 | | | 24,800 | | | | 2,979,720 | |
Repsol SA (Spain) | | | 5,660 | | | | 93,101 | |
Rosneft Oil Co. PJSC (Russia)^ | | | 31,520 | | | | — | |
Shanxi Lu’an Environmental Energy Development Co. Ltd. (China) (Class A Stock) | | | 61,100 | | | | 159,543 | |
Shell PLC (Netherlands) | | | 41,776 | | | | 1,324,058 | |
SM Energy Co. | | | 8,600 | | | | 340,990 | |
TotalEnergies SE (France) | | | 1,682 | | | | 110,590 | |
Valero Energy Corp. | | | 12,625 | | | | 1,789,089 | |
World Kinect Corp. | | | 6,949 | | | | 155,866 | |
| | | | | | | | |
| | |
| | | | | | | 23,058,130 | |
| | |
Paper & Forest Products 0.0% | | | | | | | | |
| | |
Navigator Co. SA (The) (Portugal) | | | 14,975 | | | | 56,431 | |
| | |
Passenger Airlines 0.4% | | | | | | | | |
| | |
Air France-KLM (France)* | | | 2,625 | | | | 32,853 | |
Alaska Air Group, Inc.* | | | 20,150 | | | | 747,162 | |
ANA Holdings, Inc. (Japan)* | | | 23,100 | | | | 483,669 | |
Deutsche Lufthansa AG (Germany)* | | | 53,971 | | | | 427,094 | |
Japan Airlines Co. Ltd. (Japan) | | | 2,000 | | | | 38,858 | |
Qantas Airways Ltd. (Australia)* | | | 10,962 | | | | 36,290 | |
Singapore Airlines Ltd. (Singapore) | | | 110,600 | | | | 521,724 | |
SkyWest, Inc.* | | | 5,660 | | | | 237,381 | |
United Airlines Holdings, Inc.* | | | 25,950 | | | | 1,097,685 | |
| | | | | | | | |
| | |
| | | | | | | 3,622,716 | |
| | |
Personal Care Products 0.1% | | | | | | | | |
| | |
Chlitina Holding Ltd. (China) | | | 43,000 | | | | 250,692 | |
elf Beauty, Inc.* | | | 3,050 | | | | 334,981 | |
See Notes to Financial Statements.
32
| | | | | | | | |
| | |
| Description | | Shares | | | Value | |
| | |
COMMON STOCKS (Continued) | | | | | | | | |
| | |
Personal Care Products (cont’d.) | | | | | | | | |
| | |
Herbalife Ltd.* | | | 4,600 | | | $ | 64,354 | |
Unilever PLC (United Kingdom) | | | 4,856 | | | | 240,211 | |
| | | | | | | | |
| | |
| | | | | | | 890,238 | |
| | |
Pharmaceuticals 3.2% | | | | | | | | |
| | |
Amneal Pharmaceuticals, Inc.* | | | 38,300 | | | | 161,626 | |
ANI Pharmaceuticals, Inc.* | | | 500 | | | | 29,030 | |
Astellas Pharma, Inc. (Japan) | | | 43,600 | | | | 603,495 | |
AstraZeneca PLC (United Kingdom) | | | 2,183 | | | | 294,453 | |
Bristol-Myers Squibb Co. | | | 39,245 | | | | 2,277,780 | |
China Medical System Holdings Ltd. (China) | | | 263,000 | | | | 396,945 | |
Chugai Pharmaceutical Co. Ltd. (Japan) | | | 9,800 | | | | 302,174 | |
Elanco Animal Health, Inc.* | | | 128,800 | | | | 1,447,712 | |
Eli Lilly & Co. | | | 12,350 | | | | 6,633,555 | |
GSK PLC | | | 45,117 | | | | 816,338 | |
Harmony Biosciences Holdings, Inc.* | | | 1,750 | | | | 57,347 | |
Ipsen SA (France) | | | 1,195 | | | | 156,571 | |
Johnson & Johnson | | | 41,619 | | | | 6,482,159 | |
Ligand Pharmaceuticals, Inc.* | | | 1,200 | | | | 71,904 | |
Merck & Co., Inc. | | | 13,925 | | | | 1,433,579 | |
Novartis AG (Switzerland) | | | 14,505 | | | | 1,481,376 | |
Novo Nordisk A/S (Denmark) (Class B Stock) | | | 22,220 | | | | 2,023,159 | |
Otsuka Holdings Co. Ltd. (Japan) | | | 15,100 | | | | 536,127 | |
Pfizer, Inc. | | | 22,225 | | | | 737,203 | |
Prestige Consumer Healthcare, Inc.* | | | 2,910 | | | | 166,423 | |
Roche Holding AG | | | 3,566 | | | | 973,522 | |
Sanofi | | | 4,685 | | | | 503,053 | |
Shionogi & Co. Ltd. (Japan) | | | 13,500 | | | | 602,160 | |
Theravance Biopharma, Inc.* | | | 1,950 | | | | 16,829 | |
| | | | | | | | |
| | |
| | | | | | | 28,204,520 | |
| | |
Professional Services 0.4% | | | | | | | | |
| | |
Automatic Data Processing, Inc. | | | 9,200 | | | | 2,213,336 | |
Conduent, Inc.* | | | 29,600 | | | | 103,008 | |
ExlService Holdings, Inc.* | | | 5,750 | | | | 161,230 | |
MEITEC Group Holdings, Inc. (Japan) | | | 3,600 | | | | 65,107 | |
Open Up Group, Inc. (Japan) | | | 15,200 | | | | 186,431 | |
Parsons Corp.* | | | 4,450 | | | | 241,858 | |
TriNet Group, Inc.* | | | 750 | | | | 87,360 | |
TrueBlue, Inc.* | | | 5,550 | | | | 81,419 | |
TTEC Holdings, Inc. | | | 1,850 | | | | 48,507 | |
Upwork, Inc.* | | | 18,000 | | | | 204,480 | |
See Notes to Financial Statements.
PGIM Balanced Fund 33
Schedule of Investments (continued)
as of September 30, 2023
| | | | | | | | |
| | |
| Description | | Shares | | | Value | |
| | |
COMMON STOCKS (Continued) | | | | | | | | |
| | |
Professional Services (cont’d.) | | | | | | | | |
| | |
UT Group Co. Ltd. (Japan)* | | | 2,700 | | | $ | 40,214 | |
Wolters Kluwer NV (Netherlands) | | | 612 | | | | 74,098 | |
| | | | | | | | |
| | |
| | | | | | | 3,507,048 | |
| | |
Real Estate Management & Development 0.2% | | | | | | | | |
| | |
Anywhere Real Estate, Inc.* | | | 30,150 | | | | 193,865 | |
Cushman & Wakefield PLC* | | | 2,500 | | | | 19,050 | |
Douglas Elliman, Inc. | | | 10,200 | | | | 23,052 | |
Emaar Properties PJSC (United Arab Emirates) | | | 335,595 | | | | 734,428 | |
Forestar Group, Inc.* | | | 4,800 | | | | 129,312 | |
KE Holdings, Inc. (China), ADR | | | 15,600 | | | | 242,112 | |
Tosei Corp. (Japan) | | | 3,900 | | | | 50,309 | |
| | | | | | | | |
| | |
| | | | | | | 1,392,128 | |
| | |
Residential REITs 0.3% | | | | | | | | |
| | |
Centerspace | | | 700 | | | | 42,182 | |
Equity Residential | | | 35,400 | | | | 2,078,334 | |
Veris Residential, Inc. | | | 13,300 | | | | 219,450 | |
| | | | | | | | |
| | |
| | | | | | | 2,339,966 | |
| | |
Retail REITs 0.1% | | | | | | | | |
| | |
Acadia Realty Trust | | | 7,300 | | | | 104,755 | |
Klepierre SA (France) | | | 13,038 | | | | 319,243 | |
Macerich Co. (The) | | | 11,500 | | | | 125,465 | |
RPT Realty | | | 10,150 | | | | 107,184 | |
Urban Edge Properties | | | 700 | | | | 10,682 | |
| | | | | | | | |
| | |
| | | | | | | 667,329 | |
| | |
Semiconductors & Semiconductor Equipment 4.1% | | | | | | | | |
| | |
Amkor Technology, Inc. | | | 10,150 | | | | 229,390 | |
Applied Materials, Inc. | | | 10,400 | | | | 1,439,880 | |
ASML Holding NV (Netherlands) | | | 2,060 | | | | 1,212,826 | |
Axcelis Technologies, Inc.* | | | 1,900 | | | | 309,795 | |
Broadcom, Inc. | | | 1,955 | | | | 1,623,784 | |
Diodes, Inc.* | | | 1,300 | | | | 102,492 | |
Disco Corp. (Japan) | | | 3,400 | | | | 628,171 | |
FormFactor, Inc.* | | | 500 | | | | 17,470 | |
Infineon Technologies AG (Germany) | | | 23,863 | | | | 790,360 | |
Intel Corp. | | | 103,800 | | | | 3,690,090 | |
King Yuan Electronics Co. Ltd. (Taiwan) | | | 25,000 | | | | 58,957 | |
Lam Research Corp. | | | 4,600 | | | | 2,883,142 | |
See Notes to Financial Statements.
34
| | | | | | | | |
| | |
| Description | | Shares | | | Value | |
| | |
COMMON STOCKS (Continued) | | | | | | | | |
| | |
Semiconductors & Semiconductor Equipment (cont’d.) | | | | | | | | |
| | |
Novatek Microelectronics Corp. (Taiwan) | | | 13,000 | | | $ | 170,711 | |
NVIDIA Corp. | | | 32,650 | | | | 14,202,423 | |
NXP Semiconductors NV (China) | | | 8,200 | | | | 1,639,344 | |
ON Semiconductor Corp.* | | | 3,300 | | | | 306,735 | |
Photronics, Inc.* | | | 10,100 | | | | 204,121 | |
QUALCOMM, Inc. | | | 30,700 | | | | 3,409,542 | |
Renesas Electronics Corp. (Japan)* | | | 37,500 | | | | 572,811 | |
SCREEN Holdings Co. Ltd. (Japan) | | | 6,400 | | | | 311,015 | |
Skyworks Solutions, Inc. | | | 7,300 | | | | 719,707 | |
SMART Global Holdings, Inc.* | | | 500 | | | | 12,175 | |
STMicroelectronics NV (Singapore) | | | 17,909 | | | | 772,291 | |
Synaptics, Inc.* | | | 650 | | | | 58,136 | |
Taiwan Semiconductor Manufacturing Co. Ltd. (Taiwan) | | | 77,000 | | | | 1,255,581 | |
| | | | | | | | |
| | |
| | | | | | | 36,620,949 | |
| | |
Software 5.1% | | | | | | | | |
| | |
ACI Worldwide, Inc.* | | | 9,300 | | | | 209,808 | |
Adeia, Inc. | | | 18,250 | | | | 194,910 | |
Adobe, Inc.* | | | 1,868 | | | | 952,493 | |
Appfolio, Inc. (Class A Stock)* | | | 1,650 | | | | 301,339 | |
Blackbaud, Inc.* | | | 400 | | | | 28,128 | |
Box, Inc. (Class A Stock)* | | | 4,250 | | | | 102,893 | |
Check Point Software Technologies Ltd. (Israel)* | | | 4,700 | | | | 626,416 | |
CommVault Systems, Inc.* | | | 2,850 | | | | 192,689 | |
Digital Turbine, Inc.* | | | 5,000 | | | | 30,250 | |
Freshworks, Inc. (Class A Stock)* | | | 12,500 | | | | 249,000 | |
Intuit, Inc. | | | 6,000 | | | | 3,065,640 | |
LiveRamp Holdings, Inc.* | | | 2,600 | | | | 74,984 | |
Matterport, Inc.* | | | 14,700 | | | | 31,899 | |
Microsoft Corp. | | | 89,016 | | | | 28,106,802 | |
NCR Corp.* | | | 81,000 | | | | 2,184,570 | |
Open Text Corp. (Canada) | | | 1,200 | | | | 42,116 | |
Rapid7, Inc.* | | | 1,900 | | | | 86,982 | |
Salesforce, Inc.* | | | 20,100 | | | | 4,075,878 | |
ServiceNow, Inc.* | | | 5,850 | | | | 3,269,916 | |
SolarWinds Corp.* | | | 18,400 | | | | 173,696 | |
Sprinklr, Inc. (Class A Stock)* | | | 3,200 | | | | 44,288 | |
SPS Commerce, Inc.* | | | 1,676 | | | | 285,942 | |
Tenable Holdings, Inc.* | | | 2,700 | | | | 120,960 | |
Teradata Corp.* | | | 16,075 | | | | 723,696 | |
Verint Systems, Inc.* | | | 6,700 | | | | 154,033 | |
See Notes to Financial Statements.
PGIM Balanced Fund 35
Schedule of Investments (continued)
as of September 30, 2023
| | | | | | | | |
| | |
| Description | | Shares | | | Value | |
| | |
COMMON STOCKS (Continued) | | | | | | | | |
| | |
Software (cont’d.) | | | | | | | | |
| | |
Xero Ltd. (New Zealand)* | | | 644 | | | $ | 46,315 | |
Yext, Inc.* | | | 2,450 | | | | 15,509 | |
| | | | | | | | |
| | |
| | | | | | | 45,391,152 | |
| | |
Specialized REITs 0.1% | | | | | | | | |
| | |
American Tower Corp. | | | 2,600 | | | | 427,570 | |
Digital Realty Trust, Inc. | | | 2,100 | | | | 254,142 | |
Public Storage | | | 1,900 | | | | 500,688 | |
| | | | | | | | |
| | |
| | | | | | | 1,182,400 | |
| | |
Specialty Retail 0.9% | | | | | | | | |
| | |
Aaron’s Co., Inc. (The) | | | 2,200 | | | | 23,034 | |
Abercrombie & Fitch Co. (Class A Stock)* | | | 700 | | | | 39,459 | |
American Eagle Outfitters, Inc. | | | 16,000 | | | | 265,760 | |
Chico’s FAS, Inc.* | | | 7,450 | | | | 55,726 | |
Genesco, Inc.* | | | 1,300 | | | | 40,066 | |
Group 1 Automotive, Inc. | | | 260 | | | | 69,865 | |
Home Depot, Inc. (The) | | | 4,658 | | | | 1,407,461 | |
Industria de Diseno Textil SA (Spain) | | | 23,849 | | | | 887,470 | |
JB Hi-Fi Ltd. (Australia) | | | 12,238 | | | | 355,459 | |
JD Sports Fashion PLC (United Kingdom) | | | 281,349 | | | | 511,079 | |
Lowe’s Cos., Inc. | | | 6,475 | | | | 1,345,764 | |
ODP Corp. (The)* | | | 2,300 | | | | 106,145 | |
Petco Health & Wellness Co., Inc.* | | | 281,200 | | | | 1,150,108 | |
Signet Jewelers Ltd. | | | 700 | | | | 50,267 | |
ThredUp, Inc. (Class A Stock)* | | | 4,600 | | | | 18,446 | |
TJX Cos., Inc. (The) | | | 13,900 | | | | 1,235,432 | |
Urban Outfitters, Inc.* | | | 7,100 | | | | 232,099 | |
| | | | | | | | |
| | |
| | | | | | | 7,793,640 | |
| | |
Technology Hardware, Storage & Peripherals 3.4% | | | | | | | | |
| | |
Acer, Inc. (Taiwan) | | | 38,000 | | | | 42,818 | |
Advantech Co. Ltd. (Taiwan) | | | 3,299 | | | | 35,324 | |
Apple, Inc. | | | 154,554 | | | | 26,461,190 | |
Asustek Computer, Inc. (Taiwan) | | | 3,000 | | | | 34,137 | |
Compal Electronics, Inc. (Taiwan) | | | 46,000 | | | | 43,834 | |
Hewlett Packard Enterprise Co. | | | 86,550 | | | | 1,503,374 | |
Quanta Computer, Inc. (Taiwan) | | | 102,000 | | | | 763,379 | |
Samsung Electronics Co. Ltd. (South Korea) | | | 10,714 | | | | 541,637 | |
Super Micro Computer, Inc.* | | | 870 | | | | 238,571 | |
Wistron Corp. (Taiwan) | | | 165,000 | | | | 522,532 | |
Wiwynn Corp. (Taiwan) | | | 1,000 | | | | 46,631 | |
See Notes to Financial Statements.
36
| | | | | | | | |
| | |
| Description | | Shares | | | Value | |
| | |
COMMON STOCKS (Continued) | | | | | | | | |
| | |
Technology Hardware, Storage & Peripherals (cont’d.) | | | | | | | | |
| | |
Xerox Holdings Corp. | | | 11,950 | | | $ | 187,496 | |
Xiaomi Corp. (China) (Class B Stock), 144A* | | | 74,200 | | | | 116,242 | |
| | | | | | | | |
| | |
| | | | | | | 30,537,165 | |
| | |
Textiles, Apparel & Luxury Goods 0.4% | | | | | | | | |
| | |
Cie Financiere Richemont SA (Switzerland) (Class A Stock) | | | 1,155 | | | | 140,660 | |
G-III Apparel Group Ltd.* | | | 4,200 | | | | 104,664 | |
Goldwin, Inc. (Japan) | | | 4,000 | | | | 270,868 | |
Hermes International SCA (France) | | | 487 | | | | 887,717 | |
Lululemon Athletica, Inc.* | | | 4,000 | | | | 1,542,440 | |
LVMH Moet Hennessy Louis Vuitton SE (France) | | | 529 | | | | 399,305 | |
Mavi Giyim Sanayi Ve Ticaret A/S (Turkey) (Class B Stock), 144A | | | 6,946 | | | | 28,546 | |
Youngone Corp. (South Korea) | | | 1,898 | | | | 67,840 | |
| | | | | | | | |
| | |
| | | | | | | 3,442,040 | |
| | |
Tobacco 0.3% | | | | | | | | |
| | |
British American Tobacco PLC (United Kingdom) | | | 19,256 | | | | 604,613 | |
Imperial Brands PLC (United Kingdom) | | | 30,236 | | | | 613,380 | |
ITC Ltd. (India) | | | 111,353 | | | | 594,962 | |
Japan Tobacco, Inc. (Japan) | | | 5,173 | | | | 119,021 | |
Scandinavian Tobacco Group A/S (Denmark), 144A | | | 19,075 | | | | 290,559 | |
Turning Point Brands, Inc. | | | 4,500 | | | | 103,905 | |
Vector Group Ltd. | | | 4,250 | | | | 45,220 | |
| | | | | | | | |
| | |
| | | | | | | 2,371,660 | |
| | |
Trading Companies & Distributors 0.3% | | | | | | | | |
| | |
Ashtead Group PLC (United Kingdom) | | | 8,576 | | | | 520,071 | |
BlueLinx Holdings, Inc.* | | | 200 | | | | 16,418 | |
Boise Cascade Co. | | | 2,510 | | | | 258,630 | |
Finning International, Inc. (Canada) | | | 5,000 | | | | 147,469 | |
GMS, Inc.* | | | 3,690 | | | | 236,049 | |
Marubeni Corp. (Japan) | | | 2,600 | | | | 40,529 | |
Rexel SA (France) | | | 14,782 | | | | 331,205 | |
Russel Metals, Inc. (Canada) | | | 5,500 | | | | 153,956 | |
Toromont Industries Ltd. (Canada) | | | 500 | | | | 40,722 | |
Toyota Tsusho Corp. (Japan) | | | 900 | | | | 52,935 | |
Veritiv Corp. | | | 1,500 | | | | 253,350 | |
W.W. Grainger, Inc. | | | 375 | | | | 259,440 | |
| | | | | | | | |
| | |
| | | | | | | 2,310,774 | |
See Notes to Financial Statements.
PGIM Balanced Fund 37
Schedule of Investments (continued)
as of September 30, 2023
| | | | | | | | |
| | |
| Description | | Shares | | | Value | |
| | |
COMMON STOCKS (Continued) | | | | | | | | |
| | |
Water Utilities 0.0% | | | | | | | | |
| | |
American States Water Co. | | | 700 | | | $ | 55,076 | |
| | |
Wireless Telecommunication Services 0.2% | | | | | | | | |
| | |
Etihad Etisalat Co. (Saudi Arabia) | | | 3,540 | | | | 42,052 | |
Intelsat Emergence SA (Luxembourg)* | | | 4,226 | | | | 94,662 | |
Mobile Telecommunications Co. KSCP (Kuwait) | | | 12,403 | | | | 19,520 | |
Spok Holdings, Inc. | | | 2,700 | | | | 38,529 | |
Telephone & Data Systems, Inc. | | | 4,500 | | | | 82,395 | |
TIM SA (Brazil) | | | 6,600 | | | | 19,630 | |
T-Mobile US, Inc.* | | | 8,650 | | | | 1,211,433 | |
| | | | | | | | |
| | |
| | | | | | | 1,508,221 | |
| | | | | | | | |
| | |
TOTAL COMMON STOCKS (cost $417,700,049) | | | | | | | 528,321,971 | |
| | | | | | | | |
| | |
PREFERRED STOCKS 0.2% | | | | | | | | |
| | |
Automobiles 0.0% | | | | | | | | |
| | |
Bayerische Motoren Werke AG (Germany) (PRFC) | | | 242 | | | | 22,526 | |
| | |
Banks 0.0% | | | | | | | | |
| | |
Citigroup Capital XIII, 12.001%(c), 3 Month SOFR + 6.632%, Maturing 10/30/40 | | | 3,000 | | | | 87,990 | |
| | |
Capital Markets 0.0% | | | | | | | | |
| | |
State Street Corp., 5.350%(ff), Series G, Maturing 03/15/26(oo) | | | 5,000 | | | | 116,000 | |
| | |
Electric Utilities 0.1% | | | | | | | | |
| | |
Cia Energetica de Minas Gerais (Brazil) (PRFC) | | | 108,939 | | | | 268,308 | |
| | |
Metals & Mining 0.0% | | | | | | | | |
| | |
Gerdau SA (Brazil) (PRFC) | | | 8,500 | | | | 40,669 | |
| | |
Oil, Gas & Consumable Fuels 0.1% | | | | | | | | |
| | |
Petroleo Brasileiro SA (Brazil) (PRFC) | | | 126,800 | | | | 869,794 | |
| | |
Technology Hardware, Storage & Peripherals 0.0% | | | | | | | | |
| | |
Samsung Electronics Co. Ltd. (South Korea) (PRFC) | | | 3,708 | | | | 149,382 | |
| | | | | | | | |
| | |
TOTAL PREFERRED STOCKS
(cost $1,238,208) | | | | | | | 1,554,669 | |
| | | | | | | | |
See Notes to Financial Statements.
38
| | | | | | | | | | | | | | | | |
| | | | |
| Description | | | | | | | | Units | | | Value | |
| | | | |
RIGHTS* 0.0% | | | | | | | | | | | | | | | | |
| | | | |
Wireless Telecommunication Services | | | | | | | | | | | | | | | | |
| | | | |
Intelsat Jackson Holdings SA, Series A (Luxembourg), CVR, expiring 12/05/25^ | | | | | | | | | | | 440 | | | $ | 2,750 | |
Intelsat Jackson Holdings SA, Series B (Luxembourg), CVR, expiring 12/05/25^ | | | | | | | | | | | 440 | | | | 1,760 | |
| | | | | | | | | | | | | | | | |
| | | | |
TOTAL RIGHTS
(cost $0) | | | | | | | | | | | | | | | 4,510 | |
| | | | | | | | | | | | | | | | |
| | | | |
| | | | | | | | | Shares | | | | |
| | | | |
UNAFFILIATED EXCHANGE-TRADED FUND 0.1% | | | | | | | | | | | | | | | | |
iShares MSCI EAFE ETF
(cost $608,217) | | | | | | | | | | | 9,000 | | | | 620,280 | |
| | | | | | | | | | | | | | | | |
| | | | |
| | | Interest Rate | | | Maturity Date | | | Principal Amount (000)# | | | | |
| | | | |
ASSET-BACKED SECURITIES 5.9% | | | | | | | | | | | | | | | | |
| | | | |
Automobiles 1.1% | | | | | | | | | | | | | | | | |
| | | | |
AmeriCredit Automobile Receivables Trust, | | | | | | | | | | | | | | | | |
Series 2019-02, Class C | | | 2.740% | | | | 04/18/25 | | | | 16 | | | | 16,243 | |
Series 2019-03, Class C | | | 2.320 | | | | 07/18/25 | | | | 220 | | | | 218,874 | |
Series 2020-02, Class D | | | 2.130 | | | | 03/18/26 | | | | 100 | | | | 95,608 | |
Avis Budget Rental Car Funding AESOP LLC, | | | | | | | | | | | | | | | | |
Series 2018-02A, Class A, 144A | | | 4.000 | | | | 03/20/25 | | | | 300 | | | | 298,481 | |
Series 2020-01A, Class A, 144A | | | 2.330 | | | | 08/20/26 | | | | 500 | | | | 468,503 | |
Series 2020-02A, Class A, 144A | | | 2.020 | | | | 02/20/27 | | | | 100 | | | | 91,255 | |
Series 2021-02A, Class C, 144A | | | 2.350 | | | | 02/20/28 | | | | 500 | | | | 428,358 | |
Series 2023-03A, Class B, 144A | | | 6.120 | | | | 02/22/28 | | | | 400 | | | | 394,261 | |
Exeter Automobile Receivables Trust,
Series 2020-03A, Class D | | | 1.730 | | | | 07/15/26 | | | | 83 | | | | 81,282 | |
Ford Credit Auto Owner Trust, | | | | | | | | | | | | | | | | |
Series 2021-01, Class C, 144A | | | 1.910 | | | | 10/17/33 | | | | 180 | | | | 160,584 | |
Series 2021-02, Class D, 144A | | | 2.600 | | | | 05/15/34 | | | | 300 | | | | 259,347 | |
Series 2023-01, Class C, 144A | | | 5.580 | | | | 08/15/35 | | | | 500 | | | | 484,667 | |
Hertz Vehicle Financing III LLC, | | | | | | | | | | | | | | | | |
Series 2022-01A, Class C, 144A | | | 2.630 | | | | 06/25/26 | | | | 100 | | | | 93,217 | |
Series 2023-01A, Class B, 144A | | | 6.220 | | | | 06/25/27 | | | | 500 | | | | 495,318 | |
Hertz Vehicle Financing III LP, | | | | | | | | | | | | | | | | |
Series 2021-02A, Class A, 144A | | | 1.680 | | | | 12/27/27 | | | | 700 | | | | 614,094 | |
Series 2021-02A, Class B, 144A | | | 2.120 | | | | 12/27/27 | | | | 100 | | | | 87,644 | |
See Notes to Financial Statements.
PGIM Balanced Fund 39
Schedule of Investments (continued)
as of September 30, 2023
| | | | | | | | | | | | | | | | |
| | | | |
| Description | | Interest Rate | | | Maturity Date | | | Principal Amount (000)# | | | Value | |
| | | | |
ASSET-BACKED SECURITIES (Continued) | | | | | | | | | | | | | | | | |
| | | | |
Automobiles (cont’d.) | | | | | | | | | | | | | | | | |
| | | | |
Hertz Vehicle Financing LLC,
Series 2022-02A, Class B, 144A | | | 2.650% | | | | 06/26/28 | | | | 100 | | | $ | 87,491 | |
JPMorgan Chase Bank, NA, | | | | | | | | | | | | | | | | |
Series 2020-02, Class D, 144A | | | 1.487 | | | | 02/25/28 | | | | 41 | | | | 40,316 | |
Series 2021-02, Class D, 144A | | | 1.138 | | | | 12/26/28 | | | | 63 | | | | 61,557 | |
OneMain Direct Auto Receivables Trust, | | | | | | | | | | | | | | | | |
Series 2019-01A, Class A, 144A | | | 3.630 | | | | 09/14/27 | | | | 1,280 | | | | 1,242,361 | |
Series 2021-01A, Class C, 144A | | | 1.420 | | | | 07/14/28 | | | | 500 | | | | 449,660 | |
Series 2023-01A, Class B, 144A | | | 5.810 | | | | 02/14/31 | | | | 1,000 | | | | 973,071 | |
Series 2023-01A, Class C, 144A | | | 6.140 | | | | 02/14/31 | | | | 400 | | | | 389,876 | |
Santander Bank Auto Credit-Linked Notes, | | | | | | | | | | | | | | | | |
Series 2022-A, Class C, 144A | | | 7.375 | | | | 05/15/32 | | | | 126 | | | | 125,158 | |
Series 2022-C, Class E, 144A | | | 11.366 | | | | 12/15/32 | | | | 191 | | | | 192,398 | |
Santander Drive Auto Receivables Trust, | | | | | | | | | | | | | | | | |
Series 2020-02, Class D | | | 2.220 | | | | 09/15/26 | | | | 56 | | | | 55,343 | |
Series 2020-03, Class D | | | 1.640 | | | | 11/16/26 | | | | 308 | | | | 301,178 | |
Series 2020-04, Class D | | | 1.480 | | | | 01/15/27 | | | | 279 | | | | 272,147 | |
Series 2021-01, Class D | | | 1.130 | | | | 11/16/26 | | | | 800 | | | | 772,185 | |
World Omni Select Auto Trust,
Series 2019-A, Class C | | | 2.380 | | | | 12/15/25 | | | | 81 | | | | 80,670 | |
| | | | | | | | | | | | | | | | |
| | | | |
| | | | | | | | | | | | | | | 9,331,147 | |
| | | | | | | | | | | | | | | | |
| | | | |
Collateralized Debt Obligation 0.0% | | | | | �� | | | | | | | | | | | |
| | | | |
Arbor Realty Commercial Real Estate Notes Ltd. (Cayman Islands),
Series 2022-FL01, Class A, 144A, 30 Day Average SOFR + 1.450% (Cap N/A, Floor 1.450%) | | | 6.763(c) | | | | 01/15/37 | | | | 290 | | | | 287,452 | |
| | | | | | | | | | | | | | | | |
| | | | |
Collateralized Loan Obligations 4.1% | | | | | | | | | | | | | | | | |
| | | | |
AlbaCore Euro CLO DAC (Ireland),
Series 04A, Class B1, 144A, 3 Month EURIBOR + 2.600% (Cap N/A, Floor 2.600%) | | | 6.263(c) | | | | 07/15/35 | | | EUR | 2,000 | | | | 2,097,465 | |
Balboa Bay Loan Funding Ltd. (Cayman Islands),
Series 2020-01A, Class AR, 144A, 3 Month SOFR + 1.382% (Cap N/A, Floor 1.120%) | | | 6.715(c) | | | | 01/20/32 | | | | 1,500 | | | | 1,496,674 | |
Barings CLO Ltd. (Cayman Islands),
Series LP-02A, Class A, 144A, 3 Month LIBOR + 1.100% (Cap N/A, Floor 1.100%) | | | 6.688(c) | | | | 01/20/34 | | | | 2,100 | | | | 2,097,235 | |
See Notes to Financial Statements.
40
| | | | | | | | | | | | | | | | |
| | | | |
| Description | | Interest Rate | | | Maturity Date | | | Principal Amount (000)# | | | Value | |
| | | | |
ASSET-BACKED SECURITIES (Continued) | | | | | | | | | | | | | | | | |
| | | | |
Collateralized Loan Obligations (cont’d.) | | | | | | | | | | | | | | | | |
| | | | |
Battalion CLO Ltd. (Cayman Islands), | | | | | | | | | | | | | | | | |
Series 2018-12A, Class A1, 144A, 3 Month SOFR + 1.332% (Cap N/A, Floor 1.070%) | | | 6.708%(c) | | | | 05/17/31 | | | | 988 | | | $ | 981,687 | |
Carlyle CLO Ltd. (Cayman Islands), | | | | | | | | | | | | | | | | |
Series C17A, Class A1AR, 144A, 3 Month SOFR + 1.292% (Cap N/A, Floor 0.000%) | | | 6.661(c) | | | | 04/30/31 | | | | 999 | | | | 993,927 | |
CVC Cordatus Loan Fund DAC (Ireland), | | | | | | | | | | | | | | | | |
Series 14A, Class A1R, 144A, 3 Month EURIBOR + 0.850% (Cap N/A, Floor 0.850%) | | | 4.666(c) | | | | 05/22/32 | | | EUR | 1,500 | | | | 1,562,485 | |
Series 14A, Class A2R, 144A | | | 1.250 | | | | 05/22/32 | | | EUR | 1,500 | | | | 1,487,267 | |
Elmwood CLO Ltd. (Cayman Islands), | | | | | | | | | | | | | | | | |
Series 2019-02A, Class AR, 144A, 3 Month SOFR + 1.412% (Cap N/A, Floor 1.412%) | | | 6.738(c) | | | | 04/20/34 | | | | 1,350 | | | | 1,344,692 | |
Madison Park Funding Ltd. (Cayman Islands), | | | | | | | | | | | | | | | | |
Series 2021-59A, Class A, 144A, 3 Month SOFR + 1.402% (Cap N/A, Floor 1.140%) | | | 6.712(c) | | | | 01/18/34 | | | | 1,500 | | | | 1,493,285 | |
Series 2021-59A, Class B, 144A, 3 Month SOFR + 1.962% (Cap N/A, Floor 1.700%) | | | 7.272(c) | | | | 01/18/34 | | | | 1,000 | | | | 991,400 | |
Northwoods Capital Ltd. (Cayman Islands), | | | | | | | | | | | | | | | | |
Series 2020-22A, Class AR, 144A, 3 Month SOFR + 1.450% (Cap N/A, Floor 1.450%) | | | 6.727(c) | | | | 09/01/31 | | | | 2,500 | | | | 2,484,546 | |
OZLM Ltd. (Cayman Islands), | | | | | | | | | | | | | | | | |
Series 2018-20A, Class A1, 144A, 3 Month SOFR + 1.312% (Cap N/A, Floor 1.050%) | | | 6.638(c) | | | | 04/20/31 | | | | 1,458 | | | | 1,452,231 | |
Palmer Square CLO Ltd. (Cayman Islands), | | | | | | | | | | | | | | | | |
Series 2018-02A, Class A1A, 144A, 3 Month SOFR + 1.362% (Cap N/A, Floor 0.000%) | | | 6.670(c) | | | | 07/16/31 | | | | 4,000 | | | | 3,993,757 | |
Park Avenue Institutional Advisers CLO Ltd. (Cayman Islands), | | | | | | | | | | | | | | | | |
Series 2019-02A, Class A1R, 144A, 3 Month SOFR + 1.442% (Cap N/A, Floor 1.180%) | | | 6.750(c) | | | | 10/15/34 | | | | 3,500 | | | | 3,466,962 | |
Sixth Street CLO Ltd. (Cayman Islands), | | | | | | | | | | | | | | | | |
Series 2021-19A, Class A, 144A, 3 Month SOFR + 1.362% (Cap N/A, Floor 1.100%) | | | 6.688(c) | | | | 07/20/34 | | | | 4,000 | | | | 3,970,887 | |
TCW CLO Ltd. (Cayman Islands), | | | | | | | | | | | | | | | | |
Series 2019-02A, Class A1R, 144A, 3 Month SOFR + 1.280% (Cap N/A, Floor 1.280%) | | | 6.606(c) | | | | 10/20/32 | | | | 3,500 | | | | 3,465,739 | |
TIAA CLO Ltd. (Cayman Islands), | | | | | | | | | | | | | | | | |
Series 2016-01A, Class AR, 144A, 3 Month SOFR + 1.462% (Cap N/A, Floor 0.000%) | | | 6.788(c) | | | | 07/20/31 | | | | 250 | | | | 248,819 | |
See Notes to Financial Statements.
PGIM Balanced Fund 41
Schedule of Investments (continued)
as of September 30, 2023
| | | | | | | | | | | | | | | | |
| | | | |
| Description | | Interest Rate | | | Maturity Date | | | Principal Amount (000)# | | | Value | |
| | | | |
ASSET-BACKED SECURITIES (Continued) | | | | | | | | | | | | | | | | |
| | | | |
Collateralized Loan Obligations (cont’d.) | | | | | | | | | | | | | | | | |
| | | | |
Trinitas Euro CLO DAC (Ireland), | | | | | | | | | | | | | | | | |
Series 02A, Class CR, 144A, 3 Month EURIBOR + 3.750% (Cap N/A, Floor 3.750%) | | | 7.413%(c) | | | | 04/15/35 | | | EUR | 2,750 | | | $ | 2,901,045 | |
Wellfleet CLO Ltd. (Cayman Islands), | | | | | | | | | | | | | | | | |
Series 2018-02A, Class A1, 144A, 3 Month SOFR + 1.462% (Cap N/A, Floor 1.200%) | | | 6.788(c) | | | | 10/20/31 | | | | 500 | | | | 498,750 | |
| | | | | | | | | | | | | | | | |
| | | | |
| | | | | | | | | | | | | | | 37,028,853 | |
| | | | | | | | | | | | | | | | |
| | | | |
Consumer Loans 0.4% | | | | | | | | | | | | | | | | |
| | | | |
Fairstone Financial Issuance Trust (Canada), | | | | | | | | | | | | | | | | |
Series 2020-01A, Class A, 144A | | | 2.509 | | | | 10/20/39 | | | CAD | 200 | | | | 141,841 | |
Lending Funding Trust, | | | | | | | | | | | | | | | | |
Series 2020-02A, Class A, 144A | | | 2.320 | | | | 04/21/31 | | | | 100 | | | | 89,209 | |
Lendmark Funding Trust, | | | | | | | | | | | | | | | | |
Series 2021-01A, Class A, 144A | | | 1.900 | | | | 11/20/31 | | | | 700 | | | | 604,395 | |
Mariner Finance Issuance Trust, | | | | | | | | | | | | | | | | |
Series 2020-AA, Class A, 144A | | | 2.190 | | | | 08/21/34 | | | | 177 | | | | 172,194 | |
OneMain Financial Issuance Trust, | | | | | | | | | | | | | | | | |
Series 2020-01A, Class A, 144A | | | 3.840 | | | | 05/14/32 | | | | 18 | | | | 17,725 | |
Series 2020-02A, Class A, 144A | | | 1.750 | | | | 09/14/35 | | | | 400 | | | | 358,888 | |
Series 2022-02A, Class D, 144A | | | 6.550 | | | | 10/14/34 | | | | 800 | | | | 767,324 | |
Series 2023-02A, Class C, 144A | | | 6.740 | | | | 09/15/36 | | | | 200 | | | | 199,125 | |
Series 2023-02A, Class D, 144A | | | 7.520 | | | | 09/15/36 | | | | 200 | | | | 199,115 | |
Oportun Issuance Trust, | | | | | | | | | | | | | | | | |
Series 2022-02, Class A, 144A | | | 5.940 | | | | 10/09/29 | | | | 236 | | | | 235,574 | |
Regional Management Issuance Trust, | | | | | | | | | | | | | | | | |
Series 2022-01, Class A, 144A | | | 3.070 | | | | 03/15/32 | | | | 400 | | | | 372,900 | |
| | | | | | | | | | | | | | | | |
| | | | |
| | | | | | | | | | | | | | | 3,158,290 | |
| | | | | | | | | | | | | | | | |
| | | | |
Credit Cards 0.1% | | | | | | | | | | | | | | | | |
| | | | |
Newday Funding Master Issuer PLC (United Kingdom), | | | | | | | | | | | | | | | | |
Series 2021-02A, Class A1, 144A, SONIA + 0.800% (Cap N/A, Floor 0.000%) | | | 5.996(c) | | | | 07/15/29 | | | GBP | 100 | | | | 121,729 | |
Newday Partnership Funding PLC (United Kingdom), | | | | | | | | | | | | | | | | |
Series 2020-01A, Class A3, 144A, SONIA + 1.400% (Cap N/A, Floor 0.000%) | | | 6.596(c) | | | | 11/15/28 | | | GBP | 265 | | | | 323,446 | |
| | | | | | | | | | | | | | | | |
| | | | |
| | | | | | | | | | | | | | | 445,175 | |
| | | | | | | | | | | | | | | | |
See Notes to Financial Statements.
42
| | | | | | | | | | | | | | | | |
| | | | |
| Description | | Interest Rate | | | Maturity Date | | | Principal Amount (000)# | | | Value | |
| | | | |
ASSET-BACKED SECURITIES (Continued) | | | | | | | | | | | | | | | | |
| | | | |
Equipment 0.0% | | | | | | | | | | | | | | | | |
| | | | |
MMAF Equipment Finance LLC, | | | | | | | | | | | | | | | | |
Series 2017-B, Class A5, 144A | | | 2.720% | | | | 06/15/40 | | | | 232 | | | $ | 226,670 | |
| | | | | | | | | | | | | | | | |
| | | | |
Home Equity Loans 0.0% | | | | | | | | | | | | | | | | |
| | | | |
Towd Point HE Trust, | | | | | | | | | | | | | | | | |
Series 2023-01, Class A1A, 144A | | | 6.875 | | | | 02/25/63 | | | | 122 | | | | 121,244 | |
| | | | | | | | | | | | | | | | |
| | | | |
Other 0.1% | | | | | | | | | | | | | | | | |
| | | | |
Loandepot GMSR Master Trust, | | | | | | | | | | | | | | | | |
Series 2018-GT01, Class A, 144A, 1 Month LIBOR + 2.800% (Cap N/A, Floor 2.800%) | | | 8.245(c) | | | | 10/16/23 | | | | 100 | | | | 90,292 | |
TH MSR Issuer Trust, | | | | | | | | | | | | | | | | |
Series 2019-FT01, Class A, 144A, 1 Month SOFR + 2.914% (Cap N/A, Floor 2.800%) | | | 8.234(c) | | | | 06/25/24 | | | | 700 | | | | 680,663 | |
| | | | | | | | | | | | | | | | |
| | | | |
| | | | | | | | | | | | | | | 770,955 | |
| | | | | | | | | | | | | | | | |
| | | | |
Residential Mortgage-Backed Securities 0.0% | | | | | | | | | | | | | | | | |
| | | | |
Countrywide Asset-Backed Certificates, | | | | | | | | | | | | | | | | |
Series 2004-01, Class M1, 1 Month SOFR + 0.864% (Cap N/A, Floor 0.750%) | | | 6.184(c) | | | | 03/25/34 | | | | 21 | | | | 20,838 | |
Rathlin Residential DAC (Ireland), | | | | | | | | | | | | | | | | |
Series 2021-01A, Class A, 144A, 1 Month EURIBOR + 2.000% (Cap N/A, Floor 0.000%) | | | 5.865(c) | | | | 09/27/75 | | | EUR | 319 | | | | 331,732 | |
| | | | | | | | | | | | | | | | |
| | | | |
| | | | | | | | | | | | | | | 352,570 | |
| | | | | | | | | | | | | | | | |
| | | | |
Student Loans 0.1% | | | | | | | | | | | | | | | | |
| | | | |
Commonbond Student Loan Trust, | | | | | | | | | | | | | | | | |
Series 2017-BGS, Class A1, 144A | | | 2.680 | | | | 09/25/42 | | | | 93 | | | | 83,999 | |
Series 2018-AGS, Class A1, 144A | | | 3.210 | | | | 02/25/44 | | | | 74 | | | | 67,131 | |
Series 2018-CGS, Class A1, 144A | | | 3.870 | | | | 02/25/46 | | | | 29 | | | | 27,093 | |
Laurel Road Prime Student Loan Trust, | | | | | | | | | | | | | | | | |
Series 2017-C, Class A2B, 144A | | | 2.810 | | | | 11/25/42 | | | | 6 | | | | 5,739 | |
Series 2018-B, Class A2FX, 144A | | | 3.540 | | | | 05/26/43 | | | | 16 | | | | 16,061 | |
Series 2019-A, Class A2FX, 144A | | | 2.730 | | | | 10/25/48 | | | | 39 | | | | 37,345 | |
Navient Private Education Refi Loan Trust, | | | | | | | | | | | | | | | | |
Series 2018-CA, Class A2, 144A | | | 3.520 | | | | 06/16/42 | | | | 21 | | | | 20,831 | |
Series 2019-CA, Class A2, 144A | | | 3.130 | | | | 02/15/68 | | | | 93 | | | | 88,534 | |
SoFi Professional Loan Program LLC, | | | | | | | | | | | | | | | | |
Series 2019-B, Class A2FX, 144A | | | 3.090 | | | | 08/17/48 | | | | 126 | | | | 118,379 | |
See Notes to Financial Statements.
PGIM Balanced Fund 43
Schedule of Investments (continued)
as of September 30, 2023
| | | | | | | | | | | | | | | | |
| | | | |
| Description | | Interest Rate | | | Maturity Date | | | Principal Amount (000)# | | | Value | |
| | | | |
ASSET-BACKED SECURITIES (Continued) | | | | | | | | | | | | | | | | |
| | | | |
Student Loans (cont’d.) | | | | | | | | | | | | | | | | |
| | | | |
SoFi Professional Loan Program LLC, (cont’d.) | | | | | | | | | | | | | | | | |
Series 2019-C, Class A2FX, 144A | | | 2.370% | | | | 11/16/48 | | | | 249 | | | $ | 228,278 | |
SoFi Professional Loan Program Trust, | | | | | | | | | | | | | | | | |
Series 2018-B, Class A2FX, 144A | | | 3.340 | | | | 08/25/47 | | | | 70 | | | | 67,443 | |
Series 2020-A, Class A2FX, 144A | | | 2.540 | | | | 05/15/46 | | | | 337 | | | | 308,342 | |
| | | | | | | | | | | | | | | | |
| | | | |
| | | | | | | | | | | | | | | 1,069,175 | |
| | | | | | | | | | | | | | | | |
| | | | |
TOTAL ASSET-BACKED SECURITIES
(cost $54,503,802) | | | | | | | | | | | | | | | 52,791,531 | |
| | | | | | | | | | | | | | | | |
| | | | |
COMMERCIAL MORTGAGE-BACKED SECURITIES 6.2% | | | | | | | | | | | | | | | | |
BANK, | | | | | | | | | | | | | | | | |
Series 2017-BNK04, Class A3 | | | 3.362 | | | | 05/15/50 | | | | 995 | | | | 918,307 | |
Series 2020-BN26, Class A3 | | | 2.155 | | | | 03/15/63 | | | | 1,800 | | | | 1,440,461 | |
Bank of America Merrill Lynch Commercial Mortgage Trust, | | | | | | | | | | | | | | | | |
Series 2017-BNK03, Class XB, IO | | | 0.735(cc) | | | | 02/15/50 | | | | 40,575 | | | | 718,997 | |
Barclays Commercial Mortgage Securities Trust, | | | | | | | | | | | | | | | | |
Series 2018-C02, Class A4 | | | 4.047 | | | | 12/15/51 | | | | 1,351 | | | | 1,239,543 | |
Series 2020-C07, Class XB, IO | | | 1.099(cc) | | | | 04/15/53 | | | | 4,900 | | | | 268,630 | |
Benchmark Mortgage Trust, | | | | | | | | | | | | | | | | |
Series 2019-B13, Class A3 | | | 2.701 | | | | 08/15/57 | | | | 1,800 | | | | 1,526,230 | |
Series 2020-B17, Class A4 | | | 2.042 | | | | 03/15/53 | | | | 650 | | | | 509,158 | |
Series 2023-V02, Class A3 | | | 5.812(cc) | | | | 05/15/55 | | | | 1,900 | | | | 1,873,662 | |
BMO Mortgage Trust, | | | | | | | | | | | | | | | | |
Series 2023-C06, Class XB, IO | | | 0.348(cc) | | | | 09/15/56 | | | | 90,697 | | | | 1,426,637 | |
BX Commercial Mortgage Trust, | | | | | | | | | | | | | | | | |
Series 2019-XL, Class J, 144A, 1 Month SOFR + 2.764% (Cap N/A, Floor 2.650%) | | | 8.097(c) | | | | 10/15/36 | | | | 1,275 | | | | 1,248,940 | |
Series 2021-ACNT, Class E, 144A, 1 Month SOFR + 2.311% (Cap N/A, Floor 2.197%) | | | 7.643(c) | | | | 11/15/38 | | | | 1,000 | | | | 967,377 | |
BX Trust, | | | | | | | | | | | | | | | | |
Series 2021-LGCY, Class F, 144A, 1 Month SOFR + 2.063% (Cap N/A, Floor 1.949%) | | | 7.395(c) | | | | 10/15/36 | | | | 1,350 | | | | 1,269,958 | |
CENT Trust, | | | | | | | | | | | | | | | | |
Series 2023-CITY, Class A, 144A, 1 Month SOFR + 2.620% (Cap N/A, Floor 2.620%) | | | 7.952(c) | | | | 09/15/28 | | | | 750 | | | | 749,676 | |
CFK Trust, | | | | | | | | | | | | | | | | |
Series 2020-MF02, Class B, 144A | | | 2.792 | | | | 03/15/39 | | | | 1,200 | | | | 1,011,076 | |
Series 2020-MF02, Class C, 144A | | | 2.995 | | | | 03/15/39 | | | | 1,500 | | | | 1,233,553 | |
Series 2020-MF02, Class D, 144A | | | 3.349 | | | | 03/15/39 | | | | 900 | | | | 719,855 | |
See Notes to Financial Statements.
44
| | | | | | | | | | | | | | | | |
| | | | |
| Description | | Interest Rate | | | Maturity Date | | | Principal Amount (000)# | | | Value | |
| | | |
COMMERCIAL MORTGAGE-BACKED SECURITIES (Continued) | | | | | | | | | | | | | |
Citigroup Commercial Mortgage Trust, | | | | | | | | | | | | | | | | |
Series 2014-GC21, Class A4 | | | 3.575% | | | | 05/10/47 | | | | 127 | | | $ | 125,939 | |
Series 2015-GC29, Class A3 | | | 2.935 | | | | 04/10/48 | | | | 385 | | | | 373,102 | |
Series 2015-P01, Class A4 | | | 3.462 | | | | 09/15/48 | | | | 600 | | | | 577,234 | |
Series 2019-GC41, Class A4 | | | 2.620 | | | | 08/10/56 | | | | 3,600 | | | | 3,034,461 | |
Series 2020-GC46, Class A4 | | | 2.477 | | | | 02/15/53 | | | | 1,400 | | | | 1,138,906 | |
Commercial Mortgage Trust, | | | | | | | | | | | | | | | | |
Series 2014-CR18, Class A4 | | | 3.550 | | | | 07/15/47 | | | | 144 | | | | 140,893 | |
Series 2014-UBS04, Class A4 | | | 3.420 | | | | 08/10/47 | | | | 700 | | | | 683,335 | |
Series 2015-LC21, Class A3 | | | 3.445 | | | | 07/10/48 | | | | 546 | | | | 526,299 | |
Credit Suisse Mortgage Capital Certificates, | | | | | | | | | | | | | | | | |
Series 2019-ICE04, Class F, 144A, 1 Month SOFR + 2.697% (Cap N/A, Floor 2.650%) | | | 8.030(c) | | | | 05/15/36 | | | | 1,762 | | | | 1,735,296 | |
Credit Suisse Mortgage Trust, | | | | | | | | | | | | | | | | |
Series 2014-USA, Class A2, 144A | | | 3.953 | | | | 09/15/37 | | | | 1,600 | | | | 1,365,321 | |
CSAIL Commercial Mortgage Trust, | | | | | | | | | | | | | | | | |
Series 2015-C02, Class A3 | | | 3.231 | | | | 06/15/57 | | | | 649 | | | | 624,726 | |
Series 2017-C08, Class A3 | | | 3.127 | | | | 06/15/50 | | | | 763 | | | | 680,468 | |
Deutsche Bank Commercial Mortgage Trust, | | | | | | | | | | | | | | | | |
Series 2016-C01, Class A3A | | | 3.015 | | | | 05/10/49 | | | | 705 | | | | 653,627 | |
FHLMC Multifamily Structured Pass-Through Certificates, | | | | | | | | | | | | | | | | |
Series K055, Class X1, IO | | | 1.473(cc) | | | | 03/25/26 | | | | 2,111 | | | | 59,721 | |
GS Mortgage Securities Trust, | | | | | | | | | | | | | | | | |
Series 2015-GC28, Class A4 | | | 3.136 | | | | 02/10/48 | | | | 368 | | | | 359,282 | |
Series 2021-GSA03, Class XB, IO | | | 0.746(cc) | | | | 12/15/54 | | | | 35,000 | | | | 1,463,154 | |
JPMorgan Chase Commercial Mortgage Securities Trust, | | | | | | | | | | | | | | | | |
Series 2018-AON, Class E, 144A | | | 4.767(cc) | | | | 07/05/31 | | | | 800 | | | | 274,259 | |
Series 2019-BKWD, Class A, 144A, 1 Month SOFR + 1.364% (Cap N/A, Floor 1.000%) | | | 6.947(c) | | | | 09/15/29 | | | | 476 | | | | 438,828 | |
Morgan Stanley Bank of America Merrill Lynch Trust, | | | | | | | | | | | | | | | | |
Series 2015-C23, Class A3 | | | 3.451 | | | | 07/15/50 | | | | 574 | | | | 548,236 | |
Series 2015-C25, Class A4 | | | 3.372 | | | | 10/15/48 | | | | 700 | | | | 664,561 | |
Morgan Stanley Capital I Trust, | | | | | | | | | | | | | | | | |
Series 2016-UB11, Class A3 | | | 2.531 | | | | 08/15/49 | | | | 1,269 | | | | 1,155,910 | |
Series 2019-H06, Class A3 | | | 3.158 | | | | 06/15/52 | | | | 1,250 | | | | 1,080,736 | |
Series 2020-L04, Class A2 | | | 2.449 | | | | 02/15/53 | | | | 3,600 | | | | 2,923,676 | |
MTN Commercial Mortgage Trust, | | | | | | | | | | | | | | | | |
Series 2022-LPFL, Class E, 144A, 1 Month SOFR + 4.289% (Cap N/A, Floor 4.289%) | | | 9.629(c) | | | | 03/15/39 | | | | 1,100 | | | | 1,040,146 | |
UBS Commercial Mortgage Trust, | | | | | | | | | | | | | | | | |
Series 2017-C05, Class A4 | | | 3.212 | | | | 11/15/50 | | | | 1,422 | | | | 1,296,307 | |
Series 2018-C08, Class A4 | | | 3.983 | | | | 02/15/51 | | | | 1,650 | | | | 1,501,631 | |
Series 2018-C09, Class A3 | | | 3.854 | | | | 03/15/51 | | | | 350 | | | | 318,713 | |
See Notes to Financial Statements.
PGIM Balanced Fund 45
Schedule of Investments (continued)
as of September 30, 2023
| | | | | | | | | | | | | | | | |
| | | | |
| Description | | Interest Rate | | | Maturity Date | | | Principal Amount (000)# | | | Value | |
| | | |
COMMERCIAL MORTGAGE-BACKED SECURITIES (Continued) | | | | | | | | | | | | | |
UBS Commercial Mortgage Trust, (cont’d.) | | | | | | | | | | | | | | | | |
Series 2018-C14, Class A3 | | | 4.180% | | | | 12/15/51 | | | | 814 | | | $ | 746,572 | |
Wells Fargo Commercial Mortgage Trust, | | | | | | | | | | | | | | | | |
Series 2015-NXS02, Class A4 | | | 3.498 | | | | 07/15/58 | | | | 800 | | | | 770,750 | |
Series 2016-C33, Class A3 | | | 3.162 | | | | 03/15/59 | | | | 878 | | | | 819,272 | |
Series 2016-C34, Class A3 | | | 2.834 | | | | 06/15/49 | | | | 800 | | | | 752,145 | |
Series 2016-C35, Class A3 | | | 2.674 | | | | 07/15/48 | | | | 1,061 | | | | 980,323 | |
Series 2016-NXS06, Class A3 | | | 2.642 | | | | 11/15/49 | | | | 1,500 | | | | 1,380,091 | |
Series 2017-C38, Class A4 | | | 3.190 | | | | 07/15/50 | | | | 643 | | | | 585,211 | |
Series 2017-C39, Class A4 | | | 3.157 | | | | 09/15/50 | | | | 3,000 | | | | 2,715,270 | |
Series 2018-C46, Class A3 | | | 3.888 | | | | 08/15/51 | | | | 1,050 | | | | 952,012 | |
Series 2018-C48, Class A4 | | | 4.037 | | | | 01/15/52 | | | | 1,671 | | | | 1,549,746 | |
Series 2019-C52, Class A3 | | | 2.631 | | | | 08/15/52 | | | | 2,500 | | | | 2,393,050 | |
| | | | | | | | | | | | | | | | |
| | | | |
TOTAL COMMERCIAL MORTGAGE-BACKED SECURITIES
(cost $62,616,025) | | | | | | | | | | | | | | | 55,551,269 | |
| | | | | | | | | | | | | | | | |
| | | | |
CONVERTIBLE BOND 0.0% | | | | | | | | | | | | | | | | |
| | | | |
Telecommunications | | | | | | | | | | | | | | | | |
| | | | |
Digicel Group Holdings Ltd. (Jamaica), | | | | | | | | | | | | | | | | |
Sub. Notes, 144A, Cash coupon 7.000% (original cost $4,575; purchased 03/21/23 - 04/03/23)(f)
(cost $4,575) | | | 7.000 | | | | 10/16/23(d)(oo) | | | | 31 | | | | 1,646 | |
| | | | | | | | | | | | | | | | |
| | | | |
CORPORATE BONDS 15.8% | | | | | | | | | | | | | | | | |
| | | | |
Aerospace & Defense 0.4% | | | | | | | | | | | | | | | | |
| | | | |
Boeing Co. (The), | | | | | | | | | | | | | | | | |
Sr. Unsec’d. Notes | | | 2.196 | | | | 02/04/26 | | | | 1,860 | | | | 1,708,731 | |
Sr. Unsec’d. Notes | | | 3.625 | | | | 03/01/48 | | | | 555 | | | | 359,992 | |
Bombardier, Inc. (Canada), | | | | | | | | | | | | | | | | |
Sr. Unsec’d. Notes, 144A | | | 6.000 | | | | 02/15/28 | | | | 475 | | | | 431,062 | |
Sr. Unsec’d. Notes, 144A | | | 7.125 | | | | 06/15/26 | | | | 375 | | | | 362,235 | |
Sr. Unsec’d. Notes, 144A | | | 7.500 | | | | 03/15/25 | | | | 112 | | | | 111,720 | |
Sr. Unsec’d. Notes, 144A | | | 7.500 | | | | 02/01/29 | | | | 75 | | | | 71,063 | |
Sr. Unsec’d. Notes, 144A | | | 7.875 | | | | 04/15/27 | | | | 425 | | | | 413,372 | |
RTX Corp., | | | | | | | | | | | | | | | | |
Sr. Unsec’d. Notes | | | 4.125 | | | | 11/16/28 | | | | 235 | | | | 218,775 | |
| | | | | | | | | | | | | | | | |
| | | | |
| | | | | | | | | | | | | | | 3,676,950 | |
See Notes to Financial Statements.
46
| | | | | | | | | | | | | | | | |
| | | | |
| Description | | Interest Rate | | | Maturity Date | | | Principal Amount (000)# | | | Value | |
| | | | |
CORPORATE BONDS (Continued) | | | | | | | | | | | | | | | | |
| | | | |
Agriculture 0.5% | | | | | | | | | | | | | | | | |
| | | | |
Altria Group, Inc., | | | | | | | | | | | | | | | | |
Gtd. Notes | | | 3.400% | | | | 02/04/41 | | | | 620 | | | $ | 401,546 | |
BAT Capital Corp. (United Kingdom), | | | | | | | | | | | | | | | | |
Gtd. Notes | | | 3.557 | | | | 08/15/27 | | | | 108 | | | | 98,726 | |
Gtd. Notes | | | 6.343 | | | | 08/02/30 | | | | 100 | | | | 98,421 | |
BAT International Finance PLC (United Kingdom), | | | | | | | | | | | | | | | | |
Gtd. Notes | | | 4.448 | | | | 03/16/28 | | | | 1,410 | | | | 1,314,538 | |
Gtd. Notes | | | 5.931 | | | | 02/02/29 | | | | 30 | | | | 29,441 | |
Philip Morris International, Inc., | | | | | | | | | | | | | | | | |
Sr. Unsec’d. Notes | | | 5.125 | | | | 02/15/30 | | | | 1,970 | | | | 1,889,571 | |
Vector Group Ltd., | | | | | | | | | | | | | | | | |
Sr. Sec’d. Notes, 144A | | | 5.750 | | | | 02/01/29 | | | | 400 | | | | 339,790 | |
| | | | | | | | | | | | | | | | |
| | | | |
| | | | | | | | | | | | | | | 4,172,033 | |
| | | | |
Airlines 0.1% | | | | | | | | | | | | | | | | |
| | | | |
American Airlines 2016-1 Class AA Pass-Through Trust, | | | | | | | | | | | | | | | | |
Pass-Through Certificates | | | 3.575 | | | | 07/15/29 | | | | 140 | | | | 128,443 | |
Continental Airlines 2012-2 Class A Pass-Through Trust, | | | | | | | | | | | | | | | | |
Pass-Through Certificates | | | 4.000 | | | | 04/29/26 | | | | 61 | | | | 59,163 | |
Southwest Airlines Co., | | | | | | | | | | | | | | | | |
Sr. Unsec’d. Notes | | | 5.125 | | | | 06/15/27 | | | | 260 | | | | 253,380 | |
United Airlines 2014-1 Class A Pass-Through Trust, | | | | | | | | | | | | | | | | |
Pass-Through Certificates | | | 4.000 | | | | 10/11/27 | | | | 51 | | | | 48,037 | |
United Airlines, Inc., | | | | | | | | | | | | | | | | |
Sr. Sec’d. Notes, 144A | | | 4.375 | | | | 04/15/26 | | | | 260 | | | | 240,592 | |
Sr. Sec’d. Notes, 144A | | | 4.625 | | | | 04/15/29 | | | | 60 | | | | 51,620 | |
| | | | | | | | | | | | | | | | |
| | | | |
| | | | | | | | | | | | | | | 781,235 | |
| | | | |
Auto Manufacturers 0.3% | | | | | | | | | | | | | | | | |
| | | | |
Ford Motor Co., | | | | | | | | | | | | | | | | |
Sr. Unsec’d. Notes | | | 4.750 | | | | 01/15/43 | | | | 350 | | | | 255,358 | |
Sr. Unsec’d. Notes | | | 5.291 | | | | 12/08/46 | | | | 135 | | | | 102,601 | |
Ford Motor Credit Co. LLC, | | | | | | | | | | | | | | | | |
Sr. Unsec’d. Notes | | | 2.900 | | | | 02/16/28 | | | | 425 | | | | 361,203 | |
General Motors Co., | | | | | | | | | | | | | | | | |
Sr. Unsec’d. Notes | | | 5.000 | | | | 04/01/35 | | | | 1,085 | | | | 930,271 | |
Sr. Unsec’d. Notes | | | 6.250 | | | | 10/02/43 | | | | 95 | | | | 84,860 | |
Sr. Unsec’d. Notes | | | 6.600 | | | | 04/01/36 | | | | 80 | | | | 77,665 | |
See Notes to Financial Statements.
PGIM Balanced Fund 47
Schedule of Investments (continued)
as of September 30, 2023
| | | | | | | | | | | | | | | | |
| | | | |
| Description | | Interest Rate | | | Maturity Date | | | Principal Amount (000)# | | | Value | |
| | | | |
CORPORATE BONDS (Continued) | | | | | | | | | | | | | | | | |
| | | | |
Auto Manufacturers (cont’d.) | | | | | | | | | | | | | | | | |
| | | | |
General Motors Financial Co., Inc., | | | | | | | | | | | | | | | | |
Gtd. Notes | | | 3.950% | | | | 04/13/24 | | | | 616 | | | $ | 607,945 | |
| | | | | | | | | | | | | | | | |
| | | | |
| | | | | | | | | | | | | | | 2,419,903 | |
| | | | |
Auto Parts & Equipment 0.1% | | | | | | | | | | | | | | | | |
| | | | |
Dana, Inc., | | | | | | | | | | | | | | | | |
Sr. Unsec’d. Notes | | | 5.375 | | | | 11/15/27 | | | | 250 | | | | 232,104 | |
Magna International, Inc. (Canada), | | | | | | | | | | | | | | | | |
Sr. Unsec’d. Notes | | | 2.450 | | | | 06/15/30 | | | | 350 | | | | 286,834 | |
| | | | | | | | | | | | | | | | |
| | | | |
| | | | | | | | | | | | | | | 518,938 | |
| | | | |
Banks 4.0% | | | | | | | | | | | | | | | | |
| | | | |
Banco do Brasil SA (Brazil), | | | | | | | | | | | | | | | | |
Sr. Unsec’d. Notes, 144A | | | 4.875 | | | | 01/11/29 | | | | 200 | | | | 185,175 | |
Banco Santander SA (Spain), | | | | | | | | | | | | | | | | |
Sr. Unsec’d. Notes | | | 1.849 | | | | 03/25/26 | | | | 200 | | | | 179,705 | |
Bank Gospodarstwa Krajowego (Poland), | | | | | | | | | | | | | | | | |
Gov’t. Gtd. Notes, 144A, MTN | | | 5.375 | | | | 05/22/33 | | | | 425 | | | | 399,500 | |
Bank of America Corp., | | | | | | | | | | | | | | | | |
Jr. Sub. Notes, Series JJ | | | 5.125(ff) | | | | 06/20/24(oo) | | | | 350 | | | | 340,273 | |
Sr. Unsec’d. Notes | | | 2.299(ff) | | | | 07/21/32 | | | | 665 | | | | 503,614 | |
Sr. Unsec’d. Notes | | | 5.288(ff) | | | | 04/25/34 | | | | 415 | | | | 386,107 | |
Sr. Unsec’d. Notes, GMTN | | | 3.593(ff) | | | | 07/21/28 | | | | 160 | | | | 146,064 | |
Sr. Unsec’d. Notes, MTN | | | 3.194(ff) | | | | 07/23/30 | | | | 215 | | | | 183,723 | |
Sr. Unsec’d. Notes, MTN | | | 3.824(ff) | | | | 01/20/28 | | | | 1,835 | | | | 1,703,100 | |
Sr. Unsec’d. Notes, MTN | | | 3.974(ff) | | | | 02/07/30 | | | | 115 | | | | 103,215 | |
Sr. Unsec’d. Notes, MTN | | | 4.271(ff) | | | | 07/23/29 | | | | 350 | | | | 322,407 | |
Sr. Unsec’d. Notes, Series N | | | 2.651(ff) | | | | 03/11/32 | | | | 2,290 | | | | 1,798,536 | |
Bank of Montreal (Canada), | | | | | | | | | | | | | | | | |
Sr. Unsec’d. Notes, MTN | | | 0.625 | | | | 07/09/24 | | | | 660 | | | | 633,769 | |
Barclays PLC (United Kingdom), | | | | | | | | | | | | | | | | |
Sr. Unsec’d. Notes | | | 2.645(ff) | | | | 06/24/31 | | | | 1,075 | | | | 831,443 | |
Sr. Unsec’d. Notes | | | 3.650 | | | | 03/16/25 | | | | 200 | | | | 192,499 | |
Sr. Unsec’d. Notes, MTN | | | 4.972(ff) | | | | 05/16/29 | | | | 400 | | | | 374,114 | |
BNP Paribas SA (France), | | | | | | | | | | | | | | | | |
Sr. Unsec’d. Notes, 144A | | | 1.904(ff) | | | | 09/30/28 | | | | 750 | | | | 634,488 | |
Sr. Unsec’d. Notes, 144A | | | 3.132(ff) | | | | 01/20/33 | | | | 685 | | | | 537,994 | |
BPCE SA (France), | | | | | | | | | | | | | | | | |
Sr. Unsec’d. Notes, 144A | | | 2.277(ff) | | | | 01/20/32 | | | | 250 | | | | 186,407 | |
See Notes to Financial Statements.
48
| | | | | | | | | | | | | | | | |
| | | | |
| Description | | Interest Rate | | | Maturity Date | | | Principal Amount (000)# | | | Value | |
| | | | |
CORPORATE BONDS (Continued) | | | | | | | | | | | | | | | | |
| | | | |
Banks (cont’d.) | | | | | | | | | | | | | | | | |
| | | | |
Cassa Depositi e Prestiti SpA (Italy), | | | | | | | | | | | | | | | | |
Sr. Unsec’d. Notes, 144A | | | 5.750% | | | | 05/05/26 | | | | 200 | | | $ | 196,223 | |
Citigroup, Inc., | | | | | | | | | | | | | | | | |
Jr. Sub. Notes, Series U | | | 5.000(ff) | | | | 09/12/24(oo) | | | | 100 | | | | 94,773 | |
Jr. Sub. Notes, Series V | | | 4.700(ff) | | | | 01/30/25(oo) | | | | 1,290 | | | | 1,169,576 | |
Sr. Unsec’d. Notes | | | 2.561(ff) | | | | 05/01/32 | | | | 185 | | | | 142,970 | |
Sr. Unsec’d. Notes | | | 2.572(ff) | | | | 06/03/31 | | | | 880 | | | | 701,472 | |
Sr. Unsec’d. Notes | | | 3.057(ff) | | | | 01/25/33 | | | | 280 | | | | 220,656 | |
Sr. Unsec’d. Notes | | | 3.668(ff) | | | | 07/24/28 | | | | 290 | | | | 265,824 | |
Sr. Unsec’d. Notes | | | 3.700 | | | | 01/12/26 | | | | 200 | | | | 190,187 | |
Sr. Unsec’d. Notes | | | 3.887(ff) | | | | 01/10/28 | | | | 1,500 | | | | 1,398,214 | |
Sub. Notes | | | 4.400 | | | | 06/10/25 | | | | 767 | | | | 743,915 | |
Sub. Notes | | | 4.450 | | | | 09/29/27 | | | | 195 | | | | 182,953 | |
Sub. Notes | | | 4.750 | | | | 05/18/46 | | | | 55 | | | | 42,744 | |
Deutsche Bank AG (Germany), | | | | | | | | | | | | | | | | |
Sr. Unsec’d. Notes | | | 3.961(ff) | | | | 11/26/25 | | | | 245 | | | | 236,480 | |
Sub. Notes | | | 7.079(ff) | | | | 02/10/34 | | | | 250 | | | | 225,681 | |
Discover Bank, | | | | | | | | | | | | | | | | |
Sr. Unsec’d. Notes | | | 4.250 | | | | 03/13/26 | | | | 315 | | | | 297,862 | |
Freedom Mortgage Corp., | | | | | | | | | | | | | | | | |
Sr. Unsec’d. Notes, 144A | | | 12.000 | | | | 10/01/28 | | | | 50 | | | | 50,750 | |
Goldman Sachs Group, Inc. (The), | | | | | | | | | | | | | | | | |
Jr. Sub. Notes, Series U | | | 3.650(ff) | | | | 08/10/26(oo) | | | | 290 | | | | 233,413 | |
Jr. Sub. Notes, Series V | | | 4.125(ff) | | | | 11/10/26(oo) | | | | 395 | | | | 323,528 | |
Sr. Unsec’d. Notes | | | 2.383(ff) | | | | 07/21/32 | | | | 465 | | | | 353,980 | |
Sr. Unsec’d. Notes | | | 2.615(ff) | | | | 04/22/32 | | | | 1,405 | | | | 1,096,664 | |
Sr. Unsec’d. Notes | | | 3.750 | | | | 02/25/26 | | | | 50 | | | | 47,532 | |
Sr. Unsec’d. Notes | | | 3.814(ff) | | | | 04/23/29 | | | | 190 | | | | 172,540 | |
Sr. Unsec’d. Notes | | | 3.850 | | | | 01/26/27 | | | | 410 | | | | 384,494 | |
Sr. Unsec’d. Notes | | | 4.223(ff) | | | | 05/01/29 | | | | 95 | | | | 87,918 | |
Sub. Notes | | | 6.750 | | | | 10/01/37 | | | | 275 | | | | 278,127 | |
JPMorgan Chase & Co., | | | | | | | | | | | | | | | | |
Jr. Sub. Notes, Series FF | | | 5.000(ff) | | | | 08/01/24(oo) | | | | 345 | | | | 334,418 | |
Jr. Sub. Notes, Series HH | | | 4.600(ff) | | | | 02/01/25(oo) | | | | 1,290 | | | | 1,208,145 | |
Sr. Unsec’d. Notes | | | 1.578(ff) | | | | 04/22/27 | | | | 1,005 | | | | 896,442 | |
Sr. Unsec’d. Notes | | | 2.580(ff) | | | | 04/22/32 | | | | 375 | | | | 295,746 | |
Sr. Unsec’d. Notes | | | 2.947(ff) | | | | 02/24/28 | | | | 110 | | | | 99,775 | |
Sr. Unsec’d. Notes | | | 2.963(ff) | | | | 01/25/33 | | | | 495 | | | | 394,783 | |
Sr. Unsec’d. Notes | | | 3.702(ff) | | | | 05/06/30 | | | | 145 | | | | 129,255 | |
Sr. Unsec’d. Notes | | | 3.782(ff) | | | | 02/01/28 | | | | 1,591 | | | | 1,480,771 | |
Sr. Unsec’d. Notes | | | 4.005(ff) | | | | 04/23/29 | | | | 796 | | | | 733,407 | |
Sr. Unsec’d. Notes | | | 4.323(ff) | | | | 04/26/28 | | | | 85 | | | | 80,553 | |
See Notes to Financial Statements.
PGIM Balanced Fund 49
Schedule of Investments (continued)
as of September 30, 2023
| | | | | | | | | | | | | | | | |
| | | | |
| Description | | Interest Rate | | | Maturity Date | | | Principal Amount (000)# | | | Value | |
| | | | |
CORPORATE BONDS (Continued) | | | | | | | | | | | | | | | | |
| | | | |
Banks (cont’d.) | | | | | | | | | | | | | | | | |
| | | | |
JPMorgan Chase & Co., (cont’d.) | | | | | | | | | | | | | | | | |
Sr. Unsec’d. Notes | | | 4.452%(ff) | | | | 12/05/29 | | | | 250 | | | $ | 232,941 | |
Sr. Unsec’d. Notes | | | 5.299(ff) | | | | 07/24/29 | | | | 460 | | | | 447,617 | |
Sub. Notes | | | 3.875 | | | | 09/10/24 | | | | 90 | | | | 88,128 | |
Lloyds Banking Group PLC (United Kingdom), | | | | | | | | | | | | | | | | |
Sr. Unsec’d. Notes | | | 3.750 | | | | 01/11/27 | | | | 300 | | | | 278,753 | |
Mizuho Financial Group, Inc. (Japan), | | | | | | | | | | | | | | | | |
Sr. Unsec’d. Notes | | | 5.748(ff) | | | | 07/06/34 | | | | 860 | | | | 820,649 | |
Morgan Stanley, | | | | | | | | | | | | | | | | |
Sr. Unsec’d. Notes | | | 5.449(ff) | | | | 07/20/29 | | | | 230 | | | | 224,148 | |
Sr. Unsec’d. Notes, GMTN | | | 2.239(ff) | | | | 07/21/32 | | | | 1,005 | | | | 757,664 | |
Sr. Unsec’d. Notes, GMTN | | | 3.772(ff) | | | | 01/24/29 | | | | 1,173 | | | | 1,068,980 | |
Sr. Unsec’d. Notes, GMTN | | | 3.875 | | | | 01/27/26 | | | | 370 | | | | 353,514 | |
Sr. Unsec’d. Notes, GMTN | | | 4.431(ff) | | | | 01/23/30 | | | | 240 | | | | 221,643 | |
Sr. Unsec’d. Notes, MTN | | | 2.511(ff) | | | | 10/20/32 | | | | 215 | | | | 164,224 | |
Sr. Unsec’d. Notes, MTN | | | 2.943(ff) | | | | 01/21/33 | | | | 485 | | | | 381,191 | |
Sr. Unsec’d. Notes, MTN | | | 3.591(cc) | | | | 07/22/28 | | | | 1,536 | | | | 1,399,745 | |
Societe Generale SA (France), | | | | | | | | | | | | | | | | |
Sr. Unsec’d. Notes, 144A | | | 1.488(ff) | | | | 12/14/26 | | | | 1,000 | | | | 894,853 | |
State Bank of India (India), | | | | | | | | | | | | | | | | |
Sr. Unsec’d. Notes, 144A | | | 4.375 | | | | 01/24/24 | | | | 310 | | | | 308,348 | |
State Street Corp., | | | | | | | | | | | | | | | | |
Jr. Sub. Notes, Series F, 3 Month SOFR + 3.859% | | | 9.268(c) | | | | 12/15/23(oo) | | | | 63 | | | | 63,087 | |
Sumitomo Mitsui Trust Bank Ltd. (Japan), | | | | | | | | | | | | | | | | |
Sr. Unsec’d. Notes, 144A, MTN | | | 5.650 | | | | 03/09/26 | | | | 250 | | | | 248,307 | |
UBS Group AG (Switzerland), | | | | | | | | | | | | | | | | |
Sr. Unsec’d. Notes, 144A | | | 3.091(ff) | | | | 05/14/32 | | | | 495 | | | | 391,903 | |
UniCredit SpA (Italy), | | | | | | | | | | | | | | | | |
Sr. Unsec’d. Notes, 144A | | | 3.127(ff) | | | | 06/03/32 | | | | 405 | | | | 310,294 | |
Wells Fargo & Co., | | | | | | | | | | | | | | | | |
Sr. Unsec’d. Notes, MTN | | | 2.393(ff) | | | | 06/02/28 | | | | 2,500 | | | | 2,193,051 | |
Sr. Unsec’d. Notes, MTN | | | 2.572(ff) | | | | 02/11/31 | | | | 1,025 | | | | 828,591 | |
| | | | | | | | | | | | | | | | |
| | | | |
| | | | | | | | | | | | | | | 36,111,535 | |
| | | | |
Beverages 0.2% | | | | | | | | | | | | | | | | |
| | | | |
Anheuser-Busch Cos. LLC/Anheuser-Busch InBev Worldwide, Inc. (Belgium), | | | | | | | | | | | | | | | | |
Gtd. Notes | | | 4.700 | | | | 02/01/36 | | | | 150 | | | | 137,446 | |
Gtd. Notes | | | 4.900 | | | | 02/01/46 | | | | 935 | | | | 811,070 | |
See Notes to Financial Statements.
50
| | | | | | | | | | | | | | | | |
| | | | |
| Description | | Interest
Rate | | | Maturity
Date | | | Principal Amount (000)# | | | Value | |
| | | | |
CORPORATE BONDS (Continued) | | | | | | | | | | | | | | | | |
| | | | |
Beverages (cont’d.) | | | | | | | | | | | | | | | | |
| | | | |
Bacardi Ltd. (Bermuda), | | | | | | | | | | | | | | | | |
Gtd. Notes, 144A | | | 4.450% | | | | 05/15/25 | | | | 890 | | | $ | 863,290 | |
| | | | | | | | | | | | | | | | |
| | | | |
| | | | | | | | | | | | | | | 1,811,806 | |
| | | | |
Biotechnology 0.1% | | | | | | | | | | | | | | | | |
| | | | |
Amgen, Inc., | | | | | | | | | | | | | | | | |
Sr. Unsec’d. Notes | | | 3.000 | | | | 01/15/52 | | | | 600 | | | | 362,750 | |
Sr. Unsec’d. Notes | | | 5.600 | | | | 03/02/43 | | | | 495 | | | | 460,447 | |
| | | | | | | | | | | | | | | | |
| | | | |
| | | | | | | | | | | | | | | 823,197 | |
| | | | |
Building Materials 0.1% | | | | | | | | | | | | | | | | |
| | | | |
Griffon Corp., | | | | | | | | | | | | | | | | |
Gtd. Notes | | | 5.750 | | | | 03/01/28 | | | | 425 | | | | 385,561 | |
JELD-WEN, Inc., | | | | | | | | | | | | | | | | |
Gtd. Notes, 144A | | | 4.625 | | | | 12/15/25 | | | | 49 | | | | 47,165 | |
Standard Industries, Inc., | | | | | | | | | | | | | | | | |
Sr. Unsec’d. Notes, 144A | | | 4.375 | | | | 07/15/30 | | | | 300 | | | | 248,479 | |
| | | | | | | | | | | | | | | | |
| | | | |
| | | | | | | | | | | | | | | 681,205 | |
| | | | |
Chemicals 0.3% | | | | | | | | | | | | | | | | |
| | | | |
CF Industries, Inc., | | | | | | | | | | | | | | | | |
Gtd. Notes | | | 5.375 | | | | 03/15/44 | | | | 150 | | | | 128,270 | |
Dow Chemical Co. (The), | | | | | | | | | | | | | | | | |
Sr. Unsec’d. Notes | | | 4.375 | | | | 11/15/42 | | | | 20 | | | | 15,612 | |
Sr. Unsec’d. Notes | | | 9.400 | | | | 05/15/39 | | | | 31 | | | | 39,206 | |
Huntsman International LLC, | | | | | | | | | | | | | | | | |
Sr. Unsec’d. Notes | | | 4.500 | | | | 05/01/29 | | | | 1,650 | | | | 1,490,758 | |
Nutrien Ltd. (Canada), | | | | | | | | | | | | | | | | |
Sr. Unsec’d. Notes | | | 4.900 | | | | 03/27/28 | | | | 245 | | | | 236,341 | |
Rain Carbon, Inc., | | | | | | | | | | | | | | | | |
Sr. Sec’d. Notes, 144A | | | 12.250 | | | | 09/01/29 | | | | 75 | | | | 78,674 | |
Sasol Financing USA LLC (South Africa), | | | | | | | | | | | | | | | | |
Gtd. Notes | | | 4.375 | | | | 09/18/26 | | | | 200 | | | | 176,666 | |
Gtd. Notes | | | 5.875 | | | | 03/27/24 | | | | 200 | | | | 197,152 | |
Gtd. Notes | | | 6.500 | | | | 09/27/28 | | | | 200 | | | | 178,154 | |
| | | | | | | | | | | | | | | | |
| | | | |
| | | | | | | | | | | | | | | 2,540,833 | |
See Notes to Financial Statements.
PGIM Balanced Fund 51
Schedule of Investments (continued)
as of September 30, 2023
| | | | | | | | | | | | | | | | |
| | | | |
| Description | | Interest
Rate | | | Maturity
Date | | | Principal Amount (000)# | | | Value | |
| | | | |
CORPORATE BONDS (Continued) | | | | | | | | | | | | | | | | |
| | | | |
Commercial Services 0.5% | | | | | | | | | | | | | | | | |
| | | | |
Adtalem Global Education, Inc., | | | | | | | | | | | | | | | | |
Sr. Sec’d. Notes, 144A | | | 5.500% | | | | 03/01/28 | | | | 132 | | | $ | 121,606 | |
Allied Universal Holdco LLC/Allied Universal Finance Corp., | | | | | | | | | | | | | | | | |
Sr. Sec’d. Notes, 144A | | | 6.625 | | | | 07/15/26 | | | | 500 | | | | 474,209 | |
DP World Ltd. (United Arab Emirates), | | | | | | | | | | | | | | | | |
Sr. Unsec’d. Notes, 144A | | | 2.375 | | | | 09/25/26 | | | EUR | 185 | | | | 182,993 | |
ERAC USA Finance LLC, | | | | | | | | | | | | | | | | |
Gtd. Notes, 144A | | | 2.700 | | | | 11/01/23 | | | | 1,166 | | | | 1,162,755 | |
Gtd. Notes, 144A | | | 7.000 | | | | 10/15/37 | | | | 20 | | | | 21,621 | |
Johns Hopkins University, | | | | | | | | | | | | | | | | |
Sr. Unsec’d. Notes, Series A | | | 2.813 | | | | 01/01/60 | | | | 100 | | | | 58,351 | |
Nexi SpA (Italy), | | | | | | | | | | | | | | | | |
Sr. Unsec’d. Notes(a) | | | 2.125 | | | | 04/30/29 | | | EUR | 930 | | | | 815,147 | |
President & Fellows of Harvard College, | | | | | | | | | | | | | | | | |
Unsec’d. Notes | | | 3.300 | | | | 07/15/56 | | | | 270 | | | | 180,565 | |
RELX Capital, Inc. (United Kingdom), | | | | | | | | | | | | | | | | |
Gtd. Notes | | | 4.750 | | | | 05/20/32 | | | | 210 | | | | 195,166 | |
Trustees of Boston College, | | | | | | | | | | | | | | | | |
Unsec’d. Notes | | | 3.129 | | | | 07/01/52 | | | | 279 | | | | 182,435 | |
Trustees of the University of Pennsylvania (The), | | | | | | | | | | | | | | | | |
Sr. Unsec’d. Notes | | | 3.610 | | | | 02/15/2119 | | | | 55 | | | | 35,015 | |
United Rentals North America, Inc., | | | | | | | | | | | | | | | | |
Gtd. Notes | | | 3.750 | | | | 01/15/32 | | | | 200 | | | | 161,384 | |
Gtd. Notes | | | 3.875 | | | | 02/15/31 | | | | 62 | | | | 51,579 | |
Yale University, | | | | | | | | | | | | | | | | |
Unsec’d. Notes, Series 2020 | | | 1.482 | | | | 04/15/30 | | | | 595 | | | | 473,397 | |
| | | | | | | | | | | | | | | | |
| | | | |
| | | | | | | | | | | | | | | 4,116,223 | |
| | | | |
Computers 0.0% | | | | | | | | | | | | | | | | |
| | | | |
NCR Atleos Escrow Corp., | | | | | | | | | | | | | | | | |
Sr. Sec’d. Notes, 144A | | | 9.500 | | | | 04/01/29 | | | | 131 | | | | 126,710 | |
| | | | |
Distribution/Wholesale 0.0% | | | | | | | | | | | | | | | | |
| | | | |
H&E Equipment Services, Inc., | | | | | | | | | | | | | | | | |
Gtd. Notes, 144A | | | 3.875 | | | | 12/15/28 | | | | 400 | | | | 341,886 | |
| | | | |
Diversified Financial Services 0.2% | | | | | | | | | | | | | | | | |
| | | | |
Jefferies Financial Group, Inc., | | | | | | | | | | | | | | | | |
Sr. Unsec’d. Notes | | | 5.875 | | | | 07/21/28 | | | | 610 | | | | 596,816 | |
See Notes to Financial Statements.
52
| | | | | | | | | | | | | | | | |
| | | | |
| Description | | Interest Rate | | | Maturity Date | | | Principal Amount (000)# | | | Value | |
| | | | |
CORPORATE BONDS (Continued) | | | | | | | | | | | | | | | | |
| | | | |
Diversified Financial Services (cont’d.) | | | | | | | | | | | | | | | | |
| | | | |
Nationstar Mortgage Holdings, Inc., | | | | | | | | | | | | | | | | |
Gtd. Notes, 144A | | | 5.500% | | | | 08/15/28 | | | | 120 | | | $ | 105,863 | |
Gtd. Notes, 144A | | | 6.000 | | | | 01/15/27 | | | | 400 | | | | 378,194 | |
OneMain Finance Corp., | | | | | | | | | | | | | | | | |
Gtd. Notes | | | 3.875 | | | | 09/15/28 | | | | 350 | | | | 281,140 | |
PennyMac Financial Services, Inc., | | | | | | | | | | | | | | | | |
Gtd. Notes, 144A | | | 4.250 | | | | 02/15/29 | | | | 325 | | | | 262,671 | |
Power Finance Corp. Ltd. (India), | | | | | | | | | | | | | | | | |
Sr. Unsec’d. Notes, 144A, MTN | | | 6.150 | | | | 12/06/28 | | | | 200 | | | | 199,564 | |
| | | | | | | | | | | | | | | | |
| | | | |
| | | | | | | | | | | | | | | 1,824,248 | |
| | | | |
Electric 1.3% | | | | | | | | | | | | | | | | |
| | | | |
Baltimore Gas & Electric Co., | | | | | | | | | | | | | | | | |
Sr. Unsec’d. Notes | | | 6.350 | | | | 10/01/36 | | | | 115 | | | | 118,570 | |
Berkshire Hathaway Energy Co., | | | | | | | | | | | | | | | | |
Sr. Unsec’d. Notes | | | 5.950 | | | | 05/15/37 | | | | 120 | | | | 117,425 | |
Calpine Corp., | | | | | | | | | | | | | | | | |
Sr. Sec’d. Notes, 144A | | | 4.500 | | | | 02/15/28 | | | | 175 | | | | 157,818 | |
Sr. Unsec’d. Notes, 144A | | | 4.625 | | | | 02/01/29 | | | | 150 | | | | 125,598 | |
Sr. Unsec’d. Notes, 144A | | | 5.000 | | | | 02/01/31 | | | | 225 | | | | 182,199 | |
CenterPoint Energy Houston Electric LLC, | | | | | | | | | | | | | | | | |
General Ref. Mortgage, Series K2 | | | 6.950 | | | | 03/15/33 | | | | 120 | | | | 130,511 | |
General Ref. Mortgage, Series Z | | | 2.400 | | | | 09/01/26 | | | | 170 | | | | 155,794 | |
Comision Federal de Electricidad (Mexico), | | | | | | | | | | | | | | | | |
Gtd. Notes, 144A | | | 4.688 | | | | 05/15/29 | | | | 440 | | | | 393,800 | |
Commonwealth Edison Co., | | | | | | | | | | | | | | | | |
First Mortgage, Series 123 | | | 3.750 | | | | 08/15/47 | | | | 754 | | | | 541,572 | |
Dominion Energy, Inc., | | | | | | | | | | | | | | | | |
Jr. Sub. Notes | | | 3.071 | | | | 08/15/24 | | | | 800 | | | | 779,072 | |
DTE Electric Co., | | | | | | | | | | | | | | | | |
General Ref. Mortgage | | | 3.750 | | | | 08/15/47 | | | | 622 | | �� | | 448,422 | |
Duke Energy Carolinas LLC, | | | | | | | | | | | | | | | | |
First Mortgage | | | 6.050 | | | | 04/15/38 | | | | 55 | | | | 54,905 | |
Duke Energy Corp., | | | | | | | | | | | | | | | | |
Sr. Unsec’d. Notes | | | 2.650 | | | | 09/01/26 | | | | 210 | | | | 193,349 | |
El Paso Electric Co., | | | | | | | | | | | | | | | | |
Sr. Unsec’d. Notes | | | 6.000 | | | | 05/15/35 | | | | 135 | | | | 129,171 | |
Emera US Finance LP (Canada), | | | | | | | | | | | | | | | | |
Gtd. Notes | | | 3.550 | | | | 06/15/26 | | | | 385 | | | | 361,026 | |
Enel Finance International NV (Italy), | | | | | | | | | | | | | | | | |
Gtd. Notes, 144A | | | 2.250 | | | | 07/12/31 | | | | 1,190 | | | | 897,184 | |
See Notes to Financial Statements.
PGIM Balanced Fund 53
Schedule of Investments (continued)
as of September 30, 2023
| | | | | | | | | | | | | | | | |
| | | | |
| Description | | Interest Rate | | | Maturity Date | | | Principal Amount (000)# | | | Value | |
| | | | |
CORPORATE BONDS (Continued) | | | | | | | | | | | | | | | | |
| | | | |
Electric (cont’d.) | | | | | | | | | | | | | | | | |
| | | | |
Eversource Energy, | | | | | | | | | | | | | | | | |
Sr. Unsec’d. Notes, Series O | | | 4.250% | | | | 04/01/29 | | | | 315 | | | $ | 293,366 | |
Florida Power & Light Co., | | | | | | | | | | | | | | | | |
First Mortgage | | | 5.950 | | | | 10/01/33 | | | | 60 | | | | 61,078 | |
Iberdrola International BV (Spain), | | | | | | | | | | | | | | | | |
Gtd. Notes | | | 6.750 | | | | 09/15/33 | | | | 30 | | | | 29,804 | |
Interstate Power & Light Co., | | | | | | | | | | | | | | | | |
Sr. Unsec’d. Notes | | | 2.300 | | | | 06/01/30 | | | | 315 | | | | 251,647 | |
Israel Electric Corp. Ltd. (Israel), | | | | | | | | | | | | | | | | |
Sr. Sec’d. Notes, 144A, GMTN | | | 4.250 | | | | 08/14/28 | | | | 235 | | | | 214,903 | |
Monongahela Power Co., | | | | | | | | | | | | | | | | |
First Mortgage, 144A | | | 4.100 | | | | 04/15/24 | | | | 280 | | | | 276,578 | |
NRG Energy, Inc., | | | | | | | | | | | | | | | | |
Gtd. Notes | | | 5.750 | | | | 01/15/28 | | | | 50 | | | | 46,870 | |
Gtd. Notes, 144A | | | 3.375 | | | | 02/15/29 | | | | 50 | | | | 40,355 | |
Gtd. Notes, 144A | | | 3.625 | | | | 02/15/31 | | | | 125 | | | | 94,820 | |
Gtd. Notes, 144A | | | 3.875 | | | | 02/15/32 | | | | 275 | | | | 206,256 | |
Gtd. Notes, 144A | | | 5.250 | | | | 06/15/29 | | | | 225 | | | | 198,512 | |
Jr. Sub. Notes, 144A | | | 10.250(ff) | | | | 03/15/28(oo) | | | | 75 | | | | 73,447 | |
Ohio Power Co., | | | | | | | | | | | | | | | | |
Sr. Unsec’d. Notes | | | 4.000 | | | | 06/01/49 | | | | 160 | | | | 116,552 | |
Sr. Unsec’d. Notes | | | 4.150 | | | | 04/01/48 | | | | 175 | | | | 131,246 | |
Pacific Gas & Electric Co., | | | | | | | | | | | | | | | | |
First Mortgage | | | 3.950 | | | | 12/01/47 | | | | 260 | | | | 166,040 | |
First Mortgage | | | 4.550 | | | | 07/01/30 | | | | 540 | | | | 476,659 | |
Public Service Co. of Colorado, | | | | | | | | | | | | | | | | |
First Mortgage | | | 4.300 | | | | 03/15/44 | | | | 35 | | | | 27,096 | |
Public Service Electric & Gas Co., | | | | | | | | | | | | | | | | |
Sr. Sec’d. Notes, MTN | | | 5.800 | | | | 05/01/37 | | | | 125 | | | | 122,593 | |
San Diego Gas & Electric Co., | | | | | | | | | | | | | | | | |
First Mortgage | | | 4.150 | | | | 05/15/48 | | | | 230 | | | | 174,730 | |
Southern California Edison Co., | | | | | | | | | | | | | | | | |
First Mortgage | | | 5.300 | | | | 03/01/28 | | | | 490 | | | | 483,960 | |
Southwestern Public Service Co., | | | | | | | | | | | | | | | | |
First Mortgage | | | 3.700 | | | | 08/15/47 | | | | 250 | | | | 171,376 | |
Virginia Electric & Power Co., | | | | | | | | | | | | | | | | |
Sr. Unsec’d. Notes, Series A | | | 2.875 | | | | 07/15/29 | | | | 1,135 | | | | 987,758 | |
Vistra Corp., | | | | | | | | | | | | | | | | |
Jr. Sub. Notes, 144A | | | 7.000(ff) | | | | 12/15/26(oo) | | | | 200 | | | | 183,966 | |
Jr. Sub. Notes, 144A | | | 8.000(ff) | | | | 10/15/26(oo) | | | | 650 | | | | 623,798 | |
Vistra Operations Co. LLC, | | | | | | | | | | | | | | | | |
Gtd. Notes, 144A | | | 5.625 | | | | 02/15/27 | | | | 600 | | | | 568,425 | |
See Notes to Financial Statements.
54
| | | | | | | | | | | | | | | | |
| | | | |
| Description | | Interest Rate | | | Maturity Date | | | Principal Amount (000)# | | | Value | |
| | | | |
CORPORATE BONDS (Continued) | | | | | | | | | | | | | | | | |
| | | | |
Electric (cont’d.) | | | | | | | | | | | | | | | | |
| | | | |
Vistra Operations Co. LLC, (cont’d.) | | | | | | | | | | | | | | | | |
Sr. Sec’d. Notes, 144A | | | 3.550% | | | | 07/15/24 | | | | 645 | | | $ | 629,413 | |
Xcel Energy, Inc., | | | | | | | | | | | | | | | | |
Sr. Unsec’d. Notes | | | 4.800 | | | | 09/15/41 | | | | 105 | | | | 85,344 | |
| | | | | | | | | | | | | | | | |
| | | | |
| | | | | | | | | | | | | | | 11,523,008 | |
| | | | |
Electronics 0.1% | | | | | | | | | | | | | | | | |
| | | | |
Trimble, Inc., | | | | | | | | | | | | | | | | |
Sr. Unsec’d. Notes | | | 4.750 | | | | 12/01/24 | | | | 1,200 | | | | 1,179,410 | |
| | | | |
Engineering & Construction 0.2% | | | | | | | | | | | | | | | | |
| | | | |
Cellnex Finance Co. SA (Spain), | | | | | | | | | | | | | | | | |
Gtd. Notes, EMTN | | | 2.000 | | | | 02/15/33 | | | EUR | 300 | | | | 243,859 | |
Cellnex Telecom SA (Spain), | | | | | | | | | | | | | | | | |
Sr. Unsec’d. Notes, EMTN | | | 1.750 | | | | 10/23/30 | | | EUR | 300 | | | | 256,905 | |
Mexico City Airport Trust (Mexico), | | | | | | | | | | | | | | | | |
Sr. Sec’d. Notes | | | 5.500 | | | | 07/31/47 | | | | 200 | | | | 152,128 | |
Sr. Sec’d. Notes, 144A | | | 4.250 | | | | 10/31/26 | | | | 200 | | | | 187,804 | |
Sr. Sec’d. Notes, 144A | | | 5.500 | | | | 10/31/46 | | | | 200 | | | | 152,000 | |
Sr. Sec’d. Notes, 144A | | | 5.500 | | | | 07/31/47 | | | | 400 | | | | 304,256 | |
TopBuild Corp., | | | | | | | | | | | | | | | | |
Gtd. Notes, 144A | | | 4.125 | | | | 02/15/32 | | | | 100 | | | | 81,356 | |
| | | | | | | | | | | | | | | | |
| | | | |
| | | | | | | | | | | | | | | 1,378,308 | |
| | | | |
Entertainment 0.2% | | | | | | | | | | | | | | | | |
| | | | |
Caesars Entertainment, Inc., | | | | | | | | | | | | | | | | |
Sr. Sec’d. Notes, 144A | | | 6.250 | | | | 07/01/25 | | | | 25 | | | | 24,680 | |
Sr. Sec’d. Notes, 144A | | | 7.000 | | | | 02/15/30 | | | | 125 | | | | 121,566 | |
Sr. Unsec’d. Notes, 144A | | | 4.625 | | | | 10/15/29 | | | | 250 | | | | 211,952 | |
Golden Entertainment, Inc., | | | | | | | | | | | | | | | | |
Sr. Unsec’d. Notes, 144A | | | 7.625 | | | | 04/15/26 | | | | 175 | | | | 174,626 | |
International Game Technology PLC, | | | | | | | | | | | | | | | | |
Sr. Sec’d. Notes, 144A | | | 6.250 | | | | 01/15/27 | | | | 200 | | | | 196,100 | |
Sr. Sec’d. Notes, 144A | | | 6.500 | | | | 02/15/25 | | | | 250 | | | | 249,995 | |
Warnermedia Holdings, Inc., | | | | | | | | | | | | | | | | |
Gtd. Notes | | | 5.050 | | | | 03/15/42 | | | | 265 | | | | 204,987 | |
Gtd. Notes | | | 5.141 | | | | 03/15/52 | | | | 380 | | | | 281,927 | |
| | | | | | | | | | | | | | | | |
| | | | |
| | | | | | | | | | | | | | | 1,465,833 | |
See Notes to Financial Statements.
PGIM Balanced Fund 55
Schedule of Investments (continued)
as of September 30, 2023
| | | | | | | | | | | | | | | | |
| | | | |
| Description | | Interest Rate | | | Maturity Date | | | Principal Amount (000)# | | | Value | |
| | | | |
CORPORATE BONDS (Continued) | | | | | | | | | | | | | | | | |
| | | | |
Foods 0.3% | | | | | | | | | | | | | | | | |
| | | | |
B&G Foods, Inc., | | | | | | | | | | | | | | | | |
Gtd. Notes | | | 5.250% | | | | 09/15/27 | | | | 325 | | | $ | 272,098 | |
Bellis Acquisition Co. PLC (United Kingdom), | | | | | | | | | | | | | | | | |
Sr. Sec’d. Notes, 144A | | | 3.250 | | | | 02/16/26 | | | GBP | 700 | | | | 741,132 | |
Bellis Finco PLC (United Kingdom), | | | | | | | | | | | | | | | | |
Sr. Unsec’d. Notes, 144A | | | 4.000 | | | | 02/16/27 | | | GBP | 500 | | | | 463,992 | |
JBS USA LUX SA/JBS USA Food Co./JBS Luxembourg Sarl, | | | | | | | | | | | | | | | | |
Gtd. Notes, 144A | | | 6.750 | | | | 03/15/34 | | | | 955 | | | | 927,122 | |
Kraft Heinz Foods Co., | | | | | | | | | | | | | | | | |
Gtd. Notes | | | 4.375 | | | | 06/01/46 | | | | 490 | | | | 380,069 | |
Lamb Weston Holdings, Inc., | | | | | | | | | | | | | | | | |
Gtd. Notes, 144A | | | 4.125 | | | | 01/31/30 | | | | 75 | | | | 64,114 | |
Gtd. Notes, 144A | | | 4.375 | | | | 01/31/32 | | | | 150 | | | | 125,722 | |
| | | | | | | | | | | | | | | | |
| | | | |
| | | | | | | | | | | | | | | 2,974,249 | |
| | | | |
Forest Products & Paper 0.0% | | | | | | | | | | | | | | | | |
| | | | |
Celulosa Arauco y Constitucion SA (Chile), | | | | | | | | | | | | | | | | |
Sr. Unsec’d. Notes | | | 4.500 | | | | 08/01/24 | | | | 310 | | | | 303,397 | |
| | | | |
Gas 0.2% | | | | | | | | | | | | | | | | |
| | | | |
AmeriGas Partners LP/AmeriGas Finance Corp., | | | | | | | | | | | | | | | | |
Sr. Unsec’d. Notes | | | 5.750 | | | | 05/20/27 | | | | 600 | | | | 562,415 | |
CenterPoint Energy Resources Corp., | | | | | | | | | | | | | | | | |
Sr. Unsec’d. Notes | | | 4.100 | | | | 09/01/47 | | | | 200 | | | | 148,608 | |
NiSource, Inc., | | | | | | | | | | | | | | | | |
Sr. Unsec’d. Notes | | | 3.490 | | | | 05/15/27 | | | | 548 | | | | 507,197 | |
Sr. Unsec’d. Notes | | | 4.800 | | | | 02/15/44 | | | | 40 | | | | 32,877 | |
Sr. Unsec’d. Notes | | | 5.250 | | | | 03/30/28 | | | | 100 | | | | 98,008 | |
Piedmont Natural Gas Co., Inc., | | | | | | | | | | | | | | | | |
Sr. Unsec’d. Notes | | | 3.500 | | | | 06/01/29 | | | | 740 | | | | 655,164 | |
| | | | | | | | | | | | | | | | |
| | | | |
| | | | | | | | | | | | | | | 2,004,269 | |
| | | | |
Healthcare-Products 0.0% | | | | | | | | | | | | | | | | |
| | | | |
Medline Borrower LP, | | | | | | | | | | | | | | | | |
Sr. Sec’d. Notes, 144A | | | 3.875 | | | | 04/01/29 | | | | 350 | | | | 295,728 | |
Sr. Unsec’d. Notes, 144A | | | 5.250 | | | | 10/01/29 | | | | 75 | | | | 64,836 | |
| | | | | | | | | | | | | | | | |
| | | | |
| | | | | | | | | | | | | | | 360,564 | |
See Notes to Financial Statements.
56
| | | | | | | | | | | | | | | | |
| | | | |
| Description | | Interest Rate | | | Maturity Date | | | Principal Amount (000)# | | | Value | |
| | | | |
CORPORATE BONDS (Continued) | | | | | | | | | | | | | | | | |
| | | | |
Healthcare-Services 0.7% | | | | | | | | | | | | | | | | |
| | | | |
Ascension Health, | | | | | | | | | | | | | | | | |
Sr. Unsec’d. Notes | | | 3.945% | | | | 11/15/46 | | | | 795 | | | $ | 612,796 | |
Catalent Pharma Solutions, Inc., | | | | | | | | | | | | | | | | |
Gtd. Notes, 144A | | | 2.375 | | | | 03/01/28 | | | EUR | 800 | | | | 708,358 | |
Duke University Health System, Inc., | | | | | | | | | | | | | | | | |
Sr. Unsec’d. Notes, Series 2017 | | | 3.920 | | | | 06/01/47 | | | | 95 | | | | 72,606 | |
Elevance Health, Inc., | | | | | | | | | | | | | | | | |
Sr. Unsec’d. Notes | | | 4.625 | | | | 05/15/42 | | | | 45 | | | | 37,734 | |
Sr. Unsec’d. Notes | | | 4.650 | | | | 01/15/43 | | | | 30 | | | | 25,163 | |
HCA, Inc., | | | | | | | | | | | | | | | | |
Gtd. Notes | | | 5.375 | | | | 02/01/25 | | | | 130 | | | | 128,660 | |
Gtd. Notes, MTN | | | 7.750 | | | | 07/15/36 | | | | 400 | | | | 425,813 | |
Health Care Service Corp. A Mutual Legal Reserve Co., | | | | | | | | | | | | | | | | |
Sr. Unsec’d. Notes, 144A | | | 2.200 | | | | 06/01/30 | | | | 360 | | | | 288,300 | |
IHC Health Services, Inc., | | | | | | | | | | | | | | | | |
Sec’d. Notes | | | 4.131 | | | | 05/15/48 | | | | 480 | | | | 380,613 | |
Kaiser Foundation Hospitals, | | | | | | | | | | | | | | | | |
Gtd. Notes | | | 4.150 | | | | 05/01/47 | | | | 140 | | | | 111,010 | |
Unsec’d. Notes, Series 2021 | | | 2.810 | | | | 06/01/41 | | | | 495 | | | | 330,992 | |
MultiCare Health System, | | | | | | | | | | | | | | | | |
Unsec’d. Notes | | | 2.803 | | | | 08/15/50 | | | | 280 | | | | 156,208 | |
MyMichigan Health, | | | | | | | | | | | | | | | | |
Sec’d. Notes, Series 2020 | | | 3.409 | | | | 06/01/50 | | | | 155 | | | | 99,080 | |
OhioHealth Corp., | | | | | | | | | | | | | | | | |
Sec’d. Notes | | | 2.297 | | | | 11/15/31 | | | | 1,155 | | | | 910,224 | |
Providence St. Joseph Health Obligated Group, | | | | | | | | | | | | | | | | |
Unsec’d. Notes, Series 19A | | | 2.532 | | | | 10/01/29 | | | | 190 | | | | 158,275 | |
Unsec’d. Notes, Series H | | | 2.746 | | | | 10/01/26 | | | | 50 | | | | 45,584 | |
Tenet Healthcare Corp., | | | | | | | | | | | | | | | | |
Gtd. Notes | | | 6.125 | | | | 10/01/28 | | | | 200 | | | | 187,696 | |
Sr. Sec’d. Notes | | | 4.375 | | | | 01/15/30 | | | | 300 | | | | 258,397 | |
UnitedHealth Group, Inc., | | | | | | | | | | | | | | | | |
Sr. Unsec’d. Notes | | | 5.200 | | | | 04/15/63 | | | | 1,935 | | | | 1,726,085 | |
| | | | | | | | | | | | | | | | |
| | | | |
| | | | | | | | | | | | | | | 6,663,594 | |
| | | | |
Home Builders 0.3% | | | | | | | | | | | | | | | | |
| | | | |
Brookfield Residential Properties, Inc./Brookfield Residential US LLC (Canada), | | | | | | | | | | | | | | | | |
Gtd. Notes, 144A | | | 4.875 | | | | 02/15/30 | | | | 600 | | | | 486,780 | |
Mattamy Group Corp. (Canada), | | | | | | | | | | | | | | | | |
Sr. Unsec’d. Notes, 144A | | | 4.625 | | | | 03/01/30 | | | | 675 | | | | 574,695 | |
See Notes to Financial Statements.
PGIM Balanced Fund 57
Schedule of Investments (continued)
as of September 30, 2023
| | | | | | | | | | | | | | | | |
| | | | |
| Description | | Interest Rate | | | Maturity
Date | | | Principal Amount (000)# | | | Value | |
| | | | |
CORPORATE BONDS (Continued) | | | | | | | | | | | | | | | | |
| | | | |
Home Builders (cont’d.) | | | | | | | | | | | | | | | | |
| | | | |
Taylor Morrison Communities, Inc., | | | | | | | | | | | | | | | | |
Gtd. Notes, 144A | | | 5.750% | | | | 01/15/28 | | | | 500 | | | $ | 465,511 | |
Gtd. Notes, 144A | | | 5.875 | | | | 06/15/27 | | | | 90 | | | | 85,818 | |
Toll Brothers Finance Corp., | | | | | | | | | | | | | | | | |
Gtd. Notes(a) | | | 4.350 | | | | 02/15/28 | | | | 1,650 | | | | 1,530,925 | |
| | | | | | | | | | | | | | | | |
| | | | |
| | | | | | | | | | | | | | | 3,143,729 | |
| | | | |
Insurance 0.1% | | | | | | | | | | | | | | | | |
| | | | |
Liberty Mutual Group, Inc., | | | | | | | | | | | | | | | | |
Gtd. Notes, 144A | | | 3.950 | | | | 05/15/60 | | | | 115 | | | | 72,226 | |
Gtd. Notes, 144A | | | 3.951 | | | | 10/15/50 | | | | 180 | | | | 120,531 | |
Gtd. Notes, 144A | | | 4.569 | | | | 02/01/29 | | | | 350 | | | | 329,884 | |
Lincoln National Corp., | | | | | | | | | | | | | | | | |
Sr. Unsec’d. Notes | | | 6.300 | | | | 10/09/37 | | | | 110 | | | | 106,048 | |
Markel Group, Inc., | | | | | | | | | | | | | | | | |
Sr. Unsec’d. Notes | | | 5.000 | | | | 03/30/43 | | | | 25 | | | | 19,857 | |
New York Life Insurance Co., | | | | | | | | | | | | | | | | |
Sub. Notes, 144A | | | 6.750 | | | | 11/15/39 | | | | 110 | | | | 115,208 | |
Principal Financial Group, Inc., | | | | | | | | | | | | | | | | |
Gtd. Notes | | | 4.625 | | | | 09/15/42 | | | | 15 | | | | 11,922 | |
Teachers Insurance & Annuity Association of America, | | | | | | | | | | | | | | | | |
Sub. Notes, 144A | | | 4.270 | | | | 05/15/47 | | | | 240 | | | | 182,249 | |
Sub. Notes, 144A | | | 6.850 | | | | 12/16/39 | | | | 22 | | | | 23,090 | |
| | | | | | | | | | | | | | | | |
| | | | |
| | | | | | | | | | | | | | | 981,015 | |
| | | | |
Leisure Time 0.0% | | | | | | | | | | | | | | | | |
| | | | |
NCL Corp. Ltd., | | | | | | | | | | | | | | | | |
Gtd. Notes, 144A | | | 5.875 | | | | 03/15/26 | | | | 75 | | | | 69,000 | |
Royal Caribbean Cruises Ltd., | | | | | | | | | | | | | | | | |
Gtd. Notes, 144A | | | 7.250 | | | | 01/15/30 | | | | 50 | | | | 49,413 | |
Viking Cruises Ltd., | | | | | | | | | | | | | | | | |
Gtd. Notes, 144A | | | 5.875 | | | | 09/15/27 | | | | 250 | | | | 228,175 | |
| | | | | | | | | | | | | | | | |
| | | | |
| | | | | | | | | | | | | | | 346,588 | |
| | | | |
Lodging 0.2% | | | | | | | | | | | | | | | | |
| | | | |
Hilton Domestic Operating Co., Inc., | | | | | | | | | | | | | | | | |
Gtd. Notes, 144A | | | 3.625 | | | | 02/15/32 | | | | 375 | | | | 302,253 | |
Marriott International, Inc., | | | | | | | | | | | | | | | | |
Sr. Unsec’d. Notes | | | 4.900 | | | | 04/15/29 | | | | 830 | | | | 791,106 | |
See Notes to Financial Statements.
58
| | | | | | | | | | | | | | | | |
| | | | |
| Description | | Interest Rate | | | Maturity Date | | | Principal Amount (000)# | | | Value | |
| | | | |
CORPORATE BONDS (Continued) | | | | | | | | | | | | | | | | |
| | | | |
Lodging (cont’d.) | | | | | | | | | | | | | | | | |
| | | | |
Marriott International, Inc., (cont’d.) | | | | | | | | | | | | | | | | |
Sr. Unsec’d. Notes, Series R | | | 3.125% | | | | 06/15/26 | | | | 561 | | | $ | 524,574 | |
MGM Resorts International, | | | | | | | | | | | | | | | | |
Gtd. Notes | | | 6.750 | | | | 05/01/25 | | | | 250 | | | | 248,403 | |
| | | | | | | | | | | | | | | | |
| | | | |
| | | | | | | | | | | | | | | 1,866,336 | |
| | | | |
Machinery-Diversified 0.2% | | | | | | | | | | | | | | | | |
| | | | |
Chart Industries, Inc., | | | | | | | | | | | | | | | | |
Sr. Sec’d. Notes, 144A | | | 7.500 | | | | 01/01/30 | | | | 50 | | | | 50,256 | |
Ingersoll Rand, Inc., | | | | | | | | | | | | | | | | |
Sr. Unsec’d. Notes | | | 5.700 | | | | 08/14/33 | | | | 440 | | | | 424,668 | |
Westinghouse Air Brake Technologies Corp., | | | | | | | | | | | | | | | | |
Gtd. Notes | | | 4.700 | | | | 09/15/28 | | | | 89 | | | | 83,647 | |
Xylem, Inc., | | | | | | | | | | | | | | | | |
Sr. Unsec’d. Notes | | | 1.950 | | | | 01/30/28 | | | | 975 | | | | 838,018 | |
| | | | | | | | | | | | | | | | |
| | | | |
| | | | | | | | | | | | | | | 1,396,589 | |
| | | | |
Media 0.5% | | | | | | | | | | | | | | | | |
| | | | |
CCO Holdings LLC/CCO Holdings Capital Corp., | | | | | | | | | | | | | | | | |
Sr. Unsec’d. Notes, 144A | | | 4.250 | | | | 02/01/31 | | | | 350 | | | | 278,709 | |
Sr. Unsec’d. Notes, 144A | | | 5.375 | | | | 06/01/29 | | | | 725 | | | | 650,544 | |
Charter Communications Operating LLC/Charter Communications Operating Capital, | | | | | | | | | | | | | | | | |
Sr. Sec’d. Notes | | | 3.900 | | | | 06/01/52 | | | | 290 | | | | 173,364 | |
Sr. Sec’d. Notes | | | 5.375 | | | | 05/01/47 | | | | 120 | | | | 91,546 | |
Sr. Sec’d. Notes | | | 6.384 | | | | 10/23/35 | | | | 110 | | | | 102,414 | |
Sr. Sec’d. Notes | | | 6.484 | | | | 10/23/45 | | | | 172 | | | | 150,016 | |
Comcast Corp., | | | | | | | | | | | | | | | | |
Gtd. Notes | | | 3.969 | | | | 11/01/47 | | | | 19 | | | | 14,129 | |
Gtd. Notes | | | 5.500 | | | | 05/15/64 | | | | 700 | | | | 634,536 | |
Cox Communications, Inc., | | | | | | | | | | | | | | | | |
Sr. Unsec’d. Notes, 144A | | | 3.150 | | | | 08/15/24 | | | | 255 | | | | 248,415 | |
CSC Holdings LLC, | | | | | | | | | | | | | | | | |
Gtd. Notes, 144A | | | 3.375 | | | | 02/15/31 | | | | 310 | | | | 211,986 | |
Gtd. Notes, 144A | | | 5.500 | | | | 04/15/27 | | | | 425 | | | | 364,245 | |
Sr. Unsec’d. Notes | | | 5.250 | | | | 06/01/24 | | | | 75 | | | | 71,327 | |
Sr. Unsec’d. Notes, 144A | | | 4.625 | | | | 12/01/30 | | | | 300 | | | | 159,690 | |
See Notes to Financial Statements.
PGIM Balanced Fund 59
Schedule of Investments (continued)
as of September 30, 2023
| | | | | | | | | | | | | | | | |
| | | | |
| Description | | Interest Rate | | | Maturity Date | | | Principal Amount (000)# | | | Value | |
| | | | |
CORPORATE BONDS (Continued) | | | | | | | | | | | | | | | | |
| | | | |
Media (cont’d.) | | | | | | | | | | | | | | | | |
| | | | |
Diamond Sports Group LLC/Diamond Sports Finance Co., | | | | | | | | | | | | | | | | |
Sec’d. Notes, 144A (original cost $550,396; purchased 02/12/20)(f) | | | 5.375% | | | | 08/15/26(d) | | | | 550 | | | $ | 13,030 | |
Discovery Communications LLC, | | | | | | | | | | | | | | | | |
Gtd. Notes | | | 5.300 | | | | 05/15/49 | | | | 575 | | | | 439,427 | |
DISH DBS Corp., | | | | | | | | | | | | | | | | |
Gtd. Notes | | | 5.125 | | | | 06/01/29 | | | | 100 | | | | 55,240 | |
Gtd. Notes | | | 7.375 | | | | 07/01/28 | | | | 100 | | | | 63,183 | |
Gtd. Notes | | | 7.750 | | | | 07/01/26 | | | | 400 | | | | 299,672 | |
DISH Network Corp., | | | | | | | | | | | | | | | | |
Sr. Sec’d. Notes, 144A | | | 11.750 | | | | 11/15/27 | | | | 175 | | | | 175,602 | |
Time Warner Cable LLC, | | | | | | | | | | | | | | | | |
Sr. Sec’d. Notes | | | 5.500 | | | | 09/01/41 | | | | 140 | | | | 109,219 | |
| | | | | | | | | | | | | | | | |
| | | | |
| | | | | | | | | | | | | | | 4,306,294 | |
| | | | |
Mining 0.1% | | | | | | | | | | | | | | | | |
| | | | |
Barrick North America Finance LLC (Canada), | | | | | | | | | | | | | | | | |
Gtd. Notes | | | 5.750 | | | | 05/01/43 | | | | 280 | | | | 268,842 | |
Freeport Indonesia PT (Indonesia), | | | | | | | | | | | | | | | | |
Sr. Unsec’d. Notes, 144A, MTN | | | 5.315 | | | | 04/14/32 | | | | 200 | | | | 180,040 | |
Southern Copper Corp. (Mexico), | | | | | | | | | | | | | | | | |
Sr. Unsec’d. Notes | | | 7.500 | | | | 07/27/35 | | | | 95 | | | | 104,478 | |
| | | | | | | | | | | | | | | | |
| | | | |
| | | | | | | | | | | | | | | 553,360 | |
| | | | |
Miscellaneous Manufacturing 0.1% | | | | | | | | | | | | | | | | |
| | | | |
Pentair Finance Sarl, | | | | | | | | | | | | | | | | |
Gtd. Notes | | | 4.500 | | | | 07/01/29 | | | | 450 | | | | 413,234 | |
Teledyne Technologies, Inc., | | | | | | | | | | | | | | | | |
Gtd. Notes | | | 2.750 | | | | 04/01/31 | | | | 935 | | | | 755,508 | |
| | | | | | | | | | | | | | | | |
| | | | |
| | | | | | | | | | | | | | | 1,168,742 | |
| | | | |
Oil & Gas 0.9% | | | | | | | | | | | | | | | | |
| | | | |
Aethon United BR LP/Aethon United Finance Corp., | | | | | | | | | | | | | | | | |
Sr. Unsec’d. Notes, 144A | | | 8.250 | | | | 02/15/26 | | | | 225 | | | | 223,062 | |
Aker BP ASA (Norway), | | | | | | | | | | | | | | | | |
Gtd. Notes, 144A | | | 3.100 | | | | 07/15/31 | | | | 450 | | | | 360,259 | |
See Notes to Financial Statements.
60
| | | | | | | | | | | | | | | | |
| | | | |
| Description | | Interest Rate | | | Maturity Date | | | Principal Amount (000)# | | | Value | |
| | | | |
CORPORATE BONDS (Continued) | | | | | | | | | | | | | | | | |
| | | | |
Oil & Gas (cont’d.) | | | | | | | | | | | | | | | | |
| | | | |
Ascent Resources Utica Holdings LLC/ARU Finance Corp., | | | | | | | | | | | | | | | | |
Gtd. Notes, 144A | | | 9.000% | | | | 11/01/27 | | | | 79 | | | $ | 100,078 | |
Sr. Unsec’d. Notes, 144A | | | 8.250 | | | | 12/31/28 | | | | 125 | | | | 123,445 | |
BP Capital Markets PLC (United Kingdom), | | | | | | | | | | | | | | | | |
Gtd. Notes | | | 4.375(ff) | | | | 06/22/25(oo) | | | | 750 | | | | 713,438 | |
Cenovus Energy, Inc. (Canada), | | | | | | | | | | | | | | | | |
Sr. Unsec’d. Notes | | | 5.400 | | | | 06/15/47 | | | | 190 | | | | 162,889 | |
Chesapeake Energy Corp., | | | | | | | | | | | | | | | | |
Gtd. Notes, 144A | | | 5.500 | | | | 02/01/26 | | | | 125 | | | | 121,113 | |
Gtd. Notes, 144A | | | 5.875 | | | | 02/01/29 | | | | 125 | | | | 117,581 | |
Civitas Resources, Inc., | | | | | | | | | | | | | | | | |
Gtd. Notes, 144A | | | 8.375 | | | | 07/01/28 | | | | 75 | | | | 76,304 | |
CNX Resources Corp., | | | | | | | | | | | | | | | | |
Gtd. Notes, 144A | | | 7.250 | | | | 03/14/27 | | | | 100 | | | | 98,663 | |
ConocoPhillips Co., | | | | | | | | | | | | | | | | |
Gtd. Notes | | | 3.758 | | | | 03/15/42 | | | | 150 | | | | 114,917 | |
Devon Energy Corp., | | | | | | | | | | | | | | | | |
Sr. Unsec’d. Notes | | | 5.600 | | | | 07/15/41 | | | | 35 | | | | 30,877 | |
Ecopetrol SA (Colombia), | | | | | | | | | | | | | | | | |
Sr. Unsec’d. Notes | | | 6.875 | | | | 04/29/30 | | | | 68 | | | | 61,812 | |
Sr. Unsec’d. Notes | | | 8.625 | | | | 01/19/29 | | | | 525 | | | | 525,578 | |
Endeavor Energy Resources LP/EER Finance, Inc., | | | | | | | | | | | | | | | | |
Sr. Unsec’d. Notes, 144A | | | 5.750 | | | | 01/30/28 | | | | 400 | | | | 385,865 | |
Energian Israel Finance Ltd. (Israel), | | | | | | | | | | | | | | | | |
Sr. Sec’d. Notes, 144A | | | 4.875 | | | | 03/30/26 | | | | 200 | | | | 185,674 | |
Sr. Sec’d. Notes, 144A | | | 5.375 | | | | 03/30/28 | | | | 312 | | | | 279,777 | |
EOG Resources, Inc., | | | | | | | | | | | | | | | | |
Sr. Unsec’d. Notes | | | 3.900 | | | | 04/01/35 | | | | 120 | | | | 101,470 | |
Hilcorp Energy I LP/Hilcorp Finance Co., | | | | | | | | | | | | | | | | |
Sr. Unsec’d. Notes, 144A | | | 5.750 | | | | 02/01/29 | | | | 50 | | | | 45,230 | |
Sr. Unsec’d. Notes, 144A | | | 6.000 | | | | 04/15/30 | | | | 125 | | | | 112,516 | |
Sr. Unsec’d. Notes, 144A | | | 6.000 | | | | 02/01/31 | | | | 50 | | | | 43,984 | |
Sr. Unsec’d. Notes, 144A | | | 6.250 | | | | 04/15/32 | | | | 150 | | | | 133,144 | |
MEG Energy Corp. (Canada), | | | | | | | | | | | | | | | | |
Gtd. Notes, 144A | | | 7.125 | | | | 02/01/27 | | | | 150 | | | | 152,088 | |
Petrobras Global Finance BV (Brazil), | | | | | | | | | | | | | | | | |
Gtd. Notes | | | 6.625 | | | | 01/16/34 | | | GBP | 230 | | | | 246,401 | |
Petroleos Mexicanos (Mexico), | | | | | | | | | | | | | | | | |
Gtd. Notes | | | 4.750 | | | | 02/26/29 | | | EUR | 180 | | | | 143,669 | |
Gtd. Notes | | | 5.350 | | | | 02/12/28 | | | | 49 | | | | 39,653 | |
Gtd. Notes | | | 6.490 | | | | 01/23/27 | | | | 30 | | | | 26,475 | |
See Notes to Financial Statements.
PGIM Balanced Fund 61
Schedule of Investments (continued)
as of September 30, 2023
| | | | | | | | | | | | | | | | |
| | | | |
| Description | | Interest Rate | | | Maturity Date | | | Principal Amount (000)# | | | Value | |
| | | | |
CORPORATE BONDS (Continued) | | | | | | | | | | | | | | | | |
| | | | |
Oil & Gas (cont’d.) | | | | | | | | | | | | | | | | |
| | | | |
Petroleos Mexicanos (Mexico), (cont’d.) | | | | | | | | | | | | | | | | |
Gtd. Notes | | | 6.500% | | | | 03/13/27 | | | | 1,483 | | | $ | 1,300,465 | |
Gtd. Notes | | | 6.700 | | | | 02/16/32 | | | | 10 | | | | 7,405 | |
Gtd. Notes, EMTN | | | 4.875 | | | | 02/21/28 | | | EUR | 240 | | | | 203,154 | |
Gtd. Notes, MTN | | | 6.750 | | | | 09/21/47 | | | | 133 | | | | 77,888 | |
Phillips 66 Co., | | | | | | | | | | | | | | | | |
Gtd. Notes | | | 3.550 | | | | 10/01/26 | | | | 360 | | | | 338,977 | |
Southwestern Energy Co., | | | | | | | | | | | | | | | | |
Gtd. Notes | | | 4.750 | | | | 02/01/32 | | | | 200 | | | | 171,574 | |
Var Energi ASA (Norway), | | | | | | | | | | | | | | | | |
Sr. Unsec’d. Notes, 144A | | | 5.000 | | | | 05/18/27 | | | | 870 | | | | 822,196 | |
| | | | | | | | | | | | | | | | |
| | | | |
| | | | | | | | | | | | | | | 7,647,621 | |
| | | | |
Oil & Gas Services 0.0% | | | | | | | | | | | | | | | | |
| | | | |
Schlumberger Holdings Corp., | | | | | | | | | | | | | | | | |
Sr. Unsec’d. Notes, 144A | | | 3.900 | | | | 05/17/28 | | | | 336 | | | | 313,465 | |
| | | | |
Packaging & Containers 0.1% | | | | | | | | | | | | | | | | |
| | | | |
AptarGroup, Inc., | | | | | | | | | | | | | | | | |
Sr. Unsec’d. Notes | | | 3.600 | | | | 03/15/32 | | | | 780 | | | | 645,351 | |
Ball Corp., | | | | | | | | | | | | | | | | |
Gtd. Notes | | | 6.000 | | | | 06/15/29 | | | | 250 | | | | 243,125 | |
Pactiv Evergreen Group Issuer LLC/Pactiv Evergreen Group Issuer, Inc., | | | | | | | | | | | | | | | | |
Sr. Sec’d. Notes, 144A | | | 4.375 | | | | 10/15/28 | | | | 125 | | | | 108,645 | |
Pactiv Evergreen Group Issuer, Inc./Pactiv Evergreen Group Issuer LLC, | | | | | | | | | | | | | | | | |
Sr. Sec’d. Notes, 144A | | | 4.000 | | | | 10/15/27 | | | | 75 | | | | 66,570 | |
Sealed Air Corp./Sealed Air Corp. US, | | | | | | | | | | | | | | | | |
Gtd. Notes, 144A | | | 6.125 | | | | 02/01/28 | | | | 25 | | | | 24,202 | |
| | | | | | | | | | | | | | | | |
| | | | |
| | | | | | | | | | | | | | | 1,087,893 | |
| | | | |
Pharmaceuticals 0.7% | | | | | | | | | | | | | | | | |
| | | | |
AbbVie, Inc., | | | | | | | | | | | | | | | | |
Sr. Unsec’d. Notes | | | 3.800 | | | | 03/15/25 | | | | 315 | | | | 306,213 | |
Sr. Unsec’d. Notes | | | 4.050 | | | | 11/21/39 | | | | 180 | | | | 146,955 | |
Sr. Unsec’d. Notes | | | 4.250 | | | | 11/21/49 | | | | 1,145 | | | | 906,865 | |
Sr. Unsec’d. Notes | | | 4.500 | | | | 05/14/35 | | | | 235 | | | | 212,186 | |
Sr. Unsec’d. Notes | | | 4.550 | | | | 03/15/35 | | | | 430 | | | | 391,131 | |
Sr. Unsec’d. Notes | | | 4.700 | | | | 05/14/45 | | | | 250 | | | | 213,363 | |
See Notes to Financial Statements.
62
| | | | | | | | | | | | | | | | |
| | | | |
| Description | | Interest Rate | | | Maturity Date | | | Principal Amount (000)# | | | Value | |
| | | | |
CORPORATE BONDS (Continued) | | | | | | | | | | | | | | | | |
| | | | |
Pharmaceuticals (cont’d.) | | | | | | | | | | | | | | | | |
| | | | |
Bausch Health Cos., Inc., | | | | | | | | | | | | | | | | |
Gtd. Notes, 144A | | | 5.000% | | | | 01/30/28 | | | | 150 | | | $ | 60,798 | |
Gtd. Notes, 144A | | | 5.000 | | | | 02/15/29 | | | | 75 | | | | 29,625 | |
Gtd. Notes, 144A | | | 5.250 | | | | 01/30/30 | | | | 50 | | | | 18,781 | |
Gtd. Notes, 144A | | | 5.250 | | | | 02/15/31 | | | | 350 | | | | 134,313 | |
Gtd. Notes, 144A | | | 6.250 | | | | 02/15/29 | | | | 200 | | | | 79,000 | |
Gtd. Notes, 144A | | | 7.000 | | | | 01/15/28 | | | | 250 | | | | 106,250 | |
Becton, Dickinson & Co., | | | | | | | | | | | | | | | | |
Sr. Unsec’d. Notes | | | 3.734 | | | | 12/15/24 | | | | 18 | | | | 17,542 | |
Cigna Group (The), | | | | | | | | | | | | | | | | |
Gtd. Notes | | | 4.500 | | | | 02/25/26 | | | | 967 | | | | 940,167 | |
CVS Health Corp., | | | | | | | | | | | | | | | | |
Sr. Unsec’d. Notes | | | 3.250 | | | | 08/15/29 | | | | 800 | | | | 699,787 | |
Sr. Unsec’d. Notes | | | 4.300 | | | | 03/25/28 | | | | 359 | | | | 339,504 | |
Sr. Unsec’d. Notes | | | 5.125 | | | | 07/20/45 | | | | 357 | | | | 300,309 | |
Sr. Unsec’d. Notes | | | 5.875 | | | | 06/01/53 | | | | 35 | | | | 32,399 | |
Organon & Co./Organon Foreign Debt Co-Issuer BV, | | | | | | | | | | | | | | | | |
Sr. Unsec’d. Notes, 144A | | | 5.125 | | | | 04/30/31 | | | | 200 | | | | 160,386 | |
Takeda Pharmaceutical Co. Ltd. (Japan), | | | | | | | | | | | | | | | | |
Sr. Unsec’d. Notes | | | 3.025 | | | | 07/09/40 | | | | 250 | | | | 173,944 | |
Utah Acquisition Sub, Inc., | | | | | | | | | | | | | | | | |
Gtd. Notes | | | 5.250 | | | | 06/15/46 | | | | 800 | | | | 587,480 | |
Viatris, Inc., | | | | | | | | | | | | | | | | |
Gtd. Notes | | | 4.000 | | | | 06/22/50 | | | | 325 | | | | 196,264 | |
| | | | | | | | | | | | | | | | |
| | | | |
| | | | | | | | | | | | | | | 6,053,262 | |
| | | | |
Pipelines 0.8% | | | | | | | | | | | | | | | | |
| | | | |
Antero Midstream Partners LP/Antero Midstream Finance Corp., | | | | | | | | | | | | | | | | |
Gtd. Notes, 144A | | | 5.750 | | | | 03/01/27 | | | | 350 | | | | 333,646 | |
Columbia Pipelines Operating Co. LLC, | | | | | | | | | | | | | | | | |
Sr. Unsec’d. Notes, 144A | | | 6.036 | | | | 11/15/33 | | | | 325 | | | | 317,508 | |
Eastern Gas Transmission & Storage, Inc., | | | | | | | | | | | | | | | | |
Sr. Unsec’d. Notes | | | 4.600 | | | | 12/15/44 | | | | 10 | | | | 7,706 | |
Energy Transfer LP, | | | | | | | | | | | | | | | | |
Jr. Sub. Notes, Series H | | | 6.500(ff) | | | | 11/15/26(oo) | | | | 610 | | | | 561,732 | |
Sr. Unsec’d. Notes | | | 4.950 | | | | 06/15/28 | | | | 210 | | | | 200,592 | |
Sr. Unsec’d. Notes | | | 5.000 | | | | 05/15/50 | | | | 170 | | | | 133,218 | |
Sr. Unsec’d. Notes | | | 5.300 | | | | 04/15/47 | | | | 500 | | | | 405,035 | |
Enterprise Products Operating LLC, | | | | | | | | | | | | | | | | |
Gtd. Notes | | | 3.200 | | | | 02/15/52 | | | | 220 | | | | 140,334 | |
See Notes to Financial Statements.
PGIM Balanced Fund 63
Schedule of Investments (continued)
as of September 30, 2023
| | | | | | | | | | | | | | | | |
| | | | |
| Description | | Interest Rate | | | Maturity Date | | | Principal Amount (000)# | | | Value | |
| | | | |
CORPORATE BONDS (Continued) | | | | | | | | | | | | | | | | |
| | | | |
Pipelines (cont’d.) | | | | | | | | | | | | | | | | |
| | | | |
Enterprise Products Operating LLC, (cont’d.) | | | | | | | | | | | | | | | | |
Gtd. Notes | | | 3.950% | | | | 01/31/60 | | | | 55 | | | $ | 38,650 | |
Gtd. Notes | | | 4.200 | | | | 01/31/50 | | | | 345 | | | | 266,046 | |
Gtd. Notes | | | 4.850 | | | | 03/15/44 | | | | 185 | | | | 159,067 | |
Florida Gas Transmission Co. LLC, | | | | | | | | | | | | | | | | |
Sr. Unsec’d. Notes, 144A | | | 2.550 | | | | 07/01/30 | | | | 350 | | | | 281,070 | |
Kinder Morgan, Inc., | | | | | | | | | | | | | | | | |
Gtd. Notes | | | 3.250 | | | | 08/01/50 | | | | 220 | | | | 131,146 | |
MPLX LP, | | | | | | | | | | | | | | | | |
Sr. Unsec’d. Notes | | | 2.650 | | | | 08/15/30 | | | | 630 | | | | 508,364 | |
Sr. Unsec’d. Notes | | | 4.500 | | | | 04/15/38 | | | | 175 | | | | 141,475 | |
Sr. Unsec’d. Notes | | | 4.875 | | | | 06/01/25 | | | | 375 | | | | 367,677 | |
Sr. Unsec’d. Notes | | | 4.950 | | | | 03/14/52 | | | | 520 | | | | 404,743 | |
Sr. Unsec’d. Notes | | | 5.200 | | | | 03/01/47 | | | | 20 | | | | 16,295 | |
Sr. Unsec’d. Notes | | | 5.500 | | | | 02/15/49 | | | | 90 | | | | 76,198 | |
Sr. Unsec’d. Notes | | | 5.650 | | | | 03/01/53 | | | | 80 | | | | 68,728 | |
ONEOK Partners LP, | | | | | | | | | | | | | | | | |
Gtd. Notes | | | 6.200 | | | | 09/15/43 | | | | 205 | | | | 189,964 | |
ONEOK, Inc., | | | | | | | | | | | | | | | | |
Gtd. Notes | | | 4.500 | | | | 03/15/50 | | | | 1,000 | | | | 724,266 | |
Gtd. Notes | | | 4.950 | | | | 07/13/47 | | | | 50 | | | | 39,422 | |
Spectra Energy Partners LP, | | | | | | | | | | | | | | | | |
Gtd. Notes | | | 3.375 | | | | 10/15/26 | | | | 165 | | | | 153,463 | |
Tallgrass Energy Partners LP/Tallgrass Energy Finance Corp., | | | | | | | | | | | | | | | | |
Gtd. Notes, 144A | | | 5.500 | | | | 01/15/28 | | | | 275 | | | | 250,374 | |
Gtd. Notes, 144A | | | 6.000 | | | | 12/31/30 | | | | 125 | | | | 110,338 | |
Gtd. Notes, 144A | | | 7.500 | | | | 10/01/25 | | | | 150 | | | | 149,633 | |
Venture Global Calcasieu Pass LLC, | | | | | | | | | | | | | | | | |
Sr. Sec’d. Notes, 144A | | | 3.875 | | | | 08/15/29 | | | | 30 | | | | 25,237 | |
Sr. Sec’d. Notes, 144A | | | 4.125 | | | | 08/15/31 | | | | 30 | | | | 24,623 | |
Western Midstream Operating LP, | | | | | | | | | | | | | | | | |
Sr. Unsec’d. Notes | | | 5.300 | | | | 03/01/48 | | | | 20 | | | | 15,637 | |
Williams Cos., Inc. (The), | | | | | | | | | | | | | | | | |
Sr. Unsec’d. Notes | | | 4.900 | | | | 01/15/45 | | | | 220 | | | | 176,332 | |
Sr. Unsec’d. Notes | | | 5.300 | | | | 08/15/52 | | | | 195 | | | | 165,911 | |
Sr. Unsec’d. Notes | | | 5.400 | | | | 03/02/26 | | | | 430 | | | | 426,606 | |
Sr. Unsec’d. Notes | | | 5.400 | | | | 03/04/44 | | | | 175 | | | | 151,082 | |
| | | | | | | | | | | | | | | | |
| | | | |
| | | | | | | | | | | | | | | 7,162,118 | |
See Notes to Financial Statements.
64
| | | | | | | | | | | | | | | | |
| | | | |
| Description | | Interest Rate | | | Maturity Date | | | Principal Amount (000)# | | | Value | |
| | | | |
CORPORATE BONDS (Continued) | | | | | | | | | | | | | | | | |
| | | | |
Real Estate 0.0% | | | | | | | | | | | | | | | | |
| | | | |
Howard Hughes Corp. (The), | | | | | | | | | | | | | | | | |
Gtd. Notes, 144A | | | 4.125% | | | | 02/01/29 | | | | 350 | | | $ | 279,873 | |
| | | | |
Real Estate Investment Trusts (REITs) 0.7% | | | | | | | | | | | | | | | | |
| | | | |
Brandywine Operating Partnership LP, | | | | | | | | | | | | | | | | |
Gtd. Notes | | | 4.550 | | | | 10/01/29 | | | | 450 | | | | 350,680 | |
Brixmor Operating Partnership LP, | | | | | | | | | | | | | | | | |
Sr. Unsec’d. Notes | | | 4.050 | | | | 07/01/30 | | | | 345 | | | | 301,259 | |
Diversified Healthcare Trust, | | | | | | | | | | | | | | | | |
Gtd. Notes | | | 4.375 | | | | 03/01/31 | | | | 50 | | | | 34,635 | |
Gtd. Notes | | | 9.750 | | | | 06/15/25 | | | | 25 | | | | 24,130 | |
Sr. Unsec’d. Notes | | | 4.750 | | | | 05/01/24 | | | | 50 | | | | 47,247 | |
Sr. Unsec’d. Notes | | | 4.750 | | | | 02/15/28 | | | | 400 | | | | 290,458 | |
GLP Capital LP/GLP Financing II, Inc., | | | | | | | | | | | | | | | | |
Gtd. Notes | | | 5.375 | | | | 04/15/26 | | | | 175 | | | | 169,768 | |
Healthpeak OP LLC, | | | | | | | | | | | | | | | | |
Gtd. Notes | | | 2.875 | | | | 01/15/31 | | | | 315 | | | | 255,495 | |
Gtd. Notes | | | 5.250 | | | | 12/15/32 | | | | 950 | | | | 882,259 | |
MPT Operating Partnership LP/MPT Finance Corp., | | | | | | | | | | | | | | | | |
Gtd. Notes | | | 0.993 | | | | 10/15/26 | | | EUR | 200 | | | | 148,015 | |
Realty Income Corp., | | | | | | | | | | | | | | | | |
Sr. Unsec’d. Notes | | | 3.400 | | | | 01/15/28 | | | | 800 | | | | 726,215 | |
Sun Communities Operating LP, | | | | | | | | | | | | | | | | |
Gtd. Notes | | | 2.700 | | | | 07/15/31 | | | | 675 | | | | 518,740 | |
Ventas Realty LP, | | | | | | | | | | | | | | | | |
Gtd. Notes | | | 2.650 | | | | 01/15/25 | | | | 1,750 | | | | 1,667,710 | |
Welltower OP LLC, | | | | | | | | | | | | | | | | |
Gtd. Notes | | | 4.250 | | | | 04/01/26 | | | | 160 | | | | 153,677 | |
WP Carey, Inc., | | | | | | | | | | | | | | | | |
Sr. Unsec’d. Notes | | | 2.250 | | | | 04/01/33 | | | | 545 | | | | 389,695 | |
| | | | | | | | | | | | | | | | |
| | | | |
| | | | | | | | | | | | | | | 5,959,983 | |
| | | | |
Retail 0.2% | | | | | | | | | | | | | | | | |
| | | | |
Advance Auto Parts, Inc., | | | | | | | | | | | | | | | | |
Gtd. Notes | | | 5.900 | | | | 03/09/26 | | | | 175 | | | | 168,980 | |
AutoZone, Inc., | | | | | | | | | | | | | | | | |
Sr. Unsec’d. Notes | | | 1.650 | | | | 01/15/31 | | | | 185 | | | | 138,786 | |
eG Global Finance PLC (United Kingdom), | | | | | | | | | | | | | | | | |
Sr. Sec’d. Notes | | | 6.250 | | | | 10/30/25 | | | EUR | 1,110 | | | | 1,135,573 | |
See Notes to Financial Statements.
PGIM Balanced Fund 65
Schedule of Investments (continued)
as of September 30, 2023
| | | | | | | | | | | | | | | | |
| | | | |
| Description | | Interest Rate | | | Maturity Date | | | Principal Amount (000)# | | | Value | |
| | | | |
CORPORATE BONDS (Continued) | | | | | | | | | | | | | | | | |
| | | | |
Retail (cont’d.) | | | | | | | | | | | | | | | | |
| | | | |
Sally Holdings LLC/Sally Capital, Inc., | | | | | | | | | | | | | | | | |
Gtd. Notes | | | 5.625% | | | | 12/01/25 | | | | 170 | | | $ | 165,634 | |
Suburban Propane Partners LP/Suburban Energy Finance Corp., | | | | | | | | | | | | | | | | |
Sr. Unsec’d. Notes | | | 5.875 | | | | 03/01/27 | | | | 325 | | | | 310,472 | |
| | | | | | | | | | | | | | | | |
| | | | |
| | | | | | | | | | | | | | | 1,919,445 | |
| | | | |
Semiconductors 0.2% | | | | | | | | | | | | | | | | |
| | | | |
Broadcom, Inc., | | | | | | | | | | | | | | | | |
Sr. Unsec’d. Notes, 144A | | | 3.419 | | | | 04/15/33 | | | | 1,750 | | | | 1,394,694 | |
Intel Corp., | | | | | | | | | | | | | | | | |
Sr. Unsec’d. Notes | | | 5.900 | | | | 02/10/63 | | | | 205 | | | | 194,416 | |
| | | | | | | | | | | | | | | | |
| | | | |
| | | | | | | | | | | | | | | 1,589,110 | |
| | | | |
Software 0.1% | | | | | | | | | | | | | | | | |
| | | | |
Fiserv, Inc., | | | | | | | | | | | | | | | | |
Sr. Unsec’d. Notes | | | 5.450 | | | | 03/02/28 | | | | 620 | | | | 614,013 | |
Microsoft Corp., | | | | | | | | | | | | | | | | |
Sr. Unsec’d. Notes | | | 2.525 | | | | 06/01/50 | | | | 48 | | | | 29,227 | |
Oracle Corp., | | | | | | | | | | | | | | | | |
Sr. Unsec’d. Notes | | | 5.550 | | | | 02/06/53 | | | | 245 | | | | 214,730 | |
| | | | | | | | | | | | | | | | |
| | | | |
| | | | | | | | | | | | | | | 857,970 | |
| | | | |
Telecommunications 0.6% | | | | | | | | | | | | | | | | |
| | | | |
AT&T, Inc., | | | | | | | | | | | | | | | | |
Sr. Unsec’d. Notes | | | 2.550 | | | | 12/01/33 | | | | 129 | | | | 94,688 | |
Sr. Unsec’d. Notes | | | 3.500 | | | | 09/15/53 | | | | 1,658 | | | | 1,024,404 | |
Sr. Unsec’d. Notes | | | 3.550 | | | | 09/15/55 | | | | 115 | | | | 70,492 | |
Sr. Unsec’d. Notes | | | 4.500 | | | | 05/15/35 | | | | 125 | | | | 106,503 | |
Digicel Group Holdings Ltd. (Jamaica), | | | | | | | | | | | | | | | | |
Sr. Unsec’d. Notes, 144A, Cash coupon 5.000% and PIK 3.000% (original cost $24,718; purchased 03/21/23 - 03/22/23)(f) | | | 8.000 | | | | 04/01/25(d) | | | | 63 | | | | 13,225 | |
Digicel International Finance Ltd./Digicel International Holdings Ltd. (Jamaica), | | | | | | | | | | | | | | | | |
Gtd. Notes, 144A (original cost $135,375; purchased 02/10/21)(f) | | | 8.000 | | | | 12/31/26(d) | | | | 150 | | | | 9,000 | |
Gtd. Notes, 144A, Cash coupon 6.000% and PIK 7.000% (original cost $15,750; purchased 03/17/23)(f) | | | 13.000 | | | | 12/31/25(d) | | | | 25 | | | | 17,313 | |
See Notes to Financial Statements.
66
| | | | | | | | | | | | | | | | |
| | | | |
| Description | | Interest Rate | | | Maturity Date | | | Principal Amount (000)# | | | Value | |
| | | | |
CORPORATE BONDS (Continued) | | | | | | | | | | | | | | | | |
| | | | |
Telecommunications (cont’d.) | | | | | | | | | | | | | | | | |
| | |
Digicel International Finance Ltd./Digicel International Holdings Ltd. (Jamaica), (cont’d.) | | | | | | | | | |
Sr. Sec’d. Notes, 144A (original cost $210,000; purchased 01/05/21)(f) | | | 8.750% | | | | 05/25/24 | | | | 200 | | | $ | 179,352 | |
Sr. Sec’d. Notes, 144A (original cost $183,969; purchased 01/05/21)(f) | | | 8.750 | | | | 05/25/24 | | | | 175 | | | | 155,885 | |
Digicel Ltd. (Jamaica), | | | | | | | | | | | | | | | | |
Gtd. Notes, 144A | | | 6.750 | | | | 03/01/23(d) | | | | 200 | | | | 5,000 | |
Iliad Holding SASU (France), | | | | | | | | | | | | | | | | |
Sr. Sec’d. Notes, 144A | | | 7.000 | | | | 10/15/28 | | | | 200 | | | | 182,000 | |
Intelsat Jackson Holdings SA (Luxembourg), | | | | | | | | | | | | | |
Sr. Sec’d. Notes, 144A | | | 6.500 | | | | 03/15/30 | | | | 625 | | | | 554,687 | |
NBN Co. Ltd. (Australia), | | | | | | | | | | | | | | | | |
Sr. Unsec’d. Notes, 144A, MTN | | | 5.750 | | | | 10/06/28 | | | | 295 | | | | 295,599 | |
Sprint Capital Corp., | | | | | | | | | | | | | | | | |
Gtd. Notes | | | 8.750 | | | | 03/15/32 | | | | 300 | | | | 347,310 | |
T-Mobile USA, Inc., | | | | | | | | | | | | | | | | |
Gtd. Notes | | | 2.550 | | | | 02/15/31 | | | | 1,910 | | | | 1,520,386 | |
Gtd. Notes | | | 2.625 | | | | 02/15/29 | | | | 275 | | | | 233,003 | |
Gtd. Notes | | | 3.750 | | | | 04/15/27 | | | | 75 | | | | 70,036 | |
Verizon Communications, Inc., | | | | | | | | | | | | | | | | |
Sr. Unsec’d. Notes | | | 1.680 | | | | 10/30/30 | | | | 5 | | | | 3,792 | |
Sr. Unsec’d. Notes | | | 3.400 | | | | 03/22/41 | | | | 480 | | | | 338,469 | |
Viasat, Inc., | | | | | | | | | | | | | | | | |
Sr. Unsec’d. Notes, 144A | | | 7.500 | | | | 05/30/31 | | | | 125 | | | | 82,436 | |
| | | | | | | | | | | | | | | | |
| | | | |
| | | | | | | | | | | | | | | 5,303,580 | |
| | | | |
Transportation 0.1% | | | | | | | | | | | | | | | | |
| | | | |
Burlington Northern Santa Fe LLC, | | | | | | | | | | | | | | | | |
Sr. Unsec’d. Notes | | | 6.700 | | | | 08/01/28 | | | | 135 | | | | 141,087 | |
CSX Corp., | | | | | | | | | | | | | | | | |
Sr. Unsec’d. Notes | | | 6.150 | | | | 05/01/37 | | | | 170 | | | | 173,915 | |
Forward Air Corp., | | | | | | | | | | | | | | | | |
Sr. Sec’d. Notes, 144A | | | 9.500 | | | | 10/15/31 | | | | 200 | | | | 199,868 | |
Indian Railway Finance Corp. Ltd. (India), | | | | | | | | | | | | | |
Sr. Unsec’d. Notes, 144A, MTN | | | 3.570 | | | | 01/21/32 | | | | 200 | | | | 166,138 | |
Norfolk Southern Corp., | | | | | | | | | | | | | | | | |
Sr. Unsec’d. Notes | | | 5.590 | | | | 05/17/25 | | | | 20 | | | | 19,901 | |
XPO, Inc., | | | | | | | | | | | | | | | | |
Gtd. Notes, 144A | | | 7.125 | | | | 06/01/31 | | | | 25 | | | | 24,611 | |
| | | | | | | | | | | | | | | | |
| | | | |
| | | | | | | | | | | | | | | 725,520 | |
See Notes to Financial Statements.
PGIM Balanced Fund 67
Schedule of Investments (continued)
as of September 30, 2023
| | | | | | | | | | | | | | | | |
| | | | |
| Description | | Interest Rate | | | Maturity Date | | | Principal Amount (000)# | | | Value | |
| | | | |
CORPORATE BONDS (Continued) | | | | | | | | | | | | | | | | |
| | | | |
Trucking & Leasing 0.1% | | | | | | | | | | | | | | | | |
| | | | |
Penske Truck Leasing Co. LP/PTL Finance Corp., | | | | | | | | | | | | | | | | |
Sr. Unsec’d. Notes, 144A | | | 5.550% | | | | 05/01/28 | | | | 785 | | | $ | 760,058 | |
| | | | | | | | | | | | | | | | |
| | | | |
TOTAL CORPORATE BONDS
(cost $164,650,099) | | | | | | | | | | | | | | | 141,221,885 | |
| | | | | | | | | | | | | | | | |
| | | | |
FLOATING RATE AND OTHER LOANS 0.0% | | | | | | | | | | | | | | | | |
| | | | |
Media 0.0% | | | | | | | | | | | | | | | | |
| | | | |
Diamond Sports Group LLC, | | | | | | | | | | | | | | | | |
First Lien Term Loan, 1 Month SOFR + 10.100% | | | 15.294(c) | | | | 05/25/26 | | | | 75 | | | | 39,534 | |
Second Lien Term Loan, | | | 10.010 | | | | 08/24/26 | | | | 620 | | | | 13,950 | |
| | | | | | | | | | | | | | | | |
| | | | |
| | | | | | | | | | | | | | | 53,484 | |
| | | | |
Telecommunications 0.0% | | | | | | | | | | | | | | | | |
| | | | |
Digicel International Finance Ltd. (Jamaica), | | | | | | | | | | | | | | | | |
First Lien Initial Term B Loan, 6 Month LIBOR + 3.250% | | | 8.981(c) | | | | 05/27/24 | | | | 341 | | | | 306,322 | |
| | | | | | | | | | | | | | | | |
| | | | |
TOTAL FLOATING RATE AND OTHER LOANS
(cost $606,197) | | | | | | | | | | | | | | | 359,806 | |
| | | | | | | | | | | | | | | | |
| | | | |
MUNICIPAL BONDS 0.3% | | | | | | | | | | | | | | | | |
| | | | |
Alabama 0.0% | | | | | | | | | | | | | | | | |
| | | | |
Alabama Economic Settlement Authority, | | | | | | | | | | | | | | | | |
Taxable, Revenue Bonds, Series B | | | 4.263 | | | | 09/15/32 | | | | 35 | | | | 32,482 | |
| | | | | | | | | | | | | | | | |
| | | | |
California 0.1% | | | | | | | | | | | | | | | | |
| | | | |
Bay Area Toll Authority, | | | | | | | | | | | | | | | | |
Revenue Bonds, BABs, Series F2 | | | 6.263 | | | | 04/01/49 | | | | 220 | | | | 235,449 | |
State of California, | | | | | | | | | | | | | | | | |
General Obligation Unlimited, BABs | | | 7.300 | | | | 10/01/39 | | | | 210 | | | | 238,736 | |
General Obligation Unlimited, Taxable, BABs | | | 7.500 | | | | 04/01/34 | | | | 15 | | | | 17,310 | |
| | | | | | | | | | | | | | | | |
| | | | |
| | | | | | | | | | | | | | | 491,495 | |
| | | | | | | | | | | | | | | | |
See Notes to Financial Statements.
68
| | | | | | | | | | | | | | | | |
| | | | |
| Description | | Interest Rate | | | Maturity Date | | | Principal Amount (000)# | | | Value | |
| | | | |
MUNICIPAL BONDS (Continued) | | | | | | | | | | | | | | | | |
| | | | |
Illinois 0.1% | | | | | | | | | | | | | | | | |
| | | | |
Chicago O’Hare International Airport, | | | | | | | | | | | | | | | | |
Revenue Bonds, BABs, Series B | | | 6.395% | | | | 01/01/40 | | | | 160 | | | $ | 169,563 | |
State of Illinois, | | | | | | | | | | | | | | | | |
General Obligation Unlimited, Taxable | | | 5.100 | | | | 06/01/33 | | | | 100 | | | | 94,905 | |
| | | | | | | | | | | | | | | | |
| | | | |
| | | | | | | | | | | | | | | 264,468 | |
| | | | | | | | | | | | | | | | |
| | | | |
Michigan 0.1% | | | | | | | | | | | | | | | | |
| | | | |
Michigan State University, | | | | | | | | | | | | | | | | |
Taxable, Revenue Bonds, Series A | | | 4.165 | | | | 08/15/22 | | | | 435 | | | | 304,584 | |
University of Michigan, | | | | | | | | | | | | | | | | |
Taxable, Revenue Bonds, Series A | | | 4.454 | | | | 04/01/2122 | | | | 440 | | | | 336,034 | |
Taxable, Revenue Bonds, Series B | | | 2.437 | | | | 04/01/40 | | | | 550 | | | | 371,302 | |
| | | | | | | | | | | | | | | | |
| | | | |
| | | | | | | | | | | | | | | 1,011,920 | |
| | | | | | | | | | | | | | | | |
| | | | |
New Jersey 0.0% | | | | | | | | | | | | | | | | |
| | | | |
New Jersey Turnpike Authority, | | | | | | | | | | | | | | | | |
Taxable, Revenue Bonds, BABs, Series F | | | 7.414 | | | | 01/01/40 | | | | 165 | | | | 192,418 | |
| | | | | | | | | | | | | | | | |
| | | | |
New York 0.0% | | | | | | | | | | | | | | | | |
| | | | |
New York City Transitional Finance Authority Future Tax Secured Revenue, | | | | | | | | | | | | | | | | |
Taxable, Revenue Bonds, BABs | | | 5.767 | | | | 08/01/36 | | | | 170 | | | | 171,316 | |
| | | | | | | | | | | | | | | | |
| | | | |
Ohio 0.0% | | | | | | | | | | | | | | | | |
| | | | |
Ohio State University (The), | | | | | | | | | | | | | | | | |
Taxable, Revenue Bonds, BABs, Series C | | | 4.910 | | | | 06/01/40 | | | | 65 | | | | 59,937 | |
| | | | | | | | | | | | | | | | |
| | | | |
Oregon 0.0% | | | | | | | | | | | | | | | | |
| | | | |
State of Oregon Department of Transportation, | | | | | | | | | | | | | | | | |
Taxable, Revenue Bonds, BABs, Series A | | | 5.834 | | | | 11/15/34 | | | | 70 | | | | 72,347 | |
| | | | | | | | | | | | | | | | |
| | | | |
Pennsylvania 0.0% | | | | | | | | | | | | | | | | |
| | | | |
Pennsylvania Turnpike Commission, | | | | | | | | | | | | | | | | |
Revenue Bonds, BABs, Series B | | | 5.511 | | | | 12/01/45 | | | | 80 | | | | 76,501 | |
| | | | | | | | | | | | | | | | |
See Notes to Financial Statements.
PGIM Balanced Fund 69
Schedule of Investments (continued)
as of September 30, 2023
| | | | | | | | | | | | | | | | |
| | | | |
| Description | | Interest Rate | | | Maturity Date | | | Principal Amount (000)# | | | Value | |
| | | | |
MUNICIPAL BONDS (Continued) | | | | | | | | | | | | | | | | |
| | | | |
Virginia 0.0% | | | | | | | | | | | | | | | | |
| | | | |
University of Virginia, | | | | | | | | | | | | | | | | |
Taxable, Revenue Bonds, Series C | | | 4.179% | | | | 09/01/2117 | | | | 80 | | | $ | 58,184 | |
| | | | | | | | | | | | | | | | |
| | | | |
TOTAL MUNICIPAL BONDS
(cost $2,819,024) | | | | | | | | | | | | | | | 2,431,068 | |
| | | | | | | | | | | | | | | | |
| | | | |
RESIDENTIAL MORTGAGE-BACKED SECURITIES 1.3% | | | | | | | | | | | | | | | | |
| | | | |
Alternative Loan Trust, | | | | | | | | | | | | | | | | |
Series 2004-18CB, Class 3A1 | | | 5.250 | | | | 09/25/35 | | | | 1 | | | | 1,376 | |
Banc of America Mortgage Trust, | | | | | | | | | | | | | | | | |
Series 2005-A, Class 2A1 | | | 3.818(cc) | | | | 02/25/35 | | | | 5 | | | | 4,634 | |
Bellemeade Re Ltd., | | | | | | | | | | | | | | | | |
Series 2020-04A, Class M2B, 144A, 1 Month LIBOR + 3.600% (Cap N/A, Floor 3.600%) | | | 9.034(c) | | | | 06/25/30 | | | | 37 | | | | 37,516 | |
Series 2021-01A, Class M1A, 144A, 30 Day Average SOFR + 1.750% (Cap N/A, Floor 1.750%) | | | 7.065(c) | | | | 03/25/31 | | | | 10 | | | | 9,894 | |
Series 2021-01A, Class M1C, 144A, 30 Day Average SOFR + 2.950% (Cap N/A, Floor 2.950%) | | | 8.265(c) | | | | 03/25/31 | | | | 150 | | | | 152,585 | |
Series 2022-01, Class M1B, 144A, 30 Day Average SOFR + 2.150% (Cap N/A, Floor 2.150%) | | | 7.465(c) | | | | 01/26/32 | | | | 160 | | | | 159,735 | |
Series 2022-01, Class M1C, 144A, 30 Day Average SOFR + 3.700% (Cap N/A, Floor 3.700%) | | | 9.015(c) | | | | 01/26/32 | | | | 360 | | | | 363,355 | |
Chase Mortgage Finance Trust, | | | | | | | | | | | | | | | | |
Series 2007-A01, Class 1A5 | | | 4.961(cc) | | | | 02/25/37 | | | | 14 | | | | 13,393 | |
Citigroup Mortgage Loan Trust, | | | | | | | | | | | | | | | | |
Series 2022-A, Class A1, 144A | | | 6.170 | | | | 09/25/62 | | | | 276 | | | | 273,225 | |
Connecticut Avenue Securities Trust, | | | | | | | | | | | | | | | | |
Series 2019-R03, Class 1M2, 144A, 30 Day Average SOFR + 2.264% (Cap N/A, Floor 0.000%) | | | 7.579(c) | | | | 09/25/31 | | | | 1 | | | | 755 | |
Series 2019-R07, Class 1M2, 144A, 30 Day Average SOFR + 2.214% (Cap N/A, Floor 0.000%) | | | 7.529(c) | | | | 10/25/39 | | | | 5 | | | | 5,156 | |
Series 2022-R03, Class 1B1, 144A, 30 Day Average SOFR + 6.250% (Cap N/A, Floor 0.000%) | | | 11.565(c) | | | | 03/25/42 | | | | 105 | | | | 115,437 | |
Series 2022-R04, Class 1B1, 144A, 30 Day Average SOFR + 5.250% (Cap N/A, Floor 0.000%) | | | 10.565(c) | | | | 03/25/42 | | | | 90 | | | | 95,764 | |
Credit Suisse Mortgage Trust, | | | | | | | | | | | | | | | | |
Series 2018-RPL09, Class A, 144A | | | 3.850(cc) | | | | 09/25/57 | | | | 188 | | | | 173,101 | |
Series 2020-RPL06, Class A1, 144A | | | 2.688(cc) | | | | 03/25/59 | | | | 336 | | | | 327,916 | |
Series 2022-RPL04, Class A1, 144A | | | 3.904(cc) | | | | 04/25/62 | | | | 360 | | | | 329,373 | |
Eagle Re Ltd., | | | | | | | | | | | | | | | | |
Series 2018-01, Class M1, 144A, 1 Month LIBOR + 1.700% (Cap N/A, Floor 1.700%) | | | 7.129(c) | | | | 11/25/28 | | | | 69 | | | | 68,879 | |
See Notes to Financial Statements.
70
| | | | | | | | | | | | | | | | |
| | | | |
| Description | | Interest
Rate | | | Maturity
Date | | | Principal
Amount (000)# | | | Value | |
| | | |
RESIDENTIAL MORTGAGE-BACKED SECURITIES (Continued) | | | | | | | | | | | | | |
Eagle Re Ltd., (cont’d.) | | | | | | | | | | | | | | | | |
Series 2021-01, Class M1C, 144A, 30 Day Average | | | | | | | | | | | | | | | | |
SOFR + 2.700% (Cap N/A, Floor 2.700%) | | | 8.015%(c) | | | | 10/25/33 | | | | 198 | | | $ | 198,788 | |
Series 2021-02, Class M1C, 144A, 30 Day Average | | | | | | | | | | | | | | | | |
SOFR + 3.450% (Cap N/A, Floor 3.450%) | | | 8.765(c) | | | | 04/25/34 | | | | 240 | | | | 242,375 | |
Fannie Mae Connecticut Avenue Securities, Series 2021-R02, Class 2M2, 144A, 30 Day Average SOFR + 2.000% (Cap N/A, Floor 0.000%) | | | 7.315(c) | | | | 11/25/41 | | | | 90 | | | | 88,539 | |
Fannie Mae REMIC, Series 2014-11, Class VB | | | 4.500 | | | | 04/25/42 | | | | 500 | | | | 476,072 | |
FHLMC Structured Agency Credit Risk Debt Notes, | | | | | | | | | | | | | | | | |
Series 2020-HQA05, Class B1, 144A, 30 Day Average SOFR + 4.000% (Cap N/A, Floor 0.000%) | | | 9.315(c) | | | | 11/25/50 | | | | 250 | | | | 264,538 | |
Series 2020-HQA05, Class M2, 144A, 30 Day Average SOFR + 2.600% (Cap N/A, Floor 0.000%) | | | 7.915(c) | | | | 11/25/50 | | | | 588 | | | | 595,215 | |
Series 2021-DNA02, Class B1, 144A, 30 Day Average SOFR + 3.400% (Cap N/A, Floor 0.000%) | | | 8.715(c) | | | | 08/25/33 | | | | 1,120 | | | | 1,148,041 | |
FHLMC Structured Agency Credit Risk REMIC Trust, | | | | | | | | | | | | | | | | |
Series 2020-DNA02, Class M2, 144A, 30 Day Average SOFR + 1.964% (Cap N/A, Floor 0.000%) | | | 7.279(c) | | | | 02/25/50 | | | | 125 | | | | 125,313 | |
Series 2020-DNA04, Class B1, 144A, 30 Day Average SOFR + 6.114% (Cap N/A, Floor 0.000%) | | | 11.429(c) | | | | 08/25/50 | | | | 86 | | | | 96,454 | |
Series 2020-DNA05, Class B1, 144A, 30 Day Average SOFR + 4.800% (Cap N/A, Floor 0.000%) | | | 10.115(c) | | | | 10/25/50 | | | | 190 | | | | 206,615 | |
Series 2021-DNA01, Class B1, 144A, 30 Day Average SOFR + 2.650% (Cap N/A, Floor 0.000%) | | | 7.965(c) | | | | 01/25/51 | | | | 100 | | | | 97,998 | |
Series 2021-DNA03, Class B1, 144A, 30 Day Average SOFR + 3.500% (Cap N/A, Floor 0.000%) | | | 8.815(c) | | | | 10/25/33 | | | | 275 | | | | 283,951 | |
Series 2021-DNA05, Class B1, 144A, 30 Day Average SOFR + 3.050% (Cap N/A, Floor 0.000%) | | | 8.365(c) | | | | 01/25/34 | | | | 290 | | | | 290,724 | |
Series 2021-DNA05, Class M2, 144A, 30 Day Average SOFR + 1.650% (Cap N/A, Floor 0.000%) | | | 6.965(c) | | | | 01/25/34 | | | | 74 | | | | 73,706 | |
Series 2021-DNA06, Class B1, 144A, 30 Day Average SOFR + 3.400% (Cap N/A, Floor 0.000%) | | | 8.715(c) | | | | 10/25/41 | | | | 200 | | | | 202,236 | |
Series 2021-HQA01, Class B1, 144A, 30 Day Average SOFR + 3.000% (Cap N/A, Floor 0.000%) | | | 8.315(c) | | | | 08/25/33 | | | | 160 | | | | 157,916 | |
Series 2021-HQA02, Class B1, 144A, 30 Day Average SOFR + 3.150% (Cap N/A, Floor 0.000%) | | | 8.465(c) | | | | 12/25/33 | | | | 100 | | | | 98,626 | |
Series 2021-HQA03, Class M2, 144A, 30 Day Average SOFR + 2.100% (Cap N/A, Floor 0.000%) | | | 7.415(c) | | | | 09/25/41 | | | | 300 | | | | 294,042 | |
Series 2021-HQA04, Class M2, 144A, 30 Day Average SOFR + 2.350% (Cap N/A, Floor 0.000%) | | | 7.665(c) | | | | 12/25/41 | | | | 200 | | | | 193,250 | |
Series 2022-DNA01, Class M1B, 144A, 30 Day Average SOFR + 1.850% (Cap N/A, Floor 0.000%) | | | 7.165(c) | | | | 01/25/42 | | | | 410 | | | | 404,365 | |
See Notes to Financial Statements.
PGIM Balanced Fund 71
Schedule of Investments (continued)
as of September 30, 2023
| | | | | | | | | | | | | | |
| | | | |
| Description | | Interest
Rate | | Maturity
Date | | | Principal
Amount (000)# | | | Value | |
| | | |
RESIDENTIAL MORTGAGE-BACKED SECURITIES (Continued) | | | | | | | | | | | | |
FHLMC Structured Agency Credit Risk REMIC Trust, (cont’d.) | | | | | | | | | | | | |
Series 2022-DNA02, Class M1B, 144A, 30 Day Average SOFR + 2.400% (Cap N/A, Floor 0.000%) | | 7.715%(c) | | | 02/25/42 | | | | 300 | | | $ | 301,509 | |
Series 2022-DNA03, Class M1B, 144A, 30 Day Average SOFR + 2.900% (Cap N/A, Floor 0.000%) | | 8.215(c) | | | 04/25/42 | | | | 100 | | | | 102,147 | |
Home Re Ltd., | | | | | | | | | | | | | | |
Series 2021-02, Class M1B, 144A, 30 Day Average SOFR + 1.600% (Cap N/A, Floor 0.000%) | | 6.915(c) | | | 01/25/34 | | | | 83 | | | | 83,482 | |
Series 2021-02, Class M1C, 144A, 30 Day Average SOFR + 2.800% (Cap N/A, Floor 0.000%) | | 8.115(c) | | | 01/25/34 | | | | 235 | | | | 236,990 | |
JPMorgan Mortgage Trust, | | | | | | | | | | | | | | |
Series 2007-A01, Class 4A1 | | 5.768(cc) | | | 07/25/35 | | | | 2 | | | | 1,810 | |
Series 2023-HE02, Class A1, 144A, 30 Day Average SOFR + 1.700% (Cap N/A, Floor 0.000%) | | 7.016(c) | | | 03/25/54 | | | | 65 | | | | 65,000 | |
Legacy Mortgage Asset Trust, | | | | | | | | | | | | | | |
Series 2019-PR01, Class A1, 144A | | 6.858 | | | 09/25/59 | | | | 195 | | | | 192,385 | |
Series 2020-GS01, Class A1, 144A | | 5.882 | | | 10/25/59 | | | | 244 | | | | 242,824 | |
Series 2020-SL01, Class A, 144A | | 5.734 | | | 01/25/60 | | | | 38 | | | | 37,718 | |
Series 2021-GS01, Class A1, 144A | | 1.892 | | | 10/25/66 | | | | 125 | | | | 115,813 | |
Series 2021-SL01, Class A, 144A | | 1.991(cc) | | | 09/25/60 | | | | 78 | | | | 77,631 | |
Mill City Mortgage Loan Trust, Series 2018-01, Class A1, 144A | | 3.250(cc) | | | 05/25/62 | | | | 32 | | | | 30,634 | |
New Residential Mortgage Loan Trust, Series 2018-04A, Class A1S, 144A, 1 Month SOFR + 0.864% (Cap N/A, Floor 0.750%) | | 6.184(c) | | | 01/25/48 | | | | 59 | | | | 57,072 | |
Oaktown Re VII Ltd., Series 2021-02, Class M1B, 144A, 30 Day Average SOFR + 2.900% (Cap N/A, Floor 2.900%) | | 8.215(c) | | | 04/25/34 | | | | 200 | | | | 201,975 | |
OBX Trust, Series 2018-01, Class A2, 144A, 1 Month SOFR + 0.764% (Cap N/A, Floor 0.000%) | | 6.084(c) | | | 06/25/57 | | | | 53 | | | | 49,854 | |
PMT Credit Risk Transfer Trust, Series 2023-1R, Class A, 144A, 30 Day Average SOFR + 4.400% (Cap N/A, Floor 0.000%) | | 9.715(c) | | | 03/27/25 | | | | 851 | | | | 853,444 | |
PNMAC GMSR Issuer Trust, Series 2018-GT01, Class A, 144A, 1 Month LIBOR + 3.850% (Cap N/A, Floor 2.850%) | | 9.284(c) | | | 02/25/25 | | | | 150 | | | | 150,110 | |
Radnor Re Ltd., | | | | | | | | | | | | | | |
Series 2021-02, Class M1A, 144A, 30 Day Average SOFR + 1.850% (Cap N/A, Floor 1.850%) | | 7.165(c) | | | 11/25/31 | | | | 106 | | | | 105,935 | |
Series 2021-02, Class M1B, 144A, 30 Day Average SOFR + 3.700% (Cap N/A, Floor 3.700%) | | 9.015(c) | | | 11/25/31 | | | | 300 | | | | 307,351 | |
Series 2023-01, Class M1A, 144A, 30 Day Average SOFR + 2.700% (Cap N/A, Floor 2.700%) | | 8.015(c) | | | 07/25/33 | | | | 150 | | | | 150,744 | |
See Notes to Financial Statements.
72
| | | | | | | | | | | | | | |
| | | | |
| Description | | Interest
Rate | | Maturity
Date | | | Principal
Amount (000)# | | | Value | |
| | | |
RESIDENTIAL MORTGAGE-BACKED SECURITIES (Continued) | | | | | | | | | | | | |
Retiro Mortgage Securities DAC (Spain), Series 01A, Class A1, 144A, 3 Month EURIBOR + 2.000% (Cap 5.000%, Floor 0.000%) | | 5.000%(c) | | | 07/30/75 | | | EUR | 110 | | | $ | 115,106 | |
Seasoned Credit Risk Transfer Trust, Series 2019-02, Class MA | | 3.500 | | | 08/25/58 | | | | 290 | | | | 263,649 | |
Shamrock Residential (Ireland), Series 2023-01A, Class A, 144A, 1 Month EURIBOR + 1.000% (Cap N/A, Floor 0.000%) | | 4.869(c) | | | 06/24/71 | | | EUR | 110 | | | | 115,372 | |
Structured Adjustable Rate Mortgage Loan Trust, Series 2004-01, Class 4A3 | | 6.379(cc) | | | 02/25/34 | | | | 10 | | | | 9,371 | |
Towd Point Mortgage Trust, Series 2017-05, Class A1, 144A, 1 Month SOFR + 0.714% (Cap N/A, Floor 0.000%) | | 5.280(c) | | | 02/25/57 | | | | 68 | | | | 68,734 | |
| | | | | | | | | | | | | | |
| | | | |
TOTAL RESIDENTIAL MORTGAGE-BACKED SECURITIES
(cost $11,635,954) | | | | | | | | | | | | | 11,607,518 | |
| | | | | | | | | | | | | | |
| | | | |
SOVEREIGN BONDS 0.7% | | | | | | | | | | | | | | |
Abu Dhabi Government International Bond (United Arab Emirates), Sr. Unsec’d. Notes, 144A | | 3.125 | | | 10/11/27 | | | | 485 | | | | 452,190 | |
Bermuda Government International Bond (Bermuda), Sr. Unsec’d. Notes, 144A | | 2.375 | | | 08/20/30 | | | | 200 | | | | 160,210 | |
Bulgaria Government International Bond (Bulgaria), Sr. Unsec’d. Notes | | 1.375 | | | 09/23/50 | | | EUR | 164 | | | | 90,502 | |
Colombia Government International Bond (Colombia), Sr. Unsec’d. Notes | | 7.375 | | | 09/18/37 | | | | 100 | | | | 92,030 | |
Dominican Republic International Bond (Dominican Republic), Sr. Unsec’d. Notes, 144A | | 5.500 | | | 02/22/29 | | | | 440 | | | | 402,358 | |
Export-Import Bank of India (India), Sr. Unsec’d. Notes, 144A | | 3.875 | | | 02/01/28 | | | | 200 | | | | 184,518 | |
Indonesia Government International Bond (Indonesia), | | | | | | | | | | | | | | |
Sr. Unsec’d. Notes | | 1.100 | | | 03/12/33 | | | EUR | 100 | | | | 76,044 | |
Sr. Unsec’d. Notes | | 1.450 | | | 09/18/26 | | | EUR | 315 | | | | 304,666 | |
Sr. Unsec’d. Notes | | 3.375 | | | 07/30/25 | | | EUR | 350 | | | | 363,029 | |
Sr. Unsec’d. Notes | | 3.500 | | | 01/11/28 | | | | 370 | | | | 341,673 | |
Japan Finance Organization for Municipalities (Japan), Sr. Unsec’d. Notes, 144A, MTN | | 2.125 | | | 10/25/23 | | | | 200 | | | | 199,562 | |
Panama Government International Bond (Panama), Sr. Unsec’d. Notes | | 6.700 | | | 01/26/36 | | | | 200 | | | | 197,548 | |
Province of Manitoba (Canada), Sr. Unsec’d. Notes | | 2.125 | | | 06/22/26 | | | | 100 | | | | 92,550 | |
See Notes to Financial Statements.
PGIM Balanced Fund 73
Schedule of Investments (continued)
as of September 30, 2023
| | | | | | | | | | | | | | | | |
| | | | |
| Description | | Interest
Rate | | | Maturity
Date | | | Principal
Amount (000)# | | | Value | |
| | | | |
SOVEREIGN BONDS (Continued) | | | | | | | | | | | | | | | | |
Republic of Italy Government International Bond (Italy), Sr. Unsec’d. Notes | | | 2.875% | | | | 10/17/29 | | | | 2,000 | | | $ | 1,711,830 | |
Romanian Government International Bond (Romania), | | | | | | | | | | | | | | | | |
Sr. Unsec’d. Notes, 144A, MTN | | | 3.875 | | | | 10/29/35 | | | EUR | 98 | | | | 80,370 | |
Sr. Unsec’d. Notes, 144A, MTN | | | 5.000 | | | | 09/27/26 | | | EUR | 400 | �� | | | 422,603 | |
Serbia International Bond (Serbia), | | | | | | | | | | | | | | | | |
Sr. Unsec’d. Notes | | | 1.500 | | | | 06/26/29 | | | EUR | 581 | | | | 471,170 | |
Sr. Unsec’d. Notes | | | 3.125 | | | | 05/15/27 | | | EUR | 497 | | | | 473,854 | |
Sr. Unsec’d. Notes, 144A | | | 6.250 | | | | 05/26/28 | | | | 200 | | | | 195,840 | |
Ukraine Government International Bond (Ukraine), | | | | | | | | | | | | | | | | |
Sr. Unsec’d. Notes | | | 8.994 | | | | 02/01/26(d) | | | | 300 | | | | 94,950 | |
Sr. Unsec’d. Notes, 144A | | | 4.375 | | | | 01/27/32(d) | | | EUR | 200 | | | | 49,691 | |
Sr. Unsec’d. Notes, 144A | | | 7.750 | | | | 09/01/24(d) | | | | 640 | | | | 216,000 | |
| | | | | | | | | | | | | | | | |
| | | | |
TOTAL SOVEREIGN BONDS
(cost $8,322,679) | | | | | | | | | | | | | | | 6,673,188 | |
| | | | | | | | | | | | | | | | |
| | | | |
U.S. GOVERNMENT AGENCY OBLIGATIONS 6.6% | | | | | | | | | | | | | | | | |
Federal Home Loan Bank | | | 5.500 | | | | 07/15/36 | | | | 135 | | | | 142,131 | |
Federal Home Loan Mortgage Corp. | | | 2.000 | | | | 12/01/50 | | | | 493 | | | | 376,998 | |
Federal Home Loan Mortgage Corp. | | | 2.500 | | | | 09/01/46 | | | | 369 | | | | 296,629 | |
Federal Home Loan Mortgage Corp. | | | 2.500 | | | | 03/01/51 | | | | 1,928 | | | | 1,541,855 | |
Federal Home Loan Mortgage Corp. | | | 2.500 | | | | 07/01/51 | | | | 271 | | | | 216,199 | |
Federal Home Loan Mortgage Corp. | | | 3.000 | | | | 01/01/52 | | | | 1,976 | | | | 1,642,138 | |
Federal Home Loan Mortgage Corp. | | | 3.000 | | | | 02/01/52 | | | | 1,817 | | | | 1,505,332 | |
Federal Home Loan Mortgage Corp. | | | 3.500 | | | | 03/01/52 | | | | 899 | | | | 773,376 | |
Federal Home Loan Mortgage Corp. | | | 3.500 | | | | 05/01/52 | | | | 989 | | | | 851,059 | |
Federal Home Loan Mortgage Corp. | | | 4.000 | | | | 07/01/52 | | | | 490 | | | | 436,825 | |
Federal Home Loan Mortgage Corp. | | | 4.000 | | | | 10/01/52 | | | | 2,938 | | | | 2,616,857 | |
Federal Home Loan Mortgage Corp. | | | 4.500 | | | | 10/01/39 | | | | 60 | | | | 56,712 | |
Federal Home Loan Mortgage Corp. | | | 4.500 | | | | 07/01/52 | | | | 1,455 | | | | 1,336,610 | |
Federal Home Loan Mortgage Corp. | | | 4.500 | | | | 08/01/52 | | | | 1,043 | | | | 957,866 | |
Federal Home Loan Mortgage Corp. | | | 4.500 | | | | 10/01/52 | | | | 490 | | | | 449,715 | |
Federal Home Loan Mortgage Corp. | | | 5.000 | | | | 04/01/34 | | | | 6 | | | | 5,575 | |
Federal Home Loan Mortgage Corp. | | | 5.000 | | | | 05/01/34 | | | | 12 | | | | 11,498 | |
Federal Home Loan Mortgage Corp. | | | 5.000 | | | | 10/01/35 | | | | 18 | | | | 17,454 | |
Federal Home Loan Mortgage Corp. | | | 5.000 | | | | 11/01/41 | | | | 125 | | | | 122,243 | |
Federal Home Loan Mortgage Corp. | | | 5.000 | | | | 09/01/52 | | | | 1,593 | | | | 1,503,828 | |
Federal Home Loan Mortgage Corp. | | | 5.000 | | | | 10/01/52 | | | | 1,441 | | | | 1,360,656 | |
Federal Home Loan Mortgage Corp. | | | 5.500 | | | | 12/01/33 | | | | 12 | | | | 11,888 | |
Federal Home Loan Mortgage Corp. | | | 5.500 | | | | 05/01/34 | | | | 2 | | | | 1,560 | |
Federal Home Loan Mortgage Corp. | | | 5.500 | | | | 07/01/34 | | | | 27 | | | | 26,704 | |
Federal Home Loan Mortgage Corp. | | | 5.500 | | | | 05/01/37 | | | | 4 | | | | 4,328 | |
Federal Home Loan Mortgage Corp. | | | 5.500 | | | | 10/01/37 | | | | 8 | | | | 8,446 | |
Federal Home Loan Mortgage Corp. | | | 5.500 | | | | 12/01/52 | | | | 382 | | | | 369,911 | |
See Notes to Financial Statements.
74
| | | | | | | | | | | | | | | | |
| | | | |
| Description | | Interest
Rate | | | Maturity
Date | | | Principal
Amount (000)# | | | Value | |
| | | | |
U.S. GOVERNMENT AGENCY OBLIGATIONS (Continued) | | | | | | | | | | | | | | | | |
Federal Home Loan Mortgage Corp. | | | 6.000% | | | | 01/01/34 | | | | 12 | | | $ | 12,090 | |
Federal Home Loan Mortgage Corp. | | | 7.000 | | | | 10/01/31 | | | | —(r | ) | | | 375 | |
Federal Home Loan Mortgage Corp. | | | 7.000 | | | | 05/01/32 | | | | 3 | | | | 3,347 | |
Federal National Mortgage Assoc. | | | 1.500 | | | | 02/01/51 | | | | 1,022 | | | | 736,995 | |
Federal National Mortgage Assoc. | | | 1.500 | | | | 06/01/51 | | | | 967 | | | | 696,639 | |
Federal National Mortgage Assoc. | | | 2.000 | | | | 11/01/50 | | | | 2,899 | | | | 2,219,840 | |
Federal National Mortgage Assoc. | | | 2.000 | | | | 12/01/50 | | | | 1,277 | | | | 977,558 | |
Federal National Mortgage Assoc. | | | 2.000 | | | | 04/01/51 | | | | 1,465 | | | | 1,116,746 | |
Federal National Mortgage Assoc. | | | 2.000 | | | | 05/01/51 | | | | 538 | | | | 411,027 | |
Federal National Mortgage Assoc. | | | 2.000 | | | | 08/01/51 | | | | 1,220 | | | | 932,373 | |
Federal National Mortgage Assoc.(k) | | | 2.000 | | | | 11/01/51 | | | | 3,001 | | | | 2,287,423 | |
Federal National Mortgage Assoc. | | | 2.500 | | | | TBA(tt) | | | | 1,000 | | | | 793,631 | |
Federal National Mortgage Assoc. | | | 2.500 | | | | 06/01/50 | | | | 493 | | | | 395,817 | |
Federal National Mortgage Assoc. | | | 2.500 | | | | 10/01/50 | | | | 1,974 | | | | 1,579,128 | |
Federal National Mortgage Assoc. | | | 2.500 | | | | 01/01/51 | | | | 1,061 | | | | 848,057 | |
Federal National Mortgage Assoc. | | | 2.500 | | | | 02/01/51 | | | | 530 | | | | 422,267 | |
Federal National Mortgage Assoc. | | | 2.500 | | | | 03/01/51 | | | | 441 | | | | 352,714 | |
Federal National Mortgage Assoc. | | | 2.500 | | | | 07/01/51 | | | | 224 | | | | 178,700 | |
Federal National Mortgage Assoc. | | | 3.000 | | | | 12/01/51 | | | | 882 | | | | 733,290 | |
Federal National Mortgage Assoc. | | | 3.000 | | | | 02/01/52 | | | | 445 | | | | 368,592 | |
Federal National Mortgage Assoc. | | | 3.000 | | | | 03/01/52 | | | | 2,715 | | | | 2,248,963 | |
Federal National Mortgage Assoc. | | | 3.500 | | | | 01/01/52 | | | | 411 | | | | 353,663 | |
Federal National Mortgage Assoc. | | | 3.500 | | | | 02/01/52 | | | | 1,297 | | | | 1,117,492 | |
Federal National Mortgage Assoc. | | | 4.000 | | | | 04/01/52 | | | | 1,322 | | | | 1,178,273 | |
Federal National Mortgage Assoc. | | | 4.000 | | | | 05/01/52 | | | | 2,532 | | | | 2,256,198 | |
Federal National Mortgage Assoc. | | | 4.000 | | | | 12/01/52 | | | | 492 | | | | 438,355 | |
Federal National Mortgage Assoc. | | | 4.500 | | | | 09/01/39 | | | | 47 | | | | 44,746 | |
Federal National Mortgage Assoc. | | | 4.500 | | | | 08/01/40 | | | | 41 | | | | 39,021 | |
Federal National Mortgage Assoc. | | | 4.500 | | | | 02/01/44 | | | | 57 | | | | 53,744 | |
Federal National Mortgage Assoc. | | | 4.500 | | | | 08/01/44 | | | | 126 | | | | 118,526 | |
Federal National Mortgage Assoc. | | | 4.500 | | | | 01/01/45 | | | | 107 | | | | 100,217 | |
Federal National Mortgage Assoc. | | | 4.500 | | | | 05/01/52 | | | | 460 | | | | 424,397 | |
Federal National Mortgage Assoc. | | | 4.500 | | | | 06/01/52 | | | | 935 | | | | 858,810 | |
Federal National Mortgage Assoc. | | | 4.500 | | | | 07/01/52 | | | | 967 | | | | 888,154 | |
Federal National Mortgage Assoc. | | | 4.500 | | | | 08/01/52 | | | | 988 | | | | 907,771 | |
Federal National Mortgage Assoc. | | | 4.500 | | | | 10/01/52 | | | | 972 | | | | 893,062 | |
Federal National Mortgage Assoc. | | | 5.000 | | | | 07/01/35 | | | | 11 | | | | 10,656 | |
Federal National Mortgage Assoc. | | | 5.000 | | | | 02/01/36 | | | | 24 | | | | 23,274 | |
Federal National Mortgage Assoc. | | | 5.000 | | | | 06/01/52 | | | | 447 | | | | 422,259 | |
Federal National Mortgage Assoc. | | | 5.000 | | | | 07/01/52 | | | | 2,317 | | | | 2,187,948 | |
Federal National Mortgage Assoc. | | | 5.000 | | | | 09/01/52 | | | | 1,298 | | | | 1,225,764 | |
Federal National Mortgage Assoc. | | | 5.500 | | | | 06/01/33 | | | | 5 | | | | 4,702 | |
Federal National Mortgage Assoc. | | | 5.500 | | | | 08/01/33 | | | | 9 | | | | 9,432 | |
Federal National Mortgage Assoc. | | | 5.500 | | | | 09/01/33 | | | | 13 | | | | 12,889 | |
See Notes to Financial Statements.
PGIM Balanced Fund 75
Schedule of Investments (continued)
as of September 30, 2023
| | | | | | | | | | | | | | | | |
| | | | |
| Description | | Interest
Rate | | | Maturity
Date | | | Principal
Amount (000)# | | | Value | |
| | | | |
U.S. GOVERNMENT AGENCY OBLIGATIONS (Continued) | | | | | | | | | | | | | | | | |
Federal National Mortgage Assoc. | | | 5.500% | | | | 09/01/33 | | | | 25 | | | $ | 24,856 | |
Federal National Mortgage Assoc. | | | 5.500 | | | | 01/01/34 | | | | 10 | | | | 10,340 | |
Federal National Mortgage Assoc. | | | 5.500 | | | | 01/01/34 | | | | 10 | | | | 10,426 | |
Federal National Mortgage Assoc. | | | 5.500 | | | | 07/01/34 | | | | 19 | | | | 18,624 | |
Federal National Mortgage Assoc. | | | 5.500 | | | | 08/01/52 | | | | 301 | | | | 291,074 | |
Federal National Mortgage Assoc. | | | 5.500 | | | | 11/01/52 | | | | 1,778 | | | | 1,719,932 | |
Federal National Mortgage Assoc. | | | 6.000 | | | | 01/01/34 | | | | 4 | | | | 3,574 | |
Federal National Mortgage Assoc. | | | 6.000 | | | | 01/01/34 | | | | 64 | | | | 64,506 | |
Federal National Mortgage Assoc. | | | 6.000 | | | | 02/01/34 | | | | 5 | | | | 5,381 | |
Federal National Mortgage Assoc. | | | 6.000 | | | | 10/01/34 | | | | 1 | | | | 857 | |
Federal National Mortgage Assoc. | | | 6.000 | | | | 10/01/34 | | | | 4 | | | | 4,048 | |
Federal National Mortgage Assoc. | | | 6.000 | | | | 11/01/34 | | | | 7 | | | | 7,464 | |
Federal National Mortgage Assoc. | | | 6.000 | | | | 11/01/34 | | | | 14 | | | | 14,316 | |
Federal National Mortgage Assoc. | | | 6.000 | | | | 11/01/34 | | | | 23 | | | | 22,420 | |
Federal National Mortgage Assoc. | | | 6.000 | | | | 01/01/35 | | | | 37 | | | | 36,081 | |
Federal National Mortgage Assoc. | | | 6.000 | | | | 02/01/35 | | | | 23 | | | | 23,262 | |
Federal National Mortgage Assoc. | | | 6.000 | | | | 08/01/36 | | | | 9 | | | | 9,267 | |
Federal National Mortgage Assoc. | | | 6.000 | | | | 08/01/38 | | | | 2 | | | | 1,951 | |
Federal National Mortgage Assoc. | | | 6.000 | | | | 11/01/52 | | | | 1,004 | | | | 992,223 | |
Federal National Mortgage Assoc. | | | 6.000 | | | | 12/01/52 | | | | 218 | | | | 215,718 | |
Federal National Mortgage Assoc. | | | 6.500 | | | | 05/01/24 | | | | 1 | | | | 1,099 | |
Federal National Mortgage Assoc. | | | 6.500 | | | | 07/01/29 | | | | 2 | | | | 2,318 | |
Federal National Mortgage Assoc. | | | 6.500 | | | | 07/01/32 | | | | 8 | | | | 7,816 | |
Federal National Mortgage Assoc. | | | 6.500 | | | | 04/01/33 | | | | 5 | | | | 4,998 | |
Federal National Mortgage Assoc. | | | 6.500 | | | | 01/01/34 | | | | 4 | | | | 3,849 | |
Federal National Mortgage Assoc. | | | 6.500 | | | | 10/01/36 | | | | 10 | | | | 10,469 | |
Federal National Mortgage Assoc. | | | 6.500 | | | | 09/01/37 | | | | 32 | | | | 33,733 | |
Federal National Mortgage Assoc. | | | 6.500 | | | | 10/01/37 | | | | 33 | | | | 32,986 | |
Federal National Mortgage Assoc. | | | 6.500 | | | | 06/01/53 | | | | 336 | | | | 337,416 | |
Federal National Mortgage Assoc.(k) | | | 6.625 | | | | 11/15/30 | | | | 200 | | | | 221,331 | |
Federal National Mortgage Assoc. | | | 7.000 | | | | 06/01/32 | | | | 5 | | | | 4,977 | |
Federal National Mortgage Assoc.(k) | | | 7.125 | | | | 01/15/30 | | | | 452 | | | | 508,041 | |
Federal National Mortgage Assoc. | | | 7.500 | | | | 09/01/30 | | | | —(r | ) | | | 405 | |
Federal National Mortgage Assoc. | | | 8.500 | | | | 02/01/28 | | | | 1 | | | | 553 | |
Government National Mortgage Assoc. | | | 2.500 | | | | 03/20/51 | | | | 548 | | | | 448,266 | |
Government National Mortgage Assoc. | | | 3.000 | | | | 09/20/43 | | | | 92 | | | | 79,706 | |
Government National Mortgage Assoc. | | | 3.000 | | | | 01/20/44 | | | | 29 | | | | 24,575 | |
Government National Mortgage Assoc. | | | 3.000 | | | | 03/15/45 | | | | 59 | | | | 50,274 | |
Government National Mortgage Assoc. | | | 3.000 | | | | 05/20/45 | | | | 88 | | | | 75,875 | |
Government National Mortgage Assoc. | | | 3.000 | | | | 08/20/45 | | | | 164 | | | | 139,819 | |
Government National Mortgage Assoc. | | | 3.000 | | | | 06/20/46 | | | | 175 | | | | 150,942 | |
Government National Mortgage Assoc. | | | 3.000 | | | | 03/20/47 | | | | 99 | | | | 84,810 | |
Government National Mortgage Assoc. | | | 3.000 | | | | 12/20/48 | | | | 476 | | | | 409,175 | |
Government National Mortgage Assoc. | | | 3.000 | | | | 06/20/51 | | | | 574 | | | | 488,373 | |
See Notes to Financial Statements.
76
| | | | | | | | | | | | | | | | |
| | | | |
| Description | | Interest
Rate | | | Maturity
Date | | | Principal
Amount (000)# | | | Value | |
| | | | |
U.S. GOVERNMENT AGENCY OBLIGATIONS (Continued) | | | | | | | | | | | | | | | | |
Government National Mortgage Assoc. | | | 3.000% | | | | 08/20/51 | | | | 1,807 | | | $ | 1,535,885 | |
Government National Mortgage Assoc. | | | 4.500 | | | | TBA(tt) | | | | 500 | | | | 461,895 | |
Government National Mortgage Assoc. | | | 5.000 | | | | 10/20/37 | | | | 8 | | | | 7,749 | |
Government National Mortgage Assoc. | | | 5.000 | | | | 04/20/45 | | | | 46 | | | | 45,540 | |
Government National Mortgage Assoc. | | | 5.000 | | | | 09/20/52 | | | | 494 | | | | 468,336 | |
Government National Mortgage Assoc. | | | 5.500 | | | | 07/15/33 | | | | 8 | | | | 7,750 | |
Government National Mortgage Assoc. | | | 5.500 | | | | 12/15/33 | | | | 3 | | | | 3,393 | |
Government National Mortgage Assoc. | | | 5.500 | | | | 09/15/34 | | | | 79 | | | | 76,834 | |
Government National Mortgage Assoc. | | | 5.500 | | | | 01/15/36 | | | | 29 | | | | 27,915 | |
Government National Mortgage Assoc. | | | 5.500 | | | | 02/15/36 | | | | 62 | | | | 60,083 | |
Government National Mortgage Assoc. | | | 5.500 | | | | 11/20/52 | | | | 2,605 | | | | 2,529,055 | |
Government National Mortgage Assoc. | | | 6.500 | | | | 12/15/23 | | | | —(r | ) | | | 39 | |
Government National Mortgage Assoc. | | | 6.500 | | | | 04/15/24 | | | | 1 | | | | 1,409 | |
Government National Mortgage Assoc. | | | 6.500 | | | | 07/15/32 | | | | 1 | | | | 1,037 | |
Government National Mortgage Assoc. | | | 6.500 | | | | 08/15/32 | | | | —(r | ) | | | 182 | |
Government National Mortgage Assoc. | | | 6.500 | | | | 08/15/32 | | | | 1 | | | | 570 | |
Government National Mortgage Assoc. | | | 6.500 | | | | 08/15/32 | | | | 1 | | | | 976 | |
Government National Mortgage Assoc. | | | 6.500 | | | | 08/15/32 | | | | 6 | | | | 5,748 | |
Government National Mortgage Assoc. | | | 7.000 | | | | 06/15/24 | | | | —(r | ) | | | 62 | |
Government National Mortgage Assoc. | | | 7.000 | | | | 05/15/31 | | | | 3 | | | | 2,669 | |
Government National Mortgage Assoc. | | | 7.500 | | | | 04/15/29 | | | | —(r | ) | | | 420 | |
Government National Mortgage Assoc. | | | 8.000 | | | | 06/15/25 | | | | 3 | | | | 2,683 | |
Tennessee Valley Authority, Sr. Unsec’d. Notes | | | 7.125 | | | | 05/01/30 | | | | 90 | | | | 100,439 | |
| | | | | | | | | | | | | | | | |
| | | | |
TOTAL U.S. GOVERNMENT AGENCY OBLIGATIONS
(cost $64,227,226) | | | | | | | | | | | | | | | 59,468,113 | |
| | | | | | | | | | | | | | | | |
| | | | |
U.S. TREASURY OBLIGATIONS 2.7% | | | | | | | | | | | | | | | | |
U.S. Treasury Bonds | | | 2.000 | | | | 11/15/41 | | | | 8,950 | | | | 5,809,109 | |
U.S. Treasury Bonds(h)(k) | | | 2.250 | | | | 05/15/41 | | | | 20,980 | | | | 14,394,248 | |
U.S. Treasury Bonds | | | 2.875 | | | | 05/15/43 | | | | 1,380 | | | | 1,022,278 | |
U.S. Treasury Strips Coupon | | | 1.467(s) | | | | 11/15/41 | | | | 210 | | | | 83,418 | |
U.S. Treasury Strips Coupon | | | 2.052(s) | | | | 11/15/43 | | | | 6,350 | | | | 2,289,473 | |
U.S. Treasury Strips Coupon(k) | | | 2.374(s) | | | | 05/15/43 | | | | 550 | | | | 202,834 | |
U.S. Treasury Strips Coupon | | | 2.415(s) | | | | 11/15/40 | | | | 500 | | | | 209,531 | |
U.S. Treasury Strips Coupon | | | 2.450(s) | | | | 02/15/45 | | | | 90 | | | | 30,628 | |
U.S. Treasury Strips Coupon | | | 2.732(s) | | | | 08/15/30 | | | | 286 | | | | 207,652 | |
U.S. Treasury Strips Coupon | | | 4.002(s) | | | | 05/15/41 | | | | 30 | | | | 12,224 | |
U.S. Treasury Strips Coupon | | | 4.018(s) | | | | 11/15/42 | | | | 100 | | | | 37,867 | |
| | | | | | | | | | | | | | | | |
| | | | |
TOTAL U.S. TREASURY OBLIGATIONS
(cost $37,118,145) | | | | | | | | | | | | | | | 24,299,262 | |
| | | | | | | | | | | | | | | | |
| | | | |
TOTAL LONG-TERM INVESTMENTS
(cost $826,050,200) | | | | | | | | | | | | | | | 884,906,716 | |
| | | | | | | | | | | | | | | | |
See Notes to Financial Statements.
PGIM Balanced Fund 77
Schedule of Investments (continued)
as of September 30, 2023
| | | | | | | | | | | | | | | | |
| | | | |
| Description | | | | | | | | Shares | | | Value | |
| | | | |
SHORT-TERM INVESTMENTS 1.3% | | | | | | | | | | | | | | | | |
| | | | |
AFFILIATED MUTUAL FUNDS 1.3% | | | | | | | | | | | | | | | | |
PGIM Core Government Money Market Fund(wb) | | | | | | | | | | | 9,193,037 | | | $ | 9,193,037 | |
PGIM Institutional Money Market Fund
(cost $2,492,217; includes $2,480,355 of cash collateral for securities on loan)(b)(wb) | | | | | | | | | | | 2,493,826 | | | | 2,492,330 | |
| | | | | | | | | | | | | | | | |
| | | | |
TOTAL AFFILIATED MUTUAL FUNDS
(cost $11,685,254) | | | | | | | | | | | | | | | 11,685,367 | |
| | | | | | | | | | | | | | | | |
| | | | |
| | | Interest Rate | | | Maturity Date | | | Principal
Amount
(000)# | | | | |
| | | | |
U.S. TREASURY OBLIGATION(k)(n) 0.0% | | | | | | | | | | | | | | | | |
U.S. Treasury Bills
(cost $197,840) | | | 5.330% | | | | 12/14/23 | | | | 200 | | | | 197,849 | |
| | | | | | | | | | | | | | | | |
| | | | |
TOTAL SHORT-TERM INVESTMENTS
(cost $11,883,094) | | | | | | | | | | | | | | | 11,883,216 | |
| | | | | | | | | | | | | | | | |
| | | | |
TOTAL INVESTMENTS, BEFORE OPTION WRITTEN
(cost $837,933,294) | | | | | | | | | | | | | | | 896,789,932 | |
| | | | | | | | | | | | | | | | |
| | | | | | | | | | | | |
| | | | |
OPTION WRITTEN*~ (0.0)%
(premiums received $0) | | | | | | | | | | | (21 | ) |
| | | | | | | | | | | | |
| | | | |
TOTAL INVESTMENTS, NET OF OPTION WRITTEN 100.1%
(cost $837,933,294) | | | | | | | | | | | 896,789,911 | |
Liabilities in excess of other assets(z) (0.1)% | | | | | | | | | | | (651,979 | ) |
| | | | | | | | | | | | |
| | | | |
NET ASSETS 100.0% | | | | | | | | | | $ | 896,137,932 | |
| | | | | | | | | | | | |
Below is a list of the abbreviation(s) used in the annual report:
AUD—Australian Dollar
BRL—Brazilian Real
CAD—Canadian Dollar
CLP—Chilean Peso
CNH—Chinese Renminbi
COP—Colombian Peso
CZK—Czech Koruna
EUR—Euro
GBP—British Pound
HUF—Hungarian Forint
IDR—Indonesian Rupiah
ILS—Israeli Shekel
INR—Indian Rupee
See Notes to Financial Statements.
78
JPY—Japanese Yen
KRW—South Korean Won
MXN—Mexican Peso
NZD—New Zealand Dollar
PEN—Peruvian Nuevo Sol
PHP—Philippine Peso
PLN—Polish Zloty
SGD—Singapore Dollar
THB—Thai Baht
USD—US Dollar
ZAR—South African Rand
144A—Security was purchased pursuant to Rule 144A under the Securities Act of 1933 and, pursuant to the requirements of Rule 144A, may not be resold except to qualified institutional buyers.
A—Annual payment frequency for swaps
ADR—American Depositary Receipt
BABs—Build America Bonds
BARC—Barclays Bank PLC
BNP—BNP Paribas S.A.
BNYM—Bank of New York Mellon
BOA—Bank of America, N.A.
CDI—Chess Depository Interest
CDX—Credit Derivative Index
CGM—Citigroup Global Markets, Inc.
CITI—Citibank, N.A.
CLO—Collateralized Loan Obligation
CME—Chicago Mercantile Exchange
CVA—Certificate Van Aandelen (Bearer)
CVR—Contingent Value Rights
DAC—Designated Activity Company
DB—Deutsche Bank AG
EAFE—Europe, Australasia, Far East
EMTN—Euro Medium Term Note
ETF—Exchange-Traded Fund
EURIBOR—Euro Interbank Offered Rate
GMTN—Global Medium Term Note
GS—Goldman Sachs & Co. LLC
GSI—Goldman Sachs International
HSBC—HSBC Bank PLC
IO—Interest Only (Principal amount represents notional)
JPM—JPMorgan Chase Bank N.A.
LIBOR—London Interbank Offered Rate
LP—Limited Partnership
M—Monthly payment frequency for swaps
MSCI—Morgan Stanley Capital International
MSI—Morgan Stanley & Co International PLC
MTN—Medium Term Note
OTC—Over-the-counter
PIK—Payment-in-Kind
PJSC—Public Joint-Stock Company
PRFC—Preference Shares
Q—Quarterly payment frequency for swaps
REITs—Real Estate Investment Trust
See Notes to Financial Statements.
PGIM Balanced Fund 79
Schedule of Investments (continued)
as of September 30, 2023
REMIC—Real Estate Mortgage Investment Conduit
S&P—Standard & Poor’s
SCB—Standard Chartered Bank
SOFR—Secured Overnight Financing Rate
SONIA—Sterling Overnight Index Average
SSB—State Street Bank & Trust Company
STRIPs—Separate Trading of Registered Interest and Principal of Securities
T—Swap payment upon termination
TBA—To Be Announced
TD—The Toronto-Dominion Bank
UAG—UBS AG
USOIS—United States Overnight Index Swap
| * | Non-income producing security. |
| # | Principal or notional amount is shown in U.S. dollars unless otherwise stated. |
| ~ | See tables subsequent to the Schedule of Investments for options detail. Options with maturity dates greater than one year from date of acquisition would be considered long-term investments. |
| ^ | Indicates a Level 3 instrument. The aggregate value of Level 3 instruments is $6,138 and 0.0% of net assets. |
| (a) | All or a portion of security is on loan. The aggregate market value of such securities, including those sold and pending settlement, is $2,361,712; cash collateral of $2,480,355 (included in liabilities) was received with which the Fund purchased highly liquid short-term investments. In the event of significant appreciation in value of securities on loan on the last business day of the reporting period, the Fund may reflect a collateral value that is less than the market value of the loaned securities and such shortfall is remedied the following business day. |
| (b) | Represents security, or portion thereof, purchased with cash collateral received for securities on loan and includes dividend reinvestment. |
| (c) | Variable rate instrument. The interest rate shown reflects the rate in effect at September 30, 2023. |
| (cc) | Variable rate instrument. The rate shown is based on the latest available information as of September 30, 2023. Certain variable rate securities are not based on a published reference rate and spread but are determined by the issuer or agent and are based on current market conditions. These securities do not indicate a reference rate and spread in their description. |
| (d) | Represents issuer in default on interest payments and/or principal repayment. Non-income producing security. Such securities may be post-maturity. |
| (f) | Indicates a restricted security that is acquired in unregistered, private sales from the issuing company or from an affiliate of the issuer and is considered restricted as to disposition under federal securities law; the aggregate original cost of such securities is $1,124,783. The aggregate value of $389,451 is 0.0% of net assets. |
| (ff) | Variable rate security. Security may be issued at a fixed coupon rate, which converts to a variable rate at a specified date. Rate shown is the rate in effect as of period end. |
| (h) | Represents security, or a portion thereof, segregated as collateral for OTC derivatives. |
| (k) | Represents security, or a portion thereof, segregated as collateral for centrally cleared/exchange-traded derivatives. |
| (n) | Rate shown reflects yield to maturity at purchased date. |
| (oo) | Perpetual security. Maturity date represents next call date. |
| (r) | Principal or notional amount is less than $500 par. |
| (s) | Represents zero coupon bond or principal only security. Rate represents yield to maturity at purchase date. |
| (tt) | All or partial principal amount represents “TBA” mortgage dollar rolls. The aggregate mortgage dollar roll principal amount of $1,500,000 is 0.2% of net assets. |
| (wb) | Represents an investment in a Fund affiliated with the Manager. |
| (z) | Includes net unrealized appreciation/(depreciation) and/or market value of the below holdings which are excluded from the Schedule of Investments: |
See Notes to Financial Statements.
80
Forward Commitment Contracts:
| | | | | | | | | | | | | | | | | | | | |
U.S. Government Agency Obligations | | Interest
Rate | | | Maturity
Date | | | Settlement
Date | | | Principal
Amount
(000)# | | | Value | |
| | | | | |
Federal National Mortgage Assoc. | | | 4.000% | | | | TBA | | | | 10/12/23 | | | | $(500 | ) | | $ | (445,117 | ) |
| | | | | |
Federal National Mortgage Assoc. | | | 4.500% | | | | TBA | | | | 10/12/23 | | | | (500 | ) | | | (459,063 | ) |
| | | | | |
Federal National Mortgage Assoc. | | | 5.500% | | | | TBA | | | | 11/13/23 | | | | (500 | ) | | | (483,067 | ) |
| | | | | | | | | | | | | | | | | | | | |
| | | | | |
TOTAL FORWARD COMMITMENT CONTRACTS
(proceeds receivable $1,423,438) | | | | | | | | | | | | | | | | | | $ | (1,387,247 | ) |
| | | | | | | | | | | | | | | | | | | | |
Option Written:
OTC Swaptions
| | | | | | | | | | | | | | | | | | | | | | | | | | | | | | | | | | |
Description | | Call/
Put | | Counterparty | | | Expiration
Date | | | Strike | | | Receive | | | Pay | | | Notional
Amount
(000)# | | | Value |
| | | | | | | | | | |
GS_21-PJA^ | | Put | | | GSI | | | | 06/17/24 | | | | 0.25% | | | | 0.25%(M) | | | | GS_21-PJA(M) | | | | 4,500 | | | | | $ | (21 | ) | | |
| | | | | | | | | | | | | | | | | | | | | | | | | | | | | | | | | | |
| | | | | | | | | |
(premiums received $0) | | | | | | | | | | | | | | | | | | | | | | | | | | | | | | | | |
Futures contracts outstanding at September 30, 2023:
| | | | | | | | | | | | | | | | | | | | | | |
Number of
Contracts | | Type | | Expiration
Date | | | Current
Notional
Amount | | | Value / Unrealized Appreciation (Depreciation) | |
| | | | | |
Long Positions: | | | | | | | | | | | | | | | | | | | | |
20 | | 3 Month CME SOFR | | | Dec. 2023 | | | $ | 4,731,500 | | | | | | | $ | 1,588 | | | | | |
69 | | 3 Month CME SOFR | | | Mar. 2024 | | | | 16,309,875 | | | | | | | | (7,326 | ) | | | | |
20 | | 3 Month CME SOFR | | | Jun. 2024 | | | | 4,731,250 | | | | | | | | (3,537 | ) | | | | |
114 | | 2 Year U.S. Treasury Notes | | | Dec. 2023 | | | | 23,109,047 | | | | | | | | (58,298 | ) | | | | |
322 | | 10 Year U.S. Treasury Notes | | | Dec. 2023 | | | | 34,796,125 | | | | | | | | (610,742 | ) | | | | |
147 | | 30 Year U.S. Ultra Treasury Bonds | | | Dec. 2023 | | | | 17,447,062 | | | | | | | | (1,166,496 | ) | | | | |
18 | | Mini MSCI EAFE Index | | | Dec. 2023 | | | | 1,837,350 | | | | | | | | (63,940 | ) | | | | |
18 | | Mini MSCI Emerging Markets Index | | | Dec. 2023 | | | | 859,950 | | | | | | | | (30,635 | ) | | | | |
3 | | S&P 500 E-Mini Index | | | Dec. 2023 | | | | 648,825 | | | | | | | | (27,848 | ) | | | | |
| | | | | | | | | | | | | | | | | | | | | | |
| | | | | | |
| | | | | | | | | | | | | | | | | (1,967,234 | ) | | | | |
| | | | | | | | | | | | | | | | | | | | | | |
Short Positions: | | | | | | | | | | | | | | | | | | | | |
20 | | 5 Year Euro-Bobl | | | Dec. 2023 | | | | 2,447,534 | | | | | | | | 33,086 | | | | | |
141 | | 5 Year U.S. Treasury Notes | | | Dec. 2023 | | | | 14,855,673 | | | | | | | | 117,331 | | | | | |
15 | | 10 Year Euro-Bund | | | Dec. 2023 | | | | 2,040,070 | | | | | | | | 46,828 | | | | | |
60 | | 10 Year U.S. Ultra Treasury Notes | | | Dec. 2023 | | | | 6,693,750 | | | | | | | | 194,807 | | | | | |
52 | | 20 Year U.S. Treasury Bonds | | | Dec. 2023 | | | | 5,916,625 | | | | | | | | 289,281 | | | | | |
5 | | Euro Schatz Index | | | Dec. 2023 | | | | 555,003 | | | | | | | | 2,402 | | | | | |
| | | | | | | | | | | | | | | | | | | | | | |
| | | | | | | | | | | | | | | | | 683,735 | | | | | |
| | | | | | | | | | | | | | | | | | | | | | |
| | | | | | |
| | | | | | | | | | | | | | | | $ | (1,283,499 | ) | | | | |
| | | | | | | | | | | | | | | | | | | | | | |
See Notes to Financial Statements.
PGIM Balanced Fund 81
Schedule of Investments (continued)
as of September 30, 2023
Forward foreign currency exchange contracts outstanding at September 30, 2023:
| | | | | | | | | | | | | | | | | | | | | | | | | | | | | | | | | | | | |
Purchase Contracts | | Counterparty | | | Notional Amount (000) | | | Value at
Settlement
Date | | | Current
Value | | | Unrealized Appreciation | | | Unrealized Depreciation | |
| | | | | | |
OTC Forward Foreign Currency Exchange Contracts: | | | | | | | | | | | | | | | | | | | | | | | | | |
Australian Dollar, | | | | | | | | | | | | | | | | | | | | | | | | | | | | | | | | | | | | |
Expiring 10/19/23 | | | CITI | | | | AUD | | | | 168 | | | $ | 108,000 | | | $ | 108,303 | | | $ | 303 | | | | | | | $ | — | | | | | |
Expiring 10/19/23 | | | MSI | | | | AUD | | | | 171 | | | | 111,000 | | | | 109,826 | | | | — | | | | | | | | (1,174 | ) | | | | |
Brazilian Real, | | | | | | | | | | | | | | | | | | | | | | | | | | | | | | | | | | | | |
Expiring 10/03/23 | | | GSI | | | | BRL | | | | 1,190 | | | | 238,000 | | | | 236,514 | | | | — | | | | | | | | (1,486 | ) | | | | |
British Pound, | | | | | | | | | | | | | | | | | | | | | | | | | | | | | | | | | | | | |
Expiring 10/19/23 | | | HSBC | | | | GBP | | | | 84 | | | | 104,458 | | | | 102,820 | | | | — | | | | | | | | (1,638 | ) | | | | |
Chinese Renminbi, | | | | | | | | | | | | | | | | | | | | | | | | | | | | | | | | | | | | |
Expiring 11/16/23 | | | BOA | | | | CNH | | | | 4,894 | | | | 673,000 | | | | 671,974 | | | | — | | | | | | | | (1,026 | ) | | | | |
Expiring 11/16/23 | | | GSI | | | | CNH | | | | 3,498 | | | | 481,000 | | | | 480,250 | | | | — | | | | | | | | (750 | ) | | | | |
Expiring 11/16/23 | | | GSI | | | | CNH | | | | 3,413 | | | | 467,000 | | | | 468,541 | | | | 1,541 | | | | | | | | — | | | | | |
Expiring 11/16/23 | | | HSBC | | | | CNH | | | | 2,783 | | | | 384,000 | | | | 382,128 | | | | — | | | | | | | | (1,872 | ) | | | | |
Expiring 11/16/23 | | | HSBC | | | | CNH | | | | 1,605 | | | | 221,000 | | | | 220,323 | | | | — | | | | | | | | (677 | ) | | | | |
Colombian Peso, | | | | | | | | | | | | | | | | | | | | | | | | | | | | | | | | | | | | |
Expiring 12/20/23 | | | BARC | | | | COP | | | | 2,705,152 | | | | 634,945 | | | | 649,578 | | | | 14,633 | | | | | | | | — | | | | | |
Expiring 12/20/23 | | | HSBC | | | | COP | | | | 1,519,593 | | | | 377,140 | | | | 364,894 | | | | — | | | | | | | | (12,246 | ) | | | | |
Expiring 12/20/23 | | | TD | | | | COP | | | | 1,627,865 | | | | 399,084 | | | | 390,893 | | | | — | | | | | | | | (8,191 | ) | | | | |
Czech Koruna, | | | | | | | | | | | | | | | | | | | | | | | | | | | | | | | | | | | | |
Expiring 10/19/23 | | | BARC | | | | CZK | | | | 3,309 | | | | 143,000 | | | | 143,293 | | | | 293 | | | | | | | | — | | | | | |
Expiring 10/19/23 | | | BNP | | | | CZK | | | | 1,618 | | | | 72,223 | | | | 70,069 | | | | — | | | | | | | | (2,154 | ) | | | | |
Euro, | | | | | | | | | | | | | | | | | | | | | | | | | | | | | | | | | | | | |
Expiring 10/19/23 | | | BARC | | | | EUR | | | | 381 | | | | 409,032 | | | | 402,630 | | | | — | | | | | | | | (6,402 | ) | | | | |
Expiring 10/19/23 | | | BNP | | | | EUR | | | | 275 | | | | 291,000 | | | | 290,508 | | | | — | | | | | | | | (492 | ) | | | | |
Expiring 10/19/23 | | | CITI | | | | EUR | | | | 203 | | | | 221,000 | | | | 214,834 | | | | — | | | | | | | | (6,166 | ) | | | | |
Expiring 10/19/23 | | | CITI | | | | EUR | | | | 201 | | | | 223,677 | | | | 212,687 | | | | — | | | | | | | | (10,990 | ) | | | | |
Expiring 10/19/23 | | | HSBC | | | | EUR | | | | 314 | | | | 339,726 | | | | 332,562 | | | | — | | | | | | | | (7,164 | ) | | | | |
Expiring 10/19/23 | | | SCB | | | | EUR | | | | 389 | | | | 417,680 | | | | 411,353 | | | | — | | | | | | | | (6,327 | ) | | | | |
Hungarian Forint, | | | | | | | | | | | | | | | | | | | | | | | | | | | | | | | | | | | | |
Expiring 10/19/23 | | | CITI | | | | HUF | | | | 111,123 | | | | 310,139 | | | | 300,538 | | | | — | | | | | | | | (9,601 | ) | | | | |
Expiring 10/19/23 | | | MSI | | | | HUF | | | | 40,307 | | | | 110,000 | | | | 109,013 | | | | — | | | | | | | | (987 | ) | | | | |
Indian Rupee, | | | | | | | | | | | | | | | | | | | | | | | | | | | | | | | | | | | | |
Expiring 12/20/23 | | | JPM | | | | INR | | | | 55,209 | | | | 663,000 | | | | 661,658 | | | | — | | | | | | | | (1,342 | ) | | | | |
Expiring 12/20/23 | | | JPM | | | | INR | | | | 38,857 | | | | 466,334 | | | | 465,680 | | | | — | | | | | | | | (654 | ) | | | | |
Expiring 12/20/23 | | | JPM | | | | INR | | | | 31,798 | | | | 380,999 | | | | 381,084 | | | | 85 | | | | | | | | — | | | | | |
Expiring 12/20/23 | | | MSI | | | | INR | | | | 57,272 | | | | 686,000 | | | | 686,379 | | | | 379 | | | | | | | | — | | | | | |
Indonesian Rupiah, | | | | | | | | | | | | | | | | | | | | | | | | | | | | | | | | | | | | |
Expiring 12/20/23 | | | MSI | | | | IDR | | | | 15,881,845 | | | | 1,032,395 | | | | 1,024,872 | | | | — | | | | | | | | (7,523 | ) | | | | |
Japanese Yen, | | | | | | | | | | | | | | | | | | | | | | | | | | | | | | | | | | | | |
Expiring 10/19/23 | | | BNYM | | | | JPY | | | | 29,846 | | | | 219,260 | | | | 200,430 | | | | — | | | | | | | | (18,830 | ) | | | | |
Expiring 10/19/23 | | | CITI | | | | JPY | | | | 15,834 | | | | 112,000 | | | | 106,332 | | | | — | | | | | | | | (5,668 | ) | | | | |
New Zealand Dollar, | | | | | | | | | | | | | | | | | | | | | | | | | | | | | | | | | | | | |
Expiring 10/19/23 | | | BARC | | | | NZD | | | | 416 | | | | 261,808 | | | | 249,059 | | | | — | | | | | | | | (12,749 | ) | | | | |
See Notes to Financial Statements.
82
Forward foreign currency exchange contracts outstanding at September 30, 2023 (continued):
| | | | | | | | | | | | | | | | | | | | | | | | | | | | | | | | | | |
Purchase Contracts | | Counterparty | | Notional Amount (000) | | | Value at
Settlement
Date | | | Current
Value | | | Unrealized Appreciation | | | Unrealized Depreciation | |
| | | | | | |
OTC Forward Foreign Currency Exchange Contracts (cont’d.): | | | | | | | | | | | | | | | | | | | | | | | | | |
Peruvian Nuevo Sol, | | | | | | | | | | | | | | | | | | | | | | | | | | | | | | | | | | |
Expiring 12/20/23 | | CITI | | | PEN | | | | 2,619 | | | $ | 702,349 | | | $ | 688,353 | | | $ | — | | | | | | | $ | (13,996 | ) | | | | |
Polish Zloty, | | | | | | | | | | | | | | | | | | | | | | | | | | | | | | | | | | |
Expiring 10/19/23 | | CITI | | | PLN | | | | 955 | | | | 217,000 | | | | 218,422 | | | | 1,422 | | | | | | | | — | | | | | |
Expiring 10/19/23 | | GSI | | | PLN | | | | 1,146 | | | | 288,000 | | | | 262,203 | | | | — | | | | | | | | (25,797 | ) | | | | |
Expiring 10/19/23 | | GSI | | | PLN | | | | 479 | | | | 110,000 | | | | 109,625 | | | | — | | | | | | | | (375 | ) | | | | |
Expiring 10/19/23 | | JPM | | | PLN | | | | 1,142 | | | | 286,000 | | | | 261,180 | | | | — | | | | | | | | (24,820 | ) | | | | |
Singapore Dollar, | | | | | | | | | | | | | | | | | | | | | | | | | | | | | | | | | | |
Expiring 12/20/23 | | BOA | | | SGD | | | | 533 | | | | 391,000 | | | | 391,044 | | | | 44 | | | | | | | | — | | | | | |
Expiring 12/20/23 | | CITI | | | SGD | | | | 225 | | | | 165,000 | | | | 165,542 | | | | 542 | | | | | | | | — | | | | | |
Expiring 12/20/23 | | SCB | | | SGD | | | | 641 | | | | 472,000 | | | | 470,364 | | | | — | | | | | | | | (1,636 | ) | | | | |
South African Rand, | | | | | | | | | | | | | | | | | | | | | | | | | | | | | | | | | | |
Expiring 12/20/23 | | TD | | | ZAR | | | | 4,807 | | | | 251,160 | | | | 252,048 | | | | 888 | | | | | | | | — | | | | | |
South Korean Won, | | | | | | | | | | | | | | | | | | | | | | | | | | | | | | | | | | |
Expiring 12/20/23 | | JPM | | | KRW | | | | 693,732 | | | | 520,000 | | | | 515,163 | | | | — | | | | | | | | (4,837 | ) | | | | |
Thai Baht, | | | | | | | | | | | | | | | | | | | | | | | | | | | | | | | | | | |
Expiring 12/20/23 | | BOA | | | THB | | | | 11,820 | | | | 330,000 | | | | 327,056 | | | | — | | | | | | | | (2,944 | ) | | | | |
Expiring 12/20/23 | | JPM | | | THB | | | | 12,358 | | | | 348,000 | | | | 341,944 | | | | — | | | | | | | | (6,056 | ) | | | | |
| | | | | | | | | | | | | | | | | | | | | | | | | | | | | | | | | | |
| | | | | | | | | |
| | | | | | | | | | | | $ | 14,638,409 | | | $ | 14,451,969 | | | | 20,130 | | | | | | | | (206,570 | ) | | | | |
| | | | | | | | | | | | | | | | | | | | | | | | | | | | | | | | | | |
| | | | | | | | | | | | | | | | | | | | | | | | | | | | | | | | | | | | | | | | | | | | | |
Sale Contracts | | Counterparty | | Notional Amount (000) | | Value at
Settlement
Date | | Current
Value | | Unrealized Appreciation | | Unrealized Depreciation |
| | | | | | | | | |
OTC Forward Foreign Currency Exchange Contracts: | | | | | | | | | | | | | | | | | | | | | | | | | | | | | | | | | | | | | | | | | | |
Australian Dollar, | | | | | | | | | | | | | | | | | | | | | | | | | | | | | | | | | | | | | | | | | | |
Expiring 10/19/23 | | CITI | | | | AUD | | | | | 172 | | | | $ | 112,000 | | | | $ | 110,505 | | | | $ | 1,495 | | | | | | | | | $ | — | | | | | | |
Expiring 10/19/23 | | CITI | | | | AUD | | | | | 167 | | | | | 110,769 | | | | | 107,453 | | | | | 3,316 | | | | | | | | | | — | | | | | | |
Expiring 10/19/23 | | DB | | | | AUD | | | | | 557 | | | | | 379,200 | | | | | 358,312 | | | | | 20,888 | | | | | | | | | | — | | | | | | |
Expiring 10/19/23 | | SSB | | | | AUD | | | | | 167 | | | | | 108,000 | | | | | 107,527 | | | | | 473 | | | | | | | | | | — | | | | | | |
Brazilian Real, | | | | | | | | | | | | | | | | | | | | | | | | | | | | | | | | | | | | | | | | | | |
Expiring 10/03/23 | | DB | | | | BRL | | | | | 879 | | | | | 178,489 | | | | | 174,718 | | | | | 3,771 | | | | | | | | | | — | | | | | | |
British Pound, | | | | | | | | | | | | | | | | | | | | | | | | | | | | | | | | | | | | | | | | | | |
Expiring 10/19/23 | | BOA | | | | GBP | | | | | 85 | | | | | 110,061 | | | | | 103,722 | | | | | 6,339 | | | | | | | | | | — | | | | | | |
Expiring 10/19/23 | | DB | | | | GBP | | | | | 1,765 | | | | | 2,292,455 | | | | | 2,153,666 | | | | | 138,789 | | | | | | | | | | — | | | | | | |
Canadian Dollar, | | | | | | | | | | | | | | | | | | | | | | | | | | | | | | | | | | | | | | | | | | |
Expiring 10/19/23 | | CITI | | | | CAD | | | | | 146 | | | | | 108,000 | | | | | 107,437 | | | | | 563 | | | | | | | | | | — | | | | | | |
Chilean Peso, | | | | | | | | | | | | | | | | | | | | | | | | | | | | | | | | | | | | | | | | | | |
Expiring 12/20/23 | | TD | | | | CLP | | | | | 741,527 | | | | | 824,157 | | | | | 829,170 | | | | | — | | | | | | | | | | (5,013 | ) | | | | | |
Expiring 12/20/23 | | UAG | | | | CLP | | | | | 214,669 | | | | | 237,000 | | | | | 240,041 | | | | | — | | | | | | | | | | (3,041 | ) | | | | | |
Chinese Renminbi, | | | | | | | | | | | | | | | | | | | | | | | | | | | | | | | | | | | | | | | | | | |
Expiring 11/16/23 | | MSI | | | | CNH | | | | | 14,853 | | | | | 2,037,377 | | | | | 2,039,194 | | | | | — | | | | | | | | | | (1,817 | ) | | | | | |
See Notes to Financial Statements.
PGIM Balanced Fund 83
Schedule of Investments (continued)
as of September 30, 2023
Forward foreign currency exchange contracts outstanding at September 30, 2023 (continued):
| | | | | | | | | | | | | | | | | | | | | | | | | | | | | | | | | | | | | | | | | | |
Sale Contracts | | Counterparty | | Notional Amount (000) | | Value at
Settlement
Date | | Current
Value | | Unrealized Appreciation | | Unrealized Depreciation |
| | | | | | | |
OTC Forward Foreign Currency Exchange Contracts (cont’d.): | | | | | | | | | | | | | | | | | | | | | | | | | | | | | | | | | | | | |
Colombian Peso, | | | | | | | | | | | | | | | | | | | | | | | | | | | | | | | | | | | | | | | | | | |
Expiring 12/20/23 | | MSI | | | | COP | | | | | 1,067,326 | | | | $ | 264,000 | | | | $ | 256,293 | | | | $ | 7,707 | | | | | | | | | $ | — | | | | | | |
Czech Koruna, | | | | | | | | | | | | | | | | | | | | | | | | | | | | | | | | | | | | | | | | | | |
Expiring 10/19/23 | | BARC | | | | CZK | | | | | 10,380 | | | | | 467,000 | | | | | 449,486 | | | | | 17,514 | | | | | | | | | | — | | | | | | |
Expiring 10/19/23 | | BARC | | | | CZK | | | | | 5,617 | | | | | 264,116 | | | | | 243,229 | | | | | 20,887 | | | | | | | | | | — | | | | | | |
Expiring 10/19/23 | | BNP | | | | CZK | | | | | 4,575 | | | | | 198,360 | | | | | 198,128 | | | | | 232 | | | | | | | | | | — | | | | | | |
Expiring 10/19/23 | | BNP | | | | CZK | | | | | 2,411 | | | | | 112,000 | | | | | 104,386 | | | | | 7,614 | | | | | | | | | | — | | | | | | |
Euro, | | | | | | | | | | | | | | | | | | | | | | | | | | | | | | | | | | | | | | | | | | |
Expiring 10/19/23 | | BARC | | | | EUR | | | | | 3,870 | | | | | 4,362,988 | | | | | 4,095,230 | | | | | 267,758 | | | | | | | | | | — | | | | | | |
Expiring 10/19/23 | | BOA | | | | EUR | | | | | 203 | | | | | 223,000 | | | | | 214,540 | | | | | 8,460 | | | | | | | | | | — | | | | | | |
Expiring 10/19/23 | | CITI | | | | EUR | | | | | 201 | | | | | 224,386 | | | | | 212,686 | | | | | 11,700 | | | | | | | | | | — | | | | | | |
Expiring 10/19/23 | | GSI | | | | EUR | | | | | 367 | | | | | 404,000 | | | | | 388,434 | | | | | 15,566 | | | | | | | | | | — | | | | | | |
Expiring 10/19/23 | | GSI | | | | EUR | | | | | 102 | | | | | 112,000 | | | | | 107,962 | | | | | 4,038 | | | | | | | | | | — | | | | | | |
Expiring 10/19/23 | | MSI | | | | EUR | | | | | 5,698 | | | | | 6,276,629 | | | | | 6,028,796 | | | | | 247,833 | | | | | | | | | | — | | | | | | |
Expiring 10/19/23 | | SSB | | | | EUR | | | | | 6,285 | | | | | 6,998,032 | | | | | 6,650,586 | | | | | 347,446 | | | | | | | | | | — | | | | | | |
Hungarian Forint, | | | | | | | | | | | | | | | | | | | | | | | | | | | | | | | | | | | | | | | | | | |
Expiring 10/19/23 | | BOA | | | | HUF | | | | | 80,162 | | | | | 225,000 | | | | | 216,803 | | | | | 8,197 | | | | | | | | | | — | | | | | | |
Expiring 10/19/23 | | GSI | | | | HUF | | | | | 103,728 | | | | | 277,000 | | | | | 280,539 | | | | | — | | | | | | | | | | (3,539 | ) | | | | | |
Expiring 10/19/23 | | GSI | | | | HUF | | | | | 86,823 | | | | | 243,000 | | | | | 234,817 | | | | | 8,183 | | | | | | | | | | — | | | | | | |
Expiring 10/19/23 | | GSI | | | | HUF | | | | | 84,661 | | | | | 234,000 | | | | | 228,971 | | | | | 5,029 | | | | | | | | | | — | | | | | | |
Expiring 10/19/23 | | GSI | | | | HUF | | | | | 83,654 | | | | | 233,000 | | | | | 226,247 | | | | | 6,753 | | | | | | | | | | — | | | | | | |
Israeli Shekel, | | | | | | | | | | | | | | | | | | | | | | | | | | | | | | | | | | | | | | | | | | |
Expiring 12/20/23 | | BARC | | | | ILS | | | | | 1,971 | | | | | 517,000 | | | | | 518,859 | | | | | — | | | | | | | | | | (1,859 | ) | | | | | |
Expiring 12/20/23 | | CITI | | | | ILS | | | | | 1,012 | | | | | 264,000 | | | | | 266,375 | | | | | — | | | | | | | | | | (2,375 | ) | | | | | |
Mexican Peso, | | | | | | | | | | | | | | | | | | | | | | | | | | | | | | | | | | | | | | | | | | |
Expiring 12/20/23 | | BARC | | | | MXN | | | | | 8,212 | | | | | 460,322 | | | | | 464,671 | | | | | — | | | | | | | | | | (4,349 | ) | | | | | |
Expiring 12/20/23 | | BOA | | | | MXN | | | | | 4,278 | | | | | 240,000 | | | | | 242,093 | | | | | — | | | | | | | | | | (2,093 | ) | | | | | |
Expiring 12/20/23 | | SSB | | | | MXN | | | | | 4,286 | | | | | 246,000 | | | | | 242,499 | | | | | 3,501 | | | | | | | | | | — | | | | | | |
Peruvian Nuevo Sol, | | | | | | | | | | | | | | | | | | | | | | | | | | | | | | | | | | | | | | | | | | |
Expiring 12/20/23 | | BARC | | | | PEN | | | | | 1,316 | | | | | 349,070 | | | | | 345,989 | | | | | 3,081 | | | | | | | | | | — | | | | | | |
Expiring 12/20/23 | | BOA | | | | PEN | | | | | 1,001 | | | | | 262,500 | | | | | 263,212 | | | | | — | | | | | | | | | | (712 | ) | | | | | |
Philippine Peso, | | | | | | | | | | | | | | | | | | | | | | | | | | | | | | | | | | | | | | | | | | |
Expiring 12/20/23 | | CITI | | | | PHP | | | | | 27,888 | | | | | 491,150 | | | | | 492,455 | | | | | — | | | | | | | | | | (1,305 | ) | | | | | |
Polish Zloty, | | | | | | | | | | | | | | | | | | | | | | | | | | | | | | | | | | | | | | | | | | |
Expiring 10/19/23 | | CITI | | | | PLN | | | | | 1,040 | | | | | 239,000 | | | | | 237,836 | | | | | 1,164 | | | | | | | | | | — | | | | | | |
Expiring 10/19/23 | | GSI | | | | PLN | | | | | 455 | | | | | 111,000 | | | | | 104,163 | | | | | 6,837 | | | | | | | | | | — | | | | | | |
Expiring 10/19/23 | | HSBC | | | | PLN | | | | | 1,359 | | | | | 341,438 | | | | | 310,994 | | | | | 30,444 | | | | | | | | | | — | | | | | | |
Expiring 10/19/23 | | HSBC | | | | PLN | | | | | 1,025 | | | | | 251,000 | | | | | 234,554 | | | | | 16,446 | | | | | | | | | | — | | | | | | |
Expiring 10/19/23 | | MSI | | | | PLN | | | | | 989 | | | | | 242,000 | | | | | 226,194 | | | | | 15,806 | | | | | | | | | | — | | | | | | |
Expiring 10/19/23 | | MSI | | | | PLN | | | | | 469 | | | | | 110,000 | | | | | 107,383 | | | | | 2,617 | | | | | | | | | | — | | | | | | |
Expiring 10/19/23 | | TD | | | | PLN | | | | | 1,027 | | | | | 238,000 | | | | | 235,051 | | | | | 2,949 | | | | | | | | | | — | | | | | | |
Singapore Dollar, | | | | | | | | | | | | | | | | | | | | | | | | | | | | | | | | | | | | | | | | | | |
Expiring 12/20/23 | | JPM | | | | SGD | | | | | 4,278 | | | | | 3,156,508 | | | | | 3,141,176 | | | | | 15,332 | | | | | | | | | | — | | | | | | |
See Notes to Financial Statements.
84
Forward foreign currency exchange contracts outstanding at September 30, 2023 (continued):
| | | | | | | | | | | | | | | | | | | | | | | | | | | | | | | | | | | | |
Sale Contracts | | Counterparty | | | Notional Amount (000) | | | Value at
Settlement
Date | | | Current
Value | | | Unrealized Appreciation | | | Unrealized Depreciation | |
| | | | | | |
OTC Forward Foreign Currency Exchange Contracts (cont’d.): | | | | | | | | | | | | | | | | | | | | | | | | | |
South Korean Won, | | | | | | | | | | | | | | | | | | | | | | | | | | | | | | | | | | | | |
Expiring 12/20/23 | | | CITI | | | | KRW | | | | 292,200 | | | $ | 221,000 | | | $ | 216,987 | | | $ | 4,013 | | | | | | | $ | — | | | | | |
Expiring 12/20/23 | | | SCB | | | | KRW | | | | 2,403,209 | | | | 1,821,648 | | | | 1,784,616 | | | | 37,032 | | | | | | | | — | | | | | |
Thai Baht, | | | | | | | | | | | | | | | | | | | | | | | | | | | | | | | | | | | | |
Expiring 12/20/23 | | | GSI | | | | THB | | | | 17,079 | | | | 481,480 | | | | 472,576 | | | | 8,904 | | | | | | | | — | | | | | |
| | | | | | | | | | | | | | | | | | | | | | | | | | | | | | | | | | | | |
| | | | | | | | | |
| | | | | | | | | | | | | | $ | 37,659,135 | | | $ | 36,376,561 | | | | 1,308,677 | | | | | | | | (26,103 | ) | | | | |
| | | | | | | | | | | | | | | | | | | | | | | | | | | | | | | | | | | | |
| | | | | | | | | |
| | | | | | | | | | | | | | | | | | | | | | $ | 1,328,807 | | | | | | | $ | (232,673 | ) | | | | |
| | | | | | | | | | | | | | | | | | | | | | | | | | | | | | | | | | | | |
Cross currency exchange contracts outstanding at September 30, 2023:
| | | | | | | | | | | | | | | | | | | | | | | | | | | | | | | | | | | | | | | | |
Settlement | | Type | | Notional
Amount
(000) | | In Exchange
For (000) | | Unrealized
Appreciation | | Unrealized
Depreciation | | Counterparty |
| | | | | | | | | | | | | |
| | | | | | | | |
OTC Cross Currency Exchange Contracts: | | | | | | | | | | | | | | | | | | | | | | | | | | | | | | | | | | | | | |
10/19/23 | | Buy | | | | CZK | | | | | 2,534 | | | | | EUR | | | | | 103 | | | | $ | 731 | | | | $ | — | | | | | BARC | |
10/19/23 | | Buy | | | | EUR | | | | | 103 | | | | | HUF | | | | | 40,109 | | | | | 512 | | | | | — | | | | | DB | |
10/19/23 | | Buy | | | | EUR | | | | | 103 | | | | | PLN | | | | | 479 | | | | | — | | | | | (497 | ) | | | | MSI | |
10/19/23 | | Buy | | | | PLN | | | | | 487 | | | | | EUR | | | | | 104 | | | | | 1,391 | | | | | — | | | | | CITI | |
| | | | | | | | | | | | | | | | | | | | | | | | | | | | | | | | | | | | | |
| | | | | | | | | | | | | | | | | | | | | | | | | $ | 2,634 | | | | $ | (497 | ) | | | | | |
| | | | | | | | | | | | | | | | | | | | | | | | | | | | | | | | | | | | | |
Credit default swap agreements outstanding at September 30, 2023:
| | | | | | | | | | | | | | | | | | | | | | | | | | | | | | | | | | | | | | | | |
Reference Entity/ Obligation | | Termination
Date | | Fixed
Rate | | Notional
Amount
(000)#(3) | | Implied
Credit
Spread at
September 30,
2023(4) | | Fair
Value | | Upfront
Premiums
Paid
(Received) | | Unrealized
Appreciation
(Depreciation) | | Counterparty |
|
OTC Credit Default Swap Agreement on asset-backed and/or mortgage-backed securities - Sell Protection(2)^: | |
GS_21-PJA | | | | 10/16/23 | | | | | 0.500 | %(M) | | | | 2,523 | | | | | * | | | | $ | 1,644 | | | | $ | (35 | ) | | | $ | 1,679 | | | | | GSI | |
| | | | | | | | | | | | | | | | | | | | | | | | | | | | | | | | | | | | | | | | |
| | | | | | | | | | | | | | | | | | | | | | | | | | | | | | | | | | | |
Reference Entity/ Obligation | | Termination
Date | | Fixed
Rate | | Notional
Amount
(000)#(3) | | Fair
Value | | Upfront
Premiums
Paid
(Received) | | Unrealized
Appreciation
(Depreciation) | | Counterparty |
| | | | | | | | | | | | | | | |
| |
OTC Credit Default Swap Agreements on corporate and/or sovereign issues - Buy Protection(1): | | | | | | |
Republic of Italy | | | | 12/20/27 | | | | | 1.000%(Q) | | | | EUR | 685 | | | | $ | (11,444 | ) | | | $ | (21,893 | ) | | | $ | 10,449 | | | | | BARC | |
United Mexican States | | | | 12/20/24 | | | | | 1.000%(Q) | | | | | 400 | | | | | (3,023 | ) | | | | (1,163 | ) | | | | (1,860 | ) | | | | BARC | |
| | | | | | | | | | | | | | | | | | | | | | | | | | | | | | | | | | | |
| | | | | | | | | | | | | | | | | | $ | (14,467 | ) | | | $ | (23,056 | ) | | | $ | 8,589 | | | | | | |
| | | | | | | | | | | | | | | | | | | | | | | | | | | | | | | | | | | |
See Notes to Financial Statements.
PGIM Balanced Fund 85
Schedule of Investments (continued)
as of September 30, 2023
Credit default swap agreements outstanding at September 30, 2023 (continued):
| | | | | | | | | | | | | | | | | | | | | | | | | | | | | | | | | | |
Reference Entity/ Obligation | | Termination
Date | | Fixed
Rate | | Notional
Amount
(000)#(3) | | | Implied
Credit
Spread at
September 30,
2023(4) | | Fair
Value | | | Upfront Premiums Paid (Received) | | Unrealized Appreciation
(Depreciation) | | Counterparty | |
| | | | | | | | | | | | | | | | | | | | | | | | | | | | | | |
| | |
OTC Credit Default Swap Agreement on corporate and/or sovereign issues - Sell Protection(2): | | | | | | | |
Petroleos Mexicanos | | 12/20/24 | | 1.000%(Q) | | | 400 | | | 3.525% | | $ | (11,676 | ) | | | | $ | (5,104 | ) | | | | | | $ | (6,572 | ) | | | | | BARC | |
| | | | | | | | | | | | | | | | | | | | | | | | | | | | | | | | | | |
| | | | | | | | | | | | | | | | | | | | | | | | | | | | | | | | | | |
Reference Entity/ Obligation | | Termination
Date | | Fixed
Rate | | Notional
Amount
(000)#(3) | | | Implied Credit
Spread at
September 30,
2023(4) | | Value at
Trade Date | | Value at September 30,
2023 | | Unrealized Appreciation (Depreciation) |
| | | | | | | | | | | | | | | | | | | | | | | | | | | | | | | |
| | | |
Centrally Cleared Credit Default Swap Agreement on credit indices - Sell Protection(2): | | | | | | | | |
CDX.NA.HY.41.V1 | | 12/20/28 | | 5.000%(Q) | | | 10,770 | | | 4.795% | | | | $ | 81,030 | | | | | | | $ | 104,046 | | | | | | | $ | 23,016 | | | |
| | | | | | | | | | | | | | | | | | | | | | | | | | | | | | | | | | |
The Fund entered into credit default swaps (“CDS”) to provide a measure of protection against defaults or to take an active long or short position with respect to the likelihood of a particular issuer’s default or the reference entity’s credit soundness. CDS contracts generally trade based on a spread which represents the cost a protection buyer has to pay the protection seller. The protection buyer is said to be short the credit as the value of the contract rises the more the credit deteriorates. The value of the CDS contract increases for the protection buyer if the spread increases.
| (1) | If the Fund is a buyer of protection, it pays the fixed rate. When a credit event occurs, as defined under the terms of that particular swap agreement, the Fund will either (i) receive from the seller of protection an amount equal to the notional amount of the swap and make delivery of the referenced obligation or underlying securities comprising the referenced index or (ii) receive a net settlement amount in the form of cash or securities equal to the notional amount of the swap less the recovery value of the referenced obligation or underlying securities comprising the referenced index. |
| (2) | If the Fund is a seller of protection, it receives the fixed rate. When a credit event occurs, as defined under the terms of that particular swap agreement, the Fund will either (i) pay to the buyer of protection an amount equal to the notional amount of the swap and take delivery of the referenced obligation or underlying securities comprising the referenced index or (ii) pay a net settlement amount in the form of cash or securities equal to the notional amount of the swap less the recovery value of the referenced obligation or underlying securities comprising the referenced index. |
| (3) | Notional amount represents the maximum potential amount the Fund could be required to pay as a seller of credit protection or receive as a buyer of credit protection if a credit event occurs as defined under the terms of that particular swap agreement. |
| (4) | Implied credit spreads, represented in absolute terms, utilized in determining the fair value of credit default swap agreements where the Fund is the seller of protection as of the reporting date serve as an indicator of the current status of the payment/ performance risk and represent the likelihood of risk of default for the credit derivative. The implied credit spread of a particular referenced entity reflects the cost of buying/selling protection and may include up-front |
See Notes to Financial Statements.
86
| | payments required to be made to enter into the agreement. Wider credit spreads represent a deterioration of the referenced entity’s credit soundness and a greater likelihood of risk of default or other credit event occurring as defined under the terms of the agreement. |
| * | When an implied credit spread is not available, reference the fair value of credit default swap agreements on credit indices and asset-backed securities. Where the Fund is the seller of protection, it serves as an indicator of the current status of the payment/performance risk and represents the likelihood of an expected liability (or profit) for the credit derivative should the notional amount of the swap agreement be closed/sold as of the reporting date. Increasing fair value in absolute terms, when compared to the notional amount of the swap, represents a deterioration of the referenced entity’s credit soundness and a greater likelihood of risk of default or other credit event occurring as defined under the terms of the agreement. |
Interest rate swap agreements outstanding at September 30, 2023:
| | | | | | | | | | | | | | | | | | | | | | | | | | | | | | | | | | | | | | |
Notional
Amount
(000)# | | | Termination
Date | | | Fixed
Rate | | | Floating Rate | | Value at Trade Date | | Value at September 30,
2023 | | Unrealized Appreciation
(Depreciation) |
| | | | | | | | | | | | | | | | | | | | | | | | | | | | | | | | | |
| | | | | | | | |
Centrally Cleared Interest Rate Swap Agreements: | | | | | | | | | | | | | | | | | | | | | | |
| GBP | | | 928 | | | | 05/08/26 | | | | 1.000%(A) | | | 1 Day SONIA(1)(A)/5.187% | | | | $ | (34,697 | ) | | | | | | $ | 125,551 | | | | | | | $ | 160,248 | | | |
| GBP | | | 190 | | | | 05/08/31 | | | | 1.150%(A) | | | 1 Day SONIA(1)(A)/5.187% | | | | | (8,272 | ) | | | | | | | 51,020 | | | | | | | | 59,292 | | | |
| | | 32,555 | | | | 08/31/24 | | | | 5.384%(T) | | | 1 Day SOFR(2)(T)/5.310% | | | | | — | | | | | | | | (25,134 | ) | | | | | | | (25,134 | ) | | |
| | | 4,452 | | | | 03/08/25 | | | | 4.946%(A) | | | 1 Day SOFR(2)(A)/5.310% | | | | | — | | | | | | | | (22,843 | ) | | | | | | | (22,843 | ) | | |
| | | 5,724 | | | | 03/09/25 | | | | 5.110%(A) | | | 1 Day SOFR(2)(A)/5.310% | | | | | — | | | | | | | | (11,232 | ) | | | | | | | (11,232 | ) | | |
| | | 12,993 | | | | 03/10/25 | | | | 5.088%(A) | | | 1 Day SOFR(2)(A)/5.310% | | | | | — | | | | | | | | (31,195 | ) | | | | | | | (31,195 | ) | | |
| | | 16,785 | | | | 08/31/25 | | | | 4.805%(A) | | | 1 Day SOFR(1)(A)/5.310% | | | | | — | | | | | | | | 72,050 | | | | | | | | 72,050 | | | |
| | | 2,590 | | | | 09/25/26 | | | | 4.699%(A) | | | 1 Day SOFR(1)(A)/5.310% | | | | | 479 | | | | | | | | (3,559 | ) | | | | | | | (4,038 | ) | | |
| | | | | | | | | | | | | | | | | | | | | | | | | | | | | | | | | | | | | | |
| | | | | | | | | | | | | | | | | | $ | (42,490 | ) | | | | | | $ | 154,658 | | | | | | | $ | 197,148 | | | |
| | | | | | | | | | | | | | | | | | | | | | | | | | | | | | | | | | | | | | |
| (1) | The Fund pays the fixed rate and receives the floating rate. |
| (2) | The Fund pays the floating rate and receives the fixed rate. |
Total return swap agreements outstanding at September 30, 2023:
| | | | | | | | | | | | | | | | | | | | | | | | | | | | | | |
Reference Entity | | Financing Rate | | Counterparty | | Termination Date | | Long
(Short)
Notional
Amount
(000)#(1) | | | Fair
Value | | | Upfront Premiums Paid (Received) | | Unrealized Appreciation (Depreciation)(2) |
| | | | | | | | | | | | | | | | | | | | | | | | | | | |
| | | | | | | | | | |
OTC Total Return Swap Agreements: | | | | | | | | | | | | | | | | | | | | | | | | | | | | |
Total Return Benchmark Bond Index(T) | | 1 Day USOIS -45bps(T)/4.880% | | GSI | | 03/20/24 | | | (6,170) | | | $ | 275,012 | | | | | $ | — | | | | | | | $ | 275,012 | | | |
See Notes to Financial Statements.
PGIM Balanced Fund 87
Schedule of Investments (continued)
as of September 30, 2023
Total return swap agreements outstanding at September 30, 2023 (continued):
| | | | | | | | | | | | | | | | | | | | | | | | | | | | | | |
Reference Entity | | Financing Rate | | Counterparty | | Termination Date | | Long
(Short)
Notional
Amount
(000)#(1) | | | Fair
Value | | | Upfront Premiums Paid (Received) | | Unrealized Appreciation (Depreciation)(2) |
| | | | | | | | | | | | | | | | | | | | | | | | | | | |
| | | | | | | | | |
OTC Total Return Swap Agreements (cont’d.): | | | | | | | | | | | | | | | | | | | | | | | | | | |
U.S. Treasury Bond(T) | | 1 Day USOIS +19bps(T)/5.520% | | GSI | | 02/01/24 | | | 5,970 | | | $ | (591,127 | ) | | | | $ | — | | | | | | | $ | (591,127 | ) | | |
U.S. Treasury Bond(T) | | 1 Day USOIS +18bps(T)/5.510% | | JPM | | 02/05/24 | | | 4,570 | | | | (373,316 | ) | | | | | — | | | | | | | | (373,316 | ) | | |
| | | | | | | | | | | | | | | | | | | | | | | | | | | | | | |
| | | | | | | | | | | | $ | (689,431 | ) | | | | $ | — | | | | | | | $ | (689,431 | ) | | |
| | | | | | | | | | | | | | | | | | | | | | | | | | | | | | |
| (1) | On a long total return swap, the Fund receives payments for any positive return on the reference entity (makes payments for any negative return) and pays the financing rate. On a short total return swap, the Fund makes payments for any positive return on the reference entity (receives payments for any negative return) and receives the financing rate. |
| (2) | Upfront/recurring fees or commissions, as applicable, are included in the net unrealized appreciation (depreciation). |
Balances Reported in the Statement of Assets and Liabilities for OTC Swap Agreements:
| | | | | | | | |
| | | Premiums Paid | | Premiums Received | | Unrealized Appreciation | | Unrealized Depreciation |
| | | | |
OTC Swap Agreements | | $— | | $(28,195) | | $287,140 | | $(972,875) |
Summary of Collateral for Centrally Cleared/Exchange-traded Derivatives:
Cash and securities segregated as collateral, including pending settlement for closed positions, to cover requirements for centrally cleared/exchange-traded derivatives are listed by broker as follows:
| | | | | | | | | | | | | | | | | | | | | | | | |
Broker | | Cash and/or Foreign Currency | | | Securities Market Value | |
| | | | | | |
CGM | | | | | | $ | — | | | | | | | | | | | $ | 3,514,536 | | | | | |
GS | | | | | | | — | | | | | | | | | | | | 197,849 | | | | | |
| | | | | | | | | | | | | | | | | | | | | | | | |
| | | | | | |
Total | | | | | | $ | — | | | | | | | | | | | $ | 3,712,385 | | | | | |
| | | | | | | | | | | | | | | | | | | | | | | | |
Fair Value Measurements:
Various inputs are used in determining the value of the Fund’s investments. These inputs are summarized in the three broad levels listed below.
Level 1—unadjusted quoted prices generally in active markets for identical securities.
Level 2—quoted prices for similar securities, interest rates and yield curves, prepayment speeds, foreign currency exchange rates and other observable inputs.
Level 3—unobservable inputs for securities valued in accordance with Board approved fair valuation procedures.
See Notes to Financial Statements.
88
The following is a summary of the inputs used as of September 30, 2023 in valuing such portfolio securities:
| | | | | | | | | | | | | | | | | | | | |
| | | Level 1 | | | Level 2 | | | Level 3 | |
| | | | | |
Investments in Securities | | | | | | | | | | | | | | | | | | | | |
Assets | | | | | | | | | | | | | | | | | | | | |
Long-Term Investments | | | | | | | | | | | | | | | | | | | | |
Common Stocks | | $ | 438,969,774 | | | $ | 89,352,192 | | | | | | | $ | 5 | | | | | |
Preferred Stocks | | | 1,382,761 | | | | 171,908 | | | | | | | | — | | | | | |
Rights | | | — | | | | — | | | | | | | | 4,510 | | | | | |
Unaffiliated Exchange-Traded Fund | | | 620,280 | | | | — | | | | | | | | — | | | | | |
Asset-Backed Securities | | | | | | | | | | | | | | | | | | | | |
Automobiles | | | — | | | | 9,331,147 | | | | | | | | — | | | | | |
Collateralized Debt Obligation | | | — | | | | 287,452 | | | | | | | | — | | | | | |
Collateralized Loan Obligations | | | — | | | | 37,028,853 | | | | | | | | — | | | | | |
Consumer Loans | | | — | | | | 3,158,290 | | | | | | | | — | | | | | |
Credit Cards | | | — | | | | 445,175 | | | | | | | | — | | | | | |
Equipment | | | — | | | | 226,670 | | | | | | | | — | | | | | |
Home Equity Loans | | | — | | | | 121,244 | | | | | | | | — | | | | | |
Other | | | — | | | | 770,955 | | | | | | | | — | | | | | |
Residential Mortgage-Backed Securities | | | — | | | | 352,570 | | | | | | | | — | | | | | |
Student Loans | | | — | | | | 1,069,175 | | | | | | | | — | | | | | |
Commercial Mortgage-Backed Securities | | | — | | | | 55,551,269 | | | | | | | | — | | | | | |
Convertible Bond | | | — | | | | 1,646 | | | | | | | | — | | | | | |
Corporate Bonds | | | — | | | | 141,221,885 | | | | | | | | — | | | | | |
Floating Rate and Other Loans | | | — | | | | 359,806 | | | | | | | | — | | | | | |
Municipal Bonds | | | — | | | | 2,431,068 | | | | | | | | — | | | | | |
Residential Mortgage-Backed Securities | | | — | | | | 11,607,518 | | | | | | | | — | | | | | |
Sovereign Bonds | | | — | | | | 6,673,188 | | | | | | | | — | | | | | |
U.S. Government Agency Obligations | | | — | | | | 59,468,113 | | | | | | | | — | | | | | |
U.S. Treasury Obligations | | | — | | | | 24,299,262 | | | | | | | | — | | | | | |
Short-Term Investments | | | | | | | | | | | | | | | | | | | | |
Affiliated Mutual Funds | | | 11,685,367 | | | | — | | | | | | | | — | | | | | |
U.S. Treasury Obligation | | | — | | | | 197,849 | | | | | | | | — | | | | | |
| | | | | | | | | | | | | | | | | | | | |
| | | | | |
Total | | $ | 452,658,182 | | | $ | 444,127,235 | | | | | | | $ | 4,515 | | | | | |
| | | | | | | | | | | | |
| | | | | |
Liabilities | | | | | | | | | | | | | | | | | | | | |
Option Written | | $ | — | | | $ | — | | | | | | | $ | (21) | | | | | |
| | | | | | | | | | | | |
| | | | | |
Other Financial Instruments* | | | | | | | | | | | | | | | | | | | | |
Assets | | | | | | | | | | | | | | | | | | | | |
Futures Contracts | | $ | 685,323 | | | $ | — | | | | | | | $ | — | | | | | |
OTC Forward Foreign Currency Exchange Contracts | | | — | | | | 1,328,807 | | | | | | | | — | | | | | |
OTC Cross Currency Exchange Contracts | | | — | | | | 2,634 | | | | | | | | — | | | | | |
Centrally Cleared Credit Default Swap Agreement | | | — | | | | 23,016 | | | | | | | | — | | | | | |
OTC Credit Default Swap Agreement | | | — | | | | — | | | | | | | | 1,644 | | | | | |
Centrally Cleared Interest Rate Swap Agreements | | | — | | | | 291,590 | | | | | | | | — | | | | | |
OTC Total Return Swap Agreement | | | — | | | | 275,012 | | | | | | | | — | | | | | |
| | | | | | | | | | | | | | | | | | | | |
| | | | | |
Total | | $ | 685,323 | | | $ | 1,921,059 | | | | | | | $ | 1,644 | | | | | |
| | | | | | | | | | | | |
See Notes to Financial Statements.
PGIM Balanced Fund 89
Schedule of Investments (continued)
as of September 30, 2023
| | | | | | | | | | | | | | | | | | | | |
| | | Level 1 | | | Level 2 | | | Level 3 | |
| | | | | |
Other Financial Instruments* (continued) | | | | | | | | | | | | | | | | | | | | |
Liabilities | | | | | | | | | | | | | | | | | | | | |
Forward Commitment Contracts | | $ | — | | | $ | (1,387,247 | ) | | | | | | $ | — | | | | | |
Futures Contracts | | | (1,968,822 | ) | | | — | | | | | | | | — | | | | | |
OTC Forward Foreign Currency Exchange Contracts | | | — | | | | (232,673 | ) | | | | | | | — | | | | | |
OTC Cross Currency Exchange Contracts | | | — | | | | (497 | ) | | | | | | | — | | | | | |
OTC Credit Default Swap Agreements | | | — | | | | (26,143 | ) | | | | | | | — | | | | | |
Centrally Cleared Interest Rate Swap Agreements | | | — | | | | (94,442 | ) | | | | | | | — | | | | | |
OTC Total Return Swap Agreements | | | — | | | | (964,443 | ) | | | | | | | — | | | | | |
| | | | | | | | | | | | | | | | | | | | |
| | | | | |
Total | | $ | (1,968,822 | ) | | $ | (2,705,445 | ) | | | | | | $ | — | | | | | |
| | | | | | | | | | | | |
| * | Other financial instruments are derivative instruments, with the exception of forward commitment contracts, and are not reflected in the Schedule of Investments. Futures, forwards and centrally cleared swap contracts are recorded at net unrealized appreciation (depreciation) and OTC swap contracts are recorded at fair value. Forward commitment contracts are recorded at market value. |
Industry Classification:
The industry classification of investments and other assets in excess of liabilities shown as a percentage of net assets as of September 30, 2023 were as follows:
| | | | |
Banks | | | 6.8 | % |
U.S. Government Agency Obligations | | | 6.6 | |
Commercial Mortgage-Backed Securities | | | 6.2 | |
Software | | | 5.2 | |
Collateralized Loan Obligations | | | 4.1 | |
Semiconductors & Semiconductor Equipment | | | 4.1 | |
Pharmaceuticals | | | 3.9 | |
Technology Hardware, Storage & Peripherals | | | 3.4 | |
Interactive Media & Services | | | 3.0 | |
Automobiles | | | 2.8 | |
U.S. Treasury Obligations | | | 2.7 | |
Oil, Gas & Consumable Fuels | | | 2.7 | |
Financial Services | | | 2.5 | |
Broadline Retail | | | 2.0 | |
Insurance | | | 1.8 | |
Health Care Equipment & Supplies | | | 1.6 | |
Aerospace & Defense | | | 1.6 | |
Health Care Providers & Services | | | 1.5 | |
Residential Mortgage-Backed Securities | | | 1.3 | |
Capital Markets | | | 1.3 | |
Affiliated Mutual Funds (0.3% represents investments purchased with collateral from securities on loan) | | | 1.3 | |
Electric | | | 1.3 | |
Beverages | | | 1.2 | |
| | | | |
Biotechnology | | | 1.1 | % |
Machinery | | | 1.0 | |
Entertainment | | | 1.0 | |
Household Products | | | 1.0 | |
Hotels, Restaurants & Leisure | | | 1.0 | |
Food Products | | | 0.9 | |
Specialty Retail | | | 0.9 | |
Chemicals | | | 0.9 | |
Oil & Gas | | | 0.9 | |
IT Services | | | 0.8 | |
Diversified Telecommunication Services | | | 0.8 | |
Electrical Equipment | | | 0.8 | |
Pipelines | | | 0.8 | |
Industrial Conglomerates | | | 0.8 | |
Consumer Staples Distribution & Retail | | | 0.8 | |
Sovereign Bonds | | | 0.7 | |
Healthcare-Services | | | 0.7 | |
Media | | | 0.7 | |
Real Estate Investment Trusts (REITs) | | | 0.7 | |
Metals & Mining | | | 0.6 | |
Telecommunications | | | 0.6 | |
Construction Materials | | | 0.6 | |
Electric Utilities | | | 0.6 | |
Communications Equipment | | | 0.5 | |
Industrial REITs | | | 0.5 | |
See Notes to Financial Statements.
90
Industry Classification (continued):
| | | | |
Agriculture | | | 0.5 | % |
Commercial Services | | | 0.5 | |
Passenger Airlines | | | 0.4 | |
Professional Services | | | 0.4 | |
Textiles, Apparel & Luxury Goods | | | 0.4 | |
Life Sciences Tools & Services | | | 0.4 | |
Consumer Loans | | | 0.4 | |
Home Builders | | | 0.3 | |
Foods | | | 0.3 | |
Building Products | | | 0.3 | |
Air Freight & Logistics | | | 0.3 | |
Distributors | | | 0.3 | |
Municipal Bonds | | | 0.3 | |
Auto Manufacturers | | | 0.3 | |
Tobacco | | | 0.3 | |
Residential REITs | | | 0.3 | |
Trading Companies & Distributors | | | 0.3 | |
Independent Power & Renewable Electricity Producers | | | 0.3 | |
Construction & Engineering | | | 0.2 | |
Electronic Equipment, Instruments & Components | | | 0.2 | |
Ground Transportation | | | 0.2 | |
Gas | | | 0.2 | |
Energy Equipment & Services | | | 0.2 | |
Retail | | | 0.2 | |
Lodging | | | 0.2 | |
Diversified Financial Services | | | 0.2 | |
Household Durables | | | 0.2 | |
Semiconductors | | | 0.2 | |
Automobile Components | | | 0.2 | |
Wireless Telecommunication Services | | | 0.2 | |
Multi-Utilities | | | 0.2 | |
Machinery-Diversified | | | 0.2 | |
Real Estate Management & Development | | | 0.2 | |
Engineering & Construction | | | 0.2 | |
Specialized REITs | | | 0.1 | |
Electronics | | | 0.1 | |
Miscellaneous Manufacturing | | | 0.1 | |
Packaging & Containers | | | 0.1 | |
Student Loans | | | 0.1 | |
Gas Utilities | | | 0.1 | |
Personal Care Products | | | 0.1 | |
Marine Transportation | | | 0.1 | |
| | | | |
Airlines | | | 0.1 | % |
Other | | | 0.1 | |
Trucking & Leasing | | | 0.1 | |
Transportation | | | 0.1 | |
Commercial Services & Supplies | | | 0.1 | |
Building Materials | | | 0.1 | |
Retail REITs | | | 0.1 | |
Unaffiliated Exchange-Traded Fund | | | 0.1 | |
Diversified Consumer Services | | | 0.1 | |
Mining | | | 0.1 | |
Auto Parts & Equipment | | | 0.1 | |
Credit Cards | | | 0.1 | |
Office REITs | | | 0.0 | * |
Consumer Finance | | | 0.0 | * |
Healthcare-Products | | | 0.0 | * |
Health Care Technology | | | 0.0 | * |
Containers & Packaging | | | 0.0 | * |
Diversified REITs | | | 0.0 | * |
Leisure Time | | | 0.0 | * |
Distribution/Wholesale | | | 0.0 | * |
Oil & Gas Services | | | 0.0 | * |
Health Care REITs | | | 0.0 | * |
Forest Products & Paper | | | 0.0 | * |
Leisure Products | | | 0.0 | * |
Collateralized Debt Obligation | | | 0.0 | * |
Real Estate | | | 0.0 | * |
Mortgage Real Estate Investment Trusts (REITs) | | | 0.0 | * |
Equipment | | | 0.0 | * |
Computers | | | 0.0 | * |
Hotel & Resort REITs | | | 0.0 | * |
Home Equity Loans | | | 0.0 | * |
Paper & Forest Products | | | 0.0 | * |
Water Utilities | | | 0.0 | * |
| | | | |
| |
| | | 100.1 | |
Option Written | | | (0.0 | )* |
Liabilities in excess of other assets | | | (0.1 | ) |
| | | | |
| |
| | | 100.0 | % |
| | | | |
| |
* Less than 0.05% | | | | |
See Notes to Financial Statements.
PGIM Balanced Fund 91
Schedule of Investments (continued)
as of September 30, 2023
Effects of Derivative Instruments on the Financial Statements and Primary Underlying Risk Exposure:
The Fund invested in derivative instruments during the reporting period. The primary types of risk associated with these derivative instruments are credit risk, equity risk, foreign exchange risk, and interest rate risk. See the Notes to Financial Statements for additional detail regarding these derivative instruments and their risks. The effect of such derivative instruments on the Fund’s financial position and financial performance as reflected in the Statement of Assets and Liabilities and Statement of Operations is presented in the summary below.
Fair values of derivative instruments as of September 30, 2023 as presented in the Statement of Assets and Liabilities:
| | | | | | | | | | | | | | | | |
| | | Asset Derivatives | | | | | | Liability Derivatives | |
| | | | | | | | | | |
| | | | | |
Derivatives not accounted for as hedging instruments, carried at fair value | | Statement of Assets and Liabilities Location | | Fair
Value | | | | | | Statement of Assets and Liabilities Location | | Fair
Value | |
| | | | | |
Credit contracts | | Due from/to broker-variation margin swaps | | $ | 23,016* | | | | | | | — | | $ | — | |
Credit contracts | | — | | | — | | | | | | | Premiums received for OTC swap agreements | | | 28,195 | |
Credit contracts | | — | | | — | | | | | | | Options written outstanding, at value | | | 21 | |
Credit contracts | | Unrealized appreciation on OTC swap agreements | | | 12,128 | | | | | | | Unrealized depreciation on OTC swap agreements | | | 8,432 | |
Equity contracts | | — | | | — | | | | | | | Due from/to broker-variation margin futures | | | 122,423 | * |
Foreign exchange contracts | | Unrealized appreciation on OTC cross currency exchange contracts | | | 2,634 | | | | | | | Unrealized depreciation on OTC cross currency exchange contracts | | | 497 | |
Foreign exchange contracts | | Unrealized appreciation on OTC forward foreign currency exchange contracts | | | 1,328,807 | | | | | | | Unrealized depreciation on OTC forward foreign currency exchange contracts | | | 232,673 | |
Interest rate contracts | | Due from/to broker-variation margin futures | | | 685,323 | * | | | | | | Due from/to broker-variation margin futures | | | 1,846,399 | * |
Interest rate contracts | | Due from/to broker-variation margin swaps | | | 291,590 | * | | | | | | Due from/to broker-variation margin swaps | | | 94,442 | * |
Interest rate contracts | | Unrealized appreciation on OTC swap agreements | | | 275,012 | | | | | | | Unrealized depreciation on OTC swap agreements | | | 964,443 | |
| | | | | | | | | | | | | | | | |
| | | | | |
| | | | $ | 2,618,510 | | | | | | | | | $ | 3,297,525 | |
| | | | | | | | | | | | | | | | |
| * | Includes cumulative appreciation (depreciation) as reported in the schedule of open futures and centrally cleared swap contracts. Only unsettled variation margin receivable (payable) is reported within the Statement of Assets and Liabilities. |
See Notes to Financial Statements.
92
The effects of derivative instruments on the Statement of Operations for the year ended September 30, 2023 are as follows:
| | | | | | | | | | | | | | | | | | | | | | | | |
| Amount of Realized Gain (Loss) on Derivatives Recognized in Income | |
| |
| | | | | |
Derivatives not accounted for as hedging instruments, carried at fair value | | Options Purchased(1) | | Options
Written | | | Futures | | | Forward
& Cross
Currency
Exchange
Contracts | | | Swaps | |
| | | | | | | |
Credit contracts | | | | $ | (413,874 | ) | | | | $ | 479,038 | | | $ | — | | | $ | — | | | $ | (989,090 | ) |
Equity contracts | | | | | — | | | | | | — | | | | (845 | ) | | | — | | | | — | |
Foreign exchange contracts | | | | | — | | | | | | — | | | | — | | | | (270,297 | ) | | | — | |
Interest rate contracts | | | | | (851 | ) | | | | | 26,016 | | | | (5,480,223 | ) | | | — | | | | 442,053 | |
| | | | | | | | | | | | | | | | | | | | | | | | |
Total | | | | $ | (414,725 | ) | | | | $ | 505,054 | | | $ | (5,481,068 | ) | | $ | (270,297 | ) | | $ | (547,037 | ) |
| | | | | | | | | | | | | | | | | | | | | | | | |
| (1) | Included in net realized gain (loss) on investment transactions in the Statement of Operations. |
| | | | | | | | | | | | | | | | | | | | | | | | |
| Change in Unrealized Appreciation (Depreciation) on Derivatives Recognized in Income | |
| |
| | | | | |
Derivatives not accounted for as hedging instruments, carried at fair value | | Options Purchased(2) | | Options
Written | | | Futures | | | Forward
& Cross
Currency
Exchange
Contracts | | | Swaps | |
| | | | | | | |
Credit contracts | | | | $ | (99,131 | ) | | | | $ | (94,329 | ) | | $ | — | | | $ | — | | | $ | (60,166 | ) |
Equity contracts | | | | | — | | | | | | — | | | | 84,993 | | | | — | | | | — | |
Foreign exchange contracts | | | | | — | | | | | | — | | | | — | | | | (106,498 | ) | | | — | |
Interest rate contracts | | | | | — | | | | | | — | | | | 651,344 | | | | — | | | | (738,822 | ) |
| | | | | | | | | | | | | | | | | | | | | | | | |
Total | | | | $ | (99,131 | ) | | | | $ | (94,329 | ) | | $ | 736,337 | | | $ | (106,498 | ) | | $ | (798,988 | ) |
| | | | | | | | | | | | | | | | | | | | | | | | |
| (2) | Included in net change in unrealized appreciation (depreciation) on investments in the Statement of Operations. |
For the year ended September 30, 2023, the Fund’s average volume of derivative activities is as follows:
| | | | |
| Derivative Contract Type | | Average Volume of Derivative Activities* |
| |
Options Purchased (1) | | | $ 74,456 | |
| |
Options Written (2) | | | 44,268,000 | |
| |
Futures Contracts - Long Positions (2) | | | 85,185,513 | |
| |
Futures Contracts - Short Positions (2) | | | 29,633,315 | |
| |
Forward Foreign Currency Exchange Contracts - Purchased (3) | | | 18,334,680 | |
| |
Forward Foreign Currency Exchange Contracts - Sold (3) | | | 43,394,900 | |
| |
Cross Currency Exchange Contracts (4) | | | 4,292,129 | |
| |
Interest Rate Swap Agreements (2) | | | 25,724,708 | |
| |
Credit Default Swap Agreements - Buy Protection (2) | | | 22,248,383 | |
| |
Credit Default Swap Agreements - Sell Protection (2) | | | 5,165,852 | |
See Notes to Financial Statements.
PGIM Balanced Fund 93
Schedule of Investments (continued)
as of September 30, 2023
| | |
| Derivative Contract Type | | Average Volume of Derivative Activities* |
| |
Total Return Swap Agreements (2) | | $17,056,795 |
| * | Average volume is based on average quarter end balances as noted for the year ended September 30, 2023. |
| (2) | Notional Amount in USD. |
| (3) | Value at Settlement Date. |
Financial Instruments/Transactions—Summary of Offsetting and Netting Arrangements:
The Fund invested in OTC derivatives and entered into financial instruments/transactions during the reporting period that are either offset in accordance with current requirements or are subject to enforceable master netting arrangements or similar agreements that permit offsetting. The information about offsetting and related netting arrangements for OTC derivatives and financial instruments/transactions where the legal right to set-off exists is presented in the summary below.
Offsetting of financial instrument/transaction assets and liabilities:
| | | | | | |
| Description | | Gross Market Value of Recognized Assets/(Liabilities) | | Collateral Pledged/(Received)(2) | | Net Amount |
| | | |
Securities on Loan | | $2,361,712 | | $(2,361,712) | | $— |
Offsetting of OTC derivative assets and liabilities:
| | | | | | | | | | | | | | | | | | | | | | | | | |
Counterparty | | Gross Amounts of Recognized Assets(1) | | Gross Amounts of Recognized Liabilities(1) | | Net Amounts of Recognized Assets/(Liabilities) | | Collateral Pledged/(Received)(2) | | Net Amount |
| | | | | |
BARC | | | $ | 335,346 | | | | $ | (61,951 | ) | | | $ | 273,395 | | | | $ | (273,395 | ) | | | $ | — | |
BNP | | | | 7,846 | | | | | (2,646 | ) | | | | 5,200 | | | | | — | | | | | 5,200 | |
BNYM | | | | — | | | | | (18,830 | ) | | | | (18,830 | ) | | | | — | | | | | (18,830 | ) |
BOA | | | | 23,040 | | | | | (6,775 | ) | | | | 16,265 | | | | | — | | | | | 16,265 | |
CITI | | | | 25,909 | | | | | (50,101 | ) | | | | (24,192 | ) | | | | — | | | | | (24,192 | ) |
DB | | | | 163,960 | | | | | — | | | | | 163,960 | | | | | — | | | | | 163,960 | |
GSI | | | | 333,542 | | | | | (623,130 | ) | | | | (289,588 | ) | | | | 289,588 | | | | | — | |
HSBC | | | | 46,890 | | | | | (23,597 | ) | | | | 23,293 | | | | | — | | | | | 23,293 | |
JPM | | | | 15,417 | | | | | (411,025 | ) | | | | (395,608 | ) | | | | 272,011 | | | | | (123,597 | ) |
MSI | | | | 274,342 | | | | | (11,998 | ) | | | | 262,344 | | | | | (50,000 | ) | | | | 212,344 | |
SCB | | | | 37,032 | | | | | (7,963 | ) | | | | 29,069 | | | | | — | | | | | 29,069 | |
SSB | | | | 351,420 | | | | | — | | | | | 351,420 | | | | | (264,798 | ) | | | | 86,622 | |
TD | | | | 3,837 | | | | | (13,204 | ) | | | | (9,367 | ) | | | | — | | | | | (9,367 | ) |
UAG | | | | — | | | | | (3,041 | ) | | | | (3,041 | ) | | | | — | | | | | (3,041 | ) |
| | | | | | | | | | | | | | | | | | | | | | | | | |
| | | | | |
| | | $ | 1,618,581 | | | | $ | (1,234,261 | ) | | | $ | 384,320 | | | | $ | (26,594 | ) | | | $ | 357,726 | |
| | | | | | | | | | | | | | | | | | | | | | | | | |
| (1) | Includes unrealized appreciation/(depreciation) on swaps and forwards, premiums paid/(received) on swap agreements and market value of purchased and written options, as represented on the Statement of Assets and Liabilities. |
See Notes to Financial Statements.
94
| (2) | Collateral amount disclosed by the Fund is limited to the market value of financial instruments/transactions and the Fund’s OTC derivative exposure by counterparty. |
See Notes to Financial Statements.
PGIM Balanced Fund 95
Statement of Assets and Liabilities
as of September 30, 2023
| | | | |
| |
Assets | | | | |
| |
Investments at value, including securities on loan of $2,361,712: | | | | |
Unaffiliated investments (cost $826,248,040) | | $ | 885,104,565 | |
Affiliated investments (cost $11,685,254) | | | 11,685,367 | |
Cash | | | 627 | |
Foreign currency, at value (cost $623,327) | | | 621,905 | |
Receivable for investments sold | | | 20,874,195 | |
Dividends and interest receivable | | | 3,607,034 | |
Receivable for Fund shares sold | | | 1,833,777 | |
Unrealized appreciation on OTC forward foreign currency exchange contracts | | | 1,328,807 | |
Tax reclaim receivable | | | 418,775 | |
Unrealized appreciation on OTC swap agreements | | | 287,140 | |
Due from broker—variation margin futures | | | 35,007 | |
Unrealized appreciation on OTC cross currency exchange contracts | | | 2,634 | |
Prepaid expenses | | | 9,212 | |
| | | | |
| |
Total Assets | | | 925,809,045 | |
| | | | |
| |
Liabilities | | | | |
| |
Payable for investments purchased | | | 22,173,242 | |
Payable to broker for collateral for securities on loan | | | 2,480,355 | |
Forward commitment contracts, at value (proceeds receivable $1,423,438) | | | 1,387,247 | |
Payable for Fund shares purchased | | | 1,322,277 | |
Unrealized depreciation on OTC swap agreements | | | 972,875 | |
Management fee payable | | | 402,366 | |
Accrued expenses and other liabilities | | | 265,963 | |
Unrealized depreciation on OTC forward foreign currency exchange contracts | | | 232,673 | |
Distribution fee payable | | | 209,324 | |
Affiliated transfer agent fee payable | | | 96,161 | |
Foreign capital gains tax liability accrued | | | 75,239 | |
Premiums received for OTC swap agreements | | | 28,195 | |
Due to broker—variation margin swaps | | | 16,488 | |
Due to broker—variation margin futures | | | 8,190 | |
Unrealized depreciation on OTC cross currency exchange contracts | | | 497 | |
Options written outstanding, at value (premiums received $0) | | | 21 | |
| | | | |
| |
Total Liabilities | | | 29,671,113 | |
| | | | |
| |
Net Assets | | $ | 896,137,932 | |
| | | | |
| |
| | | | | |
| |
Net assets were comprised of: | | | | |
Common stock, at par | | $ | 58,880 | |
Paid-in capital in excess of par | | | 845,520,754 | |
Total distributable earnings (loss) | | | 50,558,298 | |
| | | | |
| |
Net assets, September 30, 2023 | | $ | 896,137,932 | |
| | | | |
See Notes to Financial Statements.
96
| | | | | | | | |
Class A | | | | | | | | |
| | |
Net asset value and redemption price per share, ($639,624,681 ÷ 42,135,294 shares of common stock issued and outstanding) | | $ | 15.18 | | | | | |
Maximum sales charge (3.25% of offering price) | | | 0.51 | | | | | |
| | | | | | | | |
Maximum offering price to public | | $ | 15.69 | | | | | |
| | | | | | | | |
| | |
Class C | | | | | | | | |
| | |
Net asset value, offering price and redemption price per share, ($56,162,219 ÷ 3,672,079 shares of common stock issued and outstanding) | | $ | 15.29 | | | | | |
| | | | | | | | |
| | |
Class R | | | | | | | | |
| | |
Net asset value, offering price and redemption price per share, ($30,910 ÷ 2,035 shares of common stock issued and outstanding) | | $ | 15.19 | | | | | |
| | | | | | | | |
| | |
Class Z | | | | | | | | |
| | |
Net asset value, offering price and redemption price per share, ($112,933,581 ÷ 7,370,452 shares of common stock issued and outstanding) | | $ | 15.32 | | | | | |
| | | | | | | | |
| | |
Class R6 | | | | | | | | |
| | |
Net asset value, offering price and redemption price per share, ($87,386,541 ÷ 5,699,772 shares of common stock issued and outstanding) | | $ | 15.33 | | | | | |
| | | | | | | | |
See Notes to Financial Statements.
PGIM Balanced Fund 97
Statement of Operations
Year Ended September 30, 2023
| | | | |
Net Investment Income (Loss) | | | | |
| |
Income | | | | |
Interest income | | $ | 15,346,102 | |
Unaffiliated dividend income (net of $608,450 foreign withholding tax) | | | 12,813,700 | |
Affiliated dividend income | | | 520,316 | |
Income from securities lending, net (including affiliated income of $11,734) | | | 11,910 | |
| | | | |
| |
Total income | | | 28,692,028 | |
| | | | |
| |
Expenses | | | | |
Management fee | | | 5,964,519 | |
Distribution fee(a) | | | 2,596,219 | |
Transfer agent’s fees and expenses (including affiliated expense of $522,064)(a) | | | 1,168,065 | |
Custodian and accounting fees | | | 211,554 | |
Shareholders’ reports | | | 97,897 | |
Registration fees(a) | | | 81,263 | |
Professional fees | | | 60,152 | |
Audit fee | | | 50,880 | |
Directors’ fees | | | 22,900 | |
Miscellaneous | | | 91,423 | |
| | | | |
| |
Total expenses | | | 10,344,872 | |
Less: Fee waiver and/or expense reimbursement(a) | | | (1,180,529 | ) |
Distribution fee waiver(a) | | | (299 | ) |
| | | | |
| |
Net expenses | | | 9,164,044 | |
| | | | |
| |
Net investment income (loss) | | | 19,527,984 | |
| | | | |
| |
Realized And Unrealized Gain (Loss) On Investment And Foreign Currency Transactions | | | | |
| |
Net realized gain (loss) on: | | | | |
Investment transactions (including affiliated of $4,747) (net of foreign capital gains taxes $2,380) | | | 11,966,510 | |
Futures transactions | | | (5,481,068 | ) |
Forward and cross currency contract transactions | | | (270,297 | ) |
Options written transactions | | | 505,054 | |
Swap agreement transactions | | | (547,037 | ) |
Foreign currency transactions | | | (438,873 | ) |
| | | | |
| |
| | | 5,734,289 | |
| | | | |
Net change in unrealized appreciation (depreciation) on: | | | | |
Investments (including affiliated of $(806)) (net of change in foreign capital gains taxes $(78,297)) | | | 84,983,724 | |
Futures | | | 736,337 | |
Forward and cross currency contracts | | | (106,498 | ) |
Options written | | | (94,329 | ) |
Swap agreements | | | (798,988 | ) |
Foreign currencies | | | (13,099 | ) |
| | | | |
| |
| | | 84,707,147 | |
| | | | |
| |
Net gain (loss) on investment and foreign currency transactions | | | 90,441,436 | |
| | | | |
| |
Net Increase (Decrease) In Net Assets Resulting From Operations | | $ | 109,969,420 | |
| | | | |
See Notes to Financial Statements.
98
| (a) | Class specific expenses and waivers were as follows: |
| | | | | | | | | | | | | | | | | | | | |
| | | Class A | | | Class C | | | Class R | | | Class Z | | | Class R6 | |
Distribution fee | | | 1,958,970 | | | | 636,351 | | | | 898 | | | | — | | | | — | |
Transfer agent’s fees and expenses | | | 922,385 | | | | 94,181 | | | | 670 | | | | 149,363 | | | | 1,466 | |
Registration fees | | | 24,794 | | | | 14,820 | | | | 6,116 | | | | 14,820 | | | | 20,713 | |
Fee waiver and/or expense reimbursement | | | (998,553 | ) | | | (36,887) | | | | (6,469) | | | | (66,813 | ) | | | (71,807) | |
Distribution fee waiver | | | — | | | | — | | | | (299) | | | | — | | | | — | |
See Notes to Financial Statements.
PGIM Balanced Fund 99
Statements of Changes in Net Assets
| | | | | | | | | | | | | | | | |
| | |
| | | | | | Year Ended | |
| | |
| | | | | | September 30, | |
| | | | |
| | | | | | 2023 | | | | | | 2022 | |
| | | | |
Increase (Decrease) in Net Assets | | | | | | | | | | | | | | | | |
| | | | |
Operations | | | | | | | | | | | | | | | | |
Net investment income (loss) | | | | | | $ | 19,527,984 | | | | | | | $ | 15,271,277 | |
Net realized gain (loss) on investment and foreign currency transactions | | | | | | | 5,734,289 | | | | | | | | 214,458 | |
Net change in unrealized appreciation (depreciation) on investments and foreign currencies | | | | | | | 84,707,147 | | | | | | | | (197,367,427 | ) |
| | | | | | | | | | | | | | | | |
| | | | |
Net increase (decrease) in net assets resulting from operations | | | | | | | 109,969,420 | | | | | | | | (181,881,692 | ) |
| | | | | | | | | | | | | | | | |
| | | | |
Dividends and Distributions | | | | | | | | | | | | | | | | |
Distributions from distributable earnings | | | | | | | | | | | | | | | | |
Class A | | | | | | | (14,280,270 | ) | | | | | | | (89,089,854 | ) |
Class C | | | | | | | (846,320 | ) | | | | | | | (10,015,315 | ) |
Class R | | | | | | | (1,742 | ) | | | | | | | (47,861 | ) |
Class Z | | | | | | | (2,729,302 | ) | | | | | | | (19,206,654 | ) |
Class R6 | | | | | | | (2,158,971 | ) | | | | | | | (10,593,601 | ) |
| | | | | | | | | | | | | | | | |
| | | | |
| | | | | | | (20,016,605 | ) | | | | | | | (128,953,285 | ) |
| | | | | | | | | | | | | | | | |
Fund share transactions (Net of share conversions) | | | | | | | | | | | | | | | | |
Net proceeds from shares sold | | | | | | | 81,337,380 | | | | | | | | 148,806,824 | |
Net asset value of shares issued in reinvestment of dividends and distributions | | | | | | | 19,628,243 | | | | | | | | 126,356,982 | |
Cost of shares purchased | | | | | | | (167,597,777 | ) | | | | | | | (203,879,367 | ) |
| | | | | | | | | | | | | | | | |
| | | | |
Net increase (decrease) in net assets from Fund share transactions | | | | | | | (66,632,154 | ) | | | | | | | 71,284,439 | |
| | | | | | | | | | | | | | | | |
Total increase (decrease) | | | | | | | 23,320,661 | | | | | | | | (239,550,538 | ) |
| | | | |
Net Assets: | | | | | | | | | | | | | | | | |
Beginning of year | | | | | | | 872,817,271 | | | | | | | | 1,112,367,809 | |
| | | | | | | | | | | | | | | | |
| | | | |
End of year | | | | | | $ | 896,137,932 | | | | | | | $ | 872,817,271 | |
| | | | | | | | | | | | | | | | |
See Notes to Financial Statements.
100
Financial Highlights
| | | | | | | | | | | | | | | | | | | | |
| | | | | | |
Class A Shares | | | | | | | | | | | | | | | | | | | | |
| | |
| | | Year Ended September 30, | |
| | | | | | |
| | | 2023 | | | 2022 | | | 2021 | | | 2020 | | | 2019 | |
| | | | | | |
Per Share Operating Performance(a): | | | | | | | | | | | | | | | | | | | | |
Net Asset Value, Beginning of Year | | | $13.75 | | | | $18.70 | | | | $15.96 | | | | $15.61 | | | | $16.38 | |
Income (loss) from investment operations: | | | | | | | | | | | | | | | | | | | | |
Net investment income (loss) | | | 0.32 | | | | 0.24 | | | | 0.23 | | | | 0.24 | | | | 0.24 | |
| Net realized and unrealized gain (loss) on investment and foreign currency transactions | | | 1.44 | | | | (3.02 | ) | | | 2.75 | | | | 0.63 | | | | 0.04 | |
Total from investment operations | | | 1.76 | | | | (2.78 | ) | | | 2.98 | | | | 0.87 | | | | 0.28 | |
Less Dividends and Distributions: | | | | | | | | | | | | | | | | | | | | |
Dividends from net investment income | | | (0.33 | ) | | | (0.29 | ) | | | (0.20 | ) | | | (0.24 | ) | | | (0.25 | ) |
Distributions from net realized gains | | | - | | | | (1.88 | ) | | | (0.04 | ) | | | (0.28 | ) | | | (0.80 | ) |
Total dividends and distributions | | | (0.33 | ) | | | (2.17 | ) | | | (0.24 | ) | | | (0.52 | ) | | | (1.05 | ) |
Net asset value, end of year | | | $15.18 | | | | $13.75 | | | | $18.70 | | | | $15.96 | | | | $15.61 | |
Total Return(b): | | | 12.83 | % | | | (16.95 | )% | | | 18.76 | % | | | 5.64 | % | | | 2.28 | % |
| | | | | | | | | | | | | | | | | | | | |
| | | | | | |
Ratios/Supplemental Data: | | | | | | | | | | | | | | | | | | | | |
Net assets, end of year (000) | | | $639,625 | | | | $615,650 | | | | $760,976 | | | | $616,646 | | | | $590,383 | |
Average net assets (000) | | | $652,990 | | | | $732,873 | | | | $710,895 | | | | $593,393 | | | | $416,723 | |
Ratios to average net assets(c): | | | | | | | | | | | | | | | | | | | | |
Expenses after waivers and/or expense reimbursement | | | 1.00 | % | | | 1.00 | % | | | 1.00 | % | | | 1.00 | % | | | 1.00 | % |
Expenses before waivers and/or expense reimbursement | | | 1.15 | % | | | 1.12 | % | | | 1.11 | % | | | 1.16 | % | | | 1.16 | % |
Net investment income (loss) | | | 2.13 | % | | | 1.46 | % | | | 1.28 | % | | | 1.52 | % | | | 1.58 | % |
Portfolio turnover rate(d)(e) | | | 141 | % | | | 109 | % | | | 85 | % | | | 108 | % | | | 128 | % |
| (a) | Calculated based on average shares outstanding during the year. |
| (b) | Total return does not consider the effects of sales loads. Total return is calculated assuming a purchase of a share on the first day and a sale on the last day of each year reported and includes reinvestment of dividends and distributions, if any. Total returns may reflect adjustments to conform to GAAP. |
| (c) | Does not include expenses of the underlying funds in which the Fund invests. |
| (d) | The Fund accounts for mortgage dollar roll transactions, when applicable, as purchases and sales which, as a result, can increase its portfolio turnover rate. |
| (e) | The Fund’s portfolio turnover rate is calculated in accordance with regulatory requirements, without regard to transactions involving short-term investments, certain derivatives and in-kind transactions (if any). If such transactions were included, the Fund’s portfolio turnover rate may be higher. |
See Notes to Financial Statements.
PGIM Balanced Fund 101
Financial Highlights (continued)
| | | | | | | | | | | | | | | | | | | | |
| | | | | | |
Class C Shares | | | | | | | | | | | | | | | | | | | | |
| | |
| | | Year Ended September 30, | |
| | | | | | |
| | | 2023 | | | 2022 | | | 2021 | | | 2020 | | | 2019 | |
| | | | | | |
Per Share Operating Performance(a): | | | | | | | | | | | | | | | | | | | | |
Net Asset Value, Beginning of Year | | | $13.85 | | | | $18.81 | | | | $16.06 | | | | $15.71 | | | | $16.48 | |
Income (loss) from investment operations: | | | | | | | | | | | | | | | | | | | | |
Net investment income (loss) | | | 0.20 | | | | 0.11 | | | | 0.09 | | | | 0.12 | | | | 0.13 | |
| Net realized and unrealized gain (loss) on investment and foreign currency transactions | | | 1.45 | | | | (3.03 | ) | | | 2.77 | | | | 0.64 | | | | 0.04 | |
Total from investment operations | | | 1.65 | | | | (2.92 | ) | | | 2.86 | | | | 0.76 | | | | 0.17 | |
Less Dividends and Distributions: | | | | | | | | | | | | | | | | | | | | |
Dividends from net investment income | | | (0.21 | ) | | | (0.16 | ) | | | (0.07 | ) | | | (0.13 | ) | | | (0.14 | ) |
Distributions from net realized gains | | | - | | | | (1.88 | ) | | | (0.04 | ) | | | (0.28 | ) | | | (0.80 | ) |
Total dividends and distributions | | | (0.21 | ) | | | (2.04 | ) | | | (0.11 | ) | | | (0.41 | ) | | | (0.94 | ) |
Net asset value, end of year | | | $15.29 | | | | $13.85 | | | | $18.81 | | | | $16.06 | | | | $15.71 | |
Total Return(b): | | | 11.89 | % | | | (17.58 | )% | | | 17.82 | % | | | 4.77 | % | | | 1.62 | % |
| | | | | | | | | | | | | | | | | | | | |
| | | | | | |
Ratios/Supplemental Data: | | | | | | | | | | | | | | | | | | | | |
Net assets, end of year (000) | | | $56,162 | | | | $65,656 | | | | $93,656 | | | | $95,166 | | | | $108,958 | |
Average net assets (000) | | | $63,635 | | | | $85,096 | | | | $96,972 | | | | $102,396 | | | | $92,047 | |
Ratios to average net assets(c): | | | | | | | | | | | | | | | | | | | | |
Expenses after waivers and/or expense reimbursement | | | 1.82 | % | | | 1.79 | % | | | 1.78 | % | | | 1.77 | % | | | 1.73 | % |
Expenses before waivers and/or expense reimbursement | | | 1.88 | % | | | 1.84 | % | | | 1.82 | % | | | 1.84 | % | | | 1.84 | % |
Net investment income (loss) | | | 1.30 | % | | | 0.65 | % | | | 0.50 | % | | | 0.75 | % | | | 0.87 | % |
Portfolio turnover rate(d)(e) | | | 141 | % | | | 109 | % | | | 85 | % | | | 108 | % | | | 128 | % |
| (a) | Calculated based on average shares outstanding during the year. |
| (b) | Total return does not consider the effects of sales loads. Total return is calculated assuming a purchase of a share on the first day and a sale on the last day of each year reported and includes reinvestment of dividends and distributions, if any. Total returns may reflect adjustments to conform to GAAP. |
| (c) | Does not include expenses of the underlying funds in which the Fund invests. |
| (d) | The Fund accounts for mortgage dollar roll transactions, when applicable, as purchases and sales which, as a result, can increase its portfolio turnover rate. |
| (e) | The Fund’s portfolio turnover rate is calculated in accordance with regulatory requirements, without regard to transactions involving short-term investments, certain derivatives and in-kind transactions (if any). If such transactions were included, the Fund’s portfolio turnover rate may be higher. |
See Notes to Financial Statements.
102
| | | | | | | | | | | | | | | | | | | | |
| | | | | | |
Class R Shares | | | | | | | | | | | | | | | | | | | | |
| | |
| | | Year Ended September 30, | |
| | | | | | |
| | | 2023 | | | 2022 | | | 2021 | | | 2020 | | | 2019 | |
| | | | | | |
Per Share Operating Performance(a): | | | | | | | | | | | | | | | | | | | | |
Net Asset Value, Beginning of Year | | | $13.75 | | | | $18.70 | | | | $15.97 | | | | $15.64 | | | | $16.38 | |
Income (loss) from investment operations: | | | | | | | | | | | | | | | | | | | | |
Net investment income (loss) | | | 0.25 | | | | 0.16 | | | | 0.14 | | | | 0.16 | | | | 0.17 | |
| Net realized and unrealized gain (loss) on investment and foreign currency transactions | | | 1.45 | | | | (3.02 | ) | | | 2.75 | | | | 0.64 | | | | 0.05 | |
Total from investment operations | | | 1.70 | | | | (2.86 | ) | | | 2.89 | | | | 0.80 | | | | 0.22 | |
Less Dividends and Distributions: | | | | | | | | | | | | | | | | | | | | |
Dividends from net investment income | | | (0.26 | ) | | | (0.21 | ) | | | (0.12 | ) | | | (0.19 | ) | | | (0.16 | ) |
Distributions from net realized gains | | | - | | | | (1.88 | ) | | | (0.04 | ) | | | (0.28 | ) | | | (0.80 | ) |
Total dividends and distributions | | | (0.26 | ) | | | (2.09 | ) | | | (0.16 | ) | | | (0.47 | ) | | | (0.96 | ) |
Net asset value, end of year | | | $15.19 | | | | $13.75 | | | | $18.70 | | | | $15.97 | | | | $15.64 | |
Total Return(b): | | | 12.37 | % | | | (17.36 | )% | | | 18.15 | % | | | 5.16 | % | | | 1.85 | % |
| | | | | | | | | | | | | | | | | | | | |
| | | | | | |
Ratios/Supplemental Data: | | | | | | | | | | | | | | | | | | | | |
Net assets, end of year (000) | | | $31 | | | | $209 | | | | $427 | | | | $1,135 | | | | $2,047 | |
Average net assets (000) | | | $120 | | | | $402 | | | | $675 | | | | $1,439 | | | | $1,959 | |
Ratios to average net assets(c): | | | | | | | | | | | | | | | | | | | | |
Expenses after waivers and/or expense reimbursement | | | 1.47 | % | | | 1.47 | % | | | 1.47 | % | | | 1.47 | % | | | 1.45 | % |
Expenses before waivers and/or expense reimbursement | | | 7.12 | % | | | 3.39 | % | | | 2.72 | % | | | 2.61 | % | | | 2.16 | % |
Net investment income (loss) | | | 1.66 | % | | | 0.97 | % | | | 0.80 | % | | | 1.04 | % | | | 1.14 | % |
Portfolio turnover rate(d)(e) | | | 141 | % | | | 109 | % | | | 85 | % | | | 108 | % | | | 128 | % |
| (a) | Calculated based on average shares outstanding during the year. |
| (b) | Total return is calculated assuming a purchase of a share on the first day and a sale on the last day of each year reported and includes reinvestment of dividends and distributions, if any. Total returns may reflect adjustments to conform to GAAP. |
| (c) | Does not include expenses of the underlying funds in which the Fund invests. |
| (d) | The Fund accounts for mortgage dollar roll transactions, when applicable, as purchases and sales which, as a result, can increase its portfolio turnover rate. |
| (e) | The Fund’s portfolio turnover rate is calculated in accordance with regulatory requirements, without regard to transactions involving short-term investments, certain derivatives and in-kind transactions (if any). If such transactions were included, the Fund’s portfolio turnover rate may be higher. |
See Notes to Financial Statements.
PGIM Balanced Fund 103
Financial Highlights (continued)
| | | | | | | | | | | | | | | | | | | | |
| | | | | | |
Class Z Shares | | | | | | | | | | | | | | | | | | | | |
| | |
| | | Year Ended September 30, | |
| | | | | | |
| | | 2023 | | | 2022 | | | 2021 | | | 2020 | | | 2019 | |
| | | | | | |
Per Share Operating Performance(a): | | | | | | | | | | | | | | | | | | | | |
Net Asset Value, Beginning of Year | | | $13.87 | | | | $18.85 | | | | $16.09 | | | | $15.73 | | | | $16.49 | |
Income (loss) from investment operations: | | | | | | | | | | | | | | | | | | | | |
Net investment income (loss) | | | 0.35 | | | | 0.28 | | | | 0.27 | | | | 0.27 | | | | 0.29 | |
| Net realized and unrealized gain (loss) on investment and foreign currency transactions | | | 1.46 | | | | (3.05 | ) | | | 2.77 | | | | 0.65 | | | | 0.04 | |
Total from investment operations | | | 1.81 | | | | (2.77 | ) | | | 3.04 | | | | 0.92 | | | | 0.33 | |
Less Dividends and Distributions: | | | | | | | | | | | | | | | | | | | | |
Dividends from net investment income | | | (0.36 | ) | | | (0.33 | ) | | | (0.24 | ) | | | (0.28 | ) | | | (0.29 | ) |
Distributions from net realized gains | | | - | | | | (1.88 | ) | | | (0.04 | ) | | | (0.28 | ) | | | (0.80 | ) |
Total dividends and distributions | | | (0.36 | ) | | | (2.21 | ) | | | (0.28 | ) | | | (0.56 | ) | | | (1.09 | ) |
Net asset value, end of year | | | $15.32 | | | | $13.87 | | | | $18.85 | | | | $16.09 | | | | $15.73 | |
Total Return(b): | | | 13.02 | % | | | (16.74 | )% | | | 18.99 | % | | | 5.90 | % | | | 2.59 | % |
| | | | | | | | | | | | | | | | | | | | |
| | | | | | |
Ratios/Supplemental Data: | | | | | | | | | | | | | | | | | | | | |
Net assets, end of year (000) | | | $112,934 | | | | $113,095 | | | | $171,776 | | | | $147,635 | | | | $174,033 | |
Average net assets (000) | | | $115,259 | | | | $146,908 | | | | $165,225 | | | | $156,846 | | | | $172,091 | |
Ratios to average net assets(c): | | | | | | | | | | | | | | | | | | | | |
Expenses after waivers and/or expense reimbursement | | | 0.79 | % | | | 0.78 | % | | | 0.77 | % | | | 0.78 | % | | | 0.75 | % |
Expenses before waivers and/or expense reimbursement | | | 0.85 | % | | | 0.83 | % | | | 0.81 | % | | | 0.85 | % | | | 0.86 | % |
Net investment income (loss) | | | 2.33 | % | | | 1.65 | % | | | 1.50 | % | | | 1.74 | % | | | 1.86 | % |
Portfolio turnover rate(d)(e) | | | 141 | % | | | 109 | % | | | 85 | % | | | 108 | % | | | 128 | % |
| (a) | Calculated based on average shares outstanding during the year. |
| (b) | Total return is calculated assuming a purchase of a share on the first day and a sale on the last day of each year reported and includes reinvestment of dividends and distributions, if any. Total returns may reflect adjustments to conform to GAAP. |
| (c) | Does not include expenses of the underlying funds in which the Fund invests. |
| (d) | The Fund accounts for mortgage dollar roll transactions, when applicable, as purchases and sales which, as a result, can increase its portfolio turnover rate. |
| (e) | The Fund’s portfolio turnover rate is calculated in accordance with regulatory requirements, without regard to transactions involving short-term investments, certain derivatives and in-kind transactions (if any). If such transactions were included, the Fund’s portfolio turnover rate may be higher. |
See Notes to Financial Statements.
104
| | | | | | | | | | | | | | | | | | | | |
| | | | | | |
Class R6 Shares | | | | | | | | | | | | | | | | | | | | |
| | |
| | | Year Ended September 30, | |
| | | | | | |
| | | 2023 | | | 2022 | | | 2021 | | | 2020 | | | 2019 | |
| | | | | | |
Per Share Operating Performance(a): | | | | | | | | | | | | | | | | | | | | |
Net Asset Value, Beginning of Year | | | $13.88 | | | | $18.86 | | | | $16.10 | | | | $15.74 | | | | $16.50 | |
Income (loss) from investment operations: | | | | | | | | | | | | | | | | | | | | |
Net investment income (loss) | | | 0.38 | | | | 0.30 | | | | 0.30 | | | | 0.29 | | | | 0.30 | |
| Net realized and unrealized gain (loss) on investment and foreign currency transactions | | | 1.45 | | | | (3.05 | ) | | | 2.76 | | | | 0.65 | | | | 0.05 | |
Total from investment operations | | | 1.83 | | | | (2.75 | ) | | | 3.06 | | | | 0.94 | | | | 0.35 | |
Less Dividends and Distributions: | | | | | | | | | | | | | | | | | | | | |
Dividends from net investment income | | | (0.38 | ) | | | (0.35 | ) | | | (0.26 | ) | | | (0.30 | ) | | | (0.31 | ) |
Distributions from net realized gains | | | - | | | | (1.88 | ) | | | (0.04 | ) | | | (0.28 | ) | | | (0.80 | ) |
Total dividends and distributions | | | (0.38 | ) | | | (2.23 | ) | | | (0.30 | ) | | | (0.58 | ) | | | (1.11 | ) |
Net asset value, end of year | | | $15.33 | | | | $13.88 | | | | $18.86 | | | | $16.10 | | | | $15.74 | |
Total Return(b): | | | 13.24 | % | | | (16.66 | )% | | | 19.12 | % | | | 6.01 | % | | | 2.69 | % |
| | | | | | | | | | | | | | | | | | | | |
| | | | | | |
Ratios/Supplemental Data: | | | | | | | | | | | | | | | | | | | | |
Net assets, end of year (000) | | | $87,387 | | | | $78,207 | | | | $85,533 | | | | $54,613 | | | | $34,369 | |
Average net assets (000) | | | $85,614 | | | | $88,957 | | | | $71,970 | | | | $44,247 | | | | $16,501 | |
Ratios to average net assets(c): | | | | | | | | | | | | | | | | | | | | |
Expenses after waivers and/or expense reimbursement | | | 0.65 | % | | | 0.65 | % | | | 0.65 | % | | | 0.65 | % | | | 0.65 | % |
Expenses before waivers and/or expense reimbursement | | | 0.73 | % | | | 0.72 | % | | | 0.72 | % | | | 0.74 | % | | | 0.83 | % |
Net investment income (loss) | | | 2.48 | % | | | 1.82 | % | | | 1.63 | % | | | 1.88 | % | | | 1.96 | % |
Portfolio turnover rate(d)(e) | | | 141 | % | | | 109 | % | | | 85 | % | | | 108 | % | | | 128 | % |
| (a) | Calculated based on average shares outstanding during the year. |
| (b) | Total return is calculated assuming a purchase of a share on the first day and a sale on the last day of each year reported and includes reinvestment of dividends and distributions, if any. Total returns may reflect adjustments to conform to GAAP. |
| (c) | Does not include expenses of the underlying funds in which the Fund invests. |
| (d) | The Fund accounts for mortgage dollar roll transactions, when applicable, as purchases and sales which, as a result, can increase its portfolio turnover rate. |
| (e) | The Fund’s portfolio turnover rate is calculated in accordance with regulatory requirements, without regard to transactions involving short-term investments, certain derivatives and in-kind transactions (if any). If such transactions were included, the Fund’s portfolio turnover rate may be higher. |
See Notes to Financial Statements.
PGIM Balanced Fund 105
Notes to Financial Statements
The Prudential Investment Portfolios, Inc. (the “Registered Investment Company” or “RIC”) is registered under the Investment Company Act of 1940, as amended (“1940 Act”), as an open-end management investment company. The RIC is organized as a Maryland Corporation. These financial statements relate only to the PGIM Balanced Fund (the “Fund”), a series of the RIC. The Fund is classified as a diversified fund for purposes of the 1940 Act.
The investment objective of the Fund is to seek income and long-term growth of capital.
The Fund follows the investment company accounting and reporting guidance of the Financial Accounting Standards Board (“FASB”) Accounting Standard Codification (“ASC”) Topic 946 Financial Services — Investment Companies. The following is a summary of significant accounting policies followed by the Fund in the preparation of its financial statements. The policies conform to U.S. generally accepted accounting principles (“GAAP”). The Fund consistently follows such policies in the preparation of its financial statements.
Securities Valuation: The Fund holds securities and other assets and liabilities that are fair valued as of the close of each day (generally, 4:00 PM Eastern time) the New York Stock Exchange (“NYSE”) is open for trading. As described in further detail below, the Fund’s investments are valued daily based on a number of factors, including the type of investment and whether market quotations are readily available. The RIC’s Board of Directors (the “Board”) has approved the Fund’s valuation policies and procedures for security valuation and designated PGIM Investments LLC (“PGIM Investments” or the “Manager”) as the “Valuation Designee,” as defined by Rule 2a-5(b) under the 1940 Act, to perform the fair value determination relating to all Fund investments. Pursuant to the Board’s oversight, the Valuation Designee has established a Valuation Committee to perform the duties and responsibilities as Valuation Designee under Rule 2a-5. The valuation procedures permit the Fund to utilize independent pricing vendor services, quotations from market makers, and alternative valuation methods when market quotations are either not readily available or not deemed representative of fair value. Fair value is the estimated price that would be received to sell an asset or paid to transfer a liability in an orderly transaction between market participants on the measurement date.
For the fiscal reporting year-end, securities and other assets and liabilities were fair valued at the close of the last U.S. business day. Trading in certain foreign securities may occur when the NYSE is closed (including weekends and holidays). Because such foreign securities trade in markets that are open on weekends and U.S. holidays, the values of some of the
106
Fund’s foreign investments may change on days when investors cannot purchase or redeem Fund shares.
Various inputs determine how the Fund’s investments are valued, all of which are categorized according to the three broad levels (Level 1, 2, or 3) detailed in the Schedule of Investments and referred to herein as the “fair value hierarchy” in accordance with FASB ASC Topic 820 — Fair Value Measurement.
Common or preferred stocks, exchange-traded funds (ETFs) and derivative instruments, if applicable, that are traded on a national securities exchange are valued at the last sale price as of the close of trading on the applicable exchange where the security principally trades. Securities traded via NASDAQ are valued at the NASDAQ official closing price. To the extent these securities are valued at the last sale price or NASDAQ official closing price, they are classified as Level 1 in the fair value hierarchy. In the event that no sale or official closing price on a valuation date exists, these securities are generally valued at the mean between the last reported bid and ask prices, or at the last bid price in the absence of an ask price. These securities are classified as Level 2 in the fair value hierarchy.
Foreign equities traded on foreign securities exchanges are generally valued using pricing vendor services that provide model prices derived using adjustment factors based on information such as local closing price, relevant general and sector indices, currency fluctuations, depositary receipts, and futures, as applicable. Securities valued using such model prices are classified as Level 2 in the fair value hierarchy. The models generate an evaluated adjustment factor for each security, which is applied to the local closing price to adjust it for post closing market movements up to the time the Fund is valued. Utilizing that evaluated adjustment factor, the vendor provides an evaluated price for each security. If the vendor does not provide an evaluated price, securities are valued in accordance with exchange-traded common and preferred stock valuation policies discussed above.
Investments in open-end funds (other than ETFs) are valued at their net asset values as of the close of the NYSE on the date of valuation. These securities are classified as Level 1 in the fair value hierarchy since they may be purchased or sold at their net asset values on the date of valuation.
Fixed income securities traded in the OTC market are generally classified as Level 2 in the fair value hierarchy. Such fixed income securities are typically valued using the market approach which generally involves obtaining data from an approved independent third-party vendor source. The Fund utilizes the market approach as the primary method to value securities when market prices of identical or comparable instruments are available. The third-party vendors’ valuation techniques used to derive the evaluated bid price are based on evaluating observable inputs, including but not limited to, yield curves, yield spreads, credit ratings, deal terms, tranche level attributes, default rates, cash flows, prepayment speeds, broker/dealer quotations and reported trades. Certain Level 3 securities are also valued using the market approach when obtaining a single broker quote or when utilizing transaction prices for identical securities that have been used in excess of five business
PGIM Balanced Fund 107
Notes to Financial Statements (continued)
days. During the reporting period, there were no changes to report with respect to the valuation approach and/or valuation techniques discussed above.
Floating rate and other loans are generally valued at prices provided by approved independent pricing vendors. The pricing vendors utilize broker/dealer quotations and provide prices based on the average of such quotations. Floating rate and other loans valued using such vendor prices are generally classified as Level 2 in the fair value hierarchy. Floating rate and other loans valued based on a single broker quote or at the original transaction price in excess of five business days are classified as Level 3 in the fair value hierarchy.
OTC and centrally cleared derivative instruments are generally classified as Level 2 in the fair value hierarchy. Such derivative instruments are typically valued using the market approach and/or income approach which generally involves obtaining data from an approved independent third-party vendor source. The Fund utilizes the market approach when quoted prices in broker-dealer markets are available but also includes consideration of alternative valuation approaches, including the income approach. In the absence of reliable market quotations, the income approach is typically utilized for purposes of valuing derivatives such as interest rate swaps based on a discounted cash flow analysis whereby the value of the instrument is equal to the present value of its future cash inflows or outflows. Such analysis includes projecting future cash flows and determining the discount rate (including the present value factors that affect the discount rate) used to discount the future cash flows. In addition, the third-party vendors’ valuation techniques used to derive the evaluated derivative price is based on evaluating observable inputs, including but not limited to, underlying asset prices, indices, spreads, interest rates and exchange rates. Certain derivatives may be classified as Level 3 when valued using the market approach by obtaining a single broker quote or when utilizing unobservable inputs in the income approach. During the reporting period, there were no changes to report with respect to the valuation approach and/or valuation techniques discussed above.
Securities and other assets that cannot be priced according to the methods described above are valued based on policies and procedures approved by the Board. In the event that unobservable inputs are used when determining such valuations, the securities will be classified as Level 3 in the fair value hierarchy. Altering one or more unobservable inputs may result in a significant change to a Level 3 security’s fair value measurement.
When determining the fair value of securities, some of the factors influencing the valuation include: the nature of any restrictions on disposition of the securities; assessment of the general liquidity of the securities; the issuer’s financial condition and the markets in which it does business; the cost of the investment; the size of the holding and the capitalization of the issuer; the prices of any recent transactions or bids/offers for such securities or any
108
comparable securities; and any available analyst media or other reports or information deemed reliable by the Valuation Designee regarding the issuer or the markets or industry in which it operates. Using fair value to price securities may result in a value that is different from a security’s most recent closing price and from the price used by other unaffiliated mutual funds to calculate their net asset values.
Foreign Currency Translation: The books and records of the Fund are maintained in U.S. dollars. Foreign currency amounts are translated into U.S. dollars on the following basis:
(i) market value of investment securities, other assets and liabilities — at the exchange rate as of the valuation date;
(ii) purchases and sales of investment securities, income and expenses — at the rates of exchange prevailing on the respective dates of such transactions.
Although the net assets of the Fund are presented at the foreign exchange rates and market values at the close of the period, the Fund does not generally isolate that portion of the results of operations arising as a result of changes in the foreign exchange rates from the fluctuations arising from changes in the market prices of long-term portfolio securities held at the end of the period. Similarly, the Fund does not isolate the effect of changes in foreign exchange rates from the fluctuations arising from changes in the market prices of long-term portfolio securities sold during the period. Accordingly, holding period unrealized and realized foreign currency gains (losses) are included in the reported net change in unrealized appreciation (depreciation) on investments and net realized gains (losses) on investment transactions on the Statements of Operations. Notwithstanding the above, the Fund does isolate the effect of fluctuations in foreign currency exchange rates when determining the gain (loss) upon the sale or maturity of foreign currency denominated debt obligations; such amounts are included in net realized gains (losses) on foreign currency transactions.
Additionally, net realized gains (losses) on foreign currency transactions represent net foreign exchange gains (losses) from the disposition of holdings of foreign currencies, currency gains (losses) realized between the trade and settlement dates on investment transactions, and the difference between the amounts of interest, dividends and foreign withholding taxes recorded on the Fund’s books and the U.S. dollar equivalent amounts actually received or paid. Net unrealized currency gains (losses) arise from valuing foreign currency denominated assets and liabilities (other than investments) at period end exchange rates.
Forward and Cross Currency Contracts: A forward currency contract is a commitment to purchase or sell a foreign currency at a future date at a negotiated forward rate. The Fund enters into forward currency contracts, as defined in the prospectus, in order to hedge its exposure to changes in foreign currency exchange rates on its foreign portfolio holdings or on specific receivables and payables denominated in a foreign currency and to gain exposure to certain currencies. The contracts are valued daily at current forward exchange
PGIM Balanced Fund 109
Notes to Financial Statements (continued)
rates and any unrealized gain (loss) is included in net unrealized appreciation or depreciation on forward and cross currency contracts. Gain (loss) is realized on the settlement date of the contract equal to the difference between the settlement value of the original and negotiated forward contracts. This gain (loss), if any, is included in net realized gain (loss) on forward and cross currency contract transactions. Risks may arise upon entering into these contracts from the potential inability of the counterparties to meet the terms of their contracts. Forward currency contracts involve risks from currency exchange rate and credit risk in excess of the amounts reflected on the Statement of Assets and Liabilities. The Fund’s maximum risk of loss from counterparty credit risk is the net value of the cash flows to be received from the counterparty at the end of the contract’s life. A cross currency contract is a forward contract where a specified amount of one foreign currency will be exchanged for a specified amount of another foreign currency.
Options: The Fund purchased and/or wrote options in order to hedge against adverse market movements or fluctuations in value caused by changes in prevailing interest rates, value of equities or foreign currency exchange rates with respect to securities or financial instruments which the Fund currently owns or intends to purchase. The Fund may also use options to gain additional market exposure. The Fund’s principal reason for writing options is to realize, through receipt of premiums, a greater current return than would be realized on the underlying security alone. When the Fund purchases an option, it pays a premium and an amount equal to that premium is recorded as an asset. When the Fund writes an option, it receives a premium and an amount equal to that premium is recorded as a liability. The asset or liability is adjusted daily to reflect the current market value of the option. If an option expires unexercised, the Fund realizes a gain (loss) to the extent of the premium received or paid. If an option is exercised, the premium received or paid is recorded as an adjustment to the proceeds from the sale or the cost of the purchase in determining whether the Fund has realized a gain (loss). The difference between the premium and the amount received or paid at the closing of a purchase or sale transaction is also treated as a realized gain (loss). Gain (loss) on purchased options is included in net realized gain (loss) on investment transactions. Gain (loss) on written options is presented separately as net realized gain (loss) on options written transactions.
The Fund, as writer of an option, may have no control over whether the underlying securities or financial instruments may be sold (called) or purchased (put). As a result, the Fund bears the market risk of an unfavorable change in the price of the security or financial instrument underlying the written option. The Fund, as purchaser of an OTC option, bears the risk of the potential inability of the counterparties to meet the terms of their contracts. With exchange-traded options contracts, there is minimal counterparty credit risk to the Fund since the exchanges’ clearinghouse acts as counterparty to all exchange-traded options and guarantees the options contracts against default.
110
When the Fund writes an option on a swap, an amount equal to any premium received by the Fund is recorded as a liability and is subsequently adjusted to the current market value of the written option on the swap. If a call option on a swap is exercised, the Fund becomes obligated to pay a fixed interest rate (noted as the strike price) and receive a variable interest rate on a notional amount. If a put option on a swap is exercised, the Fund becomes obligated to pay a variable interest rate and receive a fixed interest rate (noted as the strike price) on a notional amount. Premiums received from writing options on swaps that expire or are exercised are treated as realized gains upon the expiration or exercise of such options on swaps. The risk associated with writing put and call options on swaps is that the Fund will be obligated to be party to a swap agreement if an option on a swap is exercised. The Fund entered into options on swaps that are executed through a central clearing facility, such as a registered exchange. Such options pay or receive an amount known as “variation margin”, based on daily changes in the valuation of the contract. The daily variation margin, rather than the contract market value, is recorded for financial statement purposes on the Statement of Assets and Liabilities.
Financial Futures Contracts: A financial futures contract is an agreement to purchase (long) or sell (short) an agreed amount of securities at a set price for delivery on a future date. Upon entering into a financial futures contract, the Fund is required to pledge to the broker an amount of cash and/or other assets equal to a certain percentage of the contract amount. This amount is known as the “initial margin.” Subsequent payments, known as “variation margin,” are made or received by the Fund each day, depending on the daily fluctuations in the value of the underlying security. Such variation margin is recorded for financial statement purposes on a daily basis as unrealized gain (loss). When the contract expires or is closed, the gain (loss) is realized and is presented in the Statement of Operations as net realized gain (loss) on futures transactions.
The Fund invested in financial futures contracts in order to hedge its existing portfolio securities, or securities the Fund intends to purchase, against fluctuations in value caused by changes in prevailing interest rates. Should interest rates move unexpectedly, the Fund may not achieve the anticipated benefits of the financial futures contracts and may realize a loss. The use of futures transactions involves the risk of imperfect correlation in movements in the price of futures contracts, interest rates and the underlying hedged assets. Since futures contracts are exchange-traded, there is minimal counterparty credit risk to the Fund since the exchanges’ clearinghouse acts as counterparty to all exchange-traded futures and guarantees the futures contracts against default.
Swap Agreements: The Fund entered into certain types of swap agreements detailed in the disclosures below. A swap agreement is an agreement to exchange the return generated by one instrument for the return generated by another instrument. Swap agreements are negotiated in the OTC market and may be executed either directly with a counterparty (“OTC-traded”) or through a central clearing facility, such as a registered exchange. Swap agreements are valued daily at current market value and any change in value is included in the net unrealized appreciation or depreciation on swap agreements. Centrally cleared swaps pay or receive an amount known as “variation margin”, based on daily changes in the
PGIM Balanced Fund 111
Notes to Financial Statements (continued)
valuation of the swap contract. For OTC-traded, upfront premiums paid and received are shown as swap premiums paid and swap premiums received in the Statement of Assets and Liabilities. Risk of loss may exceed amounts recognized on the Statement of Assets and Liabilities. Swap agreements outstanding at period end, if any, are listed on the Schedule of Investments.
Interest Rate Swaps: Interest rate swaps represent an agreement between counterparties to exchange cash flows based on the difference between two interest rates, applied to a notional principal amount for a specified period. The Fund is subject to interest rate risk exposure in the normal course of pursuing its investment objective. The Fund used interest rate swaps to maintain its ability to generate steady cash flow by receiving a stream of fixed rate payments or to increase exposure to prevailing market rates by receiving floating rate payments. The Fund’s maximum risk of loss from counterparty credit risk is the discounted net present value of the cash flows to be received from the counterparty over the contract’s remaining life.
Credit Default Swaps (“CDS”): CDS involve one party (the protection buyer) making a stream of payments to another party (the protection seller) in exchange for the right to receive a specified payment in the event of a default or as a result of a default (collectively a “credit event”) for the referenced entity (typically corporate issues or sovereign issues of an emerging country) on its obligation; or in the event of a write-down, principal shortfall, interest shortfall or default of all or part of the referenced entities comprising a credit index.
The Fund is subject to credit risk in the normal course of pursuing its investment objectives, and as such, has entered into CDS contracts to provide a measure of protection against defaults or to take an active long or short position with respect to the likelihood of a particular issuer’s default or the reference entity’s credit soundness. CDS contracts generally trade based on a spread which represents the cost a protection buyer has to pay the protection seller. The protection buyer is said to be “short the credit” because the higher the contract value rises, the more the credit deteriorates. The value of the CDS contract increases for the protection buyer if the spread increases. The Fund’s maximum risk of loss from counterparty credit risk for purchased CDS is the inability of the counterparty to honor the contract up to the notional value due to a credit event.
As a seller of protection on credit default swap agreements, the Fund generally receives an agreed upon payment from the buyer of protection throughout the term of the swap, provided no credit event occurs. As the seller, the Fund effectively increases its investment risk because, in addition to its total net assets, the Fund may be subject to investment exposure on the notional amount of the swap.
112
The maximum amount of the payment that the Fund, as a seller of protection, could be required to make under a credit default swap agreement would be equal to the notional amount of the underlying security or index contract as a result of a credit event. This potential amount will be partially offset by any recovery values of the respective referenced obligations or net amounts received from the settlement of buy protection credit default swap agreements which the Fund entered into for the same referenced entity or index. As a buyer of protection, the Fund generally receives an amount up to the notional value of the swap if a credit event occurs.
Implied credit spreads, represented in absolute terms, utilized in determining the market value of credit default swap agreements where the Fund is the seller of protection as of period end are disclosed in the footnotes to the Schedule of Investments, if applicable. These spreads serve as indicators of the current status of the payment/performance risk and represent the likelihood of default risk for the credit derivative. The implied credit spread of a particular referenced entity reflects the cost of buying/selling protection and may include upfront payments required to enter into the agreement. Wider credit spreads and increased market value in absolute terms, when compared to the notional amount of the swap, represent a deterioration of the referenced entity’s credit soundness and a greater likelihood of risk of default or other credit event occurring as defined under the terms of the agreement.
Total Return Swaps: In a total return swap, one party receives payments based on the market value of the security or the commodity involved, or total return of a specific referenced asset, such as an equity, index or bond, and in return pays a defined amount. The Fund is subject to risk exposures associated with the referenced asset in the normal course of pursuing its investment objectives. The Fund entered into total return swaps to manage its exposure to a security or an index. The Fund’s maximum risk of loss from counterparty credit risk is the change in the value of the security, in the Fund’s favor, from the point of entering into the contract.
Floating Rate and Other Loans: The Fund invested in floating rate and other loans. Floating rate and other loans include loans that are privately negotiated between a corporate borrower and one or more financial institutions, including, but not limited to, term loans, revolvers, and other instruments issued in the floating rate and other loans market. The Fund acquire interests in loans directly (by way of assignment from the selling institution) and/or indirectly (by way of the purchase of a participation interest from the selling institution). Under a floating rate and other loans assignment, the Fund generally will succeed to all the rights and obligations of an assigning lending institution and become a lender under the loan agreement with the relevant borrower in connection with that loan. Under a floating rate and other loans participation, the Fund generally will have a contractual relationship only with the lender, not with the relevant borrower. As a result, the Fund generally will have the right to receive payments of principal, interest, and any fees to which they are entitled only from the lender selling the participation and only upon receipt by the lender of the payments from the relevant borrower. The Fund may not directly benefit from the collateral supporting the debt obligation in which they have purchased the
PGIM Balanced Fund 113
Notes to Financial Statements (continued)
participation. As a result, the Fund will assume the credit risk of both the borrower and the institution selling the participation to the Fund.
Mortgage-Backed and Asset-Backed Securities: Mortgage-backed securities are pass-through securities, meaning that principal and interest payments made by the borrower on the underlying mortgages are passed through to the Fund. Asset-backed securities directly or indirectly represent a participation interest in, or are secured by and payable from, a stream of payments generated by particular assets such as motor vehicle or credit card receivables. Asset-backed securities may be classified as pass-through certificates or collateralized obligations, such as collateralized bond obligations, collateralized loan obligations and other similarly structured securities. The value of mortgage-backed and asset-backed securities varies with changes in interest rates and may be affected by changes in credit quality or value of the mortgage loans or other assets that support the securities.
Stripped mortgage-backed securities are usually structured with two classes that receive different proportions of the interest (“IO”) and principal (“PO”) distributions on a pool of mortgage assets. Payments received for IOs are included in interest income on the Statements of Operations. Because no principal will be received at the maturity of an IO, adjustments are made to the cost of the security on a monthly basis until maturity. These adjustments are included in interest income on the Statements of Operations. Payments received for POs are treated as reductions to the cost and par value of the securities.
Master Netting Arrangements: The RIC, on behalf of the Fund, is subject to various Master Agreements, or netting arrangements, with select counterparties. These are agreements which a subadviser may have negotiated and entered into on behalf of all or a portion of the Fund. A master netting arrangement between the Fund and the counterparty permits the Fund to offset amounts payable by the Fund to the same counterparty against amounts to be received and by the receipt of collateral from the counterparty by the Fund to cover the Fund’s exposure to the counterparty. However, there is no assurance that such mitigating factors are easily enforceable. In addition to master netting arrangements, the right to set-off exists when all the conditions are met such that each of the parties owes the other determinable amounts, the reporting party has the right to set-off the amount owed with the amount owed by the other party, the reporting party intends to set-off and the right of set-off is enforceable by law.
The RIC, on behalf of the Fund, is a party to International Swaps and Derivatives Association, Inc. (“ISDA”) Master Agreements with certain counterparties that govern OTC derivative and foreign exchange contracts entered into from time to time. The Master Agreements may contain provisions regarding, among other things, the parties’ general obligations, representations, agreements, collateral requirements, events of default and
114
early termination. With respect to certain counterparties, in accordance with the terms of the Master Agreements, collateral posted to the Fund is held in a segregated account by the Fund’s custodian and with respect to those amounts which can be sold or re-pledged, is presented in the Schedule of Investments. Collateral pledged by the Fund is segregated by the Fund’s custodian and identified in the Schedule of Investments. Collateral can be in the form of cash or debt securities issued by the U.S. Government or related agencies or other securities as agreed to by the Fund and the applicable counterparty. Collateral requirements are determined based on the Fund’s net position with each counterparty. Termination events applicable to the Fund may occur upon a decline in the Fund’s net assets below a specified threshold over a certain period of time. Termination events applicable to counterparties may occur upon a decline in the counterparty’s long-term and short-term credit ratings below a specified level. In each case, upon occurrence, the other party may elect to terminate early and cause settlement of all derivative and foreign exchange contracts outstanding, including the payment of any losses and costs resulting from such early termination, as reasonably determined by the terminating party. Any decision by one or more of the Fund’s counterparties to elect early termination could impact the Fund’s future derivative activity.
In addition to each instrument’s primary underlying risk exposure (e.g. interest rate, credit, equity or foreign exchange, etc.), swap agreements involve, to varying degrees, elements of credit, market and documentation risk. Such risks involve the possibility that no liquid market for these agreements will exist, the counterparty to the agreement may default on its obligation to perform or disagree on the contractual terms of the agreement, and changes in net interest rates will be unfavorable. In connection with these agreements, securities in the portfolio may be identified or received as collateral from the counterparty in accordance with the terms of the respective swap agreements to provide or receive assets of value and to serve as recourse in the event of default or bankruptcy/insolvency of either party. Such OTC derivative agreements include conditions which, when materialized, give the counterparty the right to cause an early termination of the transactions under those agreements. Any election by the counterparty for early termination of the contract(s) may impact the amounts reported on financial statements.
Short sales and OTC contracts, including forward foreign currency exchange contracts, swaps, forward rate agreements and written options involve elements of both market and credit risk in excess of the amounts reflected on the Statement of Assets and Liabilities, if applicable. Such risks may be mitigated by engaging in master netting arrangements.
Rights: The Fund held rights acquired either through a direct purchase or pursuant to corporate actions. Rights entitle the holder to buy a proportionate amount of common stock, or such other security that the issuer may specify, at a specific price and time through the expiration dates. Such rights are held as long positions by the Fund until exercised, sold or expired. Rights are valued at fair value in accordance with the Board approved fair valuation procedures.
Payment-In-Kind: The Fund invested in the open market or received pursuant to debt restructuring securities that pay-in-kind (PIK) the interest due on such debt instruments.
PGIM Balanced Fund 115
Notes to Financial Statements (continued)
The PIK interest, computed at the contractual rate specified, is added to the existing principal balance of the debt when issued bonds have the same terms as the bond or recorded as a separate bond when terms are different from the existing debt, and is recorded as interest income.
Delayed-Delivery Transactions: The Fund purchased or sold securities on a when-issued or delayed-delivery and forward commitment basis, including TBA securities. These transactions involve a commitment by the Fund to purchase or sell securities for a predetermined price or yield, with payment and delivery taking place beyond the customary settlement period. When delayed-delivery purchases are outstanding, the Fund will set aside and maintain an amount of liquid assets sufficient to meet the purchase price in a segregated account until the settlement date. When purchasing a security on a delayed-delivery basis, the Fund assumes the rights and risks of ownership of the security, including the risk of price and yield fluctuations, and takes such fluctuations into account when determining its net asset value. The Fund may dispose of or renegotiate a delayed-delivery transaction subsequent to establishment, and may sell when-issued securities before they are delivered, which may result in a realized gain (loss). When selling a security on a delayed-delivery basis, the Fund forfeits its eligibility to realize future gains (losses) with respect to the security.
Securities Lending: The Fund lends its portfolio securities to banks and broker-dealers. The loans are secured by collateral at least equal to the market value of the securities loaned. Collateral pledged by each borrower is invested in an affiliated money market fund and is marked to market daily, based on the previous day’s market value, such that the value of the collateral exceeds the value of the loaned securities. In the event of significant appreciation in value of the securities on loan on the last business day of the reporting period, the financial statements may reflect a collateral value that is less than the market value of the loaned securities. Such shortfall is remedied as described above. Loans are subject to termination at the option of the borrower or the Fund. Upon termination of the loan, the borrower will return to the Fund securities identical to the loaned securities. The remaining open loans of the securities lending transactions are considered overnight and continuous. Should the borrower of the securities fail financially, the Fund has the right to repurchase the securities in the open market using the collateral.
The Fund recognizes income, net of any rebate and securities lending agent fees, for lending its securities in the form of fees or interest on the investment of any cash received as collateral. The borrower receives all interest and dividends from the securities loaned and such payments are passed back to the lender in amounts equivalent thereto, which are reflected in interest income or unaffiliated dividend income based on the nature of the payment on the Statement of Operations. The Fund also continues to recognize any unrealized gain (loss) in the market price of the securities loaned and on the change in the
116
value of the collateral invested that may occur during the term of the loan. In addition, realized gain (loss) is recognized on changes in the value of the collateral invested upon liquidation of the collateral. Net earnings from securities lending are disclosed in the Statement of Operations.
Mortgage Dollar Rolls: The Fund entered into mortgage dollar rolls in which the Fund sell mortgage securities for delivery in the current month, realizing a gain (loss), and simultaneously enter into contracts to repurchase somewhat similar (same type, coupon and maturity) securities on a specified future date. During the roll period, the Fund forgoes principal and interest paid on the securities. The Fund is compensated by the interest earned on the cash proceeds of the initial sale and by the lower repurchase price at the future date. The difference between the sale proceeds and the lower repurchase price is recorded as a realized gain on investment transactions. The Fund maintains a segregated account, the dollar value of which is at least equal to its obligations, with respect to dollar rolls. The Fund is subject to the risk that the market value of the securities the Fund is obligated to repurchase under the agreement may decline below the repurchase price.
Equity and Mortgage Real Estate Investment Trusts (collectively REITs): The Fund invested in REITs, which report information on the source of their distributions annually. Based on current and historical information, a portion of distributions received from REITs during the period is estimated to be dividend income, capital gain or return of capital and recorded accordingly. When material, these estimates are adjusted periodically when the actual source of distributions is disclosed by the REITs.
Securities Transactions and Net Investment Income: Securities transactions are recorded on the trade date. Realized gains (losses) from investment and currency transactions are calculated on the specific identification method. Dividend income is recorded on the ex-date, or for certain foreign securities, when the Fund becomes aware of such dividends. Interest income, including amortization of premium and accretion of discount on debt securities, as required, is recorded on the accrual basis. Expenses are recorded on an accrual basis, which may require the use of certain estimates by management that may differ from actual expense amounts. Net investment income or loss (other than class specific expenses and waivers, which are allocated as noted below) and unrealized and realized gains (losses) are allocated daily to each class of shares based upon the relative proportion of adjusted net assets of each class at the beginning of the day. Class specific expenses and waivers, where applicable, are charged to the respective share classes. Such class specific expenses and waivers include distribution fees and distribution fee waivers, shareholder servicing fees, transfer agent’s fees and expenses, registration fees and fee waivers and/or expense reimbursements, as applicable.
Taxes: It is the Fund’s policy to continue to meet the requirements of the Internal Revenue Code applicable to regulated investment companies and to distribute all of its taxable net investment income and capital gains, if any, to its shareholders. Therefore, no federal
PGIM Balanced Fund 117
Notes to Financial Statements (continued)
income tax provision is required. Withholding taxes on foreign dividends, interest and capital gains, if any, are recorded, net of reclaimable amounts, at the time the related income is earned.
The Fund is subject to foreign income taxes imposed by certain countries in which it invests. Additionally, capital gains realized upon disposition of securities issued in or by certain foreign countries are subject to capital gains tax imposed by those countries. All taxes are computed in accordance with the applicable foreign tax law, and, to the extent permitted, capital losses are used to offset capital gains. Taxes attributable to income are accrued by the Fund as a reduction of income. Current and deferred tax expense attributable to capital gains is reflected as a component of realized or change in unrealized gain/loss on securities in the accompanying financial statements. To the extent that the Fund has country specific capital loss carryforwards, such carryforwards are applied against net unrealized gains when determining the deferred tax liability. Any deferred tax liability incurred by the Fund is included in either Other liabilities or Deferred tax liability on the accompanying Statement of Assets and Liabilities.
Dividends and Distributions: Dividends and distributions to shareholders, which are determined in accordance with federal income tax regulations and which may differ from GAAP, are recorded on the ex-date. Permanent book/tax differences relating to income and gain (loss) are reclassified between total distributable earnings (loss) and paid-in capital in excess of par, as appropriate. The chart below sets forth the expected frequency of dividend and capital gains distributions to shareholders. Various factors may impact the frequency of dividend distributions to shareholders, including but not limited to adverse market conditions or portfolio holding-specific events.
| | | | |
| | |
| Expected Distribution Schedule to Shareholders* | | Frequency | |
| |
Net Investment Income | | | Quarterly | |
| |
Short-Term Capital Gains | | | Annually | |
| |
Long-Term Capital Gains | | | Annually | |
| * | Under certain circumstances, the Fund may make more than one distribution of short-term and/or long-term capital gains during a fiscal year. |
Estimates: The preparation of financial statements requires management to make estimates and assumptions that affect the reported amounts and disclosures in the financial statements. Actual results could differ from those estimates.
The RIC, on behalf of the Fund, has a management agreement with the Manager pursuant to which it has responsibility for all investment advisory services, including supervision of the subadviser’s performance of such services, and for rendering administrative services.
118
The Manager has entered into a subadvisory agreement with PGIM, Inc., which provides subadvisory services to the Fund through its business unit PGIM Fixed Income, PGIM Limited, and PGIM Quantitative Solutions LLC (collectively the “subadviser”). The Manager pays for the services of subadviser.
Fees payable under the management agreement are computed daily and paid monthly. For the reporting period ended September 30, 2023, the contractual and effective management fee rates were as follows:
| | | | |
| | |
| Contractual Management Rate | | Effective Management Fee, before any waivers and/or expense reimbursements | |
| |
0.65% of average daily net assets up to and including $1 billion; | | | 0.65% | |
| |
0.60% on average daily net assets over $1 billion. | | | | |
The Manager has contractually agreed, through January 31, 2025, to limit total annual operating expenses after fee waivers and/or expense reimbursements. This contractual waiver excludes interest, brokerage, taxes (such as income and foreign withholding taxes, stamp duty and deferred tax expenses), acquired fund fees and expenses, extraordinary expenses, and certain other expenses of the Fund such as dividend and interest expense and broker charges on short sales.
Where applicable, the Manager agrees to waive management fees or shared operating expenses on any share class to the same extent that it waives such expenses on any other share class. In addition, total annual operating expenses for Class R6 shares will not exceed total annual operating expenses for Class Z shares. Fees and/or expenses waived and/or reimbursed by the Manager for the purpose of preventing the expenses from exceeding a certain expense ratio limit may be recouped by the Manager within the same fiscal year during which such waiver and/or reimbursement is made if such recoupment can be realized without exceeding the expense limit in effect at the time of the recoupment for that fiscal year. The expense limitations attributable to each class are as follows:
| | | | |
| | |
| Class | | Expense Limitations | |
| |
A | | | 1.00% | |
| |
C | | | — | |
| |
R | | | 1.47 | |
| |
Z | | | — | |
| |
R6 | | | 0.65 | |
The RIC, on behalf of the Fund, has a distribution agreement with Prudential Investment Management Services LLC (“PIMS”), which acts as the distributor of the Class A, Class C, Class R, Class Z and Class R6 shares of the Fund. The Fund compensates PIMS for distributing and servicing the Fund’s Class A, Class C and Class R shares, pursuant to the plans of distribution (the “Distribution Plans”), regardless of expenses actually incurred by PIMS.
PGIM Balanced Fund 119
Notes to Financial Statements (continued)
Pursuant to the Distribution Plans, the Fund compensates PIMS for distribution related activities at an annual rate based on average daily net assets per class. PIMS has contractually agreed through January 31, 2025 to limit such fees on certain classes based on the average net assets. The distribution fees are accrued daily and payable monthly.
The Fund’s annual gross and net distribution rates, where applicable, are as follows:
| | | | |
| | | |
| Class | | Gross Distribution Fee | | Net Distribution Fee |
| | |
A | | 0.30% | | 0.30% |
| | |
C | | 1.00 | | 1.00 |
| | |
R | | 0.75 | | 0.50 |
| | |
Z | | N/A | | N/A |
| | |
R6 | | N/A | | N/A |
For the year ended September 30, 2023, PIMS received front-end sales charges (“FESL”) resulting from sales of certain class shares and contingent deferred sales charges (“CDSC”) imposed upon redemptions by certain shareholders. From these fees, PIMS paid such sales charges to broker-dealers, who in turn paid commissions to salespersons and incurred other distribution costs. The sales charges are as follows where applicable:
| | | | | | | | |
| | | |
| Class | | FESL | | | CDSC | |
| | |
A | | $ | 339,411 | | | $ | 3,504 | |
| | |
C | | | — | | | | 8,622 | |
PGIM Investments, PGIM, Inc., PGIM Limited, PIMS and PGIM Quantitative Solutions are indirect, wholly-owned subsidiaries of Prudential Financial, Inc. (“Prudential”).
| 4. | Other Transactions with Affiliates |
Prudential Mutual Fund Services LLC (“PMFS”), an affiliate of PGIM Investments and an indirect, wholly-owned subsidiary of Prudential, serves as the Fund’s transfer agent and shareholder servicing agent. Transfer agent’s fees and expenses in the Statement of Operations include certain out-of-pocket expenses paid to non-affiliates, where applicable.
The Fund may invest its overnight sweep cash in the PGIM Core Government Money Market Fund (the “Core Government Fund”), a series of the Prudential Government Money Market Fund, Inc., and its securities lending cash collateral in the PGIM Institutional Money Market Fund (the “Money Market Fund”), a series of Prudential Investment Portfolios 2, each registered under the 1940 Act and managed by PGIM Investments. PGIM Investments and/or its affiliates are paid fees or reimbursed for providing their services to the Core Government Fund and the Money Market Fund. In addition to the realized and unrealized gains on investments in the Core Government Fund and the Money Market Fund, earnings
120
from such investments are disclosed on the Statement of Operations as “Affiliated dividend income” and “Income from securities lending, net”, respectively.
The Fund may enter into certain securities purchase or sale transactions under Board approved Rule 17a-7 procedures. Rule 17a-7 is an exemptive rule under the 1940 Act that, subject to certain conditions, permits purchase and sale transactions among affiliated investment companies, or between an investment company and a person that is affiliated solely by reason of having a common (or affiliated) investment adviser, common directors/trustees, and/or common officers. For the year ended September 30, 2023, no Rule 17a-7 transactions were entered into by the Fund.
The aggregate cost of purchases and proceeds from sales of portfolio securities (excluding short-term investments and U.S. Government securities) for the reporting period ended September 30, 2023, were as follows:
| | | | | | |
| | | Cost of Purchases | | Proceeds from Sales | | |
| | | |
| | | $1,259,962,740 | | $1,284,921,879 | | |
A summary of the cost of purchases and proceeds from sales of shares of affiliated mutual funds for the year ended September 30, 2023, is presented as follows:
| | | | | | | | | | | | | | | | | | | | | | | | | | | | |
| | | | | | | | |
Value, Beginning of Year | | Cost of Purchases | | | Proceeds from Sales | | | Change in Unrealized Gain (Loss) | | | Realized Gain
(Loss) | | | Value, End of Year | | | Shares, End of Year | | | Income | |
| | | |
Short-Term Investments - Affiliated Mutual Funds: | | | | | | | | | | | | | |
| | | | |
PGIM Core Government Money Market Fund(1)(wb) | | | | | | | | | | | | | | | | | |
| $ — | | | $140,100,294 | | | | $130,907,257 | | | | $ — | | | | $ — | | | | $9,193,037 | | | | 9,193,037 | | | | $520,316 | |
| | | | |
PGIM Institutional Money Market Fund(1)(b)(wb) | | | | | | | | | | | | | | | | | |
| | | | | | | |
| 3,738,839 | | | 90,656,018 | | | | 91,906,468 | | | | (806 | ) | | | 4,747 | | | | 2,492,330 | | | | 2,493,826 | | | | 11,734 | (2) |
| | | | | | | |
| $3,738,839 | | | $230,756,312 | | | | $222,813,725 | | | | $(806 | ) | | | $4,747 | | | | $11,685,367 | | | | | | | | $532,050 | |
| (1) | The Fund did not have any capital gain distributions during the reporting period. |
| (2) | The amount, or a portion thereof, represents the affiliated securities lending income shown on the Statement of Operations. |
| (b) | Represents security, or portion thereof, purchased with cash collateral received for securities on loan and includes dividend reinvestment. |
| (wb) | Represents an investment in a Fund affiliated with the Manager. |
| 6. | Distributions and Tax Information |
Distributions to shareholders, which are determined in accordance with federal income tax regulations and which may differ from GAAP, are recorded on the ex-date.
PGIM Balanced Fund 121
Notes to Financial Statements (continued)
For the year ended September 30, 2023, the tax character of dividends paid as reflected in the Statement of Changes in Net Assets were as follows:
| | | | | | |
| | | | |
Ordinary
Income | | Long-Term Capital Gains | | Tax Return of Capital | | Total Dividends and Distributions |
| | | |
$20,016,605 | | $— | | $— | | $20,016,605 |
For the year ended September 30, 2022, the tax character of dividends paid as reflected in the Statement of Changes in Net Assets were as follows:
| | | | | | |
| | | | |
Ordinary Income | | Long-Term Capital Gains | | Tax Return of Capital | | Total Dividends and Distributions |
| | | |
$62,308,953 | | $66,644,332 | | $— | | $128,953,285 |
For the year ended September 30, 2023, the Fund had the following amounts of accumulated undistributed earnings on a tax basis:
| | | | | | |
| | | | |
| | | Undistributed Ordinary Income | | Undistributed Long-Term Capital Gains | | |
| | | |
| | | $3,036,018 | | $— | | |
The United States federal income tax basis of the Fund’s investments and the net unrealized appreciation as of September 30, 2023 were as follows:
| | | | | | | | |
| | | | |
| Tax Basis | | Gross Unrealized Appreciation | | Gross Unrealized
Depreciation | | Net Unrealized Appreciation |
| | | |
| $841,453,230 | | $134,472,972 | | $(79,753,647) | | $ | 54,719,325 | |
The difference between GAAP and tax basis was primarily attributable to deferred losses on wash sales, defaulted securities, investments in passive foreign investment companies, mark-to-market of futures and forwards contracts and other cost basis differences between GAAP and tax accounting.
For federal income tax purposes, the Fund had an approximated capital loss carryforward as of September 30, 2023 which can be carried forward for an unlimited period. No capital gains distributions are expected to be paid to shareholders until net gains have been realized in excess of such losses.
| | |
| | |
Capital Loss Carryforward | | Capital Loss Carryforward Utilized |
| |
$7,029,000 | | $— |
The Manager has analyzed the Fund’s tax positions taken on federal, state and local income tax returns for all open tax years and has concluded that no provision for income tax is
122
required in the Fund’s financial statements for the current reporting period. Since tax authorities can examine previously filed tax returns, the Fund’s U.S. federal and state tax returns for each of the four fiscal years up to the most recent fiscal year ended September 30, 2023 are subject to such review.
The Fund offers Class A, Class C, Class R, Class Z and Class R6 shares. Class A shares are sold with a maximum front-end sales charge of 3.25%. Investors who purchase $500,000 or more of Class A shares and sell those shares within 12 months of purchase are subject to a CDSC of 1% on sales although these purchases are not subject to a front-end sales charge. The Class A CDSC is waived for certain retirement and/or benefit plans. A special exchange privilege is also available for shareholders who qualified to purchase Class A shares at net asset value. Class C shares are sold with a CDSC of 1% on sales made within 12 months of purchase. Class C shares will automatically convert to Class A shares on a monthly basis approximately eight years (ten years prior to January 22, 2021) after purchase. Class R, Class Z and Class R6 shares are not subject to any sales or redemption charges and are available exclusively for sale to a limited group of investors.
Under certain circumstances, an exchange may be made from specified share classes of the Fund to one or more other share classes of the Fund as presented in the table of transactions in shares of common stock, below.
The RIC is authorized to issue 6,625,000,000 shares of capital stock at $0.001 par value per share, 923,000,000 of which are designated as shares of the Fund. The authorized shares of the Fund are currently classified and designated as follows:
| | | | |
| | |
| Class | | Number of Shares | |
A | | | 125,000,000 | |
B | | | 3,000,000 | |
C | | | 25,000,000 | |
R | | | 125,000,000 | |
Z | | | 280,000,000 | |
T | | | 75,000,000 | |
R6 | | | 290,000,000 | |
The Fund currently does not have any Class B or Class T shares outstanding.
As of September 30, 2023, Prudential, through its affiliated entities, including affiliated funds (if applicable), owned shares of the Fund as follows:
| | | | |
| | | |
| Class | | Number of Shares | | Percentage of Outstanding Shares |
| | |
Z | | 66,862 | | 0.9% |
PGIM Balanced Fund 123
Notes to Financial Statements (continued)
At the reporting period end, the number of shareholders holding greater than 5% of the Fund are as follows:
| | | | |
| | | |
| | | Number of Shareholders | | Percentage of Outstanding Shares |
| | |
Affiliated | | — | | —% |
| | |
Unaffiliated | | 3 | | 47.1 |
Transactions in shares of common stock were as follows:
| | | | | | | | |
| | | |
| Share Class | | Shares | | | Amount | |
| | |
Class A | | | | | | | | |
| | |
Year ended September 30, 2023: | | | | | | | | |
| | |
Shares sold | | | 2,635,515 | | | $ | 39,517,647 | |
| | |
Shares issued in reinvestment of dividends and distributions | | | 926,541 | | | | 14,076,612 | |
| | |
Shares purchased | | | (6,549,489 | ) | | | (98,470,568 | ) |
| | |
Net increase (decrease) in shares outstanding before conversion | | | (2,987,433 | ) | | | (44,876,309 | ) |
| | |
Shares issued upon conversion from other share class(es) | | | 568,754 | | | | 8,577,200 | |
| | |
Shares purchased upon conversion into other share class(es) | | | (229,294 | ) | | | (3,429,667 | ) |
| | |
Net increase (decrease) in shares outstanding | | | (2,647,973 | ) | | $ | (39,728,776 | ) |
| | |
Year ended September 30, 2022: | | | | | | | | |
| | |
Shares sold | | | 5,408,918 | | | $ | 90,321,955 | |
| | |
Shares issued in reinvestment of dividends and distributions | | | 5,182,991 | | | | 87,779,782 | |
| | |
Shares purchased | | | (6,614,906 | ) | | | (108,173,643 | ) |
| | |
Net increase (decrease) in shares outstanding before conversion | | | 3,977,003 | | | | 69,928,094 | |
| | |
Shares issued upon conversion from other share class(es) | | | 407,148 | | | | 6,681,476 | |
| | |
Shares purchased upon conversion into other share class(es) | | | (304,295 | ) | | | (5,175,557 | ) |
| | |
Net increase (decrease) in shares outstanding | | | 4,079,856 | | | $ | 71,434,013 | |
| | |
Class C | | | | | | | | |
| | |
Year ended September 30, 2023: | | | | | | | | |
| | |
Shares sold | | | 317,347 | | | $ | 4,806,068 | |
| | |
Shares issued in reinvestment of dividends and distributions | | | 54,766 | | | | 838,470 | |
| | |
Shares purchased | | | (857,019 | ) | | | (13,004,371 | ) |
| | |
Net increase (decrease) in shares outstanding before conversion | | | (484,906 | ) | | | (7,359,833 | ) |
| | |
Shares purchased upon conversion into other share class(es) | | | (584,059 | ) | | | (8,856,669 | ) |
| | |
Net increase (decrease) in shares outstanding | | | (1,068,965 | ) | | $ | (16,216,502 | ) |
124
| | | | | | | | |
| | | |
| Share Class | | Shares | | | Amount | |
| | |
Year ended September 30, 2022: | | | | | | | | |
| | |
Shares sold | | | 648,125 | | | $ | 11,075,552 | |
| | |
Shares issued in reinvestment of dividends and distributions | | | 578,168 | | | | 9,917,089 | |
| | |
Shares purchased | | | (1,033,668 | ) | | | (17,002,315 | ) |
| | |
Net increase (decrease) in shares outstanding before conversion | | | 192,625 | | | | 3,990,326 | |
| | |
Shares purchased upon conversion into other share class(es) | | | (430,115 | ) | | | (7,103,378 | ) |
| | | |
Net increase (decrease) in shares outstanding | | | (237,490 | ) | | $ | (3,113,052 | ) |
| | |
Class R | | | | | | | | |
| | |
Year ended September 30, 2023: | | | | | | | | |
| | |
Shares sold | | | 212 | | | $ | 3,184 | |
| | |
Shares issued in reinvestment of dividends and distributions | | | 116 | | | | 1,742 | |
| | |
Shares purchased | | | (13,494 | ) | | | (200,300 | ) |
| | |
Net increase (decrease) in shares outstanding | | | (13,166 | ) | | $ | (195,374 | ) |
| | |
Year ended September 30, 2022: | | | | | | | | |
| | |
Shares sold | | | 1,423 | | | $ | 24,791 | |
| | |
Shares issued in reinvestment of dividends and distributions | | | 2,811 | | | | 47,861 | |
| | |
Shares purchased | | | (11,849 | ) | | | (178,008 | ) |
| | |
Net increase (decrease) in shares outstanding | | | (7,615 | ) | | $ | (105,356 | ) |
| | |
Class Z | | | | | | | | |
| | |
Year ended September 30, 2023: | | | | | | | | |
| | |
Shares sold | | | 1,322,403 | | | $ | 20,198,499 | |
| | |
Shares issued in reinvestment of dividends and distributions | | | 166,626 | | | | 2,552,920 | |
| | |
Shares purchased | | | (2,431,784 | ) | | | (36,737,614 | ) |
| | |
Net increase (decrease) in shares outstanding before conversion | | | (942,755 | ) | | | (13,986,195 | ) |
| | |
Shares issued upon conversion from other share class(es) | | | 180,779 | | | | 2,708,195 | |
| | |
Shares purchased upon conversion into other share class(es) | | | (18,908 | ) | | | (290,638 | ) |
| | |
Net increase (decrease) in shares outstanding | | | (780,884 | ) | | $ | (11,568,638 | ) |
| | |
Year ended September 30, 2022: | | | | | | | | |
| | |
Shares sold | | | 1,250,576 | | | $ | 20,216,036 | |
| | |
Shares issued in reinvestment of dividends and distributions | | | 1,054,436 | | | | 18,024,293 | |
| | |
Shares purchased | | | (3,535,098 | ) | | | (58,851,937 | ) |
| | |
Net increase (decrease) in shares outstanding before conversion | | | (1,230,086 | ) | | | (20,611,608 | ) |
| | |
Shares issued upon conversion from other share class(es) | | | 286,888 | | | | 4,914,239 | |
| | |
Shares purchased upon conversion into other share class(es) | | | (19,426 | ) | | | (321,855 | ) |
| | |
Net increase (decrease) in shares outstanding | | | (962,624 | ) | | $ | (16,019,224 | ) |
PGIM Balanced Fund 125
Notes to Financial Statements (continued)
| | | | | | | | |
| | | |
| Share Class | | Shares | | | Amount | |
| | |
Class R6 | | | | | | | | |
| | |
Year ended September 30, 2023: | | | | | | | | |
| | |
Shares sold | | | 1,103,799 | | | $ | 16,811,982 | |
| | |
Shares issued in reinvestment of dividends and distributions | | | 140,654 | | | | 2,158,499 | |
| | |
Shares purchased | | | (1,263,543 | ) | | | (19,184,924 | ) |
| | |
Net increase (decrease) in shares outstanding before conversion | | | (19,090 | ) | | | (214,443 | ) |
| | |
Shares issued upon conversion from other share class(es) | | | 85,274 | | | | 1,302,210 | |
| | |
Shares purchased upon conversion into other share class(es) | | | (673 | ) | | | (10,631 | ) |
| | |
Net increase (decrease) in shares outstanding | | | 65,511 | | | $ | 1,077,136 | |
| | |
Year ended September 30, 2022: | | | | | | | | |
| | |
Shares sold | | | 1,620,521 | | | $ | 27,168,490 | |
| | |
Shares issued in reinvestment of dividends and distributions | | | 621,165 | | | | 10,587,957 | |
| | |
Shares purchased | | | (1,202,626 | ) | | | (19,673,464 | ) |
| | |
Net increase (decrease) in shares outstanding before conversion | | | 1,039,060 | | | | 18,082,983 | |
| | |
Shares issued upon conversion from other share class(es) | | | 60,461 | | | | 1,014,196 | |
| | |
Shares purchased upon conversion into other share class(es) | | | (608 | ) | | | (9,121 | ) |
| | |
Net increase (decrease) in shares outstanding | | | 1,098,913 | | | $ | 19,088,058 | |
The RIC, on behalf of the Fund, along with other affiliated registered investment companies (the “Participating Funds”), is a party to a Syndicated Credit Agreement (“SCA”) with a group of banks. The purpose of the SCA is to provide an alternative source of temporary funding for capital share redemptions. The table below provides details of the SCA.
| | | | |
| | | |
| | | Current SCA | | Prior SCA |
| | |
Term of Commitment | | 9/29/2023 – 9/26/2024 | | 9/30/2022 – 9/28/2023 |
| | |
Total Commitment | | $ 1,200,000,000 | | $ 1,200,000,000 |
| | |
Annualized Commitment Fee on the Unused Portion of the SCA | | 0.15% | | 0.15% |
| | |
Annualized Interest Rate on Borrowings | | 1.00% plus the higher of (1) the effective federal funds rate, (2) the daily SOFR rate plus 0.10% or (3) zero percent | | 1.00% plus the higher of (1) the effective federal funds rate, (2) the daily SOFR rate plus 0.10% or (3) zero percent |
Certain affiliated registered investment companies that are parties to the SCA include portfolios that are subject to a predetermined mathematical formula used to manage certain benefit guarantees offered under variable annuity contracts. The formula may result in large scale asset flows into and out of these portfolios. Consequently, these portfolios may be more likely to utilize the SCA for purposes of funding redemptions. It may be possible for those
126
portfolios to fully exhaust the committed amount of the SCA, thereby requiring the Manager to allocate available funding per a Board-approved methodology designed to treat the Participating Funds in the SCA equitably.
The Fund did not utilize the SCA during the year ended September 30, 2023.
| 9. | Risks of Investing in the Fund |
The Fund’s risks include, but are not limited to, some or all of the risks discussed below. For further information on the Fund’s risks, please refer to the Fund’s Prospectus and Statement of Additional Information.
Asset Allocation Risk: PGIM Quantitative Solutions may allocate assets to an asset class that underperforms other classes. For example, the Fund may be overweight in equities when the stock market is falling and the fixed income market is rising. Likewise, the Fund may be overweight in fixed income securities when fixed income markets are falling and the equity markets are rising. Allocations to underperforming or volatile asset classes or other changes in asset allocations could lead to increased volatility in the Fund’s portfolio.
Blend Style Risk: The Fund’s blend investment style may subject the Fund to risks of both value and growth investing. The portion of the Fund’s portfolio that makes investments pursuant to a growth strategy may be subject to above-average fluctuations as a result of seeking higher than average capital growth. The portion of the Fund’s portfolio that makes investments pursuant to a value strategy may be subject to the risk that the market may not recognize a security’s intrinsic value for long periods of time or at all, or that a stock judged to be undervalued may actually be appropriately priced or overvalued. Issuers of value stocks may have experienced adverse business developments or may be subject to special risks that have caused the stock to be out of favor. If the Fund’s assessment of market conditions or a company’s value is inaccurate, the Fund could suffer losses or produce poor performance relative to other funds. Historically, growth stocks have performed best during later stages of economic expansion and value stocks have performed best during periods of economic recovery. Therefore, both styles may over time go in and out of favor with the markets. At times when a style is out of favor, that portion of the portfolio may lag the other portion of the portfolio, which may cause the Fund to underperform the market in general, its benchmark and other mutual funds. Growth and value stocks have historically produced similar long-term results, though each category has periods when it outperforms the other.
Credit Risk: This is the risk that the issuer, the guarantor or the insurer of a fixed income security, or the counterparty to a contract, may be unable or unwilling to make timely principal and interest payments, or to otherwise honor its obligations. Additionally, fixed income securities could lose value due to a loss of confidence in the ability of the issuer, guarantor, insurer or counterparty to pay back debt. The lower the credit quality of a bond, the more sensitive it is to credit risk.
PGIM Balanced Fund 127
Notes to Financial Statements (continued)
Debt Obligations Risk: Debt obligations are subject to credit risk, market risk and interest rate risk. The Fund’s holdings, share price, yield and total return may also fluctuate in response to bond market movements. The value of bonds may decline for issuer-related reasons, including management performance, financial leverage and reduced demand for the issuer’s goods and services. Certain types of fixed income obligations also may be subject to “call and redemption risk,” which is the risk that the issuer may call a bond held by the Fund for redemption before it matures and the Fund may not be able to reinvest at the same rate of interest and therefore would earn less income.
Derivatives Risk: Derivatives involve special risks and costs and may result in losses to the Fund. The successful use of derivatives requires sophisticated management, and, to the extent that derivatives are used, the Fund will depend on the subadviser’s ability to analyze and manage derivatives transactions. The prices of derivatives may move in unexpected ways, especially in abnormal market conditions. Some derivatives are “leveraged” or may create economic leverage for the Fund. and therefore may magnify or otherwise increase investment losses to the Fund. The Fund’s use of derivatives may also increase the amount of taxes payable by shareholders.
Other risks arise from the potential inability to terminate or sell derivatives positions. A liquid secondary market may not always exist for the Fund’s derivatives positions. In fact, many over-the-counter derivative instruments will not have liquidity beyond the counterparty to the instrument. Over-the-counter derivative instruments also involve the risk that the other party will not meet its obligations to the Fund. The use of derivatives also exposes the Fund to operational issues, such as documentation and settlement issues, systems failures, inadequate control and human error.
Derivatives may also involve legal risks, such as insufficient documentation, the lack of capacity or authority of a counterparty to execute or settle a transaction, and the legality and enforceability of derivatives contracts. The U.S. Government and foreign governments have adopted (and may adopt further) regulations governing derivatives markets, including mandatory clearing of certain derivatives, margin and reporting requirements and risk exposure limitations. Regulation of derivatives may make derivatives more costly, limit their availability or utility to the Fund, or otherwise adversely affect their performance or disrupt markets.
Economic and Market Events Risk: Events in the U.S. and global financial markets, including actions taken by the U.S. Federal Reserve or foreign central banks to stimulate or stabilize economic growth or the functioning of the securities markets, or otherwise reduce inflation, may at times result in unusually high market volatility, which could negatively impact performance. Governmental efforts to curb inflation often have negative effects on
128
the level of economic activity. Relatively reduced liquidity in credit and fixed income markets could adversely affect issuers worldwide.
Equity and Equity-Related Securities Risk: Equity and equity-related securities may be subject to changes in value, and their values may be more volatile than those of other asset classes. In addition to an individual security losing value, the value of the equity markets or a sector in which the Fund invests could go down. Different parts of a market can react differently to adverse issuer, market, regulatory, political and economic developments.
Foreign Securities Risk: Investments in securities of non-U.S. issuers (including those denominated in U.S. dollars) may involve more risk than investing in securities of U.S. issuers. Foreign political, economic and legal systems, especially those in developing and emerging market countries, may be less stable and more volatile than in the United States. Foreign legal systems generally have fewer regulatory requirements than the U.S. legal system, particularly those of emerging markets. In general, less information is publicly available with respect to non-U.S. companies than U.S. companies. Non-U.S. companies generally are not subject to the same accounting, auditing, and financial reporting standards as are U.S. companies. Additionally, the changing value of foreign currencies and changes in exchange rates could also affect the value of the assets the Fund holds and the Fund’s performance. Certain foreign countries may impose restrictions on the ability of issuers of foreign securities to make payment of principal and interest or dividends to investors located outside the country, due to blockage of foreign currency exchanges or otherwise. Investments in emerging markets are subject to greater volatility and price declines.
In addition, the Fund’s investments in non-U.S. securities may be subject to the risks of nationalization or expropriation of assets, imposition of currency exchange controls or restrictions on the repatriation of non-U.S. currency, confiscatory taxation and adverse diplomatic developments. Special U.S. tax considerations may apply.
Increase in Expenses Risk: Your actual cost of investing in the Fund may be higher than the expenses shown in the expense table in the Fund’s prospectus for a variety of reasons. For example, expense ratios may be higher than those shown if average net assets decrease. Net assets are more likely to decrease and Fund expense ratios are more likely to increase when markets are volatile. Active and frequent trading of Fund securities can increase expenses.
Interest Rate Risk: The value of your investment may go down when interest rates rise. A rise in rates tends to have a greater impact on the prices of longer term or duration debt securities. Similarly, a rise in interest rates may also have a greater negative impact on the value of equity securities whose issuers expect earnings further out in the future. For example, a fixed income security with a duration of three years is expected to decrease in value by approximately 3% if interest rates increase by 1%. This is referred to as “duration risk.” When interest rates fall, the issuers of debt obligations may prepay principal more quickly than expected, and the Fund may be required to reinvest the proceeds at a lower interest rate. This is referred to as “prepayment risk.” When interest rates rise, debt
PGIM Balanced Fund 129
Notes to Financial Statements (continued)
obligations may be repaid more slowly than expected, and the value of the Fund’s holdings may fall sharply. This is referred to as “extension risk.” The Fund may lose money if short-term or long-term interest rates rise sharply or in a manner not anticipated by the subadviser.
Large Shareholder and Large Scale Redemption Risk: Certain individuals, accounts, funds (including funds affiliated with the Manager) or institutions, including the Manager and its affiliates, may from time to time own or control a substantial amount of the Fund’s shares. There is no requirement that these entities maintain their investment in the Fund. There is a risk that such large shareholders or that the Fund’s shareholders generally may redeem all or a substantial portion of their investments in the Fund in a short period of time, which could have a significant negative impact on the Fund’s NAV, liquidity, and brokerage costs. Large redemptions could also result in tax consequences to shareholders and impact the Fund’s ability to implement its investment strategy. The Fund’s ability to pursue its investment objective after one or more large scale redemptions may be impaired and, as a result, the Fund may invest a larger portion of its assets in cash or cash equivalents.
Management Risk: Actively managed mutual funds are subject to management risk. The subadviser will apply investment techniques and risk analyses in making investment decisions for the Fund, but there can be no guarantee that these techniques will produce the desired results. Additionally, the investments selected by the subadviser may underperform the markets in general, the Fund’s benchmark and other mutual funds with similar investment objectives.
Market Disruption and Geopolitical Risks: Market disruption can be caused by economic, financial or political events and factors, including but not limited to, international wars or conflicts (including Russia’s military invasion of Ukraine), geopolitical developments (including trading and tariff arrangements, sanctions and cybersecurity attacks), instability in regions such as Asia, Eastern Europe and the Middle East, terrorism, natural disasters and public health epidemics (including the outbreak of COVID-19 globally).
The extent and duration of such events and resulting market disruptions cannot be predicted, but could be substantial and could magnify the impact of other risks to the Fund. These and other similar events could adversely affect the U.S. and foreign financial markets and lead to increased market volatility, reduced liquidity in the securities markets, significant negative impacts on issuers and the markets for certain securities and commodities and/or government intervention. They may also cause short- or long-term economic uncertainties in the United States and worldwide. As a result, whether or not the Fund invests in securities of issuers located in or with significant exposure to the countries directly affected, the value and liquidity of the Fund’s investments may be negatively impacted. Further, due to closures of certain markets and restrictions on trading certain securities, the value of certain
130
securities held by the Fund could be significantly impacted, which could lead to such securities being valued at zero.
Market Risk: Securities markets may be volatile and the market prices of the Fund’s securities may decline. Securities fluctuate in price based on changes in an issuer’s financial condition and overall market and economic conditions. If the market prices of the securities owned by the Fund fall, the value of your investment in the Fund will decline.
Model Design Risk: The subadviser uses certain quantitative models to help guide its investment decisions. The design of the underlying models may be flawed or incomplete. The investment models the subadviser uses are based on historical and theoretical underpinnings that it believes are sound. There can be no guarantee, however, that these underpinnings will correlate with security price behavior in the manner assumed by the subadviser’s models. Additionally, the quantitative techniques that underlie the subadviser’s portfolio construction processes may fail to fully anticipate important risks.
Model Implementation Risk: While the subadviser strives to mitigate the likelihood of material implementation errors, it is impossible to completely eliminate the risk of error in the implementation of the computer models that guide the subadviser’s quantitative investment processes. Additionally, it may be difficult to implement model recommendations in volatile and rapidly changing market conditions.
Money Market Instruments Risk: The value of money market instruments may be affected by changing interest rates and by changes in the credit ratings of those instruments. If a significant amount of the Fund’s assets are invested in money market instruments, it will be more difficult for the Fund to achieve its investment objective.
Mortgage-Backed and Asset-Backed Securities Risk: Mortgage-backed and asset-backed securities tend to increase in value less than other debt securities when interest rates decline, but are subject to similar risk of decline in market value during periods of rising interest rates. The values of mortgage-backed and asset-backed securities become more volatile as interest rates rise. In a period of declining interest rates, the Fund may be required to reinvest more frequent prepayments on mortgage-backed and asset-backed securities in lower-yielding investments.
Portfolio Turnover Risk: The length of time the Fund has held a particular security is not generally a consideration in investment decisions. Under certain market conditions, the Fund’s turnover rate may be higher than that of other mutual funds. Portfolio turnover generally involves some expense to the Fund, including brokerage commissions or dealer mark-ups and other transaction costs on the sale of securities and reinvestment in other securities. These transactions may result in realization of taxable capital gains. The trading costs and tax effects associated with portfolio turnover may adversely affect the Fund’s investment performance.
PGIM Balanced Fund 131
Notes to Financial Statements (continued)
Small Company Risk: Small company stocks present above-average risks in comparison to larger companies. Small companies usually offer a smaller range of products and services than larger companies. Smaller companies may also have limited financial resources and may lack management expertise. As a result, stocks issued by smaller companies may be comparatively less liquid and fluctuate in value more than the stocks of larger, more established companies. In addition, it is more difficult to get information on smaller companies, which tend to be less well known, have shorter operating histories, do not have significant ownership by large investors and are followed by relatively few securities analysts.
U.S. Government and Agency Securities Risk: U.S. Treasury obligations are backed by the “full faith and credit” of the U.S. Government. Securities issued or guaranteed by federal agencies or authorities and U.S. Government-sponsored instrumentalities or enterprises may or may not be backed by the full faith and credit of the U.S. Government. For example, securities issued by the Federal Home Loan Mortgage Corporation, the Federal National Mortgage Association and the Federal Home Loan Banks are neither insured nor guaranteed by the U.S. Government. These securities may be supported by the ability to borrow from the U.S. Treasury or only by the credit of the issuing agency, authority, instrumentality or enterprise and, as a result, are subject to greater credit risk than securities issued or guaranteed by the U.S. Treasury. Further, the U.S. Government and its agencies, authorities, instrumentalities and enterprises do not guarantee the market value of their securities; consequently, the value of such securities will fluctuate. This may be the case especially when there is any controversy or ongoing uncertainty regarding the status of negotiations in the U.S. Congress to increase the statutory debt ceiling. Such controversy or uncertainty could, among other things, result in the credit quality rating of the U.S. Government being downgraded and reduced prices of U.S. Treasury securities. If the U.S. Congress is unable to negotiate an adjustment to the statutory debt ceiling, there is also the risk that the U.S. Government may default on payments on certain U.S. Government securities, including those held by the Fund, which could have a negative impact on the Fund. An increase in demand for U.S. Government securities resulting from an increase in demand for government money market funds may lead to lower yields on such securities.
| 10. | Recent Regulatory Developments |
Effective January 24, 2023, the SEC adopted rule and form amendments to require mutual funds and ETFs to transmit concise and visually engaging streamlined annual and semiannual reports to shareholders that highlight key information deemed important for retail investors to assess and monitor their fund investments (the “Rule”). Other information, including financial statements, will no longer appear in the funds’ streamlined shareholder reports but must be available online, delivered free of charge upon request, and filed on a
132
semiannual basis on Form N-CSR. The Rule and form amendments have a compliance date of July 24, 2024. At this time, management is evaluating the Rule and its impact to the Fund.
PGIM Balanced Fund 133
Report of Independent Registered Public Accounting Firm
To the Board of Directors of The Prudential Investment Portfolios, Inc. and Shareholders of PGIM Balanced Fund
Opinion on the Financial Statements
We have audited the accompanying statement of assets and liabilities, including the schedule of investments, of PGIM Balanced Fund (one of the funds constituting The Prudential Investment Portfolios, Inc., referred to hereafter as the “Fund”) as of September 30, 2023, the related statement of operations for the year ended September 30, 2023, the statements of changes in net assets for each of the two years in the period ended September 30, 2023, including the related notes, and the financial highlights for each of the four years in the period ended September 30, 2023 (collectively referred to as the “financial statements”). In our opinion, the financial statements present fairly, in all material respects, the financial position of the Fund as of September 30, 2023, the results of its operations for the year then ended, the changes in its net assets for each of the two years in the period ended September 30, 2023 and the financial highlights for each of the four years in the period ended September 30, 2023 in conformity with accounting principles generally accepted in the United States of America.
The financial statements of the Fund as of and for the year ended September 30, 2019 and the financial highlights for each of the periods ended on or prior to September 30, 2019 (not presented herein, other than the financial highlights) were audited by other auditors whose report dated November 15, 2019 expressed an unqualified opinion on those financial statements and financial highlights.
Basis for Opinion
These financial statements are the responsibility of the Fund’s management. Our responsibility is to express an opinion on the Fund’s financial statements based on our audits. We are a public accounting firm registered with the Public Company Accounting Oversight Board (United States) (PCAOB) and are required to be independent with respect to the Fund in accordance with the U.S. federal securities laws and the applicable rules and regulations of the Securities and Exchange Commission and the PCAOB.
We conducted our audits of these financial statements in accordance with the standards of the PCAOB. Those standards require that we plan and perform the audit to obtain reasonable assurance about whether the financial statements are free of material misstatement, whether due to error or fraud.
Our audits included performing procedures to assess the risks of material misstatement of the financial statements, whether due to error or fraud, and performing procedures that respond to those risks. Such procedures included examining, on a test basis, evidence regarding the amounts and disclosures in the financial statements. Our audits also included evaluating the accounting principles used and significant estimates made by management, as well as evaluating the overall presentation of the financial statements. Our procedures included confirmation of securities owned as of September 30, 2023 by correspondence with the custodian, transfer agent and brokers; when replies were not received from brokers, we performed other auditing procedures. We believe that our audits provide a reasonable basis for our opinion.
/s/PricewaterhouseCoopers LLP
New York, New York
November 16, 2023
We have served as the auditor of one or more investment companies in the PGIM Retail Funds complex since 2020.
134
Tax Information (unaudited)
For the year ended September 30, 2023, the Fund reports the maximum amount allowable under Section 854 of the Internal Revenue Code, but not less than, the following percentages of the ordinary income distributions paid as: 1) qualified dividend income in accordance with Section 854 of the Internal Revenue Code (QDI); 2) eligible for the corporate dividends received deduction in accordance with Section 854 of the Internal Revenue Code (DRD); 3) interest-related dividends in accordance with Section 871(k)(1) and 881(e)(1) of the Internal Revenue Code (IRD); and 4) interest dividends that are eligible to be treated as interest income in accordance with Section 163(j):
| | | | | | | | |
| | | | | |
| Fund | | QDI | | DRD | | IRD | | 163(j) |
| | | | |
PGIM Balanced Fund | | 52.72% | | 33.80% | | 39.09% | | 54.51% |
In January 2024, you will be advised on IRS Form 1099-DIV or substitute 1099-DIV, as to the federal tax status of distributions received by you in calendar year 2023.
We are required by Massachusetts, Missouri and Oregon to inform you that dividends which have been derived from interest on federal obligations are not taxable to shareholders provided the Fund meets certain requirements mandated by the respective state’s taxing authorities. We are pleased to report that 3.18% of the dividends paid by the Fund qualify for such deduction.
For more detailed information regarding your state and local taxes, you should contact your tax advisor or the state/local taxing authorities.
PGIM Balanced Fund 135
INFORMATION ABOUT BOARD MEMBERS AND OFFICERS (unaudited)
Information about Board Members and Officers of the Fund is set forth below. Board Members who are not deemed to be “interested persons” of the Fund, as defined in the 1940 Act, are referred to as “Independent Board Members.” Board Members who are deemed to be “interested persons” of the Fund are referred to as “Interested Board Members.” The Board Members are responsible for the overall supervision of the operations of the Fund and perform the various duties imposed on the directors of investment companies by the 1940 Act. The Board in turn elects the Officers, who are responsible for administering the day-to-day operations of the Fund.
| | | | | | |
| | |
| Independent Board Members | | |
| | | | |
Name Year of Birth Position(s) Portfolios Overseen | | Principal Occupation(s) During Past Five Years | | Other Directorships Held During Past Five Years | | Length of Board Service |
| | | | |
Ellen S. Alberding 1958 Board Member Portfolios Overseen: 97 | | Chief Executive Officer (“CEO”) and President, The Joyce Foundation (charitable foundation) (since 2002); formerly Vice Chair, City Colleges of Chicago (community college system) (2011-2015); formerly Trustee, National Park Foundation (charitable foundation for national park system) (2009-2018); formerly Trustee, Economic Club of Chicago (2009-2016); Trustee, Loyola University (since 2018). | | None. | | Since September 2013 |
| | | | |
Kevin J. Bannon 1952 Board Member Portfolios Overseen: 98 | | Retired; formerly Managing Director (April 2008-May 2015) and Chief Investment Officer (October 2008-November 2013) of Highmount Capital LLC (registered investment adviser); formerly Executive Vice President and Chief Investment Officer (April 1993-August 2007) of Bank of New York Company; formerly President (May 2003-May 2007) of BNY Hamilton Family of Mutual Funds. | | Director of Urstadt Biddle Properties (equity real estate investment trust) (since September 2008). | | Since July 2008 |
PGIM Balanced Fund
| | | | | | |
| | |
| Independent Board Members | | |
| | | | |
Name Year of Birth Position(s) Portfolios Overseen | | Principal Occupation(s) During Past Five Years | | Other Directorships Held During Past Five Years | | Length of Board Service |
| | | | |
Linda W. Bynoe 1952 Board Member Portfolios Overseen: 95 | | President and Chief Executive Officer (since March 1995) and formerly Chief Operating Officer (December 1989-February 1995) of Telemat Limited LLC (formerly Telemat Ltd) (management consulting); formerly Vice President (January 1985-June 1989) at Morgan Stanley & Co. (broker-dealer). | | Trustee of Equity Residential (residential real estate) (since December 2009); Director of Northern Trust Corporation (financial services) (since April 2006); formerly Director of Anixter International, Inc. (communication products distributor) (January 2006-June 2020). | | Since March 2005 |
| | | | |
Barry H. Evans 1960 Board Member Portfolios Overseen: 98 | | Retired; formerly President (2005-2016), Global Chief Operating Officer (2014-2016), Chief Investment Officer - Global Head of Fixed Income (1998-2014), and various portfolio manager roles (1986-2006), Manulife Asset Management (asset management). | | Formerly Director, Manulife Trust Company (2011-2018); formerly Director, Manulife Asset Management Limited (2015-2017); formerly Chairman of the Board of Directors of Manulife Asset Management U.S. (2005-2016); formerly Chairman of the Board, Declaration Investment Management and Research (2008-2016). | | Since September 2017 |
| | | | |
Keith F. Hartstein 1956 Board Member & Independent Chair Portfolios Overseen: 98 | | Retired; formerly Member (November 2014-September 2022) of the Governing Council of the Independent Directors Council (IDC) (organization of independent mutual fund directors); formerly Executive Committee of the IDC Board of Governors (October 2019-December 2021); formerly President and Chief Executive Officer (2005-2012), Senior Vice President (2004-2005), Senior Vice President of Sales and Marketing (1997-2004), and various executive management positions (1990-1997), John Hancock Funds, LLC (asset management); formerly Chairman, Investment Company Institute’s Sales Force Marketing Committee (2003-2008). | | None. | | Since September 2013 |
Visit our website at pgim.com/investments
| | | | | | |
| | |
| Independent Board Members | | |
| | | | |
Name Year of Birth Position(s) Portfolios Overseen | | Principal Occupation(s) During Past Five Years | | Other Directorships Held During Past Five Years | | Length of Board Service |
| | | | |
Laurie Simon Hodrick 1962 Board Member Portfolios Overseen: 95 | | A. Barton Hepburn Professor Emerita of Economics in the Faculty of Business, Columbia Business School (since 2018); Visiting Fellow at the Hoover Institution, Stanford University (since 2015); Sole Member, ReidCourt LLC (since 2008) (a consulting firm); formerly Visiting Professor of Law, Stanford Law School (2015-2021); formerly A. Barton Hepburn Professor of Economics in the Faculty of Business, Columbia Business School (1996-2017); formerly Managing Director, Global Head of Alternative Investment Strategies, Deutsche Bank (2006-2008). | | Independent Director, Andela (since January 2022) (global talent network); Independent Director, Roku (since December 2020) (communication services); formerly Independent Director, Synnex Corporation (2019-2021) (information technology); formerly Independent Director, Kabbage, Inc. (2018-2020) (financial services); formerly Independent Director, Corporate Capital Trust (2017-2018) (a business development company). | | Since September 2017 |
| | | | |
Brian K. Reid 1961 Board Member Portfolios Overseen: 98 | | Retired; formerly Chief Economist for the Investment Company Institute (ICI) (2005-2017); formerly Senior Economist and Director of Industry and Financial Analysis at the ICI (1998-2004); formerly Senior Economist, Industry and Financial Analysis at the ICI (1996-1998); formerly Staff Economist at the Federal Reserve Board (1989-1996); formerly Director, ICI Mutual Insurance Company (2012-2017). | | None. | | Since March 2018 |
PGIM Balanced Fund
| | | | | | |
| | |
| Independent Board Members | | |
| | | | |
Name Year of Birth Position(s) Portfolios Overseen | | Principal Occupation(s) During Past Five Years | | Other Directorships Held During Past Five Years | | Length of Board Service |
| | | | |
Grace C. Torres 1959 Board Member Portfolios Overseen: 98 | | Retired; formerly Treasurer and Principal Financial and Accounting Officer of the PGIM Funds, Target Funds, Advanced Series Trust, Prudential Variable Contract Accounts and The Prudential Series Fund (1998-June 2014); Assistant Treasurer (March 1999-June 2014) and Senior Vice President (September 1999-June 2014) of PGIM Investments LLC; Assistant Treasurer (May 2003-June 2014) and Vice President (June 2005-June 2014) of AST Investment Services, Inc.; Senior Vice President and Assistant Treasurer (May 2003-June 2014) of Prudential Annuities Advisory Services, Inc. | | Director (since January 2018) of OceanFirst Financial Corp. and OceanFirst Bank; formerly Director (July 2015-January 2018) of Sun Bancorp, Inc. N.A. and Sun National Bank. | | Since November 2014 |
Visit our website at pgim.com/investments
| | | | | | |
| | |
| Interested Board Members | | |
| | | | |
Name Year of Birth Position(s) Portfolios Overseen | | Principal Occupation(s) During Past Five Years | | Other Directorships Held During Past Five Years | | Length of Board Service |
| | | | |
Stuart S. Parker 1962 Board Member & President Portfolios Overseen: 98 | | President, Chief Executive Officer, Chief Operating Officer and Officer in Charge of PGIM Investments LLC (formerly known as Prudential Investments LLC) (since January 2012); President and Principal Executive Officer (“PEO”) (since September 2022) of the PGIM Private Credit Fund; President and PEO (since March 2022) of the PGIM Private Real Estate Fund, Inc.; formerly Executive Vice President of Jennison Associates LLC and Head of Retail Distribution of PGIM Investments LLC (June 2005-December 2011); Investment Company Institute - Board of Governors (since May 2012). | | None. | | Since January 2012 |
| | | | |
Scott E. Benjamin 1973 Board Member & Vice President Portfolios Overseen: 98 | | Executive Vice President (since May 2009) of PGIM Investments LLC; Vice President (since June 2012) of Prudential Investment Management Services LLC; Executive Vice President (since September 2009) of AST Investment Services, Inc.; Senior Vice President of Product Development and Marketing, PGIM Investments (since February 2006); Vice President (since September 2022) of the PGIM Private Credit Fund; Vice President (since March 2022) of the PGIM Private Real Estate Fund, Inc.; formerly Vice President of Product Development and Product Management, PGIM Investments LLC (2003-2006). | | None. | | Since March 2010 |
PGIM Balanced Fund
| | | | |
| | | |
| Fund Officers(a) | | | | |
| | | |
Name Year of Birth Fund Position | | Principal Occupation(s) During Past Five Years | | Length of Service as Fund Officer |
| | | |
Claudia DiGiacomo 1974 Chief Legal Officer | | Chief Legal Officer (since September 2022) of the PGIM Private Credit Fund; Chief Legal Officer (since July 2022) of the PGIM Private Real Estate Fund, Inc.; Chief Legal Officer, Executive Vice President and Secretary of PGIM Investments LLC (since August 2020); Chief Legal Officer of Prudential Mutual Fund Services LLC (since August 2020); Chief Legal Officer of PIFM Holdco, LLC (since August 2020); Vice President and Corporate Counsel (since January 2005) of Prudential; and Corporate Counsel of AST Investment Services, Inc. (since August 2020); formerly Vice President and Assistant Secretary of PGIM Investments LLC (2005-2020); formerly Associate at Sidley Austin Brown & Wood LLP (1999-2004). | | Since December 2005 |
| | | |
Andrew Donohue 1972 Chief Compliance Officer | | Chief Compliance Officer (since May 2023) of the PGIM Funds, Target Funds, PGIM ETF Trust, PGIM Global High Yield Fund, Inc., PGIM High Yield Bond Fund, Inc., PGIM Short Duration High Yield Opportunities Fund, Advanced Series Trust, The Prudential Series Fund, Prudential’s Gibraltar Fund, Inc., PGIM Private Credit Fund, PGIM Private Real Estate Fund, Inc.; Chief Compliance Officer of AST Investment Services, Inc. (since October 2022); Vice President, Chief Compliance Officer of PGIM Investments LLC (since September 2022); formerly various senior compliance roles within Principal Global Investors, LLC., global asset management for Principal Financial (2011-2022), most recently as Global Chief Compliance Officer (2016-2022). | | Since May 2023 |
| | | |
Andrew R. French 1962 Secretary | | Vice President (since December 2018) of PGIM Investments LLC; Secretary (since September 2022) of the PGIM Private Credit Fund; Secretary (since March 2022) of the PGIM Private Real Estate Fund, Inc.; formerly Vice President and Corporate Counsel (2010-2018) of Prudential; formerly Director and Corporate Counsel (2006-2010) of Prudential; Vice President and Assistant Secretary (since January 2007) of PGIM Investments LLC; Vice President and Assistant Secretary (since January 2007) of Prudential Mutual Fund Services LLC. | | Since October 2006 |
| | | |
Melissa Gonzalez 1980 Assistant Secretary | | Vice President and Corporate Counsel (since September 2018) of Prudential; Vice President and Assistant Secretary (since August 2020) of PGIM Investments LLC; Assistant Secretary (since September 2022) of the PGIM Private Credit Fund; Assistant Secretary (since March 2022) of the PGIM Private Real Estate Fund, Inc.; formerly Director and Corporate Counsel (March 2014-September 2018) of Prudential. | | Since March 2020 |
Visit our website at pgim.com/investments
| | | | |
| | | |
| Fund Officers(a) | | | | |
| | | |
Name Year of Birth Fund Position | | Principal Occupation(s) During Past Five Years | | Length of Service as Fund Officer |
| | | |
Patrick E. McGuinness 1986 Assistant Secretary | | Vice President and Assistant Secretary (since August 2020) of PGIM Investments LLC; Director and Corporate Counsel (since February 2017) of Prudential; Assistant Secretary (since September 2022) of the PGIM Private Credit Fund; Assistant Secretary (since March 2022) of the PGIM Private Real Estate Fund, Inc. | | Since June 2020 |
| | | |
Debra Rubano 1975 Assistant Secretary | | Vice President and Corporate Counsel (since November 2020) of Prudential; Assistant Secretary (since September 2022) of the PGIM Private Credit Fund; Assistant Secretary (since March 2022) of the PGIM Private Real Estate Fund, Inc; formerly Director and Senior Counsel of Allianz Global Investors U.S. Holdings LLC (2010-2020) and Assistant Secretary of numerous funds in the Allianz fund complex (2015-2020). | | Since December 2020 |
| | | |
Kelly A. Coyne 1968 Assistant Secretary | | Director, Investment Operations of Prudential Mutual Fund Services LLC (since 2010); Assistant Secretary (since September 2022) of the PGIM Private Credit Fund; Assistant Secretary (since March 2022) of the PGIM Private Real Estate Fund, Inc. | | Since March 2015 |
| | | |
Christian J. Kelly 1975 Chief Financial Officer | | Vice President, Global Head of Fund Administration of PGIM Investments LLC (since November 2018); Chief Financial Officer (since March 2023) of PGIM Investments mutual funds, closed end funds and ETFs, Advanced Series Trust Portfolios, Prudential Series Funds and Prudential Gibraltar Fund; Chief Financial Officer of PGIM Private Credit Fund (since September 2022); Chief Financial Officer of PGIM Private Real Estate Fund, Inc. (since July 2022); formerly Treasurer and Principal Financial Officer (January 2019- March 2023) of PGIM Investments mutual funds, closed end funds and ETFs, Advanced Series Trust Portfolios, Prudential Series Funds and Prudential Gibraltar Fund; formerly Treasurer and Principal Financial Officer (March 2022 – July 2022) of the PGIM Private Real Estate Fund, Inc.; formerly Director of Fund Administration of Lord Abbett & Co. LLC (2009-2018), Treasurer and Principal Accounting Officer of the Lord Abbett Family of Funds (2017-2018); Director of Accounting, Avenue Capital Group (2008-2009); Senior Manager, Investment Management Practice of Deloitte & Touche LLP (1998-2007). | | Since January 2019 |
PGIM Balanced Fund
| | | | |
| | | |
| Fund Officers(a) | | | | |
| | | |
Name Year of Birth Fund Position | | Principal Occupation(s) During Past Five Years | | Length of Service as Fund Officer |
| | | |
Russ Shupak 1973 Treasurer and Principal Accounting Officer | | Vice President (since 2017) within PGIM Investments Fund Administration; Treasurer and Principal Accounting Officer of PGIM Investments mutual funds, closed end funds and ETFs (since March 2023); Treasurer and Principal Accounting Officer (since July 2022) of the PGIM Private Real Estate Fund, Inc.; Assistant Treasurer (since September 2022) of the PGIM Private Credit Fund; formerly Assistant Treasurer (March 2022 – July 2022) of the PGIM Private Real Estate Fund, Inc.; Assistant Treasurer of Advanced Series Trust Portfolios, Prudential Series Funds and Prudential Gibraltar Fund (since October 2019); formerly Director (2013-2017) within PGIM Investments Fund Administration. | | Since October 2019 |
| | | |
Lana Lomuti 1967 Assistant Treasurer | | Vice President (since 2007) within PGIM Investments Fund Administration; formerly Assistant Treasurer (December 2007-February 2014) of The Greater China Fund, Inc.; formerly Director (2005-2007) within PGIM Investments Fund Administration. | | Since April 2014 |
| | | |
Deborah Conway 1969 Assistant Treasurer | | Vice President (since 2017) within PGIM Investments Fund Administration; Assistant Treasurer (since September 2022) of the PGIM Private Credit Fund; Assistant Treasurer (since March 2022) of the PGIM Private Real Estate Fund, Inc.; formerly Director (2007-2017) within PGIM Investments Fund Administration. | | Since October 2019 |
| | | |
Elyse M. McLaughlin 1974 Assistant Treasurer | | Vice President (since 2017) within PGIM Investments Fund Administration; Treasurer and Principal Accounting Officer of the Advanced Series Trust, the Prudential Series Fund and the Prudential Gibraltar Fund (since March 2023); Treasurer and Principal Accounting Officer (since September 2022) of the PGIM Private Credit Fund; Assistant Treasurer (since March 2022) of the PGIM Private Real Estate Fund, Inc.; Assistant Treasurer of PGIM Investments mutual funds, closed end funds and ETFs (since October 2019); formerly Director (2011-2017) within PGIM Investments Fund Administration. | | Since October 2019 |
| | | |
Robert W. McCormack 1973 Assistant Treasurer | | Vice President (since 2019) within PGIM Investments Fund Administration; Assistant Treasurer (since March 2023) of PGIM Investments mutual funds, closed end funds, ETFs, Advanced Series Trust Portfolios, Prudential Series Funds and Prudential Gibraltar Fund; Assistant Treasurer (since September 2022) of the PGIM Private Credit Fund; Assistant Treasurer (since March 2022) of the PGIM Private Real Estate Fund, Inc.; formerly Director (2016-2019) within PGIM Investments Fund Administration; formerly Vice President within Goldman, Sachs & Co. Investment Management Controllers (2008- 2016), Assistant Treasurer of Goldman Sachs Family of Funds (2015-2016). | | Since March 2023 |
Visit our website at pgim.com/investments
| | | | |
| | | |
Fund Officers(a) | | | | |
| | | |
Name Year of Birth Fund Position | | Principal Occupation(s) During Past Five Years | | Length of Service as Fund Officer |
| | | |
Kelly Florio 1978 Anti-Money Laundering Compliance Officer | | Vice President, Corporate Compliance, Global Compliance Programs and Compliance Risk Management (since December 2021) of Prudential; formerly Head of Fraud Risk Management (October 2019 to December 2021) at New York Life Insurance Company; formerly Head of Key Risk Area Operations (November 2018 to October 2019), Director of the US Anti-Money Laundering Compliance Unit (2009-2018) and Bank Loss Prevention Associate (2006 -2009) at MetLife. | | Since June 2022 |
| (a) | Excludes Mr. Parker and Mr. Benjamin, interested Board Members who also serve as President and Vice President, respectively. |
Explanatory Notes to Tables:
| ∎ | Board Members are deemed to be “Interested,” as defined in the 1940 Act, by reason of their affiliation with PGIM Investments LLC and/or an affiliate of PGIM Investments LLC. |
| ∎ | Unless otherwise noted, the address of all Board Members and Officers is c/o PGIM Investments LLC, 655 Broad Street, Newark, New Jersey 07102-4410. |
| ∎ | There is no set term of office for Board Members or Officers. The Board Members have adopted a retirement policy, which calls for the retirement of Board Members on December 31 of the year in which they reach the age of 75. |
| ∎ | “Other Directorships Held” includes all directorships of companies required to register or file reports with the SEC under the 1934 Act (that is, “public companies”) or other investment companies registered under the 1940 Act. |
| ∎ | “Portfolios Overseen” includes such applicable investment companies managed by PGIM Investments LLC and overseen by the Board Member. The investment companies for which PGIM Investments LLC serves as manager include the PGIM Mutual Funds, Target Funds, PGIM ETF Trust, PGIM Private Real Estate Fund, Inc., PGIM Private Credit Fund, PGIM High Yield Bond Fund, Inc., PGIM Global High Yield Fund, Inc., PGIM Short Duration High Yield Opportunities Fund, The Prudential Series Fund, Prudential’s Gibraltar Fund, Inc. and the Advanced Series Trust. |
| ∎ | As used in the Fund Officers table “Prudential” means The Prudential Insurance Company of America. |
PGIM Balanced Fund
Approval of Advisory Agreements
The Fund’s Board of Directors
The Board of Directors (the “Board”) of PGIM Balanced Fund (the “Fund”)1 consists of ten individuals, eight of whom are not “interested persons” of the Fund, as defined in the Investment Company Act of 1940, as amended (the “1940 Act”) (the “Independent Directors”). The Board is responsible for the oversight of the Fund and its operations, and performs the various duties imposed on the directors of investment companies by the 1940 Act. The Independent Directors have retained independent legal counsel to assist them in connection with their duties. The Chair of the Board is an Independent Director. The Board has established five standing committees: the Audit Committee, the Nominating and Governance Committee, the Compliance Committee and two Investment Committees. Each committee is chaired by, and composed of, Independent Directors.
Annual Approval of the Fund’s Advisory Agreements
As required under the 1940 Act, the Board determines annually whether to renew the Fund’s management agreement with PGIM Investments LLC (“PGIM Investments”) and the Fund’s subadvisory agreements with PGIM Quantitative Solutions LLC (“PGIM Quantitative Solutions”), PGIM Limited (“PGIML”) and PGIM, Inc. (“PGIM”) on behalf of its PGIM Fixed Income unit (“PGIM Fixed Income”). In considering the renewal of the agreements, the Board, including all of the Independent Directors, met on May 25 and June 6-8, 2023 (the “Board Meeting”) and approved the renewal of the agreements through July 31, 2024, after concluding that the renewal of the agreements was in the best interests of the Fund and its shareholders.
In advance of the meetings, the Board requested and received materials relating to the agreements, and had the opportunity to ask questions and request further information in connection with its consideration. Among other things, the Board considered comparative fee information from PGIM Investments, PGIM Quantitative Solutions, PGIML and PGIM Fixed Income. Also, the Board considered comparisons with other mutual funds in relevant Peer Universes and Peer Groups, as is further discussed below.
In approving the agreements, the Board, including the Independent Directors advised by independent legal counsel, considered the factors it deemed relevant, including the nature, quality and extent of services provided by PGIM Investments and the subadvisers, the performance of the Fund, the profitability of PGIM Investments and its affiliates, expenses and fees, and the potential for economies of scale that may be shared with the Fund and its shareholders as the Fund’s assets grow. In their deliberations, the Directors did not identify any single factor which alone was responsible for the Board’s decision to approve the agreements with respect to the Fund. In connection with its deliberations, the Board considered information provided by PGIM Investments throughout the year at regular Board meetings, presentations from
1 PGIM Balanced Fund is a series of The Prudential Investment Portfolios, Inc.
PGIM Balanced Fund
Approval of Advisory Agreements (continued)
portfolio managers and other information, as well as information furnished at or in advance of the Board Meeting.
The Directors determined that the overall arrangements between the Fund and PGIM Investments, which serves as the Fund’s investment manager pursuant to a management agreement, and between PGIM Investments and each of PGIM Quantitative Solutions, PGIML and PGIM Fixed Income, which serve as the Fund’s subadvisers pursuant to the terms of subadvisory agreements with PGIM Investments, are in the best interests of the Fund and its shareholders in light of the services performed, fees charged and such other matters as the Directors considered relevant in the exercise of their business judgment.
The material factors and conclusions that formed the basis for the Directors’ reaching their determinations to approve the continuance of the agreements are separately discussed below.
Nature, Quality and Extent of Services
The Board received and considered information regarding the nature, quality and extent of services provided to the Fund by PGIM Investments, PGIM Quantitative Solutions, PGIML and PGIM Fixed Income. The Board noted that PGIM Quantitative Solutions, PGIML and PGIM Fixed Income are affiliated with PGIM Investments. The Board considered the services provided by PGIM Investments, including but not limited to the oversight of the subadvisers for the Fund, as well as the provision of fund recordkeeping, compliance and other services to the Fund, and PGIM Investments’ role as administrator for the Fund’s liquidity risk management program. With respect to PGIM Investments’ oversight of the subadvisers, the Board noted that PGIM Investments’ Strategic Investment Research Group (“SIRG”), which is a business unit of PGIM Investments, is responsible for monitoring and reporting to PGIM Investments senior management on the performance and operations of the subadvisers. The Board also considered that PGIM Investments pays the salaries of all of the officers and interested Directors of the Fund who are part of Fund management. The Board also considered the investment subadvisory services provided by PGIM Quantitative Solutions, PGIML and PGIM Fixed Income, including investment research and security selection, as well as adherence to the Fund’s investment restrictions and compliance with applicable Fund policies and procedures. The Board considered PGIM Investments’ evaluation of the subadvisers, as well as PGIM Investments’ recommendation, based on its review of the subadvisers, to renew the subadvisory agreements.
The Board considered the qualifications, backgrounds and responsibilities of PGIM Investments’ senior management responsible for the oversight of the Fund, PGIM Quantitative Solutions, PGIML and PGIM Fixed Income, and also considered the qualifications, backgrounds and responsibilities of the PGIM Quantitative Solutions, PGIML and PGIM Fixed Income portfolio managers who are responsible for the day-to-day management of the Fund’s portfolio. The Board was provided with
Visit our website at pgim.com/investments
information pertaining to PGIM Investments’, PGIM Quantitative Solutions’, PGIML’s and PGIM Fixed Income’s organizational structures, senior management, investment operations, and other relevant information pertaining to PGIM Investments, PGIM Quantitative Solutions, PGIML and PGIM Fixed Income. The Board also noted that it received favorable compliance reports from the Fund’s Chief Compliance Officer (“CCO”) as to each of PGIM Investments, PGIM Quantitative Solutions, PGIML and PGIM Fixed Income.
The Board concluded that it was satisfied with the nature, extent and quality of the investment management services provided by PGIM Investments and the subadvisory services provided to the Fund by each of PGIM Quantitative Solutions, PGIML and PGIM Fixed Income, and that there was a reasonable basis on which to conclude that the Fund benefits from the services provided by PGIM Investments, PGIM Quantitative Solutions, PGIML and PGIM Fixed Income under the management and subadvisory agreements.
Costs of Services and Profits Realized by PGIM Investments
The Board was provided with information on the profitability of PGIM Investments and its affiliates in serving as the Fund’s investment manager. The Board discussed with PGIM Investments the methodology utilized in assembling the information regarding profitability and considered its reasonableness. The Board recognized that it is difficult to make comparisons of profitability from fund management contracts because comparative information is not generally publicly available and is affected by numerous factors, including the structure of the particular adviser, the types of funds it manages, its business mix, numerous assumptions regarding allocations and the adviser’s capital structure and cost of capital. Taking these factors into account, the Board concluded that the profitability of PGIM Investments and its affiliates in relation to the services rendered was not unreasonable.
Economies of Scale
The Board received and discussed information concerning economies of scale that PGIM Investments may realize as the Fund’s assets grow beyond current levels. The Board noted that the management fee schedule for the Fund includes breakpoints, which have the effect of decreasing the fee rate as assets increase. During the course of time, the Board has considered information regarding the launch date of the Fund, the management fees of the Fund compared to those of similarly managed funds and PGIM Investments’ investment in the Fund over time. The Board noted that economies of scale can be shared with the Fund in other ways, including low management fees from inception, additional technological and personnel investments to enhance shareholder services, and maintaining existing expense structures in the face of a rising cost environment. The Board also considered PGIM Investments’ assertion that it continually evaluates the management fee schedule of the Fund and the potential to share economies of scale through breakpoints or fee waivers as asset levels increase.
PGIM Balanced Fund
Approval of Advisory Agreements (continued)
The Board recognized the inherent limitations of any analysis of economies of scale, stemming largely from the Board’s understanding that most of PGIM Investments’ costs are not specific to individual funds, but rather are incurred across a variety of products and services.
Other Benefits to PGIM Investments, PGIM Quantitative Solutions, PGIML and PGIM Fixed Income
The Board considered potential ancillary benefits that might be received by PGIM Investments, PGIM Quantitative Solutions, PGIML PGIM Fixed Income and their affiliates as a result of their relationship with the Fund. The Board concluded that potential benefits to be derived by PGIM Investments included transfer agency fees received by the Fund’s transfer agent (which is affiliated with PGIM Investments), and benefits to its reputation as well as other intangible benefits resulting from PGIM Investments’ association with the Fund. The Board concluded that the potential benefits to be derived by PGIM Quantitative Solutions, PGIML and PGIM Fixed Income included their ability to use soft dollar credits, as well as the potential benefits consistent with those generally resulting from an increase in assets under management, specifically, potential access to additional research resources and benefits to their reputations. The Board concluded that the benefits derived by PGIM Investments, PGIM Quantitative Solutions, PGIML and PGIM Fixed Income were consistent with the types of benefits generally derived by investment managers and subadvisers to mutual funds.
Performance of the Fund /Fees and Expenses
The Board considered certain additional factors and made related conclusions relating to the historical performance of the Fund for the one-, three-, five- and ten-year periods ended December 31, 2022.
The Board also considered the Fund’s actual management fee, as well as the Fund’s net total expense ratio, for the fiscal year ended September 30, 2022. The Board considered the management fee for the Fund as compared to the management fee charged by PGIM Investments to other funds and the fee charged by other advisers to comparable mutual funds in a Peer Group. The actual management fee represents the fee rate actually paid by Fund shareholders and includes any fee waivers or reimbursements. The net total expense ratio for the Fund represents the actual expense ratio incurred by Fund shareholders.
The mutual funds included in the Peer Universe, which was used to consider performance and the Peer Group, which was used to consider expenses and fees, were objectively determined by Broadridge, an independent provider of mutual fund data. In certain circumstances, PGIM Investments also provided supplemental Peer Universe or Peer Group information, for reasons addressed with the Board. The comparisons placed the Fund in various quartiles over various periods, with the first quartile being the best 25% of the mutual funds (for performance, the best performing mutual funds and, for expenses, the lowest cost mutual funds).
Visit our website at pgim.com/investments
The section below summarizes key factors considered by the Board and the Board’s conclusions regarding the Fund’s performance, fees and overall expenses. The table sets forth net performance comparisons (which reflect the impact on performance of fund expenses, or any subsidies, expense caps or waivers that may be applicable) with the Peer Universe, actual management fees with the Peer Group (which reflect the impact of any subsidies or fee waivers), and net total expenses with the Peer Group, each of which were key factors considered by the Board.
| | | | | | | | |
| Net Performance | | 1 Year | | 3 Years | | 5 Years | | 10 Years |
| | | 3rd Quartile | | 3rd Quartile | | 2nd Quartile | | 1st Quartile |
| Actual Management Fees: 3rd Quartile |
| Net Total Expenses: 3rd Quartile |
| · | The Board noted that the Fund outperformed its benchmark index over the ten-year period and underperformed its benchmark index over the one-, three-, and five-year periods. |
| · | The Board also noted that the Fund outperformed its peer group average for the year-to-date, three-, five- and ten-year periods ended March 31, 2023. |
| · | The Board considered that the Fund performed in the first or second quartile of its peer group in seven out of the last ten calendar years. |
| · | The Board and PGIM Investments agreed to retain the Fund’s existing contractual expense cap, which (exclusive of certain fees and expenses) caps total annual operating expenses at 1.00% for Class A shares, 0.65% for Class R6 shares, and 1.47% for Class R shares through January 31, 2024. |
| · | In addition, PGIM Investments will waive management fees or shared operating expenses on any share class to the same extent that it waives such expenses on any other share class, and has agreed that total annual fund operating expenses for Class R6 shares will not exceed total annual fund operating expenses for Class Z shares. |
| · | The Board concluded that, in light of the above, it would be in the best interests of the Fund and its shareholders to renew the agreements. |
| · | The Board concluded that the management fees (including subadvisory fees) and total expenses were reasonable in light of the services provided. |
* * *
After full consideration of these factors, the Board concluded that approval of the agreements was in the best interests of the Fund and its shareholders.
PGIM Balanced Fund
| | | | |
| | | |
∎ MAIL | | ∎ TELEPHONE | | ∎ WEBSITE |
655 Broad Street Newark, NJ 07102 | | (800)225-1852 | | pgim.com/investments |
|
PROXY VOTING |
| The Board of Directors of the Fund has delegated to the Fund’s subadvisers the responsibility for voting any proxies and maintaining proxy recordkeeping with respect to the Fund. A description of these proxy voting policies and procedures is available without charge, upon request, by calling (800) 225-1852 or by visiting the Securities and Exchange Commission’s website at sec.gov. Information regarding how the Fund voted proxies relating to portfolio securities during the most recent 12-month period ended June 30 is available on the Fund’s website and on the Securities and Exchange Commission’s website. |
|
| DIRECTORS |
| Ellen S. Alberding · Kevin J. Bannon · Scott E. Benjamin · Linda W. Bynoe · Barry H. Evans · Keith F. Hartstein · Laurie Simon Hodrick · Stuart S. Parker · Brian K. Reid · Grace C. Torres |
|
| OFFICERS |
| Stuart S. Parker, President · Scott E. Benjamin, Vice President · Christian J. Kelly, Chief Financial Officer · Claudia DiGiacomo, Chief Legal Officer · Andrew Donohue, Chief Compliance Officer · Russ Shupak, Treasurer and Principal Accounting Officer · Kelly Florio, Anti-Money Laundering Compliance Officer · Andrew R. French, Secretary · Melissa Gonzalez, Assistant Secretary · Kelly A. Coyne, Assistant Secretary · Patrick E. McGuinness, Assistant Secretary · Debra Rubano, Assistant Secretary · Lana Lomuti, Assistant Treasurer · Elyse M. McLaughlin, Assistant Treasurer · Deborah Conway, Assistant Treasurer · Robert W. McCormack, Assistant Treasurer |
| | | | |
MANAGER | | PGIM Investments LLC | | 655 Broad Street Newark, NJ 07102 |
| | |
SUBADVISERS | | PGIM Quantitative Solutions LLC | | 655 Broad Street 16th Floor Newark, NJ 07102 |
| | |
| | PGIM Fixed Income | | 655 Broad Street Newark, NJ 07102 |
| | |
| | PGIM Limited | | Grand Buildings, 1-3 Strand Trafalgar Square London, WC2N 5HR United Kingdom |
| | | | | |
| | |
DISTRIBUTOR | | Prudential Investment Management Services LLC | | 655 Broad Street Newark, NJ 07102 |
| | |
CUSTODIAN | | The Bank of New York Mellon | | 240 Greenwich Street New York, NY 10286 |
| | |
TRANSFER AGENT | | Prudential Mutual Fund Services LLC | | PO Box 534432 Pittsburgh, PA 15253 |
| | |
INDEPENDENT REGISTERED PUBLIC ACCOUNTING FIRM | | PricewaterhouseCoopers LLP | | 300 Madison Avenue New York, NY 10017 |
| | |
FUND COUNSEL | | Willkie Farr &Gallagher LLP | | 787 Seventh Avenue New York, NY 10019 |
|
| |
| An investor should consider the investment objectives, risks, charges, and expenses of the Fund carefully before investing. The prospectus and summary prospectus contain this and other information about the Fund. An investor may obtain the prospectus and summary prospectus by visiting our website at pgim.com/investments or by calling (800) 225-1852. The prospectus and summary prospectus should be read carefully before investing. |
|
| E-DELIVERY |
| |
| To receive your mutual fund documents online, go to pgim.com/investments/resource/edelivery and enroll. Instead of receiving printed documents by mail, you will receive notification via email when new materials are available. You can cancel your enrollment or change your email address at any time by visiting the website address above. |
|
| SHAREHOLDER COMMUNICATIONS WITH DIRECTORS |
| |
| Shareholders can communicate directly with the Board of Directors by writing to the Chair of the Board, PGIM Balanced Fund, PGIM Investments, Attn: Board of Directors, 655 Broad Street, Newark, NJ 07102. Shareholders can communicate directly with an individual Director by writing to that Director at the same address. Communications are not screened before being delivered to the addressee. |
|
| AVAILABILITY OF PORTFOLIO HOLDINGS |
| |
| The Fund files its complete schedule of portfolio holdings with the Securities and Exchange Commission for the first and third quarters of each fiscal year as an exhibit to its reports on Form N-PORT. The Fund’s Form N-PORT filings are available on the Commission’s website at sec.gov. |
|
| |
| The Fund’s Statement of Additional Information contains additional information about the Fund’s Directors and is available without charge, upon request, by calling (800) 225-1852. |
| | | | |
| Mutual Funds: | | | | |
| | | |
ARE NOT INSURED BY THE FDIC OR ANY FEDERAL GOVERNMENT AGENCY | | MAY LOSE VALUE | | ARE NOT A DEPOSIT OF OR GUARANTEED BY ANY BANK OR ANY BANK AFFILIATE |

| | | | | | | | | | | | | | | | | | |
PGIM BALANCED FUND | | | | | | | | | | | | | | | | |
| | | | | |
SHARE CLASS | | A | | | C | | | | R | | | | Z | | | | R6 | |
| | | | | |
NASDAQ | | PIBAX | | | PABCX | | | | PALRX | | | | PABFX | | | | PIBQX | |
| | | | | |
CUSIP | | 74437E883 | | | 74437E867 | | | | 74437E636 | | | | 74437E859 | | | | 74437E461 | |
MF185E

PGIM JENNISON GROWTH FUND
ANNUAL REPORT
SEPTEMBER 30, 2023

To enroll in e-delivery, go to pgim.com/investments/resource/edelivery
Table of Contents
This report is not authorized for distribution to prospective investors unless preceded or accompanied by a current prospectus.
The views expressed in this report and information about the Fund’s portfolio holdings are for the period covered by this report and are subject to change thereafter.
Mutual funds are distributed by Prudential Investment Management Services LLC, member SIPC. Jennison Associates LLC is a registered investment adviser. Both are Prudential Financial companies. © 2023 Prudential Financial, Inc. and its related entities. Jennison Associates, Jennison, PGIM, and the PGIM logo are service marks of Prudential Financial, Inc. and its related entities, registered in many jurisdictions worldwide.
| | |
| 2 | | Visit our website at pgim.com/investments |
Letter from the President
| | |
 | | Dear Shareholder: We hope you find the annual report for the PGIM Jennison Growth Fund informative and useful. The report covers performance for the 12-month period that ended September 30, 2023. Although central banks raised interest rates aggressively to tame surging inflation during the period, the global economy and financial markets demonstrated resilience. Employers continued hiring, consumers continued spending, home prices rose, and recession fears receded. |
Early in the period, stocks began a rally that eventually ended a bear market and continued to rise globally for much of 2023 as inflation cooled and the Federal Reserve (the Fed) slowed the pace of its rate hikes. However, stocks declined in September when the Fed signaled that rates may remain elevated longer than investors had expected. For the entire period, equities in both US and international markets posted gains.
Bond markets benefited during the period as the Fed moderated its rate-hiking cycle, and the higher level of interest rates offered investors an additional cushion from fixed income volatility. US and global investment-grade bonds posted small gains for the overall period, while US high yield corporate bonds and emerging-market debt rose by double digits.
Regarding your investments with PGIM, we believe it is important to maintain a diversified portfolio of funds consistent with your tolerance for risk, time horizon, and financial goals. Your financial advisor can help you create a diversified investment plan that may include funds covering all the basic asset classes and that reflects your personal investor profile and risk tolerance. However, diversification and asset allocation strategies do not assure a profit or protect against loss in declining markets.
At PGIM Investments, we provide access to active investment strategies across the global markets in the pursuit of consistent outperformance for investors. PGIM is the world’s 14th-largest investment manager with more than $1.3 trillion in assets under management. Our scale and investment expertise allow us to deliver a diversified suite of actively managed solutions across a broad spectrum of asset classes and investment styles.
Thank you for choosing our family of funds.
Sincerely,

Stuart S. Parker, President
PGIM Jennison Growth Fund
November 15, 2023
PGIM Jennison Growth Fund 3
Your Fund’s Performance (unaudited)
Performance data quoted represent past performance. Past performance does not guarantee future results. The investment return and principal value of an investment will fluctuate so that an investor’s shares, when redeemed, may be worth more or less than their original cost. Current performance may be lower or higher than the past performance data quoted. An investor may obtain performance data as of the most recent month-end by visiting our website at pgim.com/investments or by calling (800) 225-1852.
| | | | | | | | |
| |
| | | Average Annual Total Returns as of 9/30/2023 |
| | | One Year (%) | | Five Years (%) | | Ten Years (%) | | Since Inception (%) |
| | | | |
Class A | | | | | | | | |
| | | | |
(with sales charges) | | 22.81 | | 9.01 | | 12.75 | | — |
| | | | |
(without sales charges) | | 29.95 | | 10.25 | | 13.39 | | — |
| | | | |
Class C | | | | | | | | |
| | | | |
(with sales charges) | | 28.04 | | 9.50 | | 12.61 | | — |
| | | | |
(without sales charges) | | 29.04 | | 9.50 | | 12.61 | | — |
| | | | |
Class R | | | | | | | | |
| | | | |
(without sales charges) | | 29.65 | | 10.01 | | 13.15 | | — |
| | | | |
Class Z | | | | | | | | |
| | | | |
(without sales charges) | | 30.35 | | 10.59 | | 13.73 | | — |
| | | | |
Class R2 | | | | | | | | |
| | | | |
(without sales charges) | | 29.86 | | 10.14 | | N/A | | 11.68 (11/28/2017) |
| | | | |
Class R4 | | | | | | | | |
| | | | |
(without sales charges) | | 30.16 | | 10.42 | | N/A | | 11.96 (11/28/2017) |
| | | | |
Class R6 | | | | | | | | |
| | | | |
(without sales charges) | | 30.49 | | 10.71 | | N/A | | 13.47 (9/27/2017) |
| | | | |
Russell 1000® Growth Index | | | | | | | | |
| | | | |
| | 27.72 | | 12.42 | | 14.48 | | — |
| | | | |
S&P 500 Index | | | | | | | | |
| | | | |
| | | 21.62 | | 9.92 | | 11.91 | | — |
| | | | |
|
| Average Annual Total Returns as of 9/30/2023 Since Inception (%) |
| | | Class R2, Class R4
(11/28/2017) | | Class R6 (9/27/2017) |
| | |
Russell 1000® Growth Index | | 13.73 | | 14.62 |
| | |
S&P 500 Index | | 10.53 | | 11.21 |
Since Inception returns are provided for any share class with less than 10 fiscal years of returns. Since Inception returns for the Indexes are measured from the closest month-end to the class’s inception date.
| | |
| 4 | | Visit our website at pgim.com/investments |
Growth of a $10,000 Investment (unaudited)
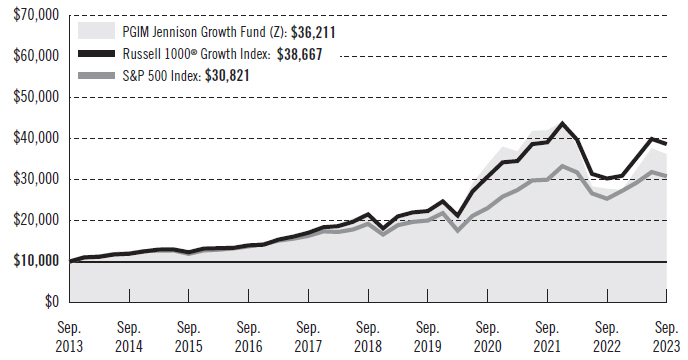
The graph compares a $10,000 investment in the Fund’s Class Z shares with a similar investment in the Russell 1000 Growth Index and the S&P 500 Index by portraying the initial account values at the beginning of the 10-year period (September 30, 2013) and the account values at the end of the current fiscal year (September 30, 2023), as measured on a quarterly basis. For purposes of the graph, and unless otherwise indicated, it has been assumed that (a) all recurring fees (including management fees) were deducted and (b) all dividends and distributions were reinvested. The line graph provides information for Class Z shares only. As indicated in the tables provided earlier, performance for other share classes will vary due to the differing fees and expenses applicable to each share class (as indicated in the following paragraphs). Without waiver of fees and/or expense reimbursements, if any, the returns would have been lower.
Past performance does not predict future performance. Total returns and the ending account values in the graph include changes in share price and reinvestment of dividends and capital gains distributions in a hypothetical investment for the periods shown. The Fund’s total returns do not reflect the deduction of income taxes on an individual’s investment. Taxes may reduce your actual investment returns on income or gains paid by the Fund or any gains you may realize if you sell your shares.
PGIM Jennison Growth Fund 5
Your Fund’s Performance (continued)
The returns in the tables do not reflect the deduction of taxes that a shareholder would pay on Fund distributions or following the redemption of Fund shares. The average annual total returns take into account applicable sales charges, which are described for each share class in the table below.
| | | | | | | | | | | | | | |
| | | | | | | | |
| | | Class A | | Class C | | Class R | | Class Z | | Class R2 | | Class R4 | | Class R6 |
| | | | | | | | |
| Maximum initial sales charge | | 5.50% of the public offering price | | None | | None | | None | | None | | None | | None |
| | | | | | | | |
| Contingent deferred sales charge (CDSC) (as a percentage of the lower of the original purchase price or the net asset value at redemption) | | 1.00% on sales of $1 million or more made within 12 months of purchase | | 1.00% on sales made within 12 months of purchase | | None | | None | | None | | None | | None |
| | | | | | | | |
| Annual distribution or distribution and service (12b-1) fees (shown as a percentage of average daily net assets) | | 0.30% | | 1.00% | | 0.75%
(0.50% currently) | | None | | 0.25% | | None | | None |
| | | | | | | | |
| Shareholder service fees | | None | | None | | None | | None | | 0.10%* | | 0.10%* | | None |
*Shareholder service fee reflects maximum allowable fees under a shareholder services plan.
Benchmark Definitions
Russell 1000 Growth Index—The Russell 1000 Growth Index is an unmanaged index which contains those securities in the Russell 1000 Index with an above-average growth orientation. Companies in this Index tend to exhibit higher price-to-book and price-to-earnings ratios, lower dividend yields, and higher forecasted growth rates.
S&P 500 Index*—The S&P 500 Index is an unmanaged index of over 500 stocks of large US public companies. It gives a broad look at how stock prices in the United States have performed.
*The S&P 500 Index is a product of S&P Dow Jones Indices LLC and/or its affiliates and has been licensed for use by PGIM, Inc. and/or its affiliates. Copyright © 2023 S&P Dow Jones Indices LLC, a division of S&P Global, Inc., and/or its affiliates. All rights reserved. Redistribution or reproduction in whole or in part are prohibited without written permission of S&P Dow Jones Indices LLC. For more information on any of S&P Dow Jones Indices LLC’s indices please visit www.spdji.com. S&P® is a registered trademark of S&P Global and Dow Jones® is a registered trademark of Dow Jones Trademark Holdings LLC.
Investors cannot invest directly in an index. The returns for the Indexes would be lower if they included the effects of sales charges, operating expenses of a mutual fund, or taxes that may be paid by an investor.
6 Visit our website at pgim.com/investments
Presentation of Fund Holdings as of 9/30/23
| | | | |
| | |
| Ten Largest Holdings | | Line of Business | | % of Net Assets |
| | |
| NVIDIA Corp. | | Semiconductors & Semiconductor Equipment | | 8.0% |
| | |
| Microsoft Corp. | | Software | | 7.6% |
| | |
| Amazon.com, Inc. | | Broadline Retail | | 7.3% |
| | |
| Tesla, Inc. | | Automobiles | | 4.6% |
| | |
| Apple, Inc. | | Technology Hardware, Storage & Peripherals | | 4.5% |
| | |
| Meta Platforms, Inc. (Class A Stock) | | Interactive Media & Services | | 3.7% |
| | |
| Eli Lilly & Co. | | Pharmaceuticals | | 3.7% |
| | |
| Visa, Inc. (Class A Stock) | | Financial Services | | 3.0% |
| | |
| Mastercard, Inc. (Class A Stock) | | Financial Services | | 3.0% |
| | |
| Advanced Micro Devices, Inc. | | Semiconductors & Semiconductor Equipment | | 2.8% |
Holdings reflect only long-term investments and are subject to change.
| | | | |
PGIM Jennison Growth Fund | | | 7 | |
Strategy and Performance Overview*
(unaudited)
How did the Fund perform?
The PGIM Jennison Growth Fund’s Class Z shares returned 30.35% in the 12-month reporting period that ended September 30, 2023, outperforming the 27.72% return of the Russell 1000 Growth Index (the Index).
What were the market conditions?
| • | | The investment backdrop for growth stocks during the reporting period can be divided into three sections. In the last three months of 2022, investors remained uncertain about inflationary pressures and US Federal Reserve (Fed) policy, heightened geopolitical tension, war in Ukraine, and expectations that US economic growth would slow and could enter a recession. |
| • | | In the first six months of 2023, the economy delivered better-than-feared results, with continued—albeit moderating—growth led by resilient consumer spending amid ongoing labor market strength. As inflationary pressures eased, the Fed slowed the pace of monetary tightening, which encouraged investors, as did stronger-than-expected earnings reports. Investors appeared to be surprised that many companies were able to effectively cut their costs and reduce their head counts, enabling them to exceed Wall Street expectations. Growth companies, led by technology, rose sharply. |
| • | | However, during the third quarter of 2023, macroeconomic and political developments stoked investor unease. Threats of a federal government shutdown, strikes at several US automakers, and tensions with China made the path to slower growth and a soft landing appear less smooth or likely. Oil prices moved higher on the back of coordinated supply restraints imposed by the OPEC+ oil-producing nations and a subsequent rebound in gasoline prices. US consumer confidence ticked down, while employment and home prices held firm. The US economy’s ongoing resilience, coupled with higher interest rates, reinvigorated the value of the US dollar, which closed the period near its early-2023 levels. |
| • | | The collapse in March 2023 of Silicon Valley Bank, the 16th-largest US bank by assets, was largely contained. Regulators closed several ailing banks—none of which were held by the Fund—and provided additional bank borrowing facilities and deposit guarantees. However, the underlying issue of asset/liability mismatch on many banks’ balance sheets remained unresolved. |
| • | | Interest in artificial intelligence (AI)—catalyzed by the launch of ChatGPT in late November 2022—continued to grow through the first nine months of 2023. Investors expressed the greatest enthusiasm for companies supplying the foundational components to design, build, and run AI and machine-learning capabilities. |
| • | | Gains in the information technology and communication services sectors outpaced those for the overall Index. The financials, industrials, energy, healthcare, materials, consumer discretionary, and consumer staples sectors advanced but lagged the overall Index. The real estate and utilities sectors lost ground. |
| | |
| 8 | | Visit our website at pgim.com/investments |
What worked?
| • | | In aggregate, security selection contributed positively to relative performance during the reporting period. |
| • | | Positions within the information technology sector were especially strong contributors to the Fund’s relative performance, as select companies posted strong gains in the first half of 2023, following a rough second half of 2022. The rebound reflected both the depressed nature of valuations when the year began and the first signs of upgrades to near- and medium-term revenue and profit expectations from company managements. |
| • | | Stock selection within the healthcare sector was another top driver of relative results. |
| • | | Key positive portfolio contributors included Nvidia Corp., Microsoft Corp., Eli Lilly & Co., Apple, Inc., and Broadcom, Inc. |
| • | | Shares in semiconductor maker Nvidia rose on the company’s growth opportunity as a leading developer of advanced computer chips that support AI development. As the period progressed, the company saw tremendous demand for its products related to accelerated computing and generative AI. Improving supply should sustain revenue growth well into next year. |
| • | | Enterprise software company Microsoft continued to gain share across multiple product lines, while having the advantage of being very well positioned for the AI wave, given the company’s plans to incorporate the technology into existing products, increasing revenue potential. |
| • | | Shares of pharmaceutical company Eli Lilly rose after the company posted strong financial results due to the strength of diabetes/obesity treatments Mounjaro and Trulicity. These products remain tremendous opportunities for Eli Lilly, as do exciting franchises in dermatology, immunology, and oncology that are starting to add meaningfully to growth. |
| • | | Consumer electronics maker Apple continued to demonstrate the power of its ecosystem, which grew to include 2 billion iPhones. |
| • | | Shares in semiconductor manufacturer Broadcom surged on the news the company had entered into two multi-year supply agreements with Apple. |
What didn’t work?
| • | | Sector allocation in the aggregate was the biggest drag on relative results, especially an overweight to consumer discretionary and an underweight to the information technology sector—the latter due to the very large Index weights in Apple and Microsoft. |
| • | | Stock selection within the communication services and consumer discretionary sectors was another significant detractor. |
| • | | Key negative portfolio contributors included Tesla, Inc., Atlassian Corp., CrowdStrike Holdings, Inc., ZoomInfo Inc., and American Tower Corp. |
| | | | |
PGIM Jennison Growth Fund | | | 9 | |
Strategy and Performance Overview* (continued)
| • | | Shares in electric vehicle (EV) maker Tesla fell significantly in the final months of 2022. Economic sensitivity began to weigh on automobile sales, including EVs, which prompted Tesla to make several intra-quarter pricing adjustments. In 2023, however, Tesla’s stock price rebounded as sales hit record levels and attractive valuations attracted buyers. Tesla also achieved a significant breakthrough in its efforts to unify the EV industry around a common charging network infrastructure with the announcement that Ford Motor Co., General Motors Co., and Rivian Automotive Inc. would adopt plug-in compatibility with Tesla’s North American charging network. |
| • | | Jennison eliminated the Fund’s position in project management software provider Atlassian due to a disappointing slowdown in the company’s Cloud revenue. |
| • | | Cybersecurity company CrowdStrike provides cloud-delivered protection of endpoints, cloud workloads, identity, and data via a software-as-a-service (SaaS) subscription-based model. Shares declined during the first three months of the period as the company experienced longer-than-expected sales cycles, especially for larger deals, as well some concerns about slowing capital spending. Later in the period, shares recovered on improved fundamentals and ongoing positive guidance. |
| • | | Jennison sold the Fund’s position in ZoomInfo early in the year, following the release of disappointing organic bookings growth and lowered expectations for 2023. |
| • | | Shares of telecom real estate investment trust (REIT) American Tower fell early in 2023 due, in part, to a market rotation away from the more defensive stocks within the secular growth ecosystem. The tower industry has high barriers to entry and fairly predictable earnings streams. Jennison believes the industry is well-positioned for what we expect will be several years of increased spending by US carriers. |
Current outlook
| • | | Sentiment in the near term is clouded by uncertainties due to—but not limited to—repeated threats of a government shutdown, auto strikes, the restart of student loan repayments, and the lagged effect on financing costs and spending intentions of interest rates at 15-year highs. These impediments will likely weigh on economic growth into year-end and deepen the deceleration that Jennison has been anticipating since 2023 began. |
| • | | US consumers, with less robust prospects overall, are beginning to show stress—primarily at lower income levels. Overall, a healthy employment backdrop and residential real estate strength, which bolsters net worth, are variables that point to a moderate slowdown. The portfolio holdings related most directly to consumer spending remain tightly focused on leading brands, retailers, and service providers that are best-positioned to take wallet share and grow revenues and profits on a multi-year basis. |
| • | | Technology spending trends have turned to cost optimization, rationalization of past customer investments to drive efficiencies, and headcount reductions. Now more than a year into this environment, Jennison expects to see greater stability in spending activity and investment intentions moving into 2024. The broad categories |
| | |
| 10 | | Visit our website at pgim.com/investments |
| | of cloud adoption, data mining and analytics, and the still-nascent development and adoption of generative AI capabilities remain at the forefront of longer-term investment plans across a wide range of industries. |
| • | | Jennison remains vigilant in evaluating the investment landscape against a mixed backdrop. It is important to emphasize that slowing growth is a feature, but not the defining factor, which will influence the performance and financial results of investments over the Fund’s longer-term investment horizon. The ability to innovate, invest, and grow through variable macroeconomic environments supports Jennison’s belief in the ability of the Fund to generate above-average returns. |
*This strategy and performance overview, which discusses what strategies or holdings (including derivatives, if applicable) affected the Fund’s performance, is compiled based on how the Fund performed relative to the Fund’s benchmark index and is viewed for performance attribution purposes at the aggregate Fund level, which in most instances will not directly correlate to the amounts disclosed in the Statement of Operations which conform to US generally accepted accounting principles.
| | | | |
PGIM Jennison Growth Fund | | | 11 | |
Fees and Expenses (unaudited)
As a shareholder of the Fund, you incur two types of costs: (1) transaction costs, including sales charges (loads) on purchase payments and redemptions, as applicable, and (2) ongoing costs, including management fees, distribution and/or service (12b-1) fees, and other Fund expenses, as applicable. This example is intended to help you understand your ongoing costs (in dollars) of investing in the Fund and to compare these costs with the ongoing costs of investing in other mutual funds.
The example is based on an investment of $1,000 held through the six-month period ended September 30, 2023. The example is for illustrative purposes only; you should consult the Prospectus for information on initial and subsequent minimum investment requirements.
Actual Expenses
The first line for each share class in the table on the following page provides information about actual account values and actual expenses. You may use the information on this line, together with the amount you invested, to estimate the expenses that you paid over the period. Simply divide your account value by $1,000 (for example, an $8,600 account value ÷ $1,000 = 8.6), then multiply the result by the number on the first line under the heading “Expenses Paid During the Six-Month Period” to estimate the expenses you paid on your account during this period.
Hypothetical Example for Comparison Purposes
The second line for each share class in the table on the following page provides information about hypothetical account values and hypothetical expenses based on the Fund’s actual expense ratio and an assumed rate of return of 5% per year before expenses, which is not the Fund’s actual return. The hypothetical account values and expenses may not be used to estimate the actual ending account balance or expenses you paid for the period. You may use this information to compare the ongoing costs of investing in the Fund and other funds. To do so, compare this 5% hypothetical example with the 5% hypothetical examples that appear in the shareholder reports of the other funds.
The Fund’s transfer agent may charge additional fees to holders of certain accounts that are not included in the expenses shown in the table on the following page. These fees apply to individual retirement accounts (IRAs) and Section 403(b) accounts. As of the close of the six-month period covered by the table, IRA fees included an annual maintenance fee of $15 per account (subject to a maximum annual maintenance fee of $25 for all accounts held by the same shareholder). Section 403(b) accounts are charged an annual $25 fiduciary maintenance fee. Some of the fees may vary in amount, or may be waived, based on your total account balance or the number of PGIM funds, including the Fund, that you own. You should consider the additional fees that were charged to your Fund account over the six-month period when you estimate the total ongoing expenses paid over the period and the impact of these fees on your ending account value, as these additional expenses are not reflected in the information
| | |
| 12 | | Visit our website at pgim.com/investments |
provided in the expense table. Additional fees have the effect of reducing investment returns.
Please note that the expenses shown in the table are meant to highlight your ongoing costs only and do not reflect any transactional costs such as sales charges (loads). Therefore, the second line for each share class in the table is useful in comparing ongoing costs only and will not help you determine the relative total costs of owning different funds. In addition, if these transactional costs were included, your costs would have been higher.
| | | | | | | | | | |
| | | | |
| PGIM Jennison Growth Fund | | Beginning Account Value
April 1, 2023 | | Ending Account Value
September 30, 2023 | | Annualized
Expense Ratio Based on
the
Six-Month Period | | Expenses Paid
During the
Six-Month Period* |
| | | | | |
| Class A | | Actual | | $1,000.00 | | $1,110.10 | | 1.01% | | $5.34 |
| | | | | |
| | Hypothetical | | $1,000.00 | | $1,020.00 | | 1.01% | | $5.11 |
| | | | | |
| Class C | | Actual | | $1,000.00 | | $1,106.10 | | 1.69% | | $8.92 |
| | | | | |
| | Hypothetical | | $1,000.00 | | $1,016.60 | | 1.69% | | $8.54 |
| | | | | |
| Class R | | Actual | | $1,000.00 | | $1,108.60 | | 1.21% | | $6.40 |
| | | | | |
| | Hypothetical | | $1,000.00 | | $1,019.00 | | 1.21% | | $6.12 |
| | | | | |
| Class Z | | Actual | | $1,000.00 | | $1,111.70 | | 0.68% | | $3.60 |
| | | | | |
| | Hypothetical | | $1,000.00 | | $1,021.66 | | 0.68% | | $3.45 |
| | | | | |
| Class R2 | | Actual | | $1,000.00 | | $1,109.70 | | 1.10% | | $5.82 |
| | | | | |
| | Hypothetical | | $1,000.00 | | $1,019.55 | | 1.10% | | $5.57 |
| | | | | |
| Class R4 | | Actual | | $1,000.00 | | $1,110.80 | | 0.85% | | $4.50 |
| | | | | |
| | Hypothetical | | $1,000.00 | | $1,020.81 | | 0.85% | | $4.31 |
| | | | | |
| Class R6 | | Actual | | $1,000.00 | | $1,112.20 | | 0.58% | | $3.07 |
| | | | | |
| | | Hypothetical | | $1,000.00 | | $1,022.16 | | 0.58% | | $2.94 |
*Fund expenses (net of fee waivers or subsidies, if any) for each share class are equal to the annualized expense ratio for each share class (provided in the table), multiplied by the average account value over the period, multiplied by the 183 days in the six-month period ended September 30, 2023, and divided by the 365 days in the Fund’s fiscal year ended September 30, 2023 (to reflect the six-month period). Expenses presented in the table include the expenses of any underlying portfolios in which the Fund may invest.
| | | | |
PGIM Jennison Growth Fund | | | 13 | |
Schedule of Investments
as of September 30, 2023
| | | | | | | | |
| | |
| Description | | Shares | | | Value | |
| | |
| LONG-TERM INVESTMENTS 99.1% | | | | | | |
| | |
| COMMON STOCKS 98.5% | | | | | | |
| | |
| Automobile Components 0.3% | | | | | | |
| | |
Mobileye Global, Inc. (Israel) (Class A Stock)*(a) | | | 442,742 | | | $ | 18,395,930 | |
| | |
| Automobiles 4.6% | | | | | | |
| | |
Tesla, Inc.* | | | 1,166,156 | | | | 291,795,554 | |
| | |
| Biotechnology 1.6% | | | | | | |
| | |
Argenx SE (Netherlands), ADR* | | | 62,044 | | | | 30,502,691 | |
| | |
Vertex Pharmaceuticals, Inc.* | | | 196,824 | | | | 68,443,578 | |
| | | | | | | | |
| | |
| | | | | | | 98,946,269 | |
| | |
| Broadline Retail 9.0% | | | | | | |
| | |
Amazon.com, Inc.* | | | 3,592,687 | | | | 456,702,372 | |
MercadoLibre, Inc. (Brazil)* | | | 84,805 | | | | 107,522,563 | |
| | | | | | | | |
| | |
| | | | | | | 564,224,935 | |
| | |
| Capital Markets 1.9% | | | | | | |
| | |
Goldman Sachs Group, Inc. (The) | | | 148,164 | | | | 47,941,426 | |
Moody’s Corp. | | | 197,170 | | | | 62,339,239 | |
S&P Global, Inc. | | | 31,425 | | | | 11,483,009 | |
| | | | | | | | |
| | |
| | | | | | | 121,763,674 | |
| | |
| Consumer Staples Distribution & Retail 2.1% | | | | | | |
| | |
Costco Wholesale Corp. | | | 230,473 | | | | 130,208,026 | |
| | |
| Entertainment 1.5% | | | | | | |
| | |
Netflix, Inc.* | | | 255,905 | | | | 96,629,728 | |
| | |
| Financial Services 6.0% | | | | | | |
| | |
Mastercard, Inc. (Class A Stock) | | | 470,407 | | | | 186,238,835 | |
Visa, Inc. (Class A Stock)(a) | | | 817,108 | | | | 187,943,011 | |
| | | | | | | | |
| | |
| | | | | | | 374,181,846 | |
| | |
| Ground Transportation 2.2% | | | | | | |
| | |
Uber Technologies, Inc.* | | | 2,950,266 | | | | 135,682,733 | |
See Notes to Financial Statements.
PGIM Jennison Growth Fund 15
Schedule of Investments (continued)
as of September 30, 2023
| | | | | | | | |
| | |
| Description | | Shares | | | Value | |
| | |
| COMMON STOCKS (Continued) | | | | | | |
| | |
| Health Care Equipment & Supplies 1.8% | | | | | | |
| | |
Dexcom, Inc.* | | | 319,787 | | | $ | 29,836,127 | |
| | |
Intuitive Surgical, Inc.* | | | 275,905 | | | | 80,644,273 | |
| | | | | | | | |
| | |
| | | | | | | 110,480,400 | |
| | |
| Health Care Providers & Services 1.0% | | | | | | |
| | |
UnitedHealth Group, Inc. | | | 130,088 | | | | 65,589,069 | |
| | |
| Hotels, Restaurants & Leisure 2.4% | | | | | | |
| | |
Airbnb, Inc. (Class A Stock)* | | | 504,661 | | | | 69,244,536 | |
| | |
Chipotle Mexican Grill, Inc.* | | | 18,499 | | | | 33,887,023 | |
| | |
Marriott International, Inc. (Class A Stock) | | | 238,532 | | | | 46,885,850 | |
| | | | | | | | |
| | |
| | | | | | | 150,017,409 | |
| | |
| Interactive Media & Services 8.7% | | | | | | |
| | |
Alphabet, Inc. (Class A Stock)* | | | 1,181,010 | | �� | | 154,546,969 | |
| | |
Alphabet, Inc. (Class C Stock)* | | | 1,183,719 | | | | 156,073,350 | |
| | |
Meta Platforms, Inc. (Class A Stock)* | | | 778,591 | | | | 233,740,804 | |
| | | | | | | | |
| | |
| | | | | | | 544,361,123 | |
| | |
| IT Services 2.3% | | | | | | |
| | |
MongoDB, Inc.* | | | 201,220 | | | | 69,593,949 | |
| | |
Snowflake, Inc. (Class A Stock)* | | | 474,179 | | | | 72,440,326 | |
| | | | | | | | |
| | |
| | | | | | | 142,034,275 | |
| | |
| Media 0.6% | | | | | | |
| | |
Trade Desk, Inc. (The) (Class A Stock)* | | | 461,583 | | | | 36,072,711 | |
| | |
| Personal Care Products 1.0% | | | | | | |
| | |
L’Oreal SA (France) | | | 155,878 | | | | 64,597,730 | |
| | |
| Pharmaceuticals 7.4% | | | | | | |
| | |
AstraZeneca PLC (United Kingdom), ADR | | | 1,276,490 | | | | 86,443,903 | |
| | |
Eli Lilly & Co. | | | 434,876 | | | | 233,584,946 | |
| | |
Novo Nordisk A/S (Denmark), ADR | | | 1,581,350 | | | | 143,807,969 | |
| | | | | | | | |
| | |
| | | | | | | 463,836,818 | |
| | |
| Semiconductors & Semiconductor Equipment 14.8% | | | | | | |
| | |
Advanced Micro Devices, Inc.* | | | 1,736,784 | | | | 178,576,131 | |
| | |
ARM Holdings PLC, ADR*(a) | | | 459,280 | | | | 24,580,666 | |
| | |
ASML Holding NV (Netherlands) | | | 81,926 | | | | 48,226,559 | |
See Notes to Financial Statements.
16
| | | | | | | | |
| | |
| Description | | Shares | | | Value | |
| | |
| COMMON STOCKS (Continued) | | | | | | |
| | |
| Semiconductors & Semiconductor Equipment (cont’d.) | | | | | | |
| | |
Broadcom, Inc. | | | 176,245 | | | $ | 146,385,572 | |
| | |
Micron Technology, Inc. | | | 454,141 | | | | 30,895,212 | |
| | |
NVIDIA Corp. | | | 1,157,981 | | | | 503,710,155 | |
| | | | | | | | |
| | |
| | | | | | | 932,374,295 | |
| | |
| Software 15.3% | | | | | | |
| | |
Adobe, Inc.* | | | 212,834 | | | | 108,524,058 | |
| | |
Cadence Design Systems, Inc.* | | | 328,124 | | | | 76,879,453 | |
| | |
Crowdstrike Holdings, Inc. (Class A Stock)* | | | 311,199 | | | | 52,088,489 | |
| | |
HubSpot, Inc.* | | | 38,702 | | | | 19,060,735 | |
| | |
Microsoft Corp. | | | 1,516,156 | | | | 478,726,257 | |
| | |
Salesforce, Inc.* | | | 603,745 | | | | 122,427,411 | |
| | |
ServiceNow, Inc.* | | | 182,371 | | | | 101,938,094 | |
| | | | | | | | |
| | |
| | | | | | | 959,644,497 | |
| | |
| Specialized REITs 0.8% | | | | | | |
| | |
American Tower Corp. | | | 325,860 | | | | 53,587,677 | |
| | |
| Specialty Retail 4.1% | | | | | | |
| | |
Home Depot, Inc. (The) | | | 241,980 | | | | 73,116,677 | |
| | |
O’Reilly Automotive, Inc.* | | | 82,750 | | | | 75,208,165 | |
| | |
TJX Cos., Inc. (The) | | | 778,431 | | | | 69,186,947 | |
| | |
Ulta Beauty, Inc.* | | | 102,381 | | | | 40,896,091 | |
| | | | | | | | |
| | |
| | | | | | | 258,407,880 | |
| | |
| Technology Hardware, Storage & Peripherals 4.5% | | | | | | |
| | |
Apple, Inc. | | | 1,671,614 | | | | 286,197,033 | |
| | |
| Textiles, Apparel & Luxury Goods 4.6% | | | | | | |
| | |
Lululemon Athletica, Inc.* | | | 292,344 | | | | 112,730,770 | |
| | |
LVMH Moet Hennessy Louis Vuitton SE (France) | | | 164,503 | | | | 124,171,908 | |
| | |
NIKE, Inc. (Class B Stock) | | | 531,527 | | | | 50,824,612 | |
| | | | | | | | |
| | |
| | | | | | | 287,727,290 | |
| | | | | | | | |
| | |
TOTAL COMMON STOCKS
(cost $3,025,790,118) | | | | | | | 6,186,756,902 | |
See Notes to Financial Statements.
PGIM Jennison Growth Fund 17
Schedule of Investments (continued)
as of September 30, 2023
| | | | | | | | |
| | |
| Description | | Shares | | | Value | |
| | |
| PREFERRED STOCK 0.6% | | | | | | |
| | |
| Automobiles | | | | | | |
Dr. Ing. h.c. F. Porsche AG (Germany) (PRFC), 144A
(cost $38,323,821) | | | 414,098 | | | $ | 38,853,617 | |
| | | | | | | | |
| | |
TOTAL LONG-TERM INVESTMENTS
(cost $3,064,113,939) | | | | | | | 6,225,610,519 | |
| | | | | | | | |
| | |
SHORT-TERM INVESTMENTS 3.8% | | | | | | | | |
| | |
AFFILIATED MUTUAL FUNDS | | | | | | | | |
PGIM Core Government Money Market Fund(wb) | | | 22,686,269 | | | | 22,686,269 | |
PGIM Institutional Money Market Fund
(cost $212,131,465; includes $211,069,564 of cash collateral for securities on loan)(b)(wb) | | | 212,398,150 | | | | 212,270,711 | |
| | | | | | | | |
| | |
TOTAL SHORT-TERM INVESTMENTS
(cost $234,817,734) | | | | | | | 234,956,980 | |
| | | | | | | | |
| | |
TOTAL INVESTMENTS 102.9%
(cost $3,298,931,673) | | | | | | | 6,460,567,499 | |
Liabilities in excess of other assets (2.9)% | | | | | | | (180,571,224 | ) |
| | | | | | | | |
| | |
NET ASSETS 100.0% | | | | | | $ | 6,279,996,275 | |
| | | | | | | | |
Below is a list of the abbreviation(s) used in the annual report:
144A—Security was purchased pursuant to Rule 144A under the Securities Act of 1933 and, pursuant to the requirements of Rule 144A, may not be resold except to qualified institutional buyers.
ADR—American Depositary Receipt
PRFC—Preference Shares
REITs—Real Estate Investment Trust
SOFR—Secured Overnight Financing Rate
| * | Non-income producing security. |
| (a) | All or a portion of security is on loan. The aggregate market value of such securities, including those sold and pending settlement, is $205,783,213; cash collateral of $211,069,564 (included in liabilities) was received with which the Fund purchased highly liquid short-term investments. In the event of significant appreciation in value of securities on loan on the last business day of the reporting period, the Fund may reflect a collateral value that is less than the market value of the loaned securities and such shortfall is remedied the following business day. |
| (b) | Represents security, or portion thereof, purchased with cash collateral received for securities on loan and includes dividend reinvestment. |
| (wb) | Represents an investment in a Fund affiliated with the Manager. |
Fair Value Measurements:
Various inputs are used in determining the value of the Fund’s investments. These inputs are summarized in the three broad levels listed below.
Level 1—unadjusted quoted prices generally in active markets for identical securities.
See Notes to Financial Statements.
18
Level 2—quoted prices for similar securities, interest rates and yield curves, prepayment speeds, foreign currency exchange rates and other observable inputs.
Level 3—unobservable inputs for securities valued in accordance with Board approved fair valuation procedures.
The following is a summary of the inputs used as of September 30, 2023 in valuing such portfolio securities:
| | | | | | | | | | | | | | | |
| | | Level 1 | | Level 2 | | Level 3 |
| Investments in Securities | | | | | | |
| Assets | | | | | | |
| Long-Term Investments | | | | | | |
Common Stocks | | | | | | | | | | | | | | | |
Automobile Components | | | $ | 18,395,930 | | | | $ | — | | | | $ | — | |
Automobiles | | | | 291,795,554 | | | | | — | | | | | — | |
Biotechnology | | | | 98,946,269 | | | | | — | | | | | — | |
Broadline Retail | | | | 564,224,935 | | | | | — | | | | | — | |
Capital Markets | | | | 121,763,674 | | | | | — | | | | | — | |
Consumer Staples Distribution & Retail | | | | 130,208,026 | | | | | — | | | | | — | |
Entertainment | | | | 96,629,728 | | | | | — | | | | | — | |
Financial Services | | | | 374,181,846 | | | | | — | | | | | — | |
Ground Transportation | | | | 135,682,733 | | | | | — | | | | | — | |
Health Care Equipment & Supplies | | | | 110,480,400 | | | | | — | | | | | — | |
Health Care Providers & Services | | | | 65,589,069 | | | | | — | | | | | — | |
Hotels, Restaurants & Leisure | | | | 150,017,409 | | | | | — | | | | | — | |
Interactive Media & Services | | | | 544,361,123 | | | | | — | | | | | — | |
IT Services | | | | 142,034,275 | | | | | — | | | | | — | |
Media | | | | 36,072,711 | | | | | — | | | | | — | |
Personal Care Products | | | | — | | | | | 64,597,730 | | | | | — | |
Pharmaceuticals | | | | 463,836,818 | | | | | — | | | | | — | |
Semiconductors & Semiconductor Equipment | | | | 932,374,295 | | | | | — | | | | | — | |
Software | | | | 959,644,497 | | | | | — | | | | | — | |
Specialized REITs | | | | 53,587,677 | | | | | — | | | | | — | |
Specialty Retail | | | | 258,407,880 | | | | | — | | | | | — | |
Technology Hardware, Storage & Peripherals | | | | 286,197,033 | | | | | — | | | | | — | |
Textiles, Apparel & Luxury Goods | | | | 163,555,382 | | | | | 124,171,908 | | | | | — | |
Preferred Stock | | | | | | | | | | | | | | | |
Automobiles | | | | — | | | | | 38,853,617 | | | | | — | |
| Short-Term Investments | | | | | | |
Affiliated Mutual Funds | | | | 234,956,980 | | | | | — | | | | | — | |
| | | | | | | | | | | | | | | |
Total | | | $ | 6,232,944,244 | | | | $ | 227,623,255 | | | | $ | — | |
| | | | | | | | | | | | | | | |
Industry Classification:
The industry classification of investments and liabilities in excess of other assets shown as a percentage of net assets as of September 30, 2023 were as follows:
| | | | |
Software | | | 15.3 | % |
Semiconductors & Semiconductor Equipment | | | 14.8 | |
Broadline Retail | | | 9.0 | |
| | | | |
Interactive Media & Services | | | 8.7 | % |
Pharmaceuticals | | | 7.4 | |
Financial Services | | | 6.0 | |
See Notes to Financial Statements.
PGIM Jennison Growth Fund 19
Schedule of Investments (continued)
as of September 30, 2023
Industry Classification (continued):
| | | | |
Automobiles | | | 5.2 | % |
Textiles, Apparel & Luxury Goods | | | 4.6 | |
Technology Hardware, Storage & Peripherals | | | 4.5 | |
Specialty Retail | | | 4.1 | |
Affiliated Mutual Funds (3.4% represents investments purchased with collateral from securities on loan) | | | 3.8 | |
Hotels, Restaurants & Leisure | | | 2.4 | |
IT Services | | | 2.3 | |
Ground Transportation | | | 2.2 | |
Consumer Staples Distribution & Retail | | | 2.1 | |
Capital Markets | | | 1.9 | |
Health Care Equipment & Supplies | | | 1.8 | |
| | | | |
Biotechnology | | | 1.6 | % |
Entertainment | | | 1.5 | |
Health Care Providers & Services | | | 1.0 | |
Personal Care Products | | | 1.0 | |
Specialized REITs | | | 0.8 | |
Media | | | 0.6 | |
Automobile Components | | | 0.3 | |
| | | | |
| | | 102.9 | |
Liabilities in excess of other assets | | | (2.9 | ) |
| | | | |
| |
| | | 100.0 | % |
| | | | |
Financial Instruments/Transactions—Summary of Offsetting and Netting Arrangements:
The Fund entered into financial instruments/transactions during the reporting period that are either offset in accordance with current requirements or are subject to enforceable master netting arrangements or similar agreements that permit offsetting. The information about offsetting and related netting arrangements for financial instruments/transactions where the legal right to set-off exists is presented in the summary below.
Offsetting of financial instrument/transaction assets and liabilities:
| | | | | | |
| | | | |
Description | | Gross Market Value of Recognized Assets/(Liabilities) | | Collateral Pledged/(Received)(1) | | Net Amount |
| | | |
Securities on Loan | | $205,783,213 | | $(205,783,213) | | $— |
| (1) | Collateral amount disclosed by the Fund is limited to the market value of financial instruments/transactions. |
See Notes to Financial Statements.
20
Statement of Assets and Liabilities
as of September 30, 2023
| | | | |
Assets | | | | |
Investments at value, including securities on loan of $205,783,213: | | | | |
Unaffiliated investments (cost $3,064,113,939) | | $ | 6,225,610,519 | |
Affiliated investments (cost $234,817,734) | | | 234,956,980 | |
Receivable for investments sold | | | 34,192,263 | |
Receivable for Fund shares sold | | | 5,669,833 | |
Tax reclaim receivable | | | 617,655 | |
Dividends and interest receivable | | | 142,956 | |
Prepaid expenses | | | 29,252 | |
| | | | |
Total Assets | | | 6,501,219,458 | |
| | | | |
| |
Liabilities | | | | |
Payable to broker for collateral for securities on loan | | | 211,069,564 | |
Payable for Fund shares purchased | | | 3,989,264 | |
Management fee payable | | | 3,000,405 | |
Accrued expenses and other liabilities | | | 1,869,861 | |
Payable for investments purchased | | | 572,808 | |
Distribution fee payable | | | 565,583 | |
Affiliated transfer agent fee payable | | | 155,648 | |
Directors’ fees payable | | | 50 | |
| | | | |
Total Liabilities | | | 221,223,183 | |
| | | | |
| |
Net Assets | | $ | 6,279,996,275 | |
| | | | |
| |
| | | | |
Net assets were comprised of: | | | | |
Common stock, at par | | $ | 123,545 | |
Paid-in capital in excess of par | | | 2,721,088,717 | |
Total distributable earnings (loss) | | | 3,558,784,013 | |
| | | | |
Net assets, September 30, 2023 | | $ | 6,279,996,275 | |
| | | | |
See Notes to Financial Statements.
PGIM Jennison Growth Fund 21
Statement of Assets and Liabilities
as of September 30, 2023
| | | | | | | | |
Class A | | | | | | | | |
Net asset value and redemption price per share, ($1,484,562,705 ÷ 31,388,130 shares of common stock issued and outstanding) | | $ | 47.30 | | | | | |
Maximum sales charge (5.50% of offering price) | | | 2.75 | | | | | |
| | | | | | | | |
Maximum offering price to public | | $ | 50.05 | | | | | |
| | | | | | | | |
| | |
| Class C | | | | | | |
Net asset value, offering price and redemption price per share, ($99,388,579 ÷ 3,096,154 shares of common stock issued and outstanding) | | $ | 32.10 | | | | | |
| | | | | | | | |
| | |
| Class R | | | | | | |
Net asset value, offering price and redemption price per share, ($229,495,824 ÷ 5,996,529 shares of common stock issued and outstanding) | | $ | 38.27 | | | | | |
| | | | | | | | |
| | |
| Class Z | | | | | | |
Net asset value, offering price and redemption price per share, ($2,937,775,294 ÷ 54,760,633 shares of common stock issued and outstanding) | | $ | 53.65 | | | | | |
| | | | | | | | |
| | |
| Class R2 | | | | | | |
Net asset value, offering price and redemption price per share, ($1,266,849 ÷ 24,277 shares of common stock issued and outstanding) | | $ | 52.18 | | | | | |
| | | | | | | | |
| | |
| Class R4 | | | | | | |
Net asset value, offering price and redemption price per share, ($15,780,085 ÷ 297,013 shares of common stock issued and outstanding) | | $ | 53.13 | | | | | |
| | | | | | | | |
| | |
| Class R6 | | | | | | |
Net asset value, offering price and redemption price per share, ($1,511,726,939 ÷ 27,982,092 shares of common stock issued and outstanding) | | $ | 54.02 | | | | | |
| | | | | | | | |
See Notes to Financial Statements.
22
Statement of Operations
Year Ended September 30, 2023
| | | | |
Net Investment Income (Loss) | | | | |
Income | | | | |
Unaffiliated dividend income (net of $912,987 foreign withholding tax) | | $ | 37,057,640 | |
Affiliated dividend income | | | 1,034,345 | |
Income from securities lending, net (including affiliated income of $707,255) | | | 707,861 | |
| | | | |
| |
Total income | | | 38,799,846 | |
| | | | |
| |
Expenses | | | | |
Management fee | | | 32,334,798 | |
Distribution fee(a) | | | 6,983,598 | |
Shareholder servicing fees(a) | | | 18,487 | |
Transfer agent’s fees and expenses (including affiliated expense of $829,679)(a) | | | 5,383,152 | |
Custodian and accounting fees | | | 311,869 | |
Shareholders’ reports | | | 227,945 | |
Registration fees(a) | | | 148,320 | |
Directors’ fees | | | 92,209 | |
Professional fees | | | 89,427 | |
Audit fee | | | 24,910 | |
Miscellaneous | | | 178,441 | |
| | | | |
| |
Total expenses | | | 45,793,156 | |
Less: Fee waiver and/or expense reimbursement(a) | | | (10,630 | ) |
Distribution fee waiver(a) | | | (587,279 | ) |
| | | | |
| |
Net expenses | | | 45,195,247 | |
| | | | |
| |
Net investment income (loss) | | | (6,395,401 | ) |
| | | | |
| |
| Realized And Unrealized Gain (Loss) On Investment And Foreign Currency Transactions | | | |
Net realized gain (loss) on: | | | | |
Investment transactions (including affiliated of $64,065) | | | 456,568,042 | |
Foreign currency transactions | | | (36,622 | ) |
| | | | |
| |
| | | 456,531,420 | |
| | | | |
Net change in unrealized appreciation (depreciation) on: | | | | |
Investments (including affiliated of $17,442) | | | 1,025,373,046 | |
Foreign currencies | | | 148,554 | |
| | | | |
| |
| | | 1,025,521,600 | |
| | | | |
| |
Net gain (loss) on investment and foreign currency transactions | | | 1,482,053,020 | |
| | | | |
| |
Net Increase (Decrease) In Net Assets Resulting From Operations | | $ | 1,475,657,619 | |
| | | | |
| (a) | Class specific expenses and waivers were as follows: |
| | | | | | | | | | | | | | | | | | | | | | | | | | | | |
| | | Class A | | | Class C | | | Class R | | | Class Z | | | Class R2 | | | Class R4 | | | Class R6 | |
Distribution fee | | | 4,233,822 | | | | 980,626 | | | | 1,761,838 | | | | — | | | | 7,312 | | | | — | | | | — | |
Shareholder servicing fees | | | — | | | | — | | | | — | | | | — | | | | 2,925 | | | | 15,562 | | | | — | |
Transfer agent’s fees and expenses | | | 1,855,368 | | | | 108,402 | | | | 313,763 | | | | 3,067,714 | | | | 5,382 | | | | 24,437 | | | | 8,086 | |
Registration fees | | | 35,044 | | | | 15,214 | | | | 9,922 | | | | 42,014 | | | | 6,678 | | | | 5,578 | | | | 33,870 | |
Fee waiver and/or expense reimbursement | | | — | | | | — | | | | — | | | | — | | | | (7,049 | ) | | | (3,581 | ) | | | — | |
Distribution fee waiver | | | — | | | | — | | | | (587,279 | ) | | | — | | | | — | | | | — | | | | — | |
See Notes to Financial Statements.
PGIM Jennison Growth Fund 23
Statements of Changes in Net Assets
| | | | | | | | |
| |
| | | Year Ended
September 30, | |
| | |
| | | 2023 | | | 2022 | |
| | |
Increase (Decrease) in Net Assets | | | | | | | | |
Operations | | | | | | | | |
Net investment income (loss) | | $ | (6,395,401 | ) | | $ | (23,094,123 | ) |
Net realized gain (loss) on investment and foreign currency transactions | | | 456,531,420 | | | | 193,970,321 | |
Net change in unrealized appreciation (depreciation) on investments and foreign currencies | | | 1,025,521,600 | | | | (2,949,366,926 | ) |
| | | | | | | | |
| | |
Net increase (decrease) in net assets resulting from operations | | | 1,475,657,619 | | | | (2,778,490,728 | ) |
| | | | | | | | |
| | |
Dividends and Distributions | | | | | | | | |
Distributions from distributable earnings | | | | | | | | |
Class A | | | (33,330,006 | ) | | | (280,939,495 | ) |
Class C | | | (3,483,621 | ) | | | (31,630,818 | ) |
Class R | | | (6,850,731 | ) | | | (53,351,055 | ) |
Class Z | | | (58,070,492 | ) | | | (550,612,131 | ) |
Class R2 | | | (109,679 | ) | | | (811,837 | ) |
Class R4 | | | (311,583 | ) | | | (3,344,480 | ) |
Class R6 | | | (22,191,684 | ) | | | (145,532,237 | ) |
| | | | | | | | |
| | |
| | | (124,347,796 | ) | | | (1,066,222,053 | ) |
| | | | | | | | |
| | |
Fund share transactions (Net of share conversions) | | | | | | | | |
Net proceeds from shares sold | | | 1,193,006,831 | | | | 1,433,891,050 | |
Net asset value of shares issued in reinvestment of dividends and distributions | | | 114,468,735 | | | | 981,630,936 | |
Cost of shares purchased | | | (1,476,921,234 | ) | | | (1,936,395,564 | ) |
| | | | | | | | |
| | |
Net increase (decrease) in net assets from Fund share transactions | | | (169,445,668 | ) | | | 479,126,422 | |
| | | | | | | | |
| | |
Total increase (decrease) | | | 1,181,864,155 | | | | (3,365,586,359 | ) |
| | |
| Net Assets: | | | | | | |
| | |
Beginning of year | | | 5,098,132,120 | | | | 8,463,718,479 | |
| | | | | | | | |
| | |
End of year | | $ | 6,279,996,275 | | | $ | 5,098,132,120 | |
| | | | | | | | |
See Notes to Financial Statements.
24
Financial Highlights
| | | | | | | | | | | | | | | | | | | | |
| Class A Shares | |
| | | Year Ended September 30, | |
| | | | | | |
| | | 2023 | | | 2022 | | | 2021 | | | 2020 | | | 2019 | |
| Per Share Operating Performance(a): | | | | | | | | | | | | | | | | | | | | |
| Net Asset Value, Beginning of Year | | | $37.36 | | | | $64.97 | | | | $57.22 | | | | $39.94 | | | | $42.79 | |
| Income (loss) from investment operations: | | | | | | | | | | | | | | | | | | | | |
| Net investment income (loss) | | | (0.14 | ) | | | (0.27 | ) | | | (0.40 | ) | | | (0.21 | ) | | | (0.09 | ) |
| Net realized and unrealized gain (loss) on investment and foreign currency transactions | | | 11.08 | | | | (18.61 | ) | | | 13.46 | | | | 20.86 | | | | (0.71 | ) |
| Total from investment operations | | | 10.94 | | | | (18.88 | ) | | | 13.06 | | | | 20.65 | | | | (0.80 | ) |
| Less Dividends and Distributions: | | | | | | | | | | | | | | | | | | | | |
| Distributions from net realized gains | | | (1.00 | ) | | | (8.73 | ) | | | (5.31 | ) | | | (3.37 | ) | | | (2.05 | ) |
| Net asset value, end of year | | | $47.30 | | | | $37.36 | | | | $64.97 | | | | $57.22 | | | | $39.94 | |
| Total Return(b): | | | 29.95 | % | | | (34.17 | )% | | | 24.17 | % | | | 55.32 | % | | | (1.25 | )% |
| | |
| Ratios/Supplemental Data: | |
| Net assets, end of year (000) | | | $1,484,563 | | | | $1,277,205 | | | | $2,112,035 | | | | $1,816,527 | | | | $1,266,661 | |
| Average net assets (000) | | | $1,411,274 | | | | $1,753,612 | | | | $2,031,924 | | | | $1,454,874 | | | | $1,257,759 | |
| Ratios to average net assets(c): | | | | | | | | | | | | | | | | | | | | |
| Expenses after waivers and/or expense reimbursement | | | 1.01 | % | | | 0.99 | % | | | 0.97 | % | | | 1.00 | % | | | 1.03 | % |
| Expenses before waivers and/or expense reimbursement | | | 1.01 | % | | | 0.99 | % | | | 0.97 | % | | | 1.00 | % | | | 1.03 | % |
| Net investment income (loss) | | | (0.34 | )% | | | (0.53 | )% | | | (0.65 | )% | | | (0.46 | )% | | | (0.24 | )% |
| Portfolio turnover rate(d) | | | 37 | % | | | 35 | % | | | 46 | % | | | 49 | % | | | 43 | % |
| (a) | Calculated based on average shares outstanding during the year. |
| (b) | Total return does not consider the effects of sales loads. Total return is calculated assuming a purchase of a share on the first day and a sale on the last day of each year reported and includes reinvestment of dividends and distributions, if any. Total returns may reflect adjustments to conform to GAAP. |
| (c) | Does not include expenses of the underlying funds in which the Fund invests. |
| (d) | The Fund’s portfolio turnover rate is calculated in accordance with regulatory requirements, without regard to transactions involving short-term investments, certain derivatives and in-kind transactions (if any). If such transactions were included, the Fund’s portfolio turnover rate may be higher. |
See Notes to Financial Statements.
PGIM Jennison Growth Fund 25
Financial Highlights (continued)
| | | | | | | | | | | | | | | | | | | | |
| Class C Shares | |
| | | Year Ended September 30, | |
| | | | | | |
| | | 2023 | | | 2022 | | | 2021 | | | 2020 | | | 2019 | |
| Per Share Operating Performance(a): | | | | | | | | | | | | | | | | | | | | |
| Net Asset Value, Beginning of Year | | | $25.84 | | | | $47.75 | | | | $43.62 | | | | $31.38 | | | | $34.34 | |
| Income (loss) from investment operations: | | | | | | | | | | | | | | | | | | | | |
| Net investment income (loss) | | | (0.30 | ) | | | (0.43 | ) | | | (0.61 | ) | | | (0.39 | ) | | | (0.27 | ) |
| Net realized and unrealized gain (loss) on investment and foreign currency transactions | | | 7.56 | | | | (12.75 | ) | | | 10.05 | | | | 16.00 | | | | (0.64 | ) |
| Total from investment operations | | | 7.26 | | | | (13.18 | ) | | | 9.44 | | | | 15.61 | | | | (0.91 | ) |
| Less Dividends and Distributions: | | | | | | | | | | | | | | | | | | | | |
| Distributions from net realized gains | | | (1.00 | ) | | | (8.73 | ) | | | (5.31 | ) | | | (3.37 | ) | | | (2.05 | ) |
| Net asset value, end of year | | | $32.10 | | | | $25.84 | | | | $47.75 | | | | $43.62 | | | | $31.38 | |
| Total Return(b): | | | 29.04 | % | | | (34.61 | )% | | | 23.33 | % | | | 54.27 | % | | | (1.92 | )% |
| | |
| Ratios/Supplemental Data: | |
| Net assets, end of year (000) | | | $99,389 | | | | $96,604 | | | | $175,778 | | | | $165,724 | | | | $119,260 | |
| Average net assets (000) | | | $98,063 | | | | $140,735 | | | | $175,013 | | | | $135,568 | | | | $145,286 | |
| Ratios to average net assets(c): | | | | | | | | | | | | | | | | | | | | |
| Expenses after waivers and/or expense reimbursement | | | 1.71 | % | | | 1.68 | % | | | 1.66 | % | | | 1.68 | % | | | 1.70 | % |
| Expenses before waivers and/or expense reimbursement | | | 1.71 | % | | | 1.68 | % | | | 1.66 | % | | | 1.68 | % | | | 1.70 | % |
| Net investment income (loss) | | | (1.03 | )% | | | (1.22 | )% | | | (1.33 | )% | | | (1.13 | )% | | | (0.89 | )% |
| Portfolio turnover rate(d) | | | 37 | % | | | 35 | % | | | 46 | % | | | 49 | % | | | 43 | % |
| (a) | Calculated based on average shares outstanding during the year. |
| (b) | Total return does not consider the effects of sales loads. Total return is calculated assuming a purchase of a share on the first day and a sale on the last day of each year reported and includes reinvestment of dividends and distributions, if any. Total returns may reflect adjustments to conform to GAAP. |
| (c) | Does not include expenses of the underlying funds in which the Fund invests. |
| (d) | The Fund’s portfolio turnover rate is calculated in accordance with regulatory requirements, without regard to transactions involving short-term investments, certain derivatives and in-kind transactions (if any). If such transactions were included, the Fund’s portfolio turnover rate may be higher. |
See Notes to Financial Statements.
26
| | | | | | | | | | | | | | | | | | | | |
| Class R Shares | |
| | |
| | | Year Ended September 30, | |
| | | 2023 | | | 2022 | | | 2021 | | | 2020 | | | 2019 | |
| Per Share Operating Performance(a): | | | | | | | | | | | | | | | | | | | | |
| Net Asset Value, Beginning of Year | | | $30.48 | | | | $54.62 | | | | $48.99 | | | | $34.71 | | | | $37.57 | |
| Income (loss) from investment operations: | | | | | | | | | | | | | | | | | | | | |
| Net investment income (loss) | | | (0.19 | ) | | | (0.31 | ) | | | (0.46 | ) | | | (0.25 | ) | | | (0.15 | ) |
| Net realized and unrealized gain (loss) on investment and foreign currency transactions | | | 8.98 | | | | (15.10 | ) | | | 11.40 | | | | 17.90 | | | | (0.66 | ) |
| Total from investment operations | | | 8.79 | | | | (15.41 | ) | | | 10.94 | | | | 17.65 | | | | (0.81 | ) |
| Less Dividends and Distributions: | | | | | | | | | | | | | | | | | | | | |
| Distributions from net realized gains | | | (1.00 | ) | | | (8.73 | ) | | | (5.31 | ) | | | (3.37 | ) | | | (2.05 | ) |
| Net asset value, end of year | | | $38.27 | | | | $30.48 | | | | $54.62 | | | | $48.99 | | | | $34.71 | |
| Total Return(b): | | | 29.65 | % | | | (34.30 | )% | | | 23.88 | % | | | 54.99 | % | | | (1.46 | )% |
| | |
| Ratios/Supplemental Data: | |
| Net assets, end of year (000) | | | $229,496 | | | | $214,699 | | | | $340,339 | | | | $300,323 | | | | $266,084 | |
| Average net assets (000) | | | $234,912 | | | | $285,127 | | | | $334,043 | | | | $278,701 | | | | $282,917 | |
| Ratios to average net assets(c): | | | | | | | | | | | | | | | | | | | | |
| Expenses after waivers and/or expense reimbursement | | | 1.22 | % | | | 1.21 | % | | | 1.21 | % | | | 1.21 | % | | | 1.23 | % |
| Expenses before waivers and/or expense reimbursement | | | 1.47 | % | | | 1.46 | % | | | 1.46 | % | | | 1.46 | % | | | 1.48 | % |
| Net investment income (loss) | | | (0.54 | )% | | | (0.75 | )% | | | (0.88 | )% | | | (0.66 | )% | | | (0.43 | )% |
| Portfolio turnover rate(d) | | | 37 | % | | | 35 | % | | | 46 | % | | | 49 | % | | | 43 | % |
| (a) | Calculated based on average shares outstanding during the year. |
| (b) | Total return is calculated assuming a purchase of a share on the first day and a sale on the last day of each year reported and includes reinvestment of dividends and distributions, if any. Total returns may reflect adjustments to conform to GAAP. |
| (c) | Does not include expenses of the underlying funds in which the Fund invests. |
| (d) | The Fund’s portfolio turnover rate is calculated in accordance with regulatory requirements, without regard to transactions involving short-term investments, certain derivatives and in-kind transactions (if any). If such transactions were included, the Fund’s portfolio turnover rate may be higher. |
See Notes to Financial Statements.
PGIM Jennison Growth Fund 27
Financial Highlights (continued)
| | | | | | | | | | | | | | | | | | | | |
| Class Z Shares | |
| | | Year Ended September 30, | |
| | | 2023 | | | 2022 | | | 2021 | | | 2020 | | | 2019 | |
| Per Share Operating Performance(a): | | | | | | | | | | | | | | | | | | | | |
| Net Asset Value, Beginning of Year | | | $42.12 | | | | $71.99 | | | | $62.71 | | | | $43.34 | | | | $46.12 | |
| Income (loss) from investment operations: | | | | | | | | | | | | | | | | | | | | |
| Net investment income (loss) | | | (0.01 | ) | | | (0.13 | ) | | | (0.25 | ) | | | (0.07 | ) | | | 0.04 | |
| Net realized and unrealized gain (loss) on investment and foreign currency transactions | | | 12.54 | | | | (21.01 | ) | | | 14.84 | | | | 22.81 | | | | (0.75 | ) |
| Total from investment operations | | | 12.53 | | | | (21.14 | ) | | | 14.59 | | | | 22.74 | | | | (0.71 | ) |
| Less Dividends and Distributions: | | | | | | | | | | | | | | | | | | | | |
| Dividends from net investment income | | | - | | | | - | | | | - | | | | - | | | | (0.02 | ) |
| Distributions from net realized gains | | | (1.00 | ) | | | (8.73 | ) | | | (5.31 | ) | | | (3.37 | ) | | | (2.05 | ) |
| Total dividends and distributions | | | (1.00 | ) | | | (8.73 | ) | | | (5.31 | ) | | | (3.37 | ) | | | (2.07 | ) |
| Net asset value, end of year | | | $53.65 | | | | $42.12 | | | | $71.99 | | | | $62.71 | | | | $43.34 | |
| Total Return(b): | | | 30.35 | % | | | (33.95 | )% | | | 24.51 | % | | | 55.83 | % | | | (0.95 | )% |
| | |
| Ratios/Supplemental Data: | |
| Net assets, end of year (000) | | | $2,937,775 | | | | $2,511,302 | | | | $4,578,256 | | | | $4,149,643 | | | | $3,028,962 | |
| Average net assets (000) | | | $2,749,757 | | | | $3,714,344 | | | | $4,536,203 | | | | $3,436,278 | | | | $3,237,702 | |
| Ratios to average net assets(c): | | | | | | | | | | | | | | | | | | | | |
| Expenses after waivers and/or expense reimbursement | | | 0.69 | % | | | 0.69 | % | | | 0.69 | % | | | 0.69 | % | | | 0.71 | % |
| Expenses before waivers and/or expense reimbursement | | | 0.69 | % | | | 0.69 | % | | | 0.69 | % | | | 0.69 | % | | | 0.71 | % |
| Net investment income (loss) | | | (0.02 | )% | | | (0.23 | )% | | | (0.36 | )% | | | (0.15 | )% | | | 0.09 | % |
| Portfolio turnover rate(d) | | | 37 | % | | | 35 | % | | | 46 | % | | | 49 | % | | | 43 | % |
| (a) | Calculated based on average shares outstanding during the year. |
| (b) | Total return is calculated assuming a purchase of a share on the first day and a sale on the last day of each year reported and includes reinvestment of dividends and distributions, if any. Total returns may reflect adjustments to conform to GAAP. |
| (c) | Does not include expenses of the underlying funds in which the Fund invests. |
| (d) | The Fund’s portfolio turnover rate is calculated in accordance with regulatory requirements, without regard to transactions involving short-term investments, certain derivatives and in-kind transactions (if any). If such transactions were included, the Fund’s portfolio turnover rate may be higher. |
See Notes to Financial Statements.
28
| | | | | | | | | | | | | | | | | | | | |
| Class R2 Shares | |
| | | Year Ended September 30, | |
| | | 2023 | | | 2022 | | | 2021 | | | 2020 | | | 2019 | |
| Per Share Operating Performance(a): | | | | | | | | | | | | | | | | | | | | |
| Net Asset Value, Beginning of Year | | | $41.16 | | | | $70.81 | | | | $61.99 | | | | $43.05 | | | | $45.99 | |
| Income (loss) from investment operations: | | | | | | | | | | | | | | | | | | | | |
| Net investment income (loss) | | | (0.16 | ) | | | (0.35 | ) | | | (0.52 | ) | | | (0.27 | ) | | | (0.14 | ) |
| Net realized and unrealized gain (loss) on investment and foreign currency transactions | | | 12.18 | | | | (20.57 | ) | | | 14.65 | | | | 22.58 | | | | (0.75 | ) |
| Total from investment operations | | | 12.02 | | | | (20.92 | ) | | | 14.13 | | | | 22.31 | | | | (0.89 | ) |
| Less Dividends and Distributions: | | | | | | | | | | | | | | | | | | | | |
| Distributions from net realized gains | | | (1.00 | ) | | | (8.73 | ) | | | (5.31 | ) | | | (3.37 | ) | | | (2.05 | ) |
| Net asset value, end of year | | | $52.18 | | | | $41.16 | | | | $70.81 | | | | $61.99 | | | | $43.05 | |
| Total Return(b): | | | 29.86 | % | | | (34.23 | )% | | | 24.00 | % | | | 55.19 | % | | | (1.37 | )% |
| | |
| Ratios/Supplemental Data: | |
| Net assets, end of year (000) | | | $1,267 | | | | $4,516 | | | | $6,175 | | | | $4,534 | | | | $3,084 | |
| Average net assets (000) | | | $2,925 | | | | $5,804 | | | | $5,521 | | | | $3,663 | | | | $5,033 | |
| Ratios to average net assets(c): | | | | | | | | | | | | | | | | | | | | |
| Expenses after waivers and/or expense reimbursement | | | 1.10 | % | | | 1.10 | % | | | 1.10 | % | | | 1.10 | % | | | 1.10 | % |
| Expenses before waivers and/or expense reimbursement | | | 1.34 | % | | | 1.21 | % | | | 1.24 | % | | | 1.45 | % | | | 1.41 | % |
| Net investment income (loss) | | | (0.37 | )% | | | (0.63 | )% | | | (0.78 | )% | | | (0.56 | )% | | | (0.33 | )% |
| Portfolio turnover rate(d) | | | 37 | % | | | 35 | % | | | 46 | % | | | 49 | % | | | 43 | % |
| (a) | Calculated based on average shares outstanding during the year. |
| (b) | Total return is calculated assuming a purchase of a share on the first day and a sale on the last day of each year reported and includes reinvestment of dividends and distributions, if any. Total returns may reflect adjustments to conform to GAAP. |
| (c) | Does not include expenses of the underlying funds in which the Fund invests. |
| (d) | The Fund’s portfolio turnover rate is calculated in accordance with regulatory requirements, without regard to transactions involving short-term investments, certain derivatives and in-kind transactions (if any). If such transactions were included, the Fund’s portfolio turnover rate may be higher. |
See Notes to Financial Statements.
PGIM Jennison Growth Fund 29
Financial Highlights (continued)
| | | | | | | | | | | | | | | | | | | | |
| Class R4 Shares | |
| | |
| | | Year Ended September 30, | |
| | | 2023 | | | 2022 | | | 2021 | | | 2020 | | | 2019 | |
| Per Share Operating Performance(a): | | | | | | | | | | | | | | | | | | | | |
| Net Asset Value, Beginning of Year | | | $41.78 | | | | $71.59 | | | | $62.48 | | | | $43.26 | | | | $46.08 | |
| Income (loss) from investment operations: | | | | | | | | | | | | | | | | | | | | |
| Net investment income (loss) | | | (0.08 | ) | | | (0.22 | ) | | | (0.37 | ) | | | (0.15 | ) | | | (0.03 | ) |
| Net realized and unrealized gain (loss) on investment and foreign currency transactions | | | 12.43 | | | | (20.86 | ) | | | 14.79 | | | | 22.74 | | | | (0.74 | ) |
| Total from investment operations | | | 12.35 | | | | (21.08 | ) | | | 14.42 | | | | 22.59 | | | | (0.77 | ) |
| Less Dividends and Distributions: | | | | | | | | | | | | | | | | | | | | |
| Distributions from net realized gains | | | (1.00 | ) | | | (8.73 | ) | | | (5.31 | ) | | | (3.37 | ) | | | (2.05 | ) |
| Net asset value, end of year | | | $53.13 | | | | $41.78 | | | | $71.59 | | | | $62.48 | | | | $43.26 | |
| Total Return(b): | | | 30.16 | % | | | (34.07 | )% | | | 24.30 | % | | | 55.59 | % | | | (1.09 | )% |
| | |
| Ratios/Supplemental Data: | |
| Net assets, end of year (000) | | | $15,780 | | | | $16,676 | | | | $27,267 | | | | $6,840 | | | | $3,969 | |
| Average net assets (000) | | | $15,562 | | | | $22,892 | | | | $11,773 | | | | $4,883 | | | | $4,125 | |
| Ratios to average net assets(c): | | | | | | | | | | | | | | | | | | | | |
| Expenses after waivers and/or expense reimbursement | | | 0.85 | % | | | 0.85 | % | | | 0.85 | % | | | 0.85 | % | | | 0.85 | % |
| Expenses before waivers and/or expense reimbursement | | | 0.87 | % | | | 0.88 | % | | | 0.85 | % | | | 1.12 | % | | | 1.22 | % |
| Net investment income (loss) | | | (0.17 | )% | | | (0.39 | )% | | | (0.52 | )% | | | (0.31 | )% | | | (0.06 | )% |
| Portfolio turnover rate(d) | | | 37 | % | | | 35 | % | | | 46 | % | | | 49 | % | | | 43 | % |
| (a) | Calculated based on average shares outstanding during the year. |
| (b) | Total return is calculated assuming a purchase of a share on the first day and a sale on the last day of each year reported and includes reinvestment of dividends and distributions, if any. Total returns may reflect adjustments to conform to GAAP. |
| (c) | Does not include expenses of the underlying funds in which the Fund invests. |
| (d) | The Fund’s portfolio turnover rate is calculated in accordance with regulatory requirements, without regard to transactions involving short-term investments, certain derivatives and in-kind transactions (if any). If such transactions were included, the Fund’s portfolio turnover rate may be higher. |
See Notes to Financial Statements.
30
| | | | | | | | | | | | | | | | | | | | |
| Class R6 Shares | |
| | | Year Ended September 30, | |
| | | 2023 | | | 2022 | | | 2021 | | | 2020 | | | 2019 | |
| Per Share Operating Performance(a): | | | | | | | | | | | | | | | | | | | | |
| Net Asset Value, Beginning of Year | | | $42.36 | | | | $72.29 | | | | $62.87 | | | | $43.41 | | | | $46.19 | |
| Income (loss) from investment operations: | | | | | | | | | | | | | | | | | | | | |
| Net investment income (loss) | | | 0.04 | (b) | | | (0.06 | ) | | | (0.18 | ) | | | (0.02 | ) | | | 0.08 | |
| Net realized and unrealized gain (loss) on investment and foreign currency transactions | | | 12.62 | | | | (21.14 | ) | | | 14.91 | | | | 22.85 | | | | (0.75 | ) |
| Total from investment operations | | | 12.66 | | | | (21.20 | ) | | | 14.73 | | | | 22.83 | | | | (0.67 | ) |
| Less Dividends and Distributions: | | | | | | | | | | | | | | | | | | | | |
| Dividends from net investment income | | | - | | | | - | | | | - | | | | - | | | | (0.06 | ) |
| Distributions from net realized gains | | | (1.00 | ) | | | (8.73 | ) | | | (5.31 | ) | | | (3.37 | ) | | | (2.05 | ) |
| Total dividends and distributions | | | (1.00 | ) | | | (8.73 | ) | | | (5.31 | ) | | | (3.37 | ) | | | (2.11 | ) |
| Net asset value, end of year | | | $54.02 | | | | $42.36 | | | | $72.29 | | | | $62.87 | | | | $43.41 | |
| Total Return(c): | | | 30.49 | % | | | (33.88 | )% | | | 24.64 | % | | | 55.98 | % | | | (0.83 | )% |
| | |
| Ratios/Supplemental Data: | |
| Net assets, end of year (000) | | | $1,511,727 | | | | $977,130 | | | | $1,223,868 | | | | $609,443 | | | | $349,897 | |
| Average net assets (000) | | | $1,216,561 | | | | $1,183,306 | | | | $951,504 | | | | $427,945 | | | | $205,755 | |
| Ratios to average net assets(d): | | | | | | | | | | | | | | | | | | | | |
| Expenses after waivers and/or expense reimbursement | | | 0.58 | % | | | 0.58 | % | | | 0.57 | % | | | 0.58 | % | | | 0.59 | % |
| Expenses before waivers and/or expense reimbursement | | | 0.58 | % | | | 0.58 | % | | | 0.57 | % | | | 0.58 | % | | | 0.59 | % |
| Net investment income (loss) | | | 0.09 | % | | | (0.10 | )% | | | (0.26 | )% | | | (0.04 | )% | | | 0.19 | % |
| Portfolio turnover rate(e) | | | 37 | % | | | 35 | % | | | 46 | % | | | 49 | % | | | 43 | % |
| (a) | Calculated based on average shares outstanding during the year. |
| (b) | The per share amount of net investment income (loss) does not directly correlate to the amounts reported in the Statement of Operations due to class specific expenses. |
| (c) | Total return is calculated assuming a purchase of a share on the first day and a sale on the last day of each year reported and includes reinvestment of dividends and distributions, if any. Total returns may reflect adjustments to conform to GAAP. |
| (d) | Does not include expenses of the underlying funds in which the Fund invests. |
| (e) | The Fund’s portfolio turnover rate is calculated in accordance with regulatory requirements, without regard to transactions involving short-term investments, certain derivatives and in-kind transactions (if any). If such transactions were included, the Fund’s portfolio turnover rate may be higher. |
See Notes to Financial Statements.
PGIM Jennison Growth Fund 31
Notes to Financial Statements
1. Organization
The Prudential Investment Portfolios, Inc. (the “Registered Investment Company” or “RIC”) is registered under the Investment Company Act of 1940, as amended (“1940 Act”), as an open-end management investment company. The RIC is organized as a Maryland Corporation. These financial statements relate only to the PGIM Jennison Growth Fund (the “Fund”), a series of the RIC. The Fund is classified as a diversified fund for purposes of the 1940 Act.
The investment objective of the Fund is to achieve long-term growth of capital.
2. Accounting Policies
The Fund follows the investment company accounting and reporting guidance of the Financial Accounting Standards Board (“FASB”) Accounting Standard Codification (“ASC”) Topic 946 Financial Services — Investment Companies. The following is a summary of significant accounting policies followed by the Fund in the preparation of its financial statements. The policies conform to U.S. generally accepted accounting principles (��GAAP”). The Fund consistently follows such policies in the preparation of its financial statements.
Securities Valuation: The Fund holds securities and other assets and liabilities that are fair valued as of the close of each day (generally, 4:00 PM Eastern time) the New York Stock Exchange (“NYSE”) is open for trading. As described in further detail below, the Fund’s investments are valued daily based on a number of factors, including the type of investment and whether market quotations are readily available. The RIC’s Board of Directors (the “Board”) has approved the Fund’s valuation policies and procedures for security valuation and designated PGIM Investments LLC (“PGIM Investments” or the “Manager”) as the “Valuation Designee,” as defined by Rule 2a-5(b) under the 1940 Act, to perform the fair value determination relating to all Fund investments. Pursuant to the Board’s oversight, the Valuation Designee has established a Valuation Committee to perform the duties and responsibilities as Valuation Designee under Rule 2a-5. The valuation procedures permit the Fund to utilize independent pricing vendor services, quotations from market makers, and alternative valuation methods when market quotations are either not readily available or not deemed representative of fair value. Fair value is the estimated price that would be received to sell an asset or paid to transfer a liability in an orderly transaction between market participants on the measurement date.
For the fiscal reporting year-end, securities and other assets and liabilities were fair valued at the close of the last U.S. business day. Trading in certain foreign securities may occur when the NYSE is closed (including weekends and holidays). Because such foreign securities trade in markets that are open on weekends and U.S. holidays, the values of some of the
32
Fund’s foreign investments may change on days when investors cannot purchase or redeem Fund shares.
Various inputs determine how the Fund’s investments are valued, all of which are categorized according to the three broad levels (Level 1, 2, or 3) detailed in the Schedule of Investments and referred to herein as the “fair value hierarchy” in accordance with FASB ASC Topic 820 — Fair Value Measurement.
Common or preferred stocks, exchange-traded funds (ETFs) and derivative instruments, if applicable, that are traded on a national securities exchange are valued at the last sale price as of the close of trading on the applicable exchange where the security principally trades. Securities traded via NASDAQ are valued at the NASDAQ official closing price. To the extent these securities are valued at the last sale price or NASDAQ official closing price, they are classified as Level 1 in the fair value hierarchy. In the event that no sale or official closing price on a valuation date exists, these securities are generally valued at the mean between the last reported bid and ask prices, or at the last bid price in the absence of an ask price. These securities are classified as Level 2 in the fair value hierarchy.
Foreign equities traded on foreign securities exchanges are generally valued using pricing vendor services that provide model prices derived using adjustment factors based on information such as local closing price, relevant general and sector indices, currency fluctuations, depositary receipts, and futures, as applicable. Securities valued using such model prices are classified as Level 2 in the fair value hierarchy. The models generate an evaluated adjustment factor for each security, which is applied to the local closing price to adjust it for post closing market movements up to the time the Fund is valued. Utilizing that evaluated adjustment factor, the vendor provides an evaluated price for each security. If the vendor does not provide an evaluated price, securities are valued in accordance with exchange-traded common and preferred stock valuation policies discussed above.
Investments in open-end funds (other than ETFs) are valued at their net asset values as of the close of the NYSE on the date of valuation. These securities are classified as Level 1 in the fair value hierarchy since they may be purchased or sold at their net asset values on the date of valuation.
Securities and other assets that cannot be priced according to the methods described above are valued based on policies and procedures approved by the Board. In the event that unobservable inputs are used when determining such valuations, the securities will be classified as Level 3 in the fair value hierarchy. Altering one or more unobservable inputs may result in a significant change to a Level 3 security’s fair value measurement.
When determining the fair value of securities, some of the factors influencing the valuation include: the nature of any restrictions on disposition of the securities; assessment of the general liquidity of the securities; the issuer’s financial condition and the markets in which it does business; the cost of the investment; the size of the holding and the capitalization of the issuer; the prices of any recent transactions or bids/offers for such securities or any
PGIM Jennison Growth Fund 33
Notes to Financial Statements (continued)
comparable securities; and any available analyst media or other reports or information deemed reliable by the Valuation Designee regarding the issuer or the markets or industry in which it operates. Using fair value to price securities may result in a value that is different from a security’s most recent closing price and from the price used by other unaffiliated mutual funds to calculate their net asset values.
Foreign Currency Translation: The books and records of the Fund are maintained in U.S. dollars. Foreign currency amounts are translated into U.S. dollars on the following basis:
(i) market value of investment securities, other assets and liabilities — at the exchange rate as of the valuation date;
(ii) purchases and sales of investment securities, income and expenses — at the rates of exchange prevailing on the respective dates of such transactions.
Although the net assets of the Fund are presented at the foreign exchange rates and market values at the close of the period, the Fund does not generally isolate that portion of the results of operations arising as a result of changes in the foreign exchange rates from the fluctuations arising from changes in the market prices of long-term portfolio securities held at the end of the period. Similarly, the Fund does not isolate the effect of changes in foreign exchange rates from the fluctuations arising from changes in the market prices of long-term portfolio securities sold during the period. Accordingly, holding period unrealized and realized foreign currency gains (losses) are included in the reported net change in unrealized appreciation (depreciation) on investments and net realized gains (losses) on investment transactions on the Statements of Operations.
Net realized gains (losses) on foreign currency transactions represent net foreign exchange gains (losses) from the disposition of holdings of foreign currencies, currency gains (losses) realized between the trade and settlement dates on investment transactions, and the difference between the amounts of interest, dividends and foreign withholding taxes recorded on the Fund’s books and the U.S. dollar equivalent amounts actually received or paid. Net unrealized currency gains (losses) arise from valuing foreign currency denominated assets and liabilities (other than investments) at period end exchange rates.
Master Netting Arrangements: The RIC, on behalf of the Fund, is subject to various Master Agreements, or netting arrangements, with select counterparties. These are agreements which a subadviser may have negotiated and entered into on behalf of all or a portion of the Fund. A master netting arrangement between the Fund and the counterparty permits the Fund to offset amounts payable by the Fund to the same counterparty against amounts to be received and by the receipt of collateral from the counterparty by the Fund to cover the Fund’s exposure to the counterparty. However, there is no assurance that such
34
mitigating factors are easily enforceable. In addition to master netting arrangements, the right to set-off exists when all the conditions are met such that each of the parties owes the other determinable amounts, the reporting party has the right to set-off the amount owed with the amount owed by the other party, the reporting party intends to set-off and the right of set-off is enforceable by law.
Securities Lending: The Fund lends its portfolio securities to banks and broker-dealers. The loans are secured by collateral at least equal to the market value of the securities loaned. Collateral pledged by each borrower is invested in an affiliated money market fund and is marked to market daily, based on the previous day’s market value, such that the value of the collateral exceeds the value of the loaned securities. In the event of significant appreciation in value of the securities on loan on the last business day of the reporting period, the financial statements may reflect a collateral value that is less than the market value of the loaned securities. Such shortfall is remedied as described above. Loans are subject to termination at the option of the borrower or the Fund. Upon termination of the loan, the borrower will return to the Fund securities identical to the loaned securities. The remaining open loans of the securities lending transactions are considered overnight and continuous. Should the borrower of the securities fail financially, the Fund has the right to repurchase the securities in the open market using the collateral.
The Fund recognizes income, net of any rebate and securities lending agent fees, for lending its securities in the form of fees or interest on the investment of any cash received as collateral. The borrower receives all interest and dividends from the securities loaned and such payments are passed back to the lender in amounts equivalent thereto, which are reflected in interest income or unaffiliated dividend income based on the nature of the payment on the Statement of Operations. The Fund also continues to recognize any unrealized gain (loss) in the market price of the securities loaned and on the change in the value of the collateral invested that may occur during the term of the loan. In addition, realized gain (loss) is recognized on changes in the value of the collateral invested upon liquidation of the collateral. Net earnings from securities lending are disclosed in the Statement of Operations.
Equity and Mortgage Real Estate Investment Trusts (collectively REITs): The Fund invested in REITs, which report information on the source of their distributions annually. Based on current and historical information, a portion of distributions received from REITs during the period is estimated to be dividend income, capital gain or return of capital and recorded accordingly. When material, these estimates are adjusted periodically when the actual source of distributions is disclosed by the REITs.
Securities Transactions and Net Investment Income: Securities transactions are recorded on the trade date. Realized gains (losses) from investment and currency transactions are calculated on the specific identification method. Dividend income is recorded on the ex-date, or for certain foreign securities, when the Fund becomes aware of such dividends. Expenses are recorded on an accrual basis, which may require the use of certain estimates by management that may differ from actual expense amounts. Net investment income or
PGIM Jennison Growth Fund 35
Notes to Financial Statements (continued)
loss (other than class specific expenses and waivers, which are allocated as noted below) and unrealized and realized gains (losses) are allocated daily to each class of shares based upon the relative proportion of adjusted net assets of each class at the beginning of the day. Class specific expenses and waivers, where applicable, are charged to the respective share classes. Such class specific expenses and waivers include distribution fees and distribution fee waivers, shareholder servicing fees, transfer agent’s fees and expenses, registration fees and fee waivers and/or expense reimbursements, as applicable.
Taxes: It is the Fund’s policy to continue to meet the requirements of the Internal Revenue Code applicable to regulated investment companies and to distribute all of its taxable net investment income and capital gains, if any, to its shareholders. Therefore, no federal income tax provision is required. Withholding taxes on foreign dividends, interest and capital gains, if any, are recorded, net of reclaimable amounts, at the time the related income is earned.
Dividends and Distributions: Dividends and distributions to shareholders, which are determined in accordance with federal income tax regulations and which may differ from GAAP, are recorded on the ex-date. Permanent book/tax differences relating to income and gain (loss) are reclassified between total distributable earnings (loss) and paid-in capital in excess of par, as appropriate. The chart below sets forth the expected frequency of dividend and capital gains distributions to shareholders. Various factors may impact the frequency of dividend distributions to shareholders, including but not limited to adverse market conditions or portfolio holding-specific events.
| | | | |
| | |
| Expected Distribution Schedule to Shareholders* | | Frequency | |
Net Investment Income | | | Annually | |
Short-Term Capital Gains | | | Annually | |
Long-Term Capital Gains | | | Annually | |
| * | Under certain circumstances, the Fund may make more than one distribution of short-term and/or long-term capital gains during a fiscal year. |
Estimates: The preparation of financial statements requires management to make estimates and assumptions that affect the reported amounts and disclosures in the financial statements. Actual results could differ from those estimates.
3. Agreements
The RIC, on behalf of the Fund, has a management agreement with the Manager pursuant to which it has responsibility for all investment advisory services, including supervision of the subadviser’s performance of such services, and for rendering administrative services.
36
The Manager has entered into a subadvisory agreement with Jennison Associates LLC (“Jennison” or the “Subadviser”). The Manager pays for the services of Jennison.
Fees payable under the management agreement are computed daily and paid monthly. For the reporting period ended September 30, 2023, the contractual and effective management fee rates were as follows:
| | | | | |
| | |
| Contractual Management Rate | | Effective Management Fee, before any waivers
and/or expense reimbursements |
0.60% of average daily net assets up to and including $300 million; | | | | 0.56 | % |
0.575% on next $2.7 billion of average daily net assets | | | | | |
0.55% on the average daily net asset over $3 billion | | | | | |
The Manager has contractually agreed, through January 31, 2025, to limit certain operating expenses and/or to limit total annual operating expenses after fee waivers and/or expense reimbursements. The contractual waiver and expense limitation excludes interest, brokerage, taxes (such as income and foreign withholding taxes, stamp duty and deferred tax expenses), acquired fund fees and expenses, and certain other Fund expenses such as dividend and interest expense and broker charges on short sales.
Where applicable, the Manager agrees to waive management fees or shared operating expenses on any share class to the same extent that it waives such expenses on any other share class. In addition, total annual operating expenses for Class R6 shares will not exceed total annual operating expenses for Class Z shares. Fees and/or expenses waived and/or reimbursed by the Manager for purpose of preventing the expenses from exceeding a certain expense ratio limit may be recouped by the Manager within the same fiscal year during which such waiver and/or reimbursement is made if such recoupment can be realized without exceeding the expense limit in effect at the time of the recoupment for that fiscal year. The expense limitations attributable to each class are as follows:
| | | | | |
| | |
| Class | | Expense
Limitations |
A | | | | — | % |
C | | | | — | |
R | | | | — | |
Z | | | | — | |
R2 | | | | 1.10 | * |
R4 | | | | 0.85 | * |
R6 | | | | 0.60 | |
*Expense limitation applicable only to blue sky fees, shareholder service fee, and transfer agency expenses (including sub-transfer agency and networking fees).
The RIC, on behalf of the Fund, has a distribution agreement with Prudential Investment Management Services LLC (“PIMS”), which acts as the distributor of the Class A, Class C, Class R, Class Z, Class R2, Class R4 and Class R6 shares of the Fund. The Fund compensates PIMS for distributing and servicing the Fund’s Class A, Class C, Class R and
PGIM Jennison Growth Fund 37
Notes to Financial Statements (continued)
Class R2 shares, pursuant to the plans of distribution (the “Distribution Plans”), regardless of expenses actually incurred by PIMS.
Pursuant to the Distribution Plans, the Fund compensates PIMS for distribution related activities at an annual rate based on average daily net assets per class. PIMS has contractually agreed through January 31, 2025 to limit such fees on certain classes based on the average daily net assets. The distribution fees are accrued daily and payable monthly.
The Fund has adopted a Shareholder Services Plan with respect to Class R2 and Class R4 shares. Under the terms of the Shareholder Services Plan, Class R2 and Class R4 shares are authorized to compensate Prudential Mutual Fund Services LLC (“PMFS”), its affiliates or third-party service providers for services rendered to the shareholders of such Class R2 or Class R4 shares. The shareholder service fee is accrued daily and paid monthly, as applicable.
The Fund’s annual gross and net distribution rates and maximum shareholder service fee, where applicable, are as follows:
| | | | | | | | | | | | | | | |
| | | | |
| Class | | Gross Distribution Fee | | Net Distribution Fee | | Shareholder Service Fee |
A | | | | 0.30 | % | | | | 0.30 | % | | | | N/A | % |
C | | | | 1.00 | | | | | 1.00 | | | | | N/A | |
R | | | | 0.75 | | | | | 0.50 | | | | | N/A | |
Z | | | | N/A | | | | | N/A | | | | | N/A | |
R2 | | | | 0.25 | | | | | 0.25 | | | | | 0.10 | |
R4 | | | | N/A | | | | | N/A | | | | | 0.10 | |
R6 | | | | N/A | | | | | N/A | | | | | N/A | |
For the year ended September 30, 2023, PIMS received front-end sales charges (“FESL”) resulting from sales of certain class shares and contingent deferred sales charges (“CDSC”) imposed upon redemptions by certain shareholders. From these fees, PIMS paid such sales charges to broker-dealers, who in turn paid commissions to salespersons and incurred other distribution costs. The sales charges are as follows where applicable:
| | | | | | | | | | |
| | | |
| Class | | FESL | | CDSC |
A | | | | $864,168 | | | | | $1,802 | |
C | | | | — | | | | | 11,691 | |
PGIM Investments, PIMS, PMFS and Jennison are indirect, wholly-owned subsidiaries of Prudential Financial, Inc. (“Prudential”).
38
4. Other Transactions with Affiliates
PMFS serves as the Fund’s transfer agent and shareholder servicing agent. Transfer agent’s and shareholder servicing agent’s fees and expenses in the Statement of Operations include certain out-of-pocket expenses paid to non-affiliates, where applicable.
The Fund may invest its overnight sweep cash in the PGIM Core Government Money Market Fund (the “Core Government Fund”), a series of the Prudential Government Money Market Fund, Inc., and its securities lending cash collateral in the PGIM Institutional Money Market Fund (the “Money Market Fund”), a series of Prudential Investment Portfolios 2, each registered under the 1940 Act and managed by PGIM Investments. PGIM Investments and/or its affiliates are paid fees or reimbursed for providing their services to the Core Government Fund and the Money Market Fund. In addition to the realized and unrealized gains on investments in the Core Government Fund and the Money Market Fund, earnings from such investments are disclosed on the Statement of Operations as “Affiliated dividend income” and “Income from securities lending, net”, respectively.
The Fund may enter into certain securities purchase or sale transactions under Board approved Rule 17a-7 procedures. Rule 17a-7 is an exemptive rule under the 1940 Act that, subject to certain conditions, permits purchase and sale transactions among affiliated investment companies, or between an investment company and a person that is affiliated solely by reason of having a common (or affiliated) investment adviser, common directors/trustees, and/or common officers. For the year ended September 30, 2023, no Rule 17a-7 transactions were entered into by the Fund.
5. Portfolio Securities
The aggregate cost of purchases and proceeds from sales of portfolio securities (excluding short-term investments and U.S. Government securities) for the reporting period ended September 30, 2023, were as follows:
| | |
| Cost of Purchases | | Proceeds from Sales |
| $2,116,116,451 | | $2,461,878,497 |
A summary of the cost of purchases and proceeds from sales of shares of affiliated mutual funds for the year ended September 30, 2023, is presented as follows:
| | | | | | | | | | | | | | | | | | | | | | | | | | | | | | | | | | | |
Value,
Beginning
of Year | | Cost of
Purchases | | Proceeds
from Sales | | Change in
Unrealized
Gain (Loss) | | Realized
Gain (Loss) | | Value,
End of Year | | Shares, End of Year | | Income |
|
Short-Term Investments - Affiliated Mutual Funds: | |
|
PGIM Core Government Money Market Fund(1)(wb) | |
$ — | | | | $ 717,101,742 | | | | | $ 694,415,473 | | | | | $ — | | | | | $ — | | | | | $ 22,686,269 | | | | | 22,686,269 | | | | | $1,034,345 | |
PGIM Jennison Growth Fund 39
Notes to Financial Statements (continued)
| | | | | | | | | | | | | | | | | | | | | | | | | | | | | | | | | | | |
Value,
Beginning
of Year | | Cost of
Purchases | | Proceeds
from Sales | | Change in
Unrealized
Gain (Loss) | | Realized
Gain (Loss) | | Value,
End of Year | | Shares, End of Year | | Income |
|
PGIM Institutional Money Market Fund(1)(b)(wb) | |
$211,699,967 | | | $ | 3,592,321,950 | | | | $ | 3,591,832,713 | | | | $ | 17,442 | | | | $ | 64,065 | | | | $ | 212,270,711 | | | | | 212,398,150 | | | | $ | 707,255 | (2) |
$211,699,967 | | | $ | 4,309,423,692 | | | | $ | 4,286,248,186 | | | | $ | 17,442 | | | | $ | 64,065 | | | | $ | 234,956,980 | | | | | | | | | $ | 1,741,600 | |
| (1) | The Fund did not have any capital gain distributions during the reporting period. |
| (2) | The amount, or a portion thereof, represents the affiliated securities lending income shown on the Statement of Operations. |
| (b) | Represents security, or portion thereof, purchased with cash collateral received for securities on loan and includes dividend reinvestment. |
| (wb) | Represents an investment in a Fund affiliated with the Manager. |
6. Distributions and Tax Information
Distributions to shareholders, which are determined in accordance with federal income tax regulations and which may differ from GAAP, are recorded on the ex-date. In order to present total distributable earnings (loss) and paid-in capital in excess of par on the Statement of Assets and Liabilities that more closely represent their tax character, certain adjustments have been made to total distributable earnings (loss) and paid-in capital in excess of par for the Fund. The adjustments were due to a net operating loss.
For the year ended September 30, 2023, the adjustments were as follows:
| | |
Total Distributable Earnings (Loss) | | Paid-in Capital in Excess of Par |
| $12,252,153 | | $(12,252,153) |
For the year ended September 30, 2023, the tax character of dividends paid as reflected in the Statement of Changes in Net Assets were as follows:
| | | | | | |
Ordinary Income | | Long-Term Capital Gains | | Tax Return of Capital | | Total Dividends and Distributions |
| $— | | $124,347,796 | | $— | | $124,347,796 |
For the year ended September 30, 2022, the tax character of dividends paid as reflected in the Statement of Changes in Net Assets were as follows:
| | | | | | |
Ordinary Income | | Long-Term Capital Gains | | Tax Return of Capital | | Total Dividends and Distributions |
| $20,080,985 | | $1,046,141,068 | | $— | | $1,066,222,053 |
40
For the year ended September 30, 2023, the Fund had the following amounts of accumulated undistributed earnings on a tax basis:
| | |
Undistributed Ordinary Income | | Undistributed Long-Term Capital Gains |
| $— | | $450,418,544 |
The United States federal income tax basis of the Fund’s investments and the net unrealized appreciation as of September 30, 2023 were as follows:
| | | | | | |
| Tax Basis | | Gross Unrealized Appreciation | | Gross Unrealized Depreciation | | Net Unrealized Appreciation |
| $3,345,956,387 | | $3,252,417,668 | | $(137,806,556) | | $3,114,611,112 |
The difference between GAAP and tax basis was primarily attributable to deferred losses on wash sales.
The Fund elected to treat the below approximated losses as having been incurred in the following fiscal year (September 30, 2024).
| | |
Qualified Late-Year Losses | | Post-October Capital Losses |
| $6,231,000 | | $— |
The Manager has analyzed the Fund’s tax positions taken on federal, state and local income tax returns for all open tax years and has concluded that no provision for income tax is required in the Fund’s financial statements for the current reporting period. Since tax authorities can examine previously filed tax returns, the Fund’s U.S. federal and state tax returns for each of the four fiscal years up to the most recent fiscal year ended September 30, 2023 are subject to such review.
7. Capital and Ownership
The Fund offers Class A, Class C, Class R, Class Z, Class R2, Class R4 and Class R6 shares. Class A shares are sold with a maximum front-end sales charge of 5.50%. Investors who purchase $1 million or more of Class A shares and sell these shares within 12 months of purchase are subject to a CDSC of 1%, although they are not subject to an initial sales charge. The Class A CDSC is waived for certain retirement and/or benefit plans. A special exchange privilege is also available for shareholders who qualified to purchase Class A shares at net asset value. Class C shares are sold with a CDSC of 1% on sales made within 12 months of purchase. Class C shares will automatically convert to Class A shares on a monthly basis approximately eight years (ten years prior to January 22, 2021) after purchase. Class R, Class Z, Class R2, Class R4 and Class R6 shares are not subject to any sales or redemption charges and are available exclusively for sale to a limited group of investors.
PGIM Jennison Growth Fund 41
Notes to Financial Statements (continued)
Under certain circumstances, an exchange may be made from specified share classes of the Fund to one or more other share classes of the Fund as presented in the table of transactions in shares of common stock, below.
The RIC is authorized to issue 6,625,000,000 shares of common stock at $0.001 par value per share, 1,897,000,000 of which are designated as shares of the Fund. The authorized shares of the Fund are currently classified and designated as follows:
| | | | | |
| | |
| Class | | Number of Shares |
A | | | | 125,000,000 | |
B | | | | 2,000,000 | |
C | | | | 25,000,000 | |
R | | | | 220,000,000 | |
Z | | | | 825,000,000 | |
T | | | | 50,000,000 | |
R2 | | | | 125,000,000 | |
R4 | | | | 250,000,000 | |
R6 | | | | 275,000,000 | |
The Fund currently does not have any Class B or Class T shares outstanding.
As of September 30, 2023, Prudential, through its affiliated entities, including affiliated funds (if applicable), owned shares of the Fund as follows:
| | | | | | | | | | |
| | | |
| Class | | Number of Shares | | Percentage of Outstanding Shares |
Z | | | | 23,740 | | | | | 0.1 | % |
At the reporting period end, the number of shareholders holding greater than 5% of the Fund are as follows:
| | | | |
| | | |
| | | Number of Shareholders | | Percentage of Outstanding Shares |
Affiliated | | — | | —% |
Unaffiliated | | 5 | | 49.0 |
42
Transactions in shares of common stock were as follows:
| | | | | | | | | | |
| | | |
| Share Class | | Shares | | Amount |
| | |
Class A | | | | | | | | | | |
Year ended September 30, 2023: | | | | | | | | | | |
Shares sold | | | | 1,700,644 | | | | $ | 72,653,005 | |
Shares issued in reinvestment of dividends and distributions | | | | 858,634 | | | | | 32,370,492 | |
Shares purchased | | | | (5,192,104 | ) | | | | (220,403,451 | ) |
Net increase (decrease) in shares outstanding before conversion | | | | (2,632,826 | ) | | | | (115,379,954 | ) |
Shares issued upon conversion from other share class(es) | | | | 345,778 | | | | | 14,846,455 | |
Shares purchased upon conversion into other share class(es) | | | | (507,516 | ) | | | | (22,562,851 | ) |
Net increase (decrease) in shares outstanding | | | | (2,794,564 | ) | | | $ | (123,096,350 | ) |
| | |
Year ended September 30, 2022: | | | | | | | | | | |
Shares sold | | | | 2,518,893 | | | | $ | 125,549,488 | |
Shares issued in reinvestment of dividends and distributions | | | | 4,512,099 | | | | | 271,808,819 | |
Shares purchased | | | | (5,613,880 | ) | | | | (277,498,540 | ) |
Net increase (decrease) in shares outstanding before conversion | | | | 1,417,112 | | | | | 119,859,767 | |
Shares issued upon conversion from other share class(es) | | | | 562,485 | | | | | 26,831,881 | |
Shares purchased upon conversion into other share class(es) | | | | (306,289 | ) | | | | (15,692,564 | ) |
Net increase (decrease) in shares outstanding | | | | 1,673,308 | | | | $ | 130,999,084 | |
| | |
Class C | | | | | | | | | | |
Year ended September 30, 2023: | | | | | | | | | | |
Shares sold | | | | 399,630 | | | | $ | 11,831,360 | |
Shares issued in reinvestment of dividends and distributions | | | | 132,693 | | | | | 3,414,199 | |
Shares purchased | | | | (771,379 | ) | | | | (21,716,430 | ) |
Net increase (decrease) in shares outstanding before conversion | | | | (239,056 | ) | | | | (6,470,871 | ) |
Shares purchased upon conversion into other share class(es) | | | | (403,198 | ) | | | | (11,774,524 | ) |
Net increase (decrease) in shares outstanding | | | | (642,254 | ) | | | $ | (18,245,395 | ) |
| | |
Year ended September 30, 2022: | | | | | | | | | | |
Shares sold | | | | 484,360 | | | | $ | 17,229,035 | |
Shares issued in reinvestment of dividends and distributions | | | | 735,280 | | | | | 30,800,876 | |
Shares purchased | | | | (790,483 | ) | | | | (26,800,468 | ) |
Net increase (decrease) in shares outstanding before conversion | | | | 429,157 | | | | | 21,229,443 | |
Shares issued upon conversion from other share class(es) | | | | 459 | | | | | 21,948 | |
Shares purchased upon conversion into other share class(es) | | | | (372,474 | ) | | | | (13,363,708 | ) |
Net increase (decrease) in shares outstanding | | | | 57,142 | | | | $ | 7,887,683 | |
PGIM Jennison Growth Fund 43
Notes to Financial Statements (continued)
| | | | | | | | | | |
| | | |
| Share Class | | Shares | | Amount |
| | |
Class R | | | | | | | | | | |
Year ended September 30, 2023: | | | | | | | | | | |
Shares sold | | | | 661,303 | | | | $ | 20,332,297 | |
Shares issued in reinvestment of dividends and distributions | | | | 224,105 | | | | | 6,848,640 | |
Shares purchased | | | | (1,932,768 | ) | | | | (68,255,844 | ) |
Net increase (decrease) in shares outstanding before conversion | | | | (1,047,360 | ) | | | | (41,074,907 | ) |
Shares purchased upon conversion into other share class(es) | | | | (481 | ) | | | | (15,871 | ) |
Net increase (decrease) in shares outstanding | | | | (1,047,841 | ) | | | $ | (41,090,778 | ) |
| | |
Year ended September 30, 2022: | | | | | | | | | | |
Shares sold | | | | 1,118,410 | | | | $ | 40,186,734 | |
Shares issued in reinvestment of dividends and distributions | | | | 1,082,946 | | | | | 53,302,609 | |
Shares purchased | | | | (1,387,975 | ) | | | | (55,041,083 | ) |
Net increase (decrease) in shares outstanding before conversion | | | | 813,381 | | | | | 38,448,260 | |
Shares purchased upon conversion into other share class(es) | | | | (308 | ) | | | | (15,701 | ) |
Net increase (decrease) in shares outstanding | | | | 813,073 | | | | $ | 38,432,559 | |
| | |
Class Z | | | | | | | | | | |
Year ended September 30, 2023: | | | | | | | | | | |
Shares sold | | | | 11,971,624 | | | | $ | 581,284,236 | |
Shares issued in reinvestment of dividends and distributions | | | | 1,250,305 | | | | | 53,325,489 | |
Shares purchased | | | | (18,130,588 | ) | | | | (864,325,328 | ) |
Net increase (decrease) in shares outstanding before conversion | | | | (4,908,659 | ) | | | | (229,715,603 | ) |
Shares issued upon conversion from other share class(es) | | | | 316,262 | | | | | 15,128,984 | |
Shares purchased upon conversion into other share class(es) | | | | (270,350 | ) | | | | (13,509,114 | ) |
Net increase (decrease) in shares outstanding | | | | (4,862,747 | ) | | | $ | (228,095,733 | ) |
| | |
Year ended September 30, 2022: | | | | | | | | | | |
Shares sold | | | | 12,560,769 | | | | $ | 698,009,778 | |
Shares issued in reinvestment of dividends and distributions | | | | 7,292,571 | | | | | 493,998,764 | |
Shares purchased | | | | (23,824,334 | ) | | | | (1,279,165,787 | ) |
Net increase (decrease) in shares outstanding before conversion | | | | (3,970,994 | ) | | | | (87,157,245 | ) |
Shares issued upon conversion from other share class(es) | | | | 333,549 | | | | | 19,165,538 | |
Shares purchased upon conversion into other share class(es) | | | | (332,945 | ) | | | | (17,096,518 | ) |
Net increase (decrease) in shares outstanding | | | | (3,970,390 | ) | | | $ | (85,088,225 | ) |
44
| | | | | | | | | | |
| | | |
| Share Class | | Shares | | Amount |
| | |
Class R2 | | | | | | | | | | |
Year ended September 30, 2023: | | | | | | | | | | |
Shares sold | | | | 17,971 | | | | $ | 907,809 | |
Shares issued in reinvestment of dividends and distributions | | | | 2,635 | | | | | 109,679 | |
Shares purchased | | | | (106,036 | ) | | | | (4,971,735 | ) |
Net increase (decrease) in shares outstanding | | | | (85,430 | ) | | | $ | (3,954,247 | ) |
| | |
Year ended September 30, 2022: | | | | | | | | | | |
Shares sold | | | | 26,851 | | | | $ | 1,519,972 | |
Shares issued in reinvestment of dividends and distributions | | | | 12,223 | | | | | 811,837 | |
Shares purchased | | | | (16,568 | ) | | | | (850,236 | ) |
Net increase (decrease) in shares outstanding | | | | 22,506 | | | | $ | 1,481,573 | |
| | |
Class R4 | | | | | | | | | | |
Year ended September 30, 2023: | | | | | | | | | | |
Shares sold | | | | 18,448 | | | | $ | 890,718 | |
Shares issued in reinvestment of dividends and distributions | | | | 6,953 | | | | | 294,128 | |
Shares purchased | | | | (127,491 | ) | | | | (5,803,545 | ) |
Net increase (decrease) in shares outstanding | | | | (102,090 | ) | | | $ | (4,618,699 | ) |
| | |
Year ended September 30, 2022: | | | | | | | | | | |
Shares sold | | | | 43,081 | | | | $ | 2,585,918 | |
Shares issued in reinvestment of dividends and distributions | | | | 39,077 | | | | | 2,629,896 | |
Shares purchased | | | | (63,921 | ) | | | | (3,463,260 | ) |
Net increase (decrease) in shares outstanding | | | | 18,237 | | | | $ | 1,752,554 | |
| | |
Class R6 | | | | | | | | | | |
Year ended September 30, 2023: | | | | | | | | | | |
Shares sold | | | | 10,082,656 | | | | $ | 505,107,406 | |
Shares issued in reinvestment of dividends and distributions | | | | 421,857 | | | | | 18,106,108 | |
Shares purchased | | | | (5,926,649 | ) | | | | (291,444,901 | ) |
Net increase (decrease) in shares outstanding before conversion | | | | 4,577,864 | | | | | 231,768,613 | |
Shares issued upon conversion from other share class(es) | | | | 338,919 | | | | | 17,932,684 | |
Shares purchased upon conversion into other share class(es) | | | | (809 | ) | | | | (45,763 | ) |
Net increase (decrease) in shares outstanding | | | | 4,915,974 | | | | $ | 249,655,534 | |
PGIM Jennison Growth Fund 45
Notes to Financial Statements (continued)
| | | | | | | | | | |
| | | |
| Share Class | | Shares | | Amount |
| | |
Year ended September 30, 2022: | | | | | | | | | | |
Shares sold | | | | 9,514,430 | | | | $ | 548,810,125 | |
Shares issued in reinvestment of dividends and distributions | | | | 1,884,503 | | | | | 128,278,135 | |
Shares purchased | | | | (5,267,568 | ) | | | | (293,576,190 | ) |
Net increase (decrease) in shares outstanding before conversion | | | | 6,131,365 | | | | | 383,512,070 | |
Shares issued upon conversion from other share class(es) | | | | 5,389 | | | | | 253,670 | |
Shares purchased upon conversion into other share class(es) | | | | (1,763 | ) | | | | (104,546 | ) |
Net increase (decrease) in shares outstanding | | | | 6,134,991 | | | | $ | 383,661,194 | |
8. Borrowings
The RIC, on behalf of the Fund, along with other affiliated registered investment companies (the “Participating Funds”), is a party to a Syndicated Credit Agreement (“SCA”) with a group of banks. The purpose of the SCA is to provide an alternative source of temporary funding for capital share redemptions. The table below provides details of the current SCA in effect at the reporting period-end as well as the prior SCA.
| | | | |
| | | |
| | | Current SCA | | Prior SCA |
| Term of Commitment | | 9/29/2023 - 9/26/2024 | | 9/30/2022 – 9/28/2023 |
| Total Commitment | | $ 1,200,000,000 | | $ 1,200,000,000 |
Annualized Commitment Fee on the Unused Portion of the SCA | | 0.15% | | 0.15% |
Annualized Interest Rate on Borrowings | | 1.00% plus the higher of (1)
the effective federal funds
rate, (2) the daily SOFR rate
plus 0.10% or (3) zero
percent | | 1.00% plus the higher of (1)
the effective federal funds
rate, (2) the daily SOFR rate
plus 0.10% or (3) zero
percent |
Certain affiliated registered investment companies that are parties to the SCA include portfolios that are subject to a predetermined mathematical formula used to manage certain benefit guarantees offered under variable annuity contracts. The formula may result in large scale asset flows into and out of these portfolios. Consequently, these portfolios may be more likely to utilize the SCA for purposes of funding redemptions. It may be possible for those portfolios to fully exhaust the committed amount of the SCA, thereby requiring the Manager to allocate available funding per a Board-approved methodology designed to treat the Participating Funds in the SCA equitably.
The Fund utilized the SCA during the year ended September 30, 2023. The average daily balance for the 25 days that the Fund had loans outstanding during the period was approximately $6,128,200, borrowed at a weighted average interest rate of 4.91%. The maximum loan outstanding amount during the period was $42,431,000. At September 30,
46
2023, the Fund did not have an outstanding loan amount.
9. Risks of Investing in the Fund
Economic and Market Events Risk: Events in the U.S. and global financial markets, including actions taken by the U.S. Federal Reserve or foreign central banks to stimulate or stabilize economic growth or the functioning of the securities markets, or otherwise reduce inflation, may at times result in unusually high market volatility, which could negatively impact performance. Governmental efforts to curb inflation often have negative effects on the level of economic activity. Relatively reduced liquidity in credit and fixed income markets could adversely affect issuers worldwide.
Equity and Equity-Related Securities Risk: Equity and equity-related securities may be subject to changes in value, and their values may be more volatile than those of other asset classes. In addition to an individual security losing value, the value of the equity markets or a sector in which the Fund invests could go down. Different parts of a market can react differently to adverse issuer, market, regulatory, political and economic developments.
Foreign Securities Risk: Investments in securities of non-U.S. issuers (including those denominated in U.S. dollars) may involve more risk than investing in securities of U.S. issuers. Foreign political, economic and legal systems, especially those in developing and emerging market countries, may be less stable and more volatile than in the United States. Foreign legal systems generally have fewer regulatory requirements than the U.S. legal system, particularly those of emerging markets. In general, less information is publicly available with respect to non-U.S. companies than U.S. companies. Non-U.S. companies generally are not subject to the same accounting, auditing, and financial reporting standards as are U.S. companies. Additionally, the changing value of foreign currencies and changes in exchange rates could also affect the value of the assets the Fund holds and the Fund’s performance. Certain foreign countries may impose restrictions on the ability of issuers of foreign securities to make payment of principal and interest or dividends to investors located outside the country, due to blockage of foreign currency exchanges or otherwise. Investments in emerging markets are subject to greater volatility and price declines.
In addition, the Fund’s investments in non-U.S. securities may be subject to the risks of nationalization or expropriation of assets, imposition of currency exchange controls or restrictions on the repatriation of non-U.S. currency, confiscatory taxation and adverse diplomatic developments. Special U.S. tax considerations may apply.
Growth Style Risk: The Fund’s growth style may subject the Fund to above-average fluctuations as a result of seeking higher than average capital growth. Growth stocks are generally more sensitive to market movements than other types of stocks primarily because their stock prices are based heavily on future expectations. Historically, growth stocks have performed best during later stages of economic expansion and value stocks have performed best during periods of economic recovery. Growth company stocks also typically lack the dividend yield that can lessen price declines in market downturns. Since the Fund follows a
PGIM Jennison Growth Fund 47
Notes to Financial Statements (continued)
growth investment style, there is the risk that the growth investment style may be out of favor for a period of time. At times when the style is out of favor, the Fund may underperform the market in general, its benchmark and other mutual funds.
Increase in Expenses Risk: Your actual cost of investing in the Fund may be higher than the expenses shown in the expense table of the Fund’s prospectus for a variety of reasons. For example, expense ratios may be higher than those shown if average net assets decrease. Net assets are more likely to decrease and Fund expense ratios are more likely to increase when markets are volatile. Active and frequent trading of Fund securities can increase expenses.
Large Shareholder and Large Scale Redemption Risk: Certain individuals, accounts, funds (including funds affiliated with the Manager) or institutions, including the Manager and its affiliates, may from time to time own or control a substantial amount of the Fund’s shares. There is no requirement that these entities maintain their investment in the Fund. There is a risk that such large shareholders or that the Fund’s shareholders generally may redeem all or a substantial portion of their investments in the Fund in a short period of time, which could have a significant negative impact on the Fund’s NAV, liquidity, and brokerage costs. Large redemptions could also result in tax consequences to shareholders and impact the Fund’s ability to implement its investment strategy. The Fund’s ability to pursue its investment objective after one or more large scale redemptions may be impaired and, as a result, the Fund may invest a larger portion of its assets in cash or cash equivalents.
Management Risk: Actively managed funds are subject to management risk. The subadviser will apply investment techniques and risk analyses in making investment decisions for the Fund, but the subadviser’s judgments about the attractiveness, value or market trends affecting a particular security, industry or sector or about market movements may be incorrect. Additionally, the investments selected for the Fund may underperform the markets in general, the Fund’s benchmark and other funds with similar investment objectives.
Market Capitalization Risk: The Fund may invest in companies of any market capitalization. Generally, the stock prices of small- and mid-cap companies are less stable than the prices of large-cap stocks and may present greater risks. Large capitalization companies as a group could fall out of favor with the market, causing the Fund to underperform compared to investments that focus on smaller capitalized companies.
Market Disruption and Geopolitical Risks: Market disruption can be caused by economic, financial or political events and factors, including but not limited to, international wars or conflicts (including Russia’s military invasion of Ukraine), geopolitical developments (including trading and tariff arrangements, sanctions and cybersecurity attacks), instability
48
in regions such as Asia, Eastern Europe and the Middle East, terrorism, natural disasters and public health epidemics (including the outbreak of COVID-19 globally).
The extent and duration of such events and resulting market disruptions cannot be predicted, but could be substantial and could magnify the impact of other risks to the Fund. These and other similar events could adversely affect the U.S. and foreign financial markets and lead to increased market volatility, reduced liquidity in the securities markets, significant negative impacts on issuers and the markets for certain securities and commodities and/or government intervention. They may also cause short- or long-term economic uncertainties in the United States and worldwide. As a result, whether or not the Fund invests in securities of issuers located in or with significant exposure to the countries directly affected, the value and liquidity of the Fund’s investments may be negatively impacted. Further, due to closures of certain markets and restrictions on trading certain securities, the value of certain securities held by the Fund could be significantly impacted, which could lead to such securities being valued at zero.
Market Risk: Securities markets may be volatile and the market prices of the Fund’s securities may decline. Securities fluctuate in price based on changes in an issuer’s financial condition and overall market and economic conditions. If the market prices of the securities owned by the Fund fall, the value of your investment in the Fund will decline.
10. Recent Regulatory Developments
Effective January 24, 2023, the SEC adopted rule and form amendments to require mutual funds and ETFs to transmit concise and visually engaging streamlined annual and semiannual reports to shareholders that highlight key information deemed important for retail investors to assess and monitor their fund investments (the “Rule”). Other information, including financial statements, will no longer appear in the funds’ streamlined shareholder reports but must be available online, delivered free of charge upon request, and filed on a semiannual basis on Form N-CSR. The Rule and form amendments have a compliance date of July 24, 2024. At this time, management is evaluating the Rule and its impact to the Fund.
PGIM Jennison Growth Fund 49
Report of Independent Registered Public Accounting Firm
To the Board of Directors of The Prudential Investment Portfolios, Inc. and Shareholders of PGIM Jennison Growth Fund
Opinion on the Financial Statements
We have audited the accompanying statement of assets and liabilities, including the schedule of investments, of PGIM Jennison Growth Fund (one of the funds constituting The Prudential Investment Portfolios, Inc., referred to hereafter as the “Fund”) as of September 30, 2023, the related statement of operations for the year ended September 30, 2023, the statements of changes in net assets for each of the two years in the period ended September 30, 2023, including the related notes, and the financial highlights for each of the four years in the period ended September 30, 2023 (collectively referred to as the “financial statements”). In our opinion, the financial statements present fairly, in all material respects, the financial position of the Fund as of September 30, 2023, the results of its operations for the year then ended, the changes in its net assets for each of the two years in the period ended September 30, 2023 and the financial highlights for each of the four years in the period ended September 30, 2023 in conformity with accounting principles generally accepted in the United States of America.
The financial statements of the Fund as of and for the year ended September 30, 2019 and the financial highlights for each of the periods ended on or prior to September 30, 2019 (not presented herein, other than the financial highlights) were audited by other auditors whose report dated November 15, 2019 expressed an unqualified opinion on those financial statements and financial highlights.
Basis for Opinion
These financial statements are the responsibility of the Fund’s management. Our responsibility is to express an opinion on the Fund’s financial statements based on our audits. We are a public accounting firm registered with the Public Company Accounting Oversight Board (United States) (PCAOB) and are required to be independent with respect to the Fund in accordance with the U.S. federal securities laws and the applicable rules and regulations of the Securities and Exchange Commission and the PCAOB.
We conducted our audits of these financial statements in accordance with the standards of the PCAOB. Those standards require that we plan and perform the audit to obtain reasonable assurance about whether the financial statements are free of material misstatement, whether due to error or fraud.
Our audits included performing procedures to assess the risks of material misstatement of the financial statements, whether due to error or fraud, and performing procedures that respond to those risks. Such procedures included examining, on a test basis, evidence regarding the amounts and disclosures in the financial statements. Our audits also included evaluating the accounting principles used and significant estimates made by management, as well as evaluating the overall presentation of the financial statements. Our procedures included confirmation of securities owned as of September 30, 2023 by correspondence with the custodian, transfer agent and brokers. We believe that our audits provide a reasonable basis for our opinion.
/s/PricewaterhouseCoopers LLP
New York, New York
November 16, 2023
We have served as the auditor of one or more investment companies in the PGIM Retail Funds complex since 2020.
50
Tax Information (unaudited)
We are advising you that during the fiscal year ended September 30, 2023, the Fund reported the maximum amount allowed per share, but not less than $1.00 for Class A, C, R, Z, R2, R4 and R6 shares as a capital gain distribution in accordance with Section 852(b)(3)(C) of the Internal Revenue Code.
In January 2024, you will be advised on IRS Form 1099-DIV or substitute 1099-DIV, as to the federal tax status of distributions received by you in calendar year 2023.
PGIM Jennison Growth Fund 51
INFORMATION ABOUT BOARD MEMBERS AND OFFICERS (unaudited)
Information about Board Members and Officers of the Fund is set forth below. Board Members who are not deemed to be “interested persons” of the Fund, as defined in the 1940 Act, are referred to as “Independent Board Members.” Board Members who are deemed to be “interested persons” of the Fund are referred to as “Interested Board Members.” The Board Members are responsible for the overall supervision of the operations of the Fund and perform the various duties imposed on the directors of investment companies by the 1940 Act. The Board in turn elects the Officers, who are responsible for administering the day-to-day operations of the Fund.
| | | | | | |
| |
| Independent Board Members |
| | | | |
Name Year of Birth Position(s) Portfolios Overseen | | Principal Occupation(s) During Past Five Years | | Other Directorships Held During Past Five Years | | Length of Board Service |
| | | | |
Ellen S. Alberding
1958
Board Member
Portfolios Overseen: 97 | | Chief Executive Officer (“CEO”) and President, The Joyce Foundation (charitable foundation) (since 2002); formerly Vice Chair, City Colleges of Chicago (community college system) (2011-2015); formerly Trustee, National Park Foundation (charitable foundation for national park system) (2009-2018); formerly Trustee, Economic Club of Chicago (2009-2016); Trustee, Loyola University (since 2018). | | None. | | Since September 2013 |
| | | | |
Kevin J. Bannon
1952
Board Member
Portfolios Overseen: 98 | | Retired; formerly Managing Director (April 2008-May 2015) and Chief Investment Officer (October 2008-November 2013) of Highmount Capital LLC (registered investment adviser); formerly Executive Vice President and Chief Investment Officer (April 1993-August 2007) of Bank of New York Company; formerly President (May 2003-May 2007) of BNY Hamilton Family of Mutual Funds. | | Director of Urstadt Biddle Properties (equity real estate investment trust) (since September 2008). | | Since July 2008 |
PGIM Jennison Growth Fund
| | | | | | |
| |
| Independent Board Members |
| | | | |
Name Year of Birth Position(s) Portfolios Overseen | | Principal Occupation(s) During Past Five Years | | Other Directorships Held During Past Five Years | | Length of Board Service |
| | | | |
Linda W. Bynoe 1952 Board Member Portfolios Overseen: 95 | | President and Chief Executive Officer (since March 1995) and formerly Chief Operating Officer (December 1989-February 1995) of Telemat Limited LLC (formerly Telemat Ltd) (management consulting); formerly Vice President (January 1985-June 1989) at Morgan Stanley & Co. (broker-dealer). | | Trustee of Equity Residential (residential real estate) (since December 2009); Director of Northern Trust Corporation (financial services) (since April 2006); formerly Director of Anixter International, Inc. (communication products distributor) (January 2006-June 2020). | | Since March 2005 |
| | | | |
Barry H. Evans 1960 Board Member Portfolios Overseen: 98 | | Retired; formerly President (2005-2016), Global Chief Operating Officer (2014-2016), Chief Investment Officer - Global Head of Fixed Income (1998-2014), and various portfolio manager roles (1986-2006), Manulife Asset Management (asset management). | | Formerly Director, Manulife Trust Company (2011-2018); formerly Director, Manulife Asset Management Limited (2015-2017); formerly Chairman of the Board of Directors of Manulife Asset Management U.S. (2005-2016); formerly Chairman of the Board, Declaration Investment Management and Research (2008-2016). | | Since September 2017 |
| | | | |
Keith F. Hartstein 1956 Board Member & Independent Chair Portfolios Overseen: 98 | | Retired; formerly Member (November 2014-September 2022) of the Governing Council of the Independent Directors Council (IDC) (organization of independent mutual fund directors); formerly Executive Committee of the IDC Board of Governors (October 2019-December 2021); formerly President and Chief Executive Officer (2005-2012), Senior Vice President (2004-2005), Senior Vice President of Sales and Marketing (1997-2004), and various executive management positions (1990-1997), John Hancock Funds, LLC (asset management); formerly Chairman, Investment Company Institute’s Sales Force Marketing Committee (2003-2008). | | None. | | Since September 2013 |
Visit our website at pgim.com/investments
| | | | | | |
| |
| Independent Board Members |
| | | | |
Name Year of Birth Position(s) Portfolios Overseen | | Principal Occupation(s) During Past Five Years | | Other Directorships Held During Past Five Years | | Length of Board Service |
| | | | |
Laurie Simon Hodrick 1962 Board Member Portfolios Overseen: 95 | | A. Barton Hepburn Professor Emerita of Economics in the Faculty of Business, Columbia Business School (since 2018); Visiting Fellow at the Hoover Institution, Stanford University (since 2015); Sole Member, ReidCourt LLC (since 2008) (a consulting firm); formerly Visiting Professor of Law, Stanford Law School (2015-2021); formerly A. Barton Hepburn Professor of Economics in the Faculty of Business, Columbia Business School (1996-2017); formerly Managing Director, Global Head of Alternative Investment Strategies, Deutsche Bank (2006-2008). | | Independent Director, Andela (since January 2022) (global talent network); Independent Director, Roku (since December 2020) (communication services); formerly Independent Director, Synnex Corporation (2019-2021) (information technology); formerly Independent Director, Kabbage, Inc. (2018-2020) (financial services); formerly Independent Director, Corporate Capital Trust (2017-2018) (a business development company). | | Since September 2017 |
| | | | |
Brian K. Reid 1961 Board Member Portfolios Overseen: 98 | | Retired; formerly Chief Economist for the Investment Company Institute (ICI) (2005-2017); formerly Senior Economist and Director of Industry and Financial Analysis at the ICI (1998-2004); formerly Senior Economist, Industry and Financial Analysis at the ICI (1996-1998); formerly Staff Economist at the Federal Reserve Board (1989-1996); formerly Director, ICI Mutual Insurance Company (2012-2017). | | None. | | Since March 2018 |
PGIM Jennison Growth Fund
| | | | | | |
| |
| Independent Board Members |
| | | | |
Name Year of Birth Position(s) Portfolios Overseen | | Principal Occupation(s) During Past Five Years | | Other Directorships Held During Past Five Years | | Length of Board Service |
| | | | |
Grace C. Torres 1959 Board Member Portfolios Overseen: 98 | | Retired; formerly Treasurer and Principal Financial and Accounting Officer of the PGIM Funds, Target Funds, Advanced Series Trust, Prudential Variable Contract Accounts and The Prudential Series Fund (1998-June 2014); Assistant Treasurer (March 1999-June 2014) and Senior Vice President (September 1999-June 2014) of PGIM Investments LLC; Assistant Treasurer (May 2003-June 2014) and Vice President (June 2005-June 2014) of AST Investment Services, Inc.; Senior Vice President and Assistant Treasurer (May 2003-June 2014) of Prudential Annuities Advisory Services, Inc. | | Director (since January 2018) of OceanFirst Financial Corp. and OceanFirst Bank; formerly Director (July 2015-January 2018) of Sun Bancorp, Inc. N.A. and Sun National Bank. | | Since November 2014 |
Visit our website at pgim.com/investments
| | | | | | |
| |
| Interested Board Members |
| | | | |
Name Year of Birth Position(s) Portfolios Overseen | | Principal Occupation(s) During Past Five Years | | Other Directorships Held During Past Five Years | | Length of Board Service |
| | | | |
Stuart S. Parker 1962 Board Member & President Portfolios Overseen: 98 | | President, Chief Executive Officer, Chief Operating Officer and Officer in Charge of PGIM Investments LLC (formerly known as Prudential Investments LLC) (since January 2012); President and Principal Executive Officer (“PEO”) (since September 2022) of the PGIM Private Credit Fund; President and PEO (since March 2022) of the PGIM Private Real Estate Fund, Inc.; formerly Executive Vice President of Jennison Associates LLC and Head of Retail Distribution of PGIM Investments LLC (June 2005-December 2011); Investment Company Institute - Board of Governors (since May 2012). | | None. | | Since January 2012 |
| | | | |
Scott E. Benjamin 1973 Board Member & Vice President Portfolios Overseen: 98 | | Executive Vice President (since May 2009) of PGIM Investments LLC; Vice President (since June 2012) of Prudential Investment Management Services LLC; Executive Vice President (since September 2009) of AST Investment Services, Inc.; Senior Vice President of Product Development and Marketing, PGIM Investments (since February 2006); Vice President (since September 2022) of the PGIM Private Credit Fund; Vice President (since March 2022) of the PGIM Private Real Estate Fund, Inc.; formerly Vice President of Product Development and Product Management, PGIM Investments LLC (2003-2006). | | None. | | Since March 2010 |
PGIM Jennison Growth Fund
| | | | |
| |
| Fund Officers(a) |
| | | |
Name Year of Birth Fund Position | | Principal Occupation(s) During Past Five Years | | Length of Service as Fund Officer |
| | | |
Claudia DiGiacomo 1974 Chief Legal Officer | | Chief Legal Officer (since September 2022) of the PGIM Private Credit Fund; Chief Legal Officer (since July 2022) of the PGIM Private Real Estate Fund, Inc.; Chief Legal Officer, Executive Vice President and Secretary of PGIM Investments LLC (since August 2020); Chief Legal Officer of Prudential Mutual Fund Services LLC (since August 2020); Chief Legal Officer of PIFM Holdco, LLC (since August 2020); Vice President and Corporate Counsel (since January 2005) of Prudential; and Corporate Counsel of AST Investment Services, Inc. (since August 2020); formerly Vice President and Assistant Secretary of PGIM Investments LLC (2005-2020); formerly Associate at Sidley Austin Brown & Wood LLP (1999-2004). | | Since December 2005 |
| | | |
Andrew Donohue 1972 Chief Compliance Officer | | Chief Compliance Officer (since May 2023) of the PGIM Funds, Target Funds, PGIM ETF Trust, PGIM Global High Yield Fund, Inc., PGIM High Yield Bond Fund, Inc., PGIM Short Duration High Yield Opportunities Fund, Advanced Series Trust, The Prudential Series Fund, Prudential’s Gibraltar Fund, Inc., PGIM Private Credit Fund, PGIM Private Real Estate Fund, Inc.; Chief Compliance Officer of AST Investment Services, Inc. (since October 2022); Vice President, Chief Compliance Officer of PGIM Investments LLC (since September 2022); formerly various senior compliance roles within Principal Global Investors, LLC., global asset management for Principal Financial (2011-2022), most recently as Global Chief Compliance Officer (2016-2022). | | Since May 2023 |
| | | |
Andrew R. French 1962 Secretary | | Vice President (since December 2018) of PGIM Investments LLC; Secretary (since September 2022) of the PGIM Private Credit Fund; Secretary (since March 2022) of the PGIM Private Real Estate Fund, Inc.; formerly Vice President and Corporate Counsel (2010-2018) of Prudential; formerly Director and Corporate Counsel (2006-2010) of Prudential; Vice President and Assistant Secretary (since January 2007) of PGIM Investments LLC; Vice President and Assistant Secretary (since January 2007) of Prudential Mutual Fund Services LLC. | | Since October 2006 |
| | | |
Melissa Gonzalez 1980 Assistant Secretary | | Vice President and Corporate Counsel (since September 2018) of Prudential; Vice President and Assistant Secretary (since August 2020) of PGIM Investments LLC; Assistant Secretary (since September 2022) of the PGIM Private Credit Fund; Assistant Secretary (since March 2022) of the PGIM Private Real Estate Fund, Inc.; formerly Director and Corporate Counsel (March 2014-September 2018) of Prudential. | | Since March 2020 |
Visit our website at pgim.com/investments
| | | | |
| |
| Fund Officers(a) |
| | | |
Name Year of Birth Fund Position | | Principal Occupation(s) During Past Five Years | | Length of Service as Fund Officer |
| | | |
Patrick E. McGuinness 1986 Assistant Secretary | | Vice President and Assistant Secretary (since August 2020) of PGIM Investments LLC; Director and Corporate Counsel (since February 2017) of Prudential; Assistant Secretary (since September 2022) of the PGIM Private Credit Fund; Assistant Secretary (since March 2022) of the PGIM Private Real Estate Fund, Inc. | | Since June 2020 |
| | | |
Debra Rubano 1975 Assistant Secretary | | Vice President and Corporate Counsel (since November 2020) of Prudential; Assistant Secretary (since September 2022) of the PGIM Private Credit Fund; Assistant Secretary (since March 2022) of the PGIM Private Real Estate Fund, Inc; formerly Director and Senior Counsel of Allianz Global Investors U.S. Holdings LLC (2010-2020) and Assistant Secretary of numerous funds in the Allianz fund complex (2015-2020). | | Since December 2020 |
| | | |
Kelly A. Coyne 1968 Assistant Secretary | | Director, Investment Operations of Prudential Mutual Fund Services LLC (since 2010); Assistant Secretary (since September 2022) of the PGIM Private Credit Fund; Assistant Secretary (since March 2022) of the PGIM Private Real Estate Fund, Inc. | | Since March 2015 |
| | | |
Christian J. Kelly 1975 Chief Financial Officer | | Vice President, Global Head of Fund Administration of PGIM Investments LLC (since November 2018); Chief Financial Officer (since March 2023) of PGIM Investments mutual funds, closed end funds and ETFs, Advanced Series Trust Portfolios, Prudential Series Funds and Prudential Gibraltar Fund; Chief Financial Officer of PGIM Private Credit Fund (since September 2022); Chief Financial Officer of PGIM Private Real Estate Fund, Inc. (since July 2022); formerly Treasurer and Principal Financial Officer (January 2019- March 2023) of PGIM Investments mutual funds, closed end funds and ETFs, Advanced Series Trust Portfolios, Prudential Series Funds and Prudential Gibraltar Fund; formerly Treasurer and Principal Financial Officer (March 2022 – July 2022) of the PGIM Private Real Estate Fund, Inc.; formerly Director of Fund Administration of Lord Abbett & Co. LLC (2009-2018), Treasurer and Principal Accounting Officer of the Lord Abbett Family of Funds (2017-2018); Director of Accounting, Avenue Capital Group (2008-2009); Senior Manager, Investment Management Practice of Deloitte & Touche LLP (1998-2007). | | Since January 2019 |
PGIM Jennison Growth Fund
| | | | |
| |
| Fund Officers(a) |
| | | |
Name Year of Birth Fund Position | | Principal Occupation(s) During Past Five Years | | Length of Service as Fund Officer |
| | | |
Russ Shupak 1973 Treasurer and Principal Accounting Officer | | Vice President (since 2017) within PGIM Investments Fund Administration; Treasurer and Principal Accounting Officer of PGIM Investments mutual funds, closed end funds and ETFs (since March 2023); Treasurer and Principal Accounting Officer (since July 2022) of the PGIM Private Real Estate Fund, Inc.; Assistant Treasurer (since September 2022) of the PGIM Private Credit Fund; formerly Assistant Treasurer (March 2022 – July 2022) of the PGIM Private Real Estate Fund, Inc.; Assistant Treasurer of Advanced Series Trust Portfolios, Prudential Series Funds and Prudential Gibraltar Fund (since October 2019); formerly Director (2013-2017) within PGIM Investments Fund Administration. | | Since October 2019 |
| | | |
Lana Lomuti 1967 Assistant Treasurer | | Vice President (since 2007) within PGIM Investments Fund Administration; formerly Assistant Treasurer (December 2007-February 2014) of The Greater China Fund, Inc.; formerly Director (2005-2007) within PGIM Investments Fund Administration. | | Since April 2014 |
| | | |
Deborah Conway 1969 Assistant Treasurer | | Vice President (since 2017) within PGIM Investments Fund Administration; Assistant Treasurer (since September 2022) of the PGIM Private Credit Fund; Assistant Treasurer (since March 2022) of the PGIM Private Real Estate Fund, Inc.; formerly Director (2007-2017) within PGIM Investments Fund Administration. | | Since October 2019 |
| | | |
Elyse M. McLaughlin 1974 Assistant Treasurer | | Vice President (since 2017) within PGIM Investments Fund Administration; Treasurer and Principal Accounting Officer of the Advanced Series Trust, the Prudential Series Fund and the Prudential Gibraltar Fund (since March 2023); Treasurer and Principal Accounting Officer (since September 2022) of the PGIM Private Credit Fund; Assistant Treasurer (since March 2022) of the PGIM Private Real Estate Fund, Inc.; Assistant Treasurer of PGIM Investments mutual funds, closed end funds and ETFs (since October 2019); formerly Director (2011-2017) within PGIM Investments Fund Administration. | | Since October 2019 |
| | | |
Robert W. McCormack 1973 Assistant Treasurer | | Vice President (since 2019) within PGIM Investments Fund Administration; Assistant Treasurer (since March 2023) of PGIM Investments mutual funds, closed end funds, ETFs, Advanced Series Trust Portfolios, Prudential Series Funds and Prudential Gibraltar Fund; Assistant Treasurer (since September 2022) of the PGIM Private Credit Fund; Assistant Treasurer (since March 2022) of the PGIM Private Real Estate Fund, Inc.; formerly Director (2016-2019) within PGIM Investments Fund Administration; formerly Vice President within Goldman, Sachs & Co. Investment Management Controllers (2008- 2016), Assistant Treasurer of Goldman Sachs Family of Funds (2015-2016). | | Since March 2023 |
Visit our website at pgim.com/investments
| | | | |
| |
| Fund Officers(a) |
| | | |
Name Year of Birth Fund Position | | Principal Occupation(s) During Past Five Years | | Length of Service as Fund Officer |
| | | |
Kelly Florio 1978 Anti-Money Laundering Compliance Officer | | Vice President, Corporate Compliance, Global Compliance Programs and Compliance Risk Management (since December 2021) of Prudential; formerly Head of Fraud Risk Management (October 2019 to December 2021) at New York Life Insurance Company; formerly Head of Key Risk Area Operations (November 2018 to October 2019), Director of the US Anti-Money Laundering Compliance Unit (2009-2018) and Bank Loss Prevention Associate (2006 -2009) at MetLife. | | Since June 2022 |
(a) Excludes Mr. Parker and Mr. Benjamin, interested Board Members who also serve as President and Vice President, respectively.
Explanatory Notes to Tables:
| ∎ | | Board Members are deemed to be “Interested,” as defined in the 1940 Act, by reason of their affiliation with PGIM Investments LLC and/or an affiliate of PGIM Investments LLC. |
| ∎ | | Unless otherwise noted, the address of all Board Members and Officers is c/o PGIM Investments LLC, 655 Broad Street, Newark, New Jersey 07102-4410. |
| ∎ | | There is no set term of office for Board Members or Officers. The Board Members have adopted a retirement policy, which calls for the retirement of Board Members on December 31 of the year in which they reach the age of 75. |
| ∎ | | “Other Directorships Held” includes all directorships of companies required to register or file reports with the SEC under the 1934 Act (that is, “public companies”) or other investment companies registered under the 1940 Act. |
| ∎ | | “Portfolios Overseen” includes such applicable investment companies managed by PGIM Investments LLC and overseen by the Board Member. The investment companies for which PGIM Investments LLC serves as manager include the PGIM Mutual Funds, Target Funds, PGIM ETF Trust, PGIM Private Real Estate Fund, Inc., PGIM Private Credit Fund, PGIM High Yield Bond Fund, Inc., PGIM Global High Yield Fund, Inc., PGIM Short Duration High Yield Opportunities Fund, The Prudential Series Fund, Prudential’s Gibraltar Fund, Inc. and the Advanced Series Trust. |
| ∎ | | As used in the Fund Officers table “Prudential” means The Prudential Insurance Company of America. |
PGIM Jennison Growth Fund
Approval of Advisory Agreements (unaudited)
The Fund’s Board of Directors
The Board of Directors (the “Board”) of PGIM Jennison Growth Fund (the “Fund”)1 consists of ten individuals, eight of whom are not “interested persons” of the Fund, as defined in the Investment Company Act of 1940, as amended (the “1940 Act”) (the “Independent Directors”). The Board is responsible for the oversight of the Fund and its operations, and performs the various duties imposed on the directors of investment companies by the 1940 Act. The Independent Directors have retained independent legal counsel to assist them in connection with their duties. The Chair of the Board is an Independent Director. The Board has established five standing committees: the Audit Committee, the Nominating and Governance Committee, the Compliance Committee and two Investment Committees. Each committee is chaired by, and composed of, Independent Directors.
Annual Approval of the Fund’s Advisory Agreements
As required under the 1940 Act, the Board determines annually whether to renew the Fund’s management agreement with PGIM Investments LLC (“PGIM Investments”) and the Fund’s subadvisory agreement with Jennison Associates LLC (“Jennison”). In considering the renewal of the agreements, the Board, including all of the Independent Directors, met on May 25 and June 6-8, 2023 (the “Board Meeting”) and approved the renewal of the agreements through July 31, 2024, after concluding that the renewal of the agreements was in the best interests of the Fund and its shareholders.
In advance of the meetings, the Board requested and received materials relating to the agreements, and had the opportunity to ask questions and request further information in connection with its consideration. Among other things, the Board considered comparative fee information from PGIM Investments and Jennison. Also, the Board considered comparisons with other mutual funds in relevant Peer Universes and Peer Groups, as is further discussed below.
In approving the agreements, the Board, including the Independent Directors advised by independent legal counsel, considered the factors it deemed relevant, including the nature, quality and extent of services provided by PGIM Investments and the subadviser, the performance of the Fund, the profitability of PGIM Investments and its affiliates, expenses and fees, and the potential for economies of scale that may be shared with the Fund and its shareholders as the Fund’s assets grow. In their deliberations, the Directors did not identify any single factor which alone was responsible for the Board’s decision to approve the agreements with respect to the Fund. In connection with its deliberations, the Board considered information provided by PGIM Investments throughout the year at regular Board meetings, presentations from portfolio managers and other information, as well as information furnished at or in advance of the Board Meeting.
The Directors determined that the overall arrangements between the Fund and PGIM Investments, which serves as the Fund’s investment manager pursuant to a
1PGIM Jennison Growth Fund is a series of The Prudential Investment Portfolios, Inc.
PGIM Jennison Growth Fund
Approval of Advisory Agreements (continued)
management agreement, and between PGIM Investments and Jennison, which serves as the Fund’s subadviser pursuant to the terms of a subadvisory agreement with PGIM Investments, are in the best interests of the Fund and its shareholders in light of the services performed, fees charged and such other matters as the Directors considered relevant in the exercise of their business judgment.
The material factors and conclusions that formed the basis for the Directors’ reaching their determinations to approve the continuance of the agreements are separately discussed below.
Nature, Quality and Extent of Services
The Board received and considered information regarding the nature, quality and extent of services provided to the Fund by PGIM Investments and Jennison. The Board noted that Jennison is affiliated with PGIM Investments. The Board considered the services provided by PGIM Investments, including but not limited to the oversight of the subadviser for the Fund, as well as the provision of fund recordkeeping, compliance and other services to the Fund, and PGIM Investments’ role as administrator for the Fund’s liquidity risk management program. With respect to PGIM Investments’ oversight of the subadviser, the Board noted that PGIM Investments’ Strategic Investment Research Group (“SIRG”), which is a business unit of PGIM Investments, is responsible for monitoring and reporting to PGIM Investments’ senior management on the performance and operations of the subadviser. The Board also considered that PGIM Investments pays the salaries of all of the officers and interested Directors of the Fund who are part of Fund management. The Board also considered the investment subadvisory services provided by Jennison, as well as adherence to the Fund’s investment restrictions and compliance with applicable Fund policies and procedures. The Board considered PGIM Investments’ evaluation of the subadviser, including investment research and security selection, as well as PGIM Investments’ recommendation, based on its review of the subadviser, to renew the subadvisory agreement.
The Board considered the qualifications, backgrounds and responsibilities of PGIM Investments’ senior management responsible for the oversight of the Fund and Jennison, and also considered the qualifications, backgrounds and responsibilities of the Jennison portfolio managers who are responsible for the day-to-day management of the Fund’s portfolio. The Board was provided with information pertaining to PGIM Investments’ and Jennison’s organizational structure, senior management, investment operations, and other relevant information pertaining to PGIM Investments and Jennison. The Board also noted that it received favorable compliance reports from the Fund’s Chief Compliance Officer (“CCO”) as to each of PGIM Investments and Jennison.
The Board concluded that it was satisfied with the nature, extent and quality of the investment management services provided by PGIM Investments and the subadvisory services provided to the Fund by Jennison, and that there was a reasonable basis on which to conclude that the Fund benefits from the services provided by PGIM Investments and Jennison under the management and subadvisory agreements.
Visit our website at pgim.com/investments
Costs of Services and Profits Realized by PGIM Investments
The Board was provided with information on the profitability of PGIM Investments and its affiliates in serving as the Fund’s investment manager. The Board discussed with PGIM Investments the methodology utilized in assembling the information regarding profitability and considered its reasonableness. The Board recognized that it is difficult to make comparisons of profitability from fund management contracts because comparative information is not generally publicly available and is affected by numerous factors, including the structure of the particular adviser, the types of funds it manages, its business mix, numerous assumptions regarding allocations and the adviser’s capital structure and cost of capital. Taking these factors into account, the Board concluded that the profitability of PGIM Investments and its affiliates in relation to the services rendered was not unreasonable.
Economies of Scale
The Board received and discussed information concerning economies of scale that PGIM Investments may realize as the Fund’s assets grow beyond current levels. The Board noted that the management fee schedule for the Fund includes breakpoints, which have the effect of decreasing the fee rate as assets increase. During the course of time, the Board has considered information regarding the launch date of the Fund, the management fees of the Fund compared to those of similarly managed funds, and PGIM Investments’ investment in the Fund over time. The Board noted that economies of scale can be shared with the Fund in other ways, including low management fees from inception, additional technological and personnel investments to enhance shareholder services, and maintaining existing expense structures in the face of a rising cost environment. The Board also considered PGIM Investments’ assertion that it continually evaluates the management fee schedule of the Fund and the potential to share economies of scale through breakpoints or fee waivers as asset levels increase.
The Board recognized the inherent limitations of any analysis of economies of scale, stemming largely from the Board’s understanding that most of PGIM Investments’ costs are not specific to individual funds, but rather are incurred across a variety of products and services.
Other Benefits to PGIM Investments and Jennison
The Board considered potential ancillary benefits that might be received by PGIM Investments, Jennison and their affiliates as a result of their relationship with the Fund. The Board concluded that potential benefits to be derived by PGIM Investments included transfer agency fees received by the Fund’s transfer agent (which is affiliated with PGIM Investments), and benefits to its reputation as well as other intangible benefits resulting from PGIM Investments’ association with the Fund. The Board concluded that the potential benefits to be derived by Jennison included its ability to use soft dollar credits, as well as the potential benefits consistent with those generally resulting from an increase in assets under management, specifically, potential access to additional research resources and benefits to its reputation. The Board concluded that
PGIM Jennison Growth Fund
Approval of Advisory Agreements (continued)
the benefits derived by PGIM Investments and Jennison were consistent with the types of benefits generally derived by investment managers and subadvisers to mutual funds.
Performance of the Fund / Fees and Expenses
The Board considered certain additional factors and made related conclusions relating to the historical performance of the Fund for the one-, three-, five- and ten-year periods ended December 31, 2022.
The Board also considered the Fund’s actual management fee, as well as the Fund’s net total expense ratio, for the fiscal year ended September 30, 2022. The Board considered the management fee for the Fund as compared to the management fee charged by PGIM Investments to other funds and the fee charged by other advisers to comparable mutual funds in a Peer Group. The actual management fee represents the fee rate actually paid by Fund shareholders and includes any fee waivers or reimbursements. The net total expense ratio for the Fund represents the actual expense ratio incurred by Fund shareholders.
The mutual funds included in the Peer Universe, which was used to evaluate performance, and the Peer Group, which was used to evaluate expenses and fees, were objectively determined by Broadridge, an independent provider of mutual fund data. In certain circumstances, PGIM Investments also provided supplemental Peer Universe or Peer Group information for reasons addressed with the Board. The comparisons placed the Fund in various quartiles over various periods, with the first quartile being the best 25% of the mutual funds (for performance, the best performing mutual funds and, for expenses, the lowest cost mutual funds).
The section below summarizes key factors considered by the Board and the Board’s conclusions regarding the Fund’s performance, fees and overall expenses. The table sets forth net performance comparisons (which reflect the impact on performance of fund expenses, or any subsidies, expense caps or waivers that may be applicable) with the Peer Universe, actual management fees with the Peer Group (which reflect the impact of any subsidies or fee waivers), and net total expenses with the Peer Group, each of which were key factors considered by the Board.
| | | | | | | | |
| Net Performance | | 1 Year | | 3 Years | | 5 Years | | 10 Years |
| | | 4th Quartile | | 3rd Quartile | | 3rd Quartile | | 1st Quartile |
| | | Actual Management Fees: 2nd Quartile | | |
| | | Net Total Expenses: 2nd Quartile | | |
| • | | The Board noted that the Fund underperformed its benchmark index over all periods. |
| • | | The Board noted PGIM Investments’ assertions that the Fund’s exposure to secular growth stocks was out of favor, but they remain encouraged by the Fund’s strong performance versus peers over the 10-year period. |
Visit our website at pgim.com/investments
| • | | The Board also considered that the Fund outperformed its peer group average for the three-, five- and ten-year periods ended March 31, 2023. |
| • | | The Board and PGIM Investments agreed to retain the existing contractual expense cap that (exclusive of certain fees and expenses) caps total annual operating expenses at 0.60% of average daily net assets for Class R6 shares through January 31, 2024. |
| • | | The Board and PGIM Investments also agreed to retain the existing contractual expense cap that (exclusive of certain fees and expenses) limits transfer agency, shareholder servicing, sub-transfer agency, and blue sky fees to the extent that such fees cause annual operating expenses to exceed 1.10% for Class R2 shares and 0.85% for Class R4 shares through January 31, 2024. |
| • | | In addition, PGIM Investments will waive management fees or shared operating expenses on any share class to the same extent that it waives such expenses on any other share class and has agreed that total annual fund operating expenses for Class R6 shares will not exceed total annual fund operating expenses for Class Z shares. |
| • | | The Board concluded that, in light of the above, it would be in the best interests of the Fund and its shareholders to renew the agreements. |
| • | | The Board concluded that the management fees (including subadvisory fees) and total expenses were reasonable in light of the services provided. |
* * *
After full consideration of these factors, the Board concluded that approval of the agreements was in the best interests of the Fund and its shareholders.
PGIM Jennison Growth Fund
| | | | |
| | | |
| ∎ MAIL | | ∎ TELEPHONE | | ∎ WEBSITE |
655 Broad Street Newark, NJ 07102 | | (800) 225-1852 | | pgim.com/investments |
|
| PROXY VOTING |
The Board of Directors of the Fund has delegated to the Fund’s subadviser the responsibility for voting any proxies and maintaining proxy recordkeeping with respect to the Fund. A description of these proxy voting policies and procedures is available without charge, upon request, by calling (800) 225-1852 or by visiting the Securities and Exchange Commission’s website at sec.gov. Information regarding how the Fund voted proxies relating to portfolio securities during the most recent 12-month period ended June 30 is available on the Fund’s website and on the Securities and Exchange Commission’s website. |
|
| DIRECTORS |
Ellen S. Alberding • Kevin J. Bannon • Scott E. Benjamin • Linda W. Bynoe • Barry H. Evans • Keith F. Hartstein • Laurie Simon Hodrick • Stuart S. Parker • Brian K. Reid • Grace C. Torres |
|
| |
| OFFICERS |
Stuart S. Parker, President • Scott E. Benjamin, Vice President • Christian J. Kelly, Chief Financial Officer • Claudia DiGiacomo, Chief Legal Officer • Andrew Donohue, Chief Compliance Officer • Russ Shupak, Treasurer and Principal Accounting Officer • Kelly Florio, Anti-Money Laundering Compliance Officer • Andrew R. French, Secretary • Melissa Gonzalez, Assistant Secretary • Kelly A. Coyne, Assistant Secretary • Patrick E. McGuinness, Assistant Secretary • Debra Rubano, Assistant Secretary • Lana Lomuti, Assistant Treasurer • Elyse M. McLaughlin, Assistant Treasurer • Deborah Conway, Assistant Treasurer • Robert W. McCormack, Assistant Treasurer |
| | | | |
| | |
| MANAGER | | PGIM Investments LLC | | 655 Broad Street Newark, NJ 07102 |
| | |
| SUBADVISER | | Jennison Associates LLC | | 466 Lexington Avenue New York, NY 10017 |
| | |
| DISTRIBUTOR | | Prudential Investment Management Services LLC | | 655 Broad Street Newark, NJ 07102 |
| | |
| CUSTODIAN | | The Bank of New York Mellon | | 240 Greenwich Street New York, NY 10286 |
| | |
| TRANSFER AGENT | | Prudential Mutual Fund Services LLC | | PO Box 534432 Pittsburgh, PA 15253 |
| | |
| INDEPENDENT REGISTERED PUBLIC ACCOUNTING FIRM | | PricewaterhouseCoopers LLP | | 300 Madison Avenue New York, NY 10017 |
| | |
| FUND COUNSEL | | Willkie Farr & Gallagher LLP | | 787 Seventh Avenue New York, NY 10019 |
|
| An investor should consider the investment objectives, risks, charges, and expenses of the Fund carefully before investing. The prospectus and summary prospectus contain this and other information about the Fund. An investor may obtain the prospectus and summary prospectus by visiting our website at pgim.com/investments or by calling (800) 225-1852. The prospectus and summary prospectus should be read carefully before investing. |
|
| E-DELIVERY |
| To receive your mutual fund documents online, go to pgim.com/investments/resource/edelivery and enroll. Instead of receiving printed documents by mail, you will receive notification via email when new materials are available. You can cancel your enrollment or change your email address at any time by visiting the website address above. |
|
| SHAREHOLDER COMMUNICATIONS WITH DIRECTORS |
| Shareholders can communicate directly with the Board of Directors by writing to the Chair of the Board, PGIM Jennison Growth Fund, PGIM Investments, Attn: Board of Directors, 655 Broad Street, Newark, NJ 07102. Shareholders can communicate directly with an individual Director by writing to that Director at the same address. Communications are not screened before being delivered to the addressee. |
|
| AVAILABILITY OF PORTFOLIO HOLDINGS |
| The Fund files its complete schedule of portfolio holdings with the Securities and Exchange Commission for the first and third quarters of each fiscal year as an exhibit to its reports on Form N-PORT. The Fund’s Form N-PORT filings are available on the Commission’s website at sec.gov. |
|
| The Fund’s Statement of Additional Information contains additional information about the Fund’s Directors and is available without charge, upon request, by calling (800) 225-1852. |
Mutual Funds:
| | | | |
| ARE NOT INSURED BY THE FDIC OR ANY FEDERAL GOVERNMENT AGENCY | | MAY LOSE VALUE | | ARE NOT A DEPOSIT OF OR GUARANTEED BY ANY BANK OR ANY BANK AFFILIATE |

PGIM JENNISON GROWTH FUND
| | | | | | | | | | | | | | |
| | | | | | | |
| SHARE CLASS | | A | | C | | R | | Z | | R2 | | R4 | | R6 |
| | | | | | | |
NASDAQ | | PJFAX | | PJFCX | | PJGRX | | PJFZX | | PJFOX | | PJFPX | | PJFQX |
| | | | | | | |
CUSIP | | 74437E107 | | 74437E305 | | 74437E651 | | 74437E404 | | 74437E420 | | 74437E412 | | 74437E479 |
MF168E

PGIM JENNISON FOCUSED VALUE FUND
ANNUAL REPORT
SEPTEMBER 30, 2023

To enroll in e-delivery, go to pgim.com/investments/resource/edelivery
Table of Contents
This report is not authorized for distribution to prospective investors unless preceded or accompanied by a current prospectus.
The views expressed in this report and information about the Fund’s portfolio holdings are for the period covered by this report and are subject to change thereafter.
Mutual funds are distributed by Prudential Investment Management Services LLC, member SIPC. Jennison Associates LLC is a registered investment adviser. Both are Prudential Financial companies. © 2023 Prudential Financial, Inc. and its related entities. Jennison Associates, Jennison, PGIM, and the PGIM logo are service marks of Prudential Financial, Inc. and its related entities, registered in many jurisdictions worldwide.
2 Visit our website at pgim.com/investments
Letter from the President
| | |
 | | Dear Shareholder: We hope you find the annual report for the PGIM Jennison Focused Value Fund informative and useful. The report covers performance for the 12-month period that ended September 30, 2023. Although central banks raised interest rates aggressively to tame surging inflation during the period, the global economy and financial markets demonstrated resilience. Employers continued hiring, consumers continued spending, home prices rose, and recession fears receded. Early in the period, stocks began a rally that eventually ended a bear market and continued to rise globally for much of 2023 as inflation cooled and the Federal Reserve (the Fed) slowed the pace of its rate hikes. However, stocks declined |
in September when the Fed signaled that rates may remain elevated longer than investors had expected. For the entire period, equities in both US and international markets posted gains.
Bond markets benefited during the period as the Fed moderated its rate-hiking cycle, and the higher level of interest rates offered investors an additional cushion from fixed income volatility. US and global investment-grade bonds posted small gains for the overall period, while US high yield corporate bonds and emerging-market debt rose by double digits.
Regarding your investments with PGIM, we believe it is important to maintain a diversified portfolio of funds consistent with your tolerance for risk, time horizon, and financial goals. Your financial advisor can help you create a diversified investment plan that may include funds covering all the basic asset classes and that reflects your personal investor profile and risk tolerance. However, diversification and asset allocation strategies do not assure a profit or protect against loss in declining markets.
At PGIM Investments, we provide access to active investment strategies across the global markets in the pursuit of consistent outperformance for investors. PGIM is the world’s 14th-largest investment manager with more than $1.3 trillion in assets under management. Our scale and investment expertise allow us to deliver a diversified suite of actively managed solutions across a broad spectrum of asset classes and investment styles.
Thank you for choosing our family of funds.
Sincerely,

Stuart S. Parker, President
PGIM Jennison Focused Value Fund
November 15, 2023
PGIM Jennison Focused Value Fund 3
Your Fund’s Performance (unaudited)
Performance data quoted represent past performance. Past performance does not guarantee future results. The investment return and principal value of an investment will fluctuate so that an investor’s shares, when redeemed, may be worth more or less than their original cost. Current performance may be lower or higher than the past performance data quoted. An investor may obtain performance data as of the most recent month-end by visiting our website at pgim.com/investments or by calling (800) 225-1852.
| | | | | | | | |
| |
| | | Average Annual Total Returns as of 9/30/2023 |
| | | One Year (%) | | Five Years (%) | | Ten Years (%) | | Since Inception (%) |
| | | | |
Class A | | | | | | | | |
| | | | |
(with sales charges) | | 12.00 | | 2.29 | | 6.11 | | — |
| | | | |
(without sales charges) | | 18.51 | | 3.45 | | 6.71 | | — |
| | | | |
Class C | | | | | | | | |
| | | | |
(with sales charges) | | 16.26 | | 2.50 | | 5.85 | | — |
| | | | |
(without sales charges) | | 17.26 | | 2.50 | | 5.85 | | — |
| | | | |
Class R | | | | | | | | |
| | | | |
(without sales charges) | | 18.03 | | 3.05 | | 6.37 | | — |
| | | | |
Class Z | | | | | | | | |
| | | | |
(without sales charges) | | 18.97 | | 3.79 | | 7.04 | | — |
| | | | |
Class R6 | | | | | | | | |
| | | | |
(without sales charges) | | 19.03 | | 3.74 | | N/A | | 6.07 (11/25/2014) |
| | | | |
Russell 1000 Value Index | | | | | | | | |
| | | | |
| | | 14.44 | | 6.23 | | 8.45 | | — |
| | |
|
| Average Annual Total Returns as of 9/30/2023 Since Inception (%) |
| | | Class R6 (11/25/2014) |
| |
Russell 1000 Value Index | | 6.98 |
Since Inception returns are provided for any share class with less than 10 fiscal years of returns. Since Inception returns for the Index are measured from the closest month-end to the class’s inception date.
4 Visit our website at pgim.com/investments
Growtah of a $10,000 Investment (unaudited)
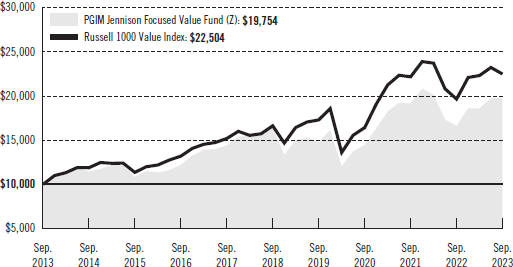
The graph compares a $10,000 investment in the Fund’s Class Z shares with a similar investment in the Russell 1000 Value Index by portraying the initial account values at the beginning of the 10-year period (September 30, 2013) and the account values at the end of the current fiscal year (September 30, 2023), as measured on a quarterly basis. For purposes of the graph, and unless otherwise indicated, it has been assumed that (a) all recurring fees (including management fees) were deducted and (b) all dividends and distributions were reinvested. The line graph provides information for Class Z shares only. As indicated in the tables provided earlier, performance for other share classes will vary due to the differing fees and expenses applicable to each share class (as indicated in the following paragraphs). Without waiver of fees and/or expense reimbursements, if any, the returns would have been lower.
Past performance does not predict future performance. Total returns and the ending account values in the graph include changes in share price and reinvestment of dividends and capital gains distributions in a hypothetical investment for the periods shown. The Fund’s total returns do not reflect the deduction of income taxes on an individual’s investment. Taxes may reduce your actual investment returns on income or gains paid by the Fund or any gains you may realize if you sell your shares.
PGIM Jennison Focused Value Fund 5
Your Fund’s Performance (continued)
The returns in the tables do not reflect the deduction of taxes that a shareholder would pay on Fund distributions or following the redemption of Fund shares. The average annual total returns take into account applicable sales charges, which are described for each share class in the table below.
| | | | | | | | | | |
| | | | | | |
| | | Class A | | Class C | | Class R | | Class Z | | Class R6 |
| | | | | | |
Maximum initial sales charge | | 5.50% of the public offering price | | None | | None | | None | | None |
| | | | | | |
Contingent deferred sales charge (CDSC) (as a percentage of the lower of the original purchase price or the net asset value at redemption) | | 1.00% on sales of $1 million or more made within 12 months of purchase | | 1.00% on sales made within 12 months of purchase | | None | | None | | None |
| | | | | | |
Annual distribution and service (12b-1) fees (shown as a percentage of average daily net assets) | | 0.30% | | 1.00% | | 0.75% (0.50% currently) | | None | | None |
Benchmark Definition
Russell 1000 Value Index—The Russell 1000 Value Index is an unmanaged index comprising those securities in the Russell 1000 Index with a less-than-average growth orientation. Companies in this Index generally have low price-to-book and price-to-earnings ratios, higher dividend yields, and lower forecasted growth values.
Investors cannot invest directly in an index. The returns for the Index would be lower if they included the effects of sales charges, operating expenses of a mutual fund, or taxes that may be paid by an investor.
6 Visit our website at pgim.com/investments
Presentation of Fund Holdings as of 9/30/23
| | | | |
| Ten Largest Holdings | | Line of Business | | % of Net Assets |
| | |
Hess Corp. | | Oil, Gas & Consumable Fuels | | 5.9% |
| | |
Walmart, Inc. | | Consumer Staples Distribution & Retail | | 5.8% |
| | |
Eli Lilly & Co. | | Pharmaceuticals | | 5.0% |
| | |
Chubb Ltd. | | Insurance | | 4.4% |
| | |
AstraZeneca plc (United Kingdom), ADR | | Pharmaceuticals | | 4.4% |
| | |
Linde plc | | Chemicals | | 4.1% |
| | |
JPMorgan Chase & Co. | | Banks | | 4.0% |
| | |
Microsoft Corp. | | Software | | 3.9% |
| | |
Schlumberger NV | | Energy Equipment & Services | | 3.8% |
| | |
MetLife, Inc. | | Insurance | | 3.6% |
Holdings reflect only long-term investments and are subject to change.
PGIM Jennison Focused Value Fund 7
Strategy and Performance Overview*
(unaudited)
How did the Fund perform?
The PGIM Jennison Focused Value Fund’s Class Z shares returned 18.97% in the 12-month reporting period that ended September 30, 2023, outperforming the 14.44% return of the Russell 1000 Value Index (the Index).
What were the market conditions?
| · | | Prior to the start of the reporting period, in June 2022, inflation rose above 9%, the highest level in four decades. Between March 2022 and July 2023, the US Federal Reserve (Fed) raised the federal funds rate 11 times, from near zero to a range of 5.25%–5.50%, reflecting the Fed’s urgency in reestablishing price stability. |
| · | | The investment backdrop for stocks during the period can be divided into three sections. In the last three months of 2022, investors remained uncertain about inflationary pressures and Fed policy, heightened geopolitical tensions, war in Ukraine, and expectations that US economic growth would slow and could enter a recession. Companies took aggressive steps to rationalize costs, expecting a more challenging environment ahead. In this environment, stocks generally continued to underperform, as they had earlier in 2022. |
| · | | In the first six months of 2023, the economy delivered better-than-feared results, with continued—albeit moderating—growth led by resilient consumer spending amid ongoing labor market strength. As inflationary pressures eased, the Fed slowed the pace of monetary tightening, which encouraged investors, as did stronger-than-expected earnings reports. Investors appeared to be surprised that many companies were able to effectively cut their costs and stabilize profit margins, enabling them to exceed Wall Street expectations. In this environment, value stocks generally advanced but underperformed growth stocks significantly, which rose sharply, largely due to the rebound of technology stocks. |
| · | | Markets stumbled again in the last three months of the reporting period in the face of the increasing likelihood that the Fed would maintain rates at elevated levels for longer than previously expected, due to rising energy prices, sustained wage pressures, and the broad persistence of above-target inflation. Value stocks continued to lag growth shares, and large-cap stocks outperformed their smaller-cap counterparts. |
| · | | Interest in artificial intelligence (AI)—catalyzed by the launch of ChatGPT in late November 2022—continued to grow through the first half of 2023. Investors expressed the greatest enthusiasm for large-cap technology-oriented companies, such as Alphabet Inc., Meta Platforms Inc., and Microsoft Inc., supplying the foundational components to design, build, and run AI and machine-learning capabilities. While AI offers the potential for transformative technological change, investors remained divided about who has the most to gain—and lose—from the application of these new technologies across companies and industries. |
| · | | Within the Index, all sectors advanced over the period, except for utilities, which came under pressure from rising rates. The communications services, energy, information |
8 Visit our website at pgim.com/investments
| | technology, industrials, materials, and consumer discretionary sectors outperformed the Index. The financials, consumer staples, healthcare, and real estate sectors advanced but lagged the Index. |
What worked?
| · | | Both security selection and sector allocation, in the aggregate, benefited relative performance during the reporting period. |
| · | | Stock selection within the healthcare, information technology, and communication services sectors materially bolstered relative results. |
| · | | An overweight in the information technology sector was another top contributor. |
| · | | The largest individual contributors during the reporting period included Eli Lilly & Company, Meta Platforms, Microsoft, Airbus SE, and Broadcom Inc. |
| · | | Shares of Eli Lilly rose on the strong performance of its diabetes/obesity treatments Mounjaro and Trulicity, which remain tremendous opportunities for the company. To date, the Mounjaro launch is the strongest for any diabetes drug ever. While Alzheimer’s disease has been a tough market for drug developers, Eli Lilly has a breakthrough designation from the US Food and Drug Administration for donanemab and is one of four companies with Phase 3 data expected over the next 12 months. Eli Lilly also has exciting franchises in dermatology, immunology, and oncology that are starting to add meaningfully to growth. Given the company’s proven history of strong commercial execution and one of the highest research and development success rates in the industry, Jennison sees opportunity for continued success. |
| · | | Jennison added a position in social media company Meta Platforms to the Fund during the period. After selling off in 2022, Meta’s shares rebounded in 2023 as the company’s results improved due to cost rationalization (mainly headcount), better-than-expected advertising revenue, and a focus on better profitability metrics and free cash flows. The business model continues to post solid profit margins and free cash flow metrics. |
| · | | Enterprise software company Microsoft Corporation continued to gain share across multiple product lines, while having the advantage of being very well positioned for the AI wave, given the company’s plans to incorporate the technology into existing products, increasing revenue potential. Shares oversold in 2022, then rebounded in 2023. |
| · | | Multinational aerospace corporation Airbus operates through three divisions: Commercial Aircraft (Airbus S.A.S.), Defense and Space, and Helicopters. The company faced supply constraints across multiple products in 2021 and in the first half of 2022, which prompted a market overreaction and share price sell-off. While these issues were severe, Jennison believed they would not persist for long. Indeed, business operations recovered nicely during the period, and the stock more than recovered. Jennison continues to like the long-term trajectory of the business model, along with its scale advantage and strong free cash flow profile. Additionally, Airbus’s valuation remains very attractive. |
PGIM Jennison Focused Value Fund 9
Strategy and Performance Overview* (continued)
| · | | Global technology leader Broadcom designs, develops, and supplies a broad range of semiconductor and infrastructure software solutions. In the wake of an earlier pullback, the stock price advanced throughout the period. Broadcom is a consistent mid-teens earnings grower, with some key business lines (including semiconductors, networking, and storage) currently seeing growth exceeding 25%. In Jennison’s opinion, this is a high-quality company with a dividend yield of 2.8% that is expected to approach 4% by 2024. |
What didn’t work?
| · | | Stock selection within the energy and industrials sectors detracted substantially from relative results during the reporting period. |
| · | | An underweight in the communication services sector relative to the Index also detracted from performance. |
| · | | The most significant individual negative contributors to relative performance included Truist Financial Corp., Bristol-Myers Squibb Co., NiSource Inc., PNC Financial Services Group Inc., and Dominion Energy Inc. |
| · | | Truist Financial, the sixth-largest US bank by assets, operates as a financial holding company. Its traditional banking business offers services to individuals, businesses and municipalities within several Southeastern and Mid-Atlantic markets. The company also operates nationally through its insurance brokerage, investment banking, mortgage banking, specialty finance, and digital lending verticals. Truist shares were negatively impacted by the failures of two other regional banks in early March 2023 due to company-specific problems. In Jennison’s view, the resulting negative sentiment did not reflect Truist’s liquidity and solid fundamentals. Jennison has maintained the Fund’s position. |
| · | | Bristol-Myers Squibb is a leader in the development of immuno-oncology, an approach that leverages a patient’s own immune system to attack tumors. The stock was negatively affected by concern that its drug Sotyku, for the treatment of plaque psoriasis, was inferior to a drug under development by rival drug maker Takeda Pharmaceutical Company Ltd. Jennison believes these concerns were overdone and can be explained by the use of a larger dose in the Takeda study. Sotyku will have a three-year head start if and when Takeda’s drug ever comes to market, and the first-mover advantage is very powerful in the pharmaceutical industry. For a new entrant to take meaningful share, it must have a noticeable efficacy and/or side effect advantage over the incumbent. The Takeda drug fails on both measures. In addition, Bristol-Myers Squibb has a favorable pipeline of drugs on the horizon. The Fund continues to hold a position. |
| · | | Jennison added a position in energy holding company NiSource to the Fund during the period. The company operates through two segments: Gas Distribution Operations and Electric Operations. Gas Distribution Operations, through its wholly owned subsidiary NiSource Gas Distribution Group, Inc., owns five distribution subsidiaries that provide natural gas to residential, commercial, and industrial customers in Ohio, |
10 Visit our website at pgim.com/investments
| | Pennsylvania, Virginia, Kentucky, and Maryland. The stock sold off slightly on concerns of high costs and gas input prices, and the overall negative sentiment regarding utility stocks. Jennison continues to like the company’s long-term prospects given its valuation, balance sheet strength, and market position. |
| · | | One of the largest diversified financial services company in the US, PNC Financial Service Group is a well-managed commercial and retail bank with solid capitalization, diversified funding sources, and well-regarded senior leadership and risk-management infrastructure. Despite these strengths, shares in the bank sold off during the period due to industry-wide concerns related to the regional bank failures mentioned above. Jennison believes that the sell-off was not merited, as PNC does not have a liquidity issue and mostly gained deposits as depositors left smaller banks. As of the end of the period, the deposit and liquidity concerns have subsided. |
| · | | Shares in Dominion Energy, a Virginia-based multi-utility engaged in the provision of electricity and natural gas to homes, businesses, and wholesale customers, struggled due to concerns regarding capital allocation, goodwill, and regulatory issues. Jennison sold the Fund’s position during the reporting period to allocate the capital to more attractive opportunities in light of ongoing negative sentiment concerning Dominion’s offshore wind assets, and the associated expense and maintenance costs. |
Current outlook
| · | | Sentiment in the near term is clouded by uncertainties due to—but not limited to—repeated threats of a government shutdown, auto strikes, the restart of student loan repayments, and the lagged effect on financing costs and spending intentions of interest rates at 15-year highs. These impediments will likely weigh on economic growth into year-end and deepen the deceleration that Jennison has been anticipating since 2023 began. |
| · | | US consumers, with less robust prospects overall, are beginning to show stress—primarily at lower income levels. Overall, a healthy employment backdrop and residential real estate strength, which bolster net worth, are variables that point to a moderate slowdown. The Fund’s holdings related most directly to consumer spending remain tightly focused on leading brands, retailers, and service providers that are best positioned to take wallet share and grow revenues and profits on a multi-year basis. |
| · | | Across a broad range of industries, technology spending trends have turned to cost optimization, rationalization of past customer investments to drive efficiencies, and headcount reductions. Now more than a year into this environment, Jennison expects to see greater stability in spending activity and investment intentions moving into 2024. The broad categories of cloud adoption, data mining and analytics, and the still-nascent development and adoption of generative AI capabilities remain at the forefront of longer-term investment plans across a wide range of business model types. |
| · | | Jennison remains vigilant in evaluating the investment landscape against a mixed backdrop. It is important to emphasize that slowing growth is a feature, but not the |
PGIM Jennison Focused Value Fund 11
Strategy and Performance Overview* (continued)
| | defining factor, that will influence the performance and financial results of investments over the Fund’s longer-term investment horizon. The ability to innovate, invest, and grow free cash flows through variable macroeconomic environments supports Jennison’s belief in the ability of the Fund to generate above-average returns. |
*This strategy and performance overview, which discusses what strategies or holdings (including derivatives, if applicable) affected the Fund’s performance, is compiled based on how the Fund performed relative to the Fund’s benchmark index and is viewed for performance attribution purposes at the aggregate Fund level, which in most instances will not directly correlate to the amounts disclosed in the Statement of Operations which conform to US generally accepted accounting principles.
12 Visit our website at pgim.com/investments
Fees and Expenses (unaudited)
As a shareholder of the Fund, you incur two types of costs: (1) transaction costs, including sales charges (loads) on purchase payments and redemptions, as applicable, and (2) ongoing costs, including management fees, distribution and/or service (12b-1) fees, and other Fund expenses, as applicable. This example is intended to help you understand your ongoing costs (in dollars) of investing in the Fund and to compare these costs with the ongoing costs of investing in other mutual funds.
The example is based on an investment of $1,000 held through the six-month period ended September 30, 2023. The example is for illustrative purposes only; you should consult the Prospectus for information on initial and subsequent minimum investment requirements.
Actual Expenses
The first line for each share class in the table on the following page provides information about actual account values and actual expenses. You may use the information on this line, together with the amount you invested, to estimate the expenses that you paid over the period. Simply divide your account value by $1,000 (for example, an $8,600 account value ÷ $1,000 = 8.6), then multiply the result by the number on the first line under the heading “Expenses Paid During the Six-Month Period” to estimate the expenses you paid on your account during this period.
Hypothetical Example for Comparison Purposes
The second line for each share class in the table on the following page provides information about hypothetical account values and hypothetical expenses based on the Fund’s actual expense ratio and an assumed rate of return of 5% per year before expenses, which is not the Fund’s actual return. The hypothetical account values and expenses may not be used to estimate the actual ending account balance or expenses you paid for the period. You may use this information to compare the ongoing costs of investing in the Fund and other funds. To do so, compare this 5% hypothetical example with the 5% hypothetical examples that appear in the shareholder reports of the other funds.
The Fund’s transfer agent may charge additional fees to holders of certain accounts that are not included in the expenses shown in the table on the following page. These fees apply to individual retirement accounts (IRAs) and Section 403(b) accounts. As of the close of the six-month period covered by the table, IRA fees included an annual maintenance fee of $15 per account (subject to a maximum annual maintenance fee of $25 for all accounts held by the same shareholder). Section 403(b) accounts are charged an annual $25 fiduciary maintenance fee. Some of the fees may vary in amount, or may be waived, based on your total account balance or the number of PGIM funds, including the Fund, that you own. You should consider the additional fees that were charged to your Fund account over the six-month period when you estimate the total ongoing expenses paid over the period and the impact of these fees on your ending account value, as these additional expenses are not reflected in the information
PGIM Jennison Focused Value Fund 13
Fees and Expenses (continued)
provided in the expense table. Additional fees have the effect of reducing investment returns.
Please note that the expenses shown in the table are meant to highlight your ongoing costs only and do not reflect any transactional costs such as sales charges (loads). Therefore, the second line for each share class in the table is useful in comparing ongoing costs only and will not help you determine the relative total costs of owning different funds. In addition, if these transactional costs were included, your costs would have been higher.
| | | | | | | | | | |
| | | | |
PGIM Jennison Focused Value Fund | | Beginning Account Value April 1, 2023 | | Ending Account Value September 30, 2023 | | Annualized Expense Ratio Based on the Six-Month Period | | Expenses Paid During the
Six-Month Period* |
| | | | | |
Class A | | Actual | | $1,000.00 | | $1,060.90 | | 1.19% | | $ 6.15 |
| | | | | |
| | Hypothetical | | $1,000.00 | | $1,019.10 | | 1.19% | | $ 6.02 |
| | | | | |
Class C | | Actual | | $1,000.00 | | $1,055.00 | | 2.32% | | $11.95 |
| | | | | |
| | Hypothetical | | $1,000.00 | | $1,013.44 | | 2.32% | | $11.71 |
| | | | | |
Class R | | Actual | | $1,000.00 | | $1,058.60 | | 1.53% | | $ 7.90 |
| | | | | |
| | Hypothetical | | $1,000.00 | | $1,017.40 | | 1.53% | | $ 7.74 |
| | | | | |
Class Z | | Actual | | $1,000.00 | | $1,062.50 | | 0.75% | | $ 3.88 |
| | | | | |
| | Hypothetical | | $1,000.00 | | $1,021.31 | | 0.75% | | $ 3.80 |
| | | | | |
Class R6 | | Actual | | $1,000.00 | | $1,063.30 | | 0.75% | | $ 3.88 |
| | | | | |
| | | Hypothetical | | $1,000.00 | | $1,021.31 | | 0.75% | | $ 3.80 |
*Fund expenses (net of fee waivers or subsidies, if any) for each share class are equal to the annualized expense ratio for each share class (provided in the table), multiplied by the average account value over the period, multiplied by the 183 days in the six-month period ended September 30, 2023, and divided by the 365 days in the Fund’s fiscal year ended September 30, 2023 (to reflect the six-month period). Expenses presented in the table include the expenses of any underlying portfolios in which the Fund may invest.
14 Visit our website at pgim.com/investments
Schedule of Investments
as of September 30, 2023
| | | | | | | | |
| | |
| Description | | Shares | | | Value | |
| | |
LONG-TERM INVESTMENTS 100.0% | | | | | | | | |
| | |
COMMON STOCKS | | | | | | | | |
| | |
Aerospace & Defense 3.1% | | | | | | | | |
| | |
Airbus SE (France) | | | 41,634 | | | $ | 5,572,648 | |
| | |
Automobile Components 1.7% | | | | | | | | |
| | |
Aptiv PLC* | | | 30,850 | | | | 3,041,502 | |
| | |
Automobiles 1.7% | | | | | | | | |
| | |
General Motors Co. | | | 92,828 | | | | 3,060,539 | |
| | |
Banks 9.6% | | | | | | | | |
| | |
Bank of America Corp. | | | 144,509 | | | | 3,956,657 | |
JPMorgan Chase & Co. | | | 49,566 | | | | 7,188,061 | |
PNC Financial Services Group, Inc. (The) | | | 25,778 | | | | 3,164,765 | |
Truist Financial Corp. | | | 109,687 | | | | 3,138,145 | |
| | | | | | | | |
| | |
| | | | | | | 17,447,628 | |
| | |
Biotechnology 2.5% | | | | | | | | |
| | |
AbbVie, Inc. | | | 30,989 | | | | 4,619,220 | |
| | |
Building Products 2.3% | | | | | | | | |
| | |
Johnson Controls International PLC | | | 78,219 | | | | 4,162,033 | |
| | |
Capital Markets 4.4% | | | | | | | | |
| | |
Blackstone, Inc.(a) | | | 28,355 | | | | 3,037,955 | |
Goldman Sachs Group, Inc. (The) | | | 15,276 | | | | 4,942,855 | |
| | | | | | | | |
| | |
| | | | | | | 7,980,810 | |
| | |
Chemicals 4.1% | | | | | | | | |
| | |
Linde PLC | | | 19,867 | | | | 7,397,477 | |
| | |
Consumer Staples Distribution & Retail 5.8% | | | | | | | | |
| | |
Walmart, Inc. | | | 65,924 | | | | 10,543,225 | |
| | |
Electric Utilities 2.0% | | | | | | | | |
| | |
PG&E Corp.* | | | 223,437 | | | | 3,604,039 | |
| | |
Energy Equipment & Services 3.8% | | | | | | | | |
| | |
Schlumberger NV | | | 118,905 | | | | 6,932,161 | |
| | |
Ground Transportation 3.4% | | | | | | | | |
| | |
Union Pacific Corp. | | | 29,835 | | | | 6,075,301 | |
See Notes to Financial Statements.
PGIM Jennison Focused Value Fund 15
Schedule of Investments (continued)
as of September 30, 2023
| | | | | | | | |
| | |
| Description | | Shares | | | Value | |
| | |
COMMON STOCKS (Continued) | | | | | | | | |
| | |
Hotels, Restaurants & Leisure 2.5% | | | | | | | | |
| | |
McDonald’s Corp. | | | 17,023 | | | $ | 4,484,539 | |
| | |
Industrial Conglomerates 1.5% | | | | | | | | |
| | |
General Electric Co. | | | 24,595 | | | | 2,718,977 | |
| | |
Insurance 8.0% | | | | | | | | |
Chubb Ltd. | | | 38,623 | | | | 8,040,536 | |
MetLife, Inc. | | | 103,603 | | | | 6,517,665 | |
| | | | | | | | |
| | |
| | | | | | | 14,558,201 | |
| | |
Interactive Media & Services 5.0% | | | | | | | | |
| | |
Alphabet, Inc. (Class A Stock)* | | | 23,053 | | | | 3,016,716 | |
Meta Platforms, Inc. (Class A Stock)* | | | 20,283 | | | | 6,089,159 | |
| | | | | | | | |
| | |
| | | | | | | 9,105,875 | |
| | |
Machinery 0.7% | | | | | | | | |
| | |
Deere & Co. | | | 3,486 | | | | 1,315,547 | |
| | |
Multi-Utilities 3.3% | | | | | | | | |
| | |
NiSource, Inc. | | | 240,772 | | | | 5,942,253 | |
| | |
Oil, Gas & Consumable Fuels 5.9% | | | | | | | | |
| | |
Hess Corp. | | | 69,355 | | | | 10,611,315 | |
| | |
Pharmaceuticals 12.1% | | | | | | | | |
| | |
AstraZeneca PLC (United Kingdom), ADR | | | 118,375 | | | | 8,016,355 | |
Bristol-Myers Squibb Co. | | | 83,857 | | | | 4,867,060 | |
Eli Lilly & Co. | | | 16,818 | | | | 9,033,453 | |
| | | | | | | | |
| | |
| | | | | | | 21,916,868 | |
| | |
Semiconductors & Semiconductor Equipment 7.4% | | | | | | | | |
| | |
Advanced Micro Devices, Inc.* | | | 26,791 | | | | 2,754,651 | |
Broadcom, Inc. | | | 4,896 | | | | 4,066,520 | |
Lam Research Corp. | | | 4,967 | | | | 3,113,166 | |
NXP Semiconductors NV (China) | | | 16,902 | | | | 3,379,048 | |
| | | | | | | | |
| | |
| | | | | | | 13,313,385 | |
See Notes to Financial Statements.
16
| | | | | | | | |
| | |
| Description | | Shares | | | Value | |
| | |
COMMON STOCKS (Continued) | | | | | | | | |
| | |
Software 6.0% | | | | | | | | |
| | |
Microsoft Corp. | | | 22,083 | | | $ | 6,972,707 | |
Salesforce, Inc.* | | | 19,588 | | | | 3,972,055 | |
| | | | | | | | |
| | | | | | | 10,944,762 | |
| | |
Technology Hardware, Storage & Peripherals 3.2% | | | | | | | | |
Dell Technologies, Inc. (Class C Stock) | | | 83,163 | | | | 5,729,931 | |
| | | | | | | | |
| | |
TOTAL LONG-TERM INVESTMENTS | | | | | | | | |
(cost $141,436,760) | | | | | | | 181,078,236 | |
| | | | | | | | |
| | |
SHORT-TERM INVESTMENTS 2.3% | | | | | | | | |
| | |
AFFILIATED MUTUAL FUNDS | | | | | | | | |
PGIM Core Government Money Market Fund(wb) | | | 1,034,350 | | | | 1,034,350 | |
PGIM Institutional Money Market Fund | | | | | | | | |
(cost $3,125,747; includes $3,124,320 of cash collateral for securities on loan)(b)(wb) | | | 3,127,623 | | | | 3,125,747 | |
| | | | | | | | |
| | |
TOTAL SHORT-TERM INVESTMENTS | | | | | | | | |
(cost $4,160,097) | | | | | | | 4,160,097 | |
| | | | | | | | |
| | |
TOTAL INVESTMENTS 102.3% | | | | | | | | |
(cost $145,596,857) | | | | | | | 185,238,333 | |
Liabilities in excess of other assets (2.3)% | | | | | | | (4,186,189 | ) |
| | | | | | | | |
| | |
NET ASSETS 100.0% | | | | | | $ | 181,052,144 | |
| | | | | | | | |
Below is a list of the abbreviation(s) used in the annual report:
ADR—American Depositary Receipt
SOFR—Secured Overnight Financing Rate
| * | Non-income producing security. |
| (a) | All or a portion of security is on loan. The aggregate market value of such securities, including those sold and pending settlement, is $3,032,062; cash collateral of $3,124,320 (included in liabilities) was received with which the Fund purchased highly liquid short-term investments. In the event of significant appreciation in value of securities on loan on the last business day of the reporting period, the Fund may reflect a collateral value that is less than the market value of the loaned securities and such shortfall is remedied the following business day. |
| (b) | Represents security, or portion thereof, purchased with cash collateral received for securities on loan and includes dividend reinvestment. |
| (wb) | Represents an investment in a Fund affiliated with the Manager. |
See Notes to Financial Statements.
PGIM Jennison Focused Value Fund 17
Schedule of Investments (continued)
as of September 30, 2023
Fair Value Measurements:
Various inputs are used in determining the value of the Fund’s investments. These inputs are summarized in the three broad levels listed below.
Level 1—unadjusted quoted prices generally in active markets for identical securities.
Level 2—quoted prices for similar securities, interest rates and yield curves, prepayment speeds, foreign currency exchange rates and other observable inputs.
Level 3—unobservable inputs for securities valued in accordance with Board approved fair valuation procedures.
The following is a summary of the inputs used as of September 30, 2023 in valuing such portfolio securities:
| | | | | | | | | | | | | | | |
| | | Level 1 | | Level 2 | | Level 3 |
Investments in Securities | | | | | | | | | | | | | | | |
Assets | | | | | | | | | | | | | | | |
Long-Term Investments | | | | | | | | | | | | | | | |
Common Stocks | | | | | | | | | | | | | | | |
Aerospace & Defense | | | $ | — | | | | $ | 5,572,648 | | | | $ | — | |
Automobile Components | | | | 3,041,502 | | | | | — | | | | | — | |
Automobiles | | | | 3,060,539 | | | | | — | | | | | — | |
Banks | | | | 17,447,628 | | | | | — | | | | | — | |
Biotechnology | | | | 4,619,220 | | | | | — | | | | | — | |
Building Products | | | | 4,162,033 | | | | | — | | | | | — | |
Capital Markets | | | | 7,980,810 | | | | | — | | | | | — | |
Chemicals | | | | 7,397,477 | | | | | — | | | | | — | |
Consumer Staples Distribution & Retail | | | | 10,543,225 | | | | | — | | | | | — | |
Electric Utilities | | | | 3,604,039 | | | | | — | | | | | — | |
Energy Equipment & Services | | | | 6,932,161 | | | | | — | | | | | — | |
Ground Transportation | | | | 6,075,301 | | | | | — | | | | | — | |
Hotels, Restaurants & Leisure | | | | 4,484,539 | | | | | — | | | | | — | |
Industrial Conglomerates | | | | 2,718,977 | | | | | — | | | | | — | |
Insurance | | | | 14,558,201 | | | | | — | | | | | — | |
Interactive Media & Services | | | | 9,105,875 | | | | | — | | | | | — | |
Machinery | | | | 1,315,547 | | | | | — | | | | | — | |
Multi-Utilities | | | | 5,942,253 | | | | | — | | | | | — | |
Oil, Gas & Consumable Fuels | | | | 10,611,315 | | | | | — | | | | | — | |
Pharmaceuticals | | | | 21,916,868 | | | | | — | | | | | — | |
Semiconductors & Semiconductor Equipment | | | | 13,313,385 | | | | | — | | | | | — | |
Software | | | | 10,944,762 | | | | | — | | | | | — | |
Technology Hardware, Storage & Peripherals | | | | 5,729,931 | | | | | — | | | | | — | |
Short-Term Investments | | | | | | | | | | | | | | | |
Affiliated Mutual Funds | | | | 4,160,097 | | | | | — | | | | | — | |
| | | | | | | | | | | | | | | |
Total | | | $ | 179,665,685 | | | | $ | 5,572,648 | | | | $ | — | |
| | | | | | | | | | | | | | | |
See Notes to Financial Statements.
18
Industry Classification:
The industry classification of investments and liabilities in excess of other assets shown as a percentage of net assets as of September 30, 2023 were as follows:
| | | | |
Pharmaceuticals | | | 12.1 | % |
Banks | | | 9.6 | |
Insurance | | | 8.0 | |
Semiconductors & Semiconductor Equipment | | | 7.4 | |
Software | | | 6.0 | |
Oil, Gas & Consumable Fuels | | | 5.9 | |
Consumer Staples Distribution & Retail | | | 5.8 | |
Interactive Media & Services | | | 5.0 | |
Capital Markets | | | 4.4 | |
Chemicals | | | 4.1 | |
Energy Equipment & Services | | | 3.8 | |
Ground Transportation | | | 3.4 | |
Multi-Utilities | | | 3.3 | |
Technology Hardware, Storage & Peripherals | | | 3.2 | |
Aerospace & Defense | | | 3.1 | |
Biotechnology | | | 2.5 | |
| | | | |
Hotels, Restaurants & Leisure | | | 2.5 | % |
Building Products | | | 2.3 | |
Affiliated Mutual Funds (1.7% represents investments purchased with collateral from securities on loan) | | | 2.3 | |
Electric Utilities | | | 2.0 | |
Automobiles | | | 1.7 | |
Automobile Components | | | 1.7 | |
Industrial Conglomerates | | | 1.5 | |
Machinery | | | 0.7 | |
| | | | |
| | | 102.3 | |
Liabilities in excess of other assets | | | (2.3 | ) |
| | | | |
| |
| | | 100.0 | % |
| | | | |
Financial Instruments/Transactions—Summary of Offsetting and Netting Arrangements:
The Fund entered into financial instruments/transactions during the reporting period that are either offset in accordance with current requirements or are subject to enforceable master netting arrangements or similar agreements that permit offsetting. The information about offsetting and related netting arrangements for financial instruments/transactions where the legal right to set-off exists is presented in the summary below.
Offsetting of financial instrument/transaction assets and liabilities:
| | | | | | |
| | | Gross Market | | | | |
| | | Value of | | | | |
| | | Recognized | | Collateral | | Net |
| Description | | Assets/(Liabilities) | | Pledged/(Received)(1) | | Amount |
| | | |
Securities on Loan | | $3,032,062 | | $(3,032,062) | | $— |
| (1) | Collateral amount disclosed by the Fund is limited to the market value of financial instruments/transactions. |
See Notes to Financial Statements.
PGIM Jennison Focused Value Fund 19
Statement of Assets and Liabilities
as of September 30, 2023
| | | | | | |
Assets | | | | | | |
| | |
Investments at value, including securities on loan of $3,032,062: | | | | | | |
Unaffiliated investments (cost $141,436,760) | | $ | 181,078,236 | | | |
Affiliated investments (cost $4,160,097) | | | 4,160,097 | | | |
Dividends receivable | | | 123,046 | | | |
Receivable for Fund shares sold | | | 59,267 | | | |
Tax reclaim receivable | | | 9,707 | | | |
Prepaid expenses | | | 1,263 | | | |
| | | | | | |
Total Assets | | | 185,431,616 | | | |
| | | | | | |
| | |
Liabilities | | | | | | |
| | |
Payable to broker for collateral for securities on loan | | | 3,124,320 | | | |
Payable for Fund shares purchased | | | 1,016,466 | | | |
Management fee payable | | | 90,242 | | | |
Accrued expenses and other liabilities | | | 85,402 | | | |
Distribution fee payable | | | 41,445 | | | |
Affiliated transfer agent fee payable | | | 21,585 | | | |
Directors’ fees payable | | | 12 | | | |
| | | | | | |
Total Liabilities | | | 4,379,472 | | | |
| | | | | | |
| | |
Net Assets | | $ | 181,052,144 | | | |
| | | | | | |
| | |
| | | | | | | |
| | |
Net assets were comprised of: | | | | | | |
Common stock, at par | | $ | 10,373 | | | |
Paid-in capital in excess of par | | | 126,504,001 | | | |
Total distributable earnings (loss) | | | 54,537,770 | | | |
| | | | | | |
Net assets, September 30, 2023 | | $ | 181,052,144 | | | |
| | | | | | |
See Notes to Financial Statements.
20
| | | | | | | | |
Class A | | | | | | | | |
| | |
Net asset value and redemption price per share, ($ 151,115,592 ÷ 8,676,618 shares of common stock issued and outstanding) | | $ | 17.42 | | | | | |
Maximum sales charge (5.50% of offering price) | | | 1.01 | | | | | |
| | | | | | | | |
Maximum offering price to public | | $ | 18.43 | | | | | |
| | | | | | | | |
| | |
Class C | | | | | | | | |
| | |
Net asset value, offering price and redemption price per share, ($ 3,109,523 ÷ 245,828 shares of common stock issued and outstanding) | | $ | 12.65 | | | | | |
| | | | | | | | |
| | |
Class R | | | | | | | | |
| | |
Net asset value, offering price and redemption price per share, ($ 232,718 ÷ 16,294 shares of common stock issued and outstanding) | | $ | 14.28 | | | | | |
| | | | | | | | |
| | |
Class Z | | | | | | | | |
| | |
Net asset value, offering price and redemption price per share, ($ 23,202,710 ÷ 1,251,232 shares of common stock issued and outstanding) | | $ | 18.54 | | | | | |
| | | | | | | | |
| | |
Class R6 | | | | | | | | |
| | |
Net asset value, offering price and redemption price per share, ($ 3,391,601 ÷ 183,453 shares of common stock issued and outstanding) | | $ | 18.49 | | | | | |
| | | | | | | | |
See Notes to Financial Statements.
PGIM Jennison Focused Value Fund 21
Statement of Operations
Year Ended September 30, 2023
| | | | |
Net Investment Income (Loss) | | | | |
| |
Income | | | | |
Unaffiliated dividend income (net of $23,097 foreign withholding tax) | | $ | 3,770,206 | |
Affiliated dividend income | | | 107,727 | |
Affiliated income from securities lending, net | | | 2,062 | |
| | | | |
Total income | | | 3,879,995 | |
| | | | |
| |
Expenses | | | | |
Management fee | | | 1,111,352 | |
Distribution fee(a) | | | 499,177 | |
Transfer agent’s fees and expenses (including affiliated expense of $118,385)(a) | | | 291,273 | |
Registration fees(a) | | | 49,515 | |
Custodian and accounting fees | | | 44,015 | |
Professional fees | | | 38,636 | |
Shareholders’ reports | | | 38,315 | |
Audit fee | | | 24,910 | |
Directors’ fees | | | 12,502 | |
Miscellaneous | | | 23,985 | |
| | | | |
| |
Total expenses | | | 2,133,680 | |
Less: Fee waiver and/or expense reimbursement(a) | | | (37,560 | ) |
Distribution fee waiver(a) | | | (926 | ) |
| | | | |
| |
Net expenses | | | 2,095,194 | |
| | | | |
| |
Net investment income (loss) | | | 1,784,801 | |
| | | | |
| |
Realized And Unrealized Gain (Loss) On Investment And Foreign Currency Transactions | | | | |
| |
Net realized gain (loss) on: | | | | |
Investment transactions (including affiliated of $(4,978)) | | | 13,657,175 | |
Foreign currency transactions | | | (2,467 | ) |
| | | | |
| |
| | | 13,654,708 | |
| | | | |
Net change in unrealized appreciation (depreciation) on: | | | | |
Investments | | | 15,506,727 | |
Foreign currencies | | | 6,203 | |
| | | | |
| |
| | | 15,512,930 | |
| | | | |
| |
Net gain (loss) on investment and foreign currency transactions | | | 29,167,638 | |
| | | | |
| |
Net Increase (Decrease) In Net Assets Resulting From Operations | | $ | 30,952,439 | |
| | | | |
| (a) | Class specific expenses and waivers were as follows: |
| | | | | | | | | | | | | | | | | | | | |
| | | Class A | | | Class C | | | Class R | | | Class Z | | | Class R6 | |
Distribution fee | | | 460,788 | | | | 35,611 | | | | 2,778 | | | | — | | | | — | |
Transfer agent’s fees and expenses | | | 251,440 | | | | 9,086 | | | | 1,272 | | | | 29,122 | | | | 353 | |
Registration fees | | | 14,986 | | | | 11,465 | | | | 5,289 | | | | 8,485 | | | | 9,290 | |
Fee waiver and/or expense reimbursement | | | — | | | | — | | | | (5,310 | ) | | | (25,261 | ) | | | (6,989 | ) |
Distribution fee waiver | | | — | | | | — | | | | (926 | ) | | | — | | | | — | |
See Notes to Financial Statements.
22
Statements of Changes in Net Assets
| | | | | | | | | | | | | | | | |
| |
| | | Year Ended
September 30, |
| | | | | |
| | | | | | 2023 | | | | | 2022 | | | |
| | | | | |
Increase (Decrease) in Net Assets | | | | | | | | | | | | | | | | |
| | | | | |
Operations | | | | | | | | | | | | | | | | |
Net investment income (loss) | | | | | | $ | 1,784,801 | | | | | $ | 1,884,567 | | | |
Net realized gain (loss) on investment and foreign currency transactions | | | | | | | 13,654,708 | | | | | | 5,143,533 | | | |
Net change in unrealized appreciation (depreciation) on investments and foreign currencies | | | | | | | 15,512,930 | | | | | | (34,275,075 | ) | | |
| | | | | | | | | | | | | | | | |
| | | | | |
Net increase (decrease) in net assets resulting from operations | | | | | | | 30,952,439 | | | | | | (27,246,975 | ) | | |
| | | | | | | | | | | | | | | | |
| | | | | |
Dividends and Distributions | | | | | | | | | | | | | | | | |
Distributions from distributable earnings | | | | | | | | | | | | | | | | |
Class A | | | | | | | (4,904,534 | ) | | | | | (8,148,900 | ) | | |
Class C | | | | | | | (129,521 | ) | | | | | (270,521 | ) | | |
Class R | | | | | | | (17,021 | ) | | | | | (25,972 | ) | | |
Class Z | | | | | | | (806,229 | ) | | | | | (1,363,410 | ) | | |
Class R6 | | | | | | | (168,416 | ) | | | | | (129,428 | ) | | |
| | | | | | | | | | | | | | | | |
| | | | | |
| | | | | | | (6,025,721 | ) | | | | | (9,938,231 | ) | | |
| | | | | | | | | | | | | | | | |
| | | | | |
Fund share transactions (Net of share conversions) | | | | | | | | | | | | | | | | |
Net proceeds from shares sold | | | | | | | 10,720,145 | | | | | | 15,317,662 | | | |
Net asset value of shares issued in reinvestment of dividends and distributions | | | | | | | 5,942,215 | | | | | | 9,804,018 | | | |
Cost of shares purchased | | | | | | | (32,625,117 | ) | | | | | (34,420,948 | ) | | |
| | | | | | | | | | | | | | | | |
| | | | | |
Net increase (decrease) in net assets from Fund share transactions | | | | | | | (15,962,757 | ) | | | | | (9,299,268 | ) | | |
| | | | | | | | | | | | | | | | |
Total increase (decrease) | | | | | | | 8,963,961 | | | | | | (46,484,474 | ) | | |
| | | | | |
Net Assets: | | | | | | | | | | | | | | | | |
| | | | | |
Beginning of year | | | | | | | 172,088,183 | | | | | | 218,572,657 | | | |
| | | | | | | | | | | | | | | | |
| | | | | |
End of year | | | | | | $ | 181,052,144 | | | | | $ | 172,088,183 | | | |
| | | | | | | | | | | | | | | | |
See Notes to Financial Statements.
PGIM Jennison Focused Value Fund 23
Financial Highlights
| | | | | | | | | | | | | | | | | | | | |
| | | | | | |
| Class A Shares | | | | | | | | | | | | | | | |
| | |
| | | Year Ended September 30, | |
| | | | | | |
| | | 2023 | | | 2022 | | | 2021 | | | 2020 | | | 2019 | |
Per Share Operating Performance(a): | | | | | | | | | | | | | | | | | | | | |
Net Asset Value, Beginning of Year | | | $15.18 | | | | $18.37 | | | | $14.03 | | | | $15.63 | | | | $20.62 | |
Income (loss) from investment operations: | | | | | | | | | | | | | | | | | | | | |
Net investment income (loss) | | | 0.16 | | | | 0.16 | | | | 0.09 | | | | 0.12 | | | | 0.14 | |
| Net realized and unrealized gain (loss) on investment and foreign currency transactions | | | 2.62 | | | | (2.50 | ) | | | 4.39 | | | | (0.38 | ) | | | (2.42 | ) |
Total from investment operations | | | 2.78 | | | | (2.34 | ) | | | 4.48 | | | | (0.26 | ) | | | (2.28 | ) |
Less Dividends and Distributions: | | | | | | | | | | | | | | | | | | | | |
Dividends from net investment income | | | (0.16 | ) | | | (0.10 | ) | | | (0.14 | ) | | | (0.15 | ) | | | (0.09 | ) |
Distributions from net realized gains | | | (0.38 | ) | | | (0.75 | ) | | | - | | | | (1.19 | ) | | | (2.62 | ) |
Total dividends and distributions | | | (0.54 | ) | | | (0.85 | ) | | | (0.14 | ) | | | (1.34 | ) | | | (2.71 | ) |
Net asset value, end of year | | | $17.42 | | | | $15.18 | | | | $18.37 | | | | $14.03 | | | | $15.63 | |
Total Return(b): | | | 18.51 | % | | | (13.63 | )% | | | 32.13 | % | | | (2.50 | )% | | | (10.13 | )% |
| | | | | | | | | | | | | | | | | | | | |
| | | | | | |
| Ratios/Supplemental Data: | | | | | | | | | | | | | | | |
Net assets, end of year (000) | | | $151,116 | | | | $140,226 | | | | $179,848 | | | | $151,149 | | | | $181,559 | |
Average net assets (000) | | | $153,596 | | | | $173,289 | | | | $173,975 | | | | $163,554 | | | | $193,160 | |
Ratios to average net assets(c): | | | | | | | | | | | | | | | | | | | | |
Expenses after waivers and/or expense reimbursement | | | 1.17 | % | | | 1.13 | % | | | 1.11 | % | | | 1.15 | % | | | 1.11 | % |
Expenses before waivers and/or expense reimbursement | | | 1.17 | % | | | 1.13 | % | | | 1.11 | % | | | 1.15 | % | | | 1.11 | % |
Net investment income (loss) | | | 0.92 | % | | | 0.88 | % | | | 0.53 | % | | | 0.85 | % | | | 0.87 | % |
Portfolio turnover rate(d) | | | 37 | % | | | 31 | % | | | 32 | % | | | 128 | % | | | 47 | % |
| (a) | Calculated based on average shares outstanding during the year. |
| (b) | Total return does not consider the effects of sales loads. Total return is calculated assuming a purchase of a share on the first day and a sale on the last day of each year reported and includes reinvestment of dividends and distributions, if any. Total returns may reflect adjustments to conform to GAAP. |
| (c) | Does not include expenses of the underlying funds in which the Fund invests. |
| (d) | The Fund’s portfolio turnover rate is calculated in accordance with regulatory requirements, without regard to transactions involving short-term investments, certain derivatives and in-kind transactions (if any). If such transactions were included, the Fund’s portfolio turnover rate may be higher. |
See Notes to Financial Statements.
24
| | | | | | | | | | | | | | | | | | | | |
| | | | | | |
| Class C Shares | | | | | | | | | | | | | | | |
| | |
| | | Year Ended September 30, | |
| | | | | | |
| | | 2023 | | | 2022 | | | 2021 | | | 2020 | | | 2019 | |
Per Share Operating Performance(a): | | | | | | | | | | | | | | | | | | | | |
Net Asset Value, Beginning of Year | | | $11.18 | | | | $13.78 | | | | $10.59 | | | | $12.15 | | | | $16.75 | |
Income (loss) from investment operations: | | | | | | | | | | | | | | | | | | | | |
Net investment income (loss) | | | (0.02 | )(b) | | | (0.02 | )(b) | | | (0.05 | )(b) | | | (- | )(b)(c) | | | 0.02 | |
| Net realized and unrealized gain (loss) on investment and foreign currency transactions | | | 1.92 | | | | (1.83 | ) | | | 3.32 | | | | (0.29 | ) | | | (2.00 | ) |
Total from investment operations | | | 1.90 | | | | (1.85 | ) | | | 3.27 | | | | (0.29 | ) | | | (1.98 | ) |
Less Dividends and Distributions: | | | | | | | | | | | | | | | | | | | | |
Dividends from net investment income | | | (0.05 | ) | | | (- | )(c) | | | (0.08 | ) | | | (0.08 | ) | | | - | |
Distributions from net realized gains | | | (0.38 | ) | | | (0.75 | ) | | | - | | | | (1.19 | ) | | | (2.62 | ) |
Total dividends and distributions | | | (0.43 | ) | | | (0.75 | ) | | | (0.08 | ) | | | (1.27 | ) | | | (2.62 | ) |
Net asset value, end of year | | | $12.65 | | | | $11.18 | | | | $13.78 | | | | $10.59 | | | | $12.15 | |
Total Return(d): | | | 17.26 | % | | | (14.57 | )% | | | 31.06 | % | | | (3.41 | )% | | | (10.78 | )% |
| | | | | | | | | | | | | | | | | | | | | |
| | | | | | |
| Ratios/Supplemental Data: | | | | | | | | | | | | | | | |
Net assets, end of year (000) | | | $3,110 | | | | $3,449 | | | | $5,279 | | | | $5,874 | | | | $10,945 | |
Average net assets (000) | | | $3,561 | | | | $4,688 | | | | $5,725 | | | | $8,068 | | | | $20,114 | |
Ratios to average net assets(e): | | | | | | | | | | | | | | | | | | | | |
Expenses after waivers and/or expense reimbursement | | | 2.27 | % | | | 2.12 | % | | | 2.03 | % | | | 2.02 | % | | | 1.85 | % |
Expenses before waivers and/or expense reimbursement | | | 2.27 | % | | | 2.12 | % | | | 2.03 | % | | | 2.02 | % | | | 1.85 | % |
Net investment income (loss) | | | (0.17 | )% | | | (0.14 | )% | | | (0.39 | )% | | | (0.02 | )% | | | 0.13 | % |
Portfolio turnover rate(f) | | | 37 | % | | | 31 | % | | | 32 | % | | | 128 | % | | | 47 | % |
| (a) | Calculated based on average shares outstanding during the year. |
| (b) | The per share amount of net investment income (loss) does not directly correlate to the amounts reported in the Statement of Operations due to class specific expenses. |
| (c) | Amount rounds to zero. |
| (d) | Total return does not consider the effects of sales loads. Total return is calculated assuming a purchase of a share on the first day and a sale on the last day of each year reported and includes reinvestment of dividends and distributions, if any. Total returns may reflect adjustments to conform to GAAP. |
| (e) | Does not include expenses of the underlying funds in which the Fund invests. |
| (f) | The Fund’s portfolio turnover rate is calculated in accordance with regulatory requirements, without regard to transactions involving short-term investments, certain derivatives and in-kind transactions (if any). If such transactions were included, the Fund’s portfolio turnover rate may be higher. |
See Notes to Financial Statements.
PGIM Jennison Focused Value Fund 25
Financial Highlights (continued)
| | | | | | | | | | | | | | | | | | | | |
| | | | | | |
| Class R Shares | | | | | | | | | | | | | | | |
| | |
| | | Year Ended September 30, | |
| | | | | | |
| | | 2023 | | | 2022 | | | 2021 | | | 2020 | | | 2019 | |
Per Share Operating Performance(a): | | | | | | | | | | | | | | | | | | | | |
Net Asset Value, Beginning of Year | | | $12.54 | | | | $15.33 | | | | $11.75 | | | | $13.30 | | | | $18.01 | |
Income (loss) from investment operations: | | | | | | | | | | | | | | | | | | | | |
Net investment income (loss) | | | 0.08 | | | | 0.07 | | | | 0.02 | | | | 0.05 | | | | 0.06 | |
| Net realized and unrealized gain (loss) on investment and foreign currency transactions | | | 2.15 | | | | (2.06 | ) | | | 3.68 | | | | (0.30 | ) | | | (2.13 | ) |
Total from investment operations | | | 2.23 | | | | (1.99 | ) | | | 3.70 | | | | (0.25 | ) | | | (2.07 | ) |
Less Dividends and Distributions: | | | | | | | | | | | | | | | | | | | | |
Dividends from net investment income | | | (0.11 | ) | | | (0.05 | ) | | | (0.12 | ) | | | (0.11 | ) | | | (0.02 | ) |
Distributions from net realized gains | | | (0.38 | ) | | | (0.75 | ) | | | - | | | | (1.19 | ) | | | (2.62 | ) |
Total dividends and distributions | | | (0.49 | ) | | | (0.80 | ) | | | (0.12 | ) | | | (1.30 | ) | | | (2.64 | ) |
Net asset value, end of year | | | $14.28 | | | | $12.54 | | | | $15.33 | | | | $11.75 | | | | $13.30 | |
Total Return(b): | | | 18.03 | % | | | (13.99 | )% | | | 31.64 | % | | | (2.82 | )% | | | (10.53 | )% |
| | | | | | | | | | | | | | | | | | | | | |
| | | | | | |
| Ratios/Supplemental Data: | | | | | | | | | | | | | | | |
Net assets, end of year (000) | | | $233 | | | | $431 | | | | $487 | | | | $494 | | | | $2,041 | |
Average net assets (000) | | | $370 | | | | $492 | | | | $562 | | | | $1,047 | | | | $2,504 | |
Ratios to average net assets(c): | | | | | | | | | | | | | | | | | | | | |
Expenses after waivers and/or expense reimbursement | | | 1.53 | % | | | 1.53 | % | | | 1.53 | % | | | 1.53 | % | | | 1.53 | % |
Expenses before waivers and/or expense reimbursement | | | 3.21 | % | | | 2.72 | % | | | 2.74 | % | | | 2.91 | % | | | 1.89 | % |
Net investment income (loss) | | | 0.60 | % | | | 0.49 | % | | | 0.11 | % | | | 0.38 | % | | | 0.44 | % |
Portfolio turnover rate(d) | | | 37 | % | | | 31 | % | | | 32 | % | | | 128 | % | | | 47 | % |
| (a) | Calculated based on average shares outstanding during the year. |
| (b) | Total return is calculated assuming a purchase of a share on the first day and a sale on the last day of each year reported and includes reinvestment of dividends and distributions, if any. Total returns may reflect adjustments to conform to GAAP. |
| (c) | Does not include expenses of the underlying funds in which the Fund invests. |
| (d) | The Fund’s portfolio turnover rate is calculated in accordance with regulatory requirements, without regard to transactions involving short-term investments, certain derivatives and in-kind transactions (if any). If such transactions were included, the Fund’s portfolio turnover rate may be higher. |
See Notes to Financial Statements.
26
| | | | | | | | | | | | | | | | | | | | |
| | | | | | |
| Class Z Shares | | | | | | | | | | | | | | | |
| | |
| | | Year Ended September 30, | |
| | | | | | |
| | | 2023 | | | 2022 | | | 2021 | | | 2020 | | | 2019 | |
Per Share Operating Performance(a): | | | | | | | | | | | | | | | | | | | | |
Net Asset Value, Beginning of Year | | | $16.11 | | | | $19.44 | | | | $14.82 | | | | $16.43 | | | | $21.52 | |
Income (loss) from investment operations: | | | | | | | | | | | | | | | | | | | | |
Net investment income (loss) | | | 0.24 | | | | 0.22 | | | | 0.15 | | | | 0.18 | | | | 0.21 | |
| Net realized and unrealized gain (loss) on investment and foreign currency transactions | | | 2.78 | | | | (2.65 | ) | | | 4.65 | | | | (0.42 | ) | | | (2.54 | ) |
Total from investment operations | | | 3.02 | | | | (2.43 | ) | | | 4.80 | | | | (0.24 | ) | | | (2.33 | ) |
Less Dividends and Distributions: | | | | | | | | | | | | | | | | | | | | |
Dividends from net investment income | | | (0.21 | ) | | | (0.15 | ) | | | (0.18 | ) | | | (0.18 | ) | | | (0.14 | ) |
Distributions from net realized gains | | | (0.38 | ) | | | (0.75 | ) | | | - | | | | (1.19 | ) | | | (2.62 | ) |
Total dividends and distributions | | | (0.59 | ) | | | (0.90 | ) | | | (0.18 | ) | | | (1.37 | ) | | | (2.76 | ) |
Net asset value, end of year | | | $18.54 | | | | $16.11 | | | | $19.44 | | | | $14.82 | | | | $16.43 | |
Total Return(b): | | | 18.97 | % | | | (13.39 | )% | | | 32.52 | % | | | (2.16 | )% | | | (9.86 | )% |
| | | | | | | | | | | | | | | | | | | | | |
| | | | | | |
| Ratios/Supplemental Data: | | | | | | | | | | | | | | | |
Net assets, end of year (000) | | | $23,203 | | | | $23,080 | | | | $30,080 | | | | $30,153 | | | | $58,051 | |
Average net assets (000) | | | $22,891 | | | | $28,698 | | | | $30,701 | | | | $40,142 | | | | $101,530 | |
Ratios to average net assets(c): | | | | | | | | | | | | | | | | | | | | |
Expenses after waivers and/or expense reimbursement | | | 0.75 | % | | | 0.83 | % | | | 0.82 | % | | | 0.84 | % | | | 0.80 | % |
Expenses before waivers and/or expense reimbursement | | | 0.86 | % | | | 0.83 | % | | | 0.82 | % | | | 0.84 | % | | | 0.80 | % |
Net investment income (loss) | | | 1.33 | % | | | 1.17 | % | | | 0.82 | % | | | 1.15 | % | | | 1.20 | % |
Portfolio turnover rate(d) | | | 37 | % | | | 31 | % | | | 32 | % | | | 128 | % | | | 47 | % |
| (a) | Calculated based on average shares outstanding during the year. |
| (b) | Total return is calculated assuming a purchase of a share on the first day and a sale on the last day of each year reported and includes reinvestment of dividends and distributions, if any. Total returns may reflect adjustments to conform to GAAP. |
| (c) | Does not include expenses of the underlying funds in which the Fund invests. |
| (d) | The Fund’s portfolio turnover rate is calculated in accordance with regulatory requirements, without regard to transactions involving short-term investments, certain derivatives and in-kind transactions (if any). If such transactions were included, the Fund’s portfolio turnover rate may be higher. |
See Notes to Financial Statements.
PGIM Jennison Focused Value Fund 27
Financial Highlights (continued)
| | | | | | | | | | | | | | | | | | | | |
| | | | | | |
| Class R6 Shares | | | | | | | | | | | | | | | |
| | |
| | | Year Ended September 30, | |
| | | | | | |
| | | 2023 | | | 2022 | | | 2021 | | | 2020 | | | 2019 | |
Per Share Operating Performance(a): | | | | | | | | | | | | | | | | | | | | |
Net Asset Value, Beginning of Year | | | $16.06 | | | | $19.39 | | | | $14.79 | | | | $16.39 | | | | $21.53 | |
Income (loss) from investment operations: | | | | | | | | | | | | | | | | | | | | |
Net investment income (loss) | | | 0.24 | | | | 0.23 | | | | 0.15 | | | | 0.18 | | | | 0.22 | |
| Net realized and unrealized gain (loss) on investment and foreign currency transactions | | | 2.78 | | | | (2.66 | ) | | | 4.63 | | | | (0.41 | ) | | | (2.59 | ) |
Total from investment operations | | | 3.02 | | | | (2.43 | ) | | | 4.78 | | | | (0.23 | ) | | | (2.37 | ) |
Less Dividends and Distributions: | | | | | | | | | | | | | | | | | | | | |
Dividends from net investment income | | | (0.21 | ) | | | (0.15 | ) | | | (0.18 | ) | | | (0.18 | ) | | | (0.15 | ) |
Distributions from net realized gains | | | (0.38 | ) | | | (0.75 | ) | | | - | | | | (1.19 | ) | | | (2.62 | ) |
Total dividends and distributions | | | (0.59 | ) | | | (0.90 | ) | | | (0.18 | ) | | | (1.37 | ) | | | (2.77 | ) |
Net asset value, end of year | | | $18.49 | | | | $16.06 | | | | $19.39 | | | | $14.79 | | | | $16.39 | |
Total Return(b): | | | 19.03 | % | | | (13.43 | )% | | | 32.54 | % | | | (2.17 | )% | | | (10.08 | )% |
| | | | | | | | | | | | | | | | | | | | | |
| | | | | | |
| Ratios/Supplemental Data: | | | | | | | | | | | | | | | |
Net assets, end of year (000) | | | $3,392 | | | | $4,902 | | | | $2,878 | | | | $1,151 | | | | $1,332 | |
Average net assets (000) | | | $4,806 | | | | $2,998 | | | | $1,894 | | | | $1,210 | | | | $12,474 | |
Ratios to average net assets(c): | | | | | | | | | | | | | | | | | | | | |
Expenses after waivers and/or expense reimbursement | | | 0.75 | % | | | 0.83 | % | | | 0.82 | % | | | 0.84 | % | | | 0.78 | % |
Expenses before waivers and/or expense reimbursement | | | 0.90 | % | | | 1.00 | % | | | 0.98 | % | | | 1.83 | % | | | 0.78 | % |
Net investment income (loss) | | | 1.35 | % | | | 1.20 | % | | | 0.80 | % | | | 1.17 | % | | | 1.26 | % |
Portfolio turnover rate(d) | | | 37 | % | | | 31 | % | | | 32 | % | | | 128 | % | | | 47 | % |
| (a) | Calculated based on average shares outstanding during the year. |
| (b) | Total return is calculated assuming a purchase of a share on the first day and a sale on the last day of each year reported and includes reinvestment of dividends and distributions, if any. Total returns may reflect adjustments to conform to GAAP. |
| (c) | Does not include expenses of the underlying funds in which the Fund invests. |
| (d) | The Fund’s portfolio turnover rate is calculated in accordance with regulatory requirements, without regard to transactions involving short-term investments, certain derivatives and in-kind transactions (if any). If such transactions were included, the Fund’s portfolio turnover rate may be higher. |
See Notes to Financial Statements.
28
Notes to Financial Statements
The Prudential Investment Portfolios, Inc. (the “Registered Investment Company” or “RIC”) is registered under the Investment Company Act of 1940, as amended (“1940 Act”), as an open-end management investment company. The RIC is organized as a Maryland Corporation. These financial statements relate only to the PGIM Jennison Focused Value Fund (the “Fund”), a series of the RIC. The Fund is classified as a diversified fund for purposes of the 1940 Act.
The investment objective of the Fund is to achieve long-term growth of capital.
The Fund follows the investment company accounting and reporting guidance of the Financial Accounting Standards Board (“FASB”) Accounting Standard Codification (“ASC”) Topic 946 Financial Services — Investment Companies. The following is a summary of significant accounting policies followed by the Fund in the preparation of its financial statements. The policies conform to U.S. generally accepted accounting principles (“GAAP”). The Fund consistently follows such policies in the preparation of its financial statements.
Securities Valuation: The Fund holds securities and other assets and liabilities that are fair valued as of the close of each day (generally, 4:00 PM Eastern time) the New York Stock Exchange (“NYSE”) is open for trading. As described in further detail below, the Fund’s investments are valued daily based on a number of factors, including the type of investment and whether market quotations are readily available. The RIC’s Board of Directors (the “Board”) has approved the Fund’s valuation policies and procedures for security valuation and designated PGIM Investments LLC (“PGIM Investments” or the “Manager”) as the “Valuation Designee,” as defined by Rule 2a-5(b) under the 1940 Act, to perform the fair value determination relating to all Fund investments. Pursuant to the Board’s oversight, the Valuation Designee has established a Valuation Committee to perform the duties and responsibilities as Valuation Designee under Rule 2a-5. The valuation procedures permit the Fund to utilize independent pricing vendor services, quotations from market makers, and alternative valuation methods when market quotations are either not readily available or not deemed representative of fair value. Fair value is the estimated price that would be received to sell an asset or paid to transfer a liability in an orderly transaction between market participants on the measurement date.
For the fiscal reporting year-end, securities and other assets and liabilities were fair valued at the close of the last U.S. business day. Trading in certain foreign securities may occur when the NYSE is closed (including weekends and holidays). Because such foreign securities trade in markets that are open on weekends and U.S. holidays, the values of some of the
PGIM Jennison Focused Value Fund 29
Notes to Financial Statements (continued)
Fund’s foreign investments may change on days when investors cannot purchase or redeem Fund shares.
Various inputs determine how the Fund’s investments are valued, all of which are categorized according to the three broad levels (Level 1, 2, or 3) detailed in the Schedule of Investments and referred to herein as the “fair value hierarchy” in accordance with FASB ASC Topic 820 — Fair Value Measurement.
Common or preferred stocks, exchange-traded funds (ETFs) and derivative instruments, if applicable, that are traded on a national securities exchange are valued at the last sale price as of the close of trading on the applicable exchange where the security principally trades. Securities traded via NASDAQ are valued at the NASDAQ official closing price. To the extent these securities are valued at the last sale price or NASDAQ official closing price, they are classified as Level 1 in the fair value hierarchy. In the event that no sale or official closing price on a valuation date exists, these securities are generally valued at the mean between the last reported bid and ask prices, or at the last bid price in the absence of an ask price. These securities are classified as Level 2 in the fair value hierarchy.
Foreign equities traded on foreign securities exchanges are generally valued using pricing vendor services that provide model prices derived using adjustment factors based on information such as local closing price, relevant general and sector indices, currency fluctuations, depositary receipts, and futures, as applicable. Securities valued using such model prices are classified as Level 2 in the fair value hierarchy. The models generate an evaluated adjustment factor for each security, which is applied to the local closing price to adjust it for post closing market movements up to the time the Fund is valued. Utilizing that evaluated adjustment factor, the vendor provides an evaluated price for each security. If the vendor does not provide an evaluated price, securities are valued in accordance with exchange-traded common and preferred stock valuation policies discussed above.
Investments in open-end funds (other than ETFs) are valued at their net asset values as of the close of the NYSE on the date of valuation. These securities are classified as Level 1 in the fair value hierarchy since they may be purchased or sold at their net asset values on the date of valuation.
Securities and other assets that cannot be priced according to the methods described above are valued based on policies and procedures approved by the Board. In the event that unobservable inputs are used when determining such valuations, the securities will be classified as Level 3 in the fair value hierarchy. Altering one or more unobservable inputs may result in a significant change to a Level 3 security’s fair value measurement.
30
When determining the fair value of securities, some of the factors influencing the valuation include: the nature of any restrictions on disposition of the securities; assessment of the general liquidity of the securities; the issuer’s financial condition and the markets in which it does business; the cost of the investment; the size of the holding and the capitalization of the issuer; the prices of any recent transactions or bids/offers for such securities or any comparable securities; and any available analyst media or other reports or information deemed reliable by the Valuation Designee regarding the issuer or the markets or industry in which it operates. Using fair value to price securities may result in a value that is different from a security’s most recent closing price and from the price used by other unaffiliated mutual funds to calculate their net asset values.
Foreign Currency Translation: The books and records of the Fund are maintained in U.S. dollars. Foreign currency amounts are translated into U.S. dollars on the following basis:
(i) market value of investment securities, other assets and liabilities — at the exchange rate as of the valuation date;
(ii) purchases and sales of investment securities, income and expenses — at the rates of exchange prevailing on the respective dates of such transactions.
Although the net assets of the Fund are presented at the foreign exchange rates and market values at the close of the period, the Fund does not generally isolate that portion of the results of operations arising as a result of changes in the foreign exchange rates from the fluctuations arising from changes in the market prices of long-term portfolio securities held at the end of the period. Similarly, the Fund does not isolate the effect of changes in foreign exchange rates from the fluctuations arising from changes in the market prices of long-term portfolio securities sold during the period. Accordingly, holding period unrealized and realized foreign currency gains (losses) are included in the reported net change in unrealized appreciation (depreciation) on investments and net realized gains (losses) on investment transactions on the Statements of Operations.
Net realized gains (losses) on foreign currency transactions represent net foreign exchange gains (losses) from the disposition of holdings of foreign currencies, currency gains (losses) realized between the trade and settlement dates on investment transactions, and the difference between the amounts of interest, dividends and foreign withholding taxes recorded on the Fund’s books and the U.S. dollar equivalent amounts actually received or paid. Net unrealized currency gains (losses) arise from valuing foreign currency denominated assets and liabilities (other than investments) at period end exchange rates.
Master Netting Arrangements: The RIC, on behalf of the Fund, is subject to various Master Agreements, or netting arrangements, with select counterparties. These are agreements which a subadviser may have negotiated and entered into on behalf of all or a portion of the Fund. A master netting arrangement between the Fund and the counterparty permits the Fund to offset amounts payable by the Fund to the same counterparty against amounts to be received and by the receipt of collateral from the counterparty by the Fund to cover
PGIM Jennison Focused Value Fund 31
Notes to Financial Statements (continued)
the Fund’s exposure to the counterparty. However, there is no assurance that such mitigating factors are easily enforceable. In addition to master netting arrangements, the right to set-off exists when all the conditions are met such that each of the parties owes the other determinable amounts, the reporting party has the right to set-off the amount owed with the amount owed by the other party, the reporting party intends to set-off and the right of set-off is enforceable by law.
Securities Lending: The Fund lends its portfolio securities to banks and broker-dealers. The loans are secured by collateral at least equal to the market value of the securities loaned. Collateral pledged by each borrower is invested in an affiliated money market fund and is marked to market daily, based on the previous day’s market value, such that the value of the collateral exceeds the value of the loaned securities. In the event of significant appreciation in value of the securities on loan on the last business day of the reporting period, the financial statements may reflect a collateral value that is less than the market value of the loaned securities. Such shortfall is remedied as described above. Loans are subject to termination at the option of the borrower or the Fund. Upon termination of the loan, the borrower will return to the Fund securities identical to the loaned securities. The remaining open loans of the securities lending transactions are considered overnight and continuous. Should the borrower of the securities fail financially, the Fund has the right to repurchase the securities in the open market using the collateral.
The Fund recognizes income, net of any rebate and securities lending agent fees, for lending its securities in the form of fees or interest on the investment of any cash received as collateral. The borrower receives all interest and dividends from the securities loaned and such payments are passed back to the lender in amounts equivalent thereto, which are reflected in interest income or unaffiliated dividend income based on the nature of the payment on the Statement of Operations. The Fund also continues to recognize any unrealized gain (loss) in the market price of the securities loaned and on the change in the value of the collateral invested that may occur during the term of the loan. In addition, realized gain (loss) is recognized on changes in the value of the collateral invested upon liquidation of the collateral. Net earnings from securities lending are disclosed in the Statement of Operations.
Securities Transactions and Net Investment Income: Securities transactions are recorded on the trade date. Realized gains (losses) from investment and currency transactions are calculated on the specific identification method. Dividend income is recorded on the ex-date, or for certain foreign securities, when the Fund becomes aware of such dividends. Expenses are recorded on an accrual basis, which may require the use of certain estimates by management that may differ from actual expense amounts. Net investment income or loss (other than class specific expenses and waivers, which are allocated as noted below) and unrealized and realized gains (losses) are allocated daily to each class of shares based
32
upon the relative proportion of adjusted net assets of each class at the beginning of the day. Class specific expenses and waivers, where applicable, are charged to the respective share classes. Such class specific expenses and waivers include distribution fees and distribution fee waivers, shareholder servicing fees, transfer agent’s fees and expenses, registration fees and fee waivers and/or expense reimbursements, as applicable.
Taxes: It is the Fund’s policy to continue to meet the requirements of the Internal Revenue Code applicable to regulated investment companies and to distribute all of its taxable net investment income and capital gains, if any, to its shareholders. Therefore, no federal income tax provision is required. Withholding taxes on foreign dividends, interest and capital gains, if any, are recorded, net of reclaimable amounts, at the time the related income is earned.
Dividends and Distributions: Dividends and distributions to shareholders, which are determined in accordance with federal income tax regulations and which may differ from GAAP, are recorded on the ex-date. Permanent book/tax differences relating to income and gain (loss) are reclassified between total distributable earnings (loss) and paid-in capital in excess of par, as appropriate. The chart below sets forth the expected frequency of dividend and capital gains distributions to shareholders. Various factors may impact the frequency of dividend distributions to shareholders, including but not limited to adverse market conditions or portfolio holding-specific events.
| | | | |
| | |
| Expected Distribution Schedule to Shareholders* | | Frequency | |
| |
Net Investment Income | | | Annually | |
| |
Short-Term Capital Gains | | | Annually | |
| |
Long-Term Capital Gains | | | Annually | |
| * | Under certain circumstances, the Fund may make more than one distribution of short-term and/or long-term capital gains during a fiscal year. |
Estimates: The preparation of financial statements requires management to make estimates and assumptions that affect the reported amounts and disclosures in the financial statements. Actual results could differ from those estimates.
The RIC, on behalf of the Fund, has a management agreement with the Manager pursuant to which it has responsibility for all investment advisory services, including supervision of the subadviser’s performance of such services, and for rendering administrative services.
The Manager has entered into a subadvisory agreement with Jennison Associates LLC (“Jennison” or the “subadviser”). The Manager pays for the services of Jennison.
PGIM Jennison Focused Value Fund 33
Notes to Financial Statements (continued)
Fees payable under the management agreement are computed daily and paid monthly. For the reporting period ended September 30, 2023, the contractual and effective management fee rates were as follows:
| | | | |
| | | |
Contractual Management Rate | | | | Effective Management Fee, before any waivers and/or expense reimbursements |
| | |
0.60% of average daily net assets up to and including $300 million; | | | | 0.60% |
0.575% of average daily net assets over $300 million. | | | | |
The Manager has contractually agreed, through January 31, 2025, to limit certain operating expenses and/or to limit total annual operating expenses after fee waivers and/or expense reimbursements. The contractual waiver and expense limitation exclude interest, brokerage, taxes (such as income and foreign withholding taxes, stamp duty and deferred tax expenses), acquired fund fees and expenses, extraordinary expenses, and certain other Fund expenses such as dividend and interest expense and broker charges on short sales.
Where applicable, the Manager agrees to waive management fees or shared operating expenses on any share class to the same extent that it waives such expenses on any other share class. In addition, total annual operating expenses for Class R6 shares will not exceed total annual operating expenses for Class Z shares. Fees and/or expenses waived and/or reimbursed by the Manager for the purpose of preventing the expenses from exceeding a certain expense ratio limit may be recouped by the Manager within the same fiscal year during which such waiver and/or reimbursement is made if such recoupment can be realized without exceeding the expense limit in effect at the time of the recoupment for that fiscal year. The expense limitations attributable to each class are as follows:
| | | | | |
| | |
Class | | Expense Limitations |
A | | —% |
C | | — |
R | | 1.53* |
Z | | 0.75 |
R6 | | 0.75 |
*Expense limitation applicable only to blue sky fees, shareholder service fee, and transfer agency expenses (including sub-transfer agency and networking fees).
The RIC, on behalf of the Fund, has a distribution agreement with Prudential Investment Management Services LLC (“PIMS”), which acts as the distributor of the Class A, Class C, Class R, Class Z and Class R6 shares of the Fund. The Fund compensates PIMS for distributing and servicing the Fund’s Class A, Class C and Class R shares, pursuant to the plans of distribution (the “Distribution Plans”), regardless of expenses actually incurred by PIMS.
34
Pursuant to the Distribution Plans, the Fund compensates PIMS for distribution related activities at an annual rate based on average daily net assets per class. PIMS has contractually agreed through January 31, 2025 to limit such fees on certain classes based on the average daily net assets. The distribution fees are accrued daily and payable monthly.
The Fund’s annual gross and net distribution rates, where applicable, are as follows:
| | | | | | |
| | | | |
| Class | | Gross Distribution Fee | | | | Net Distribution Fee |
| | | |
A | | 0.30% | | | | 0.30% |
| | | |
C | | 1.00 | | | | 1.00 |
| | | |
R | | 0.75 | | | | 0.50 |
| | | |
Z | | N/A | | | | N/A |
| | | |
R6 | | N/A | | | | N/A |
For the year ended September 30, 2023, PIMS received front-end sales charges (“FESL”) resulting from sales of certain class shares and contingent deferred sales charges (“CDSC”) imposed upon redemptions by certain shareholders. From these fees, PIMS paid such sales charges to broker-dealers, who in turn paid commissions to salespersons and incurred other distribution costs. The sales charges are as follows where applicable:
| | | | | | | | |
| | | |
| Class | | FESL | | | CDSC | |
| | |
A | | $ | 43,145 | | | $ | 8 | |
| | |
C | | | — | | | | 244 | |
PGIM Investments, PIMS and Jennison are indirect, wholly-owned subsidiaries of Prudential Financial, Inc. (“Prudential”).
| 4. | Other Transactions with Affiliates |
Prudential Mutual Fund Services LLC (“PMFS”), an affiliate of PGIM Investments and an indirect, wholly-owned subsidiary of Prudential, serves as the Fund’s transfer agent and shareholder servicing agent. Transfer agent’s fees and expenses in the Statement of Operations include certain out-of-pocket expenses paid to non-affiliates, where applicable.
The Fund may invest its overnight sweep cash in the PGIM Core Government Money Market Fund (the “Core Government Fund”), a series of the Prudential Government Money Market Fund, Inc., and its securities lending cash collateral in the PGIM Institutional Money Market Fund (the “Money Market Fund”), a series of Prudential Investment Portfolios 2, each registered under the 1940 Act and managed by PGIM Investments. PGIM Investments and/or its affiliates are paid fees or reimbursed for providing their services to the Core Government Fund and the Money Market Fund. In addition to the realized and unrealized gains on investments in the Core Government Fund and the Money Market Fund, earnings from such investments are disclosed on the Statement of Operations as “Affiliated dividend income” and “Affiliated income from securities lending, net”, respectively.
The Fund may enter into certain securities purchase or sale transactions under Board approved Rule 17a-7 procedures. Rule 17a-7 is an exemptive rule under the 1940 Act that,
PGIM Jennison Focused Value Fund 35
Notes to Financial Statements (continued)
subject to certain conditions, permits purchase and sale transactions among affiliated investment companies, or between an investment company and a person that is affiliated solely by reason of having a common (or affiliated) investment adviser, common directors/trustees, and/or common officers. For the year ended September 30, 2023, no Rule 17a-7 transactions were entered into by the Fund.
The aggregate cost of purchases and proceeds from sales of portfolio securities (excluding short-term investments and U.S. Government securities) for the reporting period ended September 30, 2023, were as follows:
| | |
| | |
| Cost of Purchases | | Proceeds from Sales |
$68,104,229 | | $83,127,548 |
A summary of the cost of purchases and proceeds from sales of shares of affiliated mutual funds for the year ended September 30, 2023, is presented as follows:
| | | | | | | | | | | | | | | | | | |
Value,
Beginning
of Year | | Cost of
Purchases | | Proceeds from Sales | | Change in
Unrealized
Gain
(Loss) | | Realized
Gain
(Loss) | | | Value,
End of Year | | Shares,
End of Year | | Income | |
|
Short-Term Investments - Affiliated Mutual Funds: | |
|
PGIM Core Government Money Market Fund(1)(wb) | |
| $— | | $ 19,700,024 | | $ 18,665,674 | | $— | | $ | — | | | $1,034,350 | | 1,034,350 | | $ | 107,727 | |
|
PGIM Institutional Money Market Fund(1)(b)(wb) | |
| — | | 87,210,384 | | 84,079,659 | | — | | | (4,978 | ) | | 3,125,747 | | 3,127,623 | | | 2,062 | (2) |
| $— | | $106,910,408 | | $102,745,333 | | $— | | $ | (4,978 | ) | | $4,160,097 | | | | $ | 109,789 | |
| (1) | The Fund did not have any capital gain distributions during the reporting period. |
| (2) | The amount, or a portion thereof, represents the affiliated securities lending income shown on the Statement of Operations. |
| (b) | Represents security, or portion thereof, purchased with cash collateral received for securities on loan and includes dividend reinvestment. |
| (wb) | Represents an investment in a Fund affiliated with the Manager. |
| 6. | Distributions and Tax Information |
Distributions to shareholders, which are determined in accordance with federal income tax regulations and which may differ from GAAP, are recorded on the ex-date.
36
For the year ended September 30, 2023, the tax character of dividends paid as reflected in the Statement of Changes in Net Assets were as follows:
| | | | | | |
Ordinary Income | | Long-Term Capital Gains | | Tax Return of Capital | | Total Dividends and Distributions |
$1,857,054 | | $4,168,667 | | $— | | $6,025,721 |
For the year ended September 30, 2022, the tax character of dividends paid as reflected in the Statement of Changes in Net Assets were as follows:
| | | | | | |
Ordinary Income | | Long-Term Capital Gains | | Tax Return of Capital | | Total Dividends and Distributions |
$1,183,462 | | $8,754,769 | | $— | | $9,938,231 |
For the year ended September 30, 2023, the Fund had the following amounts of accumulated undistributed earnings on a tax basis:
| | |
Undistributed Ordinary Income | | Undistributed Long-Term Capital Gains |
$1,888,278 | | $13,594,547 |
The United States federal income tax basis of the Fund’s investments and the net unrealized appreciation as of September 30, 2023 were as follows:
| | | | | | |
Tax Basis | | Gross Unrealized Appreciation | | Gross Unrealized Depreciation | | Net Unrealized Appreciation |
$146,183,388 | | $46,978,470 | | $(7,923,525) | | $39,054,945 |
The differences between GAAP and tax basis were primarily attributable to deferred losses on wash sales.
The Manager has analyzed the Fund’s tax positions taken on federal, state and local income tax returns for all open tax years and has concluded that no provision for income tax is required in the Fund’s financial statements for the current reporting period. Since tax authorities can examine previously filed tax returns, the Fund’s U.S. federal and state tax returns for each of the four fiscal years up to the most recent fiscal year ended September 30, 2023 are subject to such review.
The Fund offers Class A, Class C, Class R, Class Z and Class R6 shares. Class A shares are sold with a maximum front-end sales charge of 5.50%. Investors who purchase $1 million or more of Class A shares and sell these shares within 12 months of purchase are subject to a CDSC of 1%, although they are not subject to an initial sales charge. The Class A CDSC is waived for certain retirement and/or benefit plans. A special exchange privilege is also available for shareholders who qualified to purchase Class A shares at net asset value. Class C shares are sold with a CDSC of 1% on sales made within 12 months of
PGIM Jennison Focused Value Fund 37
Notes to Financial Statements (continued)
purchase. Class C shares will automatically convert to Class A shares on a monthly basis approximately eight years (ten years prior to January 22, 2021) after purchase. Class R, Class Z and Class R6 shares are not subject to any sales or redemption charges and are available exclusively for sale to a limited group of investors.
Under certain circumstances, an exchange may be made from specified share classes of the Fund to one or more other share classes of the Fund as presented in the table of transactions in shares of common stock, below.
The RIC is authorized to issue 6,625,000,000 shares of capital stock, $0.001 par value per share, 1,022,000,000 of which are designated as shares of the Fund. The authorized shares of the Fund are currently classified and designated as follows:
| | | | | |
| | |
| Class | | Number of Shares |
A | | | | 100,000,000 | |
B | | | | 2,000,000 | |
C | | | | 25,000,000 | |
R | | | | 200,000,000 | |
Z | | | | 325,000,000 | |
T | | | | 50,000,000 | |
R6 | | | | 320,000,000 | |
The Fund currently does not have any Class B or Class T shares outstanding.
At the reporting period end, the number of shareholders holding greater than 5% of the Fund are as follows:
| | | | |
| | | |
| | | Number of Shareholders | | Percentage of Outstanding Shares |
Affiliated | | — | | —% |
Unaffiliated | | 3 | | 50.5 |
38
Transactions in shares of common stock were as follows:
| | | | | | | | | | | | |
| | | | |
| Share Class | | Shares | | | | | | Amount | |
| | | |
Class A | | | | | | | | | | | | |
Year ended September 30, 2023: | | | | | | | | | | | | |
Shares sold | | | 320,900 | | | | | | | $ | 5,428,077 | |
Shares issued in reinvestment of dividends and distributions | | | 292,848 | | | | | | | | 4,823,213 | |
Shares purchased | | | (1,162,627 | ) | | | | | | | (19,633,179 | ) |
Net increase (decrease) in shares outstanding before conversion | | | (548,879 | ) | | | | | | | (9,381,889 | ) |
Shares issued upon conversion from other share class(es) | | | 46,038 | | | | | | | | 778,770 | |
Shares purchased upon conversion into other share class(es) | | | (58,694 | ) | | | | | | | (994,868 | ) |
Net increase (decrease) in shares outstanding | | | (561,535 | ) | | | | | | $ | (9,597,987 | ) |
| | | |
Year ended September 30, 2022: | | | | | | | | | | | | |
Shares sold | | | 391,978 | | | | | | | $ | 7,051,901 | |
Shares issued in reinvestment of dividends and distributions | | | 426,329 | | | | | | | | 8,019,259 | |
Shares purchased | | | (1,373,535 | ) | | | | | | | (24,227,920 | ) |
Net increase (decrease) in shares outstanding before conversion | | | (555,228 | ) | | | | | | | (9,156,760 | ) |
Shares issued upon conversion from other share class(es) | | | 62,586 | | | | | | | | 1,115,823 | |
Shares purchased upon conversion into other share class(es) | | | (58,295 | ) | | | | | | | (1,018,885 | ) |
Net increase (decrease) in shares outstanding | | | (550,937 | ) | | | | | | $ | (9,059,822 | ) |
| | | |
Class C | | | | | | | | | | | | |
Year ended September 30, 2023: | | | | | | | | | | | | |
Shares sold | | | 40,938 | | | | | | | $ | 506,063 | |
Shares issued in reinvestment of dividends and distributions | | | 10,731 | | | | | | | | 129,521 | |
Shares purchased | | | (51,541 | ) | | | | | | | (632,332 | ) |
Net increase (decrease) in shares outstanding before conversion | | | 128 | | | | | | | | 3,252 | |
Shares purchased upon conversion into other share class(es) | | | (62,899 | ) | | | | | | | (777,869 | ) |
Net increase (decrease) in shares outstanding | | | (62,771 | ) | | | | | | $ | (774,617 | ) |
| | | |
Year ended September 30, 2022: | | | | | | | | | | | | |
Shares sold | | | 66,895 | | | | | | | $ | 870,331 | |
Shares issued in reinvestment of dividends and distributions | | | 19,378 | | | | | | | | 270,521 | |
Shares purchased | | | (68,741 | ) | | | | | | | (883,603 | ) |
Net increase (decrease) in shares outstanding before conversion | | | 17,532 | | | | | | | | 257,249 | |
Shares purchased upon conversion into other share class(es) | | | (92,121 | ) | | | | | | | (1,221,981 | ) |
Net increase (decrease) in shares outstanding | | | (74,589 | ) | | | | | | $ | (964,732 | ) |
| | | |
Class R | | | | | | | | | | | | |
Year ended September 30, 2023: | | | | | | | | | | | | |
Shares sold | | | 3,341 | | | | | | | $ | 46,264 | |
Shares issued in reinvestment of dividends and distributions | | | 1,244 | | | | | | | | 16,840 | |
Shares purchased | | | (22,683 | ) | | | | | | | (310,005 | ) |
Net increase (decrease) in shares outstanding | | | (18,098 | ) | | | | | | $ | (246,901 | ) |
PGIM Jennison Focused Value Fund 39
Notes to Financial Statements (continued)
| | | | | | | | | | | | |
| | | | |
| Share Class | | Shares | | | | | | Amount | |
| | | |
Year ended September 30, 2022: | | | | | | | | | | | | |
Shares sold | | | 3,952 | | | | | | | $ | 58,030 | |
Shares issued in reinvestment of dividends and distributions | | | 1,648 | | | | | | | | 25,692 | |
Shares purchased | | | (2,981 | ) | | | | | | | (43,926 | ) |
Net increase (decrease) in shares outstanding | | | 2,619 | | | | | | | $ | 39,796 | |
| | | |
Class Z | | | | | | | | | | | | |
Year ended September 30, 2023: | | | | | | | | | | | | |
Shares sold | | | 210,124 | | | | | | | $ | 3,913,428 | |
Shares issued in reinvestment of dividends and distributions | | | 46,012 | | | | | | | | 804,292 | |
Shares purchased | | | (479,069 | ) | | | | | | | (8,514,930 | ) |
Net increase (decrease) in shares outstanding before conversion | | | (222,933 | ) | | | | | | | (3,797,210 | ) |
Shares issued upon conversion from other share class(es) | | | 54,096 | | | | | | | | 973,815 | |
Shares purchased upon conversion into other share class(es) | | | (12,498 | ) | | | | | | | (240,248 | ) |
Net increase (decrease) in shares outstanding | | | (181,335 | ) | | | | | | $ | (3,063,643 | ) |
| | | |
Year ended September 30, 2022: | | | | | | | | | | | | |
Shares sold | | | 181,044 | | | | | | | $ | 3,467,347 | |
Shares issued in reinvestment of dividends and distributions | | | 68,234 | | | | | | | | 1,359,218 | |
Shares purchased | | | (421,069 | ) | | | | | | | (7,943,418 | ) |
Net increase (decrease) in shares outstanding before conversion | | | (171,791 | ) | | | | | | | (3,116,853 | ) |
Shares issued upon conversion from other share class(es) | | | 57,529 | | | | | | | | 1,078,634 | |
Shares purchased upon conversion into other share class(es) | | | (478 | ) | | | | | | | (9,074 | ) |
Net increase (decrease) in shares outstanding | | | (114,740 | ) | | | | | | $ | (2,047,293 | ) |
| | | |
Class R6 | | | | | | | | | | | | |
Year ended September 30, 2023: | | | | | | | | | | | | |
Shares sold | | | 46,369 | | | | | | | $ | 826,313 | |
Shares issued in reinvestment of dividends and distributions | | | 9,664 | | | | | | | | 168,349 | |
Shares purchased | | | (191,372 | ) | | | | | | | (3,534,671 | ) |
Net increase (decrease) in shares outstanding before conversion | | | (135,339 | ) | | | | | | | (2,540,009 | ) |
Shares issued upon conversion from other share class(es) | | | 14,877 | | | | | | | | 283,301 | |
Shares purchased upon conversion into other share class(es) | | | (1,237 | ) | | | | | | | (22,901 | ) |
Net increase (decrease) in shares outstanding | | �� | (121,699 | ) | | | | | | $ | (2,279,609 | ) |
40
| | | | | | | | | | | | |
| | | | |
| Share Class | | Shares | | | | | | Amount | |
| | | |
Year ended September 30, 2022: | | | | | | | | | | | | |
Shares sold | | | 219,316 | | | | | | | $ | 3,870,053 | |
Shares issued in reinvestment of dividends and distributions | | | 6,512 | | | | | | | | 129,328 | |
Shares purchased | | | (72,453 | ) | | | | | | | (1,322,081 | ) |
Net increase (decrease) in shares outstanding before conversion | | | 153,375 | | | | | | | | 2,677,300 | |
Shares issued upon conversion from other share class(es) | | | 3,324 | | | | | | | | 55,483 | |
Net increase (decrease) in shares outstanding | | | 156,699 | | | | | | | $ | 2,732,783 | |
The RIC, on behalf of the Fund, along with other affiliated registered investment companies (the “Participating Funds”), is a party to a Syndicated Credit Agreement (“SCA”) with a group of banks. The purpose of the SCA is to provide an alternative source of temporary funding for capital share redemptions. The table below provides details of the current SCA in effect at the reporting period-end as well as the prior SCA.
| | | | | | |
| | | | |
| | | Current SCA | | | | Prior SCA |
Term of Commitment | | 9/29/2023 - 9/26/2024 | | | | 9/30/2022 – 9/28/2023 |
Total Commitment | | $ 1,200,000,000 | | | | $ 1,200,000,000 |
Annualized Commitment Fee on the Unused Portion of the SCA | | 0.15% | | | | 0.15% |
Annualized Interest Rate on Borrowings | | 1.00% plus the higher of (1) the effective federal funds rate, (2) the daily SOFR rate plus 0.10% or (3) zero percent | | | | 1.00% plus the higher of (1) the effective federal funds rate, (2) the daily SOFR rate plus 0.10% or (3) zero percent |
Certain affiliated registered investment companies that are parties to the SCA include portfolios that are subject to a predetermined mathematical formula used to manage certain benefit guarantees offered under variable annuity contracts. The formula may result in large scale asset flows into and out of these portfolios. Consequently, these portfolios may be more likely to utilize the SCA for purposes of funding redemptions. It may be possible for those portfolios to fully exhaust the committed amount of the SCA, thereby requiring the Manager to allocate available funding per a Board-approved methodology designed to treat the Participating Funds in the SCA equitably.
The Fund utilized the SCA during the year ended September 30, 2023. The average daily balance for the 1 day that the Fund had loans outstanding during the period was approximately $212,000, borrowed at a weighted average interest rate of 5.41%. The maximum loan outstanding amount during the period was $212,000. At September 30, 2023, the Fund did not have an outstanding loan amount.
PGIM Jennison Focused Value Fund 41
Notes to Financial Statements (continued)
| 9. | Risks of Investing in the Fund |
The Fund’s risks include, but are not limited to, some or all of the risks discussed below. For further information on the Fund’s risks, please refer to the Fund’s Prospectus and Statement of Additional Information.
Economic and Market Events Risk: Events in the U.S. and global financial markets, including actions taken by the U.S. Federal Reserve or foreign central banks to stimulate or stabilize economic growth or the functioning of the securities markets, or otherwise reduce inflation, may at times result in unusually high market volatility, which could negatively impact performance. Governmental efforts to curb inflation often have negative effects on the level of economic activity. Relatively reduced liquidity in credit and fixed income markets could adversely affect issuers worldwide.
Equity and Equity-Related Securities Risk: Equity and equity-related securities may be subject to changes in value, and their values may be more volatile than those of other asset classes. In addition to an individual security losing value, the value of the equity markets or a sector in which the Fund invests could go down. Different parts of a market can react differently to adverse issuer, market, regulatory, political and economic developments.
Foreign Securities Risk: Investments in securities of non-U.S. issuers (including those denominated in U.S. dollars) may involve more risk than investing in securities of U.S. issuers. Foreign political, economic and legal systems, especially those in developing and emerging market countries, may be less stable and more volatile than in the United States. Foreign legal systems generally have fewer regulatory requirements than the U.S. legal system, particularly those of emerging markets. In general, less information is publicly available with respect to non-U.S. companies than U.S. companies. Non-U.S. companies generally are not subject to the same accounting, auditing, and financial reporting standards as are U.S. companies. Additionally, the changing value of foreign currencies and changes in exchange rates could also affect the value of the assets the Fund holds and the Fund’s performance. Certain foreign countries may impose restrictions on the ability of issuers of foreign securities to make payment of principal and interest or dividends to investors located outside the country, due to blockage of foreign currency exchanges or otherwise. Investments in emerging markets are subject to greater volatility and price declines.
In addition, the Fund’s investments in non-U.S. securities may be subject to the risks of nationalization or expropriation of assets, imposition of currency exchange controls or restrictions on the repatriation of non-U.S. currency, confiscatory taxation and adverse diplomatic developments. Special U.S. tax considerations may apply.
Increase in Expenses Risk: Your actual cost of investing in the Fund may be higher than the expenses shown in the expense table of the Fund’s prospectus for a variety of reasons. For
42
example, expense ratios may be higher than those shown if average net assets decrease. Net assets are more likely to decrease and Fund expense ratios are more likely to increase when markets are volatile. Active and frequent trading of Fund securities can increase expenses.
Large Capitalization Company Risk: Companies with large market capitalizations go in and out of favor based on market and economic conditions. Larger companies tend to be less volatile than companies with smaller market capitalizations. In exchange for this potentially lower risk, the Fund’s value may not rise or fall as much as the value of funds that emphasize companies with smaller market capitalizations.
Large Shareholder and Large Scale Redemption Risk: Certain individuals, accounts, funds (including funds affiliated with the Manager) or institutions, including the Manager and its affiliates, may from time to time own or control a substantial amount of the Fund’s shares. There is no requirement that these entities maintain their investment in the Fund. There is a risk that such large shareholders or that the Fund’s shareholders generally may redeem all or a substantial portion of their investments in the Fund in a short period of time, which could have a significant negative impact on the Fund’s NAV, liquidity, and brokerage costs. Large redemptions could also result in tax consequences to shareholders and impact the Fund’s ability to implement its investment strategy. The Fund’s ability to pursue its investment objective after one or more large scale redemptions may be impaired and, as a result, the Fund may invest a larger portion of its assets in cash or cash equivalents.
Management Risk: Actively managed funds are subject to management risk. The subadviser will apply investment techniques and risk analyses in making investment decisions for the Fund, but the subadviser’s judgments about the attractiveness, value or market trends affecting a particular security, industry or sector or about market movements may be incorrect. Additionally, the investments selected for the Fund may underperform the markets in general, the Fund’s benchmark and other funds with similar investment objectives.
Market Disruption and Geopolitical Risks: Market disruption can be caused by economic, financial or political events and factors, including but not limited to, international wars or conflicts (including Russia’s military invasion of Ukraine), geopolitical developments (including trading and tariff arrangements, sanctions and cybersecurity attacks), instability in regions such as Asia, Eastern Europe and the Middle East, terrorism, natural disasters and public health epidemics (including the outbreak of COVID-19 globally).
The extent and duration of such events and resulting market disruptions cannot be predicted, but could be substantial and could magnify the impact of other risks to the Fund. These and other similar events could adversely affect the U.S. and foreign financial markets and lead to increased market volatility, reduced liquidity in the securities markets, significant negative impacts on issuers and the markets for certain securities and commodities and/or government intervention. They may also cause short- or long-term economic uncertainties in the United States and worldwide. As a result, whether or not the Fund invests in securities of
PGIM Jennison Focused Value Fund 43
Notes to Financial Statements (continued)
issuers located in or with significant exposure to the countries directly affected, the value and liquidity of the Fund’s investments may be negatively impacted. Further, due to closures of certain markets and restrictions on trading certain securities, the value of certain securities held by the Fund could be significantly impacted, which could lead to such securities being valued at zero.
Market Risk: Securities markets may be volatile and the market prices of the Fund’s securities may decline. Securities fluctuate in price based on changes in an issuer’s financial condition and overall market and economic conditions. If the market prices of the securities owned by the Fund fall, the value of your investment in the Fund will decline.
Value Style Risk: Since the Fund follows a value investment style, there is the risk that the value style may be out of favor for long periods of time, that the market will not recognize a security’s intrinsic value for a long time or at all, or that a stock judged to be undervalued may actually be appropriately priced or overvalued. Issuers of value stocks may have experienced adverse business developments or may be subject to special risks that have caused the stock to be out of favor. In addition, the Fund’s value investment style may go out of favor with investors, negatively affecting the Fund’s performance. If the Fund’s assessment of market conditions or a company’s value is inaccurate, the Fund could suffer losses or produce poor performance relative to other funds.
| 10. | Recent Regulatory Developments |
Effective January 24, 2023, the SEC adopted rule and form amendments to require mutual funds and ETFs to transmit concise and visually engaging streamlined annual and semiannual reports to shareholders that highlight key information deemed important for retail investors to assess and monitor their fund investments (the “Rule”). Other information, including financial statements, will no longer appear in the funds’ streamlined shareholder reports but must be available online, delivered free of charge upon request, and filed on a semiannual basis on Form N-CSR. The Rule and form amendments have a compliance date of July 24, 2024. At this time, management is evaluating the Rule and its impact to the Fund.
44
Report of Independent Registered Public Accounting Firm
To the Board of Directors of The Prudential Investment Portfolios, Inc. and Shareholders of PGIM Jennison Focused Value Fund
Opinion on the Financial Statements
We have audited the accompanying statement of assets and liabilities, including the schedule of investments, of PGIM Jennison Focused Value Fund (one of the funds constituting The Prudential Investment Portfolios, Inc., referred to hereafter as the “Fund”) as of September 30, 2023, the related statement of operations for the year ended September 30, 2023, the statements of changes in net assets for each of the two years in the period ended September 30, 2023, including the related notes, and the financial highlights for each of the four years in the period ended September 30, 2023 (collectively referred to as the “financial statements”). In our opinion, the financial statements present fairly, in all material respects, the financial position of the Fund as of September 30, 2023, the results of its operations for the year then ended, the changes in its net assets for each of the two years in the period ended September 30, 2023 and the financial highlights for each of the four years in the period ended September 30, 2023 in conformity with accounting principles generally accepted in the United States of America.
The financial statements of the Fund as of and for the year ended September 30, 2019 and the financial highlights for each of the periods ended on or prior to September 30, 2019 (not presented herein, other than the financial highlights) were audited by other auditors whose report dated November 15, 2019 expressed an unqualified opinion on those financial statements and financial highlights.
Basis for Opinion
These financial statements are the responsibility of the Fund’s management. Our responsibility is to express an opinion on the Fund’s financial statements based on our audits. We are a public accounting firm registered with the Public Company Accounting Oversight Board (United States) (PCAOB) and are required to be independent with respect to the Fund in accordance with the U.S. federal securities laws and the applicable rules and regulations of the Securities and Exchange Commission and the PCAOB.
We conducted our audits of these financial statements in accordance with the standards of the PCAOB. Those standards require that we plan and perform the audit to obtain reasonable assurance about whether the financial statements are free of material misstatement, whether due to error or fraud.
Our audits included performing procedures to assess the risks of material misstatement of the financial statements, whether due to error or fraud, and performing procedures that respond to those risks. Such procedures included examining, on a test basis, evidence regarding the amounts and disclosures in the financial statements. Our audits also included evaluating the accounting principles used and significant estimates made by management, as well as evaluating the overall presentation of the financial statements. Our procedures included confirmation of securities owned as of September 30, 2023 by correspondence with the custodian, transfer agent and broker. We believe that our audits provide a reasonable basis for our opinion.
/s/PricewaterhouseCoopers LLP
New York, New York
November 16, 2023
We have served as the auditor of one or more investment companies in the PGIM Retail Funds complex since 2020.
PGIM Jennison Focused Value Fund 45
Tax Information (unaudited)
We are advising you that during the year ended September 30, 2023, the Fund reports the maximum amount allowed per share, but not less than $0.38 for Class A, C, R, Z and R6 shares as a capital gain distribution in accordance with Section 852(b)(3)(C) of the Internal Revenue Code.
For the year ended September 30, 2023, the Fund reports in the maximum amount allowable under Section 854 of the Internal Revenue Code, but not less than, the following percentages of the ordinary income distributions paid as 1) qualified dividend income (QDI), and 2) eligible for corporate dividends received deduction (DRD):
| | | | | | |
| | | | |
| Fund | | QDI | | | | DRD |
| | | |
PGIM Jennison Focused Value Fund | | 100.00% | | | | 100.00% |
In January 2024, you will be advised on IRS Form 1099-DIV or substitute 1099-DIV, as to the federal tax status of distributions received by you in calendar year 2023.
46
INFORMATION ABOUT BOARD MEMBERS AND OFFICERS (unaudited)
Information about Board Members and Officers of the Fund is set forth below. Board Members who are not deemed to be “interested persons” of the Fund, as defined in the 1940 Act, are referred to as “Independent Board Members.” Board Members who are deemed to be “interested persons” of the Fund are referred to as “Interested Board Members.” The Board Members are responsible for the overall supervision of the operations of the Fund and perform the various duties imposed on the directors of investment companies by the 1940 Act. The Board in turn elects the Officers, who are responsible for administering the day-to-day operations of the Fund.
| | | | | | |
| |
| Independent Board Members |
| | | | |
Name Year of Birth Position(s) Portfolios Overseen | | Principal Occupation(s) During Past Five Years | | Other Directorships Held During Past Five Years | | Length of Board Service |
| | | | |
Ellen S. Alberding 1958 Board Member Portfolios Overseen: 97 | | Chief Executive Officer (“CEO”) and President, The Joyce Foundation (charitable foundation) (since 2002); formerly Vice Chair, City Colleges of Chicago (community college system) (2011-2015); formerly Trustee, National Park Foundation (charitable foundation for national park system) (2009-2018); formerly Trustee, Economic Club of Chicago (2009-2016); Trustee, Loyola University (since 2018). | | None. | | Since September 2013 |
| | | | |
Kevin J. Bannon 1952 Board Member Portfolios Overseen: 98 | | Retired; formerly Managing Director (April 2008-May 2015) and Chief Investment Officer (October 2008-November 2013) of Highmount Capital LLC (registered investment adviser); formerly Executive Vice President and Chief Investment Officer (April 1993-August 2007) of Bank of New York Company; formerly President (May 2003-May 2007) of BNY Hamilton Family of Mutual Funds. | | Director of Urstadt Biddle Properties (equity real estate investment trust) (since September 2008). | | Since July 2008 |
PGIM Jennison Focused Value Fund
| | | | | | |
| |
| Independent Board Members |
| | | | |
Name Year of Birth Position(s) Portfolios Overseen | | Principal Occupation(s) During Past Five Years | | Other Directorships Held During Past Five Years | | Length of Board Service |
| | | | |
Linda W. Bynoe 1952 Board Member Portfolios Overseen: 95 | | President and Chief Executive Officer (since March 1995) and formerly Chief Operating Officer (December 1989-February 1995) of Telemat Limited LLC (formerly Telemat Ltd) (management consulting); formerly Vice President (January 1985-June 1989) at Morgan Stanley & Co. (broker-dealer). | | Trustee of Equity Residential (residential real estate) (since December 2009); Director of Northern Trust Corporation (financial services) (since April 2006); formerly Director of Anixter International, Inc. (communication products distributor) (January 2006-June 2020). | | Since March 2005 |
| | | | |
Barry H. Evans 1960 Board Member Portfolios Overseen: 98 | | Retired; formerly President (2005-2016), Global Chief Operating Officer (2014-2016), Chief Investment Officer - Global Head of Fixed Income (1998-2014), and various portfolio manager roles (1986-2006), Manulife Asset Management (asset management). | | Formerly Director, Manulife Trust Company (2011-2018); formerly Director, Manulife Asset Management Limited (2015-2017); formerly Chairman of the Board of Directors of Manulife Asset Management U.S. (2005-2016); formerly Chairman of the Board, Declaration Investment Management and Research (2008-2016). | | Since September 2017 |
| | | | |
Keith F. Hartstein 1956 Board Member & Independent Chair Portfolios Overseen: 98 | | Retired; formerly Member (November 2014-September 2022) of the Governing Council of the Independent Directors Council (IDC) (organization of independent mutual fund directors); formerly Executive Committee of the IDC Board of Governors (October 2019-December 2021); formerly President and Chief Executive Officer (2005-2012), Senior Vice President (2004-2005), Senior Vice President of Sales and Marketing (1997-2004), and various executive management positions (1990-1997), John Hancock Funds, LLC (asset management); formerly Chairman, Investment Company Institute’s Sales Force Marketing Committee (2003-2008). | | None. | | Since September 2013 |
Visit our website at pgim.com/investments
| | | | | | |
| |
| Independent Board Members |
| | | | |
Name Year of Birth Position(s) Portfolios Overseen | | Principal Occupation(s) During Past Five Years | | Other Directorships Held During Past Five Years | | Length of Board Service |
| | | | |
Laurie Simon Hodrick 1962 Board Member Portfolios Overseen: 95 | | A. Barton Hepburn Professor Emerita of Economics in the Faculty of Business, Columbia Business School (since 2018); Visiting Fellow at the Hoover Institution, Stanford University (since 2015); Sole Member, ReidCourt LLC (since 2008) (a consulting firm); formerly Visiting Professor of Law, Stanford Law School (2015-2021); formerly A. Barton Hepburn Professor of Economics in the Faculty of Business, Columbia Business School (1996-2017); formerly Managing Director, Global Head of Alternative Investment Strategies, Deutsche Bank (2006-2008). | | Independent Director, Andela (since January 2022) (global talent network); Independent Director, Roku (since December 2020) (communication services); formerly Independent Director, Synnex Corporation (2019-2021) (information technology); formerly Independent Director, Kabbage, Inc. (2018-2020) (financial services); formerly Independent Director, Corporate Capital Trust (2017-2018) (a business development company). | | Since September 2017 |
| | | | |
Brian K. Reid 1961 Board Member Portfolios Overseen: 98 | | Retired; formerly Chief Economist for the Investment Company Institute (ICI) (2005-2017); formerly Senior Economist and Director of Industry and Financial Analysis at the ICI (1998-2004); formerly Senior Economist, Industry and Financial Analysis at the ICI (1996-1998); formerly Staff Economist at the Federal Reserve Board (1989-1996); formerly Director, ICI Mutual Insurance Company (2012-2017). | | None. | | Since March 2018 |
PGIM Jennison Focused Value Fund
| | | | | | |
| |
| Independent Board Members |
| | | | |
Name Year of Birth Position(s) Portfolios Overseen | | Principal Occupation(s) During Past Five Years | | Other Directorships Held During Past Five Years | | Length of Board Service |
| | | | |
Grace C. Torres 1959 Board Member Portfolios Overseen: 98 | | Retired; formerly Treasurer and Principal Financial and Accounting Officer of the PGIM Funds, Target Funds, Advanced Series Trust, Prudential Variable Contract Accounts and The Prudential Series Fund (1998-June 2014); Assistant Treasurer (March 1999-June 2014) and Senior Vice President (September 1999-June 2014) of PGIM Investments LLC; Assistant Treasurer (May 2003-June 2014) and Vice President (June 2005-June 2014) of AST Investment Services, Inc.; Senior Vice President and Assistant Treasurer (May 2003-June 2014) of Prudential Annuities Advisory Services, Inc. | | Director (since January 2018) of OceanFirst Financial Corp. and OceanFirst Bank; formerly Director (July 2015-January 2018) of Sun Bancorp, Inc. N.A. and Sun National Bank. | | Since November 2014 |
Visit our website at pgim.com/investments
| | | | | | |
| |
| Interested Board Members |
| | | | |
Name Year of Birth Position(s) Portfolios Overseen | | Principal Occupation(s) During Past Five Years | | Other Directorships Held During Past Five Years | | Length of Board Service |
| | | | |
Stuart S. Parker 1962 Board Member & President Portfolios Overseen: 98 | | President, Chief Executive Officer, Chief Operating Officer and Officer in Charge of PGIM Investments LLC (formerly known as Prudential Investments LLC) (since January 2012); President and Principal Executive Officer (“PEO”) (since September 2022) of the PGIM Private Credit Fund; President and PEO (since March 2022) of the PGIM Private Real Estate Fund, Inc.; formerly Executive Vice President of Jennison Associates LLC and Head of Retail Distribution of PGIM Investments LLC (June 2005-December 2011); Investment Company Institute - Board of Governors (since May 2012). | | None. | | Since January 2012 |
| | | | |
Scott E. Benjamin 1973 Board Member & Vice President Portfolios Overseen: 98 | | Executive Vice President (since May 2009) of PGIM Investments LLC; Vice President (since June 2012) of Prudential Investment Management Services LLC; Executive Vice President (since September 2009) of AST Investment Services, Inc.; Senior Vice President of Product Development and Marketing, PGIM Investments (since February 2006); Vice President (since September 2022) of the PGIM Private Credit Fund; Vice President (since March 2022) of the PGIM Private Real Estate Fund, Inc.; formerly Vice President of Product Development and Product Management, PGIM Investments LLC (2003-2006). | | None. | | Since March 2010 |
PGIM Jennison Focused Value Fund
| | | | |
| |
| Fund Officers(a) |
| | | |
Name Year of Birth Fund Position | | Principal Occupation(s) During Past Five Years | | Length of Service as Fund Officer |
| | | |
Claudia DiGiacomo 1974 Chief Legal Officer | | Chief Legal Officer (since September 2022) of the PGIM Private Credit Fund; Chief Legal Officer (since July 2022) of the PGIM Private Real Estate Fund, Inc.; Chief Legal Officer, Executive Vice President and Secretary of PGIM Investments LLC (since August 2020); Chief Legal Officer of Prudential Mutual Fund Services LLC (since August 2020); Chief Legal Officer of PIFM Holdco, LLC (since August 2020); Vice President and Corporate Counsel (since January 2005) of Prudential; and Corporate Counsel of AST Investment Services, Inc. (since August 2020); formerly Vice President and Assistant Secretary of PGIM Investments LLC (2005-2020); formerly Associate at Sidley Austin Brown & Wood LLP (1999-2004). | | Since December 2005 |
| | | |
Andrew Donohue 1972 Chief Compliance Officer | | Chief Compliance Officer (since May 2023) of the PGIM Funds, Target Funds, PGIM ETF Trust, PGIM Global High Yield Fund, Inc., PGIM High Yield Bond Fund, Inc., PGIM Short Duration High Yield Opportunities Fund, Advanced Series Trust, The Prudential Series Fund, Prudential’s Gibraltar Fund, Inc., PGIM Private Credit Fund, PGIM Private Real Estate Fund, Inc.; Chief Compliance Officer of AST Investment Services, Inc. (since October 2022); Vice President, Chief Compliance Officer of PGIM Investments LLC (since September 2022); formerly various senior compliance roles within Principal Global Investors, LLC., global asset management for Principal Financial (2011-2022), most recently as Global Chief Compliance Officer (2016-2022). | | Since May 2023 |
| | | |
Andrew R. French 1962 Secretary | | Vice President (since December 2018) of PGIM Investments LLC; Secretary (since September 2022) of the PGIM Private Credit Fund; Secretary (since March 2022) of the PGIM Private Real Estate Fund, Inc.; formerly Vice President and Corporate Counsel (2010-2018) of Prudential; formerly Director and Corporate Counsel (2006-2010) of Prudential; Vice President and Assistant Secretary (since January 2007) of PGIM Investments LLC; Vice President and Assistant Secretary (since January 2007) of Prudential Mutual Fund Services LLC. | | Since October 2006 |
| | | |
Melissa Gonzalez 1980 Assistant Secretary | | Vice President and Corporate Counsel (since September 2018) of Prudential; Vice President and Assistant Secretary (since August 2020) of PGIM Investments LLC; Assistant Secretary (since September 2022) of the PGIM Private Credit Fund; Assistant Secretary (since March 2022) of the PGIM Private Real Estate Fund, Inc.; formerly Director and Corporate Counsel (March 2014-September 2018) of Prudential. | | Since March 2020 |
Visit our website at pgim.com/investments
| | | | |
| |
| Fund Officers(a) |
| | | |
Name Year of Birth Fund Position | | Principal Occupation(s) During Past Five Years | | Length of Service as Fund Officer |
| | | |
Patrick E. McGuinness 1986 Assistant Secretary | | Vice President and Assistant Secretary (since August 2020) of PGIM Investments LLC; Director and Corporate Counsel (since February 2017) of Prudential; Assistant Secretary (since September 2022) of the PGIM Private Credit Fund; Assistant Secretary (since March 2022) of the PGIM Private Real Estate Fund, Inc. | | Since June 2020 |
| | | |
Debra Rubano 1975 Assistant Secretary | | Vice President and Corporate Counsel (since November 2020) of Prudential; Assistant Secretary (since September 2022) of the PGIM Private Credit Fund; Assistant Secretary (since March 2022) of the PGIM Private Real Estate Fund, Inc; formerly Director and Senior Counsel of Allianz Global Investors U.S. Holdings LLC (2010-2020) and Assistant Secretary of numerous funds in the Allianz fund complex (2015-2020). | | Since December 2020 |
| | | |
Kelly A. Coyne 1968 Assistant Secretary | | Director, Investment Operations of Prudential Mutual Fund Services LLC (since 2010); Assistant Secretary (since September 2022) of the PGIM Private Credit Fund; Assistant Secretary (since March 2022) of the PGIM Private Real Estate Fund, Inc. | | Since March 2015 |
| | | |
Christian J. Kelly 1975 Chief Financial Officer | | Vice President, Global Head of Fund Administration of PGIM Investments LLC (since November 2018); Chief Financial Officer (since March 2023) of PGIM Investments mutual funds, closed end funds and ETFs, Advanced Series Trust Portfolios, Prudential Series Funds and Prudential Gibraltar Fund; Chief Financial Officer of PGIM Private Credit Fund (since September 2022); Chief Financial Officer of PGIM Private Real Estate Fund, Inc. (since July 2022); formerly Treasurer and Principal Financial Officer (January 2019- March 2023) of PGIM Investments mutual funds, closed end funds and ETFs, Advanced Series Trust Portfolios, Prudential Series Funds and Prudential Gibraltar Fund; formerly Treasurer and Principal Financial Officer (March 2022 – July 2022) of the PGIM Private Real Estate Fund, Inc.; formerly Director of Fund Administration of Lord Abbett & Co. LLC (2009-2018), Treasurer and Principal Accounting Officer of the Lord Abbett Family of Funds (2017-2018); Director of Accounting, Avenue Capital Group (2008-2009); Senior Manager, Investment Management Practice of Deloitte & Touche LLP (1998-2007). | | Since January 2019 |
PGIM Jennison Focused Value Fund
| | | | |
| |
| Fund Officers(a) |
| | | |
Name Year of Birth Fund Position | | Principal Occupation(s) During Past Five Years | | Length of Service as Fund Officer |
| | | |
Russ Shupak 1973 Treasurer and Principal Accounting Officer | | Vice President (since 2017) within PGIM Investments Fund Administration; Treasurer and Principal Accounting Officer of PGIM Investments mutual funds, closed end funds and ETFs (since March 2023); Treasurer and Principal Accounting Officer (since July 2022) of the PGIM Private Real Estate Fund, Inc.; Assistant Treasurer (since September 2022) of the PGIM Private Credit Fund; formerly Assistant Treasurer (March 2022 – July 2022) of the PGIM Private Real Estate Fund, Inc.; Assistant Treasurer of Advanced Series Trust Portfolios, Prudential Series Funds and Prudential Gibraltar Fund (since October 2019); formerly Director (2013-2017) within PGIM Investments Fund Administration. | | Since October 2019 |
| | | |
Lana Lomuti 1967 Assistant Treasurer | | Vice President (since 2007) within PGIM Investments Fund Administration; formerly Assistant Treasurer (December 2007-February 2014) of The Greater China Fund, Inc.; formerly Director (2005-2007) within PGIM Investments Fund Administration. | | Since April 2014 |
| | | |
Deborah Conway 1969 Assistant Treasurer | | Vice President (since 2017) within PGIM Investments Fund Administration; Assistant Treasurer (since September 2022) of the PGIM Private Credit Fund; Assistant Treasurer (since March 2022) of the PGIM Private Real Estate Fund, Inc.; formerly Director (2007-2017) within PGIM Investments Fund Administration. | | Since October 2019 |
| | | |
Elyse M. McLaughlin 1974 Assistant Treasurer | | Vice President (since 2017) within PGIM Investments Fund Administration; Treasurer and Principal Accounting Officer of the Advanced Series Trust, the Prudential Series Fund and the Prudential Gibraltar Fund (since March 2023); Treasurer and Principal Accounting Officer (since September 2022) of the PGIM Private Credit Fund; Assistant Treasurer (since March 2022) of the PGIM Private Real Estate Fund, Inc.; Assistant Treasurer of PGIM Investments mutual funds, closed end funds and ETFs (since October 2019); formerly Director (2011-2017) within PGIM Investments Fund Administration. | | Since October 2019 |
| | | |
Robert W. McCormack 1973 Assistant Treasurer | | Vice President (since 2019) within PGIM Investments Fund Administration; Assistant Treasurer (since March 2023) of PGIM Investments mutual funds, closed end funds, ETFs, Advanced Series Trust Portfolios, Prudential Series Funds and Prudential Gibraltar Fund; Assistant Treasurer (since September 2022) of the PGIM Private Credit Fund; Assistant Treasurer (since March 2022) of the PGIM Private Real Estate Fund, Inc.; formerly Director (2016-2019) within PGIM Investments Fund Administration; formerly Vice President within Goldman, Sachs & Co. Investment Management Controllers (2008- 2016), Assistant Treasurer of Goldman Sachs Family of Funds (2015-2016). | | Since March 2023 |
Visit our website at pgim.com/investments
| | | | |
| |
| Fund Officers(a) |
| | | |
Name Year of Birth Fund Position | | Principal Occupation(s) During Past Five Years | | Length of Service as Fund Officer |
| | | |
Kelly Florio 1978 Anti-Money Laundering Compliance Officer | | Vice President, Corporate Compliance, Global Compliance Programs and Compliance Risk Management (since December 2021) of Prudential; formerly Head of Fraud Risk Management (October 2019 to December 2021) at New York Life Insurance Company; formerly Head of Key Risk Area Operations (November 2018 to October 2019), Director of the US Anti-Money Laundering Compliance Unit (2009-2018) and Bank Loss Prevention Associate (2006 -2009) at MetLife. | | Since June 2022 |
(a) Excludes Mr. Parker and Mr. Benjamin, interested Board Members who also serve as President and Vice President, respectively.
Explanatory Notes to Tables:
| ∎ | | Board Members are deemed to be “Interested,” as defined in the 1940 Act, by reason of their affiliation with PGIM Investments LLC and/or an affiliate of PGIM Investments LLC. |
| ∎ | | Unless otherwise noted, the address of all Board Members and Officers is c/o PGIM Investments LLC, 655 Broad Street, Newark, New Jersey 07102-4410. |
| ∎ | | There is no set term of office for Board Members or Officers. The Board Members have adopted a retirement policy, which calls for the retirement of Board Members on December 31 of the year in which they reach the age of 75. |
| ∎ | | “Other Directorships Held” includes all directorships of companies required to register or file reports with the SEC under the 1934 Act (that is, “public companies”) or other investment companies registered under the 1940 Act. |
| ∎ | | “Portfolios Overseen” includes such applicable investment companies managed by PGIM Investments LLC and overseen by the Board Member. The investment companies for which PGIM Investments LLC serves as manager include the PGIM Mutual Funds, Target Funds, PGIM ETF Trust, PGIM Private Real Estate Fund, Inc., PGIM Private Credit Fund, PGIM High Yield Bond Fund, Inc., PGIM Global High Yield Fund, Inc., PGIM Short Duration High Yield Opportunities Fund, The Prudential Series Fund, Prudential’s Gibraltar Fund, Inc. and the Advanced Series Trust. |
| ∎ | | As used in the Fund Officers table “Prudential” means The Prudential Insurance Company of America. |
PGIM Jennison Focused Value Fund
Approval of Advisory Agreements (unaudited)
The Fund’s Board of Directors
The Board of Directors (the “Board”) of PGIM Jennison Focused Value Fund (the “Fund”)1 consists of ten individuals, eight of whom are not “interested persons” of the Fund, as defined in the Investment Company Act of 1940, as amended (the “1940 Act”) (the “Independent Directors”). The Board is responsible for the oversight of the Fund and its operations, and performs the various duties imposed on the directors of investment companies by the 1940 Act. The Independent Directors have retained independent legal counsel to assist them in connection with their duties. The Chair of the Board is an Independent Director. The Board has established five standing committees: the Audit Committee, the Nominating and Governance Committee, the Compliance Committee and two Investment Committees. Each committee is chaired by, and composed of, Independent Directors.
Annual Approval of the Fund’s Advisory Agreements
As required under the 1940 Act, the Board determines annually whether to renew the Fund’s management agreement with PGIM Investments LLC (“PGIM Investments”) and the Fund’s subadvisory agreement with Jennison Associates LLC (“Jennison”). In considering the renewal of the agreements, the Board, including all of the Independent Directors, met on May 25 and June 6-8, 2023 (the “Board Meeting”) and approved the renewal of the agreements through July 31, 2024, after concluding that the renewal of the agreements was in the best interests of the Fund and its shareholders.
In advance of the meetings, the Board requested and received materials relating to the agreements, and had the opportunity to ask questions and request further information in connection with its consideration. Among other things, the Board considered comparative fee information from PGIM Investments and Jennison. Also, the Board considered comparisons with other mutual funds in relevant Peer Universes and Peer Groups, as is further discussed below.
In approving the agreements, the Board, including the Independent Directors advised by independent legal counsel, considered the factors it deemed relevant, including the nature, quality and extent of services provided by PGIM Investments and the subadviser, the performance of the Fund, the profitability of PGIM Investments and its affiliates, expenses and fees, and the potential for economies of scale that may be shared with the Fund and its shareholders as the Fund’s assets grow. In their deliberations, the Directors did not identify any single factor which alone was responsible for the Board’s decision to approve the agreements with respect to the Fund. In connection with its deliberations, the Board considered information provided by PGIM Investments throughout the year at regular Board meetings, presentations from portfolio managers and other information, as well as information furnished at or in advance of the Board Meeting.
The Directors determined that the overall arrangements between the Fund and PGIM Investments, which serves as the Fund’s investment manager pursuant to a
1PGIM Jennison Focused Value Fund is a series of The Prudential Investment Portfolios, Inc.
PGIM Jennison Focused Value Fund
Approval of Advisory Agreements (continued)
management agreement, and between PGIM Investments and Jennison, which serves as the Fund’s subadviser pursuant to the terms of a subadvisory agreement with PGIM Investments, are in the best interests of the Fund and its shareholders in light of the services performed, fees charged and such other matters as the Directors considered relevant in the exercise of their business judgment.
The material factors and conclusions that formed the basis for the Directors’ reaching their determinations to approve the continuance of the agreements are separately discussed below.
Nature, Quality and Extent of Services
The Board received and considered information regarding the nature, quality and extent of services provided to the Fund by PGIM Investments and Jennison. The Board noted that Jennison is affiliated with PGIM Investments. The Board considered the services provided by PGIM Investments, including but not limited to the oversight of the subadviser for the Fund, as well as the provision of fund recordkeeping, compliance and other services to the Fund, and PGIM Investments’ role as administrator for the Fund’s liquidity risk management program. With respect to PGIM Investments’ oversight of the subadviser, the Board noted that PGIM Investments’ Strategic Investment Research Group (“SIRG”), which is a business unit of PGIM Investments, is responsible for monitoring and reporting to PGIM Investments’ senior management on the performance and operations of the subadviser. The Board also considered that PGIM Investments pays the salaries of all of the officers and interested Directors of the Fund who are part of Fund management. The Board also considered the investment subadvisory services provided by Jennison, including investment research and security selection, as well as adherence to the Fund’s investment restrictions and compliance with applicable Fund policies and procedures. The Board considered PGIM Investments’ evaluation of the subadviser, as well as PGIM Investments’ recommendation, based on its review of the subadviser, to renew the subadvisory agreement.
The Board considered the qualifications, backgrounds and responsibilities of PGIM Investments’ senior management responsible for the oversight of the Fund and Jennison, and also considered the qualifications, backgrounds and responsibilities of the Jennison portfolio managers who are responsible for the day-to-day management of the Fund’s portfolio. The Board was provided with information pertaining to PGIM Investments’ and Jennison’s organizational structure, senior management, investment operations, and other relevant information pertaining to PGIM Investments and Jennison. The Board also noted that it received favorable compliance reports from the Fund’s Chief Compliance Officer (“CCO”) as to each of PGIM Investments and Jennison.
The Board concluded that it was satisfied with the nature, extent and quality of the investment management services provided by PGIM Investments and the subadvisory services provided to the Fund by Jennison, and that there was a reasonable basis on which to conclude that the Fund benefits from the services provided by PGIM Investments and Jennison under the management and subadvisory agreements.
Visit our website at pgim.com/investments
Costs of Services and Profits Realized by PGIM Investments
The Board was provided with information on the profitability of PGIM Investments and its affiliates in serving as the Fund’s investment manager. The Board discussed with PGIM Investments the methodology utilized in assembling the information regarding profitability and considered its reasonableness. The Board recognized that it is difficult to make comparisons of profitability from fund management contracts because comparative information is not generally publicly available and is affected by numerous factors, including the structure of the particular adviser, the types of funds it manages, its business mix, numerous assumptions regarding allocations and the adviser’s capital structure and cost of capital. However, the Board considered that the cost of services provided by PGIM Investments during the year ended December 31, 2022 exceeded the management fees received by PGIM Investments, resulting in an operating loss to PGIM Investments. Taking these factors into account, the Board concluded that the profitability of PGIM Investments and its affiliates in relation to the services rendered was not unreasonable.
Economies of Scale
The Board received and discussed information concerning economies of scale that PGIM Investments may realize as the Fund’s assets grow beyond current levels. The Board noted that the management fee schedule for the Fund includes breakpoints, which have the effect of decreasing the fee rate as assets increase. During the course of time, the Board has considered information regarding the launch date of the Fund, the management fees of the Fund compared to those of similarly managed funds and PGIM Investments’ investment in the Fund over time. The Board noted that economies of scale can be shared with the Fund in other ways, including low management fees from inception, additional technological and personnel investments to enhance shareholder services, and maintaining existing expense structures in the face of a rising cost environment. The Board also considered PGIM Investments’ assertion that it continually evaluates the management fee schedule of the Fund and the potential to share economies of scale through breakpoints or fee waivers as asset levels increase.
The Board recognized the inherent limitations of any analysis of economies of scale, stemming largely from the Board’s understanding that most of PGIM Investments’ costs are not specific to individual funds, but rather are incurred across a variety of products and services.
Other Benefits to PGIM Investments and Jennison
The Board considered potential ancillary benefits that might be received by PGIM Investments and Jennison and their affiliates as a result of their relationship with the Fund. The Board concluded that potential benefits to be derived by PGIM Investments included transfer agency fees received by the Fund’s transfer agent (which is affiliated with PGIM Investments), and benefits to its reputation as well as other intangible benefits resulting from PGIM Investments’ association with the Fund. The Board concluded that the potential benefits to be derived by Jennison included its ability to use
PGIM Jennison Focused Value Fund
Approval of Advisory Agreements (continued)
soft dollar credits, as well as the potential benefits consistent with those generally resulting from an increase in assets under management, specifically, potential access to additional research resources and benefits to its reputation. The Board concluded that the benefits derived by PGIM Investments and Jennison were consistent with the types of benefits generally derived by investment managers and subadvisers to mutual funds.
Performance of the Fund / Fees and Expenses
The Board considered certain additional factors and made related conclusions relating to the historical performance of the Fund for the one-, three-, five- and ten-year periods ended December 31, 2022.
The Board also considered the Fund’s actual management fee, as well as the Fund’s net total expense ratio, for the fiscal year ended September 30, 2022. The Board considered the management fee for the Fund as compared to the management fee charged by PGIM Investments to other funds and the fee charged by other advisers to comparable mutual funds in a Peer Group. The actual management fee represents the fee rate actually paid by Fund shareholders and includes any fee waivers or reimbursements. The net total expense ratio for the Fund represents the actual expense ratio incurred by Fund shareholders.
The mutual funds included in the Peer Universe, which was used to consider performance, and the Peer Group, which was used to consider fees and expenses, were objectively determined by Broadridge, an independent provider of mutual fund data. In certain circumstances, PGIM Investments also provided supplemental Peer Universe or Peer Group information, for reasons addressed with the Board. The comparisons placed the Fund in various quartiles over various periods, with the first quartile being the best 25% of the mutual funds (for performance, the best performing mutual funds and, for expenses, the lowest cost mutual funds).
The section below summarizes key factors considered by the Board and the Board’s conclusions regarding the Fund’s performance, fees and overall expenses. The table sets forth net performance comparisons (which reflect the impact on performance of fund expenses, or any subsidies, expense caps or waivers that may be applicable) with the Peer Universe, actual management fees with the Peer Group (which reflect the impact of any subsidies or fee waivers), and net total expenses with the Peer Group, each of which were key factors considered by the Board.
| | | | | | | | |
| Net Performance | | 1 Year | | 3 Years | | 5 Years | | 10 Years |
| | | 4th Quartile | | 4th Quartile | | 4th Quartile | | 4th Quartile |
| Actual Management Fees: 1st Quartile | | |
| Net Total Expenses: 2nd Quartile | | |
| · | | The Board noted that the Fund underperformed its benchmark index over all periods. |
| · | | In December 2019, the Fund’s investment approach transitioned from blend to a focused large-cap value strategy and that the Fund’s the benchmark changed from |
Visit our website at pgim.com/investments
| | the S&P 500 Index to the Russell 1000 Value Index. The Board considered the Fund’s performance history prior to December 31, 2019 does not reflect its current investment mandate. |
| · | | The Board also considered that the Fund outperformed its benchmark and peer group (ranking in the 28th percentile) for the calendar year 2021 and that it would be prudent to allow the repositioned strategy more time to develop a performance record. |
| · | | The Board and PGIM Investments agreed to a contractual expense cap, which (exclusive of certain fees and expenses) caps annual fund operating expenses at 0.75% for Class Z shares and 0.75% for Class R6 shares through January 31, 2024. |
| · | | The Board and PGIM Investments agreed to retain the Fund’s existing contractual expense cap, which (exclusive of certain fees and expenses) caps transfer agency, shareholder servicing, sub-transfer agency and blue sky fees to the extent that such fees cause annual fund operating expenses to exceed 1.53% for Class R shares through January 31, 2024. |
| · | | In addition, PGIM Investments will waive management fees or shared operating expenses on any share class to the same extent that it waives such expenses on any other share class, and has agreed that total annual fund operating expenses for Class R6 shares will not exceed total annual fund operating expenses for Class Z shares. |
| · | | The Board concluded that, in light of the above, it would be in the best interests of the Fund and its shareholders to renew the agreements. |
| · | | The Board concluded that the management fees (including subadvisory fees) and total expenses were reasonable in light of the services provided. |
* * *
After full consideration of these factors, the Board concluded that the approval of the agreements was in the best interests of the Fund and its shareholders.
PGIM Jennison Focused Value Fund
| | | | |
| | | |
⬛ MAIL 655 Broad Street Newark, NJ 07102 | | ⬛ TELEPHONE (800) 225-1852 | | ⬛ WEBSITE pgim.com/investments |
PROXY VOTING
The Board of Directors of the Fund has delegated to the Fund’s subadviser the responsibility for voting any proxies and maintaining proxy recordkeeping with respect to the Fund. A description of these proxy voting policies and procedures is available without charge, upon request, by calling (800) 225-1852 or by visiting the Securities and Exchange Commission’s website at sec.gov. Information regarding how the Fund voted proxies relating to portfolio securities during the most recent 12-month period ended June 30 is available on the Fund’s website and on the Securities and Exchange Commission’s website.
DIRECTORS
Ellen S. Alberding ● Kevin J. Bannon ● Scott E. Benjamin ● Linda W. Bynoe ● Barry H. Evans ● Keith F. Hartstein ● Laurie Simon Hodrick ● Stuart S. Parker ● Brian K. Reid ● Grace C. Torres
OFFICERS
Stuart S. Parker, President ● Scott E. Benjamin, Vice President ● Christian J. Kelly, Chief Financial Officer ● Claudia DiGiacomo, Chief Legal Officer ● Andrew Donohue, Chief Compliance Officer ● Russ Shupak, Treasurer and Principal Accounting Officer ● Kelly Florio, Anti-Money Laundering Compliance Officer ● Andrew R. French, Secretary ● Melissa Gonzalez, Assistant Secretary ● Kelly A. Coyne, Assistant Secretary ● Patrick E. McGuinness, Assistant Secretary ● Debra Rubano, Assistant Secretary ● Lana Lomuti, Assistant Treasurer ● Elyse M. McLaughlin, Assistant Treasurer ● Deborah Conway, Assistant Treasurer ● Robert W. McCormack, Assistant Treasurer
| | | | |
MANAGER | | PGIM Investments LLC | | 655 Broad Street |
| | | | | Newark, NJ 07102 |
| | |
SUBADVISER | | Jennison Associates LLC | | 466 Lexington Avenue |
| | | | | New York, NY 10017 |
| | |
DISTRIBUTOR | | Prudential Investment | | 655 Broad Street |
| | | Management Services LLC | | Newark, NJ 07102 |
| | |
CUSTODIAN | | The Bank of New York Mellon | | 240 Greenwich Street New York, NY 10286 |
| | |
TRANSFER AGENT | | Prudential Mutual Fund | | PO Box 534432 |
| | | Services LLC | | Pittsburgh, PA 15253 |
| | |
| INDEPENDENT REGISTERED PUBLIC ACCOUNTING FIRM | | PricewaterhouseCoopers LLP | | 300 Madison Avenue New York, NY 10017 |
| | | |
FUND COUNSEL | | Willkie Farr & Gallagher LLP | | 787 Seventh Avenue New York, NY 10019 |
An investor should consider the investment objectives, risks, charges, and expenses of the Fund carefully before investing. The prospectus and summary prospectus contain this and other information about the Fund. An investor may obtain the prospectus and summary prospectus by visiting our website at pgim.com/investments or by calling (800) 225-1852. The prospectus and summary prospectus should be read carefully before investing.
E-DELIVERY
To receive your mutual fund documents online, go to pgim.com/investments/resource/edelivery and enroll. Instead of receiving printed documents by mail, you will receive notification via email when new materials are available. You can cancel your enrollment or change your email address at any time by visiting the website address above.
SHAREHOLDER COMMUNICATIONS WITH DIRECTORS
Shareholders can communicate directly with the Board of Directors by writing to the Chair of the Board, PGIM Jennison Focused Value Fund, PGIM Investments, Attn: Board of Directors, 655 Broad Street, Newark, NJ 07102. Shareholders can communicate directly with an individual Director by writing to that Director at the same address. Communications are not screened before being delivered to the addressee.
AVAILABILITY OF PORTFOLIO HOLDINGS
The Fund files its complete schedule of portfolio holdings with the Securities and Exchange Commission for the first and third quarters of each fiscal year as an exhibit to its reports on Form N-PORT. The Fund’s Form N-PORT filings are available on the Commission’s website at sec.gov.
The Fund’s Statement of Additional Information contains additional information about the Fund’s Directors and is available without charge, upon request, by calling (800) 225-1852.
Mutual Funds:
| | | | |
| | | |
ARE NOT INSURED BY THE FDIC OR ANY FEDERAL GOVERNMENT AGENCY | | MAY LOSE VALUE | | ARE NOT A DEPOSIT OF OR GUARANTEED BY ANY BANK OR ANY BANK AFFILIATE |

PGIM JENNISON FOCUSED VALUE FUND
| | | | | | | | | | | | | | |
| | | | | | |
| SHARE CLASS | | | | | A | | C | | R | | Z | | R6 |
| | | | | | |
NASDAQ | | | | | | PJIAX | | PJGCX | | PJORX | | PJGZX | | PJOQX |
| | | | | | |
CUSIP | | | | | | 74437E503 | | 74437E701 | | 74437E644 | | 74437E800 | | 74437E552 |
MF172E
Item 2 – Code of Ethics — See Exhibit (a)
As of the end of the period covered by this report, the registrant has adopted a code of ethics (the “Section 406 Standards for Investment Companies – Ethical Standards for Principal Executive and Financial Officers”) that applies to the registrant’s Principal Executive Officer and Principal Financial Officer; the registrant’s Principal Financial Officer also serves as the Principal Accounting Officer.
The registrant hereby undertakes to provide any person, without charge, upon request, a copy of the code of ethics. To request a copy of the code of ethics, contact the registrant 800-225-1852, and ask for a copy of the Section 406 Standards for Investment Companies - Ethical Standards for Principal Executive and Financial Officers.
Item 3 – Audit Committee Financial Expert –
The registrant’s Board has determined that Ms. Grace C. Torres, member of the Board’s Audit Committee is an “audit committee financial expert,” and that she is “independent,” for purposes of this item.
Item 4 – Principal Accountant Fees and Services –
(a) Audit Fees
For the fiscal years ended September 30, 2023 and September 30, 2022, PricewaterhouseCoopers LLP (“PwC”), the Registrant’s principal accountant, billed the Registrant $100,700 and $95,800, respectively, for professional services rendered for the audit of the Registrant’s annual financial statements or services that are normally provided in connection with statutory and regulatory filings.
(b) Audit-Related Fees
For the fiscal years ended September 30, 2023 and September 30, 2022: none.
(c) Tax Fees
For the fiscal years ended September 30, 2023 and September 30, 2022: none.
(d) All Other Fees
For the fiscal years ended September 30, 2023 and September 30, 2022: none.
(e) (1) Audit Committee Pre-Approval Policies and Procedures
THE PGIM MUTUAL FUNDS
AUDIT COMMITTEE POLICY
on
Pre-Approval of Services Provided by the Independent
Accountants
The Audit Committee of each PGIM Mutual Fund is charged with the responsibility to monitor the independence of the Fund’s independent accountants. As part of this responsibility, the Audit Committee must pre-approve the independent accounting firm’s engagement to render audit and/or permissible non-audit services, as required by law. In evaluating a proposed engagement of the independent accountants, the Audit Committee will assess the effect that the engagement might reasonably be expected to have on the accountant’s independence. The Committee’s evaluation will be based on:
| | • | | a review of the nature of the professional services expected to be provided, |
| | • | | a review of the safeguards put into place by the accounting firm to safeguard independence, and |
| | • | | periodic meetings with the accounting firm. |
Policy for Audit and Non-Audit Services Provided to the Funds
On an annual basis, the scope of audits for each Fund, audit fees and expenses, and audit-related and non-audit services (and fees proposed in respect thereof) proposed to be performed by the Fund’s independent accountants will be presented by the Treasurer and the independent accountants to the Audit Committee for review and, as appropriate, approval prior to the initiation of such services.
Such presentation shall be accompanied by confirmation by both the Treasurer and the independent accountants that the proposed non-audit services will not adversely affect the independence of the independent accountants. Such proposed non-audit services shall be described in sufficient detail to enable the Audit Committee to assess the appropriateness of such services and fees, and the compatibility of the provision of such services with the auditor’s independence. The Committee shall receive periodic reports on the progress of the audit and other services which are approved by the Committee or by the Committee Chair pursuant to authority delegated in this Policy.
The categories of services enumerated under “Audit Services”, “Audit-related Services”, and “Tax Services” are intended to provide guidance to the Treasurer and the independent accountants as to those categories of services which the Committee believes are generally consistent with the independence of the independent accountants and which the Committee (or the Committee Chair) would expect upon the presentation of specific proposals to pre-approve. The enumerated categories are not intended as an exclusive list of audit, audit-related or tax services, which the Committee (or the Committee Chair) would consider for pre-approval.
Audit Services
The following categories of audit services are considered to be consistent with the role of the Fund’s independent accountants:
| | • | | Annual Fund financial statement audits |
| | • | | Seed audits (related to new product filings, as required) |
| | • | | SEC and regulatory filings and consents |
Audit-related Services
The following categories of audit-related services are considered to be consistent with the role of the Fund’s independent accountants:
| | • | | Accounting consultations |
| | • | | Fund merger support services |
| | • | | Agreed Upon Procedure Reports |
| | • | | Other Internal Control Reports |
Individual audit-related services that fall within one of these categories (except for fund merger support services) and are not presented to the Audit Committee as part of the annual pre-approval process are subject to an authorized pre-approval by the Audit Committee so long as the estimated fee for those services does not exceed $30,000. Any services provided under such pre-approval will be reported to the Audit Committee at its next regular meeting. Should the amount of such services exceed $30,000 any additional fees will be subject to pre-approval by the Committee Chair (or any other Committee member on whom this responsibility has been delegated). Fees related to fund merger support services are subject to a separate authorized pre-approval by the Audit Committee with fees determined on a per occurrence and merger complexity basis.
Tax Services
The following categories of tax services are considered to be consistent with the role of the Fund’s independent accountants:
| | • | | Tax compliance services related to the filing or amendment of the following: |
| | • | | Federal, state and local income tax compliance; and, |
| | • | | Sales and use tax compliance |
| | • | | Timely RIC qualification reviews |
| | • | | Tax distribution analysis and planning |
| | • | | Tax authority examination services |
| | • | | Tax appeals support services |
| | • | | Accounting methods studies |
| | • | | Fund merger support services |
| | • | | Tax consulting services and related projects |
Individual tax services that fall within one of these categories and are not presented to the Audit Committee as part of the annual pre-approval process are subject to an authorized pre-approval by the Audit Committee so long as the estimated fee for those services does not exceed $30,000. Any services provided under such pre-approval will be reported to the Audit Committee at its next regular meeting. Should the amount of such services exceed $30,000 any additional fees will be subject to pre-approval by the Committee Chair (or any other Committee member on whom this responsibility has been delegated).
Other Non-Audit Services
Certain non-audit services that the independent accountants are legally permitted to render will be subject to pre-approval by the Committee or by one or more Committee members to whom the Committee has delegated this authority and who will report to the full Committee any pre-approval decisions made pursuant to this Policy. Non-audit services presented for pre-approval pursuant to this paragraph will be accompanied by a confirmation from both the Treasurer and the independent accountants that the proposed services will not adversely affect the independence of the independent accountants.
Proscribed Services
The Fund’s independent accountants will not render services in the following categories of non-audit services:
| | • | | Bookkeeping or other services related to the accounting records or financial statements of the Fund |
| | • | | Financial information systems design and implementation |
| | • | | Appraisal or valuation services, fairness opinions, or contribution-in-kind reports |
| | • | | Internal audit outsourcing services |
| | • | | Management functions or human resources |
| | • | | Broker or dealer, investment adviser, or investment banking services |
| | • | | Legal services and expert services unrelated to the audit |
| | • | | Any other service that the Public Company Accounting Oversight Board determines, by regulation, is impermissible. |
Pre-approval of Non-Audit Services Provided to Other Entities Within the PGIM Fund Complex
Certain non-audit services provided to PGIM Investments LLC or any of its affiliates that also provide ongoing services to the PGIM Mutual Funds will be subject to pre-approval by the Audit Committee. The only non-audit services provided to these entities that will require pre-approval are those related directly to the operations and financial reporting of the Funds.
Individual projects that are not presented to the Audit Committee as part of the annual pre-approval process will be subject to pre-approval by the Committee Chair (or any other Committee member on whom this responsibility has been delegated) so long as the estimated fee for those services does not exceed $30,000. Services presented for pre-approval pursuant to this paragraph will be accompanied by a confirmation from both the Treasurer and the independent accountants that the proposed services will not adversely affect the independence of the independent accountants.
Although the Audit Committee will not pre-approve all services provided to PGIM Investments LLC and its affiliates, the Committee will receive an annual report from the Fund’s independent accounting firm showing the aggregate fees for all services provided to PGIM Investments and its affiliates.
| (e) | (2) Percentage of services described in each of paragraphs (b) through (d) of this Item that were approved by the audit committee pursuant to paragraph (c)(7)(i)(C) of Rule 2-01 of Regulation S-X – |
| | | | |
| | Fiscal Year Ended September 30, 2023 | | Fiscal Year Ended September 30, 2022 |
| 4(b) | | Not applicable. | | Not applicable. |
| 4(c) | | Not applicable. | | Not applicable. |
| 4(d) | | Not applicable. | | Not applicable. |
(f) Percentage of hours expended attributable to work performed by other than full time employees of principal accountant if greater than 50%.
The percentage of hours expended on the principal accountant’s engagement to audit the registrant’s financial statements for the most recent fiscal year that were attributed to work performed by persons other than the principal accountant’s full-time, permanent employees was 0%.
(g) Non-Audit Fees
The aggregate non-audit fees billed by the Registrant’s principal accountant for services rendered to the registrant’s investment adviser and any entity controlling, controlled by, or under common control with the investment adviser that provides ongoing services to the registrant for the fiscal years ended September 30, 2023 and September 30, 2022 was $0 and $0, respectively.
(h) Principal Accountant’s Independence
Not applicable as the Registrant’s principal accountant has not provided non-audit services to the registrant’s investment adviser and any entity controlling, controlled by, or under common control with the investment adviser that provides ongoing services to the registrant that were not pre-approved pursuant to Rule 2-01(c)(7)(ii) of Regulation S-X.
(i) Not applicable.
(j) Not applicable.
Item 5 – Audit Committee of Listed Registrants – Not applicable.
Item 6 – Schedule of Investments – The schedule is included as part of the report to shareholders filed under Item 1 of this Form.
Item 7 – Disclosure of Proxy Voting Policies and Procedures for Closed-End Management Investment Companies – Not applicable.
Item 8 – Portfolio Managers of Closed-End Management Investment Companies – Not applicable.
Item 9 – Purchases of Equity Securities by Closed-End Management Investment Company and Affiliated Purchasers – Not applicable.
Item 10 – Submission of Matters to a Vote of Security Holders – There have been no material changes to these procedures.
Item 11 – Controls and Procedures
| | (a) | It is the conclusion of the registrant’s principal executive officer and principal financial officer that the effectiveness of the registrant’s current disclosure controls and procedures (such disclosure controls and procedures having been evaluated within 90 days of the date of this filing) provide reasonable assurance that the information required to be disclosed by the registrant has been recorded, processed, summarized and reported within the time period specified in the Commission’s rules and forms and that the information required to be disclosed by the registrant has been accumulated and communicated to the registrant’s principal executive officer and principal financial officer in order to allow timely decisions regarding required disclosure. |
| | (b) | There has been no significant change in the registrant’s internal control over financial reporting (as defined in Rule 30a-3(d) under the Act (17 CFR 270.30a-3(d))) that occurred during the period covered by this report that has materially affected, or is reasonably likely to materially affect, the registrant’s internal control over financial reporting. |
Item 12 – Controls and Procedures - Disclosure of Securities Lending Activities for Closed-End Management Investment Companies – Not applicable.
Item 13 – Exhibits
(a)(1) Code of Ethics – Attached hereto as Exhibit EX-99.CODE-ETH.
(a)(2) Certifications pursuant to Section 302 of the Sarbanes-Oxley Act – Attached hereto as Exhibit EX-99.CERT.
(a)(2)(1) Any written solicitation to purchase securities under Rule 23c-1 – Not applicable.
(a)(2)(2) Change in the registrant’s independent public accountant – Not applicable.
SIGNATURES
Pursuant to the requirements of the Securities Exchange Act of 1934 and the Investment Company Act of 1940, the registrant has duly caused this report to be signed on its behalf by the undersigned, thereunto duly authorized.
| | |
| Registrant: | | The Prudential Investment Portfolios, Inc. |
| |
| By: | | /s/ Andrew R. French |
| | Andrew R. French |
| | Secretary |
| |
| Date: | | November 16, 2023 |
Pursuant to the requirements of the Securities Exchange Act of 1934 and the Investment Company Act of 1940, this report has been signed below by the following persons on behalf of the registrant and in the capacities and on the dates indicated.
| | |
| By: | | /s/ Stuart S. Parker |
| | Stuart S. Parker |
| | President and Principal Executive Officer |
| |
| Date: | | November 16, 2023 |
| |
| By: | | /s/ Christian J. Kelly |
| | Christian J. Kelly |
| | Chief Financial Officer (Principal Financial Officer) |
| |
| Date: | | November 16, 2023 |