File No. 333-
AS FILED WITH THE SECURITIES AND EXCHANGE COMMISSION ON FEBRUARY 27, 2014
SECURITIES AND EXCHANGE COMMISSION
WASHINGTON, D.C. 20549
FORM N-14
REGISTRATION STATEMENT UNDER THE SECURITIES ACT OF 1933 [X]
Pre-Effective Amendment No. [ ]
Post-Effective Amendment No. [ ]
EQ Advisors Trust
(Exact Name of Registrant as Specified in Charter)
1290 Avenue of the Americas
New York, New York 10104
(Address of Principal Executive Offices)
(212) 554-1234
(Registrant’s Area Code and Telephone Number)
STEVEN M. JOENK
AXA Equitable Funds Management Group, LLC
1290 Avenue of the Americas
New York, New York 10104
(Name and Address of Agent for Service)
With copies to:
PATRICIA LOUIE, ESQ. AXA Equitable Funds Management Group, LLC 1290 Avenue of the Americas New York, New York 10104 | MARK C. AMOROSI, ESQ. K&L Gates LLP 1601 K Street, N.W. Washington, DC 20006 |
Approximate Date of Proposed Public Offering:
As soon as practicable after this Registration Statement becomes effective.
It is proposed that this Registration Statement will become effective on the 30th day after filing pursuant to Rule 488 under the Securities Act of 1933, as amended.
Title of securities being registered: Class IA, Class IB and Class K shares of beneficial interest in the series of the registrant designated as the Multimanager Aggressive Equity Portfolio, Multimanager Technology Portfolio, Multimanager Core Bond Portfolio, Multimanager Mid Cap Growth Portfolio, Multimanager Mid Cap Value Portfolio, EQ/Large Cap Core PLUS Portfolio, EQ/Large Cap Value PLUS Portfolio, and EQ/International Core PLUS Portfolio.
No filing fee is required because the registrant is relying on Section 24(f) of the Investment Company Act of 1940, as amended, pursuant to which it has previously registered an indefinite number of shares (File Nos. 333-17217 and 811-07953).
EQ ADVISORS TRUST
CONTENTS OF REGISTRATION STATEMENT
This Registration Statement contains the following papers and documents:
Cover Sheet
Contents of Registration Statement
Letter to Shareholders
Notice of Special Meeting
Contractholder Voting Instructions
Part A - Proxy Statement/Prospectus
Part B - Statement of Additional Information
Part C - Other Information
Signature Page
Exhibits
AXA EQUITABLE LIFE INSURANCE COMPANY
1290 Avenue of the Americas
New York, New York 10104
, 2014
Dear Contractholder:
Enclosed is a notice and Combined Proxy Statement and Prospectus relating to a Special Meeting of Shareholders of each of the following Portfolios:
| • | Multimanager Aggressive Equity Portfolio, |
| • | Multimanager Technology Portfolio, |
| • | Multimanager Core Bond Portfolio, |
| • | Multimanager Mid Cap Growth Portfolio, |
| • | Multimanager Mid Cap Value Portfolio, |
| • | Multimanager Large Cap Core Equity Portfolio, |
| • | Multimanager Large Cap Value Portfolio, and |
| • | Multimanager International Equity Portfolio (together, the “Acquired Portfolios”). |
Each Acquired Portfolio is a series of AXA Premier VIP Trust (“VIP Trust”). The Special Meeting of Shareholders of the Acquired Portfolios is scheduled to be held at VIP Trust’s offices, 1290 Avenue of the Americas, New York, New York 10104, on May 21, 2014 at , Eastern time (the “Meeting”). At the Meeting, the shareholders of the Acquired Portfolios who are entitled to vote at the Meeting will be asked to approve the proposals described below.
VIP Trust’s Board of Trustees (the “Board”) has called the Meeting to request shareholder approval of the reorganization of each Acquired Portfolio from a series of VIP Trust into a corresponding series of EQ Advisors Trust (an “Acquiring Portfolio”) (a “Reorganization”) as set forth below:
| • | the Multimanager Aggressive Equity Portfolio into the Multimanager Aggressive Equity Portfolio, a newly created series of EQ Advisors Trust, |
| • | the Multimanager Technology Portfolio into the Multimanager Technology Portfolio, a newly created series of EQ Advisors Trust, |
| • | the Multimanager Core Bond Portfolio into the Multimanager Core Bond Portfolio, a newly created series of EQ Advisors Trust, |
| • | the Multimanager Mid Cap Growth Portfolio into the Multimanager Mid Cap Growth Portfolio, a newly created series of EQ Advisors Trust, |
| • | the Multimanager Mid Cap Value Portfolio into the Multimanager Mid Cap Value Portfolio, a newly created series of EQ Advisors Trust, |
| • | the Multimanager Large Cap Core Equity Portfolio into the EQ/Large Cap Core PLUS Portfolio, |
| • | the Multimanager Large Cap Value Portfolio into the EQ/Large Cap Value PLUS Portfolio, and |
| • | the Multimanager International Equity Portfolio into the EQ/International Core PLUS Portfolio. |
The Board of Trustees of VIP Trust has approved the proposed Reorganizations and recommends that you vote “FOR” the relevant proposals. Although the Board has determined that a vote “FOR” the proposals is in your best interest, the final decision is yours.
Each Acquiring Portfolio is managed by AXA Equitable Funds Management Group, LLC and is sub-advised by one or more investment sub-advisers. In each case, if a Reorganization is approved and implemented, each Contractholder that invests indirectly in an Acquired Portfolio will automatically become a Contractholder that invests indirectly in the corresponding Acquiring Portfolio.
As an owner of a variable life insurance policy and/or a variable annuity contract or certificate that participates in one or more of the Acquired Portfolios through the investment divisions of a separate account or accounts established by AXA Equitable Life Insurance Company (“AXA Equitable”), you are entitled to instruct AXA Equitable how to vote the Acquired Portfolio shares related to your interest in those accounts as of the close of business on February 28, 2014. The attached Notice of Special Meeting of Shareholders and Combined Proxy Statement and Prospectus concerning the Meeting describe the matters to be considered at the Meeting.
You are cordially invited to attend the Meeting. Since it is important that your vote be represented whether or not you are able to attend, you are urged to consider these matters and to exercise your voting instructions by completing, dating, and signing the enclosed voting instruction card and returning it in the accompanying return envelope at your earliest convenience or by relaying your voting instructions via telephone or the Internet by following the enclosed instructions. For further information on how to instruct an insurance company, please see the Contractholder Voting Instructions included herein. Of course, we hope that you will be able to attend the Meeting, and if you wish, you may provide voting instructions in person, even though you may have already returned a voting instruction card or submitted your voting instructions via telephone or the Internet. Please respond promptly in order to save additional costs of proxy solicitation and in order to make sure you are represented.
Very truly yours,
Steven M. Joenk Managing Director AXA Equitable Life Insurance Company |
ii
AXA PREMIER VIP TRUST
Multimanager Aggressive Equity Portfolio
Multimanager Technology Portfolio
Multimanager Core Bond Portfolio
Multimanager Mid Cap Growth Portfolio
Multimanager Mid Cap Value Portfolio
Multimanager Large Cap Core Equity Portfolio
Multimanager Large Cap Value Portfolio
Multimanager International Equity Portfolio
1290 Avenue of the Americas
New York, New York 10104
NOTICE OF SPECIAL MEETING OF SHAREHOLDERS
TO BE HELD ON MAY 21, 2014
To the Shareholders:
NOTICE IS HEREBY GIVEN that a Special Meeting of Shareholders of each of the following Portfolios, each of which is a series of AXA Premier VIP Trust (“VIP Trust”), will be held on May 21, 2014, at , Eastern time, at the offices of VIP Trust, located at 1290 Avenue of the Americas, New York, New York 10104 (the “Meeting”):
| • | Multimanager Aggressive Equity Portfolio, |
| • | Multimanager Technology Portfolio, |
| • | Multimanager Core Bond Portfolio, |
| • | Multimanager Mid Cap Growth Portfolio, |
| • | Multimanager Mid Cap Value Portfolio, |
| • | Multimanager Large Cap Core Equity Portfolio, |
| • | Multimanager Large Cap Value Portfolio, and |
| • | Multimanager International Equity Portfolio (together, the “Acquired Portfolios”). |
The Meeting will be held to act on the following proposals:
1. To approve the Agreement and Plan of Reorganization and Termination adopted by the Board of Trustees of VIP Trust (the “Board”) (the “Shell Reorganization Plan”) with respect to the reorganization of the Multimanager Aggressive Equity Portfolio, a series of VIP Trust, into the Multimanager Aggressive Equity Portfolio, a newly created series of EQ Advisors Trust (“EQ Trust”).
2. To approve the Shell Reorganization Plan with respect to the reorganization of the Multimanager Technology Portfolio, a series of VIP Trust, into the Multimanager Technology Portfolio, a newly created series of EQ Trust.
3. To approve the Shell Reorganization Plan with respect to the reorganization of the Multimanager Core Bond Portfolio, a series of VIP Trust, into the Multimanager Core Bond Portfolio, a newly created series of EQ Trust.
4. To approve the Shell Reorganization Plan with respect to the reorganization of the Multimanager Mid Cap Growth Portfolio, a series of VIP Trust, into the Multimanager Mid Cap Growth Portfolio, a newly created series of EQ Trust.
5. To approve the Shell Reorganization Plan with respect to the reorganization of the Multimanager Mid Cap Value Portfolio, a series of VIP Trust, into the Multimanager Mid Cap Value Portfolio, a newly created series of EQ Trust.
6. To approve the Agreement and Plan of Reorganization and Termination adopted by the Board (the “Merger Plan”) with respect to the reorganization of the Multimanager Large Cap Core Equity Portfolio, a series of VIP Trust, into the EQ/Large Cap Core PLUS Portfolio, a series of EQ Trust.
7. To approve the Merger Plan with respect to the reorganization of the Multimanager Large Cap Value Portfolio, a series of VIP Trust, into the EQ/Large Cap Value PLUS Portfolio, a series of EQ Trust.
8. To approve the Merger Plan with respect to the reorganization of the Multimanager International Equity Portfolio, a series of VIP Trust, into the EQ/International Core PLUS Portfolio, a series of EQ Trust.
9. To transact other business that may properly come before the Meeting or any adjournments thereof.
The Board unanimously recommends that you vote in favor of the relevant proposal(s).
Please note that owners of variable life insurance policies and/or variable annuity contracts or certificates (the “Contractholders”) issued by AXA Equitable Life Insurance Company, MONY Life Insurance Company, MONY Life Insurance Company of America or another insurance company (each, an “Insurance Company”) who have invested in shares of one or more of the Acquired Portfolios through the investment divisions of a separate account or accounts of an Insurance Company will be given the opportunity, to the extent required by law, to provide the applicable Insurance Company with voting instructions on the above proposals.
You should read the Combined Proxy Statement and Prospectus attached to this notice prior to completing your proxy or voting instruction card. The record date for determining the number of shares outstanding, the shareholders entitled to vote and the Contractholders entitled to provide voting instructions at the Meeting and any adjournments or postponements thereof has been fixed as the close of business on February 28, 2014. If you attend the Meeting, you may vote or provide your voting instructions in person.
ii
YOUR VOTE IS IMPORTANT
Please return your proxy or voting instruction card promptly
Regardless of whether you plan to attend the Meeting, you should vote or provide voting instructions by promptly completing, dating, and signing the enclosed proxy or voting instruction card for the Portfolio in which you directly or indirectly own shares and returning it in the enclosed postage-paid envelope. You also can vote or provide voting instructions through the Internet or by telephone using the 12-digit control number that appears on the enclosed proxy or voting instruction card and following the simple instructions. If you are present at the Meeting, you may change your vote or voting instructions, if desired, at that time. The Board recommends that you vote or provide voting instructions to vote “FOR” the proposals.
By order of the Board,
Patricia Louie Vice President and Secretary |
Dated: , 2014
New York, New York
iii
AXA EQUITABLE LIFE INSURANCE COMPANY
MONY LIFE INSURANCE COMPANY
MONY LIFE INSURANCE COMPANY OF AMERICA
CONTRACTHOLDER VOTING INSTRUCTIONS
REGARDING A SPECIAL MEETING OF SHAREHOLDERS OF
MULTIMANAGER AGGRESSIVE EQUITY PORTFOLIO,
MULTIMANAGER TECHNOLOGY PORTFOLIO,
MULTIMANAGER CORE BOND PORTFOLIO,
MULTIMANAGER MID CAP GROWTH PORTFOLIO,
MULTIMANAGER MID CAP VALUE PORTFOLIO,
MULTIMANAGER LARGE CAP CORE EQUITY PORTFOLIO,
MULTIMANAGER LARGE CAP VALUE PORTFOLIO, AND
MULTIMANAGER INTERNATIONAL EQUITY PORTFOLIO,
EACH A SERIES OF AXA PREMIER VIP TRUST
TO BE HELD ON , 2014
Dated: , 2014
GENERAL
These Contractholder Voting Instructions are being furnished by AXA Equitable Life Insurance Company (“AXA Equitable”), MONY Life Insurance Company (“MONY”), MONY Life Insurance Company of America (“MLOA”) or another insurance company (each, an “Insurance Company” and together, the “Insurance Companies”) to owners of their variable life insurance policies or variable annuity contracts or certificates (the “Contracts”) (the “Contractholders”) who, as of February 28, 2014 (the “Record Date”), had net premiums or contributions allocated to the investment divisions of their separate account or accounts (the “Separate Accounts”) that are invested in shares of one or more of the following Portfolios:
| • | Multimanager Aggressive Equity Portfolio, |
| • | Multimanager Technology Portfolio, |
| • | Multimanager Core Bond Portfolio, |
| • | Multimanager Mid Cap Growth Portfolio, |
| • | Multimanager Mid Cap Value Portfolio, |
| • | Multimanager Large Cap Core Equity Portfolio, |
| • | Multimanager Large Cap Value Portfolio, and |
| • | Multimanager International Equity Portfolio (together, the “Acquired Portfolios”). |
Each Acquired Portfolio is a series of AXA Premier VIP Trust (“VIP Trust”), a Delaware statutory trust that is registered with the Securities and Exchange Commission as an open-end management investment company.
To the extent required by applicable law, each Insurance Company will offer Contractholders the opportunity to instruct it, as the record owner of all of the shares of beneficial interest in the Acquired Portfolios (the “Shares”) held by its Separate Accounts, as to how it should vote on the reorganization proposals (the “Proposals”) that will be considered at the Special Meeting of Shareholders of the Acquired Portfolios referred to in the preceding Notice and at any adjournments or postponements (the “Meeting”). The enclosed Combined Proxy Statement and Prospectus, which you should retain for future reference, sets forth concisely information about the proposed reorganizations involving the Acquired Portfolios and corresponding series of EQ Advisors Trust that a Contractholder should know before completing the enclosed voting instruction card.
AXA Equitable Financial Services Company, LLC, a wholly owned subsidiary of AXA Financial, Inc., is the parent company of each named Insurance Company other than MONY. AXA Financial, Inc. is a wholly owned subsidiary of AXA, a French insurance holding company. The principal executive offices of AXA Equitable Financial Services Company, LLC and AXA Financial, Inc. are located at 1290 Avenue of the Americas, New York, New York 10104. Protective Life Insurance Company is the parent company of MONY. The principal executive office of Protective Life Insurance Company is located at 2801 Highway 280 South, Birmingham, Alabama 35223.
These Contractholder Voting Instructions and the accompanying voting instruction card, together with the enclosed proxy materials, are being mailed to Contractholders on or about , 2014.
HOW TO INSTRUCT AN INSURANCE COMPANY
To instruct an Insurance Company as to how to vote the Shares held in the investment divisions of its Separate Accounts, Contractholders are asked to promptly complete their voting instructions on the enclosed voting instruction card(s), sign and date the voting instruction card(s), and mail the voting instruction card(s) in the accompanying postage-paid envelope. Contractholders also may provide voting instructions by telephone at 1-800-690-6903 or by Internet at our website at www.proxyvote.com.
If a voting instruction card is not marked to indicate voting instructions but is signed and timely returned, it will be treated as an instruction to vote the Shares in favor of the Proposal(s).
The number of Shares held in the investment division of a Separate Account corresponding to an Acquired Portfolio for which a Contractholder may provide voting instructions was determined as of the Record Date by dividing (i) a Contract’s account value (minus any Contract indebtedness) allocable to that investment division by (ii) the net asset value of one Share of the corresponding Acquired Portfolio. Each whole share of an Acquired Portfolio is entitled to one vote as to each matter with respect to which it is entitled to vote and each fractional share is entitled to a
ii
proportionate fractional vote. At any time prior to an Insurance Company’s voting at the Meeting, a Contractholder may revoke his or her voting instructions with respect to that investment division by providing the Insurance Company with a properly executed written revocation of such voting instructions, properly executing later-dated voting instructions by a voting instruction card, telephone or the Internet, or appearing and providing voting instructions in person at the Meeting.
HOW AN INSURANCE COMPANY WILL VOTE
An Insurance Company will vote the Shares for which it receives timely voting instructions from Contractholders in accordance with those instructions. Shares in each investment division of a Separate Account for which an Insurance Company receives a voting instruction card that is signed and timely returned but is not marked to indicate voting instructions will be treated as an instruction to vote the Shares “FOR” the applicable Proposal. Shares in each investment division of a Separate Account for which an Insurance Company receives no timely voting instructions from Contractholders, or that are attributable to amounts retained by an Insurance Company as surplus or seed money, will be voted by the applicable Insurance Company either “FOR” or “AGAINST” the applicable Proposals, or as an abstention, in the same proportion as the Shares for which Contractholders have provided voting instructions to the Insurance Company. As a result of such proportional voting by the Insurance Companies, it is possible that a small number of Contractholders could determine whether the Proposals are approved.
OTHER MATTERS
The Insurance Companies are not aware of any matters, other than the specified Proposals, to be acted on at the Meeting. If any other matters come before the Meeting, an Insurance Company will vote the Shares upon such matters in its discretion. Voting instruction cards may be solicited by directors, officers and employees of AXA Equitable Funds Management Group, LLC, the investment manager of VIP Trust, or its affiliates as well as officers and agents of VIP Trust. The principal solicitation will be by mail but voting instructions may also be solicited by telephone, fax, personal interview, the Internet or other permissible means.
If the quorum necessary to transact business is not established or the vote required to approve a Proposal is not obtained at the Meeting, the persons named as proxies may propose one or more adjournments or postponements of the Meeting in accordance with applicable law to permit further solicitation of voting instructions. The persons named as proxies will vote in their discretion on any such adjournment or postponement.
It is important that your Contract be represented. Please promptly mark your voting instructions on the enclosed voting instruction card; then sign and date the voting instruction card and mail it in the accompanying postage-paid envelope. You may also provide your voting instructions by telephone at 1-800-690-6903 or by Internet at our website at www.proxyvote.com.
iii
PROXY STATEMENT
for
Multimanager Aggressive Equity Portfolio,
Multimanager Technology Portfolio,
Multimanager Core Bond Portfolio,
Multimanager Mid Cap Growth Portfolio,
Multimanager Mid Cap Value Portfolio,
Multimanager Large Cap Core Equity Portfolio,
Multimanager Large Cap Value Portfolio, and
Multimanager International Equity Portfolio,
each a series of AXA Premier VIP Trust
and
PROSPECTUS
for
Multimanager Aggressive Equity Portfolio,
Multimanager Technology Portfolio,
Multimanager Core Bond Portfolio,
Multimanager Mid Cap Growth Portfolio,
Multimanager Mid Cap Value Portfolio,
EQ/Large Cap Core PLUS Portfolio,
EQ/Large Cap Value PLUS Portfolio, and
EQ/International Core PLUS Portfolio,
each a series of EQ Advisors Trust
Dated
, 2014
1290 Avenue of the Americas
New York, New York 10104
1-877-222-2144
This Combined Proxy Statement and Prospectus (the “Proxy Statement/Prospectus”) is being furnished to owners of variable life insurance policies and/or variable annuity contracts or certificates (the “Contracts”) (the “Contractholders”) issued by AXA Equitable Life Insurance Company (“AXA Equitable”), MONY Life Insurance Company, MONY Life Insurance Company of America or another insurance company (each, an “Insurance Company” and together, the “Insurance Companies”) who, as of
THE SECURITIES AND EXCHANGE COMMISSION AND THE COMMODITY FUTURES TRADING COMMISSION HAVE NOT APPROVED OR DISAPPROVED THESE SECURITIES OR PASSED UPON THE ADEQUACY OF THIS PROXY STATEMENT/PROSPECTUS. ANY REPRESENTATION TO THE CONTRARY IS A CRIMINAL OFFENSE.
February 28, 2014, had net premiums or contributions allocated to the investment divisions of an Insurance Company’s separate account or accounts (the “Separate Accounts”) that are invested in shares of beneficial interest in one or more of the following Portfolios that are series of AXA Premier Trust (“VIP Trust”):
| • | Multimanager Aggressive Equity Portfolio, |
| • | Multimanager Technology Portfolio, |
| • | Multimanager Core Bond Portfolio, |
| • | Multimanager Mid Cap Growth Portfolio |
| • | Multimanager Mid Cap Value Portfolio, |
| • | Multimanager Large Cap Core Equity Portfolio, |
| • | Multimanager Large Cap Value Portfolio, and |
| • | Multimanager International Equity Portfolio. |
Each of the Multimanager Aggressive Equity, Multimanager Technology, Multimanager Core Bond, Multimanager Mid Cap Growth, Multimanager Mid Cap Value, Multimanager Large Cap Core Equity, Multimanager Large Cap Value, and Multimanager International Equity Portfolios that is a series of VIP Trust is referred to herein as an “Acquired Portfolio” and together as the “Acquired Portfolios.” Each Acquired Portfolio is a series of VIP Trust, an open-end management investment company registered with the Securities and Exchange Commission (“SEC”). This Proxy Statement/Prospectus also is being furnished to the Insurance Companies as the record owners of shares and to other shareholders that were invested in one or more of the Acquired Portfolios as of February 28, 2014. Contractholders are being provided the opportunity to instruct the applicable Insurance Company to approve or disapprove the proposals contained in this Proxy Statement/Prospectus in connection with the solicitation by the Board of Trustees of VIP Trust (“VIP Board”) of proxies to be used at the Special Meeting of Shareholders of the Acquired Portfolios to be held at 1290 Avenue of the Americas, New York, New York 10104, on May 21, 2014, at , Eastern time, or any adjournment or postponement thereof (the “Meeting”).
ii
The proposals described in this Proxy Statement/Prospectus are as follows:
| Proposal | Shareholders Entitled to Vote on the Proposal | |
| 1. To approve the Agreement and Plan of Reorganization and Termination between VIP Trust and EQ Advisors Trust (“EQ Trust”) (the “Shell Reorganization Plan”) with respect to the reorganization of the Multimanager Aggressive Equity Portfolio, a series of VIP Trust, into the Multimanager Aggressive Equity Portfolio, a newly created series of EQ Trust (the “New Multimanager Aggressive Equity Portfolio”). | Shareholders of the Multimanager Aggressive Equity Portfolio. | |
| 2. To approve the Shell Reorganization Plan with respect to the reorganization of the Multimanager Technology Portfolio, a series of VIP Trust, into the Multimanager Technology Portfolio, a newly created series of EQ Trust (the “New Multimanager Technology Portfolio”). | Shareholders of the Multimanager Technology Portfolio. | |
| 3. To approve the Shell Reorganization Plan with respect to the reorganization of the Multimanager Core Bond Portfolio, a series of VIP Trust, into the Multimanager Core Bond Portfolio, a newly created series of EQ Trust (the “New Multimanager Core Bond Portfolio”). | Shareholders of the Multimanager Core Bond Portfolio. | |
| 4. To approve the Shell Reorganization Plan with respect to the reorganization of the Multimanager Mid Cap Growth Portfolio, a series of VIP Trust, into the Multimanager Mid Cap Growth Portfolio, a newly created series of EQ Trust (the “New Multimanager Mid Cap Growth Portfolio”). | Shareholders of the Multimanager Mid Cap Growth Portfolio. | |
| 5. To approve the Shell Reorganization Plan with respect to the reorganization of the Multimanager Mid Cap Value Portfolio, a series of VIP Trust, into the Multimanager Mid Cap Value Portfolio, a newly created series of EQ Trust (the “New Multimanager Mid Cap Value Portfolio”). | Shareholders of the Multimanager Mid Cap Value Portfolio. | |
| 6. To approve the Agreement and Plan of Reorganization and Termination between VIP Trust and EQ Trust (the “Merger Plan”) with respect to the reorganization of the Multimanager Large Cap Core Equity Portfolio, a series of VIP Trust, into the EQ/Large Cap Core PLUS Portfolio, a series of EQ Trust. | Shareholders of the Multimanager Large Cap Core Equity Portfolio. | |
| 7. To approve the Merger Plan with respect to the reorganization of the Multimanager Large Cap Value Portfolio, a series of VIP Trust, into the EQ/Large Cap Value PLUS Portfolio, a series of EQ Trust. | Shareholders of the Multimanager Large Cap Value Portfolio. | |
| 8. To approve the Merger Plan with respect to the reorganization of the Multimanager International Equity Portfolio, a series of VIP Trust, into the EQ/International Core PLUS Portfolio, a series of EQ Trust. | Shareholders of the Multimanager International Equity Portfolio. |
iii
Each reorganization referred to in Proposals 1 – 8 above is referred to herein as a “Reorganization” and together as the “Reorganizations.” Each of the New Multimanager Aggressive Equity, New Multimanager Technology, New Multimanager Core Bond, New Multimanager Mid Cap Growth, New Multimanager Mid Cap Value, EQ/Large Cap Core PLUS, EQ/Large Cap Value PLUS, and EQ/International Core PLUS Portfolios is referred to herein as an “Acquiring Portfolio” and together as the “Acquiring Portfolios.” The Shell Reorganization Plan and Merger Plan are sometimes referred to herein as the “Reorganization Plans.”
Each Reorganization is intended to qualify for federal income tax purposes as a tax-free reorganization under section 368(a) of the Internal Revenue Code of 1986, as amended.
This Proxy Statement/Prospectus, which you should retain for future reference, contains important information regarding the Proposals that you should know before voting or providing voting instructions. Additional information about EQ Trust has been filed with the SEC and is available upon oral or written request. This Proxy Statement/Prospectus is being provided to the Insurance Companies and mailed to Contractholders and other shareholders on or about , 2014. This Proxy Statement/Prospectus and a proxy or voting instruction card also will be available at www.proxyvote.com on or about , 2014. It is expected that one or more representatives of each Insurance Company will attend the Meeting in person or by proxy and will vote shares held by the Insurance Company in accordance with voting instructions received from its Contractholders and in accordance with voting procedures established by VIP Trust.
The Prospectus of VIP Trust, dated May 1, 2013, as supplemented, with respect to the Acquired Portfolios has been filed with the SEC (File Nos. 333-70754 and 811-10509) and is incorporated by reference into this Proxy Statement/Prospectus.
The Statement of Additional Information dated ___, 2014, relating to the Reorganizations has been filed with the SEC (File No. 333-___) and is incorporated by reference into this Proxy Statement/Prospectus.
The Annual Report to Shareholders of VIP Trust with respect to the Acquired Portfolios for the fiscal year ended December 31, 2013, has been filed with the SEC (File Nos. 333-70754 and 811-10509).
For a free copy of any of these documents, please call 1-877-522-5035 or write VIP Trust at the address above.
Because the New Multimanager Aggressive Equity, New Multimanager Technology, New Multimanager Core Bond, New Multimanager Mid Cap Growth, and New Multimanager Mid Cap Value Portfolios have not yet commenced operations as of the date of this Proxy Statement/Prospectus, no prospectus, statement of additional information, or annual report is available for these Portfolios at this time.
iv
For a free copy of any of the above documents, please call 1-877-522-5035 or write VIP Trust at the address above.
Each Trust is subject to the informational requirements of the Securities Exchange Act of 1934, as amended. Accordingly, each Trust must file certain reports and other information with the SEC. You can copy and review information about the Trusts at the SEC’s Public Reference Room in Washington, DC, and at certain of the following SEC Regional Offices: New York Regional Office, 3 World Financial Center, Suite 400, New York, New York 10281; Miami Regional Office, 801 Brickell Avenue, Suite 1800, Miami, Florida 33131; Chicago Regional Office, 175 W. Jackson Boulevard, Suite 900, Chicago, Illinois 60604; Denver Regional Office, 1801 California Street, Suite 1500, Denver, Colorado 80202; Los Angeles Regional Office, 5670 Wilshire Boulevard, 11th Floor, Los Angeles, California 90036; Boston Regional Office, 33 Arch Street, 23rd Floor, Boston, MA 02110; Philadelphia Regional Office, The Mellon Independence Center, 701 Market Street, Philadelphia, PA 19106; Atlanta Regional Office, 3475 Lenox Road, N.E., Suite 1000, Atlanta, GA 30326; Fort Worth Regional Office, Burnett Plaza, Suite 1900, 801 Cherry Street, Unit 18, Fort Worth, TX 76102; Salt Lake Regional Office, 15 W. South Temple Street, Suite 1800, Salt Lake City, UT 84101; San Francisco Regional Office, 44 Montgomery Street, Suite 2600, San Francisco, CA 94104. You may obtain information on the operation of the Public Reference Room by calling the SEC at (202) 551-8090. Reports and other information about the Trusts are available on the IDEA Database on the SEC’s Internet site at http://www.sec.gov. You may obtain copies of this information from the SEC’s Public Reference Branch, Office of Consumer Affairs and Information Services, Washington, DC 20549, at prescribed rates.
v
| 1 | ||||
| 1 | ||||
| 2 | ||||
| 7 | ||||
| 7 | ||||
| 8 | ||||
Comparison of Investment Objectives, Policies, and Strategies | 8 | |||
| 11 | ||||
| 11 | ||||
| 13 | ||||
| 13 | ||||
| 17 | ||||
| 18 | ||||
| 19 | ||||
Comparison of Investment Objectives, Policies, and Strategies | 19 | |||
| 21 | ||||
| 22 | ||||
| 23 | ||||
| 24 | ||||
| 28 | ||||
| 29 | ||||
| 29 | ||||
Comparison of Investment Objectives, Policies, and Strategies | 30 | |||
| 33 | ||||
| 33 | ||||
| 35 | ||||
| 35 |
vi
| 40 | ||||
| 41 | ||||
| 41 | ||||
Comparison of Investment Objectives, Policies, and Strategies | 41 | |||
| 44 | ||||
| 45 | ||||
| 46 | ||||
| 46 | ||||
| 51 | ||||
| 52 | ||||
| 52 | ||||
Comparison of Investment Objectives, Policies, and Strategies | 53 | |||
| 56 | ||||
| 56 | ||||
| 58 | ||||
| 58 | ||||
| 63 | ||||
| 64 | ||||
| 64 | ||||
Comparison of Investment Objectives, Policies, and Strategies | 65 | |||
| 68 | ||||
| 68 | ||||
| 70 | ||||
| 71 | ||||
| 75 | ||||
| 77 | ||||
| 77 | ||||
Comparison of Investment Objectives, Policies, and Strategies | 78 | |||
| 81 | ||||
| 81 | ||||
| 83 | ||||
| 84 |
vii
| 88 | ||||
| 90 | ||||
| 90 | ||||
Comparison of Investment Objectives, Policies and Strategies | 91 | |||
| 94 | ||||
| 94 | ||||
| 97 | ||||
| 98 | ||||
| 98 | ||||
| 100 | ||||
| 100 | ||||
Potential Benefits of the Reorganizations to FMG LLC and its Affiliates | 102 | |||
| 103 | ||||
| 109 | ||||
| 111 | ||||
| 112 | ||||
| 112 | ||||
| 112 | ||||
| 112 | ||||
| 115 | ||||
| 117 | ||||
| 117 | ||||
| 140 | ||||
| 143 | ||||
| 143 | ||||
Payments to Broker-Dealers and Other Financial Intermediaries | 143 | |||
| 144 | ||||
| 147 | ||||
| 149 | ||||
| 149 | ||||
| 150 | ||||
| 160 | ||||
| 160 | ||||
| 162 | ||||
| 162 | ||||
| 163 | ||||
| 163 | ||||
| A-1 | ||||
APPENDIX B — Merger Plan | B-1 | |||
| C-1 | ||||
| D-1 |
viii
You should read this entire Proxy Statement/Prospectus carefully. For additional information, you should consult the Reorganization Plans, copies of the forms of which are attached hereto as Appendix A and Appendix B.
This Proxy Statement/Prospectus is soliciting shareholders with amounts invested in one or more of the Acquired Portfolios as of February 28, 2014 to approve the Reorganization Plan (with respect to the Acquired Portfolio in which they are invested), whereby each Acquired Portfolio will be reorganized into the corresponding Acquiring Portfolio. (Each Acquired Portfolio and each Acquiring Portfolio is sometimes referred to herein as a “Portfolio.”)
Each Acquired Portfolio’s shares are divided into three classes, designated Class A, Class B, and Class K shares (the “Acquired Portfolio Shares”). Each Acquiring Portfolio’s shares also are divided into three classes, designated Class IA, Class IB, and Class K shares (the “Acquiring Portfolio Shares”). The rights and preferences of each class of Acquiring Portfolio Shares are substantially similar to the rights and preferences of the corresponding class of Acquired Portfolio Shares.
The Reorganization Plans provide, with respect to each Reorganization, for:
| • | the transfer of all of the assets of the Acquired Portfolio to the corresponding Acquiring Portfolio in exchange solely for Acquiring Portfolio Shares having an aggregate net asset value equal to the Acquired Portfolio’s net assets and the Acquiring Portfolio’s assumption of all the liabilities of the Acquired Portfolio; |
| • | the distribution to the shareholders (for the benefit of the Separate Accounts, as applicable, and thus the Contractholders) of those Acquiring Portfolio Shares; and |
| • | the complete termination of the Acquired Portfolio. |
A comparison of the investment objective(s), policies, and strategies and principal risks of each Acquired Portfolio and its corresponding Acquiring Portfolio is included in “Comparison of Investment Objectives, Policies, and Strategies” and “Comparison of Principal Risk Factors” below. The Portfolios have identical distribution procedures, purchase procedures, exchange rights and redemption procedures, which are discussed in “Additional Information about the Acquiring Portfolios” below. Each Portfolio offers its shares to Separate Accounts and certain other eligible investors. Shares of each Portfolio are offered and redeemed at their net asset value without any sales load. You will not incur any sales loads or similar transaction charges as a result of a Reorganization.
Subject to shareholder approval, each Reorganization is expected to be effective at the close of business on , 2014, or on a later date the Trusts decide upon (the
1
“Closing Date”). As a result of each Reorganization, each shareholder invested in shares of one or more of the Acquired Portfolios would become an owner of shares of the corresponding Acquiring Portfolio. Each such shareholder would hold, immediately after the Closing Date, Class IA, Class IB, or Class K shares of the applicable Acquiring Portfolio having an aggregate value equal to the aggregate value of the Class A, Class B, or Class K Acquired Portfolio Shares, as applicable, that were held by the shareholder as of the Closing Date. Similarly, each Contractholder whose Contract values are invested in shares of one or more of the Acquired Portfolios would become an indirect owner of shares of the corresponding Acquiring Portfolio. Each such Contractholder would indirectly hold, immediately after the Closing Date, Class IA, Class IB, or Class K shares of the applicable Acquiring Portfolio having an aggregate value equal to the aggregate value of the Class A, Class B, or Class K Acquired Portfolio Shares, as applicable, that were indirectly held by the Contractholder as of the Closing Date. The consummation of any one Reorganization is not contingent on the consummation of any other Reorganization. VIP Trust believes that there will be no adverse tax consequences to shareholders or Contractholders as a direct result of the Reorganizations. Please see “Additional Information about the Reorganizations — Federal Income Tax Consequences of the Reorganizations” below for further information.
The VIP Board has unanimously approved each Reorganization Plan with respect to the Acquired Portfolios involved therein. Accordingly, the VIP Board is submitting the Reorganization Plans for approval by the respective Acquired Portfolio’s shareholders. In considering whether to approve a proposal (a “Proposal”), you should review the Proposal for the Acquired Portfolio(s) in which you were a direct or indirect holder on the Record Date (as defined under “Voting Information”). In addition, you should review the information in this Proxy Statement/Prospectus that relates to all of the Proposals and the Reorganization Plans generally. The VIP Board recommends that you vote “FOR” the Proposals to approve the Reorganization Plans.
PROPOSAL 1: APPROVAL OF THE SHELL REORGANIZATION PLAN WITH RESPECT TO THE REORGANIZATION OF THE MULTIMANAGER AGGRESSIVE EQUITY PORTFOLIO INTO THE NEW MULTIMANAGER AGGRESSIVE EQUITY PORTFOLIO, A NEWLY CREATED SERIES OF EQ TRUST.
This Proposal 1 requests your approval of the Shell Reorganization Plan, pursuant to which the Multimanager Aggressive Equity Portfolio will be reorganized into the New Multimanager Aggressive Equity Portfolio.
In considering whether you should approve this Proposal, you should note that:
| • | The New Multimanager Aggressive Equity Portfolio is newly organized and has no assets, operating history, or performance information of its own as of the date of this Proxy Statement/Prospectus. The New Multimanager Aggressive Equity Portfolio has been created as a shell series of EQ Trust solely for the purposes of acquiring the Multimanager Aggressive Equity Portfolio’s |
2
assets and continuing its business investment operations, and will not conduct any investment operations until after the closing of the Reorganization. If shareholders of the Multimanager Aggressive Equity Portfolio approve its Reorganization, the New Multimanager Aggressive Equity Portfolio will assume and publish the operating history and performance record of the Multimanager Aggressive Equity Portfolio. |
| • | The New Multimanager Aggressive Equity Portfolio and the Multimanager Aggressive Equity Portfolio have substantially identical investment objectives, policies, and strategies. Each Portfolio seeks to achieve long-term growth of capital by investing primarily in the securities of large-capitalization growth companies. In addition, each Portfolio’s assets are allocated among three or more investment sub-advisers (each, an “Adviser”), each of which manages its portion of the Portfolio using a different but complementary investment strategy. A portion or portions of each Portfolio are actively managed by an Adviser (the “Active Allocated Portion” or the “Active Allocated Portions”) and a portion of each Portfolio seeks to track the performance of the Russell 3000® Growth Index (the “Index Allocated Portion”). There are, however, differences in the Portfolios’ primary investment policies and strategies of which you should be aware. |
The primary difference between the two Portfolios is that FMG LLC currently may limit the equity exposure of the Multimanager Aggressive Equity Portfolio at times when market volatility is increasing above specific thresholds by reducing investments in securities, shorting or selling long futures and options positions on an index, increasing cash levels, and/or shorting and index. FMG LLC will not employ this volatility management strategy in managing the New Multimanager Aggressive Equity Portfolio. However, it is anticipated that the Multimanager Aggressive Equity Portfolio will discontinue using this strategy effective on or before April 30, 2014, and therefore at the time of the Reorganization it is expected that the investment objectives, policies, and strategies of each Portfolio will be identical. For a detailed comparison of the Portfolios’ investment policies and strategies, see “Comparison of Investment Objectives, Policies, and Strategies” below.
| • | The Portfolios have substantially similar risk profiles, although there are differences of which you should be aware. Each Portfolio’s principal risks include equity risk, foreign securities risk, and large-cap company risk. However, because it currently employs the volatility management strategy described above, the Multimanager Aggressive Equity Portfolio also is subject to cash management risk, custom benchmark risk, derivatives risk, futures contract risk, leverage risk, short position risk, and volatility management risk as principal risks, which are not principal risks of the New Multimanager Aggressive Equity Portfolio. For a detailed comparison of each Portfolio’s risks, see “Comparison of Principal Risk Factors” below. |
3
| • | FMG LLC (the “Manager”) serves as the investment manager and administrator for the Multimanager Aggressive Equity Portfolio and will serve as the investment manager and administrator for the New Multimanager Aggressive Equity Portfolio after the Reorganization. FMG LLC has received an exemptive order from the SEC that generally permits FMG LLC and each Trust’s Board of Trustees to appoint, dismiss and replace each Portfolio’s Adviser(s) and to amend the advisory agreements between FMG LLC and the Advisers without obtaining shareholder approval (except with respect to Affiliated Advisers (as defined herein)). FMG LLC has appointed six Advisers to manage distinct portions of the assets of the Multimanager Aggressive Equity Portfolio. In particular, AllianceBernstein L.P., which is responsible for the management of the Index Allocated Portion of the Multimanager Aggressive Equity Portfolio, and ClearBridge Investments, LLC, Scotia Institutional Asset Management US, Ltd., Marsico Capital Management, LLC, T. Rowe Price Associates, Inc., and Westfield Capital Management Company, L.P., which are responsible for the management of portions of the Active Allocated Portion of the Multimanager Aggressive Equity Portfolio, currently serve as Advisers to the Multimanager Aggressive Equity Portfolio, and it is anticipated that they will also serve as Advisers to the New Multimanager Aggressive Equity Portfolio after the Reorganization. For a detailed description of the Manager and the Advisers, please see “Additional Information about the Acquiring Portfolios — The Manager” and “ — The Advisers” below. |
| • | Class A shareholders of the Multimanager Aggressive Equity Portfolio will receive Class IA shares of the New Multimanager Aggressive Equity Portfolio, Class B shareholders of the Multimanager Aggressive Equity Portfolio will receive Class IB shares of the New Multimanager Aggressive Equity Portfolio, and Class K shareholders of the Multimanager Aggressive Equity Portfolio will receive Class K shares of the New Multimanager Aggressive Equity Portfolio pursuant to the Reorganization. Shareholders will not pay any sales charges in connection with the Reorganization. Please see “Comparative Fee and Expense Tables,” “Additional Information about the Reorganizations” and “Additional Information about the Acquiring Portfolios” below for more information. |
| • | It is estimated that the annual operating expense ratios for the New Multimanager Aggressive Equity Portfolio’s Class IA, Class IB, and Class K shares, for the fiscal year following the Reorganization, will be lower than those of the Multimanager Aggressive Equity Portfolio’s Class A, Class B, and Class K shares, respectively, for the fiscal year ended December 31, 2013. For a more detailed comparison of the fees and expenses of the Portfolios, please see “Comparative Fee and Expense Tables” and “Additional Information about the Acquiring Portfolios” below. |
4
| • | The maximum management fee for the Multimanager Aggressive Equity Portfolio is equal to an annual rate of 0.600% of its average daily net assets, while the maximum management fee for the New Multimanager Aggressive Equity Portfolio is equal to an annual rate of 0.580% of its average daily net assets. The management fee schedule for the Multimanager Aggressive Equity Portfolio is equal to an annual rate of 0.600% of the Portfolio’s average daily net assets up to and including $750 million, 0.550% of the Portfolio’s average daily net assets in excess of $750 million and up to and including $1.75 billion, 0.525% of the Portfolio’s average daily net assets in excess of $1.75 billion and up to and including $4.75 billion, 0.500% of the Portfolio’s average daily net assets in excess of $4.75 billion and up to and including $9.75 billion, and 0.475% of the Portfolio’s average daily net assets thereafter. The management fee schedule for the New Multimanager Aggressive Equity Portfolio is equal to an annual rate of 0.580% of the Portfolio’s average daily net assets up to and including $2 billion, 0.550% of the Portfolio’s average daily net assets in excess of $2 billion and up to and including $3 billion, 0.525% of the Portfolio’s average daily net assets in excess of $3 billion and up to and including $6 billion, 0.500% of the Portfolio’s average daily net assets in excess of $6 billion and up to and including $11 billion, and 0.475% of the Portfolio’s average daily net assets thereafter. |
| • | The administration fee schedule for the Multimanager Aggressive Equity Portfolio is equal to its proportionate share of an asset-based administration fee for the Multimanager Aggressive Equity Portfolio and certain other of VIP Trust’s multi-adviser portfolios, which is equal to an annual rate of 0.15% of these portfolios’ total average daily net assets up to and including $15 billion; 0.125% of these portfolios’ total average daily net assets in excess of $15 billion up to and including $30 billion; and 0.100% of these portfolios’ total average daily net assets in excess of $30 billion, plus an annual flat fee of $32,500 if the Multimanager Aggressive Equity Portfolio’s total average net assets are less than $5 billion. The administration fee schedule for the New Multimanager Aggressive Equity Portfolio is equal to its proportionate share of an asset-based administration fee for the New Multimanager Aggressive Equity Portfolio and certain other of EQ Trust’s portfolios, which is equal to an annual rate of 0.15% of these portfolios’ aggregate average daily net assets up to and including $20 billion; 0.110% of these portfolios’ aggregate average daily net assets in excess of $20 billion up to and including $25 billion; and 0.100% of these portfolios’ aggregate average daily net assets in excess of $25 billion, plus an annual flat fee of $32,500 if the New Multimanager Aggressive Equity Portfolio’s total average net assets are less than $5 billion. For a more detailed description of the fees and expenses of the Portfolios, please see “Comparative Fee and Expense Tables” and “Additional Information about the Acquiring Portfolios” below. |
5
| • | Following the Reorganization, the combined Portfolio will be managed in accordance with the investment objective, policies, and strategies of the New Multimanager Aggressive Equity Portfolio. It is not expected that the New Multimanager Aggressive Equity Portfolio will revise any of its investment policies following the Reorganization to reflect those of the Multimanager Aggressive Equity Portfolio. FMG LLC has reviewed the Multimanager Aggressive Equity Portfolio’s investment objective, policies, and strategies and determined that they are substantially similar to the New Multimanager Aggressive Equity Portfolio’s investment objective, policies, and strategies. Thus, FMG LLC believes that, if the Reorganization is approved, a substantial portion of the Multimanager Aggressive Equity Portfolio’s holdings could be transferred to and held by the New Multimanager Aggressive Equity Portfolio. However, it is expected that some of those holdings may not remain at the time of the Reorganization due to normal portfolio turnover. It is also expected that, if the Reorganization is approved, the Multimanager Aggressive Equity Portfolio’s holdings that are not compatible with the New Multimanager Aggressive Equity Portfolio’s investment objective, policies, and strategies will be liquidated in an orderly manner in connection with the Reorganization, and the proceeds of these sales held in temporary investments or reinvested in assets that are consistent with those investment objective, policies, and strategies. The portion of the Multimanager Aggressive Equity Portfolio’s assets that will be liquidated in connection with the Reorganization will depend on market conditions and on the assessment by the Manager and the New Multimanager Aggressive Equity Portfolio’s Advisers of the compatibility of those holdings with the New Multimanager Aggressive Equity Portfolio’s anticipated portfolio composition and investment objective, policies, and strategies at the time of the Reorganization. The need for the Portfolio to sell investments in connection with the Reorganization may result in its selling securities at a disadvantageous time and price and could result in it realizing gains (or losses) that would not otherwise have been realized and incurring transaction costs that would not otherwise have been incurred. |
| • | The New Multimanager Aggressive Equity Portfolio will bear its proportionate share (based on the fraction that the shareholder accounts of the Multimanager Aggressive Equity Portfolio bears to the aggregate shareholder accounts of all Acquired Portfolios covered by the Shell Reorganization Plan, i.e., those mentioned below, at the Valuation Time) of 50% of the first $300,000 of the expenses of the Reorganizations of the Multimanager Aggressive Equity, Multimanager Technology, Multimanager Core Bond, Multimanager Mid Cap Growth, and Multimanager Mid Cap Value Portfolios, subject to an aggregate maximum of $150,000 for these Portfolios. FMG LLC generally will bear the expenses of the Reorganizations of these Portfolios in excess of this amount, subject to certain limitations. For additional information, please refer to “Additional Information About the Reorganizations — Terms of the Reorganization Plans” below. |
6
Comparative Fee and Expense Tables
The following tables show the fees and expenses of each class of shares of the Multimanager Aggressive Equity Portfolio and the estimated pro forma fees and expenses of each class of shares of the Acquiring Portfolio after giving effect to the proposed Reorganization. The Acquiring Portfolio is newly organized and has not had any operations of its own to date. Fees and expenses for the Multimanager Aggressive Equity Portfolio are based on those incurred by each class of its shares for the fiscal year ended December 31, 2013. The pro forma fees and expenses of the Acquiring Portfolio Shares assume that the Reorganization has been in effect for the year ended December 31, 2013. The tables below do not reflect any Contract-related fees and expenses, which would increase overall fees and expenses. See a Contract prospectus for a description of those fees and expenses.
Shareholder Fees
(fees paid directly from your investment)
Multimanager Aggressive | Pro Forma New Multimanager Aggressive Equity Portfolio (assuming the Reorganization is approved) | |||
Not applicable. | Not applicable. |
Annual Operating Expenses
(expenses that you may pay each year as a percentage of the value of your investment)
| Multimanager Aggressive Equity Portfolio | Pro Forma New Multimanager Aggressive Equity Portfolio (assuming the Reorganization is approved) | |||||||||||||||||||||||
| Class A | Class B | Class K | Class IA | Class IB | Class K | |||||||||||||||||||
Management Fee | 0.58 | % | 0.58 | % | 0.58 | % | 0.58 | % | 0.58 | % | 0.58 | % | ||||||||||||
Distribution and/or Service | 0.25 | % | 0.25 | % | None | 0.25 | % | 0.25 | % | None | ||||||||||||||
Other Expenses | 0.20 | % | 0.20 | % | 0.20 | % | 0.18 | % | 0.18 | % | 0.18 | % | ||||||||||||
Total Annual Portfolio Operating Expenses | 1.03 | % | 1.03 | % | 0.78 | % | 1.01 | % | 1.01 | % | 0.76 | % | ||||||||||||
This example is intended to help you compare the costs of investing in the Portfolios with the cost of investing in other investment options. The example assumes that:
| • | You invest $10,000 in a Portfolio for the time periods indicated; |
| • | Your investment has a 5% return each year; and |
| • | The Portfolio’s operating expenses remain the same. |
7
This example does not reflect any Contract-related fees and expenses, including redemption fees (if any) at the Contract level. If such fees and expenses were reflected, the total expenses would be higher. Although your actual costs may be higher or lower, based on these assumptions your costs would be:
| 1 Year | 3 Years | 5 Years | 10 Years | |||||||||||||
Multimanager Aggressive Equity Portfolio | ||||||||||||||||
Class A | $ | 105 | $ | 328 | $ | 569 | $ | 1,259 | ||||||||
Class B | $ | 105 | $ | 328 | $ | 569 | $ | 1,259 | ||||||||
Class K | $ | 80 | $ | 249 | $ | 433 | $ | 966 | ||||||||
Pro Forma New Multimanager Aggressive Equity Portfolio (assuming the Reorganization is approved) | ||||||||||||||||
Class IA | $ | 103 | $ | 322 | $ | 558 | $ | 1,236 | ||||||||
Class IB | $ | 103 | $ | 322 | $ | 558 | $ | 1,236 | ||||||||
Class K | $ | 80 | $ | 249 | $ | 483 | $ | 966 | ||||||||
Each Portfolio pays transaction costs, such as commissions, when it buys and sells securities (or “turns over” its portfolio). A higher portfolio turnover rate may indicate higher transaction costs. These costs, which are not reflected in annual fund operating expenses or in the example, affect a Portfolio’s performance. During the fiscal year ended December 31, 2013, the portfolio turnover rate for the Multimanager Aggressive Equity Portfolio was 72% of the average value of the Portfolio. The New Multimanager Aggressive Equity Portfolio has not yet commenced operations and therefore, the New Multimanager Aggressive Equity Portfolio does not have a portfolio turnover rate to report.
Comparison of Investment Objectives, Policies, and Strategies
The following table compares the investment objectives and principal investment policies and strategies of the Multimanager Aggressive Equity Portfolio with those of the New Multimanager Aggressive Equity Portfolio. Each Trust’s Board may change the investment objective of a Portfolio without a vote of the Portfolio’s shareholders. For more detailed information about each Portfolio’s investment strategies and risks, see Appendix C.
| Acquiring Portfolio | Acquired Portfolio | |||
New Multimanager Aggressive Equity Portfolio | Multimanager Aggressive Equity Portfolio | |||
Investment Objective | Seeks to achieve long-term growth of capital. | Seeks to achieve long-term growth of capital with an emphasis on risk-adjusted returns and managing volatility in the Portfolio. However, effective on or before April 30, 2014, the investment objective of this Portfolio will be changed so that it is identical to the investment objective of the Acquiring Portfolio. |
8
| Acquiring Portfolio | Acquired Portfolio | |||
New Multimanager Aggressive Equity Portfolio | Multimanager Aggressive Equity Portfolio | |||
Principal Investment Strategies | Under normal circumstances, the Portfolio intends to invest at least 80% of its net assets, plus borrowings for investment purposes, in equity securities. For purposes of this Portfolio, equity securities shall include common stocks, preferred stocks, and other equity securities, and financial instruments that derive their value from such securities. The Portfolio invests primarily in securities of large capitalization growth companies. For purposes of this Portfolio, large capitalization companies are companies with market capitalization within the range of the Russell 3000® Growth Index at the time of investment (market capitalization range of approximately $27.9 million to $500.5 billion as of December 31, 2012). The Portfolio intends to invest primarily in common stocks, but may also invest in other equity securities that an Adviser believes provide opportunities for capital growth. The size of companies in the Russell 3000® Growth Index changes with market conditions, which can result in changes to the market capitalization range of companies in the index. | Same. | ||
The Manager will generally allocate the Portfolio’s assets among three or more Advisers, each of which will manage its portion of the Portfolio using different yet complementary investment strategies. Under normal circumstances, one portion of the Portfolio is an Index Allocated Portion and the other portions of the Portfolio will be Active Allocated Portions.
Under normal circumstances, the Manager anticipates allocating approximately 50% of the Portfolio’s net assets to the Index Allocated Portion and the remaining 50% of net assets among the Active Allocated Portions. These percentages are targets established by the Manager and actual allocations between the portions may deviate from these targets by up to 20% of the Portfolio’s net assets. | Same. |
9
| Acquiring Portfolio | Acquired Portfolio | |||
New Multimanager Aggressive Equity Portfolio | Multimanager Aggressive Equity Portfolio | |||
| The Index Allocated Portion of the Portfolio seeks to track the performance (before fees and expenses) of the Russell 3000® Growth Index with minimal tracking error. This strategy is commonly referred to as an indexing strategy. Generally, the Index Allocated Portion utilizes a stratified sampling construction process in which the Index Allocated Portion invests in a subset of the companies represented in the Russell 3000® Growth Index based on the Adviser’s analysis of key risk factors and characteristics. Such factors and characteristics include industry weightings, market capitalizations, return variability and yield. | Same. | |||
| No corresponding strategy. | The Manager also may utilize futures and options, such as exchange traded futures and options contracts on securities indices, to manage equity exposure. When market volatility is increasing above specific thresholds set for the Portfolio, the Manager may limit equity exposure either by reducing investments in securities, shorting or selling long futures and options positions on an index, increasing cash levels, and/or shorting an index. However, effective on or before April 30, 2014, the Portfolio will no longer utilize this strategy. | |||
No corresponding strategy. | The Portfolio may invest up to 25% of its assets in derivatives. It is anticipated that the Portfolio’s derivative instruments will consist primarily of exchange-traded futures and options contracts on securities indices, but the Portfolio also may utilize other types of derivatives. The Portfolio may maintain a significant percentage of its assets in cash and cash equivalent instruments, some of which may serve as margin or collateral for the Portfolio’s obligations under derivative transactions. However, effective on or before April 30, 2014, the Portfolio will no longer utilize this strategy. |
10
| Acquiring Portfolio | Acquired Portfolio | |||
New Multimanager Aggressive Equity Portfolio | Multimanager Aggressive Equity Portfolio | |||
| Each Active Allocated Portion invests primarily in equity securities of companies whose above-average prospective earnings growth is not fully reflected, in the view of the Adviser, in current market valuations. The Active Allocated Portions may invest up to 25% of their total assets in securities of foreign companies, including companies based in developing countries. An Adviser may sell a security for a variety of reasons, such as to make other investments believed by an Adviser to offer superior investment opportunities. | Same. |
Comparison of Principal Risk Factors
An investment in a Portfolio is not a deposit of a bank and is not insured or guaranteed by the Federal Deposit Insurance Corporation or any other government agency. You may lose money by investing in a Portfolio. The following table compares the principal risks of an investment in each Portfolio. For an explanation of each such risk, see “Additional Information about the Reorganizations — Description of Risk Factors” below.
Risks | New Multimanager Aggressive Equity Portfolio | Multimanager Aggressive Equity Portfolio | ||||||
Cash Management Risk | X | |||||||
Currency Risk | X | X | ||||||
Custom Benchmark Risk | X | |||||||
Derivatives Risk | X | |||||||
Emerging Markets Risk | X | X | ||||||
Equity Risk | X | X | ||||||
Foreign Securities Risk | X | X | ||||||
Futures Contract Risk | X | |||||||
Index Strategy Risk | X | X | ||||||
Large-Cap Company Risk | X | X | ||||||
Leverage Risk | X | |||||||
Mid-Cap and Small-Cap Company Risk | X | X | ||||||
Short Position Risk | X | |||||||
Volatility Management Risk | X | |||||||
Comparative Performance Information
The Acquiring Portfolio is newly organized and has no assets, operating history or performance information of its own as of the date of this Proxy Statement/Prospectus. After the Reorganization, which is subject to shareholder approval, the Acquiring Portfolio, as the successor to the Acquired Portfolio, will assume and publish the operating history and performance record of the Class A, Class B, and Class K shares of the Acquired Portfolio.
11
The bar charts and tables below provide some indication of the risks of investing in the Multimanager Aggressive Equity Portfolio by showing changes in the Portfolio’s performance from year to year and by showing how the Portfolio’s average annual total returns for the past one year, five years and since inception through December 31, 2013 compared to the returns of a broad-based market index. The additional broad-based market index shows how the Multimanager Aggressive Equity Portfolio’s performance compared with the returns of a volatility managed index. Past performance is not an indication of future performance.
The performance results do not reflect any Contract-related fees and expenses, which would reduce the performance results.
Multimanager Aggressive Equity Portfolio - Calendar Year Total Returns (Class B)
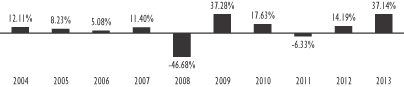
Best Quarter (% and time period) 17.70% (2009 2nd Quarter) | Worst Quarter (% and time period) -25.44% (2008 4th Quarter) | |||||||||||||||||
Multimanager Aggressive Equity Portfolio
Average Annual Total Returns | One Year | Five Years | Ten Years/ Since Inception | |||||||||
Multimanager Aggressive Equity Portfolio — Class A | 37.21% | 19.02% | 6.24% | |||||||||
Multimanager Aggressive Equity Portfolio — Class B | 37.14% | 18.83% | 6.02% | |||||||||
Multimanager Aggressive Equity Portfolio — Class K (Inception Date: August 26, 2011) | 37.55% | N/A | 22.96% | |||||||||
Russell 3000® Growth Index* | 34.23% | 20.56% | 7.95% | |||||||||
Volatility Managed Index — Large Cap Growth 3000** | 33.31% | 17.56% | 9.51% | |||||||||
| * | Russell 3000® Growth Index measures the performance of those Russell 3000® Index companies with higher price-to-book ratios and higher forecasted growth values. The Russell 3000® Index measures the performance of the 3,000 largest U.S. companies based on total market capitalization, which represents approximately 98% of the investable U.S. equity market. |
| ** | The Volatility Managed Index — Large Cap Growth 3000 is an index that applies a formula to a blend of the S&P 500 Index and the Russell 3000® Growth Index adjusting the equity exposure of the S&P 500 Index when certain volatility levels are reached. The S&P 500 Index is a weighted index of common stocks of 500 leading companies in leading industries of the U.S. economy, capturing 75% coverage of U.S. equities. The S&P 500 Index is capitalization weighted, thereby giving greater weight to companies with the largest market capitalizations. |
12
The following table shows the capitalization of the Multimanager Aggressive Equity Portfolio as of December 31, 2013, and the Acquiring Portfolio on a pro forma combined basis as of December 31, 2013, after giving effect to the proposed Reorganization. The Acquiring Portfolio is newly organized and did not have any operations of its own as of the date of this Proxy Statement/Prospectus. Pro forma net assets may not total and net asset values per share may not recalculate due to rounding of net assets.
| Net Assets (in millions) | Net Asset Value Per Share | Shares Outstanding | ||||||||||
Multimanager Aggressive Equity Portfolio — Class A | $ | 1,029.1 | $ | 39.98 | 27,742,251 | |||||||
Adjustments | $ | — | $ | — | ||||||||
Pro forma New Multimanager Aggressive Equity Portfolio — Class IA | $ | 1,029.1 | $ | 39.98 | 27,742,251 | |||||||
Multimanager Aggressive Equity Portfolio — Class B | $ | 85.9 | $ | 39.25 | 2,188,065 | |||||||
Adjustments | $ | — | $ | — | ||||||||
Pro forma New Multimanager Aggressive Equity Portfolio — Class IB | $ | 85.9 | $ | 39.25 | 2,188,065 | |||||||
Multimanager Aggressive Equity Portfolio — Class K | $ | 8.2 | $ | 39.98 | 204,639 | |||||||
Adjustments | $ | — | $ | — | ||||||||
Pro Forma New Multimanager Aggressive Equity Portfolio — Class K | $ | 8.2 | $ | 39.98 | 204,639 | |||||||
AFTER CAREFUL CONSIDERATION, THE VIP BOARD UNANIMOUSLY APPROVED THE SHELL REORGANIZATION PLAN WITH RESPECT TO THE MULTIMANAGER AGGRESSIVE EQUITY PORTFOLIO. ACCORDINGLY, THE BOARD HAS SUBMITTED THE SHELL REORGANIZATION PLAN FOR APPROVAL BY THIS PORTFOLIO’S SHAREHOLDERS. THE BOARD RECOMMENDS THAT YOU VOTE “FOR” PROPOSAL 1.
PROPOSAL 2: APPROVAL OF THE SHELL REORGANIZATION PLAN WITH RESPECT TO THE REORGANIZATION OF THE MULTIMANAGER TECHNOLOGY PORTFOLIO INTO THE NEW MULTIMANAGER TECHNOLOGY PORTFOLIO, A NEWLY CREATED SERIES OF EQ TRUST.
This Proposal 2 requests your approval of the Shell Reorganization Plan, pursuant to which the Multimanager Technology Portfolio will be reorganized into the New Multimanager Technology Portfolio.
13
In considering whether you should approve this Proposal, you should note that:
| • | The New Multimanager Technology Portfolio is newly organized and has no assets, operating history, or performance information of its own as of the date of this Proxy Statement/Prospectus. The New Multimanager Technology Portfolio has been created as a shell series of EQ Trust solely for the purposes of acquiring the Multimanager Technology Portfolio’s assets and continuing its business investment operations, and will not conduct any investment operations until after the closing of the Reorganization. If shareholders of the Multimanager Technology Portfolio approve its Reorganization, the New Multimanager Technology Portfolio will assume and publish the operating history and performance record of the Multimanager Technology Portfolio. |
| • | The New Multimanager Technology Portfolio and the Multimanager Technology Portfolio have identical investment objectives, policies, and strategies. Each Portfolio intends to invest at least 80% of its net assets, plus borrowings for investment purposes, in equity securities of companies principally engaged in the technology sector. In addition, each Portfolio’s assets are allocated among three or more investment sub-advisers (each, an “Adviser”), each of which manages its portion of the Portfolio using a different but complementary investment strategy. A portion or portions of each Portfolio are actively managed by an Adviser (the “Active Allocated Portion” or the “Active Allocated Portions”); a portion of each Portfolio seeks to track the performance of the S&P North American Technology Sector Index (the “Index Allocated Portion”); and a portion of each Portfolio invests in exchange traded funds (“ETFs”) (the “ETF Allocated Portion”). For a detailed comparison of the Portfolios’ investment policies and strategies, see “Comparison of Investment Objectives, Policies, and Strategies” below. |
| • | The principal risks of the New Multimanager Technology Portfolio are the same as the principal risks of the Multimanager Technology Portfolio. Each Portfolio’s principal risks include equity risk, ETF risk, foreign securities risk, and technology sector risk. For a detailed comparison of each Portfolio’s principal risks, please see “Comparison of Principal Risk Factors” below. |
| • | FMG LLC (the “Manager”) serves as the investment manager and administrator for the Multimanager Technology Portfolio and will serve as the investment manager and administrator for the New Multimanager Technology Portfolio after the Reorganization. FMG LLC has received an exemptive order from the SEC that generally permits FMG LLC and each Trust’s Board of Trustees to appoint, dismiss and replace each Portfolio’s Adviser(s) and to amend the advisory agreements between FMG LLC and the Advisers without obtaining shareholder approval (except with respect to Affiliated Advisers (as defined herein)). FMG LLC has appointed three Advisers to manage distinct portions of the Multimanager Technology Portfolio. In particular, Allianz Global Investors U.S. LLC and Wellington Management Company, LLP, which are responsible for the management of portions of the Active Allocated |
14
Portion of the Multimanager Technology Portfolio, and SSgA Funds Management, Inc., which is responsible for the management of the Index Allocated Portion of the Multimanager Technology Portfolio, currently serve as Advisers to the Multimanager Technology Portfolio and it is anticipated that they will also serve as Advisers for the New Multimanager Technology Portfolio after the Reorganization. In addition, FMG LLC is responsible for the management of the ETF Allocated Portion of the Multimanager Technology Portfolio, and it is anticipated that it would also manage the ETF Allocated Portion of the New Multimanager Technology Portfolio after the Reorganization. For a detailed description of the Manager and the Advisers, please see “Additional Information about the Acquiring Portfolios — The Manager” and “ — The Advisers” below. |
| • | Class A shareholders of the Multimanager Technology Portfolio will receive Class IA shares of the New Multimanager Technology Portfolio, Class B shareholders of the Multimanager Technology Portfolio will receive Class IB shares of the New Multimanager Technology Portfolio, and Class K shareholders of the Multimanager Technology Portfolio will receive Class K Shares of the New Multimanager Technology Portfolio pursuant to the Reorganization. Shareholders will not pay any sales charges in connection with the Reorganization. Please see “Comparative Fee and Expense Tables,” “Additional Information about the Reorganizations” and “Additional Information about the Acquiring Portfolios” below for more information. |
| • | It is estimated that the annual operating expense ratios for the New Multimanager Technology Portfolio’s Class IA, Class IB, and Class K shares, for the fiscal year following the Reorganization, will be lower than those of the Multimanager Technology Portfolio’s Class A, Class B, and Class K shares, respectively, for the fiscal year ended December 31, 2013. For a more detailed comparison of the fees and expenses of the Portfolios, please see “Comparative Fee and Expense Tables” and “Additional Information about the Acquiring Portfolios” below. |
| • | The maximum management fee for each Portfolio is equal to an annual rate of 0.950% of its average daily net assets. The management fee schedule for the Multimanager Technology Portfolio is equal to an annual rate of 0.950% of the Portfolio’s average daily net assets up to and including $750 million, 0.900% of the Portfolio’s average daily net assets in excess of $750 million and up to and including $1.75 billion, 0.875% of the Portfolio’s average daily net assets in excess of $1.75 billion and up to and including $4.75 billion, 0.850% of the Portfolio’s average daily net assets in excess of $4.75 billion and up to and including $9.75 billion, and 0.825% of the Portfolio’s average daily net assets thereafter. The management fee schedule for the New Multimanager Technology Portfolio is equal to an annual rate of 0.950% of the Portfolio’s average daily net assets up to and including $2 billion, 0.900% of the Portfolio’s average daily net assets in excess of $2 billion and up to and |
15
including $3 billion, 0.875% of the Portfolio’s average daily net assets in excess of $3 billion and up to and including $6 billion, 0.850% of the Portfolio’s average daily net assets in excess of $6 billion and up to and including $11 billion, and 0.825% of the Portfolio’s average daily net assets thereafter. |
| • | The administration fee schedule for the Multimanager Technology Portfolio is equal to its proportionate share of an asset-based administration fee for the Multimanager Technology Portfolio and certain other of VIP Trust’s multi-adviser portfolios, which is equal to an annual rate of 0.15% of these portfolios’ total average daily net assets up to and including $15 billion; 0.125% of these portfolios’ total average daily net assets in excess of $15 billion up to and including $30 billion; and 0.100% of these portfolios’ total average daily net assets in excess of $30 billion, plus an annual flat fee of $32,500 if the Multimanager Technology Portfolio’s total average net assets are less than $5 billion. The administration fee schedule for the New Multimanager Technology Portfolio is equal to its proportionate share of an asset-based administration fee for the New Multimanager Technology Portfolio and certain other of EQ Trust’s portfolios, which is equal to an annual rate of 0.15% of these portfolios’ aggregate average daily net assets up to and including $20 billion; 0.110% of these portfolios’ aggregate average daily net assets in excess of $20 billion up to and including $25 billion; and 0.100% of these portfolios’ aggregate average daily net assets in excess of $25 billion, plus an annual flat fee of $32,500 if the New Multimanager Technology Portfolio’s total average net assets are less than $5 billion. For a more detailed description of the fees and expenses of the Portfolios, please see “Comparative Fee and Expense Tables” and “Additional Information about the Acquiring Portfolios” below. |
| • | Following the Reorganization, the combined Portfolio will be managed in accordance with the investment objective, policies, and strategies of the New Multimanager Technology Portfolio. It is not expected that the New Multimanager Technology Portfolio will revise any of its investment policies following the Reorganization to reflect those of the Multimanager Technology Portfolio. FMG LLC has reviewed the Multimanager Technology Portfolio’s investment objective, policies, and strategies and determined that they are substantially similar to the New Multimanager Technology Portfolio’s investment objective, policies, and strategies. Thus, FMG LLC believes that, if the Reorganization is approved, a substantial portion of the Multimanager Technology Portfolio’s holdings could be transferred to and held by the New Multimanager Technology Portfolio. However, it is expected that some of those holdings may not remain at the time of the Reorganization due to normal portfolio turnover. It is also expected that, if the Reorganization is approved, the Multimanager Technology Portfolio’s holdings that are not compatible with the New Multimanager Technology Portfolio’s investment objective, policies, and strategies will be liquidated in an orderly manner in connection with the Reorganization, and the proceeds of these sales held in |
16
temporary investments or reinvested in assets that are consistent with those investment objective, policies, and strategies. The portion of the Multimanager Technology Portfolio’s assets that will be liquidated in connection with the Reorganization will depend on market conditions and on the assessment by the Manager and the New Multimanager Technology Portfolio’s Advisers of the compatibility of those holdings with the New Multimanager Technology Portfolio’s anticipated portfolio composition and investment objective, policies, and strategies at the time of the Reorganization. The need for the Portfolio to sell investments in connection with the Reorganization may result in its selling securities at a disadvantageous time and price and could result in it realizing gains (or losses) that would not otherwise have been realized and incurring transaction costs that would not otherwise have been incurred. |
| • | The New Multimanager Technology Portfolio will bear its proportionate share (based on the fraction that the shareholder accounts of the Multimanager Technology Portfolio bears to the aggregate shareholder accounts of all Acquired Portfolios covered by the Shell Reorganization Plan, i.e., those mentioned below, at the Valuation Time) of 50% of the first $300,000 of the expenses of the Reorganizations of the Multimanager Aggressive Equity, Multimanager Technology, Multimanager Core Bond, Multimanager Mid Cap Growth, and Multimanager Mid Cap Value Portfolios, subject to an aggregate maximum of $150,000 for these Portfolios. FMG LLC generally will bear the expenses of the Reorganizations of these Portfolios in excess of this amount, subject to certain limitations. For additional information, please refer to “Additional Information About the Reorganizations — Terms of the Reorganization Plans” below. |
Comparative Fee and Expense Tables
The following tables show the fees and expenses of each class of shares of the Multimanager Technology Portfolio and the estimated pro forma fees and expenses of each class of shares of the Acquiring Portfolio after giving effect to the proposed Reorganization. Fees and expenses for the Multimanager Technology Portfolio are based on those incurred by each class of its shares for the fiscal year ended December 31, 2013. The Acquiring Portfolio is newly organized and has not had any operations of its own to date. The pro forma fees and expenses of the Acquiring Portfolio Shares assume that the Reorganization has been in effect for the year ended December 31, 2013. The tables below do not reflect any Contract-related fees and expenses, which would increase overall fees and expenses. See a Contract prospectus for a description of those fees and expenses.
17
Shareholder Fees
(fees paid directly from your investment)
Multimanager Technology | Pro Forma New Multimanager Technology | |||
Not applicable. | Not applicable. |
Annual Operating Expenses
(expenses that you may pay each year as a percentage of the value of your investment)
| Multimanager Technology Portfolio | Pro Forma New Multimanager Technology Portfolio (assuming the Reorganization is approved) | |||||||||||||||||||||||
| Class A | Class B | Class K | Class IA | Class IB | Class K | |||||||||||||||||||
Management Fee | 0.95 | % | 0.95 | % | 0.95 | % | 0.95 | % | 0.95 | % | 0.95 | % | ||||||||||||
Distribution and/or Service | 0.25 | % | 0.25 | % | None | 0.25 | % | 0.25 | % | None | ||||||||||||||
Other Expenses | 0.20 | % | 0.20 | % | 0.20 | % | 0.18 | % | 0.18 | % | 0.18 | % | ||||||||||||
Total Annual Portfolio Operating Expenses | 1.40 | % | 1.40 | % | 1.15 | % | 1.38 | % | 1.38 | % | 1.13 | % | ||||||||||||
This example is intended to help you compare the costs of investing in the Portfolios with the cost of investing in other investment options. The example assumes that:
| • | You invest $10,000 in a Portfolio for the time periods indicated; |
| • | Your investment has a 5% return each year; and |
| • | The Portfolio’s operating expenses remain the same. |
This example does not reflect any Contract-related fees and expenses, including redemption fees (if any) at the Contract level. If such fees and expenses were reflected, the total expenses would be higher. Although your actual costs may be higher or lower, based on these assumptions your costs would be:
| 1 Year | 3 Years | 5 Years | 10 Years | |||||||||||||
Multimanager Technology Portfolio | ||||||||||||||||
Class A | $ | 143 | $ | 443 | $ | 766 | $ | 1,680 | ||||||||
Class B | $ | 143 | $ | 443 | $ | 766 | $ | 1,680 | ||||||||
Class K | $ | 117 | $ | 365 | $ | 633 | $ | 1,398 | ||||||||
Pro Forma New Multimanager Technology Portfolio (assuming the Reorganization is approved) | ||||||||||||||||
Class IA | $ | 140 | $ | 437 | $ | 755 | $ | 1,657 | ||||||||
Class IB | $ | 140 | $ | 437 | $ | 755 | $ | 1,657 | ||||||||
Class K | $ | 115 | $ | 359 | $ | 622 | $ | 1,375 | ||||||||
18
The Portfolio pays transaction costs, such as commissions, when it buys and sells securities (or “turns over” its portfolio). A higher portfolio turnover rate may indicate higher transaction costs. These costs, which are not reflected in annual fund operating expenses or in the example, affect the Portfolio’s performance. During the fiscal year ended December 31, 2013, the portfolio turnover rate for the Multimanager Technology Portfolio was 64% of the average value of the Portfolio. The New Multimanager Technology Portfolio has not yet commenced operations and therefore, the New Multimanager Technology Portfolio does not have a portfolio turnover rate to report.
Comparison of Investment Objectives, Policies, and Strategies
The following table compares the investment objectives and principal investment policies and strategies of the Multimanager Technology Portfolio with those of the New Multimanager Technology Portfolio. Each Trust’s Board may change the investment objective of a Portfolio without a vote of the Portfolio’s shareholders. For more detailed information about each Portfolio’s investment strategies and risks, see Appendix C.
| Acquiring Portfolio | Acquired Portfolio | |||
| New Multimanager Technology Portfolio | Multimanager Technology Portfolio | |||
Investment Objective | Seeks to achieve long-term growth of capital. | Same. | ||
Principal Investment Strategies | Under normal circumstances, the Portfolio intends to invest at least 80% of its net assets, plus borrowings for investment purposes, in equity securities of companies principally engaged in the technology sector. Such companies include, among others, those in the internet products and services, computers, electronics, hardware and components, communications, software, e-commerce, information services, healthcare equipment and services, including medical devices, biotechnology, chemical products and synthetic materials, defense and aerospace, environmental services, nanotechnology, energy equipment and services, and electronic manufacturing services. In addition, securities of companies in the technology sector may include financial instruments that derive their value from the securities of such companies. The Portfolio may invest in companies of any size and can invest in securities of both U.S. and foreign companies. The Portfolio intends to invest primarily in common stocks, but it may also invest in other securities that an Adviser believes provide opportunities for capital growth. | Same. |
19
| Acquiring Portfolio | Acquired Portfolio | |||
| New Multimanager Technology Portfolio | Multimanager Technology Portfolio | |||
| The Manager will generally allocate the Portfolio’s assets among three or more Advisers, each of which will manage its portion of the Portfolio using different yet complementary investment strategies. | Same. | |||
Under normal circumstances, one portion of the Portfolio will be an Index Allocated Portion, one or more other portions of the Portfolio are Active Allocated Portions, and another portion will be an ETF Allocation Portion.
Under normal circumstances, the Manager allocates approximately 30% of the Portfolio’s net assets to the Index Allocated Portion, approximately 50% of net assets among the Active Allocated Portions, and approximately 20% of net assets to the ETF Allocated Portion. These percentages are targets established by the Manager; actual allocations to the Index Allocated and Active Allocated Portions may deviate from these targets by up to 20% of the Portfolio’s net assets and by up to 25% of the Portfolio’s net assets with respect to the ETF Allocated Portion, but any allocation to the ETF Allocated Portion generally shall not exceed 20% of the Portfolio’s net assets. | Same. | |||
| The Index Allocated Portion of the Portfolio seeks to track the performance (before fees and expenses) of the S&P North American Technology Sector Index with minimal tracking error. This strategy is commonly referred to as an indexing strategy. Generally, the Index Allocated Portion uses a full replication technique, although in certain instances a sampling approach may be utilized for a portion of the Index Allocated Portion. The Index Allocated Portion also may invest in ETFs that seek to track the S&P North American Technology Sector Index to obtain comparable exposure as the index without buying the underlying securities comprising the index. | Same. |
20
| Acquiring Portfolio | Acquired Portfolio | |||
| New Multimanager Technology Portfolio | Multimanager Technology Portfolio | |||
| The Active Allocated Portions may engage in active and frequent trading to achieve the investment objective. The Active Allocated Portions’ Advisers select securities based upon fundamental analysis, such as an analysis of earnings, cash flows, competitive position and management’s abilities. An Adviser may sell a security for a variety of reasons, such as to make other investments believed by the Adviser to offer superior investment opportunities. | Same. | |||
| The ETF Allocated Portion invests in ETFs that meet the investment criteria of the Portfolio as a whole. The ETFs in which the ETF Allocated Portion may invest may be changed from time to time without notice or shareholder approval. An investor in the Portfolio will bear the expenses of the Portfolio as well as the indirect expenses associated with the ETFs held by the ETF Allocated Portion. | Same. |
Comparison of Principal Risk Factors
An investment in a Portfolio is not a deposit of a bank and is not insured or guaranteed by the Federal Deposit Insurance Corporation or any other government agency. You may lose money by investing in a Portfolio. The following table compares the principal risks of an investment in each Portfolio. For an explanation of each such risk, see “Additional Information about the Reorganizations — Description of Risk Factors” below.
Risks | New Multimanager Technology Portfolio | Multimanager Technology Portfolio | ||||||
Equity Risk | X | X | ||||||
ETFs Risk | X | X | ||||||
Foreign Securities Risk | X | X | ||||||
Index Strategy Risk | X | X | ||||||
Large-Cap Company Risk | X | X | ||||||
Mid-Cap and Small-Cap Company Risk | X | X | ||||||
Portfolio Turnover Risk | X | X | ||||||
Risks of Investing in Other Investment Companies | X | X | ||||||
Sector Concentration Risk | X | X | ||||||
Technology Sector Risk | X | X | ||||||
21
Comparative Performance Information
The Acquiring Portfolio is newly organized and has no assets, operating history or performance information of its own as of the date of this Proxy Statement/Prospectus. After the Reorganization, which is subject to shareholder approval, the Acquiring Portfolio, as the successor to the Acquired Portfolio, will assume and publish the operating history and performance record of the Class A, Class B, and Class K shares of the Acquired Portfolio.
The bar charts and tables below provide some indication of the risks of investing in the Multimanager Technology Portfolio by showing changes in the Portfolio’s performance from year to year and by showing how the Portfolio’s average annual total returns for the past one year, five years, and since inception through December 31, 2013 compared to the returns of a broad-based market index. The performance of the S&P North American Technology Sector Index also is included because it more closely reflects the securities in which the Multimanager Technology Portfolio invests. The return of the broad-based market index (and any additional comparative index) shown in the right hand column below is the return of the index for the last 10 years or, if shorter, since the inception of the share class with the longest history. Past performance is not an indication of future performance.
The performance results do not reflect any Contract-related fees and expenses, which would reduce the performance results.
Multimanager Technology Portfolio - Calendar Year Total Returns (Class B)
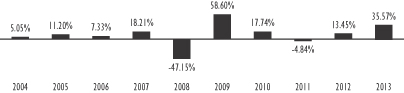
Best Quarter (% and time period) 26.92% (2003 2nd Quarter) | Worst Quarter (% and time period) -27.02% (2002 2nd Quarter) |
22
Multimanager Technology Portfolio
Average Annual Total Returns (For the periods ended December 31, 2013) | One Year | Five Years | Ten Years/ Since Inception | |||||||||
Multimanager Technology Portfolio — Class A | 35.61 | % | 22.43 | % | 8.12 | % | ||||||
Multimanager Technology Portfolio — Class B | 35.57 | % | 22.27 | % | 7.91 | % | ||||||
Multimanager Technology Portfolio — Class K (Inception Date: August 29, 2012) | 36.41 | % | N/A | 24.20 | % | |||||||
Russell 1000® Index† | 33.11 | % | 18.59 | % | 7.78 | % | ||||||
S&P North American Technology Sector Index* | 34.57 | % | 23.09 | % | 7.92 | % | ||||||
| † | The Russell 1000® Index measures the performance of approximately 1,000 of the largest companies in the Russell 3000® Index, and represents approximately 92% of the total market capitalization of the Russell 3000® Index. The Russell 3000® Index measures the performance of the 3,000 largest U.S. companies based on total market capitalization, which represents approximately 98% of the investable U.S. equity market. |
| * | The S&P North American Technology Sector Index is a modified capitalization-weighted index composed of companies involved in the technology industry |
The following table shows the capitalization of the Multimanager Technology Portfolio as of December 31, 2013, and the Acquiring Portfolio on a pro forma combined basis as of December 31, 2013 after giving effect to the proposed Reorganization. The Acquiring Portfolio is newly organized and did not have any operations of its own as of the date of this Proxy Statement/Prospectus. Pro forma net assets may not total and net asset values per share may not recalculate due to rounding of net assets.
| Net Assets (in millions) | Net Asset Value Per Share | Shares Outstanding | ||||||||||
Multimanager Technology Portfolio — Class A | $ | 15.2 | $ | 19.23 | 788,928 | |||||||
Adjustments | $ | — | $ | — | ||||||||
Pro forma Multimanager Technology Portfolio — Class IA | $ | 15.2 | $ | 19.23 | 788,928 | |||||||
Multimanager Technology Portfolio — Class B | $ | 727.7 | $ | 18.75 | 38,807,623 | |||||||
Adjustments | $ | — | $ | — | ||||||||
Pro forma New Multimanager Technology Portfolio — Class IB | $ | 727.7 | $ | 18.75 | 38,807,623 | |||||||
Multimanager Technology Portfolio — Class K | $ | 1.4 | $ | 19.37 | 72,480 | |||||||
Adjustments | $ | — | $ | — | ||||||||
Pro Forma Multimanager Technology Portfolio — Class K | $ | 1.4 | $ | 19.37 | 72,480 | |||||||
23
After careful consideration, the VIP Board unanimously approved the Shell Reorganization Plan with respect to the Multimanager Technology Portfolio. Accordingly, the Board has submitted the Shell Reorganization Plan for approval by this Portfolio’s shareholders. The Board recommends that you vote “FOR” Proposal 2.
PROPOSAL 3: APPROVAL OF THE SHELL REORGANIZATION PLAN WITH RESPECT TO THE REORGANIZATION OF THE MULTIMANAGER CORE BOND PORTFOLIO INTO THE NEW MULTIMANAGER CORE BOND PORTFOLIO, A NEWLY CREATED SERIES OF EQ TRUST.
This Proposal 3 requests your approval of the Shell Reorganization Plan, pursuant to which the Multimanager Core Bond Portfolio will be reorganized into the New Multimanager Core Bond Portfolio.
In considering whether you should approve this Proposal, you should note that:
| • | The New Multimanager Core Bond Portfolio is newly organized and has no assets, operating history, or performance information of its own as of the date of this Proxy Statement/Prospectus. The New Multimanager Core Bond Portfolio has been created as a shell series of EQ Trust solely for the purposes of acquiring the Multimanager Core Bond Portfolio’s assets and continuing its business investment operations, and will not conduct any investment operations until after the closing of the Reorganization. If shareholders of the Multimanager Core Bond Portfolio approve its Reorganization, the New Multimanager Core Bond Portfolio will assume and publish the operating history and performance record of the Multimanager Core Bond Portfolio. |
| • | The New Multimanager Core Bond Portfolio and the Multimanager Core Bond Portfolio have identical investment objectives, policies, and strategies. Each Portfolio seeks to achieve a balance of high current income and capital appreciation, consistent with a prudent level of risk. Under normal circumstances, each Portfolio intends to invest at least 80% of its net assets, plus borrowings for investment purposes, in investment grade bonds. Each Portfolio also may invest up to 50% of its assets in derivatives, including forward contracts, exchange-traded futures and options contracts on individual securities or securities indices. In addition, each Portfolio’s assets are allocated among three or more investment sub-advisers (each, an “Adviser”), each of which manages its portion of the Portfolio using a different but complementary investment strategy. A portion or portions of each Portfolio are actively managed by an Adviser (the “Active Allocated Portion” or the “Active Allocated Portions”) and a portion of each Portfolio seeks to track the performance of the Barclays Intermediate U.S. Government/Credit Index. For a detailed comparison of the Portfolios’ investment policies and strategies, see “Comparison of Investment Objectives, Policies, and Strategies” below. |
24
| • | The Portfolios have identical risk profiles. Each Portfolio’s principal risks include cash management risk, credit risk, derivatives risk, foreign securities risk, futures risk, interest rate risk, investment grade securities risk, and mortgage-backed and asset-backed securities risk. For a detailed comparison of each Portfolio’s risks, see “Comparison of Principal Risk Factors” below. |
| • | FMG LLC (the “Manager”) serves as the investment manager and administrator for the Multimanager Core Bond Portfolio and will serve as the investment manager and administrator for the New Multimanager Core Bond Portfolio after the Reorganization. FMG LLC has received an exemptive order from the SEC that generally permits FMG LLC and each Trust’s Board of Trustees to appoint, dismiss and replace each Portfolio’s Adviser(s) and to amend the advisory agreements between FMG LLC and the Advisers without obtaining shareholder approval (except with respect to Affiliated Advisers (as defined herein)). FMG LLC has appointed three Advisers to manage distinct portions of the Multimanager Core Bond Portfolio. In particular, BlackRock Financial Management, Inc. and Pacific Investment Management Company LLC, which are responsible for the management of portions of the Active Allocated Portion of the Multimanager Core Bond Portfolio, and SSgA Funds Management, Inc., which is responsible for the management of the Index Allocated Portion of the Multimanager Core Bond Portfolio, currently serve as Advisers to the Multimanager Core Bond Portfolio and it is anticipated that they will also serve as Advisers for the New Multimanager Core Bond Portfolio after the Reorganization. For a detailed description of the Manager and the Advisers, please see “Additional Information about the Acquiring Portfolios — The Manager” and “ — The Advisers” below. |
| • | Class A shareholders of the Multimanager Core Bond Portfolio will receive Class IA shares of the New Multimanager Core Bond Portfolio, Class B shareholders of the Multimanager Core Bond Portfolio will receive Class IB shares of the New Multimanager Core Bond Portfolio, and Class K shareholders of the Multimanager Core Bond Portfolio will receive Class K Shares of the New Multimanager Core Bond Portfolio pursuant to the Reorganization. Shareholders will not pay any sales charges in connection with the Reorganization. Please see “Comparative Fee and Expense Tables,” “Additional Information about the Reorganizations” and “Additional Information about the Acquiring Portfolios” below for more information. |
| • | It is estimated that the annual operating expense ratios for the New Multimanager Core Bond Portfolio’s Class IA, Class IB, and Class K shares, for the fiscal year following the Reorganization, will be lower than those of the Multimanager Core Bond Portfolio’s Class A, Class B, and Class K shares, respectively, for the fiscal year ended December 31, 2013. For a more detailed comparison of the fees and expenses of the Portfolios, please see “Comparative Fee and Expense Tables” and “Additional Information about the Acquiring Portfolios” below. |
25
| • | The maximum management fee for each Portfolio is equal to an annual rate of 0.550% of its average daily net assets. The management fee schedule for the Multimanager Core Bond Portfolio is equal to an annual rate of 0.550% of the Portfolio’s average daily net assets up to and including $1.25 billion, 0.525% of the Portfolio’s average daily net assets in excess of $1.25 billion and up to and including $2.25 billion, 0.500% of the Portfolio’s average daily net assets in excess of $2.25 billion and up to and including $3.25 billion, 0.475% of the Portfolio’s average daily net assets in excess of $3.25 billion and up to and including $5.75 billion, and 0.450% of the Portfolio’s average daily net assets thereafter. The management fee schedule for the New Multimanager Core Bond Portfolio is equal to an annual rate of 0.550% of the Portfolio’s average daily net assets up to and including $4 billion, 0.530% of the Portfolio’s average daily net assets in excess of $4 billion and up to and including $8 billion, and 0.510% of the Portfolio’s average daily net assets thereafter. |
| • | The administration fee schedule for the Multimanager Core Bond Portfolio is equal to its proportionate share of an asset-based administration fee for the Multimanager Core Bond Portfolio and certain other of VIP Trust’s multi-adviser portfolios, which is equal to an annual rate of 0.15% of these portfolios’ total average daily net assets up to and including $15 billion; 0.125% of these portfolios’ total average daily net assets in excess of $15 billion up to and including $30 billion; and 0.100% of these portfolios’ total average daily net assets in excess of $30 billion, plus an annual flat fee of $32,500 if the Multimanager Core Bond Portfolio’s total average net assets are less than $5 billion. The administration fee schedule for the New Multimanager Core Bond Portfolio is equal to its proportionate share of an asset-based administration fee for the New Multimanager Core Bond Portfolio and certain other of EQ Trust’s portfolios, which is equal to an annual rate of 0.15% of these portfolios’ aggregate average daily net assets up to and including $20 billion; 0.110% of these portfolios’ aggregate average daily net assets in excess of $20 billion up to and including $25 billion; and 0.100% of these portfolios’ aggregate average daily net assets in excess of $25 billion, plus an annual flat fee of $32,500 if the New Multimanager Core Bond Portfolio’s total average net assets are less than $5 billion. For a more detailed description of the fees and expenses of the Portfolios, please see “Comparative Fee and Expense Tables” and “Additional Information about the Acquiring Portfolios” below. |
| • | Following the Reorganization, the combined Portfolio will be managed in accordance with the investment objective, policies, and strategies of the New Multimanager Core Bond Portfolio. It is not expected that the New Multimanager Core Bond Portfolio will revise any of its investment policies following the Reorganization to reflect those of the Multimanager Core Bond Portfolio. FMG LLC has reviewed the Multimanager Core Bond Portfolio’s investment objective, policies, and strategies and determined that they are substantially similar to the New Multimanager Core Bond Portfolio’s investment |
26
objective, policies, and strategies. Thus, FMG LLC believes that, if the Reorganization is approved, a substantial portion of the Multimanager Core Bond Portfolio’s holdings could be transferred to and held by the New Multimanager Core Bond Portfolio. However, it is expected that some of those holdings may not remain at the time of the Reorganization due to normal portfolio turnover. It is also expected that, if the Reorganization is approved, the Multimanager Core Bond Portfolio’s holdings that are not compatible with the New Multimanager Core Bond Portfolio’s investment objective, policies, and strategies will be liquidated in an orderly manner in connection with the Reorganization, and the proceeds of these sales held in temporary investments or reinvested in assets that are consistent with those investment objective, policies, and strategies. The portion of the Multimanager Core Bond Portfolio’s assets that will be liquidated in connection with the Reorganization will depend on market conditions and on the assessment by the Manager and the New Multimanager Core Bond Portfolio’s Advisers of the compatibility of those holdings with the New Multimanager Core Bond Portfolio’s anticipated portfolio composition and investment objective, policies, and strategies at the time of the Reorganization. The need for the Portfolio to sell investments in connection with the Reorganization may result in its selling securities at a disadvantageous time and price and could result in it realizing gains (or losses) that would not otherwise have been realized and incurring transaction costs that would not otherwise have been incurred. |
| • | The New Multimanager Core Bond Portfolio will bear its proportionate share (based on the fraction that the shareholder accounts of the Multimanager Core Bond Portfolio bears to the aggregate shareholder accounts of all Acquired Portfolios covered by the Shell Reorganization Plan, i.e., those mentioned below, at the Valuation Time) of 50% of the first $300,000 of the expenses of the Reorganizations of the Multimanager Aggressive Equity, Multimanager Technology, Multimanager Core Bond, Multimanager Mid Cap Growth, and Multimanager Mid Cap Value Portfolios, subject to an aggregate maximum of $150,000 for these Portfolios. FMG LLC generally will bear the expenses of the Reorganizations of these Portfolios in excess of this amount, subject to certain limitations. For additional information, please refer to “Additional Information About the Reorganizations — Terms of the Reorganization Plans” below. |
27
Comparative Fee and Expense Tables
The following tables show the fees and expenses of each class of shares of the Multimanager Core Bond Portfolio and the estimated pro forma fees and expenses of each class of shares of the Acquiring Portfolio after giving effect to the proposed Reorganization. Fees and expenses for the Multimanager Core Bond Portfolio are based on those incurred by each class of its shares for the fiscal year ended December 31, 2013. The Acquiring Portfolio is newly organized and has not had any operations of its own to date. The pro forma fees and expenses of the Acquiring Portfolio Shares assume that the Reorganization has been in effect for the year ended December 31, 2013. The tables below do not reflect any Contract-related fees and expenses, which would increase overall fees and expenses. See a Contract prospectus for a description of those fees and expenses.
Shareholder Fees
(fees paid directly from your investment)
Multimanager Core Bond Portfolio | Pro Forma New Multimanager Core Bond Portfolio (assuming the Reorganization is approved) | |||
Not applicable. | Not applicable. |
Annual Operating Expenses
(expenses that you may pay each year as a percentage of the value of your investment)
| Multimanager Core Bond Portfolio | Pro Forma New Multimanager Core Bond Portfolio (assuming the Reorganization is approved) | |||||||||||||||||||||||
| Class A | Class B | Class K | Class IA | Class IB | Class K | |||||||||||||||||||
Management Fee | 0.54 | % | 0.54 | % | 0.54 | % | 0.55 | % | 0.55 | % | 0.55 | % | ||||||||||||
Distribution and/or Service Fees (12b-1 fees) | 0.25 | % | 0.25 | % | None | 0.25 | % | 0.25 | % | None | ||||||||||||||
Other Expenses | 0.21 | % | 0.21 | % | 0.21 | % | 0.19 | % | 0.19 | % | 0.19 | % | ||||||||||||
Total Annual Portfolio Operating Expenses | 1.00 | % | 1.00 | % | 0.75 | % | 0.99 | % | 0.99 | % | 0.74 | % | ||||||||||||
28
This example is intended to help you compare the costs of investing in the Portfolios with the cost of investing in other investment options. The example assumes that:
| • | You invest $10,000 in a Portfolio for the time periods indicated; |
| • | Your investment has a 5% return each year; and |
| • | The Portfolio’s operating expenses remain the same. |
This example does not reflect any Contract-related fees and expenses, including redemption fees (if any) at the Contract level. If such fees and expenses were reflected, the total expenses would be higher. Although your actual costs may be higher or lower, based on these assumptions your costs would be:
| 1 Year | 3 Years | 5 Years | 10 Years | |||||||||||||
Multimanager Core Bond Portfolio | ||||||||||||||||
Class A | $ | 102 | $ | 318 | $ | 552 | $ | 1,225 | ||||||||
Class B | $ | 102 | $ | 318 | $ | 552 | $ | 1,225 | ||||||||
Class K | $ | 77 | $ | 240 | $ | 417 | $ | 930 | ||||||||
Pro Forma New Multimanager Core Bond Portfolio (assuming the Reorganization is approved) | ||||||||||||||||
Class IA | $ | 101 | $ | 315 | $ | 547 | $ | 1,213 | ||||||||
Class IB | $ | 101 | $ | 315 | $ | 547 | $ | 1,213 | ||||||||
Class K | $ | 76 | $ | 237 | $ | 411 | $ | 918 | ||||||||
The Portfolio pays transaction costs, such as commissions, when it buys and sells securities (or “turns over” its portfolio). A higher portfolio turnover rate may indicate higher transaction costs. These costs, which are not reflected in annual fund operating expenses or in the example, affect the Portfolio’s performance. During the fiscal year ended December 31, 2013, the portfolio turnover rate for the Multimanager Core Bond Portfolio was 410% of the average value of the Portfolio. The New Multimanager Core Bond Portfolio has not yet commenced operations and therefore, the New Multimanager Core Bond Portfolio does not have a portfolio turnover rate to report.
29
Comparison of Investment Objectives, Policies, and Strategies
The following table compares the investment objectives and principal investment policies and strategies of the Multimanager Core Bond Portfolio with those of the New Multimanager Core Bond Portfolio. Each Trust’s Board may change the investment objective of a Portfolio without a vote of the Portfolio’s shareholders. For more detailed information about each Portfolio’s investment strategies and risks, see Appendix C.
| Acquiring Portfolio | Acquired Portfolio | |||
| New Multimanager Core Bond Portfolio | Multimanager Core Bond Portfolio | |||
Investment Objective | Seeks to achieve a balance of high current income and capital appreciation, consistent with a prudent level of risk. | Same. | ||
Principal Investment Strategies | Under normal circumstances, the Portfolio intends to invest at least 80% of its net assets, plus borrowings for investment purposes, in investment grade bonds. For purposes of this investment policy, a debt security is considered a “bond.” Debt securities represent an issuer’s obligation to repay a loan of money that generally pays interest to the holder. Bonds, notes and debentures are examples of debt securities. The Portfolio invests primarily in U.S. government and corporate debt securities. | Same. | ||
The Manager will generally allocate the Portfolio’s assets among three or more Advisers, each of which will manage its portion of the Portfolio using different yet complementary investment strategies. Under normal circumstances, one portion of the Portfolio will be an Index Allocated Portion and the other portions of the Portfolio will be Active Allocated Portions.
Under normal circumstances, the Manager anticipates allocating approximately 50% of the Portfolio’s net assets to the Index Allocated Portion and the remaining 50% of net assets among the Active Allocated Portions. These percentages are targets established by the Manager and actual allocations between the portions may deviate from these targets by up to 20% of the Portfolio’s net assets. | Same. |
30
| Acquiring Portfolio | Acquired Portfolio | |||
| New Multimanager Core Bond Portfolio | Multimanager Core Bond Portfolio | |||
| The Index Allocated Portion of the Portfolio seeks to track the performance (before fees and expenses and including reinvestment of coupon payments) of the Barclays Intermediate U.S. Government/ Credit Index (“Government/Credit Index”) with minimal tracking error. This strategy is commonly referred to as an indexing strategy. The Government/Credit Index covers U.S. dollar denominated, investment grade, fixed-rate securities, which include U.S. Treasury and government-related, corporate, credit and agency fixed-rate debt securities. Generally, the Index Allocated Portion uses a sampling technique. | Same. | |||
| The Active Allocated Portions may invest in debt securities of U.S. and foreign issuers, including issuers located in emerging markets. The Active Allocated Portions’ investments may include government securities, corporate bonds, bonds of foreign issuers (including those denominated in foreign currencies or U.S. dollars), commercial and residential mortgage-backed securities, and asset-backed securities. Foreign currency exposure (from non-U.S. dollar-denominated securities or currencies) normally will be limited to 10% of the Portfolio’s total assets. The Active Allocated Portions may engage in active and frequent trading to achieve the Portfolio’s investment objective. Securities are purchased for the Active Allocated Portions when an Adviser determines that they have the potential for above-average total return. An Adviser may sell a security for a variety of reasons, such as to make other investments believed by the Adviser to offer superior investment opportunities. | Same. |
31
| Acquiring Portfolio | Acquired Portfolio | |||
| New Multimanager Core Bond Portfolio | Multimanager Core Bond Portfolio | |||
| The Portfolio may purchase bonds of any maturity, but generally the Portfolio’s overall effective duration will be of an intermediate-term nature (similar to that of three- to seven-year U.S. Treasury notes) and will generally have a comparable duration in the range of the Government/ Credit Index (approximately 3.91 years as of December 31, 2012) and the Barclays U.S. Aggregate Bond Index (approximately 5.06 years as of December 31, 2012) as calculated by the Advisers. The Portfolio also may use financial instruments such as futures and options to manage duration. Duration measures the sensitivity of the value of a bond or bond portfolio to changes in interest rates. Typically, a bond portfolio with a low (short) duration means that its value is less sensitive to interest rate changes, while a bond portfolio with a high (long) duration is more sensitive. The Portfolio may invest up to 50% of its assets in derivatives. It is anticipated that the Portfolio’s derivative instruments will consist primarily of forward contracts, exchange-traded futures and options contracts on individual securities or securities indices, but the Portfolio also may utilize other types of derivatives. The Portfolio’s investments in derivatives may be deemed to involve the use of leverage because the Portfolio is not required to invest the full market value of the contract upon entering into the contract but participates in gains and losses on the full contract price. The use of derivatives also may be deemed to involve the use of leverage because the heightened price sensitivity of some derivatives to market changes may magnify the Portfolio’s gain or loss. | Same. |
32
Comparison of Principal Risk Factors
An investment in a Portfolio is not a deposit of a bank and is not insured or guaranteed by the Federal Deposit Insurance Corporation or any other government agency. You may lose money by investing in a Portfolio. The following table compares the principal risks of an investment in each Portfolio. For an explanation of each such risk, see “Additional Information about the Reorganizations — Description of Risk Factors” below.
Risks | New Multimanager Core Bond Portfolio | Multimanager Core Bond Portfolio | ||||||
Credit Risk | X | X | ||||||
Derivatives Risk | X | X | ||||||
Foreign Securities Risk | X | X | ||||||
Cash Management Risk | X | X | ||||||
Currency Risk | X | X | ||||||
Emerging Markets Risk | X | X | ||||||
Futures Contract Risk | X | X | ||||||
Index Strategy Risk | X | X | ||||||
Interest Rate Risk | X | X | ||||||
Investment Grade Securities Risk | X | X | ||||||
Leverage Risk | X | X | ||||||
Mortgage-Backed and Asset-Backed Securities Risk | X | X | ||||||
Portfolio Turnover Risk | X | X | ||||||
Comparative Performance Information
The Acquiring Portfolio is newly organized and has no assets, operating history or performance information of its own as of the date of this Proxy Statement/Prospectus. After the Reorganization, which is subject to shareholder approval, the Acquiring Portfolio, as the successor to the Acquired Portfolio, will assume and publish the operating history and performance record of the Class A, Class B, and Class K shares of the Acquired Portfolio.
The bar charts and tables below provide some indication of the risks of investing in the Multimanager Core Bond Portfolio by showing changes in the Portfolio’s performance from year to year and by showing how the Portfolios’ average annual total returns for the past one year, five years and since inception through December 31, 2013 compared to the returns of a broad-based market index. The return of the broad-based market index (and any additional comparative index) shown in the right hand column below is the return of the index for the last 10 years or, if shorter, since the inception of the share class with the longest history. Past performance is not an indication of future performance.
The performance results do not reflect any Contract-related fees and expenses, which would reduce the performance results.
33
Multimanager Core Bond Portfolio - Calendar Year Total Returns (Class B)

Best Quarter (% and time period) 4.34% (2009 3rd Quarter) | Worst Quarter (% and time period) -2.37% (2008 3rd Quarter) | |||||||||||||||||
Multimanager Core Bond Portfolio
Average Annual Total Returns | One Year | Five Years | Ten Years/ Since Inception | |||||||||
Multimanager Core Bond Portfolio — Class A | -2.33% | 4.79% | 4.33% | |||||||||
Multimanager Core Bond Portfolio — Class B | -2.31% | 4.63% | 4.12% | |||||||||
Multimanager Core Bond Portfolio — Class K | -2.08% | N/A | 2.00% | |||||||||
Barclays Intermediate U.S. Government/Credit Index* | -0.86% | 3.96% | 4.09% | |||||||||
| * | The Barclays Intermediate U.S. Government/Credit Index is an unmanaged, market value weighted index which includes Treasuries, government-related issues (i.e., agency, sovereign, supranational, and local authority debt), and corporates with maturities of one to 10 years. |
34
The following table shows the capitalization of the Multimanager Core Bond Portfolio as of December 31, 2013, and the Acquiring Portfolio on a pro forma combined basis as of December 31, 2013 after giving effect to the proposed Reorganization. The Acquiring Portfolio is newly organized and did not have any operations of its own as of the date of this Proxy Statement/Prospectus. Pro forma net assets may not total and net asset values per share may not recalculate due to rounding of net assets.
| Net Assets (in millions) | Net Asset Value Per Share | Shares Outstanding | ||||||||||
Multimanager Core Bond Portfolio — Class A | $ | 37.6 | $ | 9.87 | 3,805,313 | |||||||
Adjustments | $ | — | $ | — | ||||||||
Pro forma New Multimanager Core Bond Portfolio — Class IA | $ | 37.6 | $ | 9.87 | 3,805,313 | |||||||
Multimanager Core Bond Portfolio — Class B | $ | 291.7 | $ | 9.89 | 29,482,122 | |||||||
Adjustments | $ | — | $ | — | ||||||||
Pro forma New Multimanager Core Bond Portfolio — Class IB | $ | 291.7 | $ | 9.89 | 29,482,122 | |||||||
Multimanager Core Bond Portfolio — Class K | $ | 373.0 | $ | 9.87 | 37,775,661 | |||||||
Adjustments | $ | — | $ | — | ||||||||
Pro Forma New Multimanager Core Bond Portfolio — Class K | $ | 373.0 | $ | 9.87 | 37,775,661 | |||||||
AFTER CAREFUL CONSIDERATION, THE VIP BOARD UNANIMOUSLY APPROVED THE SHELL REORGANIZATION PLAN WITH RESPECT TO THE MULTIMANAGER CORE BOND PORTFOLIO. ACCORDINGLY, THE BOARD HAS SUBMITTED THE SHELL REORGANIZATION PLAN FOR APPROVAL BY THIS PORTFOLIO’S SHAREHOLDERS. THE BOARD RECOMMENDS THAT YOU VOTE “FOR” PROPOSAL 3.
PROPOSAL 4: APPROVAL OF THE SHELL REORGANIZATION PLAN WITH RESPECT TO THE REORGANIZATION OF THE MULTIMANAGER MID CAP GROWTH PORTFOLIO INTO THE NEW MULTIMANAGER MID CAP GROWTH PORTFOLIO, A NEWLY CREATED SERIES OF EQ TRUST.
This Proposal 4 requests your approval of the Shell Reorganization Plan, pursuant to which the Multimanager Mid Cap Growth Portfolio will be reorganized into the New Multimanager Mid Cap Growth Portfolio.
35
In considering whether you should approve this Proposal, you should note that:
| • | The New Multimanager Mid Cap Growth Portfolio is newly organized and has no assets, operating history, or performance information of its own as of the date of this Proxy Statement/Prospectus. The New Multimanager Mid Cap Growth Portfolio has been created as a shell series of EQ Trust solely for the purposes of acquiring the Multimanager Mid Cap Growth Portfolio’s assets and continuing its business investment operations, and will not conduct any investment operations until after the closing of the Reorganization. If shareholders of the Multimanager Mid Cap Growth Portfolio approve its Reorganization, the New Multimanager Mid Cap Growth Portfolio will assume and publish the operating history and performance record of the Multimanager Mid Cap Growth Portfolio. |
| • | The New Multimanager Mid Cap Growth Portfolio and the Multimanager Mid Cap Growth Portfolio have substantially identical investment objectives, policies, and strategies. Each Portfolio seeks to achieve long-term growth of capital by investing primarily in the securities of mid-capitalization growth companies. In addition, each Portfolio’s assets are allocated among three or more investment sub-advisers (each, an “Adviser”), each of which manages its portion of the Portfolio using a different but complementary investment strategy. A portion or portions of each Portfolio are actively managed by an Adviser (the “Active Allocated Portion” or the “Active Allocated Portions”) and a portion of each Portfolio seeks to track the performance of the Russell 2500™ Growth Index (the “Index Allocated Portion”). There are, however, differences in the Portfolios’ primary investment policies and strategies of which you should be aware. |
The primary difference between the two Portfolios is that FMG LLC currently may limit the equity exposure of the Multimanager Mid Cap Growth Portfolio at times when market volatility is increasing above specific thresholds by reducing investments in securities, shorting or selling long futures and options positions on an index, increasing cash levels, and/or shorting and index. FMG LLC will not employ this volatility management strategy in managing the New Multimanager Mid Cap Growth Portfolio. However, because it currently employs the volatility management strategy described above, it is anticipated that the Multimanager Mid Cap Growth Portfolio will discontinue using this strategy effective on or before April 30, 2014, and therefore at the time of the Reorganization it is expected that the investment objectives, policies, and strategies of each Portfolio will be identical. For a detailed comparison of the Portfolios’ investment policies and strategies, see “Comparison of Investment Objectives, Policies, and Strategies” below.
| • | The Portfolios have substantially similar risk profiles, although there are differences of which you should be aware. Each Portfolio’s principal risks include equity risk, foreign securities risk, and mid-cap company risk. However, the Multimanager Mid Cap Growth Portfolio also is subject to cash |
36
management risk, custom benchmark risk, derivatives risk, futures contract risk, leverage risk, short position risk, and volatility management risk as principal risks, which are not principal risks of the New Multimanager Mid Cap Growth Portfolio. For a detailed comparison of each Portfolio’s risks, see “Comparison of Principal Risk Factors” below. |
| • | FMG LLC (the “Manager”) serves as the investment manager and administrator for the Multimanager Mid Cap Growth Portfolio and will serve as the investment manager and administrator for the New Multimanager Mid Cap Growth Portfolio after the Reorganization. FMG LLC has received an exemptive order from the SEC that generally permits FMG LLC and each Trust’s Board of Trustees to appoint, dismiss and replace each Portfolio’s Adviser(s) and to amend the advisory agreements between FMG LLC and the Advisers without obtaining shareholder approval (except with respect to Affiliated Advisers (as defined herein)). FMG LLC has appointed four Advisers to manage distinct portions of the assets of the Multimanager Mid Cap Growth Portfolio. In particular, BlackRock Investment Management, LLC, which is responsible for the management of the Index Allocated Portion of the Multimanager Mid Cap Growth Portfolio, and AllianceBernstein L.P., Franklin Advisers, Inc., and Wellington Management Company, LLP, which are responsible for the management of Active Allocated Portions of the Multimanager Mid Cap Growth Portfolio, currently serve as Advisers to the Multimanager Mid Cap Growth Portfolio and it is anticipated that they will also serve as Advisers to the New Multimanager Mid Cap Growth Portfolio after the Reorganization. For a detailed description of the Manager and the Advisers, please see “Additional Information about the Acquiring Portfolios — The Manager” and “ — The Advisers” below. |
| • | Class A shareholders of the Multimanager Mid Cap Growth Portfolio will receive Class IA shares of the New Multimanager Mid Cap Growth Portfolio, Class B shareholders of the Multimanager Mid Cap Growth Portfolio will receive Class IB shares of the New Multimanager Mid Cap Growth Portfolio, and Class K shareholders of the Multimanager Mid Cap Growth Portfolio will receive Class K shares of the New Multimanager Mid Cap Growth Portfolio pursuant to the Reorganization. Shareholders will not pay any sales charges in connection with the Reorganization. Please see “Comparative Fee and Expense Tables,” “Additional Information about the Reorganizations” and “Additional Information about the Acquiring Portfolios” below for more information. |
| • | It is estimated that the annual operating expense ratios for the New Multimanager Mid Cap Growth Portfolio’s Class IA, Class IB, and Class K shares, for the fiscal year following the Reorganization, will be the same as those of the Multimanager Mid Cap Growth Portfolio’s Class A, Class B, and Class K shares, respectively, for the fiscal year ended December 31, 2013. For a more detailed comparison of the fees and expenses of the Portfolios, please see “Comparative Fee and Expense Tables” and “Additional Information about the Acquiring Portfolios” below. |
37
| • | The maximum management fee for each Portfolio is equal to an annual rate of 0.800% of its average daily net assets. The management fee schedule for the Multimanager Mid Cap Growth Portfolio is equal to an annual rate of 0.800% of the Portfolio’s average daily net assets up to and including $750 million, 0.750% of the Portfolio’s average daily net assets in excess of $750 million and up to and including $1.75 billion, 0.725% of the Portfolio’s average daily net assets in excess of $1.75 billion and up to and including $4.75 billion, 0.700% of the Portfolio’s average daily net assets in excess of $4.75 billion and up to and including $9.75 billion, and 0.675% of the Portfolio’s average daily net assets thereafter. The management fee schedule for the New Multimanager Mid Cap Growth Portfolio is equal to an annual rate of 0.800% of the Portfolio’s average daily net assets up to and including $2 billion, 0.750% of the Portfolio’s average daily net assets in excess of $2 billion and up to and including $3 billion, 0.725% of the Portfolio’s average daily net assets in excess of $3 billion and up to and including $6 billion, 0.700% of the Portfolio’s average daily net assets in excess of $6 billion and up to and including $11 billion, and 0.675% of the Portfolio’s average daily net assets thereafter. |
| • | The administration fee schedule for the Multimanager Mid Cap Growth Portfolio is equal to its proportionate share of an asset-based administration fee for the Multimanager Mid Cap Growth Portfolio and certain other of VIP Trust’s multi-adviser portfolios, which is equal to an annual rate of 0.15% of these portfolios’ total average daily net assets up to and including $15 billion; 0.125% of these portfolios’ total average daily net assets in excess of $15 billion up to and including $30 billion; and 0.100% of these portfolios’ total average daily net assets in excess of $30 billion, plus an annual flat fee of $32,500 if the Multimanager Mid Cap Growth Portfolio’s total average net assets are less than $5 billion. The administration fee schedule for the New Multimanager Mid Cap Growth Portfolio is equal to its proportionate share of an asset-based administration fee for the New Multimanager Mid Cap Growth Portfolio and certain other of EQ Trust’s portfolios, which is equal to an annual rate of 0.15% of these portfolios’ aggregate average daily net assets up to and including $20 billion; 0.110% of these portfolios’ aggregate average daily net assets in excess of $20 billion up to and including $25 billion; and 0.100% of these portfolios’ aggregate average daily net assets in excess of $25 billion, plus an annual flat fee of $32,500 if the New Multimanager Mid Cap Growth Portfolio’s total average net assets are less than $5 billion. For a more detailed description of the fees and expenses of the Portfolios, please see “Comparative Fee and Expense Tables” and “Additional Information about the Acquiring Portfolios” below. |
| • | Following the Reorganization, the combined Portfolio will be managed in accordance with the investment objective, policies, and strategies of the New Multimanager Mid Cap Growth Portfolio. It is not expected that the New Multimanager Mid Cap Growth Portfolio will revise any of its investment policies following the Reorganization to reflect those of the Multimanager |
38
Mid Cap Growth Portfolio. FMG LLC has reviewed the Multimanager Mid Cap Growth Portfolio’s investment objective, policies, and strategies and determined that they are substantially similar to the New Multimanager Mid Cap Growth Portfolio’s investment objective, policies, and strategies. Thus, FMG LLC believes that, if the Reorganization is approved, a substantial portion of the Multimanager Mid Cap Growth Portfolio’s holdings could be transferred to and held by the New Multimanager Mid Cap Growth Portfolio. However, it is expected that some of those holdings may not remain at the time of the Reorganization due to normal portfolio turnover. It is also expected that, if the Reorganization is approved, the Multimanager Mid Cap Growth Portfolio’s holdings that are not compatible with the New Multimanager Mid Cap Growth Portfolio’s investment objective, policies, and strategies will be liquidated in an orderly manner in connection with the Reorganization, and the proceeds of these sales held in temporary investments or reinvested in assets that are consistent with those investment objective, policies, and strategies. The portion of the Multimanager Mid Cap Growth Portfolio’s assets that will be liquidated in connection with the Reorganization will depend on market conditions and on the assessment by the Manager and the New Multimanager Mid Cap Growth Portfolio’s Advisers of the compatibility of those holdings with the New Multimanager Mid Cap Growth Portfolio’s anticipated portfolio composition and investment objective, policies, and strategies at the time of the Reorganization. The need for the Portfolio to sell investments in connection with the Reorganization may result in its selling securities at a disadvantageous time and price and could result in it realizing gains (or losses) that would not otherwise have been realized and incurring transaction costs that would not otherwise have been incurred. |
| • | The New Multimanager Mid Cap Growth Portfolio will bear its proportionate share (based on the fraction that the shareholder accounts of the Multimanager Mid Cap Growth Portfolio bears to the aggregate shareholder accounts of all Acquired Portfolios covered by the Shell Reorganization Plan, i.e., those mentioned below, at the Valuation Time) of 50% of the first $300,000 of the expenses of the Reorganizations of the Multimanager Aggressive Equity, Multimanager Technology, Multimanager Core Bond, Multimanager Mid Cap Growth, and Multimanager Mid Cap Value Portfolios, subject to an aggregate maximum of $150,000 for these Portfolios. FMG LLC generally will bear the expenses of the Reorganizations of these Portfolios in excess of this amount, subject to certain limitations. For additional information, please refer to “Additional Information About the Reorganizations — Terms of the Reorganization Plans” below. |
39
Comparative Fee and Expense Tables
The following tables show the fees and expenses of each class of shares of the Multimanager Mid Cap Growth Portfolio and the estimated pro forma fees and expenses of each class of shares of the Acquiring Portfolio after giving effect to the proposed Reorganization. The Acquiring Portfolio is newly organized and has not had any operations of its own to date. Fees and expenses for the Multimanager Mid Cap Growth Portfolio are based on those incurred by each class of its shares for the fiscal year ended December 31, 2013. The pro forma fees and expenses of the Acquiring Portfolio Shares assume that the Reorganization has been in effect for the year ended December 31, 2013. The tables below do not reflect any Contract-related fees and expenses, which would increase overall fees and expenses. See a Contract prospectus for a description of those fees and expenses.
Shareholder Fees
(fees paid directly from your investment)
Multimanager Mid Cap | Pro Forma New Multimanager Mid Cap Growth Portfolio (assuming the Reorganization is approved) | |||
Not applicable. | Not applicable. |
Annual Operating Expenses
(expenses that you may pay each year as a percentage of the value of your investment)
| Multimanager Mid Cap Growth Portfolio | Pro Forma New Multimanager Mid Cap Growth Portfolio (assuming the Reorganization is approved) | |||||||||||||||||||||||
| Class A | Class B | Class K | Class IA | Class IB | Class K | |||||||||||||||||||
Management Fee | 0.80 | % | 0.80 | % | 0.80 | % | 0.80 | % | 0.80 | % | 0.80 | % | ||||||||||||
Distribution and/or Service | 0.25 | % | 0.25 | % | None | 0.25 | % | 0.25 | % | None | ||||||||||||||
Other Expenses | 0.27 | % | 0.23 | % | 0.27 | % | 0.26 | % | 0.26 | % | 0.26 | % | ||||||||||||
Total Annual Portfolio Operating Expenses | 1.32 | % | 1.28 | % | 1.07 | % | 1.31 | % | 1.31 | % | 1.06 | % | ||||||||||||
Fee Waiver and/or Expense Reimbursement† | -0.07 | % | -0.03 | % | -0.07 | % | -0.06 | % | -0.06 | % | -0.06 | % | ||||||||||||
Total Annual Portfolio Operating Expenses After Fee Waiver and/or Reimbursement | 1.25 | % | 1.25 | % | 1.00 | % | 1.25 | % | 1.25 | % | 1.00 | % | ||||||||||||
| † | Pursuant to a contract, AXA Equitable Funds Management Group, LLC has agreed to make payments or waive its management, administrative and other fees to limit the expenses of the Portfolio through April 30, 2015 (unless the Board of Trustees consents to an earlier revision or termination of this arrangement) (“Expense Limitation Agreement”) so that the annual operating expenses of the Portfolio (exclusive of taxes, interest, brokerage commissions, capitalized expenses, fees and expenses of other |
40
investment companies in which the Portfolio invests, dividend and interest expenses on securities sold short, and extraordinary expenses) do not exceed an annual rate of average daily net assets of 1.25% for Class A and Class B shares and 1.00% for Class K shares of the Portfolio. The Expense Limitation Agreement may be terminated by AXA Equitable Funds Management Group, LLC at any time after April 30, 2015. |
This example is intended to help you compare the costs of investing in the Portfolios with the cost of investing in other investment options. The example assumes that:
| • | You invest $10,000 in a Portfolio for the time periods indicated; |
| • | Your investment has a 5% return each year; |
| • | The Portfolio’s operating expenses remain the same; and |
| • | The Expense Limitation Arrangement is not renewed. |
This example does not reflect any Contract-related fees and expenses, including redemption fees (if any) at the Contract level. If such fees and expenses were reflected, the total expenses would be higher. Although your actual costs may be higher or lower, based on these assumptions your costs would be:
| 1 Year | 3 Years | 5 Years | 10 Years | |||||||||||||
Multimanager Mid Cap Growth Portfolio | ||||||||||||||||
Class A | $ | 127 | $ | 411 | $ | 717 | $ | 1,584 | ||||||||
Class B | $ | 127 | $ | 403 | $ | 699 | $ | 1,543 | ||||||||
Class K | $ | 102 | $ | 333 | $ | 583 | $ | 1,299 | ||||||||
Pro Forma New Multimanager Mid Cap Growth Portfolio (assuming the Reorganization is approved) | ||||||||||||||||
Class IA | $ | 127 | $ | 409 | $ | 712 | $ | 1,574 | ||||||||
Class IB | $ | 127 | $ | 409 | $ | 712 | $ | 1,574 | ||||||||
Class K | $ | 102 | $ | 331 | $ | 579 | $ | 1,289 | ||||||||
Each Portfolio pays transaction costs, such as commissions, when it buys and sells securities (or “turns over” its portfolio). A higher portfolio turnover rate may indicate higher transaction costs. These costs, which are not reflected in annual fund operating expenses or in the example, affect a Portfolio’s performance. During the fiscal year ended December 31, 2013, the portfolio turnover rate for the Multimanager Mid Cap Growth Portfolio was 66% of the average value of the Portfolio. The New Multimanager Mid Cap Growth Portfolio has not yet commenced operations and therefore, the New Multimanager Mid Cap Growth Portfolio does not have a portfolio turnover rate to report.
Comparison of Investment Objectives, Policies, and Strategies
The following table compares the investment objectives and principal investment policies and strategies of the Multimanager Mid Cap Growth Portfolio with those of the New
41
Multimanager Mid Cap Growth Portfolio. Each Trust’s Board may change the investment objective of a Portfolio without a vote of the Portfolio’s shareholders. For more detailed information about each Portfolio’s investment strategies and risks, see Appendix C.
| Acquiring Portfolio | Acquired Portfolio | |||
| New Multimanager Mid Cap Growth Portfolio | Multimanager Mid Cap Growth Portfolio | |||
Investment Objective | Seeks to achieve long-term growth of capital. | Seeks to achieve long-term growth of capital with an emphasis on risk-adjusted returns and managing volatility in the Portfolio. However, effective on or before April 30, 2014, the investment objective of this Portfolio will be changed so that it is identical to the investment objective of the Acquiring Portfolio. | ||
Principal Investment Strategies | Under normal circumstances, the Portfolio intends to invest at least 80% of its net assets, plus borrowings for investment purposes, in equity securities of U.S. mid-capitalization companies. For purposes of this Portfolio, mid-capitalization companies generally are companies with market capitalization within the range of companies in the Russell 2500™ Index or the Russell Midcap® Index at the time of investment (as of December 31, 2012, the market capitalization of the companies in the Russell 2500™ Index was between $27.9 million and $10.1 billion and the market capitalization of the companies in the Russell Midcap® Index was between $319.4 million and $25.2 billion). In addition, securities of mid-capitalization companies may include financial instruments that derive their value from the securities of such companies. The sizes of the companies in these indexes change with market conditions, which can result in changes to the market capitalization ranges of companies in the indexes. The Portfolio intends to invest primarily in common stocks, but it may also invest in other securities that an Adviser believes provide opportunities for capital growth. | Same. |
42
| Acquiring Portfolio | Acquired Portfolio | |||
| New Multimanager Mid Cap Growth Portfolio | Multimanager Mid Cap Growth Portfolio | |||
The Manager will generally allocate the Portfolio’s assets among three or more Advisers, each of which will manage its portion of the Portfolio using different yet complementary investment strategies. Under normal circumstances, one portion of the Portfolio will be an Index Allocated Portion and the other portions of the Portfolio will be Active Allocated Portions.
Under normal circumstances, the Manager anticipates allocating approximately 50% of the Portfolio’s net assets to the Index Allocated Portion and the remaining 50% of net assets among the Active Allocated Portions. These percentages are targets established by the Manager and actual allocations between the portions may deviate from these targets by up to 20% of the Portfolio’s net assets. | Same. | |||
| The Index Allocated Portion of the Portfolio seeks to track the performance (before fees and expenses) of the Russell 2500™ Growth Index with minimal tracking error. This strategy is commonly referred to as an indexing strategy. Generally, the Index Allocated Portion utilizes a full replication technique, although in certain instances a sampling approach may be utilized for a portion of the Index Allocated Portion. | Same. | |||
| No corresponding strategy. | The Manager also may utilize futures and options, such as exchange traded futures and options contracts on securities indices, to manage equity exposure. When market volatility is increasing above specific thresholds set for the Portfolio, the Manager may limit equity exposure either by reducing investments in securities, shorting or selling long futures and options positions on an index, increasing cash levels, and/or shorting an index. However, effective on or before April 30, 2014, the Portfolio will no longer utilize this strategy. |
43
| Acquiring Portfolio | Acquired Portfolio | |||
| New Multimanager Mid Cap Growth Portfolio | Multimanager Mid Cap Growth Portfolio | |||
No corresponding strategy. | The Portfolio may invest up to 25% of its assets in derivatives. It is anticipated that the Portfolio’s derivative instruments will consist primarily of exchange-traded futures and options contracts on securities indices, but the Portfolio also may utilize other types of derivatives. The Portfolio may maintain a significant percentage of its assets in cash and cash equivalent instruments, some of which may serve as margin or collateral for the Portfolio’s obligations under derivative transactions. However, effective on or before April 30 , 2014, the Portfolio will no longer utilize this strategy. | |||
| Each Active Allocated Portion utilizes an aggressive, growth-oriented investment style and invests primarily in equity securities of companies that, in the view of the Adviser, are either in or entering into the growth phase of their business cycle. An Adviser may sell a security for a variety of reasons, such as to make other investments believed by the Adviser to offer superior investment opportunities. | Same. |
Comparison of Principal Risk Factors
An investment in a Portfolio is not a deposit of a bank and is not insured or guaranteed by the Federal Deposit Insurance Corporation or any other government agency. You may lose money by investing in a Portfolio. The following table compares the principal risks of an investment in each Portfolio. For an explanation of each such risk, see “Additional Information about the Reorganizations — Description of Risk Factors” below.
Risks | New Multimanager Mid Cap Growth Portfolio | Multimanager Mid Cap Growth Portfolio | ||||||
Cash Management Risk | X | |||||||
Custom Benchmark Risk | X | |||||||
Derivatives Risk | X | |||||||
Equity Risk | X | X | ||||||
Futures Contract Risk | X | |||||||
Index Strategy Risk | X | X | ||||||
Investment Style Risk | X | X | ||||||
Leverage Risk | X | |||||||
Mid-Cap and Small-Cap Company Risk | X | X | ||||||
Short Position Risk | X | |||||||
Volatility Management Risk | X | |||||||
44
Comparative Performance Information
The Acquiring Portfolio is newly organized and has no assets, operating history or performance information of its own as of the date of this Proxy Statement/Prospectus. After the Reorganization, which is subject to shareholder approval, the Acquiring Portfolio, as the successor to the Acquired Portfolio, will assume and publish the operating history and performance record of the Class A, Class B, and Class K shares of the Acquired Portfolio.
The bar charts and tables below provide some indication of the risks of investing in the Multimanager Mid Cap Growth Portfolio by showing changes in the Portfolio’s performance from year to year and by showing how the Portfolio’s average annual total returns for the past one year, five years and since inception through December 31, 2013 compared to the returns of a broad-based market index. The additional broad-based market index shows how the Multimanager Mid Cap Growth Portfolio’s performance compared with the returns of a volatility managed index. Past performance is not an indication of future performance.
The performance results do not reflect any Contract-related fees and expenses, which would reduce the performance results.
Multimanager Mid Cap Growth Portfolio - Calendar Year Total Returns (Class B)
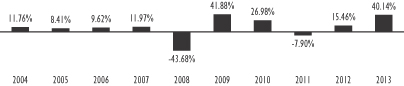
Best Quarter (% and time period) 20.36% (2003 2nd Quarter) | Worst Quarter (% and time period) -27.15% (2008 4th Quarter) | |||||||||||||||||
Multimanager Mid Cap Growth Portfolio
Average Annual Total Returns (For the periods ended December 31, 2013) | One Year | Five Years | Ten Years/ Since Inception | |||||||||
Multimanager Mid Cap Growth Portfolio — Class A | 40.15 | % | 21.99 | % | 8.65 | % | ||||||
Multimanager Mid Cap Growth Portfolio — Class B | 40.14 | % | 21.84 | % | 8.44 | % | ||||||
Multimanager Mid Cap Growth Portfolio — Class K (Inception Date: August 26, 2011) | 40.57 | % | N/A | 24.99 | % | |||||||
Russell 2500™ Growth Index* | 40.65 | % | 24.03 | % | 10.11 | % | ||||||
Volatility Managed Index — Mid Cap Growth 2500** | 36.69 | % | 19.42 | % | 11.69 | % | ||||||
| * | Russell 2500™ Growth Index measures the performance of those Russell 2500™ Index companies with higher price-to-book ratios and higher forecasted growth values. |
| ** | The Volatility Managed Index — Mid Cap Growth 2500 is an index that applies a formula to a blend of the S&P 400 Index and the Russell 2500™ Growth Index adjusting the equity exposure of the S&P 400 Index when certain volatility levels are reached. |
45
The following table shows the capitalization of the Multimanager Mid Cap Growth Portfolio as of December 31, 2013, and the Acquiring Portfolio on a pro forma combined basis as of December 31, 2013, after giving effect to the proposed Reorganization. The Acquiring Portfolio is newly organized and did not have any operations of its own as of the date of this Proxy Statement/Prospectus. Pro forma net assets may not total and net asset values per share may not recalculate due to rounding of net assets.
| Net Assets (in millions) | Net Asset Value Per Share | Shares Outstanding | ||||||||||
Multimanager Mid Cap Growth Portfolio — Class A | $ | 15.7 | $ | 10.08 | 1,554,788 | |||||||
Adjustments | $ | — | $ | — | ||||||||
Pro forma New Multimanager Mid Cap Growth Portfolio — Class IA (assuming the Reorganization is approved) | $ | 15.7 | $ | 10.08 | 1,554,788 | |||||||
Multimanager Mid Cap Growth Portfolio — Class B | $ | 122.0 | $ | 9.67 | 12,618,787 | |||||||
Adjustments | $ | — | $ | — | ||||||||
Pro forma New Multimanager Mid Cap Growth Portfolio — Class IB (assuming the Reorganization is approved) | $ | 122.0 | $ | 9.67 | 12,618,787 | |||||||
Multimanager Mid Cap Growth Portfolio — Class K | $ | 47.1 | $ | 10.16 | 4,638,912 | |||||||
Adjustments | $ | — | $ | — | ||||||||
Pro Forma New Multimanager Mid Cap Growth Portfolio — Class K (assuming the Reorganization is approved) | $ | 47.1 | $ | 10.16 | 4,638,912 | |||||||
AFTER CAREFUL CONSIDERATION, THE VIP BOARD UNANIMOUSLY APPROVED THE SHELL REORGANIZATION PLAN WITH RESPECT TO THE MULTIMANAGER MID CAP GROWTH PORTFOLIO. ACCORDINGLY, THE BOARD HAS SUBMITTED THE SHELL REORGANIZATION PLAN FOR APPROVAL BY THIS PORTFOLIO’S SHAREHOLDERS. THE BOARD RECOMMENDS THAT YOU VOTE “FOR” PROPOSAL 4.
PROPOSAL 5: APPROVAL OF THE SHELL REORGANIZATION PLAN WITH RESPECT TO THE REORGANIZATION OF THE MULTIMANAGER MID CAP VALUE PORTFOLIO INTO THE NEW MULTIMANAGER MID CAP VALUE PORTFOLIO, A NEWLY CREATED SERIES OF EQ TRUST.
This Proposal 5 requests your approval of the Shell Reorganization Plan, pursuant to which the Multimanager Mid Cap Value Portfolio will be reorganized into the New Multimanager Mid Cap Value Portfolio.
46
In considering whether you should approve this Proposal, you should note that:
| • | The New Multimanager Mid Cap Value Portfolio is newly organized and has no assets, operating history, or performance information of its own as of the date of this Proxy Statement/Prospectus. The New Multimanager Mid Cap Value Portfolio has been created as a shell series of EQ Trust solely for the purposes of acquiring the Multimanager Mid Cap Value Portfolio’s assets and continuing its business investment operations, and will not conduct any investment operations until after the closing of the Reorganization. If shareholders of the Multimanager Mid Cap Value Portfolio approve its Reorganization, the New Multimanager Mid Cap Value Portfolio will assume and publish the operating history and performance record of the Multimanager Mid Cap Value Portfolio. |
| • | The New Multimanager Mid Cap Value Portfolio and the Multimanager Mid Cap Value Portfolio have substantially identical investment objectives, policies, and strategies. Each Portfolio seeks to achieve long-term growth of capital by investing primarily in the securities of mid-capitalization under-valued companies. In addition, each Portfolio’s assets are allocated among three or more investment sub-advisers (each, an “Adviser”), each of which manages its portion of the Portfolio using a different but complementary investment strategy. A portion or portions of each Portfolio are actively managed by an Adviser (the “Active Allocated Portion” or the “Active Allocated Portions”) and a portion of each Portfolio seeks to track the performance of the Russell 2500™ Value Index (the “Index Allocated Portion”). There are, however, differences in the Portfolios’ primary investment policies and strategies of which you should be aware. |
The primary difference between the two Portfolios is that FMG LLC currently may limit the equity exposure of the Multimanager Mid Cap Value Portfolio at times when market volatility is increasing above specific thresholds by reducing investments in securities, shorting or selling long futures and options positions on an index, increasing cash levels, and/or shorting and index. FMG LLC will not employ this volatility management strategy in managing the New Multimanager Mid Cap Value Portfolio. However, it is anticipated that the Multimanager Mid Cap Value Portfolio will discontinue using this strategy effective on or before April 30, 2014, and therefore at the time of the Reorganization it is expected that the investment objectives, policies, and strategies of each Portfolio will be identical. For a detailed comparison of the Portfolios’ investment policies and strategies, see “Comparison of Investment Objectives, Policies, and Strategies” below.
| • | The Portfolios have substantially similar risk profiles, although there are differences of which you should be aware. Each Portfolio’s principal risks include equity risk, foreign securities risk, and mid-cap company risk. However, because it currently employs the volatility management strategy described above, the Multimanager Mid Cap Value Portfolio also is subject to cash management |
47
risk, custom benchmark risk, derivatives risk, futures contract risk, leverage risk, short position risk, and volatility management risk as principal risks, which are not principal risks of the New Multimanager Mid Cap Value Portfolio. For a detailed comparison of each Portfolio’s risks, see “Comparison of Principal Risk Factors” below. |
| • | FMG LLC (the “Manager”) serves as the investment manager and administrator for the Multimanager Mid Cap Value Portfolio and will serve as the investment manager and administrator for the New Multimanager Mid Cap Value Portfolio after the Reorganization. FMG LLC has received an exemptive order from the SEC that generally permits FMG LLC and each Trust’s Board of Trustees to appoint, dismiss and replace each Portfolio’s Adviser(s) and to amend the advisory agreements between FMG LLC and the Advisers without obtaining shareholder approval (except with respect to Affiliated Advisers (as defined herein)). FMG LLC has appointed four Advisers to manage distinct portions of the assets of the Multimanager Mid Cap Value Portfolio. In particular, BlackRock Investment Management, LLC, which is responsible for the management of the Index Allocated Portion of the Multimanager Mid Cap Value Portfolio, and Diamond Hill Capital Management, Inc., Knightsbridge Asset Management, LLC, and Lord, Abbett & Co., which are responsible for the management of portions of the Active Allocated Portion of the Multimanager Mid Cap Value Portfolio, currently serve as Advisers to the Multimanager Mid Cap Value Portfolio and it is anticipated that they will also serve as Advisers to the New Multimanager Mid Cap Value Portfolio after the Reorganization. For a detailed description of the Manager and the Advisers, please see “Additional Information about the Acquiring Portfolios — The Manager” and “ — The Advisers” below. |
| • | Class A shareholders of the Multimanager Mid Cap Value Portfolio will receive Class IA shares of the New Multimanager Mid Cap Value Portfolio, Class B shareholders of the Multimanager Mid Cap Value Portfolio will receive Class IB shares of the New Multimanager Mid Cap Value Portfolio, and Class K shareholders of the Multimanager Mid Cap Value Portfolio will receive Class K shares of the New Multimanager Mid Cap Value Portfolio pursuant to the Reorganization. Shareholders will not pay any sales charges in connection with the Reorganization. Please see “Comparative Fee and Expense Tables,” “Additional Information about the Reorganizations” and “Additional Information about the Acquiring Portfolios” below for more information. |
| • | It is estimated that the annual operating expense ratios for the New Multimanager Mid Cap Value Portfolio’s Class IA, Class IB, and Class K shares, for the fiscal year following the Reorganization, will be the same as those of the Multimanager Mid Cap Value Portfolio’s Class A, Class B, and Class K shares, respectively, for the fiscal year ended December 31, 2013. For a more detailed comparison of the fees and expenses of the Portfolios, please see “Comparative Fee and Expense Tables” and “Additional Information about the Acquiring Portfolios” below. |
48
| • | The maximum management fee for each Portfolio is equal to an annual rate of 0.800% of its average daily net assets. The management fee schedule for the Multimanager Mid Cap Value Portfolio is equal to an annual rate of 0.800% of the Portfolio’s average daily net assets up to and including $750 million, 0.750% of the Portfolio’s average daily net assets in excess of $750 million and up to and including $1.75 billion, 0.725% of the Portfolio’s average daily net assets in excess of $1.75 billion and up to and including $4.75 billion, 0.700% of the Portfolio’s average daily net assets in excess of $4.75 billion and up to and including $9.75 billion, and 0.675% of the Portfolio’s average daily net assets thereafter. The management fee schedule for the New Multimanager Mid Cap Value Portfolio is equal to an annual rate of 0.800% of the Portfolio’s average daily net assets up to and including $2 billion, 0.750% of the Portfolio’s average daily net assets in excess of $2 billion and up to and including $3 billion, 0.725% of the Portfolio’s average daily net assets in excess of $3 billion and up to and including $6 billion, 0.700% of the Portfolio’s average daily net assets in excess of $6 billion and up to and including $11 billion, and 0.675% of the Portfolio’s average daily net assets thereafter. |
| • | The administration fee schedule for the Multimanager Mid Cap Value Portfolio is equal to its proportionate share of an asset-based administration fee for the Multimanager Mid Cap Value Portfolio and certain other of VIP Trust’s multi-adviser portfolios, which is equal to an annual rate of 0.15% of these portfolios’ total average daily net assets up to and including $15 billion; 0.125% of these portfolios’ total average daily net assets in excess of $15 billion up to and including $30 billion; and 0.100% of these portfolios’ total average daily net assets in excess of $30 billion, plus an annual flat fee of $32,500 if the Multimanager Mid Cap Value Portfolio’s total average net assets are less than $5 billion. The administration fee schedule for the New Multimanager Mid Cap Value Portfolio is equal to its proportionate share of an asset-based administration fee for the New Multimanager Mid Cap Value Portfolio and certain other of EQ Trust’s portfolios, which is equal to an annual rate of 0.15% of these portfolios’ aggregate average daily net assets up to and including $20 billion; 0.110% of these portfolios’ aggregate average daily net assets in excess of $20 billion up to and including $25 billion; and 0.100% of these portfolios’ aggregate average daily net assets in excess of $25 billion, plus an annual flat fee of $32,500 if the New Multimanager Mid Cap Value Portfolio’s total average net assets are less than $5 billion. For a more detailed description of the fees and expenses of the Portfolios, please see “Comparative Fee and Expense Tables” and “Additional Information about the Acquiring Portfolios” below. |
| • | Following the Reorganizations, the combined Portfolio will be managed in accordance with the investment objective, policies, and strategies of the New Multimanager Mid Cap Value Portfolio. It is not expected that the New Multimanager Mid Cap Value Portfolio will revise any of its investment policies following the Reorganization to reflect those of the Multimanager Mid |
49
Cap Value Portfolio. FMG LLC has reviewed the Multimanager Mid Cap Value Portfolio’s investment objective, policies, and strategies and determined that they are substantially similar to the New Multimanager Mid Cap Value Portfolio’s investment objective, policies, and strategies. Thus, FMG LLC believes that, if the Reorganization is approved, a substantial portion of the Multimanager Mid Cap Value Portfolio’s holdings could be transferred to and held by the New Multimanager Mid Cap Value Portfolio. However, it is expected that some of those holdings may not remain at the time of the Reorganization due to normal portfolio turnover. It is also expected that, if the Reorganization is approved, the Multimanager Mid Cap Value Portfolio’s holdings that are not compatible with the New Multimanager Mid Cap Value Portfolio’s investment objective, policies, and strategies will be liquidated in an orderly manner in connection with the Reorganization, and the proceeds of these sales held in temporary investments or reinvested in assets that are consistent with those investment objective, policies, and strategies. The portion of the Multimanager Mid Cap Value Portfolio’s assets that will be liquidated in connection with the Reorganization will depend on market conditions and on the assessment by the Manager and the New Multimanager Mid Cap Value Portfolio’s Advisers of the compatibility of those holdings with the New Multimanager Mid Cap Value Portfolio’s anticipated portfolio composition and investment objective, policies, and strategies at the time of the Reorganization. The need for the Portfolio to sell investments in connection with the Reorganization may result in its selling securities at a disadvantageous time and price and could result in it realizing gains (or losses) that would not otherwise have been realized and incurring transaction costs that would not otherwise have been incurred. |
| • | The New Multimanager Mid Cap Value Portfolio will bear its proportionate share (based on the fraction that the shareholder accounts of the Multimanager Mid Cap Value Portfolio bears to the aggregate shareholder accounts of all Acquired Portfolios covered by the Shell Reorganization Plan, i.e., those mentioned below, at the Valuation Time) of 50% of the first $300,000 of the expenses of the Reorganizations of the Multimanager Aggressive Equity, Multimanager Technology, Multimanager Core Bond, Multimanager Mid Cap Growth, and Multimanager Mid Cap Value Portfolios, subject to an aggregate maximum of $150,000 for these Portfolios. FMG LLC generally will bear the expenses of the Reorganizations of these Portfolios in excess of this amount, subject to certain limitations. For additional information, please refer to “Additional Information About the Reorganizations — Terms of the Reorganization Plans” below. |
50
Comparative Fee and Expense Tables
The following tables show the fees and expenses of each class of shares of the Multimanager Mid Cap Value Portfolio and the estimated pro forma fees and expenses of each class of shares of the Acquiring Portfolio after giving effect to the proposed Reorganization. The Acquiring Portfolio is newly organized and has not had any operations of its own to date. Fees and expenses for the Multimanager Mid Cap Value Portfolio are based on those incurred by each class of its shares for the fiscal year ended December 31, 2013. The pro forma fees and expenses of the Acquiring Portfolio Shares assume that the Reorganization has been in effect for the year ended December 31, 2013. The tables below do not reflect any Contract-related fees and expenses, which would increase overall fees and expenses. See a Contract prospectus for a description of those fees and expenses.
Shareholder Fees
(fees paid directly from your investment)
Multimanager Mid Cap Value Portfolio | Pro Forma New Multimanager Portfolio (assuming the | |||
Not applicable. | Not applicable. |
Annual Operating Expenses
(expenses that you may pay each year as a percentage of the value of your investment)
| Multimanager Mid Cap Value Portfolio | Pro Forma New Multimanager Mid Cap Value Portfolio (assuming the Reorganization is approved) | |||||||||||||||||||||||
| Class A | Class B | Class K | Class IA | Class IB | Class K | |||||||||||||||||||
Management Fee | 0.80 | % | 0.80 | % | 0.80 | % | 0.80 | % | 0.80 | % | 0.80 | % | ||||||||||||
Distribution and/or Service | 0.25 | % | 0.25 | % | None | 0.25 | % | 0.25 | % | None | ||||||||||||||
Other Expenses | 0.25 | % | 0.22 | % | 0.25 | % | 0.23 | % | 0.23 | % | 0.23 | % | ||||||||||||
Total Annual Portfolio Operating Expenses | 1.30 | % | 1.27 | % | 1.05 | % | 1.28 | % | 1.28 | % | 1.03 | % | ||||||||||||
Fee Waiver and/or Expense Reimbursement† | -0.05 | % | -0.02 | % | -0.05 | % | -0.03 | % | -0.03 | % | -0.03 | % | ||||||||||||
Total Annual Portfolio Operating Expenses After Fee Waiver and/or Reimbursement | 1.25 | % | 1.25 | % | 1.00 | % | 1.25 | % | 1.25 | % | 1.00 | % | ||||||||||||
| † | Pursuant to a contract, AXA Equitable Funds Management Group, LLC has agreed to make payments or waive its management, administrative and other fees to limit the expenses of the Portfolio through April 30, 2015 (unless the Board of Trustees consents to an earlier revision or termination of this arrangement) (“Expense Limitation Agreement”) so that the annual operating expenses of the Portfolio (exclusive of taxes, interest, brokerage commissions, capitalized expenses, fees and expenses of other investment companies in which the Portfolio invests, dividend and interest expenses on securities sold short, and extraordinary expenses) do not exceed an annual rate of average daily net assets of 1.25% for Class A and Class B shares and 1.00% for Class K shares of the Portfolio. The Expense Limitation Agreement may be terminated by AXA Equitable Funds Management Group, LLC at any time after April 30, 2015. |
51
This example is intended to help you compare the costs of investing in the Portfolios with the cost of investing in other investment options. The example assumes that:
| • | You invest $10,000 in a Portfolio for the time periods indicated; |
| • | Your investment has a 5% return each year; |
| • | The Portfolio’s operating expenses remain the same; and |
| • | The Expense Limitation Arrangement is not renewed. |
This example does not reflect any Contract-related fees and expenses, including redemption fees (if any) at the Contract level. If such fees and expenses were reflected, the total expenses would be higher. Although your actual costs may be higher or lower, based on these assumptions your costs would be:
| 1 Year | 3 Years | 5 Years | 10 Years | |||||||||||||
Multimanager Mid Cap Value Portfolio | ||||||||||||||||
Class A | $ | 127 | $ | 407 | $ | 708 | $ | 1,563 | ||||||||
Class B | $ | 127 | $ | 401 | $ | 695 | $ | 1,532 | ||||||||
Class K | $ | 102 | $ | 329 | $ | 575 | $ | 1,278 | ||||||||
Pro Forma New Multimanager Mid Cap Value Portfolio (assuming the Reorganization is approved) | ||||||||||||||||
Class IA | $ | 127 | $ | 403 | $ | 699 | $ | 1,543 | ||||||||
Class IB | $ | 127 | $ | 403 | $ | 699 | $ | 1,543 | ||||||||
Class K | $ | 102 | $ | 325 | $ | 566 | $ | 1,257 | ||||||||
Each Portfolio pays transaction costs, such as commissions, when it buys and sells securities (or “turns over” its portfolio). A higher portfolio turnover rate may indicate higher transaction costs. These costs, which are not reflected in annual fund operating expenses or in the example, affect a Portfolio’s performance. During the fiscal year ended December 31, 2013, the portfolio turnover rate for the Multimanager Mid Cap Value Portfolio was 37% of the average value of the Portfolio. The New Multimanager Mid Cap Value Portfolio has not yet commenced operations and therefore, the New Multimanager Mid Cap Value Portfolio does not have a portfolio turnover rate to report.
52
Comparison of Investment Objectives, Policies, and Strategies
The following table compares the investment objectives and principal investment policies and strategies of the Multimanager Mid Cap Value Portfolio with those of the New Multimanager Mid Cap Value Portfolio. Each Trust’s Board may change the investment objective of a Portfolio without a vote of the Portfolio’s shareholders. For more detailed information about each Portfolio’s investment strategies and risks, see Appendix C.
| Acquiring Portfolio | Acquired Portfolio | |||
New Multimanager Mid Cap Value Portfolio | Multimanager Mid Cap Value Portfolio | |||
Investment Objective | Seeks to achieve long-term growth of capital. | Seeks to achieve long-term growth of capital with an emphasis on risk-adjusted returns and managing volatility in the Portfolio. However, effective on or before April 30, 2014, the investment objective of this Portfolio will be changed so that it is identical to the investment objective of the Acquiring Portfolio. | ||
Principal Investment Strategies | Under normal circumstances, the Portfolio intends to invest at least 80% of its net assets, plus borrowings for investment purposes, in equity securities of U.S. mid-capitalization companies. For purposes of this Portfolio, mid-capitalization companies generally are companies with market capitalization within the range of companies in the Russell 2500™ Index or the Russell Midcap® Index at the time of investment (as of December 31, 2012, the market capitalization of the companies in the Russell 2500™ Index was between $27.9 million and $10.1 billion and the market capitalization of the companies in the Russell Midcap® Index was between $319.4 million and $25.2 billion). In addition, securities of mid-capitalization companies may include financial instruments that derive their value from the securities of such companies. The sizes of the companies in these indexes change with market conditions, which can result in changes to the market capitalization ranges of companies in the indexes. The Portfolio intends to invest primarily in common stocks, but it may also invest in other securities that an Adviser believes provide opportunities for capital growth. | Same. |
53
| Acquiring Portfolio | Acquired Portfolio | |||
New Multimanager Mid Cap Value Portfolio | Multimanager Mid Cap Value Portfolio | |||
The Manager will generally allocate the Portfolio’s assets among three or more Advisers, each of which will manage its portion of the Portfolio using different yet complementary investment strategies. Under normal circumstances, one portion of the Portfolio will be an Index Allocated Portion and the other portions of the Portfolio will be Active Allocated Portions.
Under normal circumstances, the Manager anticipates allocating approximately 50% of the Portfolio’s net assets to the Index Allocated Portion and the remaining 50% of net assets among the Active Allocated Portions. These percentages are targets established by the Manager and actual allocations between the portions may deviate from these targets by up to 20% of the Portfolio’s net assets. | Same. | |||
| The Index Allocated Portion of the Portfolio seeks to track the performance (before fees and expenses) of the Russell 2500™ Value Index with minimal tracking error. This strategy is commonly referred to as an indexing strategy. Generally, the Index Allocated Portion uses a full replication technique, although in certain instances a sampling approach may be utilized for a portion of the Index Allocated Portion. | Same. | |||
| No corresponding strategy. | The Manager also may utilize futures and options, such as exchange traded futures and options contracts on securities indices, to manage equity exposure. When market volatility is increasing above specific thresholds set for the Portfolio, the Manager may limit equity exposure either by reducing investments in securities, shorting or selling long futures and options positions on an index, increasing cash levels, and/or shorting an index. However, effective on or before April 30, 2014, the Portfolio will no longer utilize this strategy. |
54
| Acquiring Portfolio | Acquired Portfolio | |||
New Multimanager Mid Cap Value Portfolio | Multimanager Mid Cap Value Portfolio | |||
| No corresponding strategy. | The Portfolio may invest up to 25% of its assets in derivatives. It is anticipated that the Portfolio’s derivative instruments will consist primarily of exchange-traded futures and options contracts on securities indices, but the Portfolio also may utilize other types of derivatives. The Portfolio may maintain a significant percentage of its assets in cash and cash equivalent instruments, some of which may serve as margin or collateral for the Portfolio’s obligations under derivative transactions. However, effective on or before April 30, 2014, the Portfolio will no longer utilize this strategy. | |||
| Each Active Allocated Portion utilizes a value-oriented investment style and invests primarily in equity securities of companies that, in the view of the Adviser, are currently undervalued according to certain financial measurements, which may include price-to-earnings and price-to-book ratios and dividend income potential. An Adviser may sell a security for a variety of reasons, such as because the Adviser believes that it has become overvalued or shows deteriorating fundamentals. | Same. |
55
Comparison of Principal Risk Factors
An investment in a Portfolio is not a deposit of a bank and is not insured or guaranteed by the Federal Deposit Insurance Corporation or any other government agency. You may lose money by investing in a Portfolio. The following table compares the principal risks of an investment in each Portfolio. For an explanation of each such risk, see “Additional Information about the Reorganizations – Description of Risk Factors” below.
Risks | New Multimanager Mid Cap Value Portfolio | Multimanager Mid Cap Value Portfolio | ||||||
Cash Management Risk | X | |||||||
Custom Benchmark Risk | X | |||||||
Derivatives Risk | X | |||||||
Equity Risk | X | X | ||||||
Futures Contract Risk | X | |||||||
| Index Strategy Risk | X | X | ||||||
Investment Style Risk | X | X | ||||||
Leverage Risk | X | |||||||
Mid-Cap and Small-Cap Company Risk | X | X | ||||||
Short Position Risk | X | |||||||
Volatility Management Risk | X | |||||||
Comparative Performance Information
The Acquiring Portfolio is newly organized and has no assets, operating history or performance information of its own as of the date of this Proxy Statement/Prospectus. After the Reorganization, which is subject to shareholder approval, the Acquiring Portfolio, as the successor to the Acquired Portfolio, will assume and publish the operating history and performance record of the Class A, Class B, and Class K shares of the Acquired Portfolio.
The bar charts and tables below provide some indication of the risks of investing in the Multimanager Mid Cap Value Portfolio by showing changes in the Portfolio’s performance from year to year and by showing how the Portfolio’s average annual total returns for the past one year, five years and since inception through December 31, 2013 compared to the returns of a broad-based market index. The additional broad-based market index shows how the Multimanager Mid Cap Value Portfolio’s performance compared with the returns of a volatility managed index. Past performance is not an indication of future performance.
The performance results do not reflect any Contract-related fees and expenses, which would reduce the performance results.
56
Multimanager Mid Cap Value Portfolio - Calendar Year Total Returns (Class B)

Best Quarter (% and time period) 22.65% (2009 2nd Quarter) | Worst Quarter (% and time period) -22.50% (2008 4th Quarter) |
Multimanager Mid Cap Value Portfolio
Average Annual Total Returns (For the periods ended December 31, 2013) | One Year | Five Years | Ten Years/ Since Inception | |||||||||
Multimanager Mid Cap Value Portfolio — Class A | 35.64 | % | 19.67 | % | 8.48 | % | ||||||
Multimanager Mid Cap Value Portfolio — Class B | 35.50 | % | 19.47 | % | 8.26 | % | ||||||
Multimanager Mid Cap Value Portfolio — Class K | 35.98 | % | N/A | 21.27 | % | |||||||
Russell 2500™ Value Index* | 33.32 | % | 19.61 | % | 9.29 | % | ||||||
Volatility Managed Index - Mid Cap Value 2500** | 33.07 | % | 17.29 | % | 11.24 | % | ||||||
| * | Russell 2500™ Value Index is an unmanaged index which measures the performance of those Russell 2500™ companies with lower price-to-book ratios and lower forecasted growth values. |
| ** | The Volatility Managed Index — Mid Cap Value 2500 is an index that applies a formula to a blend of the S&P 400 Index and the Russell 2500™ Value Index adjusting the equity exposure of the S&P 400 Index when certain volatility levels are reached. |
57
The following table shows the capitalization of the Multimanager Mid Cap Value Portfolio as of December 31, 2013, and the Acquiring Portfolio on a pro forma combined basis as of December 31, 2013, after giving effect to the proposed Reorganization. The Acquiring Portfolio is newly organized and did not have any operations of its own as of the date of this Proxy Statement/Prospectus. Pro forma net assets may not total and net asset values per share may not recalculate due to rounding of net assets.
| Net Assets (in millions) | Net Asset Value Per Share | Shares Outstanding | ||||||||||
Multimanager Mid Cap Value Portfolio — Class A | $ | 14.1 | $ | 13.49 | 1,044,774 | |||||||
Adjustments | $ | — | $ | — | ||||||||
Pro forma New Multimanager Mid Cap Value Portfolio — Class IA (assuming the Reorganization is approved) | $ | 14.1 | $ | 13.49 | 1,044,774 | |||||||
Multimanager Mid Cap Value Portfolio — Class B | $ | 125.0 | $ | 13.22 | 9,456,068 | |||||||
Adjustments | $ | — | $ | — | ||||||||
Pro forma New Multimanager Mid Cap Value Portfolio — Class IB (assuming the Reorganization is approved) | $ | 125.0 | $ | 13.22 | 9,456,068 | |||||||
Multimanager Mid Cap Value Portfolio — Class K | $ | 97.2 | $ | 13.49 | 7,200,575 | |||||||
Adjustments | $ | — | $ | — | ||||||||
Pro Forma New Multimanager Mid Cap Value Portfolio — Class K (assuming the Reorganization is approved) | $ | 97.2 | $ | 13.49 | 7,200,575 | |||||||
AFTER CAREFUL CONSIDERATION, THE VIP BOARD UNANIMOUSLY APPROVED THE SHELL REORGANIZATION PLAN WITH RESPECT TO THE MULTIMANAGER MID CAP VALUE PORTFOLIO. ACCORDINGLY, THE BOARD HAS SUBMITTED THE SHELL REORGANIZATION PLAN FOR APPROVAL BY THIS PORTFOLIO’S SHAREHOLDERS. THE BOARD RECOMMENDS THAT YOU VOTE “FOR” PROPOSAL 5.
PROPOSAL 6: APPROVAL OF THE MERGER PLAN WITH RESPECT TO THE REORGANIZATION OF THE MULTIMANAGER LARGE CAP CORE EQUITY PORTFOLIO INTO THE EQ/LARGE CAP CORE PLUS PORTFOLIO.
This Proposal 6 requests your approval of the Merger Plan, pursuant to which the Multimanager Large Cap Core Equity Portfolio will be reorganized into the EQ/Large Cap Core PLUS Portfolio.
58
In considering whether you should approve this Proposal, you should note that:
| • | The Portfolios have identical investment objectives. Each Portfolio seeks to achieve long-term growth of capital with an emphasis on risk-adjusted returns and managing volatility in the Portfolio. |
| • | The Portfolios also have similar investment policies. Both Portfolios invest at least 80% of their net assets, plus borrowings for investment purposes, in securities of large capitalization companies (or other financial instruments that derive their value from the securities of such companies) (the “80% Policy”). In addition, each Portfolio also may invest up to 25% of its assets in derivatives, such as exchange-traded futures and options contracts on securities indices. Further, each Portfolio’s assets are allocated among three or more investment sub-advisers (each, an “Adviser”), each of which manages its portion of the Portfolio using a different but complementary investment strategy. A portion or portions of each Portfolio are actively managed by an Adviser (the “Active Allocated Portion” or the “Active Allocated Portions”) and a portion of each Portfolio seeks to track the performance of the Standard & Poors 500 Composite Stock Index (the “Index Allocated Portion”). |
| • | There are, however, differences in the Portfolios’ primary investment policies and strategies of which you should be aware. One primary difference between the two Portfolios is that the EQ/Large Cap Core PLUS Portfolio may invest in securities of large capitalization companies, which may include securities of non-U.S. issuers. In contrast, the Multimanager Large Cap Core Equity Portfolio’s 80% Policy is limited to securities of U.S. large capitalization countries. As a result, the EQ/Large Cap Core PLUS Portfolio is exposed to foreign securities risk as a principal risk, including currency risk and emerging markets risk, whereas the Multimanager Large Cap Core Equity Portfolio is not exposed to these principal risks. |
Another difference between the two Portfolios is that one portion of the EQ/Large Cap Core PLUS Portfolio invests in exchange-traded funds (“ETFs”) (the “ETF Allocated Portion”). The Multimanager Large Cap Core Equity Portfolio does not have an ETF Allocated Portion and does not otherwise invest in ETFs as a principal investment strategy. Since ETFs incur their own management and other fees and expenses, a proportionate share of these expenses will be borne by the EQ/Large Cap Core PLUS Portfolio, which could cause certain of the Portfolio’s operating expenses to be higher.
Further, the percentage of each Portfolio’s assets that are allocated to the Active and Index Allocated Portions varies. Under normal circumstances, the Active Allocated Portion of the EQ/Large Cap Core PLUS Portfolio consists of approximately 30% of its net assets and the Index Allocated Portion consists of approximately 60% of the EQ/Large Cap Core PLUS Portfolio’s net assets. (The remaining 10% of its assets are allocated to the ETF Allocated Portion.) In contrast, under normal market conditions, the Active Allocated Portions and Index Allocated Portion of the Multimanager Large Cap Core Equity Portfolio each consist of approximately 50% of its net assets. For a
59
detailed comparison of the Portfolios’ investment policies and strategies, see “Comparison of Investment Objectives, Policies, and Strategies” below.
| • | The Portfolios have comparable risk profiles, although there are differences in the principal risks. Each Portfolio’s principal risks include derivatives risk, equity risk, large-cap company risk, and volatility management risk. The EQ/Large Cap Core PLUS Portfolio, however, also is subject to currency risk, emerging markets risk, foreign securities risk, ETF risk, and portfolio turnover risk as principal risks, which are not principal risks of the Multimanager Large Cap Core Equity Portfolio. For a detailed comparison of each Portfolio’s risks, see “Comparison of Principal Risk Factors” below. |
| • | FMG LLC (the “Manager”) serves as the investment manager and administrator for each Portfolio and would continue to manage and administer the EQ/Large Cap Core PLUS Portfolio after the Reorganization. FMG LLC has received an exemptive order from the SEC that generally permits FMG LLC and each Trust’s Board of Trustees to appoint, dismiss and replace each Portfolio’s Adviser(s) and to amend the advisory agreements between FMG LLC and the Advisers without obtaining shareholder approval (except with respect to Affiliated Advisers (as defined herein)). FMG LLC has appointed three Advisers to manage distinct portions of the Multimanager Large Cap Core Equity Portfolio. In particular, AllianceBernstein L.P., which is responsible for managing portions of the Multimanager Large Cap Core Equity Portfolio’s Active Allocated and Index Allocated Portions, and Janus Capital Management, LLC and Thornburg Investment Management, Inc., which are responsible for managing portions of the Multimanager Large Cap Core Equity Portfolio’s Active Allocated Portion, currently serve as Advisers of the Multimanager Large Cap Core Equity Portfolio. FMG LLC has appointed three Advisers to manage distinct portions of the EQ/Large Cap Core PLUS Portfolio’s assets. In particular, Institutional Capital LLC and Capital Guardian Trust Company, which are responsible for the management of portions of the Active Allocated Portion of the EQ/Large Cap Core PLUS Portfolio, and BlackRock Investment Management, LLC, which is responsible for managing the Index Allocated Portion of the EQ/Large Cap Core PLUS Portfolio, currently serve as Advisers to the EQ/Large Cap Core PLUS Portfolio and it is anticipated that they will continue to advise their respective portions of the EQ/Large Cap Core PLUS Portfolio after the Reorganization. In addition, it is anticipated that Thornburg Investment Management, Inc. will be added as an Adviser to a portion of the Active Allocated Portion of the EQ/Large Cap Core PLUS Portfolio following the Reorganization. FMG LLC is responsible for the management of the ETF Allocated Portion of the EQ/Large Cap Core PLUS Portfolio, and it is anticipated that it would continue to manage the ETF Allocated Portion of the EQ/Large Cap Core PLUS Portfolio after the Reorganization. For a detailed description of the Manager and the EQ/Large Cap Core PLUS Portfolio’s Advisers, please see “Additional Information about the Acquiring Portfolios — The Manager” and “— The Advisers” below. |
60
| • | The Multimanager Large Cap Core Equity and EQ/Large Cap Core PLUS Portfolios had net assets of approximately $602.13 million and $2.41 billion, respectively, as of December 31, 2013. Thus, if the Reorganization had been in effect on that date, the combined Portfolio would have had net assets of approximately $3.01 billion. |
| • | Class A shareholders of the Multimanager Large Cap Core Equity Portfolio will receive Class IA shares of the EQ/Large Cap Core PLUS Portfolio, Class B shareholders of the Multimanager Large Cap Core Equity Portfolio will receive Class IB shares of the EQ/Large Cap Core PLUS Portfolio, and Class K shareholders of the Multimanager Large Cap Core Equity Portfolio will receive Class K shares of the EQ/Large Cap Core PLUS Portfolio, pursuant to the Reorganization. Shareholders will not pay any sales charges in connection with the Reorganization. Please see “Comparative Fee and Expense Tables,” “Additional Information about the Reorganizations” and “Additional Information about the Acquiring Portfolios” below for more information. |
| • | It is estimated that the annual operating expense ratios for the EQ/Large Cap Core PLUS Portfolio’s Class IA, Class IB, and Class K shares, for the fiscal year following the Reorganization, will be lower than those of the Multimanager Large Cap Core Equity Portfolio’s Class A, Class B, and Class K shares, respectively, for the fiscal year ended December 31, 2013. For a more detailed comparison of the fees and expenses of the Portfolios, please see “Comparative Fee and Expense Tables” and “Additional Information about the Acquiring Portfolios” below. |
| • | The maximum management fee for the Multimanager Large Cap Core Equity Portfolio is equal to an annual rate of 0.70% of its average daily net assets, while the maximum management fee for the EQ/Large Cap Core PLUS Portfolio is equal to an annual rate of 0.50% of its average daily net assets. The administration fee schedule for the Multimanager Large Cap Core Equity Portfolio is its proportionate share of an asset-based administration fee for the Multimanager Large Cap Core Equity Portfolio and certain other of VIP Trust’s multi-adviser portfolios, which is equal to an annual rate of 0.15% of these portfolios’ total average daily net assets up to and including $15 billion; 0.125% of these portfolios’ total average daily net assets in excess of $15 billion up to and including $30 billion; and 0.10% of these portfolios’ total average daily net assets in excess of $30 billion, plus an annual flat fee of $32,500 if the Multimanager Large Cap Core Equity Portfolio’s total average net assets are less than $5 billion. The EQ/Large Cap Core PLUS Portfolio pays FMG LLC its proportionate share of an asset-based administration fee for the EQ/Large Cap Core PLUS Portfolio and certain other of EQ Trust’s portfolios, which is equal to an annual rate of 0.15% of the first $20 billion of these portfolios’ aggregate average daily net assets, 0.110% of the next $5 billion of these portfolios’ aggregate average daily net assets, and 0.10% of these portfolios’ aggregate average daily net assets thereafter, plus an annual flat fee of $32,500 if the EQ/Large Cap Core PLUS Portfolio’s total average net assets are less than $5 billion. For a more |
61
detailed description of the fees and expenses of the Portfolios, please see “Comparative Fee and Expense Tables” and “Additional Information about the Acquiring Portfolios” below. |
| • | Following the Reorganization, the combined Portfolio will be managed in accordance with the investment objective, policies, and strategies of the EQ/Large Cap Core PLUS Portfolio. It is not expected that the EQ/Large Cap Core PLUS Portfolio will revise any of its investment policies following the Reorganization to reflect those of the Multimanager Large Cap Core Equity Portfolio. FMG LLC has reviewed the Multimanager Large Cap Core Equity Portfolio’s current portfolio holdings and determined that, because both Portfolios invest in securities of large capitalization companies, the Multimanager Large Cap Core Equity Portfolio’s holdings are generally consistent and compatible with the EQ/Large Cap Core PLUS Portfolio’s current portfolio composition and investment objective, policies, and strategies and, thus, a large majority of the Multimanager Large Cap Core Equity Portfolio’s assets could be transferred to and held by the EQ/Large Cap Core PLUS Portfolio if the Reorganization is approved. However, it is expected that some of those holdings may not remain at the time of the Reorganization due to normal portfolio turnover. If the Reorganization is approved, the Manager will liquidate that portion of the Multimanager Large Cap Core Equity Portfolio’s holdings that, based on market conditions and an assessment by the Manager and the EQ/Large Cap Core PLUS Portfolio’s Advisers, is not compatible with the EQ/Large Cap Core PLUS Portfolio’s current portfolio composition or investment objective, policies, or strategies. The proceeds of such liquidation will be held in temporary investments or reinvested in assets that are consistent with the EQ/Large Cap Core PLUS Portfolio’s investment objective, policies and strategies. Although any sale of portfolio investments in connection with the Reorganization would be conducted in an orderly manner, the need for the Portfolio to sell such investments may result in its selling securities at a disadvantageous time and price and could result in the Portfolio’s realizing gains (or losses) that otherwise would not have been realized and incurring transaction costs that otherwise would not have been incurred. |
| • | The Multimanager Large Cap Core Equity Portfolio will bear its proportionate share (based on the fraction that its shareholder accounts bears to the aggregate shareholder accounts of all Acquired Portfolios covered by the Merger Plan, i.e., those mentioned below, at the Valuation Time) of the first $325,000 of the “Identified Expenses” (as defined below under “Additional Information about the Reorganizations – Terms of the Reorganization Plans”) of the Reorganizations of the Multimanager Large Cap Core Equity, Multimanager Large Cap Value, and Multimanager International Equity Portfolios. FMG LLC generally will bear expenses of the Reorganizations of these Portfolios in excess of this amount, subject to certain limitations. For additional information, please refer to “Additional Information About the Reorganizations – Terms of the Reorganization Plans” below. |
62
Comparative Fee and Expense Tables
The following tables show the fees and expenses of each class of shares of each Portfolio and the estimated pro forma fees and expenses of each class of shares of the Acquiring Portfolio after giving effect to the proposed Reorganization. Fees and expenses for each Portfolio are based on those incurred by each class of its shares for the fiscal year ended December 31, 2013. The pro forma fees and expenses of the Acquiring Portfolio Shares assume that the Reorganization has been in effect for the year ended December 31, 2013. The tables below do not reflect any Contract-related fees and expenses, which would increase overall fees and expenses. See a Contract prospectus for a description of those fees and expenses.
Shareholder Fees
(fees paid directly from your investment)
Multimanager Large Cap | EQ/Large Cap Core PLUS | Pro Forma EQ/Large Cap Core PLUS (assuming the Reorganization is approved) | ||
Not applicable. | Not applicable. | Not applicable. |
Annual Operating Expenses
(expenses that you may pay each year as a percentage of the value of your investment)
| Multimanager Large Cap Core Equity Portfolio | EQ/Large Cap Core PLUS Portfolio | Pro Forma EQ/Large Cap Core PLUS Portfolio (assuming the Reorganization is approved) | ||||||||||||||||||||||||||||||||||
| Class A | Class B | Class K | Class IA | Class IB | Class K | Class IA | Class IB | Class K | ||||||||||||||||||||||||||||
Management Fee | 0.70 | % | 0.70 | % | 0.70 | % | 0.50 | % | 0.50 | % | 0.50 | % | 0.50 | % | 0.50 | % | 0.50 | % | ||||||||||||||||||
Distribution and/or Service Fees | 0.25 | % | 0.25 | % | None | 0.25 | % | 0.25 | % | None | 0.25 | % | 0.25 | % | None | |||||||||||||||||||||
Other Expenses | 0.20 | % | 0.20 | % | 0.20 | % | 0.18 | % | 0.18 | % | 0.18 | % | 0.14 | % | 0.14 | % |
| 0.14 | % | |||||||||||||||||
Total Annual Portfolio Operating Expenses | 1.15 | % | 1.15 | % | 0.90 | % | 0.93 | % | 0.93 | % | 0.68 | % | 0.89 | % | 0.89 | % | 0.64 | % | ||||||||||||||||||
63
This example is intended to help you compare the costs of investing in the Portfolios with the cost of investing in other investment options. The example assumes that:
| • | You invest $10,000 in a Portfolio for the time periods indicated; |
| • | Your investment has a 5% return each year; and |
| • | The Portfolio’s operating expenses remain the same. |
This example does not reflect any Contract-related fees and expenses, including redemption fees (if any) at the Contract level. If such fees and expenses were reflected, the total expenses would be higher. Although your actual costs may be higher or lower, based on these assumptions your costs would be:
| 1 Year | 3 Years | 5 Years | 10 Years | |||||||||||||
Multimanager Large Cap Core Equity Portfolio | ||||||||||||||||
Class A | $ | 117 | $ | 365 | $ | 633 | $ | 1,398 | ||||||||
Class B | $ | 117 | $ | 365 | $ | 633 | $ | 1,398 | ||||||||
Class K | $ | 92 | $ | 287 | $ | 498 | $ | 1,108 | ||||||||
EQ/Large Cap Core PLUS Portfolio | ||||||||||||||||
Class IA | $ | 95 | $ | 296 | $ | 515 | $ | 1,143 | ||||||||
Class IB | $ | 95 | $ | 296 | $ | 515 | $ | 1,143 | ||||||||
Class K | $ | 69 | $ | 218 | $ | 379 | $ | 847 | ||||||||
Pro Forma EQ/Large Cap Core PLUS Portfolio (assuming the Reorganization is approved) | ||||||||||||||||
Class IA | $ | 91 | $ | 284 | $ | 493 | $ | 1,096 | ||||||||
Class IB | $ | 91 | $ | 284 | $ | 493 | $ | 1,096 | ||||||||
Class K | $ | 65 | $ | 205 | $ | 357 | $ | 798 | ||||||||
The Portfolio pays transaction costs, such as commissions, when it buys and sells securities (or “turns over” its portfolio). A higher portfolio turnover rate may indicate higher transaction costs. These costs, which are not reflected in annual fund operating expenses or in the example, affect the Portfolio’s performance. During the fiscal year ended December 31, 2013, the portfolio turnover rate for the Multimanager Large Cap Core Equity Portfolio and EQ/Large Cap Core PLUS Portfolio was 34% and 46%, respectively, of the average value of the Portfolio.
64
Comparison of Investment Objectives, Policies, and Strategies
The following table compares the investment objectives and principal investment policies and strategies of the Multimanager Large Cap Core Equity Portfolio with those of the EQ/Large Cap Core PLUS Portfolio. Each Trust’s Board may change the investment objective of a Portfolio without a vote of the Portfolio’s shareholders. For more detailed information about each Portfolio’s investment strategies and risks, see Appendix C.
| Acquiring Portfolio | Acquired Portfolio | |||
EQ/Large Cap Core PLUS Portfolio | Multimanager Large Cap Core Equity Portfolio | |||
Investment Objective | Seeks to achieve long-term growth of capital with an emphasis on risk-adjusted returns and managing volatility in the Portfolio. | Same. | ||
Principal Investment Strategies | Under normal circumstances, the Portfolio intends to invest at least 80% of its net assets, plus borrowings for investment purposes, in securities of large-cap companies (or other financial instruments that derive their value from the securities of such companies). | Under normal circumstances, the Portfolio intends to invest at least 80% of its net assets, plus borrowings for investment purposes, in equity securities of U.S. large capitalization companies. In addition, securities of large-capitalization companies may include financial instruments that derive their value from the securities of such companies. | ||
| Large-cap companies mean those companies with market capitalizations within the range of at least one of the following indices at the time of purchase: S&P 500 Index (market capitalization range of approximately $1.65 billion - $500.5 billion as of December 31, 2012), S&P 100 Index (market capitalization range of approximately $17.60 billion - $500.5 billion as of December 31, 2012), Russell 1000® Index (market capitalization range of approximately $319.35 million - $500.5 billion as of December 31, 2012), Morningstar Large Core Index (market capitalization range of approximately $11.05 billion - $228.25 billion as of December 31, 2012), NYSE 100 Index (market capitalization $21.08 billion - $389.65 billion as of December 31, 2012). | For purposes of this Portfolio, large capitalization companies are companies with market capitalization within the range of the S&P 500 Index at the time of investment (market capitalization range of approximately $1.65 billion to $500.5 billion as of December 31, 2012). The size of companies in the S&P 500 Index changes with market conditions, which can result in changes to the market capitalization range of companies in the index. The Portfolio intends to invest primarily in common stocks, but it may also invest in other securities that the Advisers believe provide opportunities for capital growth. |
65
| Acquiring Portfolio | Acquired Portfolio | |||
EQ/Large Cap Core PLUS Portfolio | Multimanager Large Cap Core Equity Portfolio | |||
| The Portfolio’s assets normally are allocated among three Advisers, each of which manages its portion of the Portfolio using a different but complementary investment strategy. One portion of the Portfolio is an Active Allocated Portion; one portion of the Portfolio is an Index Allocated Portion; and one portion of the Portfolio is an ETF Allocated Portion. Under normal circumstances, the Active Allocated Portion consists of approximately 30% of the Portfolio’s net assets, the Index Allocated Portion consists of approximately 60% of the Portfolio’s net assets and the ETF Allocated Portion consists of approximately 10% of the Portfolio’s net assets. | FMG LLC will generally allocate the Portfolio’s assets among three or more Advisers, each of which will manage its portion of the portfolio using different yet complementary investment strategies. Under normal circumstances, one portion of the Portfolio will be an Index Allocated Portion and the other portions of the Portfolio will be Active Allocated Portions. Under normal circumstances, the Manager anticipates allocating approximately 50% of the Portfolio’s net assets to the Index Allocated Portion and the remaining 50% of net assets among the Active Allocated Portions. These percentages are targets established by FMG LLC and actual allocations between the portions may deviate from these targets by up to 20% of the Portfolio’s net assets. | |||
| The Active Allocated Portion invests primarily in equity securities of companies that, in the view of the Advisers, have either above average growth prospects, or are selling at reasonable valuations, or both. The Advisers may sell a security for a variety of reasons, such as to make other investments believed by an Adviser to offer superior investment opportunities. | Same. | |||
| The Index Allocated Portion of the Portfolio seeks to track the performance (before fees and expenses) of the S&P 500 Index with minimal tracking error. This strategy is commonly referred to as an indexing strategy. Generally, the Index Allocated Portion uses a full replication technique, although in certain instances a sampling approach may be utilized for a portion of the Index Allocated Portion. The Index Allocated Portion also may invest in other instruments, such as futures and options contracts, that provide comparable exposure as the index without buying the underlying securities comprising the index. | Same. |
66
| Acquiring Portfolio | Acquired Portfolio | |||
EQ/Large Cap Core PLUS Portfolio | Multimanager Large Cap Core Equity Portfolio | |||
| The Manager also may utilize futures and options, such as exchange-traded futures and options contracts on securities indices, to manage equity exposure. Futures and options can provide exposure to the performance of a securities index without buying the underlying securities comprising the index. They also provide a means to manage the Portfolio’s equity exposure without having to buy or sell securities. When market volatility is increasing above specific thresholds set for the Portfolio, the Manager may limit equity exposure either by reducing investments in securities, shorting or selling long futures and options positions on an index, increasing cash levels, and/or shorting an index. During such times, the Portfolio’s exposure to equity securities may be significantly less than that of a traditional equity portfolio. Although these actions are intended to reduce the overall risk of investing in the Portfolio, they may result in periods of underperformance. The Portfolio may invest up to 25% of its assets in derivatives. It is anticipated that the Portfolio’s derivative instruments will consist primarily of exchange-traded futures and options contracts on securities indices, but the Portfolio also may utilize other types of derivatives. The Portfolio’s investments in derivatives may be deemed to involve the use of leverage because the Portfolio is not required to invest the full market value of the contract upon entering into the contract but participates in gains and losses on the full contract price. The use of derivatives also may be deemed to involve the use of leverage because the heightened price sensitivity of some derivatives to market changes may magnify the Portfolio’s gain or loss. It is not generally expected, however, that the Portfolio will be leveraged by borrowing money for investment purposes. In addition, the Portfolio generally does not intend to use leverage to increase its net investment exposure above approximately 100% of the Portfolio’s net asset value or below 0%. The Portfolio may maintain a significant percentage of its assets in cash and cash equivalent instruments, some of which may serve as margin or collateral for the Portfolio’s obligations under derivative transactions. | Same. |
67
| Acquiring Portfolio | Acquired Portfolio | |||
EQ/Large Cap Core PLUS Portfolio | Multimanager Large Cap Core Equity Portfolio | |||
| The ETF Allocated Portion invests in ETFs (the “Underlying ETFs”) that meet the investment criteria of the Portfolio as a whole. The Underlying ETFs in which the ETF Allocated Portion may invest may be changed from time to time without notice or shareholder approval. | No corresponding strategy. |
Comparison of Principal Risk Factors
An investment in a Portfolio is not a deposit of a bank and is not insured or guaranteed by the Federal Deposit Insurance Corporation or any other government agency. You may lose money by investing in a Portfolio. The following table compares the principal risks of an investment in each Portfolio. For an explanation of each such risk, see “Additional Information about the Reorganizations — Description of Risk Factors” below.
Risks | EQ/Large Cap Core PLUS Portfolio | Multimanager Large Cap Core Equity Portfolio | ||||||
Cash Management Risk | X | X | ||||||
Currency Risk | X | |||||||
Custom Benchmark Risk | X | X | ||||||
Derivatives Risk | X | X | ||||||
Emerging Markets Risk | X | |||||||
Equity Risk | X | X | ||||||
ETF Risk | X | |||||||
Foreign Securities Risk | X | |||||||
Futures Contract Risk | X | X | ||||||
Index Strategy Risk | X | X | ||||||
Large-Cap Company Risk | X | X | ||||||
Leverage Risk/Leveraging Risk | X | X | ||||||
Portfolio Turnover Risk | X | |||||||
Short Position Risk | X | X | ||||||
Volatility Management Risk | X | X | ||||||
Comparative Performance Information
The bar charts and tables below provide some indication of the risks of investing in each Portfolio by showing changes in the Portfolio’s performance from year to year and by showing how the Portfolios’ average annual total returns for the past one year, five years and since inception through December 31, 2013 compared to the returns of a broad-based market index. The additional broad-based market index shows how the Portfolio’s performance compared with the returns of a volatility managed index. Past performance is not an indication of future performance.
68
The performance results do not reflect any Contract-related fees and expenses, which would reduce the performance results.
Multimanager Large Cap Core Equity - Calendar Year Total Returns (Class B)
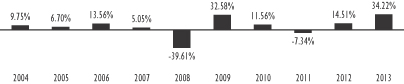
Best Quarter (% and time period) 18.97% (2009 2nd Quarter) | Worst Quarter (% and time period) -21.26% (2008 4th Quarter) |
EQ/Large Cap Core PLUS Portfolio - Calendar Year Total Returns (Class IB)
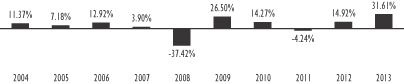
Best Quarter (% and time period) 15.69% (2009 2nd Quarter) | WorstQuarter (% and time period) -21.76% (2008 4th Quarter) |
Multimanager Large Cap Core Equity Portfolio
Average Annual Total Returns (For the periods ended December 31, 2013) | One Year | Five Years | Ten Years/ Since Inception | |||||||||
Multimanager Large Cap Core Equity Portfolio — Class A | 34.31 | % | 16.26 | % | 6.14 | % | ||||||
Multimanager Large Cap Core Equity Portfolio — Class B | 34.22 | % | 16.07 | % | 5.92 | % | ||||||
Multimanager Large Cap Core Equity Portfolio — Class K (Inception Date: August 26, 2011) | 34.65 | % | N/A | 21.80 | % | |||||||
S&P 500 Index† | 32.39 | % | 17.94 | % | 7.41 | % | ||||||
Volatility Managed Index — Large Cap Core* | 32.39 | % | 16.27 | % | 9.21 | % | ||||||
69
EQ/Large Cap Core PLUS Portfolio
Average Annual Total Returns (For the periods ended December 31, 2013) | One Year | Five Years | Ten Years/ Since Inception | |||||||||
EQ/Large Cap Core PLUS Portfolio — Class IA | 31.62 | % | 16.11 | % | 6.49 | % | ||||||
EQ/Large Cap Core PLUS Portfolio — Class IB | 31.61 | % | 15.93 | % | 6.26 | % | ||||||
EQ/Large Cap Core PLUS Portfolio — Class K | 31.95 | % | N/A | 21.92 | % | |||||||
S&P 500 Index† | 32.39 | % | 17.94 | % | 7.41 | % | ||||||
Volatility Managed Index — Large Cap Core* | 32.39 | % | 16.27 | % | 9.21 | % | ||||||
| † | The S&P 500 Index is a weighted index of common stocks of 500 leading companies in leading industries of the U.S. economy, capturing 75% coverage of U.S. equities. The index is capitalization weighted, thereby giving greater weight to companies with the largest market capitalizations. |
| * | The Volatility Managed Index — Large Cap Core is an index that applies a formula to the S&P 500 Index adjusting the equity exposure of the S&P 500 Index when certain volatility levels are reached. |
The following table shows the capitalization of each Portfolio as of December 31, 2013, and of the EQ/Large Cap Core PLUS Portfolio on a pro forma combined basis as of December 31, 2013, after giving effect to the proposed Reorganization. Pro forma net assets may not total and net asset values per share may not recalculate due to rounding of net assets.
| Net Assets (in millions) | Net Asset Value Per Share | Shares Outstanding | ||||||||||
Multimanager Large Cap Core Equity Portfolio — Class A | $ | 4.5 | $ | 14.27 | 316,458 | |||||||
EQ/Large Cap Core PLUS Portfolio — Class IA | $ | 1.2 | $ | 8.71 | 133,284 | |||||||
Adjustments* | $ | — | $ | — | 201,898 | |||||||
Pro forma EQ/Large Cap Core PLUS Portfolio — Class IA (assuming the Reorganization is approved) | $ | 5.7 | $ | 8.71 | 651,640 | |||||||
Multimanager Large Cap Core Equity Portfolio — Class B | $ | 24.8 | $ | 14.26 | 1,735,710 | |||||||
EQ/Large Cap Core PLUS Portfolio — Class IB | $ | 1,953.7 | $ | 8.71 | 224,291,286 | |||||||
Adjustments* | $ | — | $ | — | 1,106,696 | |||||||
Pro forma EQ/Large Cap Core PLUS Portfolio — Class IB (assuming the Reorganization is approved) | $ | 1,978.5 | $ | 8.71 | 227,133,692 | |||||||
Multimanager Large Cap Core Equity Portfolio — Class K | $ | 572.9 | $ | 14.27 | 40,157,043 | |||||||
EQ/Large Cap Core PLUS Portfolio — Class K | $ | 456.9 | $ | 8.71 | 52,461,008 | |||||||
Adjustments* | $ | — | $ | — | 25,619,700 | |||||||
Pro Forma EQ/Large Cap Core PLUS Portfolio — Class K (assuming the Reorganization is approved) | $ | 1,029.7 | $ | 8.71 | 118,237,751 | |||||||
| * | Reflects adjustment for additional shares issued of the Acquiring Portfolio |
70
Reorganizations of these Portfolios in excess of this amount, subject to certain limitations. For additional information, please refer to “Additional Information About the Reorganizations — Terms of the Reorganization Plans” below. |
AFTER CAREFUL CONSIDERATION, THE VIP BOARD UNANIMOUSLY APPROVED THE MERGER PLAN WITH RESPECT TO THE MULTIMANAGER LARGE CAP CORE EQUITY PORTFOLIO. ACCORDINGLY, THE BOARD HAS SUBMITTED THE MERGER PLAN FOR APPROVAL BY THIS PORTFOLIO’S SHAREHOLDERS. THE BOARD RECOMMENDS THAT YOU VOTE “FOR” PROPOSAL 6.
* * * * *
PROPOSAL 7: APPROVAL OF THE MERGER PLAN WITH RESPECT TO THE REORGANIZATION OF THE MULTIMANAGER LARGE CAP VALUE PORTFOLIO INTO THE EQ/LARGE CAP VALUE PLUS PORTFOLIO.
This Proposal 7 requests your approval of the Merger Plan, pursuant to which the Multimanager Large Cap Value Portfolio will be reorganized into the EQ/Large Cap Value PLUS Portfolio.
In considering whether you should approve this Proposal, you should note that:
| • | The Portfolios have identical investment objectives. Each Portfolio seeks to achieve long-term growth of capital with an emphasis on risk-adjusted returns and managing volatility in the Portfolio. |
| • | The Portfolios also have similar investment policies. Both Portfolios invest at least 80% of their net assets, plus borrowings for investment purposes, in securities of large capitalization companies. In addition, each Portfolio also may invest up to 25% of its assets in derivatives, such as exchange-traded futures and options contracts on securities indices. Further, each Portfolio’s assets are allocated among three or more investment sub-advisers (each, an “Adviser”), each of which manages its portion of the Portfolio using a different but complementary investment strategy. A portion or portions of each Portfolio are actively managed by an Adviser (the “Active Allocated Portion” or the “Active Allocated Portions”) and a portion of each Portfolio seeks to track the performance of the Russell 1000® Value Index (the “Index Allocated Portion”). |
| • | There are, however, differences in the Portfolios’ primary investment policies and strategies of which you should be aware. One primary difference between the two Portfolios is that one portion of the EQ/Large Cap Value PLUS Portfolio invests in exchange-traded funds (“ETFs”) (the “ETF Allocated Portion”). The Multimanager Large Cap Value Portfolio does not have an ETF Allocated Portion and does not otherwise invest in ETFs as a principal investment strategy. Since ETFs incur their own management and other fees and expenses, a proportionate share of these expenses will be borne by the EQ/Large Cap Value PLUS Portfolio, which could cause certain of the Portfolio’s operating expenses to be higher. |
71
Further, the percentage of each Portfolio’s assets that are allocated to the Active and Index Allocated Portions varies. Under normal circumstances, the Active Allocated Portion of the EQ/Large Cap Value PLUS Portfolio consists of approximately 30% of its net assets and the Index Allocated Portion consists of approximately 60% of its net assets. (The remaining 10% of the EQ/Large Cap Value PLUS Portfolio’s assets are allocated to the ETF Allocated Portion.) In contrast, under normal market conditions, the Active Allocated Portions and Index Allocated Portion of the Multimanager Large Cap Value Portfolio each consist of approximately 50% of its net assets. For a detailed comparison of the Portfolios’ investment policies and strategies, see “Comparison of Investment Objectives, Policies, and Strategies” below.
| • | The Portfolios have comparable risk profiles, although there are differences in the principal risks. Each Portfolio’s principal risks include cash management risk, custom benchmark risk, derivatives risk, equity risk, futures contract risk, index strategy risk, investment style risk, large-cap company risk, leverage or leveraging risk, short position risk, and volatility management risk. The EQ/Large Cap Value PLUS Portfolio, however, also is subject to ETF risk and portfolio turnover risk as principal risks, which are not principal risks of the Multimanager Large Cap Value Portfolio. For a detailed comparison of each Portfolio’s risks, see “Comparison of Principal Risk Factors” below. |
| • | FMG LLC (the “Manager”) serves as the investment manager and administrator for each Portfolio and would continue to manage and administer the EQ/Large Cap Value PLUS Portfolio after the Reorganization. FMG LLC has received an exemptive order from the SEC that generally permits FMG LLC and each Trust’s Board of Trustees to appoint, dismiss and replace each Portfolio’s Adviser(s) and to amend the advisory agreements between FMG LLC and the Advisers without obtaining shareholder approval (except with respect to Affiliated Advisers (as defined herein)). FMG LLC has appointed three advisers to manage distinct portions of the Multimanager Large Cap Value Portfolio. In particular, AllianceBernstein L.P. is responsible for the management of portions of the Index Allocated and Active Allocated Portions of the Multimanager Large Cap Value Portfolio, and Institutional Capital LLC and MFS Investment Management are responsible for managing portions of the Active Allocated Portion of the Multimanager Large Cap Value Portfolio. FMG LLC has appointed two Advisers to manage distinct portions of the EQ/Large Cap Value PLUS Portfolio’s assets. In particular, AllianceBernstein L.P., which is responsible for the management of a portion of the Active Allocated Portion and the Index Allocated Portion of the EQ/Large Cap Value PLUS Portfolio, and BlackRock Investment Management, LLC, which is responsible for the management of a portion of the Active Allocated Portion of the EQ/Large Cap Value PLUS Portfolio, currently serve as Advisers to the EQ/Large Cap Value PLUS Portfolio and it is anticipated that they will continue to advise their respective portion of the EQ/Large Cap Value PLUS Portfolio after the Reorganization. In addition, it is anticipated |
72
that MFS Investment Management will be added as an Adviser to a portion of the Active Allocated Portion of the EQ/Large Cap Value PLUS Portfolio following the Reorganization. FMG LLC is responsible for the management of the ETF Allocated Portion of the EQ/Large Cap Value PLUS Portfolio, and it is anticipated that it would continue to manage the ETF Allocated Portion of the EQ/Large Cap Value PLUS Portfolio after the Reorganization. For a detailed description of the Manager and the EQ/Large Cap Value PLUS Portfolio’s Advisers, please see “Additional Information about the Acquiring Portfolios — The Manager” and “— The Advisers” below. |
| • | The Multimanager Large Cap Value and EQ/Large Cap Value PLUS Portfolios had net assets of approximately $700 million and $5.5 billion, respectively, as of December 31, 2013. Thus, if the Reorganization had been in effect on that date, the combined Portfolio would have had net assets of approximately $6.2 billion. |
| • | Class A shareholders of the Multimanager Large Cap Value Portfolio will receive Class IA shares of the EQ/Large Cap Value PLUS Portfolio, Class B shareholders of the Multimanager Large Cap Value Portfolio will receive Class IB shares of the EQ/Large Cap Value PLUS Portfolio, and Class K shareholders of the Multimanager Large Cap Value Portfolio will receive Class K Shares of the EQ/Large Cap Value PLUS Portfolio pursuant to the Reorganization. Shareholders will not pay any sales charges in connection with the Reorganization. Please see “Comparative Fee and Expense Tables,” “Additional Information about the Reorganizations” and “Additional Information about the Acquiring Portfolios” below for more information. |
| • | It is estimated that the annual operating expense ratios for the EQ/Large Cap Value PLUS Portfolio’s Class IA, Class IB, and Class K shares, for the fiscal year following the Reorganization, will be lower than those of the Multimanager Large Cap Value Portfolio’s Class A, Class B, and Class K shares, respectively, for the fiscal year ended December 31, 2013. For a more detailed comparison of the fees and expenses of the Portfolios, please see “Comparative Fee and Expense Tables” and “Additional Information about the Acquiring Portfolios” below. |
| • | The maximum management fee for the Multimanager Large Cap Value Portfolio is equal to an annual rate of 0.75% of its average daily net assets, while the maximum management fee for the EQ/Large Cap Value PLUS Portfolio is equal to an annual rate of 0.50% of its average daily net assets. The administration fee schedule for the Multimanager Large Cap Value Portfolio is its proportionate share of an asset-based administration fee for the Multimanager Large Cap Value Portfolio and certain other of VIP Trust’s multi-adviser portfolios, which is equal to an annual rate of 0.15% of these portfolios’ total average daily net assets up to and including $15 billion; 0.125% of these portfolios’ total average daily net assets in excess of $15 billion up to and including $30 billion; and 0.10% of these portfolios’ total average daily net assets in excess of $30 billion, |
73
plus an annual flat fee of $32,500 if the Multimanager Large Cap Value Portfolio’s total average net assets are less than $5 billion. The EQ/Large Cap Value PLUS Portfolio pays FMG LLC its proportionate share of an asset-based administration fee for the EQ/Large Cap Value PLUS Portfolio and certain other of EQ Trust’s portfolios, which is equal to an annual rate of 0.15% of the first $20 billion of these portfolios’ aggregate average daily net assets, 0.110% of the next $5 billion of these portfolios’ aggregate average daily net assets, and 0.10% of these portfolios’ aggregate average daily net assets thereafter, plus an annual flat fee of $32,500 if the EQ/Large Cap Value PLUS Portfolio’s total average net assets are less than $5 billion. For a more detailed description of the fees and expenses of the Portfolios, please see “Comparative Fee and Expense Tables” and “Additional Information about the Acquiring Portfolios” below. |
| • | Following the Reorganization, the combined Portfolio will be managed in accordance with the investment objective, policies, and strategies of the EQ/Large Cap Value PLUS Portfolio. It is not expected that the EQ/Large Cap Value PLUS Portfolio will revise any of its investment policies following the Reorganization to reflect those of the Multimanager Large Cap Value Portfolio. FMG LLC has reviewed the Multimanager Large Cap Value Portfolio’s current portfolio holdings and determined that, because both Portfolios invest in securities of large capitalization companies, the Multimanager Large Cap Value Portfolio’s holdings are generally consistent and compatible with the EQ/Large Cap Value PLUS Portfolio’s current portfolio composition and investment objectives, policies, and strategies and, thus, a large majority of the Multimanager Large Cap Value Portfolio’s assets could be transferred to and held by the EQ/Large Cap Value PLUS Portfolio if the Reorganization is approved. However, it is expected that some of those holdings may not remain at the time of the Reorganization due to normal portfolio turnover. If the Reorganization is approved, the Manager will liquidate that portion of the Multimanager Large Cap Value Portfolio’s holdings that, based on market conditions and an assessment by the Manager and the EQ/Large Cap Value PLUS Portfolio’s Advisers, is not compatible with the EQ/Large Cap Value PLUS Portfolio’s current portfolio composition or investment objective, policies, or strategies. The proceeds of such liquidation will be held in temporary investments or reinvested in assets that are consistent with the EQ/Large Cap Value PLUS Portfolio’s investment objective, policies and strategies. Although any sale of portfolio investments in connection with the Reorganization would be conducted in an orderly manner, the need for the Portfolio to sell such investments may result in its selling securities at a disadvantageous time and price and could result in the Portfolio’s realizing gains (or losses) that otherwise would not have been realized and incurring transaction costs that otherwise would not have been incurred. |
| • | The Multimanager Large Cap Value Portfolio will bear its proportionate share (based on the fraction that its shareholder accounts bears to the aggregate shareholder accounts of all Acquired Portfolios covered by the Merger Plan, |
74
i.e., those mentioned below, at the Valuation Time) of the first $325,000 of the “’Identified Expenses’ (as defined below under ‘Additional Information about the Reorganizations – Terms of the Reorganization Plans’)” of the Reorganizations of the Multimanager Large Cap Core Equity, Multimanager Large Cap Value, and Multimanager International Equity Portfolios. FMG LLC generally will bear expenses of the Reorganizations of these Portfolios in excess of this amount, subject to certain limitations. For additional information, please refer to “Additional Information About the Reorganizations — Terms of the Reorganization Plans” below. |
Comparative Fee and Expense Tables
The following tables show the fees and expenses of each class of shares of each Portfolio and the estimated pro forma fees and expenses of each class of shares of the Acquiring Portfolio after giving effect to the proposed Reorganization. Fees and expenses for each Portfolio are based on those incurred by each class of its shares for the fiscal year ended December 31, 2013. The pro forma fees and expenses of the Acquiring Portfolio Shares assume that the Reorganization has been in effect for the year ended December 31, 2013. The tables below do not reflect any Contract-related fees and expenses, which would increase overall fees and expenses. See a Contract prospectus for a description of those fees and expenses.
Shareholder Fees
(fees paid directly from your investment)
Multimanager Large Cap | EQ/Large Cap Value PLUS | Pro Forma EQ/Large Cap Value PLUS (assuming the Reorganization is approved) | ||
Not applicable. | Not applicable. | Not applicable. |
75
Annual Operating Expenses
(expenses that you may pay each year as a percentage of the value of your investment)
| Multimanager Large Cap Value Portfolio | EQ/Large Cap Value PLUS Portfolio | Pro Forma EQ/Large Cap Value PLUS Portfolio (assuming the Reorganization is approved) | ||||||||||||||||||||||||||||||||||
| Class A | Class B | Class K | Class IA | Class IB | Class K | Class IA | Class IB | Class K | ||||||||||||||||||||||||||||
Management Fee | 0.74 | % | 0.74 | % | 0.74 | % | 0.47 | % | 0.47 | % | 0.47 | % | 0.46 | % | 0.46 | % | 0.46 | % | ||||||||||||||||||
Distribution and/or Service Fees (12b-1 fees) | 0.25 | % | 0.25 | % | None | 0.25 | % | 0.25 | % | None | 0.25 | % | 0.25 | % | None | |||||||||||||||||||||
Other Expenses | 0.20 | % | 0.20 | % | 0.20 | % | 0.17 | % | 0.17 | % | 0.17 | % | 0.16 | % | 0.16 | % | 0.16 | % | ||||||||||||||||||
Total Annual Portfolio Operating Expenses | 1.19 | % | 1.19 | % | 0.94 | % | 0.89 | % | 0.89 | % | 0.64 | % | 0.87 | % | 0.87 | % | 0.62 | % | ||||||||||||||||||
Fee Waiver and Expense Reimbursement† | -0.04 | % | -0.04 | % | -0.04 | % | N/A | N/A | N/A | N/A | N/A | N/A | ||||||||||||||||||||||||
Net Annual Portfolio Operating Expenses After Fee Waiver and/or Expense Reimbursement | 1.15 | % | 1.15 | % | 0.90 | % | 0.89 | % | 0.89 | % | 0.64 | % | 0.87 | % | 0.87 | % | 0.62 | % | ||||||||||||||||||
| † | Pursuant to a contract, FMG LLC has agreed to make payments or waive its management, administrative and other fees to limit the expenses of the Multimanager Large Cap Value Portfolio through April 30, 2015 (unless the VIP Board consents to an earlier revision or termination of this arrangement) so that the annual operating expenses of the Multimanager Large Cap Value Portfolio (exclusive of taxes, interest, brokerage commissions, capitalized expenses, fees and expenses of other investment companies in which the Multimanager Large Cap Value Portfolio invests, dividend and interest expenses on securities sold short, and extraordinary expenses) do not exceed an annual rate of average daily net assets of 1.15% for Class A and Class B shares and 0.90% for Class K shares of the Multimanager Large Cap Value Portfolio. The Expense Limitation Agreement may be terminated by FMG LLC at any time after April 30, 2015. |
76
This example is intended to help you compare the costs of investing in the Portfolios with the cost of investing in other investment options. The example assumes that:
| • | You invest $10,000 in a Portfolio for the time periods indicated; |
| • | Your investment has a 5% return each year; |
| • | The Portfolio’s operating expenses remain the same; and |
| • | The Expense Limitation Agreement currently in effect for the Multimanager Large Cap Value Portfolio is not renewed. |
This example does not reflect any Contract-related fees and expenses, including redemption fees (if any) at the Contract level. If such fees and expenses were reflected, the total expenses would be higher. Although your actual costs may be higher or lower, based on these assumptions your costs would be:
| 1 Year | 3 Years | 5 Years | 10 Years | |||||||||||||
Multimanager Large Cap Value Portfolio | ||||||||||||||||
Class A | $ | 117 | $ | 374 | $ | 650 | $ | 1,440 | ||||||||
Class B | $ | 117 | $ | 374 | $ | 650 | $ | 1,440 | ||||||||
Class K | $ | 92 | $ | 296 | $ | 516 | $ | 1,151 | ||||||||
EQ/Large Cap Value PLUS Portfolio | ||||||||||||||||
Class IA | $ | 91 | $ | 284 | $ | 493 | $ | 1,096 | ||||||||
Class IB | $ | 91 | $ | 284 | $ | 493 | $ | 1,096 | ||||||||
Class K | $ | 65 | $ | 205 | $ | 357 | $ | 798 | ||||||||
Pro Forma Large Cap Value PLUS Portfolio (assuming the Reorganization is approved) | ||||||||||||||||
Class IA | $ | 89 | $ | 278 | $ | 482 | $ | 1,073 | ||||||||
Class IB | $ | 89 | $ | 278 | $ | 482 | $ | 1,073 | ||||||||
Class K | $ | 63 | $ | 199 | $ | 346 | $ | 774 | ||||||||
The Portfolio pays transaction costs, such as commissions, when it buys and sells securities (or “turns over” its portfolio). A higher portfolio turnover rate may indicate higher transaction costs. These costs, which are not reflected in annual fund operating expenses or in the example, affect the Portfolio’s performance. During the fiscal year ended December 31, 2013, the portfolio turnover rate for the Multimanager Large Cap Value Portfolio and EQ/Large Cap Value PLUS Portfolio was 28% and 37%, respectively, of the average value of the Portfolio.
77
Comparison of Investment Objectives, Policies, and Strategies
The following table compares the investment objectives and principal investment policies and strategies of the Multimanager Large Cap Value Portfolio with those of the EQ/Large Cap Value PLUS Portfolio. Each Trust’s Board may change the investment objective of a Portfolio without a vote of the Portfolio’s shareholders. For more detailed information about each Portfolio’s investment strategies and risks, see Appendix C.
| Acquiring Portfolio | Acquired Portfolio | |||
| EQ/Large Cap Value PLUS Portfolio | Multimanager Large Cap Value Portfolio | |||
Investment Objective | Seeks to achieve long-term growth of capital with an emphasis on risk-adjusted returns and managing volatility in the Portfolio. | Same. | ||
Principal Investment Strategies | Under normal circumstances, the Portfolio invests at least 80% of its net assets, plus borrowings for investment purposes, in securities of large-cap companies (or other financial instruments that derive their value from the securities of such companies). | Under normal circumstances, the Portfolio intends to invest at least 80% of its net assets, plus borrowings for investment purposes, in equity securities of U.S. large capitalization companies.
The Portfolio intends to invest primarily in common stocks, but it may also invest in other securities that the Advisers believe provide opportunities for capital growth. | ||
| For this Portfolio, large-cap companies mean those companies with market capitalizations within the range of at least one of the following indices at the time of purchase: S&P 500 Index (market capitalization range of approximately $1.65 billion - $500.5 billion as of December 31, 2012), Russell 1000® Index (market capitalization range of approximately $319.35 million - $500.5 billion as of December 31, 2012), S&P 100 Index (market capitalization range of approximately $17.6 billion - $500.5 billion as of December 31, 2012) Morningstar Large Core Index (market capitalization range of approximately $11.05 billion - $228.25 billion as of December 31, 2012), NYSE 100 Index (market capitalization $21.08 billion - $389.65 billion as of December 31, 2012). | For purposes of this Portfolio, large capitalization companies are companies with market capitalization within the range of the Russell 1000® Index at the time of investment (market capitalization range of approximately $319.4 million to $500.5 billion as of December 31, 2012). In addition, securities of large-capitalization companies may include financial instruments that derive their value from the securities of such companies. The size of companies in the Russell 1000® Index changes with market conditions, which can result in changes to the market capitalization range of companies in the Index. |
78
| Acquiring Portfolio | Acquired Portfolio | |||
| EQ/Large Cap Value PLUS Portfolio | Multimanager Large Cap Value Portfolio | |||
| The Portfolio’s assets normally are allocated among three Advisers, each of which manages its portion of the Portfolio using a different but complementary investment strategy. One portion of the Portfolio is an Active Allocated Portion; one portion of the Portfolio is an Index Allocated Portion; and one portion of the Portfolio is an ETF Allocated Portion. Under normal circumstances, the Active Allocated Portion consists of approximately 30% of the Portfolio’s net assets and the Index Allocated Portion consists of approximately 60% of the Portfolio’s net assets and the ETF Allocated Portion consists of approximately 10% of the Portfolio’s net assets. | FMG LLC will generally allocate the Portfolio’s assets among three or more Advisers, each of which will manage its portion of the Portfolio using different yet complementary investment strategies. Under normal circumstances, one portion of the Portfolio is an Index Allocated Portion and the other portions of the Portfolio are Active Allocated Portions. Under normal circumstances, FMG LLC anticipates allocating approximately 50% of the Portfolio’s net assets to the Index Allocated Portion and the remaining 50% of net assets among the Active Allocated Portions. These percentages are targets established by FMG LLC and actual allocations between the portions may deviate from these targets by up to 20% of the Portfolio’s net assets. | |||
| The Active Allocated Portion of the Portfolio utilizes a value-oriented investment style and invests primarily in equity securities of companies that, in the view of the Advisers, are currently underpriced according to certain financial measurements, which may include price-to-earnings and price-to-book ratios and dividend income potential. These Advisers may sell a security for a variety of reasons, such as because it becomes overvalued, shows deteriorating fundamentals or to invest in a company believed to offer superior investment opportunities. | Each Active Allocated Portion utilizes a value-oriented investment style and invests primarily in equity securities of companies that, in the view of the Adviser, are currently underpriced according to certain financial measurements, which may include price-to-earnings and price-to-book ratios and dividend income potential. These Advisers may sell a security for a variety of reasons, such as because it becomes overvalued or shows deteriorating fundamentals. | |||
| The Index Allocated Portion of the Portfolio seeks to track the performance (before fees and expenses) of the Russell 1000® Value Index with minimal tracking error. This strategy is commonly referred to as an indexing strategy. Generally, the Index Allocated Portion uses a full replication technique, although in certain instances a sampling approach may be utilized for a portion of the Index Allocated Portion. The Index Allocated Portion also may invest in other instruments, such as futures and options contracts, that provide comparable exposure as the index without buying the underlying securities comprising the index. | Same. |
79
| Acquiring Portfolio | Acquired Portfolio | |||
| EQ/Large Cap Value PLUS Portfolio | Multimanager Large Cap Value Portfolio | |||
| The Manager also may utilize futures and options, such as exchange-traded futures and options contracts on securities indices, to manage equity exposure. Futures and options can provide exposure to the performance of a securities index without buying the underlying securities comprising the index. They also provide a means to manage the Portfolio’s equity exposure without having to buy or sell securities. When market volatility is increasing above specific thresholds set for the Portfolio, the Manager may limit equity exposure either by reducing investments in securities, shorting or selling long futures and options positions on an index, increasing cash levels, and/or shorting an index. During such times, the Portfolio’s exposure to equity securities may be significantly less than that of a traditional equity portfolio. Although these actions are intended to reduce the overall risk of investing in the Portfolio, they may result in periods of underperformance. The Portfolio may invest up to 25% of its assets in derivatives. It is anticipated that the Portfolio’s derivative instruments will consist primarily of exchange-traded futures and options contracts on securities indices, but the Portfolio also may utilize other types of derivatives. The Portfolio’s investments in derivatives may be deemed to involve the use of leverage because the Portfolio is not required to invest the full market value of the contract upon entering into the contract but participates in gains and losses on the full contract price. The use of derivatives also may be deemed to involve the use of leverage because the heightened price sensitivity of some derivatives to market changes may magnify the Portfolio’s gain or loss. It is not generally expected, however, that the Portfolio will be leveraged by borrowing money for investment purposes. In addition, the Portfolio generally does not intend to use leverage to increase its net investment exposure above approximately 100% of the Portfolio’s net asset value or below 0%. The Portfolio may maintain a significant percentage of its assets in cash and cash equivalent instruments, some of which may serve as margin or collateral for the Portfolio’s obligations under derivative transactions. | Same. |
80
| Acquiring Portfolio | Acquired Portfolio | |||
| EQ/Large Cap Value PLUS Portfolio | Multimanager Large Cap Value Portfolio | |||
| The ETF Allocated Portion invests in ETFs (the “Underlying ETFs”) that meet the investment criteria of the Portfolio as a whole. The Underlying ETFs in which the ETF Allocated Portion may invest may be changed from time to time without notice or shareholder approval. | No corresponding strategy. |
Comparison of Principal Risk Factors
An investment in a Portfolio is not a deposit of a bank and is not insured or guaranteed by the Federal Deposit Insurance Corporation or any other government agency. You may lose money by investing in a Portfolio. The following table compares the principal risks of an investment in each Portfolio. For an explanation of each such risk, see “Additional Information about the Reorganizations — Description of Risk Factors” below.
Risks | EQ/Large Cap Value PLUS Portfolio | Multimanager Large Cap Value Portfolio | ||||||
Cash Management Risk | X | X | ||||||
Custom Benchmark Risk | X | X | ||||||
Derivatives Risk | X | X | ||||||
Equity Risk | X | X | ||||||
ETF Risk | X | |||||||
Futures Contract Risk | X | X | ||||||
Index Strategy Risk | X | X | ||||||
Investment Style Risk | X | X | ||||||
Large-Cap Company Risk | X | X | ||||||
Leverage Risk/Leveraging Risk | X | X | ||||||
Portfolio Turnover Risk | X | |||||||
Short Position Risk | X | X | ||||||
Volatility Management Risk | X | X | ||||||
Comparative Performance Information
The bar charts and tables below provide some indication of the risks of investing in each Portfolio by showing changes in the Portfolio’s performance from year to year and by showing how the Portfolios’ average annual total returns for the past one year, five years and since inception through December 31, 2013 compared to the returns of a broad-based market index. The additional broad-based market index shows how the Portfolio’s performance compared with the returns of a volatility managed index. Past performance is not an indication of future performance.
The performance results do not reflect any Contract-related fees and expenses, which would reduce the performance results.
81
Multimanager Large Cap Value Portfolio - Calendar Year Total Returns (Class B)
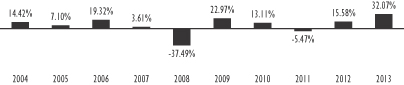
Best Quarter (% and time period) 16.77% (2009 2nd Quarter) | Worst Quarter (% and time period) -21.20% (2008 4th Quarter) |
EQ/Large Cap Value PLUS Portfolio - Calendar Year Total Returns (Class IB)
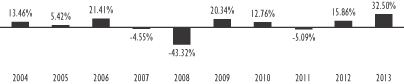
Best Quarter (% and time period) 17.58% (2009 3rd Quarter) | Worst Quarter (% and time period) -24.24% (2008 4th Quarter) |
Multimanager Large Cap Value Portfolio
Average Annual Total Returns (For the periods ended December 31, 2013) | One Year | Five Years | Ten Years/ Since Inception | |||||||||
Multimanager Large Cap Value Portfolio — Class A | 32.20 | % | 15.12 | % | 6.85 | % | ||||||
Multimanager Large Cap Value Portfolio — Class B | 32.07 | % | 14.95 | % | 6.63 | % | ||||||
Multimanager Large Cap Value Portfolio — Class K (Inception Date: August 26, 2011) | 32.53 | % | N/A | 22.32 | % | |||||||
Russell 1000® Value Index† | 32.53 | % | 16.67 | % | 7.58 | % | ||||||
Volatility Managed Index — Large Cap Value* | 32.46 | % | 15.67 | % | 9.32 | % | ||||||
82
EQ/Large Cap Value PLUS Portfolio
Average Annual Total Returns (For the periods ended December 31, 2013) | One Year | Five Years | Ten Years/ Since Inception | |||||||||
EQ/Large Cap Value PLUS Portfolio — Class IA | 32.54 | % | 14.77 | % | 4.73 | % | ||||||
EQ/Large Cap Value PLUS Portfolio — Class IB | 32.50 | % | 14.60 | % | 4.50 | % | ||||||
EQ/Large Cap Value PLUS Portfolio — Class K | 32.87 | % | N/A | 22.76 | % | |||||||
Russell 1000® Value Index† | 32.53 | % | 16.67 | % | 7.58 | % | ||||||
Volatility Managed Index — Large Cap Value* | 32.46 | % | 15.67 | % | 9.32 | % | ||||||
| † | The Russell 1000® Value Index measures the performance of those Russell 1000® Index companies with lower price to book ratios and lower forecasted growth values. The Russell 1000® Index measures the performance of approximately 1,000 of the largest companies in the Russell 3000®, and represents approximately 92% of the total market capitalization of the Russell 3000®. |
| * | The Volatility Managed Index — Large Cap Value is an index that applies a formula to a blend of the S&P 500 Index and the Russell 1000® Value Index adjusting the equity exposure of the S&P 500 Index when certain volatility levels are reached. The S&P 500 Index is a weighted index of common stocks of 500 leading companies in leading industries of the U.S. economy, capturing 75% coverage of U.S. equities. The index is capitalization weighted, thereby giving greater weight to companies with the largest market capitalizations. |
The following table shows the capitalization of each Portfolio as of December 31, 2013, and of the EQ/Large Cap Value PLUS Portfolio on a pro forma combined basis as of December 31, 2013, after giving effect to the proposed Reorganization. Pro forma net assets may not total and net asset values per share may not recalculate due to rounding of net assets.
| Net Assets (in millions) | Net Asset Value Per Share | Shares Outstanding | ||||||||||
Multimanager Large Cap Value Portfolio — Class A | $ | 12.7 | $ | 13.59 | 935,116 | |||||||
EQ/Large Cap Value PLUS Portfolio — Class IA | $ | 1,068.5 | $ | 14.29 | 74,782,216 | |||||||
Adjustments* | $ | — | $ | — | (45,651 | ) | ||||||
Pro forma EQ/Large Cap Value PLUS Portfolio — Class IA (assuming the Reorganization is approved) | $ | 1,081.2 | $ | 14.29 | 75,671,681 | |||||||
Multimanager Large Cap Value Portfolio — Class B | $ | 94.9 | $ | 13.59 | 6,978,472 | |||||||
EQ/Large Cap Value PLUS Portfolio — Class IB | $ | 3,852.9 | $ | 14.26 | 270,277,286 | |||||||
Adjustments* | $ | — | $ | — | (324,079 | ) | ||||||
Pro forma EQ/Large Cap Value PLUS Portfolio — Class IB (assuming the Reorganization is approved) | $ | 3,947.8 | $ | 14.26 | 276,931,679 | |||||||
Multimanager Large Cap Value Portfolio — Class K | $ | 596.4 | $ | 13.59 | 43,875,783 | |||||||
EQ/Large Cap Value PLUS Portfolio — Class K | $ | 597.9 | $ | 14.29 | 41,843,089 | |||||||
Adjustments* | $ | — | $ | — | (2,137,459 | ) | ||||||
Pro Forma EQ/Large Cap Value PLUS Portfolio — Class K (assuming the Reorganization is approved) | $ | 1,194.2 | $ | 14.29 | 83,581,413 | |||||||
| * | Reflects adjustment for retired shares of the Acquired Portfolio. |
83
Reorganizations of these Portfolios in excess of this amount, subject to certain limitations. For additional information, please refer to “Additional Information About the Reorganizations — Terms of the Reorganization Plans” below. |
AFTER CAREFUL CONSIDERATION, THE VIP BOARD UNANIMOUSLY APPROVED THE MERGER PLAN WITH RESPECT TO THE MULTIMANAGER LARGE CAP VALUE PORTFOLIO. ACCORDINGLY, THE BOARD HAS SUBMITTED THE MERGER PLAN FOR APPROVAL BY THIS PORTFOLIO’S SHAREHOLDERS. THE BOARD RECOMMENDS THAT YOU VOTE “FOR” PROPOSAL 7.
PROPOSAL 8: APPROVAL OF THE MERGER PLAN WITH RESPECT TO THE REORGANIZATION OF THE MULTIMANAGER INTERNATIONAL EQUITY PORTFOLIO INTO THE EQ/INTERNATIONAL CORE PLUS PORTFOLIO.
This Proposal 8 requests your approval of the Merger Plan, pursuant to which the Multimanager International Equity Portfolio will be reorganized into the EQ/International Core PLUS Portfolio.
In considering whether you should approve this Proposal, you should note that:
| • | The Portfolios have identical investment objectives. Each Portfolio seeks to achieve long-term growth of capital with an emphasis on risk-adjusted returns and managing volatility in the Portfolio. |
| • | The Portfolios also have similar investment policies. Each Portfolio primarily invests in foreign equity securities and also may invest up to 25% of its assets in derivatives, such as exchange-traded futures and options contracts on securities indices. In addition, each Portfolio’s assets are allocated among three or more investment sub-advisers (each, an “Adviser”), each of which manages its portion of the Portfolio using a different but complementary investment strategy. A portion or portions of each Portfolio are actively managed by an Adviser (the “Active Allocated Portion” or the “Active Allocated Portions”) and a portion of each Portfolio seeks to track the performance of the Morgan Stanley Capital International (“MSCI”) Europe, Australasia and Far East (“EAFE”) Index (the “Index Allocated Portion”). |
| • | There are, however, differences in the Portfolios’ primary investment policies and strategies of which you should be aware. One primary difference between the two Portfolios is that one portion of the EQ/International Core PLUS Portfolio invests in exchange-traded funds (“ETFs”) (the “ETF Allocated Portion”). The Multimanager International Equity Portfolio does not have an ETF Allocated Portion and does not otherwise invest in ETFs as a principal investment strategy. Since ETFs incur their own management and other fees and expenses, a proportionate share of these expenses will be borne by the EQ/International Core PLUS Portfolio, which could cause certain of the Portfolio’s operating expenses to be higher. |
84
Further, the percentage of each Portfolio’s assets that are allocated to the Active and Index Allocated Portions varies. Under normal circumstances, the Active Allocated Portion of the EQ/International Core PLUS Portfolio consists of approximately 30% of its net assets and the Index Allocated Portion consists of approximately 60% of its net assets. (The remaining 10% of the EQ/International Core PLUS Portfolio’s assets are allocated to the ETF Allocated Portion.) In contrast, under normal market conditions, the Active Allocated Portions and Index Allocated Portion of the Multimanager International Equity Portfolio each consist of approximately 50% of its net assets. For a detailed comparison of the Portfolios’ investment policies and strategies, see “Comparison of Investment Objectives, Policies, and Strategies” below.
| • | The Portfolios have comparable risk profiles, although there are differences in the principal risks. Each Portfolio’s principal risks include derivatives risk, equity risk, foreign securities risk, large-cap company risk, mid-cap and small-cap company risk, and volatility management risk. The EQ/International Core PLUS Portfolio, however, also is subject to ETF risk, which is not a principal risk of the Multimanager International Equity Portfolio. For a detailed comparison of each Portfolio’s risks, see “Comparison of Principal Risk Factors” below. |
| • | FMG LLC (the “Manager”) serves as the investment manager and administrator for each Portfolio and would continue to manage and administer the EQ/International Core PLUS Portfolio after the Reorganization. FMG LLC has received an exemptive order from the SEC that generally permits FMG LLC and each Trust’s Board of Trustees to appoint, dismiss and replace each Portfolio’s Adviser(s) and to amend the advisory agreements between FMG LLC and the Advisers without obtaining shareholder approval (except with respect to Affiliated Advisers (as defined herein)). FMG LLC has appointed four Advisers to manage distinct portions of the Multimanager International Equity Portfolio. In particular, EARNEST Partners, LLC, J.P. Morgan Investment Management Inc., and Marsico Capital Management, LLC are responsible for the management of portions of the Active Allocated Portion of the Multimanager International Equity Portfolio, and BlackRock Investment Management, LLC is responsible for the management of the Index Allocated Portion of the Multimanager International Equity Portfolio. FMG LLC has appointed three Advisers to manage distinct portions of the EQ/International Core PLUS Portfolio’s assets. In particular, WHV Investment Management and its affiliate Hirayama Investments, LLC and Massachusetts Financial Services Company d/b/a/ MFS Investment Management, which are responsible for the management of portions of the Active Allocated Portion of the EQ/International Core PLUS Portfolio, and BlackRock Investment Management, LLC, which is responsible for the management of the Index Allocated Portion of the EQ/International Core PLUS Portfolio, currently |
85
serve as Advisers to the EQ/International Core PLUS Portfolio and it is anticipated that they will continue to advise their respective portions of the EQ/International Core PLUS Portfolio after the Reorganization. In addition, it is anticipated that EARNEST Partners, LLC will be added as an Adviser to a portion of the Active Allocated Portion of the EQ/International Core PLUS Portfolio following the Reorganization. FMG LLC is responsible for the management of the ETF Allocated Portion of the EQ/International Core PLUS Portfolio, and it is anticipated that it would continue to manage the ETF Allocated Portion of the EQ/International Core PLUS Portfolio after the Reorganization. For a detailed description of the Manager and the EQ/International Core PLUS Portfolio’s Advisers, please see “Additional Information about the Acquiring Portfolios — The Manager” and “— The Advisers” below. |
| • | The Multimanager International Equity and EQ/International Core PLUS Portfolios had net assets of approximately $353.27 million and $1.97 billion, respectively, as of December 31, 2013. Thus, if the Reorganization had been in effect on that date, the combined Portfolio would have had net assets of approximately $2.32 billion. |
| • | Class A shareholders of the Multimanager International Equity Portfolio will receive Class IA shares of the EQ/International Core PLUS Portfolio, Class B shareholders of the Multimanager International Equity Portfolio will receive Class IB shares of the EQ/International Core PLUS Portfolio, and Class K shareholders of the Multimanager International Equity Portfolio will receive Class K Shares of the EQ/International Core PLUS Portfolio pursuant to the Reorganization. Shareholders will not pay any sales charges in connection with the Reorganization. Please see “Comparative Fee and Expense Tables,” “Additional Information about the Reorganizations” and “Additional Information about the Acquiring Portfolios” below for more information. |
| • | It is estimated that the annual operating expense ratios for the EQ/International Core PLUS Portfolio’s Class IA, Class IB, and Class K shares, for the fiscal year following the Reorganization, will be lower than those of the Multimanager International Equity Portfolio’s Class A, Class B, and Class K shares, respectively, for the fiscal year ended December 31, 2013. For a more detailed comparison of the fees and expenses of the Portfolios, please see “Comparative Fee and Expense Tables” and “Additional Information about the Acquiring Portfolios” below. |
| • | The maximum management fee for the Multimanager International Equity Portfolio is equal to an annual rate of 0.85% of its average daily net assets, while the maximum management fee for the EQ/International Core PLUS Portfolio is equal to an annual rate of 0.60% of its average daily net assets. The administration fee schedule for the Multimanager International Equity |
86
Portfolio is its proportionate share of an asset-based administration fee for the Multimanager International Equity Portfolio and certain other of VIP Trust’s multi-adviser portfolios, which is equal to an annual rate of 0.15% of these portfolios’ total average daily net assets up to and including $15 billion; 0.125% of these portfolios’ total average daily net assets in excess of $15 billion up to and including $30 billion; and 0.10% of these portfolios’ total average daily net assets in excess of $30 billion, plus an annual flat fee of $32,500 if the Multimanager International Equity Portfolio’s total average net assets are less than $5 billion. The EQ/International Core PLUS Portfolio pays FMG LLC its proportionate share of an asset-based administration fee for the EQ/International Core PLUS Portfolio and certain other of EQ Trust’s portfolios, which is equal to an annual rate of 0.15% of the first $20 billion of these portfolios’ aggregate average daily net assets, 0.110% of these portfolios’ aggregate average daily net assets in excess of $20 billion up to and including $25 billion; and 0.10% of these portfolios’ aggregate average daily net assets in excess of $25 billion, plus an annual flat fee of $32,500 if the EQ/International Core PLUS Portfolio’s total average net assets are less than $5 billion. For a more detailed description of the fees and expenses of the Portfolios, please see “Comparative Fee and Expense Tables” and “Additional Information about the Acquiring Portfolios” below. |
| • | Following the Reorganization, the combined Portfolio will be managed in accordance with the investment objective, policies, and strategies of the EQ/International Core PLUS Portfolio. It is not expected that the EQ/International Core PLUS Portfolio will revise any of its investment policies following the Reorganization to reflect those of the Multimanager International Equity Portfolio. FMG LLC has reviewed the Multimanager International Equity Portfolio’s current portfolio holdings and determined that, because both Portfolios invest in foreign securities, the Multimanager International Equity Portfolio’s holdings are generally consistent and compatible with the EQ/International Core PLUS Portfolio’s current portfolio composition and investment objectives, policies, and strategies and, thus, a large majority of the Multimanager International Equity Portfolio’s assets could be transferred to and held by the EQ/International Core PLUS Portfolio if the Reorganization is approved. However, it is expected that some of those holdings may not remain at the time of the Reorganization due to normal portfolio turnover. If the Reorganization is approved, the Manager will liquidate that portion of the Multimanager International Equity Portfolio’s holdings that, based on market conditions and an assessment by the Manager and the EQ/International Core PLUS Portfolio’s Advisers, is not compatible with the EQ/International Core PLUS Portfolio’s current portfolio composition or investment objective, policies, or strategies. The proceeds of such liquidation will be held in temporary investments or reinvested in assets that are consistent with the EQ/International Core PLUS Portfolio’s investment objective, policies and strategies. Although any sale of portfolio investments in connection |
87
with the Reorganization would be conducted in an orderly manner, the need for the Portfolio to sell such investments may result in its selling securities at a disadvantageous time and price and could result in the Portfolio’s realizing gains (or losses) that otherwise would not have been realized and incurring transaction costs that otherwise would not have been incurred. |
| • | The Multimanager International Equity Portfolio will bear its proportionate share (based on the fraction that its shareholder accounts bears to the aggregate shareholder accounts of all Acquired Portfolios covered by the Merger Plan, i.e., those mentioned below, at the Valuation Time) of the first $325,000 of the “’Identified Expenses’ (as defined below under ‘Additional Information about the Reorganizations — Terms of the Reorganization Plans’)” of the Reorganizations of the Multimanager Large Cap Core Equity, Multimanager Large Cap Value, and Multimanager International Equity Portfolios. FMG LLC generally will bear expenses of the Reorganizations of these Portfolios in excess of this amount, subject to certain limitations. For additional information, please refer to “Additional Information About the Reorganizations — Terms of the Reorganization Plans” below. |
Comparative Fee and Expense Tables
The following tables show the fees and expenses of each class of shares of each Portfolio and the estimated pro forma fees and expenses of each class of shares of the Acquiring Portfolio after giving effect to the proposed Reorganization. Fees and expenses for each Portfolio are based on those incurred by each class of its shares for the fiscal year ended December 31, 2013. The pro forma fees and expenses of the Acquiring Portfolio Shares assume that the Reorganization has been in effect for the year ended December 31, 2013. The tables below do not reflect any Contract-related fees and expenses, which would increase overall fees and expenses. See a Contract prospectus for a description of those fees and expenses.
Shareholder Fees
(fees paid directly from your investment)
Multimanager International | EQ/International Core PLUS | Pro Forma EQ/International Core PLUS (assuming the Reorganization is approved) | ||
Not applicable. | Not applicable. | Not applicable. |
88
Annual Operating Expenses
(expenses that you may pay each year as a percentage of the value of your investment)
| Multimanager International Equity Portfolio | EQ/International Core PLUS Portfolio | Pro Forma EQ/ International Core PLUS Portfolio (assuming the Reorganization is approved) | ||||||||||||||||||||||||||||||||||
| Class A | Class B | Class K | Class IA | Class IB | Class K | Class IA | Class IB | Class K | ||||||||||||||||||||||||||||
Management Fee | 0.85 | % | 0.85 | % | 0.85 | % | 0.60 | % | 0.60 | % | 0.60 | % | 0.60 | % | 0.60 | % | 0.60 | % | ||||||||||||||||||
Distribution and/or Service Fees (12b-1 fees) | 0.25 | % | 0.25 | % | None | 0.25 | % | 0.25 | % | None | 0.25 | % | 0.25 | % | None | |||||||||||||||||||||
Other Expenses | 0.30 | % | 0.25 | % | 0.30 | % | 0.20 | % | 0.20 | % | 0.20 | % | 0.16 | % | 0.16 | % | 0.16 | % | ||||||||||||||||||
Total Annual Portfolio Operating Expenses | 1.40 | % | 1.35 | % | 1.15 | % | 1.05 | % | 1.05 | % | 0.80 | % | 1.01 | % | 1.01 | % | 0.76 | % | ||||||||||||||||||
Fee Waiver and Expense Reimbursement† | -0.10 | % | -0.05 | % | -0.10 | % | N/A | N/A | N/A | N/A | N/A | N/A | ||||||||||||||||||||||||
Net Annual Portfolio Operating Expenses After Fee Waiver and/or Expense Reimbursement | 1.30 | % | 1.30 | % | 1.05 | % | 1.05 | % | 1.05 | % | 0.80 | % | 1.01 | % | 1.01 | % | 0.76 | % | ||||||||||||||||||
| † | Pursuant to a contract, FMG LLC has agreed to make payments or waive its management, administrative and other fees to limit the expenses of the Multimanager International Equity Portfolio through April 30, 2015 (unless the VIP Board consents to an earlier revision or termination of this arrangement) so that the annual operating expenses of the Multimanager International Equity Portfolio (exclusive of taxes, interest, brokerage commissions, capitalized expenses, fees and expenses of other investment companies in which the Multimanager International Equity Portfolio invests, dividend and interest expenses on securities sold short, and extraordinary expenses) do not exceed an annual rate of average daily net assets of 1.30% for Class A and Class B shares and 1.05% for Class K shares of the Multimanager International Equity Portfolio. The Expense Limitation Agreement may be terminated by FMG LLC at any time after April 30, 2015. |
89
This example is intended to help you compare the costs of investing in the Portfolios with the cost of investing in other investment options. The example assumes that:
| • | You invest $10,000 in a Portfolio for the time periods indicated; |
| • | Your investment has a 5% return each year; |
| • | The Portfolio’s operating expenses remain the same; and |
| • | The Expense Limitation Agreement currently in effect for the Multimanager International Equity Portfolio is not renewed. |
This example does not reflect any Contract-related fees and expenses, including redemption fees (if any) at the Contract level. If such fees and expenses were reflected, the total expenses would be higher. Although your actual costs may be higher or lower, based on these assumptions your costs would be:
| 1 Year | 3 Years | 5 Years | 10 Years | |||||||||||||
Multimanager International Equity Portfolio | ||||||||||||||||
Class A | $ | 132 | $ | 433 | $ | 756 | $ | 1,671 | ||||||||
Class B | $ | 132 | $ | 423 | $ | 735 | $ | 1,620 | ||||||||
Class K | $ | 107 | $ | 355 | $ | 623 | $ | 1,389 | ||||||||
EQ/International Core PLUS Portfolio | ||||||||||||||||
Class IA | $ | 107 | $ | 334 | $ | 579 | $ | 1,283 | ||||||||
Class IB | $ | 107 | $ | 334 | $ | 579 | $ | 1,283 | ||||||||
Class K | $ | 82 | $ | 255 | $ | 444 | $ | 990 | ||||||||
Pro Forma EQ/International Core PLUS Portfolio (assuming the Reorganization is approved) | ||||||||||||||||
Class IA | $ | 103 | $ | 322 | $ | 558 | $ | 1,236 | ||||||||
Class IB | $ | 103 | $ | 322 | $ | 558 | $ | 1,236 | ||||||||
Class K | $ | 78 | $ | 243 | $ | 422 | $ | 942 | ||||||||
The Portfolio pays transaction costs, such as commissions, when it buys and sells securities (or “turns over” its portfolio). A higher portfolio turnover rate may indicate higher transaction costs. These costs, which are not reflected in annual fund operating expenses or in the example, affect the Portfolio’s performance. During the fiscal year ended December 31, 2013, the portfolio turnover rate for the Multimanager International Equity Portfolio and EQ/International Core PLUS Portfolio was 38% and 15%, respectively, of the average value of the Portfolio.
90
Comparison of Investment Objectives, Policies, and Strategies
The following table compares the investment objectives and principal investment policies and strategies of the Multimanager International Equity Portfolio with those of the EQ/International Core PLUS Portfolio. Each Trust’s Board may change the investment objective of a Portfolio without a vote of the Portfolio’s shareholders. For more detailed information about each Portfolio’s investment strategies and risks, see Appendix C.
| Acquiring Portfolio | Acquired Portfolio | |||
EQ/International Core PLUS Portfolio | Multimanager International Equity Portfolio | |||
Investment Objective | Seeks to achieve long-term growth of capital with an emphasis on risk-adjusted returns and managing volatility in the Portfolio. | Same. | ||
Principal Investment Strategies | The Portfolio invests primarily in foreign equity securities (or other financial instruments that derive their value from the securities of such companies). | Under normal circumstances, the Portfolio intends to invest at least 80% of its net assets, plus borrowings for investment purposes, in equity securities, including at least 65% of its total assets in equity securities of foreign companies (securities of companies organized outside of the U.S. and that are traded in markets outside the U.S.). This policy may not be changed without providing at least sixty (60) days’ written notice to the Portfolio’s shareholders. | ||
| No corresponding strategy. | For purposes of this Portfolio, equity securities shall include common stocks, preferred stocks, and other equity securities, and financial instruments that derive their value from such securities. Foreign securities include securities issued by companies in countries with either developed or developing economies. The Portfolio may invest in issuers of any size. The Portfolio intends to invest primarily in common stocks, but it may also invest in other equity securities that the Advisers believe provide opportunities for capital growth. |
91
| Acquiring Portfolio | Acquired Portfolio | |||
EQ/International Core PLUS Portfolio | Multimanager International Equity Portfolio | |||
The Portfolio’s assets normally are allocated among three or more Advisers, each of which manages its portion of the Portfolio using a different but complementary investment strategy. One portion of the Portfolio is an Active Allocated Portion; one portion of the Portfolio is an Index Allocated Portion; and one portion of the Portfolio is an ETF Allocated Portion.
Under normal circumstances, the Active Allocated Portion consists of approximately 30% of the Portfolio’s net assets, the Index Allocated Portion consists of approximately 60% of the Portfolio’s net assets and the ETF Allocated Portion consists of approximately 10% of the Portfolio’s net assets. | The Manager will generally allocate the Portfolio’s assets among three or more Advisers, each of which will manage its portion of the Portfolio using different yet complementary investment strategies. Under normal circumstances, one portion of the Portfolio will be an Index Allocated and the other portions of the Portfolio will be Active Allocated Portions.
Under normal circumstances, the Manager anticipates allocating approximately 50% of the Portfolio’s net assets to the Index Allocated Portion and the remaining 50% of net assets among the Active Allocated Portions. These percentages are targets established by the Manager and actual allocations between the portions may deviate from these targets by up to 20% of the Portfolio’s net assets. | |||
| The Active Allocated Portion invests primarily in equity securities of foreign companies, including emerging market securities, that, in the view of the Advisers, have good prospects for future growth. Other factors, such as country and regional factors, are considered by the Advisers. The Active Allocated Portion the Advisers may sell a security for a variety of reasons, such as to make other investments believed by an Adviser to offer superior investment opportunities. | Each Active Allocated Portion invests primarily in equity securities of foreign companies that, in the view of the Adviser, have good prospects for future growth. Other factors, such as country and regional factors, are considered by the Adviser. The Active Allocated Portions’ Advisers may sell a security for a variety of reasons, such as to make other investments believed by an Adviser to offer superior investment opportunities. | |||
| The Index Allocated Portion of the Portfolio seeks to track the performance (before fees and expenses) of the MSCI EAFE Index with minimal tracking error. This strategy is commonly referred to as an indexing strategy. Generally, the Index Allocated Portion uses a full replication technique, although in certain instances a sampling approach may be utilized for a portion of the Index Allocated Portion. The Index Allocated Portion also may invest in other instruments, such as futures and options contracts, that provide comparable exposure as the index without buying the underlying securities comprising the index. | Same. |
92
| Acquiring Portfolio | Acquired Portfolio | |||
EQ/International Core PLUS Portfolio | Multimanager International Equity Portfolio | |||
| FMG LLC also may utilize futures and options, such as exchange-traded futures and options contracts on securities indices, to manage equity exposure. Futures and options can provide exposure to the performance of a securities index without buying the underlying securities comprising the index. They also provide a means to manage the Portfolio’s equity exposure without having to buy or sell securities. When market volatility is increasing above specific thresholds set for the Portfolio, the Manager may limit equity exposure either by reducing investments in securities, shorting or selling long futures and options positions on an index, increasing cash levels, and/or shorting an index. During such times, the Portfolio’s exposure to equity securities may be significantly less than that of a traditional equity portfolio. Although these actions are intended to reduce the overall risk of investing in the Portfolio, they may result in periods of underperformance. The Portfolio may invest up to 25% of its assets in derivatives. It is anticipated that the Portfolio’s derivative instruments will consist primarily of exchange-traded futures and options contracts on securities indices, but the Portfolio also may utilize other types of derivatives. The Portfolio’s investments in derivatives may be deemed to involve the use of leverage because the Portfolio is not required to invest the full market value of the contract upon entering into the contract but participates in gains and losses on the full contract price. The use of derivatives also may be deemed to involve the use of leverage because the heightened price sensitivity of some derivatives to market changes may magnify the Portfolio’s gain or loss. It is not generally expected, however, that the Portfolio will be leveraged by borrowing money for investment purposes. In addition, the Portfolio generally does not intend to use leverage to increase its net investment exposure above approximately 100% of the Portfolio’s net asset value or below 0%. The Portfolio may maintain a significant percentage of its assets in cash and cash equivalent instruments, some of which may serve as margin or collateral for the Portfolio’s obligations under derivative transactions. | Same. |
93
| Acquiring Portfolio | Acquired Portfolio | |||
EQ/International Core PLUS Portfolio | Multimanager International Equity Portfolio | |||
| The ETF Allocated Portion invests in ETFs (the “Underlying ETFs”) that meet the investment criteria of the Portfolio as a whole. The Underlying ETFs in which the ETF Allocated Portion may invest may be changed from time to time without notice or shareholder approval. | No corresponding strategy. |
Comparison of Principal Risk Factors
An investment in a Portfolio is not a deposit of a bank and is not insured or guaranteed by the Federal Deposit Insurance Corporation or any other government agency. You may lose money by investing in a Portfolio. The following table compares the principal risks of an investment in each Portfolio. For an explanation of each such risk, see “Additional Information about the Reorganizations – Description of Risk Factors” below.
Risks | EQ/International Core PLUS Portfolio | Multimanager International Equity Portfolio | ||||||
Cash Management Risk | X | X | ||||||
Currency Risk | X | X | ||||||
Custom Benchmark Risk | X | X | ||||||
Derivatives Risk | X | X | ||||||
Emerging Markets Risk | X | X | ||||||
Equity Risk | X | X | ||||||
ETF Risk | X | |||||||
Foreign Securities Risk | X | X | ||||||
Futures Contract Risk | X | X | ||||||
Index Strategy Risk | X | X | ||||||
Large-Cap Company Risk | X | X | ||||||
Leverage Risk/Leveraging Risk | X | X | ||||||
Mid-Cap and Small-Cap Company Risk | X | X | ||||||
Short Position Risk | X | X | ||||||
Volatility Management Risk | X | X | ||||||
Comparative Performance Information
The bar charts and tables below provide some indication of the risks of investing in each Portfolio by showing changes in the Portfolio’s performance from year to year and by showing how the Portfolios’ average annual total returns for the past one year, five years and since inception through December 31, 2013 compared to the returns of a broad-based market index. The additional broad-based indexes show how the Portfolio’s performance compared with the returns of other indexes that have characteristics relevant to the Portfolio’s investment strategies, including volatility managed indexes. Past performance is not an indication of future performance.
94
The performance results do not reflect any Contract-related fees and expenses, which would reduce the performance results.
Multimanager International Equity Portfolio - Calendar Year Total Returns (Class B)
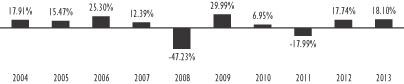
Best Quarter (% and time period) 25.14% (2009 2nd Quarter) | Worst Quarter (% and time period) -24.34% (2008 4th Quarter) | |||||||||||||||||
EQ/International Core PLUS Portfolio - Calendar Year Total Returns (Class IB)
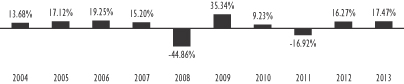
Best Quarter (% and time period) 25.00% (2009 2nd Quarter) | Worst Quarter (% and time period) -25.28% (2008 4th Quarter) | |||||||||||||||||
Multimanager International Equity Portfolio
Average Annual Total Returns (For the periods ended December 31, 2013) | One Year | Five Years | Ten Years/ Since Inception | |||
Multimanager International Equity Portfolio — Class A | 18.18% | 9.83% | 5.05% | |||
Multimanager International Equity Portfolio — Class B | 18.10% | 9.66% | 4.84% | |||
Multimanager International Equity Portfolio — Class K (Inception Date: August 26, 2011) | 18.48% | N/A | 12.78% | |||
MSCI EAFE Index† | 22.78% | 12.44% | 6.91% | |||
Volatility Managed Index — International* | 22.66% | 11.27% | 8.23% | |||
40% DJ EuroSTOXX 50/25% FTSE 100/25% TOPIX/10% S&P/ASX200** | 23.45% | 11.29% | N/A | |||
Volatility Managed Index — International Proxy‡ | 23.67% | 10.88% | N/A |
95
EQ/International Core PLUS Portfolio
Average Annual Total Returns (For the periods ended December 31, 2013) | One Year | Five Years | Ten Years/ Since Inception | |||||||||
EQ/International Core PLUS Portfolio — Class IA | 17.49 | % | 11.05 | % | 5.61 | % | ||||||
EQ/International Core PLUS Portfolio — Class IB | 17.47 | % | 10.90 | % | 5.40 | % | ||||||
EQ/International Core PLUS Portfolio — Class K (Inception Date: August 26, 2011) | 17.78 | % | N/A | 11.62 | % | |||||||
MSCI EAFE Index† | 22.78 | % | 12.44 | % | 6.91 | % | ||||||
Volatility Managed Index — International* | 22.66 | % | 11.27 | % | 8.23 | % | ||||||
40% DJ EuroSTOXX 50/25% FTSE 100/25% TOPIX/10% S&P/ASX200** | 23.45 | % | 11.29 | % | N/A | |||||||
Volatility Managed Index — International Proxy‡ | 23.67 | % | 10.88 | % | N/A | |||||||
| † | The MSCI EAFE Index is a free float-adjusted market capitalization weighted index that is designed to measure the equity market performance of developed markets excluding Canada and the United States. The index consists of the following 22 developed market country indices: Australia, Austria, Belgium, Denmark, Finland, France, Germany, Greece, Hong Kong, Ireland, Israel, Italy, Japan, the Netherlands, New Zealand, Norway, Portugal, Singapore, Spain, Sweden, Switzerland and the United Kingdom. |
| * | The Volatility Managed Index — International is an index that applies a formula to the MSCI EAFE Index adjusting the equity exposure of the MSCI EAFE Index when certain volatility levels are reached. |
| ** | The 40% DJ EuroSTOXX 50 Index (“EuroSTOXX 50”) is a hypothetical combination of un-managed indexes. The composite index combines the total return of the DJ EuroSTOXX 50 Index at a weighting of 40%, the FTSE 100 Index at a weighting of 25%, the TOPIX Index at a weighting of 25% and the S&P/ASX 200 Index at a weighting of 10%. The DJ EuroSTOXX 50 Index is Europe’s leading Blue-chip index for the Eurozone, provides a Blue-chip representation of supersector leaders in the Eurozone. The index covers 50 stocks from 12 Eurozone countries: Austria, Belgium, Finland, France, Germany, Greece, Ireland, Italy, Luxembourg, the Netherlands, Portugal and Spain. The FTSE 100 Index is a market-capitalization weighted index representing the performance of the 100 largest blue chip companies listed on the London Stock Exchange, which meet the FTSE’s size and liquidity screening. The TOPIX Index, is a free-float adjusted capitalization-weighted index that is calculated based on all the domestic common stocks listed on the TSE First Section. The S&P/ASX 200 Index is recognized as the primary investable benchmark in Australia. The S&P/ASX 200 Index represents the 200 largest and most liquid publicly listed companies in Australia and represents approximately 78% of Australian equity market capitalization. |
| ‡ | The Volatility Managed Index — International Proxy is an index that applies a formula to a blend of 40% Euro Stoxx 50, 25% FTSE 100, 25% TOPIX, and 10% S&P/ASX 200 adjusting the equity exposure of the International Proxy based when certain volatility levels are reached. |
96
The following table shows the capitalization of each Portfolio as of December 31, 2013, and of the EQ/International Core PLUS Portfolio on a pro forma combined basis as of December 31, 2013, after giving effect to the proposed Reorganization. Pro forma net assets may not total and net asset values per share may not recalculate due to rounding of net assets.
| Net Assets (in millions) | Net Asset Value Per Share | Shares Outstanding | ||||||||||
Multimanager International Equity Portfolio — Class A | $ | 13.7 | $ | 12.03 | 1,138,735 | |||||||
EQ/International Core PLUS Portfolio — Class IA | $ | 11.1 | $ | 10.31 | 1,078,274 | |||||||
Adjustments* | $ | — | $ | — | 190,335 | |||||||
Pro forma EQ/International Core PLUS Portfolio — Class IA (assuming the Reorganization is approved) | $ | 24.8 | $ | 10.31 | 2,407,344 | |||||||
Multimanager International Core Equity Portfolio — Class B | $ | 106.5 | $ | 12.01 | 8,867,746 | |||||||
EQ/International Core PLUS Portfolio — Class IB | $ | 1,566.6 | $ | 10.32 | 151,745,858 | |||||||
Adjustments* | $ | — | $ | — | 1,449,924 | |||||||
Pro forma EQ/International Core PLUS Portfolio — Class IB (assuming the Reorganization is approved) | $ | 1,673.1 | $ | 10.32 | 162,063,528 | |||||||
Multimanager International Equity Portfolio — Class K | $ | 233.0 | $ | 12.03 | 19,365,240 | |||||||
EQ/International Core PLUS Portfolio — Class K | $ | 393.8 | $ | 10.31 | 38,184,268 | |||||||
Adjustments* | $ | — | $ | — | 3,233,368 | |||||||
Pro Forma EQ/International Core PLUS Portfolio — Class K (assuming the Reorganization is approved) | $ | 626.8 | $ | 10.31 | 60,782,876 | |||||||
| * | Reflects adjustment for additional shares issued of the Acquiring Portfolio |
AFTER CAREFUL CONSIDERATION, THE VIP BOARD UNANIMOUSLY APPROVED THE MERGER PLAN WITH RESPECT TO THE MULTIMANAGER INTERNATIONAL EQUITY PORTFOLIO. ACCORDINGLY, THE BOARD HAS SUBMITTED THE MERGER PLAN FOR APPROVAL BY THIS PORTFOLIO’S SHAREHOLDERS. THE BOARD RECOMMENDS THAT YOU VOTE “FOR” PROPOSAL 8.
97
ADDITIONAL INFORMATION ABOUT THE REORGANIZATIONS
Terms of the Reorganization Plans
The terms and conditions under which the Reorganizations would be completed are contained in the respective Reorganization Plans. The following summary thereof is qualified in its entirety by reference to the Reorganization Plans, copies of the forms of which are attached to this Proxy Statement/Prospectus as Appendix A and Appendix B.
Each Reorganization will involve an Acquiring Portfolio’s acquiring all the assets of the corresponding Acquired Portfolio in exchange solely for Acquiring Portfolio Shares and the Acquiring Portfolio’s assumption of all the Acquired Portfolio’s liabilities. Each Reorganization Plan further provides that, on or as promptly as reasonably practicable after the Closing Date, each Acquired Portfolio will distribute the Acquiring Portfolio Shares it receives in the Reorganization to its shareholders, for the benefit of the Separate Accounts, as applicable, and thus the Contractholders, by class. The number of full and fractional Acquiring Portfolio Shares each shareholder will receive (for the benefit of each Separate Account, as applicable) will be equal in NAV (as determined in accordance with the Trusts’ normal valuation procedures), as of immediately after the close of business (generally 4:00 p.m., Eastern time) on the Closing Date, to the corresponding Acquired Portfolio Shares the shareholder holds at that time (for the benefit thereof, as applicable). After such distribution, VIP Trust will take all necessary steps under its Agreement and Declaration of Trust and Delaware and any other applicable law to effect a complete termination of each Acquired Portfolio.
Either Board may terminate or delay a Reorganization Plan with respect to, and abandon or postpone, any Reorganization or all Reorganizations at any time prior to the Closing Date, before or after approval by the relevant Acquired Portfolio’s shareholders, if circumstances develop that, in that Board’s opinion, make proceeding with a Reorganization inadvisable for a Portfolio. The consummation of each Reorganization also is subject to various conditions, including approval of the Reorganization by the applicable Acquired Portfolio’s shareholders, completion of all filings with, and receipt of all necessary approvals from, the SEC, delivery of a legal opinion regarding the federal income tax consequences of the Reorganization (see below) and other customary corporate and securities matters. Subject to the satisfaction of those conditions, each Reorganization will take place immediately after the close of business on the Closing Date.
The VIP Board, including the Trustees who are not “interested persons” (as defined in the Investment Company Act of 1940, as amended (the “1940 Act”)) of either Trust (the “Independent Trustees”), has determined, with respect to each Acquired Portfolio, that the interests of the Portfolio’s existing shareholders will not be diluted as a result of the Reorganization and that participation in the Reorganization is in the best interests of the Acquired Portfolio. Similarly, the EQ Board, including its Independent Trustees, has determined, with respect to each Acquiring Portfolio, that the interests of the Portfolio’s
98
shareholders will not be diluted as a result of the Reorganization and that participation in the Reorganization is in the best interests of the Acquiring Portfolio.
Pursuant to the Shell Reorganization Plan, each of the New Multimanager Aggressive Equity, New Multimanager Technology, New Multimanager Core Bond, New Multimanager Mid Cap Growth, and New Multimanager Mid Cap Value Portfolios will bear its proportionate share (based on the fraction that the shareholder accounts of its corresponding Acquired Portfolio bears to the aggregate shareholder accounts of all Acquired Portfolios covered by that plan at the Valuation Time) of 50% of the first $300,000 of the following expenses of the Reorganizations involving those Portfolios, subject to an aggregate maximum of $150,000 for those Portfolios (collectively, “Identified Expenses”): (1) costs associated with obtaining any necessary order of exemption from the 1940 Act, preparing the Proxy Statement/Prospectus, and printing and distributing each such Acquiring Portfolio’s prospectus and each such Acquired Portfolio’s proxy materials, (2) legal and accounting fees in connection with those Reorganizations, and (3) expenses of holding the Meeting of those Acquired Portfolios’ shareholders (including any adjournment or postponement thereof). FMG LLC generally will bear the expenses of the Reorganizations of those Portfolios in excess of that amount, except that (a) FMG LLC will not bear any brokerage or similar expenses incurred by or for the benefit of any Portfolio in connection with those Reorganizations, (b) all expenses other than Identified Expenses will be borne by the Portfolio that directly incurs them, and (c) expenses will be paid by the Portfolio directly incurring them if and to the extent that the payment thereof by another person would result in that Portfolio’s disqualification as a “regulated investment company” or would prevent the Reorganization in which it participates from qualifying as a tax-free reorganization.
Pursuant to the Merger Plan, each of the Multimanager Large Cap Core Equity, Multimanager Large Cap Value, and Multimanager International Equity Portfolios will bear its proportionate share (based on the fraction that its shareholder accounts bear to the aggregate shareholder accounts of all Acquiring Portfolios covered by that plan at the Valuation Time) of the first $325,000 of the Identified Expenses of the Reorganizations covered thereby. FMG LLC generally will bear expenses of the Reorganizations of those Portfolios in excess of that amount, except that (a) FMG LLC will not bear any brokerage or similar expenses incurred by or for the benefit of any Portfolio in connection with those Reorganizations, (b) all expenses other than Identified Expenses will be borne by the Portfolio that directly incurs them, and (c) expenses will be paid by the Portfolio directly incurring them if and to the extent that the payment thereof by another person would result in that Portfolio’s disqualification as a “regulated investment company” or would prevent the Reorganization in which it participates from qualifying as a tax-free reorganization.
Approval of a Reorganization Plan with respect to an Acquired Portfolio covered thereby will require a majority vote of its shareholders. Such majority is defined in the 1940 Act as the lesser of (i) 67% or more of the voting securities of the Portfolio present at a meeting, if the holders of more than 50% of its outstanding voting securities
99
are present or represented by proxy, or (ii) more than 50% of its outstanding voting securities. If a Reorganization Plan is not approved with respect to an Acquired Portfolio by its shareholders or its Reorganization is not consummated for any other reason, the VIP Board will consider other possible courses of action. The consummation of any one Reorganization is not contingent on the consummation of any other Reorganization. Please see “Voting Information” below for more information.
Description of the Securities to Be Issued
The shareholders of each Acquired Portfolio will receive Class IA, Class IB, or Class K shares of the corresponding Acquiring Portfolio in accordance with the procedures provided for in the Reorganization Plans. Each such share will be fully paid and non-assessable by EQ Trust when issued and will have no preemptive or conversion rights.
EQ Trust may issue an unlimited number of authorized shares of beneficial interest, par value $0.001 per share. EQ Trust’s Amended and Restated Declaration of Trust, as amended (“Declaration of Trust”) authorizes the Board to issue shares in different series and classes. In addition, the Declaration of Trust authorizes the Board to create new series and to name the rights and preferences of the shareholders of each series. The EQ Board does not need additional shareholder action to divide the shares into separate series or classes or to name the shareholders’ rights and preferences. Each Acquiring Portfolio is a series of EQ Trust.
EQ Trust currently offers three classes of shares – Class IA, Class IB, and Class K shares. EQ Trust has adopted, in the manner prescribed under Rule 12b-1 under the 1940 Act, a plan of distribution pertaining to the Class IA and IB shares of the Acquiring Portfolios. The maximum distribution and/or service (12b-1) fee for each Acquiring Portfolio’s Class IA and IB shares is equal to an annual rate of 0.25% of the average daily net assets attributable to those shares. Because these distribution/service fees are paid out of an Acquiring Portfolio’s assets on an ongoing basis, over time these fees will increase your cost of investing and may cost more than paying other types of charges.
At a meeting of the VIP Board held on December 4, 2013, FMG LLC recommended that each Acquired Portfolio be reorganized into its corresponding Acquiring Portfolio. FMG LLC noted that, in addition to evaluating regularly the performance of each Adviser to a portfolio of VIP Trust, it continually reviews the overall line-up of investment options and conducts in-depth analysis to reduce duplicative offerings. FMG LLC noted that a significant part of its analysis is devoted to a detailed review of each Portfolio’s attributes and features to determine whether duplicative offerings may be combined, to ascertain the future viability of each Portfolio, to promote operational efficiencies and to take additional steps to strengthen VIP Trust’s and EQ Trust’s line-up. In this regard, FMG LLC noted that VIP Trust initially consisted of series of Portfolios with multiple Advisers, whereas EQ Trust typically utilized a
100
single Adviser to execute a Portfolio’s investment strategy. FMG LLC informed the VIP Board that this differentiation had eroded over time and that many of EQ Trust’s Portfolios now utilize multiple Advisers to execute their investment strategies. FMG LLC noted that there was a significant overlap in the line-up of Advisers between VIP Trust and EQ Trust and that, to provide additional consistency, clarity and transparency to existing and potential Contractholders, FMG LLC was proposing that all Portfolios with multiple Advisers be contained within EQ Trust. FMG LLC also noted that there was significant overlap in certain portfolios offered by VIP Trust and EQ Trust and that the combination of these portfolios would reduce duplicative offerings.
In determining whether to approve the Reorganization Plans with respect to each Acquired Portfolio and recommend its approval to shareholders, the VIP Board, including the Independent Trustees, with the advice and assistance of independent legal counsel, inquired into a number of matters and considered the following factors, among others: (1) the potential benefits of the Reorganizations to shareholders; (2) comparisons of the Portfolios’ investment objectives, policies, strategies and risks; (3) the effect of a Reorganization on an Acquired Portfolio’s annual operating expenses, including fees, and shareholder costs; (4) the relative historical performance records of the Acquired and Acquiring Portfolios; (5) the direct or indirect federal income tax consequences of the Reorganizations to shareholders and Contractholders; (6) the terms and conditions of the Reorganization Plans and whether the Reorganizations would result in dilution of shareholder interests; (7) the potential benefits of the Reorganizations to other persons, including FMG LLC and its affiliates as discussed below in the section entitled “Potential Benefits of the Reorganizations to FMG LLC and its Affiliates;” and (8) possible alternatives to the Reorganizations, including the potential benefits and detriments of maintaining the current structure.
In connection with the VIP Board’s consideration of the proposed Reorganizations, the Independent Trustees requested, and FMG LLC provided to the VIP Board, information regarding the factors set forth above as well as other information relating to the Reorganizations.
In reaching the decision to recommend approval of the Reorganizations, the VIP Board, including the Independent Trustees, concluded that each Portfolio’s participation in the relevant Reorganization is in its best interests and that the interests of existing shareholders of that Portfolio would not be diluted as a result of the Reorganization. The VIP Board’s conclusion was based on a number of factors, including the following:
| • | The Reorganizations will permit shareholders invested in each of the Acquired Portfolios to continue to allocate amounts to a Portfolio that pursues a substantially similar investment objective and investment policies and that the Reorganizations will permit shareholders invested in each of the Multimanager Large Cap Core Equity, Multimanager Large Cap Value, and Multimanager International Equity Portfolios to do so in the context of a larger fund with lower total expense ratios, the potential for better growth prospects, greater opportunities for portfolio diversification and the potential for lower expenses through greater economies of scale. |
101
| • | The annual operating expense ratios for the Class IA, Class IB, and Class K shares of each Acquiring Portfolio are expected to be the same as, or lower than, those of the corresponding classes of shares of the corresponding Acquired Portfolio for the previous fiscal year. |
| • | FMG LLC will continue to serve as the investment manager and administrator of the Acquiring Portfolios following the Reorganizations. |
| • | The current Advisers to the Multimanager Aggressive Equity, Multimanager Technology, Multimanager Core Bond, Multimanager Mid Cap Growth, and Multimanager Mid Cap Value Portfolios will continue to serve as the Advisers to those Portfolios. |
| • | It is anticipated that Thornburg Investment Management, MFS Investment Management, and EARNEST Partners, LLC, each currently an Adviser to an Allocated Portion of the Multimanager Large Cap Core Equity, Multimanager Large Cap Value, and Multimanager International Equity Portfolios, respectively, will be added as Advisers to the EQ/Large Cap Core PLUS, EQ/Large Cap Value PLUS, and EQ/International Core PLUS Portfolios, respectively, following the Reorganizations. |
| • | As a result of the Reorganizations, each shareholder of Class A, Class B, or Class K shares of an Acquired Portfolio would hold, immediately after the Closing Date, Class IA, Class IB, or Class K shares of the corresponding Acquiring Portfolio, as applicable, having an aggregate value equal to the aggregate value of the relevant Acquired Portfolio Shares such shareholder holds as of the Closing Date. |
| • | The Reorganizations will be effected on the basis of each participating Portfolio’s NAV, which will be determined in connection with each Reorganization in accordance with VIP Trust’s or EQ Trust’s normal valuation procedures, as applicable, which are identical for all of the Portfolios. |
| • | Shareholders will not pay sales charges in connection with the Reorganizations. |
| • | The Reorganizations are not expected to have any adverse tax results to Contractholders. |
On the basis of the information provided to it and its evaluation of that information, the VIP Board, including the Independent Trustees, voted unanimously to approve each Reorganization Plan and to recommend that the shareholders of each Acquired Portfolio also approve the relevant Reorganization Plan.
Potential Benefits of the Reorganizations to FMG LLC and its Affiliates
FMG LLC may realize benefits in connection with the Reorganizations. For example, the profitability from the fees payable to FMG LLC by the Acquiring Portfolios may be higher than the profits derived from the fees paid by the corresponding Acquired Portfolios. In addition, the Reorganizations will reduce FMG
102
LLC’s obligations under expense limitation arrangements currently in effect for certain Acquired Portfolios by reorganizing those Acquired Portfolios into Acquiring Portfolios with lower expense ratios, no expense limitation arrangements, and/or that operate below their expense caps. The reduction of certain expense waiver or reimbursement obligations may result in increased profits to FMG LLC.
AllianceBernstein L.P., an affiliate of FMG LLC and an Adviser to certain of the Acquiring Portfolios, may also experience increased profitability in connection with the Reorganizations to the extent that its assets under management increase as a result of a Reorganization or it derives higher revenues or profits from the fees payable by the Acquiring Portfolios than from fees currently paid by the Acquired Portfolios.
In addition, the Portfolios are offered and sold through Contracts issued by AXA Equitable and its affiliates that may provide certain death benefit, income benefit or other guarantees to Contractholders. In providing these guarantees, AXA Equitable assumes the risk that Contractholder account values will not be sufficient to pay the guaranteed amounts when due, and therefore that AXA Equitable will have to use its own resources to cover any shortfall. AXA Equitable may enter into hedging transactions from time to time that are intended to help manage its risks under these guarantees. The Reorganizations described in this Proxy Statement/Prospectus may enhance AXA Equitable’s ability to manage this risk, for example, by eliminating a Portfolio that has underperformed expectations. This could have a positive impact on AXA Equitable’s profitability and/or financial position.
A Portfolio’s performance may be affected by one or more of the following risks, which are described in detail in Appendix C “More Information on Risk Factors.”
Cash Management Risk: Upon entering into certain derivatives contracts, such as futures contracts, and to maintain open positions in certain derivatives contracts, a Portfolio may be required to post collateral for the contract, the amount of which may vary. As such, a Portfolio may maintain cash balances, including foreign currency balances, which may be significant, with counterparties such as each Trust’s custodian or its affiliates. A Portfolio is thus subject to counterparty risk and credit risk with respect to these arrangements.
Credit Risk: The risk that the issuer or the guarantor of a fixed income security, or the counterparty to a derivatives contract, repurchase agreement, loan of portfolio securities or other transaction, is unable or unwilling, or is perceived (whether by market participants, ratings agencies, pricing services or otherwise) as unable or unwilling, to make timely principal and/or interest payments, or otherwise honor its obligations. Securities are subject to varying degrees of credit risk, which are often reflected in their credit ratings.
Custom Benchmark Risk: Certain of the Portfolios’ benchmarks were created by the Manager to show how the Portfolio’s performance compares with the returns of volatility managed indices. There is no guarantee that a Portfolio will outperform these or any benchmark.
103
Derivatives Risk: A Portfolio’s investment in derivatives may rise or fall more rapidly than other investments. Changes in the value of the derivative may not correlate perfectly with the underlying asset, rate or index, and a Portfolio could lose more than the principal amount invested. In addition, it may be difficult or impossible for the Portfolio to purchase or sell certain derivatives in sufficient amounts to achieve the desired level of exposure, which may result in a loss or may be costly to the Portfolio. Derivatives also may be subject to certain other risks such as leveraging risk, interest rate risk, credit risk, the risk that a counterparty may be unable or unwilling to honor its obligations, and the risk of mispricing or improper valuation. Derivatives also may not behave as anticipated by the Portfolio, especially in abnormal market conditions.
Equity Risk: In general, stocks and other equity security values fluctuate, and sometimes widely fluctuate, in response to changes in a company’s financial condition as well as general market, economic, and political conditions and other factors.
ETF Risk: A Portfolio that invests in ETFs will indirectly bear fees and expenses charged by those ETFs, in addition to the Portfolio’s direct fees and expenses. The cost of investing in the Portfolio, therefore, may be higher than the cost of investing in a mutual fund that invests directly in individual stocks and bonds. In addition, the Portfolio’s net asset value will be subject to fluctuations in the market values of the ETFs in which it invests. The Portfolio is also subject to the risks associated with the securities in which the ETFs invest and the ability of the Portfolio to meet its investment objective will directly depend on the ability of the ETFs to meet their investment objectives. The Portfolio and ETFs are subject to certain general investment risks, including market risk, asset class risk, issuer-specific risk, investment style risk and portfolio management risk. In addition, to the extent a Portfolio invests in ETFs that invest in equity securities, fixed income securities and/or foreign securities, the Portfolio is subject to the risks associated with investing in such securities such as equity risk, market capitalization risk, investment grade securities risk, interest rate risk, credit/default risk, foreign and emerging markets securities risk and lower-rated securities risk. ETFs may change their investment objectives or policies without the approval of the Portfolio. If that were to occur, the Portfolio might be forced to sell its investment in an ETF at a time and price that is unfavorable to the Portfolio. Shares of ETFs are listed and traded on securities exchanges and in over-the-counter markets, and the purchase and sale of these shares involve transaction fees and commissions. Even though the market price of an ETF is derived from the securities it owns, such price at any given time may be at, below or above the ETF’s net asset value. In addition, many ETFs invest in securities included in, or representative of, underlying indexes regardless of investment merit or market trends and, therefore, these ETFs do not change their investment strategies to respond to changes in the economy, which means that an ETF may be particularly susceptible to a general decline in the market segment relating to the relevant index. There is also the risk that an ETF’s performance may not match that of the relevant index. It is also possible that an active trading market for an ETF may not develop or be maintained, in which case the liquidity and value of the Portfolio’s investment in the ETF could be substantially and adversely affected.
104
Foreign Securities Risk: Investments in foreign securities, including depositary receipts, involve risks not associated with investing in U.S. securities. Foreign markets, particularly emerging markets, may be less liquid, more volatile and subject to less government supervision than domestic markets. Security values also may be negatively affected by changes in the exchange rates between the U.S. dollar and foreign currencies. Differences between U.S. and foreign legal, political and economic systems, regulatory regimes and market practices also may impact security values and it may take more time to clear and settle trades involving foreign securities.
Currency Risk: Investments in foreign currencies and in securities that trade in, or receive revenues in, foreign currencies are subject to the risk that those currencies will decline in value relative to the U.S. dollar. Any such decline may erode or reverse any potential gains from an investment in securities denominated in foreign currency or may widen existing loss. Currency rates may fluctuate significantly over short periods of time for a number of reasons, including changes in interest rates, intervention by governments, central banks or supranational entities, or by the imposition of currency controls or other political developments in the U.S. or abroad.
Emerging Markets Risk: There are greater risks involved in investing in emerging market countries and/or their securities markets. Investments in these countries and/or markets may present market, credit, currency, liquidity, legal, political, technical and other risks different from, or greater than, the risks of investing in developed countries. In addition, the risks associated with investing in a narrowly defined geographic area are generally more pronounced with respect to investments in emerging market countries.
Futures Contract Risk: The primary risks associated with the use of futures contracts are (a) the imperfect correlation between the change in market value of the instruments held by a Portfolio and the price of the futures contract; (b) liquidity risks, including the possible absence of a liquid secondary market for a futures contract and the resulting inability to close a futures contract when desired; (c) losses (potentially unlimited) caused by unanticipated market movements; (d) an adviser’s inability to predict correctly the direction of securities prices, interest rates, currency exchange rates and other economic factors; (e) the possibility that a counterparty will default in the performance of its obligations; (f) if a Portfolio has insufficient cash, it may have to sell securities from its portfolio to meet daily variation margin requirements, and the Portfolio may have to sell securities at a time when it may be disadvantageous to do so; and (g) transaction costs associated with investments in futures contracts may be significant, which could cause or increase losses or reduce gains.
Index Strategy Risk: A Portfolio that employs an index strategy generally invests in the securities included in the relevant index or a representative sample of such securities regardless of market trends. Such a portfolio generally will not modify its index strategy to respond to changes in the economy, which means that it may be particularly susceptible to a general decline in the market segment relating to the relevant index. In addition, although the index strategy attempts to closely track its benchmark
105
index, the Portfolio may not invest in all of the securities in the index. Also, the Portfolio’s fees and expenses will reduce the Portfolio’s returns, unlike those of the benchmark index. Cash flow into and out of the Portfolio, portfolio transaction costs, changes in the securities that comprise the index, and the Portfolio’s valuation procedures also may affect the Portfolio’s performance. Therefore, there can be no assurance that the performance of the index strategy will match that of the benchmark index.
Interest Rate Risk: The risk that fixed income securities will decline in value because of changes in interest rates. When interest rates decline, the value of a Portfolio’s debt securities generally rises. Conversely, when interest rates rise, the value of a Portfolio’s debt securities generally declines. A Portfolio with a longer average duration will be more sensitive to changes in interest rates than a fund with a shorter average duration.
Investment Grade Securities Risk: Debt securities commonly are rated by national bond ratings agencies. Investment grade securities are securities rated BBB or higher by S&P or Fitch or Baa or higher by Moody’s. Securities rated in the lower investment grade rating categories (e.g., BBB or Baa) are considered investment grade securities, but are somewhat riskier than higher rated obligations because they are regarded as having only an adequate capacity to pay principal and interest, and are considered to lack outstanding investment characteristics.
Investment Style Risk: An Adviser may use a particular style or set of styles — in this case “growth” or “value” styles — to select investments. Those styles may be out of favor or may not produce the best results over short or longer time periods.
Growth stocks may be more sensitive to changes in current or expected earnings than the prices of other stocks. Growth investing also is subject to the risk that the stock price of one or more companies will fall or will fail to appreciate as anticipated, regardless of movements in the securities market. Growth stocks also tend to be more volatile than value stocks, so in a declining market their prices may decrease more than value stocks in general. They also may increase the volatility of the Portfolio’s share price.
Value stocks are subject to the risks that notwithstanding that a stock is selling at a discount to a its perceived true worth, the market will never fully recognize their intrinsic value. In addition, there is the risk that a stock judged to be undervalued may actually be appropriately priced.
Large-Cap Company Risk: Larger more established companies may be unable to respond quickly to new competitive challenges such as changes in technology and consumer tastes. Many larger companies also may not be able to attain the high growth rate of successful smaller companies, especially during extended periods of economic expansion.
Leverage or Leveraging Risk: When a Portfolio leverages its holdings, the value of an investment in that Portfolio will be more volatile and all other risks will tend to
106
be compounded. For example, a Portfolio may take on leveraging risk when it engages in derivatives transactions, invests in collateral from securities loans or borrows money. A Portfolio may experience leveraging risk in connection with investments in derivatives because its investments in derivatives may be purchased with a fraction of the assets that would be needed to purchase the securities directly, so that the remainder of the assets may be invested in other investments. Such investments may have the effect of leveraging a Portfolio because the Portfolio may experience gains or losses not only on its investments in derivatives, but also on the investments purchased with the remainder of the assets. If the value of a Portfolio’s investments in derivatives is increasing, this could be offset by declining values of the Portfolio’s other investments. Conversely, it is possible that the rise in the value of a Portfolio’s non-derivative investments could be offset by a decline in the value of the Portfolio’s investments in derivatives. In either scenario, a Portfolio may experience losses. In a market where the value of a Portfolio’s investments in derivatives is declining and the value of its other investments is declining, the Portfolio may experience substantial losses.
Mid-Cap and Small-Cap Company Risk: Investments in mid- and small-cap companies may involve greater risks than investments in larger, more established issuers because they generally are more vulnerable than larger companies to adverse business or economic developments. Such companies generally have narrower product lines, more limited financial resources and more limited markets for their stock as compared with larger companies. As a result, the value of such securities may be more volatile than the securities of larger companies, and a Portfolio may experience difficulty in purchasing or selling such securities at the desired time and price or in the desired amount. In general, these risks are greater for small-cap companies than for mid-cap companies.
Mortgage-Backed and Asset-Backed Securities Risk: The risk that the principal on mortgage- and asset-backed securities held by a Portfolio will be prepaid, which generally will reduce the yield and market value of these securities. If interest rates fall, the rate of prepayments tends to increase as borrowers are motivated to pay off debt and refinance at new lower rates. Rising interest rates may increase the risk of default by borrowers and tend to extend the duration of these securities, making them more sensitive to changes in interest rates. As a result, in a period of rising interest rates, a Portfolio that holds these types of securities may experience additional volatility and losses. This is known as extension risk. Moreover, declines in the credit quality of and defaults by the issuers of mortgage- and asset-backed securities or instability in the markets for such securities may affect the value and liquidity of such securities, which could result in losses to the Portfolio.
Portfolio Turnover Risk: High portfolio turnover (generally, turnover in excess of 100% in any given fiscal year) may result in increased transaction costs to a Portfolio, which may result in higher fund expenses and lower total return.
107
Risks of Investing in Other Investment Companies: A Portfolio that invests in Underlying Portfolios will indirectly bear fees and expenses charged by those Underlying Portfolios, in addition to the Portfolio’s direct fees and expenses. The cost of investing in the Portfolio, therefore, may be higher than the cost of investing in a mutual fund that invests directly in individual stocks and bonds. In addition, the Portfolio’s net asset value is subject to fluctuations in the net asset value of each Underlying Portfolio. The Portfolio is also subject to the risks associated with the securities in which the Underlying Portfolios invest and the ability of the Portfolio to meet its investment objective will depend, to a significant degree, on the ability of the Underlying Portfolios to meet their objectives. The Portfolio and the Underlying Portfolios are subject to certain general investment risks, including market risk, issuer-specific risk, investment style risk and portfolio management risk. In addition, to the extent a Portfolio invests in Underlying Portfolios that invest in equity securities, fixed income securities and/or foreign securities, the Portfolio is subject to the risks associated with investing in such securities such as equity risk, market capitalization risk, investment grade securities risk, interest rate risk, credit/default risk, foreign investing and emerging markets securities risk and lower-rated securities risk. The Underlying Portfolios may change their investment objectives or policies without the approval of the Portfolio. If that were to occur, the Portfolio might be forced to withdraw its investment from the Underlying Portfolio at a time that is unfavorable to the Portfolio.
Sector Concentration Risk: A Portfolio that invests primarily in a particular sector could experience greater volatility than funds investing in a broader range of industries.
Short Position Risk: A Portfolio may engage in short sales and may enter into derivative contracts that have a similar economic effect (e.g., taking a short position in a futures contract). A Portfolio will incur a loss as a result of a short position if the price of the asset sold short increases in value between the date of the short position sale and the date on which an offsetting position is purchased. Short positions may be considered speculative transactions and involve special risks that could cause or increase losses or reduce gains, including greater reliance on the investment adviser’s ability to accurately anticipate the future value of a security or instrument, potentially higher transaction costs, and imperfect correlation between the actual and desired level of exposure. Because a Portfolio’s potential loss on a short position arises from increases in the value of the asset sold short, the extent of such loss, like the price of the asset sold short, is theoretically unlimited.
Technology Sector Risk: The value of the shares of a Portfolio that invests primarily in technology companies is particularly vulnerable to factors affecting the technology sector, such as dependency on consumer and business acceptance as new technology evolves, large and rapid price movements resulting from competition, rapid obsolescence of products and services and short product cycles. Many technology companies are small and at an earlier stage of development and, therefore, may be subject to risks such as those arising out of limited product lines, markets and financial and managerial resources.
108
Volatility Management Risk: The Manager from time to time employs various volatility management techniques, including the use of futures and options to manage equity exposure. The success of a Portfolio’s volatility management strategy will be subject to the Manager’s ability to correctly assess the degree of correlation between the performance of the relevant market index and the metrics used by the Manager to measure market volatility. Since the characteristics of many securities change as markets change or time passes, the success of a Portfolio’s volatility management strategy also will be subject to the Manager’s ability to continually recalculate, readjust, and execute volatility management techniques (such as options and futures transactions) in an efficient manner. In addition, because market conditions change, sometimes rapidly and unpredictably, the success of the volatility management strategy will be subject to the Manager’s ability to execute the strategy in a timely manner. Moreover, volatility management strategies may increase portfolio transaction costs, which could cause or increase losses or reduce gains. For a variety of reasons, the Manager may not seek to establish a perfect correlation between the relevant market index and the metrics that the Manager uses to measure market volatility. In addition, it is not possible to manage volatility fully or perfectly. Any one or more of these factors may prevent a Portfolio from achieving the intended volatility management or could cause the Portfolio to underperform or experience losses.
Federal Income Tax Consequences of the Reorganizations
Each Reorganization is intended to qualify for federal income tax purposes as a tax-free reorganization under section 368(a) of the Internal Revenue Code of 1986, as amended (the “Code”).
As a condition to consummation of each Reorganization, each Trust will receive an opinion from K&L Gates LLP (“Counsel”), with respect to the Reorganization and the Portfolios participating therein and their shareholders, substantially to the effect that, based on the facts and assumptions stated therein and conditioned on certain representations of each Trust being true and complete on the Closing Date and consummation of the Reorganization in accordance with the applicable Reorganization Plan (without the waiver or modification of any terms or conditions thereof and without taking into account any amendment thereof that Counsel has not approved), for federal income tax purposes: (1) the Reorganization will qualify as a “reorganization” (as defined in section 368(a)(1)(F) of the Code in the case of each Reorganization covered by the Shell Reorganization Plan (each, a “Shell Reorganization”) and section 368(a)(1)(D) of the Code in the case of each Reorganization covered by the Merger Plan (each, a “D Reorganization”)), and each Portfolio will be a “party to a reorganization” (within the meaning of section 368(b) of the Code); (2) neither Portfolio will recognize any gain or loss on the Reorganization; (3) an Acquired Portfolio shareholder will not recognize any gain or loss on the exchange of its Acquired Portfolio Shares for Acquiring Portfolio Shares; (4) an Acquired Portfolio shareholder’s aggregate tax basis in the Acquiring Portfolio Shares it receives pursuant to the Reorganization will be the same as the aggregate tax basis in its Acquired Portfolio Shares it actually or constructively surrenders in exchange for those Acquiring
109
Portfolio shares, and its holding period for those Acquiring Portfolio shares will include, in each instance, its holding period for those Acquired Portfolio shares, provided the shareholder holds the latter as capital assets on the Closing Date; (5) the Acquiring Portfolio’s tax basis in each asset the Acquired Portfolio transfers to it will be the same as the Acquired Portfolio’s tax basis therein immediately before the Reorganization, and the Acquiring Portfolio’s holding period for each such asset will include the Acquired Portfolio’s holding period therefor (except where the Acquiring Portfolio’s investment activities have the effect of reducing or eliminating an asset’s holding period); and (6) in the case of each Shell Reorganization, for purposes of section 381 of the Code each Acquiring Portfolio will be treated just as its corresponding Acquired Portfolio would have been treated if there had been no Reorganization, with the consequences that (a) the Reorganization will not result in the termination of the Acquired Portfolio’s taxable year, (b) the Acquired Portfolio’s tax attributes enumerated in section 381(c) of the Code will be taken into account by the Acquiring Portfolio as if there had been no Reorganization, and (c) the part of the Acquired Portfolio’s taxable year before the Reorganization will be included in the Acquiring Portfolio’s taxable year after the Reorganization. Notwithstanding clauses (2) and (5), such opinion may state that no opinion is expressed as to the effect of a Reorganization on the Portfolios participating therein or the participating Acquired Portfolio’s shareholders with respect to any transferred asset as to which any unrealized gain or loss is required to be recognized for federal income tax purposes at the end of a taxable year (or, in the case of a D Reorganization’s, on the termination or transfer thereof) under a mark-to-market system of accounting.
Contractholders who had premiums or contributions allocated to the investment divisions of the Separate Accounts that are invested in Acquired Portfolio Shares generally will not recognize any gain or loss as a result of the Reorganizations. If an Acquired Portfolio sells securities before its Reorganization, it may recognize gains or losses on those sales. Any net gains recognized on those sales would increase the amount of any distribution that such an Acquired Portfolio must make to its shareholders before consummating its Reorganization.
As a result of the Reorganizations, each Acquiring Portfolio will succeed to certain tax attributes of the corresponding Acquired Portfolio, except that, in the case of a D Reorganization, the amount of the latter’s accumulated capital loss carryovers that the former may use to offset capital gains it recognizes after its Reorganization--generally in no more than the eight succeeding taxable years for losses incurred in taxable years ended before January 1, 2011--will be subject to an annual limitation under sections 382 and 383 of the Code. Under the Regulated Investment Company Modernization Act of 2010, an Acquiring Portfolio may carry over (and use subject to the sections 382/383 limitation) capital losses the corresponding Acquired Portfolio incurred in subsequent taxable years, including any net capital loss that Acquired Portfolio sustains during its taxable year ending on the Closing Date and any net unrealized built-in loss that Acquired Portfolio has on that date, for an unlimited period. However, for an Acquiring Portfolio in a D Reorganization, any losses incurred during future years must be utilized before the losses incurred in pre-2011 taxable
110
years. As a result of this ordering rule, pre-2011 capital loss carryovers may be more likely to expire unused. Additionally, post-2010 capital losses that are carried forward will retain their character as either short-term or long-term capital losses rather than being considered all short-term as under previous law.
In general, the limitation applicable to an Acquiring Portfolio in a D Reorganization for each taxable year will equal the sum of (1) the product of the NAV of the corresponding Acquired Portfolio as of the Closing Date (the “Acquired Portfolio’s NAV”) multiplied by the “long-term tax-exempt rate” (which is a market-based rate published by the Internal Revenue Service (the “Service”) each month, currently 3.49%) for the month in which the Closing Date occurs plus (2) the amount of any net unrealized built-in gain of that Acquired Portfolio as of the Closing Date that that Acquiring Portfolio recognizes in any taxable year all or part of which is in the period through the fifth anniversary of the Closing Date (as long as the amount of that net unrealized built-in gain is greater than the lesser of (i) 15% of that Acquired Portfolio’s NAV or (ii) $10,000,000). The annual limitation will be proportionately reduced for the portion of an Acquiring Portfolio’s current taxable year after the Closing Date and for any subsequent short taxable year.
If a Reorganization fails to meet the requirements of Code section 368(a)(1), a Separate Account that is invested in shares of the Acquired Portfolio involved therein could realize a gain or loss on the transaction equal to the difference between its tax basis in those shares and the fair market value of the Acquiring Portfolio Shares it receives.
EQ Trust and VIP Trust have not sought a tax ruling from the Service but instead are acting in reliance on the opinion of Counsel discussed above. That opinion is not binding on the Service or the courts and does not preclude the Service from adopting a contrary position. Contractholders are urged to consult their tax advisers as to the specific consequences to them of the Reorganizations, including the applicability and effect of state, local, foreign and other taxes.
Rights of Shareholders of the Portfolios
The rights of shareholders of the Acquiring Portfolios involved in a D Reorganization are, and the rights of shareholders of the other Acquiring Portfolios will be, substantially similar to the rights of shareholders of the Acquired Portfolios. Each Trust is organized as a Delaware statutory trust. As such, each Trust’s operations are governed by its Declaration of Trust and Bylaws and applicable Delaware law. The operations of each Trust are also subject to the provisions of the 1940 Act and the rules and regulations thereunder.
Subject to the provisions of its Declaration, each Trust’s Board manages the business of the Trust. The Trustees have all powers necessary or convenient to carry out their responsibilities. The responsibilities, powers and fiduciary duties of the Trustees of EQ Trust are substantially the same as those of the Trustees of VIP Trust. EQ
111
Trust’s Trustees are not the same persons who serve as trustees of VIP Trust. Information regarding the Trustees of EQ Trust is included in EQ Trust’s SAI, which is available upon request.
The beneficial interests in the Acquiring Portfolios involved in a D Reorganization are, and the beneficial interests in the other Acquiring Portfolios will be, represented by transferable shares, par value $0.001 per share. Shareholders do not have the right to demand or require EQ Trust to issue share certificates. The EQ Board has the power under the Declaration of Trust to establish new series and classes of shares; VIP Trust’s Trustees currently have a similar right. EQ Trust’s Declaration of Trust and VIP Trust’s Agreement and Declaration of Trust permit their respective Trustees to issue an unlimited number of shares of each class and series of the relevant Trust.
EQ Trust has established for each Acquiring Portfolio, Class IA, Class IB, and Class K Shares. Except as discussed in this Proxy Statement/Prospectus, Class IA, Class IB, and Class K Shares of each Acquiring Portfolio will have rights, privileges and terms similar to those of the classes of the Acquired Portfolios.
ADDITIONAL INFORMATION ABOUT THE ACQUIRING PORTFOLIOS
This section gives you information about EQ Trust, the Manager and the Advisers for the Acquiring Portfolios.
EQ Trust is organized as a Delaware statutory trust and is registered with the SEC as an open-end management investment company. The EQ Board is responsible for the overall management of EQ Trust and each of its series (the “portfolios”), including the Acquiring Portfolios. EQ Trust issues shares of beneficial interest that are currently divided among eighty-six (86) portfolios, sixty-eight (68) of which have authorized Class IA, Class IB and Class K shares and the remaining eighteen (18) of which are authorized to issue only Class IB and Class K shares. This Proxy Statement/Prospectus describes the Class IA, Class IB, and Class K shares on behalf of the Acquiring Portfolios. Each Acquiring Portfolio has its own investment objective, investment strategies and risks, which have been previously described in this Proxy Statement/Prospectus. EQ Trust has adopted a Distribution Plan pursuant to Rule 12b-1 under the 1940 Act for EQ Trust’s Class IA and Class IB shares.
FMG LLC, 1290 Avenue of the Americas, New York, New York 10104, is the Manager to each portfolio. FMG LLC is registered with the SEC as an investment adviser under the 1940 Act. FMG LLC also is registered with the Commodity Futures Trading Commission (“CFTC”) as a commodity pool operator (“CPO”) under the Commodity Exchange Act, as amended, and serves as a CPO with respect to the EQ/International Core PLUS Portfolio, EQ/Large Cap Core PLUS Portfolio, and EQ/
112
Large Cap Value PLUS Portfolio. FMG LLC currently claims an exclusion (under CFTC Rule 4.5) from registration as a CPO with respect to each of the other Acquiring Portfolios. Being subject to dual regulation by the SEC and the CFTC may increase compliance costs and may affect Portfolio returns. FMG LLC is an indirect, wholly owned subsidiary of AXA Equitable. AXA Equitable is a wholly-owned subsidiary of AXA Financial, Inc., a subsidiary of AXA, a French insurance holding company. The address for AXA Equitable and AXA Financial, Inc. is 1290 Avenue of the Americas, New York, New York 10104. The address for AXA is 25 Avenue Matignon, 75008, Paris France. FMG LLC serves as the investment adviser to mutual funds and other pooled investment vehicles, and, as of December 31, 2013, had $103.0 billion in assets under management.
The Manager has a variety of responsibilities for the general management and administration of EQ Trust and the portfolios. With respect to the EQ/Large Cap Core PLUS, EQ/Large Cap Value PLUS, EQ/International Core PLUS, and New Multimanager Technology Portfolios, the Manager is responsible for, among other things, determining the asset allocation range for these Portfolios, selecting and monitoring the Advisers for these Portfolios, advising the ETF Allocated Portions of a Portfolio (including selecting Underlying ETFs in which these Portfolios invest) and ensuring that asset allocations are consistent with the guidelines that have been approved by the EQ Board. The Manager also is responsible for developing and overseeing the proprietary research model used to manage the equity exposure of the EQ/Large Cap Core PLUS, EQ/Large Cap Value PLUS, and EQ/International Core PLUS Portfolios. With respect to the New Multimanager Aggressive Equity, New Multimanager Core Bond, New Multimanager Mid Cap Growth and New Multimanager Mid Cap Value Portfolios, the Manager’s management responsibilities include the selection, monitoring and oversight of Advisers for these Portfolios and determining the allocation of assets among these Portfolios’ Allocated Portions.
The Manager plays an active role in monitoring each portfolio (or portion thereof) and Adviser and uses portfolio analytics systems to strengthen its evaluation of performance, style, risk levels, diversification and other criteria. The Manager also monitors each Adviser’s portfolio management team to determine whether its investment activities remain consistent with the portfolios’ (or portions’ thereof) investment style and objectives.
Beyond performance analysis, the Manager monitors significant changes that may impact the Adviser’s overall business. The Manager monitors continuity in the Adviser’s operations and changes in investment personnel and senior management. The Manager performs due diligence reviews with each Adviser no less frequently than annually.
The Manager obtains detailed, comprehensive information concerning portfolio (or portion thereof) and Adviser performance and portfolio (or portion thereof) operations that is used to supervise and monitor the Advisers and the portfolio (or portion thereof) operations. A team is responsible for conducting ongoing investment reviews with each Adviser and for developing the criteria by which portfolio (or portion thereof) performance is measured.
113
The Manager selects Advisers from a pool of candidates, including its affiliates, to manage the portfolios (or portions thereof). The Manager may appoint, dismiss and replace Advisers and amend advisory agreements subject to the approval of the EQ Board. The Manager also may allocate a portfolio’s assets to additional Advisers subject to the approval of the EQ Board and has discretion to allocate each portfolio’s assets among a portfolio’s current Advisers. The Manager recommends Advisers for each portfolio to the EQ Board based upon its continuing quantitative and qualitative evaluation of each Adviser’s skills in managing assets pursuant to specific investment styles and strategies. Short-term investment performance, by itself, is not a significant factor in selecting or terminating an Adviser, and the Manager does not expect to recommend frequent changes of Advisers.
If the Manager appoints, dismisses or replaces an Adviser to a portfolio or adjusts the asset allocation among Advisers in a portfolio the affected portfolio may experience a period of transition during which the securities held in the portfolio may be repositioned in connection with the change in Adviser(s). A Portfolio may not pursue its principal investment strategies during such a transition period and may incur increased brokerage commissions and other transaction costs in connection with the change(s). Generally, transitions may be implemented before or after the effective date of the new Adviser’s appointment as an adviser to the portfolio, and may be completed in several days to several weeks, depending on the particular circumstances of the transition. In addition, the past performance of a portfolio is not necessarily an indication of future performance. This may be particularly true for any portfolios that have undergone Adviser changes and/or changes to the investment objectives or policies of the portfolio.
The Manager is responsible for overseeing Advisers and recommending their hiring, termination and replacement to the EQ Board.
A committee of FMG LLC investment personnel (“Investment Committee”), (i) is primarily responsible for the selection, monitoring and oversight of each portfolio’s Adviser(s); and (ii) manages the ETF Allocated Portion of and the models used to manage ETF Allocated Portions of each of the EQ/International Core PLUS Portfolio, EQ/Large Cap Core PLUS Portfolio, EQ/Large Cap Value PLUS Portfolio and New Multimanager Technology Portfolio. The Investment Committee is responsible for determining the allocation of assets between the actively and passively managed portions of the EQ/International Core PLUS Portfolio, EQ/Large Cap Core PLUS Portfolio, EQ/Large Cap Value PLUS Portfolio, New Multimanager Aggressive Equity Portfolio, New Multimanager Technology Portfolio, New Multimanager Core Bond Portfolio, New Multimanager Mid Cap Growth Portfolio, and New Multimanager Mid Cap Value Portfolio, overseeing the models used to manage these Portfolios, selecting and monitoring the Advisers for these Portfolios, and ensuring that asset allocations are consistent with the guidelines that have been approved by the EQ Board.
114
The Manager has received an exemptive order from the SEC to permit it and the EQ Board to appoint, dismiss and replace Advisers and to amend the advisory agreements between the Manager and the Advisers without obtaining shareholder approval. Accordingly, the Manager is able, subject to the approval of the EQ Board, to appoint, dismiss and replace Advisers and to amend advisory agreements without obtaining shareholder approval. If a new Adviser is retained for a portfolio, shareholders will receive notice of such action. However, the Manager may not enter into an advisory agreement with an “affiliated person” of the Manager (as that term is defined in the 1940 Act) (the “Affiliated Adviser”), such as AllianceBernstein L.P., AXA Investment Managers, Inc., and AXA Rosenberg Investment Management LLC, unless the advisory agreement with the Affiliated Adviser, including compensation, is also approved by the affected portfolio’s shareholders.
Management and Administrative Fees
Each Acquiring Portfolio pays a fee to FMG LLC for management services. The table below shows the annual rate of the management fees (as a percentage of each Acquiring Portfolio’s average daily net assets) that the Manager received in 2013 for managing each Acquiring Portfolio and the rate of the management fees waived by the Manager in 2013 in accordance with the provisions of the Expense Limitation Agreement, as defined below, between the Manager and EQ Trust with respect to each Acquiring Portfolio.
Acquiring Portfolio | Annual Rate Received | Rate of Fees Waived and Expenses Reimbursed | ||||||
New Multimanager Aggressive Equity Portfolio* | N/A | N/A | ||||||
New Multimanager Technology Portfolio* | N/A | N/A | ||||||
New Multimanager Core Bond Portfolio* | N/A | N/A | ||||||
New Multimanager Mid Cap Growth Portfolio* | N/A | N/A | ||||||
New Multimanager Mid Cap Value Portfolio* | N/A | N/A | ||||||
EQ/Large Cap Core PLUS Portfolio | 0.50 | % | 0.00 | % | ||||
EQ/Large Cap Value PLUS Portfolio | 0.47 | % | 0.00 | % | ||||
EQ/International Core PLUS Portfolio | 0.60 | % | 0.00 | % | ||||
| * | The New Multimanager Aggressive Equity, New Multimanager Technology, New Multimanager Core Bond, New Multimanager Mid Cap Growth, and New Multimanager Mid Cap Value Portfolios are newly organized and have not had any operations to date. |
115
The table below shows the contractual rate of the management fees (as a percentage of each Portfolio’s average daily net assets) payable by each of the New Multimanager Aggressive Equity, New Multimanager Technology, New Multimanager Core Bond, New Multimanager Mid Cap Growth, and New Multimanager Mid Cap Value Portfolios.
Portfolio Name | Management Fee Rate | |||||||||||||||||||
| First $2 Billion | Next $1 Billion | Next $3 Billion | Next $5 Billion | Thereafter | ||||||||||||||||
New Multimanager Aggressive Equity Portfolio | 0.580 | % | 0.550 | % | 0.525 | % | 0.500 | % | 0.475 | % | ||||||||||
New Multimanager Technology Portfolio | 0.950 | % | 0.900 | % | 0.875 | % | 0.850 | % | 0.825 | % | ||||||||||
New Multimanager Mid Cap Growth Portfolio | 0.800 | % | 0.750 | % | 0.725 | % | 0.700 | % | 0.675 | % | ||||||||||
New Multimanager Mid Cap Value Portfolio | 0.800 | % | 0.750 | % | 0.725 | % | 0.700 | % | 0.675 | % | ||||||||||
Portfolio Name | Management Fee Rate | |||||||||||
| First $4 Billion | Next $4 Billion | Thereafter | ||||||||||
New Multimanager Core Bond Portfolio | 0.550 | % | 0.530 | % | 0.510 | % | ||||||
The Advisers to the Acquiring Portfolios are paid by the Manager. Changes to the advisory fees may be negotiated, which could result in an increase or a decrease in the amount of the management fee retained by the Manager, without shareholder approval. A discussion of the basis for the decision by the EQ Board to approve the investment management and advisory agreements with respect to the portfolios is available in EQ Trust’s Semi-Annual or Annual Reports to Shareholders for the periods ended June 30 and December 31.
FMG LLC also currently serves as the Administrator of EQ Trust. The administrative services provided to EQ Trust by FMG LLC include, among others, coordination of EQ Trust’s audit, financial statements and tax returns; expense management and budgeting; legal administrative services and compliance monitoring; portfolio accounting services, including daily net asset value accounting; operational risk management; and oversight of EQ Trust’s proxy voting policies and procedures and anti-money laundering program.
For administrative services, in addition to the management fee, the EQ/Large Cap Core PLUS Portfolio, EQ/Large Cap Value PLUS, EQ/International Core PLUS, New Multimanager Aggressive Equity, New Multimanager Technology, New Multimanager Core Bond, New Multimanager Mid Cap Growth, and New Multimanager Mid Cap Value Portfolios each pay FMG LLC its proportionate share of an asset-based administration fee for these Portfolios and certain other of EQ Trust’s portfolios (noted below), which is equal to an annual rate of 0.150% of the first $20 billion of these portfolios’ aggregate average daily net assets, 0.110% of the next $5 billion of these portfolios’ aggregate average daily net assets, and 0.100% on these portfolios’ aggregate average daily net assets thereafter, plus an annual flat fee of $32,500 per portfolio whose total average net assets are less than $5 billion. The other included portfolios are: the EQ/
116
Emerging Markets Equity PLUS Portfolio, EQ/Equity Growth PLUS Portfolio, EQ/International Value PLUS Portfolio, EQ/Large Cap Growth PLUS Portfolio, EQ/Mid Cap Value PLUS Portfolio, EQ/Natural Resources PLUS Portfolio, EQ/Real Estate PLUS Portfolio, EQ/Global Bond PLUS Portfolio, EQ/Quality Bond PLUS Portfolio, EQ/Alliance Bernstein Small Cap Growth Portfolio, EQ/Franklin Core Balanced Portfolio, EQ/Mutual Large Cap Equity Portfolio, EQ/AXA Franklin Small Cap Value Core Portfolio, EQ/Templeton Global Equity Portfolio, EQ/Global Multi-Sector Equity Portfolio, EQ/High Yield Bond Portfolio, and EQ/Convertible Securities Portfolio.
In the interest of limiting through April 30, 2015 (unless the EQ Board consents to an earlier revision or termination of this arrangement) the expenses of each Acquiring Portfolio listed in the following table, the Manager has entered into an expense limitation agreement with EQ Trust with respect to these Acquiring Portfolios (“Expense Limitation Agreement”). Pursuant to that Expense Limitation Agreement, the Manager has agreed to make payments or waive its management, administrative and other fees to limit the expenses of the Acquiring Portfolios listed below so that the annual operating expenses of each Acquiring Portfolio (other than interest, taxes, brokerage commissions, fees and expenses of other investment companies in which an Acquiring Portfolio invests, dividend and interest expenses on securities sold short, other expenditures that are capitalized in accordance with generally accepted accounting principles, and other extraordinary expenses not incurred in the ordinary course of each Acquiring Portfolio’s business) as a percentage of average daily net assets do not exceed the following respective expense ratios:
Acquiring Portfolios | Total Expenses Limited to (% of daily net assets) | |||||||||||
| Class IA Shares | Class IB Shares | Class K Shares | ||||||||||
New Multimanager Aggressive Equity Portfolio | 1.05 | % | 1.05 | % | 0.80 | % | ||||||
New Multimanager Technology Portfolio | 1.40 | % | 1.40 | % | 1.15 | % | ||||||
New Multimanager Core Bond Portfolio | 1.25 | % | 1.25 | % | 1.00 | % | ||||||
New Multimanager Mid Cap Growth Portfolio | 1.25 | % | 1.25 | % | 1.00 | % | ||||||
New Multimanager Mid Cap Value Portfolio | 1.25 | % | 1.25 | % | 1.00 | % | ||||||
EQ/International Core PLUS | 1.10 | % | 1.10 | % | 0.85 | % | ||||||
EQ/Large Cap Core PLUS | 1.00 | % | 1.00 | % | 0.75 | % | ||||||
EQ/Large Cap Value PLUS | 1.00 | % | 1.00 | % | 0.75 | % | ||||||
The Manager may be reimbursed the amount of any such payments and waivers in the future provided that the payments or waivers are reimbursed within three years of the payment or waiver being made and the combination of the Acquiring Portfolio’s expense ratio and such reimbursements do not exceed the Acquiring Portfolio’s expense cap. If the actual expense ratio is less than the expense cap and the Manager has recouped any eligible previous payments made, the Acquiring Portfolio will be charged such lower expenses.
Each Acquiring Portfolio’s investments are selected by one or more Advisers, which act independently of one another. The following table describes each Acquiring
117
Portfolio’s Adviser(s) and portfolio managers and each portfolio manager’s business experience. Information about the portfolio managers’ compensation, other accounts they manage and their ownership of securities of the EQ/Large Cap Core PLUS, EQ/Large Cap Value PLUS, and EQ/International Core PLUS Portfolios is available in EQ Trust’s Statement of Additional Information dated May 1, 2013, as supplemented. Because the New Multimanager Aggressive Equity, New Multimanager Technology, New Multimanager Core Bond, New Multimanager Mid Cap Growth, and New Multimanager Mid Cap Value Portfolios have not yet commenced operations as of the date of this Proxy Statement/Prospectus, information about the portfolio managers’ compensation, other accounts they manage and their ownership of securities of these Portfolios is not available at this time.
Acquiring Portfolio | Adviser and Portfolio Managers | Business Experience | ||
| New Multimanager Aggressive Equity Portfolio | FMG LLC 1290 Avenue of the Americas New York, New York 10104
Portfolio Managers Kenneth T. Kozlowski Alwi Chan Xavier Poutas | Kenneth T. Kozlowski, Alwi Chan, and Xavier Poutas are jointly and primarily responsible for the (i) selection, monitoring and oversight of the New Multimanager Aggressive Equity Portfolio’s Advisers and (ii) allocating assets among the New Multimanager Aggressive Equity Portfolio’s Allocated Portions. Mr. Kozlowski, Mr. Chan, and Mr. Poutas have managed the New Multimanager Aggressive Equity Portfolio since its inception. | ||
Mr. Kozlowski, CFP®, CHFC, CLU has served as Executive Vice President and Chief Investment Officer of FMG LLC since June 2012 and as Senior Vice President of AXA Equitable since September 2011. He was Senior Vice President of FMG LLC from May 2011 to June 2012 and a Vice President of AXA Equitable from February 2001 to August 2011. He has served as Vice President of EQ Trust from June 2010 to present. Since 2003, Mr. Kozlowski has had primary responsibility for the asset allocation, fund selection and rebalancing of the funds of funds currently managed by FMG LLC and for the ETF Allocated Portions since May 25, 2007. Mr. Kozlowski served as Chief Financial Officer and Treasurer of EQ Trust from 2002 to 2007.
Mr. Chan, CFA® has served as Senior Vice President and Deputy Chief Investment Officer of FMG LLC since June 2012 and as Vice President of AXA Equitable since February 2007. He served as Vice President of FMG LLC from May 2011 to June 2012. Prior to that, he served as an Assistant Vice President (2005-2007) and Senior Investment Analyst (2002-2005) of AXA Equitable. He also has served as a Vice President of EQ Trust since 2007. |
118
Acquiring Portfolio | Adviser and Portfolio Managers | Business Experience | ||
| Mr. Poutas, CFA® has served as an Assistant Portfolio Manager of FMG LLC since May 2011 and as Assistant Vice President of AXA Equitable since November 2008. He joined AXA Equitable’s Funds Management Group in October 2004 as a Fund Administrator and was involved in the implementation of the asset allocation strategy for the funds of funds currently managed by FMG LLC. | ||||
AllianceBernstein L.P. (“AllianceBernstein”) 1345 Avenue of the Americas, New York, New York 10105 Portfolio Managers Judith DeVivo | The management of and investment decisions for the Index Allocated Portion of the New Multimanager Aggressive Equity Portfolio are made by AllianceBernstein’s Passive Equity Investment Team (“Passive Team”), which is responsible for management of all of AllianceBernstein’s Passive Equity accounts. Judith DeVivo, a Senior Vice President and Portfolio Manager for the Passive Team, is primarily responsible for the day-to-day management of the Index Allocated Portion of the Multimanager Aggressive Equity Portfolio. Ms. DeVivo manages equity portfolios benchmarked to a variety of indexes including the S&P 500, S&P Mid Cap, S&P Small Cap and Russell 2000 in addition to several customized accounts. Ms. DeVivo, a Senior Vice President and Portfolio Manager, joined AllianceBernstein in 1971, joined the Passive Management Group in 1984 and has had portfolio management responsibility since that time. Ms. DeVivo has managed the Index Allocated Portion of the New Multimanager Aggressive Equity Portfolio since its inception. | |||
ClearBridge Investments, LLC (“ClearBridge”) 620 Eighth Avenue New York, NY 10018
Portfolio Managers Richard Freeman Evan Bauman | Richard Freeman and Evan Bauman have been responsible for the day-to-day management of a portion of the Active Allocated Portion of the New Multimanager Aggressive Equity Portfolio since its inception.
Mr. Freeman, Senior Portfolio Manager and Managing Director of ClearBridge since 1983, has more than 36 years of securities business experience, 30 years of which has been with ClearBridge or its predecessors.
Mr. Bauman, Portfolio Manager and Managing Director of ClearBridge, has been with ClearBridge or its predecessors since 1996. He has more than 16 years of investment industry experience. | |||
119
Acquiring Portfolio | Adviser and Portfolio Managers | Business Experience | ||
Scotia Institutional Asset Management US, Ltd. (“Scotia US”) 1 Adelaide Street East Toronto, Ontario, Canada M5C2V9
Portfolio Manager Noah Blackstein | Noah Blackstein has been primarily responsible for the day-to-day management of a portion of the Active Allocated Portion of the New Multimanager Aggressive Equity Portfolio since its inception. Mr. Blackstein is a Vice President of Scotia US and joined Scotia US in 1997 as a portfolio manager. Mr. Blackstein has more than 15 years of securities business experience, 12 of which have been with Scotia US. | |||
Marsico Capital Management, LLC (“Marsico”) 1200 17th Street Suite 1600 Denver, CO 80202
Portfolio Managers Thomas F. Marsico Coralie Witter, CFA | Thomas F. Marsico and Coralie Witter have been responsible for the day-to-day management of a portion of the Active Allocated Portion of the New Multimanager Aggressive Equity Portfolio since its inception.
Mr. Marsico is the Chief Executive Officer and Chief Investment Officer of Marsico since its inception in 1997 and has over 30 years of experience as a securities analyst and a portfolio manager.
Ms. Witter is a senior analyst and portfolio manager. She has been associated with Marsico as an investment professional since 2004 and has over 15 years of experience in the financial services industry, most of which has involved equity research. | |||
T. Rowe Price Associates, Inc. (“T. Rowe Price”) 100 East Pratt Street Baltimore, MD 21202
Portfolio Manager Robert W. Sharps | An Investment Advisory Committee has been responsible for the day-to-day management of a portion of the Active Allocated Portion of the New Multimanager Aggressive Equity Portfolio since its inception. Robert W. Sharps, Vice President of T. Rowe Price, has primary responsibility for the day-to-day management of the Active Allocated Portion of the Portfolio and works with the committee in developing and executing the allocated portion’s investment program. Mr. Sharps has been chairman of the committee since 2002. He joined T. Rowe Price in 1997 and his investment experience dates from 1995. | |||
Westfield Capital Management Company, L.P. (“Westfield”) One Financial Center Boston, MA 02111
Portfolio Managers William A. Muggia Ethan J. Meyers, CFA John M. Montgomery Hamlen Thompson Bruce N. Jacobs, CFA | Investment decisions for a portion of the Active Allocated Portion of the New Multimanager Aggressive Equity Portfolio are made at the product level by consensus of the Westfield Investment Committee. Westfield’s Investment Committee is composed of the five team members listed below, a Portfolio Strategist, Economist and team of security analysts. | |||
120
Acquiring Portfolio | Adviser and Portfolio Managers | Business Experience | ||
Mr. Muggia is President, Chief Executive Officer and Chief Investment Officer. Mr. Muggia joined Westfield in 1994. He covers Healthcare and Energy, as well as provides overall market strategy. Mr. Muggia has managed a portion of the Active Allocated Portion of the New Multimanager Aggressive Equity Portfolio since its inception.
Mr. Meyers, CFA, is a Partner and Senior Security Analyst. Mr. Meyers joined Westfield in 1999. He covers Industrials and Business Services. Mr. Meyers has managed a portion of the Active Allocated Portion of the New Multimanager Aggressive Equity Portfolio since its inception.
Mr. Montgomery is a Partner and Portfolio Strategist of Westfield. Mr. Montgomery joined Westfield in 2006. Mr. Montgomery has managed a portion of the Active Allocated Portion of the New Multimanager Aggressive Equity Portfolio since its inception.
Mr. Thompson is a Partner and Senior Security Analyst. Mr. Thompson joined Westfield in 2003. He covers Energy and Industrials. Mr. Thompson has managed a portion of the Active Allocated Portion of the New Multimanager Aggressive Equity Portfolio since its inception.
Mr. Jacobs, CFA, is a Partner and Senior Security Analyst. Mr. Jacobs joined Westfield in 2003. He covers Medical Devices and Consumer Staples. Mr. Jacobs has managed a portion of the Active Allocated Portion of the New Multimanager Aggressive Equity Portfolio since its inception. | ||||
| New Multimanager Technology Portfolio | FMG LLC 1290 Avenue of the Americas New York, New York 10104
Portfolio Managers Kenneth T. Kozlowski Alwi Chan Xavier Poutas | Kenneth T. Kozlowski, Alwi Chan, and Xavier Poutas are jointly and primarily responsible for the (i) selection, monitoring and oversight of the New Multimanager Technology Portfolio’s Advisers, (ii) allocating assets among the New Multimanager Technology Portfolio’s Allocated Portions, and (iii) selection of investments in ETFs for the New Multimanager Technology Portfolio’s ETF Allocated Portion. Mr. Kozlowski, Mr. Chan, and Mr. Poutas have managed the New Multimanager Technology Portfolio since its inception.
| ||
121
Acquiring Portfolio | Adviser and Portfolio Managers | Business Experience | ||
Mr. Kozlowski, CFP®, CHFC, CLU has served as Executive Vice President and Chief Investment Officer of FMG LLC since June 2012 and as Managing Director of AXA Equitable since September 2011. He was Senior Vice President of FMG LLC from May 2011 to June 2012 and a Vice President of AXA Equitable from February 2001 to August 2011. He has served as Vice President of EQ Trust from June 2010 to present. Since 2003, Mr. Kozlowski has had primary responsibility for the asset allocation, fund selection and rebalancing of the funds of funds currently managed by FMG LLC and for the ETF Allocated Portions since May 25, 2007. Mr. Kozlowski served as Chief Financial Officer and Treasurer of EQ Trust from 2002 to 2007.
Mr. Chan, CFA® has served as Senior Vice President and Deputy Chief Investment Officer of FMG LLC since June 2012 and as Lead Director of AXA Equitable since February 2007. He served as Vice President of FMG LLC from May 2011 to June 2012. Prior to that, he served as an Assistant Vice President (2005-2007) and Senior Investment Analyst (2002-2005) of AXA Equitable. He also has served as a Vice President of EQ Trust since 2007.
Mr. Poutas, CFA® has served as an Assistant Portfolio Manager of FMG LLC since May 2011 and as Director of AXA Equitable since November 2008. He joined AXA Equitable’s Funds Management Group in October 2004 as a Fund Administrator and was involved in the implementation of the asset allocation strategy for the funds of funds currently managed by FMG LLC. | ||||
Allianz Global Investors U.S. LLC (“AGI”) 555 Mission St. San Francisco, CA 94105
Portfolio Managers Huachen Chen Walter C. Price | Huachen Chen and Walter C. Price have been jointly and primarily responsible for the management of a portion of the Active Allocated Portion of the New Multimanager Technology Portfolio since its inception.
Mr. Chen has been a Managing Director, Senior Analyst and Portfolio Manager since 2004 and has been associated with AGI as an investment professional since 1984.
Mr. Price has been a Managing Director, Senior Analyst and Portfolio Manager of AGI since 1978. He joined AGI in 1974 as a Senior Securities Analyst. | |||
122
Acquiring Portfolio | Adviser and Portfolio Managers | Business Experience | ||
Wellington Management Company, LLP (“Wellington”) 280 Congress Street Boston, MA 02210
Portfolio Managers John F. Averill, CFA Bruce L. Glazer Anita M. Killian, CFA Michael T. Masdea | John F. Averill, CFA, Bruce L. Glazer, Anita M. Killian, CFA, and Michael T. Masdea have been jointly and primarily responsible for the management of a portion of the Active Allocated Portion of the New Multimanager Technology Portfolio since its inception.
Mr. Averill, CFA, Senior Vice President and Global Industry Analyst of Wellington Management joined Wellington Management as an investment professional in 1994.
Mr. Glazer joined Wellington Management as an investment professional in 1997.
Ms. Killian, CFA, Director and Global Industry Analyst affiliated with Wellington Management joined Wellington Management as an investment professional in 2000.
Mr. Masdea, Vice President and Global Industry Analyst of Wellington Management joined Wellington Management as an investment professional in 2008. Prior to joining Wellington Management, Mr. Masdea was an investment professional at Credit Suisse from 1999 through 2008. | |||
SSgA Funds Management, Inc. (“SSgA FM”) State Street Financial Center One Lincoln Street Boston, MA 02111
Portfolio Managers Lynn Blake John Tucker | The Index Allocated Portion of the New Multimanager Technology Portfolio is managed by SSgA FM’s Global/Equity Beta Solutions Team. Portfolio Managers Lynn Blake and John Tucker have been jointly and primarily responsible for the day-to-day management of the Index Allocated Portion of the New Multimanager Technology Portfolio since its inception.
Ms. Blake is a Senior Managing Director of SSgA FM and CIO of Passive Equities. In this capacity, Lynn oversees a team of 65 portfolio managers globally, and over 1,000 portfolios with assets in excess of $750 billion. In addition, Lynn Blake Co-Chairs the SSgA Fiduciary Committee and is a member of the North American Product Development Committee, the IT Steering Committee, and the Senior Management Group. Prior to Lynn Blake’s current role, she was Head of Non-US Markets of passive equities, responsible for overseeing the management of all non-US equity index strategies, as well as serving as portfolio manager for several equity index portfolios.
| |||
123
Acquiring Portfolio | Adviser and Portfolio Managers | Business Experience | ||
| Mr. Tucker is a Managing Director of SSgA FM, and Co-Head of Passive Equity Strategies in North America. He is responsible for overseeing the management of all equity index strategies and Exchange Traded Funds managed in Boston and Montreal. He is a member of the Senior Management Group. He joined State Street in 1988 and since that time has had portfolio management responsibilities. | ||||
| New Multimanager Core Bond Portfolio | FMG LLC 1290 Avenue of the Americas New York, New York 10104
Portfolio Managers Kenneth T. Kozlowski Alwi Chan Xavier Poutas | Kenneth T. Kozlowski, Alwi Chan, and Xavier Poutas are jointly and primarily responsible for the (i) selection, monitoring and oversight of the New Multimanager Core Bond Portfolio’s Advisers, and (ii) allocating assets among the New Multimanager Core Bond Portfolio’s Allocated Portions. Mr. Kozlowski, Mr. Chan, and Mr. Poutas have managed the New Multimanager Core Bond Portfolio since its inception.
Mr. Kozlowski, CFP®, CHFC, CLU has served as Executive Vice President and Chief Investment Officer of FMG LLC since June 2012 and as Managing Director of AXA Equitable since September 2011. He was Senior Vice President of FMG LLC from May 2011 to June 2012 and a Vice President of AXA Equitable from February 2001 to August 2011. He has served as Vice President of EQ Trust from June 2010 to present. Since 2003, Mr. Kozlowski has had primary responsibility for the asset allocation, fund selection and rebalancing of the funds of funds currently managed by FMG LLC and for the ETF Allocated Portions since May 25, 2007. Mr. Kozlowski served as Chief Financial Officer and Treasurer of EQ Trust from 2002 to 2007.
Mr. Chan, CFA® has served as Senior Vice President and Deputy Chief Investment Officer of FMG LLC since June 2012 and as Lead Director of AXA Equitable since February 2007. He served as Vice President of FMG LLC from May 2011 to June 2012. Prior to that, he served as an Assistant Vice President (2005-2007) and Senior Investment Analyst (2002-2005) of AXA Equitable. He also has served as a Vice President of EQ Trust since 2007.
| ||
124
Acquiring Portfolio | Adviser and Portfolio Managers | Business Experience | ||
| Mr. Poutas, CFA® has served as an Assistant Portfolio Manager of FMG LLC since May 2011 and as Director of AXA Equitable since November 2008. He joined AXA Equitable’s Funds Management Group in October 2004 as a Fund Administrator and was involved in the implementation of the asset allocation strategy for the funds of funds currently managed by FMG LLC. | ||||
BlackRock Financial Management, Inc. (“BFM”) 40 East 52nd Street New York, NY 10022
Portfolio Managers Brian Weinstein Bob Miller | Brian Weinstein and Bob Miller have been jointly and primarily responsible for the management of a portion of the Active Allocated Portion of the New Multimanager Core Bond Portfolio since its inception.
Mr. Weinstein has been a Managing Director at BFM since 2007. Mr. Weinstein is a member of the Multi-Sector and Mortgage Investment Group within BlackRock Fundamental Fixed Income. He is head of Institutional Multi-Sector Portfolios.
Mr. Miller has been a Managing Director at BFM since 2011. Mr. Miller was the co-founder and a Partner of RoundTable Investment Management Company from 2007 to 2009. He was a Managing Director of Bank of America from 1999 to 2007. | |||
Pacific Investment Management Company, LLC (“PIMCO”) 840 Newport Center Drive Newport Beach, CA 92660
Portfolio Manager Saumil H. Parikh | Saumil H. Parikh has been primarily responsible for the management of a portion of the Active Allocated Portion of the New Multimanager Core Bond Portfolio since its inception. Mr. Parikh is a managing director and generalist portfolio manager in the Newport Beach office. He is head of macroeconomic research for North America and also serves as a member of the short-term, mortgage and global specialist portfolio management teams. Prior to joining PIMCO in 2000, Mr. Parikh was a financial economist and market strategist at UBS Warburg. He has 11 years of investment experience. | |||
SSgA FM State Street Financial Center One Lincoln Street Boston, MA 02111
Portfolio Managers Michael Brunell Mahesh Jayakumar | Michael Brunell and Mahesh Jayakumar have been jointly and primarily responsible for the management of the Index Allocated Portion of the New Multimanager Core Bond Portfolio since its inception.
| |||
125
Acquiring Portfolio | Adviser and Portfolio Managers | Business Experience | ||
Mr. Brunell is a Vice President of SSgA FM. He is a member of the U.S. Beta Solutions team since 2004. In his current role as part of the Beta solutions group, Mr. Brunell is responsible for developing and managing funds against a variety of conventional and custom bond index strategies, including fixed income exchange traded funds, which were established in 2007. Prior to joining the investment group, Mr. Brunell was responsible for managing the US Bond Operations team, which he had been a member of since 1997.
Mr. Jayakumar is a Principal of SSgA. He is currently a Portfolio Manager in the Beta and Government Solutions team in Global Fixed Income. He is responsible for managing several portfolios spanning diverse areas such as Green Bonds, Agencies, Government/Credit and Aggregate and client directed mandates. Mr. Jayakumar has been with SSgA since 2008. Prior to joining State Street Corporation, he worked as a software development manager for a large enterprise software provider in their R&D division. | ||||
| New Multimanager Mid Cap Growth Portfolio | FMG LLC 1290 Avenue of the Americas New York, New York 10104
Portfolio Managers Kenneth T. Kozlowski Alwi Chan Xavier Poutas | Kenneth T. Kozlowski, Alwi Chan, and Xavier Poutas are jointly and primarily responsible for the (i) selection, monitoring and oversight of the New Multimanager Mid Cap Growth Portfolio’s Advisers, and (ii) allocating assets among the New Multimanager Mid Cap Growth Portfolio’s Allocated Portions. Mr. Kozlowski, Mr. Chan, and Mr. Poutas have managed the New Multimanager Mid Cap Growth Portfolio since its inception.
Mr. Kozlowski, CFP®, CHFC, CLU has served as Executive Vice President and Chief Investment Officer of FMG LLC since June 2012 and as Managing Director of AXA Equitable since September 2011. He was Senior Vice President of FMG LLC from May 2011 to June 2012 and a Vice President of AXA Equitable from February 2001 to August 2011. He has served as Vice President of EQ Trust from June 2010 to present. Since 2003, Mr. Kozlowski has had primary responsibility for the asset allocation, fund selection and rebalancing of the funds of funds currently managed by FMG LLC and for the ETF Allocated Portions since May 25, 2007. Mr. Kozlowski served as Chief Financial Officer and Treasurer of EQ Trust from 2002 to 2007. | ||
126
Acquiring Portfolio | Adviser and Portfolio Managers | Business Experience | ||
Mr. Chan, CFA® has served as Senior Vice President and Deputy Chief Investment Officer of FMG LLC since June 2012 and as Lead Director of AXA Equitable since February 2007. He served as Vice President of FMG LLC from May 2011 to June 2012. Prior to that, he served as an Assistant Vice President (2005-2007) and Senior Investment Analyst (2002-2005) of AXA Equitable. He also has served as a Vice President of EQ Trust since 2007.
Mr. Poutas, CFA® has served as an Assistant Portfolio Manager of FMG LLC since May 2011 and as Director of AXA Equitable since November 2008. He joined AXA Equitable’s Funds Management Group in October 2004 as a Fund Administrator and was involved in the implementation of the asset allocation strategy for the funds of funds currently managed by FMG LLC. | ||||
AllianceBernstein 1345 Avenue of the Americas New York, NY 10105
US Small/SMID Cap Growth Investment Team Bruce K. Aronow N. Kumar Kirpalani Samantha S. Lau Wen-Tse Tseng | The management of and investment decisions for a portion of the Active Allocated Portion of the New Multimanager Mid Cap Growth Portfolio are made by AllianceBernstein’s US Small/SMID Cap Growth Investment Team, which is responsible for management of all of AllianceBernstein’s US Small/SMID Cap Growth accounts. The US Small/SMID Cap Growth Investment Team relies heavily on the fundamental analysis and research of the US Small/SMID Cap Growth Team. In addition, the team draws upon the research of AllianceBernstein’s industry analysts as well as other portfolio management teams. The four members of the US Small/SMID Cap Growth Investment Team with the most significant responsibility for the day-to-day management of a portion of the Active Allocated Portion of the New Multimanager Mid Cap Growth Portfolio are Bruce K. Aronow, N. Kumar Kirpalani, Samantha S. Lau and Wen-Tse Tseng.
Mr. Aronow, Senior Vice President, Portfolio Manager/Research Analyst, serves as Team Leader for the Small/SMID Cap Growth product and is also responsible for research and portfolio management for the Small/SMID Cap Growth consumer/ commercial sectors. Mr. Aronow joined AllianceBernstein in 1999 and has had portfolio management responsibilities since that time. Mr. Aronow has managed a portion of the Active Allocated Portion of the New Multimanager Mid Cap Growth Portfolio since its inception. | |||
127
Acquiring Portfolio | Adviser and Portfolio Managers | Business Experience | ||
Mr. Kirpalani, Senior Vice President and Portfolio Manager/ Research Analyst, joined AllianceBernstein as an Investment Professional in 1999 and is responsible for research and portfolio management for the Small Cap/SMID Growth industrials, financials and energy sectors. Mr. Kirpalani has managed a portion of the Active Allocated Portion of the New Multimanager Mid Cap Growth Portfolio since its inception.
Ms. Lau, Senior Vice President and Portfolio Manager/Research Analyst, joined AllianceBernstein as an Investment Professional in 1999 and is responsible for research and portfolio management for the Small Cap/SMID Growth technology sector. Mr. Lau has managed a portion of the Active Allocated Portion of the New Multimanager Mid Cap Growth Portfolio since its inception.
Mr. Tseng, Senior Vice President and Portfolio Manager/Research Analyst, is responsible for research and portfolio management for the Small/SMID Cap Growth healthcare sector. Prior to joining AllianceBernstein in March 2006, Mr. Tseng was the healthcare sector portfolio manager for the small cap growth team at William D. Witter since August 2003 and with Weiss, Peck & Greer, from April 2002 to August 2003. Mr. Tseng has managed a portion of the Active Allocated Portion of the New Multimanager Mid Cap Growth Portfolio since its inception. | ||||
BlackRock Investment Management, LLC (“BlackRock”) P.O. Box 9011 Princeton, NJ 08543
Portfolio Managers Christopher Bliss, CFA, CPA Edward Corallo Greg Savage | Christopher Bliss, Edward Corallo and Greg Savage have been primarily responsible for day-to-day management of the Index Allocated Portion of the New Multimanager Mid Cap Growth Portfolio since its inception. Mr. Bliss’s service with BlackRock dates back to 2004, including years with Barclays Global Investors (BGI), which, merged with BlackRock in 2009. He is a Managing Director and a Portfolio Manager and has more than 5 years of portfolio management responsibility.
Mr. Corallo’s service with BlackRock dates back to 1998, including his years as a Principal at BGI. He is a Managing Director and has more than 5 years of portfolio management responsibility.
| |||
128
Acquiring Portfolio | Adviser and Portfolio Managers | Business Experience | ||
| Greg Savage is Managing Director and Head of iShares Portfolio Management with BlackRock’s Index Equity team. He has been with the firm as a portfolio manager since 2009. From 1999 to 2009 he served at BGI as a senior portfolio manager and team leader in the iShares Index Equity Portfolio Management group and previously as a transition manager in the Transition Management Group. | ||||
Franklin Advisers, Inc. One Franklin Parkway San Mateo, CA 94403
Portfolio Managers Edward B. Jamieson Michael McCarthy | Edward B. Jamieson, President, Chief Investment Officer-Franklin Equity Group and Portfolio Manager, and Michael McCarthy, Senior Vice President, Director of Research and Portfolio Manager are the members of the portfolio management team primarily responsible for the day-to-day management of a portion of the Active Allocated Portion of the New Multimanager Mid Cap Growth Portfolio. Members of the team work jointly to determine investment strategy and security selection for the Portfolio.
Mr. Jamieson has had portfolio management responsibilities with Franklin Advisers and its predecessor since 1987 and has managed a portion of the Active Allocated Portion of the New Multimanager Mid Cap Growth Portfolio since its inception.
Mr. McCarthy joined Franklin Advisers in 1992 and has had portfolio management responsibilities since he joined the firm. Mr. McCarthy has managed a portion of the Active Allocated Portion of the New Multimanager Mid Cap Growth Portfolio since its inception. | |||
Wellington Management Company, LLP 280 Congress Street Boston, MA 02210
Portfolio Managers Stephen Mortimer Michael T. Carmen, CFA | Stephen Mortimer, Senior Vice President and Equity Portfolio Manager of Wellington Management, is the portfolio manager and has been primarily responsible for the day-to-day management of a portion of the Active Allocated Portion of the New Multimanager Mid Cap Growth Portfolio since its inception. Mr. Mortimer joined Wellington Management as an investment professional in 2001.
Michael T. Carmen, CFA, Senior Vice President and Equity Portfolio Manager of Wellington Management, is involved in portfolio management and securities analysis of a portion of the Active Allocated Portion of the New Multimanager Mid Cap Growth Portfolio since its inception. Mr. Carmen joined Wellington Management as an investment professional in 1999. | |||
129
Acquiring Portfolio | Adviser and Portfolio Managers | Business Experience | ||
| New Multimanager Mid Cap Value Portfolio | FMG LLC 1290 Avenue of the Americas New York, New York 10104
Portfolio Managers Kenneth T. Kozlowski Alwi Chan Xavier Poutas | Kenneth T. Kozlowski, Alwi Chan, and Xavier Poutas are jointly and primarily responsible for the (i) selection, monitoring and oversight of the New Multimanager Mid Cap Value Portfolio’s Advisers, and (ii) allocating assets among the New Multimanager Mid Cap Value Portfolio’s Allocated Portions. Mr. Kozlowski, Mr. Chan, and Mr. Poutas have managed the New Multimanager Mid Cap Value Portfolio since its inception.
Mr. Kozlowski, CFP®, CHFC, CLU has served as Executive Vice President and Chief Investment Officer of FMG LLC since June 2012 and as Managing Director of AXA Equitable since September 2011. He was Senior Vice President of FMG LLC from May 2011 to June 2012 and a Vice President of AXA Equitable from February 2001 to August 2011. He has served as Vice President of EQ Trust from June 2010 to present. Since 2003, Mr. Kozlowski has had primary responsibility for the asset allocation, fund selection and rebalancing of the funds of funds currently managed by FMG LLC and for the ETF Allocated Portions since May 25, 2007. Mr. Kozlowski served as Chief Financial Officer and Treasurer of EQ Trust from 2002 to 2007.
Mr. Chan, CFA® has served as Senior Vice President and Deputy Chief Investment Officer of FMG LLC since June 2012 and as Lead Director of AXA Equitable since February 2007. He served as Vice President of FMG LLC from May 2011 to June 2012. Prior to that, he served as an Assistant Vice President (2005-2007) and Senior Investment Analyst (2002-2005) of AXA Equitable. He also has served as a Vice President of EQ Trust since 2007.
Mr. Poutas, CFA® has served as an Assistant Portfolio Manager of FMG LLC since May 2011 and as Director of AXA Equitable since November 2008. He joined AXA Equitable’s Funds Management Group in October 2004 as a Fund Administrator and was involved in the implementation of the asset allocation strategy for the funds of funds currently managed by FMG LLC. |
130
Acquiring Portfolio | Adviser and Portfolio Managers | Business Experience | ||
BlackRock P.O. Box 9011 Princeton, NJ 08543
Portfolio Managers Christopher Bliss, CFA, CPA Edward Corallo Greg Savage | Christopher Bliss, Edward Corallo and Greg Savage have been primarily responsible for day-to-day management of the Index Allocated Portion of the New Multimanager Mid Cap Value Portfolio since its inception. Mr. Bliss’s service with BlackRock dates back to 2004, including years with Barclays Global Investors (BGI), which, merged with BlackRock in 2009. He is a Managing Director and a Portfolio Manager and has more than 5 years of portfolio management responsibility.
Mr. Corallo’s service with BlackRock dates back to 1998, including his years as a Principal at BGI. He is a Managing Director and has more than 5 years of portfolio management responsibility.
Greg Savage is Managing Director and Head of iShares Portfolio Management with BlackRock’s Index Equity team. He has been with the firm as a portfolio manager since 2009. From 1999 to 2009 he served at BGI as a senior portfolio manager and team leader in the iShares Index Equity Portfolio Management group and previously as a transition manager in the Transition Management Group. | |||
Diamond Hill Capital Management, Inc. 325 John H. McConnell Blvd., Suite 200 Columbus, Ohio 43215
Portfolio Managers Chris Welch, CFA Tom Schindler, CFA Chris Bingaman, CFA | Chris Welch, CFA, Tom Schindler, CFA, and Chris Bingaman, CFA, have been primarily responsible for the day-to-day management of a portion of the Active Allocated Portion of the Multimanager Mid Cap Value Portfolio since its inception.
Mr. Welch currently serves as Portfolio Manager and Co-Chief Investment Officer, positions he has held since 2005 and 2010, respectively.
Mr. Schindler has held portfolio management responsibilities at Diamond Hill since 2000.
Mr. Bingaman has held portfolio management responsibilities at Diamond Hill since 2001. | |||
131
Acquiring Portfolio | Adviser and Portfolio Managers | Business Experience | ||
Knightsbridge Asset Management, LLC 660 Newport Center Drive, Suite 460 Newport Beach, California 92660
Portfolio Manager John G. Prichard, CFA | John Prichard, CFA, is President, Chief Investment Officer and co-founder of Knightsbridge, which was established in 1998. He has served as the lead Portfolio Manager with primary responsibility for a portion of the Active Allocated Portion of the New Multimanager Mid Cap Value Portfolio since its inception. Since the inception of Knightsbridge, Mr. Prichard has participated in all investment decision making, establishment of asset allocation and security selection across portfolios. Mr. Prichard has over nineteen years of investment experience. | |||
Lord, Abbett & Co. LLC 90 Hudson Street Jersey City, NJ 07302-3973
Portfolio Managers Justin C. Maurer Thomas B. Maher | Justin C. Maurer and Thomas B. Maher have been jointly and primarily responsible for the day-to-day management of a portion of the Active Allocated Portion of the New Multimanager Mid Cap Value Portfolio since its inception.
Mr. Maurer is a Partner of Lord Abbett and Portfolio Manager of the Smid Cap Value equity strategy. He joined the firm in 2001, at which time he was a research analyst for the small cap value equity strategy. Mr. Maurer has been in the investment business since 1991.
Mr. Maher is also a Partner of Lord Abbett and Portfolio Manager of the Smid Cap Value equity strategy. He joined the firm in 2003, at which time he was a research analyst for the mid cap growth equity strategy. Mr. Maher has been in the investment business since 1989. | |||
| EQ/Large Cap Core PLUS Portfolio | FMG LLC 1290 Avenue of the Americas New York, New York 10104
Portfolio Managers Kenneth T. Kozlowski Alwi Chan Xavier Poutas | Kenneth T. Kozlowski, Alwi Chan, and Xavier Poutas are jointly and primarily responsible for the (i) selection, monitoring and oversight of the EQ/Large Cap Core PLUS Portfolio’s Advisers, (ii) allocating assets among the EQ/Large Cap Core PLUS Portfolio’s Allocated Portions, (iii) managing the EQ/Large Cap Core PLUS Portfolio’s equity exposure, and (iv) the selection of investments in ETFs for the EQ/Large Cap Core PLUS Portfolio’s ETF Allocated Portion.
| ||
132
Acquiring Portfolio | Adviser and Portfolio Managers | Business Experience | ||
Mr. Kozlowski, CFP®, CHFC, CLU has served as Executive Vice President and Chief Investment Officer of FMG LLC since June 2012 and as Managing Director of AXA Equitable since September 2011. He was Senior Vice President of FMG LLC from May 2011 to June 2012 and a Vice President of AXA Equitable from February 2001 to August 2011. He has served as Vice President of EQ Trust from June 2010 to present. Since 2003, Mr. Kozlowski has had primary responsibility for the asset allocation, fund selection and rebalancing of the funds of funds currently managed by FMG LLC and for the ETF Allocated Portions since May 25, 2007. Mr. Kozlowski served as Chief Financial Officer and Treasurer of EQ Trust from 2002 to 2007. He has been managing the EQ/Large Cap Core PLUS Portfolio since May 2011.
Mr. Chan, CFA® has served as Senior Vice President and Deputy Chief Investment Officer of FMG LLC since June 2012 and as Lead Director of AXA Equitable since February 2007. He served as Vice President of FMG LLC from May 2011 to June 2012. Prior to that, he served as an Assistant Vice President (2005-2007) and Senior Investment Analyst (2002-2005) of AXA Equitable. He also has served as a Vice President of EQ Trust since 2007. He has been managing the EQ/Large Cap Core PLUS Portfolio since May 2009.
Mr. Poutas, CFA® has served as an Assistant Portfolio Manager of FMG LLC since May 2011 and as Director of AXA Equitable since November 2008. He joined AXA Equitable’s Funds Management Group in October 2004 as a Fund Administrator and was involved in the implementation of the asset allocation strategy for the funds of funds currently managed by FMG LLC. He has been managing the EQ/Large Cap Core PLUS Portfolio since May 2011. | ||||
Institutional Capital LLC (“ICAP”) 225 West Wacker Drive, Suite 2400, Chicago, IL 60606
Portfolio Managers Jerrold K. Senser Thomas R. Wenzel Thomas Cole | Jerrold K. Senser, Thomas R. Wenzel, and Thomas Cole are jointly and primarily responsible for the day-to-day management of a portion of the Active Allocated Portion of the EQ/Large Cap Core PLUS Portfolio.
| |||
133
Acquiring Portfolio | Adviser and Portfolio Managers | Business Experience | ||
Mr. Senser serves as Chief Executive Officer and Chief Investment Officer of ICAP. He heads the investment committee and is a lead portfolio manager for all ICAP’s investment strategies. Mr. Senser joined ICAP in 1986 and has had portfolio management responsibilities since that time. He has been managing the EQ/Large Cap Core PLUS Portfolio since May 2007.
Mr. Wenzel, Senior Executive Vice President and Co- Director of Research of ICAP. Mr. Wenzel is a senior member of the portfolio management team and serves as a member of ICAP’s Executive Management Committee. He joined ICAP in 1992 and has had portfolio management responsibility since that time. He has been managing the EQ/Large Cap Core PLUS Portfolio since May 2008.
Mr. Cole serves as Senior Executive Vice President and Co- Director of Research of ICAP. Mr. Cole is a senior member of the portfolio management team and serves as a member of ICAP’s Executive Management Committee. Mr. Cole joined ICAP in April 2012 and, prior thereto he served as Head of US Equities at UBS Global Asset Management for eleven years. Mr. Cole has over 27 years of investment management experience. He has been managing the EQ/Large Cap Core PLUS Portfolio since July 2012. | ||||
Capital Guardian Trust Company 333 South Hope Street, Los Angeles, CA 90071
Portfolio Managers Carlos Schonfeld Cheryl E. Frank | Carlos Schonfeld and Cheryl E. Frank have served as co-research portfolio coordinators for a portion of the Active Allocated Portion of the EQ/Large Cap Core PLUS Portfolio since June 2013.
Cheryl E. Frank is a vice president and co-research portfolio coordinator of U.S. equities for Capital International Research, Inc. (an affiliate of Capital Guardian Trust Company) with research responsibilities for the health care services sector, drug retail industry, and software. Ms. Frank joined Capital International in 2002.
Carlos Schonfeld is a senior vice president and co-research portfolio coordinator of U.S. equities for Capital International Research, Inc. (an affiliate of Capital Guardian Trust Company) with research responsibilities for the business services sector. Mr. Schonfeld joined Capital International as an analyst in 1999. | |||
134
Acquiring Portfolio | Adviser and Portfolio Managers | Business Experience | ||
BlackRock P.O. Box 9011, Princeton, New Jersey 08543-9011
Portfolio Managers Edward Corallo Christopher Bliss Greg Savage | Edward Corallo, Christopher Bliss, and Greg Savage are jointly and primarily responsible for the management of the Index Allocated Portion of the EQ/Large Cap Core PLUS Portfolio.
Mr. Corallo is a Managing Director of BlackRock, Inc. since 2009. He was a principal of Barclay’s Global Investors (BGI) from 1997 to 2009. Mr. Corallo has more than five years of portfolio management responsibility. He has been managing the EQ/Large Cap Core PLUS Portfolio since May 2010.
Mr. Bliss, Managing Director and portfolio manager, is a member of BlackRock’s Institutional Index Equity team. He focuses on emerging and frontier market strategies. He has been with BlackRock since 2009. From 2004 to 2009 he served at BGI heading a team responsible for a variety of index and enhanced index emerging market products. Mr. Bliss has more than five year’s portfolio management responsibility. He has been managing the EQ/Large Cap Core PLUS Portfolio since May 2011.
Greg Savage, is Managing Director and Head of iShares Portfolio Management with BlackRock’s Index Equity team. He has been with the firm as a portfolio manager since 2009. From 1999 to 2009 he served at BGI as a senior portfolio manager and team leader in the iShares Index Equity Portfolio Management group and previously as a transition manager in the Transition Management Group. He has been managing the EQ/Large Cap Core PLUS Portfolio since May 2012. | |||
| EQ/Large Cap Value PLUS Portfolio | FMG LLC 1290 Avenue of the Americas New York, New York 10104
Portfolio Managers Kenneth T. Kozlowski Alwi Chan Xavier Poutas | Kenneth T. Kozlowski, Alwi Chan, and Xavier Poutas are jointly and primarily responsible for the (i) selection, monitoring and oversight of the EQ/Large Cap Value PLUS Portfolio’s Advisers, (ii) allocating assets among the EQ/Large Cap Value PLUS Portfolio’s Allocated Portions, (iii) managing the EQ/Large Cap Value PLUS Portfolio’s equity exposure, and (iv) selection of investments in ETFs for the EQ/Large Cap Value PLUS Portfolio’s ETF Allocated Portion.
| ||
135
Acquiring Portfolio | Adviser and Portfolio Managers | Business Experience | ||
Mr. Kozlowski, CFP®, CHFC, CLU has served as Executive Vice President and Chief Investment Officer of FMG LLC since June 2012 and as Managing Director of AXA Equitable since September 2011. He was Senior Vice President of FMG LLC from May 2011 to June 2012 and a Vice President of AXA Equitable from February 2001 to August 2011. He has served as Vice President of EQ Trust from June 2010 to present. Since 2003, Mr. Kozlowski has had primary responsibility for the asset allocation, fund selection and rebalancing of the funds of funds currently managed by FMG LLC and for the ETF Allocated Portions since May 25, 2007. Mr. Kozlowski served as Chief Financial Officer and Treasurer of EQ Trust from 2002 to 2007. He has been managing the EQ/Large Cap Value PLUS Portfolio since December 2008.
Mr. Chan, CFA® has served as Senior Vice President and Deputy Chief Investment Officer of FMG LLC since June 2012 and as Lead Director of AXA Equitable since February 2007. He served as Vice President of FMG LLC from May 2011 to June 2012. Prior to that, he served as an Assistant Vice President (2005-2007) and Senior Investment Analyst (2002-2005) of AXA Equitable. He also has served as a Vice President of EQ Trust since 2007. He has been managing the EQ/Large Cap Value PLUS Portfolio since May 2009.
Mr. Poutas, CFA® has served as an Assistant Portfolio Manager of FMG LLC since May 2011 and as Director of AXA Equitable since November 2008. He joined AXA Equitable’s Funds Management Group in October 2004 as a Fund Administrator and was involved in the implementation of the asset allocation strategy for the funds of funds currently managed by FMG LLC. He has been managing the EQ/Large Cap Value PLUS Portfolio since May 2011. | ||||
AllianceBernstein 1345 Avenue of the Americas, New York, New York 10105
Portfolio Managers Joseph Gerard Paul Gregory Powell Christopher W. Marx Judith DeVivo | Joseph Gerard Paul, Gregory Powell, and Christopher W. Marx are jointly and primarily responsible for the management of a portion of the Active Allocated Portion of the EQ/Large Cap Value PLUS Portfolio.
| |||
136
Acquiring Portfolio | Adviser and Portfolio Managers | Business Experience | ||
Mr. Paul, Senior Vice President/CIO North American Value Equities since 2009. He also serves as the Global Head of Diversified Value Services of AllianceBernstein. Mr. Paul has been with AllianceBernstein and Sanford C. Bernstein & Co., a predecessor company, since 1987. For more than five years prior thereto he served as CIO of Advanced Value Fund and Small and Mid-Cap Value Fund. He has been managing the EQ/Large Cap Value PLUS Portfolio since October 2009.
Mr. Powell, Senior Vice President/Director of Research U.S. Large Cap Value Equities since 2010. Prior thereto Mr. Powell served as Director of Research of Equity Hedge Fund Strategies and Head of Fundamental Value Research. Mr. Powell joined AllianceBernstein in 1997 and has had portfolio management responsibility for more than five years. He has been managing the EQ/Large Cap Value PLUS Portfolio since May 2011.
Mr. Marx, Senior Portfolio Manager. Mr. Marx joined AllianceBernstein in 1997 as a research analyst. Mr. Marx has had portfolio management responsibility for more than five years. He has been managing the EQ/Large Cap Value PLUS Portfolio since January 2010.
Ms. DeVivo, a Senior Vice President and Portfolio Manager, has been primarily responsible for the management of the Index Allocated Portion of the EQ/Large Cap Value PLUS Portfolio since December 2008. Ms. DeVivo joined AllianceBernstein in 1971, joined the Passive Management Group in 1984 and has had portfolio management responsibility since that time. Ms. DeVivo manages equity portfolios benchmarked to a variety of indexes including the S&P 500, S&P MidCap, S&P Small Cap, Russell 2000, FTSE 100, TOPIX, DJ EuroSTOXX 50 and S&P/ASX 200 Indexes in addition to several customized accounts. | ||||
BlackRock P.O. Box 9011, Princeton, New Jersey 08543-9011
Portfolio Managers Bartlett Geer Carrie King | Bartlett Geer and Carrie King have been jointly and primarily responsible for the management of a portion of the Active Allocated Portion of the EQ/Large Cap Value PLUS Portfolio since July 2013.
| |||
137
Acquiring Portfolio | Adviser and Portfolio Managers | Business Experience | ||
Mr. Geer, CFA has been a Managing Director of and Portfolio Manager with BlackRock since 2012. Prior to that he was a Managing Director and Portfolio Manager of Putnam Investments for more than five years.
Ms. King has been a Managing Director of BlackRock since 2006. She was a Vice President of MLIM from 1993 to 2006. Ms. King has less than 5 years of portfolio management responsibility. She has been a research analyst for 24 years. | ||||
| EQ/International Core PLUS Portfolio | FMG LLC 1290 Avenue of the Americas New York, New York 10104
Portfolio Managers Kenneth T. Kozlowski Alwi Chan Xavier Poutas | Kenneth T. Kozlowski, Alwi Chan, and Xavier Poutas are jointly and primarily responsible for the (i) selection, monitoring and oversight of the EQ/International Core PLUS Portfolio’s Advisers, (ii) allocating assets among the EQ/International Core PLUS Portfolio’s Allocated Portions, (iii) managing the EQ/International Core PLUS Portfolio’s equity exposure, and (iv) selection of investments in ETFs for the EQ/International Core PLUS Portfolio’s ETF Allocated Portion.
Mr. Kozlowski, CFP®, CHFC, CLU has served as Executive Vice President and Chief Investment Officer of FMG LLC since June 2012 and as Managing Director of AXA Equitable since September 2011. He was Senior Vice President of FMG LLC from May 2011 to June 2012 and a Vice President of AXA Equitable from February 2001 to August 2011. He has served as Vice President of EQ Trust from June 2010 to present. Since 2003, Mr. Kozlowski has had primary responsibility for the asset allocation, fund selection and rebalancing of the funds of funds currently managed by FMG LLC and for the ETF Allocated Portions since May 25, 2007. Mr. Kozlowski served as Chief Financial Officer and Treasurer of EQ Trust from 2002 to 2007. He has been managing the EQ/International Core PLUS Portfolio since May 2011.
| ||
138
Acquiring Portfolio | Adviser and Portfolio Managers | Business Experience | ||
Mr. Chan, CFA® has served as Senior Vice President and Deputy Chief Investment Officer of FMG LLC since June 2012 and as Lead Director of AXA Equitable since February 2007. He served as Vice President of FMG LLC from May 2011 to June 2012. Prior to that, he served as an Assistant Vice President (2005-2007) and Senior Investment Analyst (2002-2005) of AXA Equitable. He also has served as a Vice President of EQ Trust since 2007. He has been managing the EQ/International Core PLUS Portfolio since May 2009.
Mr. Poutas, CFA® has served as an Assistant Portfolio Manager of FMG LLC since May 2011 and as Director of AXA Equitable since November 2008. He joined AXA Equitable’s Funds Management Group in October 2004 as a Fund Administrator and was involved in the implementation of the asset allocation strategy for the funds of funds currently managed by FMG LLC. He has been managing the EQ/International Core PLUS Portfolio since May 2011. | ||||
WHV Investment Management and its affiliate Hirayama Investments, LLC (“WHV”) 301 Battery Street, Suite 400, San Francisco, CA 94111
Portfolio Manager Richard K. Hirayama | Richard K. Hirayama has been primarily responsible for the management of a portion of the Active Allocated Portion of the EQ/International Core PLUS Portfolio since May 2007. Mr. Hirayama, Senior Vice President, Portfolio Manager and Security Analyst joined WHV in 1990 and has had portfolio management responsibilities since that time. Mr. Hirayama is also the Managing Member of Hirayama Investments and has had portfolio management responsibilities since its effective date of January 1, 2009. | |||
Massachusetts Financial Services Company d/b/a/ MFS Investment Management (“MFS”) 111 Huntington Avenue, Boston, MA 02199
Portfolio Managers David Antonelli Kevin Dwan | David Antonelli and Kevin Dwan have been jointly and primarily responsible for the management of a portion of the Active Allocated Portion of the EQ/International Core PLUS Portfolio since June 2013.
Mr. Antonelli is a Vice Chairman and Portfolio Manager of MFS and has been employed in the investment area of MFS since 1991.
Mr. Dwan is an Investment Officer and Portfolio Manager of MFS and has been employed in the investment area of MFS since 2005. | |||
139
Acquiring Portfolio | Adviser and Portfolio Managers | Business Experience | ||
BlackRock P.O. Box 9011, Princeton, New Jersey 08543-9011
Portfolio Managers Edward Corallo Christopher Bliss Greg Savage | Edward Corallo, Christopher Bliss, and Greg Savage are jointly and primarily responsible for the management of the Index Allocated Portion of the EQ/International Core PLUS Portfolio.
Mr. Corallo is a Managing Director of BlackRock, Inc. since 2009. He was a principal of BGI from 1997 to 2009. Mr. Corallo has more than five years of portfolio management responsibility. He has been managing the Index Allocated Portion of the EQ/International Core PLUS Portfolio since May 2010.
Mr. Bliss, Managing Director and portfolio manager, is a member of BlackRock’s Institutional Index Equity team. He focuses on emerging and frontier market strategies. He has been with BlackRock since 2009. From 2004 to 2009 he served at BGI heading a team responsible for a variety of index and enhanced index emerging market products. Mr. Bliss has more than five year’s portfolio management responsibility. He has been managing the Index Allocated Portion of the EQ/International Core PLUS Portfolio since May 2011.
Mr. Savage, is Managing Director and Head of iShares Portfolio Management with BlackRock’s Index Equity team. He has been with the firm as a portfolio manager since 2009. From 1999 to 2009 he served at BGI as a senior portfolio manager and team leader in the iShares Index Equity Portfolio Management group and previously as a transition manager in the Transition Management Group. He has been managing the Index Allocated Portion of the EQ/International Core PLUS Portfolio since May 2012. |
In July 2011, a lawsuit was filed in the United States District Court of the District of New Jersey, entitled Mary Ann Sivolella v. AXA Equitable Life Insurance Company and AXA Equitable Funds Management Group, LLC (“Sivolella Litigation”). The lawsuit was filed derivatively on behalf of eight portfolios of EQ Trust: EQ/Common Stock Index Portfolio; EQ/ Equity Growth PLUS Portfolio; EQ/Equity 500 Index Portfolio; EQ/Large Cap Value PLUS Portfolio; EQ/Global Multi-Sector Equity Portfolio; EQ/ Mid Cap Value PLUS Portfolio; EQ/Intermediate Government Bond Index Portfolio; and EQ/GAMCO Small Company Value Portfolio (the “Sivolella Portfolios”). The lawsuit seeks recovery under Section 36(b) of the 1940 Act, for alleged excessive fees paid to FMG LLC and AXA Equitable (the “Defendants”) for
140
investment management services. The Plaintiff seeks recovery of the alleged overpayments, or alternatively, rescission of the contracts and restitution of all fees paid, interest, costs and fees. In October 2011, FMG LLC and AXA Equitable filed a motion to dismiss the complaint. In November 2011, the Plaintiff filed an Amended Complaint seeking the same relief, but adding new claims under (1) Section 26(f) of the 1940 Act alleging that the variable annuity contracts sold by the Defendants charged excessive management fees, and seeking restitution and rescission of those contracts under Section 47(b) of the 1940 Act; and (2) a claim for unjust enrichment. The Defendants filed a motion to dismiss the Amended Complaint in December 2011. In May 2012, Plaintiff voluntarily dismissed the Section 26(f) claim seeking restitution and rescission under Section 47(b). In September 2012, the United States District Court for the District of New Jersey denied the motion to dismiss the Amended Complaint as it related to the Section 36(b) claim and granted the motion as it related to the unjust enrichment claim.
In January 2013, a second lawsuit against FMG LLC was filed in the United States District Court for the District of New Jersey by a group of Plaintiffs asserting substantially similar claims under Section 36(b) and seeking substantially similar damages as in the Sivolella Litigation. The lawsuit, entitled Glenn D. Sanford, et al. v. AXA Equitable Funds Management Group, LLC (“Sanford Litigation”), was filed derivatively on behalf of the EQ/PIMCO Ultra Short Bond Portfolio, the EQ/T. Rowe Price Growth Stock Portfolio, the EQ/Global Bond PLUS Portfolio, and the EQ/Core Bond Index Portfolio, in addition to four of the Sivolella Portfolios. In light of the similarities of the allegations in the Sivolella and Sanford Litigations, the court consolidated the two lawsuits.
In April 2013, the Plaintiffs in the Sivolella and Sanford Litigations amended the complaints to add additional claims under Section 36(b) of the 1940 Act for recovery of alleged excessive fees paid to FMG LLC in its capacity as the Administrator of EQ Trust. The Plaintiffs seek recovery of the alleged overpayments, or alternatively, rescission of the contract and restitution of the excessive fees paid, interest, costs, and fees.
On November 1, 2010, EQ Trust, and several of its portfolios, including the EQ/Large Cap Core PLUS Portfolio, were named as defendants and putative members of the proposed defendant class of shareholders in a lawsuit brought by The Official Committee of Unsecured Creditors of Tribune Company (the “Committee”) in the United States Bankruptcy Court for the District of Delaware regarding Tribune Company’s Chapter 11 bankruptcy proceeding (In re Tribune Company). The lawsuit relates to amounts paid to EQ Trust, and several of its portfolios, as holders of publicly-traded shares of Tribune Company, which were components of certain broad-based securities market indices, for which there were public tender offers during 2007. The suit seeks return of the share price received by Tribune Company shareholders in the tender offers plus interest and attorneys’ fees and expenses.
On July 1, 2011, retiree participants in certain Tribune-defined compensation plans (the “Retirees”) initiated a lawsuit in the United States District Court for the Southern District of New York against certain Tribune Company shareholders who
141
sold their shares as part of the 2007 public tender offers (the “Retiree Suit”). This Retiree Suit also seeks return of the share price received by Tribune Company shareholders in connection with the tender offers plus interest and attorneys’ fees and expenses.
On August 24, 2011, the trustees of certain trusts that hold notes issued by Tribune Company (the “Noteholder”) initiated a separate lawsuit in the United States District Court for the Southern District of New York against certain Tribune Company shareholders who sold their shares as part of the 2007 public tender offers (the “Noteholder Suit”). This Noteholder Suit also seeks return of the share price received by Tribune Company shareholders in connection with the tender offers plus interest and attorneys’ fees and expenses.
The Committee’s suit, the Retiree Suit, and the Noteholder Suit have each been consolidated with a number of related lawsuits into a single multidistrict litigation proceeding now pending in the United States District Court for the Southern District of New York (In re: Tribune Company Fraudulent Conveyance Litigation).
The Multimanager Large Cap Core Equity Portfolio and the Multimanager Large Cap Value Portfolio are named as defendants in the Noteholder Suit. The EQ/Equity 500 Index Portfolio, the EQ/GAMCO Mergers and Acquisitions Portfolio and the EQ/Mid Cap Value PLUS Portfolio are named as defendants in the Noteholder Suit and the Retiree Suit. The EQ/Equity 500 Index Portfolio, the EQ/GAMCO Mergers and Acquisitions Portfolio, the EQ/Mid Cap Value PLUS Portfolio, the EQ/Large Cap Core PLUS Portfolio, the EQ/Small Company Index II Portfolio, the EQ/Common Stock Index II Portfolio, the Multimanager Large Cap Core Equity Portfolio, the Multimanager Large Cap Value Portfolio and EQ Trust are all putative members of the proposed defendant class of shareholders in the Committee’s suit. The EQ/Equity 500 Index Portfolio, the EQ/GAMCO Mergers and Acquisition Portfolio, the EQ/Large Cap Core PLUS Portfolio, the Multimanager Large Cap Core Equity Portfolio, the Multimanager Large Cap Value Portfolio and EQ Trust are also named separately in the Committee’s suit, in the event it is not certified as a class action. The amounts paid to the above eight Portfolios in connection with the public tender offers were approximately: (i) the EQ/Equity 500 Index Portfolio — $1,740,800; (ii) the EQ/GAMCO Mergers and Acquisitions Portfolio — $1,122,000; (iii) the EQ/Mid Cap Value PLUS Portfolio — $2,992,000; (iv) the EQ/Large Cap Core PLUS Portfolio — $64,600; (v) the EQ/Small Company Index II Portfolio ��� $61,200; (vi) the EQ/Common Stock Index II Portfolio – $18,360; (vii) the Multimanager Large Cap Core Equity Portfolio — $1,768,000; and (viii) the Multimanager Large Cap Value Portfolio — $3,359,200. Pursuant to the Merger Plan, if its Reorganization is approved, each of the EQ/Large Cap Core PLUS Portfolio and the EQ/Large Cap Value PLUS Portfolio will assume the expenses liabilities, if any, of the Multimanager Large Cap Core Equity Portfolio and the Multimanager Large Cap Value Portfolio, respectively, in connection with the Noteholder Suit and Committee’s suit.
The lawsuits do not allege any misconduct by EQ Trust or its portfolios. In September 2013, the United States District Court for the Southern District of New
142
York dismissed the Noteholder Suit for lack of standing. An appeal to this decision filed by the Noteholders and a cross-appeal to this decision filed by the defendants are currently pending in the United States Court of Appeals for the Second Circuit. The portfolios cannot predict the outcome of these lawsuits. If the lawsuits were to be decided or settled in a manner adverse to the portfolios, the payment of such judgments or settlements could have an adverse effect on each portfolio’s net asset value.
Fund Distribution Arrangements
EQ Trust offers three classes of shares on behalf of each Acquiring Portfolio: Class IA, Class IB and Class K shares. AXA Distributors, LLC (“AXA Distributors”) serves as the distributor for the Class IA, Class IB and Class K shares of EQ Trust. Each class of shares is offered and redeemed at its net asset value without any sales load. AXA Distributors is an affiliate of FMG LLC. AXA Distributors is registered as a broker-dealer under the Securities Exchange Act of 1934, as amended, and is a member of the Financial Industry Regulatory Authority (“FINRA”).
EQ Trust has adopted a Distribution Plan pursuant to Rule 12b-1 under the 1940 Act for EQ Trust’s Class IA and Class IB shares. Under the Distribution Plan, the Class IA and Class IB shares of EQ Trust are charged an annual fee to compensate AXA Distributors for promoting, selling and servicing shares of the Portfolios. The maximum annual distribution and/or service (12b-1) fee for each Acquiring Portfolio’s Class IA and Class IB shares is 0.25% of the average daily net assets attributable to Class IA and Class IB shares. Because these fees are paid out of an Acquiring Portfolio’s assets on an on going basis, over time, the fees for Class IA and IB shares will increase your cost of investing and may cost you more than other types of charges.
The distributor may receive payments from certain Advisers of the Acquiring Portfolios or their affiliates to help defray expenses for sales meetings or seminar sponsorships that may relate to the Contracts and/or the Advisers’ respective Acquiring Portfolios. These sales meetings or seminar sponsorships may provide the Advisers with increased access to persons involved in the distribution of the Contracts. The distributor also may receive marketing support from the Advisers in connection with the distribution of the Contracts.
Payments to Broker-Dealers and Other Financial Intermediaries
The Acquiring Portfolios are not sold directly to the general public but instead are offered as underlying investment options for Contracts and retirement plans and to other eligible investors. The Acquiring Portfolios and their related companies may make payments to a sponsoring insurance company (or its affiliates) or other financial intermediary for distribution and/or other services. These payments may create a conflict of interest by influencing the insurance company or other financial intermediary
143
and your financial adviser to recommend the Portfolio over another investment or by influencing an insurance company to include the Portfolio as an underlying investment option in the Contract. The prospectus (or other offering document) for your Contract may contain additional information about these payments.
The Acquiring Portfolios’ shares are currently sold only to insurance company separate accounts in connection with Contracts issued by AXA Equitable, AXA Life and Annuity Company, and other affiliated or unaffiliated insurance companies and to The AXA Equitable 401(k) Plan. The Acquired Portfolio Shares also may be sold to other tax-qualified retirement plans, to other portfolios managed by FMG LLC that currently sell their shares to such accounts and plans and other investors eligible under applicable tax regulations. Class K shares of the Acquiring Portfolios are sold only to other portfolios of EQ Trust, portfolios of VIP Trust and certain group annuity and retirement plans.
The Acquiring Portfolios do not have minimum initial or subsequent investment requirements. Shares of the Acquiring Portfolios are redeemable on any business day upon receipt of a request. All redemption requests will be processed and payment with respect thereto will normally be made within seven days after tender. Please refer to your Contract prospectus for more information on purchasing and redeeming shares of the Acquiring Portfolios.
All shares are purchased and sold at their net asset value without any sales load. All redemption requests will be processed and payment with respect thereto will normally be made within seven days after tender. The Acquiring Portfolios reserve the right to suspend or change the terms of purchasing or selling shares.
EQ Trust may suspend the right of redemption for any period or postpone payment for more than seven days when the New York Stock Exchange is closed (other than a weekend or holiday) or when trading is restricted by the SEC or the SEC declares that an emergency exists. Redemptions may also be suspended and payments may be postponed for more than seven days during other periods permitted by the SEC. An Acquiring Portfolio may pay the redemption price in whole or part by a distribution in kind of readily marketable securities in lieu of cash or may take up to seven days to pay a redemption request in order to raise capital, when it is detrimental for a Portfolio to make cash payments as determined in the sole discretion of FMG LLC.
Frequent transfers or purchases and redemptions of Acquiring Portfolio shares, including market timing and other program trading or short-term trading strategies, may be disruptive to the Acquiring Portfolios. Excessive purchases and redemptions of shares of an Acquiring Portfolio may adversely affect that Acquiring Portfolio’s performance and the interests of long-term investors by requiring the Acquiring Portfolio to maintain larger amounts of cash or to liquidate portfolio holdings at a disadvantageous time or price. For example, when market timing occurs, an Acquiring Portfolio may have to sell its holdings to have the cash necessary to redeem the market timer’s shares. This can happen when it is not advantageous to sell any securities, so the
144
Acquiring Portfolio’s performance may be hurt. When large dollar amounts are involved, market timing can also make it difficult to use long-term investment strategies because an Acquiring Portfolio cannot predict how much cash it will have to invest. In addition, disruptive transfers or purchases and redemptions of Acquiring Portfolio shares may impede efficient portfolio management and impose increased transaction costs, such as brokerage costs, by requiring the portfolio manager to affect more frequent purchases and sales of portfolio securities. Similarly, an Acquiring Portfolio may bear increased administrative costs as a result of the asset level and investment volatility that accompanies patterns of excessive or short-term trading. Acquiring Portfolios (or Underlying ETFs in which an Acquiring Portfolio invests) that invest a significant portion of their assets in foreign securities, in securities of small- and mid-cap companies, or in high-yield securities tend to be subject to the risks associated with market timing and short-term trading strategies to a greater extent than funds that do not. Securities trading in overseas markets present time zone arbitrage opportunities when events affecting portfolio securities values occur after the close of the overseas market but prior to the close of the U.S. market. Securities of small- and mid-cap companies and high-yield securities also present arbitrage opportunities because the market for such securities may be less liquid than the market for the securities of larger companies and higher quality bonds which could result in pricing inefficiencies.
EQ Trust’s Board has adopted policies and procedures regarding disruptive transfer activity. EQ Trust and the Acquiring Portfolios discourage frequent purchases and redemptions of portfolio shares by Contractholders and will not make special arrangements to accommodate such transactions in Acquiring Portfolio shares. As a general matter, each Acquiring Portfolio and EQ Trust reserve the right to reject a transfer that they believe, in their sole discretion is disruptive (or potentially disruptive) to the management of the Acquiring Portfolio.
EQ Trust’s policies and procedures seek to discourage what it considers to be disruptive trading activity. EQ Trust seeks to apply its policies and procedures to all Contractholders uniformly, including omnibus accounts. It should be recognized, however, that such policies and procedures are subject to limitations:
| • | They do not eliminate the possibility that disruptive transfer activity, including market timing, will occur or that portfolio performance will be affected by such activity. |
| • | The design of such policies and procedures involves inherently subjective judgments, which FMG LLC and its affiliates, on behalf of EQ Trust, seek to make in a fair and reasonable manner consistent with the interests of all Contractholders. |
| • | The limits on the ability to monitor certain potentially disruptive transfer activity means that some Contractholders may be treated differently than others, resulting in the risk that some Contractholders may be able to engage in frequent transfer activity while others will bear the effect of that frequent transfer activity. |
145
If FMG LLC, on behalf of EQ Trust, determines that a Contractholder’s transfer patterns among EQ Trust’s portfolios are disruptive to EQ Trust’s portfolios, FMG LLC or an affiliate may, among other things, restrict the availability of personal telephone requests, facsimile transmissions, automated telephone services, internet services or any electronic transfer services. FMG LLC or an affiliate may also refuse to act on transfer instructions of an agent acting under a power of attorney who is acting on behalf of more than one owner. In making these determinations, FMG LLC or an affiliate may consider the combined transfer activity of Contracts that it believes are under common ownership, control or direction.
EQ Trust currently considers transfers into and out of (or vice versa) the same portfolio within a five-business day period as potentially disruptive transfer activity. In order to reduce disruptive activity, it monitors the frequency of transfers, including the size of transfers in relation to portfolio assets, in each portfolio. EQ Trust aggregates inflows and outflows for each portfolio on a daily basis. When a potentially disruptive transfer into or out of a portfolio occurs on a day when the portfolio’s net inflows and outflows exceed an established monitoring threshold, FMG LLC or an affiliate sends a letter to the Contractholder explaining that there is a policy against disruptive transfer activity and that if such activity continues, FMG LLC or an affiliate may take action to restrict the availability of voice, fax and automated transaction services. If such Contractholder is identified a second time as engaging in potentially disruptive transfer activity, FMG LLC or an affiliate currently will restrict the availability of voice, fax and automated transaction services. FMG LLC or an affiliate currently will apply such action for the remaining life of each affected Contract. Because FMG LLC or an affiliate exercises discretion in determining whether or not to take the actions discussed above, some Contractholders may be treated differently than others, resulting in the risk that some Contractholders may be able to engage in frequent transfer activity while others will bear the effect of the frequent transfer activity. Although Contractholders who have engaged in disruptive transfer activity currently receive letters notifying them of FMG LLC or an affiliate’s intention to restrict access to communication services, such letters may not continue to be provided in the future. Consistent with seeking to discourage potentially disruptive transfer activity, FMG LLC, or an affiliate thereof or EQ Trust also may in its sole discretion and without further notice, change what it considers potentially disruptive transfer activity and its monitoring procedures and thresholds, as well as change its procedures to restrict this activity. You should consult the Contract prospectus that accompanies this Proxy Statement/Prospectus for information on other specific limitations on the transfer privilege.
The above policies and procedures with respect to frequent transfers or purchases and redemptions of portfolio shares also apply to retirement plan participants. The above policies and procedures do not apply to transfers, purchases and redemptions of shares of Portfolios of EQ Trust by funds of funds managed by FMG LLC.
Notwithstanding our efforts, we may be unable to detect or deter market timing activity by certain persons, which can lead to disruption of management of, and excess costs to, a particular Acquiring Portfolio.
146
How Portfolio Shares Are Priced
“Net asset value” is the price of one share of a portfolio of EQ Trust, including an Acquiring Portfolio, without a sales charge, and is calculated each business day using the following formula:
| Net Asset Value | = | Total market value of securities | + | Cash and other assets | – | Liabilities | ||||||
| Number of outstanding shares | ||||||||||||
The net asset value of portfolio shares is determined according to this schedule:
| • | A share’s net asset value is determined as of the close of regular trading on the NYSE on the days it is open for trading. This is normally 4:00 p.m. Eastern time. |
| • | The price for purchasing or redeeming a share will be based upon the net asset value next calculated after an order is received and accepted by a portfolio or its designated agent. |
| • | A portfolio heavily invested in foreign securities may have net asset value changes on days when shares cannot be purchase or sold because foreign securities sometimes trade on days when a portfolio’s shares are not priced. |
Generally, portfolio securities are valued as follows:
| • | Equity securities (including securities issued by ETFs) — most recent sales price or official closing price or if there is no sale or official closing price, latest available bid price. |
| • | Debt securities — based upon pricing service valuations. |
| • | Convertible bonds and unlisted convertible preferred stocks — valued at prices obtained from a pricing service for such instruments or, if a pricing service price is not available, at bid prices obtained from one or more of the major dealers in such bonds or stocks. Where there is a discrepancy between dealers, values may be adjusted based on recent premium spreads to the underlying common stocks. Convertible bonds may be matrix-priced based upon the conversion value to the underlying common stocks and market premiums. |
| • | Securities traded on foreign exchanges — most recent sales or bid price on the foreign exchange or market, unless a significant event or circumstance occurs after the close of that market or exchange that will materially affect its value. In that case, fair value as determined by or under the direction of EQ Trust’s Board of Trustees at the close of regular trading on the NYSE. Foreign currency is converted into U.S. dollar equivalent daily at current exchange rates. |
| • | Options — for exchange traded options, last sales price or, if not available, previous day’s sales price. If the bid price is higher or the asked price is lower |
147
than the last sale price, the higher bid or lower asked price may be used. Options not traded on an exchange or actively traded are valued according to fair value methods. |
| • | Futures — last sales price or, if there is no sale, latest available bid price. |
| • | Investment Company Securities — shares of open-end mutual funds (other than ETFs) held by a portfolio will be valued at the net asset value of the shares of such funds as described in these funds’ prospectuses. |
Securities and assets for which market quotations are not readily available, for which valuation cannot be provided or for which events or circumstances occurring after the close of the relevant market or exchange materially affect their value are valued pursuant to the fair value procedures in good faith by or under the direction of the EQ Board. For example, a security whose trading has been halted during the trading day may be fair valued based on the available information at the time of the close of the trading market. Similarly, securities for which there is no ready market (e.g., securities of certain small capitalization issuers, high yield securities and securities of certain issuers located in emerging markets) also may be fair valued. Some methods for valuing these securities may include fundamental analysis (earnings multiple, etc.), matrix pricing, discounts from market prices of similar securities, or discounts applied due to the nature and duration of restrictions on the disposition of the securities.
Events or circumstances affecting the values of portfolio securities that occur between the closing of their principal markets and the time the NAV of portfolio shares is determined, such as foreign securities trading on foreign exchanges that close before the time the NAV is determined, may be reflected in EQ Trust’s calculations of NAVs for each applicable portfolio when EQ Trust deems that the particular event or circumstance would materially affect such portfolio’s NAV. Such events or circumstances may be company specific, such as an earning reports, country or region specific, such as a natural disaster, or global in nature. Such events or circumstances also may include price movements in the U.S. securities markets.
The effect of fair value pricing as described above is that securities may not be priced on the basis of quotations from the primary market in which they are traded, but rather may be priced by another method that EQ Trust’s Board believes will reflect fair value. As such, fair value pricing is based on subjective judgments and it is possible that fair value may differ materially from the value realized on a sale. This policy is intended to assure that each portfolio’s NAV fairly reflects security values as of the time of pricing. Also, fair valuation of a portfolio’s securities can serve to reduce arbitrage opportunities available to short-term traders, but there is no assurance that fair value pricing policies will prevent dilution of the portfolio’s NAV by those traders.
Each business day, the Acquiring Portfolios’ NAVs are transmitted electronically to insurance companies that use the Acquiring Portfolios as underlying investment options for Contracts.
148
Dividends and Other Distributions
The Acquiring Portfolios generally distribute most or all of their net investment income and their net realized gains, if any, annually. Dividends and other distributions by an Acquiring Portfolio are automatically reinvested at net asset value in shares of the distributing class of that Acquiring Portfolio.
Federal Income Tax Considerations
Each Acquiring Portfolio currently sells its shares only to insurance company separate accounts, qualified plans and other investors eligible under applicable tax regulations. Accordingly, distributions each Acquiring Portfolio makes of its net investment income and net realized gains — most or all of which it intends to distribute annually — and gains realized on redemptions or exchanges of the Acquiring Portfolios’ shares generally will not be taxable to its shareholders (or to the holders of underlying Contracts or plan participants or beneficiaries). See the prospectus for your Contract for further tax information.
Each Acquiring Portfolio is treated as a separate corporation, and intends to continue to qualify each taxable year to be treated as a “regulated investment company” (a “RIC”), for federal tax purposes. An Acquiring Portfolio will be so treated if it meets specified federal income tax rules, including requirements regarding types of investments, diversification limits on investments, types of income, and distributions. To comply with all these requirements may, from time to time, necessitate an Acquiring Portfolio’s disposition of one or more investments when it might not otherwise do so. A RIC that satisfies the federal tax requirements is not taxed at the entity (portfolio) level to the extent it passes through its net income and net realized gains to its shareholders by making distributions. Although EQ Trust intends that each Acquiring Portfolio will be operated to have no federal tax liability, if an Acquiring Portfolio does have any federal tax liability, that would hurt its investment performance. Also, to the extent that an Acquiring Portfolio invests in foreign securities or holds foreign currencies, it could be subject to foreign taxes that would reduce its investment performance.
It is important for each Acquiring Portfolio to maintain its RIC status (and to satisfy certain other requirements), because the shareholders of a Portfolio that are insurance company separate accounts will then be able to use a “look-through” rule in determining whether the Contracts indirectly funded by the Acquiring Portfolio meet the investment diversification rules for separate accounts. If an Acquiring Portfolio failed to meet those diversification rules, owners of non-pension plan Contracts funded through that Acquiring Portfolio would be taxed immediately on the accumulated investment earnings under their Contracts and would lose any benefit of tax deferral. FMG LLC, in its capacity as the Manager and the administrator of EQ Trust, therefore carefully monitors each Acquiring Portfolio’s compliance with all of the RIC rules and separate account investment diversification rules.
Contractholders seeking to more fully understand the tax consequences of their investment should consult with their tax advisers or the insurance company that issued their Contract or refer to their Contract prospectus.
149
The following financial highlights tables are intended to help you understand the financial performance of the EQ/Large Cap Core PLUS, EQ/Large Cap Value PLUS, and EQ/International Core PLUS Portfolios’ Class IA, Class IB, and Class K shares. The financial information in the tables is for the past five years (or, if shorter, the period of the Portfolio’s operations). The financial information below for the Class IA, Class IB, and Class K shares of the EQ/Large Cap Core PLUS, EQ/Large Cap Value PLUS, and EQ/International Core PLUS Portfolios has been derived from the financial statements of the EQ/Large Cap Core PLUS, EQ/Large Cap Value PLUS, and EQ/International Core PLUS Portfolios, which have been audited by PricewaterhouseCoopers LLP (“PwC”), an independent registered public accounting firm. PwC’s report on the EQ/Large Cap Core PLUS, EQ/Large Cap Value PLUS, and EQ/International Core PLUS Portfolios’ financial statements as of December 31, 2013 and the financial statements themselves appear in EQ Trust’s Statement of Additional Information relating to this Proxy Statement/Prospectus.
Certain information reflects financial results for a single share. The total returns in the tables represent the rate that a shareholder would have earned (or lost) on an investment in the EQ/Large Cap Core PLUS, EQ/Large Cap Value PLUS, and EQ/International Core PLUS Portfolios (assuming reinvestment of all dividends and other distributions). The total return figures shown below do not reflect any Separate Account or Contract fees and charges. The total return figures would be lower if they did reflect such fees and charges. The information should be read in conjunction with the financial statements that appear in EQ Trust’s Statement of Additional Information relating to this Proxy Statement/Prospectus.
Each of the New Multimanager Aggressive Equity, New Multimanager Technology, New Multimanager Core Bond, New Multimanager Mid Cap Growth, and New Multimanager Mid Cap Value Portfolios are newly organized and has no performance history or operations of its own as of the date of this Proxy Statement/Prospectus. After the Reorganizations, which are subject to shareholder approval, each of these Acquiring Portfolios, as the successor to the relevant corresponding Acquired Portfolio, will assume and publish the operating history and performance record of that Acquired Portfolio. In particular, the New Multimanager Aggressive Equity Portfolio will assume and publish the operating history and performance record of the Multimanager Aggressive Equity Portfolio. The New Multimanager Technology Portfolio will assume and publish the operating history and performance record of the Multimanager Technology Portfolio. The New Multimanager Core Bond Portfolio will assume and publish the operating history and performance record of the Multimanager Core Bond Portfolio. The New Multimanager Mid Cap Growth Portfolio will assume and publish the operating history and performance record of the Multimanager Mid Cap Growth Portfolio. The New Multimanager Mid Cap Value Portfolio will assume and publish the operating history and performance record of the Multimanager Mid Cap Value Portfolio. Financial information for each of these Acquired Portfolios is included in the current prospectus for that Portfolio, which is incorporated by reference into this Proxy Statement/Prospectus.
150
EQ/Large Cap Core PLUS Portfolio
| Year Ended December 31, | ||||||||||||||||||||
Class IA | 2013 | 2012 | 2011 | 2010 | 2009 | |||||||||||||||
Net asset value, beginning of year | $ | 6.92 | $ | 6.60 | $ | 7.22 | $ | 6.88 | $ | 5.66 | ||||||||||
|
|
|
|
|
|
|
|
|
| |||||||||||
Income (loss) from investment operations: | ||||||||||||||||||||
Net investment income (loss) | 0.06 | (e) | 0.08 | (e) | 0.08 | (e) | 0.08 | (e) | 0.09 | (e) | ||||||||||
Net realized and unrealized gain (loss) on investments, futures and foreign currency transactions | 2.12 | 0.90 | (0.38 | ) | 0.91 | 1.42 | ||||||||||||||
|
|
|
|
|
|
|
|
|
| |||||||||||
Total from investment operations | 2.18 | 0.98 | (0.30 | ) | 0.99 | 1.51 | ||||||||||||||
|
|
|
|
|
|
|
|
|
| |||||||||||
Less distributions: | ||||||||||||||||||||
Dividends from net investment income | (0.04 | ) | (0.08 | ) | (0.09 | ) | (0.09 | ) | (0.29 | ) | ||||||||||
Distributions from net realized gains | (0.35 | ) | (0.58 | ) | (0.23 | ) | (0.56 | ) | — | |||||||||||
|
|
|
|
|
|
|
|
|
| |||||||||||
Total dividends and distributions | (0.39 | ) | (0.66 | ) | (0.32 | ) | (0.65 | ) | (0.29 | ) | ||||||||||
|
|
|
|
|
|
|
|
|
| |||||||||||
Net asset value, end of year | $ | 8.71 | $ | 6.92 | $ | 6.60 | $ | 7.22 | $ | 6.88 | ||||||||||
|
|
|
|
|
|
|
|
|
| |||||||||||
Total return | 31.62 | % | 14.92 | % | (4.00 | )% | 14.56 | % | 26.84 | % | ||||||||||
|
|
|
|
|
|
|
|
|
| |||||||||||
Ratios/Supplemental Data: | ||||||||||||||||||||
Net assets, end of year (000’s) | $ | 1,161 | $ | 906 | $ | 789 | $ | 450,116 | $ | 423,167 | ||||||||||
Ratio of expenses to average net assets: | ||||||||||||||||||||
After waivers and reimbursements (f) | 0.93 | % | 0.96 | % | 0.69 | % | 0.70 | % | 0.70 | % | ||||||||||
After waivers, reimbursements and fees paid indirectly (f) | 0.93 | % | 0.96 | % | 0.69 | % | 0.70 | % | 0.68 | % | ||||||||||
Before waivers, reimbursements and fees paid indirectly (f) | 0.93 | % | 0.96 | % | 0.70 | % | 0.71 | % | 0.70 | % | ||||||||||
Ratio of net investment income (loss) to average net assets: | ||||||||||||||||||||
After waivers and reimbursements (f) | 0.76 | % | 1.08 | % | 1.10 | % | 1.19 | % | 1.60 | % | ||||||||||
After waivers, reimbursements and fees paid indirectly (f) | 0.76 | % | 1.09 | % | 1.11 | % | 1.19 | % | 1.62 | % | ||||||||||
Before waivers, reimbursements and fees paid indirectly (f) | 0.76 | % | 1.08 | % | 1.09 | % | 1.18 | % | 1.60 | % | ||||||||||
Portfolio turnover rate | 46 | % | 24 | % | 29 | % | 24 | % | 36 | % | ||||||||||
151
EQ/Large Cap Core PLUS Portfolio
| Year Ended December 31, | ||||||||||||||||||||
Class IB | 2013 | 2012 | 2011 | 2010 | 2009 | |||||||||||||||
Net asset value, beginning of year | $ | 6.92 | $ | 6.60 | $ | 7.22 | $ | 6.88 | $ | 5.66 | ||||||||||
|
|
|
|
|
|
|
|
|
| |||||||||||
Income (loss) from investment operations: | ||||||||||||||||||||
Net investment income (loss) | 0.06 | (e) | 0.08 | (e) | 0.08 | (e) | 0.07 | (e) | 0.09 | (e) | ||||||||||
Net realized and unrealized gain (loss) on investments, futures and foreign currency transactions | 2.12 | 0.90 | (0.39 | ) | 0.90 | 1.41 | ||||||||||||||
|
|
|
|
|
|
|
|
|
| |||||||||||
Total from investment operations | 2.18 | 0.98 | (0.31 | ) | 0.97 | 1.50 | ||||||||||||||
|
|
|
|
|
|
|
|
|
| |||||||||||
Less distributions: | ||||||||||||||||||||
Dividends from net investment income | (0.04 | ) | (0.08 | ) | (0.08 | ) | (0.07 | ) | (0.28 | ) | ||||||||||
Distributions from net realized gains | (0.35 | ) | (0.58 | ) | (0.23 | ) | (0.56 | ) | — | |||||||||||
|
|
|
|
|
|
|
|
|
| |||||||||||
Total dividends and distributions | (0.39 | ) | (0.66 | ) | (0.31 | ) | (0.63 | ) | (0.28 | ) | ||||||||||
|
|
|
|
|
|
|
|
|
| |||||||||||
Net asset value, end of year | $ | 8.71 | $ | 6.92 | $ | 6.60 | $ | 7.22 | $ | 6.88 | ||||||||||
|
|
|
|
|
|
|
|
|
| |||||||||||
Total return | 31.61 | % | 14.92 | % | (4.24 | )% | 14.27 | % | 26.50 | % | ||||||||||
|
|
|
|
|
|
|
|
|
| |||||||||||
Ratios/Supplemental Data: | ||||||||||||||||||||
Net assets, end of year (000’s) | $ | 1,953,737 | $ | 168,607 | $ | 161,281 | $ | 190,389 | $ | 183,149 | ||||||||||
Ratio of expenses to average net assets: | ||||||||||||||||||||
After waivers and reimbursements (f) | 0.93 | % | 0.96 | % | 0.94 | %(c) | 0.95 | % | 0.95 | %(c) | ||||||||||
After waivers, reimbursements and fees paid indirectly (f) | 0.93 | % | 0.96 | % | 0.94 | % | 0.95 | % | 0.93 | %(c) | ||||||||||
Before waivers, reimbursements and fees paid indirectly (f) | 0.93 | % | 0.96 | % | 0.95 | %(c) | 0.96 | % | 0.95 | %(c) | ||||||||||
Ratio of net investment income (loss) to average net assets: | ||||||||||||||||||||
After waivers and reimbursements (f) | 0.72 | % | 1.08 | % | 1.04 | % | 0.94 | % | 1.40 | % | ||||||||||
After waivers, reimbursements and fees paid indirectly (f) | 0.72 | % | 1.08 | % | 1.05 | % | 0.94 | % | 1.43 | % | ||||||||||
Before waivers, reimbursements and fees paid indirectly (f) | 0.72 | % | 1.08 | % | 1.04 | % | 0.93 | % | 1.40 | % | ||||||||||
Portfolio turnover rate | 46 | % | 24 | % | 29 | % | 24 | % | 36 | % | ||||||||||
152
EQ/Large Cap Core PLUS Portfolio
| Year Ended December 31, | August 26, 2011* to December 31, 2011 | |||||||||||
Class K | 2013 | 2012 | ||||||||||
Net asset value, beginning of period | $ | 6.92 | $ | 6.60 | $ | 6.49 | ||||||
|
|
|
|
|
| |||||||
Income (loss) from investment operations: | ||||||||||||
Net investment income (loss) | 0.08 | (e) | 0.10 | (e) | 0.04 | (e) | ||||||
Net realized and unrealized gain (loss) on investments, futures and foreign currency transactions | 2.12 | 0.90 | 0.26 | |||||||||
|
|
|
|
|
| |||||||
Total from investment operations | 2.20 | 1.00 | 0.30 | |||||||||
|
|
|
|
|
| |||||||
Less distributions: | ||||||||||||
Dividends from net investment income | (0.06 | ) | (0.10 | ) | (0.09 | ) | ||||||
Distributions from net realized gains | (0.35 | ) | (0.58 | ) | (0.10 | ) | ||||||
|
|
|
|
|
| |||||||
Total dividends and distributions | (0.41 | ) | (0.68 | ) | (0.19 | ) | ||||||
|
|
|
|
|
| |||||||
Net asset value, end of period | $ | 8.71 | $ | 6.92 | $ | 6.60 | ||||||
|
|
|
|
|
| |||||||
Total return (b) | 31.95 | % | 15.21 | % | 4.82 | % | ||||||
|
|
|
|
|
| |||||||
Ratios/Supplemental Data: | ||||||||||||
Net assets, end of period (000’s) | $ | 456,889 | $ | 391,301 | $ | 395,001 | ||||||
Ratio of expenses to average net assets: | ||||||||||||
After waivers and reimbursements (a)(f) | 0.68 | % | 0.71 | % | 0.71 | % | ||||||
After waivers, reimbursements and fees paid | 0.68 | % | 0.71 | % | 0.70 | % | ||||||
Before waivers, reimbursements and fees paid | 0.68 | % | 0.71 | % | 0.71 | % | ||||||
Ratio of net investment income (loss) to average net assets: | ||||||||||||
After waivers and reimbursements (a)(f) | 1.01 | % | 1.33 | % | 1.73 | % | ||||||
After waivers, reimbursements and fees paid | 1.01 | % | 1.33 | % | 1.73 | % | ||||||
Before waivers, reimbursements and fees paid | 1.01 | % | 1.33 | % | 1.73 | % | ||||||
Portfolio turnover rate | 46 | % | 24 | % | 29 | % | ||||||
| * | Commencement of Operations. |
| (a) | Ratios for periods less than one year are annualized. |
| (b) | Total returns for periods less than one year are not annualized. |
| (c) | Reflects overall fund ratios for non-class specific expenses. |
| (e) | Net investment income (loss) per share is based on average shares outstanding. |
| (f) | Expenses do not include the expenses of the underlying funds (“indirect expenses”). |
153
EQ/Large Cap Value PLUS Portfolio
| Year Ended December 31, | ||||||||||||||||||||
Class IA | 2013 | 2012 | 2011 | 2010 | 2009 | |||||||||||||||
Net asset value, beginning of year | $ | 10.89 | $ | 9.55 | $ | 10.19 | $ | 9.15 | $ | 7.75 | ||||||||||
|
|
|
|
|
|
|
|
|
| |||||||||||
Income (loss) from investment operations: | ||||||||||||||||||||
Net investment income (loss) | 0.17 | (e) | 0.16 | (e) | 0.13 | (e) | 0.13 | (e) | 0.19 | (e) | ||||||||||
Net realized and unrealized gain (loss) on investments, futures and foreign currency transactions | 3.37 | 1.35 | (0.63 | ) | 1.05 | 1.41 | ||||||||||||||
|
|
|
|
|
|
|
|
|
| |||||||||||
Total from investment operations | 3.54 | 1.51 | (0.50 | ) | 1.18 | 1.60 | ||||||||||||||
|
|
|
|
|
|
|
|
|
| |||||||||||
Less distributions: | ||||||||||||||||||||
Dividends from net investment income | (0.14 | ) | (0.17 | ) | (0.14 | ) | (0.14 | ) | (0.20 | ) | ||||||||||
|
|
|
|
|
|
|
|
|
| |||||||||||
Net asset value, end of year | $ | 14.29 | $ | 10.89 | $ | 9.55 | $ | 10.19 | $ | 9.15 | ||||||||||
|
|
|
|
|
|
|
|
|
| |||||||||||
Total return | 32.54 | % | 15.83 | % | (4.84 | )% | 12.89 | % | 20.73 | % | ||||||||||
|
|
|
|
|
|
|
|
|
| |||||||||||
Ratios/Supplemental Data: | ||||||||||||||||||||
Net assets, end of year (000’s) | $ | 1,068,537 | $ | 891,848 | $ | 872,363 | $ | 2,027,488 | $ | 2,305,328 | ||||||||||
Ratio of expenses to average net assets: | ||||||||||||||||||||
After waivers (f) | 0.89 | % | 0.91 | % | 0.65 | % | 0.66 | % | 0.70 | % | ||||||||||
After waivers and fees paid indirectly (f) | 0.88 | % | 0.91 | % | 0.64 | % | 0.66 | % | 0.69 | % | ||||||||||
Before waivers and fees paid indirectly (f) | 0.89 | % | 0.91 | % | 0.65 | % | 0.66 | % | 0.70 | % | ||||||||||
Ratio of net investment income (loss) to average net assets: | ||||||||||||||||||||
After waivers (f) | 1.31 | % | 1.52 | % | 1.26 | % | 1.33 | % | 2.35 | % | ||||||||||
After waivers and fees paid indirectly (f) | 1.32 | % | 1.52 | % | 1.27 | % | 1.34 | % | 2.36 | % | ||||||||||
Before waivers and fees paid indirectly (f) | 1.31 | % | 1.52 | % | 1.26 | % | 1.33 | % | 2.35 | % | ||||||||||
Portfolio turnover rate | 37 | % | 25 | % | 33 | % | 38 | % | 52 | % | ||||||||||
154
EQ/Large Cap Value PLUS Portfolio
| Year Ended December 31, | ||||||||||||||||||||
Class IB | 2013 | 2012 | 2011 | 2010 | 2009 | |||||||||||||||
Net asset value, beginning of year | $ | 10.87 | $ | 9.53 | $ | 10.17 | $ | 9.12 | $ | 7.73 | ||||||||||
|
|
|
|
|
|
|
|
|
| |||||||||||
Income (loss) from investment operations: | ||||||||||||||||||||
Net investment income (loss) | 0.18 | (e) | 0.16 | (e) | 0.11 | (e) | 0.10 | (e) | 0.17 | (e) | ||||||||||
Net realized and unrealized gain (loss) on investments, futures and foreign currency transactions | 3.35 | 1.35 | (0.63 | ) | 1.06 | 1.40 | ||||||||||||||
|
|
|
|
|
|
|
|
|
| |||||||||||
Total from investment operations | 3.53 | 1.51 | (0.52 | ) | 1.16 | 1.57 | ||||||||||||||
|
|
|
|
|
|
|
|
|
| |||||||||||
Less distributions: | ||||||||||||||||||||
Dividends from net investment income | (0.14 | ) | (0.17 | ) | (0.12 | ) | (0.11 | ) | (0.18 | ) | ||||||||||
|
|
|
|
|
|
|
|
|
| |||||||||||
Net asset value, end of year | $ | 14.26 | $ | 10.87 | $ | 9.53 | $ | 10.17 | $ | 9.12 | ||||||||||
|
|
|
|
|
|
|
|
|
| |||||||||||
Total return | 32.50 | % | 15.86 | % | (5.09 | )% | 12.76 | % | 20.34 | % | ||||||||||
|
|
|
|
|
|
|
|
|
| |||||||||||
Ratios/Supplemental Data: | ||||||||||||||||||||
Net assets, end of year (000’s) | $ | 3,852,949 | $ | 1,340,073 | $ | 1,328,547 | $ | 1,605,171 | $ | 1,634,368 | ||||||||||
Ratio of expenses to average net assets: | ||||||||||||||||||||
After waivers (f) | 0.89 | % | 0.91 | % | 0.90 | % | 0.91 | % | 0.95 | % | ||||||||||
After waivers and fees paid indirectly (f) | 0.88 | % | 0.91 | % | 0.89 | % | 0.91 | % | 0.94 | % | ||||||||||
Before waivers and fees paid indirectly (f) | 0.89 | % | 0.91 | % | 0.90 | % | 0.91 | % | 0.95 | % | ||||||||||
Ratio of net investment income (loss) to average net assets: | ||||||||||||||||||||
After waivers (f) | 1.35 | % | 1.52 | % | 1.09 | % | 1.09 | % | 2.22 | % | ||||||||||
After waivers and fees paid indirectly (f) | 1.35 | % | 1.52 | % | 1.10 | % | 1.09 | % | 2.23 | % | ||||||||||
Before waivers and fees paid indirectly (f) | 1.35 | % | 1.52 | % | 1.09 | % | 1.09 | % | 2.22 | % | ||||||||||
Portfolio turnover rate | 37 | % | 25 | % | 33 | % | 38 | % | 52 | % | ||||||||||
155
EQ/Large Cap Value PLUS Portfolio
| Year Ended December 31, | August 26, 2011* to December 31, 2011 | |||||||||||
Class K | 2013 | 2012 | ||||||||||
Net asset value, beginning of period | $ | 10.89 | $ | 9.55 | $ | 9.24 | ||||||
|
|
|
|
|
| |||||||
Income (loss) from investment operations: | ||||||||||||
Net investment income (loss) | 0.20 | (e) | 0.18 | (e) | 0.06 | (e) | ||||||
Net realized and unrealized gain (loss) on investments, futures and foreign currency transactions | 3.38 | 1.36 | 0.39 | |||||||||
|
|
|
|
|
| |||||||
Total from investment operations | 3.58 | 1.54 | 0.45 | |||||||||
|
|
|
|
|
| |||||||
Less distributions: | ||||||||||||
Dividends from net investment income | (0.18 | ) | (0.20 | ) | (0.14 | ) | ||||||
|
|
|
|
|
| |||||||
Net asset value, end of period | $ | 14.29 | $ | 10.89 | $ | 9.55 | ||||||
|
|
|
|
|
| |||||||
Total return (b) | 32.87 | % | 16.13 | % | 4.95 | % | ||||||
|
|
|
|
|
| |||||||
Ratios/Supplemental Data: | ||||||||||||
Net assets, end of period (000’s) | $ | 597,851 | $ | 677,124 | $ | 776,313 | ||||||
Ratio of expenses to average net assets: | ||||||||||||
After waivers (a)(f) | 0.64 | % | 0.66 | % | 0.65 | % | ||||||
After waivers and fees paid indirectly (a)(f) | 0.63 | % | 0.66 | % | 0.65 | % | ||||||
Before waivers and fees paid indirectly (a)(f) | 0.64 | % | 0.66 | % | 0.65 | % | ||||||
Ratio of net investment income (loss) to average net assets: | ||||||||||||
After waivers (a)(f) | 1.56 | % | 1.76 | % | 1.79 | % | ||||||
After waivers and fees paid indirectly (a)(f) | 1.57 | % | 1.76 | % | 1.79 | % | ||||||
Before waivers and fees paid indirectly (a)(f) | 1.56 | % | 1.76 | % | 1.79 | % | ||||||
Portfolio turnover rate | 37 | % | 25 | % | 33 | % | ||||||
| * | Commencement of Operations. |
| (a) | Ratios for periods less than one year are annualized. |
| (b) | Total returns for periods less than one year are not annualized. |
| (e) | Net investment income (loss) per share is based on average shares outstanding. |
| (f) | Expenses do not include the expenses of the underlying funds (“indirect expenses”). |
156
EQ/International Core PLUS Portfolio
| Year Ended December 31, | ||||||||||||||||||||
Class IA | 2013 | 2012 | 2011 | 2010 | 2009 | |||||||||||||||
Net asset value, beginning of year | $ | 8.85 | $ | 7.72 | $ | 9.61 | $ | 8.95 | $ | 6.80 | ||||||||||
|
|
|
|
|
|
|
|
|
| |||||||||||
Income (loss) from investment operations: | ||||||||||||||||||||
Net investment income (loss) | 0.09 | (e) | 0.11 | (e) | 0.13 | (e) | 0.11 | (e) | 0.15 | (e) | ||||||||||
Net realized and unrealized gain (loss) on investments, futures and foreign currency transactions | 1.45 | 1.15 | (1.74 | ) | 0.74 | 2.26 | ||||||||||||||
|
|
|
|
|
|
|
|
|
| |||||||||||
Total from investment operations | 1.54 | 1.26 | (1.61 | ) | 0.85 | 2.41 | ||||||||||||||
|
|
|
|
|
|
|
|
|
| |||||||||||
Less distributions: | ||||||||||||||||||||
Dividends from net investment income | (0.08 | ) | (0.13 | ) | (0.28 | ) | (0.19 | ) | (0.26 | ) | ||||||||||
|
|
|
|
|
|
|
|
|
| |||||||||||
Net asset value, end of year | $ | 10.31 | $ | 8.85 | $ | 7.72 | $ | 9.61 | $ | 8.95 | ||||||||||
|
|
|
|
|
|
|
|
|
| |||||||||||
Total return | 17.49 | % | 16.29 | % | (16.73 | )% | 9.52 | % | 35.55 | % | ||||||||||
|
|
|
|
|
|
|
|
|
| |||||||||||
Ratios/Supplemental Data: | ||||||||||||||||||||
Net assets, end of year (000’s) | $ | 11,118 | $ | 10,531 | $ | 8,903 | $ | 445,820 | $ | 404,122 | ||||||||||
Ratio of expenses to average net assets: | ||||||||||||||||||||
After waivers and reimbursements (f) | 1.05 | % | 1.05 | % | 0.78 | % | 0.85 | % | 0.85 | % | ||||||||||
After waivers, reimbursements and fees paid indirectly (f) | 1.05 | % | 1.05 | % | 0.78 | % | 0.85 | % | 0.84 | % | ||||||||||
Before waivers, reimbursements and fees paid indirectly (f) | 1.05 | % | 1.05 | % | 0.78 | % | 0.85 | % | 0.85 | % | ||||||||||
Ratio of net investment income (loss) to average net assets: | ||||||||||||||||||||
After waivers and reimbursements (f) | 0.97 | % | 1.33 | % | 1.29 | % | 1.30 | % | 2.11 | % | ||||||||||
After waivers, reimbursements and fees paid indirectly (f) | 0.97 | % | 1.33 | % | 1.30 | % | 1.30 | % | 2.12 | % | ||||||||||
Before waivers, reimbursements and fees paid indirectly (f) | 0.97 | % | 1.33 | % | 1.29 | % | 1.30 | % | 2.11 | % | ||||||||||
Portfolio turnover rate | 15 | % | 3 | % | 3 | % | 12 | % | 17 | % | ||||||||||
157
EQ/International Core PLUS Portfolio
| Year Ended December 31, | ||||||||||||||||||||
Class IB | 2013 | 2012 | 2011 | 2010 | 2009 | |||||||||||||||
Net asset value, beginning of year | $ | 8.86 | $ | 7.73 | $ | 9.62 | $ | 8.96 | $ | 6.80 | ||||||||||
|
|
|
|
|
|
|
|
|
| |||||||||||
Income (loss) from investment operations: | ||||||||||||||||||||
Net investment income (loss) | 0.08 | (e) | 0.11 | (e) | 0.12 | (e) | 0.09 | (e) | 0.13 | (e) | ||||||||||
Net realized and unrealized gain (loss) on investments, futures and foreign currency transactions | 1.46 | 1.15 | (1.75 | ) | 0.73 | 2.27 | ||||||||||||||
|
|
|
|
|
|
|
|
|
| |||||||||||
Total from investment operations | 1.54 | 1.26 | (1.63 | ) | 0.82 | 2.40 | ||||||||||||||
|
|
|
|
|
|
|
|
|
| |||||||||||
Less distributions: | ||||||||||||||||||||
Dividends from net investment income | (0.08 | ) | (0.13 | ) | (0.26 | ) | (0.16 | ) | (0.24 | ) | ||||||||||
|
|
|
|
|
|
|
|
|
| |||||||||||
Net asset value, end of year | $ | 10.32 | $ | 8.86 | $ | 7.73 | $ | 9.62 | $ | 8.96 | ||||||||||
|
|
|
|
|
|
|
|
|
| |||||||||||
Total return | 17.47 | % | 16.27 | % | (16.92 | )% | 9.23 | % | 35.34 | % | ||||||||||
|
|
|
|
|
|
|
|
|
| |||||||||||
Ratios/Supplemental Data: | ||||||||||||||||||||
Net assets, end of year (000’s) | $ | 1,566,557 | $ | 800,489 | $ | 766,952 | $ | 984,130 | $ | 943,631 | ||||||||||
Ratio of expenses to average net assets: | ||||||||||||||||||||
After waivers and reimbursements (f) | 1.05 | % | 1.05 | % | 1.03 | % | 1.10 | % | 1.10 | % | ||||||||||
After waivers, reimbursements and fees paid indirectly (f) | 1.05 | % | 1.05 | % | 1.03 | % | 1.10 | % | 1.10 | % | ||||||||||
Before waivers, reimbursements and fees paid indirectly (f) | 1.05 | % | 1.05 | % | 1.03 | % | 1.10 | % | 1.10 | % | ||||||||||
Ratio of net investment income (loss) to average net assets: | ||||||||||||||||||||
After waivers and reimbursements (f) | 0.84 | % | 1.34 | % | 1.25 | % | 1.00 | % | 1.63 | % | ||||||||||
After waivers, reimbursements and fees paid indirectly (f) | 0.85 | % | 1.34 | % | 1.25 | % | 1.01 | % | 1.64 | % | ||||||||||
Before waivers, reimbursements and fees paid indirectly (f) | 0.84 | % | 1.34 | % | 1.25 | % | 1.00 | % | 1.63 | % | ||||||||||
Portfolio turnover rate | 15 | % | 3 | % | 3 | % | 12 | % | 17 | % | ||||||||||
158
EQ/International Core PLUS Portfolio
| Year Ended December 31, | August 26, 2011* to December 31, 2011 | |||||||||||
Class K | 2013 | 2012 | ||||||||||
Net asset value, beginning of period | $ | 8.85 | $ | 7.72 | $ | 8.45 | ||||||
|
|
|
|
|
| |||||||
Income (loss) from investment operations: | ||||||||||||
Net investment income (loss) | 0.12 | (e) | 0.13 | (e) | 0.06 | (e) | ||||||
Net realized and unrealized gain (loss) on investments, futures and foreign currency transactions | 1.45 | 1.15 | (0.55 | ) | ||||||||
|
|
|
|
|
| |||||||
Total from investment operations | 1.57 | 1.28 | (0.49 | ) | ||||||||
|
|
|
|
|
| |||||||
Less distributions: | ||||||||||||
Dividends from net investment income | (0.11 | ) | (0.15 | ) | (0.24 | ) | ||||||
|
|
|
|
|
| |||||||
Net asset value, end of period | $ | 10.31 | $ | 8.85 | $ | 7.72 | ||||||
|
|
|
|
|
| |||||||
Total return (b) | 17.78 | % | 16.59 | % | (5.70 | )% | ||||||
|
|
|
|
|
| |||||||
Ratios/Supplemental Data: | ||||||||||||
Net assets, end of period (000’s) | $ | 393,771 | $ | 376,185 | $ | 335,852 | ||||||
Ratio of expenses to average net assets: | ||||||||||||
After waivers and reimbursements (a)(f) | 0.80 | % | 0.80 | % | 0.78 | % | ||||||
After waivers, reimbursements and fees paid | 0.80 | % | 0.80 | % | 0.77 | % | ||||||
Before waivers, reimbursements and fees paid | 0.80 | % | 0.80 | % | 0.78 | % | ||||||
Ratio of net investment income (loss) to average net assets: | ||||||||||||
After waivers and reimbursements (a)(f) | 1.22 | % | 1.60 | % | 2.10 | % | ||||||
After waivers, reimbursements and fees paid | 1.22 | % | 1.60 | % | 2.10 | % | ||||||
Before waivers, reimbursements and fees paid | 1.22 | % | 1.60 | % | 2.10 | % | ||||||
Portfolio turnover rate | 15 | % | 3 | % | 3 | % | ||||||
| * | Commencement of Operations. |
| (a) | Ratios for periods less than one year are annualized. |
| (b) | Total returns for periods less than one year are not annualized. |
| (e) | Net investment income (loss) per share is based on average shares outstanding. |
| (f) | Expenses do not include the expenses of the underlying funds (“indirect expenses”). |
159
The following information applies to the Reorganization of each Acquired Portfolio for which you are entitled to vote.
Shareholders with amounts invested in shares of the Acquired Portfolios at the close of business on February 28, 2014 (the “Record Date”) will be entitled to be present and vote or provide voting instructions for the applicable Acquired Portfolio at the Meeting with respect to their shares or shares attributable to their Contracts as of the Record Date.
Each whole share of an Acquired Portfolio is entitled to one vote as to each matter with respect to which it is entitled to vote, as described above, and each fractional share is entitled to a proportionate fractional vote. Votes cast by proxy or in person by a shareholder at the Meeting will be counted by persons appointed as inspectors of election for the Meeting. The table below shows the number of outstanding shares of the Acquired Portfolios as of the Record Date that are entitled to vote at the Meeting. Together, the Insurance Companies owned of record more than 95% of those shares.
Acquired Portfolio | Total Number | Number of Class A | Number of Class B | Number of Class K | ||||
Multimanager Aggressive Equity Portfolio | ||||||||
Multimanager Technology Portfolio | ||||||||
Multimanager Core Bond Portfolio | ||||||||
Multimanager Mid Cap Growth Portfolio | ||||||||
Multimanager Mid Cap Value Portfolio | ||||||||
Multimanager Large Cap Core Equity Portfolio | ||||||||
Multimanager Large Cap Value Portfolio | ||||||||
Multimanager International Equity Portfolio |
All properly executed and unrevoked proxies received in time for the Meeting will be voted as instructed by shareholders. If a shareholder executes a proxy but gives no voting instructions, that shareholder’s shares that are represented by proxy will be voted “FOR” each Proposal and “FOR” or “AGAINST” any other business which
160
may properly arise at the Meeting, in the proxies’ discretion. Any person giving a proxy has the power to revoke it at any time prior to its exercise by executing a superseding proxy or by submitting a written notice of revocation to VIP Trust. To be effective, such revocation must be received by VIP Trust prior to the Meeting. In addition, although mere attendance at the Meeting will not revoke a proxy, a shareholder present at the Meeting may withdraw his or her proxy by voting in person. If a shareholder abstains from voting as to any matter, the shares represented by the abstention or broker “non-vote” will be deemed present at the Meeting for purposes of determining a quorum but will not be voted and, therefore, will have the effect of a vote against the Proposals.
Contractholders with amounts allocated to an Acquired Portfolio on the Record Date will be entitled to be present and provide voting instructions for the Acquired Portfolio at the Meeting with respect to shares held indirectly as of the Record Date, to the extent required by applicable law. Voting instructions may be solicited, and such instructions may be provided, in the same manner as proxies as described herein. An Insurance Company will vote the shares for which it receives timely voting instructions from Contractholders in accordance with those instructions. Shares in each investment division of a Separate Account that is invested in an Acquired Portfolio for which an Insurance Company receives a voting instruction card that is signed and timely returned but is not marked to indicate voting instructions will be treated as an instruction to vote the shares “FOR” the applicable Proposal, and the Insurance Company may vote in its discretion with respect to other matters not now known that may be presented at the Meeting. An Insurance Company will vote in its discretion on any proposal to adjourn or postpone the Meeting. Shares in each investment division of a Separate Account for which an Insurance Company receives no timely voting instructions from Contractholders, or which are attributable to amounts retained by an Insurance Company as surplus or seed money, will be voted by the applicable Insurance Company “FOR” or “AGAINST” approval of the applicable Proposal, or as an abstention, in the same proportion as the shares for which Contractholders have provided voting instructions to the Insurance Company. As a result of such proportional voting by the Insurance Companies, it is possible that a small number of Contractholders could determine whether the Proposals are approved.
Voting instructions executed by a Contractholder may be revoked at any time prior to an Insurance Company voting the shares represented thereby by the Contractholder providing the Insurance Company with a properly executed written revocation of such voting instructions, or by the Contractholder providing the Insurance Company with proper later-dated voting instructions by voting instruction card, telephone or the Internet. In addition, any Contractholder who attends the Meeting in person may provide voting instructions by a voting instruction card at the Meeting, thereby canceling any voting instruction previously given. Proxies executed by an Insurance Company may be revoked at any time before they are exercised by a written revocation duly received, by properly executing a later-dated proxy or by an Insurance Company representative attending the Meeting and voting in person.
161
Approval of a Reorganization Plan involving an Acquired Portfolio will require the affirmative vote of (i) 67% or more of the voting securities of the Portfolio present at the Meeting, if the holders of more than 50% of its outstanding voting securities are present or represented by proxy, or (ii) more than 50% of its outstanding voting securities, whichever is less. “Voting securities” refers to the shares of an Acquired Portfolio.
The presence, in person or by proxy, of at least one-third of the shares of an Acquired Portfolio entitled to vote at the Meeting will constitute a quorum for the transaction of business at the Meeting with respect to that Acquired Portfolio.
To the knowledge of VIP Trust and EQ Trust, as of the Record Date, the officers and Trustees of VIP Trust and EQ Trust owned, as a group, less than 1% of the shares of each Portfolio.
Each Insurance Company may be deemed to be a control person of each Portfolio by virtue of its direct or indirect ownership of more than 25% of the shares of each Portfolio. In addition, AXA Equitable may be deemed to be a control person of VIP Trust by virtue of its direct or indirect ownership of more than 95% of VIP Trust’s shares. Shareholders owning more than 25% of the outstanding shares of an Acquired Portfolio may be able to determine the outcome of most issues that are submitted to shareholders for a vote. As of the Record Date, except as set forth in Appendix D, to VIP Trust’s knowledge, (1) no person, other than AXA Equitable, owned beneficially or of record 5% or more of the outstanding Class A, Class B, or Class K shares of an Acquired Portfolio and (2) no Contractholder owned Contracts entitling such Contractholder to provide voting instructions regarding 5% or more of the outstanding Class A, Class B, or Class K shares of an Acquired Portfolio.
Solicitation of Proxies and Voting Instructions
Solicitation of proxies and voting instructions is being made by VIP Trust primarily by the mailing of this Notice and Proxy Statement/Prospectus with its enclosures on or about , 2014. The principal solicitation will be by mail, but proxies and voting instructions also may be solicited by telephone, fax, personal interview by directors, officers, employees or agents of FMG LLC or its affiliates or VIP Trust or its affiliates, without additional compensation, through the Internet, or other permissible means. Shareholders can vote proxies: (1) by Internet at our website at www.proxyvote.com; (2) by telephone at 1-800-690-6903; or (3) by mail, with the enclosed proxy card. Contractholders can provide voting instructions: (1) by Internet at our website at www.proxyvote.com; (2) by telephone at 1-800-690-6903; or (3) by mail, with the enclosed voting instruction card. In lieu of executing a proxy card or voting instruction card, you may attend the Meeting in person.
With respect to the Reorganizations of the Multimanager Aggressive Equity, Multimanager Technology, Multimanager Core Bond, Multimanager Mid Cap Growth, and Multimanager Mid Cap Value Portfolios, the proportionate share of the
162
cost of the Meeting, including the cost of solicitation of proxies and voting instructions, will be borne by the New Multimanager Aggressive Equity, New Multimanager Technology, New Multimanager Core Bond, New Multimanager Mid Cap Growth, and New Multimanager Mid Cap Value Portfolios up to an aggregate maximum of $150,000, with FMG LLC bearing any such expenses in excess of this amount. The Multimanager Large Cap Core Equity, Multimanager Large Cap Value, and Multimanager International Equity Portfolios will bear their proportionate share of the cost of the Meeting, including the cost of solicitation of proxies and voting instructions, subject to an aggregate maximum of $325,000 for these Portfolios, with FMG LLC bearing any such expenses in excess of this amount.
If a quorum is not established at the Meeting or if sufficient votes in favor of a proposal are not received by the time scheduled for the Meeting, the persons named as proxies may propose one or more adjournments or postponements of the Meeting to permit further solicitation of proxies. Any adjournment or postponement of the Meeting will require the affirmative vote of a majority of the shares represented in person or by proxy at the session of the Meeting to be adjourned. The persons named as proxies will vote in their discretion on any such adjournment or postponement.
VIP Trust does not know of any matters to be presented at the Meeting other than those described in this Proxy Statement/Prospectus. If other business properly comes before the Meeting, the proxyholders will vote thereon in accordance with their best judgment.
VIP Trust is not required to hold regular shareholder meetings and, in order to minimize its costs, does not intend to hold meetings of shareholders unless so required by applicable law, regulation or regulatory policy or if otherwise deemed advisable by VIP Trust’s management. Therefore, it is not practicable to specify a date by which proposals must be received in order to be incorporated in an upcoming proxy statement for a meeting of shareholders. Shareholders will be given notice of any meeting of shareholders not less than ten days, and not more than ninety days, before the date of the meeting.
Prompt execution and return of the enclosed voting instruction card is requested. A self-addressed, postage-paid envelope is enclosed for your convenience. If executed but unmarked voting instructions are received, an Insurance Company will vote those unmarked voting instructions in favor of the Proposal.
* * * * *
163
Copies of VIP Trust’s most recent annual and semi-annual reports, including financial statements, previously have been delivered to Contractholders. Contractholders may request additional copies of VIP Trust’s annual or semi-annual reports, free of charge, by writing to VIP Trust at 1290 Avenue of the Americas, New York, New York 10104 or by calling 1-877-522-5035.
WE NEED YOUR VOTE. IT IS IMPORTANT THAT YOU EXECUTE AND RETURN ALL OF YOUR PROXY OR VOTING INSTRUCTION CARDS PROMPTLY.
164
APPENDIX A
FORM OF AGREEMENT AND PLAN OF REORGANIZATION AND TERMINATION
(Shell Reorganization Plan)
THIS AGREEMENT AND PLAN OF REORGANIZATION AND TERMINATION (“Agreement”) is made as of , 2014 [before the shareholders meeting], between EQ ADVISORS TRUST, a Delaware statutory trust (“EQAT”), on behalf of each of its segregated portfolios of assets (“series”) listed under the heading “New Portfolios” on Schedule A to this Agreement (“Schedule A”) (each, a “New Portfolio”), and AXA PREMIER VIP TRUST, also a Delaware statutory trust (“VIP”), on behalf of each of its series listed under the heading “Old Portfolios” on Schedule A (each, an “Old Portfolio”). (Each New Portfolio and Old Portfolio is sometimes referred to herein as a “Portfolio,” and each of EQAT and VIP is sometimes referred to herein as an “Investment Company.”) Notwithstanding anything to the contrary contained herein, (1) all agreements, covenants, representations, warranties, actions, and obligations (collectively, “Obligations”) of and by each Portfolio, and of and by each Investment Company, as applicable, on its behalf, shall be the Obligations of that Portfolio only, (2) all rights and benefits created hereunder in favor of a Portfolio shall inure to and be enforceable by the Investment Company of which that Portfolio is a series on that Portfolio’s behalf, and (3) in no event shall any other series of an Investment Company or the assets thereof be held liable with respect to the breach or other default by an obligated Portfolio or Investment Company of its Obligations set forth herein.
Each Investment Company may sell voting shares of beneficial interest in its Portfolios, $0.001 par value per share (“shares”), to (1) separate accounts of AXA Equitable Life Insurance Company (“AXA Equitable”), AXA Life and Annuity Company, and other affiliated or unaffiliated insurance companies in connection with certain variable annuity certificates and contracts and variable life insurance policies (collectively, “Contracts”) issued thereby and (2) The AXA Equitable 401(k) Plan. Shares in each Portfolio also may be sold to (3) other tax-qualified retirement plans, (4) other portfolios managed by AXA Equitable Funds Management Group, LLC (“FMG LLC”) that currently sell their shares to those accounts and plans, and (5) and other investors eligible under applicable Regulations (as defined below). At the date of adoption hereof, some shares in certain Old Portfolios are held by one or more shareholders other than separate accounts of AXA Equitable (collectively, “Other Shareholders”) and the balance of the shares in those Old Portfolios and all the shares in each other Old Portfolio are held by AXA Equitable for separate accounts thereof. Class K shares are sold only to other series of the Investment Companies and certain group annuity and retirement plans. The Portfolios are underlying investment options for those separate accounts to fund Contracts. Under applicable law, the assets of all those separate accounts (i.e., the shares in the Portfolios) are the property of AXA Equitable, which is the owner of record of those shares, and are held for the benefit of the Contract holders.
A-1
The Investment Companies wish to effect five separate reorganizations, each described in section 368(a)(1)(F) of the Internal Revenue Code of 1986, as amended (“Code”) (all “section” references are to the Code, unless otherwise noted), and intend this Agreement to be, and adopt it as, a “plan of reorganization” (within the meaning of the regulations under the Code (“Regulations”)). Each reorganization will involve an Old Portfolio’s changing its identity — by converting from a series of VIP to a series of EQAT — by (1) transferring all its assets to the New Portfolio listed on Schedule A opposite its name (“corresponding New Portfolio”) (which is being established solely for the purpose of acquiring those assets and continuing that Old Portfolio’s business) in exchange solely for shares in that New Portfolio and that New Portfolio’s assumption of all of that Old Portfolio’s liabilities, (2) distributing those shares pro rata to that Old Portfolio’s shareholders in exchange for their shares therein and in complete liquidation thereof, and (3) terminating that Old Portfolio (all the foregoing transactions involving each Old Portfolio and its corresponding New Portfolio being referred to herein collectively as a “Reorganization”), all on the terms and conditions set forth herein. The consummation of one Reorganization shall not be contingent on the consummation of any other Reorganization. (For convenience, the balance hereof, except paragraphs 1.3 and 6, refers only to a single Reorganization, one Old Portfolio, and one New Portfolio, but the terms and conditions hereof shall apply separately to each Reorganization and the Portfolios participating therein.).
Each Investment Company’s board of trustees (each, a “Board”), in each case including a majority of its members who are not “interested persons” (as that term is defined in the Investment Company Act of 1940, as amended (“1940 Act”)) of either Investment Company (“Non-Interested Persons”), (1) has duly adopted and approved this Agreement and the transactions contemplated hereby and has duly authorized its performance hereof on its Portfolio’s behalf by all necessary Board action and (2) has determined that participation in the Reorganization is in the best interests of its Portfolio and that the interests of the existing shareholders thereof will not be diluted as a result of the Reorganization.
Old Portfolio offers three classes of shares, designated Class A, Class B, and Class K shares (“Class A Old Portfolio Shares,” “Class B Old Portfolio Shares,” and “Class K Old Portfolio Shares,” respectively, and collectively, “Old Portfolio Shares”). New Portfolio also will offer three classes of shares, designated Class IA, Class IB, and Class K shares (“Class IA New Portfolio Shares,” “Class IB New Portfolio Shares,” and “Class K New Portfolio Shares,” respectively, and collectively, “New Portfolio Shares”). The Portfolios’ similarly designated classes of shares have substantially similar characteristics.
A-2
In consideration of the mutual promises contained herein, the parties agree as follows:
1. PLAN OF REORGANIZATION AND TERMINATION
1.1 Subject to the requisite approval of Old Portfolio’s shareholders and the terms and conditions set forth herein, Old Portfolio shall assign, sell, convey, transfer, and deliver all of its assets described in paragraph 1.2 (“Assets”) to New Portfolio. In exchange therefor, New Portfolio shall:
| (a) | issue and deliver to Old Portfolio the number of full and fractional (all references herein to “fractional” shares meaning fractions rounded to the eighth decimal place) (1) Class IA New Portfolio Shares equal to the number of full and fractional Class A Old Portfolio Shares then outstanding, (2) Class IB New Portfolio Shares equal to the number of full and fractional Class B Old Portfolio Shares then outstanding, and (3) Class K New Portfolio Shares equal to the number of full and fractional Class K Old Portfolio Shares then outstanding, and |
| (b) | assume all of Old Portfolio’s liabilities described in paragraph 1.3 (“Liabilities”). |
Those transactions shall take place at the Closing (as defined in paragraph 2.1).
1.2 The Assets shall consist of all assets and property of every kind and nature — including all cash, cash equivalents, securities, commodities, futures interests, receivables (including interest and dividends receivable), claims and rights of action, rights to register shares under applicable securities laws, goodwill, and books and records — Old Portfolio owns at the Effective Time (as defined in paragraph 2.1) and any deferred and prepaid expenses shown as assets on Old Portfolio’s books at that time; and Old Portfolio has no unamortized or unpaid organizational fees or expenses that have not previously been disclosed in writing to EQAT.
1.3 The Liabilities shall consist of all of Old Portfolio’s liabilities, debts, obligations, and duties of whatever kind or nature existing at the Effective Time, whether absolute, accrued, contingent, or otherwise, whether known or unknown, whether or not arising in the ordinary course of business, whether or not determinable at the Effective Time, and whether or not specifically referred to herein, except Reorganization Expenses (as defined in paragraph 3.3(f)) borne by the New Portfolios and/or FMG LLC pursuant to paragraph 6. Notwithstanding the foregoing, Old Portfolio shall use its best efforts to discharge all its known Liabilities before that time.
1.4 At or before the Closing, New Portfolio shall redeem the Initial Shares (as defined in paragraph 5.5) for the amount at which they are issued pursuant to that paragraph. At the Effective Time (or as soon thereafter as is reasonably practicable),
A-3
Old Portfolio shall distribute the New Portfolio Shares it receives pursuant to paragraph 1.1(a) to the separate accounts for which AXA Equitable holds Old Portfolio Shares, and Other Shareholders, of record at the Effective Time (each, a “Shareholder”), in proportion to their Old Portfolio Shares then so held and in constructive exchange therefor, and shall completely liquidate. That distribution shall be accomplished by EQAT’s transfer agent’s opening accounts on New Portfolio’s shareholder records in the Shareholders’ names and transferring those New Portfolio Shares thereto. Pursuant to that transfer, each Shareholder’s account shall be credited with the number of full and fractional New Portfolio Shares equal to the number of full and fractional Old Portfolio Shares that Shareholder holds at the Effective Time, by class (i.e., the account for each Shareholder that holds Class A Old Portfolio Shares shall be credited with the number of full and fractional Class IA New Portfolio Shares due that Shareholder, the account for each Shareholder that holds Class B Old Portfolio Shares shall be credited with the number of full and fractional Class IB New Portfolio Shares due that Shareholder, and the account for each Shareholder that holds Class K Old Portfolio Shares shall be credited with the number of full and fractional Class K New Portfolio Shares due that Shareholder). The aggregate net asset value (“NAV”) of New Portfolio Shares of each class to be so credited to each Shareholder’s account shall equal the aggregate NAV of the Old Portfolio Shares of the corresponding class that Shareholder holds at the Effective Time. All issued and outstanding Old Portfolio Shares, including any represented by certificates, shall simultaneously be canceled on Old Portfolio’s shareholder records. EQAT shall not issue certificates representing the New Portfolio Shares issued in connection with the Reorganization.
1.5 Any transfer taxes payable on issuance and transfer of New Portfolio Shares in a name other than that of the registered holder on Old Portfolio’s shareholder records of the Old Portfolio Shares actually or constructively exchanged therefor shall be paid by the transferee thereof, as a condition of that issuance and transfer.
1.6 After the Effective Time, Old Portfolio shall not conduct any business except in connection with its termination. As soon as reasonably practicable after distribution of the New Portfolio Shares pursuant to paragraph 1.4, all actions required to terminate Old Portfolio as a series of VIP shall be taken — and in all events Old Portfolio shall have been terminated as such within six months after the Effective Time — and VIP shall make all filings and take all other actions in connection therewith required by applicable law or necessary and proper to effect that termination.
1.7 Any reporting responsibility of Old Portfolio to a public authority, including the responsibility for filing regulatory reports, tax returns, and other documents with the Securities and Exchange Commission (“Commission”), any state securities commission, any federal, state, and local tax authorities, and any other relevant regulatory authority, is and shall remain its responsibility up to and including the date on which it is terminated. In furtherance of the foregoing, after the Effective Time, except as otherwise agreed to by the Investment Companies, VIP shall or shall cause its agents
A-4
to cooperate with EQAT and its agents in (a) preparing any federal, state, and local tax returns, including any Forms 1099, required to be filed by either Portfolio with respect to the taxable year in which the Closing occurs and for any prior periods or taxable years and (b) duly filing those tax returns and Forms 1099 filed with the appropriate taxing authorities.
2. CLOSING AND EFFECTIVE TIME
2.1 Unless the Investment Companies agree otherwise, all acts necessary to consummate the Reorganization (“Closing”) shall be deemed to occur simultaneously at the close of business (4:00 p.m., Eastern Time) on , 2014, or a later date as to which they agree (“Effective Time”). The Closing shall be held at the Investment Companies’ offices or at another place as to which they agree.
2.2 VIP shall direct the custodian of Old Portfolio’s assets to deliver to EQAT at the Closing a certificate of an authorized officer (“Certificate”) stating that (a) the Assets it holds will be transferred to New Portfolio at the Effective Time, (b) all necessary taxes in connection with the delivery of the Assets, including all applicable federal and state stock transfer stamps, if any, have been paid or provision for payment has been made, and (c) the information (including adjusted basis and holding period, by lot) concerning the Assets, including all portfolio securities, transferred by Old Portfolio to New Portfolio, as reflected on New Portfolio’s books immediately after the Closing, does or will conform to that information on Old Portfolio’s books immediately before the Closing.
2.3 VIP shall direct its transfer agent to deliver to EQAT at the Closing a Certificate stating that its records contain (a) the name, address, and taxpayer identification number of each Shareholder, (b) the number of full and fractional shares in each outstanding class of Old Portfolio Shares each Shareholder owns, and (c) the dividend reinvestment elections, if any, applicable to each Shareholder, all at the Effective Time.
2.4 EQAT shall direct its transfer agent to deliver to VIP (a) at the Closing, a confirmation, or other evidence satisfactory to VIP, that the New Portfolio Shares to be issued to Old Portfolio pursuant to paragraph 1.1(a) have been credited to Old Portfolio’s account on New Portfolio’s shareholder records and (b) at or as soon as reasonably practicable after the Closing, a Certificate as to the opening of accounts on those records in the Shareholders’ names.
2.5 Each Investment Company shall deliver to the other at the Closing (a) a Certificate in form and substance satisfactory to the recipient and dated the Effective Time, to the effect that the representations and warranties it made herein are true and correct at the Effective Time except as they may be affected by the transactions contemplated hereby and (b) bills of sale, checks, assignments, share certificates, receipts, and/or other documents the other Investment Company or its counsel reasonably requests.
A-5
3. REPRESENTATIONS AND WARRANTIES
3.1 VIP, on Old Portfolio’s behalf, represents and warrants to EQAT, on New Portfolio’s behalf, as follows:
(a) VIP (1) is a statutory trust that is duly organized, validly existing, and in good standing under the laws of the State of Delaware (a “Delaware Statutory Trust”), and its Certificate of Trust has been duly filed in the office of the Secretary of State thereof, (2) is duly registered under the 1940 Act as an open-end management investment company, which registration is in full force and effect, and (3) has the power to own all its properties and assets and to carry on its business as described in its current registration statement on Form N-1A;
(b) Old Portfolio is a duly established and designated series of VIP;
(c) The execution, delivery, and performance hereof have been duly authorized at the date hereof by all necessary action on the part of VIP’s Board, which has made the determinations required by Rule 17a-8(a) under the 1940 Act; and this Agreement constitutes a valid and legally binding obligation of VIP, with respect to Old Portfolio, enforceable in accordance with its terms, except as they may be limited by bankruptcy, insolvency, fraudulent transfer, reorganization, receivership, moratorium, and similar laws affecting the rights and remedies of creditors generally and by general principles of equity;
(d) At the Effective Time, VIP, on Old Portfolio’s behalf, will have good and marketable title to the Assets and full right, power, and authority to sell, assign, transfer, and deliver the Assets hereunder free of any liens or other encumbrances (except securities that are subject to “securities loans,” as referred to in section 851(b)(2), or are restricted to resale by their terms); and on delivery and payment for the Assets, EQAT, on New Portfolio’s behalf, will acquire good and marketable title thereto, subject to no restrictions on the full transfer thereof, including restrictions that might arise under the Securities Act of 1933, as amended (“1933 Act”);
(e) VIP, with respect to Old Portfolio, is not currently engaged in, and its execution, delivery, and performance hereof and consummation of the Reorganization will not result in, (1) a conflict with or material violation of any provision of Delaware law, VIP’s Agreement and Declaration of Trust (“VIP Declaration”) or By-Laws, or any agreement, indenture, instrument, contract, lease, or other undertaking (each, an “Undertaking”) to which VIP, with respect to Old Portfolio or on its behalf, is a party or by which it is bound or (2) the acceleration of any obligation, or the imposition of any penalty, under any Undertaking, judgment, or decree to which VIP, with respect to Old Portfolio or on its behalf, is a party or by which it is bound;
(f) At or before the Effective Time, either (a) all material contracts and other commitments of or applicable to Old Portfolio (other than this Agreement and certain investment contracts, including options, futures, forward contracts, and
A-6
swap agreements) will terminate or (b) provision for discharge, and/or New Portfolio’s assumption, of any liabilities of Old Portfolio thereunder will be made, without either Portfolio’s incurring any penalty with respect thereto and without diminishing or releasing any rights VIP, on Old Portfolio’s behalf, may have had with respect to actions taken or omitted or to be taken by any other party thereto before the Closing;
(g) No litigation, administrative proceeding, action, or investigation of or before any court, governmental body, or arbitrator is presently pending or, to VIP’s knowledge, threatened against VIP, with respect to Old Portfolio or any of its properties or assets attributable or allocable to Old Portfolio, that, if adversely determined, would materially and adversely affect Old Portfolio’s financial condition or the conduct of its business; and VIP, on Old Portfolio’s behalf, knows of no facts that might form the basis for the institution of any such litigation, proceeding, action, or investigation and is not a party to or subject to the provisions of any order, decree, judgment, or award of any court, governmental body, or arbitrator that materially and adversely affects Old Portfolio’s business or VIP’s ability to consummate the transactions contemplated hereby;
(h) Old Portfolio’s Statement of Assets and Liabilities, Portfolio of Investments, Statement of Operations, and Statement of Changes in Net Assets (each, a “Statement”) at and for the fiscal year (in the case of the last Statement, for the two fiscal years) ended December 31, 2013, have been audited by PricewaterhouseCoopers LLP, an independent registered public accounting firm, and are in accordance with generally accepted accounting principles consistently applied in the United States (“GAAP”); those Statements (copies of which VIP has furnished to EQAT) present fairly, in all material respects, Old Portfolio’s financial condition at that date in accordance with GAAP and the results of its operations and changes in its net assets for the period(s) then ended; and, to VIP’s management’s best knowledge and belief, there are no known contingent liabilities of Old Portfolio required to be reflected on a balance sheet (including the notes thereto) in accordance with GAAP at that date that are not disclosed therein;
(i) Since December 31, 2013, there has not been any material adverse change in Old Portfolio’s financial condition, assets, liabilities, or business, other than changes occurring in the ordinary course of business, or any incurrence by Old Portfolio of indebtedness maturing more than one year from the date that indebtedness was incurred; for purposes of this representation and warranty, a decline in Old Portfolio’s NAV due to declines in market values of securities Old Portfolio holds, the discharge of Old Portfolio’s liabilities, or the redemption of Old Portfolio Shares by its shareholders will not constitute a material adverse change;
(j) All federal, state, and local tax returns, dividend reporting forms, and other tax-related reports (collectively, “Returns”) of Old Portfolio required by
A-7
law to have been filed by the Effective Time (including any properly and timely filed extensions of time to file) will have been timely filed and are or will be correct in all material respects, and all federal and other taxes shown as due or required to be shown as due on those Returns will have been paid or provision will have been made for the payment thereof (except for amounts that alone or in the aggregate would not reasonably be expected to have a material adverse effect); to the best of VIP’s knowledge, no such Return is currently under audit and no assessment has been asserted with respect to those Returns; and Old Portfolio (a) is in compliance in all material respects with all applicable Regulations pertaining to (1) the reporting of dividends and other distributions on and redemptions of its shares, (2) withholding in respect thereof, and (3) shareholder basis reporting, (b) has withheld in respect of dividends and other distributions and paid to the proper taxing authorities all taxes required to be withheld, and (c) is not liable for any material penalties that could be imposed thereunder;
(k) Old Portfolio is not classified as a partnership, and instead is classified as an association that is taxable as a corporation, for federal tax purposes and either has elected the latter classification by filing Form 8832 with the Internal Revenue Service (“IRS”) or is a “publicly traded partnership” (as defined in section 7704(b)) that is treated as a corporation; Old Portfolio is an “investment company” (as defined in section 368(a)(2)(F)(iii)) and a “fund” (as defined in section 851(g)(2), eligible for treatment under section 851(g)(1)); Old Portfolio has elected to be a “regulated investment company” under Part I of Subchapter M of Chapter 1 of Subtitle A of the Code (“Subchapter M”) (“RIC”); for each taxable year of its operation (including the taxable year that includes the Effective Time (“current year”)), Old Portfolio has met (and for the current year through the Effective Time will meet) the requirements of Subchapter M for qualification and treatment as a RIC and has been (and for the current year through the Effective Time will be) eligible to and has computed its federal income tax under section 852; and Old Portfolio has no earnings and profits accumulated in any taxable year in which the provisions of Subchapter M did not apply to it;
(l) All issued and outstanding Old Portfolio Shares are, and at the Effective Time will be, duly and validly issued and outstanding, fully paid, and non-assessable by VIP and have been offered and sold in every state and the District of Columbia in compliance in all material respects with applicable registration requirements of the 1933 Act and state securities laws; all issued and outstanding Old Portfolio Shares will, at the Effective Time, be held by the persons and in the amounts set forth on Old Portfolio’s shareholder records (as provided in the Certificate to be delivered pursuant to paragraph 2.3); and Old Portfolio does not have outstanding any options, warrants, or other rights to subscribe for or purchase any Old Portfolio Shares, nor are there outstanding any securities convertible into any Old Portfolio Shares;
(m) Old Portfolio incurred the Liabilities, which are associated with the Assets, in the ordinary course of its business;
A-8
(n) Old Portfolio is not under the jurisdiction of a court in a “title 11 or similar case” (as defined in section 368(a)(3)(A));
(o) Not more than 25% of the value of Old Portfolio’s total assets (excluding cash, cash items, and Government securities) is invested in the stock and securities of any one issuer, and not more than 50% of the value of those assets is invested in the stock and securities of five or fewer issuers;
(p) On the effective date of the Registration Statement (as defined in paragraph 3.3(a)), at the time of the Shareholders Meeting (as defined in paragraph 4.2), and at the Effective Time, VIP’s current prospectus and statement of additional information (“Pro/SAI”) including Old Portfolio will (1) conform in all material respects to the applicable requirements of the 1933 Act and the 1940 Act and the rules and regulations of the Commission thereunder and (2) not contain any untrue statement of a material fact or omit to state a material fact required to be stated therein or necessary to make the statements therein, in light of the circumstances under which they were made, not misleading;
(q) The information to be furnished by VIP for use in no-action letters, applications for orders, the Registration Statement, and other documents filed or to be filed with any federal, state, or local regulatory authority (including the Financial Industry Regulatory Authority, Inc. (“FINRA”)) that may be necessary in connection with the transactions contemplated hereby will be accurate and complete in all material respects, will comply in all material respects with federal securities laws and other laws and regulations, and will not contain any untrue statement of a material fact or omit to state a material fact required to be stated therein or necessary to make the statements therein, in light of the circumstances under which they were made, not misleading;
(r) The New Portfolio Shares to be delivered to Old Portfolio hereunder are not being acquired for the purpose of making any distribution thereof, other than in accordance with the terms hereof; and
(s) The VIP Declaration permits VIP to vary its shareholders’ investment. VIP does not have a fixed pool of assets — each series thereof (including Old Portfolio) is a managed portfolio of securities, and FMG LLC and each investment sub-adviser thereof have the authority to buy and sell securities for it.
3.2 EQAT, on New Portfolio’s behalf, represents and warrants to VIP, on Old Portfolio’s behalf, as follows:
(a) EQAT (1) is a Delaware Statutory Trust, and its Certificate of Trust has been duly filed in the office of the Secretary of State of Delaware, (2) is duly registered under the 1940 Act as an open-end management investment company, which registration is in full force and effect, and (3) has the power to own all its properties and assets and to carry on its business as described in its current registration statement on Form N-1A;
A-9
(b) At the Effective Time, New Portfolio will be a duly established and designated series of EQAT; and New Portfolio has not commenced operations and will not do so until after the Closing;
(c) The execution, delivery, and performance hereof have been duly authorized at the date hereof by all necessary action on the part of EQAT’s Board, which has made the determinations required by Rule 17a-8(a) under the 1940 Act; and this Agreement constitutes a valid and legally binding obligation of EQAT, with respect to New Portfolio, enforceable in accordance with its terms, except as they may be limited by bankruptcy, insolvency, fraudulent transfer, reorganization, receivership, moratorium, and similar laws affecting the rights and remedies of creditors generally and by general principles of equity;
(d) Before the Closing, there will be no (1) issued and outstanding New Portfolio Shares, (2) options, warrants, or other rights to subscribe for or purchase any New Portfolio Shares, (3) securities convertible into any New Portfolio Shares, or (4) other securities issued by New Portfolio, except the Initial Shares;
(e) No consideration other than New Portfolio Shares (and New Portfolio’s assumption of the Liabilities) will be issued in exchange for the Assets in the Reorganization;
(f) EQAT, with respect to New Portfolio, is not currently engaged in, and its execution, delivery, and performance hereof and consummation of the Reorganization will not result in, (1) a conflict with or material violation of any provision of Delaware law, EQAT’s Amended and Restated Declaration of Trust, as amended (“EQAT Declaration”), or By-Laws, or any Undertaking to which EQAT, with respect to New Portfolio or on its behalf, is a party or by which it is bound or (2) the acceleration of any obligation, or the imposition of any penalty, under any Undertaking, judgment, or decree to which EQAT, with respect to New Portfolio or on its behalf, is a party or by which it is bound;
(g) No litigation, administrative proceeding, action, or investigation of or before any court, governmental body, or arbitrator is presently pending or, to EQAT’s knowledge, threatened against EQAT, with respect to New Portfolio or any of its properties or assets attributable or allocable to New Portfolio, that, if adversely determined, would materially and adversely affect New Portfolio’s financial condition or the conduct of its business; and EQAT, on New Portfolio’s behalf, knows of no facts that might form the basis for the institution of any such litigation, proceeding, action, or investigation and is not a party to or subject to the provisions of any order, decree, judgment, or award of any court, governmental body, or arbitrator that materially and adversely affects New Portfolio’s business or EQAT’s ability to consummate the transactions contemplated hereby;
(h) From the time it comes into existence, New Portfolio (1) will not be classified as a partnership, and instead will be classified as an association that is taxable as a corporation, for federal tax purposes (and either has elected the latter
A-10
classification by filing Form 8832 with the IRS or will be a “publicly traded partnership” (as defined in section 7704(b)) that is treated as a corporation) and (2) will be an “investment company” (as defined in section 368(a)(2)(F)(iii)) and a “fund” (as defined in section 851(g)(2), eligible for treatment under section 851(g)(1)); New Portfolio will file its federal income tax returns on Form 1120-RIC; for the taxable year in which the Reorganization occurs, New Portfolio will meet the requirements of Subchapter M for qualification and treatment as a RIC and will be eligible to and will compute its federal income tax under section 852; and New Portfolio intends to continue to meet all those requirements, and to be eligible to and to so compute its federal income tax, for succeeding taxable years;
(i) New Portfolio is not under the jurisdiction of a court in a “title 11 or similar case” (as defined in section 368(a)(3)(A));
(j) There is no plan or intention for New Portfolio to be terminated, dissolved, or merged into another statutory or business trust or a corporation or any “fund” thereof (as defined in section 851(g)(2)) following the Reorganization;
(k) Assuming the truthfulness and correctness of VIP’s representation and warranty in paragraph 3.1(o), immediately after the Reorganization (1) not more than 25% of the value of New Portfolio’s total assets (excluding cash, cash items, and Government securities) will be invested in the stock and securities of any one issuer and (2) not more than 50% of the value of those assets will be invested in the stock and securities of five or fewer issuers;
(l) The New Portfolio Shares to be issued and delivered to Old Portfolio, for the Shareholders’ accounts, pursuant to the terms hereof, (1) will have been duly authorized by EQAT and duly registered under the federal securities laws (and appropriate notices respecting them will have been duly filed under applicable state securities laws) at the Effective Time and (2) when so issued and delivered, will be duly and validly issued and outstanding New Portfolio Shares, fully paid and non-assessable by EQAT;
(m) On the effective date of the Registration Statement, at the time of the Shareholders Meeting, and at the Effective Time, (a) EQAT’s Pro/SAI including New Portfolio will conform in all material respects to the applicable requirements of the 1933 Act and the 1940 Act and the rules and regulations of the Commission thereunder and (b) that Pro/SAI and the prospectus included in the Registration Statement will not include any untrue statement of a material fact or omit to state a material fact required to be stated therein or necessary to make the statements therein, in light of the circumstances under which they were made, not misleading; provided that the foregoing will not apply to statements in or omissions from that prospectus made in reliance on and in conformity with information furnished by VIP for use therein;
(n) The information to be furnished by EQAT for use in no-action letters, applications for orders, the Registration Statement, and other documents filed or
A-11
to be filed with any federal, state, or local regulatory authority (including FINRA) that may be necessary in connection with the transactions contemplated hereby will be accurate and complete in all material respects, will comply in all material respects with federal securities laws and other laws and regulations, and will not contain any untrue statement of a material fact or omit to state a material fact required to be stated therein or necessary to make the statements therein, in light of the circumstances under which they were made, not misleading; and
(o) The EQAT Declaration permits EQAT to vary its shareholders’ investment. EQAT does not have a fixed pool of assets — each series thereof (including New Portfolio after it commences operations) is (or will be) a managed portfolio of securities, and FMG LLC and each investment sub-adviser thereof have (or will have) the authority to buy and sell securities for it.
3.3 Each Investment Company, on its Portfolio’s behalf, represents and warrants to the other Investment Company, on its Portfolio’s behalf, as follows:
(a) No governmental consents, approvals, or authorizations (collectively, “consents”) or filings are required under the 1933 Act, the Securities Exchange Act of 1934, as amended, the 1940 Act, or state securities laws, and no consents or orders of any court are required, for its execution, delivery, and performance hereof on its Portfolio’s behalf, except for (1) EQAT’s filing with the Commission of a registration statement on Form N-14 relating to the New Portfolio Shares issuable hereunder, and any supplement or amendment thereto, including therein a prospectus and proxy statement (“Registration Statement”), and a post-effective amendment to EQAT’s registration statement on Form N-1A and (2) consents, filings, and orders that have been made or received or may be required after the Effective Time;
(b) The fair market value of the New Portfolio Shares each Shareholder receives will be approximately equal to the fair market value of its Old Portfolio Shares it actually or constructively surrenders in exchange therefor;
(c) Old Portfolio’s shareholders will pay their own expenses (such as fees of personal investment or tax advisers for advice regarding the Reorganization), if any, incurred in connection with the Reorganization;
(d) The fair market value and “adjusted basis” (within the meaning of section 1011) of the Assets will equal or exceed the Liabilities to be assumed by New Portfolio and those to which the Assets are subject;
(e) None of the compensation AXA Equitable or any affiliate thereof receives as a service provider to Old Portfolio will be separate consideration for, or allocable to, any of the Old Portfolio Shares that AXA Equitable (on any Shareholder’s behalf) holds; none of the New Portfolio Shares AXA Equitable (on any Shareholder’s behalf) receives in the Reorganization will be separate consideration for, or allocable to, any employment agreement, investment advisory agreement, or other service agreement; and the compensation paid to
A-12
AXA Equitable or any affiliate thereof will be for services actually rendered and will be commensurate with amounts paid to third parties bargaining at arm’s-length for similar services;
(f) No expenses incurred by Old Portfolio or on its behalf in connection with the Reorganization will be paid or assumed by AXA Equitable, any affiliate thereof (including FMG LLC), or any other third party unless those expenses are solely and directly related to the Reorganization (determined in accordance with the guidelines set forth in Rev. Rul. 73-54, 1973-1 C.B. 187) (“Reorganization Expenses”), and no cash or property other than New Portfolio Shares will be transferred to Old Portfolio or any of its shareholders with the intention that it be used to pay any expenses (even Reorganization Expenses) thereof;
(g) Immediately following consummation of the Reorganization, (1) the Shareholders will own all the New Portfolio Shares and will own those shares solely by reason of their ownership of the Old Portfolio Shares immediately before the Reorganization and (2) New Portfolio will hold the same assets — except for assets used to pay the Portfolios’ expenses incurred in connection with the Reorganization — and be subject to the same liabilities that Old Portfolio held or was subject to immediately before the Reorganization, plus any liabilities for those expenses; and those excepted assets, together with the amount of all redemptions and distributions (other than regular, normal dividends) Old Portfolio makes immediately preceding the Reorganization, will, in the aggregate, constitute less than 1% of its net assets;
(h) There will be no dissenters to the Reorganization under the applicable provisions of Delaware law, and New Portfolio will not pay cash in lieu of fractional New Portfolio Shares in connection with the Reorganization;
(i) The Reorganization is being undertaken for bona fide business purposes (and not a purpose to avoid federal income tax); and
(j) The principal purpose of New Portfolio’s assumption of the Liabilities is not avoidance of federal income tax on the transaction.
4. COVENANTS
4.1 VIP covenants to operate Old Portfolio’s business in the ordinary course between the date hereof and the Closing, it being understood that:
(a) such ordinary course will include declaring and paying customary dividends and other distributions and changes in operations contemplated by Old Portfolio’s normal business activities; and
(b) Old Portfolio will retain exclusive control of the composition of its portfolio until the Closing.
A-13
4.2 VIP covenants to call and hold a meeting of Old Portfolio’s shareholders to consider and act on this Agreement and to take all other action necessary to obtain approval of the transactions contemplated hereby (“Shareholders Meeting”).
4.3 VIP covenants that it will assist EQAT in obtaining information EQAT reasonably requests concerning the beneficial ownership of Old Portfolio Shares.
4.4 VIP covenants that it will turn over its books and records regarding Old Portfolio (including all tax books and records and all books and records required to be maintained under the 1940 Act and the rules and regulations thereunder) to EQAT at the Closing.
4.5 Each Investment Company covenants to cooperate with the other in preparing the Registration Statement in compliance with applicable federal and state securities laws.
4.6 Each Investment Company covenants that it will, from time to time, as and when requested by the other Investment Company, execute and deliver or cause to be executed and delivered all assignments and other instruments, and will take or cause to be taken all further action, the other Investment Company deems necessary or desirable in order to vest in, and confirm to, (a) EQAT, on New Portfolio’s behalf, title to and possession of all the Assets, and (b) VIP, on Old Portfolio’s behalf, title to and possession of the New Portfolio Shares to be delivered hereunder, and otherwise to carry out the intent and purpose hereof.
4.7 EQAT covenants to use all reasonable efforts to obtain the consents required by the 1933 Act, the 1940 Act, and applicable state securities laws it deems appropriate to commence and continue New Portfolio’s operations after the Effective Time.
4.8 VIP covenants to distribute all the New Portfolio Shares it receives in the Reorganization to the Shareholders in complete liquidation of Old Portfolio.
4.9 As promptly as practicable, but in any case within sixty days, after the Effective Time, VIP shall furnish to EQAT, in a form reasonably satisfactory to EQAT, a Certificate stating the earnings and profits of Old Portfolio for federal income tax purposes that will be carried over by New Portfolio as a result of section 381.
4.10 It is the Investment Companies’ intention that the Reorganization will qualify as a reorganization with the meaning of section 368(a)(1)(F). Neither Investment Company shall take any action or cause any action to be taken (including the filing of any tax return) that is inconsistent with that treatment or results in the failure of the Reorganization to qualify as such a reorganization.
4.11 Subject to this Agreement, each Investment Company covenants to take or cause to be taken all actions, and to do or cause to be done all things, reasonably necessary, proper, or advisable to consummate and effectuate the transactions contemplated hereby.
A-14
5. CONDITIONS PRECEDENT
Each Investment Company’s obligations hereunder shall be subject to (a) the other Investment Company’s performance of all its obligations to be performed hereunder at or before the Closing, (b) all representations and warranties of the other Investment Company contained herein being true and correct in all material respects at the date hereof and, except as they may be affected by the transactions contemplated hereby, at the Effective Time, with the same force and effect as if made at that time, and (c) the following further conditions that, at or before that time:
5.1 This Agreement and the transactions contemplated hereby shall have been duly adopted and approved by both Boards and by Old Portfolio’s shareholders at the Shareholders Meeting (including any adjournment(s) thereof);
5.2 All necessary filings shall have been made with the Commission and state securities authorities, and no order or directive shall have been received that any other or further action is required to permit the Investment Companies to carry out the transactions contemplated hereby; the Registration Statement shall have become effective under the 1933 Act, no stop orders suspending the effectiveness thereof shall have been issued, and, to each Investment Company’s best knowledge, no investigation or proceeding for that purpose shall have been instituted or shall be pending, threatened, or contemplated under the 1933 Act or the 1940 Act; the Commission shall not have issued an unfavorable report with respect to the Reorganization under section 25(b) of the 1940 Act nor instituted any proceedings seeking to enjoin consummation of the transactions contemplated hereby under section 25(c) of the 1940 Act; and all consents, orders, and permits of federal, state, and local regulatory authorities (including the Commission and state securities authorities) either Investment Company deems necessary to permit consummation, in all material respects, of the transactions contemplated hereby shall have been obtained, except where failure to obtain same would not involve a risk of a material adverse effect on either Portfolio’s assets or properties, provided that either Investment Company may for itself waive any of those conditions;
5.3 At the Effective Time, no action, suit, or other proceeding shall be pending (or, to either Investment Company’s best knowledge, threatened to be commenced) before any court, governmental agency, or arbitrator in which it is sought to enjoin the performance of, restrain, prohibit, affect the enforceability of, or obtain damages or other relief in connection with, the transactions contemplated hereby;
5.4 The Investment Companies shall have received an opinion of K&L Gates LLP (“Counsel”) as to the federal income tax consequences mentioned below (“Tax Opinion”). In rendering the Tax Opinion, Counsel may rely as to factual matters, exclusively and without independent verification, on the representations and warranties made in this Agreement, which Counsel may treat as representations and warranties made to it (that, notwithstanding paragraph 7, shall survive the Closing), and in
A-15
separate letters, if Counsel requests, addressed to it (collectively, “Representations”) and the Certificates delivered pursuant to paragraph 2.5(a). The Tax Opinion shall be substantially to the effect that — based on the facts and assumptions stated therein and conditioned on the Representations’ being true and complete at the Effective Time and consummation of the Reorganization in accordance herewith (without the waiver or modification of any terms or conditions hereof and without taking into account any amendment hereof that Counsel has not approved) — for federal income tax purposes:
(a) New Portfolio’s acquisition of the Assets in exchange solely for New Portfolio Shares and its assumption of the Liabilities, followed by Old Portfolio’s distribution of those shares pro rata to the Shareholders actually or constructively in exchange for their Old Portfolio Shares and in complete liquidation of Old Portfolio, will qualify as a “reorganization” (as defined in section 368(a)(1)(F)), and each Portfolio will be “a party to a reorganization” (within the meaning of section 368(b));
(b) Old Portfolio will recognize no gain or loss on the transfer of the Assets to New Portfolio in exchange solely for New Portfolio Shares and New Portfolio’s assumption of the Liabilities or on the subsequent distribution of those shares to the Shareholders in exchange for their Old Portfolio Shares;
(c) New Portfolio will recognize no gain or loss on its receipt of the Assets in exchange solely for New Portfolio Shares and its assumption of the Liabilities;
(d) New Portfolio’s basis in each Asset will be the same as Old Portfolio’s basis therein immediately before the Reorganization, and New Portfolio’s holding period for each Asset will include Old Portfolio’s holding period therefor (except where New Portfolio’s investment activities have the effect of reducing or eliminating an Asset’s holding period);
(e) A Shareholder will recognize no gain or loss on the exchange of all its Old Portfolio Shares solely for New Portfolio Shares pursuant to the Reorganization;
(f) A Shareholder’s aggregate basis in the New Portfolio Shares it receives in the Reorganization will be the same as the aggregate basis in its Old Portfolio Shares it actually or constructively surrenders in exchange for those New Portfolio Shares; and its holding period for those New Portfolio Shares will include, in each instance, its holding period for those Old Portfolio Shares, provided the Shareholder holds the latter as capital assets at the Effective Time; and
(g) For purposes of section 381, New Portfolio will be treated just as Old Portfolio would have been treated if there had been no Reorganization. Accordingly, the Reorganization will not result in the termination of Old Portfolio’s taxable year, Old Portfolio’s tax attributes enumerated in section 381(c) will be taken into account by New Portfolio as if there had been no Reorganization, and the part of Old Portfolio’s taxable year before the Reorganization will be included in New Portfolio’s taxable year after the Reorganization.
A-16
Notwithstanding subparagraphs (b) and (d), the Tax Opinion may state that no opinion is expressed as to the effect of the Reorganization on Old Portfolio with respect to any Asset as to which any unrealized gain or loss is required to be recognized for federal income tax purposes on the termination or transfer thereof under a mark-to-market system of accounting;
5.5 Before the Closing, EQAT’s Board shall have authorized the issuance of, and EQAT shall have issued, one New Portfolio Share in each class (“Initial Shares”) to AXA Equitable or an affiliate thereof, in consideration of the payment of $10.00 each (or other amount that Board determines), to vote on the investment management and sub-advisory contracts, distribution and service plan, and other agreements and plans referred to in paragraph 5.6 and to take whatever action it may be required to take as New Portfolio’s sole shareholder;
5.6 EQAT, on New Portfolio’s behalf, shall have entered into, or adopted, as appropriate, an investment management contract, a sub-advisory contract, a distribution and service plan pursuant to Rule 12b-1 under the 1940 Act, and other agreements and plans necessary for New Portfolio’s operation as a series of an open-end management investment company. Each such contract, plan, and agreement shall have been approved by EQAT’s Board and, to the extent required by law (as interpreted by Commission staff positions), by its trustees who are Non-Interested Persons thereof and by AXA Equitable or its affiliate as New Portfolio’s sole shareholder;
5.7 EQAT, on New Portfolio’s behalf, shall have executed and delivered at or before the Closing a Certificate confirming that EQAT, on New Portfolio’s behalf, assumes all of the Liabilities; and
5.8 At any time before the Closing, either Investment Company may waive any of the foregoing conditions (except those set forth in paragraphs 5.1 and 5.4) if, in the judgment of its Board, that waiver will not have a material adverse effect on its Portfolio’s shareholders’ interests.
6. EXPENSES
Subject to satisfaction of the representation contained in paragraph 3.3(f), 50% of the first $300,000 of the Reorganization Expenses described in the following sentence for all the Reorganizations (collectively, “Identified Expenses”) (i.e., up to an aggregate maximum of $150,000) shall be borne by all the New Portfolios in proportion to the respective NAVs of their corresponding Old Portfolios at the Valuation Time, with any Identified Expenses in excess of that aggregate maximum borne solely by FMG LLC. Identified Expenses consist of the following: (1) costs associated with obtaining any necessary order of exemption from the 1940 Act, preparing the Registration Statement, and printing and distributing each New Portfolio’s prospectus and each Old Portfolio’s proxy materials, (2) legal and accounting fees in connection with the Reorganizations, and (3) expenses of holding the Shareholders Meeting (including
A-17
any adjournment or postponement thereof). Notwithstanding the foregoing, (a) FMG LLC shall not bear any brokerage or similar expenses incurred by or for the benefit of any Portfolio in connection with the Reorganizations, (b) all expenses other than Identified Expenses shall be borne by the Portfolio that directly incurs them, and (c) expenses shall be paid by the Portfolio directly incurring them if and to the extent that the payment thereof by another person would result in that Portfolio’s disqualification as a RIC or would prevent the Reorganization in which it participates from qualifying as a tax-free reorganization.
7. ENTIRE AGREEMENT; NO SURVIVAL
Neither Investment Company has made any representation, warranty, or covenant not set forth herein, and this Agreement constitutes the entire agreement between the Investment Companies. The representations, warranties, and covenants contained herein or in any document delivered pursuant hereto or in connection herewith shall not survive the Closing (except to the extent provided in paragraph 5.4).
8. TERMINATION OF AGREEMENT
This Agreement may be terminated at any time at or before the Closing:
8.1 By either Investment Company (a) in the event of the other Investment Company’s material breach of any representation, warranty, or covenant contained herein to be performed at or before the Closing, (b) if a condition to its obligations has not been met and it reasonably appears that that condition will not or cannot be met, (c) if a governmental body issues an order, decree, or ruling having the effect of permanently enjoining, restraining, or otherwise prohibiting consummation of the Reorganization, or (d) if the Closing has not occurred on or before , 2014, or another date to which the Investment Companies agree; or
8.2 By the Investment Companies’ mutual agreement.
In the event of termination under paragraphs 8.1(c) or (d) or 8.2, neither Investment Company (nor its trustees, officers, or shareholders) shall have any liability to the other Investment Company.
9. AMENDMENTS
The Investment Companies may amend, modify, or supplement this Agreement at any time in any manner they mutually agree on in writing, notwithstanding Old Portfolio’s shareholders’ approval thereof; provided that, following that approval no such amendment, modification, or supplement shall have a material adverse effect on the Shareholders’ interests.
A-18
10. MISCELLANEOUS
10.1 This Agreement shall be governed by and construed in accordance with the internal laws of the State of Delaware, without giving effect to principles of conflicts of laws; provided that, in the case of any conflict between those laws and the federal securities laws, the latter shall govern.
10.2 Nothing expressed or implied herein is intended or shall be construed to confer on or give any person, firm, trust, or corporation other than each Investment Company, on its Portfolio’s behalf, and its respective successors and assigns any rights or remedies under or by reason hereof.
10.3 Notice is hereby given that this instrument is executed and delivered on behalf of each Investment Company’s trustees solely in their capacities as trustees, and not individually, and that each Investment Company’s obligations under this instrument are not binding on or enforceable against any of its trustees, officers, shareholders, or series other than its Portfolio but are only binding on and enforceable against its property attributable to and held for the benefit of its Portfolio (“Portfolio’s Property”) and not its property attributable to and held for the benefit of any other series thereof. Each Investment Company, in asserting any rights or claims hereunder on its or its Portfolio’s behalf, shall look only to the other Portfolio’s Property in settlement of those rights or claims and not to the property of any other series of the other Investment Company or to those trustees, officers, or shareholders.
10.4 Any term or provision hereof that is invalid or unenforceable in any jurisdiction shall, as to that jurisdiction, be ineffective to the extent of that invalidity or unenforceability without rendering invalid or unenforceable the remaining terms and provisions hereof or affecting the validity or enforceability of any of the terms and provisions hereof in any other jurisdiction.
10.5 This Agreement may be executed in one or more counterparts, all of which shall be considered one and the same agreement, and shall become effective when one or more counterparts have been executed by each Investment Company and delivered to the other Investment Company. The headings contained herein are for reference purposes only and shall not affect in any way the meaning or interpretation hereof.
A-19
IN WITNESS WHEREOF, each party has caused this Agreement to be executed and delivered by its duly authorized officer as of the day and year first written above.
| EQ ADVISORS TRUST, on behalf of its series listed on Schedule A | ||
| By: |
| |
| Name: | Steven M. Joenk | |
| Title: | President and Chief Executive Officer | |
| AXA PREMIER VIP TRUST, on behalf of its series listed on Schedule A | ||
| By: |
| |
| Name: | Brian E. Walsh | |
| Title: | Chief Financial Officer | |
A-20
SCHEDULE A
OLD PORTFOLIOS | NEW PORTFOLIOS | |
| (series of VIP) | (series of EQAT) | |
| Multimanager Aggressive Equity Portfolio | Multimanager Aggressive Equity Portfolio | |
| Multimanager Technology Portfolio | Multimanager Technology Portfolio | |
| Multimanager Core Bond Portfolio | Multimanager Core Bond Portfolio | |
| Multimanager Mid Cap Growth Portfolio | Multimanager Mid Cap Growth Portfolio | |
| Multimanager Mid Cap Value Portfolio | Multimanager Mid Cap Value Portfolio | |
A-21
APPENDIX B
FORM OF AGREEMENT AND PLAN OF REORGANIZATION AND TERMINATION
(MERGER PLAN)
THIS AGREEMENT AND PLAN OF REORGANIZATION AND TERMINATION (“Agreement”) is made as of , 2014 [before the shareholders meeting], between EQ ADVISORS TRUST, a Delaware statutory trust (“EQAT”), on behalf of each of its segregated portfolios of assets (“series”) listed under the heading “Acquiring Portfolios” on Schedule A to this Agreement (“Schedule A”) (each, an “Acquiring Portfolio”), and AXA PREMIER VIP TRUST, also a Delaware statutory trust (“VIP”), on behalf of each of its series listed under the heading “Targets” on Schedule A (each, a “Target”). (Each Acquiring Portfolio and Target is sometimes referred to herein as a “Portfolio,” and each of EQAT and VIP is sometimes referred to herein as an “Investment Company.”) Notwithstanding anything to the contrary contained herein, (1) all agreements, covenants, representations, warranties, actions, and obligations (collectively, “Obligations”) of and by each Portfolio, and of and by each Investment Company, as applicable, on its behalf, shall be the Obligations of that Portfolio only, (2) all rights and benefits created hereunder in favor of a Portfolio shall inure to and be enforceable by the Investment Company of which that Portfolio is a series on that Portfolio’s behalf, and (3) in no event shall any other series of an Investment Company or the assets thereof be held liable with respect to the breach or other default by an obligated Portfolio or Investment Company of its Obligations set forth herein.
Each Investment Company currently sells voting shares of beneficial interest in its Portfolios, $0.001 par value per share (“shares”), to (1) separate accounts of AXA Equitable Life Insurance Company (“AXA Equitable”), AXA Life and Annuity Company, and other affiliated or unaffiliated insurance companies in connection with certain variable annuity certificates and contracts and variable life insurance policies (collectively, “Contracts”) issued thereby and (2) The AXA Equitable 401(k) Plan. Shares in each Portfolio also may be sold to (3) other tax-qualified retirement plans, (4) other portfolios managed by AXA Equitable Funds Management Group, LLC (“FMG LLC”) that currently sell their shares to those accounts and plans, and (5) and other investors eligible under applicable Regulations (as defined below). At the date of adoption hereof, some shares in certain Portfolios are held by one or more shareholders other than separate accounts of AXA Equitable (collectively, “Other Shareholders”) and the balance of the shares in those Portfolios and all the shares in each other Portfolio are held by AXA Equitable for separate accounts thereof. Class K shares are sold only to other series of the Investment Companies and certain group annuity and retirement plans. The Portfolios are underlying investment options for those separate accounts to fund Contracts. Under applicable law, the assets of all those separate accounts (i.e., the shares in the Portfolios) are the property of AXA Equitable, which is the owner of record of those shares, and are held for the benefit of the Contract holders.
B-1
The Investment Companies wish to effect three separate reorganizations, each described in section 368(a)(1)(D) of the Internal Revenue Code of 1986, as amended (“Code”) (all “section” references are to the Code, unless otherwise noted), and intend this Agreement to be, and adopt it as, a “plan of reorganization” (within the meaning of the regulations under the Code (“Regulations”)). Each reorganization will consist of (1) the transfer of all of a Target’s assets to the Acquiring Portfolio listed on Schedule A opposite its name (“corresponding Acquiring Portfolio”) in exchange solely for shares in that Acquiring Portfolio and that Acquiring Portfolio’s assumption of all of that Target’s liabilities, (2) the distribution of those shares pro rata to that Target’s shareholders in exchange for their shares therein and in complete liquidation thereof, and (3) that Target’s termination (all the foregoing transactions involving each Target and its corresponding Acquiring Portfolio being referred to herein collectively as a “Reorganization”), all on the terms and conditions set forth herein. The consummation of one Reorganization shall not be contingent on the consummation of any other Reorganization. (For convenience, the balance hereof, except paragraphs 1.3 and 7.2, refers only to a single Reorganization, one Target, and one Acquiring Portfolio, but the terms and conditions hereof shall apply separately to each Reorganization and the Portfolios participating therein.)
Each Investment Company’s board of trustees (each, a “Board”), in each case including a majority of its members who are not “interested persons” (as that term is defined in the Investment Company Act of 1940, as amended (“1940 Act”)) of either Investment Company, (1) has duly adopted and approved this Agreement and the transactions contemplated hereby and has duly authorized its performance hereof on its Portfolio’s behalf by all necessary Board action and (2) has determined that participation in the Reorganization is in the best interests of its Portfolio and that the interests of the existing shareholders thereof will not be diluted as a result of the Reorganization.
Target offers three classes of shares, designated Class A, Class B, and Class K shares (“Class A Target Shares,” “Class B Target Shares,” and “Class K Target Shares,” respectively, and collectively, “Target Shares”). Acquiring Portfolio also offers three classes of shares, also designated Class IA, Class IB, and Class K shares (“Class IA Acquiring Portfolio Shares,” “Class IB Acquiring Portfolio Shares,” and “Class K Acquiring Portfolio Shares,” respectively, and collectively, “Acquiring Portfolio Shares”). The Portfolios’ similarly designated classes of shares have identical characteristics, rights, and preferences.
In consideration of the mutual promises contained herein, the parties agree as follows:
1. PLAN OF REORGANIZATION AND TERMINATION
1.1. Subject to the requisite approval of Target’s shareholders and the terms and conditions set forth herein, Target shall assign, sell, convey, transfer, and deliver all of its assets described in paragraph 1.2 (“Assets”) to Acquiring Portfolio. In exchange therefor, Acquiring Portfolio shall —
B-2
(a) issue and deliver to Target the number of full and fractional (all references herein to “fractional” shares meaning fractions rounded to the eighth decimal place) (1) Class IA Acquiring Portfolio Shares determined by dividing Target’s net value (computed as set forth in paragraph 2.1) (“Target Value”) attributable to the Class A Target Shares by the net asset value (computed as set forth in paragraph 2.2) (“NAV”) of a Class IA Acquiring Portfolio Share, (2) Class IB Acquiring Portfolio Shares determined by dividing the Target Value attributable to the Class B Target Shares by the NAV of a Class IB Acquiring Portfolio Share, and (3) Class K Acquiring Portfolio Shares determined by dividing the Target Value attributable to the Class K Target Shares by the NAV of a Class K Acquiring Portfolio Share, and
(b) assume all of Target’s liabilities described in paragraph 1.3 (“Liabilities”).
Those transactions shall take place at the Closing (as defined in paragraph 3.1).
1.2. The Assets shall consist of all assets and property of every kind and nature — including all cash, cash equivalents, securities, commodities, futures interests, receivables (including interest and dividends receivable), claims and rights of action, rights to register shares under applicable securities laws, goodwill, and books and records — Target owns at the Valuation Time (as defined in paragraph 2.1) and any deferred and prepaid expenses shown as assets on Target’s books at that time; and Target has no unamortized or unpaid organizational fees or expenses that have not previously been disclosed in writing to EQAT.
1.3. The Liabilities shall consist of all of Target’s liabilities, debts, obligations, and duties of whatever kind or nature existing at the Valuation Time, whether absolute, accrued, contingent, or otherwise, whether known or unknown, whether or not arising in the ordinary course of business, whether or not determinable at the Effective Time (as defined in paragraph 3.1), and whether or not specifically referred to herein, except Reorganization Expenses (as defined in paragraph 4.3.10) borne by another Target or FMG LLC pursuant to paragraph 7.2. Notwithstanding the foregoing, Target shall use its best efforts to discharge all its known liabilities, debts, obligations, and duties before the Effective Time.
1.4. If the dividends and/or other distributions Target has paid through the Effective Time for its current taxable year do not equal or exceed the sum of its (a) “investment company taxable income” (within the meaning of section 852(b)(2)), computed without regard to any deduction for dividends paid, plus (b) “net capital gain” (as defined in section 1222(11)), after reduction by any capital loss carryovers, for that year through that time, then at or as soon as practicable before that time, Target shall declare and pay to its shareholders of record one or more dividends and/or other distributions so that it will have distributed substantially all of that income and gain — and in no event less than the sum of 98% of its “ordinary income” plus 98.2%
B-3
of its “capital gain net income,” as those terms are defined in section 4982(e)(1) and (2), respectively — for all federal income and excise tax periods ending at or before the Effective Time, and treating its current taxable year as ending at that time, such that Target will have no tax liability under sections 852 or 4982 for the current and any prior tax periods.
1.5. At the Effective Time (or as soon thereafter as is reasonably practicable), Target shall distribute the Acquiring Portfolio Shares it receives pursuant to paragraph 1.1(a) to the separate accounts for which AXA Equitable holds Target Shares, and Other Shareholders, of record at the Effective Time (each, a “Shareholder”), in proportion to their Target Shares then so held and in constructive exchange therefor, and shall completely liquidate. That distribution shall be accomplished by EQAT’s transfer agent’s opening accounts on Acquiring Portfolio’s shareholder records in the names of the Shareholders (except Shareholders in whose names accounts thereon already exist) and transferring those Acquiring Portfolio Shares to those newly opened and existing accounts. Pursuant to that transfer, each Shareholder’s account shall be credited with the respective pro rata number of full and fractional Acquiring Portfolio Shares due that Shareholder, by class (i.e., the account for each Shareholder that holds Class A Target Shares shall be credited with the respective pro rata number of full and fractional Class IA Acquiring Portfolio Shares due that Shareholder, the account for each Shareholder that holds Class B Target Shares shall be credited with the respective pro rata number of full and fractional Class IB Acquiring Portfolio Shares due that Shareholder, and the account for each Shareholder that holds Class K Target Shares shall be credited with the respective pro rata number of full and fractional Class K Acquiring Portfolio Shares due that Shareholder). The aggregate NAV of Acquiring Portfolio Shares of each class to be so credited to each Shareholder’s account shall equal the aggregate NAV of the Target Shares of the corresponding class that Shareholder holds at the Effective Time. All issued and outstanding Target Shares, including any represented by certificates, shall simultaneously be canceled on Target’s shareholder records. EQAT shall not issue certificates representing the Acquiring Portfolio Shares issued in connection with the Reorganization.
1.6. Any transfer taxes payable on issuance and transfer of Acquiring Portfolio Shares in a name other than that of the registered holder on Target’s shareholder records of the Target Shares actually or constructively exchanged therefor shall be paid by the transferee thereof, as a condition of that issuance and transfer.
1.7. After the Effective Time, Target shall not conduct any business except in connection with its termination. As soon as reasonably practicable after distribution of the Acquiring Portfolio Shares pursuant to paragraph 1.5, all actions required to terminate Target as a series of VIP shall be taken — and in all events Target shall have been terminated as such within six months after the Effective Time — and VIP shall make all filings and take all other actions in connection therewith required by applicable law or necessary and proper to effect that termination.
B-4
1.8. Any reporting responsibility of Target to a public authority, including the responsibility for filing regulatory reports, tax returns, and other documents with the Securities and Exchange Commission (“Commission”), any state securities commission, any federal, state, and local tax authorities, and any other relevant regulatory authority, is and shall remain its responsibility up to and including the date on which it is terminated. In furtherance of the foregoing, after the Effective Time, except as otherwise agreed to by the Investment Companies, VIP shall or shall cause its agents to prepare any federal, state, and local tax returns, including any Forms 1099, required to be filed by it with respect to Target’s final taxable year ending with its complete liquidation and for any prior periods or taxable years and shall cause those tax returns and Forms 1099 to be duly filed with the appropriate taxing authorities.
2. VALUATION
2.1. For purposes of paragraph 1.1(a), Target’s net value shall be (a) the value of the Assets computed immediately after the close of regular trading on the New York Stock Exchange and Target’s declaration of dividends and/or other distributions, if any, on the date of the Closing (“Valuation Time”), using the valuation procedures set forth in VIP’s then-current prospectus and statement of additional information (“Pro/SAI”) for Target and valuation procedures established by its Board (collectively, “Valuation Procedures”), less (b) the amount of the Liabilities at the Valuation Time.
2.2. For purposes of paragraph 1.1(a), the NAV per share of each class of Acquiring Portfolio Shares shall be computed at the Valuation Time, using EQAT’s Valuation Procedures.
2.3. All computations pursuant to paragraphs 2.1 and 2.2 shall be made (a) by FMG LLC, in its capacity as each Investment Company’s administrator, or (b) in the case of securities subject to fair valuation, in accordance with the respective Valuation Procedures.
3. CLOSING AND EFFECTIVE TIME
3.1. Unless the Investment Companies agree otherwise, all acts necessary to consummate the Reorganization (“Closing”) shall be deemed to occur simultaneously at the close of business (4:00 p.m., Eastern Time) on , 2014, or a later date as to which they agree (“Effective Time”). If, at or immediately before the Valuation Time, (a) the New York Stock Exchange or another primary trading market for portfolio securities of either Portfolio (each, an “Exchange”) is closed to trading or trading thereon is restricted or (b) trading or the reporting of trading on an Exchange or elsewhere is disrupted, so that, in either Board’s judgment, accurate appraisal of the value of either Portfolio’s net assets and/or the NAV per share of any class of Acquiring Portfolio Shares is impracticable, the date of the Closing (and, therefore, the Valuation Time and the Effective Time) shall be postponed until the first business day on which
B-5
that Exchange is open for regular trading after the day when that trading has been fully resumed and that reporting has been restored. The Closing shall be held at the Investment Companies’ offices or at another place as to which they agree.
3.2. The Investment Companies shall direct the custodian of the Portfolios’ assets to deliver at the Closing a certificate of an authorized officer (“Certificate”) stating that (a) the Assets it holds will be transferred to Acquiring Portfolio at the Effective Time, (b) all necessary taxes in connection with the delivery of the Assets, including all applicable federal and state stock transfer stamps, if any, have been paid or provision for payment has been made, and (c) the information (including adjusted basis and holding period, by lot) concerning the Assets, including all portfolio securities, transferred by Target to Acquiring Portfolio, as reflected on Acquiring Portfolio’s books immediately after the Closing, does or will conform to that information on Target’s books immediately before the Closing.
3.3. VIP shall direct its transfer agent to deliver to EQAT at the Closing a Certificate stating that its records contain (a) the name, address, and taxpayer identification number of each Shareholder, (b) the number of full and fractional shares in each outstanding class of Target Shares each Shareholder owns, and (c) the dividend reinvestment elections, if any, applicable to each Shareholder, all at the Effective Time.
3.4. EQAT shall direct its transfer agent to deliver to VIP (a) at the Closing, a confirmation, or other evidence satisfactory to VIP, that the Acquiring Portfolio Shares to be issued to Target pursuant to paragraph 1.1(a) have been credited to Target’s account on Acquiring Portfolio’s shareholder records and (b) at or as soon as reasonably practicable after the Closing, a Certificate as to the opening of accounts on those records in the names of the Shareholders (except Shareholders in whose names accounts thereon already exist).
3.5. Each Investment Company shall deliver to the other at the Closing (a) a Certificate in form and substance satisfactory to the recipient and dated the Effective Time, to the effect that the representations and warranties it made herein are true and correct at the Effective Time except as they may be affected by the transactions contemplated hereby and (b) bills of sale, checks, assignments, share certificates, receipts, and/or other documents the other Investment Company or its counsel reasonably requests.
4. REPRESENTATIONS AND WARRANTIES
4.1. VIP, on Target’s behalf, represents and warrants to EQAT, on Acquiring Portfolio’s behalf, as follows:
4.1.1. VIP (a) is a statutory trust that is duly organized, validly existing, and in good standing under the laws of the State of Delaware (a “Delaware Statutory
B-6
Trust”), and its Certificate of Trust has been duly filed in the office of the Secretary of State thereof, (b) is duly registered under the 1940 Act as an open-end management investment company, which registration is in full force and effect, and (c) has the power to own all its properties and assets and to carry on its business described in its current registration statement on Form N-1A;
4.1.2. Target is a duly established and designated series of VIP;
4.1.3. The execution, delivery, and performance hereof have been duly authorized at the date hereof by all necessary action on the part of VIP’s Board, which has made the determinations required by Rule 17a-8(a) under the 1940 Act; and this Agreement constitutes a valid and legally binding obligation of VIP, with respect to Target, enforceable in accordance with its terms, except as they may be limited by bankruptcy, insolvency, fraudulent transfer, reorganization, receivership, moratorium, and similar laws affecting the rights and remedies of creditors generally and by general principles of equity;
4.1.4. At the Effective Time, VIP, on Target’s behalf, will have good and marketable title to the Assets and full right, power, and authority to sell, assign, transfer, and deliver the Assets hereunder free of any liens or other encumbrances (except securities that are subject to “securities loans,” as referred to in section 851(b)(2), or are restricted to resale by their terms); and on delivery and payment for the Assets, EQAT, on Acquiring Portfolio’s behalf, will acquire good and marketable title thereto, subject to no restrictions on the full transfer thereof, including restrictions that might arise under the Securities Act of 1933, as amended (“1933 Act”);
4.1.5. VIP, with respect to Target, is not currently engaged in, and its execution, delivery, and performance hereof and consummation of the Reorganization will not result in, (a) a conflict with or material violation of any provision of Delaware law, VIP’s Agreement and Declaration of Trust (“VIP Declaration”) or Bylaws, or any agreement, indenture, instrument, contract, lease, or other undertaking (each, an “Undertaking”) to which VIP, with respect to Target or on its behalf, is a party or by which it is bound or (b) the acceleration of any obligation, or the imposition of any penalty, under any Undertaking, judgment, or decree to which VIP, with respect to Target or on its behalf, is a party or by which it is bound;
4.1.6. At or before the Effective Time, either (a) all material contracts and other commitments of or applicable to Target (other than this Agreement and certain investment contracts, including options, futures, forward contracts, and swap agreements) will terminate or (b) provision for discharge, and/or Acquiring Portfolio’s assumption, of any liabilities of Target thereunder will be made, without either Portfolio’s incurring any liability or penalty with respect thereto and without diminishing or releasing any rights VIP, on Target’s behalf, may have had with respect to actions taken or omitted or to be taken by any other party thereto before the Closing;
B-7
4.1.7. No litigation, administrative proceeding, action, or investigation of or before any court, governmental body, or arbitrator is presently pending or, to VIP’s knowledge, threatened against VIP, with respect to Target or any of its properties or assets attributable or allocable to Target, that, if adversely determined, would materially and adversely affect Target’s financial condition or the conduct of its business; and VIP, on Target’s behalf, knows of no facts that might form the basis for the institution of any such litigation, proceeding, action, or investigation and is not a party to or subject to the provisions of any order, decree, judgment, or award of any court, governmental body, or arbitrator that materially and adversely affects Target’s business or VIP’s ability to consummate the transactions contemplated hereby;
4.1.8. Target’s Statement of Assets and Liabilities, Portfolio of Investments, Statement of Operations, and Statement of Changes in Net Assets (each, a “Statement”) at and for the fiscal year (in the case of the last Statement, for the two fiscal years) ended December 31, 2013, have been audited by PricewaterhouseCoopers LLP, an independent registered public accounting firm, and are in accordance with generally accepted accounting principles consistently applied in the United States (“GAAP”); those Statements (copies of which VIP has furnished to EQAT) present fairly, in all material respects, Target’s financial condition at that date in accordance with GAAP and the results of its operations and changes in its net assets for the period(s) then ended; and, to VIP’s management’s best knowledge and belief, there are no known contingent liabilities of Target Portfolio required to be reflected on a balance sheet (including the notes thereto) in accordance with GAAP at that date that are not disclosed therein;
4.1.9. Since December 31, 2013, there has not been any material adverse change in Target’s financial condition, assets, liabilities, or business, other than changes occurring in the ordinary course of business, or any incurrence by Target of indebtedness maturing more than one year from the date that indebtedness was incurred; for purposes of this representation and warranty, a decline in Target’s NAV due to declines in market values of securities Target holds, the discharge of Target’s liabilities, or the redemption of Target Shares by its shareholders will not constitute a material adverse change;
4.1.10. All federal, state, and local tax returns, dividend reporting forms, and other tax-related reports (collectively, “Returns”) of Target required by law to have been filed by the Effective Time (including any properly and timely filed extensions of time to file) will have been timely filed and are or will be correct in all material respects, and all federal and other taxes shown as due or required to be shown as due on those Returns will have been paid or provision will have been made for the payment thereof (except for amounts that alone or in the aggregate would not reasonably be expected to have a material adverse effect); to the best of VIP’s knowledge, no such Return is currently under audit and no
B-8
assessment has been asserted with respect to those Returns; and Target (a) is in compliance in all material respects with all applicable Regulations pertaining to (1) the reporting of dividends and other distributions on and redemptions of its shares, (2) withholding in respect thereof, and (3) shareholder basis reporting, (b) has withheld in respect of dividends and other distributions and paid to the proper taxing authorities all taxes required to be withheld, and (c) is not liable for any material penalties that could be imposed thereunder;
4.1.11. Target is not classified as a partnership, and instead is classified as an association that is taxable as a corporation, for federal tax purposes and either has elected the latter classification by filing Form 8832 with the Internal Revenue Service (“IRS”) or is a “publicly traded partnership” (as defined in section 7704(b)) that is treated as a corporation; Target is an “investment company” (as defined in section 368(a)(2)(F)(iii)) and a “fund” (as defined in section 851(g)(2), eligible for treatment under section 851(g)(1)); Target has elected to be a “regulated investment company” under Part I of Subchapter M of Chapter 1 of Subtitle A of the Code (“Subchapter M”) (“RIC”); for each taxable year of its operation (including the taxable year that will end at the Effective Time (“current year”)), Target has met (and for the current year will meet) the requirements of Subchapter M for qualification and treatment as a RIC and has been (and for the current year will be) eligible to and has computed (and for the current year will compute) its federal income tax under section 852; and Target has no earnings and profits accumulated in any taxable year in which the provisions of Subchapter M did not apply to it;
4.1.12. Target is in the same line of business as Acquiring Portfolio is in, for purposes of section 1.368-1(d)(2) of the Regulations, and did not enter into that line of business as part of the plan of reorganization; from the time VIP’s Board approved the transactions contemplated hereby (“Approval Time”) through the Effective Time, Target has invested and will invest its assets in a manner that ensures its compliance with the foregoing and paragraph 4.1.11; from the time it commenced operations through the Effective Time, Target has conducted and will conduct its “historic business” (within the meaning of that section) in a substantially unchanged manner; from the Approval Time through the Effective Time, Target has not changed, and will not change, its historic investment policies in connection with the Reorganization; and VIP believes, based on its review of each Portfolio’s investment portfolio, that Target’s portfolio holdings are generally consistent and compatible with Acquiring Portfolio’s investment objective and policies and that, as a result, a large majority of Target’s assets can be transferred to and held by Acquiring Portfolio;
4.1.13. At the Effective Time, (a) at least 33 1/3% of Target’s portfolio assets will meet Acquiring Portfolio’s investment objective, strategies, policies, risks, and restrictions (collectively, “Investment Criteria”), (b) Target will not have altered its portfolio in connection with the Reorganization to meet that 33 1/3% threshold, and (c) Target will not have modified any of its Investment Criteria as part of the plan of reorganization, for purposes of section 1.368-1(d)(2) of the Regulations;
B-9
4.1.14. To the best of VIP’s management’s knowledge, there is no plan or intention by its shareholders to redeem, sell, exchange, or otherwise dispose of a number of Target Shares (or Acquiring Portfolio Shares to be received in the Reorganization), in connection with the Reorganization, that would reduce their ownership of the Target Shares (or the equivalent Acquiring Portfolio Shares) to a number of shares that is less than 50% of the current number of Target Shares outstanding;
4.1.15. During the five-year period ending at the Effective Time, neither Target nor any person “related” (within the meaning of section 1.368-1(e)(4) of the Regulations (“Related”) without regard to section 1.368-1(e)(4)(i)(A) thereof) to it will have (a) acquired Target Shares with consideration other than Acquiring Portfolio Shares or Target Shares, except for shares redeemed in the ordinary course of Target’s business as a series of an open-end investment company pursuant to section 22(e) of the 1940 Act, or (b) made distributions with respect to Target Shares except for (1) normal, regular dividend distributions made pursuant to Target’s historic dividend-paying practice and (2) other dividends and distributions declared and paid to ensure Target’s continuing qualification as a RIC and to avoid the imposition of fund-level tax;
4.1.16. All issued and outstanding Target Shares are, and at the Effective Time will be, duly and validly issued and outstanding, fully paid, and non-assessable by VIP and have been offered and sold in every state and the District of Columbia in compliance in all material respects with applicable registration requirements of the 1933 Act and state securities laws; all issued and outstanding Target Shares will, at the Effective Time, be held by the persons and in the amounts set forth on Target’s shareholder records (as provided in the Certificate to be delivered pursuant to paragraph 3.3); and Target does not have outstanding any options, warrants, or other rights to subscribe for or purchase any Target Shares, nor are there outstanding any securities convertible into any Target Shares;
4.1.17. Target incurred the Liabilities, which are associated with the Assets, in the ordinary course of its business;
4.1.18. Target is not under the jurisdiction of a court in a “title 11 or similar case” (as defined in section 368(a)(3)(A));
4.1.19. Not more than 25% of the value of Target’s total assets (excluding cash, cash items, and Government securities) is invested in the stock and securities of any one issuer, and not more than 50% of the value of those assets is invested in the stock and securities of five or fewer issuers;
4.1.20. On the effective date of the Registration Statement (as defined in paragraph 4.3.1), at the time of the Shareholders Meeting (as defined in paragraph 5.2), and at the Effective Time, VIP’s Pro/SAI including Target will (a) conform in all material respects to the applicable requirements of the 1933 Act and the 1940 Act and the rules and regulations of the Commission thereunder
B-10
and (b) not contain any untrue statement of a material fact or omit to state a material fact required to be stated therein or necessary to make the statements therein, in light of the circumstances under which they were made, not misleading;
4.1.21. The information to be furnished by VIP for use in no-action letters, applications for orders, the Registration Statement, and other documents filed or to be filed with any federal, state, or local regulatory authority (including the Financial Industry Regulatory Authority, Inc. (“FINRA”)) that may be necessary in connection with the transactions contemplated hereby will be accurate and complete in all material respects, will comply in all material respects with federal securities laws and other laws and regulations, and will not contain any untrue statement of a material fact or omit to state a material fact required to be stated therein or necessary to make the statements therein, in light of the circumstances under which they were made, not misleading;
4.1.22. The Acquiring Portfolio Shares to be delivered to Target hereunder are not being acquired for the purpose of making any distribution thereof, other than in accordance with the terms hereof; and
4.1.23. The VIP Declaration permits VIP to vary its shareholders’ investment. VIP does not have a fixed pool of assets — each series thereof (including Target) is a managed portfolio of securities, and FMG LLC and each investment sub-adviser thereof have the authority to buy and sell securities for it.
4.2. EQAT, on Acquiring Portfolio’s behalf, represents and warrants to VIP, on Target’s behalf, as follows:
4.2.1. EQAT (a) is a Delaware Statutory Trust, and its Certificate of Trust has been duly filed in the office of the Secretary of State of Delaware, (b) is duly registered under the 1940 Act as an open-end management investment company, which registration is in full force and effect, and (c) has the power to own all its properties and assets and to carry on its business described in its current registration statement on Form N-1A;
4.2.2. Acquiring Portfolio is a duly established and designated series of EQAT;
4.2.3. The execution, delivery, and performance hereof have been duly authorized at the date hereof by all necessary action on the part of EQAT’s Board, which has made the determinations required by Rule 17a-8(a) under the 1940 Act; and this Agreement constitutes a valid and legally binding obligation of EQAT, with respect to Acquiring Portfolio, enforceable in accordance with its terms, except as they may be limited by bankruptcy, insolvency, fraudulent transfer, reorganization, receivership, moratorium, and similar laws affecting the rights and remedies of creditors generally and general principles of equity;
4.2.4. No consideration other than Acquiring Portfolio Shares (and Acquiring Portfolio’s assumption of the Liabilities) will be issued in exchange for the Assets in the Reorganization;
B-11
4.2.5. EQAT, with respect to Acquiring Portfolio, is not currently engaged in, and its execution, delivery, and performance hereof and consummation of the Reorganization will not result in, (a) a conflict with or material violation of any provision of Delaware law, EQAT’s Amended and Restated Declaration of Trust, as amended (“EQAT Declaration”), or Bylaws, or any Undertaking to which EQAT, with respect to Acquiring Portfolio or on its behalf, is a party or by which it is bound or (b) the acceleration of any obligation, or the imposition of any penalty, under any Undertaking, judgment, or decree to which EQAT, with respect to Acquiring Portfolio or on its behalf, is a party or by which it is bound;
4.2.6. No litigation, administrative proceeding, action, or investigation of or before any court, governmental body, or arbitrator is presently pending or, to EQAT’s knowledge, threatened against EQAT, with respect to Acquiring Portfolio or any of its properties or assets attributable or allocable to Acquiring Portfolio, that, if adversely determined, would materially and adversely affect Acquiring Portfolio’s financial condition or the conduct of its business; and EQAT, on Acquiring Portfolio’s behalf, knows of no facts that might form the basis for the institution of any such litigation, proceeding, action, or investigation and is not a party to or subject to the provisions of any order, decree, judgment, or award of any court, governmental body, or arbitrator that materially and adversely affects Acquiring Portfolio’s business or EQAT’s ability to consummate the transactions contemplated hereby;
4.2.7. Acquiring Portfolio’s Statements at and for the fiscal year (in the case of the Statement of Changes in Net Assets, for the two fiscal years) ended December 31, 2013, have been audited by PwC and are in accordance with GAAP; those Statements (copies of which EQAT has furnished to VIP) present fairly, in all material respects, Acquiring Portfolio’s financial condition at that date in accordance with GAAP and the results of its operations and changes in its net assets for the period(s) then ended; and, to EQAT’s management’s best knowledge and belief, there are no known contingent liabilities of Acquiring Portfolio required to be reflected on a balance sheet (including the notes thereto) in accordance with GAAP at that date that are not disclosed therein;
4.2.8. Since December 31, 2013, there has not been any material adverse change in Acquiring Portfolio’s financial condition, assets, liabilities, or business, other than changes occurring in the ordinary course of business, or any incurrence by Acquiring Portfolio of indebtedness maturing more than one year from the date that indebtedness was incurred; for purposes of this representation and warranty, a decline in Acquiring Portfolio’s NAV due to declines in market values of securities Acquiring Portfolio holds, the discharge of Acquiring Portfolio’s liabilities, or the redemption of Acquiring Portfolio Shares by its shareholders will not constitute a material adverse change;
B-12
4.2.9. All Returns of Acquiring Portfolio required by law to have been filed by the Effective Time (including any properly and timely filed extensions of time to file) will have been timely filed and are or will be correct in all material respects, and all federal and other taxes shown as due or required to be shown as due on those Returns will have been paid or provision will have been made for the payment thereof except for amounts that alone or in the aggregate would not reasonably be expected to have a material adverse effect; to the best of EQAT’s knowledge, no such Return is currently under audit and no assessment has been asserted with respect to those Returns; and Acquiring Portfolio (a) is in compliance in all material respects with all applicable Regulations pertaining to (1) the reporting of dividends and other distributions on and redemptions of its shares, (2) withholding in respect thereof, and (3) shareholder basis reporting, (b) has withheld in respect of dividends and other distributions and paid to the proper taxing authorities all taxes required to be withheld, and (c) is not liable for any material penalties that could be imposed thereunder;
4.2.10. Acquiring Portfolio is not classified as a partnership, and instead is classified as an association that is taxable as a corporation, for federal tax purposes and either has elected the latter classification by filing Form 8832 with the IRS or is a “publicly traded partnership” (as defined in section 7704(b)) that is treated as a corporation; Acquiring Portfolio is an “investment company” (as defined in section 368(a)(2)(F)(iii)) and a “fund” (as defined in section 851(g)(2), eligible for treatment under section 851(g)(1)); Acquiring Portfolio has elected to be a RIC; for each taxable year of its operation (including the taxable year that includes the Effective Time (“current year”)), Acquiring Portfolio has met (and for the current year will meet) the requirements of Subchapter M for qualification and treatment as a RIC and has been (and for the current year will be) eligible to and has computed (and for the current year will compute) its federal income tax under section 852; Acquiring Portfolio will continue to meet all those requirements for the current year and intends to continue to do so, and to continue to be eligible to and to so compute its federal income tax, for succeeding taxable years; and Acquiring Portfolio has no earnings and profits accumulated in any taxable year in which the provisions of Subchapter M did not apply to it;
4.2.11. Acquiring Portfolio is in the same line of business as Target was in preceding the Reorganization, for purposes of section 1.368-1(d)(2) of the Regulations, and did not enter into that line of business as part of the plan of reorganization; and following the Reorganization, Acquiring Portfolio will continue, and has no plan or intention to change, that line of business;
4.2.12. At the Effective Time, Acquiring Portfolio (1) will not have modified any of its Investment Criteria as part of the plan of reorganization and (2) will not have any plan or intention to change any of its Investment Criteria after the Reorganization;
4.2.13. Following the Reorganization, Acquiring Portfolio will (a) continue Target’s “historic business” (within the meaning of section 1.368-1(d)(2) of the
B-13
Regulations) and (b) use a significant portion of Target’s “historic business assets” (within the meaning of section 1.368-1(d)(3) of the Regulations) in a business; moreover, Acquiring Portfolio (c) has no plan or intention to sell or otherwise dispose of a significant part of the Assets, except for dispositions made in the ordinary course of that business and dispositions necessary to maintain its status as a RIC, and (d) expects to retain substantially all the Assets in the same form as it receives them in the Reorganization, unless and until subsequent investment circumstances suggest the desirability of change or it becomes necessary to make dispositions thereof to maintain that status; and EQAT believes, based on its review of each Portfolio’s investment portfolio, that Target’s portfolio holdings are generally consistent and compatible with Acquiring Portfolio’s investment objective and policies and that, as a result, a large majority of Target’s assets can be transferred to and held by Acquiring Portfolio;
4.2.14. Acquiring Portfolio does not directly or indirectly own, nor at the Effective Time will it directly or indirectly own, nor has it directly or indirectly owned at any time during the past five years, any Target Shares;
4.2.15. Acquiring Portfolio has no plan or intention to issue additional Acquiring Portfolio Shares following the Reorganization except for shares issued in the ordinary course of its business as a series of an open-end investment company; nor will Acquiring Portfolio, or any person Related to it, have any plan or intention at the Effective Time to acquire or redeem any Acquiring Portfolio Shares issued in the Reorganization — either directly or through any transaction, agreement, or arrangement with any other person — except for redemptions Acquiring Portfolio will make as such a series pursuant to section 22(e) of the 1940 Act;
4.2.16. Before or in the Reorganization, neither Acquiring Portfolio nor any person Related to it will have acquired, directly or through any transaction, agreement, or arrangement with any other person, Target Shares with consideration other than Acquiring Portfolio Shares;
4.2.17. Acquiring Portfolio is not under the jurisdiction of a court in a “title 11 or similar case” (as defined in section 368(a)(3)(A));
4.2.18. There is no plan or intention for Acquiring Portfolio to be terminated, dissolved, or merged into another statutory or business trust or a corporation or any “fund” thereof (as defined in section 851(g)(2)) following the Reorganization;
4.2.19. Assuming the truthfulness and correctness of VIP’s representation and warranty in paragraph 4.1.19, immediately after the Reorganization (a) not more than 25% of the value of Acquiring Portfolio’s total assets (excluding cash, cash items, and Government securities) will be invested in the stock and securities of any one issuer and (b) not more than 50% of the value of those assets will be invested in the stock and securities of five or fewer issuers;
B-14
4.2.20. All issued and outstanding Acquiring Portfolio Shares are, and at the Effective Time will be, duly and validly issued and outstanding, fully paid, and non-assessable by EQAT and have been offered and sold in every state and the District of Columbia in compliance in all material respects with applicable registration requirements of the 1933 Act and state securities laws; Acquiring Portfolio does not have outstanding any options, warrants, or other rights to subscribe for or purchase any Acquiring Portfolio Shares, nor are there outstanding any securities convertible into any Acquiring Portfolio Shares; and the Acquiring Portfolio Shares to be issued and delivered to Target, for the Shareholders’ accounts, pursuant to the terms hereof, (a) will have been duly authorized by EQAT and duly registered under the federal securities laws (and appropriate notices respecting them will have been duly filed under applicable state securities laws) at the Effective Time and (b) when so issued and delivered, will be duly and validly issued and outstanding Acquiring Portfolio Shares, fully paid and non-assessable by EQAT;
4.2.21. On the effective date of the Registration Statement, at the time of the Shareholders Meeting, and at the Effective Time, (a) EQAT’s Pro/SAI including Acquiring Portfolio will conform in all material respects to the applicable requirements of the 1933 Act and the 1940 Act and the rules and regulations of the Commission thereunder and (b) that Pro/SAI and the prospectus included in the Registration Statement will not include any untrue statement of a material fact or omit to state a material fact required to be stated therein or necessary to make the statements therein, in light of the circumstances under which they were made, not misleading; provided that the foregoing will not apply to statements in or omissions from that prospectus made in reliance on and in conformity with information furnished by VIP for use therein;
4.2.22. The information to be furnished by EQAT for use in no-action letters, applications for orders, the Registration Statement, and other documents filed or to be filed with any federal, state, or local regulatory authority (including FINRA) that may be necessary in connection with the transactions contemplated hereby will be accurate and complete in all material respects, will comply in all material respects with federal securities laws and other laws and regulations, and will not contain any untrue statement of a material fact or omit to state a material fact required to be stated therein or necessary to make the statements therein, in light of the circumstances under which they were made, not misleading; and
4.2.23. The EQAT Declaration permits EQAT to vary its shareholders’ investment. EQAT does not have a fixed pool of assets — each series thereof (including Acquiring Portfolio) is a managed portfolio of securities, and FMG LLC and each investment sub-adviser thereof have the authority to buy and sell securities for it.
B-15
4.3. Each Investment Company, on its Portfolio’s behalf, represents and warrants to the other Investment Company, on its Portfolio’s behalf, as follows:
4.3.1. No governmental consents, approvals, or authorizations (collectively, “consents”) or filings are required under the 1933 Act, the Securities Exchange Act of 1934, as amended, the 1940 Act, or state securities laws, and no consents or orders of any court are required, for its execution, delivery, and performance hereof on its Portfolio’s behalf, except for (a) EQAT’s filing with the Commission of a registration statement on Form N-14 relating to the Acquiring Portfolio Shares issuable hereunder, and any supplement or amendment thereto, including therein a prospectus and proxy statement (“Registration Statement”), and a post-effective amendment to EQAT’s registration statement on Form N-1A and (b) consents, filings, and orders that have been made or received or may be required after the Effective Time;
4.3.2. The fair market value of the Acquiring Portfolio Shares each Shareholder receives will be approximately equal to the fair market value of its Target Shares it actually or constructively surrenders in exchange therefor;
4.3.3. Its management (a) is unaware of any plan or intention of Shareholders to redeem, sell, or otherwise dispose of (1) any portion of their Target Shares before the Reorganization to any person Related to either Portfolio or (2) any portion of the Acquiring Portfolio Shares they receive in the Reorganization to any person Related to Acquiring Portfolio, (b) does not anticipate dispositions of those Acquiring Portfolio Shares at the time of or soon after the Reorganization to exceed the usual rate and frequency of dispositions of shares in Target as a series of an open-end investment company, (c) expects that the percentage of shareholder interests, if any, that will be disposed of as a result, or at the time, of the Reorganization will be de minimis, and (d) does not anticipate that there will be extraordinary redemptions of Acquiring Portfolio Shares immediately following the Reorganization;
4.3.4. Target’s shareholders will pay their own expenses (such as fees of personal investment or tax advisers for advice regarding the Reorganization), if any, incurred in connection with the Reorganization;
4.3.5. The fair market value and “adjusted basis” (within the meaning of section 1011) of the Assets will equal or exceed the Liabilities to be assumed by Acquiring Portfolio and those to which the Assets are subject;
4.3.6. At the Effective Time, there will be no intercompany indebtedness existing between the Portfolios that was issued, acquired, or settled at a discount;
4.3.7. Pursuant to the Reorganization, Target will transfer to Acquiring Portfolio, and Acquiring Portfolio will acquire, at least 90% of the fair market value of the net assets, and at least 70% of the fair market value of the gross assets, Target held immediately before the Reorganization. For the purposes of this representation and warranty, any amounts Target uses to pay its Reorganization
B-16
expenses and to make redemptions and distributions immediately before the Reorganization (except (a) redemptions pursuant to section 22(e) of the 1940 Act and (b) dividends and other distributions declared and paid to ensure Target’s continuing qualification as a RIC and to avoid the imposition of fund-level tax) will be included as assets it held immediately before the Reorganization;
4.3.8. None of the compensation AXA Equitable or any affiliate thereof receives as a service provider to Target will be separate consideration for, or allocable to, any of the Target Shares that AXA Equitable (on any Shareholder’s behalf) holds; none of the Acquiring Portfolio Shares AXA Equitable (on any Shareholder’s behalf) receives in the Reorganization will be separate consideration for, or allocable to, any employment agreement, investment advisory agreement, or other service agreement; and the compensation paid to AXA Equitable or any affiliate thereof will be for services actually rendered and will be commensurate with amounts paid to third parties bargaining at arm’s-length for similar services;
4.3.9. Immediately after the Reorganization, AXA Equitable (through its separate accounts) will own shares constituting “control” (within the meaning of section 368(a)(2)(H)(i), i.e., as defined in section 304(c)) of Acquiring Portfolio;
4.3.10. No expenses incurred by Target or on its behalf in connection with the Reorganization will be paid or assumed by Acquiring Portfolio, AXA Equitable or any affiliate thereof (including FMG LLC), or any other third party unless those expenses are solely and directly related to the Reorganization (determined in accordance with the guidelines set forth in Rev. Rul. 73-54, 1973-1 C.B. 187) (“Reorganization Expenses”), and no cash or property other than Acquiring Portfolio Shares will be transferred to Target or any of its shareholders with the intention that such cash or property be used to pay any expenses (even Reorganization Expenses) thereof;
4.3.11. There will be no dissenters to the Reorganization under the applicable provisions of Delaware law, and Acquiring Portfolio will not pay cash in lieu of fractional Acquiring Portfolio Shares in connection with the Reorganization;
4.3.12. The Reorganization is being undertaken for bona fide business purposes (and not a purpose to avoid federal income tax); and
4.3.13. The principal purpose of Acquiring Portfolio’s assumption of the Liabilities is not avoidance of federal income tax on the transaction.
5. COVENANTS
5.1. Each Investment Company covenants to operate its Portfolio’s business in the ordinary course between the date hereof and the Closing, it being understood that:
(a) such ordinary course will include declaring and paying customary dividends and other distributions and changes in operations contemplated by each Portfolio’s normal business activities; and
B-17
(b) each Portfolio will retain exclusive control of the composition of its portfolio until the Closing.
5.2. VIP covenants to call and hold a meeting of Target’s shareholders to consider and act on this Agreement and to take all other action necessary to obtain approval of the transactions contemplated hereby (“Shareholders Meeting”).
5.3. VIP covenants that it will assist EQAT in obtaining information EQAT reasonably requests concerning the beneficial ownership of Target Shares.
5.4. VIP covenants that it will turn over its books and records regarding Target (including all tax books and records and all books and records required to be maintained under the 1940 Act and the rules and regulations thereunder) to EQAT at the Closing.
5.5. Each Investment Company covenants to cooperate with the other in preparing the Registration Statement in compliance with applicable federal and state securities laws.
5.6. Each Investment Company covenants that it will, from time to time, as and when requested by the other Investment Company, execute and deliver or cause to be executed and delivered all assignments and other instruments, and will take or cause to be taken all further action, the other Investment Company deems necessary or desirable in order to vest in, and confirm to, (a) EQAT, on Acquiring Portfolio’s behalf, title to and possession of all the Assets, and (b) VIP, on Target’s behalf, title to and possession of the Acquiring Portfolio Shares to be delivered hereunder, and otherwise to carry out the intent and purpose hereof.
5.7. EQAT covenants to use all reasonable efforts to obtain the consents required by the 1933 Act, the 1940 Act, and applicable state securities laws it deems appropriate to continue Acquiring Portfolio’s operations after the Effective Time.
5.8. VIP covenants to distribute all the Acquiring Portfolio Shares it receives in the Reorganization to the Shareholders in complete liquidation of Target.
5.9. As promptly as practicable, but in any case within sixty days, after the Effective Time, VIP shall furnish to EQAT, in a form reasonably satisfactory to EQAT, a Certificate stating the earnings and profits of Target for federal income tax purposes that will be carried over by Acquiring Portfolio as a result of section 381.
5.10. It is the Investment Companies’ intention that the Reorganization will qualify as a reorganization with the meaning of section 368(a)(1)(D). Neither Investment Company shall take any action or cause any action to be taken (including the filing of any tax return) that is inconsistent with that treatment or results in the failure of the Reorganization to qualify as such a reorganization.
B-18
5.11. Subject to this Agreement, each Investment Company covenants to take or cause to be taken all actions, and to do or cause to be done all things, reasonably necessary, proper, or advisable to consummate and effectuate the transactions contemplated hereby.
6. CONDITIONS PRECEDENT
Each Investment Company’s obligations hereunder shall be subject to (a) the other Investment Company’s performance of all its obligations to be performed hereunder at or before the Closing, (b) all representations and warranties of the other Investment Company contained herein being true and correct in all material respects at the date hereof and, except as they may be affected by the transactions contemplated hereby, at the Effective Time, with the same force and effect as if made at that time, and (c) the following further conditions that, at or before that time:
6.1. This Agreement and the transactions contemplated hereby shall have been duly adopted and approved by both Boards and by Target’s shareholders at the Shareholders Meeting (including any adjournment(s) thereof);
6.2. All necessary filings shall have been made with the Commission and state securities authorities, and no order or directive shall have been received that any other or further action is required to permit the Investment Companies to carry out the transactions contemplated hereby; the Registration Statement shall have become effective under the 1933 Act, no stop orders suspending the effectiveness thereof shall have been issued, and, to each Investment Company’s best knowledge, no investigation or proceeding for that purpose shall have been instituted or shall be pending, threatened, or contemplated under the 1933 Act or the 1940 Act; the Commission shall not have issued an unfavorable report with respect to the Reorganization under section 25(b) of the 1940 Act nor instituted any proceedings seeking to enjoin consummation of the transactions contemplated hereby under section 25(c) of the 1940 Act; and all consents, orders, and permits of federal, state, and local regulatory authorities (including the Commission and state securities authorities) either Investment Company deems necessary to permit consummation, in all material respects, of the transactions contemplated hereby shall have been obtained, except where failure to obtain same would not involve a risk of a material adverse effect on either Portfolio’s assets or properties, provided that either Investment Company may for itself waive any of those conditions;
6.3. At the Effective Time, no action, suit, or other proceeding shall be pending (or, to either Investment Company’s best knowledge, threatened to be commenced) before any court, governmental agency, or arbitrator in which it is sought to enjoin the performance of, restrain, prohibit, affect the enforceability of, or obtain damages or other relief in connection with, the transactions contemplated hereby;
B-19
6.4. The Investment Companies shall have received an opinion of K&L Gates LLP (“Counsel”) as to the federal income tax consequences mentioned below (“Tax Opinion”). In rendering the Tax Opinion, Counsel may rely as to factual matters, exclusively and without independent verification, on the representations and warranties made in this Agreement, which Counsel may treat as representations and warranties made to it (that, notwithstanding paragraph 8, shall survive the Closing), and in separate letters, if Counsel requests, addressed to it (collectively, “Representations”) and the Certificates delivered pursuant to paragraph 3.5(a). The Tax Opinion shall be substantially to the effect that — based on the facts and assumptions stated therein and conditioned on the Representations’ being true and complete at the Effective Time and consummation of the Reorganization in accordance herewith (without the waiver or modification of any terms or conditions hereof and without taking into account any amendment hereof that Counsel has not approved) — for federal income tax purposes:
6.4.1. Target’s transfer of the Assets to Acquiring Portfolio in exchange solely for Acquiring Portfolio Shares and Acquiring Portfolio’s assumption of the Liabilities, followed by Target’s distribution of those shares pro rata to the Shareholders actually or constructively in exchange for their Target Shares and in complete liquidation of Target, will qualify as a “reorganization” (as defined in section 368(a)(1)(D)), and each Portfolio will be “a party to a reorganization” within the meaning of section 368(b);
6.4.2. Target will recognize no gain or loss on the transfer of the Assets to Acquiring Portfolio in exchange solely for Acquiring Portfolio Shares and Acquiring Portfolio’s assumption of the Liabilities or on the subsequent distribution of those shares to the Shareholders in exchange for their Target Shares;
6.4.3. Acquiring Portfolio will recognize no gain or loss on its receipt of the Assets in exchange solely for Acquiring Portfolio Shares and its assumption of the Liabilities;
6.4.4. Acquiring Portfolio’s basis in each Asset will be the same as Target’s basis therein immediately before the Reorganization, and Acquiring Portfolio’s holding period for each Asset will include Target’s holding period therefor (except where Acquiring Portfolio’s investment activities have the effect of reducing or eliminating an Asset’s holding period);
6.4.5. A Shareholder will recognize no gain or loss on the exchange of all its Target Shares solely for Acquiring Portfolio Shares pursuant to the Reorganization; and
6.4.6. A Shareholder’s aggregate basis in the Acquiring Portfolio Shares it receives in the Reorganization will be the same as the aggregate basis in its Target Shares it actually or constructively surrenders in exchange for those Acquiring Portfolio Shares; and its holding period for those Acquiring Portfolio Shares will include, in each instance, its holding period for those Target Shares, provided the Shareholder holds the latter as capital assets at the Effective Time.
B-20
Notwithstanding subparagraphs 6.4.2 and 6.4.4, the Tax Opinion may state that no opinion is expressed as to the effect of the Reorganization on Target with respect to any Asset as to which any unrealized gain or loss is required to be recognized for federal income tax purposes at the end of a taxable year (or on the termination or transfer thereof) under a mark-to-market system of accounting;
6.5. EQAT, on Acquiring Portfolio’s behalf, shall have executed and delivered at or before the Closing a Certificate confirming that EQAT, on Acquiring Portfolio’s behalf, assumes all of the Liabilities; and
6.6. At any time before the Closing, either Investment Company may waive any of the foregoing conditions (except those set forth in paragraphs 6.1 and 6.4) if, in the judgment of its Board, that waiver will not have a material adverse effect on its Portfolio’s shareholders’ interests.
7. BROKERAGE FEES AND EXPENSES
7.1. Each Investment Company represents and warrants to the other that there are no brokers or finders entitled to receive any payments in connection with the transactions provided for herein.
7.2. Subject to satisfaction of the representation contained in paragraph 4.3.10, the sum of the Reorganization Expenses described in the following sentence for all the Reorganizations (collectively, “Identified Expenses”), up to an aggregate maximum of $325,000, shall be borne by all the Targets in proportion to their respective NAVs at the Valuation Time, with any Identified Expenses in excess of that amount borne solely by FMG LLC. Identified Expenses consist of the following: (1) costs associated with obtaining any necessary order of exemption from the 1940 Act, preparing the Registration Statement, and printing and distributing each Acquiring Portfolio’s prospectus and each Target’s proxy materials, (2) legal and accounting fees in connection with the Reorganizations, and (3) expenses of holding the Shareholders Meeting (including any adjournment or postponement thereof). Notwithstanding the foregoing, (a) FMG LLC shall not bear any brokerage or similar expenses incurred by or for the benefit of any Portfolio in connection with the Reorganizations, (b) all expenses other than Identified Expenses shall be borne by the Portfolio that directly incurs them, and (c) expenses shall be paid by the Portfolio directly incurring them if and to the extent that the payment thereof by another person would result in that Portfolio’s disqualification as a RIC or would prevent the Reorganization in which it participates from qualifying as a tax-free reorganization.
8. ENTIRE AGREEMENT; NO SURVIVAL
Neither Investment Company has made any representation, warranty, or covenant not set forth herein, and this Agreement constitutes the entire agreement between the Investment Companies. The representations, warranties, and covenants contained herein or in any document delivered pursuant hereto or in connection herewith shall not survive the Closing (except to the extent provided in paragraph 6.4).
B-21
9. TERMINATION OF AGREEMENT
This Agreement may be terminated at any time at or before the Closing:
9.1. By either Investment Company (a) in the event of the other Investment Company’s material breach of any representation, warranty, or covenant contained herein to be performed at or before the Closing, (b) if a condition to its obligations has not been met and it reasonably appears that that condition will not or cannot be met, (c) if a governmental body issues an order, decree, or ruling having the effect of permanently enjoining, restraining, or otherwise prohibiting consummation of the Reorganization, or (d) if the Closing has not occurred on or before , 2014, or another date to which the Investment Companies agree; or
9.2. By the Investment Companies’ mutual agreement.
In the event of termination under paragraphs 9.1(c) or (d) or 9.2, neither Investment Company (nor its trustees, officers, or shareholders) shall have any liability to the other Investment Company.
10. AMENDMENTS
The Investment Companies may amend, modify, or supplement this Agreement at any time in any manner they mutually agree on in writing, notwithstanding Target’s shareholders’ approval hereof; provided that, following that approval, no such amendment, modification, or supplement shall have a material adverse effect on the Shareholders’ interests.
11. MISCELLANEOUS
11.1. This Agreement shall be governed by and construed in accordance with the internal laws of the State of Delaware, without giving effect to principles of conflicts of laws; provided that, in the case of any conflict between those laws and the federal securities laws, the latter shall govern.
11.2. Nothing expressed or implied herein is intended or shall be construed to confer on or give any person, firm, trust, or corporation other than each Investment Company, on its Portfolio’s behalf, and their respective successors and assigns any rights or remedies under or by reason hereof.
11.3 Notice is hereby given that this instrument is executed and delivered on behalf of each Investment Company’s trustees solely in their capacities as trustees, and not individually, and that each Investment Company’s obligations under this instrument are not binding on or enforceable against any of its trustees, officers, shareholders, or series other than its Portfolio but are only binding on and enforceable against its property attributable to and held for the benefit of its Portfolio (“Portfolio’s
B-22
Property”) and not its property attributable to and held for the benefit of any other series thereof. Each Investment Company, in asserting any rights or claims hereunder on its or its Portfolio’s behalf, shall look only to the other Portfolio’s Property in settlement of those rights or claims and not to the property of any other series of the other Investment Company or to those trustees, officers, or shareholders.
11.4 Any term or provision hereof that is invalid or unenforceable in any jurisdiction shall, as to that jurisdiction, be ineffective to the extent of that invalidity or unenforceability without rendering invalid or unenforceable the remaining terms and provisions hereof or affecting the validity or enforceability of any of the terms and provisions hereof in any other jurisdiction.
11.5. This Agreement may be executed in one or more counterparts, all of which shall be considered one and the same agreement, and shall become effective when one or more counterparts have been executed by each Investment Company and delivered to the other Investment Company. The headings contained herein are for reference purposes only and shall not affect in any way the meaning or interpretation hereof.
[Signatures on following page]
B-23
IN WITNESS WHEREOF, each party has caused this Agreement to be executed and delivered by its duly authorized officer as of the day and year first written above.
| EQ ADVISORS TRUST, on behalf of its series listed on Schedule A | ||
| By: |
| |
| Name: | Steven M. Joenk | |
| Title: | President and Chief Executive Officer | |
| AXA PREMIER VIP TRUST, on behalf of its series listed on Schedule A | ||
| By: |
| |
| Name: | Brian E. Walsh | |
| Title: | Chief Financial Officer | |
B-24
SCHEDULE A
TARGETS | ACQUIRING PORTFOLIOS | |
| (series of VIP) | (series of EQAT) | |
| Multimanager Large Cap Core Portfolio | EQ/Large Cap Core PLUS Portfolio | |
| Multimanager Large Cap Value Portfolio | EQ/Large Cap Value PLUS Portfolio | |
| Multimanager International Equity Portfolio | EQ/International Core PLUS Portfolio | |
B-25
More Information on Strategies and Risk Factors
Strategies
Changes in Investment Objectives and Principal Investment Strategies
Each Portfolio has its own investment objective(s), policies and strategies. There is no assurance that a Portfolio will achieve its investment objective. The investment objective of each Portfolio may be changed without prior notice or shareholder approval. All investment policies and strategies that are not specifically designated as fundamental also may be changed without prior notice or shareholder approval. In addition, to the extent a Portfolio is new or is undergoing a transition (such as a rebalancing or experiencing large inflows or outflows) or takes a temporary defense position, it may not be pursuing its investment objective or executing its principal investment strategies.
80% Policies
Each of the Portfolios (except the EQ/International Core PLUS Portfolio) has a policy that it will invest at least 80% of its net assets, plus borrowings for investment purposes, in a particular type of investment connoted by its name. Each such policy is subject to change only upon at least sixty (60) days’ prior notice to shareholders of the affected Portfolio.
Indexing Strategies
One or more Index Allocated Portions of the Portfolios seeks to track the total return performance (before fees and expenses) of a particular index. The following provides additional information regarding the management strategies employed by the sub-advisers of these Index Allocated Portions in pursuing these objectives. The sub-adviser to an Index Allocated Portion does not utilize customary economic, financial or market analyses or other traditional investment techniques to manage the portion. Rather, the sub-adviser may employ a full replication technique or sampling technique in seeking to track the total return performance (before fees and expenses) of the index. A full replication technique generally involves holding each security in a particular index in approximately the same weight that the security represents in the index. Conversely, a sampling technique strives to match the characteristics of a particular index without having to purchase every stock in that index by selecting a representative sample of securities for the Index Allocated Portion based on the characteristics of the index and the particular securities included therein. Such characteristics may include, with respect to equity indexes, industry weightings, market capitalizations and fundamental characteristics and, with respect to fixed income indexes, interest rate sensitivity, credit quality and sector diversification.
C-1
Allocation Strategies
The Manager generally allocates a Portfolio’s assets among multiple sub-advisers each of which manages its portion of a Portfolio using different yet complementary investment strategies. The following provides additional information regarding the allocation of those Portfolios’ assets among their distinct portions.
EQ/Large Cap Core PLUS, EQ/Large Cap Value PLUS, and EQ/International Core PLUS Portfolios
Each allocation percentage for each Portfolio is an asset allocation target established by FMG LLC to achieve the Portfolio’s investment objective and may be changed without shareholder approval. Actual allocations among the distinct portions of a Portfolio may vary from the amounts shown above by up to 15% of the Portfolio’s net assets. Each portion of a Portfolio may deviate temporarily from its asset allocation target for defensive purposes, in response to large inflows or outflows of assets to and from the Portfolio (e.g., in connection with asset allocation rebalancing transactions, reorganization transactions and separate account substitution transactions), or as a result of appreciation or depreciation of its holdings. FMG LLC rebalances each portion of the Portfolio as it deems appropriate. To the extent that a Portfolio is being rebalanced, experiences large inflows or outflows, or takes a temporary defensive position, it may not be pursuing its investment goal or executing its principal investment strategy.
Multimanager Aggressive Equity, Multimanager Technology, Multimanager Core Bond, Multimanager Mid Cap Growth, Multimanager Mid Cap Value Portfolio, New Multimanager Aggressive Equity, New Multimanager Technology, New Multimanager Core Bond, New Multimanager Mid Cap Growth, and New Multimanager Mid Cap Value Portfolios
Each allocation percentage for each Portfolio is an asset allocation target established by FMG LLC to achieve the Portfolio’s investment objective and may be changed without shareholder approval. Each Portion of a Portfolio may deviate temporarily from its asset allocation target for defensive purposes, in response to large inflows or outflows of assets to and from the Portfolio (e.g., in connection with asset allocation rebalancing transactions, reorganization transactions and separate account substitution transactions), or as a result of appreciation or depreciation of its holdings. FMG LLC rebalances each portion of the Portfolio as it deems appropriate. To the extent that the Portfolio is being rebalanced, experiences large inflows or outflows, or takes a temporary defensive position, it may not be pursuing its investment goal or executing its principal investment strategy.
Active Management Strategies
Each Adviser has complete discretion to select portfolio securities for its portion of a Portfolio’s assets, subject to the Portfolio’s investment objectives, restrictions and policies and other parameters that may be developed from time to time by the Manager.
C-2
In selecting investments, the Advisers use their proprietary investment strategies, which are summarized above in the section “Investments, Risks and Performance” for each portfolio. The following is an additional general description of certain common types of active management strategies that may be used by the Advisers to the Portfolios.
Growth investing generally focuses on companies that, due to their strong earnings and revenue potential, offer above-average prospects for capital growth, with less emphasis on dividend income. Earnings predictability and confidence in earnings forecasts are an important part of the selection process. An Adviser using this approach generally seeks out companies experiencing some or all of the following: high sales growth, high unit growth, high or improving returns on assets and equity, and a strong balance sheet. Such an Adviser also prefers companies with a competitive advantage such as unique management, marketing or research and development. Value investing attempts to identify strong companies selling at a discount from their perceived true worth. An Adviser using this approach generally selects stocks at prices that, in its view, are temporarily low relative to the company’s earnings, assets, cash flow and dividends.
Value investing generally emphasizes companies that, considering their assets and earnings history, are attractively priced and may provide dividend income.
Core investing is an investment style that includes both the strategies used when seeking either growth companies (those with strong earnings growth) or value companies (those that may be temporarily out of favor or have earnings or assets not fully reflected in their stock price).
Fundamental analysis generally involves the analysis of the balance sheet and income statements of a company in order to forecast its future stock price movements. Fundamental analysis considers past records of assets, earnings, sales, products, management and markets in predicting future trends in these indicators of a company’s success or failure. By appraising a company’s prospects, analysts using such an approach assess whether a particular stock or group of stocks is undervalued or overvalued at its current market price.
Additional Strategies
The following provides additional information regarding the principal investment strategies discussed in “Comparison of Investment Objectives, Policies, and Strategies” and additional investment strategies that the Portfolios may employ. Each strategy may apply to all of the Portfolios. For further information about investment strategies, please see the Portfolios’ respective Statement of Additional Information (the “SAI”).
Cash Management: A Portfolio may invest its uninvested cash in high-quality, short-term debt securities, including repurchase agreements and high-quality money market instruments, and also may invest uninvested cash in money market funds, including money market funds managed by the Manager. To the extent a Portfolio invests in a money market fund, it generally is not subject to the limits placed on investments in other investment companies, as discussed in “Additional Strategies — Securities of Other Investment Companies.” Generally, these securities offer less potential for gains than other types of securities.
C-3
Currency: A Portfolio may enter into foreign currency transactions for hedging and non-hedging purposes on a spot (i.e., cash) basis or through the use of derivatives. Forward foreign currency exchange contracts (“forward contract”) are a type of derivative that may be utilized by a Portfolio. A forward contract involves an obligation to purchase or sell a specific currency at a future date, which may be any fixed number of days from the date of the contract agreed upon by the parties, at a price set at the time of the contract. These contracts are principally traded in the interbank market conducted directly between currency traders (usually large, commercial banks) and their customers. A forward contract generally has no margin deposit requirement and no commissions are charged at any stage for trades. Investments in foreign currencies are subject to the risk that those currencies will decline in value relative to the U.S. dollar.
Derivatives: A Portfolio may use “derivative” instruments to hedge its portfolio against market, economic, currency, issuer and other risks, to gain or manage exposure to the markets, sectors and securities in which the Portfolio may invest and to other economic factors that affect the Portfolio’s performance (such as interest rate movements), to increase total return or income, to reduce transaction costs, to manage cash, and for other portfolio management purposes. Derivatives are financial instruments whose value depends upon, or is derived from, the value of something else, such as one or more underlying investments, indexes or currencies. Certain derivative securities may have the effect of creating financial leverage by multiplying a change in the value of the asset underlying the derivative to produce a greater change in the value of the derivative security. This creates an opportunity for increased return but, at the same time, creates the possibility for greater loss (including the likelihood of greater volatility in the net asset value of the shares of a Portfolio). Futures and options contracts (including futures and options on individual securities and equity and bond market indexes and options on futures contracts), swaps and forward contracts, including forward currency contracts, and structured securities, are examples of derivatives in which a Portfolio may invest. A Portfolio that engages in derivatives transactions may maintain a significant percentage of its assets in cash and cash equivalent instruments, which may serve as margin or collateral for the Portfolio’s obligations under derivative transactions.
Equity Securities: Equity securities may be bought on stock exchanges or in the over-the-counter market. Equity securities generally include common stock, preferred stock, warrants, securities convertible into common stock, securities of other investment companies and securities of real estate investment trusts.
ETFs: A Portfolio may invest in shares of ETFs that are designed to provide investment results corresponding to an index of securities. An ETF is an open-end investment company which generally invests in a broad sample of securities corresponding to a particular index. ETFs are traded on a securities exchange at prices quoted by the exchange throughout its trading day. ETFs may trade at relatively modest discounts and premiums to their net asset values. However, some ETFs have a limited operating history, and information is lacking regarding the actual performance
C-4
and trading liquidity of these ETFs for extended periods or over complete market cycles. In addition, there is no assurance that the listing requirements of the various exchanges on which ETFs trade will be met to continue listing on that exchange. If substantial market or other disruptions affecting ETFs occur in the future, the liquidity and value of the assets of the Portfolio, and thus the value of the Portfolio’s shares, also could be substantially and adversely affected if a shareholder sells his or her shares in the Portfolio.
Fixed Income Securities: A Portfolio may invest in short- and long-term fixed income securities in pursuing its investment objective and for other portfolio management purposes, such as to manage cash. Fixed income securities are debt securities such as bonds, notes, debentures and commercial paper. Domestic and foreign governments, banks and companies raise cash by issuing or selling debt securities to investors. Most debt securities pay fixed or adjustable rates of interest at regular intervals until they mature, at which point investors receive their principal back.
Foreign Securities: Certain Portfolios may invest in foreign securities, including securities of companies in emerging markets. Generally, foreign securities are issued by companies organized outside the U.S. or by foreign governments or international organizations, are traded primarily in markets outside the U.S., and are denominated in a foreign currency. Foreign securities may include securities of issuers in developing countries or emerging markets, which generally involve greater risk because the economic structures of these countries and markets are less developed and their political systems are less stable. In addition, foreign securities may include depositary receipts of foreign companies. American Depositary Receipts are receipts typically issued by an American bank or trust company that evidence underlying securities issued by a foreign corporation. European Depositary Receipts (issued in Europe) and Global Depositary Receipts (issued throughout the world) each evidence a similar ownership arrangement. Depositary receipts also may be convertible into securities of foreign issuers. These securities may not necessarily be denominated in the same currency as the securities into which they may be converted.
Futures: A Portfolio may purchase or sell futures contracts on individual securities or securities indexes. In purchasing a futures contract, the buyer agrees to purchase a specified underlying instrument at a specified future date. In selling a futures contract, the seller agrees to sell a specified underlying instrument at a specified future date. The price at which the purchase and sale will take place is fixed when the buyer and seller enter into the contract. Futures can be held until their delivery dates, or can be closed out before then if a liquid market is available. The value of a futures contract tends to increase and decrease in tandem with the value of its underlying instrument. Therefore, purchasing futures contracts will tend to increase a fund’s exposure to positive and negative price fluctuations in the underlying instrument, much as if it had purchased the underlying instrument directly. When a fund sells a futures contract, by contrast, the value of its futures position will tend to move in a direction contrary to the market. Selling futures contracts, therefore, will tend to offset both positive and negative market price changes, much as if the underlying instrument had been sold. Futures contracts in which the Portfolio will invest are highly standardized contracts that typically trade on futures exchanges.
C-5
There is no assurance that a liquid market will exist for any particular futures contract at any particular time. Exchanges may establish daily price fluctuation limits for futures contracts, and may halt trading if a contract’s price moves upward or downward more than the limit in a given day. On volatile trading days when the price fluctuation limit is reached or a trading halt is imposed, it may be impossible to enter into new positions or close out existing positions. If the market for a contract is not liquid because of price fluctuation limits or other market conditions, it could prevent prompt liquidation of unfavorable positions, and potentially could require a fund to continue to hold a position until delivery or expiration regardless of changes in its value. As a result, a fund’s access to other assets held to cover its futures positions could also be impaired.
The use of futures contracts and similar instruments may be deemed to involve the use of leverage because the Portfolio is not required to invest the full market value of the futures contract upon entering into the contract. Instead, the Portfolio, upon entering into a futures contract (and to maintain its open position in a futures contract), is required to post collateral for the contract, known as “initial margin” and “variation margin,” the amount of which may vary but which generally equals a relatively small percentage (e.g., less than 5%) of the value of the contract being traded. While the use of futures contracts may involve the use of leverage, the Portfolio generally does not intend to use leverage to increase its net exposure to debt securities above approximately 100% of the Portfolio’s net asset value or below 0%.
Illiquid Securities: A Portfolio may invest up to 15% of its net assets in illiquid securities. Illiquid securities are securities that have no ready market.
Initial Public Offerings (“IPOs”): Each of the Portfolios that may invest in equity securities may participate in the IPO market and a significant portion of those Portfolios’ returns may be attributable to their investment in IPOs, which have a magnified impact on Portfolios with small asset bases. An IPO is generally the first sale of stock by a company to the public. Companies offering an IPO are sometimes new, young companies or sometimes companies which have been around for many years but are deciding to go public. Prior to an IPO, there is generally no public market for an issuer’s common stock and there can be no assurance that an active trading market will develop or be sustained following the IPO. Therefore, the market price for the securities may be subject to significant fluctuations and a Portfolio may be affected by such fluctuations.
Investment Grade Securities: A Portfolio may invest in investment grade debt securities. Investment grade securities are rated in one of the four highest rating categories by Moody’s or S&P, comparably rated by another rating agency or, if unrated, determined by the applicable Adviser to be of comparable quality. Securities with lower investment grade ratings, while normally exhibiting adequate protection parameters, have speculative characteristics. This means that changes in economic conditions or other circumstances are more likely to lead to a weakened capacity to make principal and interest payments than is the case for higher rated debt securities.
C-6
Large-Cap Companies: A Portfolio may invest in the securities of large-cap companies. These companies are typically larger, more established companies that are well-known in the market. They are a generally less vulnerable than mid- and small-cap companies to adverse business or economic developments; however, unlike mid-and small-cap companies, they may be unable to respond quickly to new competitive challenges such as changes in technology and consumer tastes.
Mid-Cap and Small-Cap Companies and Micro-Cap Companies: Each Portfolio may invest in the securities of mid- and small-cap companies. A Portfolio may also invest in micro-cap companies. Mid- and small- cap companies are more likely than larger companies to have limited product lines, markets or financial resources or to depend on a small, inexperienced management group. Generally, they are more vulnerable than larger companies to adverse business or economic developments and their securities may be less well-known, trade less frequently and in more limited volume than the securities of larger more established companies.
Mortgage- and Asset-Backed Securities: A Portfolio may invest in mortgage- and asset-backed securities. A mortgage-backed security may be an obligation of the issuer backed by a mortgage or pool of mortgages or a direct interest in an underlying pool of mortgages. Some mortgage-backed securities make payments of both principal and interest at a variety of intervals; others make semiannual interest payments at a predetermined rate and repay principal at maturity (like a typical bond). Mortgage-backed securities are based on different types of mortgages including those on commercial real estate or residential properties.
Asset-backed securities have structural characteristics similar to mortgage-backed securities. However, the underlying assets are not first lien mortgage loans or interests therein but include assets such as motor vehicle installment sales contracts, other installment sales contracts, home equity loans, leases of various types of real and personal property and receivables from revolving credit (credit card) agreements. Such assets are securitized through the use of trusts or special purpose corporations. Payments or distributions of principal and interest may be guaranteed up to a certain amount and for a certain time period by a letter of credit or pool insurance policy issued by a financial institution unaffiliated with the issuer, or other credit enhancements may be present.
Portfolio Turnover: The Portfolios do not restrict the frequency of trading to limit expenses. The Portfolios may engage in active and frequent trading of portfolio securities to achieve their investment objectives. Frequent trading can result in a portfolio turnover in excess of 100% (high portfolio turnover).
Securities of Other Investment Companies: A Portfolio may invest in the securities of other investment companies, including ETFs, to the extent permitted by applicable law. Generally, a Portfolio’s investments in other investment companies are subject to statutory limitations in the 1940 Act, including in certain circumstances a prohibition against acquiring shares of another investment company if, immediately after such acquisition, the Portfolio and its affiliated persons (i) would hold more than
C-7
3% of such other investment company’s total outstanding voting shares, (ii) would have invested more than 5% of its total assets in such other investment company, or (iii) would have invested more than 10% of its total assets in investment companies. However, there are statutory and regulatory exemptions from these restrictions under the 1940 Act on which the Portfolios may rely to invest in other investment companies in excess of these limits, subject to certain conditions. In addition, many ETFs have obtained exemptive relief from the SEC to permit unaffiliated funds (such as the Portfolios) to invest in their shares beyond the statutory limits, subject to certain conditions and pursuant to contractual arrangements between the ETFs and the investing funds. A Portfolio may rely on these exemptive orders in investing in ETFs. A Portfolio that invests in other investment companies indirectly bears the fees and expenses of that investment company.
Short Sales or Short Positions: A Portfolio may engage in short sales and may enter into derivative contracts that have a similar economic effect (e.g., taking a short position in a futures contract). A “short sale” is the sale by a portfolio of a security that has been borrowed from a third party on the expectation that the market price will drop. If the price of the security drops, the Portfolio will make a profit by purchasing the security in the open market at a lower price than at which it sold the security. If the price of the security rises, the Portfolio may have to cover short positions at a higher price than the short sale price, resulting in a loss. In addition, because a Portfolio’s potential loss on a short sale arises from increases in the value of the security sold short, the extent of such loss, like the price of the security sold short, is theoretically unlimited.
Temporary Defensive Investments: For temporary defensive purposes in response to adverse market, economic, political or other conditions each Portfolio may invest, without limit, in cash, money market instruments or high quality short-term debt securities, including repurchase agreements. To the extent a Portfolio is invested in these instruments, the Portfolio will not be pursuing its investment goal. In addition, each PLUS Portfolio may vary from its asset allocation targets and target investment percentages for defensive purposes.
U.S. Government Securities: A Portfolio may invest in U.S. government securities, which include direct obligations of the U.S. Treasury (such as Treasury bills, notes or bonds) and obligations issued or guaranteed as to principal and interest (but not as to market value) by the U.S. government, its agencies or its instrumentalities. U.S. government securities include mortgage-backed securities issued or guaranteed by government agencies or government-sponsored enterprises. Other U.S. government securities may be backed by the full faith and credit of the U.S. government or supported primarily or solely by the creditworthiness of the government-related issuer or, in the case of mortgage-backed securities, by pools of assets.
In August 2011, S&P downgraded its long-term sovereign credit rating on the U.S. from “AAA” to “AA+”. The downgrade by S&P could lead to subsequent downgrades by S&P or downgrades by other credit rating agencies. Both Fitch and Moody’s, which currently have assigned their highest credit ratings to the U.S., have a negative outlook
C-8
for those credit ratings. These developments, and the government’s credit concerns in general, could cause an increase in interest rates and borrowing costs, which may negatively impact both the perception of credit risk associated with the debt securities issued by the U.S. and the country’s ability to access the debt markets on favorable terms. In addition, these developments could create broader financial turmoil and uncertainty, which could increase volatility in both stock and bond markets. These events could result in significant adverse impacts on issuers of securities held by a Portfolio.
Risks.
Risk is the chance that you will lose money on your investment or that it will not earn as much as you expect. In general, the greater the risk, the more money your investment can earn for you and the more you can lose. Like other investment companies, the value of each Portfolio’s shares may be affected by the Portfolio’s investment objective(s), principal investment strategies and particular risk factors. Consequently, each Portfolio may be subject to different risks. Some of the risks, including principal risks, of investing in the Portfolios are discussed below. However, other factors may also affect each Portfolio’s investment results. There is no guarantee that a Portfolio will achieve its investment objective(s) or that it will not lose value.
General Investment Risks: Each Portfolio is subject to the following risks:
Adviser Selection Risk: The risk that the Manager’s process for selecting or replacing an Adviser and its decision to select or replace an Adviser does not produce the intended results.
Asset Class Risk: There is the risk that the returns from the types of securities in which a portfolio invests will underperform the general securities markets or different asset classes. Different types of securities and asset classes tend to go through cycles of outperformance and underperformance in comparison to the general securities markets.
Issuer-Specific Risk: The value of an individual security or particular type of security can be more volatile than the market as a whole and can perform differently from the market as a whole. Certain unanticipated events, such as natural disasters, can have a dramatic adverse effect on the value of an issuer’s securities.
Large Shareholder Risk: A significant percentage of a Portfolio’s shares may be owned or controlled by the Manager and its affiliates, other Portfolios that are advised by the Manager (including funds of funds), or other large shareholders, including primarily insurance company separate accounts and qualified plans. Accordingly, a Portfolio is subject to the potential for large scale inflows and outflows as a result of purchases and redemptions of its shares by such shareholders, including in connection with substitution an other transactions by affiliates of the Manager. These inflows and outflows may be frequent and could negatively affect a Portfolio’s net asset value and performance and could cause a Portfolio to purchase or sell securities at a time when it would not normally do so. It would be particularly disadvantageous for a Portfolio if it experiences outflows and needs to sell
C-9
securities at a time of volatility in the markets, when values could be falling. These inflows and outflows also could negatively affect a Portfolio’s ability to meet shareholder redemption requests or could limit a Portfolio’s ability to pay redemption proceeds within the time period stated in its prospectus because of unusual market conditions, an unusually high volume of redemption requests, or other reasons. In addition, these inflows and outflows could increase a Portfolio’s brokerage or other transaction costs, and large-scale outflows could cause a Portfolio’s actual expenses to increase, or could result in a Portfolio’s current expenses being allocated over a smaller asset base, leading to an increase in the Portfolio’s expense ratio.
Market Risk: The risk that the securities markets will move down, sometimes rapidly and unpredictably based on overall economic conditions and other factors. Changes in the financial condition of a single issuer can impact a market as a whole. In addition, markets and market-participants are increasingly reliant upon both publicly available and proprietary information data systems. Data imprecision, software or other technology malfunctions, programming inaccuracies, unauthorized use or access, and similar circumstances may impair the performance of these systems and may have an adverse impact upon a single issuer, a group of issuers, or the market at-large. In certain cases, an exchange or market may close or issue trading halts on either specific securities or even the entire market, which may result in a Portfolio being, among other things, unable to buy or sell certain securities or financial instruments or accurately price its investments.
Multiple Adviser Risk: A Portfolio may have multiple Advisers, each of which is responsible for investing a specific allocated portion of the Portfolio’s assets. Because each Adviser manages its allocated portion of the Portfolio independently from another Adviser, the same security may be held in different portions of the Portfolio, or may be acquired for one portion of the Portfolio at a time when an Adviser to another portion deems it appropriate to dispose of the security from that other portion. Similarly, under some market conditions, one Adviser may believe that temporary, defensive investments in short-term instruments or cash are appropriate when another Adviser believes continued exposure to the equity or debt markets is appropriate for its allocated portion of the Portfolio. Because each Adviser directs the trading for its own portion of the Portfolio,
and does not aggregate its transactions with those of the other Adviser, the Portfolio may incur higher brokerage costs than would be the case if a single Adviser were managing the entire Portfolio. In addition, while the Manager seeks to allocate a Portfolio’s assets among the Portfolio’s Advisers in a manner that it believes is consistent with achieving the Portfolio’s investment objective, the Manager may be subject to potential conflicts of interest in allocating the Portfolio’s assets among Advisers because the Manager pays different fees to the Advisers and due to other factors that could impact the Manager’s revenues and profits.
C-10
Portfolio Management Risk: The risk that strategies used by the Manager or the Advisers and their securities selections fail to produce the intended results. In addition, the Portfolios are available through Contracts offered by insurance company affiliates of the Manager, and the Portfolios may be used to fund all or a portion of certain benefits available under the Contracts. To the extent the assets in a Portfolio are insufficient to fund those benefits, the Manager’s insurance company affiliates might otherwise be obligated to fulfill them out of their own resources. The Manager may be subject to potential conflicts of interest in connection with providing advice to, or developing strategies and models used to manage, a Portfolio (e.g., with respect to the allocation of assets among Underlying Portfolios or between passively and actively managed portions of a Portfolio and the development and implementation of the models used to manage a Portfolio). The performance of Portfolios managed or designed by the Manager may impact the obligations and financial exposure of its insurance company affiliates under any death benefit, income benefit and other guarantees provided through Contracts that offer the Portfolio as an investment option and the ability of an insurance company affiliate to manage (e.g., through the use of various hedging techniques) the risks associated with these guarantees. The Manager’s investment decisions and the design of the Portfolios may be influenced by these factors. For example, the Portfolios or the models and strategies may be managed or designed in a manner (e.g., using more conservative or less volatile investment styles) that could reduce potential losses and/or mitigate financial risks to insurance companies affiliates that provide the guarantees and offer the Portfolios as investment options in their products, and also could facilitate such an insurance company’s ability to provide guarantees under its Contracts, including by making more predictable the costs of the guarantees and by reducing the regulatory capital needed to provide them. Consistent with its fiduciary duties, the Manager seeks to implement each Portfolio’s investment program in a manner that is in the best interests of the Portfolio and that is consistent with the Portfolio’s investment objective, policies and strategies described in detail in this Proxy Statement/Prospectus.
Recent Market Conditions Risk: The financial crisis in the U.S. and many foreign economies over the past several years, including the European sovereign debt and banking crises, has resulted, and may continue to result, in an unusually high degree of volatility in the financial markets, both domestic and foreign, and in the net asset values of many mutual funds, including the Portfolios. Both domestic and international equity and fixed income markets have been experiencing heightened volatility and turmoil, and issuers that have exposure to the real estate, mortgage, and credit markets and the sovereign debt of certain nations or their political subdivisions have been particularly affected. During times of market turmoil, investors tend to look to the safety of securities issued or backed by the U.S. Treasury, causing the prices of these securities to rise and the yields to decline. These market conditions have resulted in fixed income instruments experiencing unusual liquidity issues, increased price volatility, and, in some
C-11
cases, credit downgrades and increased likelihood of default. The reduced liquidity in fixed income and credit markets may negatively affect many issuers worldwide.
In addition, global economies and financial markets are becoming increasingly interconnected, which increases the possibilities that conditions in one country or region might adversely impact issuers in a different country or region. Because the situation is widespread and largely unprecedented, it may be unusually difficult to identify both risks and opportunities using past models of the interplay of market forces, or to predict the duration of these market conditions. The severity or duration of these conditions also may be affected by policy changes made by governments or quasi-governmental organizations. These conditions could negatively impact the value and liquidity of a Portfolio’s investments and cause it to lose money.
The situation in the financial markets has resulted in calls for increased regulation. In particular, the Dodd-Frank Wall Street Reform and Consumer Protection Act (“Dodd-Frank Act”) has initiated a revision of the U.S. financial regulatory framework and covers a broad range of topics, including (among many others) a reorganization of federal financial regulators; new rules for derivatives trading; and the registration and additional regulation of hedge and private equity fund managers. The regulators that have been charged with the responsibility for implementing the Dodd- Frank Act (e.g., the Securities and Exchange Commission (“SEC”) and the CFTC) have been active in proposing and adopting regulations and guidelines on the use of derivatives by market participants, including mutual funds. In 2012, the CFTC adopted a revision to one of its rules that as revised either restricts the use of derivatives by mutual funds or requires a mutual fund’s adviser to register as a commodity pool operator. The SEC is reviewing its current guidelines on the use of derivatives by mutual funds and may issue new guidelines. It is not clear whether or when such new guidelines will be published or what the content of such guidelines may be. Instruments in which a Portfolio may invest, or the issuers of such instruments, may be negatively affected by the new legislation and regulation in ways that are unforeseeable. Although a portion of the implementing regulations have been finalized, the ultimate impact of the Dodd-Frank Act is not yet certain.
The U.S. federal government and certain foreign central banks have taken actions to support financial markets and increase confidence in the U.S. and world economies. Certain of these entities have injected liquidity into the markets and taken other steps in an effort to stabilize the markets and grow the economy. Others have opted for austerity, which may limit growth, at least in the short to medium term. The ultimate effect of these efforts is only beginning to reveal itself. Where economic conditions are recovering, they are nevertheless perceived as still fragile. Changes in government policies may exacerbate the markets’ difficulties and withdrawal of this support, or other policy changes by governments or central banks, could adversely impact the value and liquidity of certain
C-12
securities. In addition, political events within the U.S. and abroad, such as the U.S. government’s recent inability to agree on a long-term budget and deficit reduction plan, the federal government shutdown and threats to not increase the federal government’s debt limit, may affect investor and consumer confidence and may adversely impact financial markets and the broader economy, perhaps suddenly and to a significant degree.
As indicated in “Comparison of Principal Risk Factors,” a Portfolio may be subject to the following as principal risks. In addition, to the extent a Portfolio invests in a particular type of investment, it will be subject to the risks of such investment as described below:
Cash Management Risk: Upon entering into certain derivatives contracts, such as futures contracts, and to maintain open positions in certain derivatives contracts, the Portfolio may be required to post collateral for the contract, the amount of which may vary. As such, the Portfolio may maintain cash balances, including foreign currency balances, which may be significant, with counterparties such as the Trusts’ custodian or its affiliates. The Portfolio is thus subject to counterparty risk and credit risk with respect to these arrangements.
Credit Risk: The risk that the issuer or the guarantor of a fixed income security, or the counterparty to a derivatives contract, repurchase agreement, loan of portfolio securities or other transaction, is unable or unwilling, or is perceived (whether by market participants, ratings agencies, pricing services or otherwise) as unable or unwilling, to make timely principal and/or interest payments, or otherwise honor its obligations. Securities are subject to varying degrees of credit risk, which may be reflected in their credit ratings. Securities rated below investment grade (e.g., “junk bonds”) may include a substantial risk of default. U.S. government securities held by a portfolio are supported by varying degrees of credit, and their value may fluctuate in response to political, market or economic developments. U.S. government securities, especially those that are not backed by the full faith and credit of the U.S. Treasury, such as securities supported only by the credit of the issuing governmental agency or government sponsored enterprise, carry at least some risk of nonpayment, and the maximum potential liability of the issuers of such securities may greatly exceed their current resources. There is no assurance that the U.S. government would provide financial support to the issuing entity if not obligated to do so by law. Further, any government guarantees on U.S. government securities that a portfolio owns do not extend to shares of the Portfolio themselves.
Custom Benchmark Risk: Certain of the Portfolios’ benchmarks were created by the Manager to show how the Portfolio’s performance compares with the returns of a volatility managed index. There is no guarantee that a Portfolio will outperform these or any benchmarks.
Derivatives Risk: A derivative instrument is an investment contract the value of which is linked (or is derived from) in whole or in part, the value of an underlying asset, reference rate or index (e.g., stocks, bonds, commodities, currencies, interest rates and
C-13
market indexes). Derivatives include options, swaps, futures, options on futures, forward contracts and structured securities. Investing in derivatives involves investment techniques and risks different from those associated with ordinary mutual fund securities transactions and may involve increased transaction costs. The successful use of derivatives will usually depend on the Manager’s or an Adviser’s ability to accurately forecast movements in the market relating to the underlying reference asset, rate or index. If the Manager or an Adviser does not predict correctly the direction of securities prices, interest rates and other economic factors, a portfolio’s derivatives position could lose value. A portfolio’s investment in derivatives may rise or fall more rapidly than other investments and may reduce the Portfolio’s returns. Changes in the value of the derivative may not correlate perfectly with the underlying asset, rate or index, and a portfolio could lose more than the principal amount invested. Derivatives are also subject to a number of risks such as leverage risk, liquidity risk, market risk, interest rate risk, counterparty risk, credit risk and also involve the risk of mispricing or improper valuation. Derivatives also may not behave as anticipated by a Portfolio, especially in abnormal market conditions. The use of derivatives may increase the volatility of a portfolio’s net asset value. Derivatives may be leveraged such that a small investment in derivative securities can have a significant impact on a portfolio’s exposure to stock market values, interest rates, currency exchange rates or other investments. As a result, a relatively small price movement in a derivatives contract may cause an immediate and substantial loss or gain. It may be difficult or impossible for a Portfolio to purchase or sell certain derivatives in sufficient amounts to achieve the desired level of exposure, which may result in a loss or may be costly to the Portfolio. In addition, the possible lack of a liquid secondary market for certain derivatives and the resulting inability of a Portfolio to sell or otherwise close a derivatives position could expose a portfolio to losses and could make such derivatives more difficult for the Portfolio to value accurately. Some derivatives are more sensitive to market price fluctuations and to interest rate changes than other investments. A Portfolio also could suffer losses related to its derivatives positions as a result of undervalued market movements, which losses are potentially unlimited. A Portfolio also may be exposed to losses if the counterparty in the transaction does not fulfill its contractual obligation. In addition, certain over-the-counter derivatives do not have liquidity beyond the counterparty to the transaction, and because they may not be traded on exchanges, they may not offer the protections provided by exchanges in the event that the counterparty is unable to fulfill its contractual obligation. Such over-the-counter derivatives therefore involve greater counterparty and credit risk and may be more difficult to value than exchange-traded derivatives. When a derivative is used as a hedge against a position that a portfolio holds, any loss generated by the derivative generally should be substantially offset by gains on the hedged instrument, and vice versa. While hedging can reduce or eliminate losses, it also can reduce or eliminate gains. Hedges are sometimes subject to imperfect matching between the derivative and the hedged investment, and there can be no assurance that a Portfolio’s hedging transactions will be effective.
There have been numerous recent legislative and regulatory initiatives to implement a new regulatory framework for the derivatives markets. New rules may limit the availability of certain, may make the use of derivatives by portfolios more costly, and may otherwise adversely impact the performance and value of derivatives.
C-14
Equity Risk: In general, stocks and other equity security values fluctuate and sometimes widely fluctuate, in response to changes in a company’s financial condition as well as general market, economic and political conditions and other factors.
ETF Risk: A Portfolio that invests in exchange-traded funds ETFs will indirectly bear fees and expenses charged by those ETFs, in addition to the Portfolio’s direct fees and expenses. The cost of investing in the Portfolio, therefore, may be higher than the cost of investing in a mutual fund that invests directly in individual stocks and bonds. In addition, the Portfolio’s net asset value will be subject to fluctuations in the market values of the ETFs in which it invests. The Portfolio is also subject to the risks associated with the securities in which the ETFs invest and the ability of the Portfolio to meet its investment objective will directly depend on the ability of the ETFs to meet their investment objectives. The Portfolio and the ETFs are subject to certain general investment risks, including market risk, asset class risk, issuer-specific risk, investment style risk and portfolio management risk. In addition, to the extent a Portfolio invests in ETFs that invest in equity securities, fixed income securities and/or foreign securities, the Portfolio is subject to the risks associated with investing in such securities such as equity risk, market capitalization risk, investment grade securities risk, interest rate risk, credit/default risk, foreign and emerging markets securities risk and lower-rated securities risk. ETFs may change their investment objectives or policies without the approval of the Portfolio. If that were to occur, the Portfolio might be forced to sell its investment in an ETF at a time and price that is unfavorable to the Portfolio. In addition, many ETFs invest in securities included in, or representative of, underlying indexes regardless of investment merit or market trends and, therefore, these ETFs do not change their investment strategies to respond to changes in the economy, which means that an ETF may be particularly susceptible to a general decline in the market segment relating to the relevant index. Imperfect correlation between an ETF’s securities and those in the index it seeks to track, rounding of prices, changes to the indices and regulatory policies may cause an ETF’s performance to not match the performance of its index. An ETF’s use of a representative sampling approach will result in it holding a smaller number of securities than are in the index it seeks to track. As a result, an adverse development respecting an issuer of securities held by the ETF could result in a greater decline in net asset value than would be the case if the ETF held all of the securities in the index. To the extent the assets in the ETF are smaller, these risks will be greater. No ETF fully replicates its index and an ETF may hold securities not included in its index. Therefore, there is a risk that the investment strategy of the ETF manager may not produce the intended results. Moreover, there is the risk that an ETF may value certain securities at a higher price than it can sell them for. Secondary market trading in shares of ETFs may be halted by a national securities exchange because of market conditions or for other reasons. In addition, trading in these shares is subject to trading halts caused by extraordinary market volatility pursuant to “circuit breaker” rules. There can be no assurance that the requirements necessary to maintain the listing of the shares will continue to be met or will remain unchanged. In addition, although ETFs are listed for trading on national securities exchanges, certain foreign exchanges and in over-the- counter markets,
C-15
there can be no assurance that an active trading market for such shares will develop or be maintained, in which case the liquidity and value of a Portfolio’s investment in the ETFs could be substantially and adversely affected. In addition, because ETFs are traded on these exchanges and in these markets, the purchase and sale of their shares involve transaction fees and commissions. The market price of an ETF may be different from the net asset value of such ETF (i.e., an ETF may trade at a discount or premium to its net asset value). The performance of a Portfolio that invests in such an ETF could be adversely impacted.
Foreign Securities Risk: Investments in foreign securities, including depositary receipts, involve risks not associated with investing in U.S. securities. Foreign markets, particularly emerging markets, may be less liquid, more volatile and subject to less government supervision than domestic markets. Security values also may be negatively affected by changes in the exchange rates between the U.S. dollar and foreign currencies. Differences between U.S. and foreign legal, political and economic systems, regulatory regimes and market practices also may impact security values and it may take more time to clear and settle trades involving foreign securities.
Currency Risk: Investments in foreign currencies and in securities that trade in, or receive revenues in, foreign currencies are subject to the risk that those currencies will decline in value relative to the U.S. dollar. Any such decline may erode or reverse any potential gains from an investment in securities denominated in foreign currency or may widen existing loss. Currency rates may fluctuate significantly over short periods of time for a number of reasons, including changes in interest rates, intervention by governments, central banks or supranational entities, or by the imposition of currency controls or other political developments in the U.S. or abroad.
Depositary Receipts Risk: Investments in depositary receipts (including American Depositary Receipts, European Depositary Receipts and Global Depositary Receipts) are generally subject to the same risks of investing in the foreign securities that they evidence or into which they may be converted. In addition, issuers underlying unsponsored depositary receipts may not provide as much information as U.S. issuers and issuers underlying sponsored depositary receipts. Unsponsored depositary receipts also may not carry the same voting privileges as sponsored depositary receipts.
Emerging Markets Risk: Emerging market countries generally are located in Asia, the Middle East, Eastern Europe, Central and South America and Africa. There are greater risks involved in investing in emerging market countries and/or their securities markets. Investments in these countries and/or markets may present market, credit, currency, liquidity, legal, political, technical and other risks different from, or greater than, the risks of investing in developed countries. For instance, these countries may be more likely than developed countries to experience rapid and significant developments in their political or economic structures. Some emerging market countries restrict foreign investments, impose withholding or other taxes on foreign investments, or may nationalize or expropriate the assets of private countries. Therefore, a Portfolio may be limited in its ability to make direct or additional investments in an emerging markets country. Such restrictions also may have negative impacts on transaction costs, market price, investment returns and the legal rights and remedies
C-16
of a Portfolio. In addition, the securities markets of emerging markets countries generally are smaller, less liquid and more volatile than those of developed countries. Emerging market countries often have less uniformity in accounting and reporting requirements and less reliable settlement, registration and custodial procedures. Emerging market countries also may be subject to high inflation and rapid currency devaluations and may be heavily dependent on international trade, which can materially affect their securities markets. The risks associated with investing in a narrowly defined geographic area also generally are more pronounced with respect to investments in emerging market countries.
European Economic Risk: The European Union’s (the “EU”) Economic and Monetary Union (the “EMU”) requires Euro zone countries to comply with restrictions on interest rates, deficits, debt levels, and inflation rates, and other factors, each of which may significantly impact every European country and their economic partners. The economies of EU member countries and their trading partners may be adversely affected by changes in the euro’s exchange rate, changes in EU or governmental regulations on trade and other areas, and the threat of default or default by an EU member country on its sovereign debt, which could negatively impact a Portfolio’s investments and cause it to lose money. Recently, the European financial markets have been negatively impacted by rising government debt levels; possible default on or restructuring of sovereign debt in several European countries, including Cyprus, Greece, Ireland, Italy, Portugal and Spain; and economic downturns. European country’s default or debt restructuring would adversely affect the holders of the country’s debt and sellers of credit default swaps linked to the country’s creditworthiness and could negatively impact global markets more generally. Recent events in Europe have affected the euro’s exchange rate and value and may continue to impact the economies of every European country and their economic partners.
Geographic Risk: A Portfolio that may invest a significant portion of its assets in securities of companies domiciled, or exercising the predominant part of their economic activity, in one country or geographic region assumes the risk that economic, political, social and environmental conditions in that particular country or region will have a significant impact on the Portfolio’s investment performance and that the Portfolio’s performance will be more volatile than the performance of more geographically diversified funds. The economies and financial markets of certain regions can be highly interdependent and may decline all at the same time. In addition, certain areas are prone to natural disasters such as earthquakes, volcanoes, droughts or tsunamis and are economically sensitive to environmental events.
Initial Public Offering (“IPO”) Risk: Securities issued in IPOs have no trading history, and information about the companies may be available for very limited periods. In addition, the prices of securities sold in IPOs may be highly volatile. At any particular time or from time to time, a Portfolio may not be able to invest in securities issued in IPOs, or invest to the extent desired, because, for example, only a small portion (if any) of the securities being offered in an IPO may be
C-17
made available to the Portfolio. In addition, under certain market conditions, a relatively small number of companies may issue securities in IPOs. Similarly, as the number of Portfolios to which IPO securities are allocated increases, the number of securities issued to any one Portfolio may decrease. To the extent a Portfolio invests in IPOs, a significant portion of its returns may be attributable to its investments in IPOs, which have a magnified impact on Portfolios with small asset bases. There is no guarantee that as a Portfolio’s assets grow it will continue to experience substantially similar performance by investing in IPOs.
International Fair Value Pricing Risk: A Portfolio that invests in foreign securities is subject to the risk that its share price may be exposed to arbitrage attempts by investors seeking to capitalize on differences in the values of foreign securities trading on foreign exchanges that may close before the time the Portfolio’s net asset value is determined. If such arbitrage attempts are successful, the Portfolio’s net asset value might be diluted. A Portfolio’s use of fair value pricing in certain circumstances (by adjusting the closing market prices of foreign securities to reflect what the Boards of Trustees believe to be their fair value) may help deter such arbitrage activities. The effect of such fair value pricing is that foreign securities may not be priced on the basis of quotations from the primary foreign securities market in which they are traded, but rather may be priced by another method that the Boards believe reflects fair value. As such, fair value pricing is based on subjective judgment and it is possible that fair value may differ materially from the value realized on a sale of a foreign security. It is also possible that use of fair value pricing will limit an investment adviser’s ability to implement a Portfolio’s investment strategy (e.g., reducing the volatility of the Portfolio’s share price) or achieve its investment objective.
Political/Economic Risk: Changes in economic and tax policies, government instability, war or other political or economic actions or factors may have an adverse effect on a Portfolio’s foreign investments.
Regulatory Risk: Less information may be available about foreign companies. In general, foreign companies are not subject to uniform accounting, auditing and financial reporting standards or to other regulatory practices and requirements as are U.S. companies.
Settlement Risk: Settlement and clearance procedures in certain foreign markets differ significantly from those in the United States. Foreign settlement and clearance procedures and trade regulations also may involve certain risks (such as delays in payment for or delivery of securities) not typically associated with the settlement of U.S. investments. At times, settlements in certain foreign countries have not kept pace with the number of securities transactions. These problems may make it difficult for a Portfolio to carry out transactions. If a Portfolio cannot settle or is delayed in settling a purchase of securities, it may miss attractive investment opportunities and certain of its assets may be uninvested with no return earned thereon for some period. If a Portfolio cannot settle or is delayed in settling a sale of securities, it may lose money if the value of the security then declines or, if it has contracted to sell the security to another party, the Portfolio could be liable for any losses incurred.
C-18
Transaction Costs Risk: The costs of buying and selling foreign securities, including tax, brokerage and custody costs, generally are higher than those involving domestic transactions.
Futures Contract Risk: The primary risks associated with the use of futures contracts are (a) the imperfect correlation between the change in market value of the instruments held by a Portfolio and the price of the futures contract; (b) liquidity risks, including the possible absence of a liquid secondary market for a futures contract and the resulting inability to close a futures contract when desired; (c) losses (potentially unlimited) caused by unanticipated market movements; (d) an adviser’s inability to predict correctly the direction of securities prices, interest rates, currency exchange rates and other economic factors; (e) the possibility that a counterparty will default in the performance of its obligations; (f) if a Portfolio has insufficient cash, it may have to sell securities from its portfolio to meet daily variation margin requirements, and the Portfolio may have to sell securities at a time when it may be disadvantageous to do so; and (g) transaction costs associated with investments in futures contracts may be significant, which could cause or increase losses or reduce gains.
Index Strategy Risk: A Portfolio that employs an index strategy generally invests in the securities included in the relevant index or a representative sample of such securities regardless of market trends to track the performance of an unmanaged index of securities, whereas actively managed portfolios typically seek to outperform a benchmark index. Such a portfolio generally will not modify its index strategy to respond to changes in the economy, which means that it may be particularly susceptible to a general decline in the market segment relating to the relevant index. In addition, although the index strategy attempts to closely track its benchmark index, the Portfolio may not invest in all of the securities in the index. Also, the Portfolio’s fees and expenses will reduce the Portfolio’s returns, unlike those of the benchmark index. Cash flow into and out of the Portfolio, portfolio transaction costs, changes in the securities that comprise the index, and the Portfolio’s valuation procedures also may affect the Portfolio’s performance. Therefore, there can be no assurance that the performance of the index strategy will match that of the benchmark index.
Interest Rate Risk: The risk that fixed income securities will decline in value because of changes in interest rates. When interest rates decline, the value of a Portfolio’s debt securities generally rises. Conversely, when interest rates rise, the value of a Portfolio’s debt securities generally declines. A Portfolio with a longer average duration will be more sensitive to changes in interest rates than a fund with a shorter average duration. During periods of falling interest rates, an issuer of a callable bond may “call” or repay a security before its stated maturity and a Portfolio may have to reinvest the proceeds at lower interest rates, resulting in a decline in Portfolio income. Inflation-indexed bonds, including Treasury Inflation-Protected Securities (“TIPS”), decline in value when real interest rates rise. In certain interest rate environments, such as when real interest rates are rising faster than nominal interest rates, inflation-indexed bonds may experience greater losses than other fixed income securities with similar durations. Interest rates have been unusually low in recent years.
C-19
Investment Grade Securities Risk: Debt securities commonly are rated by national bond rating agencies. A Portfolio considers securities to be investment grade if they are rated BBB or higher by S&P or Fitch and Baa or higher by Moody’s or, if unrated, are deemed to be of comparable quality by an Adviser. Securities rated in the lower investment grade rating categories (e.g., BBB or Baa) are considered investment grade securities, but are somewhat riskier than higher rated obligations because they are regarded as having only an adequate capacity to pay principal and interest, and are considered to lack outstanding investment characteristics.
Investment Style Risk: An Adviser may use a particular style or set of styles, for example, growth, value, momentum or quantitative investing styles, to select investments. Those styles may be out of favor or may not produce the best results over short or longer time periods. They may also increase the volatility of the Portfolio’s share price.
Growth investing generally focuses on companies that, due to their strong earnings and revenue potential, offer above-average prospects for capital growth, with less emphasis on dividend income. Earnings predictability and confidence in earnings forecasts are an important part of the selection process. As a result, the price of growth stocks may be more sensitive to changes in current or expected earnings than the prices of other stocks. An Adviser using this approach generally seeks out companies experiencing some or all of the following: high sales growth, high unit growth, high or improving returns on assets and equity, and a strong balance sheet. Such an Adviser also prefers companies with a competitive advantage such as unique management, marketing or research and development. Growth investing is also subject to the risk that the stock price of one or more companies will fall or will fail to appreciate as anticipated by the Adviser, regardless of movements in the securities market. Growth stocks tend to be more volatile than value stocks, so in a declining market, their prices may decrease more than value stocks in general.
Value investing attempts to identify strong companies selling at a discount from their perceived true worth. An Adviser using this approach generally selects stocks at prices that, in its view, are temporarily low relative to the company’s earnings, assets, cash flow and dividends. Value investing is subject to the risk that a stock’s intrinsic value may never be fully recognized or realized by the market, or its price may go down. In addition, there is the risk that a stock judged to be undervalued may actually be appropriately priced. Value investing generally emphasizes companies that, considering their assets and earnings history, are attractively priced and may provide dividend income.
Large-Cap Company Risk: Larger more established companies may be unable to respond quickly to new competitive challenges such as changes in technology and consumer tastes. Many larger companies also may not be able to attain the high growth rate of successful smaller companies, especially during extended periods of economic expansion.
Leveraging or Leverage Risk: When a Portfolio leverages its holdings, the value of an investment in that Portfolio will be more volatile and all other risks will tend to be compounded. For example, a Portfolio may take on leveraging risk when it engages
C-20
in derivatives transactions, invests in collateral from securities loans or borrows money. Leveraged holdings generally require corresponding holdings of cash and cash equivalents, which may impede a portfolio’s ability to pursue its objectives. A Portfolio may experience leveraging risk in connection with investments in derivatives because its investments in derivatives may be purchased with a fraction of the assets that would be needed to purchase the securities directly, so that the remainder of the assets may be invested in other investments. Such investments may have the effect of leveraging a Portfolio because the Portfolio may experience gains or losses not only on its investments in derivatives, but also on the investments purchased with the remainder of the assets. If the value of a Portfolio’s investments in derivatives is increasing, this could be offset by declining values of the Portfolio’s other investments. Conversely, it is possible that the rise in the value of a Portfolio’s non-derivative investments could be offset by a decline in the value of the Portfolio’s investments in derivatives. In either scenario, a Portfolio may experience losses. In a market where the value of a Portfolio’s investments in derivatives is declining and the value of its other investments is declining, the Portfolio may experience substantial losses.
Mid-Cap and Small-Cap and Micro-Cap Company Risk: A Portfolio’s investments in mid-, small-and micro-cap companies may involve greater risks than investments in larger, more established issuers because they generally are more vulnerable than larger companies to adverse business or economic developments. Such companies generally have narrower product lines, more limited financial resources and more limited markets for their stock as compared with larger companies. Their securities may be less well-known and trade less frequently and in limited volume compared with the securities of larger, more established companies. As a result, the value of such securities may be more volatile than the securities of larger companies, and the Portfolio may experience difficulty in purchasing or selling such securities at the desired time and price or in the desired amount. Mid-, small- and micro-cap companies also are typically subject to greater changes in earnings and business prospects than larger companies. Consequently, the prices of mid-, small- and micro-cap company stocks tend to rise and fall in value more frequently than the stocks of larger companies. Although investing in mid-, small-and micro-cap companies offers potential for above-average returns, the companies may not succeed and the value of their stock could decline significantly. In general, these risks are greater for small- and micro-cap companies than for mid-cap companies.
Mortgage-Backed and Asset-Backed Securities Risk: The risk that the principal on mortgage- and asset-backed securities held by a Portfolio may be prepaid, which generally will reduce the yield and market value of these securities. If interest rates fall, the rate of prepayments tends to increase as borrowers are motivated to pay off debt and refinance at new lower rates. Rising interest rates may increase the risk of default by borrowers and tend to extend the duration of these securities, making them more sensitive to changes in interest rates. As a result, in a period of rising interest rates, a Portfolio that holds these types of securities may experience additional volatility and losses. This is known as extension risk. Moreover, declines in the credit quality of and defaults by the issuers of mortgage- and asset-backed securities or instability in the markets for such
C-21
securities may affect the value and liquidity of such securities, which could result in losses to the Portfolio. If a Portfolio purchases mortgage- or asset-backed securities that are “subordinated” to other interests in the same pool, the Portfolio as a holder of those securities may only receive payments after the pool’s obligations to other investors have been satisfied. For example, an unexpectedly high rate of defaults on the mortgages held by a mortgage pool may limit substantially the pool’s ability to make payments of principal or interest to the Portfolio as a holder of such subordinated securities, reducing the values of those securities or in some cases rendering them worthless. Certain mortgage- and asset-backed securities may include securities backed by pools of loans made to “subprime” borrowers or borrowers with blemished credit histories; the risk of defaults is generally higher in the case of mortgage pools that include such subprime mortgages. The underwriting standards for subprime loans are more flexible than the standards generally used by banks for borrowers with non-blemished credit histories with regard to the borrowers’ credit standing and repayment ability. Borrowers who qualify generally have impaired credit histories, which may include a record of major derogatory credit items such as outstanding judgments or prior bankruptcies. In addition, they may not have the documentation required to qualify for a standard loan. As a result, the loans in the pool are likely to experience rates of delinquency, foreclosure, and bankruptcy that are higher, and that may be substantially higher, than those experienced by loans underwritten in a more traditional manner. In addition, changes in the values of the assets underlying the loans (if any), as well as changes in interest rates, may have a greater effect on the delinquency, foreclosure, bankruptcy, and loss experience of the loans in the pool than on loans originated in a more traditional manner. Moreover, instability in the markets for mortgage- and asset-backed securities may affect the liquidity of such securities, which means that a Portfolio may be unable to sell such securities at an advantageous time and price. As a result, the value of such securities may decrease and a Portfolio may incur greater losses on the sale of such securities than under more stable market conditions. Furthermore, instability and illiquidity in the market for lower-rated mortgage- and asset-backed securities may affect the overall market for such securities, thereby impacting the liquidity and value of higher-rated securities.
Portfolio Turnover Risk: High portfolio turnover (generally, turnover in excess of 100% in any given fiscal year) may result in increased transaction costs to a Portfolio, which may result in higher fund expenses and lower total return.
Risk of Investing in Other Investment Companies: A Portfolio that invests in Underlying Portfolios will indirectly bear fees and expenses charged by those Underlying Portfolios, in addition to the Portfolio’s direct fees and expenses. The cost of investing in the Portfolio, therefore, may be higher than the cost of investing in a mutual fund that invests directly in individual stocks and bonds. In addition, the Portfolio’s net asset value is subject to fluctuations in the net asset value of each Underlying Portfolio. The Portfolio is also subject to the risks associated with the securities in which the Underlying Portfolios invest and the ability of the Portfolio to meet its investment objective will depend, to a significant degree, on the ability of the Underlying Portfolios to meet their objectives. The Portfolio and the Underlying Portfolios
C-22
are subject to certain general investment risks, including market risk, issuer-specific risk, investment style risk and portfolio management risk. In addition, to the extent a Portfolio invests in Underlying Portfolios that invest in equity securities, fixed income securities and/or foreign securities, the Portfolio is subject to the risks associated with investing in such securities such as equity risk, market capitalization risk, investment grade securities risk, interest rate risk, credit/default risk, foreign investing and emerging markets securities risk and lower-rated securities risk. The Underlying Portfolios may change their investment objectives or policies without the approval of the Portfolio. If that were to occur, the Portfolio might be forced to withdraw its investment from the Underlying Portfolio at a time that is unfavorable to the Portfolio.
Sector Concentration Risk: A Portfolio that invests primarily in a particular sector could experience greater volatility than funds investing in a broader range of industries.
Securities Selection Risk: The securities selected for a Portfolio may not perform as well as other securities that were not selected for a Portfolio. As a result, a Portfolio may underperform other funds with the same objective or in the same asset class.
Short Position Risk: A Portfolio may engage in short sales and may enter into derivative contracts that have a similar economic effect (e.g., taking a short position in a futures contract). A Portfolio will incur a loss as a result of a short position if the price of the asset sold short increases in value between the date of the short position sale and the date on which an offsetting position is purchased. Short positions may be considered speculative transactions and involve special risks that could cause or increase losses or reduce gains, including greater reliance on the investment adviser’s ability to accurately anticipate the future value of a security or instrument, potentially higher transaction costs, and imperfect correlation between the actual and desired level of exposure. Because a Portfolio’s potential loss on a short position arises from increases in the value of the asset sold short, the extent of such loss, like the price of the asset sold short, is theoretically unlimited. A Portfolio’s long positions could decline in value at the same time that the value of the short positions increase, thereby increasing the Portfolio’s overall potential for loss. Market factors may prevent a Portfolio from closing out a short position at the most desirable time or at a favorable price.
Technology Sector Risk: The value of the shares of a Portfolio that invests primarily in technology companies is particularly vulnerable to factors affecting the technology sector, such as dependency on consumer and business acceptance as new technology evolves, large and rapid price movements resulting from competition, rapid obsolescence of products and services and short product cycles. Many technology companies are small and at an earlier stage of development and, therefore, may be subject to risks such as those arising out of limited product lines, markets and financial and managerial resources.
Volatility Management Risk: The Manager from time to time employs various volatility management techniques, including the use of futures and options to manage equity exposure. The success of the Portfolio’s volatility management strategy will be subject to the Manager’s ability to correctly assess the degree of correlation between
C-23
the performance of the relevant market index and the metrics used by the Manager to measure market volatility. Since the characteristics of many securities change as markets change or time passes, the success of the Portfolio’s volatility management strategy also will be subject to the Manager’s ability to continually recalculate, readjust, and execute volatility management techniques (such as options and futures transactions) in an efficient manner. In addition, because market conditions change, sometimes rapidly and unpredictably, the success of the volatility management strategy will be subject to the Manager’s ability to execute the strategy in a timely manner. Moreover, volatility management strategies may increase portfolio transaction costs, which could cause or increase losses or reduce gains. For a variety of reasons, the Manager may not seek to establish a perfect correlation between the relevant market index and the metrics that the Manager uses to measure market volatility. In addition, it is not possible to manage volatility fully or perfectly. Any one or more of these factors may prevent the Portfolio from achieving the intended volatility management or could cause the Portfolio to underperform or experience losses.
C-24
SECURITY OWNERSHIP OF CERTAIN BENEFICIAL OWNERS
As of the Record Date, to EQ Trust’s knowledge, the following persons owned beneficially or of record 5% or more of the Class IA, Class IB, or Class K shares of an Acquiring Portfolio.
Shareholder’s or Contractholder’s Name/Address | Percent Beneficial Ownership of Shares of the Portfolio | Percent Beneficial Ownership of Shares of the Combined Portfolio (assuming the Reorganizations occur) | ||
As of the Record Date, to VIP Trust’s knowledge, the following persons owned beneficially or of record 5% or more of the Class A, Class B, or Class K shares of an Acquired Portfolio.
Shareholder’s or Contractholder’s Name/Address | Percent Beneficial Ownership of Shares of the Portfolio | Percent Beneficial Ownership of Shares of the Combined Portfolio (assuming the Reorganizations occur) | ||
D-1
STATEMENT OF ADDITIONAL INFORMATION
, 2014
AXA PREMIER VIP TRUST
Multimanager Aggressive Equity Portfolio,
Multimanager Technology Portfolio,
Multimanager Core Bond Portfolio,
Multimanager Mid Cap Growth Portfolio,
Multimanager Mid Cap Value Portfolio,
Multimanager Large Cap Core Equity Portfolio,
Multimanager Large Cap Value Portfolio, and
Multimanager International Equity Portfolio
(each a series of AXA Premier VIP Trust)
(each, an “Acquired Portfolio” and together, the “Acquired Portfolios”)
AND
EQ ADVISORS TRUST
Multimanager Aggressive Equity Portfolio,
Multimanager Technology Portfolio,
Multimanager Core Bond Portfolio,
Multimanager Mid Cap Growth Portfolio,
Multimanager Mid Cap Value Portfolio,
EQ/Large Cap Core PLUS Portfolio,
EQ/Large Cap Value PLUS Portfolio, and
EQ/International Core PLUS Portfolio
(each a series of EQ Advisors Trust)
(each, an “Acquiring Portfolio” and together, the “Acquiring Portfolios”)
1290 Avenue of the Americas
New York, New York 10104
(877) 222-2144
Acquisition of the assets and assumption of the liabilities of: | By and in exchange for shares of: | |
Multimanager Aggressive Equity Portfolio | Multimanager Aggressive Equity Portfolio (“New Multimanager Aggressive Equity Portfolio”) | |
Multimanager Technology Portfolio | Multimanager Technology Portfolio (“New Multimanager Technology Portfolio”) | |
Multimanager Core Bond Portfolio | Multimanager Core Bond Portfolio (“New Multimanager Core Bond Portfolio”) |
Multimanager Mid Cap Growth Portfolio | Multimanager Mid Cap Growth Portfolio (“New Multimanager Mid Cap Growth Portfolio”) | |
Multimanager Mid Cap Value Portfolio | Multimanager Mid Cap Value Portfolio (“New Multimanager Mid Cap Value Portfolio”) | |
Multimanager Large Cap Core Equity Portfolio | EQ/Large Cap Core PLUS Portfolio | |
Multimanager Large Cap Value Portfolio | EQ/Large Cap Value PLUS Portfolio | |
Multimanager International Equity Portfolio | EQ/International Core PLUS Portfolio |
This Statement of Additional Information (the “SAI”) relates specifically to the proposed reorganization of each Acquired Portfolio into the corresponding Acquiring Portfolio under which the Acquiring Portfolio would acquire all of the assets of the Acquired Portfolio in exchange solely for shares of the Acquiring Portfolio and that Acquiring Portfolio’s assumption of all of the corresponding Acquired Portfolio’s liabilities (the “Reorganizations”). This SAI is available to owners of and participants in variable life insurance contracts and variable annuity contracts and certificates (the “Contracts”) with amounts allocated to an Acquired Portfolio and to other shareholders of the Acquired Portfolios as of February 28, 2014.
This SAI is not a prospectus. A Combined Proxy Statement and Prospectus dated , 2014 relating to the Reorganizations (the “Proxy Statement/Prospectus”) may be obtained, without charge, by writing to EQ Advisors Trust (“EQ Trust”) or AXA Premier VIP Trust (“VIP Trust”) at 1290 Avenue of the Americas, New York, New York 10104 or calling 1-877-522-5035. This SAI should be read in conjunction with the Proxy Statement/Prospectus.
Contents of the SAI
The Statement of Additional Information of EQ Trust dated May 1, 2013, as supplemented, with respect to the EQ/Large Cap Core PLUS, EQ/Large Cap Value PLUS, and EQ/International Core PLUS Portfolios. The Statement of Additional Information of VIP Trust dated May 1, 2013, as supplemented, with respect to the Acquired Portfolios. The Statements of Additional Information include information about EQ Trust’s and VIP Trust’s other portfolios that is not relevant to the Reorganizations. Please disregard that information.
The Statement of Additional Information of EQ Trust with respect to the New Multimanager Aggressive Equity, New Multimanager Technology, New Multimanager Core Bond, New Multimanager Mid Cap Growth, and New Multimanager Mid Cap Value Portfolios.
Audited Financial Statements of EQ Trust and VIP Trust for the fiscal year ended December 31, 2013, with respect to the EQ/Large Cap Core PLUS, EQ/Large Cap Value PLUS, and EQ/International Core PLUS Portfolios and the Acquired Portfolios.
Pro Forma Financial Statements relating to the Reorganizations of the Multimanager Large Cap Core Equity Portfolio into the EQ/Large Cap Core PLUS Portfolio, the Multimanager Large Cap Value Portfolio into the EQ/Large Cap Value PLUS Portfolio, and the Multimanager International Equity Portfolio into the EQ/International Core PLUS Portfolio.
Information Incorporated by Reference
This SAI incorporates by reference the following documents as filed with the Securities and Exchange Commission:
Statement of Additional Information of EQ Trust dated May 1, 2013, as supplemented, with respect to the EQ/Large Cap Core PLUS, EQ/Large Cap Value PLUS, and EQ/International Core PLUS Portfolios (File Nos. 333-17217 and 811-07953).
Statement of Additional Information of VIP Trust dated May 1, 2013, as supplemented, with respect to the Acquired Portfolios (File Nos. 333-70754 and 811-10509).
Because the New Multimanager Aggressive Equity, New Multimanager Technology, New Multimanager Core Bond, New Multimanager Mid Cap Growth, and New Multimanager Mid Cap Value Portfolios have not yet commenced operations as of the date of this Proxy Statement/Prospectus, no audited financial statements are available for these Portfolios at this time.
2
EQ ADVISORS TRUSTSM
Class IA, Class IB and Class K Shares
STATEMENT OF ADDITIONAL INFORMATION
, 2014
Multimanager Aggressive Equity Portfolio Multimanager Core Bond Portfolio Multimanager Mid Cap Growth Portfolio Multimanager Mid Cap Value Portfolio Multimanager Technology Portfolio |
MASTER
(651249)
This Statement of Additional Information (“SAI”) is not a prospectus. It should be read in conjunction with the Prospectus for the EQ Advisors Trust (“Trust”) dated , 2014, as may be supplemented from time to time, which may be obtained without charge by calling AXA Equitable Life Insurance Company (“AXA Equitable”) toll-free at 1-877-222-2144 or writing to the Trust at 1290 Avenue of the Americas, New York, New York 10104. Unless otherwise defined herein, capitalized terms have the meanings given to them in the Prospectus.
The audited financial statements for the Multimanager Aggressive Equity Portfolio, Multimanager Core Bond Portfolio, Multimanager Mid Cap Growth Portfolio, Multimanager Mid Cap Value Portfolio and Multimanager Technology Portfolio for the year ended December 31, 2013, including the financial highlights, appearing in the AXA Premier VIP Trust’s Annual Report to Shareholders (available without charge, upon request by calling toll-free 1-877-222-2144), filed electronically with the Securities and Exchange Commission (“SEC”) on , 2014 (File No. 811-10509), are incorporated by reference and made a part of this document.
| Page | ||||
| 3 | ||||
| 4 | ||||
| 9 | ||||
| 58 | ||||
| 61 | ||||
| 70 | ||||
| 80 | ||||
| 84 | ||||
| 85 | ||||
| 87 | ||||
| 90 | ||||
| 91 | ||||
| 92 | ||||
| A-1 | ||||
| B-1 | ||||
| C-1 | ||||
| D-1 | ||||
Appendix E — Control Persons and Principal Holders of Securities | E-1 | |||
EQ Advisors Trust is an open-end management investment company and is registered as such under the Investment Company Act of 1940, as amended (“1940 Act”). The Trust was organized as a Delaware statutory trust on October 31, 1996 under the name “787 Trust.” The Trust changed its name to “EQ Advisors Trust” effective November 25, 1996. (See “Other Information.”)
AXA Equitable Funds Management Group, LLC (the “Manager” or “FMG LLC”), currently serves as the investment manager for the Trust.
The Trust currently offers three classes of shares, Class IA, Class IB and Class K, on behalf of sixty-eight (68) portfolios. The Trust also offers Class IB and Class K shares on behalf of eighteen (18) portfolios. This SAI contains information with respect to shares of the five (5) portfolios of the Trust listed below (the “Portfolios” or the “Multimanager Portfolios”). Each of the Portfolios is diversified. The Trust’s Board of Trustees (“Board”) is permitted to create additional portfolios. The assets of the Trust received for the issue or sale of shares of each of its portfolios and all income, earnings, profits and proceeds thereof, subject to the rights of creditors, are allocated to such portfolio, and constitute the assets of such portfolio. The assets of each portfolio of the Trust are charged with the liabilities and expenses attributable to such portfolio, except that liabilities and expenses may be allocated to a particular class. Any general expenses of the Trust are allocated between or among any one or more of its portfolios or classes.
Multimanager Aggressive Equity Portfolio |
Multimanager Core Bond Portfolio |
Multimanager Mid Cap Growth Portfolio |
Multimanager Mid Cap Value Portfolio |
Multimanager Technology Portfolio |
Class K shares are offered at net asset value and are not subject to distribution fees imposed pursuant to a distribution plan. Class IA and Class IB shares are offered at net asset value and are subject to fees imposed under distribution plans adopted pursuant to Rule 12b-1 under the 1940 Act (“Rule 12b-1 Distribution Plans”). Each class of shares is offered under the Trust’s multi-class distribution system, which is designed to allow promotion of insurance products investing in the Trust through alternative distribution channels. Under the Trust’s multi-class distribution system, shares of each class of a Portfolio represent an equal pro rata interest in that Portfolio and, generally, will have identical voting, dividend, liquidation, and other rights, preferences, powers, restrictions, limitations, qualifications and terms and conditions, except that: (a) each class has a different designation; (b) each class bears its “Class Expenses”; (c) each class has exclusive voting rights on any matter submitted to shareholders that relates solely to its distribution arrangements; (d) each class has separate voting rights on any matter submitted to shareholders in which the interests of one class differ from the interests of any other class; (e) each class may have separate exchange privileges, although exchange privileges are not currently contemplated; and (f) each class may have different conversion features, although a conversion feature is not currently contemplated. Expenses currently designated as “Class Expenses” by the Board under the plan pursuant to Rule 18f-3 under the 1940 Act are currently limited to payments made to the Distributor for the Class IA and Class IB shares pursuant to the Rule 12b-1 Distribution Plans.
The Trust’s shares may be sold to insurance company separate accounts in connection with variable life insurance contracts and variable annuity certificates and contracts (“Contracts”) issued by AXA Equitable or other affiliated or unaffiliated insurance companies and, to the extent permitted by applicable law, to tax-qualified retirement plans, other series of the Trust and series of AXA Premier VIP Trust, a separate registered investment company managed by the Manager that currently sells its shares to such accounts and plans. Shares of each Portfolio also may be sold to any other person who may hold such shares and not preclude the Portfolio from using a certain “look-through” rule under applicable regulations under the Internal Revenue Code of 1986, as amended (“Code”) described in the section of this SAI entitled “Taxation”. Class K shares of the Trust are sold only to other Portfolios of the Trust, portfolios of AXA Premier VIP Trust and certain group annuity and retirement plans.
3
The Trust does not currently foresee any disadvantage to Contract owners arising from offering the Trust’s shares to separate accounts of insurance companies that are unaffiliated with one another or the 401(k) plan sponsored by AXA Equitable (the “Equitable Plan”) or other tax-qualified retirement plans. However, it is theoretically possible that the interests of owners of various Contracts participating in the Trust through separate accounts or of Equitable Plan or other tax-qualified retirement plan participants might at some time be in conflict. In the case of a material irreconcilable conflict, one or more separate accounts or the Equitable Plan or other tax-qualified retirement plan might withdraw their investments in the Trust, which might force the Trust to sell portfolio securities at disadvantageous prices. The Board will monitor the Portfolios for the existence of any material irreconcilable conflicts between or among such separate accounts, the Equitable Plan and other tax-qualified retirement plans and will take whatever remedial action may be necessary.
Fundamental Restrictions
Each Portfolio has also adopted certain investment restrictions that are fundamental and may not be changed without approval by a “majority” vote of each Portfolio’s shareholders. Such majority is defined in the 1940 Act as the lesser of: (i) 67% or more of the voting securities of such Portfolio present in person or by proxy at a meeting, if the holders of more than 50% of the outstanding voting securities are present or represented by proxy; or (ii) more than 50% of the outstanding voting securities of such Portfolio.
Set forth below are each of the fundamental restrictions adopted by each of the Multimanager Portfolios.
Each Portfolio may not as a matter of fundamental policy:
| (1) | Purchase securities of any one issuer if, as a result, more than 5% of the Portfolio’s total assets would be invested in securities of that issuer or the Portfolio would own or hold more than 10% of the outstanding voting securities of that issuer, except that up to 25% of the Portfolio’s total assets may be invested without regard to this limitation, and except that this limitation does not apply to securities issued or guaranteed by the U.S. Government, its agencies and instrumentalities or to securities issued by other investment companies. |
The following interpretations apply to, but are not a part of, this fundamental restriction:
(i) mortgage- and asset-backed securities will not be considered to have been issued by the same issuer by reason of the securities having the same sponsor, and mortgage- and asset-backed securities issued by a finance or other special purpose subsidiary that are not guaranteed by the parent company will be considered to be issued by a separate issuer from the parent company and (ii) each Portfolio will not consider repurchase agreements to be subject to the above-stated 5% limitation if the collateral underlying the repurchase agreements consists exclusively of obligations issued or guaranteed by the United States Government, its agencies or instrumentalities.
| (2) | Purchase any security if, as a result of that purchase, 25% or more of the Portfolio’s total assets would be invested in securities of issuers having their principal business activities in the same industry, except that this limitation does not apply to securities issued or guaranteed by the U.S. Government, its agencies or instrumentalities or to municipal securities and except that the Multimanager Technology Portfolio, under normal circumstances, will invest 25% or more of its total assets in the related group of industries consisting of the technology industries (e.g., computers, electronics (including hardware and components), communications, software, e-commerce, information service, biotechnology, chemical products and synthetic materials, and defense and aerospace industries). |
The following interpretation applies to, but is not part of, this fundamental restriction. Industries generally are determined by reference to the classifications of industries set forth in a Portfolio’s shareholder report. Investment companies are not considered an industry for purposes of this restriction. With respect to each Portfolio’s investments in options, futures, swaps and other derivative transactions, industries may be determined by reference to the industry of the reference asset.
4
| (3) | Issue senior securities or borrow money, except as permitted under the 1940 Act, and then not in excess of 33 1/3% of the Portfolio’s total assets (including the amount of the senior securities issued but reduced by any liabilities not constituting senior securities) at the time of the issuance or borrowing, except that each Portfolio may borrow up to an additional 5% of its total assets (not including the amount borrowed) for temporary purposes such as clearance of portfolio transactions and share redemptions. For purposes of these restrictions, the purchase or sale of securities on a “when-issued,” delayed delivery or forward commitment basis, the purchase and sale of options and futures contracts and collateral arrangements with respect thereto are not deemed to be the issuance of a senior security, a borrowing or a pledge of assets. |
| (4) | Make loans, except loans of portfolio securities or cash or through repurchase agreements, provided that for purposes of this restriction, the acquisition of bonds, debentures, other debt securities or instruments, or participations or other interests therein and investments in government obligations, commercial paper, certificates of deposit, bankers’ acceptances or similar instruments will not be considered the making of a loan. |
| (5) | Engage in the business of underwriting securities of other issuers, except to the extent that the Portfolio might be considered an underwriter under the federal securities laws in connection with its disposition of portfolio securities. |
| (6) | Purchase or sell real estate, except that investments in securities of issuers that invest in real estate and investments in mortgage-backed securities, mortgage participations or other instruments supported by interests in real estate are not subject to this limitation, and except that each Portfolio may exercise rights under agreements relating to such securities, including the right to enforce security interests and to hold real estate acquired by reason of such enforcement until that real estate can be liquidated in an orderly manner. |
| (7) | Purchase or sell physical commodities unless acquired as a result of owning securities or other instruments, but each Portfolio may purchase, sell or enter into financial options and futures, forward and spot currency contracts, swap transactions and other financial contracts or derivative instruments. |
The following investment restrictions apply to each of the Multimanager Portfolios, but are not fundamental. They may be changed for any Portfolio by the Board and without a vote of that Portfolio’s shareholders.
Each Portfolio may not:
| (1) | Invest more than 15% of its net assets in illiquid securities. |
| (2) | Purchase securities on margin, except for short-term credit necessary for clearance of portfolio transactions and except that each Portfolio may make margin deposits or post other forms of collateral in connection with its use of financial options and futures, forward and spot currency contracts, swap transactions and other financial contracts or derivative instruments, and short positions. |
| (3) | Engage in short sales of securities or maintain a short position, except that each Portfolio may (a) engage in covered short sales and (b) maintain short positions in connection with its use of financial options and futures, forward and spot currency contracts, swap transactions and other financial contracts or derivative instruments. |
| (4) | Purchase securities of other investment companies, except to the extent permitted by the 1940 Act and the rules and orders thereunder and except that (i) this limitation does not apply to securities received or acquired as dividends, through offers of exchange, or as a result of reorganization, consolidation, or merger and (ii) each Portfolio may not acquire any securities of registered open-end investment companies or registered unit investment trusts in reliance on Sections 12(d)(1)(F) or (G) of the 1940 Act. |
| (5) | Purchase portfolio securities while borrowings in excess of 5% of its total assets are outstanding. |
5
Each Portfolio may, notwithstanding any fundamental or non-fundamental investment policy or limitation, invest all of its assets in the securities of a single open-end management investment company with substantially the same investment objective, policies and limitations as the Portfolio.
The Multimanager Aggressive Equity Portfolio, Multimanager Core Bond Portfolio, Multimanager Mid Cap Growth Portfolio, Multimanager Mid Cap Value Portfolio and Multimanager Technology Portfolio each has a policy that it will invest at least 80% of its net assets, plus borrowings for investment purposes, in a particular type of investment, as more fully set forth in the Prospectus. Each such policy is subject to change only upon at least sixty (60) days’ prior notice to shareholders of the affected Portfolio to the extent required by SEC rules.
Certain of the Portfolios have investment policies, limitations, or practices that are applicable “normally” or under “normal circumstances” or “normal market conditions” (as stated above and elsewhere in this SAI or in the Portfolios’ Prospectus). Pursuant to the discretion of FMG LLC and a Portfolio’s sub-adviser(s), if any, these investment policies, limitations, or practices may not apply during periods of abnormal purchase or redemption activity or during periods of unusual or adverse market, economic, political or other conditions. Such market, economic or political conditions may include periods of abnormal or heightened market volatility, strained credit and/or liquidity conditions, or increased governmental intervention in the markets or industries. These conditions may impact the markets or economy broadly or may be more focused in impacting particular industries, groups or parties, including impacting the Trust alone. During such periods, a Portfolio may not invest according to its principal investment strategies or in the manner in which its name may suggest, and may be subject to different and/or heightened risks. It is possible that such unusual or adverse conditions may continue for extended periods of time.
INVESTMENT STRATEGIES AND RISKS
In addition to the Portfolios’ principal investment strategies discussed in the Prospectus, each Portfolio may engage in other types of investment strategies as further described below and as indicated in Appendix A. Each Portfolio may invest in or utilize any of these investment strategies and instruments or engage in any of these practices except where otherwise prohibited by law or the Portfolio’s own investment restrictions.
Asset-Backed Securities. As indicated in Appendix A, certain of the Portfolios may invest in asset-backed securities. Asset-backed securities, issued by trusts and special purpose corporations, are collateralized by a pool of assets, such as credit card or automobile loans, home equity loans or computer leases, and represent the obligations of a number of different parties. Asset-backed securities can also be collateralized by a single asset (e.g. a loan to a specific corporation). Asset-backed securities that represent an interest in a pool of assets provide greater credit diversification than those representing an interest in a single asset. Certain asset-backed securities may include securities backed by pools of loans made to borrowers with blemished credit histories (“subprime” loans). The underwriting standards for subprime loans may be lower and more flexible than the standards generally used by lenders for borrowers with non-blemished credit histories with respect to the borrower’s credit standing and repayment history. Asset-backed securities present certain risks. For instance, in the case of credit card receivables, these securities are generally unsecured and the debtors are entitled to the protection of a number of state and federal consumer credit laws, many of which give such debtors the right to set off certain amounts owed on the credit cards, thereby reducing the balance due. Certain collateral may be difficult to locate in the event of default, and recoveries of depreciated or damaged collateral may not fully cover payments due on such collateral. In the case of automobile loans, most issuers of automobile receivables permit the servicers to retain possession of the underlying obligations. If the servicer were to sell these obligations to another party, there is a risk that the purchaser would acquire an interest superior to that of the holders of the related automobile receivables. In addition, because of the large number of vehicles involved in a typical issuance and technical requirements under state laws, the trustee for the holders of the automobile receivables may not have a proper security interest in all of the obligations backing such receivables. Therefore, there is the possibility that recoveries on repossessed collateral may not, in some cases, be available to support payments on these securities. If a Portfolio purchases asset-backed securities that are “subordinated” to other interests in the same pool of assets, the Portfolio as a holder of those securities may only receive payments after the pool’s obligations to other investors have been satisfied. The subordinated securities may be more illiquid and less stable than other asset-backed securities.
6
The credit quality of asset-backed securities depends primarily on the quality of the underlying assets, the rights of recourse available against the underlying assets and/or the issuer, the level of credit enhancement, if any, provided for the securities, and the credit quality of the credit-support provider, if any. To lessen the effect of failures by obligors on underlying assets to make payments, the securities may contain elements of credit support which fall into two categories: (i) liquidity protection and (ii) protection against losses resulting from ultimate default by an obligor on the underlying assets. Liquidity protection refers to the provision of advances, generally by the entity administering the pool of assets, to ensure that the receipt of payments on the underlying pool occurs in a timely fashion. Protection against losses resulting from ultimate default ensures payment through insurance policies or letters of credit obtained by the issuer or sponsor from third parties. A Portfolio will not pay any additional or separate fees for credit support. The degree of credit support provided for each issue is generally based on historical information respecting the level of credit risk associated with the underlying assets. Delinquency or loss in excess of that anticipated or failure of the credit support could adversely affect the return on an investment in such a security. In addition, the risk of default by borrowers is greater during times of rising interest rates and/or unemployment rates and generally is higher in the case of asset pools that include subprime assets.
Asset-backed securities may be subject to interest rate risk and prepayment risk. In a period of declining interest rates, borrowers may prepay the underlying assets more quickly than anticipated, thereby reducing the yield to maturity and the average life of the asset-backed securities. Moreover, when a Portfolio reinvests the proceeds of a prepayment in these circumstances, it will likely receive a rate of interest that is lower than the rate on the security that was prepaid. In a period of rising interest rates, prepayments of the underlying assets may occur at a slower than expected rate, creating maturity extension risk. This particular risk may effectively change a security that was considered short- or intermediate-term at the time of purchase into a longer term security. Since the value of longer-term securities generally fluctuates more widely in response to changes in interest rates than does the value of shorter term securities, maturity extension risk could increase the volatility of a Portfolio.
Due to the possibility that prepayments (on automobile loans and other collateral) will alter the cash flow on asset-backed securities, it is not possible to determine in advance the actual final maturity date or average life. Faster prepayment will shorten the average life and slower prepayments will lengthen it. However, it is possible to determine what the range of that movement could be and to calculate the effect that it will have on the price of the security. In selecting these securities, the Adviser will look for those securities that offer a higher yield to compensate for any variation in average maturity.
Bank Loans. Certain of the Portfolios may invest in bank loans. A bank loan represents an interest in a loan or other direct indebtedness that entitles the acquirer of such interest to payments of interest, principal and/or other amounts due under the structure of the loan. A Portfolio may acquire a bank loan through (1) a participation interest, which gives the Portfolio the right to receive payments of principal, interest and/or other amounts only from the lender selling the participation interest and only when the lender receives the payments from the borrower, or (2) an assignment in which a Portfolio succeeds to the rights of the assigning lender and becomes a lender under the loan agreement. In connection with purchasing participations, a Portfolio generally will have no right to enforce compliance by the borrower with the terms of the loan agreement relating to the loans, nor any rights of set-off against the borrower, and the Portfolio may not benefit directly from any collateral supporting the loan in which it has purchased the participation. As a result, a Portfolio will assume the credit risk of both the borrower and the lender that is selling the participation. When a Portfolio purchases assignments from lenders, the Portfolio will acquire direct rights against the borrower on the loan, and will not have exposure to a counterparty’s credit risk.
Bank loans are typically borrowers’ senior debt obligations and, as such, are considered to hold a senior position in the borrower’s capital structure. The senior capital structure position generally gives the holders of bank loans a priority claim on some or all of the borrower’s assets in the event of a default. In many situations, the assets or cash flow of the borrowing corporation, partnership or other business entity may serve as collateral for the bank loan. When a Portfolio has an interest in certain types of bank loans, a Portfolio may have an obligation to make additional loans upon demand by the borrower. These
7
commitments may have the effect of requiring a Portfolio to increase its investment in a borrower at a time when it would not have otherwise done so. Bank loans may be issued in connection with acquisitions, refinancings and recapitalizations.
A Portfolio’s investments in bank loans are subject to the risk that the Portfolio will not receive payment of interest, principal and other amounts due in connection with these investments and will depend primarily on the financial condition of the borrower. Fully secured bank loans offer a Portfolio more protection than unsecured bank loans in the event of nonpayment of scheduled interest or principal, although there is no assurance that the liquidation of a secured bank loan’s collateral would satisfy the borrower’s obligation or that the collateral could be readily liquidated. In addition, a Portfolio’s access to collateral may be limited by bankruptcy or other insolvency laws. In the case of a bankruptcy, a Portfolio may not recover its principal, may experience a substantial delay in recovering its investment and may not receive interest during the delay. Unsecured bank loans are subject to a greater risk of default than secured bank loans, especially during periods of deteriorating economic conditions. Unsecured bank loans also have a greater risk of nonpayment in the event of a default than secured bank loans since there is no recourse for the lender to collateral.
A Portfolio may have difficulty disposing of assignments and participations. In certain cases, the market for such instruments is not highly liquid, and in such cases such instruments could be sold only to a limited number of institutional investors. The lack of a highly liquid secondary market may have an adverse impact on the value of such instruments and on a Portfolio’s ability to dispose of particular assignments or participations in response to a specific economic event, such as deterioration in the creditworthiness of the borrower.
Lending financial institutions often act as agents for broader groups of lenders, generally referred to as a syndicate. The syndicate’s agent arranges the loans, holds collateral and accepts payments of interest and principal. If the syndicate’s agent develops financial problems, a Portfolio may not recover its investment or its recovery may be substantially delayed.
A Portfolio may be required to pay and may receive various commissions and fees in the process of purchasing, holding and selling bank loans. Such fees may include arrangement fees, facility fees, and letter of credit fees. Arrangement fees are paid at the start of a loan as compensation for the initiation of the loan. Facility fees are ongoing annual fees paid in connection with a loan. Letter of credit fees are paid if a loan involves a letter of credit.
If state or federal regulators or legislation impose additional restrictions or requirements on the ability of financial institutions to make loans considered highly leveraged transactions, the availability of bank loans for investments may be adversely affected and such restrictions or requirements could reduce sources of financing for certain borrowers, which would increase the risk of default. In addition, if state or federal regulators or legislation subject bank loans that are considered to be highly leveraged to increased regulatory scrutiny or require financial institutions to dispose of such bank loans, financial institutions may decide to sell such bank loans. Such sales by financial institutions may not be at desirable prices and if a Portfolio attempts to sell a bank loan at the same time, the price the Portfolio could get for the bank loan may be adversely affected.
Bonds. As indicated in Appendix A, certain of the Portfolios may invest in one or more types of bonds. Bonds are fixed or variable rate debt obligations, including bills, notes, debentures, money market instruments and similar instruments and securities. Mortgage- and asset-backed securities are types of bonds, and certain types of income-producing, non-convertible preferred stocks may be treated as bonds for investment purposes. Bonds generally are used by corporations, governments and other issuers to borrow money from investors. The issuer pays the investor a fixed or variable rate of interest and normally must repay the amount borrowed on or before maturity. Many preferred stocks and some bonds are “perpetual” in that they have no maturity date.
Bonds are subject to interest rate risk and credit risk. Interest rate risk is the risk that interest rates will rise and that, as a result, bond prices will fall, lowering the value of a Portfolio’s investments in bonds. If interest rates move sharply in a manner not anticipated by Portfolio’s management, a Portfolio’s investments in bonds could be adversely affected. In general, bonds having longer durations are more sensitive to interest
8
rate changes than are bonds with shorter durations. During periods of rising interest rates, the average life of certain bonds is extended because of slower than expected principal payments. This may lock in a below-market interest rate and extend the duration of these bonds, especially mortgage-related securities, making them more sensitive to changes in interest rates. As a result, in a period of rising interest rates, these securities may exhibit additional volatility and lose value. This is known as extension risk.
Credit risk is the risk that an issuer will not make timely payments of principal and interest on the bond. The degree of credit risk depends on the issuer’s financial condition and on the terms of the debt securities. Changes in an issuer’s credit rating or the market’s perception of an issuer’s creditworthiness may also affect the value of a Portfolio’s investment in that issuer.
Brady Bonds. As indicated in Appendix A, certain of the Portfolios may invest in Brady Bonds. Brady Bonds are fixed income securities created through the exchange of existing commercial bank loans to foreign entities for new obligations in connection with debt restructuring under a plan introduced by Nicholas F. Brady when he was the United States Secretary of the Treasury. Brady Bonds may be collateralized or uncollateralized and issued in various currencies (although most are U.S. dollar-denominated) and they are actively traded in the over the counter (“OTC”) secondary market. Brady Bonds are not considered to be U.S. Government securities.
U.S. dollar-denominated, collateralized Brady Bonds, which may be fixed rate par bonds or floating rate discount bonds, are generally collateralized in full as to principal by U.S. Treasury zero-coupon bonds having the same maturity as the Brady Bonds. Interest payments on these Brady Bonds generally are collateralized on a one-year or longer rolling-forward basis by cash or securities in an amount that, in the case of fixed rate bonds, is equal to at least one year of interest payments or, in the case of floating rate bonds, initially is equal to at least one year’s interest payments based on the applicable interest rate at that time and is adjusted at regular intervals thereafter. Certain Brady Bonds are entitled to “value recovery payments” in certain circumstances, which in effect constitute supplemental interest payments but generally are not collateralized. For example, some Mexican and Venezuelan Brady Bonds include attached value recovery options, which increase interest payments if oil revenues rise. Brady Bonds are often viewed as having three or four valuation components: (i) the collateralized repayment of principal at final maturity; (ii) the collateralized interest payments; (iii) the uncollateralized interest payments; and (iv) any uncollateralized repayment of principal at maturity (the uncollateralized amounts constitute the “residual risk”).
Brady Bonds involve various risk factors described in this SAI associated with investing in foreign securities, including the history of defaults with respect to commercial bank loans by public and private entities of countries issuing Brady Bonds. In light of the residual risk of Brady Bonds and, among other factors, the history of defaults, investments in Brady Bonds are considered speculative. There can be no assurance that Brady Bonds in which a Portfolio may invest will not be subject to restructuring arrangements or to requests for new credit, which may cause the Portfolio to suffer a loss of interest or principal on any of its holdings. Each Portfolio will invest in Brady Bonds only if they are consistent with quality specifications established from time to time by the Advisers to that Portfolio.
Collateralized Debt Obligations. Certain of the Portfolios may invest in collateralized debt obligations (“CDOs”), which include collateralized bond obligations (“CBOs”), collateralized loan obligations (“CLOs”) and other similarly structured securities. CDOs are types of asset-backed securities. A CBO is ordinarily issued by a trust or other special purpose entity (“SPE”) and is typically which is backed by a diversified pool of high risk, below investment grade fixed income securities. The collateral can be from many different types of fixed income securities such as high yield debt, residential privately issued mortgage-related securities, commercial privately issued mortgage-related securities, trust preferred securities and emerging market debt. A CLO is ordinarily issued by a trust or other SPE and is typically collateralized by a pool of loans, which may include, among others, domestic and foreign senior secured loans, senior unsecured loans, and subordinate corporate loans, including loans that may be rated below investment grade or equivalent unrated loans. Other CDOs are trusts backed by other types of assets representing obligations of various parties. Although certain CDOs may benefit from credit enhancement in the form of a senior-subordinate structure, overcollateralization or bond insurance, such enhancement may not always be present, and may fail to protect a Portfolio against the risk of loss on
9
default of the collateral. Certain CDO issuers may use derivatives contracts to create “synthetic” exposure to assets rather than holding such assets directly, which entails the risks of derivative instruments described elsewhere in this SAI. CBOs, CLOs and other CDOs may charge management fees and administrative expenses, which are in addition to those of a Portfolio.
For both CBOs, CLOs and other CDOs, the cash flows from the trust or SPE are split into two or more portions, called tranches, varying in risk and yield. The riskiest portion is the “equity” tranche, which bears the bulk of defaults from the bonds or loans in the trust and serves to protect the other, more senior tranches from default in all but the most severe circumstances. Since it is partially protected from defaults, a senior tranche from a CBO trust or CLO trust or trust of another CDO typically has higher ratings and lower yields than its underlying securities, and may be rated investment grade. Despite the protection from the equity tranche, CBO, CLO or other CDO tranches can experience substantial losses due to actual defaults, downgrades of the underlying collateral by rating agencies, forced liquidation of the collateral pool due to a failure of coverage tests, increased sensitivity to defaults due to collateral default and disappearance of protecting tranches, market anticipation of defaults, as well as aversion to CBO, CLO or other CDO securities as a class. Interest on certain tranches of a CDO may be paid in kind or deferred and capitalized (paid in the form of obligations of the same type rather than cash), which involves continued exposure to default risk with respect to such payments.
The risks of an investment in a CDO can be significant and depend largely on the type of the collateral securities and the class of the CPO which a Portfolio invests. Normally, CDOs are privately offered and sold, and thus, are not registered under the securities laws. As a result, investments in CDOs may be characterized by the Portfolios as illiquid securities; however, an active dealer market may exist for CDOs allowing them to qualify for Rule 144A (under the 1933 Act) transactions. In addition to the normal risks associated with fixed income securities and asset-backed securities discussed elsewhere in this SAI and the Portfolios’ Prospectus (e.g., interest rate risk and credit risk), CDOs carry additional risks including, but not limited to: (i) the possibility that distributions from collateral securities will not be adequate to make interest or other payments; (ii) the quality of the collateral may decline in value or default or be downgraded if rated by a rating agency; (iii) the risk that Portfolios may invest in tranches of CDOs that are subordinate to other classes; (iv) the complex structure of the security may not be fully understood at the time of investment and may produce disputes with the issuer or unexpected investment results; and (v) the investment return achieved by a Portfolio could be significantly different from return predicted by financial models and (vi) the lack of a readily available secondary market for CDOs.
Convertible Securities. As indicated in Appendix A, certain of the Portfolios may invest in convertible securities, including both convertible debt and convertible preferred stock. A convertible security is a bond, debenture, note, preferred stock or other security that may be converted into or exchanged for a prescribed amount of common stock or other equity security of the same or a different issuer within a particular period of time at a specified price or formula. A convertible security entitles the holder to receive interest paid or accrued on debt or the dividend paid on preferred stock until the convertible security matures or is redeemed, converted or exchanged. Before conversion, convertible securities have characteristics similar to nonconvertible income securities in that they ordinarily provide a stable stream of income with generally higher yields than those of commons stocks of the same or similar issuers, but lower yields than comparable nonconvertible securities. The value of a convertible security is influenced by changes interest rates, with investment value declining as interest rates increase and increasing as interest rates decline. The credit standing of the issuer and other factors also may have an effect on the convertible security’s investment value. Convertible securities are subordinate in rank to any senior debt obligations of the same issuer and, therefore, an issuer’s convertible securities entail more risk than its debt obligations.
Convertible securities have unique investment characteristics in that they generally (1) have higher yields than common stocks, but lower yields than comparable nonconvertible securities, (2) are less subject to fluctuation in value than the underlying stock because they have fixed income characteristics and (3) provide the potential for capital appreciation if the market price of the underlying common stock increases. While no securities investment is without some risk, investments in convertible securities generally entail
10
less risk than the issuer’s common stock. However, the extent to which such risk is reduced depends in large measure upon the degree to which the convertible security sells above its value as a fixed income security.
If the convertible security’s “conversion value,” which is the market value of the underlying common stock that would be obtained upon the conversion of the convertible security, is substantially below the “investment value,” which is the value of a convertible security viewed without regard to its conversion feature (i.e., strictly on the basis of its yield), the price of the convertible security is governed principally by its investment value. If the conversion value of a convertible security increases to a point that approximates or exceeds its investment value, the value of the security will be principally influenced by its conversion value. A convertible security will sell at a premium over its conversion value to the extent investors place value on the right to acquire the underlying common stock while holding an income-producing security.
A convertible security may be subject to redemption at the option of the issuer at a price established in the convertible security’s governing instrument. If a convertible security held by a Portfolio is called for redemption, the Portfolio will be required to permit the issuer to redeem the security, convert it into underlying common stock or sell it to a third party. Certain convertible debt securities may provide a put option to the holder, which entitles the holder to cause the security to be redeemed by the issuer at a premium over the stated principal amount of the debt security under certain circumstances.
Investments by certain of the Portfolios in convertible debt securities are not subject to any ratings restrictions, although each Adviser will consider such ratings, and any changes in such ratings, in its determination of whether a Portfolio should invest and/or continue to hold the securities.
Before conversion, convertible securities have characteristics similar to nonconvertible income securities in that they ordinarily provide a stable stream of income with generally higher yields than those of commons stocks of the same or similar issuers, but lower yields than comparable nonconvertible securities. The value of a convertible security is influenced by changes interest rates, with investment value declining as interest rates increase and increasing as interest rates decline. The credit standing of the issuer and other factors also may have an effect on the convertible security’s investment value. Convertible securities are subordinate in rank to any senior debt obligations of the same issuer and, therefore, an issuer’s convertible securities entail more risk than its debt obligations.
Credit and Liquidity Enhancements. As indicated in Appendix A, certain of the Portfolios may invest in securities that have credit or liquidity enhancements or may purchase these types of enhancements in the secondary market. Such enhancements may be structured as demand features that permit the Portfolio to sell the instrument at designated times and prices. These credit and liquidity enhancements may be backed by letters of credit or other instruments provided by banks or other financial institutions whose credit standing affects the credit quality of the underlying obligation. Changes in the credit quality of these financial institutions could cause losses to a Portfolio and affect its share price. The credit and liquidity enhancements may have conditions that limit the ability of a Portfolio to use them when the Portfolio wishes to do so.
Depositary Receipts. As indicated in Appendix A, certain of the Portfolios may invest in depositary receipts. Depositary receipts exist for many foreign securities and are securities representing ownership interests in securities of foreign companies (an “underlying issuer”) and are deposited with a securities depositary. Depositary receipts are not necessarily denominated in the same currency as the underlying securities. Depositary receipts include American Depositary Receipts (“ADRs”), Global Depositary Receipts (“GDRs”) European Depositary Receipts (“EDRs”) and other types of depositary receipts (which, together with ADRs and GDRs, are hereinafter collectively referred to as “Depositary Receipts”). ADRs are dollar-denominated Depositary Receipts typically issued by a United States financial institution which evidence ownership interests in a security or pool of securities issued by a foreign issuer. ADRs are listed and traded in the United States. GDRs and other types of Depositary Receipts are typically issued by foreign banks or trust companies, although they also may be issued by U.S. financial institutions, and evidence ownership interests in a security or pool of securities issued by either a foreign or a United States corporation. EDRs, which are sometimes called Continental Depositary Receipts, are receipts issued in Europe, typically by foreign banks or trust companies, that evidence ownership of either foreign or domestic underlying securities. Generally, Depositary Receipts in registered form are designed for use in
11
the U.S. securities market and Depositary Receipts in bearer form are designed for use in securities markets outside the United States. Depositary Receipts generally are subject to the same risks as the foreign securities that they evidence or into which they may be converted.
Depositary Receipts may be “sponsored” or “unsponsored.” Sponsored Depositary Receipts are established jointly by a depositary and the underlying issuer, whereas unsponsored Depositary Receipts may be established by a depositary without participation by the underlying issuer. Holders of an unsponsored Depositary Receipt generally bear all the costs associated with establishing the unsponsored Depositary Receipt. In addition, the issuers of the securities underlying unsponsored Depositary Receipts are not obligated to disclose information that is, in the U.S., considered material. Therefore, there may be less information available regarding such issuers and there may not be a correlation between such information and the market value of the Depositary Receipts. For purposes of a Portfolio’s investment policies, the Portfolio’s investment in Depositary Receipts will be deemed to be investments in the underlying securities except as noted.
Derivatives. Each Portfolio may use a variety of financial instruments that derive their value from the value of one or more underlying assets, reference rates or indices (“Derivative Instruments”), including certain options, futures contracts and swap transactions. A Portfolio may enter into transactions involving one or more types of Derivative Instruments under which the full value of its portfolio is at risk. Under normal circumstances, however, a Portfolio’s use of these instruments will place at risk a smaller portion of its assets. Further information about these instruments and the risks involved in their use are contained under the description of each of these instruments below.
A Portfolio might not use any Derivative Instruments or derivative strategies, and there can be no assurance that using any strategy will succeed. If a portfolio manager is incorrect in his or her judgment on market values, interest rates or other economic factors in using a Derivative Instrument or strategy, the Portfolio may have lower net income and a net loss on the investment.
There have been numerous recent legislative and regulatory initiatives to implement a new regulatory framework for the derivatives markets.
The Dodd-Frank Wall Street Reform and Consumer Protection Act (the “Dodd-Frank Act”), enacted on July 21, 2010, has initiated a dramatic revision of the U.S. financial regulatory framework that will continue to unfold over several years. The Dodd-Frank Act covers a broad range of topics, including (among many others) a reorganization of federal financial regulators; a process intended to improve financial systemic stability and the resolution of potentially insolvent financial firms; new rules for derivatives trading; the creation of a consumer financial protection watchdog; the registration and additional regulation of hedge and private equity fund managers; and new federal requirements for residential mortgage loans. Instruments in which the Portfolios may invest, or the issuers of such instruments, may be affected by the new legislation and regulation in ways that are unforeseeable. Many of the implementing regulations have not yet been finalized. Accordingly, the ultimate impact of the Dodd-Frank Act, including on the derivative instruments in which a Portfolio may invest, is not yet certain.
The statutory provisions of the Dodd-Frank Act significantly change in several respects the ways in which investment products are marketed, sold, settled (or “cleared”) or terminated. In particular, the Dodd-Frank Act mandates the elimination of references to credit ratings in numerous securities laws, including the 1940 Act. Certain swap derivatives have been and other derivatives may be mandated for central clearing under the Dodd-Frank Act, which likely will require technological and other changes to the operations of registered investment companies and the market in which they will trade. Central clearing also will entail the use of assets of a registered investment company to satisfy margin calls and this may have an effect on the performance of such a fund. The regulators have not yet issued final regulations implementing all of the Dodd-Frank Act’s margin requirements and clearing mandates.
The regulators that have been charged with the responsibility for implementing the Dodd-Frank Act (i.e., the SEC and the Commodity Futures Trading Commission (“CFTC”)) have been
12
active in proposing and adopting regulations and guidance on the use of derivatives by registered investment companies. As discussed below, the CFTC adopted a revision to one of its rules that, as revised, either restricts the use of derivatives by a registered investment company or requires the fund’s adviser to register as a commodity pool operator (“CPO”).
Historically, advisers of registered investment companies trading commodity interests (such as futures contracts, options on futures contracts, and swaps), including the Portfolios, have been excluded from regulation as CPOs pursuant to CFTC Regulation 4.5. In February 2012, the CFTC announced substantial amendments to the permissible exclusion, and to the conditions for reliance on the permissible exclusion, from registration as a CPO. To qualify for an exclusion under these amendments to CFTC Regulation 4.5, if a Portfolio uses commodity interests (such as futures contracts, options on futures contracts, and swaps) other than for bona fide hedging purposes (as defined by the CFTC), the aggregate initial margin and premiums required to establish these positions, determined at the time the most recent position was established, may not exceed 5% of the Portfolio’s NAV (after taking into account unrealized profits and unrealized losses on any such positions and excluding the amount by which options that are “in-the-money” at the time of purchase are “in-the-money”) or, alternatively, the aggregate net notional value of those positions, determined at the time the most recent position was established, may not exceed 100% of the Portfolio’s NAV (after taking into account unrealized profits and unrealized losses on any such positions). In addition, to qualify for an exclusion, a Portfolio must satisfy a marketing test, which requires, among other things, that a Portfolio not hold itself out as a vehicle for trading commodity interests.
The Manager is registered with the SEC as an investment adviser under the 1940 Act. The Manager also is registered with the CFTC as a CPO under the Commodity Exchange Act, as amended. Being subject to dual regulation by the SEC and the CFTC may increase compliance costs and may affect Portfolio returns. The Manager serves as CPO for the [ ] Portfolios and claims an exclusion (under CFTC Regulation 4.5) from registration as a CPO with respect to others as described in the Prospectus. With respect to those Portfolios for which the Manager claims an exclusion, it intends to comply with one of the two alternative trading limitations described above and the marketing limitation with respect to each Portfolio. Complying with the trading limitations may restrict the Manager’s ability to use derivatives as part of these Portfolios’ investment strategies. Although the Manager expects to be able to execute each of these Portfolio’s investment strategies within the limitations, a Portfolio’s performance could be adversely affected. New rules may limit the availability of certain derivatives, may make the use of derivatives by Portfolios more costly, and may otherwise adversely impact the performance and value of derivatives.
Equity Securities. As indicated in Appendix A, certain of the Portfolios may invest in one or more types of equity securities. Equity securities include common stocks, most preferred stocks and securities that are convertible into them, including common stock purchase warrants and rights, equity interests in trusts, partnerships, joint ventures or similar enterprises and depositary receipts. Common stocks, the most familiar type, represent an equity (ownership) interest in a corporation.
Preferred stock has certain fixed income features, like a bond, but actually is an equity security that is senior to a company’s common stock. Convertible bonds may include debentures and notes that may be converted into or exchanged for a prescribed amount of common stock of the same or a different issuer within a particular period of time at a specified price or formula. Some preferred stock also may be converted into or exchanged for common stock. Depositary receipts typically are issued by banks or trust companies and evidence ownership of underlying equity securities.
While past performance does not guarantee future results, equity securities historically have provided the greatest long-term growth potential in a company. However, stock markets are volatile, and the prices of equity securities generally fluctuate more than other securities and reflect changes in a company’s financial condition as well as general market, economic and political conditions and other factors. Common stocks generally represent the riskiest investment in a company. Even investments in high quality or “blue chip” equity securities or securities of established companies with large market
13
capitalizations (which generally have strong financial characteristics) can be negatively impacted by poor economic conditions. It is possible that a Portfolio may experience a substantial or complete loss on an individual equity investment. While this is also possible with bonds, it is less likely.
Eurodollar and Yankee Dollar Obligations. As indicated in Appendix A, certain of the Portfolios may invest in Eurodollar and Yankee dollar obligations. Eurodollar bank obligations are U.S. dollar- denominated certificates of deposit and time deposits issued outside the U.S. capital markets by foreign branches of U.S. banks and by foreign banks. Yankee dollar bank obligations are U.S. dollar-denominated obligations issued in the U.S. capital markets by foreign banks.
Eurodollar and Yankee dollar obligations are subject to the same risks that pertain to domestic issues; notably credit risk, market risk and liquidity risk. Additionally, Eurodollar (and to a limited extent, Yankee dollar) obligations are subject to certain sovereign risks. One such risk is the possibility that a sovereign country might prevent capital, in the form of dollars, from flowing across its borders. Other risks include adverse political and economic developments; the extent and quality of government regulation of financial markets and institutions; the imposition of foreign withholding taxes; and the expropriation or nationalization of foreign issuers.
Event-Linked Bonds. As indicated in Appendix A, certain of the Portfolios may invest in event-linked bonds. Event-linked bonds are fixed income securities, for which the return of principal and payment of interest is contingent on the non-occurrence of a specific “trigger” event, such as a hurricane, earthquake, or other physical or weather-related phenomenon. They may be issued by government agencies, insurance companies, reinsurers, special purpose corporations or other on-shore or off-shore entities. If a trigger event causes losses exceeding a specific amount in the geographic region and time period specified in a bond, a Portfolio investing in the bond may lose a portion or all of its principal invested in the bond. If no trigger event occurs, the Portfolio will recover its principal plus interest. For some event-linked bonds, the trigger event or losses may be based on company-wide losses, index-fund losses, industry indices, or readings of scientific instruments rather than specified actual losses. Often the event-linked bonds provide for extensions of maturity that are mandatory, or optional at the discretion of the issuer, in order to process and audit loss claims in those cases where a trigger event has, or possibly has, occurred. In addition to the specified trigger events, event-linked bonds may also expose the Portfolio to certain unanticipated risks including issuer (credit) default, counterparty risk, adverse regulatory or jurisdictional interpretations, and adverse tax consequences.
Event-linked bonds are a relatively new type of financial instrument. As such, there is no significant trading history of these securities, and there can be no assurance that a liquid market in these instruments will develop. See “Illiquid Securities or Non-Publicly Traded Securities” below. Lack of a liquid market may impose the risk of higher transaction costs and the possibility that a Portfolio may be forced to liquidate positions when it would not be advantageous to do so. Event-linked bonds are typically rated, and a Portfolio will only invest in event-linked bonds that meet the credit quality requirements for the Portfolio.
Floaters and Inverse Floaters. As indicated in Appendix A, certain of the Portfolios may invest in floaters and inverse floaters, which are fixed income securities with a floating or variable rate of interest, i.e., the rate of interest varies with changes in specified market rates or indices, such as the prime rate, or at specified intervals. The interest rate on a floater resets periodically. Because of the interest rate reset feature, floaters provide a Portfolio with a certain degree of protection against rises in interest rates, but a Portfolio will participate in any declines in interest rates as well. Certain floaters may carry a demand feature that permits the holder to tender them back to the issuer of the underlying instrument, or to a third party, at par value prior to maturity. When the demand feature of certain floaters represents an obligation of a foreign entity, the demand feature will be subject to certain risks discussed under “Foreign Securities.”
In addition, certain of the Portfolios may invest in inverse floating rate obligations which are fixed income securities that have coupon rates that vary inversely at a multiple of a designated floating rate,
14
such as London Inter-Bank Offered Rate (“LIBOR”). Any rise in the reference rate of an inverse floater (as a consequence of an increase in interest rates) causes a drop in the coupon rate while any drop in the reference rate of an inverse floater causes an increase in the coupon rate. Inverse floaters may exhibit substantially greater price volatility than fixed rate obligations having similar credit quality, redemption provisions and maturity, and inverse floater collateralized mortgage obligations (“CMOs”) exhibit greater price volatility than the majority of mortgage-related securities. In addition, some inverse floater CMOs exhibit extreme sensitivity to changes in prepayments. As a result, the yield to maturity of an inverse floater CMO is sensitive not only to changes in interest rates but also to changes in prepayment rates on the related underlying mortgage assets.
Foreign Currency. As indicated in Appendix A, certain of the Portfolios may purchase securities denominated in foreign currencies, including the purchase of foreign currency on a spot (or cash) basis. A change in the value of any such currency against the U.S. dollar will result in a change in the U.S. dollar value of a Portfolio’s assets and income. In addition, although a portion of a Portfolio’s investment income may be received or realized in such currencies, the Portfolio will be required to compute and distribute its income in U.S. dollars. Therefore, if the exchange rate for any such currency declines after a Portfolio’s income has been earned and computed in U.S. dollars but before conversion and payment, the Portfolio could be required to liquidate portfolio securities to make such distributions.
Currency exchange rates may be affected unpredictably by intervention (or the failure to intervene) by U.S. or foreign governments or central banks, by currency controls or political developments in the United States or abroad. Foreign currencies in which a Portfolio’s assets are denominated may be devalued against the U.S. dollar, resulting in a loss to the Portfolio. Currency positions are not considered to be an investment in a foreign government for industry concentration purposes.
Certain Portfolios may also invest in the following types of foreign currency transactions:
Forward Foreign Currency Transactions. As indicated in Appendix A, certain of the Portfolios may engage in forward foreign currency exchange transactions. A forward foreign currency exchange contract (“forward contract”) involves an obligation to purchase or sell a specific currency at a future date, which may be any fixed number of days from the date of the contract agreed upon by the parties, at a price set at the time of the contract.
A Portfolio may enter into forward contracts for a variety of purposes in connection with the management of the foreign securities portion of its portfolio. A Portfolio’s use of such contracts will include, but not be limited to, the following situations.
First, when the Portfolio enters into a contract for the purchase or sale of a security denominated in or exposed to a foreign currency, it may desire to “lock in” the U.S. dollar price of the security. By entering into a forward contract for the purchase or sale, for a fixed amount of dollars, of the amount of foreign currency involved in the underlying security transactions, the Portfolio will be able to protect itself against a possible loss resulting from an adverse change in the relationship between the U.S. dollar and the subject foreign currency during the period between the date the security is purchased or sold and the date on which payment is made or received.
Second, when a Portfolio’s Adviser believes that one currency may experience a substantial movement against another currency, including the U.S. dollar, it may enter into a forward contract to sell or buy the amount of the former foreign currency, approximating the value of some or all of the Portfolio’s portfolio securities denominated in or exposed to such foreign currency. Alternatively, where appropriate, the Portfolio may hedge all or part of its foreign currency exposure through the use of a basket of currencies, multinational currency units, or a proxy currency where such currency or currencies act as an effective proxy for other currencies. In such a case, the Portfolio may enter into a forward contract where the amount of the foreign currency to be sold exceeds the value of the securities denominated in or exposed to such currency. The use of this basket hedging technique may be more efficient and economical than entering into separate forward contracts for each currency held in the Portfolio.
15
The precise matching of the forward contract amounts and the value of the securities involved will not generally be possible since the future value of such securities in foreign currencies will change as a consequence of market movements in the value of those securities between the date the forward contract is entered into and the date it matures. The projection of short-term currency market movement is extremely difficult, and the successful execution of a short-term hedging strategy is highly uncertain. Under normal circumstances, consideration of the prospect for currency parities will be incorporated into the diversification strategies. However, the Advisers to the Portfolios believe that it is important to have the flexibility to enter into such forward contracts when they determine that the best interests of the Portfolios will be served.
A Portfolio may enter into forward contracts for any other purpose consistent with the Portfolio’s investment objective and program. For example, a Portfolio may use foreign currency options and forward contracts to increase exposure to a foreign currency or shift exposure to foreign currency fluctuations from one country to another. However, the Portfolio will not enter into a forward contract, or maintain exposure to any such contract(s), if the amount of foreign currency required to be delivered thereunder would exceed the Portfolio’s holdings of liquid securities and currency available for cover of the forward contract(s). In determining the amount to be delivered under a contract, the Portfolio may net offsetting positions.
At the maturity of a forward contract, a Portfolio may sell the portfolio security and make delivery of the foreign currency, or it may retain the security and either extend the maturity of the forward contract (by “rolling” that contract forward) or may initiate a new forward contract. If a Portfolio retains the portfolio security and engages in an offsetting transaction, the Portfolio will incur a gain or a loss (as described below) to the extent that there has been movement in forward contract prices. If the Portfolio engages in an offsetting transaction, it may subsequently enter into a new forward contract to sell the foreign currency.
Should forward prices decline during the period between the Portfolio’s entering into a forward contract for the sale of a foreign currency and the date it enters into an offsetting contract for the purchase of the foreign currency, the Portfolio will realize a gain to the extent the price of the currency it has agreed to sell exceeds the price of the currency it has agreed to purchase. Should forward prices increase, the Portfolio will suffer a loss to the extent the price of the currency it has agreed to purchase exceeds the price of the currency it has agreed to sell.
Although each Portfolio values its assets daily in terms of U.S. dollars, it does not intend to convert its holdings of foreign currencies into U.S. dollars on a daily basis. The Portfolio will convert foreign currencies to U.S. dollars and vice versa from time to time, and investors should be aware of the costs of currency conversion. Although foreign exchange dealers do not charge a fee for conversion, they do realize a profit based on the difference (“spread”) between the prices at which they are buying and selling various currencies. Thus, a dealer may offer to sell a foreign currency to a Portfolio at one rate, while offering a lesser rate of exchange should the Portfolio desire to resell that currency to the dealer.
Forward contracts in which a Portfolio may engage include foreign exchange forwards. The consummation of a foreign exchange forward requires the actual exchange of the principal amounts of the two currencies in the contract (i.e., settlement on a physical basis). Because foreign exchange forwards are physically settled through an exchange of currencies, they are traded in the interbank market directly between currency traders (usually large commercial banks) and their customers. A foreign exchange forward generally has no deposit requirement, and no commissions are charged at any stage for trades; foreign exchange dealers realize a profit based on the difference (the spread) between the prices at which they are buying and the prices at which they are selling various currencies. When a Portfolio enters into a foreign exchange forward, it relies on the counterparty to make or take delivery of the underlying currency at the maturity of the contract. Failure by the counterparty to do so would result in the loss of any expected benefit of the transaction. A Portfolio may be required to obtain the currency that it must deliver under the foreign exchange forward through the sale of portfolio securities denominated in such currency or through conversion of other assets of a Portfolio into such currency.
16
Forward contracts in which a Portfolio may engage also include non-deliverable forwards (“NDFs”). NDFs are cash-settled, short-term forward contracts on foreign currencies (each a “Reference Currency”) that are non-convertible and that may be thinly traded or illiquid. NDFs involve an obligation to pay an amount (the “Settlement Amount”) equal to the difference between the prevailing market exchange rate for the Reference Currency and the agreed upon exchange rate (the “NDF Rate”), with respect to an agreed notional amount. NDFs have a fixing date and a settlement (delivery) date. The fixing date is the date and time at which the difference between the prevailing market exchange rate and the agreed upon exchange rate is calculated. The settlement (delivery) date is the date by which the payment of the Settlement Amount is due to the party receiving payment.
Although NDFs are similar to forward exchange forwards, NDFs do not require physical delivery of the Reference Currency on the settlement date. Rather, on the settlement date, the only transfer between the counterparties is the monetary settlement amount representing the difference between the NDF Rate and the prevailing market exchange rate. NDFs typically may have terms from one month up to two years and are settled in U.S. dollars.
NDFs are subject to many of the risks associated with derivatives in general and forward currency transactions, including risks associated with fluctuations in foreign currency and the risk that the counterparty will fail to fulfill its obligations. Although NDFs historically have been traded over-the-counter, in the future, pursuant to the Dodd-Frank Act, they may be exchange-traded. Under such circumstances, they will be centrally cleared and a secondary market for them will exist. With respect to NDFs that are centrally-cleared, an investor could lose margin payments it has deposited with the clearing organization as well as the net amount of gains not yet paid by the clearing organization if the clearing organization breaches its obligations under the NDF, becomes insolvent or goes into bankruptcy. In the event of bankruptcy of the clearing organization, the investor may be entitled to the net amount of gains the investor is entitled to receive plus the return of margin owed to it only in proportion to the amount received by the clearing organization’s other customers, potentially resulting in losses to the investor. Even if some NDFs remain traded OTC, they will be subject to margin requirements for uncleared swaps and counterparty risk common to other swaps. For more information about the risks associated with utilizing swaps, please see “Swaps.”
Foreign Currency Options, Foreign Currency Futures Contracts and Options on Futures. As indicated in Appendix A, certain of the Portfolios may also purchase and sell foreign currency futures contracts and may purchase and write exchange-traded call and put options on foreign currency futures contracts and on foreign currencies to increase exposure to a foreign currency or to shift exposure to foreign currency fluctuations from one country to another. Those Portfolios may purchase or sell exchange-traded foreign currency options, foreign currency futures contracts and related options on foreign currency futures contracts as a hedge against possible variations in foreign exchange rates. The Portfolios will write options on foreign currency or on foreign currency futures contracts only if they are “covered,” except as described below. A put on a foreign currency or on a foreign currency futures contract written by a Portfolio will be considered “covered” if, so long as the Portfolio is obligated as the writer of the put, it segregates, either on the records of the Advisers or with the Portfolio’s custodian, cash or other liquid securities equal at all times to the aggregate exercise price of the put. A call on a foreign currency or on a foreign currency futures contract written by the Portfolio will be considered “covered” only if the Portfolio segregates, either on the records of the Advisers or with the Portfolio’s custodian, cash or other liquid securities with a value equal to the face amount of the option contract and denominated in the currency upon which the call is written. EQ/Equity Growth PLUS Portfolio may also write uncovered call options on foreign currencies for cross-hedging purposes. The Portfolio will collateralize the option by segregating cash or other liquid assets in an amount not less than the value of the underlying foreign currency in U.S. dollars marked-to-market daily. A call option on a foreign currency is for cross-hedging purposes if it is designed to provide a hedge against a decline due to an adverse change in the exchange rate in the U.S. dollar value of a security which a Portfolio owns or has the right to acquire and which is denominated in the currency underlying the option.
17
Option transactions may be effected to hedge the currency risk on non-U.S. dollar-denominated securities owned by a Portfolio, sold by a Portfolio but not yet delivered or anticipated to be purchased by a Portfolio. As an illustration, a Portfolio may use such techniques to hedge the stated value in U.S. dollars of an investment in a Japanese yen-denominated security. In these circumstances, a Portfolio may purchase a foreign currency put option enabling it to sell a specified amount of yen for dollars at a specified price by a future date. To the extent the hedge is successful, a loss in the value of the dollar relative to the yen will tend to be offset by an increase in the value of the put option.
Over the Counter Options on Foreign Currency Transactions. As indicated in Appendix A, certain of the Portfolios may engage in over the counter options on foreign currency transactions. The Advisers may engage in these transactions to protect against uncertainty in the level of future exchange rates in connection with the purchase and sale of portfolio securities (“transaction hedging”) and to protect the value of specific portfolio positions (“position hedging”). Certain differences exist between foreign currency hedging instruments. Foreign currency options provide the holder the right to buy or to sell a currency at a fixed price on or before a future date. Listed options are third-party contracts (performance is guaranteed by an exchange or clearing corporation) which are issued by a clearing corporation, traded on an exchange and have standardized prices and expiration dates. Over the counter options are two-party contracts and have negotiated prices and expiration dates. A futures contract on a foreign currency is an agreement between two parties to buy and sell a specified amount of the currency for a set price on a future date. Futures contracts and listed options on futures contracts are traded on boards of trade or futures exchanges. Options traded in the OTC market may not be as actively traded as those on an exchange, so it may be more difficult to value such options. In addition, it may be difficult to enter into closing transactions with respect to options traded over the counter.
Hedging transactions involve costs and may result in losses. As indicated in Appendix A, certain of the Portfolios may also write covered call options on foreign currencies to offset some of the costs of hedging those currencies. A Portfolio will engage in over the counter options transactions on foreign currencies only when appropriate exchange traded transactions are unavailable and when, in the Adviser’s opinion, the pricing mechanism and liquidity are satisfactory and the participants are responsible parties likely to meet their contractual obligations. A Portfolio’s ability to engage in hedging and related option transactions may be limited by tax considerations (see the section entitled “Taxation”).
Transactions and position hedging do not eliminate fluctuations in the underlying prices of the securities which the Portfolios own or intend to purchase or sell. They simply establish a rate of exchange which one can achieve at some future point in time. Additionally, although these techniques tend to minimize the risk of loss due to a decline in the value of the hedged currency, they tend to limit any potential gain which might result from the increase in the value of such currency.
A Portfolio will not speculate in foreign currency options, futures or related options. Accordingly, a Portfolio will not hedge a currency substantially in excess of the market value of the securities denominated in that currency which it owns or the expected acquisition price of securities which it anticipates purchasing. OTC options on foreign currency also are considered to be swaps. For information concerning the risks associated with swaps please see “Swaps.”
Foreign Securities. As indicated in Appendix A, certain of the Portfolios may also invest in other types of foreign securities or engage in certain types of transactions related to foreign securities, such as Brady Bonds, Depositary Receipts, Eurodollar and Yankee Dollar Obligations and Foreign Currency Transactions, including forward foreign currency transactions, foreign currency options and foreign currency futures contracts and options on futures. Further information about these instruments and the risks involved in their use are contained under the description of each of these instruments in this section.
Foreign investments involve certain risks that are not present in domestic securities. For example, foreign securities may be subject to currency risks or to foreign income or other withholding taxes that reduce their attractiveness. There may be less information publicly available about a foreign issuer than about a U.S. issuer, and a foreign issuer is not generally subject to uniform accounting, auditing and financial reporting
18
standards and practices comparable to those in the United States. In addition, the governments of certain countries may prohibit or impose substantial restrictions on foreign investing in their capital markets or in certain industries. Other risks of investing in such securities include political or economic instability in the country involved, the difficulty of predicting international trade patterns and the possibility of imposition of exchange controls or limitations on the removal of funds or assets. The prices of such securities may be more volatile than those of domestic securities. With respect to certain foreign countries, there is a possibility of expropriation of assets or nationalization, imposition of withholding taxes on dividend or interest payments, difficulty in obtaining and enforcing judgments against foreign entities or diplomatic developments which could affect investment in these countries. Legal remedies available to investors in certain foreign countries may be less extensive than those available to investors in the United States or other foreign countries.
Losses and other expenses may be incurred in converting between various currencies in connection with purchases and sales of foreign securities. Generally, when the U.S. dollar rises in value against a foreign currency, a security denominated in that currency loses value because the currency is worth fewer U.S. dollars. Conversely, when the U.S. dollar decreases in value against a foreign currency, a security denominated in that currency gains value because the currency is worth more U.S. dollars. This risk, generally known as “currency risk,” means that a stronger U.S. dollar will reduce returns for U.S. investors while a weak U.S. dollar will increase those returns.
Foreign stock markets are generally not as developed or efficient as, and may be more volatile than, those in the United States. While growing in volume, they usually have substantially less volume than U.S. markets and a Portfolio’s investment securities may be less liquid and subject to more rapid and erratic price movements than securities of comparable U.S. companies. Equity securities may trade at price/earnings multiples higher than comparable U.S. securities and such levels may not be sustainable. There is generally less government supervision and regulation of foreign stock exchanges, brokers, banks and listed companies abroad than in the United States. Moreover, settlement practices for transactions in foreign markets may differ from those in U.S. markets. Such differences may include delays beyond periods customary in the United States and practices, such as delivery of securities prior to receipt of payment, which increase the likelihood of a “failed settlement,” which can result in losses to a Portfolio.
The economies of certain foreign markets often do not compare favorably with that of the U.S. with respect to such issues as growth of gross national product, reinvestment of capital, resources, and balance of payments position. Certain such economies may rely heavily on particular industries or foreign capital and are more vulnerable to diplomatic developments, the imposition of economic sanctions against a particular country or countries, changes in international trading patterns, trade barriers, and other protectionist or retaliatory measures.
The value of foreign investments and the investment income derived from them may also be affected unfavorably by changes in currency exchange control regulations. Although the Portfolios will invest only in securities denominated in foreign currencies that are fully exchangeable into U.S. dollars without legal restriction at the time of investment, there can be no assurance that currency controls will not be imposed subsequently. In addition, the value of foreign fixed income investments may fluctuate in response to changes in U.S. and foreign interest rates.
A Portfolio that invests in foreign securities is subject to the risk that its share price may be exposed to arbitrage attempts by investors seeking to capitalize on differences in the values of foreign securities trading on foreign exchanges that may close before the time the Portfolio’s net asset value is determined. If such arbitrage attempts are successful, the Portfolio’s net asset value might be diluted. A Portfolio’s use of fair value pricing in certain circumstances (by adjusting the closing market prices of foreign securities to reflect what the Board believes to be their fair value) may help deter such arbitrage activities. The effect of such fair value pricing is that foreign securities may not be priced on the basis of quotations from the primary foreign securities market in which they are traded, but rather may be priced by another method that the Board believes reflects fair value. As such, fair value pricing is based on
19
subjective judgment and it is possible that fair value may differ materially from the value realized on a sale of a foreign security. It is also possible that use of fair value pricing will limit an investment adviser’s ability to implement a Portfolio’s investment strategy (e.g., reducing the volatility of the Portfolio’s share price) or achieve its investment objective.
Foreign brokerage commissions, custodial expenses and other fees are also generally higher than for securities traded in the United States. Consequently, the overall expense ratios of international or global funds are usually somewhat higher than those of typical domestic stock funds.
Moreover, investments in foreign government debt securities, particularly those of emerging market country governments, involve special risks. Certain emerging market countries have historically experienced, and may continue to experience, high rates of inflation, high interest rates, exchange rate fluctuations, large amounts of external debt, balance of payments and trade difficulties and extreme poverty and unemployment. See “Emerging Market Securities” below for additional risks.
Fluctuations in exchange rates may also affect the earning power and asset value of the foreign entity issuing a security, even one denominated in U.S. dollars. Dividend and interest payments will be repatriated based on the exchange rate at the time of disbursement, and restrictions on capital flows may be imposed.
In less liquid and well developed stock markets, such as those in some Eastern European, Southeast Asian, and Latin American countries, volatility may be heightened by actions of a few major investors. For example, substantial increases or decreases in cash flows of mutual funds investing in these markets could significantly affect stock prices and, therefore, share prices. Additionally, investments in emerging market regions or the following geographic regions are subject to more specific risks, as discussed below:
Emerging Market Securities. As indicated in Appendix A, certain of the Portfolios may invest in emerging market securities. Investments in emerging market country securities involve special risks. The economies, markets and political structures of a number of the emerging market countries in which the Portfolios can invest do not compare favorably with the United States and other mature economies in terms of wealth and stability. Therefore, investments in these countries may be riskier, and will be subject to erratic and abrupt price movements. Some economies are less well developed and less diverse (for example, Latin America, Eastern Europe and certain Asian countries), and more vulnerable to the ebb and flow of international trade, trade barriers and other protectionist or retaliatory measures. Similarly, many of these countries, particularly in Southeast Asia, Latin America, and Eastern Europe, are grappling with severe inflation or recession, high levels of national debt, currency exchange problems and government instability. Investments in countries that have recently begun moving away from central planning and state-owned industries toward free markets, such as the Eastern European or Chinese economies, should be regarded as speculative.
Certain emerging market countries have historically experienced, and may continue to experience, high rates of inflation, high interest rates, exchange rate fluctuations, large amounts of external debt, balance of payments and trade difficulties and extreme poverty and unemployment. The issuer or governmental authority that controls the repayment of an emerging market country’s debt may not be able or willing to repay the principal and/or interest when due in accordance with the terms of such debt. A debtor’s willingness or ability to repay principal and interest due in a timely manner may be affected by, among other factors, its cash flow situation, and, in the case of a government debtor, the extent of its foreign reserves, the availability of sufficient foreign exchange on the date a payment is due, the relative size of the debt service burden to the economy as a whole and the political constraints to which a government debtor may be subject. Government debtors may default on their debt and may also be dependent on expected disbursements from foreign governments, multilateral agencies and others abroad to reduce principal and interest arrearages on their debt. Holders of government debt may be requested to participate in the rescheduling of such debt and to extend further loans to government debtors.
If such an event occurs, a Portfolio may have limited legal recourse against the issuer and/or guarantor. Remedies must, in some cases, be pursued in the courts of the defaulting party itself, and the ability of the holder of foreign government fixed income securities to obtain recourse may be subject to the political climate in the relevant country. In addition, no assurance can be given that the holders of
20
commercial bank debt will not contest payments to the holders of other foreign government debt obligations in the event of default under their commercial bank loan agreements.
The economies of individual emerging market countries may differ favorably or unfavorably from the U.S. economy in such respects as growth of gross domestic product, rate of inflation, currency depreciation, capital reinvestment, resource self-sufficiency and balance of payments position. Further, the economies of developing countries generally are heavily dependent upon international trade and, accordingly, have been, and may continue to be, adversely affected by trade barriers, exchange controls, managed adjustments in relative currency values and other protectionist measures imposed or negotiated by the countries with which they trade. These economies also have been, and may continue to be, adversely affected by economic conditions in the countries with which they trade.
Investing in emerging market countries may entail purchasing securities issued by or on behalf of entities that are insolvent, bankrupt, in default or otherwise engaged in an attempt to reorganize or reschedule their obligations, and in entities that have little or no proven credit rating or credit history. In any such case, the issuer’s poor or deteriorating financial condition may increase the likelihood that the investing Portfolio will experience losses or diminution in available gains due to bankruptcy, insolvency or fraud.
Eastern European and Russian Securities. Investing in the securities of Eastern European and Russian issuers is highly speculative and involves risks not usually associated with investing in the more developed markets of Western Europe. Political and economic reforms are too recent to establish a definite trend away from centrally planned economies and state-owned industries. Investments in Eastern European countries may involve risks of nationalization, expropriation, and confiscatory taxation. Many Eastern European countries continue to move towards market economies at different paces with appropriately different characteristics. Most Eastern European markets suffer from thin trading activity, dubious investor protections, and often a dearth of reliable corporate information. Information and transaction costs, differential taxes, and sometimes political or transfer risk give a comparative advantage to the domestic investor rather than the foreign investor.
Eastern European economies may also be particularly susceptible to the international credit market due to their reliance on bank related inflows of foreign capital. The recent global financial crisis restricted international credit supplies and several Eastern European economies faced significant credit and economic crises. Although some Eastern European economies are expanding again, major challenges are still present as a result of their continued dependence on the Western European zone for credit and trade.
Compared to most national stock markets, the Russian securities market suffers from a variety of problems not encountered in more developed markets. There is little long-term historical data on the Russian securities market because it is relatively new and a substantial proportion of securities transactions in Russia are privately negotiated outside of stock exchanges. The inexperience of the Russian securities market and the limited volume of trading in securities in the market may make obtaining accurate prices on portfolio securities from independent sources more difficult than in more developed markets. Additionally, there is little solid corporate information available to investors. As a result, it may be difficult to assess the value or prospects of an investment in Russian companies.
Because of the recent formation of the Russian securities market as well as the underdeveloped state of the banking and telecommunications systems, settlement, clearing and registration of securities transactions are subject to significant risks not normally associated with securities transactions in the United States and other more developed markets. Ownership of equity securities in Russian companies is evidenced by entries in a company’s share register (except where shares are held through depositories that meet the requirements of the 1940 Act) and the issuance of extracts from the register or, in certain limited cases, by formal share certificates. However, Russian share registers are frequently unreliable and a Portfolio could possibly lose its registration through oversight, negligence or fraud. Moreover, Russia lacks a centralized registry to record shares and companies themselves maintain share registers. Registrars are under no obligation to provide extracts to potential purchasers in a timely manner or at all and are not necessarily subject to effective state supervision. In addition, while registrars are liable under law for losses resulting from their errors, it may be
21
difficult for a Portfolio to enforce any rights it may have against the registrar or issuer of the securities in the event of loss of share registration. For example, although Russian companies with more than 1,000 shareholders are required by law to employ an independent company to maintain share registers, in practice, such companies have not always followed this law. Because of this lack of independence of registrars, management of a Russian company may be able to exert considerable influence over who can purchase and sell the company’s shares by illegally instructing the registrar to refuse to record transactions on the share register. Furthermore, these practices could cause a delay in the sale of Russian securities by a Portfolio if the company deems a purchaser unsuitable, which may expose a Portfolio to potential loss on its investment. A recently enacted law authorizes the establishment of a centralized securities depository (CSD), which, in effect, will become the exclusive settlement organization for publicly traded Russian companies and investment funds in Russia. Once the CSD is fully functional, it should enhance the efficiency and transparency of the Russian securities market.
In light of the risks described above, the Board has approved certain procedures concerning a Portfolio’s investments in Russian securities. Among these procedures is a requirement that a Portfolio will not invest in the securities of a Russian company unless that issuer’s registrar has entered into a contract with a Portfolio’s custodian containing certain protective conditions, including, among other things, the custodian’s right to conduct regular share confirmations on behalf of a Portfolio. This requirement will likely have the effect of precluding investments in certain Russian companies that a Portfolio would otherwise make.
European Securities. The European Union’s (the “EU”) Economic and Monetary Union requires Eurozone countries to comply with restrictions on interest rates, deficits, debt levels, and inflation rates, and other factors, each of which may significantly impact every European country and their economic partners. The economies of EU member countries and their trading partners may be adversely affected by changes in the euro’s exchange rate, changes in EU or governmental regulations on trade and other areas and the threat of default or default by an EU member country on its sovereign debt, which could negatively impact a Portfolio’s investments and cause it to lose money. Recently, the European financial markets have been negatively impacted by rising government debt levels; possible default on or restructuring of sovereign debt in several European countries, including Cyprus, Greece, Ireland, Italy, Portugal and Spain; and economic downturns. A European country’s default or debt restructuring would adversely affect the holders of the country’s debt and sellers of credit default swaps linked to the country’s creditworthiness and could negatively impact global markets more generally. Recent events in Europe have affected the euro’s exchange rate and value and may continue to impact the economies of every European country.
Latin America
Inflation. Most Latin American countries have experienced, at one time or another, severe and persistent levels of inflation, including, in some cases, hyperinflation. This has, in turn, led to high interest rates, extreme measures by governments to keep inflation in check, and a generally debilitating effect on economic growth. Although inflation in many countries has lessened, there is no guarantee it will remain at lower levels.
Political Instability. As an emerging market, Latin America historically suffered from social, political, and economic instability. For investors, this has meant additional risk caused by periods of regional conflict, political corruption, totalitarianism, protectionist measures, nationalization, hyperinflation, debt crises, sudden and large currency devaluation, and intervention by the military in civilian and economic spheres. However, in some Latin American countries, a move to sustainable democracy and a more mature and accountable political environment is under way. Domestic economies have been deregulated, privatization of state-owned companies is almost completed and foreign trade restrictions have been relaxed.
Dependence on Exports and Economic Risk. Certain Latin American countries depend heavily on exports to the U.S. and investments from a small number of countries. Accordingly, these countries may be sensitive to fluctuations in demand, exchange rates and changes in market conditions associated with those countries. The economic growth of most Latin American countries is highly dependent on commodity exports and the economies of certain Latin American countries, particularly Mexico and
22
Venezuela, are highly dependent on oil exports. As a result, these economies are particularly susceptible to fluctuations in the price of oil and other commodities and currency fluctuations. The recent global financial crisis weakened the global demand for oil and other commodities and, as a result, Latin American countries faced significant economic difficulties that led certain countries into recession. If global economic conditions worsen, prices for Latin American commodities may experience increased volatility and demand may continue to decrease. Although certain of these countries have recently shown signs of recovery, such recovery, if sustained, may be gradual.
Sovereign Debt. A number of Latin American countries are among the largest debtors of developing countries. There have been moratoria on, and reschedulings of, repayment with respect to these debts. Such events can restrict the flexibility of these debtor nations in the international markets and result in the imposition of onerous conditions on their economies. Because of their dependence on foreign credit and loans, a number of Latin American economies faced significant economic difficulties and some economies fell into recession as the recent global financial crisis tightened international credit supplies.
Pacific Basin Region. Many Asian countries may be subject to a greater degree of social, political and economic instability than is the case in the U.S. and European countries. Such instability may result from (i) authoritarian governments or military involvement in political and economic decision-making; (ii) popular unrest associated with demands for improved political, economic and social conditions; (iii) internal insurgencies; (iv) hostile relations with neighboring countries; and (v) ethnic, religious and racial disaffection. In addition, the Asia Pacific geographic region has historically been prone to natural disasters. The occurrence of a natural disaster in the region could negatively impact the economy of any country in the region.
The economies of most of the Asian countries are heavily dependent on international trade and are accordingly affected by protective trade barriers and the economic conditions of their trading partners, principally, the U.S., Japan, China and the European Community. The enactment by the U.S. or other principal trading partners of protectionist trade legislation, reduction of foreign investment in the local economies and general declines in the international securities markets could have a significant adverse effect upon the securities markets of the Asian countries. The recent global financial crisis spread to the region, significantly lowering its exports and foreign investments in the region, which are driving forces of its economic growth. In addition, the economic crisis also significantly affected consumer confidence and local stock markets. Although the economies of many countries in the region have recently shown signs of recovery from the crisis, such recovery, if sustained, may be gradual. Furthermore, any such recovery may be limited or hindered by the reduced demand for exports and lack of available capital for investment resulting from the European crisis and weakened global economy.
The securities markets in Asia are substantially smaller, less liquid and more volatile than the major securities markets in the U.S. A high proportion of the shares of many issuers may be held by a limited number of persons and financial institutions, which may limit the number of shares available for investment by a Portfolio. Similarly, volume and liquidity in the bond markets in Asia are less than in the U.S. and, at times, price volatility can be greater than in the U.S. A limited number of issuers in Asian securities markets may represent a disproportionately large percentage of market capitalization and trading value. The limited liquidity of securities markets in Asia may also affect a Portfolio’s ability to acquire or dispose of securities at the price and time it wishes to do so. In addition, the Asian securities markets are susceptible to being influenced by large investors trading significant blocks of securities.
Many stock markets are undergoing a period of growth and change which may result in trading volatility and difficulties in the settlement and recording of transactions, and in interpreting and applying the relevant law and regulations. With respect to investments in the currencies of Asian countries, changes in the value of those currencies against the U.S. dollar will result in corresponding changes in the U.S. dollar value of a Portfolio’s assets denominated in those currencies.
Chinese Companies. Investing in China, Hong Kong and Taiwan involves a high degree of risk and special considerations not typically associated with investing in other more established economies or
23
securities markets. Such risks may include: (a) the risk of nationalization or expropriation of assets or confiscatory taxation; (b) greater social, economic and political uncertainty (including the risk of war); (c) dependency on exports and the corresponding importance of international trade; (d) the increasing competition from Asia’s other low-cost emerging economies; (e) greater price volatility, substantially less liquidity and significantly smaller market capitalization of securities markets, particularly in China; (f) currency exchange rate fluctuations and the lack of available currency hedging instruments; (g) higher rates of inflation; (h) controls on foreign investment and limitations on repatriation of invested capital and on the Portfolio’s ability to exchange local currencies for U.S. dollars; (i) greater governmental involvement in and control over the economy; (j) the risk that the Chinese government may decide not to continue to support the economic reform programs implemented since 1978 and could return to the prior, completely centrally planned, economy; (k) the fact that Chinese companies, particularly those located in China, may be smaller, less seasoned and newly-organized companies; (1) the difference in, or lack of auditing and financial reporting standards which may result in unavailability of material information about issuers, particularly in China; (m) the fact that statistical information regarding the Chinese economy may be inaccurate or not comparable to statistical information regarding the U.S. or other economies; (n) the less extensive, and still developing, regulation of the securities markets, business entities and commercial transactions; (o) the fact that the settlement period of securities transactions in foreign markets may be longer (p) the willingness and ability of the Chinese government to support the Chinese and Hong Kong economies and markets is uncertain; (q) the risk that it may be more difficult or impossible, to obtain and/or enforce a judgment than in other countries; (r) the rapidity and erratic nature of growth, particularly in China, resulting in inefficiencies and dislocations; and (s) the risk that, because of the degree of interconnectivity between the economies and financial markets of China, Hong Kong and Taiwan, any sizable reduction in the demand for goods from China, or an economic downturn in China could negatively affect the economies and financial markets of Hong Kong and Taiwan, as well.
Investment in China, Hong Kong and Taiwan is subject to certain political risks. China’s economy has transitioned from a rigidly central-planned state-run economy to one that has been only partially reformed by more market-oriented policies. Although the Chinese government has implemented economic reform measures, reduced state ownership of companies and established better corporate governance practices, a substantial portion of productive assets in China are still owned by the Chinese government. The government continues to exercise significant control over regulating industrial development and, ultimately, control over China’s economic growth through the allocation of resources, controlling payment of foreign currency-denominated obligations, setting monetary policy and providing preferential treatment to particular industries or companies.
China continues to limit direct foreign investments generally in industries deemed important to national interests. Foreign investment in domestic securities are also subject to substantial restrictions. Some believe that China’s currency is undervalued. Currency fluctuations could significantly affect China and its trading partners. China continues to exercise control over the value of its currency, rather than allowing the value of the currency to be determined by market forces. This type of currency regime may experience sudden and significant currency adjustments, which may adversely impact investment returns. For decades, a state of hostility has existed between Taiwan and the People’s Republic of China. Beijing has long deemed Taiwan a part of the “one China” and has made a nationalist cause of recovering it. This situation poses a threat to Taiwan’s economy and could negatively affect its stock market. By treaty, China has committed to preserve Hong Kong’s autonomy and its economic, political and social freedoms until 2047. However, if China would exert its authority so as to alter the economic, political or legal structures or the existing social policy of Hong Kong, investor and business confidence in Hong Kong could be negatively affected, which in turn could negatively affect markets and business performance.
Forward Commitments, When-Issued and Delayed Delivery Securities. As indicated in Appendix A, certain of the Portfolios may invest in forward commitments including “TBA” (to be announced), when-issued and delayed delivery securities. Forward commitments, when-issued and delayed delivery transactions arise when securities are purchased by a Portfolio with payment and delivery taking place in the future in order to secure
24
what is considered to be an advantageous price or yield to the Portfolio at the time of entering into the transaction. However, the price of or yield on a comparable security available when delivery takes place may vary from the price of or yield on the security at the time that the forward commitment or when-issued or delayed delivery transaction was entered into. Agreements for such purchases might be entered into, for example, when a Portfolio anticipates a decline in interest rates and is able to obtain a more advantageous price or yield by committing currently to purchase securities to be issued later. When a Portfolio purchases securities on a forward commitment, when-issued or delayed delivery basis it does not pay for the securities until they are received, and the Portfolio is required to designate the segregation, either on the records of the Advisers or with the Trust’s custodian, of cash or other liquid securities in an amount equal to or greater than, on a daily basis, the amount of the Portfolio’s forward commitments, when-issued or delayed delivery commitments or to enter into offsetting contracts for the forward sale of other securities it owns. Forward commitments may be considered securities in themselves and involve a risk of loss if the value of the security to be purchased declines prior to the settlement date, which risk is in addition to the risk of decline in value of the Portfolio’s other assets. Where such purchases are made through dealers, a Portfolio relies on the dealer to consummate the sale. The dealer’s failure to do so may result in the loss to a Portfolio of an advantageous yield or price.
A Portfolio will only enter into forward commitments and make commitments to purchase securities on a when-issued or delayed delivery basis with the intention of actually acquiring the securities. However, the Portfolio may sell these securities before the settlement date if it is deemed advisable as a matter of investment strategy. Forward commitments and when-issued and delayed delivery transactions are generally expected to settle within three months from the date the transactions are entered into, although the Portfolio may close out its position prior to the settlement date by entering into a matching sales transaction.
A Portfolio may purchase forward commitments and make commitments to purchase securities on a when-issued or delayed-delivery basis for any number of reasons, including to protect the value of portfolio investments, as a means to adjust the Portfolio’s overall exposure, and to enhance the Portfolio’s return. Purchases made in an effort to enhance a Portfolio’s return may involve more risk than purchases made for other reasons. For example, by committing to purchase securities in the future, a Portfolio subjects itself to a risk of loss on such commitments as well as on its portfolio securities. Also, a Portfolio may have to sell assets that have been set aside in order to meet redemptions. In addition, if a Portfolio determines it is advisable as a matter of investment strategy to sell the forward commitment or when-issued or delayed delivery securities before delivery, that Portfolio may incur a gain or loss because of market fluctuations since the time the commitment to purchase such securities was made. When the time comes to pay for the securities to be purchased under a forward commitment or on a when-issued or delayed delivery basis, a Portfolio will meet its obligations from the then available cash flow or the sale of securities, or, although it would not normally expect to do so, from the sale of the forward commitment or when-issued or delayed delivery securities themselves (which may have a value greater or less than a Portfolio’s payment obligation).
Health Care Sector Risk. The health care sector generally is subject to substantial government regulation. Changes in governmental policy or regulation could have a material effect on the demand for products and services offered by companies in the health care sector and therefore could affect the performance of a Portfolio. Regulatory approvals are generally required before new drugs and medical devices or procedures may be introduced and before the acquisition of additional facilities by health care providers. In addition, the products and services offered by such companies may be subject to rapid obsolescence caused by technological and scientific advances.
Hybrid Instruments. As indicated in Appendix A, certain of the Portfolios may invest in hybrid instruments (a type of potentially high-risk derivative). Hybrid instruments combine the elements of futures contracts or options with those of debt, preferred equity or a depositary instrument. Generally, a hybrid instrument will be a debt security, preferred stock, depositary share, trust certificate, certificate of deposit or other evidence of indebtedness on which a portion of or all interest payments, and/or the principal or stated amount payable at maturity, redemption or retirement, is determined by reference to
25
prices, changes in prices, or differences between prices, of securities, currencies, intangibles, goods, articles or commodities (collectively “Underlying Assets”) or by another objective index, economic factor or other measure, such as interest rates, currency exchange rates, commodity indices, and securities indices (collectively “Benchmarks”). Thus, hybrid instruments may take a variety of forms, including, but not limited to, debt instruments with interest or principal payments or redemption terms determined by reference to the value of a currency or commodity or securities index at a future point in time, preferred stock with dividend rates determined by reference to the value of a currency, or convertible securities with the conversion terms related to a particular commodity rates. Under certain conditions, the redemption value of such an instrument could be zero. Hybrid instruments can have volatile prices and limited liquidity and their use by a Portfolio may not be successful.
Hybrid instruments may bear interest or pay preferred dividends at below market (or even relatively nominal) rates. Alternatively, hybrid instruments may bear interest at above market rates but bear an increased risk of principal loss (or gain). The latter scenario may result if “leverage” is used to structure the hybrid instrument. Leverage risk occurs when the hybrid instrument is structured so that a given change in a Benchmark or Underlying Asset is multiplied to produce a greater value change in the hybrid instrument, thereby magnifying the risk of loss as well as the potential for gain.
Hybrid instruments can be an efficient means of creating exposure to a particular market, or segment of a market, with the objective of enhancing total return. For example, a Portfolio may wish to take advantage of expected declines in interest rates in several European countries, but avoid the transaction costs associated with buying and currency-hedging the foreign bond positions. One solution would be to purchase a U.S. dollar-denominated hybrid instrument whose redemption price is linked to the average three year interest rate in a designated group of countries. The redemption price formula would provide for payoffs of greater than par if the average interest rate was lower than a specified level, and payoffs of less than par if rates were above the specified level. Furthermore, a Portfolio could limit the downside risk of the security by establishing a minimum redemption price so that the principal paid at maturity could not be below a predetermined minimum level if interest rates were to rise significantly. The purpose of this arrangement, known as a structured security with an embedded put option, would be to give the Portfolio the desired European bond exposure while avoiding currency risk, limiting downside market risk, and lowering transaction costs. Of course, there is no guarantee that the strategy will be successful and a Portfolio could lose money if, for example, interest rates do not move as anticipated or credit problems develop with the issuer of the hybrid instrument.
Although the risks of investing in hybrid instruments reflect a combination of the risks of investing in securities, options, futures and currencies, hybrid instruments are potentially more volatile and carry greater market risks than traditional debt instruments. The risks of a particular hybrid instrument will, of course, depend upon the terms of the instrument, but may include, without limitation, the possibility of significant changes in the Benchmarks or the prices of Underlying Assets to which the instrument is linked. Such risks generally depend upon factors which are unrelated to the operations or credit quality of the issuer of the hybrid instrument and which may not be readily foreseen by the purchaser, such as economic and political events, the supply and demand for the Underlying Assets and interest rate movements. In recent years, various Benchmarks and prices for Underlying Assets have been highly volatile, and such volatility may be expected in the future.
Hybrid instruments may also carry liquidity risk since the instruments are often “customized” to meet the portfolio needs of a particular investor, and therefore, the number of investors that are willing and able to buy such instruments in the secondary market may be smaller than that for more traditional debt securities. In addition, because the purchase and sale of hybrid instruments could take place in an OTC market without the guarantee of a central clearing organization or in a transaction between the Portfolio and the issuer of the hybrid instrument, the creditworthiness of the counterparty or issuer of the hybrid instrument would be an additional risk factor which the Portfolio would have to consider and monitor. Hybrid instruments also may not be subject to regulation of the CFTC, which generally regulates the trading of commodity futures and most swaps by persons in the United States, the SEC, which regulates the offer and
26
sale of securities by and to persons in the United States, or any other governmental regulatory authority. The various risks discussed above, particularly the market risk of such instruments, may in turn cause significant fluctuations in the net asset value of the Portfolio.
Illiquid Securities or Non-Publicly Traded Securities. As indicated in Appendix A, certain of the Portfolios may invest in illiquid securities or non-publicly traded securities. The inability of a Portfolio to dispose of illiquid or not readily marketable investments promptly or at a reasonable price could impair a Portfolio’s ability to raise cash for redemptions or other purposes. The liquidity of securities purchased by a Portfolio which are eligible for resale pursuant to Rule 144A and that have been determined to be liquid by the Board or its delegates will be monitored by each Portfolio’s Adviser on an ongoing basis, subject to the oversight of the Manager. In the event that such a security is deemed to be no longer liquid, a Portfolio’s holdings will be reviewed to determine what action, if any, is required to ensure that the retention of such security does not result in a Portfolio’s having more than 10% or 15%, as applicable, of its assets invested in illiquid or not readily marketable securities.
Rule 144A Securities will be considered illiquid, and therefore subject to a Portfolio’s limit on the purchase of illiquid securities, unless the Board or its delegates determines that the Rule 144A Securities are liquid. In reaching liquidity decisions, the Board and its delegates may consider, among other things, the following factors: (i) the unregistered nature of the security; (ii) the frequency of trades and quotes for the security; (iii) the number of dealers wishing to purchase or sell the security and the number of other potential purchasers; (iv) dealer undertakings to make a market in the security; and (v) the nature of the security and the nature of the marketplace trades (e.g., the time needed to dispose of the security, the method of soliciting offers and the mechanics of the transfer).
Historically, illiquid securities have included securities subject to contractual or legal restrictions on resale because they have not been registered under the 1933 Act, securities which are otherwise not readily marketable and repurchase agreements having a maturity of longer than seven days. Securities which have not been registered under the 1933 Act are referred to as private placements or restricted securities and are purchased directly from the issuer or in the secondary market. Mutual funds do not typically hold a significant amount of these restricted or other illiquid securities because of the potential for delays on resale and uncertainty in valuation. Limitations on resale may have an adverse effect on the marketability of portfolio securities and a mutual fund might be unable to dispose of restricted or other illiquid securities promptly or at reasonable prices and might thereby experience difficulty satisfying redemptions within seven days. A mutual fund might also have to register such restricted securities in order to dispose of them resulting in additional expense and delay. Adverse market conditions could impede such a public offering of securities.
There is a large institutional market for certain securities that are not registered under the 1933 Act, which may include markets for repurchase agreements, commercial paper, foreign securities, municipal securities and corporate bonds and notes. Institutional investors depend on an efficient institutional market in which the unregistered security can be readily resold or on an issuer’s ability to honor a demand for repayment. The fact that there are contractual or legal restrictions on resale to the general public or to certain institutions may not be indicative of the liquidity of such investments. To the extent that a portfolio acquires shares of an Underlying Portfolio in accordance with Section 12(d)(1)(F) of the 1940 Act, the Underlying Portfolio is not obligated to redeem its shares in an amount exceeding 1% of its shares outstanding during any period less than 30 days. Shares held by a portfolio in excess of 1% of an Underlying Portfolio’s outstanding securities therefore may, under certain circumstances, be considered not readily marketable securities, which, together with other such securities, are subject to the 15% limitation described above.
Inflation-Indexed Securities. Certain Portfolios may invest in inflation-indexed securities issued by the U.S. Treasury and others. Inflation-indexed securities are securities the principal value of which is adjusted periodically in accordance with changes in a measure of inflation. Inflation-indexed securities issued by the U.S. Treasury use the Consumer Price Index for Urban Consumers (“CPI-U”) published by the U.S. Bureau of Labor Statistics. Inflation-indexed securities issued by a foreign government are generally adjusted to reflect a comparable inflation index, calculated by that government. Two structures for inflation-indexed securities are common: the U.S. Treasury and some other issuers utilize a structure
27
that adjusts the principal value of the security according to the rate of inflation; most other issuers pay out the Consumer Price Index adjustments as part of a semi-annual coupon.
In the first, the interest rate on the inflation-indexed bond is fixed, while the principal value rises or falls semi-annually based on changes in a published measure of inflation. Repayment of the original bond principal upon maturity (as adjusted for inflation) is guaranteed in the case of U.S. Treasury inflation-indexed bonds. For bonds that do not provide a similar guarantee, the adjusted principal value of the bond repaid at maturity may be less than the original principal. In the second, the inflation adjustment for certain inflation-indexed bonds is reflected in the semiannual coupon payment. As a result, the principal value of these inflation-indexed bonds does not adjust according to the rate of inflation.
In general, the value of inflation-indexed securities increases in periods of general inflation and declines in periods of general deflation. If inflation is lower than expected during the period a Portfolio holds an inflation-indexed security, the Portfolio may earn less on it than on a conventional bond. Inflation-indexed securities are expected to react primarily to changes in the “real” interest rate (i.e., the nominal, or stated, rate less the rate of inflation), while a typical bond reacts to changes in the nominal interest rate. Accordingly, inflation-indexed securities have characteristics of fixed-rate U.S. Treasury securities having a shorter duration. Changes in market interest rates from causes other than inflation will likely affect the market prices of inflation-indexed securities in the same manner as conventional bonds.
Any increase in the principal value of an inflation-indexed security is taxable in the year the increase occurs, even though its holders do not receive cash representing the increase until the security matures, and the amount of that increase for a Portfolio must be distributed each taxable year to its shareholders. See the “Taxation” section of this SAI. Thus, each Portfolio that invests therein could be required, at times, to liquidate other investments in order to satisfy its distribution requirements.
Insured Bank Obligations. The Federal Deposit Insurance Corporation (“FDIC”) insures the deposits of federally insured banks and savings and loan associations (collectively referred to as “banks”) up to $250,000. The Portfolios may purchase bank obligations which are fully insured as to principal by the FDIC. Currently, to remain fully insured as to principal, these investments must be limited to $250,000 per bank; if the principal amount and accrued interest together exceed $250,000, the excess accrued interest will not be insured. Insured bank obligations may have limited marketability. Unless the Board of Trustees determines that a readily available market exists for such obligations, a portfolio will treat such obligations as subject to the limit for illiquid investments for each portfolio unless such obligations are payable at principal amount plus accrued interest on demand or within seven days after demand.
Investment Company Securities. As indicated in Appendix A, certain of the Portfolios may invest in the securities of other investment companies, including exchange-traded funds, to the extent permitted under the 1940 Act and the rules, regulations, and exemptive orders thereunder. Investment company securities are securities of other open-end or closed-end investment companies. The 1940 Act generally prohibits a Portfolio from acquiring more than 3% of the outstanding voting shares of an investment company and limits such investments to no more than 5% of the Portfolio’s total assets in any investment company and no more than 10% in any combination of unaffiliated investment companies. The 1940 Act further prohibits a Portfolio from acquiring in the aggregate more than 10% of the outstanding voting shares of any registered closed-end investment company. Certain exceptions to these limitations are provided by the 1940 Act and the rules, regulations, and exemptive orders thereunder. Investing in other investment companies involves substantially the same risks as investing directly in the underlying instruments, but the total return on such investments at the investment company level may be reduced by the operating expenses and fees of such other investment companies, including advisory fees. In addition, certain types of investment companies, such as closed-end investment companies and exchange-traded funds, trade on a stock exchange or over-the-counter at a premium or a discount to their net asset value per share. Such a premium or discount may impact the performance of the Portfolio’s investment.
Passive Foreign Investment Companies. As indicated in Appendix A, certain Portfolios may purchase the securities of “passive foreign investment companies” (“PFICs”). In general, such companies have been the only or primary way to invest in countries that limit, or prohibit, all direct foreign investment in the securities of companies domiciled therein. However, the governments of some countries have
28
authorized the organization of investment funds to permit indirect foreign investment in such securities. In addition to bearing their proportionate share of a Portfolio’s expenses (management fees and operating expenses), shareholders will also indirectly (through the Portfolio) bear similar expenses of such funds. PFICs in which a Portfolio may invest may also include foreign corporations other than such investment funds. Like other foreign securities, interests in PFICs also involve the risk of foreign securities, as described above, as well as certain tax consequences (see the section entitled “Taxation”).
Exchange Traded Funds (“ETFs”). As indicated in Appendix A, certain of the Portfolios may invest in ETFs. These are a type of investment company (or similar entity) the shares of which are bought and sold on a securities exchange. An ETF represents a portfolio of securities (or other assets) generally designed to track a particular market index or other referenced asset. A Portfolio could purchase an ETF to temporarily gain exposure to a portion of the U.S. or a foreign market while awaiting purchase of underlying securities. Many ETFs have obtained exemptive relief from the SEC to permit other investment companies (such as the Portfolios) to invest in their shares beyond the statutory limits on investments in other investment companies described above, subject to certain conditions and pursuant to contractual arrangements between the ETFs and the investing funds. A Portfolio may rely on these exemptive orders in investing in ETFs. The risks of owning an ETF generally reflect the risks of owning the underlying securities they are designed to track, although lack of liquidity in an ETF could result in it being more volatile and ETFs have fees which increase their costs. In addition, there is the risk that an ETF may fail to closely track the index, if any, that it is designed to replicate.
Investment Grade Securities. As indicated in Appendix A, certain of the Portfolios may invest in or hold investment grade securities. Investment grade securities are securities rated Baa or higher by Moody’s, BBB or higher by S&P, or BBB or higher by Fitch, securities that are comparably rated by another rating agency, or unrated securities determined by the Adviser to be of comparable quality. Bonds rated in the lower investment grade rating categories (or determined to be of comparable quality by the Adviser) have speculative characteristics. This means that changes in economic conditions or other circumstances are more likely to lead to a weakened capacity to make principal and interest payments than is the case for higher rated debt securities. If a security is downgraded, the Adviser will reevaluate the holding to determine what action, including the sale of such security, is in the best interests of the Portfolio.
Non-Investment Grade Securities or “Junk Bonds.” As indicated in Appendix A, certain of the Portfolios may invest in or hold Junk Bonds or Non-Investment Grade Securities. Non-investment grade securities are securities rated Ba or lower by Moody’s Investors Service, Inc. (“Moody’s”) or BB or lower by Standard & Poor’s Rating Services (“S&P”) or Fitch Ratings Ltd. (“Fitch”), securities that are comparably rated by another rating agency, or unrated securities determined by the Adviser to be of comparable quality. Non-investment grade securities are commonly known as “junk bonds” and are considered predominantly speculative with respect to the issuer’s ability to pay interest and repay principal. Junk bonds may be issued as a consequence of corporate restructuring, such as leveraged buyouts, mergers, acquisitions, debt recapitalizations, or similar events or by smaller or highly leveraged companies and in other circumstances.
Non-investment grade securities generally offer a higher current yield than that available for investment grade securities; however, they involve greater risks than investment grade securities in that they are especially sensitive to, and may be more susceptible to, real or perceived adverse changes in general economic conditions and in the industries in which the issuers are engaged, changes in the financial condition of, and individual corporate developments of, the issuers, and price fluctuations in response to changes in interest rates. Because a Portfolio’s investments in non-investment grade securities involve greater investment risk than its investments in higher rated securities, achievement of the portfolio’s investment objective will be more dependent on the Adviser’s analysis than would be the case if the portfolio were investing in higher rated securities.
29
Non-investment grade securities generally will be susceptible to greater risk when economic growth slows or reverses and when inflation increases or deflation occurs. Lower rated securities may experience substantial price declines when there is an expectation that issuers of such securities might experience financial difficulties. As a result, the yields on lower rated securities can rise dramatically. However, those higher yields may not reflect the value of the income stream that holders of such securities expect. Rather, those higher yields may reflect the risk that holders of such securities could lose a substantial portion of their value due to financial restructurings or defaults by the issuers. There can be no assurance that those declines will not occur.
During periods of economic downturn or rising interest rates, highly leveraged issuers may experience financial stress that could adversely affect their ability to make payments of interest and principal and increase the possibility of default. In addition, such issuers may not have more traditional methods of financing available to them and may be unable to repay debt at maturity by refinancing. The risk of loss due to default by such issuers is significantly greater because such securities frequently are unsecured by collateral and will not receive payment until more senior claims are paid in full. Non-investment grade securities may contain redemption or call provisions. If an issuer exercises these provisions in a declining interest rate market, a Portfolio would have to replace the security with a lower yielding security, resulting in a decreased return. Conversely, a non-investment grade security’s value will decrease in a rising interest rate market, as will the value of a Portfolio’s investment in such securities. If a Portfolio experiences unexpected net redemptions, this may force it to sell its non-investment grade securities, without regard to their investment merits, thereby decreasing the asset base upon which the Portfolio’s expenses can be spread and possibly reducing the Portfolio’s rate of return.
In addition, the market for non-investment grade securities generally is thinner and less active than that for higher rated securities, which may limit a Portfolio’s ability to sell such securities at fair value in response to changes in the economy or financial markets. This potential lack of liquidity may make it more difficult for an Adviser to value accurately certain Portfolio securities. Adverse publicity and investor perceptions, whether or not based on fundamental analysis, may also decrease the values and liquidity of non-investment grade securities, especially in a thinly traded market. In periods of reduced market liquidity, junk bond prices may become more volatile and may experience sudden and substantial price declines. Also, there may be significant disparities in the prices quoted for junk bonds by various dealers. Under such conditions, a Portfolio may find it difficult to value its junk bonds accurately. Under such conditions, a Portfolio may have to use subjective rather than objective criteria to value its junk bond investments accurately and rely more heavily on the judgment of the Trust’s Board. It is the policy of each Portfolio’s Adviser(s) not to rely exclusively on ratings issued by credit rating agencies but to supplement such ratings with the Adviser’s own independent and ongoing review of credit quality.
Prices for junk bonds also may be affected by legislative and regulatory developments. For example, from time to time, Congress has considered legislation to restrict or eliminate the corporate tax deduction for interest payments or to regulate corporate restructuring such as takeovers, mergers or leveraged buyouts. Such legislation, if enacted, could depress the prices of outstanding junk bonds.
Credit Ratings. Moody’s, S&P, Fitch and other rating agencies are private services that provide ratings of the credit quality of bonds, including municipal bonds, and certain other securities. A description of the ratings assigned to commercial paper and corporate bonds by Moody’s, S&P and Fitch is included in Appendix B to this SAI. The process by which Moody’s, S&P and Fitch determine ratings generally includes consideration of the likelihood of the receipt by security holders of all distributions, the nature of the underlying assets, the credit quality of the guarantor, if any, and the structural, legal and tax aspects associated with these securities. Not even the highest such rating represents an assessment of the likelihood that principal prepayments will be made by obligors on the underlying assets or the degree to which such prepayments may differ from that originally anticipated, nor do such ratings address the possibility that investors may suffer a lower than anticipated yield or that investors in such securities may fail to recoup fully their initial investment due to prepayments.
30
Credit ratings attempt to evaluate the safety of principal and interest payments, but they do not evaluate the volatility of a bond’s value or its liquidity and do not guarantee the performance of the issuer. Rating agencies may fail to make timely changes in credit ratings in response to subsequent events, so that an issuer’s current financial condition may be better or worse than the rating indicates. There is a risk that rating agencies may downgrade a bond’s rating. Subsequent to a bond’s purchase by a Portfolio, it may cease to be rated or its rating may be reduced below the minimum rating required for purchase by the Portfolio. Any subsequent change in a rating assigned by any rating service to a security (or, if unrated, deemed to be of comparable quality), or change in the percentage of portfolio assets invested in certain securities or other instruments, or change in the average duration of a Portfolio’s investment portfolio, resulting from market fluctuations or other changes in a Portfolio’s total assets will not require a Portfolio to dispose of an investment. The Portfolios may use these ratings in determining whether to purchase, sell or hold a security. It should be emphasized, however, that ratings are general and are not absolute standards of quality. Consequently, bonds with the same maturity, interest rate and rating may have different market prices.
In addition to ratings assigned to individual bond issues, the applicable Adviser will analyze interest rate trends and developments that may affect individual issuers, including factors such as liquidity, profitability and asset quality. The yields on bonds are dependent on a variety of factors, including general money market conditions, general conditions in the bond market, the financial condition of the issuer, the size of the offering, the maturity of the obligation and its rating. There is a wide variation in the quality of bonds, both within a particular classification and between classifications. An issuer’s obligations under its bonds are subject to the provisions of bankruptcy, insolvency and other laws affecting the rights and remedies of bond holders or other creditors of an issuer; litigation or other conditions may also adversely affect the power or ability of issuers to meet their obligations for the payment of interest and principal on their bonds.
Commodity-Linked Notes. Certain of the Portfolios may invest in commodity-linked notes which are privately negotiated structured debt securities the amount of principal repayment and/or interest payments for which are indexed to the return of an index, such as the Dow Jones-UBS Commodity Index Total Return, which is representative of the commodities market. They are available from a limited number of approved counterparties, and all invested amounts are exposed to the dealer’s credit risk. Commodity-linked notes may be leveraged. Commodity-linked notes also are subject to counterparty risk. Investments linked to the prices of commodities, including commodity-linked notes, are considered speculative. The values of commodity-linked notes are affected by events that might have less impact on the values of stocks and bonds. Prices of commodities and related contracts may fluctuate significantly over short periods due to a variety of factors, including changes in supply and demand relationships, weather, agriculture, fiscal, and exchange control programs, disease, pestilence, and international economic, political, military and regulatory developments. In addition, the commodity markets may be subject to temporary distortions and other disruptions due to, among other factors, lack of liquidity, the participation of speculators, and government regulation and other actions. These circumstances could adversely affect the value of the commodity-linked notes and make commodity-linked notes more volatile than other types of investments. Commodity-linked notes may have substantial risks, including risk of loss of a significant portion of their principal value.
Exchange-Traded Notes (ETNs). Certain of the Portfolios may invest in ETNs. ETNs are generally notes representing debt of the issuer, usually a financial institution. ETNs combine both aspects of bonds and ETFs. An ETN’s returns are based on the performance of one or more underlying assets, reference rates or indexes, minus fees and expenses. Similar to ETFs, ETNs are listed on an exchange and traded in the secondary market. However, unlike an ETF, an ETN can be held until the ETN’s maturity, at which time the issuer will pay a return linked to the performance of the specific asset, index or rate (“reference instrument”) to which the ETN is linked minus certain fees. This type of debt security differs from other types of bonds and notes because ETN returns are based upon the performance of a market index minus applicable fees, no period coupon payments are distributed, and no principal protection
31
exists. The value of an ETN may be influenced by time to maturity, level of supply and demand for the ETN, volatility and lack of liquidity in underlying commodities or securities markets, changes in the applicable interest rates, changes in the issuer’s credit rating and economic, legal, political or geographic events that affect the referenced commodity or security. The Portfolio’s decision to sell its ETN holdings may also be limited by the availability of a secondary market. If the Portfolio must sell some or all of its ETN holdings and the secondary market is weak, it may have to sell such holdings at a discount. There may be restrictions on the Portfolio’s right to redeem its investment in an ETN, which are generally meant to be held until maturity. ETNs are also subject to counterparty credit risk and fixed income risk.
Loan Participations and Other Direct Indebtedness. As indicated in Appendix A, certain of the Portfolios may invest a portion of their assets in loan participations and other direct indebtedness. These loans are made generally to finance internal growth, mergers, acquisitions, stock repurchases, leveraged buy-outs and other corporate activities. In purchasing a loan participation, a Portfolio acquires some or all of the interest of a bank or other lending institution in a loan to a corporate borrower. Many such loans are secured, although some may be unsecured. Such loans may be in default at the time of purchase. Loans and other direct indebtedness that are fully secured offer a Portfolio more protection than an unsecured loan in the event of non-payment of scheduled interest or principal. However, there is no assurance that the liquidation of collateral from a secured loan or other direct indebtedness would satisfy the corporate borrower’s obligation, or that the collateral can be liquidated.
Certain of the loans and other direct indebtedness acquired by the Portfolio may involve revolving credit facilities or other standby financing commitments which obligate the Portfolio to pay additional cash on a certain date or on demand. The highly leveraged nature of many such loans and other direct indebtedness may make such loans especially vulnerable to adverse changes in economic or market conditions. Loans and other direct indebtedness may not be in the form of securities or may be subject to restrictions on transfer, and only limited opportunities may exist to resell such instruments. As a result, the Portfolio may be unable to sell such investments at an opportune time or may have to resell them at less than fair market value. These commitments may have the effect of requiring a Portfolio to increase its investment in a company at a time when a Portfolio might not otherwise decide to do so (including at a time when the company’s financial condition makes it unlikely that such amounts will be repaid). To the extent that a Portfolio is committed to advance additional funds, it is required to designate the segregation, either on the records of the Advisers or with the Trust’s custodian, of cash or other liquid securities in an amount equal to or greater than on a daily basis, an amount sufficient to meet such commitments.
Such loans and other direct indebtedness loans are typically made by a syndicate of lending institutions, represented by an agent lending institution which has negotiated and structured the loan and is responsible for collecting interest, principal and other amounts due on its own behalf and on behalf of the others in the syndicate, and for enforcing its rights and the rights of other loan participants against the borrower. Alternatively, such loans and other direct indebtedness may be structured as a “novation” (i.e., a new loan) pursuant to which a Portfolio would assume all of the rights of the lending institution in a loan, or as an assignment, pursuant to which a Portfolio would purchase an assignment of a portion of a lender’s interest in a loan or other direct indebtedness either directly from the lender or through an intermediary. A Portfolio may also purchase trade or other claims against companies, which generally represent money owed by the company to a supplier of goods or services. These claims may also be purchased at a time when the company is in default.
A Portfolio’s ability to receive payment of principal, interest and other amounts due in connection with these investments will depend primarily on the financial condition of the borrower. In selecting the loans and other direct indebtedness that a Portfolio will purchase, the Adviser will rely upon its own credit analysis of the borrower. As a Portfolio may be required to rely upon another lending institution to collect and pass on to a Portfolio amounts payable with respect to the loan and to enforce a Portfolio’s rights under the loan and other direct indebtedness, an insolvency, bankruptcy or reorganization of the lending institution may delay or prevent a Portfolio from receiving such amounts. In such cases, a Portfolio will also evaluate the creditworthiness of the lending institution and will treat both the
32
borrower and the lending institutions as an “issuer” of the loan for purposes of certain investment restrictions pertaining to the diversification of a Portfolio’s portfolio investments.
Investments in such loans and other direct indebtedness may involve additional risks to a Portfolio. For example, if a loan or other direct indebtedness is foreclosed, a Portfolio could become part owner of any collateral, and would bear the costs and liabilities associated with owning and disposing of the collateral. In addition, it is conceivable that under emerging legal theories of lender liability, a Portfolio could be held liable. It is unclear whether loans and other forms of direct indebtedness offer securities law protections against fraud and misrepresentation. In the absence of definitive regulatory guidance, a Portfolio relies on the Adviser’s research in an attempt to avoid situations where fraud and misrepresentation could adversely affect a Portfolio. In addition, loans and other direct investments may not be in the form of securities or may be subject to restrictions on transfer, and only limited opportunities may exist to resell such instruments. As a result, a Portfolio may be unable to sell such investments at an opportune time or may have to resell them at less than fair market value. To the extent that the Adviser determines that any such investments are illiquid, a Portfolio will include them in the investment limitations described above.
Master Demand Notes. Variable amount master demand notes are demand obligations that permit the investment of fluctuating amounts at varying market rates of interest pursuant to arrangements between the issuer and a commercial bank acting as agent for the payees of such notes whereby both parties have the right to vary the amount of the outstanding indebtedness on the notes. Since there is no secondary market for these notes, the appropriate Sub-adviser, subject to the overall review of the portfolio’s Trustees and the Manager, monitor the financial condition of the issuers to evaluate their ability to repay the notes.
Mortgage-Backed or Mortgage-Related Securities. As indicated in Appendix A, certain of the Portfolios may invest in mortgage-related securities (i.e., mortgage-backed securities). Mortgage-backed securities represent direct or indirect participations in, or are secured by and payable from, pools of mortgage loans. Those securities may be guaranteed by a U.S. Government agency or instrumentality (such as the Government National Mortgage Association, or “Ginnie Mae”); issued and guaranteed by a government-sponsored stockholder-owned corporation, though not backed by the full faith and credit of the United States (such as by the Federal National Mortgage Association, or “Fannie Mae”, or the Federal Home Loan Mortgage Corporation, or “Freddie Mac” (collectively, the “GSEs”), and described in greater detail below); or issued by fully private issuers. Private issuers are generally originators of and investors in mortgage loans and include savings associations, mortgage bankers, commercial banks, investment bankers, and special purpose entities. Private mortgage-backed securities may be backed by U.S. Government agency supported mortgage loans or some form of non-governmental credit enhancement.
Government-related guarantors (i.e., not backed by the full faith and credit of the U.S. Government) include Fannie Mae and Freddie Mac. Fannie Mae is a government-sponsored corporation owned by stockholders. It is subject to general regulation by the Federal Housing Finance Authority (“FHFA”). Fannie Mae purchases residential mortgages from a list of approved seller/servicers that include state and federally chartered savings and loan associations, mutual savings banks, commercial banks, credit unions and mortgage bankers. Fannie Mae guarantees the timely payment of principal and interest on pass-through securities that it issues, but those securities are not backed by the full faith and credit of the U.S. Government.
Freddie Mac is a government-sponsored corporation owned by stockholders. Freddie Mac issues Participation Certificates (“PCs”), which represent interests in mortgages from Freddie Mac’s national portfolio. Freddie Mac guarantees the timely payment of interest and ultimate collection of principal on the PCs it issues, but those PCs are not backed by the full faith and credit of the U.S. Government.
The U.S. Treasury historically has had the authority to purchase obligations of Fannie Mae and Freddie Mac. However, in 2008, due to capitalization concerns, Congress provided the U.S. Treasury with additional authority to lend the GSEs emergency funds and to purchase their stock. In September 2008, those capital concerns led the U.S. Treasury and the FHFA to announce that the GSEs had been placed
33
in conservatorship. Since that time, the GSEs have received significant capital support through U.S. Treasury preferred stock purchases as well as U.S. Treasury and Federal Reserve purchases of their mortgage backed securities (“MBS”). However, no assurance can be given that continued support from the Federal Reserve, U.S. Treasury, or FHFA will ensure that the GSEs will remain successful in meeting their obligations with respect to the debt and MBS they issue. The FHFA and the U.S. Treasury also have imposed strict limits on the size of GSEs’ mortgage portfolios. In August 2012, the U.S. Treasury amended its preferred stock purchase agreements to provide that the GSEs’ portfolios will be wound down at an annual rate of 15 percent (up from the previously agreed annual rate of 10 percent), requiring the GSEs to reach the $250 billion target four years earlier than previously planned.
In addition, the U.S. Government reportedly is considering multiple options regarding the future of the GSEs, ranging on a spectrum from nationalization, privatization, consolidation, or abolishment. The Obama Administration produced a report to Congress on February 11, 2011, outlining a proposal to wind down the GSEs by increasing their guarantee fees, reducing their conforming loan limits (the maximum amount of each loan they are authorized to purchase), and continuing progressive limits on the size of their investment portfolio. Congress is currently considering several pieces of legislation that would reform the GSEs and possibly wind down their existence, addressing portfolio limits and guarantee fees, among other issues. The potential impact of these developments is unclear, but could cause a Portfolio to lose money.
Certain Portfolios may invest in collateralized mortgage obligations (“CMOs”) and stripped mortgage-backed securities that represent a participation in, or are secured by, mortgage loans. Some mortgage-backed securities, such as CMOs, make payments of both principal and interest at a variety of intervals; others make semiannual interest payments at a predetermined rate and repay principal at maturity (like a typical bond). Mortgage-backed securities are based on different types of mortgages including those on commercial real estate or residential properties.
CMOs may be issued by a U.S. Government agency or instrumentality or by a private issuer. Although payment of the principal of, and interest on, the underlying collateral securing privately issued CMOs may be guaranteed by the U.S. Government or its agencies or instrumentalities, these CMOs represent obligations solely of the private issuer and are not insured or guaranteed by the U.S. Government, its agencies or instrumentalities or any other person or entity. Prepayments could cause early retirement of CMOs. CMOs are designed to reduce the risk of prepayment for investors by issuing multiple classes of securities (or “tranches”), each having different maturities, interest rates and payment schedules, and with the principal and interest on the underlying mortgages allocated among the several classes in various ways. Payment of interest or principal on some classes or series of CMOs may be subject to contingencies or some classes or series may bear some or all of the risk of default on the underlying mortgages. CMOs of different classes or series are generally retired in sequence as the underlying mortgage loans in the mortgage pool are repaid. If enough mortgages are repaid ahead of schedule, the classes or series of a CMO with the earliest maturities generally will be retired prior to their maturities. Thus, the early retirement of particular classes or series of a CMO held by a Portfolio would have the same effect as the prepayment of mortgages underlying other mortgage-backed securities. Conversely, slower than anticipated prepayments can extend the effective maturities of CMOs, subjecting them to a greater risk of decline in market value in response to rising interest rates than traditional debt securities, and, therefore, potentially increasing the volatility of a Portfolio that invests in CMOs.
The value of mortgage-backed securities may change due to shifts in the market’s perception of issuers. In addition, regulatory or tax changes may adversely affect the mortgage securities market as a whole. Non-government mortgage-backed securities may offer higher yields than those issued by government entities, but also may be subject to greater price changes than government issues. Mortgage-backed securities have yield and maturity characteristics corresponding to the underlying assets. Certain mortgage-backed securities may include securities backed by pools of mortgage loans made to borrowers with blemished credit histories (“subprime” loans). The underwriting standards for subprime loans may be lower and more flexible than the standards generally used by lenders for borrowers with
34
non-blemished credit histories with respect to the borrower’s credit standing and repayment history. Unlike traditional debt securities, which may pay a fixed rate of interest until maturity, when the entire principal amount comes due, payments on certain mortgage-backed securities include both interest and a partial repayment of principal. Besides the scheduled repayment of principal, repayments of principal may result from the voluntary prepayment, refinancing, or foreclosure of the underlying mortgage loans.
Mortgage-backed securities are subject to prepayment risk. Prepayment, which occurs when unscheduled or early payments are made on the underlying mortgages, may shorten the effective maturities of these securities and may lower their returns. If property owners make unscheduled prepayments of their mortgage loans, these prepayments will result in early payment of the applicable mortgage-related securities. In that event, the Portfolios may be unable to invest the proceeds from the early payment of the mortgage-related securities in an investment that provides as high a yield as the mortgage-related securities. Consequently, early payment associated with mortgage-related securities may cause these securities to experience significantly greater price and yield volatility than that experienced by traditional fixed-income securities. The occurrence of mortgage prepayments is affected by factors including the level of interest rates, general economic conditions, the location and age of the mortgage and other social and demographic conditions. During periods of falling interest rates, the rate of mortgage prepayments tends to increase, thereby tending to decrease the life of mortgage-related securities. During periods of rising interest rates, the rate of mortgage prepayments usually decreases, thereby tending to increase the life of mortgage-related securities. In addition, the risk of default by borrowers is greater during times of rising interest rates and/or unemployment rates. The risk of default is generally higher in the case of mortgage pools that include subprime mortgages. If the life of a mortgage-related security is inaccurately predicted, a Portfolio may not be liable to realize the rate of return it expected.
Mortgage-backed securities are less effective than other types of securities as a means of “locking in” attractive long-term interest rates. One reason is the need to reinvest prepayments of principal; another is the possibility of significant unscheduled prepayments resulting from declines in interest rates. Prepayments may cause losses on securities purchased at a premium. At times, some of the mortgage-backed securities in which a Portfolio may invest will have higher than market interest rates and, therefore, will be purchased at a premium above their par value. Unscheduled prepayments, which are made at par, will cause a Portfolio to experience a loss equal to any unamortized premium.
Stripped mortgage-backed securities are created when a U.S. government agency or a financial institution separates the interest and principal components of a mortgage-backed security and sells them as individual securities. The securities may be issued by agencies or instrumentalities of the U.S. Government and private originators of, or investors in, mortgage loans, including savings and loan associations, mortgage banks, commercial banks, investment banks and special purpose entities of the foregoing. Stripped mortgage-backed securities are usually structured with two classes that receive different portions of the interest and principal distributions on a pool of mortgage loans. The holder of the “principal-only” security (“PO”) receives the principal payments made by the underlying mortgage-backed security, while the holder of the “interest-only” security (“IO”) receives interest payments from the same underlying security. The Portfolios may invest in both the IO class and the PO class. The prices of stripped mortgage-backed securities may be particularly affected by changes in interest rates. The yield to maturity on an IO class of stripped mortgage-backed securities is extremely sensitive not only to changes in prevailing interest rates but also to the rate of principal payments (including prepayments) on the underlying assets. As interest rates fall, prepayment rates tend to increase, which tends to reduce prices of IOs and increase prices of POs. Rising interest rates can have the opposite effect.
Prepayments may also result in losses on stripped mortgage-backed securities. A rapid rate of principal prepayments may have a measurable adverse effect on a Portfolio’s yield to maturity to the extent it invests in IOs. If the assets underlying the IO experience greater than anticipated prepayments of principal, a Portfolio may fail to recoup fully its initial investments in these securities. Conversely, POs tend to increase in value if prepayments are greater than anticipated and decline if prepayments are
35
slower than anticipated. The secondary market for stripped mortgage-backed securities may be more volatile and less liquid than that for other mortgage-backed securities, potentially limiting the Portfolios’ ability to buy or sell those securities at any particular time.
Certain Portfolios may also invest in directly placed mortgages including residential mortgages, multifamily mortgages, mortgages on cooperative apartment buildings, commercial mortgages, and sale-leasebacks. These investments are backed by assets such as office buildings, shopping centers, retail stores, warehouses, apartment buildings and single-family dwellings. In the event that the Portfolio forecloses on any non-performing mortgage, it could end up acquiring a direct interest in the underlying real property and the Portfolio would then be subject to the risks generally associated with the ownership of real property. There may be fluctuations in the market value of the foreclosed property and its occupancy rates, rent schedules and operating expenses. Investment in direct mortgages involve many of the same risks as investments in mortgage-related securities. There may also be adverse changes in local, regional or general economic conditions, deterioration of the real estate market and the financial circumstances of tenants and sellers, unfavorable changes in zoning, building, environmental and other laws, increased real property taxes, rising interest rates, reduced availability and increased cost of mortgage borrowings, the need for anticipated renovations, unexpected increases in the cost of energy, environmental factors, acts of God and other factors which are beyond the control of the Portfolio or the Adviser. Hazardous or toxic substances may be present on, at or under the mortgaged property and adversely affect the value of the property. In addition, the owners of the property containing such substances may be held responsible, under various laws, for containing, monitoring, removing or cleaning up such substances. The presence of such substances may also provide a basis for other claims by third parties. Costs of clean-up or of liabilities to third parties may exceed the value of the property. In addition, these risks may be uninsurable. In light of these and similar risks, it may be impossible to dispose profitably of properties in foreclosure.
Mortgage Dollar Rolls. As indicated in Appendix A, certain of the Portfolios may enter into mortgage dollar rolls in which the Portfolio sells securities for delivery in the current month and simultaneously contracts with the same counterparty to repurchase similar (same type, coupon and maturity) but not identical securities on a specified future date at a pre-determined price. During the roll period, the Portfolio loses the right to receive principal (including prepayments of principal) and interest paid on the securities sold. However, the Portfolio would benefit to the extent of any difference between the price received for the securities sold and the lower forward price for the future purchase (often referred to as the “drop”) or fee income plus the interest earned on the cash proceeds of the securities sold until the settlement date of the forward purchase. Unless such benefits exceed the income, capital appreciation and gain or loss due to mortgage prepayments that would have been realized on the securities sold as part of the mortgage dollar roll, the use of this technique will diminish the investment performance of the Portfolio compared with what such performance would have been without the use of mortgage dollar rolls. Accordingly, the benefits derived from the use of mortgage dollar rolls depend upon the Adviser’s ability to manage mortgage prepayments. There is no assurance that mortgage dollar rolls can be successfully employed. A “dollar roll” transaction can be viewed as a collateralized borrowing in which a Portfolio pledges a mortgage-related security to a dealer to obtain cash. However, in a “dollar roll” transaction, the dealer with which the Portfolio enters into a transaction is not obligated to return the same securities as those originally sold by the Portfolio, but generally only securities which are “substantially identical.” To be considered “substantially identical,” the securities returned to a Portfolio generally must: (1) be collateralized by the same types of underlying mortgages; (2) be issued by the same agency and be part of the same program; (3) have a similar original stated maturity; (4) have identical net coupon rates; (5) have similar market yields (and therefore price); and (6) satisfy “good delivery” requirements, meaning that the aggregate principal amounts of the securities delivered and received back must be within 0.01% of the initial amount delivered. All cash proceeds from dollar roll transactions will be invested in instruments that are permissible investments for the Portfolio. The Portfolio will maintain until the settlement date the segregation, either on the records of the Adviser or with the Trust’s custodian, of cash or other liquid securities in an amount not less than the forward purchase price. Because dollar roll transactions may be for terms ranging between one and six months, dollar roll transactions may be deemed “illiquid” and subject the risks of investing in illiquid securities as well as to a Portfolio’s overall limitations on investments in illiquid securities.
36
Municipal Securities. As indicated in Appendix A, certain of the Portfolios may invest in municipal securities (“municipals”), including residual interest bonds, which are debt obligations issued by local, state and regional governments that provide interest income that is exempt from federal income tax. Municipals include both municipal bonds (those securities with maturities of five years or more) and municipal notes (those with maturities of less than five years). Municipal bonds are issued for a wide variety of reasons: to construct public facilities, such as airports, highways, bridges, schools, hospitals, mass transportation, streets, water and sewer works; to obtain funds for operating expenses; to refund outstanding municipal obligations; and to loan funds to various public institutions and facilities. Certain private activity bonds are also considered municipals if the interest thereon is exempt from federal income tax (even though that interest may be an item of tax preference for purposes of the federal alternative minimum tax). Private activity bonds are issued by or on behalf of public authorities to obtain funds for various privately operated manufacturing facilities, housing, sports arenas, convention centers, airports, mass transportation systems and water, gas or sewer works. Private activity bonds are ordinarily dependent on the credit quality of a private user, not the public issuer.
The value of municipal securities can be affected by changes in the actual or perceived credit quality of the issuer, which can be affected by, among other things, the financial condition of the issuer, the issuer’s future borrowing plans and sources of revenue, the economic feasibility of the revenue bond project or general borrowing purpose, and political or economic developments in the region where the instrument is issued. Local and national market forces — such as declines in real estate prices or general business activity — shifting demographics or political gridlock may result in decreasing tax bases, growing entitlement budgets, and increasing construction and/or maintenance costs and could reduce the ability of certain issuers of municipal securities to repay their obligations. Those obligations are subject to the provisions of bankruptcy, insolvency and other laws affecting the rights and remedies of creditors. Congress or state legislatures may seek to extend the time for payment of principal or interest, or both, or to impose other constraints upon enforcement of such obligations. There is also the possibility that as a result of litigation or other conditions, the power or ability of issuers to meet their obligations for the payment of interest and principal on their municipal securities may be materially affected or their obligations may be found to be invalid or unenforceable. These and other factors may adversely affect the value of a Portfolio’s investments in municipal securities.
Options and Futures Transactions. As indicated in Appendix A, certain of the Portfolios may buy and sell futures and options contracts for any number of reasons, including: to manage its exposure to changes in securities prices and foreign currencies; as an efficient means of adjusting its overall exposure to certain markets; in an effort to enhance income; to protect the value of portfolio securities and to adjust the duration of fixed income investments. Each Portfolio may purchase, sell, or write call and put options and futures contracts on securities, financial indices, and foreign currencies and options on futures contracts.
The risk of loss in trading futures contracts can be substantial because of the low margin deposits required and the extremely high degree of leveraging involved in futures pricing. As a result, a relatively small price movement in a futures contract may cause an immediate and substantial loss or gain. The primary risks associated with the use of futures contracts and options are: (i) imperfect correlation between the change in market value of the stocks held by a Portfolio and the prices of futures contracts and options; and (ii) possible lack of a liquid secondary market for a futures contract or an option and the resulting inability to close a futures position or option prior to its maturity date.
Following is a description of specific Options and Futures Transactions, followed by a discussion concerning the risks associated with utilizing options, futures contracts, and forward foreign currency exchange contracts.
Futures Transactions. As indicated in Appendix A, certain of the Portfolios may utilize futures contracts. Futures contracts (a type of potentially high-risk investment) enable the investor to buy or sell an asset in the future at an agreed upon price. A futures contract is a bilateral agreement to buy or sell a security or other commodity (or deliver a cash settlement price, in the case of a contract relating to a rate or an index or otherwise not calling for physical delivery at the end of trading in the contracts) for a set price in the future. Futures contracts are designated by boards of trade which have been designated “contracts markets” by the CFTC.
37
No purchase price is paid or received when the contract is entered into. Instead, a Portfolio upon entering into a futures contract (and to maintain the Portfolio’s open positions in futures contracts) would be required to designate the segregation, either on the records of the Advisers or with the Trust’s custodian, in the name of the futures broker an amount of cash, United States Government securities, suitable money market instruments, or liquid, high-grade debt securities, known as “initial margin.” The margin required for a particular futures contract is set by the exchange on which the contract is traded, and may be significantly modified from time to time by the exchange during the term of the contract. Futures contracts are customarily purchased and sold on margin that may range upward from less than 5% of the value of the contract being traded. By using futures contracts as a risk management technique, given the greater liquidity in the futures market than in the cash market, it may be possible to accomplish certain results more quickly and with lower transaction costs.
If the price of an open futures contract changes (by increase in the case of a sale or by decrease in the case of a purchase) so that the loss on the futures contract reaches a point at which the margin on deposit does not satisfy margin requirements, the broker will require an increase in the margin. However, if the value of a position increases because of favorable price changes in the futures contract so that the margin deposit exceeds the required margin, the broker will pay the excess to the Portfolio. These subsequent payments called “variation margin,” to and from the futures broker, are made on a daily basis as the price of the underlying assets fluctuate making the long and short positions in the futures contract more or less valuable, a process known as “marking to the market.” The Portfolios expect to earn interest income on their initial and variation margin deposits.
A Portfolio will incur brokerage fees when it purchases and sells futures contracts. Positions taken in the futures markets are not normally held until delivery or cash settlement is required, but are instead liquidated through offsetting transactions which may result in a gain or a loss. While futures positions taken by a Portfolio will usually be liquidated in this manner, the Portfolio may instead make or take delivery of underlying securities whenever it appears economically advantageous for the Portfolio to do so. A clearing organization associated with the exchange on which futures are traded assumes responsibility for closing out transactions and guarantees that as between the clearing members of an exchange, the sale and purchase obligations will be performed with regard to all positions that remain open at the termination of the contract.
Options on Futures Contracts. As indicated in Appendix A, certain of the Portfolios may purchase and write exchange-traded call and put options on futures contracts of the type which the particular Portfolio is authorized to enter into. These options are traded on exchanges that are licensed and regulated by the CFTC for the purpose of options trading. A call option on a futures contract gives the purchaser the right, in return for the premium paid, to purchase a futures contract (assume a “long” position) at a specified exercise price at any time before the option expires. A put option gives the purchaser the right, in return for the premium paid, to sell a futures contract (assume a “short” position), for a specified exercise price, at any time before the option expires.
Options on futures contracts can be used by a Portfolio to hedge substantially the same risks as might be addressed by the direct purchase or sale of the underlying futures contracts. If the Portfolio purchases an option on a futures contract, it may obtain benefits similar to those that would result if it held the futures position itself. Purchases of options on futures contracts may present less risk in hedging than the purchase and sale of the underlying futures contracts since the potential loss is limited to the amount of the premium plus related transaction costs.
The Portfolios will write only options on futures contracts which are “covered.” A Portfolio will be considered “covered” with respect to a put option it has written if, so long as it is obligated as a writer of the put, the Portfolio segregates, either on the records of the Adviser or with the Trust’s custodian, cash or other liquid securities at all times equal to or greater than the aggregate exercise price of the puts it has written (less any related margin deposited with the futures broker). A Portfolio will be considered “covered” with respect to a call option it has written on a debt security future if, so long as it is obligated as a writer of the call, the Portfolio owns a security deliverable under the futures contract. A Portfolio
38
will be considered “covered” with respect to a call option it has written on a securities index future if the Portfolio owns, so long as the Portfolio is obligated as the writer of the call, a portfolio of securities the price changes of which are, in the opinion of its Adviser, expected to replicate substantially the movement of the index upon which the futures contract is based.
Upon the exercise of a call option, the writer of the option is obligated to sell the futures contract (to deliver a “long” position to the option holder) at the option exercise price, which will presumably be lower than the current market price of the contract in the futures market. Upon exercise of a put, the writer of the option is obligated to purchase the futures contract (deliver a “short” position to the option holder) at the option exercise price which will presumably be higher than the current market price of the contract in the futures market. When the holder of an option exercises it and assumes a long futures position, in the case of a call, or a short futures position, in the case of a put, its gain will be credited to its futures margin account, while the loss suffered by the writer of the option will be debited to its account and must be immediately paid by the writer. However, as with the trading of futures, most participants in the options markets do not seek to realize their gains or losses by exercise of their option rights. Instead, the holder of an option will usually realize a gain or loss by buying or selling an offsetting option at a market price that will reflect an increase or a decrease from the premium originally paid.
If a Portfolio writes options on futures contracts, the Portfolio will receive a premium but will assume a risk of adverse movement in the price of the underlying futures contract comparable to that involved in holding a futures position. If the option is not exercised, the Portfolio will realize a gain in the amount of the premium, which may partially offset unfavorable changes in the value of securities held in or to be acquired for the Portfolio. If the option is exercised, the Portfolio will incur a loss in the option transaction, which will be reduced by the amount of the premium it has received, but which will offset any favorable changes in the value of its portfolio securities or, in the case of a put, lower prices of securities it intends to acquire.
Limitations on Purchase and Sale of Futures Contracts and Options on Futures Contracts. The Portfolios may invest in futures and options for hedging purposes, as well as non-hedging purposes, to the extent permitted in the Prospectus and SAI. In instances involving the purchase of futures contracts or the writing of put options thereon by a Portfolio, an amount of cash and cash equivalents, equal to the cost of such futures contracts or options written (less any related margin deposits), will be designated either on the records of the Advisers or with the Trust’s custodian, thereby insuring that the use of such futures contracts and options is unleveraged. In instances involving the sale of futures contracts or the writing of call options thereon by a Portfolio, the securities underlying such futures contracts or options will at all times be maintained by the Portfolio or, in the case of index futures and related options, the Portfolio will own securities the price changes of which are, in the opinion of its Adviser, expected to replicate substantially the movement of the index upon which the futures contract or option is based.
For information concerning the risks associated with utilizing options, futures contracts, and forward foreign currency exchange contracts, please see “Risks of Transactions in Options, Futures Contracts and Forward Currency Contracts.”
Options Transactions. As indicated in Appendix A, certain of the Portfolios may also write and purchase put and call options. Options (another type of potentially high-risk security) give the purchaser of an option the right, but not the obligation, to buy or sell in the future an asset at a predetermined price during the term of the option. (The writer of a put or call option would be obligated to buy or sell the underlying asset at a predetermined price during the term of the option.) Each Portfolio will write put and call options only if such options are considered to be “covered,” except as described below. A call option on a security is covered, for example, when the writer of the call option owns throughout the option period the security on which the option is written (or a security convertible into such a security without the payment of additional consideration). A put option on a security is covered, for example, when the writer of the put maintains throughout the option period the segregation, either on the records of the Advisers or with the Trust’s custodian, of cash or other liquid assets in an amount equal to or
39
greater than the exercise price of the put option. A Portfolio may write call options that are not covered for cross-hedging purposes. The Portfolio collateralizes its obligation under a written call option for cross-hedging purposes by segregating, either on the records of the Adviser or with the Trust’s custodian, cash or other liquid assets in an amount not less than the market value of the underlying security, marked-to-market daily. The Portfolio would write a call option for cross-hedging purposes, instead of writing a covered call option, when the premium to be received from the cross-hedge transaction would exceed that which would be received from writing a covered call option and its Adviser believes that writing the option would achieve the desired hedge.
Certain of the Portfolios will not commit more than 5% of their total assets to premiums when purchasing call or put options. In addition, the total market value of securities against which a Portfolio has written call or put options generally will not exceed 25% of its total assets. These limitations do not apply to options attached to or acquired or traded together with their underlying securities, and do not apply to securities that incorporate features similar to options.
Writing Call Options. A call option is a contract which gives the purchaser of the option (in return for a premium paid) the right to buy, and the writer of the option (in return for a premium received) the obligation to sell, the underlying security at the exercise price at any time prior to the expiration of the option, regardless of the market price of the security during the option period. A call option on a security is covered, for example, when the writer of the call option owns the security on which the option is written (or on a security convertible into such a security without additional consideration) throughout the option period.
The writing of a call option on a futures contract constitutes a partial hedge against declining prices of the underlying securities. If the futures price at expiration is below the exercise price, the Portfolio will retain the full amount of the option premium, which provides a partial hedge against any decline that may have occurred in the value of the Portfolio’s holdings of securities. The writing of a put option on a futures contract is analogous to the purchase of a futures contract in that it hedges against an increase in the price of securities the Portfolio intends to acquire. However, the hedge is limited to the amount of premium received for writing the put.
A Portfolio will write covered call options both to reduce the risks associated with certain of its investments and to increase total investment return through the receipt of premiums. In return for the premium income, the Portfolio will give up the opportunity to profit from an increase in the market price of the underlying security above the exercise price so long as its obligations under the contract continue, except insofar as the premium represents a profit. Moreover, in writing the call option, the Portfolio will retain the risk of loss should the price of the security decline. The premium is intended to offset that loss in whole or in part.
Unlike the situation in which the Portfolio owns securities not subject to a call option, the Portfolio, in writing call options, must assume that the call may be exercised at any time prior to the expiration of its obligation as a writer, and that in such circumstances the net proceeds realized from the sale of the underlying securities pursuant to the call may be substantially below the prevailing market price.
A Portfolio may terminate its obligation under an option it has written by buying an identical option. Such a transaction is called a “closing purchase transaction.” The Portfolio will realize a gain or loss from a closing purchase transaction if the amount paid to purchase a call option is less or more than the amount received from the sale of the corresponding call option. Also, because increases in the market price of a call option will generally reflect increases in the market price of the underlying security, any loss resulting from the exercise or closing out of a call option is likely to be offset in whole or part by unrealized appreciation of the underlying security owned by the Portfolio. When an underlying security is sold from the Portfolio’s securities portfolio, the Portfolio will effect a closing purchase transaction so as to close out any existing covered call option on that underlying security.
Writing Put Options. The writer of a put option becomes obligated to purchase the underlying security at a specified price during the option period if the buyer elects to exercise the option before its expiration date. If a Portfolio writes a put option, it will “cover” the position as required by the 1940 Act.
40
A Portfolio may “cover” a put option by, for example, maintaining the segregation, either on the records of the Advisers or with the Trust’s custodian, of cash or other liquid assets having a value equal to or greater than the exercise price of the option.
The Portfolios may write put options either to earn additional income in the form of option premiums (anticipating that the price of the underlying security will remain stable or rise during the option period and the option will therefore not be exercised) or to acquire the underlying security at a net cost below the current value (e.g., the option is exercised because of a decline in the price of the underlying security, but the amount paid by the Portfolio, offset by the option premium, is less than the current price). The risk of either strategy is that the price of the underlying security may decline by an amount greater than the premium received. The premium which a Portfolio receives from writing a put option will reflect, among other things, the current market price of the underlying security, the relationship of the exercise price to that market price, the historical price volatility of the underlying security, the option period, supply and demand and interest rates.
A Portfolio may effect a closing purchase transaction to realize a profit on an outstanding put option or to prevent an outstanding put option from being exercised.
Purchasing Put and Call Options. A Portfolio may purchase put options on securities to increase the Portfolio’s total investment return or to protect its holdings against a substantial decline in market value. The purchase of put options on securities will enable a Portfolio to preserve, at least partially, unrealized gains in an appreciated security in its portfolio without actually selling the security. In addition, the Portfolio will continue to receive interest or dividend income on the security. The Portfolios may also purchase call options on securities to protect against substantial increases in prices of securities that Portfolios intend to purchase pending their ability to invest in an orderly manner in those securities. The Portfolios may sell put or call options they have previously purchased, which could result in a net gain or loss depending on whether the amount received on the sale is more or less than the premium and other transaction costs paid on the put or call option which was bought.
Interest Rate Futures Contracts. Interest rate futures contracts are bilateral agreements pursuant to which one party agrees to make, and the other party agrees to accept, delivery of a specified type of debt security at a specified future time and at a specified price. Although such futures contracts by their terms call for actual delivery or acceptance of bonds, in most cases the contracts are closed out before the settlement date without the making or taking of delivery.
Securities Index Futures Contracts. Purchases or sales of securities index futures contracts may be used in an attempt to increase the Portfolio’s total investment return or to protect a Portfolio’s current or intended investments from broad fluctuations in securities prices. A securities index futures contract does not require the physical delivery of securities, but merely provides for profits and losses resulting from changes in the market value of the contract to be credited or debited at the close of each trading day to the respective accounts of the parties to the contract. On the contract’s expiration date a final cash settlement occurs and the futures positions are simply closed out. Changes in the market value of a particular index futures contract reflect changes in the specified index of securities on which the future is based.
By establishing an appropriate “short” position in index futures, a Portfolio may also seek to protect the value of its portfolio against an overall decline in the market for such securities. Alternatively, in anticipation of a generally rising market, a Portfolio can seek to avoid losing the benefit of apparently low current prices by establishing a “long” position in securities index futures and later liquidating that position as particular securities are in fact acquired. To the extent that these hedging strategies are successful, the Portfolio will be affected to a lesser degree by adverse overall market price movements than would otherwise be the case.
Securities Index Options. A Portfolio may write covered put and call options and purchase call and put options on securities indexes for the purpose of increasing the Portfolio’s total investment return or hedging against the risk of unfavorable price movements adversely affecting the value of a Portfolio’s securities or securities it intends to purchase. Each Portfolio writes only “covered” options. A call option on a securities index is considered covered, for example, if, so long as the Portfolio is obligated as the writer
41
of the call, it holds securities the price changes of which are, in the opinion of a Portfolio’s Adviser, expected to replicate substantially the movement of the index or indexes upon which the options written by the Portfolio are based. A put on a securities index written by a Portfolio will be considered covered if, so long as it is obligated as the writer of the put, the Portfolio segregates, either on the records of the Adviser or with its custodian, cash or other liquid obligations having a value equal to or greater than the exercise price of the option. Unlike a stock option, which gives the holder the right to purchase or sell a specified stock at a specified price, an option on a securities index gives the holder the right to receive a cash “exercise settlement amount” equal to the difference between the exercise price of the option and the value of the underlying stock index on the exercise date, multiplied by a fixed “index multiplier.”
A securities index fluctuates with changes in the market value of the securities so included. For example, some securities index options are based on a broad market index such as the S&P 500 or the NYSE Composite Index, or a narrower market index such as the S&P 100. Indexes may also be based on an industry or market segment such as the AMEX Oil and Gas Index or the Computer and Business Equipment Index.
Over the Counter Options. As indicated in Appendix A, certain of the Portfolios may engage in over the counter put and call option transactions. Options traded in the OTC market may not be as actively traded as those on an exchange, so it may be more difficult to value such options. In addition, it may be difficult to enter into closing transactions with respect to such options. Such over the counter options, and the securities used as “cover” for such options, may be considered illiquid securities. Certain Portfolios may enter into contracts (or amend existing contracts) with primary dealers with whom they write over the counter options. The contracts will provide that each Portfolio has the absolute right to repurchase an option it writes at any time at a repurchase price which represents the fair market value, as determined in good faith through negotiation between the parties, but which in no event will exceed a price determined pursuant to a formula contained in the contract. Although the specific details of the formula may vary between contracts with different primary dealers, the formula will generally be based on a multiple of the premium received by each Portfolio for writing the option, plus the amount, if any, of the option’s intrinsic value (i.e., the amount the option is “in-the-money”). The formula will also include a factor to account for the difference between the price of the security and the strike price of the option if the option is written “out-of-the-money.” Although the specific details of the formula may vary with different primary dealers, each contract will provide a formula to determine the maximum price at which each Portfolio can repurchase the option at any time. The Portfolios have established standards of creditworthiness for these primary dealers, although the Portfolios may still be subject to the risk that firms participating in such transactions will fail to meet their obligations. In instances in which a Portfolio has entered into agreements with respect to the over the counter options it has written, and such agreements would enable the Portfolio to have an absolute right to repurchase at a pre-established formula price the over the counter option written by it, the Portfolio would treat as illiquid only securities equal in amount to the formula price described above less the amount by which the option is “in-the-money,” i.e., the amount by which the price of the option exceeds the exercise price. Certain over the counter options are considered to be swaps. For information concerning the risks associated with utilizing swaps, please see “Swaps.”
Risks of Transactions in Options, Futures Contracts and Forward Currency Contracts
Options. A closing purchase transaction for exchange-traded options may be made only on a national securities exchange (“exchange”). There is no assurance that a liquid secondary market on an exchange will exist for any particular option, or at any particular time, and for some options, such as over the counter options, no secondary market on an exchange may exist. If a Portfolio is unable to effect a closing purchase transaction, the Portfolio will not sell the underlying security until the option expires or the Portfolio delivers the underlying security upon exercise.
Options traded in the OTC market may not be as actively traded as those on an exchange. Accordingly, it may be more difficult to value such options. In addition, it may be difficult to enter into closing transactions with respect to options traded OTC. The Portfolios will engage in such transactions only
42
with firms of sufficient credit so as to minimize these risks. Such options and the securities used as “cover” for such options may be considered illiquid securities.
The effectiveness of hedging through the purchase of securities index options will depend upon the extent to which price movements in the portion of the securities portfolio being hedged correlate with price movements in the selected securities index. Perfect correlation is not possible because the securities held or to be acquired by a Portfolio will not exactly match the composition of the securities indexes on which options are written. In the purchase of securities index options the principal risk is that the premium and transaction costs paid by a Portfolio in purchasing an option will be lost if the changes (increase in the case of a call, decrease in the case of a put) in the level of the index do not exceed the cost of the option.
Futures. The prices of futures contracts are volatile and are influenced, among other things, by actual and anticipated changes in the market and interest rates, which in turn are affected by fiscal and monetary policies and national and international political and economic events.
Most United States futures exchanges limit the amount of fluctuation permitted in futures contract prices during a single trading day. The daily limit establishes the maximum amount that the price of a futures contract may vary either up or down from the previous day’s settlement price at the end of a trading session. Once the daily limit has been reached in a particular type of futures contract, no trades may be made on that day at a price beyond that limit. The daily limit governs only price movement during a particular trading day and therefore does not limit potential losses, because the limit may prevent the liquidation of unfavorable positions. Futures contract prices have occasionally moved to the daily limit for several consecutive trading days with little or no trading, thereby preventing prompt liquidation of futures positions and subjecting some futures traders to substantial losses.
Because of the low margin deposits required, futures trading involves an extremely high degree of leverage. As a result, a relatively small price movement in a futures contract may result in immediate and substantial loss, as well as gain, to the investor. For example, if at the time of purchase, 10% of the value of the futures contract is deposited as margin, a subsequent 10% decrease in the value of the futures contract would result in a total loss of the margin deposit, before any deduction for the transaction costs, if the account were then closed out. A 15% decrease would result in a loss equal to 150% of the original margin deposit, if the contract were closed out. Thus, a purchase or sale of a futures contract may result in losses in excess of the amount invested in the futures contract. In addition, transaction costs associated with investments in futures contracts may be significant, which could cause or increase losses or reduce gains.
A decision of whether, when, and how to hedge involves skill and judgment, and even a well-conceived hedge may be unsuccessful to some degree because of unexpected market behavior, market trends or interest rate trends. There are several risks in connection with the use by a Portfolio of futures contracts as a hedging device. One risk arises because of the imperfect correlation between movements in the prices of the futures contracts and movements in the prices of the underlying instruments which are the subject of the hedge. The Manager or a Portfolio’s Adviser will, however, attempt to reduce this risk by entering into futures contracts whose movements, in its judgment, will have a significant correlation with movements in the prices of the Portfolio’s underlying instruments sought to be hedged.
Successful use of futures contracts by a Portfolio for hedging purposes is also subject to the Manager’s or an Adviser’s ability to correctly predict movements in the direction of the market and other economic factors. It is possible that, when a Portfolio has sold futures to hedge its portfolio against a decline in the market, the index, indices, or instruments underlying futures might advance and the value of the underlying instruments held in the Portfolio’s portfolio might decline. If this were to occur, the Portfolio would lose money on the futures and also would experience a decline in value in its underlying instruments.
Positions in futures contracts may be closed out only on an exchange or a board of trade which provides the market for such futures. Although the Portfolios, specified in the Prospectus, intend to purchase or sell futures only on exchanges or boards of trade where there appears to be an active market, there is no guarantee that such will exist for any particular contract or at any particular time. If there is not a liquid market at a particular time, it may not be possible to close a futures position at such time, and, in the event of adverse price movements, a Portfolio would continue to be required to make daily cash payments of variation margin. If a Portfolio has insufficient cash, it may have to sell securities from its
43
portfolio at a time when it may be disadvantageous to do so. However, in the event futures positions are used to hedge portfolio securities, the securities will not be sold until the futures positions can be liquidated. In such circumstances, an increase in the price of securities, if any, may partially or completely offset losses on the futures contracts.
Foreign Options and Futures. Participation in foreign futures and foreign options transactions involves the execution and clearing of trades on or subject to the rules of a foreign board of trade. Neither the National Futures Association nor any domestic exchange regulates activities of any foreign boards of trade, including the execution, delivery and clearing of transactions, or has the power to compel enforcement of the rules of a foreign board of trade or any applicable foreign law. This is true even if the exchange is formally linked to a domestic market so that a position taken on the market may be liquidated by a transaction on another market. Moreover, such laws or regulations will vary depending on the foreign country in which the foreign futures or foreign options transaction occurs. For these reasons, when a Portfolio trades foreign futures or foreign options contracts, it may not be afforded certain of the protective measures provided by the Commodity Exchange Act, the CFTC’s regulations and the rules of the National Futures Association and any domestic exchange, including the right to use reparations proceedings before the CFTC and arbitration proceedings provided by the National Futures Association or any domestic futures exchange. In particular, funds received from a Portfolio for foreign futures or foreign options transactions may not be provided the same protections as funds received in respect of transactions on U.S. futures exchanges. In addition, the price of any foreign futures or foreign options contract and, therefore, the potential profit and loss thereon, may be affected by any variance in the foreign exchange rate between the time the Portfolio’s order is placed and the time it is liquidated, offset or exercised.
Foreign Currency Contracts. Hedging against a decline in the value of a currency does not eliminate fluctuations in the prices of portfolio securities or prevent losses if the prices of such securities decline. These hedging transactions also preclude the opportunity for gain if the value of the hedged currency should rise. Whether a currency hedge benefits a Portfolio will depend on the ability of a Portfolio’s Adviser to predict future currency exchange rates.
The writing of an option on foreign currency will constitute only a partial hedge, up to the amount of the premium received, and a Portfolio could be required to purchase or sell foreign currencies at disadvantageous exchange rates, thereby incurring losses. The purchase of an option on foreign currency may constitute an effective hedge against fluctuations in exchange rates although, in the event of rate movements adverse to a Portfolio’s position, it may forfeit the entire amount of the premium plus related transaction costs.
Participatory Notes. A Portfolio may invest in participatory notes (commonly known as “P-Notes”) issued by banks or broker-dealers that are designed to replicate the performance of certain issuers and markets. Participatory notes are a type of equity-linked derivative which generally are traded over-the-counter. The performance results of participatory notes will not replicate exactly the performance of the issuers or markets that the notes seek to replicate due to transaction costs and other expenses. Investments in participatory notes involve the same risks associated with a direct investment in the shares of the companies the notes seek to replicate. In addition, participatory notes are subject to counterparty risk, which is the risk that the broker-dealer or bank that issues the notes will not fulfill its contractual obligation to complete the transaction with a Portfolio. Participatory notes constitute general unsecured contractual obligations of the banks or broker-dealers that issue them, and a Portfolio is relying on the creditworthiness of such banks or broker-dealers and has no rights under a participatory note against the issuers of the securities underlying such participatory notes. Participatory notes involve transaction costs. Participatory notes may be considered illiquid and, therefore, participatory notes considered illiquid will be subject to a Portfolio’s percentage limitation on investments in illiquid securities.
Preferred Stocks. As indicated in Appendix A, certain of the Portfolios may invest in preferred stocks. Preferred stocks have the right to receive specified dividends before the payment of dividends on common stock. In the event an issuer is liquidated or declares bankruptcy, the claims of owners of the issuer’s bonds take precedence over the claims of owners of the issuer’s preferred and common stock. If
44
interest rates rise, the specified dividend on preferred stocks may be less attractive, causing the price of such stocks to decline. The value of preferred stocks is sensitive to changes in interest rates and to changes in the issuer’s credit quality. Cumulative preferred stock requires the issuer to pay stockholders all prior unpaid dividends before the issuer can pay dividends on common stock, whereas non-cumulative preferred stock does not require the issuer to do so. Some preferred stocks also participate in dividends paid on common stock. Preferred stocks may provide for the issuer to redeem the stock on a specified date. A Portfolio may treat such redeemable preferred stock as a fixed income security.
Repurchase Agreements. As indicated in Appendix A, certain of the Portfolios may enter into repurchase agreements. A repurchase agreement is a transaction in which a Portfolio purchases securities or other obligations from a bank or securities dealer (or its affiliate) and simultaneously commits to resell them to a counterparty at an agreed-upon date or upon demand and at a price reflecting a market rate of interest unrelated to the coupon rate or maturity of the purchased obligations. The difference between the total amount to be received upon repurchase of the obligations and the price that was paid by a Portfolio upon acquisition is accrued as interest and included in the Portfolio’s net investment income. Repurchase agreements generally result in a fixed rate of return insulated from market fluctuation during the holding period, and generally are used as a means of earning a return on cash reserves for periods as short as overnight.
Repurchase agreements may have the characteristics of loans by a Portfolio. During the term of a repurchase agreement, a Portfolio, among other things, (i) retains the securities or other obligations subject to the repurchase agreement, either through its regular custodian or through a special “tri-party” custodian or sub-custodian that maintains separate accounts for both the Portfolio and its counterparty, as collateral securing the seller’s repurchase obligation, (ii) continually monitors on a daily basis the market value of the securities or other obligations subject to the repurchase agreement and (iii) requires the seller to deposit with the Portfolio collateral equal to any amount by which the market value of the securities or other obligations subject to the repurchase agreement falls below the resale amount provided under the repurchase agreement.
Each Portfolio intends to enter into repurchase agreements only in transactions with counterparties (which may include brokers-dealers, banks, U.S. government securities dealers and other intermediaries) believed by the Manager and the Advisers to present minimal credit risks. A Portfolio generally will not enter into a repurchase agreement maturing in more than seven days. The SEC staff currently takes the position that repurchase agreements maturing in more than seven days are illiquid securities.
Repurchase agreements carry certain risks, including risks that are not associated with direct investments in securities. If a seller under a repurchase agreement were to default on the agreement and be unable to repurchase the security subject to the repurchase agreement, the Portfolio would look to the collateral underlying the seller’s repurchase agreement, including the securities or other obligations subject to the repurchase agreement, for satisfaction of the seller’s obligation to the Portfolio. A Portfolio’s right to liquidate the securities or other obligations subject to the repurchase agreement in the event of a default by the seller could involve certain costs and delays and, to the extent that proceeds from any sale upon a default of the obligation to repurchase are less than the repurchase price (e.g., due to transactions costs or a decline in the value of the collateral), the Portfolio could suffer a loss. In addition, if bankruptcy proceedings are commenced with respect to the seller, realization of the collateral may be delayed or limited and a loss may be incurred. Repurchase agreements involving obligations other than U.S. government securities (such as commercial paper and corporate bonds) may be subject to special risks and may not have the benefit of certain protections in the event of the counterparty’s insolvency.
Real Estate Industry Investing. Investments in securities of issuers engaged in the real estate industry entail special risks and considerations. In particular, securities of such issuers may be subject to risks associated with the direct ownership of real estate. These risks include: the cyclical nature of real estate values, including the decline in the value of real estate, risks related to general and local economic conditions, overbuilding and increased competition, increases in property taxes and operating expenses, demographic trends and variations
45
in rental income, changes in zoning laws, casualty or condemnation losses, environmental risks, regulatory limitations on rents, changes in neighborhood values, changes in the appeal of properties to tenants, increases in interest rates and other real estate capital market influences. Generally, increases in interest rates will increase the costs of obtaining financing, which could directly and indirectly decrease the value of the Portfolios’ investments.
Real Estate Investment Trusts. As indicated in Appendix A, certain Portfolios may invest in real estate investment trusts (“REITs”). Certain Portfolios may invest up to 20% of their respective net assets in real estate companies, including REITs.
REITs pool investors’ funds for investment primarily in income-producing real estate or real estate related loans or interests. A REIT is not taxed on net income and realized gain that it distributes to its owners if it complies with statutory and regulatory requirements relating to its management, organization, ownership, assets and income and with a statutory requirement that it distribute to its owners at least 90% of the sum its REIT taxable income and certain other income for each taxable year. Generally, REITs can be classified as equity REITs, mortgage REITs or hybrid REITs. Equity REITs invest the majority of their assets directly in real property and derive their income primarily from rents and capital gains from appreciation realized through property sales. Equity REITs are further categorized according to the types of real estate they own, e.g., apartment properties, retail shopping centers, office and industrial properties, hotels, health-care facilities, manufactured housing and mixed-property types. Mortgage REITs invest the majority of their assets in real estate mortgages and derive their income primarily from interest payments. Hybrid REITs combine the characteristics of both equity and mortgage REITs.
A shareholder in any Portfolio, by investing in REITs indirectly through the Portfolio, will bear not only its proportionate share of the expenses of the Portfolio, but also, indirectly, the management expenses of the underlying REITs. In addition, equity REITs may be affected by changes in the values of the underlying property they own, while mortgage REITs may be affected by the quality of credit extended. REITs are dependent upon management skills, may not be diversified and are subject to the risks of financing projects and risks inherent in investments in a limited number of properties, in a narrow geographic area, or in a single property type. REITs are also subject to heavy cash flow dependency, defaults by borrowers, self-liquidation and the possibility of failing (1) to qualify for tax-free pass-through of net income and realized gains under the Code and (2) to maintain exemption from the 1940 Act. If an issuer of debt securities collateralized by real estate defaults, it is conceivable that the REITs holding those securities could end up holding the underlying real estate.
Risks associated with investments in securities of real estate companies include those discussed above in “Real Estate Industry Investing.”
Reverse Repurchase Agreements, Dollar Rolls and Sale-Buyback Transactions. As indicated in Appendix A, certain of the Portfolios may enter into reverse repurchase agreements and dollar rolls with brokers, dealers, domestic and foreign banks and/or other financial institutions. In addition, a Portfolio may also enter into sale-buyback transactions and other economically similar transactions. Reverse repurchase agreements, dollar rolls and sale-buyback transactions may be viewed as the borrowing of money by the Portfolio. See “Fundamental Restrictions” for more information concerning restrictions on borrowing by each Portfolio. Reverse repurchase agreements are considered to be borrowings under the 1940 Act.
In a reverse repurchase agreement, a Portfolio sells a security and agrees to repurchase it at a mutually agreed upon date and price, reflecting the interest rate effective for the term of the agreement. During the term of the agreement, a Portfolio will continue to receive any principal and interest payments on the underlying security. A Portfolio may enter into a reverse repurchase agreement only if the interest income from investment of the proceeds is greater than the interest expense of the transaction and the proceeds are invested for a period no longer than the term of the agreement. If interest rates rise during a reverse repurchase agreement, it may adversely affect the Portfolio’s net asset value.
46
In “dollar roll” transactions, a Portfolio sells fixed-income securities for delivery in the current month and simultaneously contracts to repurchase similar but not identical (same type, coupon and maturity) securities on a specified future date at a pre-determined price. During the roll period, a Portfolio would forego principal and interest paid on such securities. A Portfolio would be compensated by the difference between the current sales price and the forward price for the future purchase, as well as by the interest earned on the cash proceeds of the initial sale. See “Mortgage Dollar Rolls” for more information.
A Portfolio also may effect simultaneous purchase and sale transactions that are known as “sale buybacks.” A sale buyback is similar to a reverse repurchase agreement, except that in a sale-buyback, the counterparty who purchases the security is entitled to receive any principal or interest payments made on the underlying security pending settlement of the Portfolio’s repurchase of the underlying security. A Portfolio’s obligations under a sale-buyback typically would be offset by liquid assets in an amount not less than the amount of the Portfolio’s forward commitment to repurchase the subject security.
At the time a Portfolio enters into a reverse repurchase agreement, dollar roll or sale-buyback, it will maintain the segregation, either on the records of the Advisers or with the Trust’s custodian, of cash or other liquid securities having a value not less than the repurchase price (including accrued interest) and will subsequently monitor the account to ensure that its value is maintained. The assets contained in the segregated account will be marked-to-market daily and additional assets will be placed in such account on any day in which the assets fall below the repurchase price (plus accrued interest). A Portfolio’s liquidity and ability to manage its assets might be affected when it sets aside cash or portfolio securities to cover such commitments. Reverse repurchase agreements, dollar rolls and sale-buybacks involve the risk that the market value of the securities retained in lieu of sale may decline below the price of the securities a Portfolio has sold but is obligated to repurchase. Reverse repurchase agreements, dollar rolls and sale-buybacks involve the risk that the buyer of the securities sold by a Portfolio might be unable to deliver them when that Portfolio seeks to repurchase. In the event the buyer of securities under a reverse repurchase agreement, dollar roll or sale-buyback files for bankruptcy or becomes insolvent, such buyer or its trustee or receiver may receive an extension of time to determine whether to enforce a Portfolio’s obligation to repurchase the securities, and a Portfolio’s use of the proceeds of the agreement may effectively be restricted pending such decision, which could adversely affect the Portfolio.
A Portfolio’s investment of the proceeds of a reverse repurchase agreements, dollar rolls and sale-buybacks may be viewed as creating leverage in the Portfolio and as such involve leverage risk.
The assets contained in the segregated account will be marked-to-market daily and additional assets will be placed in such account on any day in which the assets fall below the repurchase price (plus accrued interest). A Portfolio’s liquidity and ability to manage its assets might be affected when it sets aside cash or portfolio securities to cover such commitments. Reverse repurchase agreements involve the risk that the market value of the securities retained in lieu of sale may decline below the price of the securities a Portfolio has sold but is obligated to repurchase. In the event the buyer of securities under a reverse repurchase agreement files for bankruptcy or becomes insolvent, such buyer or its trustee or receiver may receive an extension of time to determine whether to enforce a Portfolio’s obligation to repurchase the securities, and a Portfolio’s use of the proceeds of the reverse repurchase agreement may effectively be restricted pending such decision, which could adversely affect the Portfolio.
In “dollar roll” transactions, a Portfolio sells fixed-income securities for delivery in the current month and simultaneously contracts to repurchase similar but not identical (same type, coupon and maturity) securities on a specified future date at a pre-determined price. During the roll period, a Portfolio would forego principal and interest paid on such securities. A Portfolio would be compensated by the difference between the current sales price and the forward price for the future purchase, as well as by the interest earned on the cash proceeds of the initial sale. At the time a Portfolio enters into a dollar roll transaction, it will maintain the segregation, either on the records of the Advisers or with the Trust’s custodian, of cash or other liquid securities having a value not less than the forward purchase price (including accrued interest) and will subsequently monitor the account to ensure that its value is maintained. See “Mortgage Dollar Rolls” for more information.
47
A Portfolio also may effect simultaneous purchase and sale transactions that are known as “sale-buybacks.” A sale buyback is similar to a reverse repurchase agreement, except that in a sale-buyback, the counterparty who purchases the security is entitled to receive any principal or interest payments made on the underlying security pending settlement of the Portfolio’s repurchase of the underlying security. A Portfolio’s obligations under a sale-buyback typically would be offset by liquid assets in an amount not less than the amount of the Portfolio’s forward commitment to repurchase the subject security.
Time and Demand Deposits. Time deposits are interest-bearing non-negotiable deposits at a bank or a savings and loan association that have a specific maturity date. A time deposit earns a specific rate of interest over a definite period of time. Time deposits may be withdrawn on demand by the investor, but may be subject to early withdrawal penalties that vary depending upon market conditions and the remaining maturity of such deposits. There are no contractual restrictions on the right to transfer a beneficial interest in a time deposit to a third party, but there is no secondary market for such deposits. Demand deposits are accounts at banks and financial institutions from which deposited funds can be withdrawn at any time without notice to the depository institution. The majority of demand deposit accounts are checking and savings accounts. The Portfolios may invest in fixed time deposits, whether or not subject to withdrawal penalties; however, investment in such deposits which are subject to withdrawal penalties, other than overnight deposits, are subject to the limits on illiquid securities.
Time deposits are subject to the same risks that pertain to domestic issuers of money market instruments, most notably credit risk (and to a lesser extent, income risk, market risk, and liquidity risk). In addition, time deposits of foreign branches of U.S. banks and foreign branches of foreign banks may be subject to certain sovereign risks. One such risk is the possibility that a sovereign country might prevent capital, in the form of dollars, from flowing across its borders. Other risks include adverse political and economic developments, the extent of government regulation of financial markets, and expropriation or nationalization of foreign issuers. Demand deposits are subject to general market and economic risks as they are usually considered part of the money supply. In addition, demand deposits are subject to risks of fraud. As access to demand deposits (e.g., via ATMs and online banking) has increased, so have the ways to carry out fraudulent schemes. Demand deposit fraud can take many forms, such as phishing schemes, cross-channel and check fraud.
Securities Loans. As indicated in Appendix A Portfolios may lend securities to brokers, dealers or other institutional investors needing to borrow securities to complete certain transactions. In connection with such loans, a Portfolio remains the owner of the loaned securities and continues to be entitled to payments in amounts equal to the interest, dividends or other distributions payable on loaned securities. A Portfolio has the right to terminate a loan at any time. A Portfolio does not have the right to vote on securities while they are on loan, but the Portfolio’s Manager or Adviser may attempt to terminate loans in time to vote those proxies the Manager or the Adviser has determined are material to the Portfolio’s interests. A Portfolio has the right to call each loan and obtain the securities on one standard settlement period’s notice or, in connection with the securities trading on foreign markets, within such longer period for purchases and sales of such securities in such foreign markets. A lending Portfolio will receive collateral consisting of cash, U.S. government securities, letters of credit or such other collateral as may be permitted under a Portfolio’s investment program and applicable law, which will be maintained at all times in an amount at least equal to 100% of the current market value of the loaned securities. If the collateral consists of cash, the Portfolio will reinvest the cash and pay the borrower a pre-negotiated fee or “rebate” from any return earned on investment. If the collateral consists of a letter of credit or securities, the borrower will pay the Portfolio a loan premium fee. A Portfolio may participate in securities lending programs operated by financial institutions, which act as lending agents (“Lending Agent”). The Lending Agent will receive a percentage of the total earnings of the Portfolio derived from lending the Portfolio’s securities. Should the borrower of securities fail financially, the Portfolio may experience delays in recovering the loaned securities or in exercising its rights in the collateral. Loans will be made only to firms judged by the Manager, with the approval of the Board, to be of good financial standing. Additional risks include the possible decline of the value of the securities acquired
48
with cash collateral. The Portfolio seeks to minimize this risk by limiting the investment of cash collateral to high quality instruments with short maturities, repurchase agreements, money market funds or similar private investment vehicles.
Short Sales. Certain of the Portfolios may enter into a short sale. A “short sale” is the sale by a Portfolio of a security which has been borrowed from a third party on the expectation that the market price will drop. To complete such a transaction, the Portfolio must borrow the security to make delivery to the buyer. The Portfolio then is obligated to replace the security borrowed by purchasing it at the market price at or prior to the time of replacement. The price at such time may be more or less than the price at which the security was sold by the Portfolio. Until the security is replaced, the Portfolio is required to prepay the lender any dividends or interest that accrue during the period of the loan. To borrow the security, a Portfolio also may be required to pay a premium, which would increase the cost of the security sold short. The net proceeds of a short sale will be retained by the Adviser (or by the Portfolio’s custodian), to the extent necessary to meet margin requirements, until the short position is closed out. The Portfolios will incur transaction costs in effecting short sales.
The Portfolios generally will engage only in covered short sales. In a covered short sale, a Portfolio either (1) enters into a “short sale” of securities in circumstances in which, at the time the short position is open, the Portfolio owns an equal amount of the securities sold short or owns securities convertible or exchangeable, without payment of further consideration, into an equal number of securities sold short (also known as a short sale “against the box”), or (2) deposits in a segregated account cash, U.S. government securities, or other liquid securities in an amount equal to the market value of the securities sold short. A short sale may be entered into by a Portfolio to, for example, lock in a sale price for a security the Portfolio does not wish to sell immediately. To the extent that a Portfolio engages in short sales, it will provide collateral to the broker-dealer arranging the short sale and (except in the case of short sales “against the box”) will maintain additional asset coverage in the form of segregated or “earmarked” assets that the Manager or Adviser determines to be liquid in accordance with procedures established by the Board of Trustees and that is equal to the current market value of the securities sold short, or will ensure that such positions are covered by “offsetting” positions, until the Portfolio replaces the borrowed security.
A Portfolio will incur a loss as a result of a short sale if the price of the security increases between the date of the short sale and the date on which the Portfolio replaces the borrowed security. A Portfolio may realize a gain if the security declines in price between those dates. The amount of any gain will be decreased, and the amount of any loss increased, by the amount of the premium, dividends, interest or expenses a Portfolio may be required to pay in connection with a short sale. There can be no assurance that a Portfolio will be able to close out a short position at any particular time or an acceptable price.
Short Term Investments. Each Portfolio may invest in short term investments. Short term investments include investments in various types of U.S. government securities and high-quality short-term debt securities with remaining maturities of one year or less (“money market instruments”). This type of short-term investment is made to provide liquidity for the purchase of new investments and to effect redemptions of shares. The money market instruments in which each Portfolio may invest include but are not limited to: government obligations, certificates of deposit, time deposits, bankers’ acceptances, commercial paper, short-term corporate securities and repurchase agreements. The Portfolios may invest in both foreign and domestic money market instruments, including foreign currency, foreign time deposits and foreign bank acceptances of domestic branches of foreign banks and savings and loan associations and similar institutions.
Small Company Securities and Micro-Cap Company Securities. As indicated in Appendix A, certain of the Portfolios may invest in the securities of smaller capitalization companies. Investing in securities of small companies may involve greater risks since these securities may have limited marketability and, thus, may be more volatile. Because smaller companies normally have fewer shares outstanding than larger companies, it may be more difficult for a Portfolio to buy or sell significant amounts of shares without an unfavorable impact on prevailing prices. In addition, small companies often have limited product lines, markets or financial resources and are typically subject to greater changes in earnings and
49
business prospects than are larger, more established companies. There is typically less publicly available information concerning smaller companies than for larger, more established ones and smaller companies may be dependent for management on one or a few key persons. Therefore, an investment in these Portfolios may involve a greater degree of risk than an investment in other Portfolios that seek capital appreciation by investing in better known, larger companies.
Certain of the Portfolios also may invest in the securities of micro-cap companies. Micro-cap companies represent the smallest sector companies based on market capitalization. Micro-cap companies may be in their earliest stages of development and may offer unique products, services or technologies or may serve special or rapidly expanding niches. Micro-cap companies may be less able to weather economic shifts or other adverse developments than larger, more established companies and may have less experienced management and unproven track records. Micro-cap companies also may be more susceptible to setbacks or economic downturns. Micro-cap securities are generally subject to the same risks as small-cap securities. However, micro-cap securities may involve even greater risk because they trade less frequently than larger stocks and may be less liquid, subjecting them to greater price fluctuations than larger company stocks.
Structured Notes. As indicated in Appendix A, certain of the Portfolios may invest in structured notes, which are derivatives on which the amount of principal repayment and/or interest payments is based upon the movement of one or more factors. Structured notes are interests in entities organized and operated solely for the purpose of restructuring the investment characteristics of debt obligations. This type of restructuring involves the deposit with or purchase by an entity, such as a corporation or trust, of specified instruments (such as commercial bank loans) and the issuance by that entity of one or more classes of securities backed by, or representing interests in, the underlying instruments. The cash flow on the underlying instruments may be apportioned among the newly issued structured notes to create securities with different investment characteristics such as varying maturities, payment priorities and interest rate provisions, and the extent of the payment made with respect to structured notes is dependent on the extent of the cash flow on the underlying instruments. The credit risk of structured notes that involve no credit enhancement generally will be equivalent to that of the underlying instruments. In addition, a class of structured notes that is subordinated to the right of payment of another class typically has higher yields and presents greater risks than a class of structured notes that is unsubordinated. Certain issuers of structured notes may be deemed to be “investment companies” as defined in the 1940 Act. As a result, a Portfolio’s investment in these structured notes may be limited by restrictions contained in the 1940 Act. Structured notes are typically sold in private placement transactions, and there currently is no active trading market for structured notes.
Swaps. As indicated in Appendix A, certain Portfolios may invest in swap contracts. Swap agreements are two party contracts entered into primarily by institutional investors for periods ranging from a few weeks to more than one year. A “standard” swap contract is an agreement between two parties to exchange the return generated by one instrument for the return (or differential in rate of return) generated by another instrument. The payment streams are calculated by reference to a specified asset, such as a specified security or index, and agreed upon “notional amount” (e.g., a particular dollar amount invested in a specified security or index). The “notional amount” of the swap agreement is used as a basis on which to calculate the obligations that the parties to a swap agreement have agreed to exchange. The term “specified index” includes, but is not limited to, currencies, fixed interest rates, prices and total return on interest rate indices, price indices, fixed income indices, stock indices and commodity indices (as well as amounts derived from arithmetic operations on these indices). For example, a Portfolio may agree to swap the return generated by a fixed income index for the return generated by a second fixed income index or to swap a single or periodic fixed amount(s) (or premium) for periodic amounts based on the movement of a specified index.
Swap agreements historically have been individually negotiated and most swap agreements are currently traded over-the-counter. Some swaps currently are, and more in the future will be, centrally cleared. Swaps that are centrally cleared are subject to the creditworthiness of the clearing organization involved in the transaction. For example, an investor could lose margin payments it has deposited with its futures commission merchant as well as the net amount of gains not yet paid by the clearing organization if the
50
clearing organization becomes insolvent or goes into bankruptcy. In the event of bankruptcy of the clearing organization, the investor may be entitled to the net amount of gains the investor is entitled to receive plus the return of margin owed to it only in proportion to the amount received by the clearing organization’s other customers, potentially resulting in losses to the investor.
To the extent a swap is not centrally cleared, the use of a swap involves the risk that a loss may be sustained as a result of the insolvency or bankruptcy of the counterparty or the failure of the counterparty to make required payments or otherwise comply with the terms of the agreement. If a counterparty’s creditworthiness declines, the value of the swap might decline, potentially resulting in losses to a Portfolio. Changing conditions in a particular market area, whether or not directly related to the referenced assets that underlie the swap agreement, may have an adverse impact on the creditworthiness of the counterparty. If a default occurs by the counterparty to such a transaction, a Portfolio may have contractual remedies pursuant to the agreements related to the transaction.
A Portfolio will usually enter into swaps on a net basis (i.e., the two payment streams are netted out in a cash settlement on the payment date or dates specified in the instrument, with the Portfolio receiving or paying, as the case may be, only the net amount of the two payments). Thus, a Portfolio’s obligations (or rights) under a swap agreement generally will be equal only to the net amount to be paid or received under the agreement based on the relative values of the positions held by each party to the agreement (the “net amount”). A Portfolio’s obligations under a swap agreement will be accrued daily (offset against any amounts owing to the Portfolio), and any accrued but unpaid net amounts owed to a swap counterparty will be covered by, for example, designating the segregation, either on the records of the Portfolio’s Adviser or with the Trust’s custodian, of cash, receivables or other liquid assets. To the extent that the net amount owed to a swap counterparty is covered by an offsetting position or with cash, receivables or liquid assets, the Manager believes that such obligation does not constitute a “senior security” under the 1940 Act and, accordingly, will not treat it as being subject to a Portfolio’s senior security or borrowing restrictions. With respect to swap transactions that are not entered into on a net basis, a Portfolio will cover its obligation under any such transaction in a manner consistent with the 1940 Act so that the obligation does not constitute a “senior security” under the 1940 Act. A Portfolio may enter into swap transactions in accordance with guidelines established by the Board of Trustees. Pursuant to these guidelines, the Portfolio may only enter into swap transactions where its Adviser has deemed the counterparties to be creditworthy and such counterparties have been approved by the Manager.
Swaps generally do not involve the delivery of securities, other underlying assets, or principal. Accordingly, unless there is a counterparty or clearing house default, the risk of loss with respect to swaps is limited to the net amount of payments a Portfolio is contractually obligated to make. If the other party to a swap defaults, a Portfolio’s risk of loss consists of the net amount of payments that the Portfolio contractually is entitled to receive. The swap market has grown substantially in recent years with a large number of banks and investment banking firms acting both as principals and as agents utilizing standardized swap documentation. As a result, the swap market has become relatively liquid. Certain swap transactions involve more recent innovations for which standardized documentation has not yet been fully developed and, accordingly, they are less liquid than traditional swap transactions. For purposes of applying a Portfolio’s investment policies and restrictions (as stated in the Prospectus and this SAI), swap agreements generally are valued by the Portfolio at market value. In addition, because they are two party contracts and because they may have terms greater than seven days, some swap agreements may be considered to be illiquid.
The use of swaps is a highly specialized activity which involves investment techniques and risks (such as counter-party risk) different from those associated with ordinary portfolio securities transactions. If a Portfolio’s Adviser is incorrect in its forecasts of applicable market factors, such as market values, interest rates, and currency exchange rates, the investment performance of the Portfolio would be less favorable than it would have been if this investment technique were not used. The swaps market was largely unregulated prior to the enactment of the Dodd-Frank Act on July 21, 2010. It is possible that developments in the swaps market, including the issuance of final implementing regulations under the Dodd-Frank Act, could adversely affect a Portfolio’s ability to enter into swaps in the OTC market (or require that certain of such instruments be exchange-traded and centrally-cleared), support those trades
51
with collateral, terminate new or existing swap agreements, or realize amounts to be received under such instruments. Regulations that are being developed by the CFTC and banking regulators will require a Portfolio to post margin on over the counter swaps, and clearing organizations and exchanges will set minimum margin requirements for exchange-traded and cleared swaps.
A Portfolio may enter into a variety of swap transactions, including total return swaps, inflation swaps, currency swaps, credit default swaps, interest rate swaps, caps, floors and swap options. Total return swap agreements are contracts in which one party agrees to make periodic payments to another party during a specified period of time based on the change in market value of the assets underlying the contract, which may include a specified security, basket of securities or securities indexes, in return for periodic payments based on a fixed or variable interest rate or the total return from other underlying assets. Total return swap agreements are often used to obtain exposure to a security or market without owning or taking physical custody of such security or investing directly in such market. The value of the swap position as well as the payments required to be made by a Portfolio or a counterparty will increase or decrease depending on the changes in the value of the underlying asset(s).
Inflation swaps into which a Portfolio may enter generally are contracts in which one party agrees to pay the cumulative percentage increase in a price index (the Consumer Price Index with respect to CIP swaps) over the term of the swap (with some lag on the inflation index), and the other pays a compounded fixed rate.
Currency swaps involve the exchange by one party with another party of a series of payments in specified currencies. Currency swaps usually involve the delivery of the entire principal value of one designated currency in exchange for the other designated currency. Therefore, the entire principal value of a currency swap is subject to the risk that the other party to the swap will default on its contractual delivery obligations. In addition, a Portfolio may enter into currency swaps that involve an agreement to pay interest streams in one currency based on a specified index in exchange for receiving interest streams denominated in another currency. Currency swaps may involve initial and final exchanges that correspond to the agreed upon notional amount.
Interest rate swaps involve the exchange between two parties of payments calculated by reference to specified interest rates (e.g., an exchange of floating rate payments for fixed rate payments). The purchase of an interest rate cap entitles the purchaser, to the extent that a specified index exceeds a predetermined interest rate, to receive payments of interest on a notional principal amount from the party selling such interest rate cap. The purchase of an interest rate floor entitles the purchaser, to the extent that a specified index falls below a predetermined interest rate, to receive payments of interest on a notional principal amount from the party selling such interest rate floor. Caps and floors may be less liquid than swaps. In addition, the value of interest rate transactions will fluctuate based on changes in interest rates.
An option on a swap agreement, also called a “swaption,” is an option that gives the buyer the right, but not the obligation, to enter into a swap on a future date in exchange for paying a market-based “premium.” A receive swaption gives the owner the right to receive the total return of a specified asset, reference rate, or index. A payer swaption gives the owner the right to pay the total return of a specified asset, reference rate, or index. A purchaser of a swaption risks losing only the amount of the premium it has paid should it decide to let the option expire, whereas the seller of a swaption is subject to the risk that it will become obligated if the option is exercised. Swaptions also include options that allow an existing swap to be terminated or extended by one of the counterparties.
A Portfolio also may enter into credit default swap agreements. The credit default swap agreement may have as reference obligations one or more securities that are not currently held by a Portfolio. The protection “buyer” in a credit default contract is generally obligated to pay the protection “seller” an upfront or a periodic stream of payments over the term of the contract, which is typically between one month and five years, provided that no credit event, such as a default, on a reference obligation has occurred. If a credit event occurs, the seller generally must pay the buyer the “par value” (full notional value) of the swap in exchange for an equal face amount of deliverable obligations of the reference entity described in the swap, or the seller may be required to deliver the related net cash amount, if the swap is cash settled. A Portfolio may be either the buyer or seller in the transaction. If a Portfolio is a buyer and
52
no credit event occurs, the Portfolio may recover nothing if the swap is held through its termination date. However, if a credit event occurs, the Portfolio generally may elect to receive the full notional value of the swap in exchange for an equal face amount of deliverable obligations of the reference entity whose value may have significantly decreased. In this connection, there is a risk that instability in the markets can threaten the ability of a buyer to fulfill its obligation to deliver the underlying securities to the seller. As a seller, a Portfolio generally receives an upfront payment or a fixed rate of income throughout the term of the swap provided that there is no credit event. However, if a credit event occurs, the Portfolio generally must pay the buyer the full notional value of the swap in exchange for an equal face amount of deliverable obligations of the reference entity that may have little or no value. As the seller, a Portfolio would effectively add leverage because, in addition to its total net assets, a Portfolio would be subject to investment exposure on the notional amount of the swap.
Credit default swap agreements involve greater risks than if a Portfolio had invested in the reference obligation directly since, in addition to general market risks, credit default swaps are subject to illiquidity risk, counterparty risk and credit risk. A Portfolio will enter into credit default swap agreements only with counterparties that meet certain standards of creditworthiness. A buyer generally also will lose its investment and recover nothing should no credit event occur and the swap is held to its termination date. If a credit event were to occur, the value of any deliverable obligation received by the seller, coupled with the upfront or periodic payments previously received, may be less than the full notional value it pays to the buyer, resulting in a loss of value to the seller. A Portfolio’s obligations under a credit default swap agreement will be accrued daily (offset against any amounts owing to the Portfolio). In connection with credit default swaps in which a Portfolio is the buyer, the Portfolio will segregate or “earmark” cash or assets determined to be liquid, or enter into certain offsetting positions, with a value at least equal to the Portfolio’s exposure (any accrued but unpaid net amounts owed by the Portfolio to any counterparty), on a marked-to-market basis. In connection with credit default swaps in which a Portfolio is the seller, the Portfolio will segregate or “earmark” cash or assets determined to be liquid, or enter into offsetting positions, with a value at least equal to the full notional amount of the swap (minus any amounts owed to the Portfolio). Such segregation or “earmarking” is intended to ensure that the Portfolio has assets available to satisfy its obligations with respect to the transaction and limit any potential leveraging of the Portfolio. Such segregation or “earmarking” will not limit the Portfolio’s exposure to loss. To the extent that credit default swaps are entered into for hedging purposes or are covered as described above, the Manager believes such obligations do not constitute “senior securities” under the 1940 Act and, accordingly, will not treat them as being subject to the Portfolio’s senior security and borrowing restrictions.
In the case of a credit default swap sold by a Portfolio (i.e., where the Portfolio is selling credit default protection), the Portfolio may value the credit default swap at its notional amount in applying certain of the Portfolio’s investment policies and restrictions, but may value the credit default swap at market value for purposes of applying certain of the Portfolio’s other investment policies and restrictions.
Variable Rate Notes. The commercial paper obligations which the Portfolios may buy are unsecured and may include variable rate notes. The nature and terms of a variable rate note (i.e., the “Master Note”) permit a Portfolio to invest fluctuating amounts at varying rates of interest pursuant to a direct arrangement between a Portfolio as lender and the issuer as borrower. It permits daily changes in the amounts borrowed. The Portfolios have the right at any time to increase, up to the full amount stated in the note agreement, or to decrease the amount outstanding under the note. The issuer may prepay at any time and without penalty any part of or the full amount of the note. The note may or may not be backed by one or more bank letters of credit. Because these notes are direct lending arrangements between the Portfolios and the issuer, it is not generally contemplated that they will be traded; moreover, there is currently no secondary market for them. The Portfolios have no limitations on the type of issuer from whom these notes will be purchased; however, in connection with such purchase and on an ongoing basis, the adviser will consider the earning power, cash flow and other liquidity ratios of the issuer, and its ability to pay principal and interest on demand, including a situation in which all holders of such notes made demand simultaneously.
53
U.S. Government Securities. As indicated in Appendix A, certain of the Portfolios may invest in U.S. Government Securities. U.S. government securities include direct obligations of the U.S. Treasury (such as Treasury bills, notes or bonds) and obligations issued or guaranteed as to principal and interest (but not as to market value) by the U.S. government, its agencies or its instrumentalities. Examples of obligations issued or guaranteed as to principal and interest by the U.S. government, its agencies or its instrumentalities include securities issued or guaranteed by government agencies that are supported by the full faith and credit of the U.S. government (e.g., securities issued by the Federal Housing Administration, Export-Import Bank of the U.S., Small Business Administration, and Ginnie Mae); securities issued or guaranteed by government agencies that are supported by the ability to borrow from the U.S. Treasury (e.g., securities issued by Fannie Mae); and securities issued or guaranteed by government agencies that are supported primarily or solely by the credit of the particular agency (e.g., Interamerican Development Bank, the International Bank for Reconstruction and Development, and the Tennessee Valley Authority).
U.S. government securities also include Treasury inflation-indexed securities (originally known as Treasury inflation-protected securities or “TIPS”), which are Treasury bonds on which the principal value is adjusted daily in accordance with changes in the Consumer Price Index. TIPS have maturities of five, ten or thirty years, although it is possible that securities with other maturities will be issued in the future. Interest on TIPS is payable semiannually on the inflation-adjusted principal value. The periodic adjustment to the principal value of TIPS is tied to the CPI-U, which is calculated monthly by the U.S. Bureau of Labor Statistics. The CPI-U is a measurement of changes in the cost of living, made up of components such as housing, food, transportation and energy. There can be no assurance that the CPI-U will accurately measure the real rate of inflation in the prices of goods and services. The principal value of TIPS would decline during periods of deflation and consequently the interest payable on these securities (calculated with respect to a smaller principal amount) will be reduced, but the principal amount payable at maturity would not be less than the original par amount. The value of TIPS is expected to change in response to changes in real interest rates. Real interest rates in turn are tied to the relationship between nominal interest rates and the rate of inflation. Therefore, if inflation were to rise at a faster rate than nominal interest rates, real interest rates might decline, leading to an increase in value of inflation-indexed bonds. In contrast, if nominal interest rates increased at a faster rate than inflation, real interest rates might rise, leading to a decrease in value of inflation-indexed bonds. While these securities are expected to be protected from long-term inflationary trends, short-term increases in inflation may lead to a decline in value. If interest rates rise due to reasons other than inflation (for example, due to changes in currency exchange rates), investors in these securities may not be protected to the extent that the increase is not reflected in the bond’s inflation measure. If inflation is lower than expected while a Portfolio holds TIPS, the Portfolio may earn less on the TIPS than it would on conventional Treasury bonds. Any increase in the principal value of TIPS is taxable in the year the increase occurs, even though holders do not receive cash representing the increase at that time. See “Taxation” below.
U.S. government securities also include separately traded principal and interest components of securities issued or guaranteed by the U.S. Treasury, which are traded independently under the Separate Trading of Registered Interest and Principal of Securities (“STRIPS”) program. Under the STRIPS program, the principal and interest components are individually numbered and separately issued by the U.S. Treasury.
In August 2011, S&P downgraded its long-term sovereign credit rating on the U.S. from “AAA” to “AA+”. The downgrade by S&P could lead to subsequent downgrades by S&P or downgrades by other credit rating agencies. Both Fitch and Moody’s, which currently have assigned their highest credit ratings to the U.S., have a negative outlook for those credit ratings. These developments, and the government’s credit concerns in general, could cause an increase in interest rates and borrowing costs, which may negatively impact both the perception of credit risk associated with the debt securities issued by the U.S. and the country’s ability to access the debt markets on favorable terms. In addition, these developments could create broader financial turmoil and uncertainty, which could increase volatility in both stock and bond markets. These events could result in significant adverse impacts on issuers of securities held by a Portfolio.
Warrants. As indicated in Appendix A, certain of the Portfolios may purchase warrants and similar rights. Warrants are securities that give the holder the right, but not the obligation, to purchase equity
54
issues of the company issuing the warrants, or a related company, at a fixed price either on a date certain or during a set period. At the time of issue, the cost of a warrant is substantially less than the cost of the underlying security itself, and price movements in the underlying security are generally magnified in the price movements of the warrant. This effect enables the investor to gain exposure to the underlying security with a relatively low capital investment but increases an investor’s risk in the event of a decline in the value of the underlying security and can result in a complete loss of the amount invested in the warrant. In addition, the price of a warrant tends to be more volatile than, and may not correlate exactly to, the price of the underlying security. If the market price of the underlying security is below the exercise price of the warrant on its expiration date, the warrant will generally expire without value.
The equity security underlying a warrant is authorized at the time the warrant is issued or is issued together with the warrant. Investing in warrants can provide a greater potential for profit or loss than an equivalent investment in the underlying security, and, thus, can be a high risk investment. The value of a warrant may decline because of a decline in the value of the underlying security, the passage of time, changes in interest rates or in the dividend or other policies of the company whose equity underlies the warrant or a change in the perception as to the future price of the underlying security, or any combination thereof. Warrants do not carry with them the right to dividends or voting rights with respect to the securities that they entitle their holder to purchase, and they do not represent any rights in the assets of the issuer. A warrant ceases to have value if it is not exercised prior to its expiration date. As a result, warrants may be considered more speculative that certain other types of investments.
Zero Coupon Bonds and Payment in-Kind Bonds. As indicated in Appendix A, certain of the Portfolios may invest in zero-coupon or payment-in-kind bonds or both. Zero-coupon bonds are issued at a significant discount from their principal amount (referred to as “original issue discount” or “OID”) and pay interest only at maturity rather than at intervals during the life of the security. Payment-in-kind bonds allow the issuer, at its option, to make current interest payments on the bonds in additional bonds rather than in cash. Zero coupon and payment-in-kind bonds thus allow an issuer to avoid the need to generate cash to meet current interest payments. Accordingly, those bonds may involve greater credit risks, and their value is subject to greater fluctuation in response to changes in market interest rates, than bonds that pay current interest in cash. Even though such bonds may not pay current interest in cash, a Portfolio is nonetheless required annually to accrue as interest income a portion of the OID on such investments for federal income tax purposes and to distribute the amount of that interest at least annually to its shareholders. See the “Taxation” section of this SAI. Thus, each Portfolio that invests in such instruments could be required, at times, to liquidate other investments in order to satisfy its distribution requirements.
Portfolio Turnover. The length of time a Portfolio has held a particular security is not generally a consideration in investment decisions. A change in the securities held by a Portfolio is known as “portfolio turnover.” High portfolio turnover may result from the strategies of the Advisers or when one Adviser replaces another, necessitating changes in the Portfolio it advises. Portfolio turnover may vary significantly from year to year due to a variety of factors, including fluctuating volume of shareholder purchase and redemption orders, market conditions, within and outside the control of a Portfolio, the Manager and the Adviser(s), investment strategy changes, changes in an Adviser’s investment outlook or changes in the Adviser managing the Portfolio. A high turnover rate (100% or more) increases transaction costs (e.g., brokerage commissions) which must be borne by the Portfolio and shareholders. A Portfolio’s Adviser will consider the economic effects of portfolio turnover but generally will not treat a Portfolio’s annual portfolio turnover rate as a factor preventing a sale or purchase when an Adviser believes investment considerations warrant such sale or purchase. Decisions to buy and sell securities for a Portfolio are made by an Adviser independently from other Advisers. Thus, one Adviser could decide to sell a security when another Adviser decides to purchase the same security, thereby increasing a Portfolio’s portfolio turnover rate. Portfolio turnover may vary greatly from year to year as well as within a particular year. The portfolio turnover rates for a Portfolio are disclosed in the sections “Portfolio Turnover” and “Financial Highlights” of the Portfolio’s Prospectus.
PORTFOLIO HOLDINGS DISCLOSURE POLICY
It is the policy of the Trust to safeguard against misuse of the Trust’s Portfolios’ current portfolio holdings information and to prevent the selective disclosure of such information. Each Portfolio will
55
publicly disclose its holdings in accordance with regulatory requirements, such as periodic portfolio disclosure in filings with the SEC including the quarterly holdings report on Form N-Q, filed within 60 days of the end of each fiscal quarter, and the annual and semiannual report to shareholders on Form N-CSR. These reports (i) are available on the SEC’s website at http://www.sec.gov; and (ii) may be reviewed and copied at the SEC’s Public Reference Room in Washington, D.C. (information on the Public Reference Room may be obtained by calling 1-800-SEC-0330). The Trust’s annual and semiannual reports to shareholders are available without charge on the Trust’s website at www.axa-equitablefunds.com.
The Trust generally makes publicly available top portfolio holdings (typically the Portfolios’ top fifteen (15) holdings) on a quarterly basis at the following website: www.axa-equitablefunds.com. Copies of such information are also available upon request to the Trust. Except as noted below, all such information generally is released with a 30-day lag time, meaning top fifteen (15) portfolio holdings information as of the end of the quarter generally is not released until the 30th day following such quarter-end.
The Trust, through the Manager, may provide non-public portfolio holdings data to certain third-parties prior to the release of such information to the public as described above. The Manager currently has ongoing arrangements with the Administrator (JPMorgan Investor Services Co.), the Custodian (JPMorgan Chase Bank, N.A.), a service provider to the directed brokerage program, BNY ConvergEx Group, LLC, a provider of execution management services (Neovest, Inc.), certain third-party data services (Thomson Reuters Vestek), mutual fund evaluation services (Lipper, Inc. and Morningstar, Inc.) and consultants (Rocaton Investment Advisors, LLC). Each of these third parties receives current portfolio holdings information at month ends, with the exception of JPMorgan Investor Services Co., JPMorgan Chase Bank, N.A., BNY ConvergEx Group, LLC, Neovest, Inc. and Thomson Reuters Vestek, which receive such information daily. Each of these third parties is subject to a duty to treat non-public portfolio holdings information confidentially and a duty not to trade on such information either by explicit agreement or by virtue of its respective duties to the Trust.
In addition, current non-public portfolio holdings information may be provided as frequently as daily as part of the legitimate business purposes of each Portfolio to service providers that have contracted to provide services to the Trust, and other organizations, which may include, but are not limited to: AXA Equitable; the Manager; the Advisers; the independent registered public accounting firm; the Custodian; the Administrator; the sub-administrator; the transfer agent; counsel to the Portfolios or the non-interested trustees; regulatory authorities and courts; the Investment Company Institute; pricing services (Pricing Direct Inc., Interactive Data Pricing and Reference Data Inc., Investment Technology Group, Inc., J.J. Kenney, Loan Pricing Corporation, Muller Data, Bloomberg L.P., Thomson Reuters (Markets) LLC, MarkIt Group Limited, EMStar, Barclays Plc); peer analysis services (Mellon Analytics); performance review services (Evestment Alliance, Informais); back office services (iX Partners, Ltd., Sunguard Financial, Principal Global Investors, The Bank of New York Mellon Corporation); research tool/quote system (Thomson Reuters); trade execution management and/or analysis (Plexus, Elkins McSherry Inc., Abel Noser Corp., FX Transparency, LLC, UAT, Inc.); data consolidator (Electra); trade order management services (Investment Technology Group Inc., ITG Macgregor XIP, Charles River, TCS); books and records vendor (Checkfree); GIPS auditor (Vincent Performance Services); auditor [ ]; marketing research services (Strategic Insight); portfolio analysis services (Barra TotalRisk System); commission tracking (Cogent Consulting); accounting systems or services (Advent Software, Eagle Investment Systems Corp., Portia); transition management/brokerage services software vendors (CDS/Computer, The MacGregor Group, OMGEO LLC, Radianz); analytic services or tools (Confluence Technologies, Inc., FactSet Research Systems Inc., Investment Technology Group, Inc., Investor Tools Perform, MSCI Inc., Citigroup Analytics, Inc., Wilshire Analytics/Axiom, Wilshire (Compass)); legal services; corporate actions and trade confirmation (Brown Brothers Harriman & Co.); over the counter derivative products and portfolio holdings (State Street Bank and Trust Company); ratings agencies (Standard & Poor’s Financial Services LLC (a division of The McGraw-Hill Companies), Moody’s Investor Service, Inc.); index providers (Russell Investment Group); consulting firms (Mercer, CRA RogersCasey, Macro Consulting, Ernst & Young); data providers (InvestorForce); broker-dealers who provide execution or research services to the Trust’s
56
Portfolios; broker-dealers who provide quotations that are used in pricing; financial printers (R.R. Donnelley & Sons Company); proxy voting services (Riskmetrics Group, Inc., Broadridge Financial Solutions, Inc. and Glass Lewis & Co.); 401(k) administrator (Hewitt Associates); and tax services (Wolters Kluwer Financial Services). The entities to which each Portfolio voluntarily provides holdings information, either by explicit agreement or by virtue of their respective duties to each Portfolio, are subject to a duty to treat non-public portfolio holdings information confidentially and a duty not to trade on such information.
On a case-by-case “need to know” basis, the Trust’s Chief Financial Officer or Vice President, subject to the approval of FMG LLC’s Legal and Compliance Group and the Trust’s Chief Compliance Officer, may approve the disclosure of additional portfolio holdings information if such disclosure is in the best interests of Portfolio shareholders. In all cases, the approval of the release of non-public portfolio holdings information by FMG LLC’s Legal and Compliance Group must be based on a determination that such disclosure is in the best interests of the Portfolios and their shareholders, that there is a legitimate business purpose for such disclosure and that the party receiving such information is subject to a duty to treat the information confidentially and a duty not to trade on such information. The Trust does not disclose its portfolio holdings to the media.
FMG LLC is responsible for administering the release of portfolio holdings information with respect to the Portfolios. Until particular portfolio holdings information has been released to the public, and except with regard to the third parties described above, no such information may be provided to any party without the approval of FMG LLC’s Legal and Compliance Group, which approval is subject to the conditions described above. No compensation is received by the Trust, the Manager or any other person in connection with their disclosure of portfolio holdings information.
FMG LLC’s Legal and Compliance Group and the Trust’s Chief Compliance Officer (“CCO”) monitor and review any potential conflicts of interest between the Portfolios’ shareholders and the Manager, distributor and their affiliates that may arise from the potential release of portfolio holdings information. The Trust’s Board approved this policy and determined that it is in the best interest of the Portfolios. The Board must also approve any material change to this policy. The Board oversees implementation of this policy and receives quarterly reports from the Trust’s CCO regarding any violations or exceptions to this policy that were granted by FMG LLC’s Legal and Compliance Group.
57
The Board of Trustees
The Trust’s Board is responsible for the overall management of the Trust and the Portfolios, including general supervision and review of the Portfolios’ investment activities and their conformity with federal and state law as well as the stated policies of the Portfolios. The Board elects the officers of the Trust who are responsible for administering the Trust’s day-to-day operations. The Trustees of the Trust are identified in the table below along with information as to their principal business occupations held during the last five years and certain other information.
The Trustees
| Name, Address and Age | Position(s) Held With Fund | Term of Office** and Length of Time Served | Principal Occupation(s) During Past 5 Years | Number of Portfolios in Fund Complex Overseen by Trustee† | Other Directorships During Past 5 Years | |||||
| Interested Trustees | ||||||||||
Steven M. Joenk* 1290 Avenue of the Americas, New York, New York | Trustee, Chairman, President and Chief Executive Officer | Trustee, Chairman from September 2004 to present, Chief Executive Officer, President from December 2002 to present | From May 2011 to present, President, Chief Executive Officer and Chairman, FMG LLC; from September 1999 to present, Managing Director, AXA Equitable; from September 2004 to April 2011, President, AXA Equitable’s Funds Management Group (“FMG”) unit; from July 2004 to present, Senior Vice President, MONY Life Insurance Company and MONY Life Insurance Company of America and Director, MONY Capital Management, Inc., Director and President, 1740 Advisers, Inc., Director, Chairman of the Board and President, MONY Asset Management, Inc. and Enterprise Capital Management (from July 2004 to January 2011); from January 2005 to January 2011, Director, MONY Financial Resources of Americas Limited and; from November 2005 to present, Director MONY International Holdings, LLC. | 122 | None | |||||
| Independent Trustees | ||||||||||
| * | Affiliated with the Manager and/or the Distributor. |
58
| Name, Address and Age | Position(s) Held With Fund | Term of Office** and Length of Time Served | Principal Occupation(s) During Past 5 Years | Number of Portfolios in Fund Complex Overseen by Trustee† | Other Directorships Held by Trustee | |||||
Jettie M. Edwards c/o EQ Advisors Trust 1290 Avenue of the Americas New York, New York 10104 (67) | Trustee | From March 1997 to present | Retired. From 1986 to 2001, Partner and Consultant, Syrus Associates (business and marketing consulting firm). | 86 | From 1997 to 2010, Director, Old Mutual Funds II (12 portfolios); from 2008 to 2009, Director, Old Mutual Funds III (13 portfolios). | |||||
Donald E. Foley c/o EQ Advisors Trust 1290 Avenue of the Americas New York, New York 10104 (61) | Trustee | From January 1, 2014 to present | Retired. From 2010 to 2011, Chairman of the Board and Chief Executive Officer, Wilmington Trust Corporation; from 1996 to 2010, Senior Vice President, Treasurer and Director of Tax ITT Corporation; 1989- 1996, Assistant Treasurer, International Paper Company. | 86 | 2011-2012, Director, and from 2012 to present Advisory Committee Member M&T Corporation; from 2007-2011, Director and member of the Audit Committee and Compensation Committee, Wilmington Trust Corporation; Advisory Board member Northern Trust Company and Goldman Sachs Management Groups 2008-2010. | |||||
William M. Kearns, Jr c/o EQ Advisors Trust 1290 Avenue of the Americas New York, New York 10104 (78) | Trustee | From March 1997 to present | From 1994 to present, President, W.M. Kearns & Co., Inc. (private investment company); from 2002 to June 2007, Chairman; Keefe Managers, Inc. (money management firm); and from 2008 to present, Chairman, Keefe Ventures, LLC. | 86 | Lead Director from 2008 to present and from 1991 to present, Director, Transistor Devices, Inc. From 1999 to 2010, Advisory Director, Alexander Proudfoot (consulting firm). From 2001 to 2011, Advisory Director, Gridley & Company LLC. From 2002 to 2009, Director, United States Shipping Partners LLC. From 2005 to 2009, Lead Director, and from 1975 to 2009, Director, Selective Insurance Group, Inc. | |||||
Christopher P.A. Komisarjevsky c/o EQ Advisors Trust 1290 Avenue of the Americas New York, New York 10104 (68) | Trustee | From March 1997 to present | From 2006 to 2008, Senior Counselor for APCO Worldwide® (global communications consulting) and a member of its International Advisory Council. From 1998 to 2005, President and Chief Executive Officer, Burson-Marsteller Worldwide (public relations). From 1996 to 1998, President and Chief Executive Officer of Burson-Marsteller U.S.A. | 86 | None |
59
| Name, Address and Age | Position(s) Held With Fund | Term of Office** and Length of Time Served | Principal Occupation(s) During Past 5 Years | Number of Portfolios in Fund Complex Overseen by Trustee† | Other Directorships Held by Trustee | |||||
H. Thomas McMeekin c/o EQ Advisors Trust 1290 Avenue of the Americas New York, New York 10104 (60) | Trustee | From January 1, 2014 to present | Retired. From 2000 to present, Managing Partner and Founder of Griffin Investments, LLC a private equity firm; from 2009 to 2012 Chief Investment Officer, Sun America Financial Group and United Guaranty Corporation and Senior Managing Director of AIG Asset Management; from 2001 to 2008, Managing Director, Institutional Client Relations of Prudential Investment Management, Inc. Financial Group and United Guaranty Corporation and Senior Managing Director of AIG Asset Management; from 2001 to 2008, Managing Director, Institutional Client Relations of Prudential Investment Management, Inc. | 86 | 2012 to present, Director, Achaen Financial Group; 2011 to 2012, Director US Life Insurance Company in the City of New York | |||||
Harvey Rosenthal c/o EQ Advisors Trust 1290 Avenue of the Americas New York, New York 10104 (70) | Trustee | From March 1997 to present | Retired. From 1994 to 1996, President and Chief Operating Officer of Melville Corporation. From 1984-1994 President and Chief Executive Officer of the CVS Division of Melville Corporation. | 86 | From 1997 to 2012, Director, LoJack Corporation. | |||||
Gary S. Schpero c/o EQ Advisors Trust 1290 Avenue of the Americas New York, New York 10104 (60) | Lead Independent Trustee | From May 2000 to present; from September 2011 to present, Lead Independent Trustee | Retired. Prior to January 1, 2000, Partner of Simpson Thacher & Bartlett (law firm) and Managing Partner of the Investment Management and Investment Company Practice Group. | 86 | From May 2012 to present, Trustee, Blackstone/GSO Senior Floating Rate Term Fund and Blackstone/GSO Long –Short Credit Income Fund. From October 2012 to present, Trustee, Blackstone/GSO Strategic Credit Fund. | |||||
Kenneth L. Walker c/o EQ Advisors Trust 1290 Avenue of the Americas New York, New York 10104 (61) | Trustee | From January 2012 | From May 2002 to present, Partner, The Capital Management Corporation (investment advisory firm). | 86 | None. |
60
Caroline L. Williams c/o EQ Advisors Trust 1290 Avenue of the Americas New York, New York 10104 (67) | Trustee | From January 2012 | From July 2010 to December 2012, Executive Vice President, from May 2005 to December 2007, Consultant and from May 2001 to May 2005, Chief Financial and Investment Officer, Nathan Cummings Foundation (non-profit organization); from 1988 to 1992, Managing Director, from 1982 to 1988, Senior Vice President, from 1978 to 1982, Vice President and from 1971 to 1976, Associate, Donaldson, Lufkin & Jenrette Securities Corporation (investment bank). | 86 | From 1997 to 2009, Director, Hearst-Argyle Television. |
| ** | Each Trustee serves until his or her resignation or retirement. |
| † | The registered investment companies in the fund complex include AXA Premier VIP Trust and the Trust. Mr. Joenk serves as Trustee, President and Chief Executive Officer for each of the registered investment companies in the fund complex, as well as Chairman for each such company. |
Qualifications and Experience of the Trustees
In determining that a particular Trustee is qualified to serve as a Trustee, the Board considered a wide variety of criteria, none of which, in isolation, was controlling. The Board believes that, collectively, the Trustees have diverse and complimentary qualifications, experience, attributes, and skills, which allow the Board to operate effectively in governing the Trust and protecting the interests of each Portfolio’s shareholders. Information about certain of the specific qualifications and experience of each Trustee relevant to the Board’s conclusion that the Trustee should serve as a Trustee of the Trust is set forth in the table above. Set forth below are certain additional qualifications, experience, attributes, and skills of each Trustee that the Board believes support a conclusion that the Trustee should serve as a Trustee of the Trust in light of the Trust’s business activities and structure.
Interested Trustee
Steven M. Joenk — Mr. Joenk has a background in the financial services industry, senior management experience with multiple insurance companies, investment management firms and investment companies and multiple years of service as an officer, Trustee and Chairman of the Trust and other registered investment companies.
Independent Trustees
Jettie Edwards — Ms. Edwards has business management experience, including several years as a consultant to investment management firms, with multiple years of service as a Trustee to the Trust and other mutual fund complexes.
Donald E. Foley — Mr. Foley has a background in the financial services industry, experience in senior management positions with financial services firms and multiple years of service on the boards of public and private companies and organizations.
William M. Kearns, Jr. — Mr. Kearns has a background in the financial services industry, experience in senior management positions with investment management firms and private investment funds, service on the boards of operating companies and multiple years of service as a Trustee of the Trust.
61
Christopher P.A. Komisarjevsky — Mr. Komisarjevsky has experience in senior management positions with global firms providing business consulting services and multiple years of service as a Trustee of the Trust.
H. Thomas McMeekin — Mr. McMeekin has a background in the financial services industry, has held senior management positions with insurance companies and has multiple years of service on the boards of public and private companies and organizations.
Harvey Rosenthal — Mr. Rosenthal has experience in senior management positions with a large publicly-traded corporation and multiple years of service as a Trustee of the Trust.
Gary S. Schpero — Mr. Schpero has experience as the managing partner of the investment management practice group at a large international law firm and multiple years of service as a Trustee of the Trust.
Kenneth L. Walker — Mr. Walker has a background in the financial services industry and senior management experience with investment management firms.
Caroline L. Williams — Ms. Williams has a background in the financial services industry, senior management experience with an investment banking firm and multiple years of service on the boards of public and private companies and organizations.
Board Structure. The Board currently is comprised of ten Trustees, nine of which are not “interested persons” (as that term is defined in the 1940 Act) of the Trust (“Independent Trustees”). Steven M. Joenk, who, among other things, serves as Chairman of the Board, is an “interested person” (as that term is defined in the 1940 Act) of the Trust. The Board has appointed Gary S. Schpero to serve as Lead Independent Trustee. The Trust’s Lead Independent Trustee is recommended by the Trust’s Nominating and Compensation Committee and approved by the full Board. The Lead Independent Trustee, among other things, chairs meetings of the Independent Trustees, serves as a spokesperson for the Independent Trustees and serves as a liaison between the Independent Trustees and the Trust’s management between Board meetings.
The Board holds five regular meetings each year to consider and address matters involving the Trust and its Portfolios. The Board also may hold special meetings to address matters arising between regular meetings. The Independent Trustees also regularly meet outside the presence of management and are advised by independent legal counsel. These meetings may take place in-person or by telephone.
The Board has established a committee structure that includes an Audit Committee, a Nominating and Compensation Committee and two Investment Committees (discussed in more detail below). All Independent Trustees are members of the Audit Committee and the Nominating and Compensation Committee. Each Independent Trustee is also a member of one of the two Investment Committees. This structure allows all of the Independent Trustees to participate in the full range of the Board’s oversight responsibilities. The Board reviews its structure regularly and believes that its leadership structure, including the appointment of a Lead Independent Trustee, is appropriate given the asset size of the Trust, the number of Portfolios offered by the Trust, the number of Trustees overseeing the Trust and the Board’s oversight responsibilities, as well as the Trust’s business activities, manager of managers advisory structure and its use as an investment vehicle in connection with the Contracts and retirement plans.
Risk Oversight. The management of various risks relating to the administration and operation of the Trust and its Portfolios is the responsibility of the Manager and the other service providers, including any Advisers, retained by the Trust or the Manager, many of whom employ professional personnel who have risk management responsibilities. Consistent with its responsibility for oversight of the Trust and its Portfolios, the Board, among other things, oversees risk management of each Portfolio’s investment program and business affairs directly and through the committee structure that it has established. Risks to the Portfolios include, among others, investment risk, credit risk, liquidity risk, valuation risk, operational risk, reputational risk, and compliance risk as well as the overall business and disclosure risks relating to the Portfolios and the Trust and the risk of conflicts of interest affecting the Manager (or its affiliates) in
62
managing the Portfolios. The Board has adopted, and periodically reviews, policies and procedures designed to address these and other risks. Under the overall supervision of the Board, the Manager and other service providers to the Portfolios also have implemented a variety of processes, procedures and controls to address these and other risks. Different processes, procedures and controls are employed with respect to different types of risks. These processes include those that are embedded in the conduct of regular business by the Board and in the responsibilities of officers of the Trust and other service providers. The Board has been advised that it is not practicable to identify all of the risks that may impact the Portfolios or to develop procedures or controls that are designed to eliminate all such risk exposures.
The Board oversees risk management activities in part through receipt and review by the Board or its committees of regular and special reports, presentations and other information from officers of the Trust and from other service providers. The Board requires senior officers of the Trust, including the President, Chief Financial Officer and CCO, to report to the full Board on a variety of matters at regular and special meetings of the Board, including matters relating to risk management. The Chief Financial Officer also reports regularly to the Board and to the Audit Committee on the Trust’s internal controls and accounting and financial reporting policies and practices. The Board and the Audit Committee also receive regular reports from the Trust’s independent registered public accounting firm on internal control and financial reporting matters. On at least a quarterly basis, the Board meets with the Trust’s CCO, including meetings in executive session, to discuss issues related to portfolio compliance and, on at least an annual basis, receives a report from the CCO regarding the effectiveness of the Trust’s compliance program. In addition, the Board receives reports from the Manager on the investments and securities trading of the Portfolios, as well as reports from the Valuation Committee (discussed below in the section “Purchase and Pricing of Shares”) regarding the valuation of those investments. The Board also receives reports from the Trust’s primary service providers on a periodic or regular basis, including the Advisers to the Portfolios as well as the Trust’s custodian, distributor and sub-administrator. The Board also requires the Manager to report to the Board on other matters relating to risk management on a regular and as-needed basis.
Committees of the Board
The Board has four standing committees. All of the Independent Trustees are members of the Audit Committee and the Nominating and Compensation Committee. The Audit Committee’s function is to oversee the Trust’s accounting and financial reporting policies and practices and its internal controls, oversee the quality and objectivity of the Trust’s financial statements and the independent audit thereof, and act as a liaison between the Trust’s independent accountants and the Board. To carry out its function, the Audit Committee, among other things, selects, retains or terminates the Trust’s independent accountants and evaluates their independence; meets with the Trust’s independent accountants as necessary to review and approve the arrangements for and scope of the audit and to discuss and consider any matters of concern relating to the Trust’s financial statements and the Trust’s financial reporting and controls; and approves the fees charged by the independent accountants for audit and non-audit services and, to the extent required by applicable law, any non-audit services proposed to be performed for the Trust by the independent accountants. The Audit Committee held [ ] meetings during the fiscal year ended December 31, 2013. Ms. Edwards serves as the Chair of the Audit Committee.
The Nominating and Compensation Committee’s functions are to provide oversight of the Trust’s CCO; consider the size and committee structure of the Board; nominate and evaluate candidates for Independent Trustee membership and membership on committees of the Trust; and review the compensation arrangements for each of the Trustees. The Nominating and Compensation Committee also assists the Board in selecting, appointing, and evaluating the Trust’s CCO, and meets in executive session from time to time with the Manager to discuss the CCO’s performance and the effectiveness of the Trust’s compliance program. The Nominating and Compensation Committee generally will not consider nominees recommended by Contract owners. The Nominating and Compensation Committee held [ ] meetings during the fiscal year ended December 31, 2013. Mr. Komisarjevsky serves as the Chair of the Nominating and Compensation Committee.
63
The Board also has two Investment Committees each composed entirely of Independent Trustees. The Board formed the Committees in September 2013 on a provisional basis to evaluate whether the Committees could assist the Board in its oversight of Portfolio performance. Each Investment Committee is responsible for overseeing and guiding the process by which the Board reviews Portfolio performance and interfacing with personnel at the Manager and the Advisers responsible for portfolio management. Each Investment Committee held [two] meetings during the fiscal year ended December 31, 2013. The Chairs of the Committees are Ms. Edwards and Mr. Rosenthal.
Compensation of the Trustees
Effective October 1, 2013, each Independent Trustee receives from the Trust an annual fee of $260,000, payable quarterly, representing the payment of an annual retainer and all regular, committee and special meeting fees. In addition, an annual retainer of $30,000 is paid to the lead Independent Trustee; an annual retainer of $22,500 is paid to the Chair of the Audit Committee; an annual retainer of $15,000 is paid to the Chair of the Nominating and Compensation Committee; and an annual retainer of $7,500 is paid to the Chairs of each Investment Committee. Trustees also receive reimbursement from the Trust for expenses associated with attending Board or Committee meetings.
Prior to October 1, 2013, each Independent Trustee received from the Trust an annual fee of $250,000, representing the payment of an annual retainer and all regular, committee and special meeting fees. In addition, an annual retainer of $30,000 was paid to the lead Independent Trustee; an annual retainer of $22,500 was paid to the Chair of the Audit Committee; and an annual retainer of $15,000 was paid to the Chair of the Nominating and Compensation Committee.
Prior to October 1, 2012, each Independent Trustee received from the Trust an annual fee of $230,000 representing the payment of an annual retainer and all regular, committee and special meeting fees. In addition, an annual retainer of $30,000 was paid to the Lead Independent Trustee; an annual retainer of $22,500 was paid to the Chair of the Audit Committee; and an annual retainer of $15,000 was paid to the Chair of the Nominating and Compensation Committee.
Trustee Compensation Table
for the Year Ended December 31, 2013*
| Trustee | Aggregate Compensation from the Trust | Pension or Retirement Benefits Accrued As Part of Trust Expenses | Estimated Annual Benefits Upon Retirement | Total Compensation from Trust and Fund Complex Paid to Trustees** | ||||
| Interested Trustees | ||||||||
Steven M. Joenk | $ -0- | $-0- | $-0- | $ -0- | ||||
| Independent Trustees | ||||||||
Jettie M. Edwards | $-0- | $-0- | ||||||
William M. Kearns, Jr. | $-0- | $-0- | ||||||
Christopher P.A. Komisarjevsky | $-0- | $-0- | ||||||
Harvey Rosenthal | $-0- | $-0- | ||||||
Gary S. Schpero | $-0- | $-0- | ||||||
Kenneth L. Walker | $-0- | $-0- | ||||||
Caroline L. Williams | $-0- | $-0- | ||||||
64
| * | A deferred compensation plan for the benefit of the Independent Trustees has been adopted by the Trust. Under the deferred compensation plan, each Trustee may defer payment of all or part of the fees payable for such Trustee’s services until his or her retirement as a Trustee or until the earlier attainment of a specified age. Fees deferred under the deferred compensation plan, together with accrued interest thereon, will be disbursed to a participating Trustee in monthly installments over a five to 20 year period elected by such Trustee. |
| ** | The amounts reported in this column reflect the total compensation paid to each trustee for his or her service as trustee of 77 portfolios of one trust in the fund complex. The Multimanager Portfolios are newly organized as of the date of this SAI. Including the Multimanager Portfolios, the compensation for each Trustee for the current fiscal year is estimated to be the same as stated in the table above, and would reflect compensation for service as trustee of 86 funds. |
As of December 31, 2013, no Independent Trustee or members of his or her immediate family beneficially owned or owned of record securities representing interests in the Manager, Advisers or Distributors of the Trust, or any person controlling, controlled by or under common control with such persons. For this purpose, “immediate family member” includes the Independent Trustee’s spouse, children residing in the Independent Trustee’s household and dependents of the Trustee. Furthermore, the Trustees of the Trust did not beneficially own shares of any Portfolio of the Trust or of portfolios overseen in the same family of investment companies, except as set forth in the following table:
Trustee Ownership of Equity Securities
| Name of Trustee | Dollar Range of Equity Securities in the Portfolios* | Aggregate Dollar Range of Equity Securities in All Portfolios Overseen in Family of Investment Companies: | ||||
| Interested Trustee | ||||||
| Steven M. Joenk | None | over $100,000 | ||||
| Independent Trustees | ||||||
| Jettie M. Edwards | ||||||
| William M. Kearns, Jr. | ||||||
| Christopher P.A. Komisarjevsky | ||||||
| Harvey Rosenthal | ||||||
| Gary S. Schpero | ||||||
| Kenneth L. Walker | ||||||
| Caroline L. Williams | ||||||
| * | As of December 31, 2013. |
65
The Trust’s Officers
No officer of the Trust receives any compensation paid by the Trust. Each officer of the Trust is an employee of AXA Equitable, FMG LLC, and/or AXA Distributors, LLC (“AXA Distributors”). The Trust’s principal officers are:
| Name, Address and Age | Position(s) Held With Fund* | Term of Office and Length of Time Served** | Principal Occupation(s) During Past 5 Years | |||
Steven M. Joenk 1290 Avenue of the Americas, New York, New York 10104 (54) | Trustee, Chairman, President and Chief Executive Officer | From September 2004 to present, Trustee and Chairman and from December 2002 to present, Chief Executive Officer and President. | From May 2011 to present, Director, President, Chief Executive Officer and Chairman, FMG LLC; from September 1999 to present, Managing Director, AXA Equitable; from September 2004 to April 2011, President, AXA Equitable’s FMG; from July 2004 to present, Senior Vice President, MONY Life Insurance Company and MONY Life Insurance Company of America and Director, MONY Capital Management, Inc., Director and President, 1740 Advisers, Inc., Director, Chairman of the Board and President, MONY Asset Management, Inc. and Enterprise Capital Management (from July 2004 to January 2011); from January 2005 to January 2011, Director, MONY Financial Resources of Americas Limited and; from November 2005 to present, Director MONY International Holdings, LLC. | |||
Patricia Louie, Esq. 1290 Avenue of the Americas, New York, New York 10104 (58) | Vice President and Secretary | From July 1999 to Present | From June 2012 to present, Executive Vice President and General Counsel of FMG LLC; from May 2011 to June 2012, Senior Vice President and Corporate Counsel of FMG LLC; from February 2011 to present Managing Director and Associate General Counsel of AXA Financial and AXA Equitable; from May 2003 to February 2011, Vice President and Associate General Counsel of AXA Financial and AXA Equitable. | |||
Brian Walsh Newport Center, 525 Washington Boulevard, 33rd Floor, Jersey City, New Jersey 07310-1606 (45) | Chief Financial Officer and Treasurer | From June 2007 to present | From May 2011 to present, Senior Vice President of FMG LLC; from February 2003 to present, Lead Director of AXA Financial and AXA Equitable. | |||
Kenneth Kozlowski 1290 Avenue of the Americas New York, New York 10104 | Vice President | From to present | From June 2012 to present, Executive Vice President and Chief Investment Officer of FMG LLC; from May 2011 to June 2012, Senior Vice President of FMG LLC; from September 2011 to present Managing Director of AXA Financial and AXA Equitable; from February 2001 to September 2011, Vice President AXA Financial and AXA Equitable; from July 2004 to January 2011, Director, Enterprise Capital Management, Inc. | |||
Alwi Chan 1290 Avenue of the Americas, New York, New York 10104 (38) | Vice President | From June 2007 to present | From June 2012 to present, Senior Vice President and Deputy Chief Investment Officer of FMG LLC; from May 2011 to June 2012, Vice President of FMG LLC; from February 2007 to present, Lead Director, AXA Financial and AXA Equitable. | |||
James Kelly Newport Center, 525 Washington Boulevard, 33rd Floor, Jersey City, New Jersey 07310-1606 (45) | Controller | From June 2007 to present | From May 2011 to present, Vice President of FMG LLC; from September 2008 to present, Senior Director of AXA Equitable; from March 2006 to September 2008, Assistant Vice President, AXA Financial and AXA Equitable. |
66
| Name, Address and Age | Position(s) Held With Fund* | Term of Office and Length of Time Served** | Principal Occupation(s) During Past 5 Years | |||
Mary E. Cantwell 1290 Avenue of the Americas, New York, New York 10104 (51) | Vice President | From July 1999 to Present | From June 2012 to present, Senior Vice President of FMG LLC; from May 2011 to June 2012, Vice President of FMG LLC; from February 2001 to present, Lead Director, AXA Financial; from July 2004 to January 2011, a Director of Enterprise Capital Management, Inc. | |||
Roselle Ibanga Newport Center, 525 Washington Boulevard, 33rd Floor, Jersey City, New Jersey 07310-1606 (34) | Assistant Controller | From March 2009 to present | From February 2009 to present, Director of AXA Equitable; from December 2008 to February 2009, Director of AXA Equitable’s FMG; from October 2007 to December 2008, Second Vice President, New York Life Investments Management, LLC. | |||
Lisa Perrelli Newport Center, 525 Washington Boulevard, 33rd Floor, Jersey City, New Jersey 07310-1606 (39) | Assistant Controller | From March 2009 to present | From November 2012 to present, Senior Director of AXA Equitable; from September 2008 to November 2012, Assistant Vice President of AXA Equitable; from February 2008 to September 2008, Director of AXA Equitable’s FMG; from September 2006 to February 2008, Manager of AXA’s FMG. | |||
William MacGregor, Esq. 1290 Avenue of the Americas, New York, New York 10104 (38) | Vice President and Assistant Secretary | From September 2006 to present | From June 2012 to present, Senior Vice President, Secretary and Associate General Counsel of FMG LLC; from May 2011 to June 2012, Vice President and Associate Corporate Counsel of FMG LLC; from May 2008 to present, Lead Director and counsel of AXA Equitable. | |||
Gariel Nahoum, Esq. 1290 Avenue of the Americas, New York, New York 10104 (30) | Vice President and Assistant Secretary | From December 2011 to present | From June 2012 to present, Vice President, Assistant Secretary and Associate General Counsel of FMG LLC; from September 2011 to present, Vice President, Secretary and Counsel of FMG LLC; from August 2011 to present, Senior Director and Counsel of AXA Equitable; from September 2008 to August 2011, Associate, Kramer Levin Naftalis & Frankel LLP; graduate, Hofstra Law School, magna cum laude, May 2008. | |||
Joseph J. Paolo 1290 Avenue of the Americas, New York, New York 10104 (43) | Chief Compliance Officer, Vice President and Anti-Money Laundering Compliance Officer | Chief Compliance Officer from May 2007, Vice President and Anti-Money Laundering Compliance Officer from November 2005 to Present | From May 2011 to present, Senior Vice President and Chief Compliance Officer of FMG LLC; from June 2007 to present, Lead Director of AXA Equitable and Chief Compliance Officer of AXA’s FMG. | |||
Richard Guinnessey 1290 Avenue of the Americas, New York, New York 10104 (49) | Vice President | From March 2011 to present | From June 2012 to present, Senior Director of FMG LLC; from September 2010 to present Vice President of AXA Equitable; from November 2005 to September 2010 Assistant Vice President of AXA Equitable. | |||
Jennifer Mastronardi 1290 Avenue of the Americas, New York, New York 10104 (27) | Assistant Vice President | From March 2012 to present | From February 2009 to present, Director of AXA Equitable; from June 2007 to February 2009, Operations Associate in Managed Futures Department, Morgan Stanley. | |||
Paraskevou Charalambous 1290 Avenue of the Americas, New York, New York 10104 (51) | Assistant Secretary | From November 2005 to present | From March 2000 to present, Lead Manager/Senior Legal Assistant for AXA Equitable. |
67
| Name, Address and Age | Position(s) Held With Fund* | Term of Office and Length of Time Served** | Principal Occupation(s) During Past 5 Years | |||
Helen Espaillat 1290 Avenue of the Americas, New York, New York 10104 (50) | Assistant Secretary | From March 2009 to present | From July 2004 to present, Senior Manager/Legal Assistant for AXA Equitable. |
| * | The officers in the table above (except Ms. Charalambous and Ms. Espaillat) hold similar positions with one other registered investment company in the fund complex. The registered investment companies in the fund complex include AXA Premier VIP Trust and the Trust. |
| ** | Each officer is elected on an annual basis. |
Control Persons and Principal Holders of Securities
As of March [ ], 2014, the Trustees and officers of the Trust, as a group, owned less than 1% of the outstanding shares of any class of any Portfolio of the Trust.
See Appendix E to this SAI for a list of control persons and principal holders of securities of each Portfolio.
INVESTMENT MANAGEMENT AND OTHER SERVICES
The Manager
FMG LLC currently serves as the investment manager for each Portfolio. BlackRock Investment Management, LLC (“BlackRock Investment”), AllianceBernstein, L.P. (“AllianceBernstein”), Marsico Capital Management, LLC (“Marsico”), Pacific Investment Management Company, LLC (“PIMCO”), Lord, Abbett & Co. LLC (“Lord Abbett”), Franklin Advisers, Inc. (“Franklin Advisers”), Wellington Management Company, LLP (“Wellington Management”), T. Rowe Price Associates, Inc. (“T. Rowe Price”), SSgA Funds Management, Inc. (“SSgA FM”), Diamond Hill Capital Management, Inc. (“Diamond Hill”), Knightsbridge Asset Management, LLC (“Knightsbridge”), Allianz Global Investors U.S. LLC (“Allianz”), ClearBridge Investments, LLC (“ClearBridge”), Scotia Institutional Asset Management US, Ltd. (“Scotia”), Westfield Capital Management Company, L.P. (“Westfield”), and BlackRock Financial Management, Inc. (“BlackRock Financial”) (each an “Adviser,” and together the “Advisers”) serve as investment advisers to one or more of the Portfolios, as described more fully in the Prospectus.
FMG LLC is a wholly-owned subsidiary of AXA Equitable. AXA Equitable, which is a New York life insurance company and one of the largest life insurance companies in the U.S., is a wholly owned subsidiary of AXA Financial, Inc. (“AXA Financial”), a subsidiary of AXA, a French insurance holding company. The principal offices of FMG LLC, AXA Equitable and AXA Financial are located at 1290 Avenue of the Americas, New York, New York 10104.
AXA Financial is a wholly-owned subsidiary of AXA. AXA is the holding company for an international group of insurance and related financial services companies. AXA insurance operations include activities in life insurance, property and casualty insurance and reinsurance. The insurance operations are diverse geographically, with activities principally in Western Europe, North America, and the Asia/Pacific area and, to a lesser extent, in Africa and South America. AXA is also engaged in asset management, investment banking, securities trading, brokerage, real estate and other financial services activities principally in the U.S., as well as in Western Europe and the Asia/Pacific area.
The Manager serves as the investment manager of the Trust pursuant to Investment Management Agreements with respect to the Portfolios (each, a “Management Agreement”). Subject always to the direction and control of the Trustees of the Trust, under each Management Agreement, the Manager has, with respect to each sub-advised Portfolio or portion thereof, (i) overall supervisory responsibility for the general management and investment of each Portfolio’s assets; (ii) full discretion to select new or additional Advisers for each Portfolio; (iii) full discretion to enter into and materially modify existing Advisory Agreements with Advisers; (iv) full discretion to terminate and replace any Adviser; and (v)
68
full investment discretion to make all determinations with respect to the investment of a Portfolio’s assets not then managed by an Adviser. In connection with the Manager’s responsibilities under the Management Agreements, the Manager will assess each Portfolio’s investment focus and, with respect to Portfolios advised by one or more Advisers, will seek to implement decisions with respect to the allocation and reallocation of each Portfolio’s assets among one or more current or additional Advisers from time to time, as the Manager deems appropriate, to enable each Portfolio to achieve its investment goals. In addition, the Manager will monitor compliance of each such Adviser with the investment objectives, policies and restrictions of any Portfolio or Portfolios (or portions of any Portfolio) under the management of such Adviser, and review and report to the Trustees of the Trust on the performance of each Adviser. The Manager will furnish, or cause the appropriate Adviser(s) to furnish, to the Trust such statistical information, with respect to the investments that a Portfolio (or portions of any Portfolio) may hold or contemplate purchasing, as the Trust may reasonably request. On the Manager’s own initiative, the Manager will apprise, or cause the appropriate Adviser(s) to apprise, the Trust of important developments materially affecting each Portfolio (or any portion of a Portfolio that they advise) and will furnish the Trust, from time to time, with such information as may be appropriate for this purpose. Further, the Manager agrees to furnish, or cause the appropriate Adviser(s) to furnish, to the Trustees of the Trust such periodic and special reports as the Trustees of the Trust may reasonably request. In addition, the Manager agrees to cause the appropriate Adviser(s) to furnish to third-party data reporting services all currently available standardized performance information and other customary data.
Under each Management Agreement, the Manager also is required to furnish to the Trust, at its own expense and without remuneration from or other cost to the Trust, the following:
| • | Office space, all necessary office facilities and equipment. |
| • | Necessary executive and other personnel, including personnel for the performance of clerical and other office functions, other than those functions |
| • | related to and to be performed under the Trust’s contract or contracts for administration, custodial, accounting, bookkeeping, transfer and dividend disbursing agency or similar services by the entity selected to perform such services; or |
| • | related to the investment advisory services to be provided by any Adviser pursuant to an advisory agreement with the Manager (“Advisory Agreement”). |
| • | Information and services, other than services of outside counsel or independent accountants or investment advisory services to be provided by any Adviser under an Advisory Agreement, required in connection with the preparation of all registration statements, prospectuses and statements of additional information, any supplements thereto, annual, semi-annual, and periodic reports to Trust Shareholders, regulatory authorities, or others, and all notices and proxy solicitation materials, furnished to Shareholders or regulatory authorities, and all tax returns. |
Each Management Agreement also requires the Manager (or its affiliates) to pay all salaries, expenses, and fees of the Trustees and officers of the Trust who are affiliated with the Manager or its affiliates.
The continuance of each Management Agreement, with respect to each Portfolio, must be specifically approved at least annually (i) by the Trust’s Board or by vote of a majority of the outstanding voting securities (as defined in the 1940 Act) of such Portfolio and (ii) by vote of a majority of the Trustees who are not parties to the Management Agreement or “interested persons” (as defined in the 1940 Act) of any such party cast in person at a meeting called for such purpose. The Management Agreement with respect to each Portfolio may be terminated (i) at any time, without the payment of any penalty, by the Trust upon the vote of a majority of the Trustees, including a majority of the Independent Trustees, or by vote of the majority of the outstanding voting securities (as defined in the 1940 Act) of such Portfolio upon sixty (60) days’ written notice to the Manager or (ii) by the Manager at any time without penalty upon sixty (60) days’ written notice to the Trust. Each Management Agreement will also terminate automatically in the event of its assignment (as defined in the 1940 Act).
69
Each Portfolio pays a fee to the Manager for its services. The Manager and the Trust have also entered into an expense limitation agreement with respect to the Portfolios as set forth in the Prospectus (“Expense Limitation Agreement”), pursuant to which the Manager has agreed to waive or limit its management, administrative and other fees and to assume other expenses so that the net annual operating expenses (with certain exceptions as set forth in the Prospectus) of the Portfolio are limited to the extent described in the “Management of the Trust-Expense Limitation Agreement” section of the Prospectus.
In addition to the management fees, the Trust pays all expenses not assumed by the Manager, including without limitation: fees and expenses of its independent accountants and of legal counsel for itself and the Trust’s Independent Trustees; the costs of preparing, setting in type, printing and mailing to shareholders annual and semi-annual reports, proxy statements, prospectuses, prospectus supplements and statements of additional information; the costs of printing registration statements; custodian’s fees; any proxy solicitors’ fees and expenses; filing fees; Trustee expenses (including any special counsel to Trustees); transfer agent fees; advisory and administration fees; any federal, state or local income or other taxes; any interest; any membership fees of the Investment Company Institute and similar organizations; fidelity bond and Trustees’ liability insurance premiums; and any extraordinary expenses, such as indemnification payments or damages awarded in litigation or settlements made. All general Trust expenses are allocated among and charged to the assets of the portfolios of the Trust on a basis that the Trustees deem fair and equitable, which may be on the basis of relative net assets of each portfolio or the nature of the services performed and relative applicability to each portfolio. As discussed in greater detail below under “The Distributor,” the Class IA and IB shares of each Portfolio may pay for certain distribution-related expenses in connection with activities primarily intended to result in the sale of its shares.
The tables below show the fees paid by each Multimanager Portfolio to the Manager during the years ended December 31, 2011, 2012 and 2013, respectively. The first column shows each fee without fee waivers, the second column shows the fees actually paid to the Manager after fee waivers and the third column shows the total amount of fees waived by the Manager and other expenses of each Portfolio assumed by the Manager pursuant to the Expense Limitation Agreement. During the years ended December 31, 2011, December 31, 2012 and December 31, 2013, the Manager received $[ ], $[ ] and $[ ] respectively, in reimbursement for the Multimanager Portfolios.
CALENDAR YEAR ENDED DECEMBER 31, 2011
Portfolio | Management Fee | Management Fee Paid To Manager After Fee Waiver | Total Amount Of Fees Waived And Other Expenses Assumed by Manager | |||||||||
Multimanager Aggressive Equity | $ | 9,213,569 | $ | 9,213,569 | $ | 0 | ||||||
Multimanager Core Bond | $ | 20,427,038 | $ | 20,427,038 | $ | 0 | ||||||
Multimanager Mid Cap Growth | $ | 4,191,283 | $ | 4,191,283 | $ | 0 | ||||||
Multimanager Mid Cap Value | $ | 4,827,233 | $ | 4,827,233 | $ | 0 | ||||||
Multimanager Technology | $ | 6,290,691 | $ | 6,290,691 | $ | 0 | ||||||
CALENDAR YEAR ENDED DECEMBER 31, 2012
Portfolio | Management Fee | Management Fee Paid To Manager After Fee Waiver | Total Amount Of Fees Waived And Other Expenses Assumed by Manager | |||||||||
Multimanager Aggressive Equity | $ | 8,484,231 | $ | 8,484,231 | $ | 0 | ||||||
Multimanager Core Bond | $ | 11,428,075 | $ | 11,428,075 | $ | 0 | ||||||
Multimanager Mid Cap Growth | $ | 3,605,777 | $ | 3,572,092 | $ | 33,685 | ||||||
Multimanager Mid Cap Value | $ | 4,427,501 | $ | 4,387,223 | $ | 40,278 | ||||||
Multimanager Technology | $ | 6,102,490 | $ | 6,102,490 | $ | 0 | ||||||
70
CALENDAR YEAR ENDED DECEMBER 31, 2013
Portfolio | Management Fee | Management Fee Paid To Manager After Fee Waiver | Total Amount Of Fees Waived And Other Expenses Assumed by Manager | |||||||||
Multimanager Aggressive Equity | $ | $ | $ | |||||||||
Multimanager Core Bond | $ | $ | $ | |||||||||
Multimanager Mid Cap Growth | $ | $ | $ | |||||||||
Multimanager Mid Cap Value | $ | $ | $ | |||||||||
Multimanager Technology | $ | $ | $ | |||||||||
The Advisers
The Manager has entered into one or more Advisory Agreements on behalf of each Portfolio with the Advisers identified in the Prospectus. The Advisory Agreements obligate the Advisers to: (i) make investment decisions on behalf of their respective Portfolios (or portions thereof); (ii) place all orders for the purchase and sale of investments for their respective Portfolios (or portions thereof) with brokers or dealers selected by the Manager and/or the Advisers; and (iii) perform certain related administrative functions in connection therewith.
As discussed in the Prospectus, a discussion of the basis of the decision by the Trust’s Board to approve the Advisory Agreements with the Advisers is available in the Trust’s Annual or Semi-Annual Reports to Shareholders.
During the years ended December 31, 2011, 2012 and 2013, respectively, the Manager paid the following fees to the Advisers with respect to the Multimanager Portfolios pursuant to the Advisory Agreements:
| Advisory Fee Paid | ||||||||||||
Portfolio | 2011 | 2012 | 2013 | |||||||||
Multimanager Aggressive Equity | $ | 3,430,024 | $ | 3,191,190 | $ | |||||||
Multimanager Core Bond | $ | 4,948,554 | $ | 2,935,252 | $ | |||||||
Multimanager Mid Cap Growth | $ | 1,525,523 | $ | 1,375,441 | $ | |||||||
Multimanager Mid Cap Value | $ | 1,782,205 | $ | 1,525,857 | $ | |||||||
Multimanager Technology | $ | 2,115,655 | $ | 2,014,522 | $ | |||||||
The Manager recommends Advisers for the Portfolios to the Trustees based upon its continuing quantitative and qualitative evaluation of each Adviser’s skills in managing assets pursuant to specific investment styles and strategies. Unlike many other mutual funds, these Portfolios are not associated with any one portfolio manager, and benefit from independent specialists selected from the investment management industry. Short-term investment performance, by itself, is not a significant factor in selecting or terminating an Adviser, and the Manager does not expect to recommend frequent changes of Advisers. The Trust has received an exemptive order from the SEC (“Multi-Manager Order”) that permits the Manager, subject to certain conditions, to enter into Advisory Agreements with Advisers approved by the Trustees, but without the requirement of shareholder approval. Pursuant to the terms of the Multi-Manager Order, the Manager is able, subject to the approval of the Trustees, but without shareholder approval, to employ new Advisers for new or existing funds, change the terms of particular Advisory Agreements or continue the employment of existing Advisers after events that under the 1940 Act and the Advisory Agreements would cause an automatic termination of the agreement. The Manager also may allocate a Portfolio’s assets to additional Advisers subject to approval of the Trust’s Board. However, the Manager may not enter into an advisory agreement with an “affiliated person” of the Manager (as that term is defined in Section 2(a)(3) of the 1940 Act) (“Affiliated Adviser”), such as AllianceBernstein, AXA IM, and AXA Rosenberg, unless the advisory agreement with the Affiliated Adviser, including compensation payable thereunder, is approved by the affected Portfolio’s
71
shareholders, including, in instances in which the Advisory Agreement pertains to a newly formed Portfolio, the Portfolio’s initial shareholder. Although shareholder approval would not be required for the termination of Advisory Agreements, shareholders of a Portfolio would continue to have the right to terminate such agreements for the Portfolio at any time by a vote of a majority of outstanding voting securities of the Portfolio. The Manager may be subject to certain potential conflicts of interest in connection with recommending the appointment and continued service of Advisers. The Manager may also be subject to potential conflicts of interest in recommending or selecting of Advisers, or choosing ETF investments, where applicable, to the extent it invests in ETFs sponsored by Advisers. As noted above, the Manager is affiliated with certain Advisers, including AllianceBernstein, and therefore the Manager will benefit not only from the net management fee the Manager retains, but also from the advisory fees paid by the Manager to the affiliated Adviser. Since the Manager pays fees to the Advisers from the management fees that it earns from the Portfolios, any increase or decrease in the advisory fees negotiated with proposed or current Advisers will result in a corresponding decrease or increase, respectively, in the amount of the management fee retained by the Manager. The Manager or its affiliates also have distribution relationships with certain Advisers or their affiliates under which the Advisers or their affiliates distribute or support the distribution of investment products issued or sold by the Manager or its affiliates (including those in which the Trust’s Portfolios serve as investment options), which could financially benefit the Manager and its affiliates or provide an incentive to the Manager in selecting one Adviser over another. When recommending the appointment or continued service of an Adviser, consistent with its fiduciary duties, the Manager relies primarily on the qualitative and quantitative factors described in detail in the Prospectus. In addition, the appointment of each Adviser is subject to approval of the Trust’s Board, including a majority of the Trust’s Independent Trustees.
| Portfolio | Name and Control Persons of the Sub-adviser | |
Multimanager Aggressive Equity Portfolio | AllianceBernstein, a limited partnership, is indirectly majority owned by, and therefore controlled by and affiliated with, AXA Equitable, a life insurance company. | |
| ClearBridge is a wholly owned subsidiary of Legg Mason, Inc., a publicly-traded financial services holding company. | ||
| Scotia (formerly GCIC US Ltd.) is a wholly owned subsidiary of GCIC Ltd., which is an indirect wholly owned subsidiary of Dundee Wealth Inc. Dundee Wealth Inc. is a wholly owned subsidiary of The Bank of Nova Scotia (“ScotiaBank”). | ||
| Marisco is an independent, registered investment adviser. Marisco was organized in September 1997 as a Delaware Limited Liability Company and provides investment management services to mutual funds and private accounts. Marisco is an indirect subsidiary of Marisco Group LLC, a Delaware Limited Liability Company. | ||
| T. Rowe Price is a wholly-owned subsidiary of T. Rowe Price Group, Inc., a publicly traded financial services holding company. | ||
| Westfield is 100% employee owned. | ||
Multimanager Core Bond Portfolio | BlackRock Financial is an indirect wholly-owned subsidiary of BlackRock. BlackRock is a publicly-traded corporation (NYSE: BLK), independent in ownership and governance, with no single majority stockholder and a majority of independent directors. | |
| PIMCO is a majority-owned subsidiary of Allianz Asset Management with a minority interested held by PIMCO Partners, LLC, a California limited liability company. Prior to December 31, 2011, Allianz Asset Management was named Allianz Global Investors of America L.P. PIMCO Partners, LLC is owned by the current managing directors and executive management of PIMCO. Through various holding company structures, Allianz Asset Management is majority owned by Allianz SE. | ||
| SSgA FM is a wholly-owned subsidiary of State Street Corporation. SSgA FM and other advisory affiliates of State Street Corporation make up State Street Global Advisors (“SSgA”), the investment management arm of State Street Corporation. |
72
| Portfolio | Name and Control Persons of the Sub-adviser | |
Multimanager Mid Cap Growth Portfolio | AllianceBernstein, a limited partnership, is indirectly majority owned by, and therefore controlled by and affiliated with, AXA Equitable, a life insurance company. | |
| BlackRock Investment, a global investment manager, is a wholly-owned subsidiary of BlackRock Advisors. BlackRock Advisors is a wholly-owned subsidiary of BlackRock. As of December 31, 2013, PNC owned [ ]% of BlackRock and institutional investors, employees and the public held economic interest of [ ]%. With regard to voting stock, PNC owned [ ]% and institutional investors, employees and the public owned [ ]% of voting shares. | ||
| Franklin Advisers Inc. is a wholly-owned subsidiary of Resources, a publicly owned company engaged in the financial services industry. Charles B. Johnson and Robert H. Johnson, Jr. are principal shareholders of Resources. | ||
| Wellington Management is a Massachusetts limited liability partnership whose sole business is investment management. | ||
Multimanager Mid Cap Value Portfolio | BlackRock Investment, a global investment manager, is a wholly-owned subsidiary of BlackRock Advisors. BlackRock Advisors is a wholly-owned subsidiary of BlackRock. As of December 31, 2013, PNC owned [ ]% of BlackRock and institutional investors, employees and the public held economic interest of [ ]%. With regard to voting stock, PNC owned [ ]% and institutional investors, employees and the public owned [ ]% of voting shares. | |
| Diamond Hill, an Ohio corporation, is a wholly-owned subsidiary of Diamond Hill Investment Group, Inc., a publicly traded investment adviser. | ||
| Knightsbridge is an investment advisory firm registered with the SEC under the Investment Advisers Act of 1940 and is employee owned. | ||
| Lord Abbett is owned by its members. | ||
Multimanager Technology Portfolio | Allianz (formerly, RCM Capital Management LLC) is an indirect wholly owned subsidiary of Allianz SE, a European-based, multinational insurance and financial services holding company that is publicly traded. | |
| SSgA FM is a wholly-owned subsidiary of State Street Corporation. SsgA FM and other advisory affiliates of State Street Corporation make up SSGA, the investment management arm of State Street Corporation. | ||
| Wellington Management is a Massachusetts limited liability partnership whose sole business is investment management. |
Information regarding the portfolio managers’ compensation, other accounts managed by the portfolio managers and the portfolio managers’ ownership of shares of the Portfolios to the extent applicable is attached in Appendix C.
The Manager reserves the right, subject to approval of the Trust’s Board, to appoint more than one Adviser to manage the assets of each Portfolio. When a Portfolio has more than one Adviser, the assets of each Portfolio are allocated by the Manager among the Advisers selected for the Portfolio. Each Adviser has discretion, subject to oversight by the Trustees and the Manager, to purchase and sell portfolio assets, consistent with each Portfolio’s investment objectives, policies and restrictions and specific investment strategies developed by the Manager.
Generally, no Adviser provides any services to any Portfolio except asset management and related administrative and recordkeeping services. However, an Adviser or its affiliated broker-dealer may execute portfolio transactions for a Portfolio and receive brokerage commissions in connection therewith as permitted by Section 17(e) of the 1940 Act and the rules thereunder.
Personal Trading Policies
The Trust, the Manager and the Distributor (as defined below) each have adopted a code of ethics pursuant to Rule 17j-1 under the 1940 Act, which permits personnel covered by the rule to invest in securities that may be purchased or held by a Portfolio but prohibits fraudulent, misleading, deceptive or manipulative acts or conduct in connection with that personal investing. Each Adviser also has adopted a code of ethics under Rule 17j-1. Such codes of ethics may permit personnel covered by the rule to invest in securities that may be purchased or held by the Portfolio for which the Adviser serves as an adviser. The Codes of Ethics of the Trust, FMG LLC, the Distributor and the Advisers have been filed as exhibits to the Trust’s Registration Statement.
73
The Administrator
Pursuant to an administrative agreement (“Mutual Funds Service Agreement”), FMG LLC (“Administrator”) provides the Trust with necessary administrative services, as more fully described in the Prospectus. In addition, the Administrator makes available the office space, equipment, personnel and facilities required to provide such administrative services to the Trust. For these administrative services, in addition to the management fee, each Portfolio pays FMG LLC its proportionate share of an asset-based administration fee for the Trust, plus an annual flat fee of $32,500 where the Portfolio’s total average net assets are less than $5 billion. The Trust’s asset-based administration fee for each Portfolio is equal to an annual rate of 0.15% of the first $20 billion of the Trust’s Hybrid Portfolios’ aggregate average daily net assets, 0.110% of the next $5 billion, and 0.100% thereafter. The Trust’s Hybrid Portfolios include the EQ/AllianceBernstein Small Cap Growth, EQ/Franklin Core Balanced, EQ/Mutual Large Cap Equity, EQ/AXA Franklin Small Cap Value Core, EQ/Templeton Global Equity, EQ/Emerging Markets Equity PLUS, EQ/Equity Growth PLUS, EQ/Global Bond PLUS, EQ/Global Multi-Sector Equity, EQ/High Yield Bond, EQ/International Core PLUS, EQ/International Value PLUS, EQ/Large Cap Core PLUS, EQ/Large Cap Growth PLUS, EQ/Large Cap Value PLUS, EQ/Mid Cap Value PLUS, EQ/Natural Resources PLUS, EQ/Quality Bond PLUS, EQ/Real Estate PLUS, EQ/Convertible Securities, Multimanager Aggressive Equity, Multimanager Core Bond, Multimanager Mid Cap Growth, Multimanager Mid Cap Value and Multimanager Technology Portfolios.
Pursuant to a sub-administration arrangement, the Manager has contracted with JPMorgan Investors Services Co. (“JPMorgan Services”) to provide the Trust with certain administrative services, including monitoring of portfolio compliance and portfolio accounting services.
During the years ended December 31, 2011, 2012 and 2013, respectively, the Portfolios listed in the table below paid the following fees to FMG LLC or AXA Equitable (the predecessor administrator to FMG LLC) for administrative services.
| Administration Fee | ||||||||||||
Portfolio | 2011 | 2012 | 2013 | |||||||||
Multimanager Aggressive Equity | $ | 2,442,681 | $ | 2,244,135 | $ | |||||||
Multimanager Core Bond | $ | 5,950,346 | $ | 3,209,629 | $ | |||||||
Multimanager Mid Cap Growth | $ | 818,154 | $ | 708,591 | $ | |||||||
Multimanager Mid Cap Value | $ | 937,367 | $ | 862,666 | $ | |||||||
Multimanager Technology | $ | 1,025508 | $ | 996,060 | $ | |||||||
The Distributor
The Trust has distribution agreements with AXA Distributors (also referred to as the “Distributor”), by which AXA Distributors serves as Distributor for the Trust’s Class IA shares, Class IB shares and Class K shares. AXA Distributors is an indirect wholly owned subsidiary of AXA Equitable and an affiliate of FMG LLC and its address is 1290 Avenue of the Americas, New York, New York 10104.
The Trust’s distribution agreements with respect to the Class IA, Class IB and Class K shares of the Portfolios (“Distribution Agreements”) have been approved by the Trust’s Board, including a majority of the Independent Trustees, with respect to each Portfolio. The Distribution Agreements will remain in effect from year to year provided each Distribution Agreement’s continuance is approved annually by (i) a majority of the Independent Trustees who are not parties to such agreement and, if applicable, who have no direct or indirect financial interest in the operation of the Rule 12b-1 Distribution Plans or any such related agreement, by a vote cast in person at a meeting called for the purpose of voting on such Agreements and (ii) either by vote of a majority of the Trustees or a majority of the outstanding voting securities (as defined in the 1940 Act) of the Trust, as applicable.
The Trust has adopted in the manner prescribed under Rule 12b-1 under the 1940 Act a Rule 12b-1 Distribution Plans. Under the Rule 12b-1 Distribution Plans, each Portfolio is authorized to pay the Distributor
74
an annual distribution fee of up to 0.25% of each Portfolio’s average daily net assets attributable to Class IA and Class IB shares. There is no distribution plan with respect to Class K shares and the Portfolios pay no distribution fees with respect to those shares.
The Board considered various factors in connection with its decision as to whether to approve the Rule 12b-1 Distribution Plans, including: (i) the nature and causes of the circumstances which make approval or continuation of the Rule 12b-1 Distribution Plans necessary and appropriate; (ii) the way in which the Rule 12b-1 Distribution Plans would address those circumstances, including the nature and potential amount of expenditures; (iii) the nature of the anticipated benefits; (iv) the possible benefits of the Rule 12b-1 Distribution Plans to any other person relative to those of the Trust; (v) the effect of the Rule 12b-1 Distribution Plans on existing Contract owners; (vi) the merits of possible alternative plans or pricing structures; (vii) competitive conditions in the variable products industry; and (viii) the relationship of the Rule 12b-1 Distribution Plans to other distribution efforts of the Trust. The Board noted that the overall distribution arrangements would (1) enable investors to choose the purchasing option best suited to their individual situation, thereby encouraging current Contract owners to make additional investments in the Portfolios and attracting new investors and assets to the Portfolios to the benefit of the Portfolios and their respective Contract owners, (2) facilitate distribution of the Portfolios’ shares and (3) maintain the competitive position of the Portfolios in relation to other Portfolios that have implemented or are seeking to implement similar distribution arrangements.
Based upon its review of the foregoing factors and the materials presented to it, and in light of its fiduciary duties under the 1940 Act, the Board, including the Independent Trustees with no direct or indirect financial interest in the Rule 12b-1 Distribution Plans or any related agreements, unanimously determined, in the exercise of its reasonable business judgment, that the Rule 12b-1 Distribution Plans are reasonably likely to benefit the Trust and the shareholders of the Portfolios. As such, the Trustees, including such Independent Trustees, approved each Rule 12b-1 Distribution Plan and its continuance.
Pursuant to the Rule 12b-1 Distribution Plans, the Trust compensates the Distributor from assets attributable to the Class IA and Class IB shares for services rendered and expenses borne in connection with activities primarily intended to result in the sale of that class of shares. Generally, the 12b-1 fees are paid to the Distributor on a monthly basis. A portion of the amounts received by the Distributor will be used to defray various costs incurred or paid by the Distributor in connection with the printing and mailing of Trust prospectuses, statements of additional information, and any supplements thereto and shareholder reports, and holding seminars and sales meetings with wholesale and retail sales personnel designed to promote the distribution of Class IA and Class IB shares. The Distributor may also use a portion of the amounts received to provide compensation to financial intermediaries and third-party broker-dealers for their services in connection with the distribution of Class IA and Class IB shares.
The Rule 12b-1 Distribution Plans are of a type known as a “compensation” plan because payments are made for services rendered to the Trust with respect to a class of shares regardless of the level of expenditures by the Distributor. The Trustees, however, take into account such expenditures for purposes of reviewing operations under the Rule 12b-1 Distribution Plans and in connection with their annual consideration of the Rule 12b-1 Distribution Plans’ renewal. The Distributor’s expenditures include, without limitation: (a) the printing and mailing of Trust prospectuses, statements of additional information, any supplements thereto and shareholder reports for prospective Contract owners with respect to the Class IA and Class IB shares of the Trust; (b) those relating to the development, preparation, printing and mailing of advertisements, sales literature and other promotional materials describing and/or relating to the Class IA and Class IB shares of the Trust; (c) holding seminars and sales meetings designed to promote the distribution of Trust Class IA and Class IB shares; (d) obtaining information and providing explanations to wholesale and retail distributors of Contracts regarding Trust investment objectives and policies and other information about the Trust and its Portfolios, including the performance of the Portfolios; (e) training sales personnel regarding the Class IA and Class IB shares of the Trust; and (f) financing any other activity that the Distributor determines is primarily intended to result in the sale of Class IA and Class IB shares.
FMG LLC, the Distributor and their affiliates may use their respective past profits or other resources to pay for expenses incurred in connection with providing services intended to result in the sale of shares of the Trust and/or support services that benefit Contract owners, including payments of significant
75
amounts made to intermediaries that provide those services. These services may include sales personnel training, prospectus review, marketing and related services. The Distributor also may receive payments from Advisers of the Trust’s Portfolios, which may include other investment companies managed by the Manager in which the Portfolios invest (the “Underlying Portfolios”), and/or their affiliates to help defray expenses for sales meetings, seminar sponsorships and similar expenses that may relate to the Contracts and/or the Advisers’ respective Portfolios.
The Distributor pays all fees and expenses in connection with its qualification and registration as a broker or dealer under federal and state laws. In the capacity of agent, the Distributor currently offers shares of each Portfolio on a continuous basis to the separate accounts of insurance companies offering the Contracts in all states in which the Portfolio or the Trust may from time to time be registered or where permitted by applicable law. Each Distribution Agreement provides that the Distributor shall accept orders for shares at net asset value without sales commissions or loads being charged. The Distributor has made no firm commitment to acquire shares of any Portfolio.
The Rule 12b-1 Distribution Plans and any Rule 12b-1 related agreement that is entered into by the Trust with the Distributor of the Class IA and Class IB shares in connection with the Rule 12b-1 Distribution Plans will continue in effect for a period of more than one year only so long as such continuance is specifically approved at least annually by a vote of a majority of the Trust’s Board, and a majority of the Independent Trustees, with no direct or indirect financial interest in the operation of the Rule 12b-1 Distribution Plans or Rule 12b-1 related agreement, cast in person at a meeting called for the purpose of voting on such Plan or agreement. In addition, annual continuance of the Distribution Agreements must be approved by the Trust’s Board or a majority of outstanding voting securities (as defined in the 1940 Act), and a majority of Independent Trustees, by a vote cast in person at a meeting called for the purpose of voting on the Distribution Agreements. In addition, the Rule 12b-1 Distribution Plans and any Rule 12b-1 related agreement may be terminated as to Class IA and Class IB shares of a Portfolio at any time, without penalty, by vote of a majority of the outstanding Class IA and Class IB shares of the Portfolio, as applicable, or by vote of a majority of the Independent Trustees, with no direct or indirect financial interest in the operation of the Rule 12b-1 Distribution Plans or Rule 12b-1 related agreement. The Rule 12b-1 Distribution Plans also provide that they may not be amended to increase materially the amount (up to 0.25% of Class IA or Class IB average daily net assets annually) that may be spent for distribution of Class IA or Class IB shares of any Portfolio without the approval of Class IA or Class IB shareholders of that Portfolio.
The table below shows the amount paid by the Class IA and Class IB shares of each listed Portfolio to the Distributor pursuant to the Rule 12b-1 Distribution Plans for the year ended December 31, 2013.
Portfolio | Class IA | Class IB | Total | |||||||||
Multimanager Aggressive Equity | $ | $ | $ | |||||||||
Multimanager Core Bond | $ | $ | $ | |||||||||
Multimanager Mid Cap Growth | $ | $ | $ | |||||||||
Multimanager Mid Cap Value | $ | $ | $ | |||||||||
Multimanager Technology | $ | $ | $ | |||||||||
BROKERAGE ALLOCATION AND OTHER STRATEGIES
Brokerage Commissions
The Portfolios of the Trust may be charged for securities brokers’ commissions, transfer taxes and similar fees relating to securities transactions. The Manager and the Advisers of the Portfolios, as appropriate, seek to obtain the best net price and execution on all orders placed for the Portfolios, considering all the circumstances. The Manager and the Advisers may, as appropriate, in the allocation of brokerage business, take into consideration the receipt of research and other brokerage services, consistent with the obligation to seek to obtain best net price and execution.
76
Investment company securities (including securities of the Underlying Portfolios, but not including securities of exchange-traded securities of other registered investment companies of pooled investment vehicles) generally are purchased directly from the issuer. It is expected that other securities will ordinarily be purchased in the primary markets, whether OTC or listed, and that listed securities may be purchased in the OTC market if that market is deemed the primary market.
Purchases and sales of equity securities on a securities exchange or in the OTC market are effected through brokers who receive compensation for their services. Such compensation varies among different brokers. Generally, compensation relating to securities traded on foreign exchanges will be higher than compensation relating to securities traded on U.S. exchanges and may not be subject to negotiation. However, brokerage commission rates in certain countries in which the Portfolios may invest may be discounted for certain large domestic and foreign investors such as the Portfolios. A number of foreign banks and brokers will be used for execution of the Portfolios’ portfolio transactions. In the case of securities traded in the foreign and domestic OTC markets, there is generally no stated commission, but the price usually includes an undisclosed commission or mark-up. Equity securities may be purchased from underwriters at prices that include underwriting fees.
Purchases and sales of fixed-income securities are generally made with an issuer or a primary market-maker acting as principal. Although there is generally no stated brokerage commission paid by a Portfolio for a fixed-income security, the price paid by a Portfolio to an underwriter includes the disclosed underwriting fee and prices in secondary trades usually include an undisclosed commission or mark-up.
The Manager and Advisers of the Portfolios may, as appropriate, in the allocation of brokerage business, take into consideration research and other brokerage services provided by brokers and dealers to the Manager or Advisers. The research services include economic, market, industry and company research material. Commissions charged by brokers that provide research services may be somewhat higher than commissions charged by brokers that do not provide research services. As permitted by Section 28(e) of the Securities Exchange Act of 1934, as amended (“1934 Act”) and by policies adopted by the Trustees, the Manager and Advisers, as appropriate, may cause the Trust to pay a broker-dealer that provides brokerage and research services to the Manager and Advisers an amount of commission for effecting a securities transaction for the Trust in excess of the commission another broker-dealer would have charged for effecting that transaction. To obtain the benefit of Section 28(e), the Manager or the relevant Adviser must make a good faith determination that the commissions paid are reasonable in relation to the value of the brokerage and research services provided viewed in terms of either that particular transaction or its overall responsibilities with respect to the accounts as to which it exercises investment discretion and that the services provided by a broker provide the Manager or the Adviser with lawful and appropriate assistance in the performance of its investment decision-making responsibilities. Accordingly, the price to a Portfolio in any transaction may be less favorable than that available from another broker-dealer if the difference is reasonably justified by other aspects of the portfolio execution services offered.
For futures transactions, the selection of a futures broker is generally based on the overall quality of execution and other services provided by the futures broker. The Manager and the Advisers or their affiliates may choose to execute futures transactions electronically.
Certain Advisers may also receive research or research credits from brokers which are generated from underwriting commissions when purchasing new issues of fixed income securities or other assets for a Portfolio in underwritten fixed price offerings. In these situations, the underwriter or selling group member may provide an Adviser with research in addition to selling the securities (at the fixed public offering price) to the Portfolio. Because the offerings are conducted at a fixed price, the ability to obtain research from a broker-dealer in this situation provides knowledge that may benefit the Portfolio, the Adviser’s other clients and the Adviser without incurring additional costs. These arrangements may not fall within the safe harbor of Section 28(e) of the 1934 Act because the broker-dealer is considered to be acting in a principal capacity in underwritten transactions. However, the Financial Industry Regulatory Authority has adopted rules expressly permitting broker-dealers to provide bona fide research to advisers in connection with fixed price offerings under certain circumstances.
77
Certain Advisers may obtain third-party research from broker-dealers or non-broker dealers by entering into commission sharing arrangements (“CSAs”). Under a CSA, the executing broker-dealer agrees that part of the commissions it earns on certain equity trades will be allocated to one or more research providers as payment for research. CSAs allow an Adviser to direct broker-dealers to pool commissions that are generated from orders executed at that broker-dealer, and then periodically direct the broker-dealer to pay third party research providers for research.
The overall reasonableness of commissions paid will be determined by evaluating brokers on such general factors as execution capabilities, quality of research (that is, quantity and quality of information provided, diversity of sources utilized, nature and frequency of communication, professional experience, analytical ability and professional stature of the broker) and financial standing, as well as the net results of specific transactions, taking into account such factors as price, promptness, confidentiality, size of order and difficulty of execution. The research services obtained will, in general, be used by the Manager and Advisers, as appropriate, for the benefit of all accounts for which the responsible party makes investment decisions. As such, research services paid for with the Portfolios’ brokerage commissions may not benefit the Portfolios, while research services paid for with the brokerage commissions of other clients may benefit the Portfolios. The receipt of research services from brokers will tend to reduce the Manager’s and Advisers’ expenses in managing the Portfolios.
When the Manager and the Advisers, as appropriate, seek to buy or sell the same security or other investment on behalf of one or more portfolios, the purchase or sale will be carried out in a manner that is considered fair and equitable to all accounts. In general, the Manager and the Advisers, as appropriate, will make allocations among accounts with the same or similar investment objective based upon a variety of factors which may include, among other things, the account’s available cash, investment restrictions, permitted investment techniques, tolerance for risk, tax status, account size, and other relevant considerations.
During the years ended December 31, 2011, 2012 and 2013, respectively, the listed Portfolios paid the amounts indicated in brokerage commissions:
| Brokerage Commissions Paid† | ||||||||||||
Portfolio | 2011 | 2012 | 2013 | |||||||||
Multimanager Aggressive Equity | $ | 1,393,977 | $ | 1,120,988 | $ | |||||||
Multimanager Core Bond | $ | 273,065 | $ | 81,416 | $ | |||||||
Multimanager Mid Cap Growth | $ | 550,220 | $ | 413,504 | $ | |||||||
Multimanager Mid Cap Value | $ | 785,314 | $ | 443,304 | $ | |||||||
Multimanager Technology | $ | 918,139 | $ | 724,898 | $ | |||||||
| † | Brokerage commissions may vary significantly from year to year due to a variety of factors, including the type of investments selected by the Adviser(s), investment strategy changes, the appointment of a new or additional Adviser, changes in transaction costs and market conditions. |
Brokerage Transactions with Affiliates
To the extent permitted by law and in accordance with procedures established by the Trust’s Board, the Trust may engage in brokerage transactions with brokers that are affiliates of the Manager or its affiliates, including Sanford C. Bernstein & Co., LLC (“Bernstein”), Advisers, brokers who are affiliates of such Advisers, or unaffiliated brokers who trade or clear through affiliates of the Manager or the Advisers. The 1940 Act generally prohibits the Trust from engaging in principal securities transactions with brokers that are affiliates of the Manager or Advisers or their respective affiliates, unless pursuant to an exemption from the SEC. The Trust relies on exemptive relief from the SEC that permits a portion of a Portfolio that has multiple portions advised by different Advisers and/or the Manager to engage in principal and brokerage transactions with an Adviser (or an affiliate of that Adviser) to another portion of the same Portfolio, subject to certain conditions. The Trust has adopted procedures, prescribed by the 1940 Act and the rules thereunder, which are reasonably designed to provide that any commissions or other remuneration it pays to brokers that are affiliates of the Manager and brokers that are affiliates of an Adviser to a Portfolio for which that Adviser provides investment advice do not exceed the usual and
78
customary broker’s commission. In addition, the Trust will adhere to the requirements under the 1934 Act governing floor trading. Also, under applicable securities law, the Trust will limit purchases of securities in a public offering, if such securities are underwritten by brokers that are affiliates of the Manager or Advisers or their respective affiliates.
During the years ended December 31, 2011, 2012 and 2013, respectively, the following Portfolios paid the amounts indicated to affiliated broker-dealers of the Manager and the Distributor, or affiliates of the Advisers to each Portfolio.
CALENDAR YEAR ENDED DECEMBER 31, 2011
Portfolio | Affiliated Broker-Dealer | Aggregate Brokerage Commissions Paid† | Percentage of Total Brokerage Commissions | Percentage of Transactions (Based On Dollar Amounts) | ||||||||||
Multimanager Aggressive Equity | Sanford Bernstein & Co | $ | 5,372 | 0.39% | 0.07% | |||||||||
Multimanager Mid Cap Growth | Sanford Bernstein & Co | $ | 948 | 0.17% | 0.08% | |||||||||
Multimanager Technology | Sanford Bernstein & Co | $ | 572 | 0.06% | 0.00% | |||||||||
| BNP Paribas | $ | 151 | 0.02% | 0.00% | ||||||||||
| † | Brokerage commissions may vary significantly from year to year due to a variety of factors, including the type of investments selected by the Adviser(s), investment strategy changes, the appointment of a new or additional Advisers, changes in transaction costs and market conditions. |
CALENDAR YEAR ENDED DECEMBER 31, 2012
Portfolio | Affiliated Broker-Dealer | Aggregate Brokerage Commissions Paid† | Percentage of Total Brokerage Commissions | Percentage of Transactions (Based On Dollar Amounts) | ||||||||||
Multimanager Aggressive Equity | Sanford Bernstein & Co | $ | 2,077 | 0.19% | 0.04% | |||||||||
Multimanager Mid Cap Growth | Sanford Bernstein & Co | $ | 1,192 | 0.29% | 0.13% | |||||||||
Multimanager Mid Cap Value | Sanford Bernstein & Co | $ | 1,119 | 0.25% | 0.07% | |||||||||
Multimanager Technology | Sanford Bernstein & Co | $ | 113 | 0.02% | 0.00% | |||||||||
| † | Brokerage commissions may vary significantly from year to year due to a variety of factors, including the type of investments selected by the Adviser(s), investment strategy changes, the appointment of a new or additional Advisers, changes in transaction costs and market conditions. |
CALENDAR YEAR ENDED DECEMBER 31, 2013
Portfolio | Affiliated Broker-Dealer | Aggregate Brokerage Commissions Paid † | Percentage of Total Brokerage Commissions | Percentage of Transactions (Based On Dollar Amounts) | ||||||||||
Multimanager Aggressive Equity | $ | % | % | |||||||||||
Multimanager Core Bond | $ | % | % | |||||||||||
Multimanager Mid Cap Growth | $ | % | % | |||||||||||
Multimanager Mid Cap Value | $ | % | % | |||||||||||
Multimanager Technology | $ | % | % | |||||||||||
| † | Brokerage commissions may vary significantly from year to year due to a variety of factors, including the type of investments selected by the Adviser(s), investment strategy changes, the appointment of a new or additional Advisers, changes in transaction costs and market conditions. |
79
Brokerage Transactions Relating to Research Services
For the fiscal year ended December 31, 2013, the following Portfolios of the Trust directed the following amount of portfolio transactions to broker-dealers that provided research services, for which the Portfolios paid the brokerage commissions indicated:
Portfolio | Transaction | Related Brokerage Commissions Paid | ||||||
Multimanager Aggressive Equity | $ | $ | ||||||
Multimanager Core Bond | $ | $ | ||||||
Multimanager Mid Cap Growth | $ | $ | ||||||
Multimanager Mid Cap Value | $ | $ | ||||||
Multimanager Technology | $ | $ | ||||||
Investments in Regular Broker-Dealers
As of December 31, 2013, the following Portfolios owned securities issued by their regular brokers or dealers (or by their parents) as follows:
Portfolio | Broker or Dealer | Type of Security† | Value (000) | |||||
Multimanager Aggressive Equity | $ | |||||||
Multimanager Core Bond | $ | |||||||
Multimanager Mid Cap Growth | $ | |||||||
Multimanager Mid Cap Value | $ | |||||||
Multimanager Technology | $ | |||||||
| † | D = Debt, E = Equity |
PROXY VOTING POLICIES AND PROCEDURES
Pursuant to the Trust’s Proxy Voting Policies and Procedures, the Trust has delegated the proxy voting responsibilities with respect to each Portfolio to the Manager as its investment manager. Because the Manager views proxy voting as a function that is incidental and integral to portfolio management, it has in turn delegated the proxy voting responsibilities with respect to each Portfolio to the applicable Advisers. The primary focus of the Trust’s proxy voting procedures as they relate to the sub-advised Portfolios, therefore, is to seek to ensure that the Advisers have adequate proxy voting policies and procedures in place and to monitor each Adviser’s proxy voting. A description of the proxy voting policies and procedures that each Adviser uses to determine how to vote proxies relating to the Portfolio’s portfolio securities are included in Appendix D to this SAI. With respect to the ETF allocated portion of the Multimanager Technology Portfolio, to the extent a proxy proposal is presented with respect to an Underlying ETF, whether or not the proposal would present an issue as to which FMG LLC, the Distributor or their affiliates could be deemed to have a conflict of interest, FMG LLC will vote shares held by the ETF allocated portion of the Multimanager Technology Portfolio it manages either for or against approval of the proposal, or as an abstention, in the same proportion as the shares for which the Underlying ETF’s other shareholders have voted. Information regarding how the Portfolios voted proxies relating to portfolio securities during the most recent 12-month period ended June 30 is available (1) on the Trust’s website at http://www.axa-equitablefunds.com (go to “EQ Advisors Trust Portfolios” or “AXA Premier VIP Trust Portfolios” (for the Multimanager Portfolios proxy voting record for the 12-month period ended June 30, 2013) and click on “Proxy Voting Records”) and (2) on the SEC’s website at http://www.sec.gov.
80
PURCHASE AND PRICING OF SHARES
The Trust will offer and sell its shares for cash or securities based on each Portfolio’s net asset value per share, which will be determined in the manner set forth below. Shares of a Portfolio will be issued to a shareholder upon receipt of consideration.
The net asset value of the shares of each class of each Portfolio will be determined once daily, immediately after the declaration of dividends, if any, at the close of business on each business day as defined below. The net asset value per share of each class of a Portfolio will be computed by dividing the sum of the investments held by that Portfolio applicable to that class plus any cash or other assets, minus all liabilities, by the total number of outstanding shares of that class of the Portfolio at such time. All expenses borne by the Trust and each of its classes will be accrued daily.
The net asset value per share of each Portfolio will be determined and computed as follows, in accordance with generally accepted accounting principles and consistent with the 1940 Act:
| • | The assets belonging to each Portfolio will include (i) all consideration received by the Trust for the issue or sale of shares of that particular Portfolio, together with all assets in which such consideration is invested or reinvested, (ii) all income, earnings, profits, and proceeds thereof, including any proceeds derived from the sale, exchange or liquidation of such assets, (iii) any funds or payments derived from any reinvestment of such proceeds in whatever form the same may be, and (iv) “General Items,” if any, allocated to that Portfolio. “General Items” include any assets, income, earnings, profits, and proceeds thereof, funds, or payments which are not readily identifiable as belonging to any particular Portfolio. General Items will be allocated as the Trust’s Board considers fair and equitable. |
| • | The liabilities belonging to each Portfolio will include (i) the liabilities of the Trust in respect of that Portfolio, (ii) all expenses, costs, charges and reserves attributable to that Portfolio, and (iii) any general liabilities, expenses, costs, charges or reserves of the Trust which are not readily identifiable as belonging to any particular Portfolio which have been allocated as the Trust’s Board considers fair and equitable. |
The value of each Portfolio will be determined at the close of business on each “business day.” Normally, this would be at the close of regular trading on the New York Stock Exchange (“NYSE”) on days the NYSE is open for trading. This is normally 4:00 p.m. Eastern Time. The NYSE is closed on New Year’s Day (observed), Martin Luther King, Jr. Day, Washington’s Birthday (observed), Good Friday, Memorial Day, Independence Day, Labor Day, Thanksgiving Day and Christmas.
Values are determined according to accepted accounting practices and all laws and regulations that apply. The assets of each Portfolio and Underlying Portfolio, are valued as follows:
| • | Stocks listed on national securities exchanges (including securities issued by ETFs) are valued at the last sale price or official closing price, or, if there is no sale or official closing price, at the latest available bid price. Securities listed on the Nasdaq Stock Market will be valued using the Nasdaq Official Closing Price (“NOCP”). Generally, the NOCP will be the last sale price unless the reported trade for the security is outside the range of the bid/ask price. In such cases, the NOCP will be normalized to the nearer of the bid or ask price. Other unlisted stocks are valued at their last sale price or official closing price or, if there is no reported sale during the day or official closing price, at a bid price estimated by a broker. |
| • | Foreign securities not traded directly, or in ADRs or similar form, in the U.S. are valued at most recent sales or bid price from the primary exchange in the currency of the country of origin. Foreign currency is converted into U.S. dollar equivalent at current exchange rates. Because foreign securities sometimes trade on days when a Portfolio’s shares are not priced, the value of the Portfolio’s investment that includes such securities may change on days when shares of the Portfolio cannot be purchased or redeemed. |
81
| • | U.S. Treasury securities and other obligations issued or guaranteed by the U.S. Government, its agencies or instrumentalities, are valued at representative quoted prices. |
| • | Corporate bonds and notes may be valued on the basis of prices provided by a pricing service when such prices are believed to reflect the fair market value of such securities. The prices provided by a pricing service take into account many factors, including institutional size, trading in similar groups of securities and any developments related to specific securities. However, when such prices are not available, such bonds and notes are valued at a bid price estimated by a broker. |
| • | Convertible preferred stocks listed on national securities exchanges or included on the Nasdaq Stock Market are valued as of their last sale price or, if there is no sale, at the latest available bid price. |
| • | Convertible bonds, and unlisted convertible preferred stocks, are valued at prices obtained from a pricing service for such instruments or, if a pricing service price is not available, at bid prices obtained from one or more of the major dealers in such bonds or stocks. Where there is a discrepancy between dealers, values may be adjusted based on recent premium spreads to the underlying common stocks. Convertible bonds may be matrix-priced based upon the conversion value to the underlying common stocks and market premiums. |
| • | Mortgage-backed and asset-backed securities are valued at prices obtained from a bond pricing service where available, or at a bid price obtained from one or more of the major dealers in such securities. If a quoted price is unavailable, an equivalent yield or yield spread quotes will be obtained from a broker and converted to a price. |
| • | Exchange traded options are valued at their last sales price or, if not available, previous day’s sales price. If the bid price is higher or the asked price is lower than the last sale price, the higher bid or lower asked price may be used. Options not traded on an exchange or actively traded are valued according to fair value methods. The market value of a put or call option will usually reflect, among other factors, the market price of the underlying security. |
| • | Futures contracts are valued at their last settlement price or, if there is no sale, at the latest available bid price. |
| • | Forward foreign exchange contracts are valued by interpolating between the forward and spot currency rates as quoted by a pricing service as of a designated hour on the valuation date. |
| • | Shares of open end mutual funds (other than ETFs) will be valued at the net asset value of the shares of such funds as described in the funds’ prospectuses. |
| • | Securities and assets for which market quotations are not readily available or for which valuation cannot be provided are valued in good faith under the direction of the applicable Board. For example, a security whose trading has been halted during the trading day may be fair valued based on the available information at the time of the close of trading market. |
Events or circumstances affecting the values of portfolio securities that occur between the closing of their principal markets and the time the net asset value is determined, such as foreign securities trading on foreign exchanges that may close before the time the net asset value is determined, may be reflected in the Trust’s calculations of net asset values for each applicable Portfolio when the Trust deems that the event or circumstance would materially affect such Portfolio’s net asset value. Such events or circumstances may be company specific, such as an earning report, country or region specific, such as a natural disaster, or global in nature. Such events or circumstances also may include price movements in the U.S. securities markets.
The Trust’s Valuation Committee, which was established by the Board, determines the value of any of the Trust’s securities and assets for which market quotations are not readily available or for which valuation cannot otherwise be provided in accordance with procedures adopted by the Board. The effect of fair value pricing as described above is that securities may not be priced on the basis of quotations from the primary market in which they are traded, but rather may be priced by a fair valuation method
82
adopted by the Trust’s Board that relies on other available pricing inputs. As such, fair value pricing is based on subjective judgments and it is possible that the valuations reached may differ materially from the value realized on a sale. This policy is intended to assure that the Portfolio’s net asset value fairly reflects security values as of the time of pricing. Also, fair valuation of a Portfolio’s securities can serve to reduce arbitrage opportunities available to short-term traders, but there is no assurance that fair value pricing policies will prevent dilution of the Portfolio’s net asset value by those traders.
When the Trust writes a call option, an amount equal to the premium received by the Trust is included in the Trust’s financial statements as an asset and an equivalent liability. The amount of the liability is subsequently marked-to-market to reflect the current market value of the option written. When an option expires on its stipulated expiration date or the Trust enters into a closing purchase or sale transaction, the Trust realizes a gain (or loss) without regard to any unrealized gain or loss on the underlying security, and the liability related to such option is extinguished. When an option is exercised, the Trust realizes a gain or loss from the sale of the underlying security, and the proceeds of sale are increased by the premium originally received, or reduced by the price paid for the option.
The Manager may, from time to time, under the general supervision of the Board or the Trust’s valuation committee, utilize the services of one or more pricing services available in valuing the assets of the Trust. In addition, there may be occasions when a different pricing provider or methodology is used. The Manager will continuously monitor the performance of these services.
Redemptions In Kind
The Trust’s organizational documents provide that it may redeem its shares in kind. The Trust has elected, pursuant to Rule 18f-1 under the 1940 Act, to commit itself to pay in cash all requests for redemption by any shareholder of record, limited in amount with respect to each shareholder during any 90-day period to the lesser of: (i) $250,000; or (ii) 1% of the net asset value of the Trust at the beginning of such period. If shares are redeemed through a distribution of assets of the Trust, the recipient would incur brokerage commissions upon the sale of such securities.
Each Portfolio is treated for federal tax purposes as a separate corporation. The Trust intends that each Portfolio will continue to qualify each taxable year to be treated as a regulated investment company under Subchapter M of Chapter 1, Subtitle A, of the Code (“RIC”). By doing so, a Portfolio will be relieved of federal income tax on the part of its investment company taxable income (consisting generally of net investment income, the excess, if any, of net short-term capital gain over net long-term capital loss, and net gains and losses from certain foreign currency transactions, if any, all determined without regard to any deduction for dividends paid) and net capital gain (the excess of net long-term capital gain over net short-term capital loss) that it distributes to its shareholders. Such qualification does not involve supervision of management or investment practices or policies by any governmental agency or bureau.
To continue to qualify for treatment as a RIC, a Portfolio must distribute annually to its shareholders at least 90% of its investment company taxable income (“Distribution Requirement”) and must meet several additional requirements. With respect to each Portfolio, these requirements include the following: (1) the Portfolio must derive at least 90% of its gross income each taxable year from (a) dividends, interest, payments with respect to securities loans and gains (without regard to losses) from the sale or other disposition of securities or foreign currencies, or other income (including gains from options, futures or forward contracts) derived with respect to its business of investing in securities or those currencies, and (b) net income from an interest in a “qualified publicly traded partnership” (defined below) (“QPTP”) (“Income Requirement”); and (2) at the close of each quarter of the Portfolio’s taxable year, (a) at least 50% of the value of its total assets must be represented by cash and cash items, government securities, securities of other RICs (collectively, “Qualifying Assets”), and other securities, with these other securities limited, in respect of any one issuer, to an amount that does not
83
exceed 5% of the value of the Portfolio’s total assets and that does not represent more than 10% of the issuer’s outstanding voting securities (equity securities of QPTPs being considered voting securities for these purposes), and (b) not more than 25% of the value of its total assets may be invested in (i) the securities (other than government securities or securities of other RICs) of any one issuer, (ii) the securities (other than securities of other RICs) of two or more issuers the Portfolio controls that are determined to be engaged in the same, similar or related trades or businesses, or (iii) the securities of one or more QPTPs (collectively, “Subchapter M Diversification Requirements”). A QPTP is defined as a publicly traded partnership (generally, a partnership the interests in which are “traded on an established securities market” or are “readily tradable on a secondary market (or the substantial equivalent thereof)”) other than a partnership at least 90% of the gross income of which consists of dividends, interest, and other qualifying income for a RIC.
If a Portfolio failed to qualify for treatment as a RIC for any taxable year — either (1) by failing to satisfy the Distribution Requirement, even if it satisfied the Income and Subchapter M Diversification Requirements, or (2) by failing to satisfy the Income Requirement and/or either Subchapter M Diversification Requirement and was unable, or determined not to, avail itself of provisions enacted as part of the Regulated Investment Company Modernization Act of 2010 that enable a RIC to cure a failure to satisfy any of the Income and Subchapter M Diversification Requirements as long as the failure “is due to reasonable cause and not due to willful neglect” and the RIC pays a deductible tax calculated in accordance with those provisions and meets certain other requirements — (1) it would be taxed as an ordinary corporation on its taxable income for that year without being able to deduct the distributions it makes to its shareholders, (2) each insurance company separate account invested in the Portfolio would fail to satisfy the diversification requirements described in the following paragraphs, with the result that the Contracts supported by each such account would no longer be eligible for tax deferral, and (3) all distributions out of the Portfolio’s earnings and profits, including distributions of net capital gain, would be taxable to its shareholders as dividends (i.e., ordinary income, except that, for individual and certain other non-corporate shareholders, the part thereof that is “qualified dividend income” would be subject to federal income tax at the rates for net capital gain — a maximum of 15% for a single shareholder with taxable income not exceeding $400,000 ($450,000 for married shareholders filing jointly) and 20% for those non-corporate shareholders with taxable income exceeding those respective amounts); those dividends would be eligible for the dividends-received deduction available to corporations under certain circumstances. In addition, the Portfolio could be required to recognize unrealized gains, pay substantial taxes and interest and make substantial distributions before requalifying for RIC treatment.
Subchapter L of Chapter 1, Subtitle A, of the Code (“Subchapter L”) requires that each separate account in which Contract premiums are invested be “adequately diversified” (as described in the next paragraph). If a Portfolio satisfies certain requirements regarding the types of shareholders it has and the availability of its shares, which each Portfolio intends to continue to do, then such a separate account will be able to “look through” that Portfolio, and in effect treat a pro rata portion of the Portfolio’s assets as the account’s assets, for purposes of determining whether the account is diversified. Moreover, if an Underlying Portfolio (each of which is treated as a RIC) in which a Portfolio invests also satisfies those requirements, a separate account investing in that Portfolio will effectively treat a pro rata portion of the Underlying Portfolio’s assets as its own for those purposes. The same treatment will not apply, however, with respect to any ETF, including any Underlying ETF (even one that also is treated as a RIC) in which a Portfolio invests, which instead will be treated for those purposes as a single investment.
Because the Trust is used to fund Contracts, each Portfolio must meet the diversification requirements imposed by Subchapter L on insurance company separate accounts (which are in addition to the Subchapter M Diversification Requirements) or those Contracts will fail to qualify as life insurance policies or annuity contracts. In general, for a Portfolio to meet the diversification requirements of Subchapter L, Treasury regulations require that, except as permitted by the “safe harbor” described below, no more than 55% of the total value of its assets may be represented by any one investment, no more than 70% by any two investments, no more than 80% by any three investments and no more than 90% by any four investments. Generally, for these purposes, all securities of the same issuer are treated
84
as a single investment. Furthermore, the Code provides that each U.S. Government agency or instrumentality is treated as a separate issuer. Subchapter L provides, as a safe harbor, that a separate account will be treated as being adequately diversified if the Subchapter M Diversification Requirements are satisfied and no more than 55% of the value of the account’s total assets are Qualifying Assets. Compliance with the regulations is tested on the last day of each calendar year (which is each Portfolio’s taxable year) quarter. If a Portfolio has satisfied those requirements for the first quarter of its first taxable year, it will have a 30-day period after the end of each subsequent quarter in which to cure any non-compliance.
Many technical rules govern the computation of a Portfolio’s, Underlying Portfolio’s or Underlying ETF’s investment company taxable income (or income and deductions, in the case of an Underlying ETF that is not a grantor trust and not a RIC) and net capital gain. (As used in the balance of this “Taxation” section, the word “Portfolio” includes each Underlying Portfolio and each Underlying ETF that is treated as a RIC.) For example, dividends are generally treated as received on the ex-dividend date. Also, certain foreign currency losses and capital losses arising after October 31 of a given year may be treated as if they arise on the first day of the next taxable year.
A Portfolio that invests in foreign securities or currencies may be subject to foreign taxes that could reduce its investment performance.
Each Portfolio may invest in the stock of PFICs if that stock is a permissible investment. A PFIC is any foreign corporation (with certain exceptions) that, in general, meets either of the following tests: (1) at least 75% of its gross income each taxable year is passive or (2) an average of at least 50% of its assets produce, or are held for the production of, passive income. Under certain circumstances, a Portfolio will be subject to federal income tax on a portion of any “excess distribution” received on the stock of a PFIC or of any gain from disposition of that stock (collectively “PFIC income”), plus interest thereon, even if the Portfolio distributes the PFIC income as a dividend to its shareholders. The balance of the PFIC income will be included in the Portfolio’s investment company taxable income and, accordingly, will not be taxable to it to the extent it distributes that income to its shareholders.
If a Portfolio invests in a PFIC and elects to treat the PFIC as a “qualified electing fund” (“QEF”), then in lieu of the foregoing tax and interest obligation, the Portfolio will be required to include in income each year its pro rata share of the QEF’s annual ordinary earnings and net capital gain (which it may have to distribute to satisfy the Distribution Requirement), even if the QEF does not distribute those earnings and gain to the Portfolio. In most instances it will be very difficult, if not impossible, to make this election because of certain of its requirements.
Each Portfolio may elect to “mark to market” its stock in any PFIC. “Marking-to-market,” in this context, means including in gross income each taxable year (and treating as ordinary income) the excess, if any, of the fair market value of a PFIC’s stock over a Portfolio’s adjusted basis therein as of the end of that year. Pursuant to the election, a Portfolio also would be allowed to deduct (as an ordinary, not a capital, loss) the excess, if any, of its adjusted basis in PFIC stock over the fair value thereof as of the taxable year-end, but only to the extent of any net mark-to-market gains with respect to that stock the Portfolio included in income for prior taxable years under the election. A Portfolio’s adjusted basis in each PFIC’s stock with respect to which it has made this election will be adjusted to reflect the amounts of income included and deductions taken thereunder.
Certain Portfolios may acquire (1) zero coupon securities issued with original issue discount (OID), (2) payment-in-kind securities, and/or (3) TIPS, on which principal is adjusted based on changes in the Consumer Price Index. A Portfolio must include in its gross income the OID that accrues on OID securities, securities it receives as “interest” on payment-in-kind securities, and the amount of any principal increases on TIPS, during the taxable year, even if it receives no corresponding payment on them during the year. Because a Portfolio annually must distribute substantially all of its investment company taxable income, including any accrued OID and other non-cash income, to satisfy the Distribution Requirement, it might be required in a particular year to distribute as a dividend an amount
85
that is greater than the total amount of cash it actually receives. Those distributions would have to be made from a Portfolio’s cash assets or, if necessary, from the proceeds of sales of its portfolio securities. A Portfolio might realize capital gains or losses from those sales, which would increase or decrease its investment company taxable income and/or net capital gain.
Delaware Statutory Trust. The Trust is an entity of the type commonly known as a Delaware statutory trust. Although Delaware law statutorily limits the potential liabilities of a Delaware statutory trust’s shareholders to the same extent as it limits the potential liabilities of a Delaware corporation’s shareholders, shareholders of a Portfolio could, under certain conflicts of laws jurisprudence in various states, be held personally liable for the obligations of the Trust or a Portfolio. However, the trust instrument of the Trust disclaims shareholder liability for acts or obligations of the Trust or its series (the Portfolios) and requires that notice of such disclaimer be given in each written obligation made or issued by the trustees or by any officers or officer by or on behalf of the Trust, a series, the trustees or any of them in connection with the Trust. The trust instrument provides for indemnification from a Portfolio’s property for all losses and expenses of any Portfolio shareholder held personally liable for the obligations of the Portfolio. Thus, the risk of a shareholder’s incurring financial loss on account of shareholder liability is limited to circumstances in which a Portfolio itself would be unable to meet its obligations, a possibility that the Manager believes is remote and not material. Upon payment of any liability incurred by a shareholder solely by reason of being or having been a shareholder of a Portfolio, the shareholder paying such liability will be entitled to reimbursement from the general assets of the Portfolio. The Trustees intend to conduct the operations of the Portfolios in such a way as to avoid, as far as possible, ultimate liability of the shareholders for liabilities of the Portfolios.
Classes of Shares. The Multimanager Portfolios consist of Class IA shares, Class IB shares and Class K shares. A share of each class of a Portfolio represents an identical interest in that Portfolio’s investment portfolio and has the same rights, privileges and preferences. However, each class may differ with respect to sales charges, if any, distribution and/or service fees, if any, other expenses allocable exclusively to each class, voting rights on matters exclusively affecting that class, and its exchange privilege, if any. The different sales charges and other expenses applicable to the different classes of shares of the Portfolios will affect the performance of those classes. Each share of a Portfolio is entitled to participate equally in dividends, other distributions and the proceeds of any liquidation of that Portfolio. However, to the extent the expenses of the classes differ, dividends and liquidation proceeds on Class IA, Class IB and Class K shares will differ.
Voting Rights. Shareholders of each Portfolio are entitled to one vote for each full share held and fractional votes for fractional shares held. Voting rights are not cumulative and, as a result, the holders of more than 50% of all the shares of the portfolios of the Trust as a group may elect all of the Trustees of the Trust. The shares of each series of the Trust will be voted separately, except when an aggregate vote of all the series of the Trust is required by law. In accordance with current laws, it is anticipated that an insurance company issuing a Contract that participates in a Portfolio will request voting instructions from Contract owners and will vote shares or other voting interests in the insurance company’s separate account in proportion to the voting instructions received. The Board may, without shareholder approval unless such approval is required by applicable law, cause any one or more series or classes of the Trust to merge or consolidate with or into one or more other series or classes of the Trust, one or more other trusts, partnerships or corporations.
Shareholder Meetings. The Trust does not hold annual meetings. Shareholders of record of no less than two-thirds of the outstanding shares of the Trust may remove a Trustee through a declaration in writing or by vote cast in person or by proxy at a meeting called for that purpose. A meeting will be called to vote on the removal of a Trustee at the written request of holders of 10% of the outstanding shares of the Trust.
86
Class-Specific Expenses. Each Portfolio may determine to allocate certain of its expenses (in addition to service and distribution fees) to the specific classes of its shares to which those expenses are attributable.
Availability of Net Asset Values. Each business day, each Portfolio’s net asset value is transmitted electronically to shareholders (e.g. insurance companies, tax qualified-retirement plans and other eligible investors) and/or are available to shareholders upon request.
Additional Information. No Portfolio is sponsored, endorsed, sold or promoted by any third party involved in, or related to, compiling, computing or creating any index. No third party index provider makes any representation or warranty, express or implied, to the issuer or owners of any Portfolio or any other person or entity regarding the advisability of investing in investment companies generally or in any Portfolio particularly or the ability of any index to track corresponding stock market performance. Indexes are determined, composed and calculated by third parties without regard to any Portfolio or the issuer or owners of a Portfolio or any other person or entity. No third party index provider has any obligation to take the needs of the issuer or owners of any Portfolio or any other person or entity into consideration in determining, composing or calculating indexes. Further, no third party index provider has any obligation or liability to the issuer or owners of any Portfolio or any other person or entity in connection with the administration, marketing or offering of a Portfolio.
Third party index providers shall obtain information for inclusion in or for use in the calculation of indexes from sources that the third party index providers consider reliable, none of the third parties warrant or guarantee the originality, accuracy and/or the completeness of any index or any data included therein. None of the third party index providers make any warranty, express or implied, as to results to be obtained by the issuer of the Portfolios, owners of the Portfolios, or any other person or entity, from the use of any index or any data included therein. None of the third party index providers shall have any liability for any errors, omissions or interruptions of or in connection with any index or any data included therein. Further, none of the third party index providers make any express or implied warranties of any kind, and the third party index providers hereby expressly disclaim all warranties of merchantability and fitness for a particular purpose, with respect to each index and any data included therein. Without limiting any of the foregoing, in no event shall any of the third party index providers have any liability for any direct, indirect, special, punitive, consequential or any other damages (including lost profits) even if notified of the possibility of such damages.
Independent Registered Public Accounting Firm
[ ] serves as the Trust’s independent registered public accounting firm. [ ] is responsible for auditing the annual financial statements of the Trust.
Custodian
JPMorgan Chase Bank (“Chase”), 4 New York Plaza, Floor 15, New York, New York 10004-2413 serves as custodian of the Trust’s portfolio securities and other assets. Under the terms of the custody agreement between the Trust and Chase, Chase maintains cash, securities and other assets of the Portfolios. Chase is also required, upon the order of the Trust, to deliver securities held by Chase, and to make payments for securities purchased by the Trust. Chase has also entered into sub-custodian agreements with a number of foreign banks and clearing agencies, pursuant to which portfolio securities purchased outside the United States are maintained in the custody of these entities.
Transfer Agent
AXA Equitable serves as the transfer agent and dividend disbursing agent for the Trust. AXA Equitable receives no additional compensation for providing such services for the Trust.
87
Counsel
K&L Gates LLP, 1601 K Street, N.W., Washington, DC 20006-1600, serves as counsel to the Trust.
Bingham McCutchen LLP, One Federal Street, Boston, Massachusetts, 02110 serves as counsel to the Independent Trustees of the Trust.
The audited financial statements for the Multimanager Portfolios for the year ended December 31, 2013, including the financial highlights, appearing in AXA Premier VIP Trust’s Annual Report to Shareholders, filed electronically with the SEC on [ ], 2014 (File No. 811-10509), are incorporated by reference and made a part of this document.
88
EQ ADVISORS TRUST
INVESTMENT STRATEGIES SUMMARY
Portfolio | Asset- backed Securities | Bonds | Borrowings (emergencies, redemptions) | Borrowings (leveraging purposes) | Convertible Securities | Credit & Liquidity Enhancements | Floaters(A) | Inverse Floaters(A) | Brady Bonds(B) | Depositary Receipts(B) | Dollar Rolls | Equity Securities | Eurodollar & Yankee Dollar Obligations | Event- Linked Bonds | Foreign Currency Spot Trans. | Foreign Currency Forward Trans. | Foreign Currency Futures Trans.(A) | |||||||||||||||||||||||||||||||||||||||||||||||||||
Multimanager Aggressive Equity Portfolio | Y | Y | Y | Y | Y | Y | Y | Y | Y | Y | Y | Y | Y | Y | Y | Y | Y | |||||||||||||||||||||||||||||||||||||||||||||||||||
Multimanager Core Bond Portfolio | Y | Y | Y | Y | Y | Y | Y | Y | Y | Y | Y | Y | Y | Y | Y | Y | Y | |||||||||||||||||||||||||||||||||||||||||||||||||||
Multimanager Mid Cap Growth Portfolio | Y | Y | Y | Y | Y | Y | Y | Y | Y | Y | Y | Y | Y | Y | Y | Y | Y | |||||||||||||||||||||||||||||||||||||||||||||||||||
Multimanager Mid Cap Value Portfolio | Y | Y | Y | Y | Y | Y | Y | Y | Y | Y | Y | Y | Y | Y | Y | Y | Y | |||||||||||||||||||||||||||||||||||||||||||||||||||
Multimanager Technology Portfolio | Y | Y | Y | Y | Y | Y | Y | Y | Y | Y | Y | Y | Y | Y | Y | Y | Y | |||||||||||||||||||||||||||||||||||||||||||||||||||
A-1
EQ ADVISORS TRUST
INVESTMENT STRATEGIES SUMMARY (Continued)
Portfolio | Foreign Options (OTC) | Foreign Currency | Emerging Markets Securities | Forward Commitments when-Issued and Delayed Delivery Securities | Hybrid Instruments(A) | Illiquid Securities | Investment Company Securities | Exchange- Traded Funds (ETFs) | Investment Grade Securities | Below Inv. Grade Fixed Income | Loan Participations and Assignments | Mortgage Backed or Related(D) | Direct Mortgages | Municipal Securities | Security Futures Trans.(A) | Security Options Trans.(A) | ||||||||||||||||||||||||||||||||||||||||||||||||
| (Written, call options) | Foreign Securities | |||||||||||||||||||||||||||||||||||||||||||||||||||||||||||||||
Multimanager Aggressive Equity Portfolio | Y | Y | Y | Y | Y | Y | Y | Y | Y | Y | Y | Y | Y | Y | Y | Y | Y | |||||||||||||||||||||||||||||||||||||||||||||||
Multimanager Core Bond Portfolio | Y | Y | Y | Y | Y | Y | Y | Y | Y | Y | Y | Y | Y | Y | Y | Y | Y | |||||||||||||||||||||||||||||||||||||||||||||||
Multimanager Mid Cap Growth Portfolio | Y | Y | Y | Y | Y | Y | Y | Y | Y | Y | Y | Y | Y | Y | Y | Y | Y | |||||||||||||||||||||||||||||||||||||||||||||||
Multimanager Mid Cap Value Portfolio | Y | Y | Y | Y | Y | Y | Y | Y | Y | Y | Y | Y | Y | Y | Y | Y | Y | |||||||||||||||||||||||||||||||||||||||||||||||
Multimanager Technology Portfolio | Y | Y | Y | Y | Y | Y | Y | Y | Y | Y | Y | Y | Y | Y | Y | Y | Y | |||||||||||||||||||||||||||||||||||||||||||||||
A-2
EQ ADVISORS TRUST
INVESTMENT STRATEGIES SUMMARY (Continued)
Portfolio | Passive Foreign Inv. Comp. | Payment In-Kind Bonds | Preferred Stocks | Real Estate Investment Trusts | Repurchase Agreements | Reverse Repurchase Agreements | Securities Lending | Short Sales Against- the-box | Small Company Securities | Structured Notes(A) | Swap Trans.(A) | U.S. Gov’t Securities | Warrants | Zero Coupon Bonds | ||||||||||||||||||||||||||||||||||||||||||
Multimanager Aggressive Equity Portfolio | Y | Y | Y | Y | Y | Y | Y | Y | Y | Y | Y | Y | Y | Y | ||||||||||||||||||||||||||||||||||||||||||
Multimanager Core Bond Portfolio | Y | Y | Y | Y | Y | Y | Y | Y | Y | Y | Y | Y | Y | Y | ||||||||||||||||||||||||||||||||||||||||||
Multimanager Mid Cap Growth Portfolio | Y | Y | Y | Y | Y | Y | Y | Y | Y | Y | Y | Y | Y | Y | ||||||||||||||||||||||||||||||||||||||||||
Multimanager Mid Cap Value Portfolio | Y | Y | Y | Y | Y | Y | Y | Y | Y | Y | Y | Y | Y | Y | ||||||||||||||||||||||||||||||||||||||||||
Multimanager Technology Portfolio | Y | Y | Y | Y | Y | Y | Y | Y | Y | Y | Y | Y | Y | Y | ||||||||||||||||||||||||||||||||||||||||||
A-3
DESCRIPTION OF COMMERCIAL PAPER RATINGS
S&P’s ratings are as follows:
| • | A-1 is the highest rating and indicates that the obligor’s capacity to meet its financial commitment on the obligation is strong or, where the obligation is rated A-1+, extremely strong. |
| • | Issues or issuers rated A-2 are somewhat more susceptible to the adverse effects of changes in circumstances and economic conditions than obligations in higher rated categories; however, the obligor’s capacity to meet its financial commitment on the obligation is satisfactory. |
| • | Issues or issuers rated A-3 exhibit adequate protection parameters. Adverse economic conditions or changing circumstances are more likely to lead to a weakened capacity of the obligor to meet its financial commitment on the obligation. |
| • | Issues or issuers rated B are regarded as having significant speculative characteristics. The obligor of a B-rated short-term obligation currently has the capacity to meet its financial commitment on the obligation but faces major ongoing uncertainties which could lead to its inadequate capacity to meet its financial commitment on the obligation. Ratings of B-1, B-2 and B-3 are assigned to indicate finer distinctions within the “B” category, with an obligor of a B-1 obligation having the strongest capacity, and an obligor of a B-3 obligation having the weakest capacity, to meet its financial commitments over the short-term compared to other speculative-grade obligors. |
| • | Issues or issuers rated C are currently vulnerable to nonpayment. The obligor of a C-rated short-term obligation is dependent upon favorable business, financial and economic conditions to meet its financial commitment on the obligation. |
| • | The D rating is used when a short-term obligation is in payment default or upon the filing of a bankruptcy petition or the taking of similar action if payments on the obligation are jeopardized. |
Moody’s ratings are as follows:
| • | The rating Prime-1 (P-1) is the highest commercial paper rating assigned by Moody’s. Issues or issuers rated Prime-1 have a superior ability to repay short-term obligations. |
| • | Issues or issuers rated Prime-2 (P-2) have a strong ability to repay short-term obligations. |
| • | Issues or issuers rated Prime-3 (P-3) have an acceptable ability to repay short-term obligations. |
| • | Issues or issuers rated Not Prime (NP) do not fall within any of the above Prime rating categories. |
Fitch’s ratings are as follows:
| • | Issues or issuers rated F1 exhibit the highest short-term credit quality and strongest intrinsic capacity for timely payment of financial commitments. Issues or issuers with any exceptionally strong credit feature may be rated F1+. |
| • | Issues or issuers rated F2 exhibit good short-term credit quality and good intrinsic capacity for timely payment of financial commitments. |
| • | Issues or issuers rated F3 exhibit fair short-term credit quality and an adequate intrinsic capacity for timely payment of financial commitments. |
| • | Issues or issuers rated B exhibit speculative short-term credit quality with a minimal capacity for timely repayment of financial commitments, plus a heightened vulnerability to near-term adverse changes in financial and economic conditions. |
B-1
| • | Issues or issuers rated C exhibit high short-term default risk, and default is a real possibility. |
| • | RD applies to entities only and indicates that the entity has defaulted on one or more of its financial commitments, although it continues to meet other financial obligations. |
| • | D indicates a broad-based default event for an entity or the default of a specific short-term obligation. |
DESCRIPTION OF BOND RATINGS
Bonds are considered to be “investment grade” if they are in one of the top four ratings.
S&P’s ratings are as follows:
| • | Bonds rated AAA have the highest rating assigned by S&P’s. The obligor’s capacity to meet its financial commitment on the obligation is extremely strong. |
| • | The obligor of a bond rated AA has a very strong capacity to meet its financial commitment on the obligation. |
| • | The obligor of a bond rated A has a strong capacity to meet its financial commitment on the obligation. Bonds rated A are somewhat more susceptible to the adverse effects of changes in circumstances and economic conditions than bonds in higher rated categories. |
| • | Bonds rated BBB normally exhibit adequate protection parameters. However, adverse economic conditions or changing circumstances are more likely to lead to a weakened capacity of the obligor to meet its financial commitment on the obligation. |
| • | Bonds rated BB, B, CCC, CC or C are regarded as having significant speculative characteristics. ‘B’ indicates the least degree of speculation and ‘C’ the highest. While such bonds will likely have some quality and protective characteristics, these may be outweighed by large uncertainties or major risk exposures to adverse conditions. |
| • | Bonds rated D are in payment default. This rating is also used upon the filing of a bankruptcy petition or the taking of similar action if debt payments are jeopardized. |
The ratings from AA to CCC may be modified by the addition of a plus (+) or minus (-) sign to show relative standing within the major rating categories.
Moody’s ratings are as follows:
| • | Bonds which are rated Aaa are judged to be of the best quality, with minimal credit risk. |
| • | Bonds which are rated Aa are judged to be of high quality and are subject to very low credit risk. |
| • | Bonds which are rated A are to be considered as upper medium grade obligations and are subject to low credit risk. |
| • | Bonds which are rated Baa are considered as medium grade obligations, are subject to moderate credit risk and may possess certain speculative characteristics. |
| • | Bonds which are rated Ba are judged to have speculative elements and are subject to substantial credit risk. |
| • | Bonds which are rated B are considered speculative and subject to high credit risk. |
| • | Bonds which are rated Caa are of poor standing and are subject to very high credit risk. |
| • | Bonds which are rated Ca represent obligations which are highly speculative. Such issues are likely in, or very near, default, with some prospect of recovery of principal and interest. |
| • | Bonds which are rated C are the lowest class of bonds and are typically in default, with little prospect for recovery of principal or interest. |
B-2
Moody’s applies modifiers to each rating classification from Aa through Caa to indicate relative ranking within its rating categories. The modifier “1” indicates that a security ranks in the higher end of its rating category, the modifier “2” indicates a mid-range ranking and the modifier “3” indicates that the issue ranks in the lower end of its rating category.
Fitch ratings are as follows:
| • | AAA — This is the highest rating assigned by Fitch, denoting the lowest expectation of default risk relative to other issues or issuers. This rating is assigned only to issues or issuers with an exceptionally strong capacity for payment of financial commitments that is highly unlikely to be adversely affected by foreseeable events. |
| • | AA — This rating is assigned to issues or issuers that present very low default risk and have a very strong capacity for payment of financial commitments that is not significantly vulnerable to foreseeable events. |
| • | A — This rating is assigned to issues or issuers that present a low default risk and have a strong capacity for payment of financial commitments; however, this capacity may be more vulnerable to adverse business or economic conditions than higher rated issues or issuers. |
| • | BBB — This rating indicates expectations of default risk are currently low. Issues or issuers assigned this rating have an adequate capacity for payment of financial commitments; however, adverse business or economic conditions are more likely to impair this capacity. |
| • | BB — This rating indicates an elevated vulnerability to default risk, particularly in the event of adverse changes in business or economic conditions over time. |
| • | B — This rating indicates a material default risk is present but a limited margin of safety remains. Financial commitments are being met but the capacity for continued payment is vulnerable to deterioration in the business and economic environment. |
| • | CCC — This rating is assigned to issues or issuers with a substantial credit risk, and default is a real possibility. |
| • | CC — This rating is assigned to issues or issuers with very high levels of credit risk, and default of some kind appears probable. |
| • | C — This rating is assigned to issues or issuers with exceptionally high levels of credit risk, and default is imminent or inevitable, or the issuer is in standstill. |
| • | RD — This rating indicates that, in Fitch’s opinion, an issuer has experienced an uncured default but has not entered into bankruptcy filings, administration, receivership, liquidation or other formal winding-up procedure, and has not otherwise ceased business. |
| • | D — This rating indicates that, in Fitch’s opinion, an issuer has entered into bankruptcy filings, administration, receivership, liquidation or other formal winding-up procedure, or has otherwise ceased business. |
PLUS (+) or MINUS (-) — The ratings above may be modified by the addition of a plus or minus sign to show relative standing within the major categories.
B-3
[TO BE UPDATED BY AMENDMENT]
EQ ADVISORS TRUST
PORTFOLIO MANAGER INFORMATION
| Portfolio Manager | Presented below for each portfolio manager is the number of other accounts of the Adviser managed by the portfolio manager and the total assets in the accounts managed within each category below as of December 31, 2013 | Presented below for each of the categories is the number of accounts and the total assets in the accounts with respect to which the advisory fee is based on the performance of the account | ||||||||||||||||||||||
| Registered Investment Companies | Other Pooled Investment Vehicles | Other Accounts | Registered Investment Companies | Other Pooled Investment Vehicles | Other Accounts | |||||||||||||||||||
| Number of Accounts | Total Assets | Number of Accounts | Total Assets | Number of Accounts | Total Assets | Number of Accounts | Total Assets | Number of Accounts | Total Assets | Number of Accounts | Total Assets | |||||||||||||
| Multimanager Aggressive Equity Portfolio | ||||||||||||||||||||||||
| Kenneth T. Kozlowski | ||||||||||||||||||||||||
| Alwi Chan | ||||||||||||||||||||||||
| Multimanager Core Bond Portfolio | ||||||||||||||||||||||||
| Kenneth T. Kozlowski | ||||||||||||||||||||||||
| Alwi Chan | ||||||||||||||||||||||||
| Multimanager Mid Cap Growth Portfolio | ||||||||||||||||||||||||
| Kenneth T. Kozlowski | ||||||||||||||||||||||||
| Alwi Chan | ||||||||||||||||||||||||
| Multimanager Mid Cap Value Portfolio | ||||||||||||||||||||||||
| Kenneth T. Kozlowski | ||||||||||||||||||||||||
| Alwi Chan | ||||||||||||||||||||||||
| Multimanager Technology Portfolio | ||||||||||||||||||||||||
| Kenneth T. Kozlowski | ||||||||||||||||||||||||
| Alwi Chan | ||||||||||||||||||||||||
| Xavier Poutas | ||||||||||||||||||||||||
Description of any Material Conflicts
Actual or potential conflicts of interest may arise when a portfolio manager has management responsibilities to more than one account, such as devotion of unequal time and attention to the management of the accounts, inability to allocate limited investment opportunities across a broad band of accounts and incentive to allocate opportunities to an account where the portfolio manager or Manager has a greater financial incentive, such as a performance fee account. The Manager has adopted policies and procedures reasonably designed to address these types of conflicts and that serve to operate in a manner that is fair and equitable among its clients, including the Funds. In addition, registered investment companies for which the Portfolio Managers serve as the portfolio manager are generally structured as a “fund of funds,” which invest in other registered investment companies for which the Manager serves as the investment manager and/or in registered investment companies that are exchange-traded funds (“ETFs”). Each Portfolio Manager also serves as a portfolio manager to allocated portions which invest in ETFs for certain portfolios that are not “fund of funds”. None of these portfolios or allocated portions is subject to an advisory fee that is based on the performance of the portfolio or allocated portion. Given the structure of these portfolios and allocated portions and the absence of performance-based advisory fee, as well as the lack of any impact of portfolio performance on individual portfolio manager’s compensation as further described below, each Portfolio Manager is not, as a general matter and in relation to these portfolios or allocated portions, subject to the potential conflicts of
C-1
interest that may arise in connection with his management of the Portfolios, on the one hand, and the other portfolios and allocated portions, on the other, such as material differences in the investment strategies or allocation of investment opportunities.
Compensation Information as of December 31, 2013
Because each Portfolio Manager serves as officer and employee of the Manager and their respective roles are not limited to serving as the portfolio manager of the Funds and other accounts they manage their compensation is based on the Manager’s compensation program as it applies to the firm’s officers in general. The Manager’s compensation program consists of a base salary, short-term incentive compensation and long-term incentive compensation. Individual jobs are defined based on scope, responsibility and market value and assigned to a specific level within the firm’s base salary structure. An individual’s base salary is then established within the range of such structure based on a combination of experience, skills, job content and performance and periodically evaluated based on survey data and market research. Annual short-term incentive compensation opportunities, granted in cash, are made available depending on whether firm-wide objectives were met during the year, as measured by various performance objectives such as underlying and adjusted earnings, expense management and sales. Once the target level of the short-term incentive compensation, granted in the form of stock options, restricted stocks, and/or performance units, is offered in a manner similar to the short-term incentive compensation and is based on the combination of firm-wide performance and individual performance. Annual longterm incentive compensation, granted in the form of stock options, restricted stocks and/or performance units, is offered in a manner similar to the short-term incentive compensation and is based on the combination of firm-wide performance and individual performance.
Ownership of Shares of the Portfolios as of December 31, 2013
| Portfolio Manager | None | $1-$10,000 | $10,001-$50,000 | $50,001-$100,000 | $100,001-$500,000 | $500,001-$1,000,000 | over $1,000,000 | |||||||
| Multimanager Aggressive Equity Portfolio | ||||||||||||||
| Kenneth Kozlowski | ||||||||||||||
| Alwi Chan | ||||||||||||||
| Multimanager Core Bond Portfolio | ||||||||||||||
| Kenneth Kozlowski | ||||||||||||||
| Alwi Chan | ||||||||||||||
| Multimanager Mid Cap Growth Portfolio | ||||||||||||||
| Kenneth Kozlowski | ||||||||||||||
| Alwi Chan | ||||||||||||||
| Multimanager Mid Cap Value Portfolio | ||||||||||||||
| Kenneth Kozlowski | ||||||||||||||
| Alwi Chan | ||||||||||||||
| Multimanager Technology Portfolio | ||||||||||||||
| Kenneth Kozlowski | ||||||||||||||
| Alwi Chan | ||||||||||||||
| Xavier Poutas | ||||||||||||||
C-2
EQ ADVISORS TRUST
PORTFOLIO MANAGER INFORMATION
| AllianceBernstein L.P. (“Adviser”) | ||||||||||||||||||||||||
| Portfolio Manager | Presented below for each portfolio manager is the number of other accounts of the Adviser managed by the portfolio manager and the total assets in the accounts managed within each category as of December 31, 2013 | Presented below for each of the categories is the number of accounts and the total assets in the accounts with respect to which the advisory fee is based on the performance of the account | ||||||||||||||||||||||
| Registered Investment Companies | Other Pooled Investment Vehicles | Other Accounts | Registered Investment Companies | Other Pooled Investment Vehicles | Other Accounts | |||||||||||||||||||
| Number of Accounts | Total Assets | Number of Accounts | Total Assets | Number of Accounts | Total Assets | Number of Accounts | Total Assets | Number of Accounts | Total Assets | Number of Accounts | Total Assets | |||||||||||||
| Multimanager Aggressive Equity Portfolio | ||||||||||||||||||||||||
| Judith DeVivo | ||||||||||||||||||||||||
| Multimanager Mid Cap Growth Portfolio | ||||||||||||||||||||||||
| Bruce Aronow | ||||||||||||||||||||||||
| N. Kumar Kirpalani | ||||||||||||||||||||||||
| Samantha S. Lau | ||||||||||||||||||||||||
| Wen-Tse Tseng | ||||||||||||||||||||||||
ALLIANCEBERNSTEIN L.P.
Description of any Material Conflicts
As an investment adviser and fiduciary, AllianceBernstein owes its clients and shareholders an undivided duty of loyalty. We recognize that conflicts of interest are inherent in our business and accordingly have developed policies and procedures (including oversight monitoring) reasonably designed to detect, manage and mitigate the effects of actual or potential conflicts of interest in the area of employee personal trading, managing multiple accounts for multiple clients, including AllianceBernstein Mutual Funds, and allocating investment opportunities. Investment professionals, including portfolio managers and research analysts, are subject to the above-mentioned policies and oversight monitoring to ensure that all clients are treated equitably. We place the interests of our clients first and expect all of our employees to meet their fiduciary duties.
Employee Personal Trading. AllianceBernstein has adopted a Code of Business Conduct and Ethics that is designed to detect and prevent conflicts of interest when investment professionals and other personnel of AllianceBernstein own, buy or sell securities which may be owned by, or bought or sold for, clients. Personal securities transactions by an employee may raise a potential conflict of interest when an employee owns or trades in a security that is owned or considered for purchase or sale by a client, or recommended for purchase or sale by an employee to a client. Subject to the reporting requirements and other limitations of its Code of Business Conduct and Ethics, AllianceBernstein permits its employees to engage in personal securities transactions. AllianceBernstein’s Code of Ethics and Business Conduct requires disclosure of all personal accounts and maintenance of brokerage accounts with designated broker-dealers approved by AllianceBernstein. The Code also requires preclearance of all securities transactions and imposes a 90 day holding period for securities purchased by employees to discourage short-term trading.
Managing Multiple Accounts for Multiple Clients. AllianceBernstein has compliance policies and oversight monitoring in place to address conflicts of interest relating to the management of multiple accounts for multiple clients. Conflicts of interest may arise when an investment professional has responsibilities for the investments of more than one account because the investment professional may be unable to devote equal time and attention to each account. The investment professional or investment professional teams for each client may have responsibilities for managing all or a portion of the investments of multiple accounts with a common investment strategy, including other registered
C-3
investment companies, unregistered investment vehicles, such as hedge funds, pension plans, separate accounts, collective trusts and charitable foundations. Among other things, AllianceBernstein’s policies and procedures provide for the prompt dissemination to investment professionals of initial or changed investment recommendations by analysts so that investment professionals are better able to develop investment strategies for all accounts they manage. In addition, investment decisions by investment professionals are reviewed for the purpose of maintaining uniformity among similar accounts and ensuring that accounts are treated equitably. No investment professional that manages client accounts carrying performance fees is compensated directly or specifically for the performance of those accounts. Investment professional compensation reflects a broad contribution in multiple dimensions to long-term investment success for our clients and is not tied specifically to the performance of any particular client’s account, nor is it directly tied to the level or change in the level of assets under management.
Allocating Investment Opportunities. AllianceBernstein has policies and procedures intended to address conflicts of interest relating to the allocation of investment opportunities. These policies and procedures are designed to ensure that information relevant to investment decisions is disseminated promptly within its portfolio management teams and investment opportunities are allocated equitably among different clients. The investment professionals at AllianceBernstein routinely are required to select and allocate investment opportunities among accounts. Portfolio holdings, position sizes, and industry and sector exposures tend to be similar across similar accounts, which minimizes the potential for conflicts of interest relating to the allocation of investment opportunities. Nevertheless, investment opportunities may be allocated differently among accounts due to the particular characteristics of an account, such as size of the account, cash position, tax status, risk tolerance and investment restrictions or for other reasons. AllianceBernstein’s procedures are also designed to prevent potential conflicts of interest that may arise when AllianceBernstein has a particular financial incentive, such as a performance-based management fee, relating to an account. An investment professional may perceive that he or she has an incentive to devote more time to developing and analyzing investment strategies and opportunities or allocating securities preferentially to accounts for which AllianceBernstein could share in investment gains. To address these conflicts of interest, AllianceBernstein’s policies and procedures require, among other things, the prompt dissemination to investment professionals of any initial or changed investment recommendations by analysts; the aggregation of orders to facilitate best execution for all accounts; price averaging for all aggregated orders; objective allocation for limited investment opportunities (e.g., on a rotational basis) to ensure fair and equitable allocation among accounts; and limitations on short sales of securities. These procedures also require documentation and review of justifications for any decisions to make investments only for select accounts or in a manner disproportionate to the size of the account.
Compensation Information as of December 31, 2013
AllianceBernstein’s compensation program for investment professionals is designed to be competitive and effective in order to attract and retain the highest caliber employees. The compensation program for investment professionals is designed to reflect their ability to generate long-term investment success for our clients. Investment professionals do not receive any direct compensation based upon the investment returns of any individual client account, nor is compensation tied directly to the level or change in the level of assets under management. Investment professionals’ annual compensation is comprised of the following:
| (i) | Fixed base salary: This is generally the smallest portion of compensation. The base salary is a relatively low, fixed salary within a similar range for all investment professionals. The base salary does not change significantly from year to year, and hence, is not particularly sensitive to performance. |
| (ii) | Discretionary incentive compensation in the form of an annual cash bonus: AllianceBernstein’s overall profitability determines the total amount of incentive compensation available to investment professionals. This portion of compensation is determined subjectively based on qualitative and quantitative factors. In evaluating this component of an investment professional’s compensation, |
C-4
| AllianceBernstein considers the contribution to his/her team or discipline as it relates to that team’s overall contribution to the long-term investment success, business results and strategy of AllianceBernstein. Quantitative factors considered include, among other things, relative investment performance (e.g., by comparison to competitor or peer group funds or similar styles of investments, and appropriate, broad-based or specific market indices), and consistency of performance. There are no specific formulas used to determine this part of an investment professional’s compensation and the compensation is not tied to any pre-determined or specified level of performance. AllianceBernstein also considers qualitative factors such as the complexity and risk of investment strategies involved in the style or type of assets managed by the investment professional; success of marketing/business development efforts and client servicing; seniority/length of service with the firm; management and supervisory responsibilities; and fulfillment of AllianceBernstein’s leadership criteria. |
| (iii) | Discretionary incentive compensation in the form of awards under AllianceBernstein’s Incentive Compensation Awards Plan (“deferred awards”): AllianceBernstein’s overall profitability determines the total amount of deferred awards available to investment professionals. The deferred awards are allocated among investment professionals based on criteria similar to those used to determine the annual cash bonus. Deferred awards, which are in the form of AllianceBernstein’s publicly traded units for which there are various investment options, vest over a four-year period and are generally forfeited if the employee resigns or AllianceBernstein terminates his/her employment.1 |
| (iv) | Contributions under AllianceBernstein’s Profit Sharing/401(k) Plan: The contributions are based on AllianceBernstein’s overall profitability. The amount and allocation of the contributions are determined at the sole discretion of AllianceBernstein. |
Ownership of Shares of the Portfolios as of December 31, 2013
| Portfolio Manager | None | $1- $10,000 | $10,001-$50,000 | $50,001-$100,000 | $100,001-$500,000 | $500,001- $1,00,000 | over $1,000,000 | |||||||
| Multimanager Aggressive Equity Portfolio | ||||||||||||||
| Judith DeVivo | ||||||||||||||
| Multimanager Mid Cap Growth Portfolio | ||||||||||||||
| Bruce Aronow | ||||||||||||||
| N. Kumar Kirpalani | ||||||||||||||
| Samantha S. Lau | ||||||||||||||
| Wen-Tse Tseng | ||||||||||||||
| 1 | Prior to 2002, investment professional compensation also included discretionary long-term incentive in the form of restricted grants of AllianceBernstein’s Master Limited Partnership Units. |
C-5
EQ ADVISORS TRUST
PORTFOLIO MANAGER INFORMATION
Multimanager Technology Portfolio (“Portfolio”) Allianz Global Investors U.S. LLC (“Adviser”) | ||||||||||||||||||||||||
| Portfolio Manager | Presented below for each portfolio manager is the number of other accounts of the Adviser managed by the portfolio manager and the total assets in the accounts managed within each category as of December 31, 2013 | Presented below for each of the categories is the number of accounts and the total assets in the accounts with respect to which the advisory fee is based on the performance of the account | ||||||||||||||||||||||
| Registered Investment Companies | Other Pooled Investment Vehicles | Other Accounts | Registered Investment Companies | Other Pooled Investment Vehicles | Other Accounts | |||||||||||||||||||
| Number of Accounts | Total Assets | Number of Accounts | Total Assets | Number of Accounts | Total Assets | Number of Accounts | Total assets | Number of Accounts | Total Assets | Number of Accounts | Total Assets | |||||||||||||
| Huachen Chen | ||||||||||||||||||||||||
| Walter C. Price | ||||||||||||||||||||||||
ALLIANZ GLOBAL INVESTORS U.S. LLC
Description of any Material Conflicts
Like other investment professionals with multiple clients, a portfolio manager for a Fund may face certain potential conflicts of interest in connection with managing both the Fund and other accounts at the same time. The paragraphs below describe some of these potential conflicts, which AGI U.S. believes are faced by investment professionals at most major financial firms.
AGI U.S. has adopted compliance policies and procedures that address certain of these potential conflicts. The management of accounts with different advisory fee rates and/or fee structures, including accounts that pay advisory fees based on account performance (“performance fee accounts”), may raise potential conflicts of interest by creating an incentive to favor higher-fee accounts. These potential conflicts may include, among others:
| • | The most attractive investments could be allocated to higher-fee accounts or performance fee accounts. |
| • | The trading of higher-fee accounts could be favored as to timing and/or execution price. For example, higher-fee accounts could be permitted to sell securities earlier than other accounts when a prompt sale is desirable or to buy securities at an earlier and more opportune time. |
| • | The investment management team could focus their time and efforts primarily on higher-fee accounts due to a personal stake in compensation. |
When AGI U.S. considers the purchase or sale of a security to be in the best interests of a Fund as well as other accounts, AGI U.S.’s trading desk may, to the extent permitted by applicable laws and regulations, aggregate the securities to be sold or purchased. Aggregation of trades may create the potential for unfairness to a Fund or another account if one account is favored over another in allocating the securities purchased or sold-for example, by allocating a disproportionate amount of a security that islikely to increase in value to a favored account. AGI U.S. considers many factors when allocating securities among accounts, including the account’s investment style, applicable investment restrictions, availability of securities, available cash and other current holdings. AGI U.S. attempts to allocate investment opportunities among accounts in a fair and equitable manner. However, accounts are not assured of participating equally or at all in particular investment allocations due to such factors as noted above. “Cross trades,” in which one AGI U.S. account sells a particular security to another account (potentially saving transaction costs for both accounts), may also pose a potential conflict of interest when cross trades are effected in a manner perceived to favor one client over another. For example, AGI U.S. may cross a trade between performance fee account and a fixed fee account that results in a benefit to the performance fee account and a detriment to the fixed fee account. AGI U.S. has adopted compliance procedures that provide that all cross trades are to be made at an independent current market price, as required by law.
C-6
Another potential conflict of interest may arise from the different investment objectives and strategies of a Fund and other accounts. For example, another account may have a shorter-term investment horizon or different investment objectives, policies or restrictions than a Fund. Depending on another account’s objectives or other factors, a portfolio manager may give advice and make decisions that may differ from advice given, or the timing or nature of decisions made, with respect to a Fund. In addition, investment decisions are subject to suitability for the particular account involved. Thus, a particular security may not be bought or sold for certain accounts even though it was bought or sold for other accounts at the same time. More rarely, a particular security may be bought for one or more accounts managed by a portfolio manager when one or more other accounts are selling the security (including short sales). There may be circumstances when purchases or sales of portfolio securities for one or more accounts may have an adverse effect on other accounts. AGI U.S. maintains trading policies designed to provide portfolio managers an opportunity to minimize the effect that short sales in one portfolio may have on holdings in other portfolios.
A portfolio manager who is responsible for managing multiple funds and/or accounts may devote unequal time and attention to the management of those funds and/or accounts. As a result, the portfolio manager may not be able to formulate as complete a strategy or identify equally attractive investment opportunities for each of those accounts as might be the case if he or she were to devote substantially more attention to the management of a single fund. The effects of this potential conflict may be more pronounced where funds and/or accounts overseen by a particular portfolio manager have different investment strategies.
A Fund’s portfolio manager(s) may be able to select or influence the selection of the broker/dealers that are used to execute securities transactions for the Fund. In addition to executing trades, some brokers and dealers provide AGI U.S. with brokerage and research services (as those terms are defined in Section 28(e) of the Securities Exchange Act of 1934), which may result in the payment of higher brokerage fees than might have otherwise be available. These services may be more beneficial to certain funds or accounts than to others. In order to be assured of continuing to receive services considered of value to its clients, AGI U.S. has adopted a brokerage allocation policy embodying the concepts of Section 28(e) of the Securities Exchange Act of 1934. Although the payment of brokerage commissions is subject to the requirement that the portfolio manager determine in good faith that the commissions are reasonable in relation to the value of the brokerage and research services provided to the Fund and the Adviser’s other clients, a portfolio manager’s decision as to the selection of brokers and dealers could yield disproportionate costs and benefits among the funds and/or accounts that he or she manages.
A Fund’s portfolio manager(s) may also face other potential conflicts of interest in managing a Fund, and the description above is not a complete description of every conflict that could be deemed to exist in managing both the Funds and other accounts. In addition, a Fund’s portfolio manager may also manage other accounts (including their personal assets or the assets of family members) in their personal capacity.
AGI U.S.’s investment personnel, including each Fund’s portfolio manager, are subject to restrictions on engaging in personal securities transactions pursuant to AGI U.S.’s Codes of Ethics, which contain provisions and requirements designed to identify and address conflicts of interest between personal investment activities and the interests of the Funds. The Code of Ethics is designed to ensure that the personal securities transactions, activities and interests of the employees of AGI U.S. will not interfere with (i) making decisions in the best interest of advisory clients (including the Funds) or (ii) implementing such decisions while, at the same time, allowing employees to invest for their own accounts.
Pallas Investment Partners, L.P. (“Pallas”) and Related Entities. Pallas is an investment adviser registered with the SEC. Pallas is owned by Walter Price. Mr. Price is dually employed by Pallas and by AGI U.S. Pallas serves as investment manager to two unregistered investment companies (the “Pallas Hedge Funds”) — Pallas Global Technology Hedge Fund, L.P. and Pallas Investments II, L.P., each a Delaware limited partnership. The general partner of Pallas Investments II, L.P. and Pallas Global Technology Hedge Fund, L.P. is Pallas Investments, LLC, a Delaware limited liability company (the “General Partner”).
C-7
Mr. Price owns a majority of the interests in the General Partner. AGI U.S. has the right to a minority percentage of the profits of Pallas that are derived from the Pallas Hedge Funds. AGI U.S. has a minority ownership interest in the General Partner.
Each of the Pallas Hedge Funds pays a management fee and an incentive fee (based on a percentage of profits) to either Pallas or the General Partner. The management fee is 1.25% for Pallas Investments II, L.P. and 1.50% for Pallas Global Technology Hedge Fund, L.P. Mr. Price acts as portfolio manager for certain AGI U.S. client accounts including, among others, the Multimanager Technology Fund.
AGI U.S. and Pallas share common employees, facilities, and systems. Pallas may act as investment adviser to one or more of AGI U.S.’s affiliates, and may serve as sub-adviser for accounts or clients for which AGI U.S. or one of its affiliates serves as investment manager or investment adviser. AGI U.S. also may provide other services, including but not limited to investment advisory services or administrative services, to Pallas.
AGI U.S., Pallas, and the Allianz Advisory Affiliates all engage in proprietary research and all acquire investment information and research services from broker-dealers. AGI U.S. and the Allianz Advisory Affiliates share such research and investment information.
In addition, trades entered into by Pallas on behalf of Pallas’ clients are executed through AGI U.S.’s equity trading desk, and trades by Pallas on behalf of Pallas’ clients (including the Pallas Hedge Funds) are aggregated with trades by AGI U.S. on behalf of AGI U.S.’s clients. All trades on behalf of Pallas’ clients that are executed through AGI U.S.’s equity trading desk will be executed pursuant to procedures designed to ensure that all clients of both AGI U.S. and Pallas (including the Pallas Hedge Funds) are treated fairly and equitably over time.
The General Partner and/or Pallas receive a participation in the profits of the Pallas Hedge Funds. Mr. Price also invested personally in one or more of the Pallas Hedge Funds. As a result, Mr. Price has a conflict of interest with respect to the management of the Pallas Hedge Funds and the other accounts that he manages, including the Multimanager Technology Fund, and he may have an incentive to favor the Pallas Hedge Funds over other accounts that he manages. AGI U.S. has adopted procedures reasonably designed to ensure that Mr. Price meets his fiduciary obligations to all clients for whom he acts as portfolio manager and treats all such clients fairly and equitably over time.
Compensation Information as of December 31, 2013
Investment professional compensation is designed to align with our client’s interests, attract, motivate and retain top talent, and encourage long-term stability. We aim to provide rewards for exceptional investment performance and to build an enduring firm with a long-term culture of shared success. In support of these objectives, our compensation program includes base salary, an annual cash bonus, and long-term incentive. For some investment teams, compensation is funded by team revenue adjusted by investment performance.
Base Salary. Investment professionals are provided a competitive base salary which reflects the scope and responsibilities of the position and experience level of the individual. Salaries are periodically evaluated against industry peers using market data provided by independent third-party compensation surveys. Salaries represent a larger percentage of total compensation for more junior positions; and for more senior positions is a smaller percentage and subject to less frequent adjustments. Typically, salary comprises 30%-50% of total compensation for junior portfolio managers and 10%-30% of total compensation for senior portfolio managers.
Annual Cash Bonus. Investment professionals are eligible for an annual, discretionary bonus. Bonuses are awarded based on achievement to set goals, investment performance, and individual contribution.Investment performance is measured relative to the relevant fund/strategy benchmark and/or peer group ranking through measurement periods that are trailing one, three, and five years, but vary by investment team and fund. The differences in measurement periods are not arbitrary, but are linked to the nature of the investment process, strategies, and investment turnover.
C-8
Long-Term Incentive. Allianz Global Investors’ long-term incentive program is designed to align compensation of key staff, managers, and executives with client success and longer-term company performance. Long-term incentive awards are granted annually under two plans. The first plan, the Allianz Global Investors Deferral Into Funds (“DIF”) allows participants to invest their award grant in Allianz Global Investor funds. The second plan, the Allianz Global Investors Long-Term Cash Bonus Plan “LTIPA”) provides participants the opportunity to earn award appreciation as determined by the earnings growth of Allianz Global Investors globally over a three-year period. Awards for both the DIF plan and LTIPA plan have a three-year vesting schedule and are paid in cash upon vesting.
The portion of individual incentive received as annual cash bonus versus long-term deferred incentive is standardized globally across Allianz Global Investors. Senior investment professionals receive a higher proportion of incentive compensation in long-term award. Typically, long-term incentive represents 10%-20% of junior portfolio manager total compensation while long-term incentive represents 25%- 35% of senior portfolio manager total compensation.
Ownership of Shares of the Portfolio as of December 31, 2013
| Portfolio Manager | None | $1- $10,000 | $10,001-$50,000 | $50,001-$100,000 | $100,001-$500,000 | $500,001- $1,00,000 | over $1,000,000 | |||||||
| Huachen Chen | ||||||||||||||
| Walter C. Price |
C-9
EQ ADVISORS TRUST
PORTFOLIO MANAGER INFORMATION
Multimanager Core Bond Portfolio (“Portfolio”) BlackRock Financial Management, Inc. (“Adviser”) | ||||||||||||||||||||||||
| Portfolio Manager | Presented below for each portfolio manager is the number of other accounts of the Adviser managed by the portfolio manager and the total assets in the accounts managed within each category as of December 31, 2013 | Presented below for each of the categories is the number of accounts and the total assets in the accounts with respect to which the advisory fee is based on the performance of the account | ||||||||||||||||||||||
| Registered Investment Companies | Other Pooled Investment Vehicles | Other Accounts | Registered Investment Companies | Other Pooled Investment Vehicles | Other Accounts | |||||||||||||||||||
| Number of Accounts | Total Assets | Number of Accounts | Total Assets | Number of Accounts | Total Assets | Number of Accounts | Total Assets | Number of Accounts | Total Assets | Number of Accounts | Total Assets | |||||||||||||
| Brian Weinstein | ||||||||||||||||||||||||
| Bob Miller | ||||||||||||||||||||||||
BLACKROCK FINANCIAL MANAGEMENT, INC.
Description of any Material Conflicts
BlackRock has built a professional working environment, firm-wide compliance culture and compliance procedures and systems designed to protect against potential incentives that may favor one account over another. BlackRock has adopted policies and procedures that address the allocation of investment opportunities, execution of portfolio transactions, personal trading by employees and other potential conflicts of interest that are designed to ensure that all client accounts are treated equitably over time. Nevertheless, BlackRock furnishes investment management and advisory services to numerous clients in addition to the Fund, and BlackRock may, consistent with applicable law, make investment recommendations to other clients or accounts (including accounts which are hedge funds or have performance or higher fees paid to BlackRock, or in which portfolio managers have a personal interest in the receipt of such fees), which may be the same as or different from those made to the Fund. In addition, BlackRock, its affiliates and significant shareholders and any officer, director, shareholder or employee may or may not have an interest in the securities whose purchase and sale BlackRock recommends to the Fund. BlackRock, or any of its affiliates or significant shareholders, or any officer, director, shareholder, employee or any member of their families may take different actions than those recommended to the Fund by BlackRock with respect to the same securities. Moreover, BlackRock may refrain from rendering any advice or services concerning securities of companies of which any of BlackRock’s (or its affiliates’ or significant shareholders’) officers, directors or employees are directors or officers, or companies as to which BlackRock or any of its affiliates or significant shareholders or the officers, directors and employees of any of them has any substantial economic interest or possesses material non-public information. Certain portfolio managers also may manage accounts whose investment strategies may at times be opposed to the strategy utilized for a fund. It should also be noted that Mr. Weinstein may be managing hedge fund and/or long only accounts, or may be part of a team managing hedge fund and/or long only accounts, subject to incentive fees. Mr. Weinstein may therefore be entitled to receive a portion of any incentive fees earned on such accounts.
As a fiduciary, BlackRock owes a duty of loyalty to its clients and must treat each client fairly. When BlackRock purchases or sells securities for more than one account, the trades must be allocated in a manner consistent with its fiduciary duties. BlackRock attempts to allocate investments in a fair and equitable manner among client accounts, with no account receiving preferential treatment. To this end, BlackRock has adopted policies that are intended to ensure reasonable efficiency in client transactions and provide BlackRock with sufficient flexibility to allocate investments in a manner that is consistent with the particular investment discipline and client base, as appropriate.
C-10
Compensation Information as of December 31, 2013
Portfolio Manager Compensation Overview
BlackRock’s financial arrangements with its portfolio managers, its competitive compensation and its career path emphasis at all levels reflect the value senior management places on key resources. Compensation may include a variety of components and may vary from year to year based on a number of factors. The principal components of compensation include a base salary, a performance-based discretionary bonus, participation in various benefits programs and one or more of the incentive compensation programs established by BlackRock. Base compensation. Generally, portfolio managers receive base compensation based on their position with the firm.
Discretionary Incentive Compensation.
Discretionary incentive compensation is a function of several components: the performance of BlackRock, Inc., the performance of the portfolio manager’s group within BlackRock, the investment performance, including risk-adjusted returns, of the firm’s assets under management or supervision by that portfolio manager relative to predetermined benchmarks, and the individual’s performance and contribution to the overall performance of these portfolios and BlackRock. In most cases, these benchmarks are the same as the benchmark or benchmarks against which the performance of the Fund or other accounts managed by the portfolio managers are measured. Among other things, BlackRock’s Chief Investment Officers make a subjective determination with respect to each portfolio manager’s compensation based on the performance of the Funds and other accounts managed by each portfolio manager relative to the various benchmarks. Performance of fixed income and multi-asset class funds is measured on a pre-tax and/or after-tax basis over various time periods including 1-, 3- and 5- year periods, as applicable. Performance of index funds is based on the performance of such funds relative to pre-determined tolerance bands around a benchmark, as applicable. With respect to these portfolio managers, such benchmarks for the Fund and other accounts are:
| Portfolio Managers | Funds Managed | Applicable Benchmarks | ||
Bob Miller Brian Weinstein | Multimanager Core Bond Portfolio | A combination of market-based indices (e.g., Barclays Capital U.S. Aggregate Bond Index), certain customized indices and certain fund industry peer groups. |
Distribution of Discretionary Incentive Compensation
Discretionary incentive compensation is distributed to portfolio managers in a combination of cash and BlackRock, Inc. restricted stock units which vest ratably over a number of years. For some portfolio managers, discretionary incentive compensation is also distributed in deferred cash awards that notionally track the returns of select BlackRock investment products they manage and that vest ratably over a number of years. The BlackRock, Inc. restricted stock units, upon vesting, will be settled in BlackRock, Inc. common stock. Typically, the cash portion of the discretionary incentive compensation, when combined with base salary, represents more than 60% of total compensation for the portfolio managers. Paying a portion of discretionary incentive compensation in BlackRock stock puts compensation earned by a portfolio manager for a given year “at risk” based on BlackRock’s ability to sustain and improve its performance over future periods. Providing a portion of discretionary incentive compensation in deferred cash awards that notionally track the BlackRock investment products they manage provides direct alignment with investment product results.
Long-Term Incentive Plan Awards — From time to time long-term incentive equity awards are granted to certain key employees to aid in retention, align their interests with long-term shareholder interests and motivate performance. Equity awards are generally granted in the form of BlackRock, Inc. restricted stock units that, once vested, settle in BlackRock, Inc. common stock. Messrs. Miller and Weinstein have each received long-term incentive awards.
C-11
Deferred Compensation Program — A portion of the compensation paid to eligible United States-based BlackRock employees may be voluntarily deferred at their election for defined periods of time into an account that tracks the performance of certain of the firm’s investment products. Any portfolio manager who is either a managing director or director at BlackRock is eligible to participate in the deferred compensation program.
Other compensation benefits. In addition to base compensation and discretionary incentive compensation, portfolio managers may be eligible to receive or participate in one or more of the following:
Incentive Savings Plans — BlackRock, Inc. has created a variety of incentive savings plans in which BlackRock employees are eligible to participate, including a 401(k) plan, the BlackRock Retirement Savings Plan (RSP), and the BlackRock Employee Stock Purchase Plan (ESPP). The employer contribution components of the RSP include a company match equal to 50% of the first 8% of eligible pay contributed to the plan capped at $5,000 per year, and a company retirement contribution equal to 3-5% of eligible compensation up to the IRS limit ($255,000 for 2013). The RSP offers a range of investment options, including registered investment companies and collective investment funds managed by the firm. BlackRock contributions follow the investment direction set by participants for their own contributions or, absent participant investment direction, are invested into a target date fund that corresponds to, or is closest to, the year in which the participant attains age 65. The ESPP allows for investment in BlackRock common stock at a 5% discount on the fair market value of the stock on the purchase date. Annual participation in the ESPP is limited to the purchase of 1,000 shares of common stock or a dollar value of $25,000 based on its fair market value on the Purchase Date. All of the eligible portfolio managers are eligible to participate in these plans.
Ownership of Shares of the Portfolio as of December 31, 2013
| Portfolio Manager | None | $1- $10,000 | $10,001-$50,000 | $50,001-$100,000 | $100,001-$500,000 | $500,001- $1,00,000 | over $1,000,000 | |||||||
| Brian Weinstein | ||||||||||||||
| Bob Miller |
C-12
EQ ADVISORS TRUST
PORTFOLIO MANAGER INFORMATION
| BlackRock Investment Management, LLC (“Adviser”) | ||||||||||||||||||||||||
| Portfolio Manager | Presented below for each portfolio manager is the number of other accounts of the Adviser managed by the portfolio manager and the total assets in the accounts managed within each category as of December 31, 2013 | Presented below for each of the categories is the number of accounts and the total assets in the accounts with respect to which the advisory fee is based on the performance of the account | ||||||||||||||||||||||
| Registered Investment Companies | Other Pooled Investment Vehicles | Other Accounts | Registered Investment Companies | Other Pooled Investment Vehicles | Other Accounts | |||||||||||||||||||
| Number of Accounts | Total Assets | Number of Accounts | Total Assets | Number of Accounts | Total Assets | Number of Accounts | Total Assets | Number of Accounts | Total Assets | Number of Accounts | Total Assets | |||||||||||||
| Multimanager Mid Cap Growth Portfolio | ||||||||||||||||||||||||
| Christopher Bliss | ||||||||||||||||||||||||
| Edward Corallo | ||||||||||||||||||||||||
| Greg Savage | ||||||||||||||||||||||||
| Multimanager Mid Cap Value Portfolio | ||||||||||||||||||||||||
| Christopher Bliss | ||||||||||||||||||||||||
| Edward Corallo | ||||||||||||||||||||||||
| Greg Savage | ||||||||||||||||||||||||
BLACKROCK INVESTMENT MANAGEMENT, LLC
Description of any Material Conflicts
BlackRock has built a professional working environment, firm-wide compliance culture and compliance
procedures and systems designed to protect against potential incentives that may favor one account over another. BlackRock has adopted policies and procedures that address the allocation of investment opportunities, execution of portfolio transactions, personal trading by employees and other potential conflicts of interest that are designed to ensure that all client accounts are treated equitably over time. Nevertheless, BlackRock furnishes investment management and advisory services to numerous clients in addition to the Fund, and BlackRock may, consistent with applicable law, make investment recommendations to other clients or accounts (including accounts which are hedge funds or have performance or higher fees paid to BlackRock, or in which portfolio managers have a personal interest in the receipt of such fees), which may be the same as or different from those made to the Fund. In addition, BlackRock, its affiliates and significant shareholders and any officer, director, shareholder or employee may or may not have an interest in the securities whose purchase and sale BlackRock recommends to the Fund. BlackRock, or any of its affiliates or significant shareholders, or any officer, director, shareholder, employee or any member of their families may take different actions than those recommended to the Fund by BlackRock with respect to the same securities. Moreover, BlackRock may refrain from rendering any advice or services concerning securities of companies of which any of BlackRock’s (or its affiliates’ or significant shareholders’) officers, directors or employees are directors or officers, or companies as to which BlackRock or any of its affiliates or significant shareholders or the officers, directors and employees of any of them has any substantial economic interest or possesses material non-public information. Certain portfolio managers also may manage accounts whose investment strategies may at times be opposed to the strategy utilized for a fund.
As a fiduciary, BlackRock owes a duty of loyalty to its clients and must treat each client fairly. When BlackRock purchases or sells securities for more than one account, the trades must be allocated in a manner consistent with its fiduciary duties. BlackRock attempts to allocate investments in a fair and equitable manner among client accounts, with no account receiving preferential treatment. To this end, BlackRock has adopted policies that are intended to ensure reasonable efficiency in client transactions and provide BlackRock with sufficient flexibility to allocate investments in a manner that is consistent with the particular investment discipline and client base, as appropriate.
C-13
Compensation Information as of December 31, 2013
Portfolio Manager Compensation Overview
BlackRock’s financial arrangements with its portfolio managers, its competitive compensation and its career path emphasis at all levels reflect the value senior management places on key resources. Compensation may include a variety of components and may vary from year to year based on a number of factors. The principal components of compensation include a base salary, a performance-based discretionary bonus, participation in various benefits programs and one or more of the incentive compensation programs established by BlackRock.
Base compensation. Generally, portfolio managers receive base compensation based on their position with the firm.
Discretionary Incentive Compensation.
Discretionary incentive compensation is a function of several components: the performance of BlackRock, Inc., the performance of the portfolio manager’s group within BlackRock, the investment performance, including risk-adjusted returns, of the firm’s assets under management or supervision by that portfolio manager relative to predetermined benchmarks, and the individual’s performance and contribution to the overall performance of these portfolios and BlackRock. In most cases, these benchmarks are the same as the benchmark or benchmarks against which the performance of the Fund or other accounts managed by the portfolio managers are measured. Among other things, BlackRock’s Chief Investment Officers make a subjective determination with respect to each portfolio manager’s compensation based on the performance of the Funds and other accounts managed by each portfolio manager relative to the various benchmarks. Performance of fixed income and multi-asset class funds is measured on a pre-tax and/or after-tax basis over various time periods including 1-, 3- and 5- year periods, as applicable. Performance of index funds is based on the performance of such funds relative to pre-determined tolerance bands around a benchmark, as applicable. With respect to these portfolio managers, such benchmarks for the Fund and other accounts are:
| Portfolio Managers | Funds Managed | Applicable Benchmarks | ||
| Ed Corallo | Multimanager Mid Cap Growth Portfolio, Multimanager Mid Cap Value Portfolio | This manager’s performance is not measured against a specific benchmark. | ||
| Christopher Bliss | Multimanager Mid Cap Growth Portfolio, Multimanager Mid Cap Value Portfolio | This manager’s performance is not measured against a specific benchmark. | ||
| Greg Savage | Multimanager Mid Cap Growth Portfolio, Multimanager Mid Cap Value Portfolio | This manager’s performance is not measured against a specific benchmark. |
Distribution of Discretionary Incentive Compensation
Discretionary incentive compensation is distributed to portfolio managers in a combination of cash and BlackRock, Inc. restricted stock units which vest ratably over a number of years. For some portfolio managers, discretionary incentive compensation is also distributed in deferred cash awards that notionally track the returns of select BlackRock investment products they manage and that vest ratably over a number of years. The BlackRock, Inc. restricted stock units, upon vesting, will be settled in BlackRock, Inc. common stock. Typically, the cash portion of the discretionary incentive compensation, when combined with base salary, represents more than 60% of total compensation for the portfolio managers. Paying a portion of discretionary incentive compensation in BlackRock stock puts compensation earned by a portfolio manager for a given year “at risk” based on BlackRock’s ability to sustain and improve its performance over future periods. Providing a portion of discretionary incentive compensation in deferred cash awards that notionally track the BlackRock investment products they manage provides direct alignment with investment product results.
Long-Term Incentive Plan Awards — From time to time long-term incentive equity awards are granted to certain key employees to aid in retention, align their interests with long-term shareholder interests
C-14
and motivate performance. Equity awards are generally granted in the form of BlackRock, Inc. restricted stock units that, once vested, settle in BlackRock, Inc. common stock. Messrs. Corallo, Bliss, and Savage have each received long-term incentive awards.
Deferred Compensation Program — A portion of the compensation paid to eligible United States-based BlackRock employees may be voluntarily deferred at their election for defined periods of time into an account that tracks the performance of certain of the firm’s investment products. Any portfolio manager who is either a managing director or director at BlackRock is eligible to participate in the deferred compensation program.
Other compensation benefits. In addition to base compensation and discretionary incentive compensation, portfolio managers may be eligible to receive or participate in one or more of the following:
Incentive Savings Plans — BlackRock, Inc. has created a variety of incentive savings plans in which BlackRock employees are eligible to participate, including a 401(k) plan, the BlackRock Retirement Savings Plan (RSP), and the BlackRock Employee Stock Purchase Plan (ESPP). The employer contribution components of the RSP include a company match equal to 50% of the first 8% of eligible pay contributed to the plan capped at $5,000 per year, and a company retirement contribution equal to 3-5% of eligible compensation up to the IRS limit ($255,000 for 2013). The RSP offers a range of investment options, including registered investment companies and collective investment funds managed by the firm. BlackRock contributions follow the investment direction set by participants for their own contributions or, absent participant investment direction, are invested into a target date fund that corresponds to, or is closest to, the year in which the participant attains age 65. The ESPP allows for investment in BlackRock common stock at a 5% discount on the fair market value of the stock on the purchase date. Annual participation in the ESPP is limited to the purchase of 1,000 shares of common stock or a dollar value of $25,000 based on its fair market value on the Purchase Date. All of the eligible portfolio managers are eligible to participate in these plans.
Ownership of Shares of the Portfolios as of December 31, 2013
| Portfolio Manager | None | $1- $10,000 | $10,001-$50,000 | $50,001-$100,000 | $100,001-$500,000 | $500,001- $1,00,000 | over $1,000,000 | |||||||
| Multimanager Mid Cap Growth Portfolio | ||||||||||||||
| Christopher Bliss | ||||||||||||||
| Edward Corallo | ||||||||||||||
| Greg Savage | ||||||||||||||
| Multimanager Mid Cap Value Portfolio | ||||||||||||||
| Christopher Bliss | ||||||||||||||
| Edward Corallo | ||||||||||||||
| Greg Savage | ||||||||||||||
C-15
EQ ADVISORS TRUST
PORTFOLIO MANAGER INFORMATION
Multimanager Aggressive Equity Portfolio (“Portfolio”) ClearBridge Investments, LLC (“Adviser”) | ||||||||||||||||||||||||
| Portfolio Manager | Presented below for each portfolio manager is the number of other accounts of the Adviser managed by the portfolio manager and the total assets in the accounts managed within each category as of December 31, 2013 | Presented below for each of the categories is the number of accounts and the total assets in the accounts with respect to which the advisory fee is based on the performance of the account | ||||||||||||||||||||||
| Registered Investment Companies | Other Pooled Investment Vehicles | Other Accounts | Registered Investment Companies | Other Pooled Investment Vehicles | Other Accounts | |||||||||||||||||||
| Number of Accounts | Total Assets | Number of Accounts | Total Assets | Number of Accounts | Total Assets | Number of Accounts | Total Assets | Number of Accounts | Total Assets | Number of Accounts | Total Assets | |||||||||||||
| Richard Freeman | ||||||||||||||||||||||||
| Evan Bauman | ||||||||||||||||||||||||
CLEARBRIDGE INVESTMENTS, LLC
Description of any Material Conflicts
Potential conflicts of interest may arise when a Fund’s portfolio manager has day-to-day management responsibilities with respect to one or more other funds or other accounts.
ClearBridge has adopted compliance policies and procedures that are designed to address various conflicts of interest that may arise for the investment adviser and the individuals that it employs. For example, ClearBridge seeks to minimize the effects of competing interests for the time and attention of portfolio managers by assigning portfolio managers to manage funds and accounts that share a similar investment style. ClearBridge has also adopted trade allocation procedures that are designed to facilitate the fair allocation of limited investment opportunities among multiple funds and accounts. There is no guarantee, however, that the policies and procedures adopted by ClearBridge and the fund(s) will be able to detect and/or prevent every situation in which an actual or potential conflict may appear.
These potential conflicts include:
Allocation of Limited Time and Attention. A portfolio manager who is responsible for managing multiple funds and/or accounts may devote unequal time and attention to the management of those funds and/or accounts. As a result, the portfolio manager may not be able to formulate as complete a strategy or identify equally attractive investment opportunities for each of those accounts as might be the case if he or she were to devote substantially more attention to the management of a single fund. The effects of this potential conflict may be more pronounced where funds and/or accounts overseen by a particular portfolio manager have different investment strategies.
Allocation of Limited Investment Opportunities. If a portfolio manager identifies a limited investment opportunity that may be suitable for multiple funds and/or accounts, the opportunity may be allocated among these several funds or accounts, which may limit a fund’s ability to take full advantage of the investment opportunity.
Pursuit of Differing Strategies. At times, a portfolio manager may determine that an investment opportunity may be appropriate for only some of the funds and/or accounts for which he or she exercises investment responsibility, or may decide that certain of the funds and/or accounts should take differing positions with respect to a particular security. In these cases, the portfolio manager may place separate transactions for one or more funds or accounts which may affect the market price of the security or the execution of the transaction, or both, to the detriment or benefit of one or more other funds and/or accounts.
C-16
Variation in Compensation. A conflict of interest may arise where the financial or other benefits available to the portfolio manager differ among the funds and/or accounts that he or she manages. If the structure of the investment adviser’s management fee and/or the portfolio manager’s compensation differs among funds and/or accounts (such as where certain funds or accounts pay higher management fees or performance-based management fees), the portfolio manager might be motivated to help certain funds and/or accounts over others. The portfolio manager might be motivated to favor funds and/or accounts in which he or she has an interest or in which the investment advisor and/or its affiliates have interests. Similarly, the desire to maintain or raise assets under management or to enhance the portfolio manager’s performance record or to derive other rewards, financial or otherwise, could influence the portfolio manager to lend preferential treatment to those funds and/or accounts that could most significantly benefit the portfolio manager.
Selection of Broker/Dealers. Portfolio managers may be able to select or influence the selection of the brokers and dealers that are used to execute securities transactions for the funds and/or accounts that they supervise. In addition to executing trades, some brokers and dealers provide brokerage and research services (as those terms are defined in Section 28(e) of the Securities Exchange Act of 1934), which may result in the payment of higher brokerage fees than might otherwise be available. These services may be more beneficial to certain funds or accounts than to others. Although the payment of brokerage commissions is subject to the requirement that the sub-adviser determines in good faith that the commissions are reasonable in relation to the value of the brokerage and research services provided to the fund, a decision as to the selection of brokers and dealers could yield disproportionate costs and benefits among the funds and/or accounts managed. For this reason, the sub-adviser has formed a brokerage committee that reviews, among other things, the allocation of brokerage to broker/dealers, best execution and soft dollar usage.
Related Business Opportunities. The investment adviser or its affiliates may provide more services (such as distribution or recordkeeping) for some types of funds or accounts than for others. In such cases, a portfolio manager may benefit, either directly or indirectly, by devoting disproportionate attention to the management of fund and/or accounts that provide greater overall returns to the investment manager and its affiliates.
Compensation Information as of December 31, 2013
ClearBridge’s portfolio managers participate in a competitive compensation program that is designed to attract and retain outstanding investment professionals and closely align the interests of its investment professionals with those of its clients and overall firm results. The total compensation program includes a significant incentive component that rewards high performance standards, integrity, and collaboration consistent with the firm’s values. Portfolio manager compensation is reviewed and modified each year as appropriate to reflect changes in the market and to ensure the continued alignment with the goals stated above. ClearBridge’s portfolio managers and other investment professionals receive a combination of base compensation and discretionary compensation, comprising a cash incentive award and deferred incentive plans described below.
Base salary compensation. Base salary is fixed and primarily determined based on market factors and the experience and responsibilities of the investment professional within the firm.
Discretionary compensation. In addition to base compensation managers may receive discretionary compensation.
Discretionary compensation can include:
| • | Cash Incentive Award |
| • | ClearBridge’s Deferred Incentive Plan (CDIP) — a mandatory program that typically defers 15% of discretionary year-end compensation into ClearBridge managed products. For portfolio |
C-17
managers, one-third of this deferral tracks the performance of their primary managed product, one-third tracks the performance of a composite portfolio of the firm’s new products and one third can be elected to track the performance of one or more of ClearBridge managed funds. Consequently, portfolio managers can have two-thirds of their CDIP award tracking the performance of their primary managed product. |
For centralized research analysts, two-thirds of their deferral is elected to track the performance of one of more of ClearBridge managed funds, while one-third tracks the performance of the new product composite.
ClearBridge then makes a company investment in the proprietary managed funds equal to the deferral amounts by fund. This investment is a company asset held on the balance sheet and paid out to the employees in shares subject to vesting requirements.
| • | Legg Mason Restricted Stock Deferral — a mandatory program that typically defers 5% of discretionary year-end compensation into Legg Mason restricted stock. The award is paid out to employees in shares subject to vesting requirements. |
| • | Legg Mason Restricted Stock and Stock Option Grants — a discretionary program that may be utilized as part of the total compensation program. These special grants reward and recognize significant contributions to our clients, shareholders and the firm and aid in retaining key talent. |
Several factors are considered by ClearBridge Senior Management when determining discretionary
compensation for portfolio managers. These include but are not limited to:
| • | Investment performance. A portfolio manager’s compensation is linked to the pre-tax investment performance of the fund/accounts managed by the portfolio manager. Investment performance is calculated for 1-, 3-, and 5-year periods measured against the applicable product benchmark (e.g., a securities index and, with respect to a fund, the benchmark set forth in the fund’s Prospectus) and relative to applicable industry peer groups. The greatest weight is generally placed on 3- and 5-year performance. |
| • | Appropriate risk positioning that is consistent with ClearBridge’s investment philosophy and the Investment Committee/CIO approach to generation of alpha; |
| • | Overall firm profitability and performance; |
| • | Amount and nature of assets managed by the portfolio manager; |
| • | Contributions for asset retention, gathering and client satisfaction; |
| • | Contribution to mentoring, coaching and/or supervising; |
| • | Contribution and communication of investment ideas in ClearBridge’s Investment Committee meetings and on a day to day basis; |
| • | Market compensation survey research by independent third parties |
Ownership of Shares of the Portfolio as of December 31, 2013
| Portfolio Manager | None | $1- $10,000 | $10,001-$50,000 | $50,001-$100,000 | $100,001-$500,000 | $500,001- $1,00,000 | over $1,000,000 | |||||||
| Richard Freeman | ||||||||||||||
| Evan Bauman |
C-18
EQ ADVISORS TRUST
PORTFOLIO MANAGER INFORMATION
Multimanager Mid Cap Value Portfolio (“Portfolio”) Diamond Hill Capital Management, Inc. (“Adviser”) | ||||||||||||||||||||||||
| Portfolio Manager | Presented below for each portfolio manager is the number of other accounts of the Adviser managed by the portfolio manager and the total assets in the accounts managed within each category as of December 31, 2013 | Presented below for each of the categories is the number of accounts and the total assets in the accounts with respect to which the advisory fee is based on the performance of the account | ||||||||||||||||||||||
| Registered Investment Companies | Other Pooled Investment Vehicles | Other Accounts | Registered Investment Companies | Other Pooled Investment Vehicles | Other Accounts | |||||||||||||||||||
| Number of Accounts | Total Assets | Number of Accounts | Total Assets | Number of Accounts | Total Assets | Number of Accounts | Total Assets | Number of Accounts | Total Assets | Number of Accounts | Total Assets | |||||||||||||
| Chris Bingaman | ||||||||||||||||||||||||
| Tom Schindler | ||||||||||||||||||||||||
| Chris Welch | ||||||||||||||||||||||||
DIAMOND HILL CAPITAL MANAGEMENT, INC.
[Description of any Material Conflicts]
Compensation Information as of December 31, 2013
All of the portfolio managers, and research analysts, are paid by the adviser a competitive base salary based on experience, external market comparisons to similar positions, and other business factors. To align their interests with those of shareholders, all portfolio managers also participate in an annual cash and equity incentive compensation program that is based on:
| • | The long-term pre-tax investment performance of the Fund(s) that they manage, |
| • | The Adviser’s assessment of the investment contribution they make to Funds they do not manage, |
| • | The Adviser’s assessment of each portfolio manager’s overall contribution to the development of the investment team through ongoing discussion, interaction, feedback and collaboration, and |
| • | The Adviser’s assessment of each portfolio manager’s contribution to client service, marketing to prospective clients and investment communication activities. |
Long-term performance is defined as the trailing five years (performance of less than five years is judged on a subjective basis). Investment performance is measured against an absolute return target for each Fund, the respective Fund’s benchmark and its Morningstar or Lipper peer group.
Incentive compensation is paid annually from an incentive pool that is determined by the compensation committee of the adviser’s parent firm, Diamond Hill Investment Group, Inc. The compensation committee, which is comprised of outside members of the board of directors, makes its determination as to the amount of the pool based on overall firm operating margins compared to similar firms. The portfolio managers are also eligible to participate in the Diamond Hill Investment Group, Inc. 401(k) plan and related company match.
Other Portfolio Manager Information
Each of the Portfolio Managers is also responsible for managing other account portfolios in addition to the respective Funds in which they manage. Management of other accounts in addition to the Funds can present certain conflicts of interest, including those associated with different fee structures and various trading practices. The Adviser has implemented specific policies and procedures to address any potential conflicts.
C-19
Performance Based Fees
Diamond Hill Capital Management, Inc. (“Adviser”) manages certain accounts, including private investment funds (a.k.a. “Hedge Funds”) for which part of its fee is based on the performance of the account/fund (“Performance Fee Accounts”). As a result of the performance based fee component, the Adviser may receive additional revenue related to the Performance Fee Accounts. None of the Portfolio Managers receive any direct incentive compensation related to their management of the Performance Fee Accounts; however, revenues from Performance Fee Accounts management will impact the resources available to compensate Portfolio Managers and all staff.
Trade Allocation
The Adviser manages numerous accounts in addition to the Funds. When a Fund and another of the Adviser’s clients seek to purchase or sell the same security at or about the same time, the Adviser may execute the transactions with the same broker on a combined or “blocked” basis. Blocked transactions can produce better execution for a Fund because of increased volume of the transaction. However, when another of the Adviser’s clients specifies that trades be executed with a specific broker (“Directed Brokerage Accounts”), a potential conflict of interest exists related to the order in which those trades are executed and allocated. As a result, the Adviser has adopted a trade allocation policy in which all trade orders occurring simultaneously among any of the Funds and one or more other discretionary accounts are blocked and executed first. After the blocked trades have been completed, the remaining trades for the Directed Brokerage Accounts are then executed.
Ownership of Shares of the Portfolio as of December 31, 2013
| Portfolio Manager | None | $1- $10,000 | $10,001-$50,000 | $50,001-$100,000 | $100,001-$500,000 | $500,001- $1,00,000 | over $1,000,000 | |||||||
| Chris Bingaman | ||||||||||||||
| Tom Schindler | ||||||||||||||
| Chris Welch |
C-20
EQ ADVISORS TRUST
PORTFOLIO MANAGER INFORMATION
Multimanager Mid Cap Growth (“Portfolio”) Franklin Advisers, Inc. (“Adviser”) | ||||||||||||||||||||||||
| Portfolio Manager | Presented below for each portfolio manager is the number of other accounts of the Adviser managed by the portfolio manager and the total assets in the accounts managed within each category as of December 31, 2013 | Presented below for each of the categories is the number of accounts and the total assets in the accounts with respect to which the advisory fee is based on the performance of the account | ||||||||||||||||||||||
| Registered Investment Companies | Other Pooled Investment Vehicles | Other Accounts | Registered Investment Companies | Other Pooled Investment Vehicles | Other Accounts | |||||||||||||||||||
| Number of Accounts | Total Assets | Number of Accounts | Total Assets | Number of Accounts | Total Assets | Number of Accounts | Total Assets | Number of Accounts | Total Assets | Number of Accounts | Total Assets | |||||||||||||
| Edward B. Jamieson | ||||||||||||||||||||||||
| Michael McCarthy | ||||||||||||||||||||||||
FRANKLIN ADVISERS, INC.
Description of any Material Conflicts
The management of multiple funds and accounts may also give rise to potential conflicts of interest if the funds and accounts have different objectives, benchmarks, time horizons, and fees as the portfolio manager must allocate his time and investment ideas across multiple funds and accounts. Franklin Advisers, Inc. seeks to manage such competing interests for the time and attention of portfolio managers by having portfolio managers focus on a particular investment discipline, such as investing in small and mid capitalization securities. Most other accounts managed by a portfolio manager are managed using the same investment strategies that are used in connection with the management of the Fund. Accordingly, portfolio holdings, position sizes, and industry and sector exposures tend to be similar across similar portfolios, which may minimize the potential for conflicts of interest.
A portfolio manager may also execute transactions for another fund or account at the direction of such fund or account that may adversely impact the value of securities held by the Fund. Securities selected for funds or accounts other than the Fund may outperform the securities selected for the Fund. Finally, if a portfolio manager identifies a limited investment opportunity that may be suitable for more than one fund or other account, the Fund may not be able to take full advantage of that opportunity due to an allocation of that opportunity across all eligible funds and accounts. Franklin Templeton Investments seeks to manage such potential conflicts by having adopted procedures, approved by the fund boards, intended to provide a fair allocation of buy and sell opportunities among Funds and other accounts.
The structure of a portfolio manager’s compensation may give rise to potential conflicts of interest. A portfolio manager’s base pay tends to increase with additional and more complex responsibilities that include increased assets under management, which indirectly links compensation to sales.
Finally, the management of personal accounts by a portfolio manager may give rise to potential conflicts of interest; here is no assurance that a fund’s code of ethics will adequately address such conflicts.
Franklin Templeton Investments has adopted certain compliance procedures that are designed to address these, and other, types of conflicts. However, there is no guarantee that such procedures will detect each and every situation where a conflict arises.
Compensation Information as of December 31, 2013
The manager seeks to maintain a compensation program that is competitively positioned to attract, retain and motivate top-quality investment professionals. Portfolio managers receive a base salary, a cash incentive bonus opportunity, an equity compensation opportunity, and a benefits package. Portfolio manager compensation is reviewed annually and the level of compensation is based on individual
C-21
performance, the salary range for a portfolio manager’s level of responsibility and Franklin Templeton guidelines. Portfolio managers are provided no financial incentive to favor one fund or account over another. Each portfolio manager’s compensation consists of the following three elements:
Base salary Each portfolio manager is paid a base salary.
Annual bonus Annual bonuses are structured to align the interests of the portfolio manager with those of the Fund’s shareholders. Each portfolio manager is eligible to receive an annual bonus. Bonuses generally are split between cash (50% to 65%) and restricted shares of Franklin Resources stock (17.5% to 25%) and mutual fund shares (17.5% to 25%). The deferred equity-based compensation is intended to build a vested interest of the portfolio manager in the financial performance of both Franklin Resources and mutual funds advised by the manager. The bonus plan is intended to provide a competitive level of annual bonus compensation that is tied to the portfolio manager achieving consistently strong investment performance, which aligns the financial incentives of the portfolio manager and Fund shareholders. The Chief Investment Officer of the manager and/or other officers of the manager, with responsibility for the Fund, have discretion in the granting of annual bonuses to portfolio managers in accordance with Franklin Templeton guidelines. The following factors are generally used in determining bonuses under the plan:
| • | Investment performance. Primary consideration is given to the historic investment performance over the 1, 3 and 5 preceding years of all accounts managed by the portfolio manager. The pretax performance of each fund managed is measured relative to a relevant peer group and/or applicable benchmark as appropriate. |
| • | Non-investment performance. The more qualitative contributions of a portfolio manager to the manager’s business and the investment management team, including professional knowledge, productivity, responsiveness to client needs and communication, are evaluated in determining the amount of any bonus award. |
| • | Responsibilities. The characteristics and complexity of funds managed by the portfolio manager are factored in the manager’s appraisal. |
Additional long-term equity-based compensation Portfolio managers may also be awarded restricted shares or units of Franklin Resources stock or restricted shares or units of one or more mutual funds, and options to purchase common shares of Franklin Resources stock. Awards of such deferred equity-based compensation typically vest over time, so as to create incentives to retain key talent.
Portfolio managers also participate in benefit plans and programs available generally to all employees of the manager.
Ownership of Shares of the Portfolio as of December 31, 2013
| Portfolio Manager | None | $1- $10,000 | $10,001- $50,000 | $50,001-$100,000 | $100,001-$500,000 | $500,001- $1,00,000 | over $1,000,000 | |||||||
| Edward B. Jamieson | ||||||||||||||
| Michael McCarthy |
C-22
EQ ADVISORS TRUST
PORTFOLIO MANAGER INFORMATION
Multimanager Mid Cap Value Portfolio (“Portfolio”) Knightsbridge Asset Management, LLC (“Adviser”) | ||||||||||||||||||||||||
| Portfolio Manager | Presented below for each portfolio manager is the number of other accounts of the Adviser managed by the portfolio manager and the total assets in the accounts managed within each category as of December 31, 2013 | Presented below for each of the categories is the number of accounts and the total assets in the accounts with respect to which the advisory fee is based on the performance of the account | ||||||||||||||||||||||
| Registered Investment Companies | Other Pooled Investment Vehicles | Other Accounts | Registered Investment Companies | Other Pooled Investment Vehicles | Other Accounts | |||||||||||||||||||
| Number of Accounts | Total Assets | Number of Accounts | Total Assets | Number of Accounts | Total Assets | Number of Accounts | Total Assets | Number of Accounts | Total Assets | Number of Accounts | Total Assets | |||||||||||||
| John G. Prichard | ||||||||||||||||||||||||
KNIGHTSBRIDGE ASSET MANAGEMENT, LLC
Description of any Material Conflicts
Knightsbridge performs investment management services for other accounts, including proprietary accounts, similar to those provided to the Portfolio and the investment action for such other accounts and the Portfolio may differ. Additionally, the management of other strategies and multiple accounts may give rise to potential conflicts of interest, as the investment team must allocate time and effort to other accounts and the Portfolio. Knightsbridge may discover an investment opportunity that may be suitable for more than one account or strategy which may be limited so that all accounts or strategies for which the investment would be suitable may not be able to participate. Knightsbridge has a fiduciary duty to manage all client accounts in a fair and equitable manner and has adopted policies and procedures designed to address potential conflicts.
Compensation Information as of December 31, 2013
As a principal of Knightsbridge, John Prichard’s compensation is tied to the net income of the firm.
Ownership of Shares of the Portfolio as of December 31, 2013
| Portfolio Manager | None | $1- $10,000 | $10,001- $50,000 | $50,001-$100,000 | $100,001- $500,000 | $500,001- $1,00,000 | over $1,000,000 | |||||||
| John G. Prichard |
C-23
EQ ADVISORS TRUST
PORTFOLIO MANAGER INFORMATION
| Lord Abbett & Co. LLC (“Adviser”) | ||||||||||||||||||||||||
| Portfolio Manager | Presented below for each portfolio manager is the number of other accounts of the Adviser managed by the portfolio manager and the total assets in the accounts managed within each category, as of December 31, 2013 | Presented below for each of the categories is the number of accounts and the total assets in the accounts with respect to which the advisory fee is based on the performance of the account. | ||||||||||||||||||||||
| Registered Investment Companies | Other Pooled Investment Vehicles | Other Accounts | Registered Investment Companies | Other Pooled Investment Vehicles | Other Accounts | |||||||||||||||||||
| Number of Accounts | Total Assets | Number of Accounts | Total Assets | Number of Accounts | Total Assets | Number of Accounts | Total Assets | Number of Accounts | Total Assets | Number of Accounts | Total Assets | |||||||||||||
| Multimanager Mid Cap Value Portfolio | ||||||||||||||||||||||||
| Thomas B. Maher | ||||||||||||||||||||||||
| Justin C. Maurer | ||||||||||||||||||||||||
LORD ABBETT & CO. LLC
Description of any Material Conflicts
Conflicts of interest may arise in connection with the portfolio managers’ management of the investments of Lord Abbett’s portion of the Multimanager Mid Cap Value Portfolio and the investments of the other accounts included in the table above. Such conflicts may arise with respect to the allocation of investment opportunities among the Portfolio and other accounts with similar investment objectives and policies. A portfolio manager potentially could use information concerning the Portfolio’s transactions to the advantage of other accounts and to the detriment of the Portfolio. To address these potential conflicts of interest, Lord Abbett has adopted and implemented a number of policies and procedures. Lord Abbett has adopted Policies and Procedures Relating to Client Brokerage and Soft Dollars, as well as Evaluations of Proprietary Research Procedures. The objective of these policies and procedures is to ensure the fair and equitable treatment of transactions and allocation of investment opportunities on behalf of all accounts managed by Lord Abbett. In addition, Lord Abbett’s Code of Ethics sets forth general principles for the conduct of employee personal securities transactions in a manner that avoids any actual or potential conflicts of interest with the interests of Lord Abbett’s clients including the Portfolio. Moreover, Lord Abbett’s Insider Trading and Receipt of Material Non-Public Information Policy and Procedure sets forth procedures for personnel to follow when they have inside information. Lord Abbett is not affiliated with a full service broker-dealer and therefore does not execute any portfolio transactions through such an entity, a structure that could give rise to additional conflicts. Lord Abbett does not conduct any investment bank functions and does not manage any hedge funds. Lord Abbett does not believe that any material conflicts of interest exist in connection with the portfolio managers’ management of the investments of the Portfolio and the investments of the other accounts referenced in the table above.
Compensation Information as of December 31, 2013
When used in this section, the term “fund” refers to the portion of the Multimanager Mid Cap Value Portfolio managed by Lord Abbett’s portfolio managers, as well as any other registered investment companies, pooled investment vehicles and accounts managed by such portfolio managers. Each portfolio manager receives compensation from Lord Abbett consisting of salary, bonus and profit sharing plan contributions. The level of base compensation takes into account the portfolio manager’s experience, reputation and competitive market rates.
Fiscal year-end bonuses, which can be a substantial percentage of overall compensation, are determined after an evaluation of various factors. These factors include the portfolio manager’s investment results and style consistency, the dispersion among funds with similar objectives, the risk taken to achieve the fund returns and similar factors. In considering the portfolio manager’s investment results, Lord Abbett’s
C-24
senior management may evaluate the fund’s performance against one or more benchmarks from among the fund’s primary benchmark and any supplemental benchmarks as disclosed in the prospectus, indexes disclosed as performance benchmarks by the portfolio manager’s other accounts, and other indexes within the one or more of the fund’s peer groups maintained by rating agencies, as well as the fund’s peer group. In particular, investment results are evaluated based on an assessment of the portfolio manager’s three- and five-year investment returns on a pretax basis versus both the benchmark and the peer groups. Finally, there is a component of the bonus that reflects leadership and management of the investment team. The evaluation does not follow a formulaic approach, but rather is reached following a review of these factors. No part of the bonus payment is based on the portfolio manager’s assets under management, the revenues generated by those assets, or the profitability of the portfolio manager’s team. Lord Abbett does not manage hedge funds. In addition, Lord Abbett may designate a bonus payment of a manager for participation in the firm’s senior incentive compensation plan, which provides for a deferred payout over a five-year period. The plan’s earnings are based on the overall asset growth of the firm as a whole. Lord Abbett believes this incentive focuses portfolio managers on the impact their fund’s performance has on the overall reputation of the firm as a whole and encourages exchanges of investment ideas among investment professionals managing different mandates.
Lord Abbett provides a 401(k) profit-sharing plan for all eligible employees. Contributions to a portfolio manager’s profit-sharing account are based on a percentage of the portfolio manager’s total base and bonus paid during the fiscal year, subject to a specified maximum amount. The assets of this profit sharing plan are entirely invested in Lord Abbett-sponsored funds.
Ownership of Shares of the Portfolios as of December 31, 2013
| Portfolio Manager | None | $1- $10,000 | $10,001-$50,000 | $50,001-$100,000 | $100,001-$500,000 | $500,001-$1,000,000 | over $1,000,000 | |||||||
| Multimanager Mid Cap Value Portfolio | ||||||||||||||
| Thomas B. Maher | ||||||||||||||
| Justin C. Maurer | ||||||||||||||
C-25
EQ ADVISORS TRUST
PORTFOLIO MANAGER INFORMATION
Multimanager Aggressive Equity Portfolio (“Portfolio”) Marisco Capital Management, LLC (“Adviser”) | ||||||||||||||||||||||||
| Portfolio Manager | Presented below for each portfolio manager is the number of other accounts of the Adviser managed by the portfolio manager and the total assets in the accounts managed within each category as of December 31, 2013 | Presented below for each of the categories is the number of accounts and the total assets in the accounts with respect to which the advisory fee is based on the performance of the account | ||||||||||||||||||||||
| Registered Investment Companies | Other Pooled Investment Vehicles | Other Accounts | Registered Investment Companies | Other Pooled Investment Vehicles | Other Accounts | |||||||||||||||||||
| Number of Accounts | Total Assets | Number of Accounts | Total Assets | Number of Accounts | Total Assets | Number of Accounts | Total Assets | Number of Accounts | Total Assets | Number of Accounts | Total Assets | |||||||||||||
| Thomas F. Marisco | ||||||||||||||||||||||||
| Coralie Witter, CFA | ||||||||||||||||||||||||
MARISCO CAPITAL MANAGEMENT, LLC
Description of any Material Conflicts
A portfolio manager may manage accounts for other clients. These accounts may include registered investment companies, other types of pooled accounts (e.g., collective investment funds), and separate accounts (i.e., accounts managed on behalf of individuals or public or private institutions). Portfolio managers of the Adviser make investment decisions for each account based on the investment objectives and policies and other relevant investment considerations applicable to that account. The management of multiple accounts may result in a portfolio manager devoting unequal time and attention to the management of each account. Although the Adviser does not track the time a portfolio manager spends on a single portfolio, it does assess whether a portfolio manager has adequate time and resources to effectively manage all of the accounts for which he is responsible. The Adviser seeks to manage competing interests for the time and attention of portfolio managers by having portfolio managers focus on a particular investment discipline or complementary investment disciplines. Accounts within a particular investment discipline may often be managed by using generally similar investment strategies, subject to factors including particular account restrictions and objectives, account opening dates, cash flows, and other considerations. Even where multiple accounts are managed by the same portfolio manager within the same investment discipline, however, the Adviser may take action with respect to one account that may differ from the timing or nature of action taken with respect to another account because of different client-specific objectives or restrictions or for other reasons such as different cash flows. Accordingly, the performance of each account managed by a portfolio manager will vary.
Potential conflicts of interest may also arise when allocating and/or aggregating trades. The Adviser often aggregates into a single trade order several individual contemporaneous client trade orders in a single security. Under the Adviser’s trade management policy and procedures, when trades are aggregated on behalf of more than one account, such transactions will be allocated to participating client accounts in a fair and equitable manner. With respect to initial public offerings and other syndicated or limited offerings, it is the Adviser’s policy to seek to ensure that over the long term, accounts with the same or similar investment objectives or strategies will receive an equitable opportunity to participate meaningfully in such offerings and will not be unfairly disadvantaged. To deal with these situations, the Adviser has adopted policies and procedures for allocating transactions across multiple accounts. The Adviser’s policies also seek to ensure that portfolio managers do not systematically allocate other types of trades in a manner that would be more beneficial to one account than another. The Adviser’s compliance department monitors transactions made on behalf of multiple clients to seek to ensure adherence to its policies.
C-26
The Adviser has adopted and implemented policies and procedures, including brokerage and trade allocation policies and procedures, that seek to minimize potential conflicts of interest that may arise because the Adviser advises multiple accounts. In addition, the Adviser monitors a variety of areas, including compliance with account investment guidelines and/or restrictions and compliance with the policies and procedures of the Adviser, including the Adviser’s Code of Ethics.
Compensation Information as of December 31, 2013
The compensation package for portfolio managers of the Adviser is structured as a combination of base salary (reevaluated at least annually), and periodic cash bonuses. Base salaries may be adjusted upward or downward depending on the Adviser’s profitability. Bonuses are typically based on two other primary factors: (1) the Adviser’s overall profitability for the period, and (2) individual achievement and contribution. Exceptional individual efforts are typically rewarded through salary readjustments and through larger bonuses. No other special employee incentive arrangements are currently in place or being planned. Portfolio manager compensation takes into account, among other factors, the overall performance of all accounts for which the portfolio manager provides investment advisory services. In receiving compensation such as bonuses, portfolio managers do not receive special consideration based on the performance of particular accounts, and do not receive compensation from accounts charging performance-based fees. In addition to salary and bonus, the Adviser’s portfolio managers may participate in other benefits such as health insurance and retirement plans on the same basis as other Adviser employees. The Adviser’s portfolio managers also may be offered the opportunity to acquire equity interests in the firm’s parent company.
As a general matter, the Adviser does not tie portfolio manager compensation to specific levels of performance relative to fixed benchmarks (e.g., S&P 500 Index). Although performance is a relevant consideration, comparisons with fixed benchmarks may not always be useful. Relevant benchmarks vary depending on specific investment styles and client guidelines or restrictions, and comparisons to benchmark performance may at times reveal more about market sentiment than about a portfolio manager’s performance or abilities. To encourage a long-term horizon for managing client assets and concurrently minimizing potential conflicts of interest and portfolios risks, the Adviser evaluates a portfolio manager’s performance over periods longer than the immediate compensation period, and may consider a variety of measures in determining compensation, such as the performance of unaffiliated mutual funds or other portfolios having similar strategies as well as other measurements. Other factors that may be significant in determining portfolio manager compensation include, without limitation, the effectiveness of the manager’s leadership within the Adviser’s investment management team, contributions to the Adviser’s overall performance, discrete securities analysis, idea generation, the ability and willingness to support and train other analysts, and other considerations.
Ownership of Shares of the Portfolio as of December 31, 2013
| Portfolio Manager | None | $1- $10,000 | $10,001-$50,000 | $50,001-$100,000 | $100,001-$500,000 | $500,001- $1,00,000 | over $1,000,000 | |||||||
| Thomas F. Marisco | ||||||||||||||
| Coralie Witter, CFA |
C-27
EQ ADVISORS TRUST
PORTFOLIO MANAGER INFORMATION
Multimanager Core Bond Portfolio (“Portfolio”) Pacific Investment Management Company LLC (“Adviser”) | ||||||||||||||||||||||||
| Portfolio Manager | Presented below for each portfolio manager is the number of other accounts of the Adviser managed by the portfolio manager and the total assets in the accounts managed within each category, as of December 31, 2013 | Presented below for each of the categories is the number of accounts and the total assets in the accounts with respect to which the advisory fee is based on the performance of the account. | ||||||||||||||||||||||
| Registered Investment Companies | Other Pooled Investment Vehicles | Other Accounts | Registered Investment Companies | Other Pooled Investment Vehicles | Other Accounts | |||||||||||||||||||
| Number of Accounts | Total Assets | Number of Accounts | Total Assets | Number of Accounts | Total Assets | Number of Accounts | Total Assets | Number of Accounts | Total Assets | Number of Accounts | Total Assets | |||||||||||||
| Saumil H. Parikh | ||||||||||||||||||||||||
PACIFIC INVESTMENT MANAGEMENT COMPANY LLC
Description of any Material Conflicts
From time to time, potential and actual conflicts of interest may arise between a portfolio manager’s management of the investments of a Fund, on the one hand, and the management of other accounts, on the other. Potential and actual conflicts of interest may also arise as a result of PIMCO’s other business activities and PIMCO’s possession of material non-public information about an issuer. Other accounts managed by a portfolio manager might have similar investment objectives or strategies as a Fund, or otherwise hold purchase, or sell securities that are eligible to be held, purchased or sold by the Funds. The other accounts might also have different investment objectives or strategies than the Funds.
Knowledge and Timing of Fund Trades. A potential conflict of interest may arise as a result of the portfolio manager’s day-to-day management of a Fund. Because of their positions with the Funds, the portfolio managers know the size, timing and possible market impact of a Fund’s trades. It is theoretically possible that the portfolio managers could use this information to the advantage of other accounts they manage and to the possible detriment of a Fund.
Investment Opportunities. A potential conflict of interest may arise as a result of the portfolio manager’s management of a number of accounts with varying investment guidelines. Often, an investment opportunity may be suitable for both a Fund and other accounts managed by the portfolio manager, but may not be available in sufficient quantities for both the Fund and the other accounts to participate fully. Similarly, there may be limited opportunity to sell an investment held by a Fund and another account. PIMCO has adopted policies and procedures reasonably designed to allocate investment opportunities on a fair and equitable basis over time.
Under PIMCO’s allocation procedures, investment opportunities are allocated among various investment strategies based on individual account investment guidelines and PIMCO’s investment outlook. PIMCO has also adopted additional procedures to complement the general trade allocation policy that are designed to address potential conflicts of interest due to the side-by-side management of the Funds and certain pooled investment vehicles, including investment opportunity allocation issues.
Conflicts potentially limiting a Fund’s investment opportunities may also arise when the Fund and other PIMCO clients invest in different parts of an issuer’s capital structure, such as when the Fund owns senior debt obligations of an issuer and other clients own junior tranches of the same issuer. In such circumstances, decisions over whether to trigger an event of default, over the terms of any workout, or how to exit an investment may result in conflicts of interest. In order to minimize such conflicts, a portfolio manager may avoid certain investment opportunities that would potentially give rise to conflicts with other PIMCO clients or PIMCO may enact internal procedures designed to minimize such conflicts, which could have the effect of limiting a Fund’s investment opportunities. Additionally, if PIMCO acquires material non-public confidential information in connection with its business activities
C-28
for other clients, a portfolio manager may be restricted from purchasing securities or selling securities for a Fund. When making investment decisions where a conflict of interest may arise, PIMCO will endeavor to act in a fair and equitable manner as between a Fund and other clients; however, in certain instances the resolution of the conflict may result in PIMCO acting on behalf of another client in a manner that may not be in the best interest, or may be opposed to the best interest, of a Fund.
Performance Fees. A portfolio manager may advise certain accounts with respect to which the advisory fee is based entirely or partially on performance. Performance fee arrangements may create a conflict of interest for the portfolio manager in that the portfolio manager may have an incentive to allocate the investment opportunities that he or she believes might be the most profitable to such other accounts instead of allocating them to a Fund. PIMCO has adopted policies and procedures reasonably designed to allocate investment opportunities between the Funds and such other accounts on a fair and equitable basis over time.
All Asset and All Asset All Authority Funds. Because the All Asset and the All Asset All Authority Funds invest substantially all of their assets in the Underlying PIMCO Funds, Research Affiliates believes that the potential conflicts of interest discussed above are mitigated. However, if any PIMCO Sponsored Fund including, without limitation, the PIMCO Funds of Funds, invests in either the EM Fundamental IndexPLUS TR Strategy Fund, Fundamental Advantage Total Return Strategy Fund, Fundamental IndexPLUS™ Fund or Fundamental IndexPLUS™ TR Fund, Research Affiliates will waive any fee to which it would be entitled under the RAFI® Sub-Advisory Agreement or EM Sub-Advisory Agreement, as applicable, with respect to any assets of the PIMCO Sponsored Fund invested in such Fund. Accordingly, PIMCO and Research Affiliates believe that the potential conflicts of interest discussed above also are mitigated.
Compensation Information as of December 31, 2013
PIMCO has adopted a Total Compensation Plan for its professional level employees, including its portfolio managers, that is designed to pay competitive compensation and reward performance, integrity and teamwork consistent with the firm’s mission statement. The Total Compensation Plan includes an incentive component that rewards high performance standards, work ethic and consistent individual and team contributions to the firm. The compensation of portfolio managers consists of a base salary, discretionary performance bonus, and may include an equity or long term incentive component.
Certain employees of PIMCO, including portfolio managers, may elect to defer compensation through PIMCO’s deferred compensation plan. PIMCO also offers its employees a non-contributory defined contribution plan through which PIMCO makes a contribution based on the employee’s compensation. PIMCO’s contribution rate increases at a specified compensation level, which is a level that would include portfolio managers.
The Total Compensation Plan consists of three components:
| • | Base Salary — Base salary is determined based on core job responsibilities positions/levels and market factors. Base salary levels are reviewed annually, when there is a significant change in job responsibilities or a significant change in the market. Base salary is paid in regular installments throughout the year and payment dates are in line with local practice. |
| • | Performance Bonus—Performance bonuses are designed to reward individual performance. Each professional and his or her supervisor will agree upon performance objectives to serve as a basis for performance evaluation during the year. The objectives will outline individual goals according to pre-established measures of the group or department success. Achievement against these goals as measured by the employee and supervisor will be an important, but not exclusive, element of the Compensation Committee’s bonus decision process. Final award amounts are determined at the discretion of the Compensation Committee and will also consider firm performance. |
C-29
| • | Equity or Long Term Incentive Compensation — Equity allows key professionals to participate in the long-term growth of the firm. This program provides mid to senior level employees with the potential to acquire an equity stake in PIMCO over their careers and to better align employee incentives with the firm’s long-term results. These options vest over a number of years and may convert into PIMCO equity which shares in the profit distributions of the firm. M Units are non-voting common equity of PIMCO and provide a mechanism for individuals to build a significant equity stake in PIMCO over time. Employees who reach a total compensation threshold are delivered their annual compensation in a mix of cash and option awards. PIMCO incorporates a progressive allocation of option awards as a percentage of total compensation which is in line with market practices. |
In certain countries with significant tax implications for employees to participate in the M Unit Option Plan, PIMCO continues to use the Long Term Incentive Plan (“LTIP”) in place of the M Unit Option Plan. The LTIP provides cash awards that appreciate or depreciate based upon PIMCO’s performance over a three-year period. The aggregate amount available for distribution to participants is based upon PIMCO’s profit growth.
Participation in the M Unit Option Plan and LTIP is contingent upon continued employment at PIMCO.
In addition, the following non-exclusive list of qualitative criteria may be considered when specifically determining the total compensation for portfolio managers:
| • | 3-year, 2-year and 1-year dollar-weighted and account-weighted, pre-tax investment performance as judged against the applicable benchmarks for each account managed by a portfolio manager (including the Portfolios) and relative to applicable industry peer groups; |
| • | Appropriate risk positioning that is consistent with PIMCO’s investment philosophy and the Investment Committee/CIO approach to the generation of alpha; |
| • | Amount and nature of assets managed by the portfolio manager; |
| • | Consistency of investment performance across portfolios of similar mandate and guidelines (reward low dispersion); |
| • | Generation and contribution of investment ideas in the context of PIMCO’s secular and cyclical forums, portfolio strategy meetings, Investment Committee meetings, and on a day-to-day basis; |
| • | Absence of defaults and price defaults for issues in the portfolios managed by the portfolio manager; |
| • | Contributions to asset retention, gathering and client satisfaction; |
| • | Contributions to mentoring, coaching and/or supervising; and |
| • | Personal growth and skills added. |
A portfolio manager’s compensation is not based directly on the performance of any Portfolio or any other account managed by that portfolio manager.
Profit Sharing Plan. Portfolio managers who are Managing Directors of PIMCO receive compensation from a non-qualified profit sharing plan consisting of a portion of PIMCO’s net profits. Portfolio managers who are Managing Directors receive an amount determined by the Compensation Committee, based upon an individual’s overall contribution to the firm.
Ownership of Shares of the Portfolio as of December 31, 2013
| Portfolio Manager | None | $1- $10,000 | $10,001-$50,000 | $50,001-$100,000 | $100,001-$500,000 | $500,001- $1,00,000 | over $1,000,000 | |||||||
| Saumil H. Parikh |
C-30
EQ ADVISORS TRUST
PORTFOLIO MANAGER INFORMATION
Multimanager Aggressive Equity Portfolio (“Portfolio”) Scotia Institutional Asset Management US, Ltd. (“Adviser”) | ||||||||||||||||||||||||
| Portfolio Manager | Presented below for each portfolio manager is the number of other accounts of the Adviser managed by the portfolio manager and the total assets in the accounts managed within each category, as of December 31, 2013 | Presented below for each of the categories is the number of accounts and the total assets in the accounts with respect to which the advisory fee is based on the performance of the account. | ||||||||||||||||||||||
| Registered Investment Companies | Other Pooled Investment Vehicles | Other Accounts | Registered Investment Companies | Other Pooled Investment Vehicles | Other Accounts | |||||||||||||||||||
| Number of Accounts | Total Assets | Number of Accounts | Total Assets | Number of Accounts | Total Assets | Number of Accounts | Total Assets | Number of Accounts | Total Assets | Number of Accounts | Total Assets | |||||||||||||
| Noah Blackstein | ||||||||||||||||||||||||
SCOTIA INSTITUTIONAL ASSET MANAGEMENT US, LTD.
Description of any Material Conflicts
As is typical for many money managers, potential conflicts of interest may arise related to a portfolio manager’s management of multiple accounts relating to: where not all accounts are able to participate in a desired IPO or another limited opportunity, the use of soft dollars and other brokerage practices, the voting of proxies, employee personal securities trading, the side by side management of accounts with performance based fees and accounts with fixed fees, and a variety of other circumstances. In all cases, however, Scotia Institutional Asset Management US, Ltd. (“Scotia”) believes it has written policies and procedures in place reasonably designed to prevent violations of the federal securities laws and to prevent material conflicts of interest from arising. The Form ADV, Part 2 of Scotia also contains a description of some of its policies and procedures in this regard.
Compensation Information as of December 31, 2013
Compensation by Scotia is designed to attract and retain high-caliber professional employees. The compensation arrangements for members of the investment team promote the interests of Scotia’s clients by providing a structure that contributes to retention of key investment professionals and by providing appropriate incentives for long term performance results.
Compensation arrangements, both fixed and variable, are as follows:
Base Salaries
Investment professionals are provided with what Scotia believes to be base salaries that are in line with industry standards and the appropriate human resources agencies are consulted to ensure that these levels are maintained.
Bonuses
Portfolio manager bonuses primarily consist of a variable compensation component and a discretionary component. The bonus weighting is typically two thirds variable and one third discretionary.
The variable component is based on quartile rankings over various periods of time. As part of the bonus compensation structure for the portfolio managers, typically one third is retained and vests over a 3 year period. Of the amount retained, 50% is invested in a portfolio manager’s own funds.
The discretionary component of portfolio managers’ bonuses is based on a review of their contribution to the investment team for investment insights and recommendations as well as their contribution to sales and marketing efforts.
C-31
Other considerations include level of assets under management and profitability of the firm.
Stock Purchase Program
Up to 10% of an employee’s salary may be used to purchase the stock of the publicly-listed parent company, The Bank of Nova Scotia, and the contribution will be matched 50% by the firm.
Stock Incentives in Parent Company, The Bank of Nova Scotia
Key individuals, such as executive management and senior investment professionals, including portfolio managers, may be provided with stock incentives that are dependent on factors individual to each.
Performance Based Fees
Some funds managed by Scotia, but not the Aggressive Allocation Portfolio, incur performance based fees and the portfolio manager shares in a portion of such fees.
Ownership of Shares of the Portfolio as of December 31, 2013
| Portfolio Manager | None | $1- $10,000 | $10,001-$50,000 | $50,001-$100,000 | $100,001-$500,000 | $500,001- $1,00,000 | over $1,000,000 | |||||||
| Noah Blackstein |
C-32
EQ ADVISORS TRUST
PORTFOLIO MANAGER INFORMATION
| SSgA Funds Management, Inc. (“Adviser”) | ||||||||||||||||||||||||
| Portfolio Manager | Presented below for each portfolio manager is the number of other accounts of the Adviser managed by the portfolio manager and the total assets in the accounts managed within each category, as of December 31, 2013 | Presented below for each of the categories is the number of accounts and the total assets in the accounts with respect to which the advisory fee is based on the performance of the account. | ||||||||||||||||||||||
| Registered Investment Companies | Other Pooled Investment Vehicles | Other Accounts | Registered Investment Companies | Other Pooled Investment Vehicles | Other Accounts | |||||||||||||||||||
| Number of Accounts | Total Assets | Number of Accounts | Total Assets | Number of Accounts | Total Assets | Number of Accounts | Total Assets | Number of Accounts | Total Assets | Number of Accounts | Total Assets | |||||||||||||
| Multimanager Core Bond Portfolio | ||||||||||||||||||||||||
| Michael Brunell | ||||||||||||||||||||||||
| Mahesh Jayakumar | ||||||||||||||||||||||||
| Multimanager Technology Portfolio | ||||||||||||||||||||||||
| Lynn Blake | ||||||||||||||||||||||||
| John Tucker | ||||||||||||||||||||||||
SSGA FUNDS MANAGEMENT, INC.
Description of any Material Conflicts
A Portfolio Manager may be subject to potential conflicts of interest because he or she is responsible for other accounts in addition to the Fund. Potential conflicts may arise out of (a) the Portfolio Manager’s execution of different investment strategies for various accounts or (b) the allocation of investment opportunities among the Portfolio Manager’s accounts with the same strategy.
A potential conflict of interest may arise as a result of the Portfolio Manager’s responsibility for multiple accounts with similar investment guidelines. Under these circumstances, a potential investment may be suitable for more than one of the Portfolio Manager’s accounts, but the quantity of the investment available for purchase is less than the aggregate amount the accounts would ideally devote to the opportunity. Similar conflicts may arise when multiple accounts seek to dispose of the same investment. The Portfolio Manager may also manage accounts whose objectives and policies differ from that of the Fund. These differences may be such that under certain circumstances, trading activity appropriate for one account managed by the Portfolio Manager may have adverse consequences for another account managed by the Portfolio Manager. For example, an account may sell a significant position in a security, which could cause the market price of that security to decrease, while the Fund maintained its position in that security.
A potential conflict may arise when the Portfolio Manager is responsible for accounts that have different advisory fees — the difference in fees could create an incentive for the Portfolio Manager to favor one account over another, for example, in terms of access to investment opportunities. This conflict may be heightened if an account is subject to a performance-based fee. Another potential conflict may arise when the Portfolio Manager has an investment in one or more accounts that participates in transactions with other accounts. His or her investment(s) may create an incentive for the portfolio manager to favor one account over another. SSgA FM has adopted policies and procedures reasonably designed to address these potential material conflicts. For instance, portfolio managers within SSgA FM are normally responsible for all accounts within a certain investment discipline, and do not, absent special circumstances, differentiate among the various accounts when allocating resources. Additionally, SSgA FM has processes and procedures for allocating investment opportunities among portfolios that are designed to provide a fair and equitable allocation.
C-33
Compensation Information as of December 31, 2013
The compensation of SSgA FM’s Investment professionals is based on a number of factors, including external benchmarking data and market trends, State Street performance, SSgA performance, and individual performance. Each year SSgA’s Global Human Resources department participates in compensation surveys in order to provide SSgA with critical, market-based compensation information that helps support individual pay decisions. Additionally, subject to State Street and SSgA business results, State Street allocates an incentive pool to SSgA to reward its employees. This pool is then allocated to the various functions within SSgA. The discretionary determination of the allocation amounts to business units is influenced by market-based compensation data, as well as the overall performance of the group. Individual compensation decisions are made by the employee’s manager, in conjunction with the senior management of the employee’s business unit. These decisions are based on the performance of the employee and, as mentioned above, on the performance of the firm and business unit.
Ownership of Shares of the Portfolios as of December 31, 2013
| Portfolio Manager | None | $1- $10,000 | $10,001-$50,000 | $50,001-$100,000 | $100,001-$500,000 | $500,001- $1,00,000 | over $1,000,000 | |||||||
| Multimanager Core Bond Portfolio | ||||||||||||||
| Michael Brunell | ||||||||||||||
| Mahesh Jayakumar | ||||||||||||||
| Multimanager Technology Portfolio | ||||||||||||||
| Lynn Blake | ||||||||||||||
| John Tucker | ||||||||||||||
C-34
EQ ADVISORS TRUST
PORTFOLIO MANAGER INFORMATION
Multimanager Aggressive Equity Portfolio (“Portfolio”) T. Rowe Price Associates, Inc. (“Adviser”) | ||||||||||||||||||||||||
| Portfolio Manager | Presented below for each portfolio manager is the number of other accounts of the Adviser managed by the portfolio manager and the total assets in the accounts managed within each category, as of December 31, 2013 | Presented below for each of the categories is the number of accounts and the total assets in the accounts with respect to which the advisory fee is based on the performance of the account. | ||||||||||||||||||||||
| Registered Investment Companies | Other Pooled Investment Vehicles | Other Accounts | Registered Investment Companies | Other Pooled Investment Vehicles | Other Accounts | |||||||||||||||||||
| Number of Accounts | Total Assets | Number of Accounts | Total Assets | Number of Accounts | Total Assets | Number of Accounts | Total Assets | Number of Accounts | Total Assets | Number of Accounts | Total Assets | |||||||||||||
| Robert W. Sharps | ||||||||||||||||||||||||
T. ROWE PRICE ASSOCIATES, INC.
Description of any Material Conflicts
Portfolio managers at T. Rowe Price typically manage multiple accounts. These accounts may include, among others, mutual funds, separate accounts (assets managed on behalf of institutions such as pension funds, colleges and universities, foundations), offshore funds and commingled trust accounts. Portfolio managers make investment decisions for each portfolio based on the investment objectives, policies, practices and other relevant investment considerations that the managers believe are applicable to that portfolio. Consequently, portfolio managers may purchase (or sell) securities for one portfolio and not another portfolio. T. Rowe Price has adopted brokerage and trade allocation policies and procedures which it believes are reasonably designed to address any potential conflicts associated with managing multiple accounts for multiple clients. Also, as disclosed under the “Compensation” section below, our portfolio managers’ compensation is determined in the same manner with respect to all portfolios managed by the portfolio manager.
T. Rowe Price funds may, from time to time, own shares of Morningstar, Inc. Morningstar is a provider of investment research to individual and institutional investors, and publishes ratings on mutual funds, including the Price Funds. T. Rowe Price manages the Morningstar retirement plan and T. Rowe Price and its affiliates pay Morningstar for a variety of products and services. In addition, Morningstar may provide investment consulting and investment management services to clients of T. Rowe Price or its affiliates.
Compensation Information as of December 31, 2013
Portfolio manager compensation consists primarily of a base salary, a cash bonus, and an equity incentive that usually comes in the form of a stock option grant. Occasionally, portfolio managers will also have the opportunity to participate in venture capital partnerships. Compensation is variable and is determined based on the following factors:
Investment performance over 1-, 3-, 5-, and 10-year periods is the most important input. The weightings for these time periods are generally balanced and are applied consistently across similar strategies. T. Rowe Price evaluates performance in absolute, relative, and risk-adjusted terms. Relative performance and risk-adjusted performance are determined with reference to the broad-based index (e.g., S&P 500) and the Lipper index (e.g., Large-Cap Growth) set forth in the total returns table in the fund’s prospectus, although other benchmarks may be used as well. Investment results are also measured against comparably managed funds of competitive investment management firms. The selection of comparable funds is approved by the applicable investment steering committee and are the same as those presented to the directors of the Price Funds in their regular review of fund performance.
C-35
Performance is primarily measured on a pretax basis though tax efficiency is considered and is especially important for the Tax-Efficient Equity Fund. Compensation is viewed with a long-term time horizon. The more consistent a manager’s performance over time, the higher the compensation opportunity. The increase or decrease in a fund’s assets due to the purchase or sale of fund shares is not considered a material factor. In reviewing relative performance for fixed-income funds, a fund’s expense ratio is usually taken into account. Contribution to T. Rowe Price’s overall investment process is an important consideration as well. Sharing ideas with other portfolio managers, working effectively with and mentoring younger analysts, and being good corporate citizens are important components of T. Rowe Price’s long-term success and are highly valued.
All employees of T. Rowe Price, including portfolio managers, participate in a 401(k) plan sponsored by T. Rowe Price Group. In addition, all employees are eligible to purchase T. Rowe Price common stock through an employee stock purchase plan that features a limited corporate matching contribution. Eligibility for and participation in these plans is on the same basis as for all employees. Finally, all vice presidents of T. Rowe Price Group, including all portfolio managers, receive supplemental medical/ hospital reimbursement benefits.
This compensation structure is used for all portfolios managed by the portfolio manager.
Ownership of Shares of the Portfolio as of December 31, 2013
| Portfolio Manager | None | $1- $10,000 | $10,001-$50,000 | $50,001-$100,000 | $100,001-$500,000 | $500,001- $1,00,000 | over $1,000,000 | |||||||
| Robert W. Sharps |
C-36
EQ ADVISORS TRUST
PORTFOLIO MANAGER INFORMATION
| Wellington Management Company, LLP (“Adviser”) | ||||||||||||||||||||||||
| Portfolio Manager | Presented below for each portfolio manager is the number of other accounts of the Adviser managed by the portfolio manager and the total assets in the accounts managed within each category, as of December 31, 2013 | Presented below for each of the categories is the number of accounts and the total assets in the accounts with respect to which the advisory fee is based on the performance of the account. | ||||||||||||||||||||||
| Registered Investment Companies | Other Pooled Investment Vehicles | Other Accounts | Registered Investment Companies | Other Pooled Investment Vehicles | Other Accounts | |||||||||||||||||||
| Number of Accounts | Total Assets | Number of Accounts | Total Assets | Number of Accounts | Total Assets | Number of Accounts | Total Assets | Number of Accounts | Total Assets | Number of Accounts | Total Assets | |||||||||||||
| Multimanager Mid Cap Growth Portfolio | ||||||||||||||||||||||||
| Michael T. Carmen | ||||||||||||||||||||||||
| Stephen Mortimer | ||||||||||||||||||||||||
| Multimanager Technology Portfolio | ||||||||||||||||||||||||
| John F. Averill | ||||||||||||||||||||||||
| Bruce L. Glazer | ||||||||||||||||||||||||
| Anita M. Killian | ||||||||||||||||||||||||
| Michael T. Masdea | ||||||||||||||||||||||||
WELLINGTON MANAGEMENT COMPANY, LLP
Description of any Material Conflicts
Individual investment professionals at Wellington Management Company, LLP (“Wellington Management”) manage multiple accounts for multiple clients. These accounts may include mutual funds, separate accounts (assets managed on behalf of institutions, such as pension funds, insurance companies, foundations, or separately managed account programs sponsored by financial intermediaries), bank common trust accounts, and hedge funds. The Fund’s managers listed in the prospectus who are primarily responsible for the day-to-day management of the Fund (“Investment Professionals”) generally manage accounts in several different investment styles. These accounts may have investment objectives, strategies, time horizons, tax considerations and risk profiles that differ from those of the Fund. The Investment Professionals make investment decisions for each account, including the Fund, based on the investment objectives, policies, practices, benchmarks, cash flows, tax and other relevant investment considerations applicable to that account. Consequently, the Investment Professionals may purchase or sell securities, including IPOs, for one account and not another account, and the performance of securities purchased for one account may vary from the performance of securities purchased for other accounts. Alternatively, these accounts may be managed in a similar fashion to the Fund and thus the accounts may have similar, and in some cases nearly identical, objectives, strategies and/or holdings to that of the Fund.
An Investment Professional or other investment professionals at Wellington Management may place transactions on behalf of other accounts that are directly or indirectly contrary to investment decisions made on behalf of the Fund, or make investment decisions that are similar to those made for the Fund, both of which have the potential to adversely impact the Fund depending on market conditions. For example, an investment professional may purchase a security in one account while appropriately selling that same security in another account. Similarly, an Investment Professional may purchase the same security for the Fund and one or more other accounts at or about the same time. In those instances the other accounts will have access to their respective holdings prior to the public disclosure of the Fund’s holdings. In addition, some of these accounts have fee structures, including performance fees, which are or have the potential to be higher, in some cases significantly higher, than the fees Wellington Management receives for managing the Fund. Messrs. Carmen and Mortimer also manage accounts
C-37
which pay performance allocations to Wellington Management or its affiliates. Because incentive payments paid by Wellington Management to the Investment Professionals are tied to revenues earned by Wellington Management and, where noted, to the performance achieved by the manager in each account, the incentives associated with any given account may be significantly higher or lower than those associated with other accounts managed by a given Investment Professional. Finally, the Investment Professionals may hold shares or investments in the other pooled investment vehicles and/or other accounts identified above.
Wellington Management’s goal is to meet its fiduciary obligation to treat all clients fairly and provide high quality investment services to all of its clients. Wellington Management has adopted and implemented policies and procedures, including brokerage and trade allocation policies and procedures, which it believes address the conflicts associated with managing multiple accounts for multiple clients. n addition, Wellington Management monitors a variety of areas, including compliance with primary account guidelines, the allocation of IPOs, and compliance with the firm’s Code of Ethics, and places additional investment restrictions on investment professionals who manage hedge funds and certain other accounts. Furthermore, senior investment and business personnel at Wellington Management periodically review the performance of Wellington Management’s investment professionals. Although Wellington Management does not track the time an investment professional spends on a single account, Wellington Management does periodically assess whether an investment professional has adequate time and resources to effectively manage the investment professional’s various client mandates.
Compensation Information as of December 31, 2013
Wellington Management receives a fee based on the assets under management of the Fund as set forth in the Investment Advisory Agreement between Wellington Management and AXA Equitable Funds Management Group, LLC on behalf of the Fund. Wellington Management pays its investment professionals out of its total revenues, including the advisory fees earned with respect to the Fund. The following information relates to the fiscal year ended December 31, 2012.
Wellington Management’s compensation structure is designed to attract and retain high-caliber investment professionals necessary to deliver high quality investment management services to its clients. Wellington Management’s compensation of the Fund’s managers listed in the prospectus who are primarily responsible for the day-to-day management of the Fund (“Investment Professionals”) includes a base salary and incentive components. The base salary for each Investment Professional who is a partner of Wellington Management is generally a fixed amount that is determined by the Managing Partners of the firm. Each Investment Professional is eligible to receive an incentive payment based on the revenues earned by Wellington Management from the Fund managed by the Investment Professional and generally each other account managed by such Investment Professional. Each Investment Professional’s incentive payment relating to the Fund is linked to the gross pre-tax performance of the portion of the Fund managed by the Investment Professional compared to the benchmark index and/or peer group identified below over one and three year periods, with an emphasis on three year results. In 2012, Wellington Management began placing increased emphasis on long-term performance and is phasing in a five-year performance comparison period. Wellington Management applies similar incentive compensation structures (although the benchmarks or peer groups, time periods and rates may differ) to other accounts managed by the Investment Professionals, including accounts with performance fees.
Portfolio-based incentives across all accounts managed by an investment professional can, and typically do, represent a significant portion of an investment professional’s overall compensation; incentive compensation varies significantly by individual and can vary significantly from year to year. The Investment Professionals may also be eligible for bonus payments based on their overall contribution to Wellington Management’s business operations. Senior management at Wellington Management may reward individuals as it deems appropriate based on other factors. Each partner of Wellington Management is eligible to participate in a partner-funded tax qualified retirement plan, the contributions to which are made pursuant to an actuarial formula. Messrs. Carmen and Mortimer are partners of the firm.
C-38
| Fund | Benchmark Index and/or Peer Group for Incentive Period | |
| Multimanager Mid Cap Growth Portfolio | Russell Mid Cap Growth |
Ownership of Shares of the Portfolios as of December 31, 2013
| Portfolio Manager | None | $1- $10,000 | $10,001-$50,000 | $50,001-$100,000 | $100,001-$500,000 | $500,001- $1,00,000 | over $1,000,000 | |||||||
| Multimanager Mid Cap Growth Portfolio | ||||||||||||||
| Michael T. Carmen | ||||||||||||||
| Stephen Mortimer | ||||||||||||||
| Multimanager Technology Portfolio | ||||||||||||||
| John F. Averill | ||||||||||||||
| Bruce L. Glazer | ||||||||||||||
| Anita M. Killian | ||||||||||||||
| Michael T. Masdea | ||||||||||||||
C-39
EQ ADVISORS TRUST
PORTFOLIO MANAGER INFORMATION
Multimanager Aggressive Equity Portfolio (“Portfolio”) Westfield Capital Management Company, L.P. (“Adviser”) | ||||||||||||||||||||||||
| Portfolio Manager | Presented below for each portfolio manager is the number of other accounts of the Adviser managed by the portfolio manager and the total assets in the accounts managed within each category, as of December 31, 2013 | Presented below for each of the categories is the number of accounts and the total assets in the accounts with respect to which the advisory fee is based on the performance of the account. | ||||||||||||||||||||||
| Registered Investment Companies | Other Pooled Investment Vehicles | Other Accounts | Registered Investment Companies | Other Pooled Investment Vehicles | Other Accounts | |||||||||||||||||||
| Number of Accounts | Total Assets | Number of Accounts | Total Assets | Number of Accounts | Total Assets | Number of Accounts | Total Assets | Number of Accounts | Total Assets | Number of Accounts | Total Assets | |||||||||||||
| Bruce N. Jacobs | ||||||||||||||||||||||||
| Ethan J. Meyers | ||||||||||||||||||||||||
| John M. Montgomery | ||||||||||||||||||||||||
| William A. Muggia | ||||||||||||||||||||||||
| Hamlen Thompson | ||||||||||||||||||||||||
WESTFIELD CAPITAL MANAGEMENT COMPANY, L.P.
Description of any Material Conflicts
| • | The simultaneous management of multiple accounts by our investment professionals creates a possible conflict of interest as they must allocate their time and investment ideas across multiple accounts. This may result in the Investment Committee or portfolio manager allocating unequal attention and time to the management of each client account as each has different objectives, benchmarks, investment restrictions and fees. For most client accounts, investment decisions are made at the Investment Committee level. Once an idea has been approved, it is implemented across all eligible and participating accounts within the strategy. Client specific restrictions are monitored by the Compliance team. |
| • | Although the Investment Committee collectively acts as portfolio manager on most client accounts, there are some client accounts that are managed by a sole portfolio manager who also is a member of the Investment Committee. This can create a conflict of interest because investment decisions for these individually managed accounts do not require approval by the Investment Committee; thus, there is an opportunity for individually managed client accounts to trade in a security ahead of Investment Committee-managed client accounts. Trade orders for individually managed accounts must be communicated to the Investment Committee. Additionally, the Compliance team performs periodic reviews of such accounts to ensure procedures have been followed. |
| • | Westfield has clients with performance-based fee arrangements. A conflict of interest can arise between those portfolios that incorporate a performance fee and those that do not. When the same securities are recommended for both types of accounts, it is Westfield’s policy to allocate investments, on a pro-rata basis, to all participating and eligible accounts, regardless of the account’s fee structure. Our Operations team performs periodic reviews of each product’s model portfolio versus each client account, where each position size is compared against the model’s weight. Discrepancies are researched, and any exceptions are documented. |
| • | In placing each transaction for a client’s account, Westfield seeks best execution of that transaction except in cases where Westfield does not have the authority to select the broker or dealer, as stipulated by the client. We attempt to bundle directed brokerage accounts with nondirected accounts, and then utilize step-out trades to satisfy the directed arrangements. Clients who do not allow step-out trades will typically go last. |
C-40
| • | Because of our interest in receiving third party research services, there may be an incentive for Westfield to select a broker or dealer based on such interest rather than the clients’ interest in receiving most favorable execution. To mitigate the conflict that Westfield may have an incentive beyond best execution to utilize a particular broker, a broker vote is conducted and reviewed on a quarterly basis. This vote provides the opportunity to recognize the unique research efforts of a wide variety of firms, as well as the opportunity to compare aggregate commission dollars with a particular broker to ensure appropriate correlation. |
| • | Some Westfield clients have elected to retain certain brokerage firms as consultants or to invest their assets through a broker-sponsored wrap program for which Westfield acts as a manager. Several of these firms are on our approved broker list. Since Westfield may gain new clients through such relationships, and will interact closely with such firms to service the client, there may be an incentive for Westfield to select a broker or dealer based on such interest rather than the clients’ interest. To help ensure independence in the brokerage selection process, the brokerage selection and evaluation process is managed by our Portfolio Strategist, while client relationships are managed by our Marketing/Client Service team. Also, Westfield prohibits any member of the Marketing/Client Service team to provide input into brokerage selection. Furthermore, the consultant or wrap program teams at such firms are usually separate and distinct from the brokerage teams. |
| • | Personal accounts may give rise to conflicts of interest. Westfield’s employees will, from time to time, for their own account, purchase, sell, hold or own securities or other assets which may be recommended for purchase, sale or ownership for one or more clients. Westfield has a Code of Ethics which regulates trading in personal accounts. Personal accounts are reported to Compliance and most personal transactions are pre-approved by Compliance. Compliance also reviews personal trading activity regularly. |
| • | Westfield serves as manager to the General Partners of two limited partnerships, for which we also provide investment advisory services. As such, Westfield has a financial interest in each of the partnerships. Having a financial interest in client accounts can create a conflict between those client accounts in which we have a financial interest and those in which we do not. To help ensure all clients are treated equitably and fairly, Westfield allocates investment opportunities on a pro-rata basis. Compliance also conducts regular reviews of the limited partnership accounts against other client accounts to ensure procedures have been followed. |
Compensation Information as of December 31, 2013
William A. Muggia, President, CEO, CIO, and Partner of Westfield, is the lead member of the Investment Committee, which has day-to-day management responsibility of the Portfolio. Investment decisions for the Portfolio are made at the product level by consensus of the Investment Committee. Members of the Investment Committee may be eligible to receive various components of compensation:
| • | Investment Committee members receive a base salary commensurate with industry standards. This salary is reviewed annually during the employee’s performance assessment. |
| • | Investment Committee members also receive a performance based bonus award. This bonus award is determined and paid in December. The amount awarded is based on the employee’s individual performance attribution and overall contribution to the investment performance of Westfield. While the current calendar year is a primary focus, a rolling three year attribution summary is also considered when determining the bonus award. |
| • | Investment Committee members may be eligible to receive equity interests in the future profits of Westfield. Individual awards are typically determined by a member’s overall performance within the firm, including contribution to company strategy, participation in marketing and client services initiatives, as well as longevity at the firm. The key members of Westfield’s management |
C-41
team who receive equity interests in the firm enter into agreements restricting post-employment competition and solicitation of clients or employees of Westfield. This compensation is in addition to the base salary and performance based bonus. Equity interest grants typically vest over five years. |
| • | Investment Committee members may receive a portion of the performance-based fees earned from a client account that is managed solely by Mr. Muggia. He has full discretion to grant such awards to any member of the Investment Committee. |
Ownership of Shares of the Portfolio as of December 31, 2013
| Portfolio Manager | None | $1- $10,000 | $10,001-$50,000 | $50,001-$100,000 | $100,001-$500,000 | $500,001- $1,00,000 | over $1,000,000 | |||||||
| Bruce N. Jacobs | ||||||||||||||
| Ethan J. Meyers | ||||||||||||||
| John M. Montgomery | ||||||||||||||
| William A. Muggia | ||||||||||||||
| Hamlen Thompson |
C-42
EQ ADVISORS TRUST
AMENDED AND RESTATED
PROXY VOTING POLICIES AND PROCEDURES
| I. | TRUST’S POLICY STATEMENT |
EQ Advisors Trust (“Trust”) is firmly committed to ensuring that proxies relating to the Trust’s portfolio securities are voted in the best interests of the Trust. The following procedures have been established to implement the Trust’s proxy voting program.
| II. | TRUST’S PROXY VOTING PROGRAM |
AXA Equitable Funds Management Group, LLC (“FMG LLC” or the “Manager”) serves as the investment manager of the Trust’s portfolios. FMG LLC is responsible for the selection and ongoing monitoring of investment sub-advisers (the “Advisers”) who provide the day-to-day portfolio management for each portfolio. The Trust has delegated proxy voting responsibility with respect to each portfolio to FMG LLC. Because FMG LLC views proxy voting as a function that is incidental and integral to portfolio management, it has in turn delegated the proxy voting responsibility with respect to each sub-advised portfolio or sub-advised portion of a portfolio (“Sub-Advised Portion”) to the applicable Adviser, except as described in Section III below. The primary focus of the Trust’s proxy voting program as it relates to the sub-advised portfolios or Sub-Advised Portions, therefore, is to seek to ensure that the Advisers have adequate proxy voting policies and procedures in place and to monitor each Adviser’s proxy voting. These policies and procedures may be amended from time to time based on experience as well as changing environments, especially as new and/or differing laws and regulations are promulgated, and need not be identical.
| III. | AXA EQUITABLE’S PROXY VOTING POLICIES AND PROCEDURES |
FMG LLC provides the day-to-day portfolio management services to certain portfolios, or an allocated portion of a portfolio (“Allocated Portion”) of the Trust, each of which seek to achieve its investment objective by investing in other mutual funds managed by FMG LLC (“Underlying Portfolios”) or by investing in exchange-traded funds (“Underlying ETFs”). As a result of this direct portfolio management by FMG LLC, FMG LLC is responsible for proxy voting for these portfolios or Allocated Portions. In light of the fact that the holdings of the portfolios or Allocated Portions managed by FMG LLC are Underlying Portfolios or Underlying ETFs, FMG LLC has determined it to be appropriate to vote the portfolios’ or Allocated Portions’ shares in these securities either for or against approval of a proposal, or as an abstention, in the same proportion as the vote of all other securities holders of the applicable Underlying Portfolio or Underlying ETF (whether or not the proposal presents an issue as to which FMG LLC or its affiliates could be deemed to have a conflict of interest). These policies and procedures may be amended from time to time.
| IV. | AXA EQUITABLE’S DUE DILIGENCE AND COMPLIANCE PROGRAM |
As part of its ongoing due diligence and compliance responsibilities, with respect to the sub-advised portfolios or Sub-Advised Portions, FMG LLC will seek to ensure that each Adviser maintains proxy voting policies and procedures that are reasonably designed to comply with applicable laws and regulations. FMG LLC will review each Adviser’s proxy voting policies and procedures (including any proxy voting guidelines) in connection with the initial selection of the Adviser to manage a portfolio or Sub-Advised Portion and on at least an annual basis thereafter.
D-1
| V. | ADVISERS’ PROXY VOTING POLICIES AND PROCEDURES |
Each Adviser will be required to maintain proxy voting policies and procedures that satisfy the following elements:
| A. | Written Policies and Procedures: The Adviser must maintain written proxy voting policies and procedures in accordance with applicable laws and regulations and must provide to the Trust and AXA Equitable, upon request, copies of such policies and procedures. |
| B. | Fiduciary Duty: The Adviser’s policies and procedures must be reasonably designed to ensure that the Adviser votes client securities in the best interest of its clients. |
| C. | Conflicts of Interest: The Adviser’s policies and procedures must include appropriate procedures to identify and resolve as necessary, before voting client proxies, all material proxy-related conflicts of interest between the Adviser (including its affiliates) and its clients. |
| D. | Voting Guidelines: The Adviser’s policies and procedures must address with reasonable specificity how the Adviser will vote proxies, or what factors it will take into account, when voting on particular types of matters, e.g., corporate governance proposals, compensation issues and matters involving social or corporate responsibility. |
| E. | Monitoring Proxy Voting: The Adviser must have a system and/or process that is reasonably designed to ensure that proxies are voted on behalf of its clients in a timely and efficient manner. |
| F. | Record Retention and Inspection: The Adviser must have an established system for creating and retaining all appropriate documentation relating to its proxy voting activities as required by applicable laws and regulations. The Adviser must provide to the Trust and FMG LLC such information and records with respect to proxies relating to the Trust’s portfolio securities as required by law and as the Trust or FMG LLC may reasonably request. |
| VI. | DISCLOSURE OF TRUST’S PROXY VOTING POLICIES AND PROCEDURES AND VOTING RECORD |
FMG LLC, on behalf of the Trust, will take reasonable steps as necessary to seek to ensure that the Trust complies with all applicable laws and regulations relating to disclosure of the Trust’s proxy voting policies and procedures and its proxy voting record. FMG LLC (including, at its option, through third-party service providers) will maintain a system that is reasonably designed to ensure that its actual proxy voting record and the actual proxy voting record of the Advisers with respect to the Trust’s portfolio securities are collected, processed, filed with the Securities and Exchange Commission and made available to the Trust’s shareholders as required by applicable laws and regulations.
| VII. | REPORTS TO TRUST’S BOARD OF TRUSTEES |
FMG LLC will periodically (but no less frequently than annually) report to the Board of Trustees with respect to the Trust’s implementation of its proxy voting program, including summary information with respect to the proxy voting record of the Advisers with respect to the sub-advised portfolios’ and Sub-Advised Portions’ portfolio securities and any other information requested by the Board of Trustees.
Adopted as of: March 1, 2011
Effective: May 1, 2011
Predecessor Procedures of Investment Manager Adopted: August 6, 2003
Amended July 11, 2007
D-2
PROXY VOTING POLICIES AND PROCEDURES
ALLIANCEBERNSTEIN L.P.
Statement of Policies and Procedures for Proxy Voting
| 1. | Introduction |
As a registered investment adviser, AllianceBernstein L.P. (“AllianceBernstein”, “we” or “us”) has a fiduciary duty to act solely in the best interests of our clients. We recognize that this duty requires us to vote client securities in a timely manner and make voting decisions that are intended to maximize long-term shareholder value. Generally, our clients’ objective is to maximize the financial return of their portfolios within appropriate risk parameters. We have long recognized that environmental, social and governance (“ESG”) issues can impact the performance of investment portfolios. Accordingly, we have sought to integrate ESG factors into our investment process to the extent that the integration of such factors is consistent with our fiduciary duty to help our clients achieve their investment objectives and protect their economic interests. For additional information regarding our ESG policies and practices, please refer to our firm’s Statement of Policy Regarding Responsible Investment.
We consider ourselves shareholder advocates and take this responsibility very seriously. Consistent with our commitments, we will disclose our clients’ voting records only to them and as required by mutual fund vote disclosure regulations. In addition, our Proxy Committee may, after careful consideration, choose to respond to surveys so long as doing so does not compromise confidential voting.
This statement is intended to comply with Rule 206(4)-6 of the Investment Advisers Act of 1940. It sets forth our policies and procedures for voting proxies for our discretionary investment advisory clients, including investment companies registered under the Investment Company Act of 1940. This statement applies to AllianceBernstein’s investment groups investing on behalf of clients in both U.S. and non-U.S. securities.
| 2. | Proxy Policies |
Our proxy voting policies are principle-based rather than rules-based. We adhere to a core set of principles that are described in this Statement and in our Proxy Voting Manual. We assess each proxy proposal in light of those principles. Our proxy voting “litmus test” will always be what we view as most likely to maximize long-term shareholder value. We believe that authority and accountability for setting and executing corporate policies, goals and compensation should generally rest with the board of directors and senior management. In return, we support strong investor rights that allow shareholders to hold directors and management accountable if they fail to act in the best interests of shareholders. In addition, if we determine that ESG issues that arise with respect to an issuer’s past, current or anticipated behaviors are, or are reasonably likely to become, material to its future earnings, we address these concerns in our proxy voting and engagement.
This statement is designed to be responsive to the wide range of proxy voting subjects that can have a significant effect on the investment value of the securities held in our clients’ accounts. These policies are not exhaustive due to the variety of proxy voting issues that we may be required to consider. AllianceBernstein reserves the right to depart from these guidelines in order to make voting decisions that are in our clients’ best interests. In reviewing proxy issues, we will apply the following general policies:
| 2.1. | Corporate Governance |
We recognize the importance of good corporate governance in our proxy voting policies and engagement practices in ensuring that management and the board of directors fulfill their obligations to shareholders. We favor proposals promoting transparency and accountability within a company. We support the appointment of a majority of independent directors on boards and key committees. Because we believe that good corporate governance requires shareholders to have a meaningful voice in the affairs of the company, we generally will support shareholder proposals which request that companies amend their by-
D-3
laws to provide that director nominees be elected by an affirmative vote of a majority of the votes cast. Furthermore, we have written to the SEC in support of shareholder access to corporate proxy statements under specified conditions with the goal of serving the best interests of all shareholders.
| 2.2. | Elections of Directors |
Unless there is a proxy fight for seats on the Board or we determine that there are other compelling reasons to oppose directors, we will vote in favor of the management proposed slate of directors. That said, we believe that directors have a duty to respond to shareholder actions that have received significant shareholder support. Therefore, we may vote against directors (or withhold votes for directors where plurality voting applies) who fail to act on key issues such as failure to implement proposals to declassify the board, failure to implement a majority vote requirement, failure to submit a rights plan to a shareholder vote or failure to act on tender offers where a majority of shareholders have tendered their shares. In addition, we will vote against directors who fail to attend at least seventy-five percent of board meetings within a given year without a reasonable excuse, and we may abstain or vote against directors of non-U.S. issuers where there is insufficient information about the nominees disclosed in the proxy statement. Also, we will generally not oppose directors who meet the definition of independence promulgated by the primary exchange on which the company’s shares are traded or set forth in the code we determine to be best practice in the country where the subject company is domiciled. Finally, because we believe that cumulative voting in single shareholder class structures provides a disproportionately large voice to minority shareholders in the affairs of a company, we will generally vote against such proposals and vote for management proposals seeking to eliminate cumulative voting. However, in dual class structures (such as A&B shares) where the shareholders with a majority economic interest have a minority voting interest, we will generally vote in favor of cumulative voting.
| 2.3. | Appointment of Auditors |
AllianceBernstein believes that the company is in the best position to choose its auditors, so we will generally support management’s recommendation. However, we recognize that there are inherent conflicts when a company’s independent auditor performs substantial non-audit services for the company. The Sarbanes-Oxley Act of 2002 prohibits certain categories of services by auditors to U.S. issuers, making this issue less prevalent in the U.S. Nevertheless, in reviewing a proposed auditor, we will consider the fees paid for non-audit services relative to total fees and whether there are other reasons for us to question the independence or performance of the auditors.
| 2.4. | Changes in Legal and Capital Structure |
Changes in a company’s charter, articles of incorporation or by-laws are often technical and administrative in nature. Absent a compelling reason to the contrary, AllianceBernstein will cast its votes in accordance with management’s recommendations on such proposals. However, we will review and analyze on a case-by-case basis any non-routine proposals that are likely to affect the structure and operation of the company or have a material economic effect on the company. For example, we will generally support proposals to increase authorized common stock when it is necessary to implement a stock split, aid in a restructuring or acquisition, or provide a sufficient number of shares for an employee savings plan, stock option plan or executive compensation plan. However, a satisfactory explanation of a company’s intentions must be disclosed in the proxy statement for proposals requesting an increase of greater than 100% of the shares outstanding. We will oppose increases in authorized common stock where there is evidence that the shares will be used to implement a poison pill or another form of anti-takeover device. We will support shareholder proposals that seek to eliminate dual class voting structures.
| 2.5. | Corporate Restructurings, Mergers and Acquisitions |
AllianceBernstein believes proxy votes dealing with corporate reorganizations are an extension of the investment decision. Accordingly, we will analyze such proposals on a case-by-case basis, weighing
D-4
heavily the views of our research analysts that cover the company and our investment professionals managing the portfolios in which the stock is held.
| 2.6. | Proposals Affecting Shareholder Rights |
AllianceBernstein believes that certain fundamental rights of shareholders must be protected. We will generally vote in favor of proposals that give shareholders a greater voice in the affairs of the company and oppose any measure that seeks to limit those rights. However, when analyzing such proposals we will weigh the financial impact of the proposal against the impairment of shareholder rights.
| 2.7. | Anti-Takeover Measures |
AllianceBernstein believes that measures that impede corporate transactions (such as takeovers) or entrench management not only infringe on the rights of shareholders but may also have a detrimental effect on the value of the company. Therefore, we will generally oppose proposals, regardless of whether they are advanced by management or shareholders, when their purpose or effect is to entrench management or excessively or inappropriately dilute shareholder ownership. Conversely, we support proposals that would restrict or otherwise eliminate anti-takeover or anti-shareholder measures that have already been adopted by corporate issuers. For example, we will support shareholder proposals that seek to require the company to submit a shareholder rights plan to a shareholder vote. We will evaluate, on a case-by-case basis, proposals to completely redeem or eliminate such plans. Furthermore, we will generally oppose proposals put forward by management (including the authorization of blank check preferred stock, classified boards and supermajority vote requirements) that appear to be anti-shareholder or intended as management entrenchment mechanisms.
| 2.8. | Executive Compensation |
AllianceBernstein believes that company management and the compensation committee of the board of directors should, within reason, be given latitude to determine the types and mix of compensation and benefits offered to company employees. Whether proposed by a shareholder or management, we will review proposals relating to executive compensation plans on a case-by-case basis to ensure that the long-term interests of management and shareholders are properly aligned. In general, we will analyze the proposed plan to ensure that shareholder equity will not be excessively diluted taking into account shares available for grant under the proposed plan as well as other existing plans. We generally will oppose plans that allow stock options to be granted with below market value exercise prices on the date of issuance or permit re-pricing of underwater stock options without shareholder approval. Other factors such as the company’s performance and industry practice will generally be factored into our analysis. In markets where remuneration reports or advisory votes on executive compensation are not required for all companies, we will generally support shareholder proposals asking the board to adopt a policy (i.e., “say on pay”) that the company’s shareholders be given the opportunity to vote on an advisory resolution to approve the compensation practices of the company. Although “say on pay” votes are by nature only broad indications of shareholder views, they do lead to more compensation-related dialogue between management and shareholders and help ensure that management and shareholders meet their common objective: maximizing the value of the company. In markets where votes to approve remuneration reports or advisory votes on executive compensation are required, we review the compensation practices on a case-by-case basis. With respect to companies that have received assistance through government programs such as TARP, we will generally oppose shareholder proposals that seek to impose greater executive compensation restrictions on subject companies than are required under the applicable program because such restrictions could create a competitive disadvantage for the subject company. We believe the U.S. Securities and Exchange Commission (“SEC”) took appropriate steps to ensure more complete and transparent disclosure of executive compensation when it issued modified executive compensation and corporate governance disclosure rules in 2006 and February 2010. Therefore, while we will consider them on a case-by-case basis, we generally vote against shareholder
D-5
proposals seeking additional disclosure of executive and director compensation, including proposals that seek to specify the measurement of performance-based compensation, if the company is subject to SEC rules. We will support requiring a shareholder vote on management proposals to provide severance packages that exceed 2.99 times the sum of an executive officer’s base salary plus bonus that are triggered by a change in control. Finally, we will support shareholder proposals requiring a company to expense compensatory employee stock options (to the extent the jurisdiction in which the company operates does not already require it) because we view this form of compensation as a significant corporate expense that should be appropriately accounted for.
| 2.9. | ESG |
We are appointed by our clients as an investment manager with a fiduciary responsibility to help them achieve their investment objectives over the long term. Generally, our clients’ objective is to maximize the financial return of their portfolios within appropriate risk parameters. We have long recognized that ESG issues can impact the performance of investment portfolios. Accordingly, we have sought to integrate ESG factors into our investment and proxy voting processes to the extent that the integration of such factors is consistent with our fiduciary duty to help our clients achieve their investment objectives and protect their economic interests. For additional information regarding our approach to incorporating ESG issues in our investment and decision-making processes, please refer to our RI Policy, which is attached to this Statement as an Exhibit.
Shareholder proposals relating to environmental, social (including political) and governance issues often raise complex and controversial issues that may have both a financial and non-financial effect on the company. And while we recognize that the effect of certain policies on a company may be difficult to quantify, we believe it is clear that they do affect the company’s long-term performance. Our position in evaluating these proposals is founded on the principle that we are a fiduciary. As such, we carefully consider any factors that we believe could affect a company’s long-term investment performance (including ESG issues) in the course of our extensive fundamental, company-specific research and engagement, which we rely on in making our investment and proxy voting decisions. Maximizing long-term shareholder value is our overriding concern when evaluating these matters, so we consider the impact of these proposals on the future earnings of the company. In so doing, we will balance the assumed cost to a company of implementing one or more shareholder proposals against the positive effects we believe implementing the proposal may have on long-term shareholder value.
| 3. | Proxy Voting Procedures |
| 3.1. | Engagement |
In evaluating proxy issues and determining our votes, we welcome and seek out the points of view of various parties. Internally, the Proxy Committee may consult chief investment officers, directors of research, research analysts across our value and growth equity platforms, portfolio managers in whose managed accounts a stock is held and/or other Investment Policy Group members. Externally, the Proxy Committee may consult company management, company directors, interest groups, shareholder activists and research providers. If we believe an ESG issue is, or is reasonably likely to become, material, we engage a company’s management to discuss the relevant issues.
| 3.2. | Conflicts of Interest |
AllianceBernstein recognizes that there may be a potential conflict of interest when we vote a proxy solicited by an issuer whose retirement plan we manage or administer, who distributes AllianceBernstein-sponsored mutual funds, or with whom we have, or one of our employees has, a business or personal relationship that may affect (or may be reasonably viewed as affecting) how we vote on the issuer’s proxy. Similarly, AllianceBernstein may have a potentially material conflict of interest when deciding how to vote on a proposal sponsored or supported by a shareholder group that is a client.
D-6
We believe that centralized management of proxy voting, oversight by the Proxy Committee and adherence to these policies ensures that proxies are voted based solely on our clients’ best interests. Additionally, we have implemented procedures to ensure that our votes are not the product of a material conflict of interest, including: (i) on an annual basis, the Proxy Committee taking reasonable steps to evaluate (A) the nature of AllianceBernstein’s and our employees’ material business and personal relationships (and those of our affiliates) with any company whose equity securities are held in client accounts and (B) any client that has sponsored or has a material interest in a proposal upon which we will be eligible to vote; (ii) requiring anyone involved in the decision making process to disclose to the Chair of the Proxy Committee any potential conflict that he or she is aware of (including personal relationships) and any contact that he or she has had with any interested party regarding a proxy vote; (iii) prohibiting employees involved in the decision making process or vote administration from revealing how we intend to vote on a proposal in order to reduce any attempted influence from interested parties; and (iv) where a material conflict of interests exists, reviewing our proposed vote by applying a series of objective tests and, where necessary, considering the views of third party research services to ensure that our voting decision is consistent with our clients’ best interests.
Because under certain circumstances AllianceBernstein considers the recommendation of third party research services, the Proxy Committee takes reasonable steps to verify that any third party research service is, in fact, independent taking into account all of the relevant facts and circumstances. This includes reviewing the third party research service’s conflict management procedures and ascertaining, among other things, whether the third party research service (i) has the capacity and competency to adequately analyze proxy issues, and (ii) can make recommendations in an impartial manner and in the best interests of our clients.
| 3.3. | Proxies of Certain Non-U.S. Issuers |
Proxy voting in certain countries requires “share blocking.” Shareholders wishing to vote their proxies must deposit their shares shortly before the date of the meeting with a designated depositary. During this blocking period, shares that will be voted at the meeting cannot be sold until the meeting has taken place and the shares are returned to the clients’ custodian banks. Absent compelling reasons to the contrary, AllianceBernstein believes that the benefit to the client of exercising the vote is outweighed by the cost of voting (i.e., not being able to sell the shares during this period). Accordingly, if share blocking is required we generally choose not to vote those shares.
AllianceBernstein seeks to vote all proxies for securities held in client accounts for which we have proxy voting authority. However, in non-US markets, administrative issues beyond our control may at times prevent AllianceBernstein from voting such proxies. For example, AllianceBernstein may receive meeting notices after the cut-off date for voting or without sufficient time to fully consider the proxy. As another example, certain markets require periodic renewals of powers of attorney that local agents must have from our clients prior to implementing AllianceBernstein’s voting instructions.
| 3.4. | Loaned Securities |
Many clients of AllianceBernstein have entered into securities lending arrangements with agent lenders to generate additional revenue. AllianceBernstein will not be able to vote securities that are on loan under these types of arrangements. However, under rare circumstances, for voting issues that may have a significant impact on the investment, we may request that clients recall securities that are on loan if we determine that the benefit of voting outweighs the costs and lost revenue to the client or fund and the administrative burden of retrieving the securities.
| 3.5. | Proxy Committee |
We have formed a Proxy Committee, which includes investment professionals from both our growth and value equities teams, which is directly involved in the decision-making process to ensure that our votes are guided by the investment professionals who are most familiar with a given company. The Proxy
D-7
Committee establishes general proxy policies for AllianceBernstein and considers specific proxy voting matters as necessary. The Proxy Committee periodically reviews these policies and new types of environmental, social and governance issues, and decides how we should vote on proposals not covered by these policies. When a proxy vote cannot be clearly decided by an application of our stated policy, the Proxy Committee will evaluate the proposal. In addition, the Proxy Committee, in conjunction with the analyst that covers the company, may contact corporate management, interested shareholder groups and others as necessary to discuss proxy issues.
Different investment philosophies may occasionally result in different conclusions being drawn regarding certain proposals and, in turn, may result in the Proxy Committee making different voting decisions on the same proposal for value and growth holdings. Nevertheless, the Proxy Committee always votes proxies with the goal of maximizing the value of the securities in client portfolios.
It is the responsibility of the Proxy Committee to evaluate and maintain proxy voting procedures and guidelines, to evaluate proposals and issues not covered by these guidelines, to evaluate proxies where we face a potential conflict of interest (as discussed in section 3.2), to consider changes in policy and to review the Proxy Voting Statement and the Proxy Voting Manual no less frequently than annually. In addition, the Proxy Committee meets as necessary to address special situations.
Members of the Proxy Committee include senior investment personnel and representatives of the Legal and Compliance Department. The Proxy Committee is chaired by Linda Giuliano, Senior Vice President and Chief Administrative Officer-Equities.
Proxy Committee
Vincent DuPont: SVP-Equities
Linda Giuliano: SVP-Equities
Stephen Grillo: VP-Equities
David Lesser: VP-Legal
Mark Manley: SVP-Legal
Andrew Weiner: SVP-Equities
| 3.6. | Proxy Voting Records |
Clients may obtain information about how we voted proxies on their behalf by contacting their AllianceBernstein administrative representative. Alternatively, clients may make a written request for proxy voting information to: Mark R. Manley, Senior Vice President & Chief Compliance Officer, AllianceBernstein L.P., 1345 Avenue of the Americas, New York, NY 10105.
D-8
BLACKROCK
GLOBAL CORPORATE GOVERNANCE & ENGAGEMENT PRINCIPLES
December 2011
Contents
| D-9 | ||||
| D-9 | ||||
| D-10 | ||||
| D-11 | ||||
| D-12 | ||||
— Capital structure, mergers, asset sales and other special transactions | D-12 | |||
| D-13 | ||||
| D-13 | ||||
| D-14 | ||||
BLACKROCK’S OVERSIGHT OF ITS CORPORATE GOVERNANCE ACTIVITIES | D-14 | |||
| D-14 | ||||
| D-15 | ||||
| D-15 | ||||
| D-16 | ||||
| D-17 |
BlackRock is the world’s preeminent asset management firm and a premier provider of global investment management, risk management and advisory services to institutional and individual clients around the world. BlackRock offers a wide range of investment strategies and product structures to meet clients’ needs, including individual and institutional separate accounts, mutual funds, and other pooled investment vehicles and the industry-leading iShares exchange traded funds. Through BlackRock Solutions®, we offer risk management, strategic advisory and enterprise investment system services to a broad base of clients.
PHILOSOPHY ON CORPORATE GOVERNANCE
BlackRock’s corporate governance program is focused on protecting and enhancing the economic value of the companies in which it invests on behalf of clients. We do this through engagement with boards and management of investee companies and, for those clients who have given us authority, through voting at shareholder meetings.
We believe that there are certain fundamental rights attached to share ownership: companies should be accountable to shareholders for the use of their money, companies and their boards should be structured with appropriate checks and balances to ensure that they operate in shareholders’ interests, effective voting rights are central to the rights of ownership and there should be one vote for one share. Key elements of shareholder protection include protection against excessive dilution, the election of directors and the appointment of auditors. Specifically, shareholders should have the right to elect, remove and nominate directors and to amend the corporate charter or by-laws. Shareholders should also be able to vote on matters that are material to the protection of their investment including but not limited to changes to the
D-9
purpose of the business, the distribution of income and the capital structure. In order to exercise these rights in their own best interests, we believe shareholders have the right to sufficient and timely information to be able to take an informed view of the performance of the company and management.
Our focus is on the board of directors, as the agent of shareholders, who should set the company’s strategic aims within a framework of prudent and effective controls which enables risk to be assessed and managed. The board should provide direction and leadership to the management and oversee management’s performance. Our starting position is to be supportive of boards in their oversight efforts on our behalf and the items of business they put to a shareholder vote at shareholder meetings. Votes against or withheld from resolutions proposed by the board are a signal that we are concerned that the directors or management have either not acted in the interests of shareholders or have not responded adequately to shareholder concerns communicated to it regarding the strategy or management of a company.
These principles set out our approach to engaging with companies, provide guidance on our position on the key aspects of corporate governance and outline how these might be reflected in our voting decisions. Corporate governance practices vary internationally and our expectations in relation to individual companies are based on the legal and regulatory framework of each market. However, we do believe that there are some overarching principles of corporate governance that apply globally. We assess voting matters on a case-by-case basis and in light of a company’s unique circumstances. We are interested to understand from the company’s reporting the approach taken, particularly where it is different from the usual market practice and to understand how it benefits shareholders.
BlackRock also believes that shareholders are responsible for exercising oversight of, and promoting due care in, the stewardship of their investment in a company. These ownership responsibilities include, in our view, engaging in certain circumstances with management or board members on corporate governance matters, voting proxies in the best long-term economic interests of shareholders and engaging with regulatory bodies to ensure a sound policy framework consistent with promoting long-term shareholder value creation. Institutional shareholders also have responsibilities to their clients to have appropriate resources and oversight structures. BlackRock’s approach to oversight in relation to its corporate governance activities is set out in the section titled “BlackRock’s oversight of its corporate governance activities” below.
CORPORATE GOVERNANCE, ENGAGEMENT AND VOTING
We recognize that accepted standards of corporate governance differ between markets but we believe that there are sufficient common threads globally to identify an overarching set of principles. The primary objective of our corporate governance activities is the protection and enhancement of our clients’ investments in public corporations. Thus, these principles focus on practices and structures that we consider to be supportive of long-term value creation. We discuss below the principles under six key themes. In our regional and market-specific voting guidelines we explain how these principles inform our voting decisions in relation to specific resolutions that may appear on the agenda of a shareholder meeting in the relevant market.
The six key themes are:
| • | Boards and directors |
| • | Accounting and audit-related issues |
| • | Capital structure, mergers, asset sales and other special transactions |
| • | Remuneration and benefits |
| • | Social, ethical and environmental issues |
| • | General corporate governance matters |
D-10
At a minimum we would expect companies to observe the accepted corporate governance standard in their domestic market or to explain why doing so is not in the interests of shareholders. Where company reporting and disclosure is inadequate or the approach taken is inconsistent with our view of what is in the best interests of shareholders, we will engage with the company and/or use our vote to encourage better practice. In making voting decisions, we take into account research from external proxy advisors, other internal and external research and academic articles, information published by the company or provided through engagement and the views of our equity portfolio managers.
BlackRock views engagement as an important activity; engagement provides BlackRock with the opportunity to improve our understanding of investee companies and their governance structures, so that our voting decisions may be better informed. Engagement also allows us to share our philosophy and approach to investment and corporate governance with issuers to enhance their understanding of our objectives. There are a range of approaches we may take in engaging companies depending on the nature of the issue under consideration, the company and the market.
The performance of the board is critical to the economic success of the company and to the protection of shareholders’ interests. Board members serve as agents of shareholders in overseeing the operation and strategic direction of the company. For this reason, BlackRock focuses on directors in many of its engagements and sees the election of directors as one of its most important responsibilities in the proxy voting context.
We expect the board of directors to promote and protect shareholder interests by:
| • | establishing an appropriate corporate governance structure; |
| • | overseeing and supporting management in setting strategy; |
| • | ensuring the integrity of financial statements; |
| • | making decisions regarding mergers, acquisitions and disposals; |
| • | establishing appropriate executive compensation structures; and |
| • | addressing business issues including social, ethical and environmental issues when they have the potential to materially impact company reputation and performance. |
There should be clear definitions of the role of the board, the sub-committees of the board and the senior management such that the responsibilities of each are well understood and accepted. Companies should report publicly the approach taken to governance (including in relation to board structure) and why this approach is in the interest of shareholders. We will engage with the appropriate directors where we have concerns about the performance of the board or the company, the broad strategy of the company or the performance of individual board members. Concerns about individual board directors may include their membership on the board of a different company where that board has performed poorly and failed to protect shareholder interests.
BlackRock believes that directors should stand for re-election on a regular basis. We assess directors nominated for election or re-election in the context of the composition of the board as a whole. There should be detailed disclosure of the relevant credentials of the individual directors in order that shareholders can assess the caliber of an individual nominee. We expect there to be a sufficient number of independent directors on the board to ensure the protection of the interests of all shareholders. Common impediments to independence include but are not limited to:
| • | current employment at the company or a subsidiary; |
| • | former employment within the past several years as an executive of the company; |
D-11
| • | providing substantial professional services to the company and/or members of the company’s management; |
| • | having had a substantial business relationship in the past three years; |
| • | having, or representing a shareholder with, a substantial shareholding in the company; |
| • | being an immediate family member of any of the aforementioned; and |
| • | interlocking directorships. |
BlackRock believes that the operation of the board is enhanced when there is a clearly independent, senior non-executive director to lead it. Where the chairman is also the CEO or is otherwise not independent the company should have an independent lead director. The role of this director is to enhance the effectiveness of the independent members of the board through shaping the agenda, ensuring adequate information is provided to the board and encouraging independent participation in board deliberations. The lead independent board director should be available to shareholders where they have concerns that they wish to discuss.
To ensure that the board remains effective, regular reviews of board performance should be carried out and assessments made of gaps in skills or experience amongst the members. BlackRock believes it is beneficial for new directors to be brought onto the board periodically to refresh the group’s thinking and to ensure both continuity and adequate succession planning. We believe that directors are in the best position to assess the optimal size for the board but we would be concerned if a board seemed too small to have an appropriate balance of directors or too large to be effective.
There are matters for which the board has responsibility that may involve a conflict of interest for executives or for affiliated directors. BlackRock believes that shareholders’ interests are best served when the independent members of the board form a sub-committee to deal with such matters. In many markets, these sub-committees of the board specialize in audit, director nominations and compensation matters. An ad hoc committee might also be formed to decide on a special transaction, particularly one with a related party.
Accounting and audit-related issues
BlackRock recognizes the critical importance of financial statements which provide a complete and accurate picture of a company’s financial condition. We will hold the members of the audit committee or equivalent responsible for overseeing the management of the audit function. We take particular note of cases involving significant financial restatements or ad hoc notifications of material financial weakness.
The integrity of financial statements depends on the auditor being free of any impediments to being an effective check on management. To that end, we believe it is important that auditors are, and are seen to be, independent. Where the audit firm provides services to the company in addition to the audit the fees earned should be disclosed and explained. Audit committees should also have in place a procedure for assuring annually the independence of the auditor.
Capital structure, mergers, asset sales and other special transactions
The capital structure of a company is critical to its owners, the shareholders, as it impacts the value of their investment and the priority of their interest in the company relative to that of other equity or debt investors. Pre-emption rights are a key protection for shareholders against the dilution of their interests.
In assessing mergers, asset sales or other special transactions, BlackRock’s primary consideration is the long-term economic interests of shareholders. Boards proposing a transaction need to clearly explain the economic and strategic rationale behind it. We will review the transaction to determine the degree to which the proposed transaction enhances long term shareholder value. We would prefer that such transactions have the unanimous support of the board and have been negotiated at arm’s length. We may
D-12
seek reassurance from the board that executive and/or board members’ financial interests in a given transaction have not affected their ability to place shareholders’ interests before their own. Where the transaction does involve related parties we would expect the recommendation to support it to come from the independent directors and would prefer only non-conflicted shareholders to vote on the proposal.
BlackRock believes that shareholders have a right to dispose of company shares in the open market without unnecessary restriction. In our view, corporate mechanisms designed to limit shareholders’ ability to sell their shares are contrary to basic property rights. Such mechanisms can serve to protect and entrench interests other than those of the shareholders. We believe that shareholders are broadly capable of making decisions in their own best interests. We would expect any so-called ‘shareholder rights plans’ being proposed by a board to be subject to shareholder approval on introduction and periodically thereafter for continuation.
BlackRock expects a company’s board of directors to put in place a compensation structure that incentivizes and rewards executives appropriately and is aligned with shareholder interests. We would expect the compensation committee to take into account the specific circumstances of the company and the key individuals the board is trying to incentivize. We encourage companies to ensure that their compensation packages incorporate appropriate and challenging performance conditions consistent with corporate strategy and market practice. We use third party research, in addition to our own analysis, to evaluate existing and proposed compensation structures. We hold members of the compensation committee or equivalent accountable for poor compensation practices or structures.
BlackRock believes that there should be a clear link between variable pay and company performance as reflected in returns to shareholders. We are not supportive of one-off or special bonuses unrelated to company or individual performance. We support incentive plans that payout rewards earned over multiple and extended time periods. We believe consideration should be given to building claw back provisions into incentive plans such that executives would be required to repay rewards where they were not justified by actual performance. Compensation committees should guard against contractual arrangements that would entitle executives to material compensation for early termination of their contract. Finally, pension contributions should be reasonable in light of market practice.
Outside directors should be compensated in a manner that does not risk compromising their independence or aligning their interests too closely with those of the management, whom they are charged with overseeing.
Social, ethical, and environmental issues
Our fiduciary duty to clients is to protect and enhance their economic interest in the companies in which we invest on their behalf. It is within this context that we undertake our corporate governance activities. We believe that well-managed companies will deal effectively with the social, ethical and environmental (SEE) aspects of their businesses.
BlackRock expects companies to identify and report on the key, business-specific SEE risks and opportunities and to explain how these are managed. This explanation should make clear how the approach taken by the company best serves the interests of shareholders and protects and enhances the long-term economic value of the company. The key performance indicators in relation to SEE matters should also be disclosed and performance against them discussed, along with any peer group benchmarking and verification processes in place. This helps shareholders assess how well management are dealing with the SEE aspects of the business. Any global standards adopted should also be disclosed and discussed in this context.
We may vote against the election of directors where we have concerns that a company might not be dealing with SEE issues appropriately. Sometimes we may reflect such concerns by supporting a
D-13
shareholder proposal on the issue, where there seems to be either a significant potential threat or realized harm to shareholders’ interests caused by poor management of SEE matters. In deciding our course of action, we will assess whether the company has already taken sufficient steps to address the concern and whether there is a clear and substantial economic disadvantage to the company if the issue is not addressed.
More commonly, given that these are often not voting issues, we will engage directly with the board or management. The trigger for engagement on a particular SEE concern is our assessment that there is potential for material economic ramifications for shareholders.
We do not see it as our role to make social, ethical or political judgments on behalf of clients. We expect investee companies to comply, at a minimum, with the laws and regulations of the jurisdictions in which they operate. They should explain how they manage situations where such laws or regulations are contradictory or ambiguous.
General corporate governance matters
BlackRock believes that shareholders have a right to timely and detailed information on the financial performance and situation of the companies in which they invest. In addition, companies should also publish information on the governance structures in place and the rights of shareholders to influence these. The reporting and disclosure provided by companies forms the basis on which shareholders can assess the extent to which the economic interests of shareholders have been protected and enhanced and the quality of the board’s oversight of management. BlackRock considers as fundamental, shareholders’ rights to vote, including on changes to governance mechanisms, to submit proposals to the shareholders’ meeting and to call special meetings of shareholders.
BLACKROCK’S OVERSIGHT OF ITS CORPORATE GOVERNANCE ACTIVITIES
BlackRock holds itself to a very high standard in its corporate governance activities, including in relation to executing proxy votes. This function is executed by a team of dedicated BlackRock employees without sales responsibilities (the “Corporate Governance Group”), which reports to the equity portfolio management business and is considered an investment function. BlackRock maintains regional oversight committees (“Corporate Governance Committees”) for the Americas, Europe, Asia ex-Japan, Japan, and Australia/New Zealand, consisting of senior BlackRock investment professionals. All of the regional Corporate Governance Committees report to a Global Corporate Governance Committee which is composed of the Chair and Vice-Chair of each regional Corporate Governance Committee. The Corporate Governance Committees review and approve amendments to the BlackRock Guidelines and grant authority to the Global Head of Corporate Governance (“Global Head”), a dedicated BlackRock employee without sales responsibilities, to vote in accordance with the Guidelines. The Global Head leads the Corporate Governance Group to carry out engagement, voting and vote operations in a manner consistent with the relevant Corporate Governance Committee’s mandate. The Corporate Governance Group engages companies in conjunction with the portfolio managers in discussions of significant governance issues, conducts research on corporate governance issues and participates in industry discussions to keep abreast of the field of corporate governance. The Corporate Governance Group, or vendors overseen by the Corporate Governance Group, also monitor upcoming proxy votes, execute proxy votes and maintain records of votes cast. The Corporate Governance Group may refer complicated or particularly controversial matters or discussions to the appropriate investors and/or regional Corporate Governance Committees for their review, discussion and guidance prior to making a voting decision. The Corporate Governance Committees likewise retain the authority to, among other things, deliberate or otherwise act directly on specific proxies as they deem appropriate. BlackRock’s Equity Investment Portfolio Oversight Committee (EIPOC) oversees certain aspects of the Global Corporate Governance Committee and the Corporate Governance Group’s activities.
D-14
BlackRock carefully considers proxies submitted to funds and other fiduciary accounts (“Funds”) for which it has voting authority. BlackRock votes (or refrains from voting) proxies for each Fund for which it has voting authority based on BlackRock’s evaluation of the best long-term economic interests of shareholders, in the exercise of its independent business judgment, and without regard to the relationship of the issuer of the proxy (or any dissident shareholder) to the Fund, the Fund’s affiliates (if any), BlackRock or BlackRock’s affiliates.
When exercising voting rights, BlackRock will normally vote on specific proxy issues in accordance with its proxy voting guidelines (“Guidelines”) for the relevant market. The Guidelines are reviewed regularly and are amended consistent with changes in the local market practice, as developments in corporate governance occur, or as otherwise deemed advisable by BlackRock’s Corporate Governance Committees. The Corporate Governance Committees may, in the exercise of their business judgment, conclude that the Guidelines do not cover the specific matter upon which a proxy vote is requested or that an exception to the Guidelines would be in the best long-term economic interests of BlackRock’s clients.
In certain markets, proxy voting involves logistical issues which can affect BlackRock’s ability to vote such proxies, as well as the desirability of voting such proxies. These issues include but are not limited to: (i) untimely notice of shareholder meetings; (ii) restrictions on a foreigner’s ability to exercise votes; (iii) requirements to vote proxies in person; (iv) “shareblocking” (requirements that investors who exercise their voting rights surrender the right to dispose of their holdings for some specified period in proximity to the shareholder meeting); (v) potential difficulties in translating the proxy; and (vi) requirements to provide local agents with unrestricted powers of attorney to facilitate voting instructions. We are not supportive of impediments to the exercise of voting rights such as shareblocking or overly burdensome administrative requirements.
As a consequence, BlackRock votes proxies in these markets only on a “best-efforts” basis. In addition, the Corporate Governance Committees may determine that it is generally in the best interests of BlackRock clients not to vote proxies of companies in certain countries if the committee determines that the costs (including but not limited to opportunity costs associated with shareblocking constraints) associated with exercising a vote are expected to outweigh the benefit the client will derive by voting on the issuer’s proposal.
While it is expected that BlackRock, as a fiduciary, will generally seek to vote proxies over which BlackRock exercises voting authority in a uniform manner for all BlackRock clients, the relevant Corporate Governance Committee, in conjunction with the portfolio manager of an account, may determine that the specific circumstances of such an account require that such account’s proxies be voted differently due to such account’s investment objective or other factors that differentiate it from other accounts. In addition, BlackRock believes portfolio managers may from time to time legitimately reach differing but equally valid views, as fiduciaries for their funds and the client assets in those funds, on how best to maximize economic value in respect of a particular investment. Accordingly, portfolio managers retain full discretion to vote the shares in the funds they manage based on their analysis of the economic impact of a particular ballot item.
BlackRock maintains policies and procedures that are designed to prevent undue influence on BlackRock’s proxy voting activity that might stem from any relationship between the issuer of a proxy (or any dissident shareholder) and BlackRock, BlackRock’s affiliates, a Fund or a Fund’s affiliates. Some of the steps BlackRock has taken to prevent conflicts include, but are not limited to:
| • | BlackRock has adopted a proxy voting oversight structure whereby the Corporate Governance Committees oversee the voting decisions and other activities of the Corporate Governance Group, and particularly its activities with respect to voting in the relevant region of each Corporate Governance Committee’s jurisdiction. |
D-15
| • | The Corporate Governance Committees have adopted Guidelines for each region, which set forth the firm’s views with respect to certain corporate governance and other issues that typically arise in the proxy voting context. The Corporate Governance Committees reserve the right to review voting decisions at any time and to make voting decisions as necessary to ensure the independence and integrity of the voting process. In addition, the Corporate Governance Committees receive periodic reports regarding the specific votes cast by the Corporate Governance Group and regular updates on material process issues, procedural changes and other matters of concern to the Corporate Governance Committees. |
| • | BlackRock’s Global Corporate Governance Committee oversees the Global Head, the Corporate Governance Group and the Corporate Governance Committees. The Global Corporate Governance Committee conducts a review, at least annually, of the proxy voting process to ensure compliance with BlackRock’s risk policies and procedures. |
| • | BlackRock maintains a reporting structure that separates the Global Head and Corporate Governance Group from employees with sales responsibilities. In addition, BlackRock maintains procedures to ensure that all engagements with corporate issuers or dissident shareholders are managed consistently and without regard to BlackRock’s relationship with the issuer of the proxy or dissident shareholder. Within the normal course of business, the Global Head or Corporate Governance Group may engage directly with BlackRock clients, and with employees with sales responsibilities, in discussions regarding general corporate governance policy matters, and to otherwise ensure proxy-related client service levels are met. The Global Head or Corporate Governance Group does not discuss any specific voting matter with a client prior to the disclosure of the vote decision to all applicable clients after the shareholder meeting has taken place, except if the client is acting in the capacity as issuer of the proxy or dissident shareholder and is engaging through the established procedures independent of the client relationship. |
| • | In certain instances, BlackRock may determine to engage an independent fiduciary to vote proxies as a further safeguard to avoid potential conflicts of interest or as otherwise required by applicable law. The independent fiduciary may either vote such proxies, or provide BlackRock with instructions as to how to vote such proxies. In the latter case, BlackRock votes the proxy in accordance with the independent fiduciary’s determination. Use of an independent fiduciary has been adopted for voting the proxies related to any company that is affiliated with BlackRock, or any company that includes BlackRock employees on its board of directors. |
With regard to the relationship between securities lending and proxy voting, BlackRock’s approach is driven by our clients’ economic interests. The evaluation of the economic desirability of recalling loans involves balancing the revenue producing value of loans against the likely economic value of casting votes. Based on our evaluation of this relationship, we believe that generally the likely economic value of casting most votes is less than the securities lending income, either because the votes will not have significant economic consequences or because the outcome of the vote would not be affected by BlackRock recalling loaned securities in order to ensure they are voted. Periodically, BlackRock analyzes the process and benefits of voting proxies for securities on loan, and will consider whether any modification of its proxy voting policies or procedures is necessary in light of future conditions. In addition, BlackRock may in its discretion determine that the value of voting outweighs the cost of recalling shares, and thus recall shares to vote in that instance.
The attached issue-specific voting Guidelines for each region/country in which we vote are intended to summarize BlackRock’s general philosophy and approach to issues that may commonly arise in the proxy voting context in each market where we invest. These Guidelines are not intended to be exhaustive. BlackRock applies the Guidelines on a case-by-case basis, in the context of the individual
D-16
circumstances of each company and the specific issue under review. As such, these Guidelines do not provide a guide to how BlackRock will vote in every instance. Rather, they share our view about corporate governance issues generally, and provide insight into how we typically approach issues that commonly arise on corporate ballots.
We report our proxy voting activity directly to clients and publically as required. In addition, we publish for clients a more detailed discussion of our corporate governance activities, including engagement with companies and with other relevant parties.
D-17
BLACKROCK
PROXY VOTING GUIDELINES FOR U.S. SECURITIES
January 2013
| D-18 | ||||
| D-18 | ||||
| D-19 | ||||
| D-22 | ||||
| D-23 | ||||
| D-24 | ||||
| D-25 | ||||
| D-27 | ||||
| D-28 |
These guidelines should be read in conjunction with BlackRock’s Global Corporate Governance and Engagement Principles , which are available on-line at www.blackrock.com
BlackRock, Inc. and its subsidiaries (collectively, “BlackRock”) seek to make proxy voting decisions in the manner most likely to protect and promote the economic value of the securities held in client accounts. The following issue-specific proxy voting guidelines (the “Guidelines”) are intended to summarize BlackRock’s general philosophy and approach to issues that may commonly arise in the proxy voting context for U.S. Securities. These Guidelines are not intended to limit the analysis of individual issues at specific companies and are not intended to provide a guide to how BlackRock will vote in every instance. Rather, they share our view about corporate governance issues generally, and provide insight into how we typically approach issues that commonly arise on corporate ballots. They are applied with discretion, taking into consideration the range of issues and facts specific to the company and the individual ballot item.
These guidelines are divided into six key themes which group together the issues that frequently appear on the agenda of annual and extraordinary meetings of shareholders.
The six key themes are:
| • | Boards and directors |
| • | Auditors and audit-related issues |
| • | Capital structure, mergers, asset sales and other special transactions |
| • | Remuneration and benefits |
| • | Social, ethical and environmental issues |
| • | General corporate governance matters |
D-18
Director elections
BlackRock generally supports board nominees in most uncontested elections. BlackRock may withhold votes from certain directors on the board or members of particular board committees (or prior members, as the case may be) in certain situations, including, but not limited to:
| • | The independent chair or lead independent director and members of the governance committee, where a board fails to implement shareholder proposals that receive a majority of votes cast at a prior shareholder meeting, and the proposals, in our view, have a direct and substantial impact on shareholders’ fundamental rights or long-term economic interests. |
| • | The independent chair or lead independent director and members of the governance committee, where a board implements or renews a poison pill without seeking shareholder approval beforehand or within a reasonable period of time after implementation. |
| • | An insider or affiliated outsider who sits on the board’s audit, compensation, nominating or governance committees, which we believe generally should be entirely independent. However, BlackRock will examine a board’s complete profile when questions of independence arise prior to casting a withhold vote for any director. For controlled companies, as defined by the U.S. stock exchanges, we will only vote against insiders or affiliates who sit on the audit committee, but not other key committees. |
| • | Members of the audit committee during a period when the board failed to facilitate quality, independent auditing, for example, if substantial accounting irregularities suggest insufficient oversight by that committee. |
| • | Members of the audit committee during a period in which we believe the company has aggressively accounted for its equity compensation plans. |
| • | Members of the compensation committee during a period in which executive compensation appears excessive relative to performance and peers, and where we believe the compensation committee has not already substantially addressed this issue. |
| • | Members of the compensation committee where the company has repriced options without contemporaneous shareholder approval. |
| • | The chair of the nominating committee, or where no chair exists, the nominating committee member with the longest tenure, where board member(s) at the most recent election of directors have received withhold votes from more than 30% of shares voting and the board has not taken appropriate action to respond to shareholder concerns. This may not apply in cases where BlackRock did not support the initial withhold vote. |
| • | The chair of the nominating committee, or where no chair exists, the nominating committee member with the longest tenure, where the board is not composed of a majority of independent directors. However, this would not apply in the case of a controlled company. |
| • | Where BlackRock obtains evidence that casts significant doubt on a director’s qualifications or ability to represent shareholders. |
| • | Where it appears the director has acted (at the company or at other companies) in a manner that compromises his or her reliability in representing the best long-term economic interests of shareholders. |
| • | Where a director has a pattern over a period of years of attending less than 75% of combined board and applicable key committee meetings. |
D-19
| • | Where a director has committed himself or herself to service on a large number of boards, such that we deem it unlikely that the director will be able to commit sufficient focus and time to a particular company (commonly referred to as “over-boarding”). While each situation will be reviewed on a case-by-case basis, BlackRock is most likely to withhold votes for over-boarding where a director is: 1) serving on more than four public company boards; or 2) is a chief executive officer at a public company and is serving on more than two public company boards in addition to the board of the company where they serve as chief executive officer. |
If a board maintains a classified structure, it is possible that the director(s) with whom we have a particular concern may not be subject to election in the year that the concern arises. In such situations, if we have a concern regarding a committee or committee chair, we generally register our concern by withholding votes from all members of the relevant committee who are subject to election that year.
Director independence
We expect that a board should be majority independent. We believe that an independent board faces fewer conflicts and is best prepared to protect shareholder interests. Common impediments to independence in the U.S. include but are not limited to:
| • | Employment by the company or a subsidiary as a senior executive within the previous five years |
| • | Status as a founder of the company |
| • | Substantial business or personal relationships with the company or the company’s senior executives |
| • | Family relationships with senior executives or founders of the company |
| • | An equity ownership in the company in excess of 20% |
Age limits / term limits
We encourage boards to routinely refresh their membership to ensure that new viewpoints are included in the boardroom. We believe that the nominating committee of the board has the ability to implement such refreshment. As a result, we typically oppose shareholder proposals imposing arbitrary limits on the pool of directors from which shareholders can choose their representatives. However, where boards find that age limits or term limits are the most efficient mechanism for ensuring routine board refreshment, we generally defer to the board’s determination in setting such limits.
Board size
We generally defer to the board in setting the appropriate size. We believe directors are generally in the best position to assess what size is optimal to ensure a board’s effectiveness. However, we may oppose boards that appear too small to allow for effective shareholder representation or too large to function efficiently.
Classified board of directors/staggered terms
A classified board of directors is one that is divided into classes (generally three), each of which is elected on a staggered schedule (generally for three years). At each annual meeting, only a single class of directors is subject to reelection (generally one-third of the entire board).
We believe that classification of the board dilutes shareholders’ right to evaluate promptly a board’s performance and limits shareholder selection of their representatives. By not having the mechanism to immediately address concerns we may have with any specific director, we may be required to register our concerns through our vote on the directors who are subject to election that year (see “Director elections” for additional detail). Furthermore, where boards are classified, director entrenchment is more likely, because review of board service generally only occurs every three years. Therefore, we typically vote against classification and for proposals to eliminate board classification.
D-20
Contested director elections
Most director elections are not competitive, but shareholders are sometimes presented with competing slates of director candidates. Generally, such proxy contests are the result of a shareholder (or group of shareholders) seeking to change the company’s strategy or address failures in the board’s oversight of management. The details of proxy contests are assessed on a case-by-case basis. We evaluate a number of factors, which may include, but are not limited to: the qualifications of the dissident and management candidates; the validity of the concerns identified by the dissident; the viability of both the dissident’s and management’s plans; the likelihood that the dissident’s solutions will produce the desired change; and whether the dissidents represent the best option for enhancing long term shareholder value.
| Cumulative | voting for directors |
Cumulative voting allocates one vote for each share of stock held, times the number of directors subject to election. A shareholder may cumulate his/her votes and cast all of them in favor of a single candidate, or split them among any combination of candidates. By making it possible to use their cumulated votes to elect at least one board member, cumulative voting is typically a mechanism through which minority shareholders attempt to secure board representation.
We typically oppose proposals that further the candidacy of minority shareholders whose interests do not coincide with our fiduciary responsibility. We may support cumulative voting proposals at companies where the board is not majority independent. We may support cumulative voting at companies that have a controlling shareholder. A cumulative voting structure is not consistent with a majority voting requirement, as it may interfere with the capacity of director candidates to achieve the required level of support. We may not support a cumulative voting proposal at a company that has adopted a majority voting standard.
| Director | compensation and equity programs |
We believe that compensation for independent directors should be structured to align the interests of the directors with those of shareholders, whom the directors have been elected to represent. We believe that independent director compensation packages based on the company’s long-term performance and that include some form of long-term equity compensation are more likely to meet this goal; therefore, we typically support proposals to provide such compensation packages. However, we will generally oppose shareholder proposals requiring directors to own a minimum amount of company stock, as we believe that companies should maintain flexibility in administering compensation and equity programs for independent directors, given each company’s and director’s unique circumstances. As discussed in further detail under the heading “Equity compensation plans” below, we believe that companies should prohibit directors from engaging in transactions with respect to their long term compensation that might disrupt the intended economic alignment between equity plan beneficiaries and shareholders.
| Indemnification | of directors and officers |
We generally support reasonable but balanced protection of directors and officers. We believe that failure to provide protection to directors and officers might severely limit a company’s ability to attract and retain competent leadership. We generally support proposals to provide indemnification that is limited to coverage of legal expenses. However, we may oppose proposals that provide indemnity for: breaches of the duty of loyalty; transactions from which a director derives an improper personal benefit; and actions or omissions not in good faith or those that involve intentional misconduct.
D-21
| Majority | vote requirements |
BlackRock generally supports proposals seeking to require director election by majority vote. Majority voting standards assist in ensuring that directors who are not broadly supported by shareholders are not elected to serve as their representatives. We note that majority voting is not appropriate in all circumstances, for example, in the context of a contested election. We also recognize that some companies with a plurality voting standard have adopted a resignation policy for directors who do not receive support from at least a majority of votes cast, and we believe that such a requirement can be generally equivalent to a majority voting regime. Where we believe that the company already has a sufficiently robust majority voting process in place, we may not support a shareholder proposal seeking an alternative mechanism.
| Separation | of chairman and CEO positions |
We believe that independent leadership is important in the board room. In the US there are two commonly accepted structures for independent board leadership: 1) an independent chairman; or 2) a lead independent director. We generally consider the designation of a lead independent director as an acceptable alternative to an independent chair if the lead independent director has a term of at least one year and has powers to: 1) set board meeting agendas; 2) call meetings of the independent directors; and 3) preside at meetings of independent directors. Where a company does not have a lead independent director that meets these criteria, we generally support the separation of chairman and CEO.
| Shareholder | access to the proxy |
We believe that long-term shareholders should have the opportunity, when necessary and under reasonable conditions, to nominate individuals to stand for election to the boards of the companies they own and to have those nominees included on the company’s proxy card. This right is commonly referred to as “proxy access”. In our view, securing a right of shareholders to nominate directors without engaging in a control contest can enhance shareholders’ ability to participate meaningfully in the director election process, stimulate board attention to shareholder interests, and provide shareholders an effective means of directing that attention where it is lacking. Given the complexity of structuring an appropriate proxy access mechanism and the brevity required of shareholder proposals, we generally expect that a shareholder proposal to adopt proxy access will describe general parameters for the mechanism, while providing the board with flexibility to design a process that is appropriate in light of the company’s specific circumstances. Proxy access mechanisms should provide shareholders with assurances that the mechanism will not be subject to abuse by short term investors, investors without a substantial investment in the company, or investors seeking to take control of the board. We will review proposals regarding the adoption of proxy access on a case-by-case basis in light of the specific terms of the proposal and the circumstances of the company.
| Auditors | and audit-related issues |
BlackRock recognizes the critical importance of financial statements that provide a complete and accurate portrayal of a company’s financial condition. Consistent with our approach to voting on boards of directors, we seek to hold the audit committee of the board responsible for overseeing the management of the audit function at a company, and may withhold votes from the audit committee’s members where the board has failed to facilitate quality, independent auditing. We take particular note of cases involving significant financial restatements or material weakness disclosures.
The integrity of financial statements depends on the auditor effectively fulfilling its role. To that end, we favor an independent auditor. In addition, to the extent that an auditor fails to reasonably identify and address issues that eventually lead to a significant financial restatement, or the audit firm has violated standards of practice that protect the interests of shareholders, we may also vote against ratification.
D-22
From time to time, shareholder proposals may be presented to promote auditor independence or the rotation of audit firms. We may support these proposals when they are consistent with our views as described above.
| Capital | structure proposals |
| Blank | check preferred |
We frequently oppose proposals requesting authorization of a class of preferred stock with unspecified voting, conversion, dividend distribution and other rights (“blank check” preferred stock) because they may serve as a transfer of authority from shareholders to the board and a possible entrenchment device. We generally view the board’s discretion to establish voting rights on a when-issued basis as a potential anti-takeover device, as it affords the board the ability to place a block of stock with an investor sympathetic to management, thereby foiling a takeover bid without a shareholder vote. Nonetheless, where the company appears to have a legitimate financing motive for requesting blank check authority, has committed publicly that blank check preferred shares will not be used for anti-takeover purposes, has a history of using blank check preferred stock for financings, or has blank check preferred stock previously outstanding such that an increase would not necessarily provide further anti-takeover protection but may provide greater financing flexibility, we may support the proposal.
| Equal | voting rights |
BlackRock supports the concept of equal voting rights for all shareholders. Some management proposals request authorization to allow a class of common stock to have superior voting rights over the existing common or to allow a class of common to elect a majority of the board. We oppose such differential voting power as it may have the effect of denying shareholders the opportunity to vote on matters of critical economic importance to them.
However, when a management or shareholder proposal requests to eliminate an existing dual-class voting structure, we seek to determine whether this action is warranted at that company at that time, and whether the cost of restructuring will have a clear economic benefit to shareholders. We evaluate these proposals on a case-by-case basis, and we consider the level and nature of control associated with the dual-class voting structure as well as the company’s history of responsiveness to shareholders in determining whether support of such a measure is appropriate.
| Increase | in authorized common shares |
BlackRock considers industry specific norms in our analysis of these proposals, as well as a company’s history with respect to the use of its common shares. Generally, we are predisposed to support a company if the board believes additional common shares are necessary to carry out the firm’s business. The most substantial concern we might have with an increase is the possibility of use of common shares to fund a poison pill plan that is not in the economic interests of shareholders.
| Increase | or issuance of preferred stock |
These proposals generally request either authorization of a class of preferred stock or an increase in previously authorized preferred stock. Preferred stock may be used to provide management with the flexibility to consummate beneficial acquisitions, combinations or financings on terms not necessarily available via other means of financing. We generally support these proposals in cases where the company specifies the voting, dividend, conversion and other rights of such stock where the terms of the preferred stock appear reasonable.
D-23
| Stock | splits and reverse stock splits |
We generally support stock splits that are not likely to negatively affect the ability to trade shares or the economic value of a share. We generally support reverse splits that are designed to avoid delisting or to facilitate trading in the stock, where the reverse split will not have a negative impact on share value (e.g. one class is reduced while others remain at pre-split levels). In the event of a proposal to reverse split that would not also proportionately reduce the company’s authorized stock, we apply the same analysis we would use for a proposal to increase authorized stock.
| Mergers, | asset sales, and other special transactions |
In reviewing merger and asset sale proposals, BlackRock’s primary concern is the best long-term economic interests of shareholders. While these proposals vary widely in scope and substance, we closely examine certain salient features in our analyses. The varied nature of these proposals ensures that the following list will be incomplete. However, the key factors that we typically evaluate in considering these proposals include:
| • | For mergers and asset sales, we assess the degree to which the proposed transaction represents a premium to the company’s trading price. In order to filter out the effects of pre-merger news leaks on the parties’ share prices, we consider a share price from multiple time periods prior to the date of the merger announcement. In most cases, business combinations should provide a premium. We may consider comparable transaction analyses provided by the parties’ financial advisors and our own valuation assessments. For companies facing insolvency or bankruptcy, a premium may not apply. |
| • | There should be a favorable business reason for the combination. |
| • | Unanimous board approval and arm’s-length negotiations are preferred. We will consider whether the transaction involves a dissenting board or does not appear to be the result of an arm’s-length bidding process. We may also consider whether executive and/or board members’ financial interests in a given transaction appear likely to affect their ability to place shareholders’ interests before their own. |
| • | We prefer transaction proposals that include the fairness opinion of a reputable financial advisor assessing the value of the transaction to shareholders in comparison to recent similar transactions. |
| Poison | pill plans |
Also known as Shareholder Rights Plans, these plans generally involve issuance of call options to purchase securities in a target firm on favorable terms. The options are exercisable only under certain circumstances, usually accumulation of a specified percentage of shares in a relevant company or launch of a hostile tender offer. These plans are often adopted by the board without being subject to shareholder vote.
Poison pill proposals generally appear on the proxy as shareholder proposals requesting that existing plans be put to a vote. This vote is typically advisory and therefore non-binding. We generally vote in favor of shareholder proposals to rescind poison pills.
Where a poison pill is put to a shareholder vote, our policy is to examine these plans individually. Although we oppose most plans, we may support plans that include a reasonable ‘qualifying offer clause.’ Such clauses typically require shareholder ratification of the pill, and stipulate a sunset provision whereby the pill expires unless it is renewed. These clauses also tend to specify that an all cash bid for all shares that includes a fairness opinion and evidence of financing does not trigger the pill, but forces either a special meeting at which the offer is put to a shareholder vote, or the board to seek the written consent of shareholders where shareholders could rescind the pill in their discretion. We may also support a pill where it is the only effective method for protecting tax or other economic benefits that may be associated with limiting the ownership changes of individual shareholders.
D-24
| Reimbursement | of expenses for successful shareholder campaigns |
Proxy contests and other public campaigns can be valuable mechanisms for holding boards of underperforming companies accountable to their shareholders. However, these campaigns can also lead to unwarranted cost and distraction for boards and management teams, and may be imposed by investors whose interests are not aligned with other investors. Therefore, we generally do not support proposals seeking the reimbursement of proxy contest expenses, even in situations where we support the shareholder campaign, as we believe that introducing the possibility of such reimbursement may incentivize disruptive and unnecessary shareholder campaigns.
| Remuneration | and benefits |
We note that there are both management and shareholder proposals related to executive compensation that appear on corporate ballots. We generally vote on these proposals as described below, except that we typically oppose shareholder proposals on issues where the company already has a reasonable policy in place that we believe is sufficient to address the issue. We may also oppose a shareholder proposal regarding executive compensation if the company’s history suggests that the issue raised is not likely to present a problem for that company.
| Advisory | resolutions on executive compensation (“Say on Pay”) |
In cases where there is a Say on Pay vote, BlackRock will respond to the proposal as informed by our evaluation of compensation practices at that particular company, and in a manner that appropriately addresses the specific question posed to shareholders. We believe that compensation committees are in the best position to make compensation decisions and should maintain significant flexibility in administering compensation programs, given their knowledge of the wealth profiles of the executives they seek to incentivize, the appropriate performance measures for the company, and other issues internal and/or unique to the company. We understand that compensation committees are undertaking their analysis in the context of a competitive marketplace for executive talent. We also believe that shareholders can express concern regarding executive compensation practices through their vote on directors, and our preferred approach to managing pay-for-performance disconnects is via a withhold vote for the compensation committee. As a result, our Say on Pay vote is likely to correspond with our vote on the directors who are compensation committee members responsible for making compensation decisions.
| Advisory | votes on the frequency of Say on Pay resolutions (“Say When on Pay”) |
BlackRock will generally opt for a triennial vote on Say on Pay. We believe that shareholders should undertake an annual review of executive compensation and express their concerns through their vote on the members of the compensation committee. As a result, it is generally not necessary to hold a Say on Pay vote on an annual basis, as the Say on Pay vote merely supplements the shareholder’s vote on Compensation Committee members. However, we may support annual Say on Pay votes in some situations, for example, where we conclude that a company has failed to align pay with performance.
| Claw | back proposals |
Claw back proposals are generally shareholder sponsored and seek recoupment of bonuses paid to senior executives if those bonuses were based on financial results that are later restated or were otherwise awarded as a result of deceptive business practices. We generally favor recoupment from any senior executive whose compensation was based on faulty financial reporting or deceptive business practices, regardless of that particular executive’s role in the faulty reporting. We typically support these proposals unless the company already has a robust claw back policy that sufficiently addresses our concerns.
D-25
| Employee | stock purchase plans |
An employee stock purchase plan (“ESPP”) gives the issuer’s employees the opportunity to purchase stock in the issuer, typically at a discount to market value. We believe these plans can provide performance incentives and help align employees’ interests with those of shareholders. The most common form of ESPP qualifies for favorable tax treatment under Section 423 of the Internal Revenue Code. Section 423 plans must permit all full-time employees to participate, carry restrictions on the maximum number of shares that can be purchased, carry an exercise price of at least 85 percent of fair market value on grant date with offering periods of 27 months or less, and be approved by shareholders. We will typically support qualified ESPP proposals.
| Equity | compensation plans |
BlackRock supports equity plans that align the economic interests of directors, managers and other employees with those of shareholders. We believe that boards should establish policies prohibiting use of equity awards in a manner that could disrupt the intended alignment with shareholder interests, for example: use of the stock as collateral for a loan; use of the stock in a margin account; use of the stock (or an unvested award) in hedging or derivative transactions. We may support shareholder proposals requesting the board to establish such policies.
Our evaluation of equity compensation plans is based on a company’s executive pay and performance relative to peers and whether the plan plays a significant role in a pay-for-performance disconnect. We generally oppose plans that contain “evergreen” provisions allowing for the unlimited increase of shares reserved without requiring further shareholder approval after a reasonable time period. We also generally oppose plans that allow for repricing without shareholder approval. We may also oppose plans that provide for the acceleration of vesting of equity awards even in situations where an actual change of control may not occur. We encourage companies to structure their change of control provisions to require the termination of the covered employee before acceleration or special payments are triggered. Finally, we may oppose plans where we believe that the company is aggressively accounting for the equity delivered through their stock plans.
| Golden | parachutes |
Golden parachutes provide for compensation to management in the event of a change in control. We generally view golden parachutes as encouragement to management to consider transactions that might be beneficial to shareholders. However, a large potential payout under a golden parachute arrangement also presents the risk of motivating a management team to support a sub-optimal sale price for a company.
We may support shareholder proposals requesting that implementation of such arrangements require shareholder approval. We generally support proposals requiring shareholder approval of plans that exceed 2.99 times an executive’s current salary and bonus, including equity compensation.
When determining whether to support or oppose an advisory vote on a golden parachute plan (“Say on Golden Parachutes”), we normally support the plan unless it appears to result in payments that are excessive or detrimental to shareholders. In evaluating golden parachute plans, BlackRock may consider several factors, including:
| • | whether we believe that the triggering event is in the best interest of shareholders; |
| • | an evaluation of whether management attempted to maximize shareholder value in the triggering event; |
| • | the percentage of total transaction value that will be transferred to the management team, rather than shareholders, as a result of the golden parachute payment; |
D-26
| • | whether excessively large excise tax gross up payments are part of the payout; |
| • | whether the pay package that serves as the basis for calculating the golden parachute payment was reasonable in light of performance and peers; and/or |
| • | whether the golden parachute payment will have the effect of rewarding a management team that has failed to effectively manage the company. |
It may be difficult to anticipate the results of a plan until after it has been triggered; as a result, BlackRock may vote against a Say on Golden Parachute proposal even if the golden parachute plan under review was approved by shareholders when it was implemented.
| Option | exchanges |
BlackRock may support a request to exchange underwater options under the following circumstances: the company has experienced significant stock price decline as a result of macroeconomic trends, not individual company performance; directors and executive officers are excluded; the exchange is value neutral or value creative to shareholders; and there is clear evidence that absent repricing the company will suffer serious employee incentive or retention and recruiting problems. BlackRock may also support a request to exchange underwater options in other circumstances, if we determine that the exchange is in the best interest of shareholders.
| Pay-for-Performance | plans |
In order for executive compensation exceeding $1 million to qualify for federal tax deductions, the Omnibus Budget Reconciliation Act (OBRA) requires companies to link that compensation, for the Company’s top five executives, to disclosed performance goals and submit the plans for shareholder approval. The law further requires that a compensation committee comprised solely of outside directors administer these plans. Because the primary objective of these proposals is to preserve the deductibility of such compensation, we generally favor approval in order to preserve net income.
| Pay-for-Superior-Performance |
These are typically shareholder proposals requesting that compensation committees adopt policies under which a portion of equity compensation requires the achievement of performance goals as a prerequisite to vesting. We generally believe these matters are best left to the compensation committee of the board and that shareholders should not set executive compensation or dictate the terms thereof. We may support these proposals if we have a substantial concern regarding the company’s compensation practices over a significant period of time, the proposals are not overly prescriptive, and we believe the proposed approach is likely to lead to substantial improvement.
| Supplemental | executive retirement plans |
BlackRock may support shareholder proposals requesting to put extraordinary benefits contained in Supplemental Executive Retirement Plans (“SERP”) agreements to a shareholder vote unless the company’s executive pension plans do not contain excessive benefits beyond what is offered under employee-wide plans.
| Social, | ethical and environmental issues |
See “Global Corporate Governance and Engagement Principles.”
D-27
| General | corporate governance matters |
| Adjourn | meeting to solicit additional votes |
We generally support such proposals unless the agenda contains items that we judge to be detrimental to shareholders’ best long-term economic interests.
| Bundled | proposals |
We believe that shareholders should have the opportunity to review substantial governance changes individually without having to accept bundled proposals. Where several measures are grouped into one proposal, BlackRock may reject certain positive changes when linked with proposals that generally contradict or impede the rights and economic interests of shareholders.
| Corporate | political activities |
Portfolio companies may engage in certain political activities, within legal and regulatory limits, in order to influence public policy consistent with the companies’ values and strategies, and thus serve shareholders’ best long-term economic interests. These activities can create risks, including: the potential for allegations of corruption; the potential for reputational issues associated with a candidate, party or issue; and risks that arise from the complex legal, regulatory and compliance considerations associated with corporate political activity. We believe that companies which choose to engage in political activities should develop and maintain robust processes to guide these activities and to mitigate risks, including a level of board oversight.
When presented with shareholder proposals requesting increased disclosure on corporate political activities, we may consider the political activities of that company and its peers, the existing level of disclosure, and our view regarding the associated risks. We generally believe that it is the duty of boards and management to determine the appropriate level of disclosure of all types of corporate activity, and we are generally not supportive of proposals that are overly prescriptive in nature. We may determine to support a shareholder proposal requesting additional reporting of corporate political activities where there seems to be either a significant potential threat or actual harm to shareholders’ interests and where we believe the company has not already provided shareholders with sufficient information to assess the company’s management of the risk.
Finally, we believe that it is not the role of shareholders to suggest or approve corporate political activities; therefore we generally do not support proposals requesting a shareholder vote on political activities or expenditures.
| Other | business |
We oppose giving companies our proxy to vote on matters where we are not given the opportunity to review and understand those measures and carry out an appropriate level of shareholder oversight.
| Reincorporation |
Proposals to reincorporate from one state or country to another are most frequently motivated by considerations of anti-takeover protections or cost savings. Where cost savings are the sole issue, we will typically favor reincorporating. In all instances, we will evaluate the changes to shareholder protection under the new charter/articles/by-laws to assess whether the move increases or decreases shareholder protections. Where we find that shareholder protections are diminished, we will support reincorporation if we determine that the overall benefits outweigh the diminished rights.
D-28
| Shareholders’ | right to act by written consent |
In exceptional circumstances and with sufficiently broad support, shareholders should have the opportunity to raise issues of substantial importance without having to wait for management to schedule a meeting. We therefore believe that shareholders should have the right to solicit votes by written consent provided that: 1) there are reasonable requirements to initiate the consent solicitation process in order to avoid the waste of corporate resources in addressing narrowly supported interests; and 2) support from a minimum of 50% of outstanding shares is required to effectuate the action by written consent. We may oppose shareholder proposals requesting the right to act by written consent in cases where the proposal is structured for the benefit of a dominant shareholder to the exclusion of others, or if the proposal is written to discourage the board from incorporating appropriate mechanisms to avoid the waste of corporate resources when establishing a right to act by written consent. Additionally, we may oppose shareholder proposals requesting the right to act by written consent if the company already provides a shareholder right to call a special meeting that we believe offers shareholders a reasonable opportunity to raise issues of substantial importance without having to wait for management to schedule a meeting.
| Shareholders’ | right to call a special meeting |
In exceptional circumstances and with sufficiently broad support, shareholders should have the opportunity to raise issues of substantial importance without having to wait for management to schedule a meeting. We therefore believe that shareholders should have the right to call a special meeting in cases where a reasonably high proportion of shareholders (typically a minimum of 15% but no higher than 25%) are required to agree to such a meeting before it is called, in order to avoid the waste of corporate resources in addressing narrowly supported interests. However, we may oppose this right in cases where the proposal is structured for the benefit of a dominant shareholder to the exclusion of others. We generally believe that a right to act via written consent is not a sufficient alternative to the right to call a special meeting.
| Simple | majority voting |
We generally favor a simple majority voting requirement to pass proposals. Therefore, we will support the reduction or the elimination of supermajority voting requirements to the extent that we determine shareholders’ ability to protect their economic interests is improved. Nonetheless, in situations where there is a substantial or dominant shareholder, supermajority voting may be protective of public shareholder interests and we may support supermajority requirements in those situations.
D-29
BLACK ROCK
PROXY VOTING GUIDELINES FOR CANADIAN SECURITIES
January 2013
| D-30 | ||||
| D-30 | ||||
| D-31 | ||||
| D-34 | ||||
| D-34 | ||||
| D-36 | ||||
| D-38 | ||||
| D-38 |
These guidelines should be read in conjunction with BlackRock’s Global Corporate Governance and Engagement Principles, which are available on-line at www.blackrock.com
BlackRock, Inc. and its subsidiaries (collectively, “BlackRock”) seek to make proxy voting decisions in the manner most likely to protect and promote the economic value of the securities held in client accounts. The following issue-specific proxy voting guidelines (the “Guidelines”) are intended to summarize BlackRock’s general philosophy and approach to issues that may commonly arise in the proxy voting context for Canadian securities. These Guidelines are not intended to limit the analysis of individual issues at specific companies and are not intended to provide a guide to how BlackRock will vote in every instance. Rather, they share our view about corporate governance issues generally, and provide insight into how we typically approach issues that commonly arise on corporate ballots. They are applied with discretion, taking into consideration the range of issues and facts specific to the company and the individual ballot item.
Under Canadian securities laws, publicly offered mutual funds such as the Canadian iShares funds have certain voting prohibitions if such funds hold another public mutual fund that is managed by the same manager or an affiliate. The same prohibition is also a condition in exemptive relief permitting BlackRock-sponsored Canadian funds to hold other BlackRock-sponsored funds. As a result, any BlackRock-sponsored Canadian funds which hold other BlackRock-sponsored fund(s) are not permitted to vote any proxies received from such underlying BlackRock-sponsored fund(s), even if the voting would be conducted by an independent fiduciary.
These guidelines are divided into six key themes which group together the issues that frequently appear on the agenda of annual and extraordinary meetings of shareholders.
The six key themes are:
| • | Boards and directors |
| • | Auditors and audit-related issues |
| • | Capital structure proposals |
| • | Remuneration and benefits |
D-30
| • | Social, ethical and environmental issues |
| • | General corporate governance matters |
Director elections
BlackRock generally supports board nominees in most uncontested elections. BlackRock may withhold votes from certain directors on the board or members of particular board committees (or prior members, as the case may be) in certain situations, including, but not limited to:
| • | The independent chair or lead independent director and members of the governance committee, where a board fails to implement shareholder proposals that receive a majority of votes cast at a prior shareholder meeting, and the proposals, in our view, have a direct and substantial impact of shareholders’ fundamental rights or long-term economic interests. |
| • | The independent chair or lead independent director and members of the governance committee, where a board implements or renews a poison pill without seeking shareholder approval beforehand or within a reasonable period of time after implementation. |
| • | An insider or affiliated outsider who sits on the board’s audit, compensation, nominating or governance committees, which we believe generally should be entirely independent. However, BlackRock will examine a board’s complete profile when questions of independence arise prior to casting a withhold vote for any director. For controlled companies, as defined by the more stringent of Canadian regulatory or U.S. stock exchanges definitions, we will typically only vote against insiders or affiliates who sit on the audit committee, but not other key committees. For companies listed on venture stock exchanges, we will typically only vote against insiders or affiliates who sit on the audit committee, but not other key committees. |
| • | Members of the audit committee during a period when the board failed to facilitate quality, independent auditing, for example, if substantial accounting irregularities suggest insufficient oversight by that committee. |
| • | Members of the compensation committee during a period in which executive compensation appears excessive relative to performance and peers, and where we believe the compensation committee has not already substantially addressed this issue. |
| • | Members of the compensation committee where the company has repriced options without shareholder approval. |
| • | The chair of the nominating committee, or where no chair exists, the nominating committee member with the longest tenure, where board member(s) at the most recent election of directors have received withhold votes from more than 30% of shares voting and the board has not taken appropriate action to respond to shareholder concerns. This may not apply in cases where BlackRock did not support the initial withhold vote. |
| • | The chair of the nominating committee where the board is not composed of a majority of independent directors. However, this would not apply in the case of a controlled company or a company listed on a venture exchange. |
| • | Where BlackRock obtains evidence that casts significant doubt on a director’s qualifications or ability to represent shareholders. |
| • | Where it appears the director has acted (at the company or at other companies) in a manner that compromises his or her reliability in representing the best long-term economic interests of shareholders. |
| • | Where a director has a pattern over a period of years of attending less than 75% of combined board and applicable key committee meetings. |
D-31
BlackRock believes that shareholders should have the opportunity to elect each board member individually without having to accept a single slate. Where a company does not allow investors to vote for directors individually BlackRock may withhold for an entire slate of directors where director(s) have acted sufficiently contrary to shareholders’ interests to raise substantial concern about several directors or the board as a whole. The decision to support or oppose a slate of directors will often require the evaluation of each individual director, per the above parameters, and a balancing of the overall concerns regarding the nominees.
If a board maintains a classified structure, it is possible that the director(s) with whom we have a particular concern may not be subject to election in the year that the concern arises. In such situations, if we have a concern regarding a committee or committee chair, we generally register our concern by withholding votes from all members of the relevant committee who are subject to election that year.
Director independence
We expect that a board should be majority independent. We believe that an independent board faces fewer conflicts and is best prepared to protect shareholder interests. Common impediments to independence in Canada include but are not limited to:
| • | Employment by the company or a subsidiary as a senior executive within the previous five years |
| • | Substantial business or personal relationships with the company or the company’s senior executives |
| • | Family relationships with senior executives or founders of the company |
| • | An equity ownership in the company in excess of 20% |
| Age | limits / term limits |
We encourage boards to routinely refresh their membership to ensure that new viewpoints are included in the boardroom. We believe that the nominating committee of the board has the ability to implement such refreshment. As a result, we typically oppose shareholder proposals imposing arbitrary limits on the pool of directors from which shareholders can choose their representatives, However, where boards find that age limits or term limits are the most efficient mechanism for ensuring routine board refreshment, we generally defer to the board’s determination in setting such limits.
| Board | size |
We generally defer to the board in setting the appropriate size. We believe directors are generally in the best position to assess what size is optimal to ensure a board’s effectiveness. However, we may oppose boards that appear too small to allow for effective shareholder representation or too large to function efficiently.
| Classified | board of directors / staggered terms |
A classified board of directors is one that is divided into classes (generally three), each of which is elected on a staggered schedule (generally for three years). At each annual meeting, only a single class of directors is subject to re-election (generally one-third of the entire board).
We believe that classification of the board dilutes shareholders’ right to evaluate promptly a board’s performance and limits shareholder selection of their representatives. By not having the mechanism to immediately address concerns we may have with any specific director, we may be required to register our concerns through our vote on the directors who are subject to election that year (see “Director elections” for additional detail). Furthermore, where boards are classified, director entrenchment is more likely, because review of board service generally only occurs every three years. Therefore, we typically vote against classification and for proposals to eliminate board classification.
D-32
| Contested | director elections |
Most director elections are not competitive, but shareholders are sometimes presented with competing slates of director candidates. Generally, such proxy contests are the result of a shareholder (or group of shareholders) seeking to change the company’s strategy or address failures in the board’s oversight of management. The details of proxy contests are assessed on a case-by-case basis. We evaluate a number of factors, which may include, but are not limited to: the qualifications of the dissident and management candidates; the validity of the concerns identified by the dissident; the viability of both the dissident’s and management’s plans; the likelihood that the dissident’s solutions will produce the desired change; and whether the dissidents represent the best option for enhancing long term shareholder value.
| Cumulative | voting for directors |
Cumulative voting allocates one vote for each share of stock held, times the number of directors subject to election. A shareholder may cumulate his/her votes and cast all of them in favor of a single candidate, or split them among any combination of candidates. By making it possible to use their cumulated votes to elect at least one board member, cumulative voting is typically a mechanism through which minority shareholders attempt to secure board representation.
We typically oppose proposals that further the candidacy of minority shareholders whose interests do not coincide with our fiduciary responsibility. We may support cumulative voting proposals at companies where the board is not majority independent. We may support cumulative voting proposals at companies where company has a controlling shareholder. A cumulative voting structure is not consistent with a majority voting requirement, as it may interfere with the capacity of director candidates to achieve the required level of support. We may not support a cumulative voting proposal at a company that has adopted a majority voting standard.
| Director | compensation and equity plans |
We believe that compensation for independent outside directors should be structured to align the interests of the directors with those of shareholders, whom they have been elected to represent. We believe that independent outside director compensation packages based on the company’s long term performance and that include some form of equity compensation are more likely to meet this goal; therefore, we typically support proposals to provide such compensation packages. However, we will generally oppose shareholder proposals requiring directors to own a minimum amount of company stock, as we believe that companies should maintain flexibility in administering compensation and equity programs for independent directors, given each company’s and director’s unique circumstances. As discussed in further detail under the heading “Equity compensation plans” below, we believe that companies should prohibit directors from engaging in transactions with respect to their long term compensation that might disrupt the intended economic alignment between equity plan beneficiaries and shareholders.
| Majority | vote requirements |
BlackRock generally supports proposals seeking to require director election by majority vote. Majority voting standards assist in ensuring that directors who are not broadly supported by shareholders are not elected to serve as their representatives. We note that majority voting is not appropriate in all circumstances, for example, in the context of a contested election. We also recognize that some companies with a plurality voting standard have adopted a resignation policy for directors who do not receive support from at least a majority of votes cast, and we believe that such a requirement can be generally equivalent to a majority voting regime. Where we believe the majority vote proposal is reasonable and does not unnecessarily restrict a board’s ability to allow a director to continue serving where appropriate, we will generally support the proposal. Where we believe that the company already has a sufficiently robust majority voting process in place, we may not support a shareholder proposal seeking an alternative mechanism.
D-33
| Separation | of chairman and CEO positions |
We believe that independent leadership is important in the board room. Further, National Policy 58-201 states “the chair of the board should be an independent director. Where this is not appropriate, an independent director should be appointed to act as ‘lead director’. However, either an independent chair or an independent lead director should act as the effective leader of the board and ensure that the board’s agenda will enable it to successfully carry out its duties.” We therefore generally consider the designation of an independent lead director as an acceptable alternative to an independent chair if the independent lead director meets this definition. Where a company does not have an independent chair or an independent lead director that meet these criteria, we generally support the separation of chairman and CEO.
| Auditors | and audit-related issues |
BlackRock recognizes the critical importance of financial statements that provide a complete and accurate portrayal of a company’s financial condition. Consistent with our approach to voting on boards of directors, we seek to hold the audit committee of the board responsible for overseeing the management of the audit function at a company, and may withhold votes from the audit committee’s members where the board has failed to facilitate quality, independent auditing. We take particular note of cases involving significant financial restatements or material weakness disclosures.
The integrity of financial statements depends on the auditor effectively fulfilling its role. To that end, we favor an independent auditor. In addition, to the extent that an auditor fails to reasonably identify and address issues that eventually lead to a significant financial restatement, or the audit firm has violated standards of practice that protect the interests of shareholders, we may also vote against ratification.
From time to time, shareholder proposals may be presented to promote auditor independence or the rotation of audit firms. We may support these proposals when they are consistent with our views as described above.
| Capital | structure proposals |
| Blank | check preferred |
We frequently oppose proposals requesting authorization of a class of preferred stock with unspecified voting, conversion, dividend distribution and other rights (“blank check” preferred stock) because they may serve as a transfer of authority from shareholders to the board and a possible entrenchment device. We generally view the board’s discretion to establish voting rights on a when-issued basis as a potential anti-takeover device, as it affords the board the ability to place a block of stock with an investor sympathetic to management, thereby foiling a takeover bid without a shareholder vote. Nonetheless, where the company appears to have a legitimate financing motive for requesting blank check authority, has committed publicly that blank check preferred shares will not be used for anti-takeover purposes, has a history of using blank check preferred stock for financings, or has blank check preferred stock previously outstanding such that an increase would not necessarily provide further anti-takeover protection but may provide greater financing flexibility, we may support the proposal.
| Equal | voting rights |
BlackRock supports the concept of equal voting rights for all shareholders. Some management proposals request authorization to allow a class of common stock to have superior voting rights over the existing common or to allow a class of common to elect a majority of the board. We oppose such differential voting power as it may have the effect of denying shareholders the opportunity to vote on matters of critical economic importance to them.
D-34
However, when a management or shareholder proposal requests to eliminate an existing dual-class voting structure, we seek to determine whether this action is warranted at that company at that time, and whether the cost of restructuring will have a clear economic benefit to shareholders. We evaluate these proposals on a case-by-case basis, and we consider the level and nature of control associated with the dual-class voting structure as well as the company’s history of responsiveness to shareholders in determining whether support of such a measure is appropriate.
| Mergers, | asset sales, and other special transactions |
In reviewing merger and asset sale proposals, BlackRock’s primary concern is the best long-term economic interests of shareholders. While these proposals vary widely in scope and substance, we closely examine certain salient features in our analyses. The varied nature of these proposals ensures that the following list will be incomplete. However, the key factors that we typically evaluate in considering these proposals include:
| • | For mergers and asset sales, we assess the degree to which the proposed transaction represents a premium to the company’s trading price. In order to filter out the effects of pre-merger news leaks on the parties’ share prices, we consider a share price from multiple time periods prior to the date of the merger announcement. In most cases, business combinations should provide a premium. We may consider comparable transaction analyses provided by the parties’ financial advisors and our own valuation assessments. For companies facing insolvency or bankruptcy, a premium may not apply. |
| • | There should be a favorable business reason for the combination. |
| • | Unanimous board approval and arm’s-length negotiations are preferred. We will consider whether the transaction involves a dissenting board or does not appear to be the result of an arm’s-length bidding process. We may also consider whether executive and/or board members’ financial interests in a given transaction appear likely to affect their ability to place shareholders’ interests before their own. |
| • | We prefer transaction proposals that include the fairness opinion of a reputable financial advisor assessing the value of the transaction to shareholders in comparison to recent similar transactions. |
Poison pill plans
Also known as Shareholder Rights Plans, these plans generally involve issuance of call options to purchase securities in a target firm on favorable terms. The options are exercisable only under certain circumstances, usually accumulation of a specified percentage of shares in a relevant company or launch of a hostile tender offer. Canadian corporations are required to submit any poison pill to a shareholder vote within six months following the adoption of the plan by the board.
Our policy is to examine these plans individually, taking into account the design and intent of each plan. We generally support plans that are designed to ensure the equal treatment of all shareholders in a takeover situation. In making this determination, we seek to ensure that the plan includes a reasonable Permitted Bid clause allowing for shareholders to determine for themselves the acceptability of any bid for their shares. A favorable Permitted Bid clause should include clear definitions of key elements of the plan, set a reasonable time period (typically not longer than 60 days) for a bid in order to allow a board to seek superior alternatives, and establish a sufficiently high triggering threshold for the pill. Further, we look for plans that stipulate a sunset provision whereby the pill expires unless it is renewed by shareholders from time-to-time, generally every three years. We will typically oppose poison pills that do not provide for a reasonable Permitted Bid or that provides extensive discretion to the board in a takeover situation, potentially preventing shareholders the opportunity to accept a bid for their shares.
D-35
Stock splits and reverse stock splits
We generally support stock splits that are not likely to negatively affect the ability to trade shares or the economic value of a share. We generally support reverse splits that are designed to avoid delisting or to facilitate trading in the stock, where the reverse split will not have a negative impact on share value (e.g. one class is reduced while others remain at pre-split levels).
We note that there are both management and shareholder proposals related to executive compensation that appear on corporate ballots. We generally vote on these proposals as described below, except that we typically oppose shareholder proposals on issues where the company already has a policy in place that we believe is sufficient to address the issue. We may also oppose a shareholder proposal regarding executive compensation if the company’s history suggests that the issue raised is not likely to present a problem for that company.
| Adopt | advisory resolutions on executive compensation |
BlackRock generally opposes proposals asking for companies to adopt advisory resolutions on executive compensation (“Say-on-Pay”). We believe that compensation committees are in the best position to make compensation decisions and should maintain significant flexibility in administering compensation programs, given their knowledge of the wealth profiles of the executives they seek to incentivize, the appropriate performance measures for the company, and other issues unique to the company. In our view, shareholders have a sufficient and much more powerful “say-on-pay” today in the form of director elections, in particular with regards to members of the compensation committee.
Advisory resolutions on compensation committee reports
In cases where there is an advisory vote on compensation, BlackRock will respond to the proposal as informed by our evaluation of compensation practices at that particular company, and in a manner that appropriately addresses the specific question posed to shareholders. Our vote is likely to correspond with our vote on the directors who are compensation committee members responsible for making compensation decisions.
Claw back proposals
Claw back proposals are generally shareholder sponsored and seek recoupment of bonuses paid to senior executives if those bonuses were based on financial results that are later restated or were otherwise awarded as a result of deceptive business practices. We generally favor recoupment from any executive whose compensation was based on faulty financial reporting or deceptive business practices, regardless of that particular executive’s role in the faulty reporting. We generally support these proposals.
Employee stock purchase plans
An employee stock purchase plan (“ESPP”) gives the issuer’s employees the opportunity to purchase stock in the issuer, typically at a discount to market value. We believe these plans can provide performance incentives and help align employees’ interests with those of shareholders. The most common form of ESPP qualifies for favorable tax treatment under the Income Tax Act (Canada) (“ITA”). The ITA sets out conditions that such ESPP’s are required to satisfy. We will typically support ESPP proposals that (1) satisfy the requirements of the ITA, and (2) result in voting power dilution of ten percent or less.
D-36
Equity compensation plans
BlackRock generally supports equity plans that align the economic interests of directors, managers and other employees with those of shareholders, while limiting dilution to existing shareholders. Our evaluation of equity compensation plans is based on the cost to shareholders, relative to the company’s peers and its performance. BlackRock reviews equity compensation cost and dilution models provided by third party research vendors in making our voting decisions on equity plans.
In principle, we oppose the repricing and exchange of options, but we will consider the impact of such features on high-tech, emerging and growth companies and merger situations. Such consideration generally will focus on the cost-benefit relationship. Inappropriate repricings without shareholder approval may lead us to oppose a company’s proposed future use of equity compensation despite other attractive features of a plan.
We believe that boards should establish policies prohibiting use of equity awards in a manner that could disrupt the intended alignment with shareholder interests, for example: use of the stock as collateral for a loan; use of the stock in a margin account; use of the stock (or an unvested award) in hedging or derivative transactions. We may support shareholder proposals requesting the board to establish such policies.
Golden parachutes
Golden parachutes provide for compensation to management in the event of a change in control. We generally view this as encouragement to management to consider proposals that might be beneficial to shareholders. We normally support golden parachutes put to shareholder vote unless there is clear evidence of excess or abuse. We may also support shareholder proposals requesting that implementation of such arrangements require shareholder approval. In particular, we generally support proposals requiring shareholder approval of plans that exceed 2.99 times an executive’s current salary and bonus, including equity compensation.
Option exchanges
BlackRock may support a request to exchange underwater options under the following circumstances: the company has experienced significant stock price decline as a result of macroeconomics trends, not individual company performance; directors and executives officers are excluded; the exchange is value neutral or value creative to shareholders; and there is clear evidence that absent repricing the company will suffer serious employee incentive or retention and recruiting problems. BlackRock may also support a request to exchange underwater options in other circumstances, if we determine that the exchange is in the best interest of shareholders.
Pay-for-superior performance
These are typically shareholder proposals requesting that compensation committees adopt policies under which a portion of equity compensation requires the achievement of performance goals as a prerequisite to vesting. We generally believe these matters are best left to the compensation committee of the board and that shareholders should not set executive compensation or dictate the terms thereof. We may support these proposals if we have a substantial concern regarding the company’s compensation practices over a significant period of time, the proposals are not overly prescriptive, and we believe the proposed approach is likely to lead to substantial improvement. However, our preferred approach to managing pay-for-superior performance disconnect is via a withhold vote for the compensation committee.
D-37
Supplemental executive retirement plans
BlackRock may support shareholder proposals requesting to put extraordinary benefits contained in Supplemental Executive Retirement Plans (“SERP”) agreements to a shareholder vote unless the company’s executive pension plans do not contain excessive benefits beyond what is offered under employee-wide plans.
Social, ethical and environmental issues
See “Global Corporate Governance and Engagement Principles.”
General corporate governance matters
Adjourn meeting to solicit additional votes
We generally support such proposals unless the agenda contains items that we judge to be detrimental to shareholders’ best long-term economic interests.
Bundled proposals
We believe that shareholders should have the opportunity to review substantial governance changes individually without having to accept bundled proposals. Where several measures are grouped into one proposal, BlackRock may reject certain positive changes when linked with proposals that generally contradict or impede the rights and economic interest of shareholders.
Other business
We oppose giving companies our proxy to vote on matters where we are not given the opportunity to review and understand those measures and carry-out an appropriate level of shareholder oversight.
Ratify acts of board and management
Some companies propose that shareholders ratify all acts of directors and/or officers taken in the previous year. In most cases, shareholder ratification does not preclude future shareholder action in the event that wrongdoing is discovered. We generally vote to ratify all acts of directors and/or officers taken in the previous year unless there is clear evidence of negligence or action counter to shareholder interests.
Reincorporation
Proposals to reincorporate from one province or country to another are quite uncommon in Canada. Where cost savings are the sole issue, we will typically favor reincorporating. In all instances, we will evaluate the changes to shareholder protection under the new charter/articles/by-laws to assess whether the move increases or decreases shareholder protections. Where we find that shareholder protections are diminished, we will generally support reincorporation if we determine that the overall benefits outweigh the diminished rights.
Simple majority voting
We generally favor a simple majority voting requirement to pass proposals. Therefore, we will support the reduction or the elimination of supermajority voting requirements to the extent that we determined shareholders’ ability to protect their economic interests is improved. Nonetheless, in situations where there is a substantial or dominant shareholder, supermajority voting may be protective of shareholder interest and we may support such requirements in those situations.
D-38
Stakeholder provisions
Stakeholder provisions introduce the concept that the board may consider the interests of constituencies other than shareholders when making corporate decisions. Stakeholder interests vary widely and are not necessarily consistent with the best long-term economic interests of shareholders, whose capital is at risk in the ownership of a public company. We believe the board’s fiduciary obligation is to ensure management is employing this capital in the most efficient manner so as to maximize shareholder value, and we oppose any provision that suggests the board should do otherwise.
D-39
BLACKROCK
PROXY VOTING GUIDELINES FOR LATIN AMERICAN SECURITIES
January 2013
| D-40 | ||||
| D-41 | ||||
| D-41 | ||||
| D-42 | ||||
| D-44 | ||||
| D-45 | ||||
| D-46 |
These guidelines should be read in conjunction with BlackRock’s Global Corporate Governance and Engagement Principles, which are available on-line at www.blackrock.com
These voting guidelines cover issues specific to certain Latin American markets in which BlackRock is a large investor. If you are interested in our approach to governance in a market that is not specifically addressed in this document, you can refer to BlackRock’s Global Corporate Governance and Engagement Principles, which provide a broad overview of our philosophy regarding governance. We also invite our portfolio companies to reach out to BlackRock’s Corporate Governance team directly to discuss any questions regarding governance issues.
These guidelines are intended only to give an indication of how we are likely to vote. We assess voting issues on a case-by-case basis, taking into account the circumstances of the company, and our voting decisions at any individual shareholder meeting may diverge from the general approach described in these guidelines.
BlackRock expects companies to observe the relevant laws and regulations of their market, as well as local guidelines on corporate governance best practice. Local governance best practice codes may be underpinned by an approach that allows companies not to adopt recommended practices as long as they explain why they have not. BlackRock agrees that individual companies may have good reasons for pursuing an atypical approach to governance, and asks companies to frame their explanations for such alternative approaches in the context of why not complying with the recommended practices better serves shareholders’ long-term interests.
In many Latin American markets, companies have historically been controlled by a single owner or a small group of owners, who have turned to the public equity markets as a source of capital without ceding control of the company to the owners of publicly traded shares. In Latin America, these closely held firms are sometimes viewed as more reliable investment opportunities than companies with a dispersed ownership base (sometimes referred to as “dispersed companies” or “ownerless companies”) because the controlling shareholder can be addressed directly regarding questions of corporate strategy and is known to have a level of long-term commitment to the performance of the company.
As investors from other markets have increasingly viewed publicly traded companies in Latin America as an opportunity for portfolio growth and diversification, BlackRock encourages all issuers to adopt disclosure and operational processes to facilitate the participation of foreign investors in the development of governance policy and, specifically, at meetings of shareholders. Such changes might include: publishing the shareholder meeting circular at least 45 days prior to the meeting taking place; providing biographical information regarding director candidates as part of the shareholder meeting
D-40
information circular; ensuring that the Investor Relations team includes individuals who speak languages commonly used by the company’s foreign shareholders; or providing dedicated seats on the board for minority investors.
COUNTRY-SPECIFIC CONSIDERATIONS
The Sao Paulo stock exchange or BOVESPA currently offers four listing levels (basic, Nivel 1, Nivel 2 and the Novo Mercado) that require increasingly stringent corporate governance standards. Additionally, all Brazilian companies follow, on a comply-or-explain basis, The Code of Good Corporate Governance administered by the Comissão de Valores Mobiliários or CVM (the counterpart of the U.S. Securities and Exchange Commission). Furthermore, The Brazilian Institute of Good Corporate Governance (IBGC) has published a best practices code for voluntary adoption that aims to strengthen governance standards in the market.
While increasing capital from foreign investors has recently diversified Brazilian companies’ ownership base and increased the average free float, corporate ownership typically remains highly concentrated. Traditionally, shareholder meetings have relied on the physical presence of shareholders. This characteristic explains why information is often not available in advance of the meeting and the market’s overall relative lack of disclosure.
Boards and directors
The Brazilian Corporations Law mandates a minimum of three directors, while the CVM recommends five to nine directors with a minimum of two directors having expertise in finance and accounting. The boards of companies listed on the Novo Mercado are required to have at least 20% of their directors be independent. The IBGC code recommends boards to have at least a majority of independent directors. The Brazilian Corporations law allows minority and preferred shareholders present at the meeting to appoint one member each to the board of directors.
In addition to the board of directors, companies typically have an executive officer board and a fiscal council that is responsible for overseeing audit-related board functions. Brazilian companies generally do not have audit or other board committees.
Shareholders are often presented with the directors for election bundled on a slate. Candidate information is not necessarily available until the shareholder meeting. Minority shareholder representatives to the board are most often identified by minority shareholders at the shareholder meeting; as a result, shareholders voting via proxy may not be able to meaningfully identify their preferred candidates. In the event that the names of the board candidates are not available ahead of the meeting, we may evaluate the current board composition and assess any specific problems or concerns at the board or the company.
In recognition of local market practices, BlackRock generally votes to support director slates in Brazil, even in the absence of specific information regarding their identities. We are likely to oppose director slates in situations where we identify a specific concern with the slate of directors.
Auditors and audit-related issues
Public companies in Brazil have an external auditor that is selected by the board of directors and not typically ratified by shareholders. Auditor compensation is typically not disclosed.
Capital structure, mergers, asset sales and other special transactions
In a merger, the acquiring company must name risk assessment companies to evaluate the assets of the target company. The approval of the statutory report does not preclude shareholders’ right to dissent. Shareholders generally benefit from preemptive rights on new share issuances, regardless of share class.
D-41
According to the Corporations Law, companies must present financial statements to shareholders for approval at least one month in advance of the annual meeting.
BlackRock expects companies to adhere to the Corporations Law with regards to dividend distribution and payout ratios. Typically, 5% of the company’s income needs to be allocated to the company’s legal reserve (as long as it is less than 20% of the outstanding capital) and at least 25% of a company’s adjusted net income must be distributed as dividends. If BlackRock concludes that a company has failed to appropriately allocate income to shareholders, BlackRock may vote against a proposal seeking approval of income allocation and dividends.
Proposals to issue additional shares, establish new share classes, or engage in a debt financing arrangement will be assessed on a case-by-case basis. BlackRock’s decision will be guided by the information provided by the company, the company’s current share structure and BlackRock’s assessment of whether the changes to the capital structure appear to be in the best long-term interests of shareholders. In the absence of sufficient disclosure for BlackRock to understand the purposes of the proposed changes to the capital structure, BlackRock may be unable to support management’s proposal.
Similarly, mergers, asset sales, and other special transactions are assessed based on the specific circumstances of the company and the details of the proposed transaction.
Remuneration and benefits
While local best practice standards call for the disclosure of compensation for CEOs, directors, and auditors, companies rarely disclose the proposed compensation levels prior to the shareholder meeting. When companies do provide data regarding compensation, they seldom disclose compensation levels of individual executive officers, preferring instead to disclose the aggregate compensation levels of both directors and executive officers. Shareholders are not asked to approve remuneration of executives.
Various best practice codes and regulations inform the corporate governance of companies in Chile: The 2000 Tender Offers and Corporate Governance Law (“Ley de OPAS”); the 2001 First Capital Market law (“MKI”); the 2008 Second Capital Markets Law (“MKII”); and the 2009 Law 20,382. Companies must disclose their vote results on their websites.
In Chile, the predominant forms of corporate structure are business groups or conglomerates. Most publicly traded companies have a controlling shareholder or a group of shareholders acting in concert. While concentrated and pyramid structures are common, Chilean institutional investors, primarily pensions funds, are actively influencing corporate governance in this market in an effort to protect minority shareholder rights.
Boards and directors
Most companies have a unitary board structure and directors generally serve two year terms. The minimum number of board seats is seven, although the board is often elected as a slate. Under Chilean law, companies are not required to have any committees; however, if a company’s market capitalization exceeds $60M with a free float of at least 12.5%, they are required to have at least one independent director and an audit committee composed of at least three board members, a majority of whom must be independent.
Chilean investors owning a minimum of 1% (and a maximum of 10%), may nominate independent directors to the board. For foreign investors, however, disclosure regarding matters to be addressed at the shareholder meeting is relatively poor and detailed information regarding director candidates is generally not available in advance of the meeting.
D-42
In recognition of local market practices, BlackRock generally votes to support director nominees in Chile, even in the absence of specific information regarding their identities. We are likely to oppose individual board nominees or slates in situations where we identify a specific concern with the individual director or slate of directors.
Auditors and audit-related issues
External auditors are required to be independent by standards defined in the Code of Ethics and Auditing Standards of the Association of Auditors. Furthermore, auditors must not own, directly or indirectly, more than 3% of the total equity of an issuer, nor should revenue from any one company exceed more than 15% of the auditor’s total revenue.
BlackRock generally supports ratification of auditor proposals, unless there is evidence of auditor misconduct.
Capital structure, mergers, asset sales and other special transactions
Chilean companies are allowed to create multiple classes of stock with different voting rights for each class. Most companies have a single class share structure. Nearly all Chilean companies have a controlling shareholder. Mergers and acquisitions, reorganizations, private placements and liquidations all require supermajority vote approval, to protect the minority shareholders’ interests. Related transactions must be: preapproved by a majority of uninterested directors; in the best interest of the company; and put to shareholders for a vote.
Companies must present financial results and director and auditor reports to shareholders for approval at the annual meeting. These reports typically include a letter from the board, balance sheet, and income statements.
BlackRock expects Chilean companies to adhere to market standards with regards to dividend distribution and payout ratios, and issuers are generally required by law to pay out at least 30% of net income as cash dividends. BlackRock typically supports payout ratios of 30% or more, and will review the payout levels of the past two years if the ratio has fallen below this level. If BlackRock concludes that a company has failed to appropriately allocate income to shareholders, BlackRock may vote against a proposal seeking approval of income allocation and dividends.
Proposals to issue additional shares, establish new share classes, or engage in a debt financing arrangement will be assessed on a case-by-case basis. BlackRock’s decision will be guided by the information provided by the company, the company’s current share structure and BlackRock’s assessment of whether the changes to the capital structure appear to be in the best long-term interests of shareholders. In the absence of sufficient disclosure for BlackRock to understand the purposes of the proposed changes to the capital structure, BlackRock may be unable to support management’s proposal.
Similarly, mergers, asset sales, and other special transactions are assessed based on the specific circumstances of the company and the details of the proposed transaction.
Remuneration and benefits
In Chile, public companies must disclose director remuneration in the Annual Report with separate figures for travel, representation and other expenses. As a result, shareholders have material with which to evaluate director compensation proposals.
Shareholders are not asked to approve remuneration of executives; however, the aggregate compensation figure for all officers may be disclosed.
General corporate governance matters
Amendment of articles generally requires the approval of 75% of voting stock at a shareholder meeting. BlackRock will generally vote against a proposal to amend articles or bylaws unless sufficient information has been provided for investors to reasonably understand the implications of the proposal.
D-43
Various best practice codes and regulations inform the corporate governance of companies in Colombia. Best practice codes include: the Confecamaras code (2001); the SME’s Code of Corporate Governance (2003); the Andean Code (2004); and the new Colombian Corporate Governance Code (2007). Regulations include: Law 222 (1995); Resolution 275 (2001); and Law 964 (2005).
Boards and directors
Boards of directors in Colombia must comprise a minimum of five directors and a maximum of ten; 25% of directors must be independent. The separation of chairman and CEO positions is mandated by law. Common impediments to director independence as considered by local market practice may include the receipt of director compensation for services provided other than serving on the board, charitable payments made to non-profit organizations with which a director is involved, and interlocking directorships.
An Audit Committee is required, consisting of a minimum of three directors. The Audit Committee must include all of the independent directors on the board, and the chair of the Audit Committee must be independent. It is uncommon for companies to adopt other board committees in Colombia, although local best practice standards call for the establishment of a Human Resources Committee and a Corporate Governance Committee.
Shareholders are presented with the directors for election bundled on a slate. Candidate information is not typically available until the shareholder meeting. In the event that the names of the board candidates are not available ahead of the meeting, we may evaluate the current board composition and assess any specific problems or concerns at the board or the company.
In some instances, Colombian companies may actively solicit institutional shareholders for director nominations in order to further minority investor representation.
In recognition of local market practices, BlackRock generally votes to support director slates in Colombia, even in the absence of specific information regarding their identities. We are likely to oppose director slates in situations where we identify a specific concern with the slate of directors.
Auditors and audit-related issues
Public companies in Colombia must have an external auditor that is elected by shareholders. Auditor compensation is typically not disclosed. In the absence of contentious allegations surrounding the financial accounts of the company, BlackRock generally votes for the appointment of the board-selected auditors.
Capital structure, mergers, asset sales and other special transactions
Corporate ownership and control is typically highly concentrated in Colombia. Common shares carry one vote per share. Share classes with multiple voting rights are not allowed, although preferred shares carrying no votes are allowed in the capital structure. Shareholders have preemptive rights on new share issuances, regardless of share class. Shareholder approval is required for share issuances without preemption. Companies typically seek approval for creation of a pool of capital for general issuances.
Colombian companies must present annual accounts and statutory reports to shareholders for approval at the annual meeting. These reports typically include a chairman’s letter, balance sheet, income statement, and explanatory notes in accordance with Colombian GAAP.
BlackRock expects companies in Colombia to adhere to market standards with regards to dividend distribution and payout ratios. Typically, at least 50% of net income must be distributed as dividends. If BlackRock concludes that a company has failed to appropriately allocate income to shareholders, BlackRock may vote against a proposal seeking approval of income allocation and dividends.
D-44
Proposals to issue additional shares, establish new share classes, or engage in a debt financing arrangement will be assessed on a case-by-case basis. BlackRock’s decision will be guided by the information provided by the company, the company’s current share structure and BlackRock’s assessment of whether the changes to the capital structure appear to be in the best long-term interests of shareholders. In the absence of sufficient disclosure for BlackRock to understand the purposes of the proposed changes to the capital structure, BlackRock may be unable to support management’s proposal.
Similarly, mergers, asset sales, and other special transactions are assessed based on the specific circumstances of the company and the details of the proposed transaction.
Remuneration and benefits
Best practice calls for the disclosure of compensation policy for CEOs, directors, auditors and consultants. Shareholders are not asked to approve remuneration of executives.
General corporate governance matters
Amendment of articles requires the approval of 70% of votes cast at a shareholder meeting to consider such amendment. BlackRock will generally vote against a proposal to amend articles or bylaws unless sufficient disclosure allows for investors to reasonably understand the implications of the proposal.
Various best practice codes and regulations inform the corporate governance of companies in Mexico: the New Mexican Securities Law (Ley del Mercado de Valores, or “New LMV”) (2005) and the Mexican Best Practice Code (last revised in 2010). The website of the main stock exchange (Bolsa Mexicana de Valores) provides quarterly financial reports and company information. However, detailed and up-to-date proxy statements remain extremely rare.
Most large companies in Mexico have been traditionally organized as business groups which are conglomerates owned and controlled by families and/or consisting of holdings companies that invest in other companies. Cross-shareholding and interlocking directorships are common.
Boards and directors
Most Mexican companies are governed by a single-tiered board of directors composed of both non-executive and executive members. Director biographies are infrequently available prior to the AGM. The board must have at least five and not more than twenty-one members, however, companies generally bundle director elections. Furthermore, these proposals also often include verification of the directors’ independence or approval of their remuneration. At least 25% of the board must be independent. Any shareholder who owns 10% of voting shares is entitled to appoint at least one board member. It is recommended that all companies establish an audit committee and a corporate/societal practices committee, both of which should be entirely comprised of independent directors. The latter committee is responsible for monitoring business strategy, ensuring against conflicts of interests and setting remuneration of directors. Companies are not required to establish a nominating or compensation committee. Shareholders are not permitted to cumulate their votes in this market.
In recognition of local market practices, BlackRock generally votes to support director nominees in Mexico, even in the absence of specific information regarding their identities. We are likely to oppose individual board nominees or slates in situations where we identify a specific concern with the individual director or slate of directors.
Auditors and audit-related issues
Companies often have an internal auditor to manage day to day operations. They must also have an external auditor nominated by the board. The audit committee certifies the objectivity of the auditor and
D-45
approves their remuneration. There are restrictions on the types of non-audit services and the amount of revenue thus generated that an auditor can provide to the company and still be considered independent. Furthermore, the firm must be rotated every five years and go through a cooling off period of two years.
In the absence of contentious allegations surrounding the financial accounts of the company, BlackRock generally votes for the appointment of the board-selected auditors and approves their remuneration.
Capital structure, mergers, asset sales and other special transactions
Mexican companies are allowed to create multiple classes of stock with special rights. Capital structures include multiple voting share classes with special voting rights for each. Furthermore, shares with voting rights may be restricted to local investors. Mergers and acquisitions, reorganizations, private placements and liquidations all require shareholder approval; related party transactions do not. Due to the closely-held structure of most companies, such transactions are not generally hostile.
Companies must present financial results and director and auditor reports to shareholders for approval at the annual meeting. These reports typically include a letter from the board, balance sheet, and income statements.
BlackRock expects Mexican companies to adhere to market standards with regards to dividend distribution and payout ratios, and uses a 30% benchmark as a trigger for further analysis. BlackRock typically supports payout ratios of 30% or more, and will review the payout levels of the past two years if the ratio has fallen below this level. If BlackRock concludes that a company has failed to appropriately allocate income to shareholders, BlackRock may vote against a proposal seeking approval of income allocation and dividends.
Proposals to issue additional shares, establish new share classes, or engage in a debt financing arrangement will be assessed on a case-by-case basis. BlackRock’s decision will be guided by the information provided by the company, the company’s current share structure and BlackRock’s assessment of whether the changes to the capital structure appear to be in the best long-term interests of shareholders. In the absence of sufficient disclosure for BlackRock to understand the purposes of the proposed changes to the capital structure, BlackRock may be unable to support management’s proposal.
Similarly, mergers, asset sales, and other special transactions are assessed based on the specific circumstances of the company and the details of the proposed transaction.
Remuneration and benefits
There is no disclosure of director remuneration, although there is a cap of 10% of net income payable to company founders. Shareholders are not asked to approve remuneration of executives.
General corporate governance matters
Amendment of articles generally requires the approval of 75% of voting stock at a shareholder meeting. BlackRock will generally vote against a proposal to amend articles or bylaws unless sufficient disclosure allows for investors to reasonably understand the implications of the proposal.
Shareholders with at least 10% of voting shares have the right to call a special meeting.
Shareholder proposals are rare in Mexico.
The Peruvian Securities Commission (CONASEV) has established the Principles of Good Corporate Governance for Peruvian Corporations (2002). Companies are encouraged to disclose information regarding shareholder structure, director independence, board committees and remuneration.
D-46
Under Peruvian Capital Market Regulations, listed companies are not required to elect independent directors, establish committees, or disclose substantial information. In practice, disclosure regarding directors and their independence is uncommon. A 2010 report by CONASEV indicated that approximately one out of four Peruvian listed companies did not have any independent directors, and that less than half of listed companies had any committee structure.1 Companies are primarily organized as financial and industrial conglomerates owned or controlled by families, government and/or multinational companies. Although voting by proxy is allowed, voting by a show of hands is the primary mechanism utilized by shareholders and company-specific powers-of-attorney are required for third party representation of funds or trusts. This structure can prove challenging for international investors seeking to engage with companies through the proxy voting mechanism.
At annual shareholder meetings, Peruvian companies generally seek: 1) the election of directors; 2) approval of the remuneration of the directors; 3) approval of income allocation and dividends; 4) the election of the external auditor and approval of their remuneration; and 5) approval of financial statements and discharge of directors.
Boards and directors
BlackRock encourages Peruvian issuers to provide information regarding the names and biographies of director nominees simultaneous with the public announcement of the shareholder meeting. This practice is uncommon in Peru. In recognition of local market practices, BlackRock generally votes to support director nominees in Peru, even in the absence of specific information regarding their identities. We are likely to oppose individual board nominees or slates in situations where we identify a specific concern with the individual director or slate of directors.
In Peru, it is also acceptable for directors to appoint “substitute” or “alternate” directors who can stand in for “regular” directors in the event that the regular director is unavailable. BlackRock encourages boards that choose to utilize this structure to establish processes that ensure that substitute directors and/or alternate directors are sufficiently informed regarding the activities of the company to contribute effectively to the board’s decision making process. Additionally, directors who are absent from a meeting should ensure that they are fully informed of all information shared at the meeting and all decisions taken in their absence.
BlackRock generally votes to support proposals regarding director remuneration unless BlackRock determines that the proposed remuneration is inconsistent with director remuneration at similar companies, or otherwise concludes that the proposed remuneration is not in the best interest of shareholders. Information regarding director remuneration is usually presented to shareholders after the annual meeting has taken place, and is presented on an aggregated basis, rather than providing details of payments to each director.
BlackRock also generally votes in support of the discharge of the board and management, provided sufficient information has been provided to shareholders and there are no unresolved allegations regarding misconduct by the board or management.
Auditors and audit-related issues
In the absence of contentious allegations surrounding the financial accounts of the company, BlackRock generally votes for the appointment of the board-selected auditors and approves their remuneration. Consistent with regulatory requirements, BlackRock expects that auditors will be independent of the company. They should not hold a position with the company in the 24 months preceding the audit, should not have any direct or indirect financial interest in the company, and should not be related to directors or senior management of the company.
| 1 | CONASEV, “Grado de Cumplimiento de los Principios de Buen Gobierno Corporativo Durante el Ejercicio Económico 2010” (2010) |
D-47
Capital structure, mergers, asset sales and other special transactions
BlackRock expects companies in Peru to adhere to market standards with regards to dividend distribution and payout ratios. Typically, at least 10% of net income must be distributed as dividends. Proposals seeking approval of income allocation and dividends are assessed in light of the company’s profitability, any share repurchase program that the company may have initiated, and other circumstances driving the income allocation decisions of the board. If BlackRock concludes that a company has failed to appropriately allocate income to shareholders, BlackRock may vote against a proposal seeking approval of income allocation and dividends.
Proposals to issue additional shares, establish new share classes, or engage in a debt financing arrangement will be assessed on a case-by-case basis. BlackRock’s decision will be guided by the information provided by the company, the company’s current share structure and BlackRock’s assessment of whether the changes to the capital structure appear to be in the best long-term interests of shareholders. In the absence of sufficient disclosure for BlackRock to understand the purposes of the proposed changes to the capital structure, BlackRock may be unable to support management’s proposal.
Similarly, mergers, asset sales, and other special transactions are assessed based on the specific circumstances of the company and the details of the proposed transaction.
Remuneration and benefits
Although the Principles of Good Corporate Governance for Peruvian Corporations encourage disclosure of information regarding the remuneration of senior management, in practice, such information is generally not provided to shareholders. Shareholders are not asked to approve remuneration of executives.
D-48
CLEARBRIDGE INVESTMENTS, LLC
PROXY VOTING POLICIES AND PROCEDURES
| I. | TYPES OF ACCOUNTS FOR WHICH CLEARBRIDGE VOTES PROXIES |
ClearBridge votes proxies for each client that has specifically authorized us to vote them in the investment management contract or otherwise and votes proxies for each ERISA account unless the plan document or investment advisory agreement specifically reserves the responsibility to vote proxies to the plan trustees or other named fiduciary. These policies and procedures are intended to fulfill applicable requirements imposed on ClearBridge by the Investment Advisers Act of 1940, as amended, the Investment Company Act of 1940, as amended, and the Employee Retirement Income Security Act of 1974, as amended, and the rules and regulations adopted under these laws.
| II. | GENERAL GUIDELINES |
In voting proxies, we are guided by general fiduciary principles. Our goal is to act prudently, solely in the best interest of the beneficial owners of the accounts we manage and, in the case of ERISA accounts, for the exclusive purpose of providing economic benefits to such persons. We attempt to provide for the consideration of all factors that could affect the value of the investment and will vote proxies in the manner that we believe will be consistent with efforts to maximize shareholder values.
| III. | HOW CLEARBRIDGE VOTES |
Section V of these policies and procedures sets forth certain stated positions. In the case of a proxy issue for which there is a stated position, we generally vote in accordance with the stated position. In the case of a proxy issue for which there is a list of factors set forth in Section V that we consider in voting on such issue, we consider those factors and vote on a case-by-case basis in accordance with the general principles set forth above. In the case of a proxy issue for which there is no stated position or list of factors that we consider in voting on such issue, we vote on a case-by-case basis in accordance with the general principles set forth above. We may utilize an external service provider to provide us with information and/or a recommendation with regard to proxy votes but we are not required to follow any such recommendations. The use of an external service provider does not relieve us of our responsibility for the proxy vote.
For routine matters, we usually vote according to our policy or the external service provider’s recommendation, although we are not obligated to do so and an individual portfolio manager may vote contrary to our policy or the recommendation of the external service provider. If a matter is non-routine, e.g., management’s recommendation is different than that of the external service provider and ClearBridge is a significant holder or it is a significant holding for ClearBridge, the issues will be highlighted to the appropriate investment teams and their views solicited by members of the Proxy Committee. Different investment teams may vote differently on the same issue, depending upon their assessment of clients’ best interests.
ClearBridge’s proxy voting process is overseen and coordinated by its Proxy Committee.
| IV. | CONFLICTS OF INTEREST |
In furtherance of ClearBridge’s goal to vote proxies in the best interests of clients, ClearBridge follows procedures designed to identify and address material conflicts that may arise between ClearBridge’s interests and those of its clients before voting proxies on behalf of such clients.
D-49
| A. | Procedures for Identifying Conflicts of Interest |
ClearBridge relies on the following to seek to identify conflicts of interest with respect to proxy voting:
| 1. | ClearBridge’s employees are periodically reminded of their obligation (i) to be aware of the potential for conflicts of interest on the part of ClearBridge with respect to voting proxies on behalf of client accounts both as a result of their personal relationships or personal or business relationships relating to another Legg Mason business unit, and (ii) to bring conflicts of interest of which they become aware to the attention of ClearBridge’s General Counsel/Chief Compliance Officer. |
| 2. | ClearBridge’s finance area maintains and provides to ClearBridge Compliance and proxy voting personnel an up- to-date list of all client relationships that have historically accounted for or are projected to account for greater than 1% of ClearBridge’s net revenues. |
| 3. | As a general matter, ClearBridge takes the position that relationships between a non-ClearBridge Legg Mason unit and an issuer (e.g., investment management relationship between an issuer and a non-ClearBridge Legg Mason affiliate) do not present a conflict of interest for ClearBridge in voting proxies with respect to such issuer because ClearBridge operates as an independent business unit from other Legg Mason business units and because of the existence of informational barriers between ClearBridge and certain other Legg Mason business units. As noted above, ClearBridge employees are under an obligation to bring such conflicts of interest, including conflicts of interest which may arise because of an attempt by another Legg Mason business unit or non-ClearBridge Legg Mason officer or employee to influence proxy voting by ClearBridge to the attention of ClearBridge Compliance. |
| 4. | A list of issuers with respect to which ClearBridge has a potential conflict of interest in voting proxies on behalf of client accounts will be maintained by ClearBridge proxy voting personnel. ClearBridge will not vote proxies relating to such issuers until it has been determined that the conflict of interest is not material or a method for resolving the conflict of interest has been agreed upon and implemented, as described in Section IV below. |
| B. | Procedures for Assessing Materiality of Conflicts of Interest and for Addressing Material Conflicts of Interest |
| 1. | ClearBridge maintains a Proxy Committee which, among other things, reviews and addresses conflicts of interest brought to its attention. The Proxy Committee is comprised of such ClearBridge personnel (and others, at ClearBridge’s request), as are designated from time to time. The current members of the Proxy Committee are set forth in the Proxy Committee’s Terms of Reference. |
| 2. | All conflicts of interest identified pursuant to the procedures outlined in Section IV. A. must be brought to the attention of the Proxy Committee for resolution. A proxy issue that will be voted in accordance with a stated ClearBridge position on such issue or in accordance with the recommendation of an independent third party generally is not brought to the attention of the Proxy Committee for a conflict of interest review because ClearBridge’s position is that any conflict of interest issues are resolved by voting in accordance with a pre-determined policy or in accordance with the recommendation of an independent third party. |
| 3. | The Proxy Committee will determine whether a conflict of interest is material. A conflict of interest will be considered material to the extent that it is determined that such conflict |
D-50
| is likely to influence, or appear to influence, ClearBridge’s decision-making in voting the proxy. All materiality determinations will be based on an assessment of the particular facts and circumstances. A written record of all materiality determinations made by the Proxy Committee will be maintained. |
| 4. | If it is determined by the Proxy Committee that a conflict of interest is not material, ClearBridge may vote proxies notwithstanding the existence of the conflict. |
| 5. | If it is determined by the Proxy Committee that a conflict of interest is material, the Proxy Committee will determine an appropriate method to resolve such conflict of interest before the proxy affected by the conflict of interest is voted. Such determination shall be based on the particular facts and circumstances, including the importance of the proxy issue, the nature of the conflict of interest, etc. Such methods may include: |
| • | disclosing the conflict to clients and obtaining their consent before voting; |
| • | suggesting to clients that they engage another party to vote the proxy on their behalf; |
| • | in the case of a conflict of interest resulting from a particular employee’s personal relationships, removing such employee from the decision-making process with respect to such proxy vote; or |
| • | such other method as is deemed appropriate given the particular facts and circumstances, including the importance of the proxy issue, the nature of the conflict of interest, etc.* |
A written record of the method used to resolve a material conflict of interest shall be maintained.
| C. | Third Party Proxy Voting Firm — Conflicts of Interest |
With respect to a third party proxy voting firm described herein, the Proxy Committee will periodically review and assess such firm’s policies, procedures and practices with respect to the disclosure and handling of conflicts of interest.
| V. | VOTING POLICY |
These are policy guidelines that can always be superseded, subject to the duty to act solely in the best interest of the beneficial owners of accounts, by the investment management professionals responsible for the account holding the shares being voted. There may be occasions when different investment teams vote differently on the same issue. A ClearBridge investment team (e.g., ClearBridge’s Social Awareness Investment team) may adopt proxy voting policies that supplement these policies and procedures. In addition, in the case of Taft-Hartley clients, ClearBridge will comply with a client direction to vote proxies in accordance with Institutional Shareholder Services’ (ISS) PVS Proxy Voting Guidelines, which ISS represents to be fully consistent with AFL-CIO guidelines.
| A. | Election of Directors |
| 1. | Voting on Director Nominees in Uncontested Elections. |
| a. | We withhold our vote from a director nominee who: |
| • | attended less than 75 percent of the company’s board and committee meetings without a valid excuse (illness, service to the nation/local government, work on behalf of the company); |
| * | Especially in the case of an apparent, as opposed to actual, conflict of interest, the Proxy Committee may resolve such conflict of interest by satisfying itself that ClearBridge’s proposed vote on a proxy issue is in the best interest of client accounts and is not being influenced by the conflict of interest. |
D-51
| • | were members of the company’s board when such board failed to act on a shareholder proposal that received approval of a majority of shares cast for the previous two consecutive years; |
| • | received more than 50 percent withheld votes of the shares cast at the previous board election, and the company has failed to address the issue as to why; |
| • | is an insider where: (1) such person serves on any of the audit, compensation or nominating committees of the company’s board, (2) the company’s board performs the functions typically performed by a company’s audit, compensation and nominating committees, or (3) the full board is less than a majority independent (unless the director nominee is also the company CEO, in which case we will vote FOR); |
| • | is a member of the company’s audit committee, when excessive non-audit fees were paid to the auditor, or there are chronic control issues and an absence of established effective control mechanisms. |
| b. | We vote for all other director nominees. |
| 2. | Chairman and CEO is the Same Person. |
We vote on a case-by-case basis on shareholder proposals that would require the positions of the Chairman and CEO to be held by different persons. We would generally vote FOR such a proposal unless there are compelling reasons to vote against the proposal, including:
| • | Designation of a lead director |
| • | Majority of independent directors (supermajority) |
| • | All independent key committees |
| • | Size of the company (based on market capitalization) |
| • | Established governance guidelines |
| • | Company performance |
| 3. | Majority of Independent Directors |
| a. | We vote for shareholder proposals that request that the board be comprised of a majority of independent directors. Generally that would require that the director have no connection to the company other than the board seat. In determining whether an independent director is truly independent (e.g. when voting on a slate of director candidates), we consider certain factors including, but not necessarily limited to, the following: whether the director or his/her company provided professional services to the company or its affiliates either currently or in the past year; whether the director has any transactional relationship with the company; whether the director is a significant customer or supplier of the company; whether the director is employed by a foundation or university that received significant grants or endowments from the company or its affiliates; and whether there are interlocking directorships. |
| b. | We vote for shareholder proposals that request that the board audit, compensation and/or nominating committees include independent directors exclusively. |
| 4. | Stock Ownership Requirements |
We vote against shareholder proposals requiring directors to own a minimum amount of company stock in order to qualify as a director, or to remain on the board.
D-52
| 5. | Term of Office |
We vote against shareholder proposals to limit the tenure of independent directors.
| 6. | Director and Officer Indemnification and Liability Protection |
| a. | Subject to subparagraphs 2, 3, and 4 below, we vote for proposals concerning director and officer indemnification and liability protection. |
| b. | We vote for proposals to limit and against proposals to eliminate entirely director and officer liability for monetary damages for violating the duty of care. |
| c. | We vote against indemnification proposals that would expand coverage beyond just legal expenses to acts, such as negligence, that are more serious violations of fiduciary obligations than mere carelessness. |
| d. | We vote for only those proposals that provide such expanded coverage noted in subparagraph 3 above in cases when a director’s or officer’s legal defense was unsuccessful if: (1) the director was found to have acted in good faith and in a manner that he reasonably believed was in the best interests of the company, and (2) if only the director’s legal expenses would be covered. |
| 7. | Director Qualifications |
| a. | We vote case-by-case on proposals that establish or amend director qualifications. Considerations include how reasonable the criteria are and to what degree they may preclude dissident nominees from joining the board. |
| b. | We vote against shareholder proposals requiring two candidates per board seat. |
| B. | Proxy Contests |
| 1. | Voting for Director Nominees in Contested Elections |
We vote on a case-by-case basis in contested elections of directors. Considerations include: chronology of events leading up to the proxy contest; qualifications of director nominees (incumbents and dissidents); for incumbents, whether the board is comprised of a majority of outside directors; whether key committees (i.e.: nominating, audit, compensation) comprise solely of independent outsiders; discussion with the respective portfolio manager(s).
| 2. | Reimburse Proxy Solicitation Expenses |
We vote on a case-by-case basis on proposals to provide full reimbursement for dissidents waging a proxy contest. Considerations include: identity of persons who will pay solicitation expenses; cost of solicitation; percentage that will be paid to proxy solicitation firms.
| C. | Auditors |
| 1. | Ratifying Auditors |
We vote for proposals to ratify auditors, unless an auditor has a financial interest in or association with the company, and is therefore not independent; or there is reason to believe that the independent auditor has rendered an opinion that is neither accurate nor indicative of the company’s financial position or there is reason to believe the independent auditor has not followed the highest level of ethical conduct. Specifically, we will vote to ratify auditors if the auditors only provide the company audit services and such other audit-related and non-audit services the provision of which will not cause such auditors to lose their independence under applicable laws, rules and regulations.
D-53
| 2. | Financial Statements and Director and Auditor Reports |
We generally vote for management proposals seeking approval of financial accounts and reports and the discharge of management and supervisory board members, unless there is concern about the past actions of the company’s auditors or directors.
| 3. | Remuneration of Auditors |
We vote for proposals to authorize the board or an audit committee of the board to determine the remuneration of auditors, unless there is evidence of excessive compensation relative to the size and nature of the company.
| 4. | Indemnification of Auditors |
We vote against proposals to indemnify auditors.
| D. | Proxy Contest Defenses |
| 1. | Board Structure: Staggered vs. Annual Elections |
| a. | We vote against proposals to classify the board. |
| b. | We vote for proposals to repeal classified boards and to elect all directors annually. |
| 2. | Shareholder Ability to Remove Directors |
| a. | We vote against proposals that provide that directors may be removed only for cause. |
| b. | We vote for proposals to restore shareholder ability to remove directors with or without cause. |
| c. | We vote against proposals that provide that only continuing directors may elect replacements to fill board vacancies. |
| d. | We vote for proposals that permit shareholders to elect directors to fill board vacancies. |
| 3. | Cumulative Voting |
| a. | If plurality voting is in place for uncontested director elections, we vote for proposals to permit or restore cumulative voting. |
| b. | If majority voting is in place for uncontested director elections, we vote against cumulative voting. |
| c. | If plurality voting is in place for uncontested director elections, and proposals to adopt both cumulative voting and majority voting are on the same slate, we vote for majority voting and against cumulative voting. |
| 4. | Majority Voting |
We vote for non-binding and/or binding resolutions requesting that the board amend a company’s by-laws to stipulate that directors need to be elected with an affirmative majority of the votes cast, provided that it does not conflict with the state law where the company is incorporated. In addition, all resolutions need to provide for a carve-out for a plurality vote standard when there are more nominees than board seats (i.e. contested election). In addition, ClearBridge strongly encourages companies to adopt a post-election director resignation policy setting guidelines for the company to follow to promptly address situations involving holdover directors.
D-54
| 5. | Shareholder Ability to Call Special Meetings |
| a. | We vote against proposals to restrict or prohibit shareholder ability to call special meetings. |
| b. | We vote for proposals that provide shareholders with the ability to call special meetings, taking into account a minimum ownership threshold of 10 percent (and investor ownership structure, depending on bylaws). |
| 6. | Shareholder Ability to Act by Written Consent |
| a. | We vote against proposals to restrict or prohibit shareholder ability to take action by written consent. |
| b. | We vote for proposals to allow or make easier shareholder action by written consent. |
| 7. | Shareholder Ability to Alter the Size of the Board |
| a. | We vote for proposals that seek to fix the size of the board. |
| b. | We vote against proposals that give management the ability to alter the size of the board without shareholder approval. |
| 8. | Advance Notice Proposals |
We vote on advance notice proposals on a case-by-case basis, giving support to those proposals which allow shareholders to submit proposals as close to the meeting date as reasonably possible and within the broadest window possible.
| 9. | Amendment of By-Laws |
| a. | We vote against proposals giving the board exclusive authority to amend the by-laws. |
| b. | We vote for proposals giving the board the ability to amend the by-laws in addition to shareholders. |
| 10. | Article Amendments (not otherwise covered by ClearBridge Proxy Voting Policies and Procedures). |
We review on a case-by-case basis all proposals seeking amendments to the articles of association.
We vote for article amendments if:
| • | shareholder rights are protected; |
| • | there is negligible or positive impact on shareholder value; |
| • | management provides adequate reasons for the amendments; and |
| • | the company is required to do so by law (if applicable). |
| E. | Tender Offer Defenses |
| 1. | Poison Pills |
| a. | We vote for shareholder proposals that ask a company to submit its poison pill for shareholder ratification. |
| b. | We vote on a case-by-case basis on shareholder proposals to redeem a company’s poison pill. Considerations include: when the plan was originally adopted; financial condition of the company; terms of the poison pill. |
D-55
| c. | We vote on a case-by-case basis on management proposals to ratify a poison pill. Considerations include: sunset provision—poison pill is submitted to shareholders for ratification or rejection every 2 to 3 years; shareholder redemption feature -10% of the shares may call a special meeting or seek a written consent to vote on rescinding the rights plan. |
| 2. | Fair Price Provisions |
| a. | We vote for fair price proposals, as long as the shareholder vote requirement embedded in the provision is no more than a majority of disinterested shares. |
| b. | We vote for shareholder proposals to lower the shareholder vote requirement in existing fair price provisions. |
| 3. | Greenmail |
| a. | We vote for proposals to adopt anti-greenmail charter or bylaw amendments or otherwise restrict a company’s ability to make greenmail payments. |
| b. | We vote on a case-by-case basis on anti-greenmail proposals when they are bundled with other charter or bylaw amendments. |
| 4. | Unequal Voting Rights |
| a. | We vote against dual class exchange offers. |
| b. | We vote against dual class re-capitalization. |
| 5. | Supermajority Shareholder Vote Requirement to Amend the Charter or Bylaws |
| a. | We vote against management proposals to require a supermajority shareholder vote to approve charter and bylaw amendments. |
| b. | We vote for shareholder proposals to lower supermajority shareholder vote requirements for charter and bylaw amendments. |
| 6. | Supermajority Shareholder Vote Requirement to Approve Mergers |
| a. | We vote against management proposals to require a supermajority shareholder vote to approve mergers and other significant business combinations. |
| b. | We vote for shareholder proposals to lower supermajority shareholder vote requirements for mergers and other significant business combinations. |
| 7. | White Squire Placements |
We vote for shareholder proposals to require approval of blank check preferred stock issues.
| F. | Miscellaneous Governance Provisions |
| 1. | Confidential Voting |
| a. | We vote for shareholder proposals that request corporations to adopt confidential voting, use independent tabulators and use independent inspectors of election as long as the proposals include clauses for proxy contests as follows: in the case of a contested election, management is permitted to request that the dissident group honor its confidential voting policy. If the dissidents agree, the policy remains in place. If the dissidents do not agree, the confidential voting policy is waived. |
| b. | We vote for management proposals to adopt confidential voting subject to the proviso for contested elections set forth in sub-paragraph A.1 above. |
D-56
| 2. | Equal Access |
We vote for shareholder proposals that would allow significant company shareholders equal access to management’s proxy material in order to evaluate and propose voting recommendations on proxy proposals and director nominees, and in order to nominate their own candidates to the board.
| 3. | Bundled Proposals |
We vote on a case-by-case basis on bundled or “conditioned” proxy proposals. In the case of items that are conditioned upon each other, we examine the benefits and costs of the packaged items. In instances when the joint effect of the conditioned items is not in shareholders’ best interests and therefore not in the best interests of the beneficial owners of accounts, we vote against the proposals. If the combined effect is positive, we support such proposals.
| 4. | Shareholder Advisory Committees |
We vote on a case-by-case basis on proposals to establish a shareholder advisory committee. Considerations include: rationale and cost to the firm to form such a committee. We generally vote against such proposals if the board and key nominating committees are comprised solely of independent/outside directors.
| 5. | Other Business |
We vote for proposals that seek to bring forth other business matters.
| 6. | Adjourn Meeting |
We vote on a case-by-case basis on proposals that seek to adjourn a shareholder meeting in order to solicit additional votes.
| 7. | Lack of Information |
We vote against proposals if a company fails to provide shareholders with adequate information upon which to base their voting decision.
| G. | Capital Structure |
| 1. | Common Stock Authorization |
| a. | We vote on a case-by-case basis on proposals to increase the number of shares of common stock authorized for issue, except as described in paragraph 2 below. |
| b. | Subject to paragraph 3, below we vote for the approval requesting increases in authorized shares if the company meets certain criteria: |
| • | Company has already issued a certain percentage (i.e. greater than 50%) of the company’s allotment. |
| • | The proposed increase is reasonable (i.e. less than 150% of current inventory) based on an analysis of the company’s historical stock management or future growth outlook of the company. |
| c. | We vote on a case-by-case basis, based on the input of affected portfolio managers, if holding is greater than 1% of an account. |
| 2. | Stock Distributions: Splits and Dividends |
We vote on a case-by-case basis on management proposals to increase common share authorization for a stock split, provided that the split does not result in an increase of authorized but unissued shares of more than 100% after giving effect to the shares needed for the split.
D-57
| 3. | Reverse Stock Splits |
We vote for management proposals to implement a reverse stock split, provided that the reverse split does not result in an increase of authorized but unissued shares of more than 100% after giving effect to the shares needed for the reverse split.
| 4. | Blank Check Preferred Stock |
| a. | We vote against proposals to create, authorize or increase the number of shares with regard to blank check preferred stock with unspecified voting, conversion, dividend distribution and other rights. |
| b. | We vote for proposals to create “declawed” blank check preferred stock (stock that cannot be used as a takeover defense). |
| c. | We vote for proposals to authorize preferred stock in cases where the company specifies the voting, dividend, conversion, and other rights of such stock and the terms of the preferred stock appear reasonable. |
| d. | We vote for proposals requiring a shareholder vote for blank check preferred stock issues. |
| 5. | Adjust Par Value of Common Stock |
We vote for management proposals to reduce the par value of common stock.
| 6. | Preemptive Rights |
| a. | We vote on a case-by-case basis for shareholder proposals seeking to establish them and consider the following factors: |
| • | Size of the Company. |
| • | Characteristics of the size of the holding (holder owning more than 1% of the outstanding shares). |
| • | Percentage of the rights offering (rule of thumb less than 5%). |
| b. | We vote on a case-by-case basis for shareholder proposals seeking the elimination of pre-emptive rights. |
| 7. | Debt Restructuring |
We vote on a case-by-case basis for proposals to increase common and/or preferred shares and to issue shares as part of a debt-restructuring plan. Generally, we approve proposals that facilitate debt restructuring.
| 8. | Share Repurchase Programs |
We vote for management proposals to institute open-market share repurchase plans in which all shareholders may participate on equal terms.
| 9. | Dual-Class Stock |
We vote for proposals to create a new class of nonvoting or sub voting common stock if:
| • | It is intended for financing purposes with minimal or no dilution to current shareholders |
| • | It is not designed to preserve the voting power of an insider or significant shareholder |
D-58
| 10. | Issue Stock for Use with Rights Plan |
We vote against proposals that increase authorized common stock for the explicit purpose of implementing a shareholder rights plan (poison pill).
| 11. | Debt Issuance Requests |
When evaluating a debt issuance request, the issuing company’s present financial situation is examined. The main factor for analysis is the company’s current debt-to-equity ratio, or gearing level. A high gearing level may incline markets and financial analysts to downgrade the company’s bond rating, increasing its investment risk factor in the process. A gearing level up to 100 percent is considered acceptable.
We vote for debt issuances for companies when the gearing level is between zero and 100 percent.
We view on a case-by-case basis proposals where the issuance of debt will result in the gearing level being greater than 100 percent. Any proposed debt issuance is compared to industry and market standards.
| 12. | Financing Plans |
We generally vote for the adopting of financing plans if we believe they are in the best economic interests of shareholders.
| H. | Executive and Director Compensation |
In general, we vote for executive and director compensation plans, with the view that viable compensation programs reward the creation of stockholder wealth by having high payout sensitivity to increases in shareholder value. Certain factors, however, such as repricing underwater stock options without shareholder approval, would cause us to vote against a plan. Additionally, in some cases we would vote against a plan deemed unnecessary.
| 1. | OBRA-Related Compensation Proposals |
| a. | Amendments that Place a Cap on Annual Grant or Amend Administrative Features |
We vote for plans that simply amend shareholder-approved plans to include administrative features or place a cap on the annual grants any one participant may receive to comply with the provisions of Section 162(m) of the Internal Revenue Code.
| b. | Amendments to Added Performance-Based Goals |
We vote for amendments to add performance goals to existing compensation plans to comply with the provisions of Section 162(m) of the Internal Revenue Code.
| c. | Amendments to Increase Shares and Retain Tax Deductions Under OBRA |
We vote for amendments to existing plans to increase shares reserved and to qualify the plan for favorable tax treatment under the provisions of Section 162(m) the Internal Revenue Code.
| d. | Approval of Cash or Cash-and-Stock Bonus Plans |
We vote for cash or cash-and-stock bonus plans to exempt the compensation from taxes under the provisions of Section 162(m) of the Internal Revenue Code.
| 2. | Expensing of Options |
We vote for proposals to expense stock options on financial statements.
D-59
| 3. | Index Stock Options |
We vote on a case by case basis with respect to proposals seeking to index stock options. Considerations include whether the issuer expenses stock options on its financial statements and whether the issuer’s compensation committee is comprised solely of independent directors.
| 4. | Shareholder Proposals to Limit Executive and Director Pay |
| a. | We vote on a case-by-case basis on all shareholder proposals that seek additional disclosure of executive and director pay information. Considerations include: cost and form of disclosure. We vote for such proposals if additional disclosure is relevant to shareholder’s needs and would not put the company at a competitive disadvantage relative to its industry. |
| b. | We vote on a case-by-case basis on all other shareholder proposals that seek to limit executive and director pay. |
We have a policy of voting to reasonably limit the level of options and other equity-based compensation arrangements available to management to reasonably limit shareholder dilution and management compensation. For options and equity-based compensation arrangements, we vote FOR proposals or amendments that would result in the available awards being less than 10% of fully diluted outstanding shares (i.e. if the combined total of shares, common share equivalents and options available to be awarded under all current and proposed compensation plans is less than 10% of fully diluted shares). In the event the available awards exceed the 10% threshold, we would also consider the % relative to the common practice of its specific industry (e.g. technology firms). Other considerations would include, without limitation, the following:
| • | Compensation committee comprised of independent outside directors |
| • | Maximum award limits |
| • | Repricing without shareholder approval prohibited |
| • | 3-year average burn rate for company |
| • | Plan administrator has authority to accelerate the vesting of awards |
| • | Shares under the plan subject to performance criteria |
| 5. | Golden Parachutes |
| a. | We vote for shareholder proposals to have golden parachutes submitted for shareholder ratification. |
| b. | We vote on a case-by-case basis on all proposals to ratify or cancel golden parachutes. Considerations include: the amount should not exceed 3 times average base salary plus guaranteed benefits; golden parachute should be less attractive than an ongoing employment opportunity with the firm. |
| 6. | Golden Coffins |
| a. | We vote for shareholder proposals that request a company not to make any death benefit payments to senior executives’ estates or beneficiaries, or pay premiums in respect to any life insurance policy covering a senior executive’s life (“golden coffin”). We carve out benefits provided under a plan, policy or arrangement applicable to a broader group of employees, such as offering group universal life insurance. |
| b. | We vote for shareholder proposals that request shareholder approval of survivor benefits for future agreements that, following the death of a senior executive, would obligate the company to make payments or awards not earned. |
D-60
| 7. | Anti Tax Gross-up Policy |
| a. | We vote for proposals that ask a company to adopt a policy whereby it will not make, or promise to make, any tax gross-up payment to its senior executives, except for tax gross-ups provided pursuant to a plan, policy, or arrangement applicable to management employees of the company generally, such as relocation or expatriate tax equalization policy; we also vote for proposals that ask management to put gross-up payments to a shareholder vote. |
| b. | We vote against proposals where a company will make, or promise to make, any tax gross-up payment to its senior executives without a shareholder vote, except for tax gross-ups provided pursuant to a plan, policy, or arrangement applicable to management employees of the company generally, such as relocation or expatriate tax equalization policy. |
| 8. | Employee Stock Ownership Plans (ESOPs) |
We vote for proposals that request shareholder approval in order to implement an ESOP or to increase authorized shares for existing ESOPs, except in cases when the number of shares allocated to the ESOP is “excessive” (i.e., generally greater than five percent of outstanding shares).
| 9. | Employee Stock Purchase Plans |
| a. | We vote for qualified plans where all of the following apply: |
| • | The purchase price is at least 85 percent of fair market value |
| • | The offering period is 27 months or less |
| • | The number of shares allocated to the plan is five percent or less of outstanding shares |
If the above do not apply, we vote on a case-by-case basis.
| b. | We vote for non-qualified plans where all of the following apply: |
| • | All employees of the company are eligible to participate (excluding 5 percent or more beneficial owners) |
| • | There are limits on employee contribution (ex: fixed dollar amount) |
| • | There is a company matching contribution with a maximum of 25 percent of an employee’s contribution |
| • | There is no discount on the stock price on purchase date (since there is a company match) |
If the above do not apply, we vote against the non-qualified employee stock purchase plan.
| 10. | 401(k) Employee Benefit Plans |
We vote for proposals to implement a 401(k) savings plan for employees.
| 11. | Stock Compensation Plans |
| a. | We vote for stock compensation plans which provide a dollar-for-dollar cash for stock exchange. |
| b. | We vote on a case-by-case basis for stock compensation plans which do not provide a dollar-for-dollar cash for stock exchange using a quantitative model. |
D-61
| 12. | Directors Retirement Plans |
| a. | We vote against retirement plans for non-employee directors. |
| b. | We vote for shareholder proposals to eliminate retirement plans for non-employee directors. |
| 13. | Management Proposals to Reprice Options |
We vote on a case-by-case basis on management proposals seeking approval to reprice options. Considerations include the following:
| • | Historic trading patterns |
| • | Rationale for the repricing |
| • | Value-for-value exchange |
| • | Option vesting |
| • | Term of the option |
| • | Exercise price |
| • | Participation |
| 14. | Shareholder Proposals Recording Executive and Director Pay |
| a. | We vote against shareholder proposals seeking to set absolute levels on compensation or otherwise dictate the amount or form of compensation. |
| b. | We vote against shareholder proposals requiring director fees be paid in stock only. |
| c. | We vote for shareholder proposals to put option repricing to a shareholder vote. |
| d. | We vote for shareholder proposals that call for a non-binding advisory vote on executive pay (“say-on-pay”). Company boards would adopt a policy giving shareholders the opportunity at each annual meeting to vote on an advisory resolution to ratify the compensation of the named executive officers set forth in the proxy statement’s summary compensation table. |
| e. | We vote “annual” for the frequency of say-on-pay proposals rather than once every two or three years. |
| f. | We vote on a case-by-case basis for all other shareholder proposals regarding executive and director pay, taking into account company performance, pay level versus peers, pay level versus industry, and long term corporate outlook. |
| 15. | Management Proposals On Executive Compensation |
| a. | For non-binding advisory votes on executive officer compensation, when management and the external service provider agree, we vote for the proposal. When management and the external service provider disagree, the proposal becomes a refer item. In the case of a Refer item, the factors under consideration will include the following: |
| • | Company performance over the last 1-, 3- and 5-year periods on a total shareholder return basis |
| • | Performance metrics for short- and long-term incentive programs |
| • | CEO pay relative to company performance (is there a misalignment) |
| • | Tax gross-ups to senior executives |
D-62
| • | Change-in-control arrangements |
| • | Presence of a clawback provision, ownership guidelines, or stock holding requirements for senior executives |
| b. | We vote “annual” for the frequency of say-on-pay proposals rather than once every two or three years. |
| 16. | Stock Retention / Holding Period of Equity Awards |
We vote on a case-by-case basis on shareholder proposals asking companies to adopt policies requiring senior executives to retain all or a significant (>50 percent) portion of their shares acquired through equity compensation plans, either:
| • | While employed and/or for one to two years following the termination of their employment; or |
| • | For a substantial period following the lapse of all other vesting requirements for the award, with ratable release of a portion of the shares annually during the lock-up period |
The following factors will be taken into consideration:
| • | Whether the company has any holding period, retention ratio, or named executive officer ownership requirements currently in place |
| • | Actual stock ownership of the company’s named executive officers |
| • | Policies aimed at mitigating risk taking by senior executives |
| • | Pay practices at the company that we deem problematic |
| I. | State/Country of Incorporation |
| 1. | Voting on State Takeover Statutes |
| a. | We vote for proposals to opt out of state freeze-out provisions. |
| b. | We vote for proposals to opt out of state disgorgement provisions. |
| 2. | Voting on Re-incorporation Proposals |
We vote on a case-by-case basis on proposals to change a company’s state or country of incorporation. Considerations include: reasons for re-incorporation (i.e. financial, restructuring, etc); advantages/benefits for change (i.e. lower taxes); compare the differences in state/country laws governing the corporation.
| 3. | Control Share Acquisition Provisions |
| a. | We vote against proposals to amend the charter to include control share acquisition provisions. |
| b. | We vote for proposals to opt out of control share acquisition statutes unless doing so would enable the completion of a takeover that would be detrimental to shareholders. |
| c. | We vote for proposals to restore voting rights to the control shares. |
| d. | We vote for proposals to opt out of control share cashout statutes. |
D-63
| J. | Mergers and Corporate Restructuring |
| 1. | Mergers and Acquisitions |
We vote on a case-by-case basis on mergers and acquisitions. Considerations include: benefits/advantages of the combined companies (i.e. economies of scale, operating synergies, increase in market power/share, etc…); offer price (premium or discount); change in the capital structure; impact on shareholder rights.
| 2. | Corporate Restructuring |
We vote on a case-by-case basis on corporate restructuring proposals involving minority squeeze outs and leveraged buyouts. Considerations include: offer price, other alternatives/offers considered and review of fairness opinions.
| 3. | Spin-offs |
We vote on a case-by-case basis on spin-offs. Considerations include the tax and regulatory advantages, planned use of sale proceeds, market focus, and managerial incentives.
| 4. | Asset Sales |
We vote on a case-by-case basis on asset sales. Considerations include the impact on the balance sheet/working capital, value received for the asset, and potential elimination of diseconomies.
| 5. | Liquidations |
We vote on a case-by-case basis on liquidations after reviewing management’s efforts to pursue other alternatives, appraisal value of assets, and the compensation plan for executives managing the liquidation.
| 6. | Appraisal Rights |
We vote for proposals to restore, or provide shareholders with, rights of appraisal.
| 7. | Changing Corporate Name |
We vote for proposals to change the “corporate name”, unless the proposed name change bears a negative connotation.
| 8. | Conversion of Securities |
We vote on a case-by-case basis on proposals regarding conversion of securities. Considerations include the dilution to existing shareholders, the conversion price relative to market value, financial issues, control issues, termination penalties, and conflicts of interest.
| 9. | Stakeholder Provisions |
We vote against proposals that ask the board to consider non-shareholder constituencies or other non-financial effects when evaluating a merger or business combination.
| K. | Social and Environmental Issues |
| 1. | In general we vote on a case-by-case basis on shareholder social and environmental proposals, on the basis that their impact on share value may be difficult to quantify. In most cases, however, we vote for disclosure reports that seek additional information, particularly when it appears the company has not adequately addressed shareholders’ social and environmental concerns. In determining our vote on shareholder social and environmental proposals, we also analyze the following factors: |
| a. | whether adoption of the proposal would have either a positive or negative impact on the company’s short-term or long-term share value; |
D-64
| b. | the percentage of sales, assets and earnings affected; |
| c. | the degree to which the company’s stated position on the issues could affect its reputation or sales, or leave it vulnerable to boycott or selective purchasing; |
| d. | whether the issues presented should be dealt with through government or company-specific action; |
| e. | whether the company has already responded in some appropriate manner to the request embodied in a proposal; |
| f. | whether the company’s analysis and voting recommendation to shareholders is persuasive; |
| g. | what other companies have done in response to the issue; |
| h. | whether the proposal itself is well framed and reasonable; |
| i. | whether implementation of the proposal would achieve the objectives sought in the proposal; and |
| j. | whether the subject of the proposal is best left to the discretion of the board. |
| 2. | Among the social and environmental issues to which we apply this analysis are the following: |
| a. | Energy Efficiency and Resource Utilization |
| b. | Environmental Impact and Climate Change |
| c. | Human Rights and Impact on Communities of Corporate Activities |
| d. | Equal Employment Opportunity and Non Discrimination |
| e. | ILO Standards and Child/Slave Labor |
| f. | Product Integrity and Marketing |
| g. | Sustainability Reporting |
| h. | Board Representation |
| i. | Animal Welfare |
| L. | Miscellaneous |
| 1. | Charitable Contributions |
We vote against proposals to eliminate, direct or otherwise restrict charitable contributions.
| 2. | Political Contributions |
In general, we vote on a case-by-case basis on shareholder proposals pertaining to political contributions. In determining our vote on political contribution proposals we consider, among other things, the following:
| • | Does the company have a political contributions policy publicly available |
| • | How extensive is the disclosure on these documents |
| • | What oversight mechanisms the company has in place for approving/reviewing political contributions and expenditures |
| • | Does the company provide information on its trade association expenditures |
| • | Total amount of political expenditure by the company in recent history |
D-65
| 3. | Operational Items |
| a. | We vote against proposals to provide management with the authority to adjourn an annual or special meeting absent compelling reasons to support the proposal. |
| b. | We vote against proposals to reduce quorum requirements for shareholder meetings below a majority of the shares outstanding unless there are compelling reasons to support the proposal. |
| c. | We vote for by-law or charter changes that are of a housekeeping nature (updates or corrections). |
| d. | We vote for management proposals to change the date/time/location of the annual meeting unless the proposed change is unreasonable. |
| e. | We vote against shareholder proposals to change the date/time/location of the annual meeting unless the current scheduling or location is unreasonable. |
| f. | We vote against proposals to approve other business when it appears as voting item. |
| 4. | Routine Agenda Items |
In some markets, shareholders are routinely asked to approve:
| • | the opening of the shareholder meeting |
| • | that the meeting has been convened under local regulatory requirements |
| • | the presence of a quorum |
| • | the agenda for the shareholder meeting |
| • | the election of the chair of the meeting |
| • | regulatory filings |
| • | the allowance of questions |
| • | the publication of minutes |
| • | the closing of the shareholder meeting |
We generally vote for these and similar routine management proposals.
| 5. | Allocation of Income and Dividends |
We generally vote for management proposals concerning allocation of income and the distribution of dividends, unless the amount of the distribution is consistently and unusually small or large.
| 6. | Stock (Scrip) Dividend Alternatives |
| a. | We vote for most stock (scrip) dividend proposals. |
| b. | We vote against proposals that do not allow for a cash option unless management demonstrates that the cash option is harmful to shareholder value. |
ClearBridge has determined that registered investment companies, particularly closed end investment companies, raise special policy issues making specific voting guidelines frequently inapplicable. To the extent that ClearBridge has proxy voting authority with respect to shares of registered investment companies, ClearBridge shall vote such shares in the best interest of client accounts and subject to the general fiduciary principles set forth herein without regard to the specific voting guidelines set forth in Section V. A. through L.
D-66
The voting policy guidelines set forth in Section V may be changed from time to time by ClearBridge in its sole discretion.
| VI. | OTHER CONSIDERATIONS |
In certain situations, ClearBridge may determine not to vote proxies on behalf of a client because ClearBridge believes that the expected benefit to the client of voting shares is outweighed by countervailing considerations. Examples of situations in which ClearBridge may determine not to vote proxies on behalf of a client include:
| A. | Share Blocking |
Proxy voting in certain countries requires “share blocking.” This means that shareholders wishing to vote their proxies must deposit their shares shortly before the date of the meeting (e.g. one week) with a designated depositary. During the blocking period, shares that will be voted at the meeting cannot be sold until the meeting has taken place and the shares have been returned to client accounts by the designated depositary. In deciding whether to vote shares subject to share blocking, ClearBridge will consider and weigh, based on the particular facts and circumstances, the expected benefit to clients of voting in relation to the detriment to clients of not being able to sell such shares during the applicable period.
| B | Securities on Loan |
Certain clients of ClearBridge, such as an institutional client or a mutual fund for which ClearBridge acts as a sub-adviser, may engage in securities lending with respect to the securities in their accounts. ClearBridge typically does not direct or oversee such securities lending activities. To the extent feasible and practical under the circumstances, ClearBridge will request that the client recall shares that are on loan so that such shares can be voted if ClearBridge believes that the expected benefit to the client of voting such shares outweighs the detriment to the client of recalling such shares (e.g., foregone income). The ability to timely recall shares for proxy voting purposes typically is not entirely within the control of ClearBridge and requires the cooperation of the client and its other service providers. Under certain circumstances, the recall of shares in time for such shares to be voted may not be possible due to applicable proxy voting record dates and administrative considerations.
| VII. | DISCLOSURE OF PROXY VOTING |
ClearBridge employees may not disclose to others outside of ClearBridge (including employees of other Legg Mason business units) how ClearBridge intends to vote a proxy absent prior approval from ClearBridge’s General Counsel/Chief Compliance Officer, except that a ClearBridge investment professional may disclose to a third party (other than an employee of another Legg Mason business unit) how s/he intends to vote without obtaining prior approval from ClearBridge’s General Counsel/Chief Compliance Officer if (1) the disclosure is intended to facilitate a discussion of publicly available information by ClearBridge personnel with a representative of a company whose securities are the subject of the proxy, (2) the company’s market capitalization exceeds $1 billion and (3) ClearBridge has voting power with respect to less than 5% of the outstanding common stock of the company.
If a ClearBridge employee receives a request to disclose ClearBridge’s proxy voting intentions to, or is otherwise contacted by, another person outside of ClearBridge (including an employee of another Legg Mason business unit) in connection with an upcoming proxy voting matter, he/she should immediately notify ClearBridge’s General Counsel/Chief Compliance Officer.
If a portfolio manager wants to take a public stance with regards to a proxy, s/he must consult with ClearBridge’s General Counsel/Chief Compliance Officer before making or issuing a public statement.
D-67
| VIII. | RECORDKEEPING AND OVERSIGHT |
ClearBridge shall maintain the following records relating to proxy voting:
| • | a copy of these policies and procedures; |
| • | a copy of each proxy form (as voted); |
| • | a copy of each proxy solicitation (including proxy statements) and related materials with regard to each vote; |
| • | documentation relating to the identification and resolution of conflicts of interest; |
| • | any documents created by ClearBridge that were material to a proxy voting decision or that memorialized the basis for that decision; and |
| • | a copy of each written client request for information on how ClearBridge voted proxies on behalf of the client, and a copy of any written response by ClearBridge to any (written or oral) client request for information on how ClearBridge voted proxies on behalf of the requesting client. |
Such records shall be maintained and preserved in an easily accessible place for a period of not less than six years from the end of the fiscal year during which the last entry was made on such record, the first two years in an appropriate office of the ClearBridge adviser.
To the extent that ClearBridge is authorized to vote proxies for a United States Registered Investment Company, ClearBridge shall maintain such records as are necessary to allow such fund to comply with its recordkeeping, reporting and disclosure obligations under applicable laws, rules and regulations.
In lieu of keeping copies of proxy statements, ClearBridge may rely on proxy statements filed on the EDGAR system as well as on third party records of proxy statements and votes cast if the third party provides an undertaking to provide the documents promptly upon request.
D-68
DIAMOND HILL CAPITAL MANAGEMENT, INC.
PROXY VOTING POLICY, PROCEDURES AND GUIDELINES
Rule 206(4)-6 under the Investment Advisers Act of 1940, as amended (the “Act”), make it a fraudulent, deceptive, or manipulative act, practice or course of business, within the meaning of Section 206(4) of the Act, for an investment adviser to exercise voting authority with respect to client securities, unless (i) the adviser has adopted and implemented written policies and procedures that are reasonably designed to ensure that the adviser votes proxies in the best interests of its clients, (ii) the adviser describes its proxy voting procedures to its clients and provides copies on request, and (iii) the adviser discloses to clients how they may obtain information on how the adviser voted their proxies.
In order to fulfill its responsibilities under the Act, Diamond Hill Capital Management, Inc. (hereinafter “we” or “us” or “our”) has adopted the following Proxy Voting Policy, Procedures and Guidelines (the “Proxy Policy”) with regard to companies in our clients’ investment portfolios.
Key Objective
The key objective of our Proxy Policy is to maximize the value of the securities held in our clients’ portfolios. These policies and procedures recognize that a company’s management is entrusted with the day-to-day operations and longer term strategic planning of the company, subject to the oversight of the company’s board of directors. While ordinary business matters are primarily the responsibility of management and should be approved solely by the corporation’s board of directors, we also recognize that the company’s shareholders must have final say over how management and directors are performing, and how shareholders’ rights and ownership interests are handled, especially when matters could have substantial economic implications to the shareholders.
Therefore, we will pay particular attention to the following matters in exercising our proxy voting responsibilities as a fiduciary for our clients:
Accountability. Each company should have effective means in place to hold those entrusted with running a company’s business accountable for their actions. Management of a company should be accountable to its board of directors and the board should be accountable to shareholders.
Alignment of Management and Shareholder Interests. Each company should endeavor to align the interests of management and the board of directors with the interests of the company’s shareholders. For example, we generally believe that compensation should be designed to reward management for doing a good job of creating value for the shareholders of the company.
Transparency. Each company should provide timely disclosure of important information about its business operations and financial performance to enable investors to evaluate the company’s performance and to make informed decisions about the purchase and sale of the company’s securities.
Decision Methods
Clients may retain the right to vote on shareholder proposals concerning stocks that we have bought on the client’s behalf. This is a perfectly reasonable request and we will not be offended if a client chooses to vote the shares. In addition, we will not vote the proxy for shares held in a client’s account where we do not have investment authority over the shares. The client can instruct the custodian to forward proxy materials from these issuers directly to the client for voting. Where clients have voting authority we encourage them to exercise their right by conscientiously voting all the shares owned.
Our recommendation, however, is that clients delegate the responsibility of voting on shareholder matters to us. Many clients recognize that good corporate governance and good investment decisions are complementary. Often, the investment manager is uniquely positioned to judge what is in the client’s best economic interest regarding shareholder proposals. Additionally, we can vote in accordance with a client’s wishes on any individual issue or shareholder proposal. Personally, we might believe that implementation of this proposal will diminish shareholder value, but the vote will be made in the manner
D-69
the client directs. We believe clients are entitled to a statement of our principles and an articulation of our process when we make investment decisions and similarly, we believe clients are entitled to an explanation of our voting principles, as both ultimately affect clients economically.
We have developed the guidelines outlined below to guide our proxy voting. In addition, we generally believe that the investment professionals involved in the selection of securities are the most knowledgeable and best suited to make decisions with regard to proxy votes. Therefore, the portfolio management team whose strategy owns the shares has the authority to override the guidelines. Also, where the guidelines indicate that an issue will be analyzed on a case-by-case basis or for votes that are not covered by the Proxy Policy, the portfolio management team whose strategy owns the shares has final authority to direct the vote. In special cases, we may seek insight from a variety of sources on how a particular proxy proposal will affect the financial prospects of a company then vote in keeping with our primary objective of maximizing shareholder value over the long term.
Voting to maximize shareholder value over the long term may lead to an unusual circumstance of votes on the same issue held by different clients may not be the same. For instance, the Small Cap Fund may own a company that is the subject of a takeover bid by a company owned in the Large Cap Fund. Analysis of the bid may show that the bid is in the best interest of the Large Cap Fund but not in the best interest of the Small Cap Fund; therefore the Large Cap Fund may vote for the merger whereas the Small Cap Fund may vote against it.
In addition, when securities are out on loan, our clients collectively hold a significant portion of the company’s outstanding securities, and we learn of a pending proxy vote enough in advance of the record date, we will perform a cost/benefit analysis to determine if there is a compelling reason to recall the securities from loan to enable us to vote.
Conflicts Of Interest
Conflicts of interest may arise from various sources. They may be due to positions taken by clients that are perceived by them to be in their own best interests, but are inconsistent with our primary objective of maximizing shareholder value in the long run. We encourage clients who have their own objectives that differ from ours to notify us that they will vote their proxies themselves, either permanently or temporarily. Otherwise, we will vote their shares in keeping with this Proxy Policy.
In some instances, a proxy vote may present a conflict between the interests of a client, on the one hand, and our interests or the interests of a person affiliated with us, on the other. For example, we might manage money for a plan sponsor and that company’s securities may be held in client investment portfolios. The potential for conflict of interest is imminent since we now would have a vested interest to acquiesce to company management’s recommendations, which may not be in the best interests of clients. Another possible scenario could arise if we held a strong belief in a social cause and felt obligated to vote in this manner, which may not be best for clients. In cases of conflicts of interest that impede our ability to vote, we will refrain from making a voting decision and will forward all of the necessary proxy voting materials to the client to enable the client to cast the votes. In the case of the mutual funds under our management, we will forward the proxy material to the independent trustees or directors if we are the investment adviser or to the investment adviser if we are the sub-adviser.
Recordkeeping
We will maintain records documenting how proxies were voted. In addition, when we vote contrary to the Proxy Policy or for votes that the Proxy Policy indicates will be analyzed on a case-by-case basis or for votes that are not covered by the Proxy Policy, we will document the rationale for our vote. We will maintain this documentation in accordance with the requirements of the Act and we will provide this information to a client who held the security in question upon the client’s request.
D-70
Proxy Voting Principles
| 1) | We recognize that the right to vote a proxy has economic value. All else being equal, a share with voting rights is worth more than a share of the same company without voting rights. (Sometimes, investors may observe a company with both a voting class and a non-voting class in which the non-voting class sells at a higher price than the voting, the exact opposite of the expected result described above; typically, this can be attributed to the voting class being relatively illiquid.) Thus, when you buy a share of voting stock, part of the purchase price is for the right to vote in matters concerning your company. If you do not exercise that right, you paid more for that stock than you should have. |
| 2) | We recognize that we incur additional fiduciary responsibility by assuming this proxy voting right. In general, acting as a fiduciary when dealing with the assets of others means being held to a higher than ordinary standard in each of the following aspects: |
Loyalty — We will act only in the best interest of the client. Furthermore, the duty of loyalty extends to the avoidance of conflicts of interest and self-dealing.
Care — We will carefully analyze the issues at hand and bring all the skills, knowledge, and insights a professional in the field is expected to have in order to cast an informed vote.
Prudence — We will make the preservation of assets and the earning of a reasonable return on those assets primary and secondary objectives as a fiduciary.
Impartiality — We will treat all clients fairly.
Discretion — We will keep client information confidential. Information concerning client-specific requests is strictly between the client and us.
| 3) | We believe that a corporation exists to maximize the value for shareholders. Absent a specific client directive, we will always vote in the manner (to the extent that it can be determined) that we believe will maximize the share price, and thus shareholder value, in the long-term. |
| 4) | We believe conscientious proxy voting can result in better investment performance. The presence of an owner-oriented management is a major consideration in many of our investment decisions. As a result, we typically would not expect to find ourselves at odds with management recommendations on major issues. Furthermore, we do not anticipate entering a position intending to be shareholder activists. Yet, cases will arise in which we feel the current management or management’s current strategy is unlikely to result in the maximization of shareholder value. So why would we own the stock? One reason might be that the stock price is at such a significant discount to intrinsic value that the share price need not be “maximized” for us to realize an attractive return. Another reason may be that we believe management will soon face reality and alter company strategy when it becomes apparent that a new strategy is more appropriate. Additionally, we may disagree with management on a specific issue while still holding admiration for a company, its management, or its corporate governance in general. We do not subscribe to the “If you don’t like management or its strategy, sell the stock” philosophy in many instances. |
| 5) | We believe there is relevant and material investment information contained in the proxy statement. Close attention to this document may reveal insights into management motives, aid in developing quantifiable or objective measures of how a company has managed its resources over a period of time, and, perhaps most importantly, speak volumes about a “corporate culture”. |
Proxy Voting Guidelines
Each proposal put to a shareholder vote is different. As a result, each must be considered individually, however, there are several issues that recur frequently in U.S. public companies. Below are brief descriptions of various issues and our position on each. Please note that this list is not meant to be all-inclusive. In the absence of exceptional circumstances, we generally will vote in this manner on such proposals.
D-71
| I. | Corporate Governance Provisions |
| A. | Board of Directors |
The election of the Board of Directors (the “Board”) is frequently viewed as a “routine item”. Yet, in many ways the election of the Board is the most important issue that comes before shareholders. Inherent conflicts of interest can exist between shareholders (the owners of the company) and management (who run the company). At many companies, plans have been implemented attempting to better align the interests of shareholders and management, including stock ownership requirements and additional compensation systems based on stock performance. Yet, seldom do these perfectly align shareholder and management interests. An independent Board serves the role of oversight on behalf of shareholders. For this reason, we strongly prefer that the majority of the Board be comprised of independent (also referred to as outside or non-affiliated) directors. Furthermore, we also strongly prefer that key committees be comprised entirely of outside directors.
1. Cumulative Voting
Cumulative voting allows the shareholders to distribute the total number of votes they have in any manner they wish when electing directors. In some cases, this may allow a small number of shareholders to elect a minority representative to the corporate board, thus ensuring representation for all sizes of shareholders. Cumulative voting may also allow a dissident shareholder to obtain representation on the Board in a proxy contest. To illustrate the difference between cumulative voting and straight voting, consider the John Smith Corporation. There are 100 total shares outstanding; Jones owns 51 and Wilson owns 49. Three directors are to be elected. Under the straight voting method, each shareholder is entitled to one vote per share and each vacant director’s position is voted on separately. Thus, Jones could elect all the directors since he would vote his 51 shares for his choice on each separately elected director. Under the cumulative voting method, each shareholder has a total number of votes equal to the number of shares owned times the number of directors to be elected. Thus, Jones has 153 votes (51 X 3 = 153) and Wilson has 147 votes (49 X 3). The election of all directors then takes place simultaneously, with the top three vote recipients being elected. Shareholders may group all their votes for one candidate. Thus, Wilson could vote all 147 of his votes for one candidate. This will ensure that Wilson is able to elect at least one director to the board since his candidate is guaranteed to be one of the top three vote recipients.
Since cumulative voting subjects management to the disciplinary effects of outside shareholder involvement, it should encourage management to maximize shareholder value and promote management accountability. Thus, we will vote FOR proposals seeking to permit cumulative voting.
2. Majority vs Plurality Voting
In evaluating majority voting vs. plurality voting we will vote on a case-by-case basis. A majority vote requires a candidate to receive support from a majority of votes cast to be elected. Plurality voting, on the other hand, provides that the winning candidate only garner more votes than a competing candidate. If a director runs unopposed under a plurality voting standard, he or she needs only one vote to be elected, so an “against” vote is meaningless. We feel that directors should be elected to the board by a majority vote simply because it gives us a greater ability to elect board candidates that represent our clients’ best interest. However, in the case where a company adopts a provision in which a board candidate receives more AGAINST votes than FOR votes is required to tender his or her resignation, there is less reason to vote in favor of a majority vote standard.
D-72
3. Election of Directors (Absenteeism)
Customarily, schedules for regular board and committee meetings are made well in advance. A person accepting a nomination for a directorship should be prepared to attend meetings. A pattern of high absenteeism (less than 75% attendance) raises sufficient doubt about that director’s ability to effectively represent shareholder interests and contribute experience and guidance to the company. While valid excuses for absences (such as illness) are possible, these are not the norm. Schedule conflicts are not an acceptable reason for absenteeism since it suggests a lack of commitment or an inability to devote sufficient time to make a noteworthy contribution. Thus, we will WITHHOLD our vote for (or vote AGAINST, if that option is provided) any director with a pattern of high absenteeism.
4. Classified Boards
A classified Board separates directors into more than one class, with only a portion of the full Board standing for election each year. For example, if the John Smith Corporation has nine directors on its Board and divides them into three classes, each member will be elected for a term of three years with elections staggered so that only one of the three classes stands for election in a given year. A non-classified Board requires all directors to stand for election every year and serve a one-year term.
Proponents of classified Boards argue that by staggering the election of directors, a certain level of continuity and stability is maintained. However, a classified Board makes it more difficult for shareholders to change control of the Board. A classified Board can delay a takeover advantageous to shareholders yet opposed by management or prevent bidders from approaching a target company if the acquirer fears having to wait more than one year before gaining majority control.
We will vote FOR proposals seeking to declassify the Board and AGAINST proposals to classify the Board.
5. Inside versus Independent (or Non-Affiliated) Directors
We will vote FOR shareholder proposals asking that Boards be comprised of a majority of independent directors.
We will vote FOR shareholder proposals seeking Board nominating committees be comprised exclusively of independent directors.
We will WITHHOLD votes for (or vote AGAINST, if that option is provided) directors who may have an inherent conflict of interest, such as due to receipt of consulting fees from a corporation (affiliated outsiders) if the fees are significant or represent a significant percent of the director’s income.
| B. | Confidential Voting |
In a system of confidential voting, individual shareholder’s votes are kept confidential. Management and shareholders are only told the vote total. This eliminates the pressure placed on investors to vote with management, especially in cases when a shareholder would desire a business relationship with management. We will vote FOR proposals seeking confidential voting.
| C. | Supermajority Votes |
Most state corporation laws require that mergers, acquisitions, and amendments to the corporate bylaws or charter be approved by a simple majority of the outstanding shares. A company may, however, set a higher requirement for certain corporate actions. We believe a simple majority should be enough to approve mergers and other business combinations, amend
D-73
corporate governance provisions, and enforce other issues relevant to all shareholders. Requiring a supermajority vote entrenches management and weakens the governance ability of shareholders. We will vote AGAINST management proposals to require a supermajority vote to enact these changes. In addition, we will vote FOR shareholder proposals seeking to lower supermajority vote requirements.
| D. | Shareholder Rights Plans (Poison Pills) |
Shareholder rights plans are corporate-sponsored financial devices designed with provisions that, when triggered by a hostile takeover bid, generally result in either: (1) dilution of the acquirer’s equity holdings in the target company; (2) dilution of the acquirer’s voting rights in the target company; or (3) dilution of the acquirer’s equity interest in the post-merger company. This is typically accomplished by distributing share rights to existing shareholders that allow the purchase of stock at a fixed price should a takeover attempt occur.
Proponents of shareholder rights plans argue that they benefit shareholders by forcing potential acquirers to negotiate with the target company’s Board, thus protecting shareholders from unfair coercive offers and often leading to higher premiums in the event of a purchase. Obviously, this argument relies on the assumption of director independence and integrity. Opponents claim that these plans merely lead to the entrenchment of management and discourage legitimate tender offers by making them prohibitively expensive.
We will evaluate these proposals on a case-by-case basis. However, we generally will vote AGAINST proposals seeking to ratify a poison pill in which the expiration of the plan (sunset provision) is unusually long, the plan does not allow for the poison pill to be rescinded in the face of a bona fide offer, or the existing management has a history of not allowing shareholders to consider legitimate offers. Similarly, we generally will vote FOR the rescission of a poison pill where these conditions exist.
We will vote FOR proposals requiring shareholder rights plans be submitted to shareholder vote.
| II. | Compensation Plans |
Management is an immensely important factor in the performance of a corporation. Management can either create or destroy shareholder value depending on the success it has both operating the business and allocating capital. Well-designed compensation plans can prove essential in setting the right incentives to enhance the probability that both operations and capital allocation are conducted in a rational manner. Ill-designed compensation plans work to the detriment of shareholders in several ways. For instance, there may be outsized compensation for mediocre (or worse) performance, directly reducing the resources available to the company, or misguided incentives could cloud business judgment. Given the variations in compensation plans, most of these proposals must be considered on a case-by-case basis.
| A. | Non-Employee Directors |
As directors take a more active role in corporate governance, compensation is becoming more performance-based. In general, stock-based compensation will better tie the interests of directors and shareholders than cash-based compensation. The goal is to have directors own enough stock (directly or in the form of a stock derivative) that when faced with a situation in which the interests of shareholders and management differ, rational directors will have incentive to act on behalf of shareholders. However, if the stock compensation or ownership is excessive (especially if management is viewed as the source for this largesse), the plan may not be beneficial.
We will vote FOR proposals to eliminate retirement plans and AGAINST proposals to maintain or expand retirement packages for non-employee directors.
D-74
We will vote FOR proposals requiring compensation of non-employee directors to be paid at least half in company stock.
| B. | Incentive Compensation subject to Section 162(m) |
The Omnibus Budget and Reconciliation Act of 1993 prohibits the deductibility of executive compensation of more than $1 million. The intention was to slow the rise in executive compensation (whether the rise could be economically justified or was “bad” per se is a separate question) and to tie more of the future compensation to performance. However, the law provided exemptions to this $1 million limit in certain circumstances. Included in this exemption was compensation above $1 million that was paid on account of the attainment of one or more performance goals. The IRS required the goals to be established by a compensation committee comprised solely of two or more outside directors. Also, the material terms of the compensation and performance goals must be disclosed to shareholders and approved. The compensation committee must certify that the goals have been attained before any payment is made.
The issue at hand is the qualification for a tax deduction, not whether the executive deserves more than $1 million per year in compensation.
We will vote FOR any such plan submitted for shareholder approval. Voting against an incentive bonus plan is fruitless if the practical result will be to deny the company, and ultimately its shareholders, the potential tax deduction.
| C. | Stock Incentive Plans |
Stock compensation programs can reward the creation of shareholder value through high payout sensitivity to increases in shareholder value. Of all the recurring issues presented for shareholder approval, these plans typically require the most thorough examination for several reasons. First, their economic significance is large. Second, the prevalence of these plans has grown and is likely to persist in the future. Third, there are many variations in these plans. As a result, we must consider any such plan on a case-by-case basis. However, some general comments are in order.
We recognize that options, stock appreciation rights, and other equity-based grants (whether the grants are made to directors, executive management, employees, or other parties) are a form of compensation. As such, there is a cost to their issuance and the issue boils down to a cost-benefit analysis. If the costs are excessive, then the benefit will be overwhelmed. Factors that are considered in determining whether the costs are too great (in other words, that shareholders are overpaying for the services of management and employees) include: the number of shares involved, the exercise price, the award term, the vesting parameters, and any performance criteria. Additionally, objective measures of company performance (which do not include short-term share price performance) will be factored into what we consider an acceptable amount of dilution. We will also consider past grants in our analysis, as well as the level of the executives’ or directors’ cash compensation.
We will look particularly closely at companies that have repriced options. Repricing stock options may reward poor performance and lessen the incentive such options are supposed to provide. In cases where there is a history of repricing stock options, we will vote AGAINST any plan not expressly prohibiting the future practice of option repricing.
| D. | Say-on-Pay |
The Securities and Exchange Commission adopted rules on Jan. 25, 2011 which implement requirements in Section 951 of the Dodd-Frank Wall Street Reform and Consumer Protection Act, which amends the Securities Exchange Act of 1934. The rules concern three separate non-binding shareholder votes on executive compensation:
| (1) | Say-on-Pay Votes. The new rule requires public companies subject to the proxy rules to provide their shareholders with an advisory vote on the compensation of the most highly |
D-75
| compensated executives. Say-on-pay votes must be held at least once every three years. As stated above, support for or against executive compensation will be determined on a case-by-case basis. |
| (2) | Frequency Votes. These companies also are required to provide their shareholders with an advisory vote on how often they would like to be presented with the say-on-pay votes – every year, every second year, or every third year. In voting on the frequency of the say-on-pay, we believe that a TRIENNIAL vote is appropriate due to the fact that say-on-pay is a non-binding advisory vote and more frequent votes could reduce the Board’s strategic focus on the business. A three-year time horizon allows the Board to make well-informed decisions regarding executive compensation, evaluate the effectiveness of executive compensation, and increase time spent focusing on long-term shareholder value creation. |
| (3) | Golden Parachute Disclosures and Votes. These companies are also required to disclose compensation arrangements and understandings with highly compensated executive officers in connection with an acquisition or merger. In certain circumstances, these companies also are required to conduct a shareholder vote to approve the golden parachute compensation arrangements. We have a bias against golden parachutes, but since each merger or acquisition presents unique facts and circumstances, we will determine our votes on golden parachutes on a case-by case basis. |
| III. | Capital Structure, Classes of Stock, and Recapitalizations |
| A. | Common Stock Authorization |
Corporations increase the supply of common stock for a variety of ordinary business reasons including: to raise new capital to invest in a project; to make an acquisition for stock; to fund a stock compensation program; or to implement a stock split or stock dividend. When proposing an increase in share authorization, corporations typically request an amount that provides a cushion for unexpected financing needs or opportunities. However, unusually large share authorizations create the potential for abuse. An example would be the targeted placement of a large number of common shares to a friendly party in order to deter a legitimate tender offer. Thus, we generally prefer that companies present for shareholder approval all requests for share authorizations that extend beyond what is currently needed, and indicate the specific purpose for which the shares are intended. Generally, we will vote AGAINST any proposal seeking to increase the total number of authorized shares to more than 120% of the current outstanding and reserved but unissued shares, unless there is a specific purpose for the shares with which we agree.
For example, suppose a company has a total share authorization of 100 million. Of the 100 million, 85 million are issued and outstanding and an additional 5 million are reserved but unissued. We would vote against any proposal seeking to increase the share authorization by more than 8 million shares (Total allowable authorization: 1.2 X 90 =108 million; Current authorization: 100 million).
| B. | Unequal Voting Rights (Dual Class Exchange Offers/ Dual Class Recapitalizations) |
Proposals to issue a class of stock with inferior or even no voting rights are sometimes made. Frequently, this class is given a preferential dividend to coax holders to cede voting power. In general, we will vote AGAINST proposals to authorize or issue voting shares without full voting rights on the grounds that it could entrench management.
| IV. | Social and Environmental Issues |
Shareholder proposals relating to a company’s activities, policies, or programs concerning a particular social or environmental issue have become prevalent at annual meetings. In some cases, an attempt is made to relate a recommendation for the company’s policies and activity to its financial health. In other cases, the proposal seems tangentially related at best. These issues are
D-76
often difficult to analyze in terms of their effect on shareholder value. As a result, these proposals must be considered on a case-by-case basis. In cases where we do not believe we can determine the effect, we will ABSTAIN. We will vote FOR any proposal that seeks to have a corporation change its activities or policy and we believe the failure to do so will result in economic harm to the company. Similarly, we will vote AGAINST any policy that requests a change we believe will result in economic harm.
We will vote FOR proposals seeking information that is relatively inexpensive to produce and provide, is not publicly available, and does not reveal sensitive company information that could be harmful if acquired by competitors. If these factors are present, then the issue reduces to freedom of information.
In practice, however, this is seldom the case. Frequently, shareholder proposals call for a company to conduct an exhaustive study of some issue that is only tangentially related to the company’s business interests. Further, the nature of the study proposed often deals with subjective issues in which no conclusive resolution will likely result from the study. We will vote AGAINST such proposals.
| V. | Voting Foreign Securities |
Voting proxies of foreign issuers can be much different than voting proxies of U.S.-domiciled companies. It can be more expensive (for instance, we could need to hire a translator for the proxy materials or, in some cases votes can only be cast in person so there would be travel costs to attend the meeting) and in some jurisdictions the shares to be voted must be sequestered and cannot be sold until the votes are cast or even until the meeting has been held. In addition, the SEC has acknowledged that in some cases it can be in an investor’s best interests not to vote a proxy, for instance, when the costs of voting outweigh the potential benefits of voting. Therefore, proxy voting for foreign issuers will be evaluated and voted, or not voted, on a case-by-case basis.
Adopted: June 2003
Amended: August 2011
D-77
FRANKLIN ADVISERS, INC
FRANKLIN ADVISORY SERVICES, LLC
FRANKLIN MUTUAL ADVISERS, LLC
TEMPLETON INVESTMENT COUNSEL LLC
PROXY VOTING POLICIES & PROCEDURES
RESPONSIBILITY OF INVESTMENT MANAGER TO VOTE PROXIES
Each of Franklin Advisers, Inc., Franklin Advisory Services, LLC, Franklin Mutual Advisers, LLC, and Templeton Investment Counsel, LLC (hereinafter “Investment Manager”) has delegated its administrative duties with respect to voting proxies for equity securities to the Proxy Group within Franklin Templeton Companies, LLC (the “Proxy Group”), a wholly-owned subsidiary of Franklin Resources, Inc. Franklin Templeton Companies, LLC provides a variety of general corporate services to its affiliates, including but not limited to legal and compliance activities. Proxy duties consist of analyzing proxy statements of issuers whose stock is owned by any client (including both investment companies and any separate accounts managed by Investment Manager) that has either delegated proxy voting administrative responsibility to Investment Manager or has asked for information and/or recommendations on the issues to be voted.
The Proxy Group will process proxy votes on behalf of, and Investment Manager votes proxies solely in the best interests of, separate account clients, Investment Manager-managed mutual fund shareholders, or Undertakings for the Collective Investment of Transferable Securities (“UCITS”) that have properly delegated such responsibility in writing, or, where employee benefit plan assets subject to the Employee Retirement Income Security Act of 1974, as amended, are involved (“ERISA accounts”), in the best interests of the plan participants and beneficiaries (collectively, “Advisory Clients”), unless (i) the power to vote has been specifically retained by the named fiduciary in the documents in which the named fiduciary appointed the Investment Manager or (ii) the documents otherwise expressly prohibit the Investment Manager from voting proxies. The Investment Manager recognizes that the exercise of voting rights on securities held by ERISA plans for which the Investment Manager has voting responsibility is a fiduciary duty that must be exercised with care, skill, prudence and diligence. The Investment Manager will inform Advisory Clients that have not delegated the voting responsibility but that have requested voting advice about Investment Manager’s views on such proxy votes. The Proxy Group also provides these services to other advisory affiliates of Investment Manager.
The Investment Manager has adopted and implemented proxy voting policies and procedures that it believes are reasonably designed to ensure that proxies are voted in the best interest of Advisory Clients in accordance with its fiduciary duties and rule 206(4)-6 under the Investment Advisers Act of 1940. To the extent that the Investment Manager has a subadvisory agreement with an affiliated investment manager (the “Affiliated Subadviser”) with respect to a particular Advisory Client, the Investment Manager may delegate proxy voting responsibility to the Affiliated Subadviser. The Investment Manager’s Proxy Voting Policies and Procedures are substantially similar to those of its affiliated investment managers.
HOW INVESTMENT MANAGER VOTES PROXIES
Fiduciary Considerations
All proxies received by the Proxy Group will be voted based upon Investment Manager’s instructions and/or policies. To assist it in analyzing proxies, Investment Manager subscribes to Institutional Shareholder Services Inc. (“ISS”), an unaffiliated third party corporate governance research service that provides in-depth analyses of shareholder meeting agendas and vote recommendations. In addition, the Investment Manager subscribes to ISS’s Proxy Voting Service and Vote Disclosure Service. These
D-78
services include receipt of proxy ballots, working with custodian banks, account maintenance, executing votes, ballot reconciliation, maintaining vote records, providing comprehensive reporting and vote disclosure services. Also, Investment Manager subscribes to Glass, Lewis & Co., LLC (“Glass Lewis”), an unaffiliated third party analytical research firm, to receive analyses and vote recommendations on the shareholder meetings of publicly held U.S. companies, as well as a limited subscription to its international research. Although ISS’s and/or Glass Lewis’s analyses are thoroughly reviewed and considered in making a final voting decision, Investment Manager does not consider recommendations from ISS, Glass Lewis, or any other third party to be determinative of Investment Manager’s ultimate decision. As a matter of policy, the officers, directors and employees of Investment Manager and the Proxy Group will not be influenced by outside sources whose interests conflict with the interests of Advisory Clients.
Conflicts of Interest
All conflicts of interest will be resolved in the interests of the Advisory Clients. Investment Manager is an affiliate of a large, diverse financial services firm with many affiliates and makes its best efforts to avoid conflicts of interest. However, conflicts of interest can arise in situations where:
| 1. | The issuer is a client1 of Investment Manager or its affiliates; |
| 2. | The issuer is a vendor whose products or services are material or significant to the business of Investment Manager or its affiliates; |
| 3. | The issuer is an entity participating to a material extent in the distribution of proprietary investment products advised, administered or sponsored by Investment Manager or its affiliates (e.g., a broker, dealer or bank);2 |
| 4. | The issuer is a significant executing broker dealer;3 |
| 5. | An Access Person4 of Investment Manager or its affiliates also serves as a director or officer of the issuer; |
| 6. | A director or trustee of Franklin Resources, Inc. or any of its subsidiaries or of a Franklin Templeton investment product, or an immediate family member5 of such director or trustee, also serves as an officer or director of the issuer; or |
| 7. | The issuer is Franklin Resources, Inc. or any of its proprietary investment products that are offered to the public as a direct investment. |
Nonetheless, even though a potential conflict of interest exists, the Investment Manager may vote in opposition to the recommendations of an issuer’s management even if contrary to the recommendations of a third party proxy voting research provider. If management has made no recommendations, the Proxy Group may defer to the voting instructions of the Investment Manager.
Material conflicts of interest are identified by the Proxy Group based upon analyses of client, distributor, broker dealer and vendor lists, information periodically gathered from directors and officers, and
| 1 | For purposes of this section, a “client” does not include underlying investors in a commingled trust, Canadian pooled fund, or other pooled investment vehicle managed by the Investment Manager or its affiliates. Sponsors of funds sub-advised by Investment Manager or its affiliates will be considered a “client.” |
| 2 | The top 40 distributors (based on aggregate gross sales) will be considered to present a potential conflict of interest. In addition, any insurance company that has entered into a participation agreement with a Franklin Templeton entity to distribute the Franklin Templeton Variable Insurance Products Trust or other variable products will be considered to present a potential conflict of interest. |
| 3 | The top 40 executing broker-dealers (based on gross brokerage commissions and client commissions) will be considered to present a potential conflict of interest. |
| 4 | “Access Person” shall have the meaning provided under the current Code of Ethics of Franklin Resources, Inc. |
| 5 | The term “immediate family member” means a person’s spouse; child residing in the person’s household (including step and adoptive children); and any dependent of the person, as defined in Section 152 of the Internal Revenue Code (26 U.S.C. 152). |
D-79
information derived from other sources, including public filings. The Proxy Group gathers and analyzes this information on a best efforts basis, as much of this information is provided directly by individuals and groups other than the Proxy Group, and the Proxy Group relies on the accuracy of the information it receives from such parties.
In situations where a material conflict of interest is identified between the Investment Manager or one of its affiliates and an issuer, the Proxy Group may defer to the voting recommendation of ISS, Glass Lewis, or those of another independent third party provider of proxy services or send the proxy directly to the relevant Advisory Clients with the Investment Manager’s recommendation regarding the vote for approval.
Where the Proxy Group refers a matter to an Advisory Client, it may rely upon the instructions of a representative of the Advisory Client, such as the board of directors or trustees, a committee of the board, or an appointed delegate in the case of a U.S. registered mutual fund, the conducting officer in the case of an open-ended collective investment scheme formed as a Société d’investissement à capital variable (SICAV), the Independent Review Committee for Canadian investment funds, or a plan administrator in the case of an employee benefit plan. The Proxy Group may determine to vote all shares held by Advisory Clients in accordance with the instructions of one or more of the Advisory Clients.
The Investment Manager may also decide whether to vote proxies for securities deemed to present conflicts of interest that are sold following a record date, but before a shareholder meeting date. The Investment Manager may consider various factors in deciding whether to vote such proxies, including Investment Manager’s long-term view of the issuer’s securities for investment, or it may defer the decision to vote to the applicable Advisory Client.
Where a material conflict of interest has been identified, but the items on which the Investment Manager’s vote recommendations differ from Glass Lewis, ISS, or another independent third party provider of proxy services relate specifically to (1) shareholder proposals regarding social or environmental issues, (2) “Other Business” without describing the matters that might be considered, or (3) items the Investment Manager wishes to vote in opposition to the recommendations of an issuer’s management, the Proxy Group may defer to the vote recommendations of the Investment Manager rather than sending the proxy directly to the relevant Advisory Clients for approval.
To avoid certain potential conflicts of interest, the Investment Manager will employ echo voting, if possible, in the following instances: (1) when a Franklin Templeton registered investment company invests in an underlying fund in reliance on any one of Sections 12(d)(1)(E), (F), or (G) of the Investment Company Act of 1940, as amended, (“1940 Act”), the rules thereunder, or pursuant to a U.S. Securities and Exchange Commission (“SEC”) exemptive order thereunder; (2) when a Franklin Templeton registered investment company invests uninvested cash in affiliated money market funds pursuant to the rules under the 1940 Act or any exemptive orders thereunder (“cash sweep arrangement”); or (3) when required pursuant to the fund’s governing documents or applicable law. Echo voting means that the Investment Manager will vote the shares in the same proportion as the vote of all of the other holders of the fund’s shares.
Weight Given Management Recommendations
One of the primary factors Investment Manager considers when determining the desirability of investing in a particular company is the quality and depth of that company’s management. Accordingly, the recommendation of management on any issue is a factor that Investment Manager considers in determining how proxies should be voted. However, Investment Manager does not consider recommendations from management to be determinative of Investment Manager’s ultimate decision. As a matter of practice, the votes with respect to most issues are cast in accordance with the position of the company’s management. Each issue, however, is considered on its own merits, and Investment Manager will not support the position of a company’s management in any situation where it determines that the ratification of management’s position would adversely affect the investment merits of owning that company’s shares.
D-80
THE PROXY GROUP
The Proxy Group is part of the Franklin Templeton Companies, LLC Legal Department and is overseen by legal counsel. Full-time staff members are devoted to proxy voting administration and oversight and providing support and assistance where needed. On a daily basis, the Proxy Group will review each proxy upon receipt as well as any agendas, materials and recommendations that they receive from ISS, Glass Lewis, or other sources. The Proxy Group maintains a log of all shareholder meetings that are scheduled for companies whose securities are held by Investment Manager’s managed funds and accounts. For each shareholder meeting, a member of the Proxy Group will consult with the research analyst that follows the security and provide the analyst with the agenda, ISS and/or Glass Lewis analyses, recommendations and any other information provided to the Proxy Group. Except in situations identified as presenting material conflicts of interest, Investment Manager’s research analyst and relevant portfolio manager(s) are responsible for making the final voting decision based on their review of the agenda, ISS and/or Glass Lewis analyses, proxy statements, their knowledge of the company and any other information publicly available. In situations where the Investment Manager has not responded with vote recommendations to the Proxy Group by the deadline date, the Proxy Group may defer to the vote recommendations of an independent third party provider of proxy services. Except in cases where the Proxy Group is deferring to the voting recommendation of an independent third party service provider, the Proxy Group must obtain voting instructions from Investment Manager’s research analyst, relevant portfolio manager(s), legal counsel and/or the Advisory Client prior to submitting the vote. In the event that an account holds a security that the Investment Manager did not purchase on its behalf, and the Investment Manager does not normally consider the security as a potential investment for other accounts, the Proxy Group may defer to the voting recommendations of an independent third party service provider or take no action on the meeting.
GENERAL PROXY VOTING GUIDELINES
Investment Manager has adopted general guidelines for voting proxies as summarized below. In keeping with its fiduciary obligations to its Advisory Clients, Investment Manager reviews all proposals, even those that may be considered to be routine matters. Although these guidelines are to be followed as a general policy, in all cases each proxy and proposal will be considered based on the relevant facts and circumstances. Investment Manager may deviate from the general policies and procedures when it determines that the particular facts and circumstances warrant such deviation to protect the best interests of the Advisory Clients. These guidelines cannot provide an exhaustive list of all the issues that may arise nor can Investment Manager anticipate all future situations. Corporate governance issues are diverse and continually evolving and Investment Manager devotes significant time and resources to monitor these changes.
INVESTMENT MANAGER’S PROXY VOTING POLICIES AND PRINCIPLES
Investment Manager’s proxy voting positions have been developed based on years of experience with proxy voting and corporate governance issues. These principles have been reviewed by various members of Investment Manager’s organization, including portfolio management, legal counsel, and Investment Manager’s officers. The Board of Directors of Franklin Templeton’s U.S.-registered mutual funds will approve the proxy voting policies and procedures annually.
The following guidelines reflect what Investment Manager believes to be good corporate governance and behavior:
Board of Directors: The election of directors and an independent board are key to good corporate governance. Directors are expected to be competent individuals and they should be accountable and responsive to shareholders. Investment Manager supports an independent board of directors, and prefers that key committees such as audit, nominating, and compensation committees be comprised of
D-81
independent directors. Investment Manager will generally vote against management efforts to classify a board and will generally support proposals to declassify the board of directors. Investment Manager will consider withholding votes from directors who have attended less than 75% of meetings without a valid reason. Investment Manager will review the issue of separating Chairman and CEO positions on a case-by-case basis taking into consideration other factors including the corporate governance guidelines and performance. Investment Manager evaluates proposals to restore or provide for cumulative voting on a case-by-case basis and considers such factors as corporate governance provisions as well as relative performance. The Investment Manager generally will support non-binding shareholder proposals to require a majority vote standard for the election of directors; however, if these proposals are binding, the Investment Manager will give careful review on a case-by-case basis of the potential ramifications of such implementation.
In the event of a contested election, the Investment Manager will review a number of factors in making a decision including management’s track record, the company’s financial performance, qualifications of candidates on both slates, and the strategic plan of the dissidents.
Ratification of Auditors: Investment Manager will closely scrutinize the independence, role, and performance of auditors. On a case-by-case basis, Investment Manager will examine proposals relating to non-audit relationships and non-audit fees. Investment Manager will also consider, on a case-by-case basis, proposals to rotate auditors, and will vote against the ratification of auditors when there is clear and compelling evidence of a lack of independence, accounting irregularities or negligence attributable to the auditors. The Investment Manager may also consider whether the ratification of auditors has been approved by an appropriate audit committee that meets applicable composition and independence requirements.
Management & Director Compensation: A company’s equity-based compensation plan should be in alignment with the shareholders’ long-term interests. Investment Manager believes that executive compensation should be directly linked to the performance of the company. Investment Manager evaluates plans on a case-by-case basis by considering several factors to determine whether the plan is fair and reasonable. Investment Manager reviews the ISS quantitative model utilized to assess such plans and/or the Glass Lewis evaluation of the plan. Investment Manager will generally oppose plans that have the potential to be excessively dilutive, and will almost always oppose plans that are structured to allow the repricing of underwater options, or plans that have an automatic share replenishment “evergreen” feature. Investment Manager will generally support employee stock option plans in which the purchase price is at least 85% of fair market value, and when potential dilution is 5% or less.
Severance compensation arrangements will be reviewed on a case-by-case basis, although Investment Manager will generally oppose “golden parachutes” that are considered excessive. Investment Manager will normally support proposals that require that a percentage of directors’ compensation be in the form of common stock, as it aligns their interests with those of the shareholders.
Investment Manager will review non-binding say-on-pay proposals on a case-by-case basis, and will generally vote in favor of such proposals unless compensation is misaligned with performance and/or shareholders’ interests, the company has not provided reasonably clear disclosure regarding its compensation practices, or there are concerns with the company’s remuneration practices.
Anti-Takeover Mechanisms and Related Issues: Investment Manager generally opposes anti-takeover measures since they tend to reduce shareholder rights. However, as with all proxy issues, Investment Manager conducts an independent review of each anti-takeover proposal. On occasion, Investment Manager may vote with management when the research analyst has concluded that the proposal is not onerous and would not harm Advisory Clients’ interests as stockholders. Investment Manager generally supports proposals that require shareholder rights plans (“poison pills”) to be subject to a shareholder vote. Investment Manager will closely evaluate shareholder rights’ plans on a case-by-case basis to determine whether or not they warrant support. Investment Manager will generally vote against any proposal to issue stock that has unequal or subordinate voting rights. In addition, Investment Manager
D-82
generally opposes any supermajority voting requirements as well as the payment of “greenmail.” Investment Manager usually supports “fair price” provisions and confidential voting. The Investment Manager will review a company’s proposal to reincorporate to a different state or country on a case-by-case basis taking into consideration financial benefits such as tax treatment as well as comparing corporate governance provisions and general business laws that may result from the change in domicile.
Changes to Capital Structure: Investment Manager realizes that a company’s financing decisions have a significant impact on its shareholders, particularly when they involve the issuance of additional shares of common or preferred stock or the assumption of additional debt. Investment Manager will carefully review, on a case-by-case basis, proposals by companies to increase authorized shares and the purpose for the increase. Investment Manager will generally not vote in favor of dual-class capital structures to increase the number of authorized shares where that class of stock would have superior voting rights. Investment Manager will generally vote in favor of the issuance of preferred stock in cases where the company specifies the voting, dividend, conversion and other rights of such stock and the terms of the preferred stock issuance are deemed reasonable. Investment Manager will review proposals seeking preemptive rights on a case-by-case basis.
Mergers and Corporate Restructuring: Mergers and acquisitions will be subject to careful review by the research analyst to determine whether they would be beneficial to shareholders. Investment Manager will analyze various economic and strategic factors in making the final decision on a merger or acquisition. Corporate restructuring proposals are also subject to a thorough examination on a case-by-case basis.
Environmental, Social and Governance Issues: As a fiduciary, Investment Manager is primarily concerned about the financial interests of its Advisory Clients. Investment Manager will generally give management discretion with regard to social, environmental and ethical issues although Investment Manager may vote in favor of those issues that are believed to have significant economic benefits or implications. Investment Manager generally supports the right of shareholders to call special meetings and act by written consent. However, Investment Manager will review such shareholder proposals on a case-by-case basis in an effort to ensure that such proposals do not disrupt the course of business or waste company resources for the benefit of a small minority of shareholders. The Investment Manager will consider supporting a shareholder proposal seeking disclosure and greater board oversight of lobbying and corporate political contributions if Investment Manager believes that there is evidence of inadequate oversight by the company’s board, if the company’s current disclosure is significantly deficient, or if the disclosure is notably lacking in comparison to the company’s peers. The Investment Manager will consider on a case-by-case basis any well-drafted and reasonable proposals for proxy access considering such factors as the size of the company, ownership thresholds and holding periods, responsiveness of management, intentions of the shareholder proponent, company performance, and shareholder base.
Global Corporate Governance: Investment Manager manages investments in countries worldwide. Many of the tenets discussed above are applied to Investment Manager’s proxy voting decisions for international investments. However, Investment Manager must be flexible in these worldwide markets. Principles of good corporate governance may vary by country, given the constraints of a country’s laws and acceptable practices in the markets. As a result, it is on occasion difficult to apply a consistent set of governance practices to all issuers. As experienced money managers, Investment Manager’s analysts are skilled in understanding the complexities of the regions in which they specialize and are trained to analyze proxy issues germane to their regions.
PROXY PROCEDURES
The Proxy Group is fully cognizant of its responsibility to process proxies and maintain proxy records pursuant to SEC and Canadian Securities Administrators (“CSA”) rules and regulations. In addition, Investment Manager understands its fiduciary duty to vote proxies and that proxy voting decisions may
D-83
affect the value of shareholdings. Therefore, Investment Manager will generally attempt to process every proxy it receives for all domestic and foreign securities. However, there may be situations in which Investment Manager may be unable to vote a proxy, or may chose not to vote a proxy, such as where: (i) proxy ballot was not received from the custodian bank; (ii) a meeting notice was received too late; (iii) there are fees imposed upon the exercise of a vote and it is determined that such fees outweigh the benefit of voting; (iv) there are legal encumbrances to voting, including blocking restrictions in certain markets that preclude the ability to dispose of a security if Investment Manager votes a proxy or where Investment Manager is prohibited from voting by applicable law or other regulatory or market requirements, including but not limited to, effective Powers of Attorney; (v) the Investment Manager held shares on the record date but has sold them prior to the meeting date; (vi) proxy voting service is not offered by the custodian in the market; (vii) the Investment Manager believes it is not in the best interest of the Advisory Client to vote the proxy for any other reason not enumerated herein; or (viii) a security is subject to a securities lending or similar program that has transferred legal title to the security to another person. Investment Manager or its affiliates may, on behalf of one or more of the proprietary registered investment companies advised by Investment Manager or its affiliates, determine to use its best efforts to recall any security on loan where Investment Manager or its affiliates (a) learn of a vote on a material event that may affect a security on loan and (b) determine that it is in the best interests of such proprietary registered investment companies to recall the security for voting purposes. Investment Managers will not generally make such efforts on behalf of other Advisory Clients, or notify such Advisory Clients or their custodians that Investment Manager or its affiliates has learned of such a vote.
There may be instances in certain non-U.S. markets where split voting is not allowed. Split voting occurs when a position held within an account is voted in accordance with two differing instructions. Some markets and/or issuers only allow voting on an entire position and do not accept split voting. In certain cases, when more than one Franklin Templeton Investment Manager has accounts holding shares of an issuer that are held in an omnibus structure, the Proxy Group will seek direction from an appropriate representative of the Advisory Client with multiple Investment Managers (such as the conducting officer in the case of an open-ended collective investment scheme formed as a Société d’investissement à capital variable (SICAV)), or the Proxy Group will submit the vote based on the voting instructions provided by the Investment Manager with accounts holding the greatest number of shares of the security within the omnibus structure.
Investment Manager may vote against an agenda item where no further information is provided, particularly in non-U.S. markets. For example, if “Other Business” is listed on the agenda with no further information included in the proxy materials, Investment Manager may vote against the item to send a message to the company that if it had provided additional information, Investment Manager may have voted in favor of that item. Investment Manager may also enter a “withhold” vote on the election of certain directors from time to time based on individual situations, particularly where Investment Manager is not in favor of electing a director and there is no provision for voting against such director.
If several issues are bundled together in a single voting item, the Investment Manager will assess the total benefit to shareholders and the extent that such issues should be subject to separate voting proposals.
The following describes the standard procedures that are to be followed with respect to carrying out Investment Manager’s proxy policy:
| 1. | The Proxy Group will identify all Advisory Clients, maintain a list of those clients, and indicate those Advisory Clients who have delegated proxy voting authority in writing to the Investment Manager. The Proxy Group will periodically review and update this list. If the agreement with an Advisory Client permits the Advisory Client to provide instructions to the Investment Manager regarding how to vote the client’s shares, the Investment Manager will make a best-efforts attempt to vote per the Advisory Client’s instructions. |
D-84
| 2. | All relevant information in the proxy materials received (e.g., the record date of the meeting) will be recorded promptly by the Proxy Group in a database to maintain control over such materials. |
| 3. | The Proxy Group will review and compile information on each proxy upon receipt of any agendas, materials, reports, recommendations from ISS and/or Glass Lewis, or other information. The Proxy Group will then forward this information to the appropriate research analyst for review and voting instructions. |
| 4. | In determining how to vote, Investment Manager’s analysts and relevant portfolio manager(s) will consider the General Proxy Voting Guidelines set forth above, their in-depth knowledge of the company, any readily available information and research about the company and its agenda items, and the recommendations put forth by ISS, Glass Lewis, or other independent third party providers of proxy services. |
| 5. | The Proxy Group is responsible for maintaining the documentation that supports Investment Manager’s voting decision. Such documentation may include, but is not limited to, any information provided by ISS, Glass Lewis, or other proxy service providers and, with respect to an issuer that presents a potential conflict of interest, any board or audit committee memoranda describing the position it has taken. Additionally, the Proxy Group may include documentation obtained from the research analyst, portfolio manager and/or legal counsel; however, the relevant research analyst may, but is not required to, maintain additional documentation that was used or created as part of the analysis to reach a voting decision, such as certain financial statements of an issuer, press releases, or notes from discussions with an issuer’s management. |
| 6. | After the proxy is completed but before it is returned to the issuer and/or its agent, the Proxy Group may review those situations including special or unique documentation to determine that the appropriate documentation has been created, including conflict of interest screening. |
| 7. | The Proxy Group will make every effort to submit Investment Manager’s vote on all proxies to ISS by the cut-off date. However, in certain foreign jurisdictions or instances where the Proxy Group did not receive sufficient notice of the meeting, the Proxy Group will use its best efforts to send the voting instructions to ISS in time for the vote to be processed. |
| 8. | With respect to proprietary products, the Proxy Group will file Powers of Attorney in all jurisdictions that require such documentation on a best efforts basis. |
| 9. | The Proxy Group prepares reports for each Advisory Client that has requested a record of votes cast. The report specifies the proxy issues that have been voted for the Advisory Client during the requested period and the position taken with respect to each issue. The Proxy Group sends one copy to the Advisory Client, retains a copy in the Proxy Group’s files and forwards a copy to either the appropriate portfolio manager or the client service representative. While many Advisory Clients prefer quarterly or annual reports, the Proxy Group will provide reports for any timeframe requested by an Advisory Client. |
| 10. | If the Franklin Templeton Services, LLC Global Trade Services learns of a vote on a potentially material event that may affect a security on loan from a proprietary registered investment company, Global Trade Services will notify Investment Manager. If the Investment Manager decides that the vote is material and it would be in the best interests of shareholders to recall the security, the Investment Manager will advise Global Trade Services to contact the custodian bank in an effort to retrieve the security. If so requested by Investment Manager, Global Trade Services shall use its best efforts to recall any security on loan and will use other practicable and legally enforceable means to ensure that Investment Manager is able to fulfill its fiduciary duty to vote proxies for proprietary registered investment companies with respect to such loaned securities. However, there can be no guarantee that the securities can be retrieved for such purposes. Global Trade Services will advise the Proxy Group of all recalled securities. Many |
D-85
| Advisory Clients have entered into securities lending arrangements with agent lenders to generate additional revenue. Under normal circumstances, the Investment Manager will not make efforts to recall any security on loan for voting purposes on behalf of other Advisory Clients, or notify such clients or their custodians that the Investment Manager or its affiliates have learned of such a vote. |
| 11. | The Proxy Group participates in Franklin Templeton Investment’s Business Continuity and Disaster Preparedness programs. The Proxy Group will conduct disaster recovery testing on a periodic basis in an effort to ensure continued operations of the Proxy Group in the event of a disaster. Should the Proxy Group not be fully operational, then the Proxy Group will instruct ISS to vote all meetings immediately due per the recommendations of the appropriate third-party proxy voting service provider. |
| 12. | The Proxy Group, in conjunction with Legal Staff responsible for coordinating Fund disclosure, on a timely basis, will file all required Form N-PXs, with respect to proprietary registered investment company clients, disclose that each fund’s proxy voting record is available on the Franklin Templeton web site, and will make available the information disclosed in each fund’s Form N-PX as soon as is reasonably practicable after filing Form N-PX with the SEC. |
| 13. | The Proxy Group, in conjunction with Legal Staff responsible for coordinating Fund disclosure, will ensure that all required disclosure about proxy voting of the proprietary registered investment company clients is made in such clients’ disclosure documents. |
| 14. | The Proxy Group is subject to periodic review by Internal Audit, compliance groups, and external auditors. |
| 15. | The Proxy Group will review the guidelines of ISS and Glass Lewis, with special emphasis on the factors they use with respect to proxy voting recommendations. |
| 16. | The Proxy Group will update the proxy voting policies and procedures as necessary for review and approval by legal, compliance, investment officers, and/or other relevant staff. |
| 17. | The Proxy Group will familiarize itself with the procedures of ISS that govern the transmission of proxy voting information from the Proxy Group to ISS and periodically review how well this process is functioning. The Proxy Group, in conjunction with the compliance department, will conduct periodic due diligence reviews of ISS and Glass Lewis via on-site visits or by written questionnaires. The Investment Manager reviews the conflicts procedures of ISS and Glass Lewis as part of the periodic due diligence process. The Investment Manager also considers the independence of ISS and Glass Lewis on an on-going basis. |
| 18. | The Proxy Group will investigate, or cause others to investigate, any and all instances where these Procedures have been violated or there is evidence that they are not being followed. Based upon the findings of these investigations, the Proxy Group, if practicable, will recommend amendments to these Procedures to minimize the likelihood of the reoccurrence of non-compliance. |
| 19. | At least annually, the Proxy Group will verify that: |
| a. | A sampling of proxies received by Franklin Templeton Investments has been voted in a manner consistent with the Proxy Voting Policies and Procedures; |
| b. | A sampling of proxies received by Franklin Templeton Investments has been voted in accordance with the instructions of the Investment Manager; |
| c. | Adequate disclosure has been made to clients and fund shareholders about the procedures and how proxies were voted in markets where such disclosures are required by law or regulation; and |
D-86
| d. | Timely filings were made with applicable regulators, as required by law or regulation, related to proxy voting. |
The Proxy Group is responsible for maintaining appropriate proxy voting records. Such records will include, but are not limited to, a copy of all materials returned to the issuer and/or its agent, the documentation described above, listings of proxies voted by issuer and by client, each written client request for proxy voting policies/records and the Investment Manager’s written response to any client request for such records, and any other relevant information. The Proxy Group may use an outside service such as ISS to support this recordkeeping function. All records will be retained for at least five years, the first two of which will be on-site. Advisory Clients may request copies of their proxy voting records by calling the Proxy Group collect at 1-954-527-7678, or by sending a written request to: Franklin Templeton Companies, LLC, 300 S.E. 2nd Street, Fort Lauderdale, FL 33301, Attention: Proxy Group. The Investment Manager does not disclose to third parties (other than ISS) the proxy voting records of its Advisory Clients, except to the extent such disclosure is required by applicable law or regulation or court order. Advisory Clients may review Investment Manager’s proxy voting policies and procedures on-line at www.franklintempleton.com and may request additional copies by calling the number above. For U.S. proprietary registered investment companies, an annual proxy voting record for the period ending June 30 of each year will be posted to www.franklintempleton.com no later than August 31 of each year. For proprietary Canadian mutual fund products, an annual proxy voting record for the period ending June 30 of each year will be posted to www.franklintempleton.ca no later than August 31 of each year. The Proxy Group will periodically review web site posting and update the posting when necessary. In addition, the Proxy Group is responsible for ensuring that the proxy voting policies, procedures and records of the Investment Manager are available as required by law and is responsible for overseeing the filing of such policies, procedures and mutual fund voting records with the SEC, the CSA and other applicable regulators.
As of January 2, 2013
D-87
KNIGHTSBRIDGE ASSET MANAGEMENT, LLC
PROXY VOTING SUMMARY
MARCH 31, 2010
The fundamental guideline followed by Knightsbridge in voting proxies is to make every effort to ensure that the manner in which shares are voted is in the best interest of clients/beneficiaries and the value of the investment. Absent special circumstances, it is the policy of Knightsbridge to exercise its proxy voting discretion in accordance with written pre-determined proxy voting guidelines (“Proxy Voting Guidelines”). The Proxy Voting Guidelines are applicable to the voting of domestic and global proxies. Knightsbridge may subscribe to the services of unaffiliated third party proxy vendors that provide written vote recommendations/ guidelines, proxy voting, and administrative and record-keeping assistance.
In cases where sole proxy voting authority rests with Knightsbridge for plans governed by ERISA, Knightsbridge will vote proxies in accordance with the Proxy Voting Guidelines unless outlined otherwise in the plan’s governing documents and subject to the fiduciary responsibility standards of ERISA.
If Knightsbridge becomes aware of any type of potential or actual conflict of interest relating to a proxy proposal, Knightsbridge will promptly document the conflict and may handle such conflict in a number of ways depending on the type and materiality. The method selected by Knightsbridge will depend upon the facts and circumstances of each situation and the requirements of applicable laws and will always be handled in the client(s)’ best interest.
Knightsbridge may also choose not to vote proxies in certain situations or for certain accounts; for example, (1) where a client has retained the right to vote the proxies; (2) where Knightsbridge deems that the cost of voting the proxy would exceed any anticipated benefit to the client, or (3) where a proxy is received for a client account that has been terminated.
A complete copy of the Knightsbridge’s current Proxy Voting Policies & Procedures is attached. Clients may obtain information on how their proxies were voted by contacting Knightsbridge at the principal office and place of business indicated on page 1 of this form. Clients should include in their request, their name, and the account and security for which they are making the request.
D-88
LORD, ABBETT & CO. LLC
Proxy Voting Policies and Procedures
INTRODUCTION
Under the Investment Advisers Act of 1940, as amended, Lord, Abbett & Co. LLC (“Lord Abbett” or “we”) acts as a fiduciary that owes each of its clients duties of care and loyalty with respect to all services undertaken on the client’s behalf, including proxy voting. This means that Lord Abbett is required to vote proxies in the manner we believe is in the best interests of each client, including the Lord Abbett Funds (the “Funds”) and their shareholders. We take a long-term perspective in investing our clients’ assets and employ the same perspective in voting proxies on their behalf. Accordingly, we tend to support proxy proposals that we believe are likely to maximize shareholder value over time, whether such proposals were initiated by a company or its shareholders.
PROXY VOTING PROCESS OVERVIEW
Lord Abbett has a Proxy Group within its Operations Department (the “Proxy Group”) that oversees proxy voting mechanics on a day-to-day basis and provides Lord Abbett’s Proxy Policy Committee (the “Proxy Policy Committee”) and Investment Department personnel with information regarding proxy voting. The Proxy Policy Committee consists of Lord Abbett’s Chief Investment Officer, Director of Domestic Equity Portfolio Management, Director of International Equity, Director of Domestic Equity Research, Chief Administrative Officer for the Investment Department, and General Counsel. Voting decisions are made by the Investment Department in accordance with these policies and procedures and are carried out by the Proxy Group.
Lord Abbett has retained an independent third party service provider (the “Proxy Advisor”) to analyze proxy issues and recommend how to vote on those issues, and to provide assistance in the administration of the proxy process, including maintaining complete proxy voting records.1 While Lord Abbett takes into consideration the information and recommendations of the Proxy Advisor, Lord Abbett votes all proxies based on its own proxy voting policies, including Lord Abbett’s conclusions regarding the best interests of the Funds, their shareholders, and other advisory clients, rather than basing decisions solely on the Proxy Advisor’s recommendations.
Lord Abbett has implemented the following three-pronged approach to the proxy voting process:
| • | In cases where we deem any client’s position in a company to be material,2 the relevant investment team is responsible for determining how to vote the security. Once a voting decision has been made, the investment team provides instructions to the Proxy Group, which is responsible for submitting Lord Abbett’s vote. |
| • | In cases where we deem all clients’ positions in a company to be non-material, the Chief Administrative Officer for the Investment Department is responsible for determining how to vote the security. The Chief Administrative Officer may seek guidance from the relevant investment team, the Proxy Policy Committee or any of its members, the Proxy Advisor, or other sources to determine how to vote. Once a voting decision has been made, the Chief Administrative Officer provides instructions to the Proxy Group, which is responsible for submitting Lord Abbett’s vote. |
| 1 | Lord Abbett currently retains Institutional Shareholder Services Inc. as the Proxy Advisor. |
| 2 | We presently consider a position in a particular company to be material if: (1) it represents more than 1% of any client’s portfolio holdings and all clients’ positions in the company together represent more than 1% of the company’s outstanding shares; or (2) all clients’ (continued from page 1) positions in the company together represent more than 5% of the company’s outstanding shares. For purposes of determining materiality, we exclude shares held by clients with respect to which Lord Abbett does not have authority to vote proxies. We also exclude shares with respect to which Lord Abbett’s vote is restricted or limited due to super-voting share structures (where one class of shares has super-voting rights that effectively disenfranchise other classes of shares), vote limitation policies, and other similar measures. This definition of materiality is subject to change at our discretion. |
D-89
| • | Lord Abbett has identified certain types of proxy proposals that it considers purely administrative in nature and as to which it always will vote in the same manner. The Proxy Group is authorized to vote on such proposals without receiving instructions from the Investment Department, regardless of the materiality of any client’s position. Lord Abbett presently considers the following specific types of proposals to fall within this category: (1) proposals to change a company’s name, as to which Lord Abbett always votes in favor; (2) proposals regarding formalities of shareholder meetings (namely, changes to a meeting’s date, time, or location), as to which Lord Abbett always votes in favor; and (3) proposals to allow shareholders to transact other business at a meeting, as to which Lord Abbett always votes against. |
When multiple investment teams manage one or more portfolios that hold the same voting security, the investment team that manages the largest number of shares of the security will be considered to have the dominant position and Lord Abbett will vote all shares on behalf of all clients that hold the security in accordance with the vote determined by the investment team with the dominant position.
CONFLICTS OF INTEREST
Lord Abbett is an independent, privately held firm with a singular focus on the management of money. Although Lord Abbett does not face the conflicts of interest inherent in being part of a larger financial institution, conflicts of interest nevertheless may arise in the proxy voting process. Such a conflict may exist, for example, when a client’s account holds shares of a company that also is a client of Lord Abbett. We have adopted safeguards designed to ensure that conflicts of interests are identified and resolved in our clients’ best interests rather than our own. These safeguards include, but are not limited to, the following:
| • | Lord Abbett has implemented special voting measures with respect to companies for which one of the Funds’ independent directors/trustees also serves on the board of directors or is a nominee for election to the board of directors. If a Fund owns stock in such a company, Lord Abbett will notify the Funds’ Proxy Committees3 and seek voting instructions from the Committees only in those situations where Lord Abbett proposes not to follow the Proxy Advisor’s recommendations. In these instances, if applicable, the independent director/trustee will abstain from any discussions by the Funds’ Proxy Committees regarding the company. |
| • | Lord Abbett also has implemented special voting measures with respect to companies that have a significant business relationship with Lord Abbett (including any subsidiaries of such companies). For this purpose, a “significant business relationship” means: (1) a broker dealer firm that is responsible for one percent or more of the Funds’ total dollar amount of shares sold for the last 12 months; (2) a firm that is a sponsor firm with respect to Lord Abbett’s separately managed account business; (3) an institutional account client that has an investment management agreement with Lord Abbett; (4) an institutional investor that, to Lord Abbett’s knowledge, holds at least $5 million in shares of the Funds; and (5) a retirement plan client that, to Lord Abbett’s knowledge, has at least $5 million invested in the Funds. If a Fund owns stock in such a company, Lord Abbett will notify the Funds’ Proxy Committees and seek voting instructions from the Committees only in those situations where Lord Abbett proposes not to follow the Proxy Advisor’s recommendations. |
| 3 | The Boards of Directors and Trustees of the Funds have delegated oversight of proxy voting to separate Proxy Committees comprised solely of independent directors and/or trustees, as the case may be. Each Proxy Committee is responsible for, among other things: (1) monitoring Lord Abbett’s actions in voting securities owned by the related Fund; (2) evaluating Lord Abbett’s policies in voting securities; and (3) meeting with Lord Abbett to review the policies in voting securities, the sources of information used in determining how to vote on particular matters, and the procedures used to determine the votes in any situation where there may be a conflict of interest. |
D-90
PROXY VOTING GUIDELINES
A general summary of the guidelines that we normally follow in voting proxies appears below. These voting guidelines reflect our general views. We reserve the flexibility to vote in a manner contrary to our general views on particular issues if we believe doing so is in the best interests of our clients, including the Funds and their shareholders. Many different specific types of proposals may arise under the broad categories discussed below, and it is not possible to contemplate every issue on which we may be asked to vote. Accordingly, we will vote on proposals concerning issues not expressly covered by these guidelines based on the specific factors that we believe are relevant.
| A. | Auditors — Auditors are responsible for examining, correcting, and verifying the accuracy of a company’s financial statements. Lord Abbett believes that companies normally are in the best position to select their auditors and, therefore, we generally support management’s recommendations concerning the ratification of the selection of auditors. However, we may evaluate such proposals on a case-by-case basis due to concerns about impaired independence, accounting irregularities, or failure of the auditors to act in shareholders’ best economic interests, among other factors we may deem relevant. |
| 1. | Election of directors — The board of directors of a company oversees all aspects of the company’s business. Companies and, under certain circumstances, their shareholders, may nominate directors for election by shareholders. Lord Abbett believes that the independent directors currently serving on a company’s board of directors (or a nominating committee comprised of such independent directors) generally are in the best position to identify qualified director nominees. Accordingly, we normally vote in accordance with management’s recommendations on the election of directors. In evaluating a director nominee’s candidacy, however, Lord Abbett may consider the following factors, among others: (1) the nominee’s experience, qualifications, attributes, and skills, as disclosed in the company’s proxy statement; (2) the composition of the board and its committees; (3) whether the nominee is independent of company management; (4) the nominee’s board meeting attendance; (5) the nominee’s history of representing shareholder interests on the company’s board or other boards; (6) the nominee’s investment in the company; (7) the company’s long-term performance relative to a market index; and (8) takeover activity. In evaluating a compensation committee nominee’s candidacy, Lord Abbett may consider additional factors including the nominee’s record on various compensation issues such as tax gross-ups, severance payments, options repricing, and pay for performance, although the nominee’s record as to any single compensation issue alone will not necessarily be determinative. Lord Abbett may withhold votes for some or all of a company’s director nominees on a case-by-case basis. |
| 2. | Majority voting — Under a majority voting standard, director nominees must be elected by an affirmative majority of the votes cast at a meeting. Majority voting establishes a higher threshold for director election than plurality voting, in which nominees who receive the most votes are elected, regardless of how small the number of votes received is relative to the total number of shares voted. Lord Abbett generally supports proposals that seek to adopt a majority voting standard. |
| 3. | Board classification — A “classified” or “staggered” board is a structure in which only a portion of a company’s board of directors (typically one-third) is elected each year. A company may employ such a structure to promote continuity of leadership and thwart takeover attempts. Lord Abbett generally votes against proposals to classify a board, absent special circumstances indicating that shareholder interests would be better served by such a structure. In evaluating a classified board proposal, Lord Abbett may consider the following factors, among others: (1) the company’s long-term strategic plan; (2) the extent to which continuity of leadership is necessary to advance that plan; and (3) the need to guard against takeover attempts. |
D-91
| 4. | Independent board and committee members — An independent director is one who serves on a company’s board but is not employed by the company or affiliated with it in any other capacity. While company boards may apply different standards in assessing director independence, including any applicable standards prescribed by stock exchanges and the federal securities laws, a director generally is determined to qualify as independent if the director does not have any material relationship with the company (either directly or indirectly) based on all relevant facts and circumstances. Material relationships can include employment, business, and familial relationships, among others. Lord Abbett believes that independent board and committee membership often helps to mitigate the inherent conflicts of interest that arise when a company’s executive officers also serve on its board and committees. Therefore, we generally support the election of board or committee nominees if such election would cause a majority of a company’s board or committee members to be independent. However, a nominee’s effect on the independent composition of the board or any committee is one of many factors Lord Abbett considers in voting on the nominee and will not necessarily be dispositive. |
| 5. | Independent board chairman — Proponents of proposals to require independent board chairmen (formerly often referred to as “separation of chairman and chief executive officer” proposals) seek to enhance board accountability and mitigate a company’s risk-taking behavior by requiring that the role of the chairman of the company’s board of directors be filled by an independent director. We generally vote with management on proposals that call for independent board chairmen. We may vote in favor of such proposals on a case-by-case basis, despite management opposition, if we believe that a company’s governance structure does not promote independent oversight through other means, such as a lead director, a board composed of a majority of independent directors, and/or independent board committees. In evaluating independent chairman proposals, we will focus in particular on the presence of a lead director, which is an independent director designated by a board with a non-independent chairman to serve as the primary liaison between company management and the independent directors and act as the independent directors’ spokesperson. |
| C. | Compensation and Benefits |
| 1. | General — In the wake of recent corporate scandals and market volatility, shareholders increasingly have scrutinized the nature and amount of compensation paid by a company to its executive officers and other employees. Lord Abbett believes that because a company has exclusive knowledge of material information not available to shareholders regarding its business, financial condition, and prospects, the company itself usually is in the best position to make decisions about compensation and benefits. Accordingly, we generally vote with management on such matters. However, we may oppose management on a case-by-case basis if we deem a company’s compensation to be excessive or inconsistent with its peer companies’ compensation, we believe a company’s compensation measures do not foster a long-term focus among its executive officers and other employees, or we believe a company has not met performance expectations, among other reasons. Discussed below are some specific types of compensation-related proposals that we may encounter. |
| 2. | Incentive compensation plans — An incentive compensation plan rewards an executive’s performance through a combination of cash compensation and stock awards. Incentive compensation plans are designed to align an executive’s compensation with a company’s long-term performance. As noted above, Lord Abbett believes that management generally is in the best position to assess executive compensation levels and, therefore, generally votes with management on proposals relating to incentive compensation plans. In evaluating such a proposal, however, Lord Abbett may consider the following factors, among others: (1) the executive’s expertise and the value he or she brings to the company; (2) the company’s performance, particularly during the executive’s tenure; (3) the percentage of overall |
D-92
| compensation that consists of stock; (4) whether and/or to what extent the incentive compensation plan has any potential to dilute the voting power or economic interests of other shareholders; (5) the features of the plan and costs associated with it; (6) whether the plan provides for repricing or replacement of underwater stock options; and (7) quantitative data from the Proxy Advisor regarding compensation ranges by industry and company size. We also scrutinize very closely the proposed repricing or replacement of underwater stock options, taking into consideration the stock’s volatility, management’s rationale for the repricing or replacement, the new exercise price, and any other factors we deem relevant. |
| 3. | Say on pay — “Say on pay” proposals give shareholders a nonbinding vote on executive compensation. These proposals are designed to serve as a means of conveying to company management shareholder concerns, if any, about executive compensation. Lord Abbett believes that management generally is in the best position to assess executive compensation. Thus, we generally vote with management on say on pay proposals unless we believe that compensation has been excessive or direct feedback to management about compensation has not resulted in any changes. We also generally vote with management on proposals regarding the frequency of say on pay votes. However, any particular vote will be based on the specific facts and circumstances we deem relevant. |
| 4. | Pay for performance — “Pay for performance” proposals are shareholder proposals that seek to achieve greater alignment between executive compensation and company performance. Shareholders initiating these proposals tend to focus on board compensation committees’ accountability, the use of independent compensation consultants, enhanced disclosure of compensation packages, and perquisites given to executives. Because Lord Abbett believes that management generally is in the best position to assess executive compensation, we generally follow management’s voting recommendations regarding pay for performance proposals. However, we may evaluate such proposals on a case-by-case basis if we believe a company’s long-term interests and its executives’ financial incentives are not properly aligned or if we question the methodology a company followed in setting executive compensation, among other reasons. |
| 5. | Clawback provisions — A clawback provision allows a company to recoup or “claw back” incentive compensation paid to an executive if the company later determines that the executive did not actually meet applicable performance goals. For example, such provisions might be used when a company calculated an executive’s compensation based on materially inaccurate or fraudulent financial statements. Some clawback provisions are triggered only if the misalignment between compensation and performance is attributable to improper conduct on the part of the executive. Shareholder proponents of clawback proposals believe that they encourage executive accountability and mitigate a company’s risk-taking behavior. Because Lord Abbett believes that management generally is in the best position to assess executive compensation, we generally vote with management on clawback proposals. We may, however, evaluate such a proposal on a case-by-case basis due to concerns about the amount of compensation paid to the executive, the executive’s or the company’s performance, or accounting irregularities, among other factors we may deem relevant. |
| 6. | Anti-gross-up policies — Tax “gross-ups” are payments by a company to an executive intended to reimburse some or all of the executive’s tax liability with respect to compensation, perquisites, and other benefits. Because the gross-up payment also is taxable, it typically is inflated to cover the amount of the tax liability and the gross-up payment itself. Critics of such payments argue that they often are not transparent to shareholders and can substantially enhance an executive’s overall compensation. Thus, shareholders increasingly are urging companies to establish policies prohibiting tax gross-ups. Lord Abbett generally favors adoption of anti-tax gross-up policies themselves, but will not automatically vote against a compensation committee nominee solely because the nominee approved a gross-up. |
D-93
| 7. | Severance agreements and executive death benefits — Severance or so-called “golden parachute” payments sometimes are made to departing executives after termination or upon a company’s change in control. Similarly, companies sometimes make executive death benefit or so-called “golden coffin” payments to an executive’s estate. Both practices increasingly are coming under shareholder scrutiny. While we generally vote with management on compensation matters and acknowledge that companies may have contractual obligations to pay severance or executive death benefits, we scrutinize cases in which such benefits are especially lucrative or are granted despite the executive’s or the company’s poor performance, and may vote against management on a case-by-case basis as we deem appropriate. We also generally support proposals to require that companies submit severance agreements and executive death benefits for shareholder ratification. |
| 8. | Executive pay limits — Lord Abbett believes that a company’s flexibility with regard to its compensation practices is critical to its ability to recruit, retain, and motivate key talent. Accordingly, we generally vote with management on shareholder proposals that seek to impose limits on executive compensation. |
| 9. | Employee stock purchase plans — Employee stock purchase plans permit employees to purchase company stock at discounted prices and, under certain circumstances, receive favorable tax treatment when they sell the stock. Lord Abbett generally follows management’s voting recommendation concerning employee stock purchase plans, although we generally do not support plans that are dilutive. |
| D. | Corporate Matters |
| 1. | Charter amendments — A company’s charter documents, which may consist of articles of incorporation or a declaration of trust and bylaws, govern the company’s organizational matters and affairs. Lord Abbett believes that management normally is in the best position to determine appropriate amendments to a company’s governing documents. Some charter amendment proposals involve routine matters, such as changing a company’s name or procedures relating to the conduct of shareholder meetings. Lord Abbett believes that such routine matters do not materially affect shareholder interests and, therefore, we vote with management with respect to them in all cases. Other types of charter amendments, however, are more substantive in nature and may impact shareholder interests. We consider such proposals on a case-by-case basis to the extent they are not explicitly covered by these guidelines. |
| 2. | Changes to capital structure — A company may propose amendments to its charter documents to change the number of authorized shares or create new classes of stock. We generally support proposals to increase a company’s number of authorized shares when the company has articulated a clear and reasonable purpose for the increase (for example, to facilitate a stock split, merger, acquisition, or restructuring). However, we generally oppose share capital increases that would have a dilutive effect. We also generally oppose proposals to create a new class of stock with superior voting rights. |
| 3. | Reincorporation — We generally follow management’s recommendation regarding proposals to change a company’s state of incorporation, although we consider the rationale for the reincorporation and the financial, legal, and corporate governance implications of the reincorporation. We will vote against reincorporation proposals that we believe contravene shareholders’ interests. |
| 4. | Mergers, acquisitions, and restructurings — A merger or acquisition involves combining two distinct companies into a single corporate entity. A restructuring involves a significant change in a company’s legal, operational, or structural features. After these kinds of transactions are completed, shareholders typically will own stock in a company that differs from the company |
D-94
| whose shares they initially purchased. Thus, Lord Abbett views the decision to approve or reject a potential merger, acquisition, or restructuring as being equivalent to an investment decision. In evaluating such a proposal, Lord Abbett may consider the following factors, among others: (1) the anticipated financial and operating benefits; (2) the offer price; (3) the prospects of the resulting company; and (4) any expected changes in corporate governance and their impact on shareholder rights. We generally vote against management proposals to require a supermajority shareholder vote to approve mergers or other significant business combinations. We generally vote for shareholder proposals to lower supermajority vote requirements for mergers and acquisitions. We also generally vote against charter amendments that attempt to eliminate shareholder approval for acquisitions involving the issuance of more than 10% of a company’s voting stock. |
| E. | Anti-Takeover Issues and Shareholder Rights |
| 1. | Proxy access — Proxy access proposals advocate permitting shareholders to have their nominees for election to a company’s board of directors included in the company’s proxy statement in opposition to the company’s own nominees. Proxy access initiatives enable shareholders to nominate their own directors without incurring the often substantial cost of preparing and mailing a proxy statement, making it less expensive and easier for shareholders to challenge incumbent directors. Lord Abbett generally votes with management on proposals that seek to allow proxy access. |
| 2. | Shareholder rights plans — Shareholder rights plans or “poison pills” are a mechanism of defending a company against takeover efforts. Poison pills allow current shareholders to purchase stock at discounted prices or redeem shares at a premium after a takeover, effectively making the company more expensive and less attractive to potential acquirers. Companies may employ other defensive tactics in combination with poison pills, such as golden parachutes that take effect upon a company’s change in control and therefore increase the cost of a takeover. Because poison pills can serve to entrench management and discourage takeover offers that may be attractive to shareholders, we generally vote in favor of proposals to eliminate poison pills and proposals to require that companies submit poison pills for shareholder ratification. In evaluating a poison pill proposal, however, Lord Abbett may consider the following factors, among others: (1) the duration of the poison pill; (2) whether we believe the poison pill facilitates a legitimate business strategy that is likely to enhance shareholder value; (3) our level of confidence in management; (4) whether we believe the poison pill will be used to force potential acquirers to negotiate with management and assure a degree of stability that will support good long-range corporate goals; and (5) the need to guard against takeover attempts. |
| 3. | Chewable pill provisions — A “chewable pill” is a variant of the poison pill that mandates a shareholder vote in certain situations, preventing management from automatically discouraging takeover offers that may be attractive to shareholders. We generally support chewable pill provisions that balance management’s and shareholders’ interests by including: (1) a redemption clause allowing the board to rescind a pill after a potential acquirer’s holdings exceed the applicable ownership threshold; (2) no dead-hand or no-hand pills, which would allow the incumbent board and their approved successors to control the pill even after they have been voted out of office; (3) sunset provisions that allow shareholders to review and reaffirm or redeem a pill after a predetermined time frame; and (4) a qualifying offer clause, which gives shareholders the ability to redeem a poison pill when faced with a bona fide takeover offer. |
| 4. | Anti-greenmail provisions — An anti-greenmail provision is a special charter provision that prohibits a company’s management from buying back shares at above market prices from potential acquirers without shareholder approval. We generally support such provisions, provided that they are not bundled with other measures that serve to entrench management or discourage attractive takeover offers. |
D-95
| 5. | Fair price provisions — A fair price provision is a special charter provision that requires that all selling shareholders receive the same price from a buyer. Fair price provisions are designed to protect shareholders from inequitable two-tier stock acquisition offers in which some shareholders may be bought out on disadvantageous terms. We generally support such provisions, provided that they are not bundled with other measures that serve to entrench management or discourage attractive takeover offers. |
| 6. | Rights to call special shareholder meetings — Proposals regarding rights to call special shareholder meetings normally seek approval of amendments to a company’s charter documents. Lord Abbett generally votes with management on proposals concerning rights to call special shareholder meetings. In evaluating such a proposal, Lord Abbett may consider the following factors, among others: (1) the stock ownership threshold required to call a special meeting; (2) the purposes for which shareholders may call a special meeting; (3) whether the company’s annual meetings offer an adequate forum in which shareholders may raise their concerns; and (4) the anticipated economic impact on the company of having to hold additional shareholder meetings. |
| 7. | Supermajority vote requirements — A proposal that is subject to a supermajority vote must receive the support of more than a simple majority in order to pass. Supermajority vote requirements can have the effect of entrenching management by making it more difficult to effect change regarding a company and its corporate governance practices. Lord Abbett normally supports shareholders’ ability to approve or reject proposals based on a simple majority vote. Thus, we generally vote for proposals to remove supermajority vote requirements and against proposals to add them. |
| 8. | Cumulative voting — Under cumulative or proportional voting, each shareholder is allotted a number of votes equal to the number of shares owned multiplied by the number of directors to be elected. This voting regime strengthens the voting power of minority shareholders because it enables shareholders to cast multiple votes for a single nominee. Lord Abbett believes that a shareholder or group of shareholders using this technique to elect a director may seek to have the director represent a narrow special interest rather than the interests of the broader shareholder population. Accordingly, we generally vote against cumulative voting proposals. |
| 9. | Confidential voting — In a confidential voting system, all proxies, ballots, and voting tabulations that identify individual shareholders are kept confidential. An open voting system, by contrast, gives management the ability to identify shareholders who oppose its proposals. Lord Abbett believes that confidential voting allows shareholders to vote without fear of retribution or coercion based on their views. Thus, we generally support proposals that seek to preserve shareholders’ anonymity. |
| 10. | Reimbursing proxy solicitation expenses — Lord Abbett generally votes with management on shareholder proposals to require a company to reimburse reasonable expenses incurred by one or more shareholders in a successful proxy contest, and may consider factors including whether the board has a plurality or majority vote standard for the election of directors, the percentage of directors to be elected in the contest, and shareholders’ ability to cumulate their votes for the directors. |
| 11. | Transacting other business — Lord Abbett believes that proposals to allow shareholders to transact other business at a meeting deprive other shareholders of sufficient time and information to carefully evaluate the relevant business issues and determine how to vote with respect to them. Therefore, Lord Abbett always votes against such proposals. |
D-96
| F. | Social, Political, and Environmental Issues — Proposals relating to social, political, or environmental issues typically are initiated by shareholders and urge a company to disclose certain information or change certain business practices. Lord Abbett evaluates such proposals based on their effect on shareholder value rather than on their ideological merits. We generally follow management’s recommendation on social, political, and environmental proposals and tend to vote against proposals that are unduly burdensome or impose substantial costs on a company with no countervailing economic benefits to the company’s shareholders. Nonetheless, we pay particular attention to highly controversial issues, as well as instances where management has failed repeatedly to take corrective actions with respect to an issue. |
| G. | Share Blocking — Certain foreign countries impose share blocking restrictions that would prohibit Lord Abbett from trading a company’s stock during a specified period before the company’s shareholder meeting. Lord Abbett believes that in these situations, the benefit of maintaining liquidity during the share blocking period outweighs the benefit of exercising our right to vote. Therefore, it is Lord Abbett’s general policy to not vote securities in cases where share blocking restrictions apply. |
Amended: September 13, 2012
D-97
MARSICO CAPITAL MANAGEMENT, LLC
PROXY VOTING POLICY AND PROCEDURES
It is the policy of Marsico Capital Management, LLC (“MCM”) to seek to vote or otherwise process, such as by a decision to abstain from voting or to take no action on, proxies over which it has voting authority in the best interests of MCM’s clients, as summarized here.
| • | MCM’s security analysts generally review proxy proposals as part of their monitoring of portfolio companies. Under MCM’s investment discipline, one of the qualities that MCM generally seeks in companies selected for client portfolios is good management teams that generally seek to serve shareholder interests. Because MCM believes that the management teams of most companies it invests in generally seek to serve shareholder interests, MCM believes that voting proxy proposals in clients’ best economic interests usually means voting with the recommendations of these management teams (including their boards of directors). |
| • | In certain circumstances, MCM’s vote-by-vote analysis of proxy proposals could lead it to conclude that particular management or board recommendations may not appear as closely aligned with shareholder interests as MCM may deem desirable, or could be disregarded in the best interests of shareholders. In those and other circumstances, MCM may, in its sole discretion, vote against a management recommendation (or abstain or take no action) based on its analysis if such a vote appears consistent with the best interests of clients. |
| • | MCM may process certain proxies without voting them, such as by making a decision to abstain from voting or take no action on such proxies (or on certain proposals within such proxies). Examples include, without limitation, proxies issued by companies that MCM has decided to sell, proxies issued for securities that MCM did not select for a client portfolio (such as, without limitation, securities that were selected by a previous adviser, unsupervised securities held in a client’s account, money market securities, or other securities selected by clients or their representatives other than MCM), or proxies issued by foreign companies that impose burdensome or unreasonable voting, power of attorney, or holding requirements. MCM also may abstain from voting, or take no action on, proxies in other circumstances, such as when voting may not be in the best interests of clients, as an alternative to voting with (or against) management, or when voting may be unduly burdensome or expensive or if MCM may have a material conflict of interest in voting certain proxies and alternative voting procedures are not desirable. |
| • | In circumstances when there may be an apparent material conflict of interest between MCM’s interests and clients’ interests in how proxies are voted (such as when MCM knows that a proxy issuer is also an MCM client), MCM generally will resolve any appearance concerns by causing those proxies to be “echo voted” or “mirror voted” in the same proportion as other votes, or by voting the proxies as recommended by an independent service provider or by abstaining or taking no action. In other cases, MCM might use other procedures to resolve an apparent conflict. |
| • | MCM may use an independent service provider to assist in voting proxies, keep voting records, and disclose voting information to clients. MCM’s Proxy Voting policy and reports describing the voting of a client’s proxies are available to the client on request. |
| • | MCM seeks to ensure that, to the extent reasonably feasible, proxies for which MCM receives ballots in good order and receives timely notice will be voted or otherwise processed (such as through a decision to abstain or take no action) as intended under MCM’s Proxy Voting policy and procedures. MCM may be unable to vote or otherwise process proxy ballots that are not received or processed in a timely manner due to functional limitations of the proxy voting system, custodial limitations or other factors beyond MCM’s control. Such ballots may include, without limitation, ballots for securities out on loan under securities lending programs initiated by the client or its custodian, ballots not timely forwarded by a custodian, or ballots for which MCM does not timely receive essential information such as the proxy proposal itself or modifications to the required voting date. Other ballots may be voted but not counted, or may be counted in an unexpected way, because of factors such as foreign voting requirements or other limitations. |
D-98
PIMCO
PROXY VOTING POLICY & PROCEDURES SUMMARY
October 2012
PIMCO has adopted written proxy voting policies and procedures (“Proxy Policy”) as required by Rule 206(4)-6 under the Advisers Act. In addition to covering the voting of equity securities, the Proxy Policy also applies generally to voting and/or consent rights of fixed income securities, including but not limited to, plans of reorganization, and waivers and consents under applicable indentures. The Proxy Policy does not apply, however, to consent rights that primarily entail decisions to buy or sell investments, such as tender or exchange offers, conversions, put options, redemption and Dutch auctions. The Proxy Policy is designed and implemented in a manner reasonably expected to ensure that voting and consent rights (collectively, “proxies”) are exercised in the best interests of accounts.
With respect to the voting of proxies relating to equity securities, PIMCO has selected an unaffiliated third party proxy research and voting service (“Proxy Voting Service”), to assist it in researching and voting proxies. With respect to each proxy received, the Proxy Voting Service researches the financial implications of the proposals and provides a recommendation to PIMCO as to how to vote on each proposal based on the Proxy Voting Service’s research of the individual facts and circumstances and the Proxy Voting Service’s application of its research findings to a set of guidelines that have been approved by PIMCO. Upon the recommendation of the applicable portfolio managers, PIMCO may determine to override any recommendation made by the Proxy Voting Service. In the event that the Proxy Voting Service does not provide a recommendation with respect to a proposal, PIMCO may determine to vote on the proposals directly.
With respect to the voting of proxies relating to fixed income securities, PIMCO’s fixed income credit research group (the “Credit Research Group”) is responsible for researching and issuing recommendations for voting proxies. With respect to each proxy received, the Credit Research Group researches the financial implications of the proxy proposal and makes voting recommendations specific for each account that holds the related fixed income security. PIMCO considers each proposal regarding a fixed income security on a case-by-case basis taking into consideration any relevant contractual obligations as well as other relevant facts and circumstances at the time of the vote. Upon the recommendation of the applicable portfolio managers, PIMCO may determine to override any recommendation made by the Credit Research Group. In the event that the Credit Research Group does not provide a recommendation with respect to a proposal, PIMCO may determine to vote the proposal directly.
PIMCO may determine not to vote a proxy for an equity or fixed income security if: (1) the effect on the applicable account’s economic interests or the value of the portfolio holding is insignificant in relation to the account’s portfolio; (2) the cost of voting the proxy outweighs the possible benefit to the applicable account, including, without limitation, situations where a jurisdiction imposes share blocking restrictions which may affect the ability of the portfolio managers to effect trades in the related security; or (3) PIMCO otherwise has determined that it is consistent with its fiduciary obligations not to vote the proxy.
In the event that the Proxy Voting Service or the Credit Research Group, as applicable, does not provide a recommendation or the portfolio managers of a client account propose to override a recommendation by the Proxy Voting Service, or the Credit Research Group, as applicable, PIMCO will review the proxy to determine whether there is a material conflict between PIMCO and the applicable account or among PIMCO-advised accounts. If no material conflict exists, the proxy will be voted according to the portfolio managers’ recommendation. If a material conflict does exist, PIMCO will seek to resolve the conflict in good faith and in the best interests of the applicable client account, as provided by the Proxy Policy. The Proxy Policy permits PIMCO to seek to resolve material conflicts of interest by pursuing any one of
D-99
several courses of action. With respect to material conflicts of interest between PIMCO and a client account, the Proxy Policy permits PIMCO to either: (i) convene a committee to assess and resolve the conflict (the “Proxy Conflicts Committee”); or (ii) vote in accordance with protocols previously established by the Proxy Policy, the Proxy Conflicts Committee and/or other relevant procedures approved by PIMCO’s Legal and Compliance department with respect to specific types of conflicts. With respect to material conflicts of interest between one or more PIMCO-advised accounts, the Proxy Policy permits PIMCO to: (i) designate a PIMCO portfolio manager who is not subject to the conflict to determine how to vote the proxy if the conflict exists between two accounts with at least one portfolio manager in common; or (ii) permit the respective portfolio managers to vote the proxies in accordance with each client account’s best interests if the conflict exists between client accounts managed by different portfolio managers.
PIMCO will supervise and periodically review its proxy voting activities and the implementation of the Proxy Policy. PIMCO’s Proxy Policy, and information about how PIMCO voted a client’s proxies, is available upon request.
D-100
RCM GLOBAL CORPORATE GOVERNANCE GUIDELINES AND PROXY VOTING POLICY
JULY 2011
Preamble
RCM is a global asset manager and a company of Allianz Global Investors (AllianzGI). RCM operates on four continents from six international offices – Frankfurt, Hong Kong, London, San Francisco, Sydney and Tokyo. We believe that by generating and exploiting information, we will be able to deliver superior and consistent investment results for the benefit of our clients – a philosophy we call “RCM informed”.
This document lays out the Global Corporate Governance Guidelines and Proxy Voting Policy for RCM. It is written in the “RCM informed” philosophy. An international standard is particularly difficult to formulate, as it has to deal with our fiduciary duty, as well as differences in local regulations and market practices.
The Global Corporate Governance Guidelines and Proxy Voting Policy are detailed as follows in the form of voting criteria, which provide a framework for analysis but are not necessarily applied systematically in the form of box-ticking. Their objective is to give a generally applicable answer for the all points, as well as indications to help each entity with regard to those voting criteria that need to be modified to reflect local corporate governance “Best Practice”. We will evaluate governance issues on a case-by-case basis, using the Global Corporate Governance Guidelines and Proxy Voting Policy but taking into account the variances across markets in regulatory and legal frameworks, best practices, actual market practices, and disclosure regimes (including, but not limited to, the UK Corporate Governance Code and the NAPF Corporate Governance Policy and Voting Guidelines, the ASX Corporate Governance Principles and Recommendations (Australia), the Dutch Corporate Governance Code, AFEP Corporate Governance Code of Listed Corporations (France), the German Corporate Governance Code, the Hong Kong Code on Corporate Governance, the Swedish Code of Corporate Governance, and the Swiss Code of Best Practice for Corporate Governance).
While the Global Corporate Governance Guidelines and Proxy Voting Policy often provide explicit guidance on how to vote proxies with regard to specific issues that appear on the ballot, they are not intended to be exhaustive. Rather, these guidelines are intended to address the most significant and frequent proxy issues that arise. Each proxy issue will be subject to rigorous analysis of the economic impact of that issue on the long-term share value. All votes shall be cast solely in the long-term interest of shareholders.
Disclaimer
The RCM Corporate Governance Guidelines and Proxy Voting Policy represent a set of recommendations that were agreed upon by RCM’s Global Executive Committee. These Guidelines and Policy were developed to provide RCM entities with a comprehensive list of recommendations that provide guidance to each RCM entity in determining how to vote proxies for its clients. These guidelines allow each RCM entity the discretion to vote proxies in accordance with local laws, standards and client requirements, as appropriate, independently of influence either directly or indirectly by parent or affiliated companies. The governance structures of each of the RCM legal entities allows that entity to execute proxy voting rights on behalf of clients independently of any Allianz Global Investors’ parent or affiliated company. The individuals that make proxy voting decisions are also free to act independently, subject to the normal and customary supervision by the management/boards of these legal entities and to our fiduciary duty to act in the best interests of our clients. These Guidelines and Policy represent the views and guidance of RCM as at the date of publication. They may be subject to change at any time. The Guidelines and Policy are for RCM internal guidance purposes only and are not intended to be relied upon by any third party.
D-101
Section 1: Board of Directors
| 1.1 | Composition and Structure of the Board |
| 1.1.1 | Chairman and CEO |
RCM believes that the roles of Chairman and Chief Executive Officer should be separate, as there should be a clearly accepted division of responsibility at the head of the company.
| 1.1.2 | Independence of the Board of Directors |
RCM believes that there should be a majority of independent directors on the board, as far as legal regulations do not impose constraints on the composition of the board by law. In markets where independence of directors is currently not standard market practice, RCM will encourage moves towards a more independent board.
RCM considers independence to be an important criterion when voting for board members but will take into account other factors as well, as described elsewhere in these guidelines.
RCM expects companies to appoint a senior independent director, who acts as a crucial conduit for shareholders to raise issues of particular concern.
While dealing with specific corporate structures, RCM also considers the following points:
| • | State-owned companies: there should be a sufficient number of directors independent from the company and the government. |
| • | Subsidiary of multinational organisations: there should be a sufficient number of directors independent from the group. |
| • | Family-controlled companies should provide sufficient information, which makes the relationship of non-dependent directors to the family more transparent. |
| 1.1.3 | Competence and Experience of the Board |
The board should have a requisite balance of special skills, competence, experience, and knowledge of the company and of the industry the company is active in. This should enable the directors to discharge their duties and responsibilities in an effective way.
| 1.1.4 | Diversity of the Board |
While the board members’ independence, competence, skills and experience are of high importance, the board of directors is also encouraged to have a diversified representation in terms of education, age, nationality, gender, etc.
In this respect RCM generally votes in favour of requests for reports on the company’s efforts to diversify the board, unless the board composition is reasonably diversified in relation to companies of similar size and industry as well as local laws and practices.
| 1.1.5 | Size of the Board |
RCM generally supports proposals requiring shareholder approval to fix or alter the size of the board.
RCM supports boards of between four and 18 directors.
| 1.1.6 | Classified Boards |
RCM votes against the introduction of classified/staggered boards and supports efforts to declassify boards.
D-102
| 1.1.7 | Age Limits and Tenure Limits |
RCM generally does not support minimum or maximum age or tenure limits.
| 1.1.8 | Board Committees |
RCM believes that there should be three key committees specialising in audit, director nomination and compensation issues. Such committees constitute a critical component of corporate governance and contribute to the proper functioning of the board of directors.
The remuneration committee should be responsible for setting remuneration for all executive directors and the chairman.
In addition RCM strongly supports the establishment of a separate and independent risk committee responsible for supervision of risks within the company.
The members of these committees should in general be independent non-executive directors.
Any committee should have the authority to engage independent advisers where appropriate at the company’s expense.
| 1.1.9 | Director Conflicts of Interest |
RCM expects companies to have a process for identifying and managing conflicts of interest directors may have. Individual directors should seek to avoid situations where there might be an appearance of a conflict of interest. If a director has an interest in a matter under consideration by the board, then the director should recuse himself from those discussions.
| 1.2 | Election of Board of Directors |
| 1.2.1 | Information on Directors |
RCM expects companies to provide comprehensive and timely information on their directors, in order to be enabled to assess the value they provide. The company should also disclose the positions and mandates of the directors in the annual report.
The disclosure should include but not limited to the biographical information, information on core competencies and qualifications, professional or other background, recent and current board and management mandates at other companies, factors affecting independence as well as board and committee meetings attendance.
The list of candidates should be available in a timely manner.
While RCM encourages the possibility to vote for each director individually, a bundled proposition on the election (or discharge) of the directors may be considered if RCM is satisfied with the performance of every director. Nevertheless, sufficient information should be provided, and all the directors should fulfil also other criteria, as mentioned in 1.2.4., in such a case.
| 1.2.2 | Term of Directors’ Contract |
For executive directors, long-term incentives are considered key. Overly short-term contracts may be counterproductive in this respect. RCM encourages instead that the contract terms state clear performance measurement criteria, while refraining from stipulating excessive severance packages.
For non-executive directors, RCM generally supports minimum contract terms of three years and maximum contract terms of five years with annual approval, except when local market practices differ. In markets where shorter or longer terms are industry standard, RCM will consider voting against directors with terms which substantially deviate from best practice in those markets.
D-103
| 1.2.3 | Attendance of Board and Committee Meetings |
RCM believes that all directors should be able to allocate sufficient time and effort to the company to discharge their responsibilities efficiently. Thus, the board members should attend at least 75% of board and — in cases where directors are board committee members — committee meetings.
RCM expects information about attendance of the board and committee meetings to be disclosed, and will support initiatives to in this sense in markets where it is not yet standard practice.
| 1.2.4 | Discharge of the Board |
RCM will consider the criteria on attendance, performance, competence etc. when voting on propositions to discharge the board.
RCM will vote against single directors or the whole board in cases of established fraud, misstatements of accounts and other illegal acts.
| 1.2.5 | Multiple Directorships |
RCM believes that directors should be able to allocate sufficient time to performing their duties as board members efficiently. Therefore, RCM will question whether directors are able to perform their duties whilst already being members of other boards, membership on more than 6 of which is viewed as excessive if the director is not a CEO, and more than 3 of which is viewed as excessive if the director is a CEO.
| 1.2.6 | Majority Voting for Directors |
RCM believes that one of the fundamental rights shareholders have is the power to elect or remove corporate directors. RCM generally believes that a majority voting standard is an appropriate mechanism to provide greater board accountability.
Based on our beliefs, RCM would in general vote in favour of proposals that would require the implementation of a majority voting standard for elections of directors in uncontested director elections.
There should be no provisions in place that hamper modifications to the composition of the board or impede the ability to adapt quickly to changing environments.
RCM would support cumulative voting in case it substantially enhances minority shareholders’ rights in a particular company and has the potential to add value.
| 1.2.7 | Shareholders Access to Board of Directors |
Shareholders should be able to nominate director candidates for the board.
| 1.2.8 | Legal Indemnification of Board Members |
RCM will consider voting against proposals that would limit or eliminate all liability for monetary damages, for directors and officers who violate the duty of care.
RCM would also consider voting against proposals that would expand indemnification to cover acts, such as negligence, that are more serious violations of fiduciary obligations than mere carelessness.
If, however, a director was found to have acted in good faith and in a manner that he reasonably believed was in the best interest of the company, and if only the director’s legal expenses would be covered, RCM may consider voting for expanded coverage.
D-104
| 1.2.9 | Proxy Contests |
Proxy contests are among the most difficult and most crucial corporate governance decisions because an investor must attempt to determine which group is best suited to manage the company. RCM will vote case-by-case on proxy contests, considering the following factors:
| • | Past performance relative to its peers; |
| • | Market in which fund invests; |
| • | Measures taken by the board to address the issues; |
| • | Past shareholder activism, board activity, and votes on related proposals; |
| • | Strategy of the incumbents versus the dissidents; |
| • | Independence of directors; |
| • | Experience and skills of director candidates; |
| • | Governance profile of the company; |
| • | Evidence of management entrenchment. |
| 1.2.10 | Reimburse Proxy Solicitation Expenses |
RCM will vote case-by-case on proposals to reimburse proxy solicitation expenses. When voting in conjunction with support of a dissident slate, RCM will support the reimbursement of all appropriate proxy solicitation expenses associated with the election.
RCM will generally support shareholder proposals calling for the reimbursement of reasonable costs incurred in connection with nominating one or more candidates in a contested election where the following apply:
| • | The election of fewer than 50% of the directors to be elected is contested in the election; |
| • | One or more of the dissident’s candidates is elected; |
| • | Shareholders are not permitted to cumulate their votes for directors; and |
| • | The election occurred, and the expenses were incurred, after the adoption of this bylaw. |
Section 2: Remuneration and Benefits
| 2.1 | Executive and Director Compensation |
| 2.1.1 | Compensation of Executive Directors and Senior Managers |
Compensation should contain both a short-term and long-term element, which fully aligns the executive with shareholders and where superior awards can only be achieved by attaining truly superior performance.
RCM believes that executive directors should be encouraged to receive a certain percentage of their salary in form of company stock. Therefore RCM would generally support the use of reasonably designed stock-related compensation plans, including appropriate deferrals.
Each director’s share option schemes should be clearly explained and fully disclosed (including exercise prices, expiry dates and the market price of the shares at the date of exercise) to both shareholders and participants, and should be subject to shareholder approval. They should also take into account appropriate levels of dilution. Overall, share options plans should be structured in a way to reward above-median performance.
D-105
RCM would generally vote against equity award plans or amendments that are too dilutive and expensive to existing shareholders, may be materially altered (cancellation and re-issue, re-testing and especially re-pricing of options, or the backdating of options) without shareholder approval, allow management significant discretion in granting certain awards, or are otherwise inconsistent with the interests of shareholders.
| 2.1.2 | Performance Measurement and Disclosure of Performance Criteria and Achievement |
RCM reserves the right to vote against boards or individual directors if performance has been significantly unsatisfactory for a prolonged time.
For performance measurement different criteria should be taken into consideration:
| • | The management goals should be linked to the mid- and long-term goals of the company. |
| • | It is not sensible to define companies’ performance by only one dimension or key indicator (such as EPS). Therefore, a healthy mixture of various indicators should be considered. |
| • | A very important criterion is the sustainability of companies’ performance. Social, environmental and governance issues should be integrated into the companies’ performance measurement to the degree possible. |
| • | Performance measurement should incorporate risk considerations so that there are no rewards for taking inappropriate risks at the expense of the company and its shareholders. |
| • | Performance should be measured over timescales which are sufficient to determine that value has in fact been added for the company and its shareholders. |
The performance criteria used by the companies as well as their achievement should be disclosed to the shareholders.
| 2.1.3 | Compensation of Non-Executive Directors |
RCM believes that compensation for non-executive directors should be structured in a way which aligns their interests with the long-term interests of the shareholders, does not compromise their independence from management or from controlling shareholders of the company and does not encourage excessive risk-taking behaviour.
In particular the following elements should be taken into account:
| • | Compensation should be in line with industry practice, with no performance link. |
| • | The amount of time and effort that the directors can invest in the company, given other directorships they may have. |
| 2.1.4 | Remuneration Committee and “Say on Pay” |
Any remuneration policy should be determined by independent remuneration committees, be transparent and fully disclosed (to shareholders for every executive and non-executive director) in a separate Remuneration Report within the Annual Report. In markets for which proposals to approve the company’s remuneration policy or the company’s Remuneration Report, RCM will evaluate such proposals on a case-by-case basis, taking into account RCM’s approach to executive and non-executive director compensation as described elsewhere in these guidelines.
In the US market, the Dodd-Frank Act requires advisory votes on pay (MSOP), and requires that the proxy for the first annual or other meeting of the shareholders occurring after the enactment includes vote item to determine going forward, the frequency of the say-on-pay vote by shareholders to approve compensation.
D-106
RCM will support annual advisory votes on compensation, which provide the most consistent and clear communication channel for shareholder concerns about companies’ executive pay programs.
RCM encourages companies to increase transparency in this respect, and furthermore in general supports moves to empower shareholders with regard to having a say on the remuneration policy.
RCM pays close attention to perquisites, including pension arrangements, and will vote against them if deemed excessive.
| 2.1.5 | Special Provisions |
Special provisions whereby additional payment becomes due in the event of a change of control are an inappropriate use of shareholder funds and should be discouraged.
Transaction bonuses, executive severance agreements, poison pills or other retrospective ex-gratia payments should be subject to shareholder approval and should not be excessive.
RCM believes that clawbacks should be used in order to better align long-term incentives of executive directors with the interests of the shareholders.
RCM also:
| • | Votes against retirement benefits for non-executive directors. |
| • | Believes that severance pay should not exceed one year’s fixed salary or two years if the executive is dismissed during his first term of office. |
| 2.2 | Employee Remuneration |
Remuneration structures and frameworks for the employees should reinforce the corporate culture and foster above-average performance.
Performance measurement for staff remuneration should incorporate risk considerations to ensure that there are no rewards for taking inappropriate risks at the expense of the company and its shareholders.
RCM will consider voting against stock purchase plans with discounts exceeding 15%. RCM will also vote against share issues to employees which appear to excessively dilute existing shareholder capital.
Section 3: Audit
| 3.1 | Role of Audit |
RCM recognizes the critical importance of financial statements which provide a complete and precise picture of a company’s financial status.
RCM would generally support the audit committee to scrutinize auditor fees and the independence of the audit function.
| 3.2 | Role of Audit Committee |
RCM believes that the most important responsibilities of the Audit Committee are:
| • | Assuring itself and shareholders of the quality of the audit carried out by the auditors as well as reviewing and monitoring their independence and objectivity. |
| • | Approval of the remuneration and terms of engagement of external auditors. |
| • | Reviewing and monitoring key auditing and accounting decisions. |
D-107
| • | Making recommendations to the board for consideration and acceptance by shareholders, in relation to the appointment, reappointment and, if necessary, the removal of the external auditors. |
The board should disclose and explain the main role and responsibilities of the audit committee and the process by which the audit committee reviews and monitors the independence of the external auditors.
| 3.3 | Independence of Auditors |
RCM believes that annual audits should be carried out by an independent, external audit firm. The audit committee should have ongoing dialogue with the external audit firm without presence of management. Any resignation of an auditor as well as the reasons for such resignation should be publicly disclosed.
Fees paid for consulting and other services should not exceed fees paid for auditing services.
| 3.4 | Remuneration of Auditors |
Companies should be encouraged to delineate clearly between audit and non-audit fees. The breakdown of the fees should be disclosed.
Audit committees should keep under review the non-audit fees paid to the auditor and in relation to the company’s total expenditure on consultancy. Audit fees should never be excessive.
Section 4: Risk Management and Internal Control
| 4.1 | Role of Risk Management |
RCM believes that boards with high standards of corporate governance will be better able to make sound strategic decisions and to oversee the approach to risk management. Boards need to understand and ensure that proper risk management is put in place for all material and relevant risks that the company faces.
| 4.2 | Risk Management Process |
The board has the responsibility to ensure that the company has implemented an effective and dynamic ongoing process to identify risks, measure their potential outcomes, and proactively manage those risks to the extent appropriate.
The Chief Risk Officer should be a member of the main Board.
| 4.3 | Risk Management Documentation |
Companies should maintain a documented risk management plan. The board should approve the risk management plan, which it is then the responsibility of management to implement. Risk identification should adopt a broad approach and not be limited to financial reporting; this will require consideration of relevant financial, operational and reputational risks.
RCM in general supports proposals which require the board to conduct a review of the effectiveness of the company’s risk management and internal control systems and the risk management plan at least annually.
| 4.4 | Risk Committee |
RCM strongly supports the establishment of a risk committee responsible for supervision of risks within the company. If necessary the board or the risk committee should seek independent external support to supplement internal resources.
D-108
Section 5: Sustainability Issues
RCM customarily reviews shareholder proposals concerning sustainability issues. Consideration should be given to the circumstances of a particular environment, social, governance or ethical issue and whether this may have financial consequences, either directly or indirectly for the company.
In these cases, RCM would consider:
| • | whether adoption of the proposal would have either a positive or negative impact on the company’s short-term or long-term share value; |
| • | whether the company has already responded in some appropriate manner to the request embodied in the proposal; |
| • | what other companies have done in response to the issue in question. |
RCM generally supports proposals that encourage increased transparency on forward-looking and strategy-related sustainability issues deemed material to the financial performance of the company.
RCM can leverage its dedicated Sustainability Research team to formulate coherent and insightful opinions reflecting best practice for all industries globally, guided by national and international law and voluntary codes of good practice developed by authoritative bodies.
As a signatory to the UN Principles for Responsible Investment (UN PRI), RCM is committed where appropriate, to actively implementing the principles into its voting activities.
Section 6: Capital Structure and Corporate Finance Issues
| 6.1 | Capital Increases |
| 6.1.1 | Increase in Authorised Common Stock |
RCM in general considers acceptable capital increases for purposes which aim to increase shareholder value in the long term. Any capital increase should take into consideration appropriate levels of dilution.
RCM regards the protection of minority and existing shareholders as a fundamental task for companies, and generally favours pre-emptive rights – i.e. for any new issue of shares to be first offered to existing shareholders. For companies in markets which have conditional capital systems (e.g. Germany, South Africa, etc.) RCM will in general support non-specific capital increases (i.e. not tied to any particular transaction) with pre-emptive rights to a maximum of 100% of the current authorised capital. Capital increases without pre-emptive rights will in general be accepted to a maximum of 20% of the current authorised capital. Only in exceptional circumstances will RCM consider voting for higher ceilings.
However, given wide variations of local market practices, RCM will support lower ceilings in markets where they are industry standard (e.g. in the UK, where NAPF guidelines stipulate an amount for share issuances with pre-emptive rights no more than 33% of the current issued share capital that could be used under the general issuance and no more than an additional 33% pursuant to a rights issue, and for share issuances without preemptive rights up to a maximum of 5% of the current issued share capital).
An issuance period for a capital increase is favoured to be limited to a reasonable amount of time in line with local market practice, but normally not longer than 18 months.
D-109
For companies in markets which have authorized capital systems (e.g. US, Brazil, etc.), RCM will in general support proposals to increase authorized capital up to 100% over the current authorization unless the increase would leave the company with less than 30% of its new authorization outstanding.
| 6.1.2 | Issuance or Increase of Preferred Stock |
RCM generally votes against issuance of securities conferring special rights conflicting with the principle of “one share, one vote” (e.g. preferred shares).
RCM will in general support the issuance or the increase of preferred stock if its conditions are clearly defined (in terms of voting, dividend and conversion possibility, as well as other rights and terms associated with the stock) and are considered reasonable with a view of the overall capital structure of the firm, as well as with previously issued preferred stock.
RCM will in this respect also consider the impact of issuance/increase of preferred stock on the current and future rights of common shareholders.
RCM will generally oppose “blank check” preferred stock where the conditions are left at the discretion of the board, in particular when no clear statement is provided by the board that the preferred stock will not be used to prevent a takeover. RCM will only approve preferred stock deemed reasonable in light of the overall capital structure of the company, as well as previously issued preferred stock.
| 6.2 | Issuance of Debt |
RCM is in favour of proposals that enhance a company’s long-term prospects and do not result in the company reaching unacceptable levels of financial leverage. RCM is in favour that shareholders should be consulted on the significant issuance of debt and the raising of borrowing limits.
When convertible debt is to be issued, RCM will analyse such a proposal also in light of its criteria to approve issuance of common shares.
| 6.3 | Issues Related to Mergers, Takeovers and Restructurings |
| 6.3.1 | General Criteria for Mergers and Restructurings |
A merger, restructuring, or spin-off in some way affects a change in control of the company’s assets. RCM expects companies to provide sufficient information to be able to evaluate the merits of such transactions considering various factors such as valuation, strategic rationale, conflicts of interest and corporate governance. RCM expects significant changes in the structure of a company to be approved by the shareholders
RCM may support a merger or restructuring where the transaction appears to offer fair value and the shareholders presumably cannot realise greater value through other means, where equal treatment of all shareholders is ensured and where the corporate governance profile is not significantly altered for the worse.
| 6.3.2 | Poison Pill Plans |
In general, RCM will not support Poison Pill plans and similar anti-takeover measures. RCM is clearly in favour of putting all poison pill plans to shareholder vote.
| 6.3.3 | Anti-Greenmail Provisions |
Greenmail is the practise of buying shares owned by a corporate raider back at a premium to the market price.
D-110
RCM will generally support anti-greenmail provisions that do not include other anti-takeover provisions. RCM believe that paying greenmail in favour of a corporate raider discriminates against other shareholders.
| 6.3.4 | Fair Price Provisions |
RCM will generally favour fair price provisions that protect minority shareholders and that are not merely designed for the purpose of imposing barriers to transactions.
RCM will vote against “standard fair price provisions” that are from RCM’s view marginally favourable to the remaining disinterested shareholders.
RCM will vote against fair price provisions if the shareholder vote requirement imbedded in the provision is greater than a majority of disinterested shares.
RCM will vote for shareholder proposals to lower the shareholder vote requirement embedded in existing fair price provisions.
| 6.3.5 | Control Share Acquisition and Cash-Out Provisions |
Control share acquisition statutes function by denying shares their voting rights when they contribute to ownership in excess of certain thresholds. Voting rights for those shares exceeding ownership limits may only be restored by approval of either a majority or supermajority of disinterested shares. Thus, control share acquisition statutes effectively require a hostile bidder to put its offer to a shareholder vote or risk voting disenfranchisement if the bidder continues buying up a large block of shares.
RCM will support proposals to opt out of control share acquisition statutes unless doing so would enable the completion of a takeover that would be detrimental to shareholders. RCM will oppose proposals to amend the charter to include control share acquisition provisions. RCM will support proposals to restore voting rights to the control shares.
Control share cash-out statutes give dissident shareholders the right to “cash-out” of their position in a company at the expense of the shareholder who has taken a control position. In other words, when an investor crosses a preset threshold level, remaining shareholders are given the right to sell their shares to the acquirer, who must buy them at the highest acquiring price.
RCM will generally support proposals to opt out of control share cash-out statutes.
| 6.3.6 | Going Private/Going Dark Transactions |
RCM will vote case-by-case on going private transactions, taking into account the following:
| • | Offer price/premium; |
| • | Fairness opinion; |
| • | How the deal was negotiated; |
| • | Conflicts of interest; |
| • | Other alternatives/offers considered; and |
| • | Non completion risk. |
RCM will vote case-by-case on going dark transactions, determining whether the transaction enhances shareholder value by taking into consideration:
| • | Whether the company has attained benefits from being publicly-traded (examination of trading volume, liquidity, and market research of the stock); |
D-111
| • | Balanced interests of continuing vs. cashed-out shareholders, taking into account the following: |
- Are all shareholders able to participate in the transaction?
- Will there be a liquid market for remaining shareholders following the transaction?
- Does the company have strong corporate governance?
- Will insiders reap the gains of control following the proposed transaction?
- Does the state of incorporation have laws requiring continued reporting that may benefit shareholders?
| 6.3.7 | Joint Ventures |
When voting on proposals to form joint ventures, RCM will consider the following factors:
| • | Percentage of assets/business contributed; |
| • | Percentage ownership; |
| • | Financial and strategic benefits; |
| • | Governance structure; |
| • | Conflicts of interest; |
| • | Other alternatives; and |
| • | Non-completion risk. |
| 6.3.8 | Liquidations |
RCM will consider liquidations on a case-by-case basis, taking into account the following:
| • | Management’s efforts to pursue other alternatives; |
| • | Appraisal value of assets; and |
| • | The compensation plan for executives managing the liquidation. |
RCM will support the liquidation if the company will file for bankruptcy if the proposal is not approved.
| 6.3.9 | Special Purpose Acquisition Corporations (SPACs) |
RCM will consider SPAC mergers and acquisitions on a case-by-case basis taking into account the following:
| • | Valuation — Is the value being paid by the SPAC reasonable? |
| • | Market reaction — How has the market responded to the proposed deal? |
| • | Deal timing — A main driver for most transactions is that the SPAC charter typically requires the deal to be complete within 18 to 24 months, or the SPAC is to be liquidated. |
| • | Negotiations and process — What was the process undertaken to identify potential target companies within specified industry or location specified in charter? |
| • | Conflicts of interest — How are sponsors benefiting from the transaction compared to IPO shareholders? Potential conflicts could arise if a fairness opinion is issued by the insiders to qualify the deal rather than a third party or if management is encouraged to pay a higher |
D-112
price for the target because of an 80% rule (the charter requires that the fair market value of the target is at least equal to 80% of net assets of the SPAC). |
| • | Voting agreements — Are the sponsors entering into enter into any voting agreements/ tender offers with shareholders who are likely to vote against the proposed merger or exercise conversion rights? |
| 6.4 | Other Corporate Finance Issues |
| 6.4.1 | Stock Splits and Reverse Stock Splits |
In general RCM will support stock splits.
Regarding reverse stock splits, RCM will support them in case their purpose is to fulfil a minimum stock exchange listing requirement.
| 6.4.2 | Share Repurchase Programs |
RCM will approve share repurchase programs when they are in the best interest of the shareholders, when all shareholders can participate on equal terms in the buyback program and where RCM agrees that the company cannot use the cash in a more useful way.
RCM will also view such programs in conjunction with the company’s dividend policy.
| 6.4.3 | Dividend Policy |
RCM believes that the proposed dividend payments should be disclosed in advance to shareholders and be put to a vote.
| 6.4.4 | Creating Classes with Different Voting Rights/Dual-Voting Share Class Structures |
RCM will in general support the principle “one-share, one-vote” as unequal voting rights allow for voting power to potentially be concentrated in the hands of a limited number of shareholders.
Therefore, RCM will normally favour a conversion to a “one-share, one-vote” capital structure and will in principle not support the introduction of multiple-class capital structures or the creation of new or additional super-voting shares.
| 6.4.5 | Conversion of Securities |
RCM will vote case-by-case on proposals regarding conversion of securities. When evaluating these proposals the investor should review the dilution to existing shareholders, the conversion price relative to market value, financial issues, control issues, termination penalties, and conflicts of interest.
RCM will support the conversion if it is expected that the company will be subject to onerous penalties or will be forced to file for bankruptcy if the transaction is not approved.
| 6.4.6 | Private Placements/Warrants/Convertible Debentures |
RCM will consider proposals regarding private placements, warrants, and convertible debentures on a case-by-case basis, taking into consideration:
| • | Dilution to existing shareholders’ position;. |
| • | Terms of the offer (discount/premium in purchase price to investor, including any fairness opinion, conversion features, termination penalties, exit strategy); |
D-113
| • | Financial issues (the company’s financial condition, degree of need for capital, use of proceeds, effect of the financing on the company’s cost of capital, current and proposed cash burn rate, going concern viability, and the state of the capital and credit markets); |
| • | Management’s efforts to pursue alternatives and whether the company engaged in a process to evaluate alternatives; |
| • | Control issues (potential change in management/board seats, change in control, standstill provisions, voting agreements, veto power over certain corporate actions, and minority versus majority ownership and corresponding minority discount or majority control premium); |
| • | Conflicts of interest (as viewed from the perspective of the company and the investor), considering whether the terms of the transaction were negotiated at arm’s length, and whether managerial incentives are aligned with shareholder interests; |
| • | Market reaction — How has the market responded to the proposed deal? |
RCM will support the private placement or the issuance of warrants and/or convertible debentures in a private placement, if it is expected that the company will file for bankruptcy if the transaction is not approved.
Section 7: Other Issues
| 7.1 | General Issues regarding Voting |
| 7.1.1 | Bundled Proposals |
RCM in general favours voting on individual issues and therefore votes against bundled resolutions.
Agenda items at shareholder meetings should be presented in such a way that they can be voted upon clearly, distinctly and unambiguously.
| 7.1.2 | “Other Business” Proposals |
RCM in general opposes “Other Business” proposals unless there is full and clear information about the exact nature of the business to be voted on.
| 7.1.3 | Simple Majority Voting/Elimination of Supermajority |
RCM in general supports simple majority voting and the elimination of supermajority. In certain cases, RCM may consider favouring supermajority in cases where it protects minority shareholders from dominant large shareholders.
| 7.2 | Miscellaneous |
| 7.2.1 | Re-domiciliation |
RCM will oppose re-domiciliation if the reason is to take advantage of a protective status and if the change will incur a significant loss of shareholder power.
| 7.2.2 | Shareholder Right to Call Special Meeting/Act by Written Consent |
RCM believes that companies should enable holders of a specified portion of its outstanding shares or a specified number of shareholders to call a meeting of shareholders for the purpose of transacting the legitimate business of the company. While it is appropriate to limit abuses, these hurdles should nevertheless be low enough to enable appropriate accountability of the company to its shareholders. Shareholders should be enabled to work together to make such a proposal.
D-114
| 7.2.3 | Disclosure and Transparency |
RCM believes that companies should apply high standards of disclosure and transparency. In this regards, RCM shows a preference for:
| • | at least half-year or full-year reports; |
| • | adherence to consistent internationally accepted financial standards; |
| • | availability of financial information and investor communication in a Business English translation; |
| • | personal accessibility and availability of top management for investors; |
| • | preparation of two reports (simplified and detailed versions) in at least two commonly used languages; |
| • | a guide to reading financial statements and clear explanations of proposed resolutions; |
| • | publication of documents on the Internet; |
| • | mandatory presence of directors at general meetings; |
| • | video link for shareholders not physically present; |
| • | adoption of electronic voting; |
| • | standardisation of voting forms. |
| 7.2.4 | Proposals to Adjourn Meeting |
RCM will generally oppose proposals to provide management with the authority to adjourn an annual or special meeting absent compelling reasons to support the proposal.
However, RCM will support proposals that relate specifically to soliciting votes for a merger or transaction if supporting that merger or transaction.
| 7.2.5 | Amend Bylaws without Shareholder Consent |
Providing the board with the sole ability to amend a company’s bylaws could serve as an entrenchment mechanism and could limit shareholder rights. As such, RCM will oppose proposals giving the board exclusive authority to amend the bylaws. However, RCM will support proposals giving the board the ability to amend the bylaws in addition to shareholders.
| 7.2.6 | Routine Agenda Items |
Many routine proposals are operational issues of a non-controversial nature. The list of operational issues includes, but is not limited to: changing date, time, or location of the annual meeting; amending quorum requirements; amending minor bylaws; approving financial results, director reports, and auditor reports; approving allocation of income; changing the company’s fiscal term; and lowering disclosure threshold for stock ownership.
While these proposals are considered to be routine, they are not inconsequential. Fiduciaries remain charged with casting their votes, so these proposals must be evaluated on a case-by-case basis, taking into account shareholders’ rights and the potential economic benefits that would be derived from implementation of the proposal.
| 7.2.7 | Succession Planning |
All companies should have succession planning policies and succession plans in place, and boards should periodically review and update them. Guidelines for disclosure of a company’s succession
D-115
planning process should balance the board’s interest in keeping business strategies confidential with shareholders’ interests in ensuring that the board is performing its planning duties adequately.
RCM will generally support proposals seeking disclosure on a CEO succession planning policy, considering at a minimum, the following factors:
| • | The reasonableness/scope of the request; and |
| • | The company’s existing disclosure on its current CEO succession planning process. |
D-116
SCOTIA INSTITUTIONAL ASSET MANAGEMENT US, LTD.
PROXY VOTING GUIDELINES
Scotia Institutional Asset Management US, Ltd. (“Scotia”), in its capacity as an investment advisor, provides investment management and administrative services to investment companies, trusts, estates, individuals, pension plans and corporations (collectively the “Funds”).
Scotia is a subsidiary of the Bank of Nova Scotia (“BNS”). BNS is a financial services company which provides a broad range of financial products and services to individuals, institutions and corporations through a number of operating subsidiaries including Scotia.
The purpose of this document is to outline the general guidelines used by Scotia for voting proxies received from companies held in Funds managed by Scotia.
Subject to compliance with the provisions from time to time of applicable securities and corporate legislation, rules, regulations and policies, Scotia, in its capacity as investment advisor, acting on each Fund’s behalf, has the right and obligation to vote proxies relating to the issuers of each Fund’s portfolio securities. In certain circumstances, Scotia may delegate this function to the Fund’s portfolio advisor or sub-advisor as part of such advisor’s discretionary authority to manage the Fund’s assets. In all cases, Scotia, or the portfolio advisor or the sub-advisor, voting proxies on behalf of a Fund must do so in a manner consistent with the best interests of the Fund and its securityholders. The proxy voting guidelines described below form an important part of Scotia fiduciary duty to maximize the long-term value of each Fund for the benefit of its securityholders. While the Scotia proxy voting guidelines are stated below, the portfolio managers will take into consideration all relevant facts and circumstances, and retain the right to vote proxies as deemed appropriate.
Our fundamental policy is that Scotia will vote with management of an issuer on routine business matters, otherwise a Fund will not own or maintain a position in the security of that issuer. Examples of routine business applicable to an issuer are voting on the size, nomination and election of the board of directors as well as the appointment of auditors. All other matters that are special or non-routine are assessed on a case-by-case basis with a focus on the potential impact of the vote on the value of the particular investment of the Fund.
Special or non-routine matters are brought to the attention of the portfolio manager(s) of the applicable Fund, and, after assessment, the portfolio manager(s) will direct that such matters be voted in a way that he or she believes will better protect or enhance the value of the investment for the Fund. Without limiting the generality of the foregoing, examples of non-routine business that require assessment on a case-by-case basis before voting the proxies of the issuer are: stock-based compensation plans, executive severance compensation arrangements, shareholders rights plans, corporate restructuring plans, going private transactions in connection with leveraged buyouts, lock-up arrangements, crown jewel defenses, supermajority approval proposals, stakeholder or shareholder proposals etc. The portfolio managers have responsibility for exercising all proxy votes and in doing so, for acting in the best interest of the Fund and its securityholders.
Scotia fundamental policy to vote proxies on behalf of a Fund in a manner consistent with the best interests of the Fund and its securityholders will always guide any proxy voting decision. If Scotia, on behalf of a Fund, votes against management of an issuer on any particular proposal, whether routine or non-routine, and the Fund continues to own the security of such issuer, documentation of that vote is required along with an explanation to be kept on file. In situations where a portfolio manager decides to vote securities held in his or her Fund differently from another portfolio manager(s) who holds the same security on behalf of another Fund, rationale for the differing vote is documented and kept on file. Factors such as an individual Fund’s investment objectives and strategies may lead to different judgments and conclusions by different portfolio managers about the expected impact of proxy proposals. On occasion, a portfolio manager may abstain from voting a proxy or a specific proxy item
D-117
when he or she concludes that the potential benefit of voting the proxy of that issuer is outweighed by the cost. Such instances require that a detailed explanation be kept on file. All such documentation will be submitted to the Portfolio Administrator for filing and record keeping.
Scotia will not vote proxies received for issuers of securities that are no longer held in a Fund. Scotia, on behalf of a Fund, will not vote any of the securities a Fund holds in any of its affiliates or associates. However, Scotia, in its sole discretion, may arrange for securityholders of a Fund to vote their share of those securities.
Where Scotia provides sub advisory investment management services to a registered investment company, Scotia will work with the fund’s manager to identify the proxy reports the Fund’s board requires, as well as the frequency of those reports. Scotia will also work with the fund manager to assist in facilitating all required regulatory reporting surrounding proxy voting.
As noted above, Scotia is a subsidiary of BNS. Some of the Funds may hold common shares of BNS or other related entities. There is the potential for a conflict of interest between the interests of the Funds and the interests of Scotia or its employees in connection with the exercise of voting rights of the Funds attached to the BNS shares. There is also the potential for a conflict of interest in connection with the exercise of the Funds’ voting rights attached to the shares of another issuer, where the outcome of the vote may directly impact the price of BNS shares. To the extent that a portfolio manager has any conflict of interest with respect to a company or a matter presented in a proxy proposal, that portfolio manager is required to report to the Legal and Compliance department any such conflicts of interest. In addition, any new conflict of interest situations must also be referred to the Legal & Compliance department.
In order to balance the interests of the Funds in exercising proxies with the desire to avoid the perception of a conflict of interest, Scotia has instituted procedures to help ensure that a Fund’s proxy is voted:
| • | in accordance with the business judgment of the portfolio manager, uninfluenced by considerations other than the best interests of the Fund; and |
| • | free from any influence by BNS and without taking into account any consideration relevant to BNS or any of its associates or affiliates. |
Scotia will maintain records relating to a Fund’s proxy voting activity. These will include a record of all proxies received; a record of votes cast; a copy of the reasons for voting against management; a copy of reasons for a portfolio manager voting differently from another portfolio manager; and a copy of any documents prepared by Scotia that were material to making a decision on how to vote, or that memorialized the basis for a decision.
It is the responsibility of the Director & Head Compliance & Investment Counsel to amend this document when necessary to reflect changes at Scotia and changes in applicable laws and regulatory requirements. At a minimum, the document will be reviewed on an annual basis to determine any necessary amendments.
Inquiries should be directed to the Legal and Compliance Department, 29th Floor, 1 Adelaide Street East, Tusonto Ontario, M5C2V9.
D-118
SSgA FUNDS MANAGEMENT, INC.
PROXY VOTING POLICY
March 2012
Introduction
SSgA Funds Management, Inc. (“SSgA FM”) is a registered investment adviser and a wholly owned subsidiary of State Street Corporation, a leading provider of financial services to institutional investors. As an investment manager, SSgA FM has discretionary proxy voting authority over most of its client accounts, and SSgA FM votes these proxies in the manner that we believe will most likely protect and promote the long term economic value of client investments and as set forth in the SSgA FM Proxy Voting Guidelines (the “Proxy Voting Guidelines”).
Proxy Voting Procedure
Oversight
The SSgA FM Corporate Governance Team is responsible for implementing the Proxy Voting Guidelines, case-by-case voting items, issuer engagement activities, and research and analysis of governance-related issues impacting shareholder value. The implementation of the Proxy Voting Guidelines is overseen by the SSgA FM Global Proxy Review Committee (“SSgA FM PRC”), a committee of investment, compliance and legal professionals, who provide guidance on proxy issues as described in more detail below. The SSgA FM PRC reports to the SSgA Investment Committee, and may refer certain significant proxy items to that committee. In addition to voting proxies, SSgA:
| 1) | describes its proxy voting procedures to its clients in Part II of its Form ADV; |
| 2) | provides the client with this written proxy policy, upon request; |
| 3) | discloses to its clients how they may obtain information on how FM voted the client’s proxies; |
| 4) | matches proxies received with holdings as of record date; |
| 5) | generally applies its proxy voting policy consistently and keeps records of votes for each client; |
| 6) | documents the reason(s) for voting for all non-routine items; and |
| 7) | keeps records of such proxy voting available for inspection by the client or governmental agencies. |
Oversight of the proxy voting process is ultimately the responsibility of the SSgA Investment Committee. The SSgA Investment Committee reviews and approves amendments to the Proxy Voting Guidelines.
Proxy Voting Process
SSgA FM retains Institutional Shareholder Services Inc. (“ISS”), a firm with expertise in proxy voting and corporate governance, to support our proxy voting process. SSgA FM utilizes ISS’s services in three ways: (1) as SSgA FM’s proxy voting agent (providing SSgA FM with vote execution and administration services); (2) applying SSgA FM’s Proxy Voting Guidelines; and (3) provides research and analysis relating to general corporate governance issues and specific proxy items.
On most routine proxy voting items (e.g., retention of auditors), ISS will effect the proxy votes in accordance with the Proxy Voting Guidelines and our standing instructions, which the SSgA FM Corporate Governance Team reviews with ISS on an annual basis or on a case-by-case basis as required. The guidance permits ISS to apply the Proxy Voting Guidelines without consulting us on each proxy and in a manner that is consistent with our investment view. On matters not directly covered by the Proxy Voting Guidelines, and we conclude there is no likelihood of impacting shareholder value, ISS may effect proxy votes in accordance with its own recommendations.
D-119
In other cases, the Corporate Governance Team will evaluate the proxy solicitation to determine how to vote consistent with SSgA FM’s investment views and to maximize the value of our client accounts. In general, the Corporate Governance Team will engage in this additional review for:
| (i) | proxies that involve special circumstances and require additional research and discussion (e.g. a material merger or acquisition, or a material governance issue with the potential to become a significant precedent in corporate governance); and |
| (ii) | proxies that are not directly addressed by our policies and which are reasonably anticipated to have an impact on the current or potential value of a security or which we do not consider to be routine. |
In some instances, the SSgA FM Corporate Governance Team may refer significant issues which are not addressed by our Proxy Voting Guidelines or guidance to ISS to the SSgA FM PRC for a determination of the proxy vote. In addition, in determining whether to refer a proxy vote to the SSgA FM PRC, the SSgA FM Corporate Governance Team will examine whether there is a material conflict of interest between the interests of our client and those of SSgA FM or its affiliates (as explained in greater detail below under “Conflict of Interest”). If there is no material conflict, we examine the proposals that involve special circumstances or are not addressed by our policy or guidance in detail in seeking to determine what vote would be in the best interest of our clients (i.e., to maximize the economic value of our clients’ securities).
Conflict of Interest
From time to time, SSgA FM will review a proxy which may present a potential conflict of interest. In general, we do not believe matters that fall within our Proxy Voting Guidelines and are voted consistently with the Proxy Voting Guidelines present any potential conflicts, since the vote on the matter has effectively been determined without reference to the soliciting entity; however, where matters do not fall within our Proxy Voting Guidelines or where we believe that voting in accordance with the Proxy Voting Guidelines is unwarranted, we conduct an additional review to determine whether there is a conflict of interest. Although various relationships could be deemed to give rise to a conflict of interest, SSgA has determined that two categories of relationships present a serious concern to warrant an alternative process: (1) clients of SSgA FM or its affiliates which are among the top 100 clients of State Street Corporation or its affiliates based upon revenue; and (2) the 10 largest broker-dealers used by SSgA, based upon revenue (a “Material Relationship”).
In circumstances where either (i) the matter does not fall clearly within the Proxy Voting Guidelines or (ii) SSgA FM determines that voting in accordance with such policies or guidance is not in the best interests of its clients, the Director of SSgA FM’s Corporate Governance Team will determine whether a Material Relationship exists. If so the matter is referred to the SSgA FM PRC. The SSgA FM PRC then reviews the matter and determines whether a conflict of interest exists, and if so, how to best resolve such conflict. For example, the SSgA FM PRC may (i) determine that the proxy vote does not give rise to a conflict due to the issues presented, (ii) refer the matter to the SSgA Investment Committee for further evaluation or (iii) retain an independent fiduciary to determine the appropriate vote.
Engagement
SSgA FM conducts issuer engagement activity to support SSgA FM’s voting principles. SSgA FM believes engagement with portfolio companies is often the most active and productive way shareholders can exercise their ownership rights, with the goal of increasing shareholder value. SSgA FM regularly engages with companies to discuss corporate governance issues and to provide insight about the principles and practices that drive our voting decisions. In our discussions, we highlight the attributes and practices that we believe enhance the quality of corporate governance at companies. Some engagement topics include takeover defenses, merger transactions, proxy contests, board elections, sustainability issues, executive compensation, equity compensation plans and other topical issues of interest to our
D-120
clients as shareholders. Through our discussions, we seek to strengthen the quality of corporate governance with boards and management, which helps protect shareholder value.
The SSgA FM Governance Team is dedicated to providing governance research, analysis, issuer engagement and voting services. The SSgA FM Governance Team has no fixed set of priorities that dictate engagement practices. Instead, we view engagement practices as being dependent upon facts and circumstances, while giving consideration to the size of our total position of the issuer and/or the potential negative governance practices, performance profile, and circumstance at hand.
Nature and Form of Engagement
SSgA FM believes issuer engagement can take many forms and be triggered under numerous circumstances. The following methods represent how SSgA FM defines engagement methods:
Reactive
Reactive engagement is initiated by the issuers and typically represents a majority of SSgA FM’s engagement activity. SSgA FM routinely discusses specific voting issues and items with the issuer community. These are viewed as an opportunity to address not only voting items, but also a wide range of governance items that impact shareholder value.
Recurring
Recurring engagement takes advantage of SSgA FM’s strong relationships with many of its largest holdings. SSgA FM maintains regular face-to-face meetings with these issuers, allowing SSgA FM to reinforce key tenets of good corporate governance and actively advise these issuers around concerns that SSgA FM feels may impact long-term shareholder value.
Dynamic
Using screening tools designed to capture a mix of SSgA FM’s largest exposures to issuers demonstrating severe negative governance profiles, SSgA FM will actively seek direct dialogue with the board and management. In these cases, the dynamic engagement process represents the most meaningful chance for SSgA FM to protect long-term shareholder value from excessive risk due to governance related risks.
SSgA FM believes active engagement is best conducted individually and directly with company management or board members. Collaborative engagement, where multiple shareholders communicate with company representatives, such as shareholder conference calls, can serve as a potential forum for issues that are not identified by SSgA FM as requiring active engagement.
When Does SSgA FM Engage Issuers?
SSgA FM uses various methods to monitor its investments to determine which issuers require dynamic engagement. A blend of quantitative and qualitative research and data is used to identify potential engagement opportunities. SSgA FM sources internal and external research and screening tools to support the engagement process.
Voting and Engagement
SSgA FM believes engagement and voting activity have a direct relationship. Issuer engagement seeks to address significant shareholder concerns and governance issues. Logically, successful issuer engagement should reduce the need to vote against management. The integration and exercise of both these rights leads to a meaningful shareholder tool that seeks to achieve enhanced shareholder value on behalf of SSgA FM clients.
D-121
Developed and Non-Developed Markets
SSgA FM engagement philosophy applies across all global markets. We have found the opportunity and effectiveness of engagement activity directly correlates to the level of ownership and voting rights provided by local market laws. From market to market, engagement activity may take different forms in order to best achieve long term engagement goals.
Engagement in developed markets is a mature process for SSgA FM. In some cases, engagement activity is institutionalized into local best practices, such as the UK Stewardship Code overseen by Financial Reporting Commission (FRC). In the UK, disclosure standards are high, allowing shareholders simple access to the key components of governance, such as board and by-law structure, remuneration policies and practices, sustainability data and reporting, among others. Further, shareholder rights are relatively high allowing for SSgA FM to engage on a variety of issues.
In many non-OECD markets we often supplement direct company engagement with participation in shareholder advocacy groups that seek change at a market level. This type of “top-down” approach should have a positive long-term impact by addressing shortcomings in local market laws on disclosure and shareholder rights.
Summary of Proxy Voting Guidelines
Directors and Boards
The election of directors is one of the most important fiduciary duties SSgA FM performs as a shareholder. SSgA FM believes that well-governed companies can protect and pursue shareholder interests better and withstand the challenges of an uncertain economic environment. As such, SSgA FM seeks to vote director elections, in a way, which we as a fiduciary, believe will maximize the monetary value of each portfolio’s holdings.
The role of the board, in SSgA FM’s view, is to carry out its responsibilities in the best long-term interest of the company and its shareholders. A strong and effective board oversees management, provides guidance on strategic matters, selects the CEO and other senior executives, creates a succession plan, and performs risk oversight and performance assessment of the CEO and management. In contrast, management implements the business strategy and runs the company’s day-to-day operations. As part of SSgA FM’s engagement process, SSgA FM routinely discusses the importance of the board with issuers.
SSgA FM believes the quality of a board is a measure of director independence and company governance practices. In voting to elect nominees, SSgA FM considers many factors. SSgA FM believes independent directors are crucial to good corporate governance and help management establish sound corporate governance policies and practices. A sufficiently independent board will most effectively monitor management, maintain appropriate governance practices, and perform oversight functions necessary to protect shareholder interests.
Accounting and Audit Related Issues
SSgA FM believes audit committees are critical and necessary as part of the board’s risk oversight role. We expect auditors to provide assurance as of a company’s financial condition. Having trust in the accuracy of financial statements is important for shareholders to make decisions. Subsequently, SSgA FM believes that it is imperative for audit committees to select outside auditors who are independent from management.
SSgA FM believes the audit committee is responsible for appointing, compensating, retaining and overseeing the issuer’s outside audit firm. In addition, SSgA FM believes the audit committee should approve audit and non-audit services performed by outside audit firms.
D-122
Capital Structure, Reorganization and Mergers
Though SSgA FM does not seek involvement in the day-to-day operations of an organization, SSgA FM recognizes the need for oversight and input into management decisions that may affect a company’s value. Altering the capital structure of a company is a critical decision for management, and in making such a critical decision, SSgA FM believes the company should have a well explained business rationale that is consistent with corporate strategy and should not overly dilute its shareholders.
The organizational structure of a company or proposed modifications to a company, may improve the effectiveness of a company’s operations, thereby enhancing shareholder value. M&A issues may result in a substantial economic impact to a corporation. SSgA FM evaluates mergers and acquisitions on a case-by-case basis. SSgA FM considers the adequacy of the consideration and the impact of the corporate governance provisions to shareholders. In all cases, SSgA FM uses its discretion in order to maximize shareholder value.
Occasionally, companies add anti-takeover provisions that reduce the chances of a potential acquirer making an offer or reducing the likelihood of a successful offer. SSgA FM does not support proposals that reduce shareholders’ rights, entrench management or reduce the likelihood of shareholder’s right to vote on reasonable offers.
Compensation
SSgA FM considers the board’s responsibility to include setting the appropriate level of executive compensation. Despite the differences among the types of plans and the awards possible, there is a simple underlying philosophy that guides SSgA FM’s analysis of executive compensation; there should be a direct relationship between executive compensation and company performance over the long term.
General/Routine
Although SSgA FM does not seek involvement in the day-to-day operations of an organization, SSgA FM recognizes the need for conscientious oversight and input into management decisions that may affect a company’s value. SSgA FM supports proposals that encourage economically advantageous corporate practices and governance, while leaving decisions that are deemed to be routine or constitute ordinary business to management and the board of directors.
Environmental and Social Issues
Proposals relating to social and environmental issues, typically initiated by shareholders, generally request that the company disclose or amend certain business practices. Often, proposals may address concerns with which SSgA FM philosophically agrees, but absent a compelling economic impact on shareholder value, SSgA FM will typically abstain from voting on these proposals.
International Statement
SSgA FM reviews proxies of non-US issuers consistent with our Principles and Proxy Voting Guidelines; however, SSgA FM also endeavors to show sensitivity to local market practices when voting non-US proxies. This may lead to contrasting votes as corporate governance standards, disclosure requirements and voting mechanics differ from market to market. SSgA will vote issues in the context of our Proxy Voting Guidelines, as well as local market standards, where appropriate.
SSgA FM votes in all markets where it is feasible; however, SSgA FM may refrain from voting meetings when power of attorney documentation is required, where voting will have a material impact on our ability to trade the security, or where issuer-specific special documentation is required or various market or issuer certifications are required. SSgA FM is unable to vote proxies when certain custodians, used by our clients, do not offer proxy voting in a jurisdiction or when they charge a meeting specific fee in excess of the typical custody service agreement.
D-123
SSgA FM Proxy Voting Guidelines
State Street Global Advisors Funds Management (“SSgA FM”) seeks to vote proxies for which it has discretionary authority in the best interests SSgA FM clients. This means that SSgA FM will make voting decisions in the manner SSgA believes will most likely protect and promote the long term economic value of client accounts. Absent unusual circumstances or specific client instructions, SSgA FM votes proxies on a particular matter in the same way for all clients, regardless of their investment style or strategies. SSgA FM takes the view that voting in a manner consistent with maximizing the monetary value of our clients’ holdings will benefit our direct clients (e.g. fund shareholders).
| I. | DIRECTOR RELATED ITEMS |
Director related proposals concern issues submitted to shareholders that deal with the composition of the board or impact the members of a corporation’s board of directors. In deciding which director nominee to support, SSgA FM considers numerous factors.
Director Elections
SSgA’s director election policy focuses on companies’ governance profile to identify if a company demonstrates appropriate governance practices or if it exhibits negative governance practices. Factors SSgA considers when evaluating governance practices include, but are not limited to the following:
| • | Shareholder rights |
| • | Board independence |
| • | Board structure |
If a company demonstrates appropriate governance practices, SSgA believes a director should be classified as independent based on the relevant listing standards or local market practice standards. In such cases, the composition of the key oversight committees of a board should meet the minimum standards of independence. Accordingly, SSgA will vote against a nominee at a company with appropriate governance practices if the director is classified as non-independent under relevant listing standards or local market practice AND serves on a key committee of the board (compensation, audit, nominating or committees required to be fully independent by local market standards).
Conversely, if a company demonstrates negative governance practices, SSgA believes the classification standards for director independence should be elevated. In such circumstances, we will evaluate all director nominees based on the following classification standards:
| • | Is the nominee an employee of or related to an employee of the issuer or its auditor, |
| • | Does the nominee provides professional services to the issuer, |
| • | Has the nominee attended an appropriate number of board meetings, or |
| • | Has the nominee received non-board related compensation from the issuer. |
Where companies demonstrate negative governance practices, these stricter standards will apply not only to directors who are a member of a key committee but to all directors on the board as market practice permits. Accordingly, SSgA will vote against a nominee (with the exception of the CEO) where the board has inappropriate governance practices and is considered not independent based on the above independence criteria.
Additionally, SSgA may withhold votes based on the following:
| • | CEOs of public companies who sit on more than three public company boards. |
| • | Nominees who sit on more than six public company boards. |
D-124
| • | SSgA may withhold votes from all director nominees at companies that have ignored a shareholder proposal which received a majority of the shares outstanding at the last annual or special meeting, unless management submits the proposal(s) on the ballot as a binding management proposal, recommending shareholders vote for the particular proposal(s). |
| • | SSgA may withhold votes from compensation committee members where there is a weak relationship between executive pay and performance over a five-year period. |
| • | SSgA will withhold votes from audit committee members if non-audit fees exceed 50% of total fees paid to the auditors. |
| • | SSgA will withhold votes from directors who appear to have been remiss in their duties. |
Director Related Proposals
SSgA FM generally votes for the following director related proposals:
| • | Discharge of board members’ duties, in the absence of pending litigation, governmental investigation, charges of fraud or other indications of significant concern. |
| • | Proposals to restore shareholders’ ability to remove directors with or without cause. |
| • | Proposals that permit shareholders to elect directors to fill board vacancies. |
| • | Shareholder proposals seeking disclosure regarding the company, board, or compensation committee’s use of compensation consultants, such as company name, business relationship(s) and fees paid. |
SSgA FM generally votes against the following director related proposals:
| • | Requirements that candidates for directorships own large amounts of stock before being eligible to be elected. |
| • | Proposals that relate to the “transaction of other business as properly comes before the meeting”, which extend “blank check” powers to those acting as proxy. |
| • | Shareholder proposals requiring two candidates per board seat. |
Majority Voting
SSgA FM will generally support a majority vote standard based on votes cast for the election of directors.
SSgA FM will generally vote to support amendments to bylaws that would require simple majority of voting shares (i.e. shares cast) to pass or repeal certain provisions.
Annual Elections
SSgA FM generally supports the establishment of annual elections of the board of directors. Consideration is given to the overall level of board independence and the independence of the key committees as well as whether there is a shareholders rights plan.
Cumulative Voting
SSgA FM does not support cumulative voting structures for the election of directors.
Separation Chair/CEO
SSgA FM analyzes proposals for the separation of Chair/CEO on a case-by-case basis taking into consideration numerous factors, including but not limited to, a company’s performance and the overall governance structure of the company.
D-125
Proxy Access
SSgA will consider proposals relating to Proxy Access on a case-by-case basis:
SSgA will evaluate the company’s specific circumstances, the impact of the proposal on the target company and its potential effect on shareholder value.
Considerations include but are not limited to the following:
| • | The ownership thresholds and holding duration proposed in the resolution; |
| • | The binding nature of the proposal; |
| • | The number of directors that shareholders may be nominate each year; |
| • | Company performance; |
| • | Company governance structure; |
| • | Shareholder rights; and |
| • | Board performance. |
Age/Term Limits
Generally, SSgA FM will vote against limits to tenure.
Approve Remuneration of Directors
Generally, SSgA FM will support directors’ compensation, provided the amounts are not excessive relative to other issuers in the market or industry. In making our determination, we review whether the compensation is overly dilutive to existing shareholders.
Indemnification
Generally, SSgA FM supports proposals to limit directors’ liability and/or expand indemnification and liability protection if he or she has not acted in bad faith, gross negligence or reckless disregard of the duties involved in the conduct of his or her office.
Classified Boards
SSgA FM generally supports annual elections for the board of directors. In certain cases, SSgA FM will support a classified board structure, if the board is composed of 80 percent of independent directors, the board’s key committees (auditing, nominating and compensation) are composed of independent directors, and SSgA FM will consider other governance factors, including antitakeover devices.
Confidential Voting
SSgA FM will support confidential voting.
Board Size
SSgA FM will support proposals seeking to fix the board size or designate a range for the board size and will vote against proposals that give management the ability to alter the size of the board outside of a specified range without shareholder approval.
| II. | AUDIT RELATED ITEMS |
Ratifying Auditors and Approving Auditor Compensation
SSgA FM supports the approval of auditors and auditor compensation provided that the issuer has properly disclosed audit and non-audit fees relative to market practice and the audit fees are not deemed
D-126
excessive. SSgA FM deems audit fees to be excessive if the non-audit fees for the prior year constituted 50% or more of the total fees paid to the auditor. SSgA FM will support the disclosure of auditor and consulting relationships when the same or related entities are conducting both activities and will support the establishment of a selection committee responsible for the final approval of significant management consultant contract awards where existing firms are already acting in an auditing function.
In circumstances where “other” fees include fees related to initial public offerings, bankruptcy emergence, and spin-offs, and the company makes public disclosure of the amount and nature of those fees which are determined to be an exception to the standard “non-audit fee” category, then such fees may be excluded from the non-audit fees considered in determining the ratio of non-audit to audit/audit-related fees/fax compliance and preparation for purposes of determining whether non-audit fees are excessive.
SSgA FM will support the discharge of auditors and requirements that auditors attend the annual meeting of shareholders.*
Accept Financial Statements Consolidated Financial Statements and Statutory Reports
It is the auditor’s responsibility to provide assurance as of the company’s financial condition. Accordingly, in the absence of pending litigation, governmental investigation, charges of fraud or other indicia of significant concern, SSgA FM will accept the financial statement, allocation of income and/or statutory report.
| III. | CAPITAL STRUCTURE |
Capital structure proposals include requests by management for approval of amendments to the certificate of incorporation that will alter the capital structure of the company. The most common request is for an increase in the number of authorized shares of common stock, usually in conjunction with a stock split or dividend. Typically, requests that are not unreasonably dilutive or enhance the rights of common shareholders are supported. In considering authorized share proposals, the typical threshold for approval is 100% over current authorized shares. However, the threshold may be increased if the company offers a specific need or purpose (merger, stock splits, growth purposes, etc.). All proposals are evaluated on a case-by-case basis taking into account the company’s specific financial situation.
Increase in Authorized Common Shares
In general, SSgA FM supports share increases for general corporate purposes up to 100% of current authorized stock.
SSgA FM supports increases for specific corporate purposes up to 100% of the specific need plus 50% of current authorized common stock for U.S. firms and plus 100% of current authorized stock for international firms.
When applying the thresholds, SSgA FM will also consider the nature of the specific need, such as mergers and acquisitions and stock splits.
Increase in Authorized Preferred Shares
SSgA FM votes on a case-by-case basis on proposals to increase the number of preferred shares.
Generally, SSgA FM will vote for the authorization of preferred stock in cases where the company specifies the voting, dividend, conversion, and other rights of such stock and the terms of the preferred stock appear reasonable.
| * | Common for non-US issuers; request from the issuer to discharge from liability the directors or auditors with respect to actions taken by them during the previous year. |
D-127
SSgA FM will support proposals to create “declawed” blank check preferred stock (stock that cannot be used as a takeover defense).
However, SSgA FM will vote against proposals to increase the number of blank check preferred stock authorized for issuance when no shares have been issued or reserved for a specific purpose.
Preemptive Rights and Non-Preemptive Rights
In general, SSgA FM supports issuance authority requests up to 100% of current share capital with preemptive rights. Requests for the authority to remove preemptive rights will be supported for share issuances that are less than a certain percentage (ranging from 5-20%, based on market practice) of the outstanding shares, unless even such a small amount could have a material dilutive effect on existing shareholders (e.g. illiquid markets).
For Hong Kong, SSgA FM does not support issuances that do not place limits on discounts or do not provide the authority to refresh the share issuance amounts without prior shareholder approval.
Unequal Voting Rights
SSgA FM will not support proposals authorizing the creation of new classes of common stock with superior voting rights and will vote against new classes of preferred stock with unspecified voting, conversion, dividend distribution, and other rights. In addition, SSgA FM will not support capitalization changes that add “blank check” classes of stock (i.e. classes of stock with undefined voting rights) or classes that dilute the voting interests of existing shareholders.
However, SSgA FM will support capitalization changes that eliminate other classes of stock and/or unequal voting rights.
Dividends and Share Repurchase Programs
SSgA FM generally supports dividend payouts that are greater than or equal to country and industry standards; we generally support a dividend which constitutes 30% or more of net income. SSgA FM may vote against the dividend payouts if the dividend payout ratio has been consistently below 30% without adequate explanation; or, the payout is excessive given the company’s financial position.
Generally, SSgA FM votes for the authorization of share repurchase programs, unless the issuer does not clearly state the business purpose for the program, a definitive number of shares to be repurchased, and the time frame for the repurchase.
| IV. | MERGERS AND ACQUISITIONS |
Mergers and the reorganization structure of a company often involve proposals relating to reincorporation, restructurings, mergers, liquidations, and other major changes to the corporation. Proposals that are in the best interests of the shareholders, demonstrated by enhancing share value or improving the effectiveness of the company’s operations, will be supported. In general, provisions that are not viewed as economically sound or are thought to be destructive to shareholders’ rights are not supported.
SSgA FM will generally support transactions that maximize shareholder value. Some of the considerations include, but are not limited to the following:
| • | Offer premium |
| • | Strategic rationale |
| • | Board oversight of the process for the recommended transaction, including, director and/or management conflicts of interest |
D-128
| • | Offers made at a premium and where there are no other higher bidders |
| • | Offers in which the secondary market price is substantially lower than the net asset value |
SSgA FM may vote against a transaction considering the following:
| • | Offers with potentially damaging consequences for minority shareholders because of illiquid stock, especially in some non-US markets |
| • | Offers where we believe there is a reasonable prospect for an enhanced bid or other bidders |
| • | At the time of voting, the current market price of the security exceeds the bid price |
| V. | ANTI-TAKEOVER MEASURES |
Typically, proposals relating to requests by management to amend the certificate of incorporation or bylaws to add or delete a provision are deemed to have an antitakeover effect. The majority of these proposals deal with management’s attempt to add some provision that makes a hostile takeover more difficult or will protect incumbent management in the event of a change in control of the company.
Proposals that reduce shareholders’ rights or have the effect of entrenching incumbent management will not be supported. Proposals that enhance the right of shareholders to make their own choices as to the desirability of a merger or other proposal are supported.
Shareholder Rights Plans
SSgA FM will support mandates requiring shareholder approval of a shareholder rights plans (“poison pill”) and repeals of various anti-takeover related provisions.
In general, SSgA FM will vote against the adoption or renewal of a US issuer’s shareholder rights plan (“poison pill”).
SSgA FM will support the adoption or renewal of a non-US issuer’s shareholder rights plans (“poison pill”) if the following conditions are met: (i) minimum trigger, flip-in or flip-over of 20%, (ii) maximum term of three years, (iii) no “dead hand,” “slow hand,” “no hand” or similar feature that limits the ability of a future board to redeem the pill, and (iv) inclusion of a shareholder redemption feature (qualifying offer clause), permitting ten percent of the shares to call a special meeting or seek a written consent to vote on rescinding the pill if the board refuses to redeem the pill 90 days after a qualifying offer is announced.
SSgA FM will vote for an amendment to a shareholder rights plan (“poison pill”) where the terms of the new plans are more favorable to shareholders’ ability to accept unsolicited offers (i.e. if one of the following conditions are met: (i) minimum trigger, flip-in or flip-over of 20%, (ii) maximum term of three years, (iii) no “dead hand,” “slow hand,” “no hand” or similar feature that limits the ability of a future board to redeem the pill, and (iv) inclusion of a shareholder redemption feature (qualifying offer clause), permitting ten percent of the shares to call a special meeting or seek a written consent to vote on rescinding the pill if the board refuses to redeem the pill 90 days after a qualifying offer is announced).
Special Meetings
SSgA will vote for shareholder proposals related to special meetings at companies that do not provide shareholders the right to call for a special meeting in their by-laws if:
| - | The company also does not allow shareholders to act by written consent, OR |
| - | The company allows shareholders to act by written consent but the ownership threshold for acting by written consent is set above 25% of outstanding shares. |
D-129
SSgA will vote for shareholder proposals related to special meetings at companies that give shareholders (with a minimum 10% ownership threshold) the right to call for a special meeting in their by-laws if:
| - | The current ownership threshold to call for a special meeting is above 25% of outstanding shares. |
SSgA will vote for management proposals related to special meetings.
Written Consent
SSgA will vote for shareholder proposals on written consent at companies if:
| - | The company does not have provisions in their by-laws giving shareholders the right to call for a special meeting, OR |
| - | The company allows shareholders the right to call for a special meeting but the current ownership threshold to call for a special meeting is above 25% of outstanding shares, AND |
| - | The company has a poor governance profile. |
SSgA will vote management proposals on written consent on a case-by-case basis.
Super-Majority
SSgA FM will generally vote against amendments to by-laws requiring super-majority shareholder votes to pass or repeal certain provisions. SSgA FM will vote for the reduction or elimination of super-majority vote requirements, unless management of the issuer was concurrently seeking to or had previously made such a reduction or elimination.
| VI. | REMUNERATION |
Despite the differences among the types of plans and the awards possible there is a simple underlying philosophy that guides the analysis of all compensation plans; namely, are the terms of the plan designed to provide an incentive for executives and/or employees to align their interests with those of the shareholders and thus work toward enhancing shareholder value. Plans which benefit participants only when the shareholders also benefit are those most likely to be supported.
Advisory Vote on Executive Compensation and Frequency
SSgA FM supports management proposals on executive compensation where there is a strong relationship between executive pay and performance over a five-year period.
SSgA FM supports an annual advisory vote on executive compensation.
Approve Remuneration Report
SSgA FM will generally support remuneration reports that are judged to be in-line with local market practices. SSgA FM will generally vote against the approval of the remuneration report if the company fails to disclose information regarding any element of CEO remuneration including but not limited to, base salary, annual bonuses, and special bonuses relative to market practice.
If the company’s schemes allows for retesting of performance criteria over extended time period or for retesting if the original performance criteria was not met during the initial time period, SSgA FM may vote against the remuneration report.
D-130
Employee Equity Award Plans
SSgA FM considers numerous criteria when examining equity award proposals. Generally, SSgA FM does not vote against plans for lack of performance or vesting criteria. Rather, the main criteria that will result in a vote against an equity award plan are:
Excessive voting power dilution: To assess the dilutive effect, we divide the number of shares required to fully fund the proposed plan, the number of authorized but unissued shares and the issued but unexercised shares by the fully diluted share count. SSgA reviews that number in light of certain factors, including the industry of the issuer.
Other criteria include the following:
| • | Number of participants or eligible employees; |
| • | The variety of awards possible |
| • | The period of time covered by the plan |
There are numerous factors that we view as negative, and together, may result in a vote against a proposal:
| • | Grants to individuals or very small groups of participants; |
| • | “Gun-jumping” grants which anticipate shareholder approval of a plan or amendment; |
| • | The power of the board to exchange “underwater” options without shareholder approval this pertains to the ability of a company to reprice options, not the actual act of repricing described above; |
| • | Below market rate loans to officers to exercise their options; |
| • | The ability to grant options at less than fair market value; |
| • | Acceleration of vesting automatically upon a change in control; |
| • | Excessive compensation (i.e. compensation plans which are deemed by SSgA FM to be overly dilutive). |
Historical option grants: Excessive historical option grants over the past three years. Plans that provide for historical grant patterns of greater than eight to twelve percent are generally not supported.
Repricing: SSgA FM will vote against any plan where repricing is expressly permitted. If a company has a history of repricing underwater options, the plan will not be supported.
Share Repurchases: If a company makes a clear connection between a share repurchase program and its intent to offset dilution created from option plans and the company fully discloses the amount of shares being repurchased, the voting dilution calculation may be adjusted to account for the impact of the buy back.
Companies who do not (i) clearly state the intentions of any proposed share buy-back plan or (ii) do not disclose a definitive number of the shares to be bought back and, (iii) the time frame during which the shares will be bought back will not have any such repurchase plan factored into the dilution calculation.
162(m) Plan Amendments: If a plan would not normally meet SSgA FM criteria described above, but is primarily being amended to add specific performance criteria to be used with awards designed to qualify for performance-based exception from the tax deductibility limitations of Section 162(m) of the Internal Revenue Code, then SSgA FM will support the proposal to amend the plan.
Employee Stock Option Plans
SSgA FM generally votes for stock purchase plans with an exercise price of not less than 85% of fair market value. However, SSgA FM takes market practice into consideration.
D-131
Compensation Related Items
SSgA FM will generally support the following proposals:
| • | Expansions to reporting of financial or compensation-related information, within reason |
| • | Proposals requiring the disclosure of executive retirement benefits if the issuer does not have an independent compensation committee |
SSgA FM will generally vote against the following proposals:
| • | Retirement bonuses for non-executive directors and auditors |
| VII. | MISCELLANEOUS/ROUTINE ITEMS |
SSgA FM generally supports the following miscellaneous/routine governance items:
| • | Reimbursement of all appropriate proxy solicitation expenses associated with the election when voting in conjunction with support of a dissident slate |
| • | Opting out of business combination provision |
| • | Proposals that remove restrictions on the right of shareholders to act independently of management |
| • | Liquidation of the company if the company will file for bankruptcy if the proposal is not approved |
| • | Shareholder proposals to put option repricings to a shareholder vote |
| • | General updating of or corrective amendments to charter and by-laws not otherwise specifically addressed herein, unless such amendments would reasonably be expected to diminish shareholder rights (e.g. extension of directors’ term limits, amending shareholder vote requirement to amend the charter documents, insufficient information provided as to the reason behind the amendment) |
| • | Change in corporation name |
| • | Mandates that amendments to bylaws or charters have shareholder approval |
| • | Management proposals to change the date, time, and/or location of the annual meeting unless the proposed change is unreasonable |
| • | Repeals, prohibitions or adoption of anti-greenmail provisions |
| • | Management proposals to implement a reverse stock split when the number of authorized shares will be proportionately reduce and proposals to implement a reverse stock split to avoid delisting |
| • | Exclusive forum provisions |
SSgA FM generally does not support the following miscellaneous/routine governance items:
| • | Proposals asking companies to adopt full tenure holding periods for their executives |
| • | Reincorporation to a location that we believe has more negative attributes than its current location of incorporation |
| • | Shareholder proposals to change the date, time, and/or location of the annual meeting unless the current scheduling or location is unreasonable |
| • | Proposals to approve other business when it appears as voting item |
| • | Proposals giving the board exclusive authority to amend the bylaws |
| • | Proposals to reduce quorum requirements for shareholder meetings below a majority of the shares outstanding unless there are compelling reasons to support the proposal |
D-132
| VIII. | ENVIRONMENTAL AND SOCIAL ISSUES |
Proposals relating to social and environmental issues, typically initiated by shareholders, generally request that the company disclose or amend certain business practices. Where it appears there is a potential effect on shareholder or economic value of a company that is related to a specific environmental or social issue, SSgA FM evaluates the shareholder proposal addressing the issue on a case-by-case basis. Absent a compelling economic impact on shareholder value, SSgA FM will typically abstain from voting on these proposals.
Record Keeping
In accordance with applicable law, FM shall retain the following documents for not less than five years from the end of the year in which the proxies were voted, the first two years in FM’s office:
| 1) | FM’s Proxy Voting Policy and any additional procedures created pursuant to such Policy; |
| 2) | a copy of each proxy statement FM receives regarding securities held by its clients (note: this requirement may be satisfied by a third party who has agreed in writing to do so or by obtaining a copy of the proxy statement from the EDGAR database); |
| 3) | a record of each vote cast by FM (note: this requirement may be satisfied by a third party who has agreed in writing to do so); |
| 4) | a copy of any document created by FM that was material in making its voting decision or that memorializes the basis for such decision; and |
| 5) | a copy of each written request from a client, and response to the client, for information on how FM voted the client’s proxies. |
More Information
Any client who wishes to receive information on how its proxies were voted should contact its SSgA FM relationship manager.
D-133
T. ROWE PRICE ASSOCIATES, INC.
T. ROWE PRICE INTERNATIONAL LTD
T. ROWE PRICE (CANADA), INC
T. ROWE PRICE HONG KONG LIMITED
T. ROWE PRICE SINGAPORE PRIVATE LTD.
PROXY VOTING POLICIES AND PROCEDURES
RESPONSIBILITY TO VOTE PROXIES
T. Rowe Price Associates, Inc., T. Rowe Price International Ltd, T. Rowe Price (Canada), Inc., T. Rowe Price Hong Kong Limited, and T. Rowe Price Singapore Private Ltd. (“T. Rowe Price”) recognize and adhere to the principle that one of the privileges of owning stock in a company is the right to vote in the election of the company’s directors and on matters affecting certain important aspects of the company’s structure and operations that are submitted to shareholder vote. As an investment adviser with a fiduciary responsibility to its clients, T. Rowe Price analyzes the proxy statements of issuers whose stock is owned by the U.S.-registered investment companies which it sponsors and serves as investment adviser (“T. Rowe Price Funds”) and by common trust funds, offshore funds, institutional and private counsel clients who have requested that T. Rowe Price be involved in the proxy process. T. Rowe Price has assumed the responsibility for voting proxies on behalf of the T. Rowe Price Funds and certain counsel clients who have delegated such responsibility to T. Rowe Price. In addition, T. Rowe Price makes recommendations regarding proxy voting to counsel clients who have not delegated the voting responsibility but who have requested voting advice. T. Rowe Price reserves the right to decline to vote proxies in accordance with client-specific voting guidelines.
T. Rowe Price has adopted these Proxy Voting Policies and Procedures (“Policies and Procedures”) for the purpose of establishing formal policies and procedures for performing and documenting its fiduciary duty with regard to the voting of client proxies.
Fiduciary Considerations. It is the policy of T. Rowe Price that decisions with respect to proxy issues will be made in light of the anticipated impact of the issue on the desirability of investing in the portfolio company from the viewpoint of the particular client or Price Fund. Proxies are voted solely in the interests of the client, Price Fund shareholders or, where employee benefit plan assets are involved, in the interests of plan participants and beneficiaries. Our intent has always been to vote proxies, where possible to do so, in a manner consistent with our fiduciary obligations and responsibilities. Practicalities and costs involved with international investing may make it impossible at times, and at other times disadvantageous, to vote proxies in every instance.
Other Considerations. One of the primary factors T. Rowe Price considers when determining the desirability of investing in a particular company is the quality and depth of its management. We recognize that a company’s management is entrusted with the day-to-day operations of the company, as well as its long-term direction and strategic planning, subject to the oversight of the company’s board of directors. Accordingly, our proxy voting guidelines are not intended to substitute our judgment for management’s with respect to the company’s day-to-day operations. Rather, our voting guidelines are designed to promote accountability of a company’s management and board of directors to its shareholders; to align the interests of management with those of shareholders; and to encourage companies to adopt best practices in terms of their corporate governance. In addition to our voting guidelines, we rely on a company’s disclosures, its board’s recommendations, a company’s track record, country-specific best practices codes, our research providers and, most importantly, our investment professionals’ views, in making voting decisions.
D-134
ADMINISTRATION OF POLICIES AND PROCEDURES
Proxy Committee. T. Rowe Price’s Proxy Committee (“Proxy Committee”) is responsible for establishing positions with respect to corporate governance and other proxy issues, including those involving corporate social responsibility issues. Certain delegated members of the Proxy Committee also review questions and respond to inquiries from clients and mutual fund shareholders pertaining to proxy issues. While the Proxy Committee sets voting guidelines and serves as a resource for T. Rowe Price portfolio management, it does not have proxy voting authority for any Price Fund or counsel client. Rather, this responsibility is held by the Chairperson of the Fund’s Investment Advisory Committee or counsel client’s portfolio manager.
Global Proxy Services Group. The Global Proxy Services Group is responsible for administering the proxy voting process as set forth in the Policies and Procedures.
Proxy Administrator. The Global Proxy Services Group will assign a Proxy Administrator who will be responsible for ensuring that all meeting notices are reviewed and important proxy matters are communicated to the portfolio managers for consideration.
Global Corporate Governance Analyst. Our Global Corporate Governance Analyst is responsible for reviewing the proxy agendas for all upcoming meetings and making company-specific recommendations to our global industry analysts and portfolio managers with regard to the voting decisions in their portfolios.
HOW PROXIES ARE REVIEWED, PROCESSED AND VOTED
In order to facilitate the proxy voting process, T. Rowe Price has retained ISS as an expert in the proxy voting and corporate governance area. ISS specializes in providing a variety of fiduciary-level proxy advisory and voting services. These services include voting recommendations as well as vote execution, reporting, auditing and consulting assistance for the handling of proxy voting responsibility. In order to reflect T. Rowe Price’s issue-by-issue voting guidelines as approved each year by the Proxy Committee, ISS maintains and implements a custom voting policy for the Price Funds and other client accounts.
Meeting Notification
T. Rowe Price utilizes ISS’s voting agent services to notify us of upcoming shareholder meetings for portfolio companies held in client accounts and to transmit votes to the various custodian banks of our clients. ISS tracks and reconciles T. Rowe Price holdings against incoming proxy ballots. If ballots do not arrive on time, ISS procures them from the appropriate custodian or proxy distribution agent. Meeting and record date information is updated daily, and transmitted to T. Rowe Price through Proxy Exchange, ISS’s web-based application.
Vote Determination
Each day, ISS delivers into T. Rowe Price’s proprietary proxy research platform a comprehensive summary of upcoming meetings, proxy proposals, publications discussing key proxy voting issues, and custom vote recommendations to assist us with proxy research and processing. The final authority and responsibility for proxy voting decisions remains with T. Rowe Price. Decisions with respect to proxy matters are made primarily in light of the anticipated impact of the issue on the desirability of investing in the company from the perspective of our clients.
Portfolio managers may decide to vote their proxies consistent with T. Rowe Price’s policies as set by the Proxy Committee and instruct our Proxy Administrator to vote all proxies accordingly. Alternatively, portfolio managers may request to review the vote recommendations and sign off on all proxies before the votes are cast, or they may choose only to sign off on those votes cast against management. The portfolio managers are also given the option of reviewing and determining the votes on all proxies without utilizing the vote guidelines of the Proxy Committee. In all cases, the portfolio managers may
D-135
elect to receive current reports summarizing all proxy votes in their client accounts. Portfolio managers who vote their proxies inconsistent with T. Rowe Price guidelines are required to document the rationale for their votes. The Proxy Administrator is responsible for maintaining this documentation and assuring that it adequately reflects the basis for any vote which is cast contrary to T. Rowe Price guidelines.
T. Rowe Price Voting Policies
Specific voting guidelines have been adopted by the Proxy Committee for all regularly occurring categories of management and shareholder proposals. A detailed set of voting guidelines is available on the T. Rowe Price web site, www.troweprice.com. The following is a summary of our guidelines on the most significant proxy voting topics:
Election of Directors — For U.S. companies, T. Rowe Price generally supports slates with a majority of independent directors. However, T. Rowe Price may vote against outside directors who do not meet our criteria relating to their independence, particularly when they serve on key board committees, such as compensation and nominating committees, for which we believe that all directors should be independent. Outside the U.S., we expect companies to adhere to the minimum independence standard established by regional corporate governance codes. At a minimum, however, we believe boards in all regions should include a blend of executive and non-executive members, and we are likely to vote against senior executives at companies without any independent directors. We also vote against directors who are unable to dedicate sufficient time to their board duties due to their commitments to other boards. We may vote against certain directors who have served on company boards where we believe there has been a gross failure in governance or oversight. Additionally, we may vote against compensation committee members who approve excessive executive compensation or severance arrangements. We support efforts to elect all board members annually because boards with staggered terms lessen directors’ accountability to shareholders and act as deterrents to takeover proposals. To strengthen boards’ accountability, T. Rowe Price supports proposals calling for a majority vote threshold for the election of directors and we may withhold votes from an entire board if they fail to implement shareholder proposals that receive majority support.
Anti-takeover, Capital Structure and Corporate Governance Issues — T. Rowe Price generally opposes anti-takeover measures since they adversely impact shareholder rights and limit the ability of shareholders to act on potential value-enhancing transactions. Such anti-takeover mechanisms include classified boards, supermajority voting requirements, dual share classes, and poison pills. When voting on capital structure proposals, T. Rowe Price will consider the dilutive impact to shareholders and the effect on shareholder rights. We may support shareholder proposals that call for the separation of the Chairman and CEO positions if we determine that insufficient governance safeguards are in place at the company.
Executive Compensation Issues — T. Rowe Price’s goal is to assure that a company’s equity-based compensation plan is aligned with shareholders’ long-term interests. We evaluate plans on a case-by-case basis, using a proprietary, scorecard-based approach that employs a number of factors, including dilution to shareholders, problematic plan features, burn rate, and the equity compensation mix. Plans that are constructed to effectively and fairly align executives’ and shareholders’ incentives generally earn our approval. Conversely, we oppose compensation packages that provide what we view as excessive awards to few senior executives, contain the potential for excessive dilution relative to the company’s peers, or rely on an inappropriate mix of options and full-value awards. We also may oppose equity plans at any company where we deem the overall compensation practices to be problematic. We generally oppose efforts to reprice options in the event of a decline in value of the underlying stock unless such plans appropriately balance shareholder and employee interests. For companies with particularly egregious pay practices such as excessive severance packages, executives with outsized pledged/hedged stock positions, executive perks, and bonuses that are not adequately linked to performance, we may vote against compensation committee members. We analyze management proposals requesting ratification of a company’s executive compensation practices (“Say-on-Pay” proposals) on a case-by-case basis, using a proprietary scorecard-based approach that assesses the long-term linkage between executive compensation and company performance as well as the presence of objectionable structural features in
D-136
compensation plans. With respect to the frequency in which companies should seek advisory votes on compensation, we believe shareholders should be offered the opportunity to vote annually. Finally, we may withhold votes from compensation committee members or even the entire board if we have cast votes against a company’s “Say-on-Pay” vote in consecutive years.
Mergers and Acquisitions — T. Rowe Price considers takeover offers, mergers, and other extraordinary corporate transactions on a case-by-case basis to determine if they are beneficial to shareholders’ current and future earnings stream and to ensure that our Price Funds and clients are receiving fair consideration for their securities. We generally oppose proposals for the ratification of executive severance packages (“Say on Golden Parachute” proposals) in conjunction with merger transactions because we believe these arrangements are, by and large, unnecessary, and they reduce the alignment of executives’ incentives with shareholders’ interests.
Corporate Social Responsibility Issues — Vote recommendations for corporate responsibility issues are generated by the Global Corporate Governance Analyst using ISS’s proxy research and company reports. T. Rowe Price generally votes with a company’s management on social, environmental and corporate responsibility issues unless the issue has substantial investment implications for the company’s business or operations which have not been adequately addressed by management. T. Rowe Price supports well-targeted shareholder proposals on environmental and other public policy issues that are particularly relevant to a company’s businesses.
Global Portfolio Companies — ISS applies a two-tier approach to determining and applying global proxy voting policies. The first tier establishes baseline policy guidelines for the most fundamental issues, which span the corporate governance spectrum without regard to a company’s domicile. The second tier takes into account various idiosyncrasies of different countries, making allowances for standard market practices, as long as they do not violate the fundamental goals of good corporate governance. The goal is to enhance shareholder value through effective use of the shareholder franchise, recognizing that application of policies developed for U.S. corporate governance issues are not appropriate for all markets. The Proxy Committee has reviewed ISS’s general global policies and has developed international proxy voting guidelines which in most instances are consistent with ISS recommendations.
Index and Passively Managed Accounts — Proxy voting for index and other passively-managed portfolios is administered by the Proxy Services Group using T. Rowe Price’s policies as set by the Proxy Committee. If a portfolio company is held in both an actively managed account and an index account, the index account will default to the vote as determined by the actively managed proxy voting process.
Divided Votes — In situations where a decision is made which is contrary to the policies established by the Proxy Committee, or differs from the vote for any other client or T. Rowe Price Fund, the Proxy Services Group advises the portfolio managers involved of the divided vote. The persons representing opposing views may wish to confer to discuss their positions. In such instances, it is the normal practice for the portfolio manager to document the reasons for the vote if it is against T. Rowe Price policy. The Proxy Administrator is responsible for assuring that adequate documentation is maintained to reflect the basis for any vote which is cast in opposition to T. Rowe Price policy.
Shareblocking — Shareblocking is the practice in certain foreign countries of “freezing” shares for trading purposes in order to vote proxies relating to those shares. In markets where shareblocking applies, the custodian or sub-custodian automatically freezes shares prior to a shareholder meeting once a proxy has been voted. Shareblocking typically takes place between one and fifteen (15) days before the shareholder meeting, depending on the market. In markets where shareblocking applies, there is a potential for a pending trade to fail if trade settlement takes place during the blocking period. T. Rowe Price’s policy is generally to abstain from voting shares in shareblocking countries unless the matter has compelling economic consequences that outweigh the loss of liquidity in the blocked shares.
Securities on Loan — The T. Rowe Price Funds and our institutional clients may participate in securities lending programs to generate income. Generally, the voting rights pass with the securities on loan;
D-137
however, lending agreements give the lender the right to terminate the loan and pull back the loaned shares provided sufficient notice is given to the custodian bank in advance of the voting deadline. T. Rowe Price’s policy is generally not to vote securities on loan unless the portfolio manager has knowledge of a material voting event that could affect the value of the loaned securities. In this event, the portfolio manager has the discretion to instruct the Proxy Administrator to pull back the loaned securities in order to cast a vote at an upcoming shareholder meeting.
Monitoring and Resolving Conflicts of Interest
The Proxy Committee is also responsible for monitoring and resolving potential conflicts between the interests of T. Rowe Price and those of its clients with respect to proxy voting. We have adopted safeguards to ensure that our proxy voting is not influenced by interests other than those of our fund shareholders. While membership on the Proxy Committee is diverse, it does not include individuals whose primary duties relate to client relationship management, marketing, or sales. Since T. Rowe Price’s voting guidelines are pre-determined by the Proxy Committee, application of the guidelines by fund portfolio managers to vote fund proxies should in most instances adequately address any potential conflicts of interest. However, the Proxy Committee conducts a post-vote review of all proxy votes that are inconsistent with the guidelines to determine whether the portfolio manager’s voting rationale appears reasonable. The Proxy Committee also assesses whether any business or other material relationships between T. Rowe Price and a portfolio company (unrelated to the ownership of the portfolio company’s securities) could have influenced an inconsistent vote on that company’s proxy. Issues raising potential conflicts of interest are referred to designated members of the Proxy Committee for immediate resolution prior to the time T. Rowe Price casts its vote. With respect to personal conflicts of interest, T. Rowe Price’s Code of Ethics and Conduct requires all employees to avoid placing themselves in a “compromising position” in which their interests may conflict with those of our clients and restrict their ability to engage in certain outside business activities. Portfolio managers or Proxy Committee members with a personal conflict of interest regarding a particular proxy vote must recuse themselves and not participate in the voting decisions with respect to that proxy.
Specific Conflict of Interest Situations — Voting of T. Rowe Price Group, Inc. common stock (sym: TROW) by certain T. Rowe Price Index Funds will be done in all instances in accordance with T. Rowe Price policy, and votes inconsistent with policy will not be permitted. In addition, T. Rowe Price has voting authority for proxies of the holdings of certain T. Rowe Price funds that invest in other T. Rowe Price funds. In cases where the underlying fund of a T. Rowe Price fund-of-funds holds a proxy vote, T. Rowe Price will mirror vote the fund shares held by the fund-of-funds in the same proportion as the votes cast by the shareholders of the underlying funds.
REPORTING AND RECORD RETENTION
Vote Summary Reports will be generated for each client that requests T. Rowe Price to furnish proxy voting records. The report specifies the portfolio companies, meeting dates, proxy proposals, and votes which have been cast for the client during the period and the position taken with respect to each issue. Reports normally cover quarterly or annual periods and are provided to clients upon request.
T. Rowe Price retains proxy solicitation materials, memoranda regarding votes cast in opposition to the position of a company’s management, and documentation on shares voted differently. In addition, any document which is material to a proxy voting decision such as the T. Rowe Price voting guidelines, Proxy Committee meeting materials, and other internal research relating to voting decisions will be kept. All proxy voting materials and supporting documentation are retained for six years (except for proxy statements available on the SEC’s EDGAR database).
D-138
WELLINGTON MANAGEMENT COMPANY, LLP
GLOBAL PROXY POLICY AND PROCEDURES
Introduction | Wellington Management Company, LLP (“Wellington Management”) has adopted and implemented policies and procedures that it believes are reasonably designed to ensure that proxies are voted in the best economic interests of its clients around the world. |
| Wellington Management’s Proxy Voting Guidelines (the “Guidelines”), which are incorporated by reference to these Global Proxy Policy and Procedures, set forth the sets of guidelines that Wellington Management uses in voting specific proposals presented by the boards of directors or shareholders of companies whose securities are held in client portfolios for which Wellington Management has voting discretion. While the Guidelines set forth general sets of guidelines for voting proxies, it should be noted that these are guidelines and not rigid rules. Many of the Guidelines are accompanied by explanatory language that describes criteria that may affect our vote decision. The criteria as described are to be read as part of the guideline, and votes cast according to the criteria will be considered within guidelines. In some circumstances, the merits of a particular proposal may cause us to enter a vote that differs from the Guidelines. |
Statement of Policy | As a matter of policy, Wellington Management: |
| 1 | Takes responsibility for voting client proxies only upon a client’s written request. |
| 2 | Votes all proxies in the best interests of its clients as shareholders, i.e., to maximize economic value. |
| 3 | Develops and maintains broad guidelines setting out positions on common proxy issues, but also considers each proposal in the context of the issuer, industry, and country or countries in which its business is conducted. |
| 4 | Evaluates all factors it deems relevant when considering a vote, and may determine in certain instances that it is in the best interest of one or more clients to refrain from voting a given proxy ballot. |
| 5 | Identifies and resolves all material proxy-related conflicts of interest between the firm and its clients in the best interests of the client. |
| 6 | Believes that sound corporate governance practices can enhance shareholder value and therefore encourages consideration of an issuer’s corporate governance as part of the investment process. |
D-139
| 7 | Believes that proxy voting is a valuable tool that can be used to promote sound corporate governance to the ultimate benefit of the client as shareholder. |
| 8 | Provides all clients, upon request, with copies of these Global Proxy Policy and Procedures, the Guidelines, and related reports, with such frequency as required to fulfill obligations under applicable law or as reasonably requested by clients. |
| 9 | Reviews regularly the voting record to ensure that proxies are voted in accordance with these Global Proxy Policy and Procedures and the Guidelines; and ensures that procedures, documentation, and reports relating to the voting of proxies are promptly and properly prepared and disseminated. |
Responsibility and Oversight | Wellington Management has a Corporate Governance Committee, established by action of the firm’s Executive Committee, that is responsible for the review and approval of the firm’s written Global Proxy Policy and Procedures and the Guidelines, and for providing advice and guidance on specific proxy votes for individual issuers. The firm’s Legal and Compliance Group monitors regulatory requirements with respect to proxy voting on a global basis and works with the Corporate Governance Committee to develop policies that implement those requirements. Day-to-day administration of the proxy voting process at Wellington Management is the responsibility of the Global Research Services Group. In addition, the Global Research Services Group acts as a resource for portfolio managers and research analysts on proxy matters, as needed. |
Statement of Procedures | Wellington Management has in place certain procedures for implementing its proxy voting policy. |
General Proxy Voting | Authorization to Vote |
| Wellington Management will vote only those proxies for which its clients have affirmatively delegated proxy-voting authority. |
| Receipt of Proxy |
| Proxy materials from an issuer or its information agent are forwarded to registered owners of record, typically the client’s custodian bank. If a client requests that Wellington Management votes proxies on its behalf, the client must instruct its custodian bank to deliver all relevant voting material to Wellington Management or its voting agent. Wellington Management, or its voting agent, may receive this voting information by mail, fax, or other electronic means. |
| Reconciliation |
To the extent reasonably practicable, each public security proxy received by electronic means is matched to the securities eligible to be voted and a reminder is sent to any custodian or trustee that has not forwarded the proxies as due. Although proxies received for private securities, as well as those received in non-electronic format, are voted as received, Wellington |
D-140
Management is not able to reconcile these proxies to holdings, nor does it notify custodians of non-receipt. |
| Research |
| In addition to proprietary investment research undertaken by Wellington Management investment professionals, the firm conducts proxy research internally, and uses the resources of a number of external sources to keep abreast of developments in corporate governance around the world and of current practices of specific companies. |
| Proxy Voting |
| Following the reconciliation process, each proxy is compared against the Guidelines, and handled as follows: |
| • Generally, issues for which explicit proxy voting guidance is provided in the Guidelines (i.e., “For”, “Against”, “Abstain”) are reviewed by the Global Research Services Group and voted in accordance with the Guidelines. |
| • Issues identified as “case-by-case” in the Guidelines are further reviewed by the Global Research Services Group. In certain circumstances, further input is needed, so the issues are forwarded to the relevant research analyst and/or portfolio manager(s) for their input. |
| • Absent a material conflict of interest, the portfolio manager has the authority to decide the final vote. Different portfolio managers holding the same securities may arrive at different voting conclusions for their clients’ proxies. |
| Material Conflict of Interest Identification and Resolution Processes |
| Wellington Management’s broadly diversified client base and functional lines of responsibility serve to minimize the number of, but not prevent, material conflicts of interest it faces in voting proxies. Annually, the Corporate Governance Committee sets standards for identifying material conflicts based on client, vendor, and lender relationships, and publishes those standards to individuals involved in the proxy voting process. In addition, the Corporate Governance Committee encourages all personnel to contact the Global Research Services Group about apparent conflicts of interest, even if the apparent conflict does not meet the published materiality criteria. Apparent conflicts are reviewed by designated members of the Corporate Governance Committee to determine if there is a conflict, and if so whether the conflict is material. |
If a proxy is identified as presenting a material conflict of interest, the matter must be reviewed by designated members of the Corporate Governance Committee, who will resolve the conflict and direct the vote. In certain circumstances, the designated members may determine that the full Corporate Governance Committee should convene. Any Corporate |
D-141
Governance Committee member who is himself or herself subject to the identified conflict will not participate in the decision on whether and how to vote the proxy in question. |
Other Considerations | In certain instances, Wellington Management may be unable to vote or may determine not to vote a proxy on behalf of one or more clients. While not exhaustive, the following list of considerations highlights some potential instances in which a proxy vote might not be entered. |
| Securities Lending |
| Wellington Management may be unable to vote proxies when the underlying securities have been lent out pursuant to a client’s securities lending program. In general, Wellington Management does not know when securities have been lent out and are therefore unavailable to be voted. Efforts to recall loaned securities are not always effective, but, in rare circumstances, Wellington Management may recommend that a client attempt to have its custodian recall the security to permit voting of related proxies. |
| Share Blocking and Re-registration |
| Certain countries require shareholders to stop trading securities for a period of time prior to and/or after a shareholder meeting in that country (i.e., share blocking). When reviewing proxies in share blocking countries, Wellington Management evaluates each proposal in light of the trading restrictions imposed and determines whether a proxy issue is sufficiently important that Wellington Management would consider the possibility of blocking shares. The portfolio manager retains the final authority to determine whether to block the shares in the client’s portfolio or to pass on voting the meeting. |
| In certain countries, re-registration of shares is required to enter a proxy vote. As with share blocking, re-registration can prevent Wellington Management from exercising its investment discretion to sell shares held in a client’s portfolio for a substantial period of time. The decision process in blocking countries as discussed above is also employed in instances where re-registration is necessary. |
| Lack of Adequate Information, Untimely Receipt of Proxy Materials, or Excessive Costs |
| Wellington Management may be unable to enter an informed vote in certain circumstances due to the lack of information provided in the proxy statement or by the issuer or other resolution sponsor, and may abstain from voting in those instances. Proxy materials not delivered in a timely fashion may prevent analysis or entry of a vote by voting deadlines. In addition, Wellington Management’s practice is to abstain from voting a proxy in circumstances where, in its judgment, the costs exceed the expected benefits to clients. Requirements for Powers of Attorney and consularization are examples of such circumstances. |
D-142
Additional Information | Wellington Management maintains records of proxies voted pursuant to Section 204-2 of the Investment Advisers Act of 1940 (the “Advisers Act”), the Employee Retirement Income Security Act of 1974, as amended (“ERISA”), and other applicable laws. |
| Wellington Management’s Global Proxy Policy and Procedures may be amended from time to time by Wellington Management. Wellington Management provides clients with a copy of its Global Proxy Policy and Procedures, including the Guidelines, upon written request. In addition, Wellington Management will make specific client information relating to proxy voting available to a client upon reasonable written request. |
| Dated: July 8, 2009 |
WELLINGTON MANAGEMENT COMPANY, LLP
GLOBAL PROXY VOTING GUIDELINES
Introduction | Upon a client’s written request, Wellington Management Company, LLP (“Wellington Management”) votes securities that are held in the client’s account in response to proxies solicited by the issuers of such securities. Wellington Management established these Global Proxy Voting Guidelines to document positions generally taken on common proxy issues voted on behalf of clients. |
| These guidelines are based on Wellington Management’s fiduciary obligation to act in the best economic interest of its clients as shareholders. Hence, Wellington Management examines and votes each proposal so that the long-term effect of the vote will ultimately increase shareholder value for our clients. Because ethical considerations can have an impact on the long-term value of assets, our voting practices are also attentive to these issues and votes will be cast against unlawful and unethical activity. Further, Wellington Management’s experience in voting proposals has shown that similar proposals often have different consequences for different companies. Moreover, while these Global Proxy Voting Guidelines are written to apply globally, differences in local practice and law make universal application impractical. Therefore, each proposal is evaluated on its merits, taking into account its effects on the specific company in question, and on the company within its industry. It should be noted that the following are guidelines, and not rigid rules, and Wellington Management reserves the right in all cases to vote contrary to guidelines where doing so is judged to represent the best economic interest of its clients. |
| Following is a list of common proposals and the guidelines on how Wellington Management anticipates voting on these proposals. The “(SP)” after a proposal indicates that the proposal is usually presented as a Shareholder Proposal. |
D-143
| Voting Guidelines | Composition and Role of the Board of Directors | |||
• Election of Directors: We believe that shareholders’ ability to elect directors annually is the most important right shareholders have. We generally support management nominees, but will withhold votes from any director who is demonstrated to have acted contrary to the best economic interest of shareholders. We may also withhold votes from directors who failed to implement shareholder proposals that received majority support, implemented dead-hand or no-hand poison pills, or failed to attend at least 75% of scheduled board meetings. | Case-by-Case | |||
• Classify Board of Directors: We will also vote in favor of shareholder proposals seeking to declassify boards. | Against | |||
• Adopt Director Tenure/Retirement Age (SP): | Against | |||
• Adopt Director & Officer Indemnification: We generally support director and officer indemnification as critical to the attraction and retention of qualified candidates to the board. Such proposals must incorporate the duty of care. | For | |||
• Allow Special Interest Representation to Board (SP): | Against | |||
• Require Board Independence: We believe that, in the absence of a compelling counter-argument or prevailing market norms, at least 65% of a board should be comprised of independent directors, with independence defined by the local market regulatory authority. Our support for this level of independence may include withholding approval for non-independent directors, as well as votes in support of shareholder proposals calling for independence. | For | |||
• Require Key Board Committees to be Independent. Key board committees are the Nominating, Audit, and Compensation Committees. Exceptions will be made, as above, in respect of local market conventions. | For | |||
• Require a Separation of Chair and CEO or Require a Lead Director (SP): We will generally support management proposals to separate the Chair and CEO or establish a Lead Director. | Case-by-Case | |||
• Approve Directors’ Fees: | For | |||
• Approve Bonuses for Retiring Directors: | Case-by-Case | |||
• Elect Supervisory Board/Corporate Assembly: | For | |||
• Elect/Establish Board Committee: | For | |||
D-144
• Adopt Shareholder Access/Majority Vote on Election of Directors (SP): We believe that the election of directors by a majority of votes cast is the appropriate standard for companies to adopt and therefore generally will support those proposals that seek to adopt such a standard. Our support for such proposals will extend typically to situations where the relevant company has an existing resignation policy in place for directors that receive a majority of “withhold” votes. We believe that it is important for majority voting to be defined within the company’s charter and not simply within the company’s corporate governance policy. | Case-by-Case | |||
Generally we will not support proposals that fail to provide for the exceptional use of a plurality standard in the case of contested elections. Further, we will not support proposals that seek to adopt a majority of votes outstanding (i.e., total votes eligible to be cast as opposed to actually cast) standard. | ||||
| ||||
| Management Compensation | ||||
• Adopt/Amend Stock Option Plans: | Case-by-Case | |||
• Adopt/Amend Employee Stock Purchase Plans: | For | |||
• Approve/Amend Bonus Plans: | Case-by-Case | |||
In the US, Bonus Plans are customarily presented for shareholder approval pursuant to Section 162(m) of the Omnibus Budget Reconciliation Act of 1992 (“OBRA”). OBRA stipulates that certain forms of compensation are not tax-deductible unless approved by shareholders and subject to performance criteria. Because OBRA does not prevent the payment of subject compensation, we generally vote “for” these proposals. Nevertheless, occasionally these proposals are presented in a bundled form seeking 162(m) approval and approval of a stock option plan. In such cases, failure of the proposal prevents the awards from being granted. We will vote against these proposals where the grant portion of the proposal fails our guidelines for the evaluation of stock option plans. | ||||
• Approve Remuneration Policy: | Case-by-Case | |||
• To approve compensation packages for named executive Officers: | Case-by-Case | |||
• To determine whether the compensation vote will occur every 1, 2 or 3 years: | 1 Year | |||
• Exchange Underwater Options: We may support value-neutral exchanges in which senior management is ineligible to participate. | Case-by-Case | |||
• Eliminate or Limit Severance Agreements (Golden Parachutes): We will oppose excessively generous arrangements, but may support agreements structured to encourage management to negotiate in shareholders’ best economic interest. | Case-by-Case | |||
D-145
• To approve golden parachute arrangements in connection with certain corporate transactions: | Case-by-Case | |||
• Shareholder Approval of Future Severance Agreements Covering Senior Executives (SP): We believe that severance arrangements require special scrutiny, and are generally supportive of proposals that call for shareholder ratification thereof. But, we are also mindful of the board’s need for flexibility in recruitment and retention and will therefore oppose limitations on board compensation policy where respect for industry practice and reasonable overall levels of compensation have been demonstrated. | Case-by-Case | |||
• Expense Future Stock Options (SP): | For | |||
• Shareholder Approval of All Stock Option Plans (SP): | For | |||
• Disclose All Executive Compensation (SP): | For | |||
| ||||
| Reporting of Results | ||||
• Approve Financial Statements: | For | |||
• Set Dividends and Allocate Profits: | For | |||
• Limit Non-Audit Services Provided by Auditors (SP): | Case-by-Case | |||
We follow the guidelines established by the Public Company Accounting Oversight Board regarding permissible levels of non-audit fees payable to auditors. | ||||
• Ratify Selection of Auditors and Set Their Fees: We will generally support management’s choice of auditors, unless the auditors have demonstrated failure to act in shareholders’ best economic interest. | Case-by-Case | |||
• Elect Statutory Auditors: | Case-by-Case | |||
• Shareholder Approval of Auditors (SP): | For | |||
| ||||
| Shareholder Voting Rights | ||||
• Adopt Cumulative Voting (SP): | Against | |||
We are likely to support cumulative voting proposals at “controlled” companies (i.e., companies with a single majority shareholder), or at companies with two-tiered voting rights. | ||||
• Shareholder Rights Plans | Case-by-Case | |||
Also known as Poison Pills, these plans can enable boards of directors to negotiate higher takeover prices on behalf of shareholders. However, these plans also may be misused to entrench management. The following criteria are used to evaluate both management and shareholder proposals regarding shareholder rights plans. | ||||
D-146
– We generally support plans that include: | ||||
– Shareholder approval requirement | ||||
– Sunset provision | ||||
– Permitted bid feature (i.e., bids that are made for all shares and demonstrate evidence of financing must be submitted to a shareholder vote). | ||||
Because boards generally have the authority to adopt shareholder rights plans without shareholder approval, we are equally vigilant in our assessment of requests for authorization of blank check preferred shares (see below). | ||||
• Authorize Blank Check Preferred Stock: We may support authorization requests that specifically proscribe the use of such shares for anti-takeover purposes. | Case-by-Case | |||
• Eliminate Right to Call a Special Meeting: | Against | |||
• Establish Right to Call a Special Meeting or Lower Ownership Threshold to Call a Special Meeting (SP): | Case-by-Case | |||
• Increase Supermajority Vote Requirement: We likely will support shareholder and management proposals to remove existing supermajority vote requirements. | Against | |||
• Adopt Anti-Greenmail Provision: | For | |||
• Adopt Confidential Voting (SP): We require such proposals to include a provision to suspend confidential voting during contested elections so that management is not subject to constraints that do not apply to dissidents. | Case-by-Case | |||
• Remove Right to Act by Written Consent: | Against | |||
| ||||
| Capital Structure | ||||
• Increase Authorized Common Stock: We generally support requests for increases up to 100% of the shares currently authorized. Exceptions will be made when the company has clearly articulated a reasonable need for a greater increase. Conversely, at companies trading in less liquid markets, we may impose a lower threshold. | Case-by-Case | |||
• Approve Merger or Acquisition: | Case-by-Case | |||
• Approve Technical Amendments to Charter: | Case-by-Case | |||
• Opt Out of State Takeover Statutes: | For | |||
• Authorize Share Repurchase: | For | |||
• Authorize Trade in Company Stock: | For | |||
• Approve Stock Splits: We approve stock splits and reverse stock splits that preserve the level of authorized, but unissued shares. | Case-by-Case | |||
D-147
• Approve Recapitalization/Restructuring: | Case-by-Case | |||
• Issue Stock with or without Preemptive Rights: | Case-by-Case | |||
• Issue Debt Instruments: | Case-by-Case | |||
| ||||
| Environmental and Social Issues | ||||
| We expect portfolio companies to comply with applicable laws and regulations with regards to environmental and social standards. We evaluate shareholder proposals related to environmental and social issues on a case-by-case basis. | ||||
• Disclose Political and PAC Gifts (SP): | Case-by-Case | |||
• Report on Sustainability (SP): | Case-by-Case | |||
| ||||
| Miscellaneous | ||||
• Approve Other Business: | Against | |||
• Approve Reincorporation: | Case-by-Case | |||
• Approve Third-Party Transactions: | Case-by-Case | |||
| Dated: March 8, 2012 | ||||
D-148
Westfield Capital Management Company, L.P.
Proxy Voting Policy
Revised March 2012
Introduction
Westfield Capital Management Company, L.P. (“Westfield”) will offer to vote proxies for all client accounts. Westfield believes that the voting of proxies can be an important tool for investors to promote best practices in corporate governance and we seek to vote all proxies in the best interests of our clients as investors. We also recognize that the voting of proxies with respect to securities held in managed accounts is an investment responsibility having economic value.
In accordance with Rule 206(4)-6 under the Investment Advisers Act of 1940 (the “Act”), Westfield has adopted and implemented policies and procedures that we believe are reasonably designed to ensure that proxies are voted in the best interest of our clients. Our authority to vote proxies for our clients is established by the investment advisory contract with each client or comparable documents. Clients can contact their Marketing representative or our Compliance Department (wcmcompliance@wcmgmt.com) for a report of how their account’s securities were voted if Westfield has voting authority.
Oversight of Proxy Voting Function
Westfield’s proxy voting function is managed by the firm’s Compliance team. Westfield has engaged a third party service provider, Institutional Shareholder Services, Inc. (the “vendor”), to assist with the proxy voting function. Westfield’s Compliance Associate (the “Associate”), is responsible for handling the day-to-day items that may arise from voting proxy ballots. These items include, but are not limited to:
| 1. | overseeing the vendor; this includes performing periodic audits of the proxy votes and the vendor’s reconciliation efforts, as well as tracking missing ballots; |
| 2. | ensuring required proxy records are retained according to applicable rules and regulations and internal policy; |
| 3. | preparing and distributing proxy reports for internal and external requests; |
| 4. | reviewing proxy policy and voting guidelines at least annually; |
| 5. | identifying and reporting any conflicts of interest to the other members of the Compliance team and if necessary to the Operating and Risk Management Committee; and |
| 6. | conducting vendor due diligence annually. |
Proxy Voting Guidelines
Westfield will utilize the ISS Proxy Voting Guidelines. We believe these guidelines have been developed in the best interest of shareholders. Therefore, Westfield will typically not accept client direction on proxy votes, nor will we notify clients of material proxy proposals prior to voting. Clients, however, may contact Westfield to inquire how a particular proposal will be voted.
Clients who have designated proxy voting authority to Westfield may choose to vote in accordance with the vendor’s standard guidelines (Exhibit A), the vendor’s Taft-Hartley guidelines which are in full conformity with the AFL-CIO Proxy Voting Guidelines (Exhibit B), or the vendor’s Socially Responsible Guidelines (Exhibit C). Clients who do not designate a specific set of voting guidelines will be assigned the standard guidelines (Exhibit A).
D-149
As a general policy, information on Westfield’s proxy voting decisions or status of votes will not be communicated or distributed to external solicitors. On occasion, Westfield may provide such information to solicitors if we believe a response will benefit our clients or a response is requested from the Westfield security analyst.
Proxy Voting Process
The vendor tracks proxy meetings and reconciles proxy ballots received for each meeting. Westfield will use our best efforts in obtaining any missing ballots; however, we vote only those proxy ballots our vendor has received. For any missing ballots, the vendor will contact custodians to locate such missing ballots. Since there can be many factors affecting proxy ballot retrieval, it is possible that Westfield will not receive a ballot in time to place a vote. Clients who participate in securities lending programs should be aware that Westfield will not call back any shares on loan for proxy voting purposes.
For each meeting, the vendor reviews the agenda and applies a vote recommendation for each proposal based on the written guidelines assigned to the applicable accounts. The Associate monitors this process and conducts periodic reviews of the vendor to ensure votes are cast in-line with the established guidelines.
Westfield will vote all proxies in accordance with the guidelines, with the following exceptions:
| 1. | Provided that Westfield is a current holder, all contentious issues, especially special meeting agendas or contested meetings will be referred to the Westfield security analyst or portfolio manager who covers the security (the “analyst” or “manager”). Similarly, if Westfield is a current holder and is among the Top 10 shareholders (based on the vendor’s published research papers), the Associate will confirm the recommended votes with the analyst or manager. If an override to the guidelines is proposed, the analyst or manager will provide rationale on such decision. If the security is sold to zero before the date of the meeting, votes will be cast in accordance with the client’s selected policy. |
| 2. | At any time, if an analyst or manager believes that following the guidelines in any specific case would not be in the clients’ best interests, he/she may request to override the guidelines. The request must be in writing and shall include an explanation of the rationale for doing so. |
Westfield will not override any of the voting positions in either the Taft-Hartley/AFL-CIO Guidelines or Socially Responsible Investing Guidelines (“SRI”); thus, the preceding exceptions will not apply to voting guidelines set forth in the Taft-Hartley/AFL-CIO or SRI policies.
Conflicts of Interest
Working with Westfield’s Operating & Risk Management Committee, the Compliance team is responsible for monitoring the potential conflicts of interest that could arise when voting proxy ballots on behalf of our clients. Since our business is solely focused on providing investment advisory services, it is unlikely that a conflict will arise in connection with proxy voting. Additionally, per Westfield’s Code of Ethics, all employees are required to avoid situations where potential conflicts may exist. However, Westfield has put in place certain reviews to ensure proxies are voted solely on the investment merits of the proposal. To help us identify potential conflicts, Westfield will review many factors, including whether the issuer is a client or a vendor with a material relationship with Westfield. If an actual conflict of interest is identified, it is reviewed by the Compliance team. If Compliance determines that the conflict is material in nature, the conflict may be addressed with the Operating & Risk Management Committee and the analyst or portfolio manager. Rationale for the resolution is documented, typically via email.
D-150
Proxy Reports
Westfield can provide account specific proxy reports to clients upon request or at scheduled time periods (e.g., quarterly). Client reporting requirements typically are established during the initial account set-up. The reports will contain at least the following information:
| • | company name |
| • | meeting agenda |
| • | how the account voted on each agenda item |
| • | whether the account vote was in-line or against management recommendation |
| • | rationale for any votes against the established guidelines (rationale is not always provided for votes that are in-line with guidelines since these are set forth in the written guidelines) |
Recordkeeping
In accordance with Rule 204-2 of the Investment Advisers Act of 1940, proxy voting records will be maintained for at least five years. The following records will be retained by Westfield or the proxy vendor:
| 1. | a copy of the Proxy Voting Polices and Guidelines and amendments that were in effect for the past five years; |
| 2. | electronic or paper copies of each proxy statement received by Westfield or the vendor with respect to securities in client accounts (Westfield may also rely on obtaining copies of proxy statements from the SEC’s Electronic Data Gathering, Analysis, and Retrieval (EDGAR) system); |
| 3. | records of each vote cast for each client; |
| 4. | documents created by Westfield that were material to making a decision on how to vote proxies or memorializes the basis for such decision (basis for decisions voted in line with policy is provided in the written guidelines); |
| 5. | written reports to clients on proxy voting and all client requests for information and Westfield’s response; |
| 6. | disclosure documentation to clients on how they may obtain information on how we voted their securities. |
D-151
[TO BE UPDATED BY AMENDMENT]
EQ ADVISORS TRUST
CONTROL PERSONS AND PRINCIPAL HOLDERS OF SECURITIES
AXA Equitable may be deemed to be a control person with respect to the Trust by virtue of its ownership of more than 95% of the Trust’s shares as of March [ ], 2014. Shareholders owning more than 25% of the outstanding shares of a Portfolio may be able to determine the outcome of most issues that are submitted to shareholders for a vote.
As a “series” type of mutual fund, the Trust issues separate series of shares of beneficial interest with respect to each Portfolio. Each Portfolio resembles a separate fund issuing separate classes of stock. Because of current federal securities law requirements, the Trust expects that its shareholders will offer Contract owners the opportunity to instruct shareholders as to how shares allocable to Contracts will be voted with respect to certain matters, such as approval of investment advisory agreements.
To the Trust’s knowledge, as of March [ ], 2014 the following persons owned Contracts entitling such persons to give voting instructions regarding more than 25% of the outstanding shares of any Portfolio:
Portfolio | Contract Owner | Shares Beneficially Owned | Percentage of Ownership |
To the Trust’s knowledge, as of March [ ], 2014, the following persons owned Contracts entitling such persons to give voting instructions regarding 5% or more of the outstanding shares of any class of any Portfolio.
Portfolio | Contract Owner | Shares Beneficially Owned | Percentage of Ownership |
E-1
AXA Premier VIP Trust
Annual Report
December 31, 2013
AXA Premier VIP Trust Annual Report
December 31, 2013
| 4 | ||
Portfolios | ||
Multimanager Portfolios | ||
| 6 | ||
| 27 | ||
| 64 | ||
| 84 | ||
| 100 | ||
| 118 | ||
| 143 | ||
| 171 | ||
| 184 | ||
| 203 | ||
| 204 | ||
| 205 | ||
| 210 | ||
Overview
2013 Market Overview
Economy
The employment picture in the U.S. continued to brighten in 2013. Three of the final four months of the year showed non-farm payroll gains of more than 200,000, and the unemployment rate dropped to 7.0%, a rate last seen in 2008. Housing continued to show a meaningful recovery in most markets and the automobile sector showed its best year since 2007. Nonetheless, the economy showed some worrisome trends, namely the increasing dependence of retailers on major markdowns in order to move merchandise, and the fact that much of the upward revision to the fourth quarter’s GDP report was tied to inventory growth, rather than to legitimate consumer demand.
At its final meeting of 2013, the Federal Reserve decided to begin to reduce the $85 billion per month it had been buying in longer-term Treasury and mortgage securities. While this move was long expected, it was the first sign that the Fed itself felt confident enough in the strength of the economy to begin unwinding its unprecedented easing posture.
Fixed Income
In the first half of the year, Japan flooded the global financial markets with liquidity, which served to buoy all assets, including the very expensive risk-free rates in the beginning of the year. In the spring, interest rates rose sharply when markets reacted to the announcement that Fed might consider tapering its quantitative easing program in the fourth quarter. The uncertainty and resulting volatility also had an impact on credit markets, which witnessed spread widening across all sectors including corporate credit and structured products.
By mid-year, two events led to an uptick in risk sentiment within fixed-income markets. Larry Summers withdrew from the race for the Chairmanship of the Federal Reserve, and the Fed surprised markets by deciding to refrain from tapering its quantitative easing program due to a perceived tightening of financial conditions. However, volatility returned to the markets towards the end of September due to the U.S. government shut down and prolonged political wrangling over the debt ceiling issue.
At the end of the year, U.S. Treasury rates generally rose across the yield curve. In light of stronger U.S. economic data, consistent labor market improvement, and reduced political risk, the Fed announced that it would slow the pace of purchases beginning in January 2014 by $10bn per month, split evenly between agency mortgage-backed securities and Treasuries.
US Equity
In 2013, U.S. equities, as represented by the S&P 500 Index, posted an impressive gain of 32.4% for the year, as the world’s largest central banks continued stimulus measures and corporate profits benefited from slow-but-positive economic growth. Mid-cap U.S. equities, as represented by the S&P MidCap 400 Index, posted an impressive gain of 33.5% in 2013, as mid-cap company profits benefited from the growth environment. Small companies benefited even more, as the Russell 2000® Index of U.S. small-cap stocks gained 38.8% for the year.
The U.S. equity markets began 2013 with a powerful relief rally after the United States averted the worst of its potential fiscal crisis with a last-minute tax deal. Moving into spring, the ascent of equities persevered as increased global liquidity kept interest rates low and investors turned to riskier asset classes in search of yield. As the year progressed, the direction of stock markets became increasingly dominated by speculation around the future of monetary policy. Sluggish U.S. growth, ironically, was often conducive to positive stock market performance as weak economic data reinforced investors’ expectations that the U.S. Federal Reserve would maintain its accommodative stance. Additionally, the U.S. recovery was strong enough to support corporate revenues while nearly stagnant wage growth kept costs low.
The waning months of the year brought another sharp rally as the Fed defied market expectations with its September decision to delay tapering its asset purchases. Turmoil in Egypt and Syria subsided and the re-election of Angela Merkel as Chancellor of Germany was welcomed as a continuation of the status quo. As economic indicators improved later in the fall, investors grappled with rising uncertainty around the timing of the anticipated Fed taper, ultimately commencing in mid-December. Investors reacted positively to this policy move as it signaled the Fed’s perception of real improvement in U.S. growth. Sentiment was also buoyed by the extension of the Fed’s expected time horizon for maintaining low short-term interest rates.
International Equity
International equities, as represented by the MSCI EAFE Index, posted an impressive gain of 22.8% (in US dollar terms) for the 12-month period ended December 31, 2013 as the world’s largest central banks continued to shore up their economies with stimulus measures.
Building on a year of gains that followed roughly in step with the U.S. stock market, world equity markets closed the year on a strong note, fuelled by signs that the global economy continued to improve, but at a pace sufficiently modest to allow most major central banks to maintain accommodative policies. With conditions in the periphery having stabilized and Germany continuing to motor along, the Eurozone emerged from recession. However, the fragile recovery, combined with a lack of inflationary pressures, prompted a surprise rate cut by the European Central Bank. The Bank of England kept interest rates and its asset purchase target unchanged despite the U.K. having racked up three straight quarters of gross domestic product (GDP) growth. Japan appears to be responding, at least partially, to policymakers’ attempts to reflate the economy. Economic growth has slowed in recent months, but remains positive. The Bank of Japan’s asset purchase program continued to put pressure on the yen, helping boost the profitability of export-oriented corporations even as year-over-year consumer price index readings rose to their highest levels since 2008.
2
In contrast to strength exhibited in developed markets, emerging market equities generally posted weak returns. In particular, countries with high deficits have been hurt by the U.S. Federal Reserve’s steps to begin to unwind its monetary stimulus and the potential for higher interest rates. For the 12-month period, the MSCI Emerging Markets GR Index sagged -2.3%
Source: AXA Equitable Funds Management Group, LLC. As of 12/31/2013.
This information is provided for general information only and is not intended to provide specific advice or recommendations for any individual investor. The S&P 500 Index is a widely recognized index that is considered representative of the performance of the large-cap sector of the U.S. stock market. The S&P MidCap 400 Index is a widely recognized index that is considered representative of the performance of the mid-cap sector of the U.S. stock market. The Russell 2000® Index measures the performance of the small-cap segment of the U.S. equity universe. The MSCI EAFE Index measures equity performance in foreign developed markets. The MSCI Emerging Markets Index measures equity performance in global emerging market countries.
PAST PERFORMANCE IS NO GUARANTEE OF FUTURE RESULTS. No investment is risk-free. International securities carry additional risks including currency exchange fluctuation and different government regulations, economic conditions or accounting standards. Smaller company stocks involve a greater risk than is customarily associated with more established companies. Bond investments are subject to interest rate risk so that when interest rates rise, the prices of bonds can decrease and the investor can lose principal value. High yield bonds are subject to a high degree of credit and market risk. Index performance is shown for illustrative purposes only. You cannot invest directly in an index.
AXA Equitable Life Insurance Company (New York, NY). Distributors: AXA Distributors, LLC.
AXA Equitable Funds Management Group, LLC is a wholly owned subsidiary of AXA Equitable Life Insurance Company.
AXA Equitable Life Insurance Company, AXA Advisors and AXA Distributors are affiliated companies.
GE 91457 (2/14) (Exp. 2/16)
3
Total Returns
Performance of the AXA Premier VIP Trust Portfolios as shown on the following pages compares each Portfolio’s performance to that of a broad-based securities index or indices. Each of the Portfolio’s annualized rates of return is net of investment management fees and expenses of the Portfolio. Rates of return are not representative of the actual return you would receive under your variable life insurance policy or annuity contract. No policyholder or contractholder can invest directly in the AXA Premier VIP Trust Portfolios. Changes in policy values depend not only on the investment performance of the AXA Premier VIP Trust Portfolios, but also on the insurance and administrative charges, applicable sales charges, and the mortality and expense risk charge applicable under a policy. These policy charges effectively reduce the dollar amount of any net gains and increase the dollar amount of any net losses.
Each of the AXA Premier VIP Trust Portfolios has a separate investment objective it seeks to achieve by following a separate investment policy. There is no guarantee that these objectives will be attained. The objectives and policies of each Portfolio will affect its return and its risk. Keep in mind that past performance is not an indication of future results.
Growth of $10,000 Investment
The charts shown on the following pages illustrate the total value of an assumed investment in Class A, Class B and/or Class K shares of each Portfolio of the AXA Premier VIP Trust. The periods illustrated are from the inception dates shown, or for a ten year period if the inception date is prior to December 31, 2003, through December 31, 2013. These results assume reinvestment of dividends and capital gains. The total value shown for each Portfolio reflects management fees and operating expenses of the Portfolios and 12b-1 fees which are applicable to Class B shares. Effective January 1, 2012, 12b-1 fees are applicable to Class A shares. 12b-1 fees are not applicable to Class K shares. The results have not been adjusted for insurance-related charges and expenses associated with life insurance policies or annuity contracts, which would lower the total values shown. Results should not be considered representative of future gains or losses.
The Benchmarks
Broad-based securities indices are unmanaged and are not subject to fees and expenses typically associated with actively-managed funds. An investment cannot be made directly in a broad-based securities index. Comparisons with these benchmarks, therefore, are of limited use. They are included because they are widely known and may help you to understand the universe of securities from which each Portfolio is likely to select its holdings.
Barclays Intermediate U.S. Government/Credit Index
An unmanaged, market value weighted index composed of over 3,500 publicly issued corporate and U.S. government debt securities rated investment grade with maturities of 1-10 years and at least $250 million par outstanding.
DJ EuroSTOXX 50 Index (“EuroSTOXX 50”)
The EuroSTOXX 50 Index is designed to represent the performance of some of the largest companies across all components of the 18 EURO STOXX Supersector Indexes. The EURO STOXX TMI Supersector Indexes represent the Eurozone portion of the EURO STOXX Total Market Index. The index covers approximately 95% of the freefloat market capitalization of the investable universe in the Eurozone. Index composition is reviewed annually and weights are reviewed quarterly.
The 50 companies in the index are selected by first identifying the companies that equal approximately 60% of the free-float market capitalization of each corresponding EURO STOXX TMI Supersector Index. In addition, any stocks that are currently components of the index are added to the list. From that list, the 40 largest stocks are selected to be components of the index. In addition, any stocks that are current components of the Index (and ranked 41-60 on the list) are included as components.
FTSE 100 Index (“FTSE” 100”)
The FTSE 100 Index is a market-capitalization weighted index representing the performance of the 100 largest UK-domiciled blue chip companies, which pass screening for size and liquidity. As of August 31, 2010, the FTSE 100 Index represents approximately 81% of the UK’s market capitalization.
Morgan Stanley Capital International (MSCI) EAFE Index
An unmanaged index considered representative of the market structure of the developed equity markets in Europe, Australasia and the Far East.
Russell 1000® Index
An unmanaged index of common stocks that measures the performance of the 1,000 largest companies in the Russell 3000® Index, representing approximately 92% of the total market capitalization of the Russell 3000® Index.
Russell 1000® Value Index
An unmanaged index which contains those Russell 1000 securities (1,000 largest securities in the Russell 3000® Index) with a less-than average growth orientation. It represents the universe of stocks from which value managers typically select. Securities in this index tend to exhibit lower price-to-book and price-to-earnings ratios, higher dividend yields and lower forecasted growth values than the growth universe.
Russell 2500™ Growth Index
An unmanaged index which contains those Russell 2500 securities (the bottom 500 securities in the Russell 1000® Index and all 2,000 securities in the Russell 2000® Index) with a greater-than-average growth orientation. Securities in this index tend to exhibit higher price-to-book and price-earnings ratios, lower dividend yields and higher forecasted growth values than the value universe.
Russell 2500™ Value Index
An unmanaged index which contains those Russell 2500 securities (the bottom 500 securities in the Russell 1000® Index and all 2,000 securities in the Russell 2000® Index) with a less-than-average growth orientation. Securities in this index tend to exhibit lower price-to-book and price-earnings ratios, higher dividend yields and lower forecasted growth values than the growth universe.
Russell 3000® Growth Index
An unmanaged index that measures the performance of those companies in the Russell 3000® Index with higher price-to-book ratios and higher forecasted growth values.
Standard & Poor’s (S&P) 500 Index
An unmanaged index which contains 500 of the largest U.S. industrial, transportation, utility and financial companies deemed by Standard and Poor’s to be representative of the larger capitalization portion of the U.S. stock market.
S&P/ASX 200 Index (“S&P/ASX 200”)
The Standard & Poor’s Australian Security Exchange 200 (a.k.a. S&P/ASX 200 Index) is recognized as the primary investable benchmark in Australia. The index represents the 200 largest and most liquid publicly listed companies in Australia and represents approximately 78% of Australian equity market capitalization.
S&P North America Technology Sector Index
A modified capitalization-weighted index composed of companies in the technology industry in North America. S&P 500 Index based on its observed historic volatility.
4
NOTES ON PERFORMANCE
TOPIX Index (“TOPIX”)
The TOPIX, also known as the Tokyo Price Index, is a capitalization weighted index of all companies listed on the First Section of the Tokyo Stock Exchange.
Volatility Managed Index — International (“VMI — Intl”)
An index that utilizes the MSCI EAFE Index methodology with an overlying formulaic adjustment that dynamically modifies the equity exposure to the MSCI EAFE Index based on its observed historic volatility.
Volatility Managed Index — International Proxy (“VMI —International Proxy”)
An index that utilizes a blend of 40% DJ Euro Stoxx 50, 25% FTSE 100, 25% TOPIX, and 10% S&P/ASX 200 (“International Proxy”) with an overlying formulaic adjustment that dynamically modifies the equity exposure to the International Proxy based on its observed historic volatility.
Volatility Managed Index — Large Cap Core (“VMI — LCC”)
An index that utilizes the S&P 500 Index methodology with an overlying formulaic adjustment that dynamically modifies the equity exposure to the S&P 500 Index based on its observed historic volatility.
Volatility Managed Index — Large Cap Growth 3000 (“VMI — LCG 3000”)
An index that utilizes a blend of the S&P 500 Index and the Russell 3000® Growth Index methodologies with an overlying formulaic adjustment that dynamically modifies the S&P 500 Index equity exposure of the index based on observed historic volatility.
Volatility Managed Index — Large Cap Value (“VMI — LCV”)
An index that utilizes a blend of the S&P 500 Index and the Russell 1000® Value Index methodologies with an overlying formulaic adjustment that dynamically modifies the S&P 500 Index equity exposure of the index based on observed historic volatility.
Volatility Managed Index — Mid Cap Growth 2500 (“VMI — MCG 2500”)
An index that utilizes a blend of the S&P MidCap 400 Index and the Russell 2500® Growth Index methodologies with an overlying formulaic adjustment that dynamically modifies the S&P MidCap 400 Index equity exposure of the index based on observed historic volatility.
Volatility Managed Index — Mid Cap Value 2500 (“VMI — MCV 2500”)
An index that utilizes a blend of the S&P MidCap 400 Index and the Russell 2500® Value Index methodologies with an overlying formulaic adjustment that dynamically modifies the S&P MidCap 400 Index equity exposure of the index based on observed historic volatility.
5
MULTIMANAGER AGGRESSIVE EQUITY PORTFOLIO (Unaudited)
PORTFOLIO ADVISERS
| Ø | AllianceBernstein L.P. |
| Ø | ClearBridge Investments, LLC |
| Ø | Scotia Institutional Asset Management US, Ltd. |
| Ø | Marsico Capital Management, LLC |
| Ø | T. Rowe Price Associates, Inc. |
| Ø | Westfield Capital Management Company, L.P. |
PERFORMANCE RESULTS
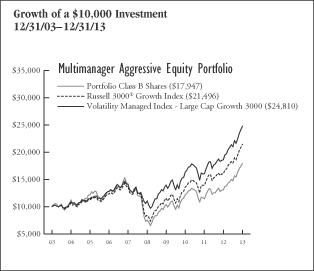
| Annualized Total Returns as of 12/31/13 | ||||||||||||
| 1 | 5 | 10 Years/ Since | ||||||||||
| Year | Years | Incept. | ||||||||||
Portfolio – Class A Shares* | 37.21 | % | 19.02 | % | 6.24 | % | ||||||
Portfolio – Class B Shares** | 37.14 | 18.83 | 6.02 | |||||||||
Portfolio – Class K Shares*** | 37.55 | N/A | 22.96 | |||||||||
Russell 3000® Growth Index | 34.23 | 20.56 | 7.95 | |||||||||
Volatility Managed Index – Large Cap Growth 3000 | 33.31 | 17.56 | 9.51 | |||||||||
* Date of inception 1/27/86.
** Date of inception 10/2/96.
***Date of inception 8/26/11.
Returns for periods greater than one year are annualized. |
| |||||||||||
Past performance is not indicative of future results.
PERFORMANCE SUMMARY
The Portfolio’s Class A shares returned 37.21% for the year ended December 31, 2013. The Portfolio’s benchmarks, the Russell 3000® Growth Index, returned 34.23%, and the Volatility Managed Index — Large Cap Growth 3000 returned 33.31%, over the same period.
The following commentary describes key factors (such as stock selection and sector allocation decisions) that helped or hurt the Portfolio’s performance relative to its primary benchmark.
Portfolio Highlights
For the year ended December 31, 2013
What helped performance during the year:
| • | Positive stock selection in the Information Technology, Health Care and Consumer Discretionary sectors was the overwhelming driver of outperformance relative to the benchmark. |
| • | Specific contributors in the Information Technology sector included an underweight to Apple Inc. and International Business Machines Corp. and relative overweight allocations to Yelp, Inc., Splunk Inc. and LinkedIn Corporation. |
| • | Within the Health Care sector, an overweight allocation to Biogen Idec Inc. was a key contributor. |
| • | Tesla Motors, Inc. was the leading contributor in the Consumer Discretionary sector. |
| • | The Portfolio also benefited from an underweight allocation in Consumer Staples relative to the benchmark, as Consumer Staples was a weak-performing sector of the benchmark. |
What hurt performance during the year:
| • | Overweight positions relative to the benchmark in Information Technology holdings Fusion-io, Inc., Solarwinds, Inc. and Mellanox Technologies detracted from Portfolio performance. |
| • | Within the Consumer Discretionary sector, relative overweights in Ulta Salon Cosmetics & Fragrance, Inc. and athletic apparel company Lululemon Athletica, Inc. held back performance for the period. |
| • | An underweight to the Industrials sector also detracted from relative performance for the period. |
| • | Stock selection in the Materials and Energy sectors hurt relative performance for the period. Within the Energy sector, an overweight position in Anadarko Petroleum Corp. was notably detrimental. |
6
MULTIMANAGER AGGRESSIVE EQUITY PORTFOLIO (Unaudited)
Sector Weightings as of December 31, 2013 | % of Net Assets | |||
Information Technology | 23.9 | % | ||
Consumer Discretionary | 20.6 | |||
Health Care | 16.7 | |||
Industrials | 10.1 | |||
Consumer Staples | 5.7 | |||
Energy | 4.7 | |||
Financials | 4.4 | |||
Materials | 4.0 | |||
Telecommunication Services | 1.1 | |||
Utilities | 0.1 | |||
Cash and Other | 8.7 | |||
|
| |||
| 100.0 | % | |||
|
| |||
UNDERSTANDING YOUR EXPENSES:
As a shareholder of the Portfolio, you incur two types of costs:
(1)transaction costs, including applicable sales charges and redemption fees; and (2)ongoing costs, including management fees, distribution (12b-1) fees (in the case of Class A and Class B shares of the Trust), and other Portfolio expenses. These examples are intended to help you understand your ongoing costs (in dollars) of investing in the Portfolio and to compare these costs with the ongoing costs of investing in other mutual funds.
The examples are based on an investment of $1,000 invested at the beginning of the six-month period ended December 31, 2013 and held for the entire six-month period.
Actual Expenses
The first line of the table to the right provides information about actual account values and actual expenses. You may use the information in this line, together with the amount you invested, to estimate the expenses that you paid over the period. Simply divide your account value by $1,000 (for example, an $8,600 account value divided by $1,000 = 8.6), then multiply the result by the number in the first line under the heading entitled ‘‘Expenses Paid During Period’’ to estimate the expenses you paid on your account during this period.
Hypothetical Example for Comparison Purposes
The second line of the table below provides information about hypothetical account values and hypothetical expenses based on the Portfolio’s actual expense ratio and an assumed rate of return of 5% per year before expenses, which is not the Portfolio’s actual return. The hypothetical account values and expenses may not be used to estimate the actual ending account balance or expenses you paid for the period. You may use this information to compare the ongoing costs of investing in the Portfolio and other funds. To do so, compare this 5% hypothetical example with the 5% hypothetical examples that appear in the shareholder reports of the other funds.
Please note that the expenses shown in the table are meant to highlight your ongoing costs only and do not reflect any transactional costs, such as sales charges (loads), redemption fees, or exchange fees. Therefore, the second line of the table is useful in comparing ongoing costs only, and will not help you determine the relative total costs of owning different funds. In addition, if these transactional costs were included, your costs would have been higher. Also note that the table does not reflect any variable life insurance or variable annuity contract-related fees and expenses, which would increase overall fees and expenses.
EXAMPLE
Beginning Account Value 7/1/13 | Ending Account Value 12/31/13 | Expenses Paid During Period* 7/1/13 - | ||||||||||
Class A | ||||||||||||
Actual | $1,000.00 | $1,215.40 | $5.84 | |||||||||
Hypothetical (5% average annual return before expenses) | 1,000.00 | 1,019.93 | 5.33 | |||||||||
Class B | ||||||||||||
Actual | 1,000.00 | 1,214.58 | 5.77 | |||||||||
Hypothetical (5% average annual return before expenses) | 1,000.00 | 1,019.99 | 5.26 | |||||||||
Class K | ||||||||||||
Actual | 1,000.00 | 1,216.96 | 4.45 | |||||||||
Hypothetical (5% average annual return before expenses) | 1,000.00 | 1,021.19 | 4.06 | |||||||||
* Expenses are equal to the Portfolio’s Class A, Class B and Class K shares annualized expense ratios of 1.05%, 1.03% and 0.80%, respectively, multiplied by the average account value over the period, and multiplied by 184/365 (to reflect the one-half year period). |
| |||||||||||
7
AXA PREMIER VIP TRUST
MULTIMANAGER AGGRESSIVE EQUITY PORTFOLIO
PORTFOLIO OF INVESTMENTS
December 31, 2013
Number of Shares | Value (Note 1) | |||||||
COMMON STOCKS: | ||||||||
Consumer Discretionary (20.6%) |
| |||||||
Auto Components (0.5%) | ||||||||
Allison Transmission Holdings, Inc. | 5,412 | $ | 149,425 | |||||
BorgWarner, Inc. | 40,840 | 2,283,364 | ||||||
Dana Holding Corp. | 6,468 | 126,902 | ||||||
Delphi Automotive plc | 15,179 | 912,713 | ||||||
Drew Industries, Inc. | 924 | 47,309 | ||||||
Gentherm, Inc.* | 1,188 | 31,850 | ||||||
Goodyear Tire & Rubber Co. | 13,590 | 324,122 | ||||||
Johnson Controls, Inc. | 29,610 | 1,518,993 | ||||||
Lear Corp. | 1,980 | 160,321 | ||||||
Tenneco, Inc.* | 2,838 | 160,546 | ||||||
Visteon Corp.* | 2,178 | 178,357 | ||||||
|
| |||||||
| 5,893,902 | ||||||||
|
| |||||||
Automobiles (0.6%) | ||||||||
Ford Motor Co. | 59,924 | 924,627 | ||||||
Harley-Davidson, Inc. | 10,691 | 740,245 | ||||||
Tesla Motors, Inc.* | 30,728 | 4,620,877 | ||||||
|
| |||||||
| 6,285,749 | ||||||||
|
| |||||||
Distributors (0.1%) | ||||||||
Genuine Parts Co. | 7,193 | 598,385 | ||||||
LKQ Corp.* | 15,863 | 521,893 | ||||||
Pool Corp. | 2,112 | 122,792 | ||||||
|
| |||||||
| 1,243,070 | ||||||||
|
| |||||||
Diversified Consumer Services (0.1%) |
| |||||||
American Public Education, Inc.* | 1,084 | 47,122 | ||||||
Grand Canyon Education, Inc.* | 1,320 | 57,552 | ||||||
H&R Block, Inc. | 12,011 | 348,799 | ||||||
Hillenbrand, Inc. | 2,249 | 66,166 | ||||||
ITT Educational Services, Inc.* | 1,980 | 66,488 | ||||||
K12, Inc.* | 1,450 | 31,538 | ||||||
Service Corp. International | 7,325 | 132,802 | ||||||
Sotheby’s, Inc. | 4,356 | 231,739 | ||||||
Steiner Leisure Ltd.* | 528 | 25,972 | ||||||
Weight Watchers International, Inc. | 1,299 | 42,776 | ||||||
|
| |||||||
| 1,050,954 | ||||||||
|
| |||||||
Hotels, Restaurants & Leisure (4.3%) |
| |||||||
AFC Enterprises, Inc.* | 726 | 27,951 | ||||||
Brinker International, Inc. | 3,498 | 162,097 | ||||||
Buffalo Wild Wings, Inc.* | 24,500 | 3,606,400 | ||||||
Burger King Worldwide, Inc. | 5,742 | 131,262 | ||||||
CEC Entertainment, Inc. | 1,382 | 61,195 | ||||||
Chipotle Mexican Grill, Inc.* | 17,680 | 9,419,550 | ||||||
Choice Hotels International, Inc. | 132 | 6,483 | ||||||
Darden Restaurants, Inc. | 3,762 | 204,540 | ||||||
Denny’s Corp.* | 5,082 | 36,540 | ||||||
DineEquity, Inc. | 1,452 | 121,315 | ||||||
Domino’s Pizza, Inc. | 2,508 | 174,682 | ||||||
Dunkin’ Brands Group, Inc. | 3,762 | 181,328 | ||||||
Einstein Noah Restaurant Group, Inc. | 132 | 1,914 | ||||||
Hilton Worldwide Holdings, Inc.* | 5,300 | 117,925 | ||||||
International Game Technology | 11,518 | $ | 209,167 | |||||
Interval Leisure Group, Inc. | 2,371 | 73,264 | ||||||
Las Vegas Sands Corp. | 65,059 | 5,131,203 | ||||||
Life Time Fitness, Inc.* | 195 | 9,165 | ||||||
Marriott International, Inc., Class A | 10,854 | 535,753 | ||||||
McDonald’s Corp. | 44,344 | 4,302,698 | ||||||
MGM Resorts International* | 22,200 | 522,144 | ||||||
Morgans Hotel Group Co.* | 1,188 | 9,659 | ||||||
Norwegian Cruise Line Holdings Ltd.* | 3,696 | 131,097 | ||||||
Panera Bread Co., Class A* | 1,452 | 256,554 | ||||||
Papa John’s International, Inc. | 1,848 | 83,899 | ||||||
Pinnacle Entertainment, Inc.* | 2,068 | 53,747 | ||||||
Ruth’s Hospitality Group, Inc. | 594 | 8,441 | ||||||
Scientific Games Corp., Class A* | 5,016 | 84,921 | ||||||
Six Flags Entertainment Corp. | 4,164 | 153,319 | ||||||
Sonic Corp.* | 4,554 | 91,945 | ||||||
Starbucks Corp. | 112,025 | 8,781,640 | ||||||
Starwood Hotels & Resorts Worldwide, Inc. | 60,756 | 4,827,064 | ||||||
Texas Roadhouse, Inc. | 4,158 | 115,592 | ||||||
Wyndham Worldwide Corp. | 6,732 | 496,081 | ||||||
Wynn Resorts Ltd. | 31,332 | 6,084,988 | ||||||
Yum! Brands, Inc. | 19,862 | 1,501,766 | ||||||
|
| |||||||
| 47,717,289 | ||||||||
|
| |||||||
Household Durables (0.4%) | ||||||||
D.R. Horton, Inc.* | 47,710 | 1,064,887 | ||||||
iRobot Corp.* | 990 | 34,422 | ||||||
Jarden Corp.* | 5,562 | 341,229 | ||||||
Lennar Corp., Class A | 32,286 | 1,277,234 | ||||||
Newell Rubbermaid, Inc. | 7,391 | 239,542 | ||||||
NVR, Inc.* | 198 | 203,150 | ||||||
PulteGroup, Inc. | 17,159 | 349,529 | ||||||
Tupperware Brands Corp. | 3,564 | 336,905 | ||||||
Whirlpool Corp. | 990 | 155,292 | ||||||
|
| |||||||
| 4,002,190 | ||||||||
|
| |||||||
Internet & Catalog Retail (4.9%) |
| |||||||
1-800-FLOWERS.COM, Inc., | 1,386 | 7,498 | ||||||
Amazon.com, Inc.* | 49,066 | 19,567,030 | ||||||
Blue Nile, Inc.* | 990 | 46,619 | ||||||
Ctrip.com International Ltd. (ADR)* | 14,400 | 714,528 | ||||||
Expedia, Inc. | 4,746 | 330,606 | ||||||
Groupon, Inc.* | 18,545 | 218,275 | ||||||
Liberty Interactive Corp., | 56,718 | 1,664,673 | ||||||
Liberty Ventures* | 4,655 | 570,656 | ||||||
Netflix, Inc.* | 17,050 | 6,277,299 | ||||||
Nutrisystem, Inc. | 1,650 | 27,126 | ||||||
Overstock.com, Inc.* | 858 | 26,418 | ||||||
PetMed Express, Inc. | 1,254 | 20,854 | ||||||
priceline.com, Inc.* | 17,478 | 20,316,427 | ||||||
TripAdvisor, Inc.* | 60,244 | 4,990,011 | ||||||
|
| |||||||
| 54,778,020 | ||||||||
|
| |||||||
See Notes to Financial Statements.
8
AXA PREMIER VIP TRUST
MULTIMANAGER AGGRESSIVE EQUITY PORTFOLIO
PORTFOLIO OF INVESTMENTS (Continued)
December 31, 2013
Number of Shares | Value (Note 1) | |||||||
Leisure Equipment & Products (0.1%) |
| |||||||
Brunswick Corp. | 3,800 | $ | 175,028 | |||||
Hasbro, Inc. | 4,339 | 238,688 | ||||||
Mattel, Inc. | 15,300 | 727,974 | ||||||
Polaris Industries, Inc. | 2,508 | 365,265 | ||||||
Smith & Wesson Holding Corp.* | 5,412 | 73,008 | ||||||
|
| |||||||
| 1,579,963 | ||||||||
|
| |||||||
Media (5.2%) | ||||||||
AMC Networks, Inc., Class A* | 26,078 | 1,776,173 | ||||||
Cablevision Systems Corp. - New York Group, Class A | 132,166 | 2,369,736 | ||||||
CBS Corp. (Non-Voting), Class B | 43,280 | 2,758,667 | ||||||
Charter Communications, Inc., | 2,706 | 370,073 | ||||||
Cinemark Holdings, Inc. | 5,280 | 175,982 | ||||||
Comcast Corp., Class A | 345,664 | 17,727,761 | ||||||
Crown Media Holdings, Inc., | 264 | 932 | ||||||
DIRECTV* | 51,283 | 3,543,142 | ||||||
Discovery Communications, Inc., Class A* | 20,823 | 1,882,816 | ||||||
Discovery Communications, Inc., Class C* | 13,472 | 1,129,762 | ||||||
DISH Network Corp., Class A* | 9,239 | 535,123 | ||||||
Global Sources Ltd.* | 1,016 | 8,260 | ||||||
Interpublic Group of Cos., Inc. | 8,777 | 155,353 | ||||||
Lamar Advertising Co., Class A* | 3,498 | 182,771 | ||||||
Liberty Global plc, Class A* | 21,983 | 1,956,267 | ||||||
Liberty Media Corp., Class A* | 13,142 | 1,924,646 | ||||||
Lions Gate Entertainment Corp. | 4,158 | 131,642 | ||||||
Loral Space & Communications, Inc.* | 698 | 56,524 | ||||||
Madison Square Garden Co., Class A* | 28,717 | 1,653,525 | ||||||
Morningstar, Inc. | 2,178 | 170,080 | ||||||
National CineMedia, Inc. | 148 | 2,954 | ||||||
News Corp., Class A* | 16,185 | 291,654 | ||||||
Omnicom Group, Inc. | 11,426 | 849,752 | ||||||
Regal Entertainment Group, Class A | 2,790 | 54,265 | ||||||
Scripps Networks Interactive, Inc., Class A | 4,861 | 420,039 | ||||||
Sirius XM Holdings, Inc.* | 64,411 | 224,794 | ||||||
Starz, Class A* | 16,290 | 476,320 | ||||||
Time Warner Cable, Inc. | 12,869 | 1,743,749 | ||||||
Twenty-First Century Fox, Inc., Class A | 101,784 | 3,580,761 | ||||||
Viacom, Inc., Class B | 52,781 | 4,609,893 | ||||||
Walt Disney Co. | 98,295 | 7,509,738 | ||||||
World Wrestling Entertainment, Inc., Class A | 28,180 | 467,224 | ||||||
|
| |||||||
| 58,740,378 | ||||||||
|
| |||||||
Multiline Retail (0.5%) | ||||||||
Big Lots, Inc.* | 3,036 | 98,032 | ||||||
Dillard’s, Inc., Class A | 1,452 | 141,149 | ||||||
Dollar General Corp.* | 14,453 | 871,805 | ||||||
Dollar Tree, Inc.* | 25,256 | $ | 1,424,944 | |||||
Family Dollar Stores, Inc. | 5,744 | 373,188 | ||||||
Macy’s, Inc. | 13,133 | 701,302 | ||||||
Nordstrom, Inc. | 7,374 | 455,713 | ||||||
Target Corp. | 22,240 | 1,407,125 | ||||||
|
| |||||||
| 5,473,258 | ||||||||
|
| |||||||
Specialty Retail (3.1%) | ||||||||
Aaron’s, Inc. | 561 | 16,493 | ||||||
Abercrombie & Fitch Co., Class A | 2,508 | 82,538 | ||||||
Advance Auto Parts, Inc. | 3,366 | 372,549 | ||||||
Aeropostale, Inc.* | 5,313 | 48,295 | ||||||
American Eagle Outfitters, Inc. | 6,996 | 100,742 | ||||||
America’s Car-Mart, Inc.* | 594 | 25,085 | ||||||
Ascena Retail Group, Inc.* | 5,678 | 120,147 | ||||||
AutoNation, Inc.* | 3,102 | 154,138 | ||||||
AutoZone, Inc.* | 1,791 | 855,991 | ||||||
Bed Bath & Beyond, Inc.* | 10,761 | 864,108 | ||||||
Best Buy Co., Inc. | 4,356 | 173,717 | ||||||
Buckle, Inc. | 1,914 | 100,600 | ||||||
Cabela’s, Inc.* | 2,112 | 140,786 | ||||||
CarMax, Inc.* | 9,899 | 465,451 | ||||||
Cato Corp., Class A | 1,720 | 54,696 | ||||||
Dick’s Sporting Goods, Inc. | 4,884 | 283,760 | ||||||
DSW, Inc., Class A | 792 | 33,842 | ||||||
Finish Line, Inc., Class A | 726 | 20,452 | ||||||
Foot Locker, Inc. | 3,498 | 144,957 | ||||||
Gap, Inc. | 13,991 | 546,768 | ||||||
GNC Holdings, Inc., Class A | 3,432 | 200,600 | ||||||
Home Depot, Inc. | 89,089 | 7,335,588 | ||||||
L Brands, Inc. | 12,077 | 746,963 | ||||||
Lowe’s Cos., Inc. | 85,157 | 4,219,529 | ||||||
Lumber Liquidators Holdings, Inc.* | 1,320 | 135,815 | ||||||
O’Reilly Automotive, Inc.* | 5,796 | 746,003 | ||||||
PetSmart, Inc. | 5,016 | 364,914 | ||||||
Ross Stores, Inc. | 11,087 | 830,749 | ||||||
Sally Beauty Holdings, Inc.* | 6,707 | 202,753 | ||||||
Signet Jewelers Ltd. | 1,716 | 135,049 | ||||||
Tiffany & Co. | 4,909 | 455,457 | ||||||
TJX Cos., Inc. | 107,250 | 6,835,043 | ||||||
Tractor Supply Co. | 99,274 | 7,701,677 | ||||||
Ulta Salon Cosmetics & Fragrance, Inc.* | 2,904 | 280,294 | ||||||
Urban Outfitters, Inc.* | 7,096 | 263,262 | ||||||
Williams-Sonoma, Inc. | 4,290 | 250,021 | ||||||
Zumiez, Inc.* | 1,056 | 27,456 | ||||||
|
| |||||||
| 35,336,288 | ||||||||
|
| |||||||
Textiles, Apparel & Luxury Goods (0.8%) |
| |||||||
Carter’s, Inc. | 2,244 | 161,097 | ||||||
Coach, Inc. | 14,264 | 800,638 | ||||||
Crocs, Inc.* | 2,574 | 40,978 | ||||||
Deckers Outdoor Corp.* | 1,848 | 156,082 | ||||||
Fossil Group, Inc.* | 7,722 | 926,177 | ||||||
G-III Apparel Group Ltd.* | 462 | 34,091 | ||||||
Hanesbrands, Inc. | 5,412 | 380,301 | ||||||
Lululemon Athletica, Inc.* | 2,812 | 165,992 | ||||||
Michael Kors Holdings Ltd.* | 8,909 | 723,322 | ||||||
NIKE, Inc., Class B | 31,333 | 2,464,027 | ||||||
Oxford Industries, Inc. | 858 | 69,215 | ||||||
See Notes to Financial Statements.
9
AXA PREMIER VIP TRUST
MULTIMANAGER AGGRESSIVE EQUITY PORTFOLIO
PORTFOLIO OF INVESTMENTS (Continued)
December 31, 2013
Number of Shares | Value (Note 1) | |||||||
PVH Corp. | 2,970 | $ | 403,979 | |||||
Ralph Lauren Corp. | 2,949 | 520,705 | ||||||
Steven Madden Ltd.* | 3,294 | 120,528 | ||||||
Under Armour, Inc., Class A* | 3,432 | 299,614 | ||||||
VF Corp. | 35,066 | 2,186,014 | ||||||
|
| |||||||
| 9,452,760 | ||||||||
|
| |||||||
Total Consumer Discretionary | 231,553,821 | |||||||
|
| |||||||
Consumer Staples (5.7%) | ||||||||
Beverages (1.4%) | ||||||||
Brown-Forman Corp., Class B | 6,534 | 493,774 | ||||||
Coca-Cola Bottling Co. Consolidated | 198 | 14,492 | ||||||
Coca-Cola Co. | 169,154 | 6,987,752 | ||||||
Coca-Cola Enterprises, Inc | 12,101 | 534,017 | ||||||
Constellation Brands, Inc., | 6,402 | 450,573 | ||||||
Dr. Pepper Snapple Group, Inc. | 10,427 | 508,003 | ||||||
Monster Beverage Corp.* | 7,391 | 500,888 | ||||||
National Beverage Corp.* | 66 | 1,330 | ||||||
PepsiCo, Inc. | 81,122 | 6,728,259 | ||||||
|
| |||||||
| 16,219,088 | ||||||||
|
| |||||||
Food & Staples Retailing (1.4%) | ||||||||
Arden Group, Inc., Class A | 66 | 8,350 | ||||||
Costco Wholesale Corp. | 36,470 | 4,340,295 | ||||||
CVS Caremark Corp. | 6,204 | 444,020 | ||||||
Fresh Market, Inc.* | 2,772 | 112,266 | ||||||
Harris Teeter Supermarkets, Inc. | 2,310 | 113,998 | ||||||
Kroger Co. | 25,936 | 1,025,250 | ||||||
Pantry, Inc.* | 198 | 3,322 | ||||||
PriceSmart, Inc. | 792 | 91,508 | ||||||
Safeway, Inc. | 5,808 | 189,167 | ||||||
Sysco Corp. | 9,066 | 327,283 | ||||||
United Natural Foods, Inc.* | 2,244 | 169,175 | ||||||
Walgreen Co. | 31,546 | 1,812,002 | ||||||
Wal-Mart Stores, Inc. | 47,190 | 3,713,381 | ||||||
Whole Foods Market, Inc. | 52,877 | 3,057,877 | ||||||
|
| |||||||
| 15,407,894 | ||||||||
|
| |||||||
Food Products (1.1%) | ||||||||
Alico, Inc. | 132 | 5,131 | ||||||
Archer-Daniels-Midland Co. | 3,564 | 154,678 | ||||||
Campbell Soup Co. | 7,160 | 309,885 | ||||||
ConAgra Foods, Inc. | 17,027 | 573,810 | ||||||
Darling International, Inc.* | 5,940 | 124,027 | ||||||
Flowers Foods, Inc. | 7,573 | 162,592 | ||||||
General Mills, Inc. | 28,494 | 1,422,135 | ||||||
Green Mountain Coffee Roasters, Inc.* | 8,408 | 635,477 | ||||||
Hain Celestial Group, Inc.* | 1,914 | 173,753 | ||||||
Hershey Co. | 27,646 | 2,688,021 | ||||||
Hillshire Brands Co. | 6,619 | 221,339 | ||||||
Hormel Foods Corp. | 5,940 | 268,310 | ||||||
Ingredion, Inc. | 2,904 | 198,808 | ||||||
J.M. Smucker Co. | 1,188 | 123,100 | ||||||
Kellogg Co. | 10,759 | 657,052 | ||||||
Kraft Foods Group, Inc. | 26,310 | 1,418,635 | ||||||
Lifeway Foods, Inc. | 264 | 4,219 | ||||||
McCormick & Co., Inc. (Non-Voting) | 6,104 | $ | 420,688 | |||||
Mead Johnson Nutrition Co. | 9,437 | 790,443 | ||||||
Mondelez International, Inc., Class A | 58,720 | 2,072,816 | ||||||
WhiteWave Foods Co., Class A* | 1,871 | 42,921 | ||||||
|
| |||||||
| 12,467,840 | ||||||||
|
| |||||||
Household Products (0.6%) | ||||||||
Church & Dwight Co., Inc. | 6,138 | 406,826 | ||||||
Clorox Co. | 4,884 | 453,040 | ||||||
Colgate-Palmolive Co. | 41,442 | 2,702,433 | ||||||
Kimberly-Clark Corp. | 14,241 | 1,487,615 | ||||||
Procter & Gamble Co. | 17,441 | 1,419,872 | ||||||
|
| |||||||
| 6,469,786 | ||||||||
|
| |||||||
Personal Products (0.2%) | ||||||||
Avon Products, Inc. | 20,036 | 345,020 | ||||||
Estee Lauder Cos., Inc., Class A | 10,182 | 766,908 | ||||||
Herbalife Ltd. | 3,762 | 296,069 | ||||||
Inter Parfums, Inc. | 66 | 2,364 | ||||||
Nu Skin Enterprises, Inc., Class A | 2,640 | 364,901 | ||||||
Star Scientific, Inc.* | 726 | 842 | ||||||
USANA Health Sciences, Inc.* | 330 | 24,941 | ||||||
|
| |||||||
| 1,801,045 | ||||||||
|
| |||||||
Tobacco (1.0%) | ||||||||
Altria Group, Inc. | 88,825 | 3,409,992 | ||||||
Lorillard, Inc. | 18,017 | 913,102 | ||||||
Philip Morris International, Inc. | 72,815 | 6,344,371 | ||||||
Reynolds American, Inc. | 10,559 | 527,844 | ||||||
|
| |||||||
| 11,195,309 | ||||||||
|
| |||||||
Total Consumer Staples | 63,560,962 | |||||||
|
| |||||||
Energy (4.7%) | ||||||||
Energy Equipment & Services (2.4%) |
| |||||||
Atwood Oceanics, Inc.* | 2,640 | 140,950 | ||||||
Cameron International Corp.* | 8,755 | 521,185 | ||||||
CARBO Ceramics, Inc. | 924 | 107,674 | ||||||
Core Laboratories N.V. | 16,700 | 3,188,865 | ||||||
Dresser-Rand Group, Inc.* | 4,620 | 275,491 | ||||||
Dril-Quip, Inc.* | 1,584 | 174,129 | ||||||
FMC Technologies, Inc.* | 11,285 | 589,190 | ||||||
Frank’s International N.V | 1,100 | 29,700 | ||||||
Halliburton Co. | 72,498 | 3,679,273 | ||||||
National Oilwell Varco, Inc. | 51,239 | 4,075,038 | ||||||
Oceaneering International, Inc. | 5,082 | 400,868 | ||||||
RPC, Inc. | 3,564 | 63,617 | ||||||
Schlumberger Ltd. | 107,982 | 9,730,258 | ||||||
Seadrill Ltd. | 15,641 | 642,532 | ||||||
Weatherford International Ltd.* | 234,997 | 3,640,103 | ||||||
|
| |||||||
| 27,258,873 | ||||||||
|
| |||||||
Oil, Gas & Consumable Fuels (2.3%) |
| |||||||
Anadarko Petroleum Corp. | 70,831 | 5,618,315 | ||||||
Antero Resources Corp.* | 5,600 | 355,264 | ||||||
Apco Oil and Gas International, Inc.* | 792 | 12,347 | ||||||
Cabot Oil & Gas Corp. | 19,534 | 757,138 | ||||||
Cheniere Energy, Inc.* | 9,635 | 415,461 | ||||||
See Notes to Financial Statements.
10
AXA PREMIER VIP TRUST
MULTIMANAGER AGGRESSIVE EQUITY PORTFOLIO
PORTFOLIO OF INVESTMENTS (Continued)
December 31, 2013
Number of Shares | Value (Note 1) | |||||||
Clean Energy Fuels Corp.* | 3,036 | $ | 39,104 | |||||
Cobalt International Energy, Inc.* | 11,153 | 183,467 | ||||||
Concho Resources, Inc.* | 5,016 | 541,728 | ||||||
Contango Oil & Gas Co.* | 726 | 34,311 | ||||||
Continental Resources, Inc.* | 22,209 | 2,498,957 | ||||||
CVR Energy, Inc. | 3,960 | 171,983 | ||||||
EOG Resources, Inc. | 11,285 | 1,894,074 | ||||||
EQT Corp. | 6,072 | 545,144 | ||||||
FX Energy, Inc.* | 2,178 | 7,971 | ||||||
Gulfport Energy Corp.* | 2,376 | 150,044 | ||||||
Isramco, Inc.* | 132 | 16,771 | ||||||
Kinder Morgan, Inc. | 26,860 | 966,960 | ||||||
Kodiak Oil & Gas Corp.* | 11,700 | 131,157 | ||||||
Kosmos Energy Ltd.* | 5,544 | 61,982 | ||||||
Laredo Petroleum Holdings, Inc.* | 5,346 | 148,031 | ||||||
Newfield Exploration Co.* | 25,000 | 615,750 | ||||||
Noble Energy, Inc. | 3,300 | 224,763 | ||||||
Oasis Petroleum, Inc.* | 4,158 | 195,301 | ||||||
Panhandle Oil and Gas, Inc., Class A | 396 | 13,230 | ||||||
Pioneer Natural Resources Co. | 14,764 | 2,717,610 | ||||||
Range Resources Corp. | 32,273 | 2,720,937 | ||||||
Rosetta Resources, Inc.* | 2,508 | 120,484 | ||||||
SM Energy Co. | 2,442 | 202,955 | ||||||
Southwestern Energy Co.* | 15,567 | 612,250 | ||||||
Suncor Energy, Inc. | 36,839 | 1,291,207 | ||||||
VAALCO Energy, Inc.* | 990 | 6,821 | ||||||
Valero Energy Corp. | 34,765 | 1,752,156 | ||||||
Whiting Petroleum Corp.* | 2,574 | 159,253 | ||||||
Williams Cos., Inc. | 16,565 | 638,912 | ||||||
World Fuel Services Corp. | 2,706 | 116,791 | ||||||
|
| |||||||
| 25,938,629 | ||||||||
|
| |||||||
Total Energy | 53,197,502 | |||||||
|
| |||||||
Financials (4.4%) | ||||||||
Capital Markets (1.0%) | ||||||||
Affiliated Managers Group, Inc.* | 2,442 | 529,621 | ||||||
Ameriprise Financial, Inc. | 2,838 | 326,512 | ||||||
BGC Partners, Inc., Class A | 990 | 5,999 | ||||||
BlackRock, Inc. | 2,029 | 642,118 | ||||||
Charles Schwab Corp. | 6,600 | 171,600 | ||||||
Cohen & Steers, Inc. | 528 | 21,152 | ||||||
Diamond Hill Investment Group, Inc. | 132 | 15,621 | ||||||
Eaton Vance Corp. | 6,607 | 282,713 | ||||||
Federated Investors, Inc., Class B | 4,092 | 117,850 | ||||||
Franklin Resources, Inc. | 18,087 | 1,044,162 | ||||||
GAMCO Investors, Inc., Class A | 132 | 11,480 | ||||||
Greenhill & Co., Inc. | 1,584 | 91,777 | ||||||
ICG Group, Inc.* | 1,254 | 23,362 | ||||||
Lazard Ltd., Class A | 4,554 | 206,387 | ||||||
LPL Financial Holdings, Inc. | 2,904 | 136,575 | ||||||
Morgan Stanley | 47,072 | 1,476,178 | ||||||
Pzena Investment Management, Inc., Class A | 330 | 3,881 | ||||||
SEI Investments Co. | 7,193 | 249,813 | ||||||
State Street Corp. | 48,052 | $ | 3,526,536 | |||||
T. Rowe Price Group, Inc. | 12,144 | 1,017,303 | ||||||
TD Ameritrade Holding Corp. | 50,314 | 1,541,621 | ||||||
Waddell & Reed Financial, Inc., Class A | 4,950 | 322,344 | ||||||
Westwood Holdings Group, Inc. | 264 | 16,344 | ||||||
|
| |||||||
| 11,780,949 | ||||||||
|
| |||||||
Commercial Banks (0.0%) | ||||||||
Signature Bank/New York* | 1,914 | 205,602 | ||||||
|
| |||||||
Consumer Finance (0.7%) | ||||||||
American Express Co. | 82,291 | 7,466,263 | ||||||
Portfolio Recovery Associates, Inc.* | 3,585 | 189,431 | ||||||
|
| |||||||
| 7,655,694 | ||||||||
|
| |||||||
Diversified Financial Services (0.8%) |
| |||||||
CBOE Holdings, Inc. | 3,828 | 198,903 | ||||||
Citigroup, Inc. | 87,319 | 4,550,193 | ||||||
IntercontinentalExchange Group, Inc. | 3,296 | 741,336 | ||||||
JPMorgan Chase & Co. | 27,868 | 1,629,721 | ||||||
Leucadia National Corp. | 4,752 | 134,672 | ||||||
McGraw Hill Financial, Inc. | 5,699 | 445,662 | ||||||
Moody’s Corp. | 8,597 | 674,606 | ||||||
MSCI, Inc.* | 5,769 | 252,221 | ||||||
|
| |||||||
| 8,627,314 | ||||||||
|
| |||||||
Insurance (0.9%) | ||||||||
Allied World Assurance Co. Holdings AG | 1,320 | 148,909 | ||||||
American Financial Group, Inc./Ohio | 2,442 | 140,952 | ||||||
American International Group, Inc. | 94,713 | 4,835,099 | ||||||
Aon plc | 10,559 | 885,794 | ||||||
Arch Capital Group Ltd.* | 2,772 | 165,461 | ||||||
Arthur J. Gallagher & Co. | 5,478 | 257,083 | ||||||
Axis Capital Holdings Ltd. | 2,574 | 122,445 | ||||||
Brown & Brown, Inc. | 3,894 | 122,233 | ||||||
Chubb Corp. | 1,650 | 159,439 | ||||||
Erie Indemnity Co., Class A | 1,452 | 106,170 | ||||||
Loews Corp. | 2,706 | 130,537 | ||||||
Marsh & McLennan Cos., Inc. | 16,301 | 788,316 | ||||||
Progressive Corp. | 21,448 | 584,887 | ||||||
Prudential Financial, Inc. | 7,853 | 724,204 | ||||||
Travelers Cos., Inc. | 4,488 | 406,344 | ||||||
Validus Holdings Ltd. | 3,300 | 132,957 | ||||||
|
| |||||||
| 9,710,830 | ||||||||
|
| |||||||
Real Estate Investment Trusts (REITs) (0.8%) |
| |||||||
Acadia Realty Trust (REIT) | 858 | 21,304 | ||||||
Alexander’s, Inc. (REIT) | 66 | 21,780 | ||||||
American Tower Corp. (REIT) | 31,498 | 2,514,170 | ||||||
Apartment Investment & Management Co. (REIT), Class A | 4,356 | 112,864 | ||||||
Boston Properties, Inc. (REIT) | 1,188 | 119,240 | ||||||
Corrections Corp. of America (REIT) | 3,498 | 112,181 | ||||||
See Notes to Financial Statements.
11
AXA PREMIER VIP TRUST
MULTIMANAGER AGGRESSIVE EQUITY PORTFOLIO
PORTFOLIO OF INVESTMENTS (Continued)
December 31, 2013
Number of Shares | Value (Note 1) | |||||||
Digital Realty Trust, Inc. (REIT) | 4,429 | $ | 217,553 | |||||
DuPont Fabros Technology, Inc. (REIT) | 396 | 9,785 | ||||||
Equity Lifestyle Properties, Inc. (REIT) | 2,508 | 90,865 | ||||||
Extra Space Storage, Inc. (REIT) | 3,498 | 147,371 | ||||||
Federal Realty Investment Trust (REIT) | 1,980 | 200,792 | ||||||
Highwoods Properties, Inc. (REIT) | 3,102 | 112,199 | ||||||
Omega Healthcare Investors, Inc. (REIT) | 4,884 | 145,543 | ||||||
Plum Creek Timber Co., Inc. (REIT) | 7,457 | 346,825 | ||||||
Potlatch Corp. (REIT) | 1,273 | 53,135 | ||||||
PS Business Parks, Inc. (REIT) | 264 | 20,175 | ||||||
Public Storage (REIT) | 6,619 | 996,292 | ||||||
Rayonier, Inc. (REIT) | 5,742 | 241,738 | ||||||
Regency Centers Corp. (REIT) | 2,508 | 116,120 | ||||||
Saul Centers, Inc. (REIT) | 330 | 15,751 | ||||||
Senior Housing Properties Trust (REIT) | 4,752 | 105,637 | ||||||
Simon Property Group, Inc. (REIT) | 10,262 | 1,561,466 | ||||||
Tanger Factory Outlet Centers (REIT) | 3,350 | 107,267 | ||||||
Taubman Centers, Inc. (REIT) | 1,386 | 88,593 | ||||||
Universal Health Realty Income Trust (REIT) | 594 | 23,796 | ||||||
Ventas, Inc. (REIT) | 5,874 | 336,463 | ||||||
Vornado Realty Trust (REIT) | 1,584 | 140,643 | ||||||
Washington Real Estate Investment Trust (REIT) | 361 | 8,433 | ||||||
Weyerhaeuser Co. (REIT) | 24,220 | 764,625 | ||||||
|
| |||||||
| 8,752,606 | ||||||||
|
| |||||||
Real Estate Management & Development (0.0%) |
| |||||||
CBRE Group, Inc., Class A* | 15,569 | 409,465 | ||||||
Realogy Holdings Corp.* | 4,752 | 235,082 | ||||||
Tejon Ranch Co.* | 594 | 21,835 | ||||||
|
| |||||||
| 666,382 | ||||||||
|
| |||||||
Thrifts & Mortgage Finance (0.2%) |
| |||||||
Astoria Financial Corp. | 84,832 | 1,173,227 | ||||||
New York Community Bancorp, Inc. | 74,245 | 1,251,028 | ||||||
Ocwen Financial Corp.* | 4,554 | 252,519 | ||||||
|
| |||||||
| 2,676,774 | ||||||||
|
| |||||||
Total Financials | 50,076,151 | |||||||
|
| |||||||
Health Care (16.7%) | ||||||||
Biotechnology (8.3%) | ||||||||
Agios Pharmaceuticals, Inc.* | 1,100 | 26,345 | ||||||
Alexion Pharmaceuticals, Inc.* | 56,653 | 7,538,248 | ||||||
Alkermes plc* | 5,610 | 228,103 | ||||||
Alnylam Pharmaceuticals, Inc.* | 2,838 | 182,569 | ||||||
AMAG Pharmaceuticals, Inc.* | 1,320 | 32,036 | ||||||
Amgen, Inc. | 91,676 | 10,465,732 | ||||||
Arena Pharmaceuticals, Inc.* | 5,008 | $ | 29,297 | |||||
ARIAD Pharmaceuticals, Inc.* | 7,655 | 52,207 | ||||||
ArQule, Inc.* | 2,178 | 4,683 | ||||||
Array BioPharma, Inc.* | 2,574 | 12,896 | ||||||
Biogen Idec, Inc.* | 78,748 | 22,029,753 | ||||||
BioMarin Pharmaceutical, Inc.* | 6,138 | 431,317 | ||||||
Celgene Corp.* | 120,900 | 20,427,264 | ||||||
Celldex Therapeutics, Inc.* | 792 | 19,174 | ||||||
Cepheid, Inc.* | 3,036 | 141,842 | ||||||
Cubist Pharmaceuticals, Inc.* | 2,904 | 199,998 | ||||||
Curis, Inc.* | 6,468 | 18,240 | ||||||
Cytori Therapeutics, Inc.* | 1,122 | 2,884 | ||||||
Dendreon Corp.* | 7,668 | 22,927 | ||||||
Dyax Corp.* | 2,970 | 22,364 | ||||||
Emergent Biosolutions, Inc.* | 1,518 | 34,899 | ||||||
Exelixis, Inc.* | 8,381 | 51,375 | ||||||
Genomic Health, Inc.* | 726 | 21,250 | ||||||
Gilead Sciences, Inc.* | 232,472 | 17,470,271 | ||||||
Halozyme Therapeutics, Inc.* | 5,610 | 84,094 | ||||||
Idenix Pharmaceuticals, Inc.* | 1,320 | 7,894 | ||||||
ImmunoGen, Inc.* | 16,417 | 240,837 | ||||||
Immunomedics, Inc.* | 3,498 | 16,091 | ||||||
Incyte Corp.* | 4,092 | 207,178 | ||||||
InterMune, Inc.* | 3,102 | 45,692 | ||||||
Isis Pharmaceuticals, Inc.* | 26,107 | 1,040,103 | ||||||
Lexicon Pharmaceuticals, Inc.* | 1,254 | 2,257 | ||||||
Ligand Pharmaceuticals, Inc., Class B* | 913 | 48,024 | ||||||
MannKind Corp.* | 3,266 | 17,016 | ||||||
Medivation, Inc.* | 4,488 | 286,424 | ||||||
Momenta Pharmaceuticals, Inc.* | 2,970 | 52,510 | ||||||
Neurocrine Biosciences, Inc.* | 2,046 | 19,110 | ||||||
Novavax, Inc.* | 3,102 | 15,882 | ||||||
NPS Pharmaceuticals, Inc.* | 2,508 | 76,143 | ||||||
Opko Health, Inc.* | 2,574 | 21,725 | ||||||
Orexigen Therapeutics, Inc.* | 1,056 | 5,945 | ||||||
Osiris Therapeutics, Inc.* | 792 | 12,735 | ||||||
PDL BioPharma, Inc. | 9,503 | 80,205 | ||||||
Pharmacyclics, Inc.* | 2,508 | 265,296 | ||||||
Progenics Pharmaceuticals, Inc.* | 1,452 | 7,739 | ||||||
Quintiles Transnational Holdings, Inc.* | 2,706 | 125,396 | ||||||
Regeneron Pharmaceuticals, Inc.* | 24,052 | 6,620,072 | ||||||
Sangamo BioSciences, Inc.* | 1,980 | 27,502 | ||||||
Seattle Genetics, Inc.* | 6,336 | 252,743 | ||||||
SIGA Technologies, Inc.* | 1,829 | 5,981 | ||||||
Synta Pharmaceuticals Corp.* | 924 | 4,842 | ||||||
Theravance, Inc.* | 3,432 | 122,351 | ||||||
United Therapeutics Corp.* | 2,734 | 309,161 | ||||||
Vanda Pharmaceuticals, Inc.* | 1,725 | 21,407 | ||||||
Vertex Pharmaceuticals, Inc.* | 47,356 | 3,518,551 | ||||||
Vical, Inc.* | 4,554 | 5,374 | ||||||
|
| |||||||
| 93,031,954 | ||||||||
|
| |||||||
Health Care Equipment & Supplies (1.2%) |
| |||||||
Abaxis, Inc.* | 1,782 | 71,316 | ||||||
ABIOMED, Inc.* | 1,848 | 49,416 | ||||||
Accuray, Inc.* | 2,250 | 19,597 | ||||||
Align Technology, Inc.* | 4,620 | 264,033 | ||||||
Analogic Corp. | 726 | 64,295 | ||||||
Atrion Corp. | 66 | 19,553 | ||||||
See Notes to Financial Statements.
12
AXA PREMIER VIP TRUST
MULTIMANAGER AGGRESSIVE EQUITY PORTFOLIO
PORTFOLIO OF INVESTMENTS (Continued)
December 31, 2013
Number of Shares | Value (Note 1) | |||||||
Baxter International, Inc. | 24,098 | $ | 1,676,016 | |||||
Becton, Dickinson and Co. | 8,728 | 964,357 | ||||||
C.R. Bard, Inc. | 3,995 | 535,090 | ||||||
Cooper Cos., Inc. | 16,765 | 2,076,178 | ||||||
Covidien plc | 35,389 | 2,409,991 | ||||||
Cyberonics, Inc.* | 2,310 | 151,328 | ||||||
DENTSPLY International, Inc. | 2,772 | 134,387 | ||||||
DexCom, Inc.* | 3,322 | 117,632 | ||||||
Edwards Lifesciences Corp.* | 5,211 | 342,675 | ||||||
Endologix, Inc.* | 3,894 | 67,911 | ||||||
Exactech, Inc.* | 396 | 9,409 | ||||||
HeartWare International, Inc.* | 528 | 49,611 | ||||||
Hologic, Inc.* | 5,940 | 132,759 | ||||||
ICU Medical, Inc.* | 776 | 49,439 | ||||||
IDEXX Laboratories, Inc.* | 3,300 | 351,021 | ||||||
Insulet Corp.* | 2,376 | 88,150 | ||||||
Integra LifeSciences Holdings Corp.* | 1,518 | 72,424 | ||||||
Intuitive Surgical, Inc.* | 2,819 | 1,082,722 | ||||||
Natus Medical, Inc.* | 1,452 | 32,670 | ||||||
Neogen Corp.* | 1,782 | 81,437 | ||||||
NxStage Medical, Inc.* | 792 | 7,920 | ||||||
Quidel Corp.* | 1,518 | 46,891 | ||||||
ResMed, Inc. | 8,579 | 403,899 | ||||||
Sirona Dental Systems, Inc.* | 2,640 | 185,328 | ||||||
Spectranetics Corp.* | 1,716 | 42,900 | ||||||
St. Jude Medical, Inc. | 7,993 | 495,166 | ||||||
Stryker Corp. | 8,542 | 641,846 | ||||||
Thoratec Corp.* | 3,102 | 113,533 | ||||||
Varian Medical Systems, Inc.* | 5,486 | 426,207 | ||||||
Volcano Corp.* | 1,650 | 36,052 | ||||||
Wright Medical Group, Inc.* | 5,472 | 168,045 | ||||||
Zimmer Holdings, Inc. | 1,650 | 153,763 | ||||||
|
| |||||||
| 13,634,967 | ||||||||
|
| |||||||
Health Care Providers & Services (2.5%) |
| |||||||
Aetna, Inc. | 4,422 | 303,305 | ||||||
Air Methods Corp.* | 1,782 | 103,944 | ||||||
AmerisourceBergen Corp. | 11,681 | 821,291 | ||||||
AMN Healthcare Services, Inc.* | 1,716 | 25,225 | ||||||
Bio-Reference Labs, Inc.* | 1,188 | 30,342 | ||||||
BioScrip, Inc.* | 2,935 | 21,719 | ||||||
Brookdale Senior Living, Inc.* | 4,488 | 121,984 | ||||||
Cardinal Health, Inc. | 43,010 | 2,873,498 | ||||||
Catamaran Corp.* | 9,478 | 450,016 | ||||||
Centene Corp.* | 2,376 | 140,065 | ||||||
Cigna Corp. | 1,716 | 150,116 | ||||||
Community Health Systems, Inc.* | 2,508 | 98,489 | ||||||
Corvel Corp.* | 924 | 43,151 | ||||||
DaVita HealthCare Partners, Inc.* | 9,016 | 571,344 | ||||||
Emeritus Corp.* | 1,056 | 22,841 | ||||||
Ensign Group, Inc. | 1,188 | 52,593 | ||||||
Envision Healthcare Holdings, Inc.* | 4,900 | 174,048 | ||||||
Express Scripts Holding Co.* | 31,585 | 2,218,530 | ||||||
HCA Holdings, Inc.* | 3,828 | 182,634 | ||||||
Health Management Associates, Inc., Class A* | 11,483 | 150,427 | ||||||
HealthSouth Corp. | 4,092 | 136,345 | ||||||
Henry Schein, Inc.* | 3,839 | 438,644 | ||||||
IPC The Hospitalist Co., Inc.* | 1,001 | $ | 59,449 | |||||
Laboratory Corp. of America Holdings* | 4,871 | 445,063 | ||||||
Landauer, Inc. | 264 | 13,889 | ||||||
McKesson Corp. | 27,095 | 4,373,133 | ||||||
MEDNAX, Inc.* | 2,904 | 155,016 | ||||||
MWI Veterinary Supply, Inc.* | 924 | 157,625 | ||||||
National Research Corp., Class A* | 198 | 3,726 | ||||||
Patterson Cos., Inc. | 4,026 | 165,871 | ||||||
Providence Service Corp.* | 528 | 13,580 | ||||||
Quest Diagnostics, Inc. | 1,790 | 95,837 | ||||||
Team Health Holdings, Inc.* | 3,036 | 138,290 | ||||||
Tenet Healthcare Corp.* | 5,197 | 218,898 | ||||||
U.S. Physical Therapy, Inc. | 660 | 23,272 | ||||||
UnitedHealth Group, Inc. | 174,419 | 13,133,751 | ||||||
Universal Health Services, Inc., Class B | 4,246 | 345,030 | ||||||
|
| |||||||
| 28,472,981 | ||||||||
|
| |||||||
Health Care Technology (0.3%) | ||||||||
athenahealth, Inc.* | 2,606 | 350,507 | ||||||
Cerner Corp.* | 15,311 | 853,435 | ||||||
Computer Programs & Systems, Inc. | 858 | 53,033 | ||||||
HMS Holdings Corp.* | 3,960 | 90,011 | ||||||
MedAssets, Inc.* | 3,145 | 62,365 | ||||||
Medidata Solutions, Inc.* | 20,200 | 1,223,514 | ||||||
Omnicell, Inc.* | 1,650 | 42,125 | ||||||
Quality Systems, Inc. | 2,508 | 52,818 | ||||||
|
| |||||||
| 2,727,808 | ||||||||
|
| |||||||
Life Sciences Tools & Services (1.2%) |
| |||||||
Agilent Technologies, Inc. | 2,723 | 155,728 | ||||||
Bruker Corp.* | 7,325 | 144,815 | ||||||
Charles River Laboratories International, Inc.* | 198 | 10,502 | ||||||
Covance, Inc.* | 3,624 | 319,129 | ||||||
Illumina, Inc.* | 78,033 | 8,632,011 | ||||||
Life Technologies Corp.* | 4,944 | 374,755 | ||||||
Luminex Corp.* | 3,300 | 64,020 | ||||||
Mettler-Toledo International, Inc.* | 1,320 | 320,219 | ||||||
PAREXEL International Corp.* | 2,508 | 113,311 | ||||||
Sequenom, Inc.* | 3,234 | 7,568 | ||||||
Techne Corp. | 2,112 | 199,943 | ||||||
Thermo Fisher Scientific, Inc. | 27,553 | 3,068,027 | ||||||
Waters Corp.* | 4,290 | 429,000 | ||||||
|
| |||||||
| 13,839,028 | ||||||||
|
| |||||||
Pharmaceuticals (3.2%) | ||||||||
AbbVie, Inc. | 112,203 | 5,925,440 | ||||||
Actavis plc* | 21,782 | 3,659,376 | ||||||
Akorn, Inc.* | 3,036 | 74,777 | ||||||
Allergan, Inc. | 14,218 | 1,579,335 | ||||||
Bristol-Myers Squibb Co. | 111,677 | 5,935,633 | ||||||
Cadence Pharmaceuticals, Inc.* | 1,914 | 17,322 | ||||||
Depomed, Inc.* | 2,706 | 28,629 | ||||||
Eli Lilly and Co. | 9,587 | 488,937 | ||||||
Endo Health Solutions, Inc.* | 5,478 | 369,546 | ||||||
Forest Laboratories, Inc.* | 80,348 | 4,823,290 | ||||||
See Notes to Financial Statements.
13
AXA PREMIER VIP TRUST
MULTIMANAGER AGGRESSIVE EQUITY PORTFOLIO
PORTFOLIO OF INVESTMENTS (Continued)
December 31, 2013
Number of Shares | Value (Note 1) | |||||||
Forest Laboratories, Inc. (Contingent Value Shares)*†(b) | 594 | $ | — | |||||
Jazz Pharmaceuticals plc* | 2,310 | 292,354 | ||||||
Johnson & Johnson | 16,057 | 1,470,661 | ||||||
Mallinckrodt plc* | 2,548 | 133,158 | ||||||
Medicines Co.* | 2,772 | 107,055 | ||||||
Mylan, Inc.* | 18,654 | 809,584 | ||||||
Perrigo Co. plc | 5,549 | 851,550 | ||||||
Questcor Pharmaceuticals, Inc. | 2,706 | 147,342 | ||||||
Salix Pharmaceuticals Ltd.* | 2,706 | 243,378 | ||||||
Santarus, Inc.* | 3,828 | 122,343 | ||||||
Sciclone Pharmaceuticals, Inc.* | 3,828 | 19,293 | ||||||
Sucampo Pharmaceuticals, Inc., Class A* | 462 | 4,343 | ||||||
Teva Pharmaceutical Industries Ltd. (ADR) | 89,731 | 3,596,418 | ||||||
Valeant Pharmaceuticals International, Inc.* | 33,933 | 3,983,734 | ||||||
Vivus, Inc.* | 5,544 | 50,339 | ||||||
XenoPort, Inc.* | 2,310 | 13,282 | ||||||
Zoetis, Inc. | 20,947 | 684,757 | ||||||
|
| |||||||
| 35,431,876 | ||||||||
|
| |||||||
Total Health Care | 187,138,614 | |||||||
|
| |||||||
Industrials (10.1%) | ||||||||
Aerospace & Defense (3.3%) | ||||||||
B/E Aerospace, Inc.* | 4,290 | 373,359 | ||||||
Boeing Co. | 55,902 | 7,630,064 | ||||||
Cubic Corp | 950 | 50,027 | ||||||
GenCorp, Inc.* | 3,036 | 54,709 | ||||||
HEICO Corp. | 3,093 | 179,239 | ||||||
Hexcel Corp.* | 4,620 | 206,468 | ||||||
Honeywell International, Inc. | 34,826 | 3,182,052 | ||||||
Huntington Ingalls Industries, Inc. | 2,244 | 201,982 | ||||||
L-3 Communications Holdings, Inc. | 21,222 | 2,267,783 | ||||||
Lockheed Martin Corp. | 11,330 | 1,684,318 | ||||||
National Presto Industries, Inc.* | 303 | 24,391 | ||||||
Precision Castparts Corp. | 27,459 | 7,394,709 | ||||||
Rockwell Collins, Inc. | 5,338 | 394,585 | ||||||
Rolls-Royce Holdings plc* | 216,725 | 4,575,793 | ||||||
Rolls-Royce Holdings plc (Preference)*†(b) | 18,638,350 | 30,864 | ||||||
Spirit AeroSystems Holdings, Inc., Class A* | 2,274 | 77,498 | ||||||
Taser International, Inc.* | 3,366 | 53,452 | ||||||
Teledyne Technologies, Inc.* | 660 | 60,628 | ||||||
TransDigm Group, Inc. | 2,291 | 368,897 | ||||||
Triumph Group, Inc. | 1,518 | 115,474 | ||||||
United Technologies Corp. | 68,319 | 7,774,702 | ||||||
|
| |||||||
| 36,700,994 | ||||||||
|
| |||||||
Air Freight & Logistics (0.6%) | ||||||||
C.H. Robinson Worldwide, Inc. | 7,729 | 450,910 | ||||||
Expeditors International of Washington, Inc. | 9,954 | 440,464 | ||||||
FedEx Corp. | 13,906 | 1,999,266 | ||||||
Forward Air Corp. | 774 | 33,986 | ||||||
Hub Group, Inc., Class A* | 1,254 | $ | 50,010 | |||||
United Parcel Service, Inc., Class B | 32,039 | 3,366,658 | ||||||
|
| |||||||
| 6,341,294 | ||||||||
|
| |||||||
Airlines (0.3%) | ||||||||
Alaska Air Group, Inc. | 3,102 | 227,594 | ||||||
Allegiant Travel Co. | 934 | 98,481 | ||||||
Copa Holdings S.A., Class A | 1,452 | 232,480 | ||||||
Delta Air Lines, Inc. | 17,318 | 475,725 | ||||||
Southwest Airlines Co. | 9,107 | 171,576 | ||||||
United Continental Holdings, Inc.* | 52,521 | 1,986,869 | ||||||
|
| |||||||
| 3,192,725 | ||||||||
|
| |||||||
Building Products (0.1%) | ||||||||
A.O. Smith Corp. | 3,168 | 170,882 | ||||||
AAON, Inc. | 1,633 | 52,174 | ||||||
Allegion plc* | 3,146 | 139,007 | ||||||
Armstrong World Industries, Inc.* | 792 | 45,627 | ||||||
Fortune Brands Home & Security, Inc. | 6,402 | 292,571 | ||||||
Lennox International, Inc. | 2,244 | 190,875 | ||||||
Masco Corp. | 16,812 | 382,809 | ||||||
Trex Co., Inc.* | 1,254 | 99,731 | ||||||
USG Corp.* | 396 | 11,238 | ||||||
|
| |||||||
| 1,384,914 | ||||||||
|
| |||||||
Commercial Services & Supplies (0.7%) |
| |||||||
ADT Corp. | 25,110 | 1,016,202 | ||||||
CECO Environmental Corp. | 193 | 3,121 | ||||||
Cintas Corp. | 2,772 | 165,183 | ||||||
Clean Harbors, Inc.* | 2,244 | 134,550 | ||||||
Copart, Inc.* | 7,615 | 279,090 | ||||||
Deluxe Corp. | 2,310 | 120,559 | ||||||
EnerNOC, Inc.* | 782 | 13,458 | ||||||
Healthcare Services Group, Inc. | 5,148 | 146,049 | ||||||
InnerWorkings, Inc.* | 1,716 | 13,368 | ||||||
Interface, Inc. | 2,838 | 62,322 | ||||||
Iron Mountain, Inc. | 7,108 | 215,728 | ||||||
Knoll, Inc. | 3,960 | 72,507 | ||||||
Mine Safety Appliances Co. | 1,495 | 76,559 | ||||||
Multi-Color Corp. | 528 | 19,927 | ||||||
Rollins, Inc. | 4,620 | 139,940 | ||||||
SP Plus Corp.* | 330 | 8,593 | ||||||
Stericycle, Inc.* | 4,818 | 559,707 | ||||||
Team, Inc.* | 990 | 41,916 | ||||||
Tyco International Ltd. | 98,670 | 4,049,417 | ||||||
U.S. Ecology, Inc. | 858 | 31,909 | ||||||
Waste Connections, Inc. | 5,119 | 223,342 | ||||||
Waste Management, Inc. | 2,970 | 133,264 | ||||||
|
| |||||||
| 7,526,711 | ||||||||
|
| |||||||
Construction & Engineering (0.2%) |
| |||||||
Chicago Bridge & Iron Co. N.V. (N.Y. Shares) | 4,422 | 367,645 | ||||||
Fluor Corp. | 19,964 | 1,602,910 | ||||||
Quanta Services, Inc.* | 4,422 | 139,558 | ||||||
|
| |||||||
| 2,110,113 | ||||||||
|
| |||||||
See Notes to Financial Statements.
14
AXA PREMIER VIP TRUST
MULTIMANAGER AGGRESSIVE EQUITY PORTFOLIO
PORTFOLIO OF INVESTMENTS (Continued)
December 31, 2013
Number of Shares | Value (Note 1) | |||||||
Electrical Equipment (0.6%) | ||||||||
Acuity Brands, Inc. | 1,716 | $ | 187,593 | |||||
AMETEK, Inc. | 49,887 | 2,627,548 | ||||||
AZZ, Inc. | 1,517 | 74,121 | ||||||
Babcock & Wilcox Co. | 6,114 | 209,038 | ||||||
Emerson Electric Co. | 23,794 | 1,669,863 | ||||||
General Cable Corp. | 264 | 7,764 | ||||||
Hubbell, Inc., Class B | 2,244 | 244,372 | ||||||
Polypore International, Inc.* | 1,848 | 71,887 | ||||||
Rockwell Automation, Inc. | 6,534 | 772,058 | ||||||
Roper Industries, Inc. | 4,733 | 656,372 | ||||||
|
| |||||||
| 6,520,616 | ||||||||
|
| |||||||
Industrial Conglomerates (0.8%) | ||||||||
3M Co. | 25,849 | 3,625,323 | ||||||
Carlisle Cos., Inc. | 1,105 | 87,737 | ||||||
Danaher Corp. | 71,516 | 5,521,035 | ||||||
Raven Industries, Inc. | 1,716 | 70,596 | ||||||
|
| |||||||
| 9,304,691 | ||||||||
|
| |||||||
Machinery (1.8%) | ||||||||
Caterpillar, Inc. | 24,230 | 2,200,326 | ||||||
Chart Industries, Inc.* | 1,320 | 126,245 | ||||||
CLARCOR, Inc. | 1,517 | 97,619 | ||||||
Colfax Corp.* | 3,762 | 239,602 | ||||||
Crane Co. | 2,046 | 137,594 | ||||||
Cummins, Inc. | 29,056 | 4,096,024 | ||||||
Deere & Co. | 17,137 | 1,565,122 | ||||||
Donaldson Co., Inc. | 8,711 | 378,580 | ||||||
Dover Corp. | 5,610 | 541,589 | ||||||
Flow International Corp.* | 2,046 | 8,266 | ||||||
Flowserve Corp. | 15,918 | 1,254,816 | ||||||
Gorman-Rupp Co. | 1,237 | 41,353 | ||||||
Graco, Inc. | 3,042 | 237,641 | ||||||
Graham Corp. | 528 | 19,161 | ||||||
IDEX Corp. | 3,696 | 272,950 | ||||||
Illinois Tool Works, Inc. | 6,204 | 521,632 | ||||||
Ingersoll-Rand plc | 9,437 | 581,319 | ||||||
ITT Corp. | 4,000 | 173,680 | ||||||
Lincoln Electric Holdings, Inc. | 3,894 | 277,798 | ||||||
Lindsay Corp. | 660 | 54,615 | ||||||
Manitowoc Co., Inc. | 1,914 | 44,634 | ||||||
Middleby Corp.* | 858 | 205,894 | ||||||
Nordson Corp. | 3,247 | 241,252 | ||||||
Omega Flex, Inc. | 198 | 4,051 | ||||||
PACCAR, Inc. | 22,131 | 1,309,491 | ||||||
Pall Corp. | 28,601 | 2,441,095 | ||||||
Pentair Ltd. (Registered) | 10,255 | 796,506 | ||||||
RBC Bearings, Inc.* | 1,188 | 84,051 | ||||||
Snap-on, Inc. | 1,584 | 173,480 | ||||||
Stanley Black & Decker, Inc. | 1,518 | 122,487 | ||||||
Sun Hydraulics Corp. | 891 | 36,380 | ||||||
Tennant Co. | 1,518 | 102,936 | ||||||
Toro Co. | 2,772 | 176,299 | ||||||
Valmont Industries, Inc. | 1,056 | 157,471 | ||||||
WABCO Holdings, Inc.* | 3,036 | 283,593 | ||||||
Wabtec Corp. | 16,234 | 1,205,699 | ||||||
Woodward, Inc. | 3,168 | 144,493 | ||||||
Xylem, Inc. | 4,092 | 141,583 | ||||||
|
| |||||||
| 20,497,327 | ||||||||
|
| |||||||
Marine (0.0%) | ||||||||
Kirby Corp.* | 1,476 | $ | 146,493 | |||||
|
| |||||||
Professional Services (0.4%) | ||||||||
Acacia Research Corp. | 2,182 | 31,726 | ||||||
Advisory Board Co.* | 1,716 | 109,258 | ||||||
Dun & Bradstreet Corp. | 2,804 | 344,191 | ||||||
Equifax, Inc. | 5,016 | 346,556 | ||||||
Exponent, Inc. | 1,188 | 91,999 | ||||||
Huron Consulting Group, Inc.* | 1,782 | 111,767 | ||||||
IHS, Inc., Class A* | 2,726 | 326,302 | ||||||
Insperity, Inc. | 1,716 | 61,999 | ||||||
Nielsen Holdings N.V. | 42,788 | 1,963,541 | ||||||
Robert Half International, Inc. | 8,719 | 366,111 | ||||||
Verisk Analytics, Inc., Class A* | 6,468 | 425,077 | ||||||
|
| |||||||
| 4,178,527 | ||||||||
|
| |||||||
Road & Rail (1.1%) | ||||||||
Amerco, Inc.* | 726 | 172,672 | ||||||
Avis Budget Group, Inc.* | 4,374 | 176,797 | ||||||
Canadian Pacific Railway Ltd. | 25,252 | 3,821,133 | ||||||
Celadon Group, Inc. | 1,322 | 25,752 | ||||||
Con-way, Inc. | 1,333 | 52,933 | ||||||
CSX Corp. | 77,448 | 2,228,179 | ||||||
Genesee & Wyoming, Inc., Class A* | 1,848 | 177,500 | ||||||
Heartland Express, Inc. | 1,848 | 36,258 | ||||||
Hertz Global Holdings, Inc.* | 15,311 | 438,201 | ||||||
J.B. Hunt Transport Services, Inc. | 5,097 | 393,998 | ||||||
Kansas City Southern | 10,684 | 1,323,000 | ||||||
Landstar System, Inc. | 2,178 | 125,126 | ||||||
Norfolk Southern Corp. | 2,508 | 232,818 | ||||||
Old Dominion Freight Line, Inc.* | 3,139 | 166,430 | ||||||
Union Pacific Corp. | 20,632 | 3,466,176 | ||||||
|
| |||||||
| 12,836,973 | ||||||||
|
| |||||||
Trading Companies & Distributors (0.2%) |
| |||||||
Beacon Roofing Supply, Inc.* | 2,297 | 92,523 | ||||||
Fastenal Co. | 31,899 | 1,515,522 | ||||||
Houston Wire & Cable Co. | 924 | 12,363 | ||||||
Kaman Corp. | 1,385 | 55,026 | ||||||
MSC Industrial Direct Co., Inc., Class A | 2,442 | 197,485 | ||||||
TAL International Group, Inc. | 198 | 11,355 | ||||||
United Rentals, Inc.* | 4,356 | 339,550 | ||||||
W.W. Grainger, Inc. | 2,707 | 691,422 | ||||||
|
| |||||||
| 2,915,246 | ||||||||
|
| |||||||
Total Industrials | 113,656,624 | |||||||
|
| |||||||
Information Technology (23.9%) | ||||||||
Communications Equipment (1.3%) |
| |||||||
ADTRAN, Inc. | 2,904 | 78,437 | ||||||
Anaren, Inc.* | 884 | 24,743 | ||||||
ARRIS Group, Inc.* | 18,064 | 440,129 | ||||||
Aruba Networks, Inc.* | 4,092 | 73,247 | ||||||
Ciena Corp.* | 1,872 | 44,797 | ||||||
F5 Networks, Inc.* | 4,488 | 407,780 | ||||||
Harris Corp. | 2,223 | 155,188 | ||||||
Infinera Corp.* | 6,798 | 66,484 | ||||||
InterDigital, Inc. | 2,046 | 60,337 | ||||||
See Notes to Financial Statements.
15
AXA PREMIER VIP TRUST
MULTIMANAGER AGGRESSIVE EQUITY PORTFOLIO
PORTFOLIO OF INVESTMENTS (Continued)
December 31, 2013
Number of Shares | Value (Note 1) | |||||||
Ixia* | 1,386 | $ | 18,448 | |||||
JDS Uniphase Corp.* | 8,381 | 108,785 | ||||||
Juniper Networks, Inc.* | 102,895 | 2,322,340 | ||||||
Motorola Solutions, Inc. | 10,097 | 681,547 | ||||||
Palo Alto Networks, Inc.* | 2,772 | 159,307 | ||||||
QUALCOMM, Inc. | 122,834 | 9,120,425 | ||||||
Riverbed Technology, Inc.* | 7,376 | 133,358 | ||||||
ShoreTel, Inc.* | 1,980 | 18,374 | ||||||
ViaSat, Inc.* | 1,558 | 97,609 | ||||||
|
| |||||||
| 14,011,335 | ||||||||
|
| |||||||
Computers & Peripherals (3.6%) | ||||||||
3D Systems Corp.* | 43,222 | 4,016,620 | ||||||
Apple, Inc. | 41,933 | 23,529,026 | ||||||
EMC Corp. | 46,465 | 1,168,595 | ||||||
Immersion Corp.* | 792 | 8,221 | ||||||
NCR Corp.* | 7,497 | 255,348 | ||||||
NetApp, Inc. | 15,971 | 657,047 | ||||||
SanDisk Corp. | 65,795 | 4,641,179 | ||||||
Seagate Technology plc | 61,279 | 3,441,429 | ||||||
Silicon Graphics International Corp.* | 198 | 2,655 | ||||||
Stratasys Ltd.* | 23,222 | 3,128,003 | ||||||
|
| |||||||
| 40,848,123 | ||||||||
|
| |||||||
Electronic Equipment, Instruments & Components (0.4%) |
| |||||||
Amphenol Corp., Class A | 7,497 | 668,582 | ||||||
Anixter International, Inc. | 1,716 | 154,165 | ||||||
Badger Meter, Inc. | 1,188 | 64,746 | ||||||
Cognex Corp.* | 802 | 30,620 | ||||||
Daktronics, Inc. | 1,782 | 27,942 | ||||||
Dolby Laboratories, Inc., Class A* | 13,991 | 539,493 | ||||||
DTS, Inc.* | 924 | 22,158 | ||||||
FARO Technologies, Inc.* | 924 | 53,869 | ||||||
FEI Co. | 2,710 | 242,166 | ||||||
FLIR Systems, Inc. | 4,405 | 132,591 | ||||||
IPG Photonics Corp.* | 1,056 | 81,956 | ||||||
Maxwell Technologies, Inc.* | 990 | 7,692 | ||||||
MTS Systems Corp. | 330 | 23,513 | ||||||
National Instruments Corp. | 4,290 | 137,366 | ||||||
OSI Systems, Inc.* | 660 | 35,053 | ||||||
TE Connectivity Ltd. | 40,873 | 2,252,511 | ||||||
Trimble Navigation Ltd.* | 13,595 | 471,746 | ||||||
Universal Display Corp.* | 1,518 | 52,158 | ||||||
|
| |||||||
| 4,998,327 | ||||||||
|
| |||||||
Internet Software & Services (6.6%) |
| |||||||
Akamai Technologies, Inc.* | 33,859 | 1,597,468 | ||||||
Baidu, Inc. (ADR)* | 8,186 | 1,456,126 | ||||||
Blucora, Inc.* | 1,056 | 30,793 | ||||||
comScore, Inc.* | 990 | 28,324 | ||||||
Constant Contact, Inc.* | 1,914 | 59,468 | ||||||
Cornerstone OnDemand, Inc.* | 2,640 | 140,818 | ||||||
CoStar Group, Inc.* | 1,642 | 303,080 | ||||||
Dealertrack Technologies, Inc.* | 3,102 | 149,144 | ||||||
Dice Holdings, Inc.* | 858 | 6,220 | ||||||
eBay, Inc.* | 95,764 | 5,256,486 | ||||||
Equinix, Inc.* | 2,481 | 440,253 | ||||||
Facebook, Inc., Class A* | 301,542 | 16,482,286 | ||||||
Google, Inc., Class A* | 35,707 | 40,017,192 | ||||||
IAC/InterActiveCorp | 2,244 | 154,140 | ||||||
j2 Global, Inc. | 3,234 | 161,732 | ||||||
LinkedIn Corp., Class A* | 7,272 | $ | 1,576,788 | |||||
Liquidity Services, Inc.* | 792 | 17,947 | ||||||
LivePerson, Inc.* | 3,630 | 53,797 | ||||||
Move, Inc.* | 3,168 | 50,656 | ||||||
NIC, Inc. | 4,092 | 101,768 | ||||||
Pandora Media, Inc.* | 7,787 | 207,134 | ||||||
Rackspace Hosting, Inc.* | 3,894 | 152,372 | ||||||
Stamps.com, Inc.* | 726 | 30,565 | ||||||
support.com, Inc.* | 1,716 | 6,504 | ||||||
Twitter, Inc.* | 2,800 | 178,220 | ||||||
VeriSign, Inc.* | 6,732 | 402,439 | ||||||
Vocus, Inc.* | 858 | 9,773 | ||||||
XO Group, Inc.* | 1,518 | 22,557 | ||||||
Yelp, Inc.* | 68,700 | 4,736,865 | ||||||
Zix Corp.* | 6,336 | 28,892 | ||||||
|
| |||||||
| 73,859,807 | ||||||||
|
| |||||||
IT Services (4.5%) | ||||||||
Accenture plc, Class A | 28,444 | 2,338,666 | ||||||
Alliance Data Systems Corp.* | 2,165 | 569,243 | ||||||
Automatic Data Processing, Inc. | 21,487 | 1,736,364 | ||||||
Booz Allen Hamilton Holding Corp. | 6,864 | 131,446 | ||||||
Broadridge Financial Solutions, Inc. | 8,559 | 338,252 | ||||||
Cardtronics, Inc.* | 660 | 28,677 | ||||||
Cass Information Systems, Inc. | 399 | 26,873 | ||||||
Cognizant Technology Solutions Corp., Class A* | 30,246 | 3,054,241 | ||||||
CSG Systems International, Inc. | 990 | 29,106 | ||||||
DST Systems, Inc. | 2,244 | 203,620 | ||||||
ExlService Holdings, Inc.* | 792 | 21,875 | ||||||
Fidelity National Information Services, Inc. | 2,706 | 145,258 | ||||||
Fiserv, Inc.* | 11,100 | 655,455 | ||||||
FleetCor Technologies, Inc.* | 2,706 | 317,062 | ||||||
Forrester Research, Inc. | 858 | 32,827 | ||||||
Gartner, Inc.* | 3,432 | 243,844 | ||||||
Genpact Ltd.* | 6,534 | 120,030 | ||||||
Global Payments, Inc. | 4,620 | 300,254 | ||||||
Hackett Group, Inc. | 2,178 | 13,525 | ||||||
Heartland Payment Systems, Inc. | 3,102 | 154,604 | ||||||
iGATE Corp.* | 1,188 | 47,710 | ||||||
International Business Machines Corp. | 46,048 | 8,637,223 | ||||||
Jack Henry & Associates, Inc. | 3,828 | 226,656 | ||||||
Lender Processing Services, Inc. | 2,310 | 86,348 | ||||||
Lionbridge Technologies, Inc.* | 6,204 | 36,976 | ||||||
MasterCard, Inc., Class A | 13,062 | 10,912,778 | ||||||
MAXIMUS, Inc. | 3,867 | 170,109 | ||||||
MoneyGram International, Inc.* | 849 | 17,642 | ||||||
NeuStar, Inc., Class A* | 2,904 | 144,793 | ||||||
Paychex, Inc. | 13,973 | 636,191 | ||||||
Syntel, Inc.* | 1,848 | 168,076 | ||||||
Teradata Corp.* | 8,240 | 374,838 | ||||||
Total System Services, Inc. | 6,402 | 213,058 | ||||||
Vantiv, Inc., Class A* | 17,290 | 563,827 | ||||||
Virtusa Corp.* | 330 | 12,570 | ||||||
Visa, Inc., Class A | 74,195 | 16,521,743 | ||||||
Western Union Co. | 31,387 | 541,426 | ||||||
WEX, Inc.* | 1,782 | 176,471 | ||||||
|
| |||||||
| 49,949,657 | ||||||||
|
| |||||||
See Notes to Financial Statements.
16
AXA PREMIER VIP TRUST
MULTIMANAGER AGGRESSIVE EQUITY PORTFOLIO
PORTFOLIO OF INVESTMENTS (Continued)
December 31, 2013
Number of Shares | Value (Note 1) | |||||||
Office Electronics (0.0%) | ||||||||
Zebra Technologies Corp., Class A* | 2,574 | $ | 139,202 | |||||
|
| |||||||
Semiconductors & Semiconductor Equipment (1.6%) |
| |||||||
Advanced Micro Devices, Inc.* | 28,906 | 111,866 | ||||||
Altera Corp. | 4,866 | 158,291 | ||||||
Analog Devices, Inc. | 5,873 | 299,112 | ||||||
Applied Materials, Inc. | 35,110 | 621,096 | ||||||
ASML Holding N.V. | 30,081 | 2,818,590 | ||||||
Atmel Corp.* | 22,504 | 176,206 | ||||||
Avago Technologies Ltd. | 10,625 | 561,956 | ||||||
Broadcom Corp., Class A | 83,621 | 2,479,363 | ||||||
Cabot Microelectronics Corp.* | 140 | 6,398 | ||||||
Cree, Inc.* | 56,774 | 3,552,349 | ||||||
Cypress Semiconductor Corp.* | 8,843 | 92,852 | ||||||
Exar Corp.* | 198 | 2,334 | ||||||
Freescale Semiconductor Ltd.* | 8,249 | 132,397 | ||||||
GT Advanced Technologies, Inc.* | 1,122 | 9,784 | ||||||
Intel Corp. | 49,031 | 1,272,845 | ||||||
Lam Research Corp.* | 2,943 | 160,246 | ||||||
Linear Technology Corp. | 12,633 | 575,433 | ||||||
LSI Corp. | 26,266 | 289,451 | ||||||
Maxim Integrated Products, Inc. | 12,860 | 358,923 | ||||||
Micrel, Inc. | 282 | 2,783 | ||||||
Microchip Technology, Inc. | 9,623 | 430,629 | ||||||
Monolithic Power Systems, Inc.* | 2,676 | 92,750 | ||||||
NVE Corp.* | 264 | 15,386 | ||||||
ON Semiconductor Corp.* | 18,941 | 156,074 | ||||||
Power Integrations, Inc. | 1,848 | 103,155 | ||||||
Rambus, Inc.* | 5,940 | 56,252 | ||||||
Semtech Corp.* | 3,234 | 81,756 | ||||||
Skyworks Solutions, Inc.* | 9,895 | 282,601 | ||||||
SunEdison, Inc.* | 1,386 | 18,087 | ||||||
Texas Instruments, Inc. | 49,081 | 2,155,147 | ||||||
Ultratech, Inc.* | 1,254 | 36,366 | ||||||
Veeco Instruments, Inc.* | 1,518 | 49,957 | ||||||
Xilinx, Inc. | 12,077 | 554,576 | ||||||
|
| |||||||
| 17,715,011 | ||||||||
|
| |||||||
Software (5.9%) | ||||||||
Actuate Corp.* | 3,234 | 24,934 | ||||||
Adobe Systems, Inc.* | 8,670 | 519,160 | ||||||
Advent Software, Inc | 1,848 | 64,661 | ||||||
American Software, Inc., Class A | 792 | 7,817 | ||||||
ANSYS, Inc.* | 4,977 | 433,994 | ||||||
Aspen Technology, Inc.* | 4,026 | 168,287 | ||||||
Autodesk, Inc.* | 33,233 | 1,672,617 | ||||||
Blackbaud, Inc. | 3,300 | 124,245 | ||||||
Bottomline Technologies (de), Inc.* | 1,727 | 62,448 | ||||||
Cadence Design Systems, Inc.* | 12,605 | 176,722 | ||||||
Citrix Systems, Inc.* | 38,667 | 2,445,688 | ||||||
CommVault Systems, Inc.* | 2,046 | 153,204 | ||||||
Concur Technologies, Inc.* | 1,914 | 197,487 | ||||||
Ebix, Inc. | 990 | 14,573 | ||||||
Electronic Arts, Inc.* | 10,295 | 236,167 | ||||||
EPIQ Systems, Inc. | 1,981 | 32,112 | ||||||
FactSet Research Systems, Inc. | 2,376 | 257,986 | ||||||
Fortinet, Inc.* | 5,610 | 107,319 | ||||||
Guidewire Software, Inc.* | 2,838 | 139,261 | ||||||
Infoblox, Inc.* | $ | 120,240 | $ | 3,970,325 | ||||
Informatica Corp.* | 5,016 | 208,164 | ||||||
Interactive Intelligence Group, Inc.* | 726 | 48,903 | ||||||
Intuit, Inc. | 14,233 | 1,086,263 | ||||||
Manhattan Associates, Inc.* | 1,320 | 155,074 | ||||||
MICROS Systems, Inc.* | 4,554 | 261,263 | ||||||
Microsoft Corp.# | 369,349 | 13,824,733 | ||||||
NetScout Systems, Inc.* | 1,320 | 39,059 | ||||||
NetSuite, Inc.* | 46,091 | 4,748,295 | ||||||
Oracle Corp. | 157,039 | 6,008,312 | ||||||
Pegasystems, Inc. | 1,254 | 61,672 | ||||||
PROS Holdings, Inc.* | 660 | 26,334 | ||||||
PTC, Inc.* | 8,843 | 312,954 | ||||||
Qlik Technologies, Inc.* | 3,300 | 87,879 | ||||||
Red Hat, Inc.* | 26,636 | 1,492,681 | ||||||
Rovi Corp.* | 5,635 | 110,953 | ||||||
Salesforce.com, Inc.* | 186,707 | 10,304,359 | ||||||
ServiceNow, Inc.* | 81,646 | 4,572,992 | ||||||
SolarWinds, Inc.* | 2,855 | 108,005 | ||||||
Solera Holdings, Inc. | 3,923 | 277,591 | ||||||
Splunk, Inc.* | 73,081 | 5,018,472 | ||||||
SS&C Technologies Holdings, Inc.* | 3,564 | 157,743 | ||||||
Symantec Corp. | 22,438 | 529,088 | ||||||
Synchronoss Technologies, Inc.* | 1,122 | 34,861 | ||||||
Take-Two Interactive Software, Inc.* | 587 | 10,196 | ||||||
TIBCO Software, Inc.* | 7,752 | 174,265 | ||||||
Tyler Technologies, Inc.* | 2,046 | 208,958 | ||||||
Ultimate Software Group, Inc.* | 1,254 | 192,138 | ||||||
VASCO Data Security International, Inc.* | 1,452 | 11,224 | ||||||
VMware, Inc., Class A* | 4,016 | 360,275 | ||||||
Workday, Inc., Class A* | 65,241 | 5,425,442 | ||||||
|
| |||||||
| 66,667,155 | ||||||||
|
| |||||||
Total Information Technology | 268,188,617 | |||||||
|
| |||||||
Materials (4.0%) | ||||||||
Chemicals (3.4%) | ||||||||
Airgas, Inc. | 3,168 | 354,341 | ||||||
Albemarle Corp. | 2,342 | 148,459 | ||||||
Balchem Corp. | 1,485 | 87,170 | ||||||
Calgon Carbon Corp.* | 4,356 | 89,603 | ||||||
Celanese Corp. | 8,793 | 486,341 | ||||||
Dow Chemical Co. | 6,996 | 310,622 | ||||||
E.I. du Pont de Nemours & Co. | 40,691 | 2,643,694 | ||||||
Eastman Chemical Co. | 7,421 | 598,875 | ||||||
Ecolab, Inc. | 38,016 | 3,963,928 | ||||||
FMC Corp. | 31,309 | 2,362,577 | ||||||
Hawkins, Inc. | 588 | 21,868 | ||||||
International Flavors & Fragrances, Inc. | 4,224 | 363,180 | ||||||
Koppers Holdings, Inc. | 822 | 37,607 | ||||||
LSB Industries, Inc.* | 1,518 | 62,268 | ||||||
LyondellBasell Industries N.V., Class A | 17,951 | 1,441,106 | ||||||
Monsanto Co. | 103,223 | 12,030,641 | ||||||
NewMarket Corp. | 462 | 154,377 | ||||||
OMNOVA Solutions, Inc.* | 3,630 | 33,069 | ||||||
PolyOne Corp. | 4,686 | 165,650 | ||||||
See Notes to Financial Statements.
17
AXA PREMIER VIP TRUST
MULTIMANAGER AGGRESSIVE EQUITY PORTFOLIO
PORTFOLIO OF INVESTMENTS (Continued)
December 31, 2013
Number of Shares | Value (Note 1) | |||||||
PPG Industries, Inc. | 15,012 | $ | 2,847,176 | |||||
Praxair, Inc. | 25,007 | 3,251,660 | ||||||
Rockwood Holdings, Inc. | 3,036 | 218,349 | ||||||
RPM International, Inc. | 5,478 | 227,392 | ||||||
Scotts Miracle-Gro Co., Class A | 2,442 | 151,941 | ||||||
Sherwin-Williams Co. | 29,909 | 5,488,301 | ||||||
Sigma-Aldrich Corp. | 5,221 | 490,826 | ||||||
Valspar Corp. | 4,290 | 305,834 | ||||||
W.R. Grace & Co.* | 3,102 | 306,695 | ||||||
Westlake Chemical Corp. | 1,980 | 241,699 | ||||||
Zep, Inc. | 1,122 | 20,376 | ||||||
|
| |||||||
| 38,905,625 | ||||||||
|
| |||||||
Construction Materials (0.1%) | ||||||||
Eagle Materials, Inc. | 2,161 | 167,326 | ||||||
Martin Marietta Materials, Inc. | 2,046 | 204,478 | ||||||
United States Lime & Minerals, Inc.* | 66 | 4,037 | ||||||
Vulcan Materials Co. | 10,200 | 606,084 | ||||||
|
| |||||||
| 981,925 | ||||||||
|
| |||||||
Containers & Packaging (0.2%) | ||||||||
AEP Industries, Inc.* | 264 | 13,947 | ||||||
AptarGroup, Inc. | 2,112 | 143,215 | ||||||
Avery Dennison Corp. | 2,772 | 139,127 | ||||||
Ball Corp. | 7,919 | 409,095 | ||||||
Bemis Co., Inc. | 3,036 | 124,355 | ||||||
Berry Plastics Group, Inc.* | 5,082 | 120,901 | ||||||
Crown Holdings, Inc.* | 5,412 | 241,213 | ||||||
Graphic Packaging Holding Co.* | 15,179 | 145,718 | ||||||
Owens-Illinois, Inc.* | 5,610 | 200,726 | ||||||
Packaging Corp. of America | 4,356 | 275,648 | ||||||
Rock-Tenn Co., Class A | 3,234 | 339,602 | ||||||
Sealed Air Corp. | 8,645 | 294,362 | ||||||
Silgan Holdings, Inc. | 2,508 | 120,434 | ||||||
|
| |||||||
| 2,568,343 | ||||||||
|
| |||||||
Metals & Mining (0.2%) | ||||||||
AMCOL International Corp. | 462 | 15,699 | ||||||
Compass Minerals International, Inc. | 1,782 | 142,649 | ||||||
Freeport-McMoRan Copper & Gold, Inc. | 17,786 | 671,244 | ||||||
Nucor Corp | 19,997 | 1,067,440 | ||||||
Royal Gold, Inc. | 2,559 | 117,893 | ||||||
Southern Copper Corp. | 5,612 | 161,120 | ||||||
|
| |||||||
| 2,176,045 | ||||||||
|
| |||||||
Paper & Forest Products (0.1%) | ||||||||
Deltic Timber Corp. | 594 | 40,356 | ||||||
International Paper Co. | 16,895 | 828,362 | ||||||
|
| |||||||
| 868,718 | ||||||||
|
| |||||||
Total Materials | 45,500,656 | |||||||
|
| |||||||
Telecommunication Services (1.1%) |
| |||||||
Diversified Telecommunication Services (0.6%) |
| |||||||
Cogent Communications Group, Inc. | 3,678 | $ | 148,628 | |||||
Consolidated Communications Holdings, Inc. | 462 | 9,069 | ||||||
Level 3 Communications, Inc.* | 4,752 | 157,624 | ||||||
Lumos Networks Corp. | 1,254 | 26,334 | ||||||
tw telecom, Inc.* | 8,383 | 255,430 | ||||||
Verizon Communications, Inc. | 126,513 | 6,216,849 | ||||||
Windstream Holdings, Inc. | 24,775 | 197,704 | ||||||
|
| |||||||
| 7,011,638 | ||||||||
|
| |||||||
Wireless Telecommunication Services (0.5%) |
| |||||||
Crown Castle International Corp.* | 59,434 | 4,364,239 | ||||||
NTELOS Holdings Corp. | 1,254 | 25,368 | ||||||
SBA Communications Corp., | 6,666 | 598,874 | ||||||
|
| |||||||
| 4,988,481 | ||||||||
|
| |||||||
Total Telecommunication | 12,000,119 | |||||||
|
| |||||||
Utilities (0.1%) | ||||||||
Electric Utilities (0.0%) | ||||||||
ITC Holdings Corp. | 2,376 | 227,668 | ||||||
|
| |||||||
Gas Utilities (0.1%) | ||||||||
ONEOK, Inc. | 9,635 | 599,104 | ||||||
Questar Corp. | 5,082 | 116,835 | ||||||
|
| |||||||
| 715,939 | ||||||||
|
| |||||||
Water Utilities (0.0%) | ||||||||
Aqua America, Inc. | 6,847 | 161,521 | ||||||
|
| |||||||
Total Utilities | 1,105,128 | |||||||
|
| |||||||
Total Common Stocks (91.3%) | 1,025,978,194 | |||||||
|
| |||||||
| Principal Amount | Value (Note 1) | |||||||
LONG-TERM DEBT SECURITIES: |
| |||||||
Corporate Bond (0.0%) | ||||||||
Financials (0.0%) | ||||||||
Capital Markets (0.0%) | ||||||||
GAMCO Investors, Inc. | $ | 600 | 594 | |||||
|
| |||||||
Total Financials | 594 | |||||||
|
| |||||||
Total Corporate Bonds | 594 | |||||||
|
| |||||||
Total Long-Term Debt Securities (0.0%) | 594 | |||||||
|
| |||||||
See Notes to Financial Statements.
18
AXA PREMIER VIP TRUST
MULTIMANAGER AGGRESSIVE EQUITY PORTFOLIO
PORTFOLIO OF INVESTMENTS (Continued)
December 31, 2013
| Number of Rights | Value (Note 1) | |||||||
RIGHTS: | ||||||||
Health Care (0.0%) | ||||||||
Biotechnology (0.0%) | ||||||||
Cubist Pharmaceuticals, Inc., | 2,442 | $ | 3,297 | |||||
|
| |||||||
Health Care Equipment & Supplies (0.0%) |
| |||||||
Wright Medical Group, Inc., | 22,047 | 7,121 | ||||||
|
| |||||||
Total Rights (0.0%) | 10,418 | |||||||
|
| |||||||
Total Investments (91.3%) | 1,025,989,206 | |||||||
Other Assets Less Liabilities (8.7%) |
| 97,205,308 | ||||||
|
| |||||||
Net Assets (100%) | $ | 1,123,194,514 | ||||||
|
| |||||||
| * | Non-income producing. |
| † | Securities (totaling $30,864 or 0.0% of net assets) at fair value by management. |
| # | All, or a portion of security held by broker as collateral for financial futures contracts, with a total collateral value of $973,180. |
| (b) | Illiquid security. |
Glossary:
| ADR | — American Depositary Receipt |
At December 31, 2013, the Portfolio had the following futures contracts open: (Note 1)
Purchases | Number of Contracts | Expiration Date | Original Value | Value at 12/31/2013 | Unrealized Appreciation/ (Depreciation) | |||||||||||||||
NASDAQ 100 E-Mini Index | 271 | March-14 | $ | 18,962,548 | $ | 19,423,925 | $ | 461,377 | ||||||||||||
S&P MidCap 400 E-Mini Index | 137 | March-14 | 17,922,505 | 18,349,780 | 427,275 | |||||||||||||||
S&P 500 E-Mini Index | 457 | March-14 | 41,148,171 | 42,069,135 | 920,964 | |||||||||||||||
|
| |||||||||||||||||||
| $ | 1,809,616 | |||||||||||||||||||
|
| |||||||||||||||||||
The following is a summary of the inputs used to value the Portfolio’s assets and liabilities carried at fair value as of December 31, 2013:
The inputs or methodology used for valuing securities are not necessarily an indication of the risk associated with investing in those securities.
Various inputs are used in determining the value of the Portfolio’s investments. These inputs are summarized in the three broad levels listed below:
| Investment Type | Level 1 Quoted Prices in | Level 2 Significant Other Observable Inputs (including quoted prices for similar securities, interest rates, prepayment speeds, credit risk, etc.)(a) | Level 3 Significant Unobservable Inputs (including the Portfolio’s own assumptions in determining the fair value of investments) | Total | ||||||||||||
Assets: | ||||||||||||||||
Common Stocks | ||||||||||||||||
Consumer Discretionary | $ | 231,553,821 | $ | — | $ | — | $ | 231,553,821 | ||||||||
Consumer Staples | 63,067,188 | 493,774 | — | 63,560,962 | ||||||||||||
Energy | 53,197,502 | — | — | 53,197,502 | ||||||||||||
Financials | 50,076,151 | — | — | 50,076,151 | ||||||||||||
Health Care | 187,138,614 | — | — | † | 187,138,614 | |||||||||||
Industrials | 109,049,967 | 4,575,793 | 30,864 | 113,656,624 | ||||||||||||
Information Technology | 268,188,617 | — | — | 268,188,617 | ||||||||||||
Materials | 45,500,656 | — | — | 45,500,656 | ||||||||||||
Telecommunication Services | 12,000,119 | — | — | 12,000,119 | ||||||||||||
Utilities | 1,105,128 | — | — | 1,105,128 | ||||||||||||
Corporate Bonds | ||||||||||||||||
Financials | — | 594 | — | 594 | ||||||||||||
Futures | 1,809,616 | — | — | 1,809,616 | ||||||||||||
See Notes to Financial Statements.
19
AXA PREMIER VIP TRUST
MULTIMANAGER AGGRESSIVE EQUITY PORTFOLIO
PORTFOLIO OF INVESTMENTS (Continued)
December 31, 2013
| Investment Type | Level 1 Quoted Prices in | Level 2 Significant Other Observable Inputs (including quoted prices for similar securities, interest rates, prepayment speeds, credit risk, etc.)(a) | Level 3 Significant Unobservable Inputs (including the Portfolio’s own assumptions in determining the fair value of investments) | Total | ||||||||||||
Rights | ||||||||||||||||
Health Care | 10,418 | — | — | 10,418 | ||||||||||||
|
|
|
|
|
|
|
| |||||||||
Total Assets | $ | 1,022,697,797 | $ | 5,070,161 | $ | 30,864 | $ | 1,027,798,822 | ||||||||
|
|
|
|
|
|
|
| |||||||||
Total Liabilities | $ | — | $ | — | $ | — | $ | — | ||||||||
|
|
|
|
|
|
|
| |||||||||
Total | $ | 1,022,697,797 | $ | 5,070,161 | $ | 30,864 | $ | 1,027,798,822 | ||||||||
|
|
|
|
|
|
|
| |||||||||
† Value is zero.
(a) A security with a market value of $493,774 transferred from Level 1 to Level 2 during the year ended December 31, 2013 due to inactive trading.
There were no additional transfers between Levels 1, 2 or 3 during the year ended December 31, 2013.
Fair Values of Derivative Instruments as of December 31, 2013:
Statement of Assets and Liabilities | ||||||
Derivatives Not Accounted for as Hedging | Asset Derivatives | Fair Value | ||||
Interest rate contracts | Receivables, Net assets - Unrealized appreciation | $ | — | * | ||
Foreign exchange contracts | Receivables | — | ||||
Credit contracts | Receivables | — | ||||
Equity contracts | Receivables, Net assets - Unrealized appreciation | 1,809,616 | * | |||
Commodity contracts | Receivables | — | ||||
Other contracts | Receivables | — | ||||
|
| |||||
Total | $ | 1,809,616 | ||||
|
| |||||
Liability Derivatives | ||||||
Interest rate contracts | Payables, Net assets - Unrealized depreciation | $ | — | * | ||
Foreign exchange contracts | Payables | — | ||||
Credit contracts | Payables | — | ||||
Equity contracts | Payables, Net assets - Unrealized depreciation | — | * | |||
Commodity contracts | Payables | — | ||||
Other contracts | Payables | — | ||||
|
| |||||
Total | $ | — | ||||
|
| |||||
| * | Includes cumulative appreciation/depreciation of futures contracts as reported in the Portfolio of Investments. Only current day’s variation margin is reported within the Statement of Assets & Liabilities. |
See Notes to Financial Statements.
20
AXA PREMIER VIP TRUST
MULTIMANAGER AGGRESSIVE EQUITY PORTFOLIO
PORTFOLIO OF INVESTMENTS (Continued)
December 31, 2013
The effect of Derivative Instruments on the Statement of Operations for the year ended December 31, 2013:
| Amount of Realized Gain or (Loss) on Derivatives Recognized in Income | ||||||||||||||||||||
Derivatives Not Accounted for as Hedging Instruments^ | Options | Futures | Forward Currency Contracts | Swaps | Total | |||||||||||||||
Interest rate contracts | $ | — | $ | — | $ | — | $ | — | $ | — | ||||||||||
Foreign exchange contracts | — | — | — | — | — | |||||||||||||||
Credit contracts | — | — | — | — | — | |||||||||||||||
Equity contracts | — | 36,059,911 | — | — | 36,059,911 | |||||||||||||||
Commodity contracts | — | — | — | — | — | |||||||||||||||
Other contracts | — | — | — | — | — | |||||||||||||||
|
|
|
|
|
|
|
|
|
| |||||||||||
Total | $ | — | $ | 36,059,911 | $ | — | $ | — | $ | 36,059,911 | ||||||||||
|
|
|
|
|
|
|
|
|
| |||||||||||
| Amount of Unrealized Appreciation or (Depreciation) on Derivatives Recognized in Income | ||||||||||||||||||||
Derivatives Not Accounted for as Hedging Instruments^ | Options | Futures | Forward Currency Contracts | Swaps | Total | |||||||||||||||
Interest rate contracts | $ | — | $ | — | $ | — | $ | — | $ | — | ||||||||||
Foreign exchange contracts | — | — | — | — | — | |||||||||||||||
Credit contracts | — | — | — | — | — | |||||||||||||||
Equity contracts | — | 1,813,745 | — | — | 1,813,745 | |||||||||||||||
Commodity contracts | — | — | — | — | — | |||||||||||||||
Other contracts | — | — | — | — | — | |||||||||||||||
|
|
|
|
|
|
|
|
|
| |||||||||||
Total | $ | — | $ | 1,813,745 | $ | — | $ | — | $ | 1,813,745 | ||||||||||
|
|
|
|
|
|
|
|
|
| |||||||||||
^ This Portfolio held futures contracts as a substitute for investing in conventional securities, hedging and in an attempt to enhance returns.
The Portfolio held futures contracts with an average notional balance of approximately $129,293,000 during the year ended December 31, 2013.
The following table presents the Portfolio’s gross derivative assets and liabilities by counterparty net of amounts available for offset under netting arrangements and any related collateral received or pledged by the Portfolio as of December 31, 2013:
Counterparty | Gross Amount of Derivative Assets Presented in the Statement of Assets and Liabilities (a) | Derivatives Available for Offset | Collateral Received | Net Amount Due from Counterparty | ||||||||||||
Exchange Traded Futures & Options Contracts (b) | $ 1,809,616 | (c) | $ | — | $ | — | $ | 1,809,616 | ||||||||
|
|
|
|
|
|
|
| |||||||||
| (a) | For financial reporting purposes the Portfolio does not offset derivative assets and derivative liabilities subject to master netting arrangements in the Statement of Assets and Liabilities. |
| (b) | These derivatives are traded on an exchange, therefore they are not subject to master netting arrangements. |
| (c) | This amount represents the cumulative appreciation (depreciation) of futures contracts as reported in the Portfolio of Investments. The Statement of Assets and Liabilities only reflects the current day variation margin receivable/payable to brokers for futures contracts. |
Investment security transactions for the year ended December 31, 2013 were as follows:
Cost of Purchases: | ||||
Long-term investments other than U.S. government debt securities | $ | 829,147,682 | ||
Net Proceeds of Sales and Redemptions: | ||||
Long-term investments other than U.S. government debt securities | $ | 928,299,099 |
See Notes to Financial Statements.
21
AXA PREMIER VIP TRUST
MULTIMANAGER AGGRESSIVE EQUITY PORTFOLIO
PORTFOLIO OF INVESTMENTS (Continued)
December 31, 2013
As of December 31, 2013, the gross unrealized appreciation (depreciation) of investments based on the aggregate cost of investments for Federal income tax purposes was as follows:
Aggregate gross unrealized appreciation | $ | 376,018,056 | ||
Aggregate gross unrealized depreciation | (3,275,465 | ) | ||
|
| |||
Net unrealized appreciation | $ | 372,742,591 | ||
|
| |||
Federal income tax cost of investments | $ | 653,246,615 | ||
|
|
For the year ended December 31, 2013, the Portfolio incurred approximately $2,412 as brokerage commissions with Sanford C. Bernstein & Co., LLC, an affiliated broker/dealer.
The Portfolio has a net capital loss carryforward of $923,463,994 of which $595,332,607 expires in the year 2016 and $328,131,387 expires in the year 2017. The Portfolio utilized net capital loss carryforward of $160,604,955 during 2013.
See Notes to Financial Statements.
22
AXA PREMIER VIP TRUST
MULTIMANAGER AGGRESSIVE EQUITY PORTFOLIO
STATEMENT OF ASSETS AND LIABILITIES
December 31, 2013
ASSETS | ||||
Investments at value (Cost $647,226,763) | $ | 1,025,989,206 | ||
Cash | 70,332,394 | |||
Foreign cash (Cost $885) | 922 | |||
Cash held as collateral at broker | 28,030,000 | |||
Dividends, interest and other receivables | 735,180 | |||
Due from broker for futures variation margin | 291,750 | |||
Receivable for securities sold | 210,642 | |||
Receivable from Separate Accounts for Trust shares sold | 138,644 | |||
Other assets | 3,877 | |||
|
| |||
Total assets | 1,125,732,615 | |||
|
| |||
LIABILITIES | ||||
Payable for securities purchased | 884,016 | |||
Payable to Separate Accounts for Trust shares redeemed | 554,397 | |||
Investment management fees payable | 545,882 | |||
Distribution fees payable - Class A | 214,177 | |||
Administrative fees payable | 172,691 | |||
Trustees’ fees payable | 53,312 | |||
Distribution fees payable - Class B | 17,773 | |||
Accrued expenses | 95,853 | |||
|
| |||
Total liabilities | 2,538,101 | |||
|
| |||
NET ASSETS | $ | 1,123,194,514 | ||
|
| |||
Net assets were comprised of: | ||||
Paid in capital | $ | 1,695,700,212 | ||
Accumulated undistributed net investment income (loss) | 538,614 | |||
Accumulated undistributed net realized gain (loss) on investments, futures and foreign currency transactions | (953,616,408 | ) | ||
Net unrealized appreciation (depreciation) on investments, futures and foreign currency translations | 380,572,096 | |||
|
| |||
Net assets | $ | 1,123,194,514 | ||
|
| |||
Class A | ||||
Net asset value, offering and redemption price per share, $1,029,123,306 / 25,742,251 shares outstanding (unlimited amount authorized: $0.001 par value) | $ | 39.98 | ||
|
| |||
Class B | ||||
Net asset value, offering and redemption price per share, $85,890,228 / 2,188,065 shares outstanding (unlimited amount authorized: $0.001 par value) | $ | 39.25 | ||
|
| |||
Class K | ||||
Net asset value, offering and redemption price per share, $8,180,980 / 204,639 shares outstanding (unlimited amount authorized: $0.001 par value) | $ | 39.98 | ||
|
| |||
STATEMENT OF OPERATIONS
For the Year Ended December 31, 2013
INVESTMENT INCOME | ||||
Dividends (net of $17,478 foreign withholding tax) | $ | 14,359,066 | ||
Interest | 127,798 | |||
|
| |||
Total income | 14,486,864 | |||
|
| |||
EXPENSES | ||||
Investment management fees | 7,492,935 | |||
Distribution fees - Class A | 2,335,947 | |||
Administrative fees | 1,973,756 | |||
Distribution fees - Class B | 881,461 | |||
Custodian fees | 247,900 | |||
Printing and mailing expenses | 168,702 | |||
Professional fees | 106,964 | |||
Trustees’ fees | 30,244 | |||
Miscellaneous | 46,427 | |||
|
| |||
Gross expenses | 13,284,336 | |||
Less: Fees paid indirectly | (51,877 | ) | ||
|
| |||
Net expenses | 13,232,459 | |||
|
| |||
NET INVESTMENT INCOME (LOSS) | 1,254,405 | |||
|
| |||
REALIZED AND UNREALIZED GAIN (LOSS) | ||||
Realized gain (loss) on: | ||||
Investments | 288,434,804 | |||
Futures | 36,059,911 | |||
Foreign currency transactions | (570 | ) | ||
|
| |||
Net realized gain (loss) | 324,494,145 | |||
|
| |||
Change in unrealized appreciation (depreciation) on: | ||||
Investments | 85,422,618 | |||
Futures | 1,813,745 | |||
Foreign currency translations | (280 | ) | ||
|
| |||
Net change in unrealized appreciation (depreciation) | 87,236,083 | |||
|
| |||
NET REALIZED AND UNREALIZED GAIN (LOSS) | 411,730,228 | |||
|
| |||
NET INCREASE (DECREASE) IN NET ASSETS RESULTING FROM OPERATIONS | $ | 412,984,633 | ||
|
| |||
See Notes to Financial Statements.
23
AXA PREMIER VIP TRUST
MULTIMANAGER AGGRESSIVE EQUITY PORTFOLIO
STATEMENT OF CHANGES IN NET ASSETS
| Year Ended December 31, | ||||||||
| 2013 | 2012 | |||||||
INCREASE (DECREASE) IN NET ASSETS FROM OPERATIONS: | ||||||||
Net investment income (loss) | $ | 1,254,405 | $ | 3,333,327 | ||||
Net realized gain (loss) on investments, futures and foreign currency transactions | 324,494,145 | 73,238,047 | ||||||
Net change in unrealized appreciation (depreciation) on investments, futures and foreign currency translations | 87,236,083 | 118,756,236 | ||||||
|
|
|
| |||||
NET INCREASE (DECREASE) IN NET ASSETS RESULTING FROM OPERATIONS | 412,984,633 | 195,327,610 | ||||||
|
|
|
| |||||
DIVIDENDS: | ||||||||
Dividends from net investment income | ||||||||
Class A | (1,067,632 | ) | (2,024,059 | ) | ||||
Class B | (87,745 | ) | (1,334,695 | ) | ||||
Class K | (28,053 | ) | (31,588 | ) | ||||
|
|
|
| |||||
TOTAL DIVIDENDS | (1,183,430 | ) | (3,390,342 | ) | ||||
|
|
|
| |||||
CAPITAL SHARES TRANSACTIONS: | ||||||||
Class A | ||||||||
Capital shares sold [ 404,099 and 616,503 shares, respectively ] | 13,650,458 | 17,606,653 | ||||||
Capital shares issued in reinvestment of dividends [ 27,784 and 68,660 shares, respectively ] | 1,067,632 | 2,024,059 | ||||||
Capital shares repurchased [ (3,588,854) and (4,153,212) shares, respectively ] | (122,246,940 | ) | (118,766,187 | ) | ||||
Capital shares repurchased in-kind (Note 10)[ (207,266) and 0 shares, respectively ] | (7,208,083 | ) | — | |||||
|
|
|
| |||||
Total Class A transactions | (114,736,933 | ) | (99,135,475 | ) | ||||
|
|
|
| |||||
Class B | ||||||||
Capital shares sold [ 441,195 and 693,080 shares, respectively ] | 14,640,671 | 19,359,429 | ||||||
Capital shares issued in reinvestment of dividends [ 2,326 and 46,093 shares, respectively ] | 87,745 | 1,334,695 | ||||||
Capital shares repurchased [ (2,047,167) and (3,438,712) shares, respectively ] | (65,605,192 | ) | (96,567,204 | ) | ||||
Capital shares repurchased in-kind (Note 10)[ (15,726,976) and 0 shares, respectively ] | (537,225,889 | ) | — | |||||
|
|
|
| |||||
Total Class B transactions | (588,102,665 | ) | (75,873,080 | ) | ||||
|
|
|
| |||||
Class K | ||||||||
Capital shares sold [ 34,653 and 36,716 shares, respectively ] | 1,177,003 | 1,044,295 | ||||||
Capital shares issued in reinvestment of dividends [ 730 and 1,072 shares, respectively ] | 28,053 | 31,588 | ||||||
Capital shares repurchased [ (50,272) and (212,438) shares, respectively ] | (1,702,001 | ) | (6,077,302 | ) | ||||
Capital shares repurchased in-kind (Note 10)[ (3) and 0 shares, respectively ] | (111 | ) | — | |||||
|
|
|
| |||||
Total Class K transactions | (497,056 | ) | (5,001,419 | ) | ||||
|
|
|
| |||||
NET INCREASE (DECREASE) IN NET ASSETS RESULTING FROM CAPITAL SHARE TRANSACTIONS | (703,336,654 | ) | (180,009,974 | ) | ||||
|
|
|
| |||||
TOTAL INCREASE (DECREASE) IN NET ASSETS | (291,535,451 | ) | 11,927,294 | |||||
NET ASSETS: | ||||||||
Beginning of year | 1,414,729,965 | 1,402,802,671 | ||||||
|
|
|
| |||||
End of year (a) | $ | 1,123,194,514 | $ | 1,414,729,965 | ||||
|
|
|
| |||||
(a) Includes accumulated undistributed (overdistributed) net investment income (loss) of | $ | 538,614 | $ | 624,633 | ||||
|
|
|
| |||||
See Notes to Financial Statements.
24
AXA PREMIER VIP TRUST
MULTIMANAGER AGGRESSIVE EQUITY PORTFOLIO(p)(q)
FINANCIAL HIGHLIGHTS
| Year Ended December 31, | ||||||||||||||||||||
| Class A | 2013 | 2012 | 2011 | 2010 | 2009 | |||||||||||||||
Net asset value, beginning of year | $ | 29.17 | $ | 25.60 | $ | 27.32 | $ | 23.37 | $ | 17.03 | ||||||||||
|
|
|
|
|
|
|
|
|
| |||||||||||
Income (loss) from investment operations: | ||||||||||||||||||||
Net investment income (loss) | 0.03 | (e) | 0.06 | (e) | 0.06 | (e) | 0.14 | (e) | 0.19 | (e) | ||||||||||
Net realized and unrealized gain (loss) on investments, futures and foreign currency transactions | 10.82 | 3.58 | (1.73 | ) | 4.03 | 6.23 | ||||||||||||||
|
|
|
|
|
|
|
|
|
| |||||||||||
Total from investment operations | 10.85 | 3.64 | (1.67 | ) | 4.17 | 6.42 | ||||||||||||||
|
|
|
|
|
|
|
|
|
| |||||||||||
Less distributions: | ||||||||||||||||||||
Dividends from net investment income | (0.04 | ) | (0.07 | ) | (0.05 | ) | (0.22 | ) | (0.08 | ) | ||||||||||
|
|
|
|
|
|
|
|
|
| |||||||||||
Net asset value, end of year | $ | 39.98 | $ | 29.17 | $ | 25.60 | $ | 27.32 | $ | 23.37 | ||||||||||
|
|
|
|
|
|
|
|
|
| |||||||||||
Total return | 37.21 | % | 14.21 | % | (6.12 | )% | 17.92 | %(aa) | 37.69 | % | ||||||||||
|
|
|
|
|
|
|
|
|
| |||||||||||
Ratios/Supplemental Data: | ||||||||||||||||||||
Net assets, end of year (000’s) | $ | 1,029,123 | $ | 849,059 | $ | 833,975 | $ | 1,009,682 | $ | 914,031 | ||||||||||
Ratio of expenses to average net assets: | ||||||||||||||||||||
After fees paid indirectly | 1.03 | % | 1.00 | % | 0.74 | % | 0.76 | % | 0.67 | % | ||||||||||
Before fees paid indirectly | 1.03 | % | 1.01 | % | 0.75 | % | 0.77 | % | 0.82 | % | ||||||||||
Ratio of net investment income (loss) to average net assets: | ||||||||||||||||||||
After fees paid indirectly | 0.09 | % | 0.23 | % | 0.21 | % | 0.56 | % | 0.96 | % | ||||||||||
Before fees paid indirectly | 0.09 | % | 0.22 | % | 0.20 | % | 0.55 | % | 0.81 | % | ||||||||||
Portfolio turnover rate | 72 | % | 72 | % | 74 | % | 54 | % | 91 | % | ||||||||||
| Year Ended December 31, | ||||||||||||||||||||
| Class B | 2013 | 2012 | 2011 | 2010 | 2009 | |||||||||||||||
Net asset value, beginning of year | $ | 28.65 | $ | 25.15 | $ | 26.85 | $ | 22.97 | $ | 16.74 | ||||||||||
|
|
|
|
|
|
|
|
|
| |||||||||||
Income (loss) from investment operations: | ||||||||||||||||||||
Net investment income (loss) | 0.03 | (e) | 0.06 | (e) | (0.01 | )(e) | — | #(e) | 0.16 | (e) | ||||||||||
Net realized and unrealized gain (loss) on investments, futures and foreign currency transactions | 10.61 | 3.51 | (1.69 | ) | 4.03 | 6.09 | ||||||||||||||
|
|
|
|
|
|
|
|
|
| |||||||||||
Total from investment operations | 10.64 | 3.57 | (1.70 | ) | 4.03 | 6.25 | ||||||||||||||
|
|
|
|
|
|
|
|
|
| |||||||||||
Less distributions: | ||||||||||||||||||||
Dividends from net investment income | (0.04 | ) | (0.07 | ) | — | (0.15 | ) | (0.02 | ) | |||||||||||
|
|
|
|
|
|
|
|
|
| |||||||||||
Net asset value, end of year | $ | 39.25 | $ | 28.65 | $ | 25.15 | $ | 26.85 | $ | 22.97 | ||||||||||
|
|
|
|
|
|
|
|
|
| |||||||||||
Total return | 37.14 | % | 14.19 | % | (6.33 | )% | 17.63 | %(bb) | 37.34 | % | ||||||||||
|
|
|
|
|
|
|
|
|
| |||||||||||
Ratios/Supplemental Data: | ||||||||||||||||||||
Net assets, end of year (000’s) | $ | 85,890 | $ | 559,267 | $ | 558,736 | $ | 696,114 | $ | 430,402 | ||||||||||
Ratio of expenses to average net assets: | ||||||||||||||||||||
After fees paid indirectly | 1.03 | % | 1.00 | % | 0.99 | % | 1.01 | % | 0.92 | % | ||||||||||
Before fees paid indirectly | 1.03 | % | 1.01 | % | 1.00 | % | 1.02 | % | 1.07 | %(c) | ||||||||||
Ratio of net investment income (loss) to average net assets: | ||||||||||||||||||||
After fees paid indirectly | 0.11 | % | 0.22 | % | (0.04 | )% | (0.02 | )% | 0.79 | % | ||||||||||
Before fees paid indirectly | 0.10 | % | 0.22 | % | (0.05 | )% | (0.02 | )% | 0.65 | % | ||||||||||
Portfolio turnover rate | 72 | % | 72 | % | 74 | % | 54 | % | 91 | % | ||||||||||
See Notes to Financial Statements.
25
AXA PREMIER VIP TRUST
MULTIMANAGER AGGRESSIVE EQUITY PORTFOLIO(p)(q)
FINANCIAL HIGHLIGHTS (Continued)
| Year Ended December 31, | August 26, 2011* to December 31, 2011 | |||||||||||
| Class K | 2013 | 2012 | ||||||||||
Net asset value, beginning of period | $ | 29.17 | $ | 25.60 | $ | 24.85 | ||||||
|
|
|
|
|
| |||||||
Income (loss) from investment operations: | ||||||||||||
Net investment income (loss) | 0.12 | (e) | 0.12 | (e) | 0.03 | (e) | ||||||
Net realized and unrealized gain (loss) on investments, futures and foreign currency transactions | 10.83 | 3.59 | 0.77 | |||||||||
|
|
|
|
|
| |||||||
Total from investment operations | 10.95 | 3.71 | 0.80 | |||||||||
|
|
|
|
|
| |||||||
Less distributions: | ||||||||||||
Dividends from net investment income | (0.14 | ) | (0.14 | ) | (0.05 | ) | ||||||
|
|
|
|
|
| |||||||
Net asset value, end of period | $ | 39.98 | $ | 29.17 | $ | 25.60 | ||||||
|
|
|
|
|
| |||||||
Total return (b) | 37.55 | % | 14.50 | % | 3.21 | % | ||||||
|
|
|
|
|
| |||||||
Ratios/Supplemental Data: | ||||||||||||
Net assets, end of period (000’s) | $ | 8,181 | $ | 6,404 | $ | 10,092 | ||||||
Ratio of expenses to average net assets: | ||||||||||||
After fees paid indirectly (a) | 0.78 | % | 0.75 | % | 0.74 | % | ||||||
Before fees paid indirectly (a) | 0.78 | % | 0.76 | % | 0.75 | % | ||||||
Ratio of net investment income (loss) to average net assets: | ||||||||||||
After fees paid indirectly (a) | 0.34 | % | 0.43 | % | 0.37 | % | ||||||
Before fees paid indirectly(a) | 0.34 | % | 0.42 | % | 0.37 | % | ||||||
Portfolio turnover rate | 72 | % | 72 | % | 74 | % | ||||||
| * | Commencement of Operations. |
| # | Per share amount is less than $0.005. |
| (a) | Ratios for periods less than one year are annualized. |
| (b) | Total returns for periods less than one year are not annualized. |
| (c) | Reflects overall fund ratios for non-class specific expenses. |
| (e) | Net investment income (loss) per share is based on average shares outstanding. |
| (p) | On September 18, 2009, this Portfolio received, through a substitution transaction, the assets and liabilities of the Multimanager Health Care Portfolio that followed the same objectives as this Portfolio. |
| (q) | On September 17, 2010, this Portfolio received, through a substitution transaction, the assets and liabilities of Multimanager Large Cap Growth Portfolio that followed the same objectives as this Portfolio. |
| (aa) | Includes a gain incurred resulting from a litigation payment. Without this gain, the total return would have been 17.83%. |
| (bb) | Includes a gain incurred resulting from a litigation payment. Without this gain, the total return would have been 17.58%. |
See Notes to Financial Statements.
26
MULTIMANAGER CORE BOND PORTFOLIO (Unaudited)
PORTFOLIO ADVISERS
| Ø | BlackRock Financial Management, Inc. |
| Ø | Pacific Investment Management Company LLC |
| Ø | SSgA Funds Management, Inc. |
PERFORMANCE RESULTS
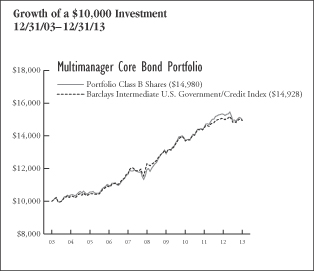
| Annualized Total Returns as of 12/31/13 | ||||||||||||
1 Year | 5 Years | 10 Years/ Since Incept. | ||||||||||
Portfolio – Class A Shares* | (2.33 | )% | 4.79 | % | 4.33 | % | ||||||
Portfolio – Class B Shares* | (2.31 | ) | 4.63 | 4.12 | ||||||||
Portfolio – Class K Shares** | (2.08 | ) | N/A | 2.00 | ||||||||
Barclays Intermediate U.S. Government/Credit Index | (0.86 | ) | 3.96 | 4.09 | ||||||||
* Date of inception 12/31/01.
** Date of inception 8/26/11.
Returns for periods greater than one year are annualized. |
| |||||||||||
Past performance is not indicative of future results.
PERFORMANCE SUMMARY
The Portfolio’s Class A shares returned (2.33)% for the year ended December 31, 2013. The Portfolio’s benchmark, the Barclays Intermediate U.S. Government/Credit Index, returned (0.86)% over the same period.
Portfolio Highlights
For the year ended December 31, 2013
What helped performance during the year:
| • | The Portfolio benefited from exposure to high quality securitized sectors such as commercial mortgage-backed securities (CMBS), asset-backed securities (ABS) and non-agency mortgage-backed securities (MBS). |
| • | Non-agency MBS appreciated due to limited supply and an ongoing housing recovery. |
| • | In corporate credit, the Portfolio benefited from exposures to high yield, as spreads narrowed. |
| • | Currency positions that benefited from the depreciation of the Japanese yen against the U.S. dollar added to performance, as did non-dollar exposure from Euro denominated positions in Italian sovereign debt. |
| • | Holdings of Build America Bonds were additive, as they outperformed tax-exempt municipals for the year. |
What hurt performance during the year:
| • | Duration positioning throughout the year, including an overweight to intermediate maturities, was a negative for the Portfolio. |
| • | Holdings of Treasury Inflation-Protected Bonds (TIPS) detracted, as breakeven levels narrowed for the year. |
| • | Allocation to agency mortgage-backed securities (MBS), particularly 30-year agency pass throughs, was detrimental due to rising interest rates. |
| • | Modest exposure to the Brazilian real, which depreciated versus the U.S. dollar, detracted from Portfolio performance. |
| Portfolio Characteristics | ||||
| As of December 31, 2013 | ||||
Weighted Average Life (Years) | 5.28 | |||
Weighted Average Coupon (%) | 3.09 | |||
Weighted Average Modified Duration (Years)* | 4.38 | |||
Weighted Average Rating | AA | |||
* Modified duration is a measure of the price sensitivity of the Portfolio to interest rate movements, taking into account specific features of the securities in which it invests. |
| |||
27
MULTIMANAGER CORE BOND PORTFOLIO (Unaudited)
| Distribution of Assets by Sector as of December 31, 2013 | % of Net Assets | |||
Government Securities | 71.6 | % | ||
Corporate Bonds | 25.4 | |||
Asset-Backed and Mortgage-Backed Securities | 7.9 | |||
Convertible Preferred Stocks | 0.3 | |||
Options Purchased | 0.0 | # | ||
Cash and Other | (5.2 | ) | ||
|
| |||
Total | 100.0 | % | ||
|
| |||
# Less than 0.05% | ||||
UNDERSTANDING YOUR EXPENSES:
As a shareholder of the Portfolio, you incur two types of costs:
(1)transaction costs, including applicable sales charges and redemption fees; and (2)ongoing costs, including management fees, distribution (12b-1) fees (in the case of Class A and Class B shares of the Trust), and other Portfolio expenses. These examples are intended to help you understand your ongoing costs (in dollars) of investing in the Portfolio and to compare these costs with the ongoing costs of investing in other mutual funds.
The examples are based on an investment of $1,000 invested at the beginning of the six-month period ended December 31, 2013 and held for the entire six-month period.
Actual Expenses
The first line of the table to the right provides information about actual account values and actual expenses. You may use the information in this line, together with the amount you invested, to estimate the expenses that you paid over the period. Simply divide your account value by $1,000 (for example, an $8,600 account value divided by $1,000 = 8.6), then multiply the result by the number in the first line under the heading entitled ‘‘Expenses Paid During Period’’ to estimate the expenses you paid on your account during this period.
Hypothetical Example for Comparison Purposes
The second line of the table below provides information about hypothetical account values and hypothetical expenses based on the Portfolio’s actual expense ratio and an assumed rate of return of 5% per year before expenses, which is not the Portfolio’s actual return. The hypothetical account values and expenses may not be used to estimate the actual ending account balance or expenses you paid for the period. You may use this information to compare the ongoing costs of investing in the Portfolio and other funds. To do so, compare this 5% hypothetical example with the 5% hypothetical examples that appear in the shareholder reports of the other funds.
Please note that the expenses shown in the table are meant to highlight your ongoing costs only and do not reflect any transactional costs, such as sales charges (loads), redemption fees, or exchange fees. Therefore, the second line of the table is useful in comparing ongoing costs only, and will not help you determine the relative total costs of owning different funds. In addition, if these transactional costs were included, your costs would have been higher. Also note that the table does not reflect any variable life insurance or variable annuity contract-related fees and expenses, which would increase overall fees and expenses.
EXAMPLE
| Beginning Account Value 7/1/13 | Ending Account Value 12/31/13 | Expenses Paid During Period* 7/1/13 - 12/31/13 | ||||||||||
Class A | ||||||||||||
Actual | $1,000.00 | $1,001.66 | $5.21 | |||||||||
Hypothetical (5% average annual return before expenses) | 1,000.00 | 1,020.00 | 5.25 | |||||||||
Class B | ||||||||||||
Actual | 1,000.00 | 1,001.71 | 5.12 | |||||||||
Hypothetical (5% average annual return before expenses) | 1,000.00 | 1,020.09 | 5.17 | |||||||||
Class K | ||||||||||||
Actual | 1,000.00 | 1,002.91 | 3.95 | |||||||||
Hypothetical (5% average annual return before expenses) | 1,000.00 | 1,021.26 | 3.99 | |||||||||
* Expenses are equal to the Portfolio’s Class A, Class B and Class K shares annualized expense ratios of 1.00%, 1.00% and 0.75%, respectively, multiplied by the average account value over the period, and multiplied by 184/365 (to reflect the one-half year period). |
| |||||||||||
28
AXA PREMIER VIP TRUST
MULTIMANAGER CORE BOND PORTFOLIO
PORTFOLIO OF INVESTMENTS
December 31, 2013
| Principal Amount | Value (Note 1) | |||||||
LONG-TERM DEBT SECURITIES: |
| |||||||
Asset-Backed and Mortgage-Backed Securities (7.9%) |
| |||||||
Asset-Backed Securities (2.7%) | ||||||||
321 Henderson Receivables, LLC | ||||||||
Series 2010-1A A | $ | 498,866 | $ | 561,365 | ||||
Series 2010-2A A | 343,804 | 361,460 | ||||||
Series 2010-3A A | 273,256 | 284,198 | ||||||
AmeriCredit Automobile Receivables Trust, |
| |||||||
Series 2012-2 C | 92,000 | 94,059 | ||||||
Series 2012-5 C | 145,000 | 144,474 | ||||||
Auto ABS Compartiment, | ||||||||
Series 2012-2 A | EUR | 117,667 | 163,888 | |||||
Black Diamond CLO Delaware Corp., |
| |||||||
Series 2005-1A A1A | $ | 7,371 | 7,371 | |||||
BlueMountain CLO Ltd., | ||||||||
Series 2005-1A A1F | 71,176 | 70,976 | ||||||
Chesapeake Funding LLC, | ||||||||
Series 2012-1A B | 220,000 | 221,513 | ||||||
Series 2012-1A C | 200,000 | 201,077 | ||||||
EFS Volunteer LLC, | ||||||||
Series 2010-1 A1 | 355,654 | 357,819 | ||||||
Ford Credit Floorplan Master Owner Trust, |
| |||||||
Series 2012-1 C | 125,000 | 125,013 | ||||||
Series 2012-1 D | 116,000 | 116,016 | ||||||
Series 2012-2 C | 100,000 | 102,603 | ||||||
Series 2012-2 D | 145,000 | 149,532 | ||||||
Series 2012-4 D | 116,000 | 116,219 | ||||||
Series 2012-5 C | 218,000 | 216,900 | ||||||
Series 2013-1 D | 288,000 | 286,750 | ||||||
GSAA Home Equity Trust, | ||||||||
Series 2005-11 2A1 | 349,875 | 321,694 | ||||||
Series 2006-5 2A1 | 25,581 | 15,233 | ||||||
Hilton USA Trust, | ||||||||
Series 2013-HLT X1FX | 1,655,000 | 27,177 | ||||||
HLSS Servicer Advance Receivables Backed Notes, |
| |||||||
Series 2012-T2 A2 | 100,000 | 100,660 | ||||||
Hyundai Auto Receivables Trust, | ||||||||
Series 2012-A D | 73,000 | 74,007 | ||||||
Kingsland I Ltd., | ||||||||
Series 2005-1A A1A | $ | 154,107 | $ | 154,021 | ||||
Landmark VII CDO Ltd., | ||||||||
Series 2006-7A A1L | 463,921 | 460,851 | ||||||
LB-UBS Commercial Mortgage Trust, | ||||||||
Series 2007-C7 AM | 65,000 | �� | 74,168 | |||||
Merrill Lynch Mortgage Trust, | ||||||||
Series 2007-C1 A1A | 89,820 | 95,260 | ||||||
Mid-State Trust, | ||||||||
Series 4 A | 29,986 | 30,815 | ||||||
Nelnet Student Loan Trust, | ||||||||
Series 2006-1 A5 | 364,000 | 354,399 | ||||||
Series 2008-3 A4 | 125,000 | 129,914 | ||||||
PFS Financing Corp., | ||||||||
Series 2012-AA A | 309,000 | 309,264 | ||||||
Renaissance Home Equity Loan Trust, |
| |||||||
Series 2003-3 A | 42,525 | 42,427 | ||||||
Santander Drive Auto Receivables Trust, |
| |||||||
Series 2012-AA B | 283,000 | 282,928 | ||||||
Series 2012-AA C | 490,000 | 486,598 | ||||||
Series 2013-2 B | 363,000 | 361,674 | ||||||
Series 2013-4 B | 134,000 | 135,753 | ||||||
Scholar Funding Trust, | ||||||||
Series 2011-A A | 417,630 | 417,630 | ||||||
Series 2013-A A | 491,141 | 486,841 | ||||||
SLM Private Credit Student Loan Trust, |
| |||||||
Series 2002-A A2 | 135,586 | 133,218 | ||||||
Series 2003-B A2 | 207,907 | 202,278 | ||||||
Series 2004-B A2 | 231,493 | 228,863 | ||||||
Series 2005-B A2 | 520,749 | 507,179 | ||||||
SLM Private Education Loan Trust, | ||||||||
Series 2011-C A2B | 138,000 | 147,996 | ||||||
Series 2012-A A1 | 115,354 | 116,314 | ||||||
Series 2012-C A1 | 191,914 | 192,626 | ||||||
Series 2012-C A2 | 330,000 | 342,797 | ||||||
See Notes to Financial Statements.
29
AXA PREMIER VIP TRUST
MULTIMANAGER CORE BOND PORTFOLIO
PORTFOLIO OF INVESTMENTS (Continued)
December 31, 2013
| Principal Amount | Value (Note 1) | |||||||
Series 2012-D A2 | $ | 400,000 | $ | 412,148 | ||||
Series 2012-E A1 | 128,475 | 128,341 | ||||||
Series 2012-E A2A | 320,000 | 326,858 | ||||||
Series 2013-A A1 | 83,167 | 82,786 | ||||||
Series 2013-A A2A | 524,000 | 512,461 | ||||||
Series 2013-A A2B | 355,000 | 350,042 | ||||||
Series 2013-B A1 | 225,162 | 224,501 | ||||||
Series 2013-B A2A | 305,000 | 295,465 | ||||||
SLM Student Loan Trust, | ||||||||
Series 2003-11 A6 | 250,000 | 247,545 | ||||||
Series 2008-5 A4 | 368,000 | 385,881 | ||||||
Series 2008-9 A | 4,050,056 | 4,192,178 | ||||||
Series 2011-B A2 | 130,000 | 135,757 | ||||||
Series 2013-6 A3 | 250,000 | 250,006 | ||||||
Series 2013-C A1 | 237,856 | 237,918 | ||||||
Series 2013-C A2A | 185,000 | 188,387 | ||||||
Series 2013-C A2B | 200,000 | 200,439 | ||||||
Structured Asset Receivables Trust, | ||||||||
Series 2003-2A CTFS | 976 | 976 | ||||||
Structured Receivables Finance LLC, | ||||||||
Series 2010-B A | 214,116 | 219,038 | ||||||
World Financial Network Credit Card Master Trust, |
| |||||||
Series 2010-A B | 123,000 | 132,088 | ||||||
Series 2012-C A | 268,000 | 265,723 | ||||||
Series 2012-D A | 346,000 | 335,769 | ||||||
|
| |||||||
| 18,938,125 | ||||||||
|
| |||||||
Non-Agency CMO (5.2%) | ||||||||
Alternative Loan Trust, | ||||||||
Series 2006-OA22 A1 | 110,401 | 94,066 | ||||||
Series 2006-OA6 1A2 | 67,643 | 57,275 | ||||||
Series 2007-OH1 A1D | 117,677 | 80,788 | ||||||
American Home Mortgage Investment Trust, |
| |||||||
Series 2004-3 5A | 47,889 | 46,674 | ||||||
BAMLL Commercial Mortgage Securities Trust, |
| |||||||
Series 2012-CLRN A | 100,000 | 100,366 | ||||||
Banc of America Commercial Mortgage Trust, |
| |||||||
Series 2006-5 AM | $ | 69,000 | $ | 73,751 | ||||
Series 2007-1 AMFX | 16,000 | 16,619 | ||||||
Series 2007-3 A1A | 243,653 | 267,310 | ||||||
Series 2007-3 AM | 125,000 | 137,896 | ||||||
Banc of America Commercial Mortgage, Inc., |
| |||||||
Series 2007-3 A4 | 334,000 | 369,118 | ||||||
Banc of America Re-Remic Trust, | ||||||||
Series 2009-UB1 A4A | 797,097 | 873,403 | ||||||
Series 2010-UB4 A4A | 79,033 | 84,715 | ||||||
BB-UBS Trust, | ||||||||
Series 2012-SHOW XA | 2,277,000 | 125,856 | ||||||
Series 2012-TFT A | 152,000 | 142,932 | ||||||
Bear Stearns Commercial Mortgage Securities Trust, |
| |||||||
Series 2005-PW10 AM | 76,000 | 80,895 | ||||||
Series 2006-PW14 A1A | 212,435 | 231,261 | ||||||
Series 2007-PW15 A1A | 147,931 | 161,770 | ||||||
Series 2007-PW17 A1A | 150,735 | 167,778 | ||||||
CHL Mortgage Pass-Through Trust, | ||||||||
Series 2006-OA5 2A1 | 127,518 | 97,832 | ||||||
Citigroup Commercial Mortgage Trust, |
| |||||||
Series 2013-GC15 XA | 877,631 | 64,850 | ||||||
Series 2013-SM X-A | 3,093,707 | 86,556 | ||||||
Citigroup Mortgage Loan Trust, | ||||||||
Series 2006-AR1 1A1 | 1,358,493 | 1,309,756 | ||||||
Citigroup-Deutsche Bank Commercial Mortgage Trust, |
| |||||||
Series 2007-CD5 A | 15,000 | 17,154 | ||||||
Commercial Mortgage Pass-Through Certificates, |
| |||||||
Series 2013-FL3 A | 195,000 | 195,664 | ||||||
Commercial Mortgage Trust, | ||||||||
Series 2006-C8 AM | 140,000 | 152,700 | ||||||
Series 2010-C1 A1 | 2,525,115 | 2,603,471 | ||||||
Series 2010-RR1 GEB | 100,000 | 107,850 | ||||||
Series 2012-CR1 XA | 684,732 | 81,906 | ||||||
Series 2012-LTRT A2 | 228,000 | 208,821 | ||||||
Series 2013-CR6 XA | 1,740,000 | 134,673 | ||||||
See Notes to Financial Statements.
30
AXA PREMIER VIP TRUST
MULTIMANAGER CORE BOND PORTFOLIO
PORTFOLIO OF INVESTMENTS (Continued)
December 31, 2013
| Principal Amount | Value (Note 1) | |||||||
Series 2013-GAM A2 | $ | 156,000 | $ | 151,680 | ||||
Credit Suisse Commercial Mortgage Trust, |
| |||||||
Series 2006-C3 AM | 105,000 | 113,029 | ||||||
Credit Suisse Mortgage Capital Certificates, |
| |||||||
Series 2008-C1 A2 | 56,433 | 58,579 | ||||||
Series 2010-RR1 2A | 1,740,251 | 1,899,742 | ||||||
Series 2010-RR1 3A | 1,740,251 | 1,900,191 | ||||||
Series 2010-RR2 2A | 591,000 | 649,653 | ||||||
Series 2010-RR7 2A | 920,356 | 1,001,541 | ||||||
Series 2011-4R 5A1 | 654,758 | 641,214 | ||||||
Series 2011-4R 6A1 | 292,186 | 288,699 | ||||||
CS First Boston Mortgage Securities Corp., |
| |||||||
Series 2005-C3 AJ | 134,000 | 136,338 | ||||||
DBRR Trust, | ||||||||
Series 2011-C32 A3A | 181,000 | 197,282 | ||||||
Series 2012-EZ1 A | 238,854 | 238,865 | ||||||
Series 2013-EZ3 A | 112,968 | 113,145 | ||||||
EMF-NL B.V., | ||||||||
Series 2008-2X A2 | EUR | 435,000 | 466,472 | |||||
Extended Stay America Trust, | ||||||||
Series 2013-ESFL CFL | $ | 363,000 | 362,900 | |||||
Series 2013-ESHL A27 | 121,000 | 117,347 | ||||||
First Republic Mortgage Loan Trust, |
| |||||||
Series 2001-FRB1 A | 115,618 | 113,494 | ||||||
GMAC Commercial Mortgage Securities Trust, |
| |||||||
Series 2006-C1 AM | 120,000 | 126,680 | ||||||
Greenwich Capital Commercial Funding Corp., |
| |||||||
Series 2007-GG11 A4 | 58,000 | 64,794 | ||||||
Series 2007-GG11 AM | 89,000 | 97,281 | ||||||
GS Mortgage Securities Corp. II, |
| |||||||
Series 2012-SHOP A | 250,000 | 249,860 | ||||||
Series 2013-KING XA | 1,296,072 | 46,822 | ||||||
Series 2013-KYO XB1 | 1,966,000 | 90,657 | ||||||
GS Mortgage Securities Trust, | ||||||||
Series 2006-GG8 AM | 51,000 | 55,903 | ||||||
Series 2010-C1 A2 | $ | 2,248,000 | $ | 2,418,196 | ||||
GSR Mortgage Loan Trust, | ||||||||
Series 2005-AR6 2A1 | 299,567 | 302,814 | ||||||
Series 2006-AR2 2A1 | 186,731 | 176,767 | ||||||
HomeBanc Mortgage Trust, | ||||||||
Series 2005-4 A1 | 179,122 | 156,289 | ||||||
Impac CMB Trust, | ||||||||
Series 2003-8 2A1 | 18,547 | 18,565 | ||||||
JP Morgan Chase Commercial Mortgage Securities Corp., |
| |||||||
Series 2004-CB8 A1A | 100,170 | 100,700 | ||||||
Series 2006-CB14 AM | 44,000 | 47,216 | ||||||
Series 2007-CB18 A1A | 308,357 | 339,643 | ||||||
Series 2007-LD12 A1A | 283,563 | 318,198 | ||||||
Series 2007-LDPX A1A | 247,061 | 273,083 | ||||||
Series 2008-C2 ASB | 146,275 | 156,738 | ||||||
Series 2012-CBX XA | 647,207 | 63,680 | ||||||
JP Morgan Mortgage Trust, | ||||||||
Series 2006-A3 6A1 | 188,250 | 185,868 | ||||||
Series 2007-A1 3A3 | 190,411 | 191,066 | ||||||
LB-UBS Commercial Mortgage Trust, |
| |||||||
Series 2004-C7 A1A | 283,755 | 290,295 | ||||||
Series 2005-C2 AJ | 96,000 | 99,537 | ||||||
Series 2006-C4 AM | 87,000 | 94,868 | ||||||
Series 2006-C7 AM | 83,000 | 89,530 | ||||||
Series 2007-C1 A4 | 1,450,209 | 1,598,703 | ||||||
Series 2007-C7 A3 | 294,213 | 327,494 | ||||||
Merrill Lynch Mortgage Investors, Inc., |
| |||||||
Series 2003-A1 3A | 40,524 | 40,074 | ||||||
Series 2005-A10 A | 542,131 | 496,341 | ||||||
Merrill Lynch Mortgage Trust, | ||||||||
Series 2005-CKI1 AJ | 132,000 | 136,468 | ||||||
Merrill Lynch/Countrywide Commercial Mortgage Trust, |
| |||||||
Series 2007-9 A4 | 692,000 | 772,307 | ||||||
Morgan Stanley Bank of America Merrill Lynch Trust, |
| |||||||
Series 2013-C7 XA | 665,905 | 66,423 | ||||||
See Notes to Financial Statements.
31
AXA PREMIER VIP TRUST
MULTIMANAGER CORE BOND PORTFOLIO
PORTFOLIO OF INVESTMENTS (Continued)
December 31, 2013
| Principal Amount | Value (Note 1) | |||||||
Morgan Stanley Capital I Trust, | ||||||||
Series 1998-HF2 J | $ | 2,179,723 | $ | 2,310,279 | ||||
Series 2007-HQ12 A2FX | 236,619 | 241,727 | ||||||
Series 2007-IQ13 AM | 83,000 | 89,052 | ||||||
Series 2007-IQ14 A1A | 116,473 | 126,609 | ||||||
Series 2007-IQ14 A2FX | 248,025 | 248,650 | ||||||
Series 2007-IQ15 AM | 45,000 | 48,571 | ||||||
Series 2012-C4 XA | 1,168,076 | 144,102 | ||||||
Morgan Stanley Re-Remic Trust, |
| |||||||
Series 2009-GG10 A4A | 652,594 | 713,010 | ||||||
Series 2011-IO A | 41,309 | 41,838 | ||||||
Series 2012-IO AXB1 | 53,079 | 53,078 | ||||||
Series 2012-IO AXB2 | 100,000 | 98,000 | ||||||
Series 2012-XA A | 131,198 | 132,247 | ||||||
OBP Depositor LLC Trust, | ||||||||
Series 2010-OBP A | 2,357,000 | 2,550,958 | ||||||
RBSCF Trust, | ||||||||
Series 2010-RR3 JPMA | 906,381 | 981,278 | ||||||
Series 2010-RR4 CMLA | 447,390 | 488,218 | ||||||
S2 Hospitality LLC, | ||||||||
Series 2012-LV1 A | 913 | 913 | ||||||
Sequoia Mortgage Trust, | ||||||||
Series 10 2A1 | 9,169 | 8,922 | ||||||
Series 2003-4 2A1 | 35,698 | 34,444 | ||||||
STRIPs 2012-1 Ltd., | ||||||||
Series 2012-1A A | 220,940 | 218,731 | ||||||
Structured Adjustable Rate Mortgage Loan Trust, |
| |||||||
Series 2004-16 3A1 | 346,016 | 341,605 | ||||||
Structured Asset Mortgage Investments II Trust, | ||||||||
Series 2005-AR5 A1 | 124,747 | 114,980 | ||||||
Series 2006-AR3 12A1 | 445,312 | 338,789 | ||||||
Wachovia Bank Commercial Mortgage Trust, |
| |||||||
Series 2005-C20 B | 232,000 | 238,487 | ||||||
WaMu Mortgage Pass-Through Certificates Trust, |
| |||||||
Series 2002-AR9 1A | 21,805 | 21,186 | ||||||
Series 2003-AR1 A5 | 177,282 | 180,909 | ||||||
Wells Fargo Resecuritization Trust, |
| |||||||
Series 2012-IO A | $ | 147,612 | $ | 146,727 | ||||
WF-RBS Commercial Mortgage Trust, |
| |||||||
Series 2012-C10 XA | 1,149,475 | 123,394 | ||||||
Series 2013-C11 A4 | 181,000 | 171,427 | ||||||
Series 2013-C12 XA | 1,813,349 | 161,902 | ||||||
Series 2013-C15 XA | 1,185,866 | 49,243 | ||||||
|
| |||||||
| 36,536,013 | ||||||||
|
| |||||||
Total Asset-Backed and Mortgage-Backed Securities | 55,474,138 | |||||||
|
| |||||||
Corporate Bonds (25.4%) | ||||||||
Consumer Discretionary (1.2%) | ||||||||
Auto Components (0.0%) | ||||||||
Johnson Controls, Inc. | 113,000 | 117,629 | ||||||
|
| |||||||
Hotels, Restaurants & Leisure (0.1%) |
| |||||||
Carnival Corp. | ||||||||
1.875%, 12/15/17 | 55,000 | 54,541 | ||||||
3.950%, 10/15/20 | 28,000 | 27,909 | ||||||
Darden Restaurants, Inc. | ||||||||
4.500%, 10/15/21 | 55,000 | 52,886 | ||||||
Hyatt Hotels Corp. | ||||||||
3.875%, 8/15/16 | 36,000 | 38,064 | ||||||
5.375%, 8/15/21 | 36,000 | 38,520 | ||||||
International Game Technology | ||||||||
5.500%, 6/15/20 | 36,000 | 38,376 | ||||||
Marriott International, Inc. | ||||||||
3.250%, 9/15/22 | 91,000 | 84,722 | ||||||
McDonald’s Corp. | ||||||||
5.800%, 10/15/17 | 91,000 | 104,404 | ||||||
3.500%, 7/15/20 | 58,000 | 60,137 | ||||||
3.625%, 5/20/21 | 36,000 | 37,108 | ||||||
Starbucks Corp. | ||||||||
6.250%, 8/15/17 | 36,000 | 41,961 | ||||||
Wyndham Worldwide Corp. | ||||||||
2.500%, 3/1/18 | 73,000 | 73,456 | ||||||
Yum! Brands, Inc. | ||||||||
4.250%, 9/15/15 | 36,000 | 38,020 | ||||||
5.300%, 9/15/19 | 55,000 | 60,865 | ||||||
|
| |||||||
| 750,969 | ||||||||
|
| |||||||
Household Durables (0.1%) | ||||||||
Newell Rubbermaid, Inc. | ||||||||
4.700%, 8/15/20 | 73,000 | 76,004 | ||||||
NVR, Inc. | ||||||||
3.950%, 9/15/22 | 55,000 | 52,139 | ||||||
Tupperware Brands Corp. | ||||||||
4.750%, 6/1/21 | 36,000 | 35,943 | ||||||
Whirlpool Corp. | ||||||||
4.850%, 6/15/21 | 36,000 | 37,889 | ||||||
|
| |||||||
| 201,975 | ||||||||
|
| |||||||
Internet & Catalog Retail (0.0%) | ||||||||
Expedia, Inc. | ||||||||
5.950%, 8/15/20 | 109,000 | 118,197 | ||||||
See Notes to Financial Statements.
32
AXA PREMIER VIP TRUST
MULTIMANAGER CORE BOND PORTFOLIO
PORTFOLIO OF INVESTMENTS (Continued)
December 31, 2013
| Principal Amount | Value (Note 1) | |||||||
QVC, Inc. | ||||||||
4.375%, 3/15/23 | $ | 36,000 | $ | 33,660 | ||||
|
| |||||||
| 151,857 | ||||||||
|
| |||||||
Leisure Equipment & Products (0.0%) |
| |||||||
Mattel, Inc. | ||||||||
3.150%, 3/15/23 | 36,000 | 32,965 | ||||||
|
| |||||||
Media (0.8%) | ||||||||
21st Century Fox America, Inc. | ||||||||
4.500%, 2/15/21 | 182,000 | 200,397 | ||||||
3.000%, 9/15/22 | 73,000 | 68,783 | ||||||
CBS Corp. | ||||||||
8.875%, 5/15/19 | 91,000 | 116,572 | ||||||
5.750%, 4/15/20 | 69,000 | 77,975 | ||||||
Comcast Corp. | ||||||||
6.500%, 1/15/15 | 351,000 | 373,061 | ||||||
5.900%, 3/15/16 | 109,000 | 120,430 | ||||||
6.500%, 1/15/17 | 109,000 | 125,061 | ||||||
5.875%, 2/15/18 | 282,000 | 324,598 | ||||||
5.700%, 5/15/18 | 109,000 | 124,855 | ||||||
3.125%, 7/15/22 | 91,000 | 86,860 | ||||||
4.650%, 7/15/42 | 260,000 | 241,759 | ||||||
COX Communications, Inc. | ||||||||
5.500%, 10/1/15 | 55,000 | 58,991 | ||||||
8.375%, 3/1/39§ | 305,000 | 374,437 | ||||||
4.700%, 12/15/42§ | 7,000 | 5,901 | ||||||
DIRECTV Holdings LLC/DIRECTV Financing Co., Inc. |
| |||||||
3.550%, 3/15/15 | 71,000 | 73,292 | ||||||
3.500%, 3/1/16 | 109,000 | 114,296 | ||||||
5.875%, 10/1/19 | 73,000 | 82,466 | ||||||
5.200%, 3/15/20 | 47,000 | 51,149 | ||||||
4.600%, 2/15/21 | 109,000 | 111,982 | ||||||
5.000%, 3/1/21 | 213,000 | 223,974 | ||||||
3.800%, 3/15/22 | 75,000 | 71,635 | ||||||
5.150%, 3/15/42 | 120,000 | 107,389 | ||||||
Discovery Communications LLC | ||||||||
3.700%, 6/1/15 | 73,000 | 75,938 | ||||||
5.050%, 6/1/20 | 73,000 | 79,510 | ||||||
Interpublic Group of Cos., Inc. | ||||||||
2.250%, 11/15/17 | 73,000 | 72,635 | ||||||
NBCUniversal Media LLC | ||||||||
3.650%, 4/30/15 | 109,000 | 113,321 | ||||||
5.150%, 4/30/20 | 275,000 | 305,405 | ||||||
4.375%, 4/1/21 | 109,000 | 115,368 | ||||||
4.450%, 1/15/43 | 106,000 | 95,026 | ||||||
Omnicom Group, Inc. | ||||||||
5.900%, 4/15/16 | 73,000 | 80,731 | ||||||
4.450%, 8/15/20 | 73,000 | 77,472 | ||||||
Reed Elsevier Capital, Inc. | ||||||||
3.125%, 10/15/22 | 150,000 | 138,174 | ||||||
Thomson Reuters Corp. | ||||||||
4.700%, 10/15/19 | 55,000 | 59,735 | ||||||
Time Warner Cable, Inc. | ||||||||
5.850%, 5/1/17 | 273,000 | 297,074 | ||||||
5.000%, 2/1/20 | 73,000 | 73,593 | ||||||
4.000%, 9/1/21 | 91,000 | 84,088 | ||||||
Time Warner, Inc. | ||||||||
5.875%, 11/15/16 | 182,000 | 205,049 | ||||||
4.875%, 3/15/20 | 91,000 | 99,084 | ||||||
3.400%, 6/15/22 | 36,000 | 34,853 | ||||||
Viacom, Inc. | ||||||||
5.625%, 9/15/19 | $ | 91,000 | $ | 103,593 | ||||
4.250%, 9/1/23 | 125,000 | 124,781 | ||||||
Walt Disney Co. | ||||||||
5.500%, 3/15/19 | 109,000 | 125,241 | ||||||
2.750%, 8/16/21 | 55,000 | 52,806 | ||||||
2.350%, 12/1/22 | 91,000 | 81,974 | ||||||
WPP Finance 2010 | ||||||||
3.625%, 9/7/22 | 55,000 | 52,829 | ||||||
|
| |||||||
| 5,684,143 | ||||||||
|
| |||||||
Multiline Retail (0.1%) | ||||||||
Family Dollar Stores, Inc. | ||||||||
5.000%, 2/1/21 | 36,000 | 37,090 | ||||||
Kohl’s Corp. | ||||||||
6.250%, 12/15/17 | 36,000 | 41,152 | ||||||
Macy’s Retail Holdings, Inc. | ||||||||
5.900%, 12/1/16 | 52,000 | 58,500 | ||||||
4.375%, 9/1/23 | 100,000 | 101,500 | ||||||
Nordstrom, Inc. | ||||||||
4.750%, 5/1/20 | 36,000 | 39,372 | ||||||
4.000%, 10/15/21 | 36,000 | 37,377 | ||||||
Target Corp. | ||||||||
6.000%, 1/15/18 | 146,000 | 168,921 | ||||||
2.900%, 1/15/22 | 55,000 | 52,694 | ||||||
|
| |||||||
| 536,606 | ||||||||
|
| |||||||
Specialty Retail (0.1%) | ||||||||
AutoZone, Inc. | ||||||||
4.000%, 11/15/20 | 91,000 | 93,941 | ||||||
Home Depot, Inc. | ||||||||
5.400%, 3/1/16 | 182,000 | 200,086 | ||||||
4.400%, 4/1/21 | 91,000 | 98,266 | ||||||
Lowe’s Cos., Inc. | ||||||||
2.125%, 4/15/16 | 73,000 | 75,046 | ||||||
4.625%, 4/15/20 | 109,000 | 119,484 | ||||||
O’Reilly Automotive, Inc. | ||||||||
4.625%, 9/15/21 | 36,000 | 37,055 | ||||||
TJX Cos., Inc. | ||||||||
6.950%, 4/15/19 | 53,000 | 63,525 | ||||||
|
| |||||||
| 687,403 | ||||||||
|
| |||||||
Textiles, Apparel & Luxury Goods (0.0%) |
| |||||||
Cintas Corp. No. 2 | ||||||||
2.850%, 6/1/16 | 73,000 | 75,613 | ||||||
NIKE, Inc. | ||||||||
2.250%, 5/1/23 | 36,000 | 32,336 | ||||||
|
| |||||||
| 107,949 | ||||||||
|
| |||||||
Total Consumer Discretionary | 8,271,496 | |||||||
|
| |||||||
Consumer Staples (1.5%) | ||||||||
Beverages (0.4%) | ||||||||
Anheuser-Busch InBev Worldwide, Inc. |
| |||||||
4.125%, 1/15/15 | 230,000 | 238,658 | ||||||
2.875%, 2/15/16 | 73,000 | 76,140 | ||||||
1.375%, 7/15/17 | 175,000 | 174,339 | ||||||
7.750%, 1/15/19 | 91,000 | 113,428 | ||||||
See Notes to Financial Statements.
33
AXA PREMIER VIP TRUST
MULTIMANAGER CORE BOND PORTFOLIO
PORTFOLIO OF INVESTMENTS (Continued)
December 31, 2013
| Principal Amount | Value (Note 1) | |||||||
5.375%, 1/15/20 | $ | 91,000 | $ | 104,044 | ||||
2.500%, 7/15/22 | 182,000 | 168,623 | ||||||
Bottling Group LLC | ||||||||
5.500%, 4/1/16 | 73,000 | 80,604 | ||||||
Brown-Forman Corp. | ||||||||
2.500%, 1/15/16 | 55,000 | 56,791 | ||||||
Coca-Cola Co. | ||||||||
0.750%, 3/13/15 | 36,000 | 36,124 | ||||||
1.500%, 11/15/15 | 91,000 | 92,785 | ||||||
1.800%, 9/1/16 | 146,000 | 149,667 | ||||||
1.150%, 4/1/18 | 91,000 | 88,646 | ||||||
3.150%, 11/15/20 | 91,000 | 92,208 | ||||||
3.200%, 11/1/23 | 125,000 | 120,136 | ||||||
Coca-Cola Enterprises, Inc. | ||||||||
2.000%, 8/19/16 | 100,000 | 101,866 | ||||||
3.250%, 8/19/21 | 100,000 | 96,648 | ||||||
Diageo Capital plc | ||||||||
5.750%, 10/23/17 | 91,000 | 103,719 | ||||||
1.125%, 4/29/18 | 73,000 | 70,522 | ||||||
Diageo Finance B.V. | ||||||||
3.250%, 1/15/15 | 73,000 | 75,274 | ||||||
5.300%, 10/28/15 | 91,000 | 98,553 | ||||||
Dr. Pepper Snapple Group, Inc. | ||||||||
2.600%, 1/15/19 | 73,000 | 73,604 | ||||||
3.200%, 11/15/21 | 36,000 | 34,694 | ||||||
PepsiCo, Inc. | ||||||||
0.700%, 8/13/15 | 36,000 | 36,060 | ||||||
0.700%, 2/26/16 | 150,000 | 149,631 | ||||||
7.900%, 11/1/18 | 182,000 | 228,298 | ||||||
4.500%, 1/15/20 | 146,000 | 158,955 | ||||||
3.600%, 8/13/42 | 54,000 | 44,483 | ||||||
|
| |||||||
| 2,864,500 | ||||||||
|
| |||||||
Food & Staples Retailing (0.6%) | ||||||||
Costco Wholesale Corp. | ||||||||
5.500%, 3/15/17 | 55,000 | 61,949 | ||||||
1.700%, 12/15/19 | 91,000 | 87,456 | ||||||
CVS Caremark Corp. | ||||||||
3.250%, 5/18/15 | 128,000 | 132,280 | ||||||
4.750%, 5/18/20 | 128,000 | 138,767 | ||||||
4.000%, 12/5/23 | 100,000 | 99,820 | ||||||
7.507%, 1/10/32§ | 1,864,507 | 2,193,742 | ||||||
5.300%, 12/5/43 | 24,000 | 24,796 | ||||||
Delhaize Group S.A. | ||||||||
4.125%, 4/10/19 | 36,000 | 37,062 | ||||||
Kroger Co. | ||||||||
6.400%, 8/15/17 | 91,000 | 103,489 | ||||||
2.300%, 1/15/19 | 100,000 | 99,462 | ||||||
Safeway, Inc. | ||||||||
5.000%, 8/15/19 | 146,000 | 154,518 | ||||||
Walgreen Co. | ||||||||
1.800%, 9/15/17 | 55,000 | 55,398 | ||||||
5.250%, 1/15/19 | 36,000 | 40,430 | ||||||
3.100%, 9/15/22 | 73,000 | 68,698 | ||||||
Wal-Mart Stores, Inc. | ||||||||
2.875%, 4/1/15 | 273,000 | 281,660 | ||||||
5.800%, 2/15/18 | 182,000 | 209,344 | ||||||
3.250%, 10/25/20 | 73,000 | 74,550 | ||||||
2.550%, 4/11/23 | 109,000 | 100,034 | ||||||
4.000%, 4/11/43 | 98,000 | 87,142 | ||||||
|
| |||||||
| 4,050,597 | ||||||||
|
| |||||||
Food Products (0.2%) | ||||||||
ConAgra Foods, Inc. | ||||||||
5.819%, 6/15/17 | $ | 73,000 | $ | 82,141 | ||||
1.900%, 1/25/18 | 46,000 | 45,219 | ||||||
3.200%, 1/25/23 | 73,000 | 67,479 | ||||||
General Mills, Inc. | ||||||||
0.875%, 1/29/16 | 29,000 | 28,958 | ||||||
5.650%, 2/15/19 | 91,000 | 105,348 | ||||||
Hershey Co. | ||||||||
4.850%, 8/15/15 | 91,000 | 96,952 | ||||||
Hormel Foods Corp. | ||||||||
4.125%, 4/15/21 | 36,000 | 37,071 | ||||||
Ingredion, Inc. | ||||||||
3.200%, 11/1/15 | 36,000 | 37,244 | ||||||
4.625%, 11/1/20 | 36,000 | 37,538 | ||||||
J.M. Smucker Co. | ||||||||
3.500%, 10/15/21 | 73,000 | 72,580 | ||||||
Kellogg Co. | ||||||||
4.000%, 12/15/20 | 91,000 | 94,436 | ||||||
Kraft Foods Group, Inc. | ||||||||
3.500%, 6/6/22 | 182,000 | 178,062 | ||||||
McCormick & Co., Inc. | ||||||||
3.900%, 7/15/21 | 27,000 | 27,562 | ||||||
Mead Johnson Nutrition Co. | ||||||||
4.900%, 11/1/19 | 73,000 | 79,641 | ||||||
Mondelez International, Inc. | ||||||||
4.125%, 2/9/16 | 128,000 | 135,978 | ||||||
6.125%, 2/1/18 | 91,000 | 105,077 | ||||||
5.375%, 2/10/20 | 182,000 | 206,613 | ||||||
Tyson Foods, Inc. | ||||||||
4.500%, 6/15/22 | 182,000 | 185,640 | ||||||
Unilever Capital Corp. | ||||||||
4.800%, 2/15/19 | 109,000 | 121,729 | ||||||
WM Wrigley Jr Co. | ||||||||
2.900%, 10/21/19§ | 168,000 | 165,863 | ||||||
|
| |||||||
| 1,911,131 | ||||||||
|
| |||||||
Household Products (0.1%) | ||||||||
Clorox Co. | ||||||||
3.550%, 11/1/15 | 91,000 | 95,344 | ||||||
Colgate-Palmolive Co. | ||||||||
3.150%, 8/5/15 | 109,000 | 113,516 | ||||||
Energizer Holdings, Inc. | ||||||||
4.700%, 5/19/21 | 55,000 | 55,527 | ||||||
Kimberly-Clark Corp. | ||||||||
6.125%, 8/1/17 | 91,000 | 105,022 | ||||||
7.500%, 11/1/18 | 36,000 | 44,708 | ||||||
3.875%, 3/1/21 | 38,000 | 39,504 | ||||||
Procter & Gamble Co. | ||||||||
3.150%, 9/1/15 | 128,000 | 133,502 | ||||||
4.700%, 2/15/19 | 182,000 | 204,249 | ||||||
|
| |||||||
| 791,372 | ||||||||
|
| |||||||
Personal Products (0.0%) | ||||||||
Avon Products, Inc. | ||||||||
5.000%, 3/15/23 | 91,000 | 88,980 | ||||||
|
| |||||||
Tobacco (0.2%) | ||||||||
Altria Group, Inc. | ||||||||
9.700%, 11/10/18 | 80,000 | 105,492 | ||||||
4.750%, 5/5/21 | 91,000 | 97,899 | ||||||
2.850%, 8/9/22 | 91,000 | 83,598 | ||||||
See Notes to Financial Statements.
34
AXA PREMIER VIP TRUST
MULTIMANAGER CORE BOND PORTFOLIO
PORTFOLIO OF INVESTMENTS (Continued)
December 31, 2013
| Principal Amount | Value (Note 1) | |||||||
4.000%, 1/31/24 | $ | 69,000 | $ | 67,510 | ||||
Lorillard Tobacco Co. | ||||||||
3.500%, 8/4/16 | 40,000 | 42,043 | ||||||
6.875%, 5/1/20 | 91,000 | 104,736 | ||||||
Philip Morris International, Inc. | ||||||||
5.650%, 5/16/18 | 237,000 | 272,661 | ||||||
1.875%, 1/15/19 | 149,000 | 145,746 | ||||||
2.500%, 8/22/22 | 36,000 | 32,832 | ||||||
2.625%, 3/6/23 | 36,000 | 32,638 | ||||||
4.875%, 11/15/43 | 49,000 | 48,186 | ||||||
Reynolds American, Inc. | ||||||||
6.750%, 6/15/17 | 109,000 | 125,396 | ||||||
3.250%, 11/1/22 | 73,000 | 66,664 | ||||||
|
| |||||||
| 1,225,401 | ||||||||
|
| |||||||
Total Consumer Staples | 10,931,981 | |||||||
|
| |||||||
Energy (2.3%) | ||||||||
Energy Equipment & Services (0.4%) | ||||||||
AK Transneft OJSC (TransCapitalInvest Ltd.) |
| |||||||
8.700%, 8/7/18 (m) | 326,000 | 395,682 | ||||||
Cameron International Corp. | ||||||||
4.500%, 6/1/21 | 55,000 | 57,538 | ||||||
Diamond Offshore Drilling, Inc. | ||||||||
5.875%, 5/1/19 | 38,000 | 44,143 | ||||||
Ensco plc | ||||||||
3.250%, 3/15/16 | 91,000 | 95,275 | ||||||
4.700%, 3/15/21 | 146,000 | 154,597 | ||||||
Halliburton Co. | ||||||||
6.150%, 9/15/19 | 91,000 | 107,775 | ||||||
3.500%, 8/1/23 | 100,000 | 97,479 | ||||||
Nabors Industries, Inc. | ||||||||
9.250%, 1/15/19 | 109,000 | 133,949 | ||||||
Rowan Cos., Inc. | ||||||||
7.875%, 8/1/19 | 47,000 | 56,910 | ||||||
Schlumberger Investment S.A. | ||||||||
3.650%, 12/1/23 | 63,000 | 62,628 | ||||||
Transocean, Inc. | ||||||||
4.950%, 11/15/15 | 91,000 | 97,623 | ||||||
5.050%, 12/15/16 | 47,000 | 51,856 | ||||||
2.500%, 10/15/17 | 257,000 | 258,837 | ||||||
6.000%, 3/15/18 | 510,000 | 577,701 | ||||||
6.500%, 11/15/20 | 214,000 | 245,328 | ||||||
6.800%, 3/15/38 | 65,000 | 72,640 | ||||||
Weatherford International Ltd. | ||||||||
5.500%, 2/15/16 | 109,000 | 118,857 | ||||||
9.625%, 3/1/19 | 109,000 | 140,545 | ||||||
|
| |||||||
| 2,769,363 | ||||||||
|
| |||||||
Oil, Gas & Consumable Fuels (1.9%) |
| |||||||
Anadarko Petroleum Corp. | ||||||||
5.950%, 9/15/16 | 146,000 | 162,446 | ||||||
8.700%, 3/15/19 | 109,000 | 138,176 | ||||||
Apache Corp. | ||||||||
5.625%, 1/15/17 | 73,000 | 82,139 | ||||||
3.250%, 4/15/22 | 53,000 | 52,558 | ||||||
4.750%, 4/15/43 | 40,000 | 38,893 | ||||||
4.250%, 1/15/44 | 70,000 | 61,560 | ||||||
BP Capital Markets plc | ||||||||
3.875%, 3/10/15 | 128,000 | 133,211 | ||||||
3.200%, 3/11/16 | 182,000 | 191,747 | ||||||
1.375%, 11/6/17 | $ | 73,000 | $ | 72,353 | ||||
4.500%, 10/1/20 | 182,000 | 197,622 | ||||||
3.245%, 5/6/22 | 109,000 | 106,118 | ||||||
2.500%, 11/6/22 | 55,000 | 49,899 | ||||||
2.750%, 5/10/23 | 155,000 | 142,447 | ||||||
Buckeye Partners LP | ||||||||
4.875%, 2/1/21 | 73,000 | 74,797 | ||||||
Canadian Natural Resources Ltd. | ||||||||
5.700%, 5/15/17 | 146,000 | 165,141 | ||||||
Cenovus Energy, Inc. | ||||||||
5.700%, 10/15/19 | 73,000 | 82,623 | ||||||
Chevron Corp. | ||||||||
1.104%, 12/5/17 | 73,000 | 71,786 | ||||||
4.950%, 3/3/19 | 91,000 | 102,885 | ||||||
2.355%, 12/5/22 | 55,000 | 50,185 | ||||||
3.191%, 6/24/23 | 150,000 | 145,043 | ||||||
CNOOC Finance 2013 Ltd. | ||||||||
3.000%, 5/9/23 | 128,000 | 113,515 | ||||||
ConocoPhillips Co. | ||||||||
4.600%, 1/15/15 | 182,000 | 189,993 | ||||||
1.050%, 12/15/17 | 36,000 | 35,334 | ||||||
5.750%, 2/1/19 | 91,000 | 106,063 | ||||||
6.000%, 1/15/20 | 91,000 | 107,827 | ||||||
Devon Energy Corp. | ||||||||
2.400%, 7/15/16 | 55,000 | 56,825 | ||||||
4.000%, 7/15/21 | 73,000 | 74,320 | ||||||
El Paso Pipeline Partners Operating Co. LLC |
| |||||||
5.000%, 10/1/21 | 91,000 | 95,379 | ||||||
Enbridge Energy Partners LP | ||||||||
9.875%, 3/1/19 | 91,000 | 118,051 | ||||||
EnCana Corp. | ||||||||
6.500%, 5/15/19 | 89,000 | 103,218 | ||||||
Energy Transfer Partners LP | ||||||||
9.000%, 4/15/19 | 109,000 | 138,101 | ||||||
5.200%, 2/1/22 | 109,000 | 115,511 | ||||||
Enterprise Products Operating LLC | ||||||||
1.250%, 8/13/15 | 44,000 | 44,328 | ||||||
3.200%, 2/1/16 | 146,000 | 152,837 | ||||||
5.250%, 1/31/20 | 36,000 | 40,092 | ||||||
3.350%, 3/15/23 | 128,000 | 121,209 | ||||||
4.450%, 2/15/43 | 76,000 | 67,387 | ||||||
EOG Resources, Inc. | ||||||||
2.950%, 6/1/15 | 91,000 | 94,203 | ||||||
5.625%, 6/1/19 | 36,000 | 41,967 | ||||||
4.100%, 2/1/21 | 91,000 | 96,356 | ||||||
EQT Corp. | ||||||||
8.125%, 6/1/19 | 73,000 | 88,769 | ||||||
Gazprom OAO (Gaz Capital S.A.) | ||||||||
8.146%, 4/11/18§ | 653,000 | 771,356 | ||||||
Kinder Morgan Energy Partners LP | ||||||||
5.625%, 2/15/15 | 36,000 | 37,967 | ||||||
6.000%, 2/1/17 | 73,000 | 82,266 | ||||||
6.850%, 2/15/20 | 91,000 | 108,013 | ||||||
3.950%, 9/1/22 | 91,000 | 88,793 | ||||||
Magellan Midstream Partners LP | ||||||||
6.550%, 7/15/19 | 55,000 | 63,713 | ||||||
4.250%, 2/1/21 | 36,000 | 37,219 | ||||||
Marathon Oil Corp. | ||||||||
2.800%, 11/1/22 | 73,000 | 67,470 | ||||||
Marathon Petroleum Corp. | ||||||||
3.500%, 3/1/16 | 47,000 | 49,467 | ||||||
5.125%, 3/1/21 | 55,000 | 59,951 | ||||||
See Notes to Financial Statements.
35
AXA PREMIER VIP TRUST
MULTIMANAGER CORE BOND PORTFOLIO
PORTFOLIO OF INVESTMENTS (Continued)
December 31, 2013
| Principal Amount | Value (Note 1) | |||||||
Murphy Oil Corp. | ||||||||
2.500%, 12/1/17 | $ | 172,000 | $ | 170,603 | ||||
4.000%, 6/1/22 | 73,000 | 69,686 | ||||||
3.700%, 12/1/22 | 93,000 | 86,007 | ||||||
Nexen Energy ULC | ||||||||
6.200%, 7/30/19 | 36,000 | 41,557 | ||||||
5.875%, 3/10/35 | 7,000 | 7,503 | ||||||
6.400%, 5/15/37 | 76,000 | 86,503 | ||||||
Noble Energy, Inc. | ||||||||
8.250%, 3/1/19 | 80,000 | 98,506 | ||||||
4.150%, 12/15/21 | 179,000 | 182,973 | ||||||
6.000%, 3/1/41 | 94,000 | 102,682 | ||||||
5.250%, 11/15/43 | 105,000 | 104,853 | ||||||
Noble Holding International Ltd. | ||||||||
3.050%, 3/1/16 | 55,000 | 56,703 | ||||||
4.625%, 3/1/21 | 73,000 | 74,767 | ||||||
5.250%, 3/15/42 | 37,000 | 35,473 | ||||||
Occidental Petroleum Corp. | ||||||||
2.500%, 2/1/16 | 36,000 | 37,314 | ||||||
4.125%, 6/1/16 | 55,000 | 59,229 | ||||||
4.100%, 2/1/21 | 109,000 | 115,341 | ||||||
ONEOK Partners LP | ||||||||
3.250%, 2/1/16 | 36,000 | 37,503 | ||||||
8.625%, 3/1/19 | 36,000 | 45,119 | ||||||
3.375%, 10/1/22 | 36,000 | 33,830 | ||||||
Petrobras International Finance Co. | ||||||||
3.875%, 1/27/16 | 1,067,000 | 1,096,227 | ||||||
3.500%, 2/6/17 | 91,000 | 91,518 | ||||||
7.875%, 3/15/19 | 128,000 | 145,193 | ||||||
5.750%, 1/20/20 | 173,000 | 177,965 | ||||||
5.375%, 1/27/21 | 273,000 | 269,282 | ||||||
Petrohawk Energy Corp. | ||||||||
6.250%, 6/1/19 | 91,000 | 99,537 | ||||||
Petroleos Mexicanos | ||||||||
4.875%, 3/15/15 | 128,000 | 133,888 | ||||||
8.000%, 5/3/19 | 182,000 | 220,675 | ||||||
6.000%, 3/5/20 | 226,000 | 250,295 | ||||||
3.500%, 1/30/23 | 82,000 | 75,030 | ||||||
Phillips 66 | ||||||||
4.300%, 4/1/22 | 146,000 | 148,675 | ||||||
Pioneer Natural Resources Co. | ||||||||
6.875%, 5/1/18 | 55,000 | 64,520 | ||||||
3.950%, 7/15/22 | 73,000 | 73,248 | ||||||
Plains All American Pipeline LP/Plains All American Finance Corp. |
| |||||||
3.950%, 9/15/15 | 91,000 | 95,695 | ||||||
8.750%, 5/1/19 | 36,000 | 46,135 | ||||||
5.000%, 2/1/21 | 36,000 | 39,435 | ||||||
Plains Exploration & Production Co. | ||||||||
6.875%, 2/15/23 | 109,000 | 120,482 | ||||||
Southwestern Energy Co. | ||||||||
7.500%, 2/1/18 | 73,000 | 86,467 | ||||||
4.100%, 3/15/22 | 181,000 | 180,022 | ||||||
Spectra Energy Capital LLC | ||||||||
6.200%, 4/15/18 | 73,000 | 82,567 | ||||||
8.000%, 10/1/19 | 36,000 | 42,622 | ||||||
Statoil ASA | ||||||||
1.200%, 1/17/18 | 36,000 | 35,188 | ||||||
5.250%, 4/15/19 | 91,000 | 103,966 | ||||||
2.900%, 11/8/20 | 315,000 | 313,077 | ||||||
Talisman Energy, Inc. | ||||||||
7.750%, 6/1/19 | $ | 73,000 | $ | 87,626 | ||||
Total Capital International S.A. | ||||||||
1.000%, 8/12/16 | 125,000 | 124,666 | ||||||
2.875%, 2/17/22 | 91,000 | 86,985 | ||||||
3.700%, 1/15/24 | 155,000 | 153,480 | ||||||
Total Capital S.A. | ||||||||
3.125%, 10/2/15 | 146,000 | 152,091 | ||||||
2.125%, 8/10/18 | 100,000 | 100,244 | ||||||
4.450%, 6/24/20 | 36,000 | 39,188 | ||||||
4.125%, 1/28/21 | 73,000 | 77,224 | ||||||
TransCanada PipeLines Ltd. | ||||||||
3.400%, 6/1/15 | 73,000 | 75,831 | ||||||
7.125%, 1/15/19 | 146,000 | 175,363 | ||||||
2.500%, 8/1/22 | 64,000 | 58,203 | ||||||
6.350%, 5/15/67 (l) | 36,000 | 37,080 | ||||||
Valero Energy Corp. | ||||||||
6.125%, 2/1/20 | 133,000 | 151,204 | ||||||
Western Gas Partners LP | ||||||||
5.375%, 6/1/21 | 160,000 | 172,325 | ||||||
4.000%, 7/1/22 | 91,000 | 87,521 | ||||||
Williams Cos., Inc. | ||||||||
7.875%, 9/1/21 | 117,000 | 134,983 | ||||||
3.700%, 1/15/23 | 223,000 | 193,813 | ||||||
Williams Partners LP | ||||||||
3.800%, 2/15/15 | 73,000 | 75,407 | ||||||
5.250%, 3/15/20 | 113,000 | 123,278 | ||||||
4.000%, 11/15/21 | 36,000 | 35,363 | ||||||
4.500%, 11/15/23 | 100,000 | 98,577 | ||||||
XTO Energy, Inc. | ||||||||
6.250%, 8/1/17 | 73,000 | 84,760 | ||||||
|
| |||||||
| 13,252,202 | ||||||||
|
| |||||||
Total Energy | 16,021,565 | |||||||
|
| |||||||
Financials (12.7%) | ||||||||
Capital Markets (2.2%) | ||||||||
Ameriprise Financial, Inc. | ||||||||
5.650%, 11/15/15 | 28,000 | 30,412 | ||||||
7.300%, 6/28/19 | 33,000 | 40,411 | ||||||
5.300%, 3/15/20 | 36,000 | 40,539 | ||||||
Bank of New York Mellon Corp. |
| |||||||
3.100%, 1/15/15 | 182,000 | 187,157 | ||||||
1.200%, 2/20/15 | 31,000 | 31,232 | ||||||
2.100%, 1/15/19 | 195,000 | 192,207 | ||||||
5.450%, 5/15/19 | 73,000 | 83,322 | ||||||
4.150%, 2/1/21 | 73,000 | 77,810 | ||||||
3.550%, 9/23/21 | 36,000 | 36,473 | ||||||
BlackRock, Inc. | ||||||||
5.000%, 12/10/19 | 73,000 | 82,517 | ||||||
Charles Schwab Corp. | ||||||||
4.450%, 7/22/20 | 36,000 | 38,962 | ||||||
3.225%, 9/1/22 | 36,000 | 34,594 | ||||||
Credit Suisse AG/New York | ||||||||
4.375%, 8/5/20 | 146,000 | 157,493 | ||||||
Credit Suisse FB USA, Inc. | ||||||||
5.125%, 8/15/15 | 364,000 | 389,902 | ||||||
Deutsche Bank AG | ||||||||
4.296%, 5/24/28 (l) | 200,000 | 182,000 | ||||||
Deutsche Bank AG/London | ||||||||
3.250%, 1/11/16 | 100,000 | 104,562 | ||||||
6.000%, 9/1/17 | 182,000 | 207,987 | ||||||
See Notes to Financial Statements.
36
AXA PREMIER VIP TRUST
MULTIMANAGER CORE BOND PORTFOLIO
PORTFOLIO OF INVESTMENTS (Continued)
December 31, 2013
| Principal Amount | Value (Note 1) | |||||||
Eaton Vance Corp. | ||||||||
6.500%, 10/2/17 | $ | 22,000 | $ | 24,890 | ||||
Goldman Sachs Group, Inc. | ||||||||
5.125%, 1/15/15 | 1,270,000 | 1,326,965 | ||||||
0.567%, 5/18/15 (l) | EUR | 50,000 | 68,594 | |||||
5.350%, 1/15/16 | $ | 364,000 | 393,658 | |||||
3.625%, 2/7/16 | 444,000 | 466,136 | ||||||
5.625%, 1/15/17 | 109,000 | 119,982 | ||||||
6.250%, 9/1/17 | 273,000 | 312,610 | ||||||
6.150%, 4/1/18 | 273,000 | 313,621 | ||||||
7.500%, 2/15/19 | 471,000 | 575,608 | ||||||
5.375%, 3/15/20 | 255,000 | 283,808 | ||||||
5.250%, 7/27/21 | 264,000 | 289,144 | ||||||
5.750%, 1/24/22 | 351,000 | 395,700 | ||||||
3.625%, 1/22/23 | 131,000 | 126,721 | ||||||
1.838%, 11/29/23 (l) | 205,000 | 208,225 | ||||||
Jefferies Group LLC | ||||||||
8.500%, 7/15/19 | 109,000 | 131,889 | ||||||
5.125%, 1/20/23 | 18,000 | 18,175 | ||||||
Lazard Group LLC | ||||||||
4.250%, 11/14/20 | 125,000 | 124,900 | ||||||
Lehman Brothers Holdings, Inc. | ||||||||
0.000%, 12/23/12 (h) | 10,200,000 | 2,129,250 | ||||||
5.625%, 1/24/13 (h)* | 5,000,000 | 1,056,250 | ||||||
6.750%, 12/28/17*†(b)(h) | 470,000 | — | ||||||
Merrill Lynch & Co., Inc. | ||||||||
6.875%, 4/25/18 | 364,000 | 429,918 | ||||||
Morgan Stanley | ||||||||
6.000%, 4/28/15 | 16,000 | 17,037 | ||||||
4.000%, 7/24/15 | 546,000 | 571,525 | ||||||
3.450%, 11/2/15 | 258,000 | 269,338 | ||||||
3.800%, 4/29/16 | 100,000 | 105,801 | ||||||
5.550%, 4/27/17 | 219,000 | 244,744 | ||||||
5.950%, 12/28/17 | 182,000 | 206,973 | ||||||
7.300%, 5/13/19 | 437,000 | 531,092 | ||||||
5.750%, 1/25/21 | 273,000 | 308,871 | ||||||
5.500%, 7/28/21 | 55,000 | 61,559 | ||||||
3.750%, 2/25/23 | 109,000 | 106,124 | ||||||
4.100%, 5/22/23 | 55,000 | 53,281 | ||||||
5.000%, 11/24/25 | 215,000 | 217,507 | ||||||
Nomura Holdings, Inc. | ||||||||
5.000%, 3/4/15 | 109,000 | 113,762 | ||||||
4.125%, 1/19/16 | 36,000 | 37,900 | ||||||
6.700%, 3/4/20 | 74,000 | 83,749 | ||||||
Northern Trust Corp. | ||||||||
3.450%, 11/4/20 | 73,000 | 74,904 | ||||||
Raymond James Financial, Inc. | ||||||||
4.250%, 4/15/16 | 36,000 | 38,260 | ||||||
8.600%, 8/15/19 | 36,000 | 45,302 | ||||||
SteelRiver Transmission Co. LLC |
| |||||||
4.710%, 6/30/17§(b) | 647,176 | 666,519 | ||||||
TD Ameritrade Holding Corp. | ||||||||
5.600%, 12/1/19 | 36,000 | 41,397 | ||||||
UBS AG/Connecticut | ||||||||
5.875%, 7/15/16 | 91,000 | 100,714 | ||||||
5.875%, 12/20/17 | 74,000 | 84,704 | ||||||
5.750%, 4/25/18 | 122,000 | 139,753 | ||||||
4.875%, 8/4/20 | 170,000 | 188,655 | ||||||
|
| |||||||
| 15,023,095 | ||||||||
|
| |||||||
Commercial Banks (3.6%) | ||||||||
Australia & New Zealand Banking Group Ltd./New York |
| |||||||
1.450%, 5/15/18 | $ | 250,000 | $ | 245,002 | ||||
Banco do Brasil S.A./Cayman Islands |
| |||||||
4.500%, 1/22/15§ | 18,000 | 18,405 | ||||||
3.875%, 10/10/22 | 300,000 | 261,000 | ||||||
Banco Santander S.A./Chile | ||||||||
1.842%, 1/19/16 (b)(l)§ | 2,755,000 | 2,727,450 | ||||||
Bancolombia S.A. | ||||||||
4.250%, 1/12/16 | 91,000 | 94,413 | ||||||
Bank of Montreal | ||||||||
0.800%, 11/6/15 | 55,000 | 55,257 | ||||||
1.400%, 9/11/17 | 109,000 | 108,014 | ||||||
2.550%, 11/6/22 | 55,000 | 50,458 | ||||||
Bank of Nova Scotia | ||||||||
3.400%, 1/22/15 | 73,000 | 75,217 | ||||||
0.750%, 10/9/15 | 91,000 | 90,966 | ||||||
0.950%, 3/15/16 | 146,000 | 146,122 | ||||||
1.375%, 7/15/16 | 91,000 | 91,748 | ||||||
1.100%, 12/13/16 | 150,000 | 150,317 | ||||||
Barclays Bank plc | ||||||||
5.000%, 9/22/16 | 146,000 | 160,498 | ||||||
5.140%, 10/14/20 | 182,000 | 193,931 | ||||||
BB&T Corp. | ||||||||
3.200%, 3/15/16 | 146,000 | 153,490 | ||||||
1.450%, 1/12/18 | 55,000 | 53,495 | ||||||
5.250%, 11/1/19 | 109,000 | 120,525 | ||||||
BBVA Senior Finance S.A.U. | ||||||||
4.664%, 10/9/15 | 200,000 | 210,822 | ||||||
BNP Paribas S.A. | ||||||||
3.250%, 3/11/15 | 219,000 | 225,257 | ||||||
5.000%, 1/15/21 | 182,000 | 200,100 | ||||||
3.250%, 3/3/23 | 91,000 | 86,880 | ||||||
Canadian Imperial Bank of Commerce |
| |||||||
2.350%, 12/11/15 | 73,000 | 75,245 | ||||||
1.350%, 7/18/16 | 73,000 | 73,387 | ||||||
Capital One Bank USA N.A. | ||||||||
8.800%, 7/15/19 | 63,000 | 80,459 | ||||||
Commonwealth Bank of Australia/New York |
| |||||||
1.900%, 9/18/17 | 182,000 | 182,037 | ||||||
Cooperatieve Centrale Raiffeisen-Boerenleenbank B.A. |
| |||||||
1.700%, 3/19/18 | 250,000 | 246,788 | ||||||
3.875%, 2/8/22 | 182,000 | 183,832 | ||||||
5.750%, 12/1/43 | 250,000 | 265,019 | ||||||
DNB Bank ASA | ||||||||
3.200%, 4/3/17§ | 1,559,000 | 1,627,136 | ||||||
Fifth Third Bancorp | ||||||||
3.625%, 1/25/16 | 91,000 | 95,689 | ||||||
5.450%, 1/15/17 | 91,000 | 100,012 | ||||||
First Horizon National Corp. | ||||||||
5.375%, 12/15/15 | 36,000 | 38,621 | ||||||
First Niagara Financial Group, Inc. | ||||||||
7.250%, 12/15/21 | 55,000 | 63,751 | ||||||
HSBC Bank Brasil S.A. - Banco Multiplo |
| |||||||
4.000%, 5/11/16§ | 417,000 | 427,946 | ||||||
HSBC Bank USA N.A. | ||||||||
4.875%, 8/24/20 | 182,000 | 196,623 | ||||||
HSBC Holdings plc | ||||||||
4.000%, 3/30/22 | 182,000 | 185,684 | ||||||
See Notes to Financial Statements.
37
AXA PREMIER VIP TRUST
MULTIMANAGER CORE BOND PORTFOLIO
PORTFOLIO OF INVESTMENTS (Continued)
December 31, 2013
| Principal Amount | Value (Note 1) | |||||||
Huntington Bancshares, Inc./Ohio |
| |||||||
7.000%, 12/15/20 | $ | 9,000 | $ | 10,513 | ||||
Intesa Sanpaolo S.p.A. | ||||||||
3.875%, 1/16/18 | 200,000 | 203,128 | ||||||
KeyBank N.A./Ohio | ||||||||
7.413%, 5/6/15 | 146,000 | 158,791 | ||||||
KfW | ||||||||
1.000%, 1/12/15 | 146,000 | 146,632 | ||||||
2.625%, 3/3/15 | 182,000 | 186,631 | ||||||
1.250%, 10/26/15 | 273,000 | 275,730 | ||||||
2.625%, 2/16/16 | 364,000 | 377,806 | ||||||
0.500%, 4/19/16 | 219,000 | 217,378 | ||||||
4.875%, 1/17/17 | 482,000 | 534,564 | ||||||
1.250%, 2/15/17 | 182,000 | 182,256 | ||||||
0.875%, 9/5/17 | 73,000 | 71,652 | ||||||
4.500%, 7/16/18 | 182,000 | 201,341 | ||||||
4.875%, 6/17/19 | 182,000 | 207,244 | ||||||
4.000%, 1/27/20 | 182,000 | 198,160 | ||||||
2.750%, 9/8/20 | 364,000 | 368,399 | ||||||
2.750%, 10/1/20 | 200,000 | 200,791 | ||||||
6.250%, 5/19/21 | AUD | 2,248,000 | 2,191,371 | |||||
2.625%, 1/25/22 | $ | 182,000 | 177,805 | |||||
2.125%, 1/17/23 | 237,000 | 217,901 | ||||||
Landwirtschaftliche Rentenbank | ||||||||
3.125%, 7/15/15 | 182,000 | 189,395 | ||||||
2.500%, 2/15/16 | 364,000 | 378,201 | ||||||
1.375%, 10/23/19 | 21,000 | 19,944 | ||||||
National Australia Bank Ltd./New York |
| |||||||
2.750%, 3/9/17 | 50,000 | 52,042 | ||||||
3.000%, 1/20/23 | 250,000 | 232,809 | ||||||
Nordea Bank AB | ||||||||
1.144%, 1/14/14 (l)§ | 2,103,000 | 2,103,372 | ||||||
Oesterreichische Kontrollbank AG |
| |||||||
4.875%, 2/16/16 | 182,000 | 197,986 | ||||||
PNC Bank N.A. | ||||||||
4.875%, 9/21/17 | 50,000 | 55,150 | ||||||
PNC Funding Corp. | ||||||||
3.625%, 2/8/15 | 273,000 | 281,856 | ||||||
5.625%, 2/1/17 | 109,000 | 121,132 | ||||||
5.125%, 2/8/20 | 36,000 | 40,628 | ||||||
4.375%, 8/11/20 | 36,000 | 38,673 | ||||||
Royal Bank of Canada | ||||||||
0.800%, 10/30/15 | 73,000 | 73,026 | ||||||
2.625%, 12/15/15 | 128,000 | 132,389 | ||||||
2.300%, 7/20/16 | 73,000 | 75,404 | ||||||
1.500%, 1/16/18 | 91,000 | 89,344 | ||||||
Royal Bank of Scotland Group plc |
| |||||||
5.050%, 1/8/15 | 761,000 | 783,556 | ||||||
6.400%, 10/21/19 | 100,000 | 114,576 | ||||||
Royal Bank of Scotland plc | ||||||||
3.950%, 9/21/15 | 182,000 | 190,420 | ||||||
5.625%, 8/24/20 | 91,000 | 101,372 | ||||||
Santander Holdings USA, Inc./Pennsylvania |
| |||||||
4.625%, 4/19/16 | 36,000 | 38,399 | ||||||
Sberbank of Russia (SB Capital S.A.) |
| |||||||
5.499%, 7/7/15 (m) | 816,000 | 858,840 | ||||||
Sumitomo Mitsui Banking Corp. | ||||||||
1.450%, 7/19/16 | 250,000 | 251,325 | ||||||
SunTrust Banks, Inc./Georgia | ||||||||
7.250%, 3/15/18 | 91,000 | 108,614 | ||||||
2.750%, 5/1/23 | 200,000 | 181,750 | ||||||
Svenska Handelsbanken AB | ||||||||
3.125%, 7/12/16 | $ | 250,000 | $ | 261,932 | ||||
Toronto-Dominion Bank | ||||||||
2.500%, 7/14/16 | 128,000 | 132,871 | ||||||
2.375%, 10/19/16 | 73,000 | 75,654 | ||||||
U.S. Bancorp/Minnesota | ||||||||
2.450%, 7/27/15 | 91,000 | 93,519 | ||||||
1.950%, 11/15/18 | 289,000 | 286,861 | ||||||
2.950%, 7/15/22 | 91,000 | 83,566 | ||||||
Union Bank N.A. | ||||||||
2.625%, 9/26/18 | 250,000 | 254,467 | ||||||
UnionBanCal Corp. | ||||||||
3.500%, 6/18/22 | 91,000 | 89,041 | ||||||
Wachovia Corp. | ||||||||
5.625%, 10/15/16 | 91,000 | 102,297 | ||||||
5.750%, 2/1/18 | 73,000 | 84,227 | ||||||
Wells Fargo & Co. | ||||||||
1.250%, 2/13/15 | 91,000 | 91,841 | ||||||
1.500%, 7/1/15 | 262,000 | 265,577 | ||||||
5.625%, 12/11/17 | 182,000 | 208,830 | ||||||
1.500%, 1/16/18 | 109,000 | 107,822 | ||||||
2.150%, 1/15/19 | 118,000 | 117,641 | ||||||
4.600%, 4/1/21 | 150,000 | 164,142 | ||||||
3.500%, 3/8/22 | 273,000 | 274,208 | ||||||
3.450%, 2/13/23 | 109,000 | 102,530 | ||||||
5.375%, 11/2/43 | 65,000 | 66,193 | ||||||
Westpac Banking Corp. | ||||||||
3.000%, 8/4/15 | 182,000 | 188,780 | ||||||
0.950%, 1/12/16 | 109,000 | 109,442 | ||||||
2.000%, 8/14/17 | 73,000 | 73,682 | ||||||
4.875%, 11/19/19 | 109,000 | 120,558 | ||||||
|
| |||||||
| 25,555,573 | ||||||||
|
| |||||||
Consumer Finance (1.8%) | ||||||||
Ally Financial, Inc. | ||||||||
3.439%, 2/11/14 (l) | 1,450,000 | 1,453,480 | ||||||
8.300%, 2/12/15 | 218,000 | 234,486 | ||||||
American Express Centurion Bank | ||||||||
6.000%, 9/13/17 | 146,000 | 168,881 | ||||||
American Express Co. | ||||||||
6.150%, 8/28/17 | 363,000 | 418,499 | ||||||
7.000%, 3/19/18 | 2,339,000 | 2,796,834 | ||||||
8.125%, 5/20/19 | 91,000 | 115,708 | ||||||
American Express Credit Corp. | ||||||||
1.750%, 6/12/15 | 47,000 | 47,769 | ||||||
2.750%, 9/15/15 | 182,000 | 188,308 | ||||||
2.800%, 9/19/16 | 109,000 | 113,806 | ||||||
American Honda Finance Corp. | ||||||||
2.125%, 10/10/18 | 150,000 | 149,265 | ||||||
Capital One Financial Corp. | ||||||||
2.150%, 3/23/15 | 91,000 | 92,449 | ||||||
1.000%, 11/6/15 | 55,000 | 55,025 | ||||||
3.150%, 7/15/16 | 124,000 | 129,792 | ||||||
Caterpillar Financial Services Corp. | ||||||||
2.750%, 6/24/15 | 182,000 | 187,776 | ||||||
1.250%, 11/6/17 | 91,000 | 89,735 | ||||||
7.150%, 2/15/19 | 73,000 | 89,462 | ||||||
Discover Financial Services | ||||||||
6.450%, 6/12/17 | 73,000 | 82,809 | ||||||
5.200%, 4/27/22 | 55,000 | 57,097 | ||||||
3.850%, 11/21/22 | 288,000 | 276,480 | ||||||
See Notes to Financial Statements.
38
AXA PREMIER VIP TRUST
MULTIMANAGER CORE BOND PORTFOLIO
PORTFOLIO OF INVESTMENTS (Continued)
December 31, 2013
| Principal Amount | Value (Note 1) | |||||||
Ford Motor Credit Co. LLC | ||||||||
3.875%, 1/15/15 | $ | 181,000 | $ | 186,810 | ||||
12.000%, 5/15/15 | 273,000 | 313,267 | ||||||
3.984%, 6/15/16 | 91,000 | 96,779 | ||||||
8.000%, 12/15/16 | 182,000 | 214,987 | ||||||
3.000%, 6/12/17 | 273,000 | 282,828 | ||||||
2.375%, 1/16/18 | 3,009,000 | 3,037,285 | ||||||
5.000%, 5/15/18 | 303,000 | 337,936 | ||||||
5.875%, 8/2/21 | 182,000 | 206,534 | ||||||
HSBC Finance Corp. | ||||||||
5.000%, 6/30/15 | 250,000 | 264,418 | ||||||
HSBC USA, Inc. | ||||||||
1.625%, 1/16/18 | 146,000 | 142,870 | ||||||
John Deere Capital Corp. | ||||||||
2.800%, 9/18/17 | 182,000 | 190,529 | ||||||
1.300%, 3/12/18 | 55,000 | 53,669 | ||||||
3.150%, 10/15/21 | 109,000 | 107,113 | ||||||
PACCAR Financial Corp. | ||||||||
0.700%, 11/16/15 | 55,000 | 55,091 | ||||||
Toyota Motor Credit Corp. | ||||||||
0.875%, 7/17/15 | 91,000 | 91,547 | ||||||
2.800%, 1/11/16 | 146,000 | 152,505 | ||||||
2.000%, 9/15/16 | 109,000 | 111,705 | ||||||
1.250%, 10/5/17 | 73,000 | 71,566 | ||||||
3.400%, 9/15/21 | 109,000 | 110,243 | ||||||
|
| |||||||
| 12,775,343 | ||||||||
|
| |||||||
Diversified Financial Services (3.7%) |
| |||||||
Bank of America Corp. | ||||||||
4.500%, 4/1/15 | 182,000 | 190,260 | ||||||
3.700%, 9/1/15 | 315,000 | 329,045 | ||||||
1.500%, 10/9/15 | 109,000 | 110,064 | ||||||
6.500%, 8/1/16 | 365,000 | 411,926 | ||||||
5.625%, 10/14/16 | 182,000 | 202,334 | ||||||
2.000%, 1/11/18 | 558,000 | 556,973 | ||||||
5.650%, 5/1/18 | 930,000 | 1,058,928 | ||||||
2.600%, 1/15/19 | 124,000 | 124,546 | ||||||
7.625%, 6/1/19 | 1,670,000 | 2,067,784 | ||||||
5.625%, 7/1/20 | 365,000 | 415,628 | ||||||
5.000%, 5/13/21 | 182,000 | 198,583 | ||||||
3.300%, 1/11/23 | 333,000 | 315,879 | ||||||
4.100%, 7/24/23 | 125,000 | 125,480 | ||||||
Bank of America N.A. | ||||||||
0.523%, 6/15/16 (l) | 616,000 | 610,449 | ||||||
1.125%, 11/14/16 | 250,000 | 249,685 | ||||||
5.300%, 3/15/17 | 182,000 | 200,620 | ||||||
Bear Stearns Cos. LLC | ||||||||
5.300%, 10/30/15 | 302,000 | 325,621 | ||||||
Block Financial LLC | ||||||||
5.500%, 11/1/22 | 73,000 | 74,970 | ||||||
Boeing Capital Corp. | ||||||||
2.125%, 8/15/16 | 55,000 | 56,771 | ||||||
Citigroup, Inc. | ||||||||
5.500%, 10/15/14 | 24,000 | 24,879 | ||||||
2.650%, 3/2/15 | 150,000 | 153,100 | ||||||
4.750%, 5/19/15 | 182,000 | 191,510 | ||||||
2.250%, 8/7/15 | 55,000 | 56,093 | ||||||
3.953%, 6/15/16 | 182,000 | 193,682 | ||||||
4.450%, 1/10/17 | 58,000 | 62,724 | ||||||
5.500%, 2/15/17 | 91,000 | 99,695 | ||||||
6.000%, 8/15/17 | 156,000 | 178,343 | ||||||
6.125%, 5/15/18 | 364,000 | 422,532 | ||||||
2.500%, 9/26/18 | $ | 100,000 | $ | 100,381 | ||||
8.500%, 5/22/19 | 364,000 | 469,747 | ||||||
3.375%, 3/1/23 | 107,000 | 101,828 | ||||||
3.875%, 10/25/23 | 150,000 | 147,012 | ||||||
General Electric Capital Corp. | ||||||||
3.500%, 6/29/15 | 364,000 | 379,481 | ||||||
1.625%, 7/2/15 | 100,000 | 101,623 | ||||||
1.000%, 12/11/15 | 91,000 | 91,697 | ||||||
1.000%, 1/8/16 | 91,000 | 91,151 | ||||||
2.950%, 5/9/16 | 109,000 | 113,818 | ||||||
1.500%, 7/12/16 | 100,000 | 100,964 | ||||||
5.400%, 2/15/17 | 294,000 | 330,165 | ||||||
1.600%, 11/20/17 | 55,000 | 54,685 | ||||||
6.000%, 8/7/19 | 396,000 | 464,123 | ||||||
5.300%, 2/11/21 | 323,000 | 362,160 | ||||||
4.650%, 10/17/21 | 182,000 | 199,328 | ||||||
3.150%, 9/7/22 | 109,000 | 105,696 | ||||||
3.100%, 1/9/23 | 150,000 | 142,887 | ||||||
ING US, Inc. | ||||||||
5.500%, 7/15/22 | 36,000 | 39,006 | ||||||
JPMorgan Chase & Co. | ||||||||
4.750%, 3/1/15 | 337,000 | 352,425 | ||||||
3.150%, 7/5/16 | 175,000 | 183,536 | ||||||
2.000%, 8/15/17 | 91,000 | 92,290 | ||||||
6.000%, 1/15/18 | 546,000 | 629,881 | ||||||
6.300%, 4/23/19 | 182,000 | 214,987 | ||||||
4.400%, 7/22/20 | 364,000 | 391,949 | ||||||
4.625%, 5/10/21 | 182,000 | 196,410 | ||||||
3.250%, 9/23/22 | 204,000 | 195,752 | ||||||
3.200%, 1/25/23 | 150,000 | 142,482 | ||||||
JPMorgan Chase Bank N.A. | ||||||||
0.994%, 5/31/17 (l) | EUR | 1,400,000 | 1,903,831 | |||||
6.000%, 10/1/17 | $ | 2,249,000 | 2,566,170 | |||||
4.375%, 11/30/21 (l)(m) | EUR | 150,000 | 216,038 | |||||
NASDAQ OMX Group, Inc. | ||||||||
4.000%, 1/15/15 | $ | 36,000 | 37,240 | |||||
5.550%, 1/15/20 | 36,000 | 38,937 | ||||||
National Credit Union Administration Guaranteed Notes |
| |||||||
2.350%, 6/12/17 | 73,000 | 75,557 | ||||||
National Rural Utilities Cooperative Finance Corp. |
| |||||||
3.050%, 3/1/16 | 109,000 | 114,208 | ||||||
5.450%, 2/1/18 | 109,000 | 123,797 | ||||||
ORIX Corp. | ||||||||
4.710%, 4/27/15 | 91,000 | 94,465 | ||||||
Private Export Funding Corp. | ||||||||
4.550%, 5/15/15 | 73,000 | 77,211 | ||||||
4.950%, 11/15/15 | 73,000 | 79,109 | ||||||
1.375%, 2/15/17 | 18,000 | 18,199 | ||||||
2.050%, 11/15/22 | 46,000 | 41,158 | ||||||
Rosneft Finance S.A. | ||||||||
6.250%, 2/2/15 (m) | 218,000 | 228,628 | ||||||
7.500%, 7/18/16 (m) | 725,000 | 816,531 | ||||||
6.625%, 3/20/17 (m) | 399,000 | 440,895 | ||||||
7.875%, 3/13/18 (m) | 471,000 | 543,416 | ||||||
RZD Capital Ltd. | ||||||||
5.739%, 4/3/17 (m) | 100,000 | 108,125 | ||||||
Sasol Financing International plc |
| |||||||
4.500%, 11/14/22 | 50,000 | 47,000 | ||||||
Shell International Finance B.V. |
| |||||||
3.100%, 6/28/15 | 2,394,000 | 2,485,840 | ||||||
0.900%, 11/15/16 | 100,000 | 99,933 | ||||||
See Notes to Financial Statements.
39
AXA PREMIER VIP TRUST
MULTIMANAGER CORE BOND PORTFOLIO
PORTFOLIO OF INVESTMENTS (Continued)
December 31, 2013
| Principal Amount | Value (Note 1) | |||||||
2.000%, 11/15/18 | $ | 174,000 | $ | 174,212 | ||||
4.300%, 9/22/19 | 73,000 | 79,888 | ||||||
4.375%, 3/25/20 | 36,000 | 39,093 | ||||||
2.375%, 8/21/22 | 73,000 | 66,673 | ||||||
3.400%, 8/12/23 | 150,000 | 146,478 | ||||||
4.550%, 8/12/43 | 153,000 | 150,013 | ||||||
Waha Aerospace B.V. | ||||||||
3.925%, 7/28/20§ | 376,600 | 395,430 | ||||||
XTRA Finance Corp. | ||||||||
5.150%, 4/1/17 | 36,000 | 39,923 | ||||||
|
| |||||||
| 26,051,566 | ||||||||
|
| |||||||
Insurance (0.9%) | ||||||||
ACE INA Holdings, Inc. | ||||||||
5.600%, 5/15/15 | 91,000 | 97,026 | ||||||
2.600%, 11/23/15 | 36,000 | 37,217 | ||||||
5.900%, 6/15/19 | 36,000 | 42,004 | ||||||
Aegon N.V. | ||||||||
4.625%, 12/1/15 | 109,000 | 116,040 | ||||||
Aflac, Inc. | ||||||||
8.500%, 5/15/19 | 55,000 | 69,960 | ||||||
Alleghany Corp. | ||||||||
5.625%, 9/15/20 | 36,000 | 39,392 | ||||||
Allianz Finance II B.V. | ||||||||
5.750%, 7/8/41 (b)(l) | EUR | 100,000 | 154,410 | |||||
Allstate Corp. | ||||||||
7.450%, 5/16/19 | $ | 73,000 | 90,641 | |||||
American Financial Group, Inc./Ohio |
| |||||||
9.875%, 6/15/19 | 36,000 | 45,915 | ||||||
American International Group, Inc. |
| |||||||
5.050%, 10/1/15 | 91,000 | 97,556 | ||||||
5.600%, 10/18/16 | 36,000 | 40,072 | ||||||
3.800%, 3/22/17 | 222,000 | 236,898 | ||||||
5.450%, 5/18/17 | 91,000 | 101,772 | ||||||
5.850%, 1/16/18 | 91,000 | 103,699 | ||||||
3.375%, 8/15/20 | 180,000 | 180,701 | ||||||
6.400%, 12/15/20 | 182,000 | 214,758 | ||||||
4.875%, 6/1/22 | 73,000 | 78,533 | ||||||
4.125%, 2/15/24 | 105,000 | 104,160 | ||||||
8.175%, 5/15/58 (l) | 326,000 | 390,385 | ||||||
Aon Corp. | ||||||||
3.500%, 9/30/15 | 91,000 | 94,912 | ||||||
5.000%, 9/30/20 | 36,000 | 39,473 | ||||||
Axis Specialty Finance LLC | ||||||||
5.875%, 6/1/20 | 55,000 | 59,880 | ||||||
Berkshire Hathaway Finance Corp. |
| |||||||
4.850%, 1/15/15 | 146,000 | 152,664 | ||||||
0.950%, 8/15/16 | 100,000 | 99,908 | ||||||
4.250%, 1/15/21 | 109,000 | 115,198 | ||||||
Berkshire Hathaway, Inc. | ||||||||
1.550%, 2/9/18 | 55,000 | 54,289 | ||||||
Chubb Corp. | ||||||||
5.750%, 5/15/18 | 36,000 | 41,177 | ||||||
6.375%, 3/29/67 (l) | 73,000 | 79,570 | ||||||
CNA Financial Corp. | ||||||||
5.875%, 8/15/20 | 109,000 | 123,514 | ||||||
Genworth Holdings, Inc. | ||||||||
8.625%, 12/15/16 | 73,000 | 86,289 | ||||||
7.700%, 6/15/20 | 91,000 | 108,332 | ||||||
Hartford Financial Services Group, Inc. |
| |||||||
5.500%, 3/30/20 | 73,000 | 81,446 | ||||||
HCC Insurance Holdings, Inc. | ||||||||
6.300%, 11/15/19 | $ | 36,000 | $ | 41,573 | ||||
Lincoln National Corp. | ||||||||
8.750%, 7/1/19 | 36,000 | 46,262 | ||||||
6.050%, 4/20/67 (l) | 109,000 | 107,910 | ||||||
Manulife Financial Corp. | ||||||||
3.400%, 9/17/15 | 305,000 | 316,787 | ||||||
Markel Corp. | ||||||||
7.125%, 9/30/19 | 36,000 | 43,386 | ||||||
5.350%, 6/1/21 | 36,000 | 39,138 | ||||||
Marsh & McLennan Cos., Inc. | ||||||||
4.800%, 7/15/21 | 36,000 | 38,285 | ||||||
MetLife, Inc. | ||||||||
6.750%, 6/1/16 | 109,000 | 123,637 | ||||||
4.750%, 2/8/21 | 91,000 | 97,210 | ||||||
4.368%, 9/15/23 | 200,000 | 201,731 | ||||||
Metropolitan Life Global Funding I |
| |||||||
5.125%, 6/10/14§ | 281,000 | 286,769 | ||||||
Montpelier Reinsurance Holdings Ltd. |
| |||||||
4.700%, 10/15/22 | 73,000 | 70,375 | ||||||
OneBeacon US Holdings, Inc. | ||||||||
4.600%, 11/9/22 | 36,000 | 35,218 | ||||||
PartnerReinsurance Finance B LLC | ||||||||
5.500%, 6/1/20 | 36,000 | 38,906 | ||||||
Principal Financial Group, Inc. | ||||||||
8.875%, 5/15/19 | 73,000 | 93,900 | ||||||
Progressive Corp. | ||||||||
3.750%, 8/23/21 | 46,000 | 46,841 | ||||||
Protective Life Corp. | ||||||||
7.375%, 10/15/19 | 36,000 | 43,954 | ||||||
Prudential Financial, Inc. | ||||||||
6.200%, 1/15/15 | 16,000 | 16,920 | ||||||
4.750%, 9/17/15 | 288,000 | 307,551 | ||||||
6.000%, 12/1/17 | 273,000 | 314,005 | ||||||
5.375%, 6/21/20 | 170,000 | 191,074 | ||||||
5.875%, 9/15/42 (l) | 109,000 | 111,044 | ||||||
Reinsurance Group of America, Inc. | ||||||||
6.450%, 11/15/19 | 36,000 | 41,471 | ||||||
Torchmark Corp. | ||||||||
9.250%, 6/15/19 | 36,000 | 46,150 | ||||||
Travelers Cos., Inc. | ||||||||
5.500%, 12/1/15 | 55,000 | 59,796 | ||||||
5.800%, 5/15/18 | 91,000 | 104,409 | ||||||
Unum Group | ||||||||
5.625%, 9/15/20 | 36,000 | 39,392 | ||||||
XLIT Ltd. | ||||||||
2.300%, 12/15/18 | 50,000 | 48,878 | ||||||
5.250%, 12/15/43 | 23,000 | 22,891 | ||||||
|
| |||||||
| 6,353,254 | ||||||||
|
| |||||||
Real Estate Investment Trusts (REITs) (0.5%) |
| |||||||
American Tower Corp. | ||||||||
4.625%, 4/1/15 | 55,000 | 57,469 | ||||||
5.050%, 9/1/20 | 128,000 | 134,551 | ||||||
AvalonBay Communities, Inc. | ||||||||
5.700%, 3/15/17 | 55,000 | 61,344 | ||||||
4.200%, 12/15/23 | 100,000 | 99,295 | ||||||
Boston Properties LP | ||||||||
3.700%, 11/15/18 | 73,000 | 77,219 | ||||||
5.875%, 10/15/19 | 109,000 | 124,595 | ||||||
Brandywine Operating Partnership LP |
| |||||||
4.950%, 4/15/18 | 36,000 | 38,248 | ||||||
See Notes to Financial Statements.
40
AXA PREMIER VIP TRUST
MULTIMANAGER CORE BOND PORTFOLIO
PORTFOLIO OF INVESTMENTS (Continued)
December 31, 2013
| Principal Amount | Value (Note 1) | |||||||
Camden Property Trust | ||||||||
4.625%, 6/15/21 | $ | 73,000 | $ | 76,221 | ||||
CommonWealth REIT | ||||||||
6.650%, 1/15/18 | 36,000 | 39,297 | ||||||
CubeSmart LP | ||||||||
4.375%, 12/15/23 | 50,000 | 48,508 | ||||||
DDR Corp. | ||||||||
4.625%, 7/15/22 | 55,000 | 55,970 | ||||||
Digital Realty Trust LP | ||||||||
4.500%, 7/15/15 | 36,000 | 37,560 | ||||||
3.625%, 10/1/22 | 55,000 | 48,979 | ||||||
Duke Realty LP | ||||||||
6.750%, 3/15/20 | 55,000 | 63,223 | ||||||
EPR Properties | ||||||||
7.750%, 7/15/20 | 36,000 | 41,014 | ||||||
ERP Operating LP | ||||||||
5.125%, 3/15/16 | 182,000 | 197,088 | ||||||
Federal Realty Investment Trust | ||||||||
3.000%, 8/1/22 | 36,000 | 33,546 | ||||||
HCP, Inc. | ||||||||
3.750%, 2/1/16 | 36,000 | 37,801 | ||||||
6.000%, 1/30/17 | 73,000 | 81,774 | ||||||
3.150%, 8/1/22 | 36,000 | 33,128 | ||||||
4.250%, 11/15/23 | 140,000 | 137,218 | ||||||
Health Care REIT, Inc. | ||||||||
4.700%, 9/15/17 | 73,000 | 79,222 | ||||||
6.125%, 4/15/20 | 53,000 | 59,419 | ||||||
Healthcare Realty Trust, Inc. | ||||||||
6.500%, 1/17/17 | 36,000 | 40,099 | ||||||
Highwoods Realty LP | ||||||||
3.625%, 1/15/23 | 55,000 | 50,141 | ||||||
Hospitality Properties Trust | ||||||||
5.625%, 3/15/17 | 36,000 | 38,859 | ||||||
Host Hotels & Resorts LP | ||||||||
4.750%, 3/1/23 | 36,000 | 36,315 | ||||||
Kilroy Realty LP | ||||||||
5.000%, 11/3/15 | 36,000 | 38,285 | ||||||
Kimco Realty Corp. | ||||||||
6.875%, 10/1/19 | 36,000 | 42,830 | ||||||
Liberty Property LP | ||||||||
4.750%, 10/1/20 | 73,000 | 76,224 | ||||||
Mack-Cali Realty LP | ||||||||
7.750%, 8/15/19 | 36,000 | 42,936 | ||||||
National Retail Properties, Inc. | ||||||||
3.800%, 10/15/22 | 55,000 | 52,354 | ||||||
ProLogis LP | ||||||||
4.250%, 8/15/23 | 100,000 | 98,557 | ||||||
Realty Income Corp. | ||||||||
5.750%, 1/15/21 | 91,000 | 100,289 | ||||||
Senior Housing Properties Trust | ||||||||
4.300%, 1/15/16 | 36,000 | 37,530 | ||||||
Simon Property Group LP | ||||||||
5.100%, 6/15/15 | 185,000 | 196,665 | ||||||
5.650%, 2/1/20 | 182,000 | 205,294 | ||||||
4.125%, 12/1/21 | 36,000 | 37,396 | ||||||
UDR, Inc. | ||||||||
4.250%, 6/1/18 | 73,000 | 77,431 | ||||||
Ventas Realty LP/Ventas Capital Corp. |
| |||||||
3.125%, 11/30/15 | 36,000 | 37,404 | ||||||
2.000%, 2/15/18 | 55,000 | 53,937 | ||||||
4.250%, 3/1/22 | 40,000 | 40,237 | ||||||
3.250%, 8/15/22 | 36,000 | 33,387 | ||||||
Vornado Realty LP | ||||||||
5.000%, 1/15/22 | $ | 91,000 | $ | 94,565 | ||||
Washington Real Estate Investment Trust |
| |||||||
3.950%, 10/15/22 | 36,000 | 34,329 | ||||||
Weingarten Realty Investors | ||||||||
3.375%, 10/15/22 | 109,000 | 99,306 | ||||||
Weyerhaeuser Co. | ||||||||
4.625%, 9/15/23 | 100,000 | 101,165 | ||||||
|
| |||||||
| 3,328,224 | ||||||||
|
| |||||||
Thrifts & Mortgage Finance (0.0%) | ||||||||
Abbey National Treasury Services plc/London |
| |||||||
4.000%, 4/27/16 | 36,000 | 38,308 | ||||||
|
| |||||||
Total Financials | 89,125,363 | |||||||
|
| |||||||
Health Care (1.8%) | ||||||||
Biotechnology (0.1%) | ||||||||
Amgen, Inc. | ||||||||
5.850%, 6/1/17 | 109,000 | 124,235 | ||||||
6.150%, 6/1/18 | 11,000 | 12,865 | ||||||
3.450%, 10/1/20 | 109,000 | 110,300 | ||||||
4.100%, 6/15/21 | 109,000 | 113,639 | ||||||
3.625%, 5/15/22 | 91,000 | 90,698 | ||||||
5.150%, 11/15/41 | 60,000 | 60,170 | ||||||
5.650%, 6/15/42 | 105,000 | 109,724 | ||||||
Biogen Idec, Inc. | ||||||||
6.875%, 3/1/18 | 36,000 | 42,135 | ||||||
Celgene Corp. | ||||||||
2.300%, 8/15/18 | 86,000 | 85,821 | ||||||
Genentech, Inc. | ||||||||
4.750%, 7/15/15 | 36,000 | 38,281 | ||||||
Gilead Sciences, Inc. | ||||||||
4.500%, 4/1/21 | 109,000 | 116,666 | ||||||
|
| |||||||
| 904,534 | ||||||||
|
| |||||||
Health Care Equipment & Supplies (0.3%) |
| |||||||
Abbott Laboratories | ||||||||
4.125%, 5/27/20 | 73,000 | 78,576 | ||||||
Baxter International, Inc. | ||||||||
0.950%, 6/1/16 | 100,000 | 99,992 | ||||||
5.900%, 9/1/16 | 73,000 | 82,075 | ||||||
4.250%, 3/15/20 | 36,000 | 38,884 | ||||||
2.400%, 8/15/22 | 36,000 | 32,860 | ||||||
Becton Dickinson and Co. | ||||||||
3.250%, 11/12/20 | 109,000 | 109,298 | ||||||
Boston Scientific Corp. | ||||||||
6.400%, 6/15/16 | 121,000 | 135,172 | ||||||
5.125%, 1/12/17 | 348,000 | 380,360 | ||||||
2.650%, 10/1/18 | 231,000 | 232,660 | ||||||
6.000%, 1/15/20 | 36,000 | 41,443 | ||||||
C.R. Bard, Inc. | ||||||||
2.875%, 1/15/16 | 36,000 | 37,363 | ||||||
CareFusion Corp. | ||||||||
3.300%, 3/1/23 § | 36,000 | 33,010 | ||||||
Covidien International Finance S.A. | ||||||||
2.800%, 6/15/15 | 36,000 | 36,999 | ||||||
4.200%, 6/15/20 | 36,000 | 38,192 | ||||||
2.950%, 6/15/23 | 150,000 | 138,770 | ||||||
DENTSPLY International, Inc. | ||||||||
2.750%, 8/15/16 | 20,000 | 20,599 | ||||||
4.125%, 8/15/21 | 36,000 | 35,929 | ||||||
See Notes to Financial Statements.
41
AXA PREMIER VIP TRUST
MULTIMANAGER CORE BOND PORTFOLIO
PORTFOLIO OF INVESTMENTS (Continued)
December 31, 2013
| Principal Amount | Value (Note 1) | |||||||
Edwards Lifesciences Corp. | ||||||||
2.875%, 10/15/18 | $ | 178,000 | $ | 177,205 | ||||
Medtronic, Inc. | ||||||||
3.000%, 3/15/15 | 109,000 | 112,376 | ||||||
1.375%, 4/1/18 | 36,000 | 35,225 | ||||||
4.450%, 3/15/20 | 109,000 | 118,898 | ||||||
St. Jude Medical, Inc. | ||||||||
3.250%, 4/15/23 | 55,000 | 51,205 | ||||||
Stryker Corp. | ||||||||
3.000%, 1/15/15 | 36,000 | 36,938 | ||||||
4.375%, 1/15/20 | 36,000 | 38,898 | ||||||
Zimmer Holdings, Inc. | ||||||||
4.625%, 11/30/19 | 55,000 | 59,565 | ||||||
|
| |||||||
| 2,202,492 | ||||||||
|
| |||||||
Health Care Providers & Services (0.7%) |
| |||||||
Aetna, Inc. | ||||||||
3.950%, 9/1/20 | 128,000 | 133,695 | ||||||
AmerisourceBergen Corp. | ||||||||
4.875%, 11/15/19 | 55,000 | 60,674 | ||||||
Cardinal Health, Inc. | ||||||||
4.000%, 6/15/15 | 36,000 | 37,678 | ||||||
4.625%, 12/15/20 | 36,000 | 38,860 | ||||||
Cigna Corp. | ||||||||
5.125%, 6/15/20 | 78,000 | 85,545 | ||||||
4.375%, 12/15/20 | 36,000 | 37,915 | ||||||
Coventry Health Care, Inc. | ||||||||
5.450%, 6/15/21 | 176,000 | 194,480 | ||||||
Express Scripts Holding Co. | ||||||||
3.125%, 5/15/16 | 91,000 | 95,152 | ||||||
4.750%, 11/15/21 | 36,000 | 38,164 | ||||||
HCA, Inc. | ||||||||
2.669%, 3/15/14 | 2,587,500 | 2,585,345 | ||||||
Humana, Inc. | ||||||||
7.200%, 6/15/18 | 55,000 | 64,756 | ||||||
Laboratory Corp. of America Holdings |
| |||||||
2.200%, 8/23/17 | 24,000 | 24,128 | ||||||
4.625%, 11/15/20 | 91,000 | 95,059 | ||||||
3.750%, 8/23/22 | 20,000 | 19,295 | ||||||
McKesson Corp. | ||||||||
4.750%, 3/1/21 | 91,000 | 96,192 | ||||||
2.700%, 12/15/22 | 55,000 | 49,320 | ||||||
2.850%, 3/15/23 | 73,000 | 65,870 | ||||||
Medco Health Solutions, Inc. | ||||||||
2.750%, 9/15/15 | 36,000 | 37,149 | ||||||
7.125%, 3/15/18 | 91,000 | 107,603 | ||||||
4.125%, 9/15/20 | 91,000 | 93,945 | ||||||
Quest Diagnostics, Inc. | ||||||||
6.400%, 7/1/17 | 73,000 | 83,065 | ||||||
UnitedHealth Group, Inc. | ||||||||
6.000%, 2/15/18 | 91,000 | 105,071 | ||||||
4.700%, 2/15/21 | 146,000 | 157,462 | ||||||
3.375%, 11/15/21 | 82,000 | 80,333 | ||||||
2.875%, 3/15/23 | 55,000 | 51,177 | ||||||
WellPoint, Inc. | ||||||||
1.875%, 1/15/18 | 145,000 | 143,321 | ||||||
2.300%, 7/15/18 | 109,000 | 108,147 | ||||||
4.350%, 8/15/20 | 237,000 | 250,580 | ||||||
|
| |||||||
| 4,939,981 | ||||||||
|
| |||||||
Life Sciences Tools & Services (0.1%) |
| |||||||
Agilent Technologies, Inc. | ||||||||
6.500%, 11/1/17 | $ | 36,000 | $ | 41,696 | ||||
Life Technologies Corp. | ||||||||
4.400%, 3/1/15 | 73,000 | 76,021 | ||||||
6.000%, 3/1/20 | 237,000 | 272,433 | ||||||
Thermo Fisher Scientific, Inc. | ||||||||
3.200%, 3/1/16 | 182,000 | 190,119 | ||||||
1.850%, 1/15/18 | 36,000 | 35,769 | ||||||
2.400%, 2/1/19 | 171,000 | 169,775 | ||||||
5.300%, 2/1/44 | 13,000 | 13,112 | ||||||
|
| |||||||
| 798,925 | ||||||||
|
| |||||||
Pharmaceuticals (0.6%) | ||||||||
AbbVie, Inc. | ||||||||
1.200%, 11/6/15 | 146,000 | 147,402 | ||||||
1.750%, 11/6/17 | 130,000 | 129,996 | ||||||
2.900%, 11/6/22 | 146,000 | 136,615 | ||||||
4.400%, 11/6/42 | 120,000 | 111,612 | ||||||
Actavis, Inc. | ||||||||
6.125%, 8/15/19 | 47,000 | 54,174 | ||||||
3.250%, 10/1/22 | 73,000 | 68,118 | ||||||
4.625%, 10/1/42 | 120,000 | 109,881 | ||||||
Allergan, Inc. | ||||||||
3.375%, 9/15/20 | 91,000 | 92,969 | ||||||
AstraZeneca plc | ||||||||
5.900%, 9/15/17 | 73,000 | 83,336 | ||||||
Bristol-Myers Squibb Co. | ||||||||
5.450%, 5/1/18 | 73,000 | 84,080 | ||||||
4.500%, 3/1/44 | 137,000 | 131,919 | ||||||
Eli Lilly and Co. | ||||||||
5.200%, 3/15/17 | 109,000 | 121,862 | ||||||
GlaxoSmithKline Capital plc | ||||||||
2.850%, 5/8/22 | 91,000 | 86,009 | ||||||
GlaxoSmithKline Capital, Inc. | ||||||||
5.650%, 5/15/18 | 273,000 | 313,988 | ||||||
2.800%, 3/18/23 | 73,000 | 67,598 | ||||||
Johnson & Johnson | ||||||||
5.550%, 8/15/17 | 109,000 | 124,781 | ||||||
2.950%, 9/1/20 | 73,000 | 73,965 | ||||||
Merck & Co., Inc. | ||||||||
6.000%, 9/15/17 | 73,000 | 84,544 | ||||||
1.300%, 5/18/18 | 61,000 | 59,442 | ||||||
3.875%, 1/15/21 | 73,000 | 76,852 | ||||||
2.400%, 9/15/22 | 55,000 | 50,203 | ||||||
2.800%, 5/18/23 | 125,000 | 115,873 | ||||||
Mylan, Inc. | ||||||||
1.350%, 11/29/16 | 100,000 | 99,789 | ||||||
Novartis Capital Corp. | ||||||||
2.900%, 4/24/15 | 73,000 | 75,370 | ||||||
2.400%, 9/21/22 | 36,000 | 32,954 | ||||||
Novartis Securities Investment Ltd. | ||||||||
5.125%, 2/10/19 | 128,000 | 145,143 | ||||||
Perrigo Co. plc | ||||||||
4.000%, 11/15/23§ | 200,000 | 196,134 | ||||||
Pfizer, Inc. | ||||||||
6.200%, 3/15/19 | 91,000 | 107,938 | ||||||
Sanofi S.A. | ||||||||
2.625%, 3/29/16 | 91,000 | 94,536 | ||||||
1.250%, 4/10/18 | 91,000 | 88,643 | ||||||
4.000%, 3/29/21 | 73,000 | 76,573 | ||||||
See Notes to Financial Statements.
42
AXA PREMIER VIP TRUST
MULTIMANAGER CORE BOND PORTFOLIO
PORTFOLIO OF INVESTMENTS (Continued)
December 31, 2013
| Principal Amount | Value (Note 1) | |||||||
Teva Pharmaceutical Finance Co. B.V. |
| |||||||
3.650%, 11/10/21 | $ | 89,000 | $ | 86,985 | ||||
2.950%, 12/18/22 | 73,000 | 66,189 | ||||||
Teva Pharmaceutical Finance IV B.V. | ||||||||
3.650%, 11/10/21 | 91,000 | 88,940 | ||||||
Teva Pharmaceutical Finance IV LLC | ||||||||
2.250%, 3/18/20 | 36,000 | 33,908 | ||||||
Wyeth LLC | ||||||||
5.500%, 2/15/16 | 182,000 | 200,392 | ||||||
Zoetis, Inc. | ||||||||
1.875%, 2/1/18 | 73,000 | 72,114 | ||||||
|
| |||||||
| 3,790,827 | ||||||||
|
| |||||||
Total Health Care | 12,636,759 | |||||||
|
| |||||||
Industrials (1.0%) | ||||||||
Aerospace & Defense (0.2%) |
| |||||||
Honeywell International, Inc. | ||||||||
5.300%, 3/1/18 | 28,000 | 31,755 | ||||||
4.250%, 3/1/21 | 91,000 | 97,454 | ||||||
L-3 Communications Corp. | ||||||||
3.950%, 11/15/16 | 36,000 | 38,205 | ||||||
4.950%, 2/15/21 | 146,000 | 152,619 | ||||||
Lockheed Martin Corp. | ||||||||
2.125%, 9/15/16 | 91,000 | 93,606 | ||||||
3.350%, 9/15/21 | 91,000 | 90,115 | ||||||
Precision Castparts Corp. | ||||||||
1.250%, 1/15/18 | 91,000 | 88,657 | ||||||
Raytheon Co. | ||||||||
4.400%, 2/15/20 | 146,000 | 156,146 | ||||||
Rockwell Collins, Inc. | ||||||||
5.250%, 7/15/19 | 18,000 | 20,309 | ||||||
Textron, Inc. | ||||||||
4.625%, 9/21/16 | 36,000 | 38,816 | ||||||
7.250%, 10/1/19 | 36,000 | 41,583 | ||||||
United Technologies Corp. | ||||||||
4.875%, 5/1/15 | 91,000 | 96,173 | ||||||
1.800%, 6/1/17 | 18,000 | 18,309 | ||||||
6.125%, 2/1/19 | 55,000 | 64,765 | ||||||
4.500%, 4/15/20 | 73,000 | 78,934 | ||||||
3.100%, 6/1/22 | 109,000 | 106,467 | ||||||
|
| |||||||
| 1,213,913 | ||||||||
|
| |||||||
Air Freight & Logistics (0.0%) |
| |||||||
FedEx Corp. | ||||||||
8.000%, 1/15/19 | 36,000 | 44,784 | ||||||
2.700%, 4/15/23 | 36,000 | 32,470 | ||||||
United Parcel Service, Inc. | ||||||||
3.125%, 1/15/21 | 109,000 | 110,237 | ||||||
|
| |||||||
| 187,491 | ||||||||
|
| |||||||
Airlines (0.2%) | ||||||||
Continental Airlines, Inc. | ||||||||
6.000%, 1/12/19 | 810,006 | 826,207 | ||||||
Series 2009-1 | ||||||||
9.000%, 7/8/16 | 73,056 | 83,466 | ||||||
Delta Air Lines, Inc. | ||||||||
Series 2009-1 A | ||||||||
7.750%, 6/17/21 | 48,407 | 56,152 | ||||||
Series 2010-2 A | ||||||||
4.950%, 5/23/19 | 56,522 | 61,326 | ||||||
United Air Lines, Inc. | ||||||||
Series 2009-2 A | ||||||||
9.750%, 1/15/17 | $ | 48,098 | $ | 55,102 | ||||
|
| |||||||
| 1,082,253 | ||||||||
|
| |||||||
Building Products (0.0%) | ||||||||
Owens Corning, Inc. | ||||||||
9.000%, 6/15/19 | 12,000 | 14,835 | ||||||
|
| |||||||
Commercial Services & Supplies (0.1%) |
| |||||||
Board of Trustees of the Leland Stanford Junior University |
| |||||||
4.250%, 5/1/16 | 91,000 | 98,014 | ||||||
Cornell University | ||||||||
5.450%, 2/1/19 | 73,000 | 83,512 | ||||||
Pitney Bowes, Inc. | ||||||||
5.750%, 9/15/17 | 109,000 | 119,643 | ||||||
Republic Services, Inc. | ||||||||
5.500%, 9/15/19 | 54,000 | 60,666 | ||||||
5.250%, 11/15/21 | 73,000 | 78,971 | ||||||
Waste Management, Inc. | ||||||||
7.375%, 3/11/19 | 73,000 | 87,882 | ||||||
4.750%, 6/30/20 | 36,000 | 39,145 | ||||||
2.900%, 9/15/22 | 73,000 | 67,388 | ||||||
|
| |||||||
| 635,221 | ||||||||
|
| |||||||
Construction & Engineering (0.0%) |
| |||||||
ABB Finance USA, Inc. | ||||||||
1.625%, 5/8/17 | 46,000 | 46,000 | ||||||
2.875%, 5/8/22 | 73,000 | 68,975 | ||||||
|
| |||||||
| 114,975 | ||||||||
|
| |||||||
Electrical Equipment (0.0%) |
| |||||||
Eaton Corp. | ||||||||
0.950%, 11/2/15 | 55,000 | 55,212 | ||||||
1.500%, 11/2/17 | 55,000 | 54,180 | ||||||
2.750%, 11/2/22 | 91,000 | 84,829 | ||||||
Emerson Electric Co. | ||||||||
4.875%, 10/15/19 | 91,000 | 101,868 | ||||||
Roper Industries, Inc. | ||||||||
1.850%, 11/15/17 | 36,000 | 35,521 | ||||||
|
| |||||||
| 331,610 | ||||||||
|
| |||||||
Industrial Conglomerates (0.2%) |
| |||||||
3M Co. | ||||||||
1.375%, 9/29/16 | 36,000 | 36,477 | ||||||
Acuity Brands Lighting, Inc. | ||||||||
6.000%, 12/15/19 | 36,000 | 38,815 | ||||||
Cooper U.S., Inc. | ||||||||
2.375%, 1/15/16 | 36,000 | 36,891 | ||||||
3.875%, 12/15/20 | 36,000 | 36,222 | ||||||
Danaher Corp. | ||||||||
5.400%, 3/1/19 | 36,000 | 41,293 | ||||||
3.900%, 6/23/21 | 55,000 | 56,687 | ||||||
General Electric Co. | ||||||||
0.850%, 10/9/15 | 55,000 | 55,287 | ||||||
5.250%, 12/6/17 | 182,000 | 206,180 | ||||||
2.700%, 10/9/22 | 128,000 | 119,899 | ||||||
Hutchison Whampoa International Ltd. |
| |||||||
7.625%, 4/9/19 (m) | 254,000 | 306,827 | ||||||
Ingersoll-Rand Global Holding Co., Ltd. |
| |||||||
6.875%, 8/15/18 | 36,000 | 42,326 | ||||||
See Notes to Financial Statements.
43
AXA PREMIER VIP TRUST
MULTIMANAGER CORE BOND PORTFOLIO
PORTFOLIO OF INVESTMENTS (Continued)
December 31, 2013
| Principal Amount | Value (Note 1) | |||||||
Koninklijke Philips N.V. | ||||||||
5.750%, 3/11/18 | $ | 73,000 | $ | 83,621 | ||||
Pentair Finance S.A. | ||||||||
5.000%, 5/15/21 | 55,000 | 57,563 | ||||||
Tyco Electronics Group S.A. | ||||||||
4.875%, 1/15/21 | 73,000 | 75,948 | ||||||
|
| |||||||
| 1,194,036 | ||||||||
|
| |||||||
Machinery (0.1%) | ||||||||
Caterpillar, Inc. | ||||||||
1.500%, 6/26/17 | 182,000 | 181,538 | ||||||
Deere & Co. | ||||||||
2.600%, 6/8/22 | 182,000 | 170,458 | ||||||
Dover Corp. | ||||||||
5.450%, 3/15/18 | 36,000 | 40,228 | ||||||
Harsco Corp. | ||||||||
2.700%, 10/15/15 | 91,000 | 92,365 | ||||||
Illinois Tool Works, Inc. | ||||||||
3.375%, 9/15/21 | 44,000 | 43,530 | ||||||
Joy Global, Inc. | ||||||||
5.125%, 10/15/21 | 58,000 | 59,780 | ||||||
Kennametal, Inc. | ||||||||
3.875%, 2/15/22 | 54,000 | 51,181 | ||||||
Pall Corp. | ||||||||
5.000%, 6/15/20 | 36,000 | 37,703 | ||||||
Snap-On, Inc. | ||||||||
4.250%, 1/15/18 | 36,000 | 38,392 | ||||||
Stanley Black & Decker, Inc. | ||||||||
2.900%, 11/1/22 | 36,000 | 33,565 | ||||||
Xylem, Inc. | ||||||||
3.550%, 9/20/16 | 91,000 | 95,770 | ||||||
|
| |||||||
| 844,510 | ||||||||
|
| |||||||
Professional Services (0.0%) | ||||||||
Dun & Bradstreet Corp. | ||||||||
2.875%, 11/15/15 | 42,000 | 43,097 | ||||||
Equifax, Inc. | ||||||||
3.300%, 12/15/22 | 36,000 | 32,972 | ||||||
Verisk Analytics, Inc. | ||||||||
5.800%, 5/1/21 | 36,000 | 38,948 | ||||||
|
| |||||||
| 115,017 | ||||||||
|
| |||||||
Road & Rail (0.2%) | ||||||||
Burlington Northern Santa Fe LLC | ||||||||
4.700%, 10/1/19 | 182,000 | 199,866 | ||||||
3.000%, 3/15/23 | 46,000 | 42,635 | ||||||
Canadian National Railway Co. | ||||||||
5.550%, 3/1/19 | 128,000 | 146,275 | ||||||
Canadian Pacific Railway Co. | ||||||||
7.250%, 5/15/19 | 36,000 | 43,588 | ||||||
CSX Corp. | ||||||||
6.250%, 4/1/15 | 55,000 | 58,795 | ||||||
6.250%, 3/15/18 | 109,000 | 125,563 | ||||||
3.700%, 10/30/20 | 36,000 | 36,915 | ||||||
JB Hunt Transport Services, Inc. | ||||||||
3.375%, 9/15/15 | 36,000 | 37,306 | ||||||
Norfolk Southern Corp. | ||||||||
7.700%, 5/15/17 | 98,000 | 116,324 | ||||||
5.900%, 6/15/19 | 73,000 | 84,406 | ||||||
Ryder System, Inc. | ||||||||
3.600%, 3/1/16 | 73,000 | 76,301 | ||||||
2.500%, 3/1/18 | 46,000 | 46,164 | ||||||
Union Pacific Corp. | ||||||||
2.750%, 4/15/23 | $ | 125,000 | $ | 113,772 | ||||
|
| |||||||
| 1,127,910 | ||||||||
|
| |||||||
Trading Companies & Distributors (0.0%) |
| |||||||
Doric Nimrod Air Finance Alpha Ltd. |
| |||||||
Series 2012-1A | ||||||||
5.125%, 11/30/22§ | 204,614 | 206,660 | ||||||
GATX Corp. | ||||||||
4.750%, 5/15/15 | 36,000 | 37,839 | ||||||
3.500%, 7/15/16 | 36,000 | 37,436 | ||||||
|
| |||||||
| 281,935 | ||||||||
|
| |||||||
Total Industrials | 7,143,706 | |||||||
|
| |||||||
Information Technology (1.2%) |
| |||||||
Communications Equipment (0.1%) |
| |||||||
Cisco Systems, Inc. | ||||||||
5.500%, 2/22/16 | 237,000 | 260,401 | ||||||
4.950%, 2/15/19 | 100,000 | 112,090 | ||||||
Harris Corp. | ||||||||
6.375%, 6/15/19 | 31,000 | 35,953 | ||||||
Motorola Solutions, Inc. | ||||||||
6.000%, 11/15/17 | 36,000 | 40,697 | ||||||
|
| |||||||
| 449,141 | ||||||||
|
| |||||||
Computers & Peripherals (0.6%) |
| |||||||
Apple, Inc. | ||||||||
1.000%, 5/3/18 | 182,000 | 175,816 | ||||||
2.400%, 5/3/23 | 273,000 | 244,350 | ||||||
Dell, Inc. | ||||||||
Term Loan | ||||||||
4.500%, 3/24/20 | 3,100,000 | 3,099,138 | ||||||
EMC Corp. | ||||||||
1.875%, 6/1/18 | 91,000 | 90,056 | ||||||
2.650%, 6/1/20 | 73,000 | 71,582 | ||||||
3.375%, 6/1/23 | 36,000 | 34,507 | ||||||
Hewlett-Packard Co. | ||||||||
2.350%, 3/15/15 | 36,000 | 36,629 | ||||||
2.200%, 12/1/15 | 91,000 | 93,029 | ||||||
3.000%, 9/15/16 | 91,000 | 94,429 | ||||||
3.750%, 12/1/20 | 182,000 | 181,878 | ||||||
4.375%, 9/15/21 | 91,000 | 91,769 | ||||||
4.050%, 9/15/22 | 36,000 | 35,441 | ||||||
Lexmark International, Inc. | ||||||||
5.125%, 3/15/20 | 36,000 | 36,841 | ||||||
NetApp, Inc. | ||||||||
2.000%, 12/15/17 | 36,000 | 35,775 | ||||||
Seagate HDD Cayman | ||||||||
3.750%, 11/15/18§ | 150,000 | 151,687 | ||||||
|
| |||||||
| 4,472,927 | ||||||||
|
| |||||||
Electronic Equipment, Instruments & Components (0.0%) |
| |||||||
Arrow Electronics, Inc. | ||||||||
3.375%, 11/1/15 | 36,000 | 37,232 | ||||||
6.000%, 4/1/20 | 36,000 | 38,938 | ||||||
Avnet, Inc. | ||||||||
5.875%, 6/15/20 | 91,000 | 97,479 | ||||||
Corning, Inc. | ||||||||
1.450%, 11/15/17 | 55,000 | 53,999 | ||||||
|
| |||||||
| 227,648 | ||||||||
|
| |||||||
See Notes to Financial Statements.
44
AXA PREMIER VIP TRUST
MULTIMANAGER CORE BOND PORTFOLIO
PORTFOLIO OF INVESTMENTS (Continued)
December 31, 2013
| Principal Amount | Value (Note 1) | |||||||
Internet Software & Services (0.0%) |
| |||||||
eBay, Inc. | ||||||||
1.625%, 10/15/15 | $ | 36,000 | $ | 36,674 | ||||
3.250%, 10/15/20 | 36,000 | 36,231 | ||||||
2.600%, 7/15/22 | 91,000 | 83,590 | ||||||
Google, Inc. | ||||||||
2.125%, 5/19/16 | 36,000 | 37,244 | ||||||
3.625%, 5/19/21 | 36,000 | 37,546 | ||||||
|
| |||||||
| 231,285 | ||||||||
|
| |||||||
IT Services (0.2%) | ||||||||
Computer Sciences Corp. | ||||||||
6.500%, 3/15/18 | 73,000 | 83,873 | ||||||
Fidelity National Information Services, Inc. |
| |||||||
2.000%, 4/15/18 | 21,000 | 20,321 | ||||||
Fiserv, Inc. | ||||||||
3.125%, 10/1/15 | 91,000 | 94,291 | ||||||
4.625%, 10/1/20 | 36,000 | 37,081 | ||||||
International Business Machines Corp. |
| |||||||
0.550%, 2/6/15 | 73,000 | 73,158 | ||||||
0.450%, 5/6/16 | 150,000 | 148,762 | ||||||
5.700%, 9/14/17 | 273,000 | 313,799 | ||||||
7.625%, 10/15/18 | 91,000 | 113,653 | ||||||
1.875%, 8/1/22 | 91,000 | 79,400 | ||||||
3.375%, 8/1/23 | 125,000 | 121,584 | ||||||
Leidos Holdings, Inc. | ||||||||
4.450%, 12/1/20 | 73,000 | 72,762 | ||||||
Western Union Co. | ||||||||
5.253%, 4/1/20 | 146,000 | 154,223 | ||||||
|
| |||||||
| 1,312,907 | ||||||||
|
| |||||||
Office Electronics (0.0%) | ||||||||
Xerox Corp. | ||||||||
6.350%, 5/15/18 | 109,000 | 124,666 | ||||||
|
| |||||||
Semiconductors & Semiconductor Equipment (0.1%) |
| |||||||
Broadcom Corp. | ||||||||
2.500%, 8/15/22 | 36,000 | 32,139 | ||||||
Intel Corp. | ||||||||
1.950%, 10/1/16 | 73,000 | 75,179 | ||||||
1.350%, 12/15/17 | 128,000 | 126,363 | ||||||
3.300%, 10/1/21 | 108,000 | 107,181 | ||||||
2.700%, 12/15/22 | 91,000 | 83,388 | ||||||
Texas Instruments, Inc. | ||||||||
0.450%, 8/3/15 | 55,000 | 55,012 | ||||||
2.375%, 5/16/16 | 91,000 | 94,317 | ||||||
|
| |||||||
| 573,579 | ||||||||
|
| |||||||
Software (0.2%) | ||||||||
Adobe Systems, Inc. | ||||||||
3.250%, 2/1/15 | 36,000 | 36,953 | ||||||
4.750%, 2/1/20 | 46,000 | 49,489 | ||||||
Autodesk, Inc. | ||||||||
3.600%, 12/15/22 | 36,000 | 33,359 | ||||||
CA, Inc. | ||||||||
4.500%, 8/15/23 | 100,000 | 99,799 | ||||||
Microsoft Corp. | ||||||||
4.200%, 6/1/19 | 109,000 | 120,436 | ||||||
2.375%, 5/1/23 | 205,000 | 186,464 | ||||||
Oracle Corp. | ||||||||
5.250%, 1/15/16 | 91,000 | 99,266 | ||||||
1.200%, 10/15/17 | 128,000 | 125,936 | ||||||
5.750%, 4/15/18 | 219,000 | 253,526 | ||||||
2.500%, 10/15/22 | $ | 146,000 | $ | 132,959 | ||||
3.625%, 7/15/23 | 8,000 | 7,915 | ||||||
Symantec Corp. | ||||||||
3.950%, 6/15/22 | 182,000 | 176,208 | ||||||
|
| |||||||
| 1,322,310 | ||||||||
|
| |||||||
Total Information Technology | 8,714,463 | |||||||
|
| |||||||
Materials (0.9%) | ||||||||
Chemicals (0.4%) | ||||||||
Agrium, Inc. | ||||||||
3.150%, 10/1/22 | 36,000 | 33,052 | ||||||
Air Products and Chemicals, Inc. | ||||||||
2.000%, 8/2/16 | 20,000 | 20,469 | ||||||
4.375%, 8/21/19 | 73,000 | 78,215 | ||||||
Airgas, Inc. | ||||||||
3.250%, 10/1/15 | 73,000 | 75,658 | ||||||
Cabot Corp. | ||||||||
5.000%, 10/1/16 | 36,000 | 39,354 | ||||||
Dow Chemical Co. | ||||||||
8.550%, 5/15/19 | 112,000 | 144,313 | ||||||
4.250%, 11/15/20 | 219,000 | 233,338 | ||||||
3.000%, 11/15/22 | 55,000 | 51,331 | ||||||
E.I. du Pont de Nemours & Co. | ||||||||
3.250%, 1/15/15 | 109,000 | 112,234 | ||||||
3.625%, 1/15/21 | 128,000 | 130,414 | ||||||
2.800%, 2/15/23 | 91,000 | 83,493 | ||||||
Eastman Chemical Co. | ||||||||
2.400%, 6/1/17 | 73,000 | 74,043 | ||||||
3.600%, 8/15/22 | 91,000 | 87,431 | ||||||
Ecolab, Inc. | ||||||||
1.000%, 8/9/15 | 34,000 | 34,031 | ||||||
1.450%, 12/8/17 | 55,000 | 53,773 | ||||||
4.350%, 12/8/21 | 91,000 | 94,336 | ||||||
Lubrizol Corp. | ||||||||
8.875%, 2/1/19 | 53,000 | 68,698 | ||||||
LYB International Finance B.V. | ||||||||
4.000%, 7/15/23 | 36,000 | 35,383 | ||||||
5.250%, 7/15/43 | 3,000 | 2,986 | ||||||
LyondellBasell Industries N.V. | ||||||||
5.000%, 4/15/19 | 509,000 | 561,280 | ||||||
Methanex Corp. | ||||||||
3.250%, 12/15/19 | 36,000 | 36,090 | ||||||
Monsanto Co. | ||||||||
5.125%, 4/15/18 | 36,000 | 40,474 | ||||||
2.200%, 7/15/22 | 18,000 | 16,270 | ||||||
Potash Corp. of Saskatchewan, Inc. | ||||||||
4.875%, 3/30/20 | 55,000 | 59,195 | ||||||
PPG Industries, Inc. | ||||||||
1.900%, 1/15/16 | 36,000 | 36,566 | ||||||
6.650%, 3/15/18 | 55,000 | 63,635 | ||||||
3.600%, 11/15/20 | 55,000 | 55,751 | ||||||
Praxair, Inc. | ||||||||
4.625%, 3/30/15 | 92,000 | 96,625 | ||||||
4.500%, 8/15/19 | 73,000 | 80,428 | ||||||
2.200%, 8/15/22 | 36,000 | 32,111 | ||||||
2.700%, 2/21/23 | 36,000 | 33,298 | ||||||
RPM International, Inc. | ||||||||
6.125%, 10/15/19 | 36,000 | 40,181 | ||||||
Valspar Corp. | ||||||||
7.250%, 6/15/19 | 36,000 | 42,195 | ||||||
|
| |||||||
| 2,646,651 | ||||||||
|
| |||||||
See Notes to Financial Statements.
45
AXA PREMIER VIP TRUST
MULTIMANAGER CORE BOND PORTFOLIO
PORTFOLIO OF INVESTMENTS (Continued)
December 31, 2013
| Principal Amount | Value (Note 1) | |||||||
Construction Materials (0.0%) |
| |||||||
CRH America, Inc. | ||||||||
6.000%, 9/30/16 | $ | 91,000 | $ | 101,737 | ||||
5.750%, 1/15/21 | 91,000 | 100,289 | ||||||
|
| |||||||
| 202,026 | ||||||||
|
| |||||||
Containers & Packaging (0.0%) |
| |||||||
Avery Dennison Corp. | ||||||||
5.375%, 4/15/20 | 36,000 | 37,394 | ||||||
Bemis Co., Inc. | ||||||||
6.800%, 8/1/19 | 36,000 | 42,131 | ||||||
Packaging Corp. of America | ||||||||
3.900%, 6/15/22 | 36,000 | 35,010 | ||||||
Rock-Tenn Co. | ||||||||
3.500%, 3/1/20 | 51,000 | 50,235 | ||||||
4.000%, 3/1/23 | 47,000 | 45,003 | ||||||
|
| |||||||
| 209,773 | ||||||||
|
| |||||||
Metals & Mining (0.4%) |
| |||||||
Alcoa, Inc. | ||||||||
6.150%, 8/15/20 | 182,000 | 197,242 | ||||||
Allegheny Technologies, Inc. | ||||||||
9.375%, 6/1/19 | 73,000 | 88,705 | ||||||
Barrick Gold Corp. | ||||||||
6.950%, 4/1/19 | 55,000 | 63,150 | ||||||
4.100%, 5/1/23 | 73,000 | 65,519 | ||||||
Barrick North America Finance LLC | ||||||||
4.400%, 5/30/21 | 91,000 | 87,294 | ||||||
BHP Billiton Finance USA Ltd. | ||||||||
6.500%, 4/1/19 | 182,000 | 217,658 | ||||||
2.875%, 2/24/22 | 109,000 | 103,706 | ||||||
3.850%, 9/30/23 | 156,000 | 156,144 | ||||||
5.000%, 9/30/43 | 61,000 | 61,639 | ||||||
Celulosa Arauco y Constitucion S.A. | ||||||||
5.000%, 1/21/21 | 91,000 | 92,251 | ||||||
Cliffs Natural Resources, Inc. | ||||||||
3.950%, 1/15/18 | 55,000 | 55,273 | ||||||
4.800%, 10/1/20 | 38,000 | 37,557 | ||||||
Freeport-McMoRan Copper & Gold, Inc. |
| |||||||
2.375%, 3/15/18 | 55,000 | 54,818 | ||||||
3.100%, 3/15/20 | 36,000 | 35,118 | ||||||
3.550%, 3/1/22 | 128,000 | 121,100 | ||||||
3.875%, 3/15/23 | 100,000 | 94,341 | ||||||
Glencore Canada Corp. | ||||||||
5.500%, 6/15/17 | 82,000 | 89,151 | ||||||
Goldcorp, Inc. | ||||||||
2.125%, 3/15/18 | 36,000 | 35,229 | ||||||
Newmont Mining Corp. | ||||||||
5.125%, 10/1/19 | 36,000 | 37,162 | ||||||
3.500%, 3/15/22 | 182,000 | 154,308 | ||||||
Nucor Corp. | ||||||||
5.850%, 6/1/18 | 55,000 | 62,377 | ||||||
Reliance Steel & Aluminum Co. | ||||||||
4.500%, 4/15/23 | 36,000 | 35,110 | ||||||
Rio Tinto Alcan, Inc. | ||||||||
5.000%, 6/1/15 | 73,000 | 77,129 | ||||||
Rio Tinto Finance USA Ltd. | ||||||||
9.000%, 5/1/19 | 182,000 | 237,026 | ||||||
4.125%, 5/20/21 | 91,000 | 93,918 | ||||||
Rio Tinto Finance USA plc | ||||||||
2.250%, 12/14/18 | 91,000 | 90,235 | ||||||
2.875%, 8/21/22 | 91,000 | 84,191 | ||||||
Southern Copper Corp. | ||||||||
3.500%, 11/8/22 | $ | 24,000 | $ | 21,999 | ||||
Teck Resources Ltd. | ||||||||
4.500%, 1/15/21 | 36,000 | 35,987 | ||||||
Vale Overseas Ltd. | ||||||||
6.250%, 1/11/16 | 91,000 | 99,442 | ||||||
4.625%, 9/15/20 | 128,000 | 131,214 | ||||||
|
| |||||||
| 2,815,993 | ||||||||
|
| |||||||
Paper & Forest Products (0.1%) |
| |||||||
International Paper Co. | ||||||||
5.300%, 4/1/15 | 36,000 | 37,927 | ||||||
9.375%, 5/15/19 | 146,000 | 190,183 | ||||||
4.750%, 2/15/22 | 465,000 | 485,822 | ||||||
|
| |||||||
| 713,932 | ||||||||
|
| |||||||
Total Materials | 6,588,375 | |||||||
|
| |||||||
Telecommunication Services (1.5%) |
| |||||||
Diversified Telecommunication Services (1.1%) |
| |||||||
AT&T, Inc. | ||||||||
2.500%, 8/15/15 | 182,000 | 186,984 | ||||||
0.800%, 12/1/15 | 73,000 | 72,856 | ||||||
2.400%, 8/15/16 | 91,000 | 93,666 | ||||||
1.700%, 6/1/17 | 109,000 | 109,619 | ||||||
1.400%, 12/1/17 | 109,000 | 106,495 | ||||||
5.500%, 2/1/18 | 182,000 | 206,069 | ||||||
2.375%, 11/27/18 | 101,000 | 100,494 | ||||||
4.450%, 5/15/21 | 219,000 | 230,795 | ||||||
2.625%, 12/1/22 | 55,000 | 49,678 | ||||||
British Telecommunications plc | ||||||||
5.950%, 1/15/18 | 91,000 | 103,794 | ||||||
CC Holdings GS V LLC/Crown Castle GS III Corp. |
| |||||||
3.849%, 4/15/23 | 117,000 | 109,537 | ||||||
Cellco Partnership/Verizon Wireless Capital LLC | ||||||||
8.500%, 11/15/18 | 109,000 | 138,304 | ||||||
Deutsche Telekom International Finance B.V. |
| |||||||
6.750%, 8/20/18 | 73,000 | 86,028 | ||||||
Orange S.A. | ||||||||
5.375%, 7/8/19 | 73,000 | 81,377 | ||||||
4.125%, 9/14/21 | 36,000 | 36,141 | ||||||
Qwest Corp. | ||||||||
6.500%, 6/1/17 | 91,000 | 102,830 | ||||||
Telefonica Emisiones S.A.U. | ||||||||
3.992%, 2/16/16 | 73,000 | 76,591 | ||||||
6.221%, 7/3/17 | 73,000 | 82,436 | ||||||
5.134%, 4/27/20 | 66,000 | 70,068 | ||||||
5.462%, 2/16/21 | 91,000 | 96,510 | ||||||
Verizon Communications, Inc. | ||||||||
5.550%, 2/15/16 | 219,000 | 239,202 | ||||||
1.773%, 9/15/16 (l) | 400,000 | 411,364 | ||||||
2.500%, 9/15/16 | 387,000 | 400,199 | ||||||
5.500%, 2/15/18 | 273,000 | 309,436 | ||||||
1.993%, 9/14/18 (l) | 100,000 | 105,356 | ||||||
3.650%, 9/14/18 | 970,000 | 1,022,267 | ||||||
4.500%, 9/15/20 | 714,000 | 762,645 | ||||||
4.600%, 4/1/21 | 182,000 | 194,492 | ||||||
2.450%, 11/1/22 | 73,000 | 65,111 | ||||||
5.150%, 9/15/23 | 541,000 | 579,695 | ||||||
3.850%, 11/1/42 | 504,000 | 404,183 | ||||||
See Notes to Financial Statements.
46
AXA PREMIER VIP TRUST
MULTIMANAGER CORE BOND PORTFOLIO
PORTFOLIO OF INVESTMENTS (Continued)
December 31, 2013
| Principal Amount | Value (Note 1) | |||||||
6.550%, 9/15/43 | $ | 587,000 | $ | 688,040 | ||||
|
| |||||||
| 7,322,262 | ||||||||
|
| |||||||
Wireless Telecommunication Services (0.4%) |
| |||||||
America Movil S.A.B. de C.V. | ||||||||
2.375%, 9/8/16 | 436,000 | 447,595 | ||||||
5.625%, 11/15/17 | 36,000 | 40,604 | ||||||
5.000%, 3/30/20 | 1,632,000 | 1,777,144 | ||||||
Rogers Communications, Inc. | ||||||||
6.800%, 8/15/18 | 91,000 | 108,872 | ||||||
4.100%, 10/1/23 | 100,000 | 100,250 | ||||||
Vodafone Group plc | ||||||||
5.000%, 9/15/15 | 109,000 | 116,336 | ||||||
0.900%, 2/19/16 | 100,000 | 99,547 | ||||||
5.450%, 6/10/19 | 109,000 | 123,450 | ||||||
2.500%, 9/26/22 | 91,000 | 80,597 | ||||||
2.950%, 2/19/23 | 91,000 | 82,734 | ||||||
|
| |||||||
| 2,977,129 | ||||||||
|
| |||||||
Total Telecommunication Services | 10,299,391 | |||||||
|
| |||||||
Utilities (1.3%) | ||||||||
Electric Utilities (0.8%) | ||||||||
American Electric Power Co., Inc. | ||||||||
1.650%, 12/15/17 | 36,000 | 35,598 | ||||||
Cleveland Electric Illuminating Co. | ||||||||
8.875%, 11/15/18 | 68,000 | 85,562 | ||||||
5.950%, 12/15/36 | 33,000 | 33,790 | ||||||
Commonwealth Edison Co. | ||||||||
6.150%, 9/15/17 | 182,000 | 210,434 | ||||||
Detroit Edison Co. | ||||||||
5.600%, 6/15/18 | 36,000 | 41,765 | ||||||
2.650%, 6/15/22 | 91,000 | 84,828 | ||||||
Dominion Gas Holdings LLC | ||||||||
4.800%, 11/1/43§ | 13,000 | 12,693 | ||||||
Duke Energy Carolinas LLC | ||||||||
4.300%, 6/15/20 | 219,000 | 233,605 | ||||||
4.250%, 12/15/41 | 163,000 | 148,519 | ||||||
Duke Energy Corp. | ||||||||
2.150%, 11/15/16 | 146,000 | 149,841 | ||||||
5.050%, 9/15/19 | 36,000 | 39,724 | ||||||
Duke Energy Florida, Inc. | ||||||||
4.550%, 4/1/20 | 18,000 | 19,475 | ||||||
3.100%, 8/15/21 | 36,000 | 35,334 | ||||||
5.900%, 3/1/33 | 30,000 | 33,181 | ||||||
Duke Energy Progress, Inc. | ||||||||
5.300%, 1/15/19 | 91,000 | 103,293 | ||||||
Entergy Arkansas, Inc. | ||||||||
3.750%, 2/15/21 | 979,000 | 981,316 | ||||||
Entergy Texas, Inc. | ||||||||
7.125%, 2/1/19 | 91,000 | 107,541 | ||||||
Florida Power & Light Co. | ||||||||
5.550%, 11/1/17 | 36,000 | 41,174 | ||||||
Georgia Power Co. | ||||||||
3.000%, 4/15/16 | 134,000 | 140,568 | ||||||
5.400%, 6/1/18 | 109,000 | 122,605 | ||||||
Hydro-Quebec | ||||||||
7.500%, 4/1/16 | 109,000 | 125,178 | ||||||
2.000%, 6/30/16 | 73,000 | 74,780 | ||||||
Indiana Michigan Power Co. | ||||||||
7.000%, 3/15/19 | 91,000 | 107,958 | ||||||
IPALCO Enterprises, Inc. | ||||||||
5.000%, 5/1/18 | $ | 417,000 | $ | 436,286 | ||||
Jersey Central Power & Light Co. | ||||||||
7.350%, 2/1/19 | 48,000 | 56,799 | ||||||
Kansas City Power & Light Co. | ||||||||
5.850%, 6/15/17 | 73,000 | 78,921 | ||||||
LG&E and KU Energy LLC | ||||||||
2.125%, 11/15/15 | 91,000 | 92,471 | ||||||
3.750%, 11/15/20 | 109,000 | 110,746 | ||||||
Nevada Power Co. | ||||||||
7.125%, 3/15/19 | 109,000 | 131,957 | ||||||
NextEra Energy Capital Holdings, Inc. |
| |||||||
7.875%, 12/15/15 | 109,000 | 123,098 | ||||||
Northeast Utilities | ||||||||
4.500%, 11/15/19 | 36,000 | 39,214 | ||||||
Northern States Power Co. | ||||||||
1.950%, 8/15/15 | 36,000 | 36,781 | ||||||
5.250%, 3/1/18 | 55,000 | 61,874 | ||||||
NSTAR Electric Co. | ||||||||
2.375%, 10/15/22 | 91,000 | 82,836 | ||||||
Ohio Power Co. | ||||||||
6.050%, 5/1/18 | 36,000 | 41,566 | ||||||
Oncor Electric Delivery Co. LLC | ||||||||
6.800%, 9/1/18 | 73,000 | 85,413 | ||||||
Pacific Gas & Electric Co. | ||||||||
3.500%, 10/1/20 | 91,000 | 91,973 | ||||||
4.250%, 5/15/21 | 36,000 | 37,834 | ||||||
PacifiCorp | ||||||||
5.500%, 1/15/19 | 91,000 | 105,192 | ||||||
Peco Energy Co. | ||||||||
2.375%, 9/15/22 | 91,000 | 82,719 | ||||||
Portland General Electric Co. | ||||||||
6.100%, 4/15/19 | 36,000 | 42,065 | ||||||
Progress Energy, Inc. | ||||||||
5.625%, 1/15/16 | 73,000 | 79,685 | ||||||
Public Service Co. of Colorado | ||||||||
3.200%, 11/15/20 | 91,000 | 91,633 | ||||||
Public Service Co. of Oklahoma | ||||||||
4.400%, 2/1/21 | 146,000 | 154,358 | ||||||
Southern California Edison Co. | ||||||||
3.500%, 10/1/23 | 100,000 | 97,827 | ||||||
Southern Co. | ||||||||
1.950%, 9/1/16 | 40,000 | 40,762 | ||||||
Tampa Electric Co. | ||||||||
6.100%, 5/15/18 | 27,000 | 31,375 | ||||||
Virginia Electric & Power Co. | ||||||||
5.400%, 1/15/16 | 109,000 | 118,859 | ||||||
Wisconsin Electric Power Co. | ||||||||
2.950%, 9/15/21 | 91,000 | 89,236 | ||||||
|
| |||||||
| 5,410,242 | ||||||||
|
| |||||||
Gas Utilities (0.1%) | ||||||||
Boardwalk Pipelines LP | ||||||||
5.750%, 9/15/19 | 73,000 | 81,347 | ||||||
CenterPoint Energy Resources Corp. | ||||||||
4.500%, 1/15/21 | 109,000 | 116,330 | ||||||
DCP Midstream Operating LP | ||||||||
3.875%, 3/15/23 | 36,000 | 32,947 | ||||||
Panhandle Eastern Pipe Line Co. LP | ||||||||
6.200%, 11/1/17 | 73,000 | 82,993 | ||||||
Questar Corp. | ||||||||
2.750%, 2/1/16 | 31,000 | 31,933 | ||||||
|
| |||||||
| 345,550 | ||||||||
|
| |||||||
See Notes to Financial Statements.
47
AXA PREMIER VIP TRUST
MULTIMANAGER CORE BOND PORTFOLIO
PORTFOLIO OF INVESTMENTS (Continued)
December 31, 2013
| Principal Amount | Value (Note 1) | |||||||
Independent Power Producers & Energy Traders (0.2%) |
| |||||||
Constellation Energy Group, Inc. | ||||||||
5.150%, 12/1/20 | $ | 91,000 | $ | 96,759 | ||||
NRG Energy, Inc. | ||||||||
7.625%, 1/15/18 | 544,000 | 615,400 | ||||||
PSEG Power LLC | ||||||||
5.125%, 4/15/20 | 73,000 | 79,379 | ||||||
Tennessee Valley Authority | ||||||||
5.500%, 7/18/17 | 246,000 | 281,591 | ||||||
3.875%, 2/15/21 | 182,000 | 192,241 | ||||||
TransAlta Corp. | ||||||||
4.750%, 1/15/15 | 73,000 | 75,777 | ||||||
4.500%, 11/15/22 | 55,000 | 51,935 | ||||||
|
| |||||||
| 1,393,082 | ||||||||
|
| |||||||
Multi-Utilities (0.2%) | ||||||||
AGL Capital Corp. | ||||||||
3.500%, 9/15/21 | 91,000 | 90,303 | ||||||
Consolidated Edison Co. of | ||||||||
5.850%, 4/1/18 | 36,000 | 41,568 | ||||||
7.125%, 12/1/18 | 36,000 | 43,855 | ||||||
Consumers Energy Co. | ||||||||
6.700%, 9/15/19 | 91,000 | 109,658 | ||||||
3.375%, 8/15/23 | 175,000 | 169,846 | ||||||
Dominion Resources, Inc. | ||||||||
5.150%, 7/15/15 | 103,000 | 109,627 | ||||||
1.950%, 8/15/16 | 226,000 | 229,379 | ||||||
Series 07-A | ||||||||
6.000%, 11/30/17 | 146,000 | 168,092 | ||||||
Series B | ||||||||
2.750%, 9/15/22 | 91,000 | 83,183 | ||||||
MidAmerican Energy Holdings Co. | ||||||||
5.750%, 4/1/18 | 36,000 | 41,265 | ||||||
3.750%, 11/15/23§ | 100,000 | 97,170 | ||||||
6.500%, 9/15/37 | 145,000 | 172,468 | ||||||
National Grid plc | ||||||||
6.300%, 8/1/16 | 36,000 | 40,476 | ||||||
NiSource Finance Corp. | ||||||||
6.400%, 3/15/18 | 73,000 | 83,656 | ||||||
Sempra Energy | ||||||||
9.800%, 2/15/19 | 128,000 | 168,113 | ||||||
2.875%, 10/1/22 | 64,000 | 59,042 | ||||||
TECO Finance, Inc. | ||||||||
5.150%, 3/15/20 | 36,000 | 39,374 | ||||||
|
| |||||||
| 1,747,075 | ||||||||
|
| |||||||
Total Utilities | 8,895,949 | |||||||
|
| |||||||
Total Corporate Bonds | 178,629,048 | |||||||
|
| |||||||
Government Securities (75.6%) |
| |||||||
Agency ABS (0.5%) | ||||||||
Small Business Administration | ||||||||
4.504% 2/1/14 | 12,193 | 12,225 | ||||||
Series 2008-P10B 1 | ||||||||
5.944% 8/10/18 | 472,207 | 515,799 | ||||||
Small Business Administration Participation Certificates |
| |||||||
4.340% 3/1/24 | 655,491 | 690,423 | ||||||
4.625% 2/1/25 | 61,487 | 65,251 | ||||||
5.870% 7/1/28 | 653,439 | 733,476 | ||||||
Series 2004-20A 1 | ||||||||
4.930% 1/1/24 | $ | 79,204 | $ | 85,140 | ||||
Series 2008-20A 1 | ||||||||
5.170% 1/1/28 | 176,861 | 191,711 | ||||||
Series 2008-20C 1 | ||||||||
5.490% 3/1/28 | 710,742 | 785,650 | ||||||
|
| |||||||
| 3,079,675 | ||||||||
|
| |||||||
Agency CMO (18.1%) |
| |||||||
Federal Home Loan Mortgage Corp. |
| |||||||
6.000% 1/1/14 | 12 | 12 | ||||||
5.500% 2/1/14 | 105 | 105 | ||||||
6.000% 7/1/14 | 143 | 145 | ||||||
6.000% 2/1/17 | 15,447 | 16,261 | ||||||
6.000% 3/1/17 | 813 | 857 | ||||||
6.500% 3/1/17 | 5,268 | 5,548 | ||||||
6.000% 4/1/17 | 10,553 | 11,151 | ||||||
6.000% 5/1/17 | 264 | 280 | ||||||
4.879% 5/19/17 | 1,268,933 | 1,385,047 | ||||||
6.000% 7/1/17 | 2,969 | 3,155 | ||||||
6.000% 8/1/17 | 5,477 | 5,809 | ||||||
5.500% 11/1/17 | 5,529 | 5,833 | ||||||
1.556% 12/25/18 IO (l) | 658,600 | 43,332 | ||||||
1.783% 5/25/19 IO (l) | 529,585 | 42,445 | ||||||
1.394% 11/25/19 IO (l) | 4,411,027 | 283,712 | ||||||
1.512% 6/25/22 IO (l) | 1,352,398 | 131,688 | ||||||
0.903% 10/25/22 IO (l) | 1,375,835 | 84,172 | ||||||
0.842% 1/25/23 IO (l) | 2,419,769 | 139,252 | ||||||
2.630% 1/25/23 | 345,000 | 324,385 | ||||||
3.300% 4/25/23 (l) | 225,000 | 221,976 | ||||||
3.060% 7/25/23 (l) | 170,000 | 164,050 | ||||||
3.458% 8/25/23 (l) | 100,000 | 99,407 | ||||||
2.375% 11/1/31 (l) | 3,551 | 3,747 | ||||||
2.602% 4/1/36 (l) | 91,471 | 97,216 | ||||||
5.500% 6/1/41 | 192,643 | 210,335 | ||||||
3.500% 4/1/42 | 99,605 | 99,029 | ||||||
3.500% 8/1/42 | 53,310 | 53,019 | ||||||
3.500% 11/1/42 | 91,805 | 91,188 | ||||||
3.000% 3/1/43 | 104,443 | 99,066 | ||||||
3.000% 4/1/43 | 704,292 | 668,032 | ||||||
3.500% 4/1/43 | 287,757 | 285,959 | ||||||
3.000% 8/1/43 | 300,000 | 284,555 | ||||||
4.500% 9/1/43 | 288,870 | 306,089 | ||||||
4.500% 11/1/43 | 199,764 | 211,672 | ||||||
2.500% 1/15/29 TBA | 500,000 | 495,390 | ||||||
3.000% 1/15/29 TBA | 300,000 | 305,391 | ||||||
3.500% 1/15/44 TBA | 1,000,000 | 991,875 | ||||||
4.000% 2/15/44 TBA (z) | 1,300,000 | 1,331,688 | ||||||
Federal National Mortgage Association |
| |||||||
7.000% 4/1/15 | 878 | 898 | ||||||
7.000% 4/1/16 | 2,229 | 2,321 | ||||||
5.500% 2/1/17 | 5,635 | 5,894 | ||||||
5.500% 6/1/17 | 1,777 | 1,867 | ||||||
3.949% 2/25/18 IO (l) | 1,809,554 | 239,607 | ||||||
4.000% 4/1/23 | 2,154 | 2,283 | ||||||
5.000% 2/1/24 (l) | 298 | 324 | ||||||
5.165% 6/1/24 (l) | 34 | 35 | ||||||
4.500% 12/1/24 | 36,810 | 39,596 | ||||||
4.000% 9/1/25 | 79,989 | 84,760 | ||||||
4.000% 1/1/26 | 141,314 | 149,744 | ||||||
4.000% 4/1/26 | 38,132 | 40,532 | ||||||
See Notes to Financial Statements.
48
AXA PREMIER VIP TRUST
MULTIMANAGER CORE BOND PORTFOLIO
PORTFOLIO OF INVESTMENTS (Continued)
December 31, 2013
| Principal Amount | Value (Note 1) | |||||||
4.000% 7/1/26 | $ | 186,223 | $ | 197,331 | ||||
4.000% 8/1/26 | 88,982 | 94,290 | ||||||
2.500% 9/1/27 | 1,522,909 | 1,508,751 | ||||||
2.363% 1/1/28 (l) | 29,849 | 31,125 | ||||||
4.500% 4/1/28 | 6,452 | 6,902 | ||||||
3.500% 7/1/28 | 86,286 | 90,439 | ||||||
4.500% 4/1/29 | 205,476 | 219,932 | ||||||
4.500% 6/1/29 | 3,793 | 4,060 | ||||||
4.500% 8/1/29 | 69,101 | 73,963 | ||||||
4.500% 9/1/29 | 319,288 | 341,751 | ||||||
4.500% 10/1/29 | 15,094 | 16,156 | ||||||
4.500% 3/1/30 | 159,857 | 171,403 | ||||||
4.500% 6/1/30 | 60,257 | 64,609 | ||||||
4.500% 7/1/31 | 68,209 | 73,220 | ||||||
2.206% 3/1/33 (l) | 34,932 | 36,138 | ||||||
5.000% 4/1/33 | 4,336 | 4,708 | ||||||
5.000% 7/1/33 | 6,525 | 7,085 | ||||||
5.310% 8/25/33 | 125,967 | 128,940 | ||||||
5.000% 9/1/33 | 32,938 | 35,765 | ||||||
5.000% 11/1/33 | 28,766 | 31,235 | ||||||
5.000% 12/1/33 | 14,025 | 15,228 | ||||||
5.000% 2/1/34 | 4,041 | 4,388 | ||||||
6.000% 2/1/34 | 88,716 | 97,841 | ||||||
5.000% 3/1/34 | 3,884 | 4,218 | ||||||
5.000% 7/1/34 | 372,605 | 404,698 | ||||||
6.500% 7/25/34 | 16,645 | 17,303 | ||||||
6.000% 8/1/34 | 50,963 | 56,224 | ||||||
5.000% 10/1/34 | 93,714 | 101,756 | ||||||
5.500% 2/1/35 | 212,970 | 234,491 | ||||||
6.000% 4/1/35 | 794,819 | 876,357 | ||||||
5.000% 7/1/35 | 168,778 | 183,316 | ||||||
4.500% 8/1/35 | 87,267 | 92,697 | ||||||
5.000% 10/1/35 | 497,057 | 539,718 | ||||||
5.500% 12/1/35 | 154,460 | 169,973 | ||||||
2.309% 1/1/36 (l) | 641,772 | 682,083 | ||||||
5.000% 7/1/36 | 70,312 | 76,347 | ||||||
5.000% 8/1/36 | 50,455 | 54,800 | ||||||
4.500% 7/1/37 | 17,616 | 18,712 | ||||||
5.000% 7/1/37 | 31,475 | 34,177 | ||||||
4.500% 8/1/37 | 21,079 | 22,377 | ||||||
6.000% 2/1/38 | 44,751 | 49,632 | ||||||
6.000% 3/1/38 | 18,233 | 20,269 | ||||||
4.500% 4/1/38 | 186,956 | 198,298 | ||||||
6.000% 5/1/38 | 53,589 | 59,621 | ||||||
5.000% 6/1/38 | 69,973 | 75,978 | ||||||
6.000% 10/1/38 | 16,855 | 18,676 | ||||||
6.000% 12/1/38 | 23,995 | 26,574 | ||||||
4.500% 2/1/39 | 865,547 | 918,055 | ||||||
4.500% 3/1/39 | 804,683 | 853,498 | ||||||
4.500% 4/1/39 | 487,378 | 516,944 | ||||||
4.500% 5/1/39 | 9,663 | 10,249 | ||||||
4.500% 6/1/39 | 71,087 | 75,400 | ||||||
5.000% 6/1/39 | 1,210,380 | 1,314,255 | ||||||
4.500% 7/1/39 | 939,096 | 997,565 | ||||||
4.500% 1/1/40 | 54,969 | 58,303 | ||||||
6.500% 5/1/40 | 787,196 | 869,131 | ||||||
5.000% 7/1/40 | 164,287 | 178,386 | ||||||
4.500% 8/1/40 | 198,689 | 210,742 | ||||||
4.000% 9/1/40 | 220,302 | 227,221 | ||||||
4.500% 9/1/40 | 198,618 | 210,667 | ||||||
4.000% 10/1/40 | 107,575 | 111,004 | ||||||
4.000% 11/1/40 | $ | 545,404 | $ | 562,533 | ||||
4.500% 11/1/40 | 37,002 | 39,247 | ||||||
5.000% 11/1/40 | 381,022 | 413,721 | ||||||
2.374% 12/1/40 (l) | 14,156 | 14,853 | ||||||
4.000% 12/1/40 | 4,388,723 | 4,526,556 | ||||||
4.000% 1/1/41 | 215,211 | 221,970 | ||||||
4.500% 2/1/41 | 133,630 | 141,737 | ||||||
4.500% 3/1/41 | 88,404 | 93,767 | ||||||
4.000% 4/1/41 | 432,928 | 446,524 | ||||||
4.500% 4/1/41 | 418,560 | 443,952 | ||||||
5.500% 4/1/41 | 29,004 | 31,844 | ||||||
4.500% 5/1/41 | 1,032,216 | 1,094,853 | ||||||
3.355% 6/1/41 (l) | 116,548 | 122,916 | ||||||
4.500% 6/1/41 | 779,758 | 827,062 | ||||||
4.500% 7/1/41 | 1,307,664 | 1,386,998 | ||||||
5.000% 7/1/41 | 29,315 | 31,841 | ||||||
4.500% 8/1/41 | 4,041,621 | 4,286,802 | ||||||
5.000% 8/1/41 | 21,182 | 23,007 | ||||||
3.496% 9/1/41 (l) | 85,404 | 90,209 | ||||||
4.500% 9/1/41 | 892,926 | 947,095 | ||||||
4.500% 10/1/41 | 244,514 | 259,347 | ||||||
4.500% 1/1/42 | 240,257 | 254,907 | ||||||
4.500% 2/1/42 | 602,618 | 639,363 | ||||||
4.500% 6/1/42 | 372,609 | 395,213 | ||||||
4.500% 8/1/42 | 61,811 | 65,581 | ||||||
4.500% 9/1/42 | 299,276 | 317,431 | ||||||
4.500% 11/1/42 | 119,955 | 127,232 | ||||||
3.000% 2/1/43 | 314,959 | 299,851 | ||||||
4.000% 2/1/43 | 83,843 | 86,620 | ||||||
3.000% 3/1/43 | 820,605 | 780,928 | ||||||
3.000% 4/1/43 | 581,125 | 553,058 | ||||||
3.000% 5/1/43 | 802,661 | 764,130 | ||||||
3.000% 6/1/43 | 140,118 | 133,457 | ||||||
3.500% 6/1/43 | 99,828 | 99,422 | ||||||
3.500% 7/1/43 | 115,611 | 115,141 | ||||||
3.500% 8/1/43 | 987,612 | 983,476 | ||||||
4.000% 8/1/43 | 186,374 | 192,460 | ||||||
4.000% 9/1/43 | 31,967 | 33,011 | ||||||
4.500% 9/1/43 | 999,101 | 1,060,023 | ||||||
4.000% 10/1/43 | 298,849 | 308,771 | ||||||
4.500% 10/1/43 | 96,921 | 102,832 | ||||||
4.000% 11/1/43 | 251,000 | 259,432 | ||||||
4.000% 12/1/43 | 529,873 | 546,920 | ||||||
4.500% 12/1/43 | 100,000 | 106,098 | ||||||
4.000% 1/1/44 | 600,000 | 619,437 | ||||||
3.000% 1/25/29 TBA | 700,000 | 714,109 | ||||||
3.500% 1/25/29 TBA | 700,000 | 732,102 | ||||||
4.500% 1/25/29 TBA | 1,600,000 | 1,701,000 | ||||||
3.500% 1/25/44 TBA | 32,000,000 | 31,815,002 | ||||||
4.000% 1/25/44 TBA | 800,000 | 824,375 | ||||||
3.500% 2/25/44 TBA (z) | 34,000,000 | 33,698,515 | ||||||
FREMF Mortgage Trust | ||||||||
4.023% 11/25/44(l)§ | 20,400 | 19,512 | ||||||
3.562% 8/25/45(l)§ | 121,000 | 116,289 | ||||||
3.656% 10/25/45(l)§ | 94,000 | 86,937 | ||||||
Government National Mortgage Association |
| |||||||
1.625% 7/20/27 (l) | 1,723 | 1,771 | ||||||
6.500% 6/20/32 | 23,464 | 26,374 | ||||||
5.500% 4/15/33 | 3,366 | 3,717 | ||||||
5.000% 12/15/38 | 27,793 | 30,287 | ||||||
5.000% 7/15/39 | 83,516 | 91,100 | ||||||
5.000% 10/20/39 | 31,510 | 34,362 | ||||||
See Notes to Financial Statements.
49
AXA PREMIER VIP TRUST
MULTIMANAGER CORE BOND PORTFOLIO
PORTFOLIO OF INVESTMENTS (Continued)
December 31, 2013
| Principal Amount | Value (Note 1) | |||||||
5.000% 12/15/40 | $ | 108,954 | $ | 118,849 | ||||
4.500% 5/20/41 | 938,297 | 1,004,307 | ||||||
4.500% 6/20/41 | 94,028 | 100,570 | ||||||
4.500% 7/20/41 | 62,972 | 67,353 | ||||||
4.500% 2/15/42 | 913,828 | 976,404 | ||||||
4.000% 9/15/42 | 442,372 | 460,913 | ||||||
3.000% 5/15/43 | 350,270 | 338,763 | ||||||
4.000% 11/20/43 | 1,996,068 | 2,080,355 | ||||||
1.015% 2/16/53 IO (l) | 738,285 | 58,395 | ||||||
3.500% 1/15/44 TBA (z) | 1,700,000 | 1,715,805 | ||||||
5.500% 1/15/44 TBA | 400,000 | 440,094 | ||||||
3.000% 1/15/44 TBA | 1,000,000 | 965,938 | ||||||
4.500% 1/15/44 TBA | 500,000 | 533,359 | ||||||
5.000% 1/15/44 TBA | 800,000 | 868,375 | ||||||
|
| |||||||
| 127,372,269 | ||||||||
|
| |||||||
Foreign Governments (6.5%) |
| |||||||
African Development Bank | ||||||||
0.750% 10/18/16 | 100,000 | 99,652 | ||||||
Australia Government Bond | ||||||||
5.500% 1/21/18 | AUD | 23,500,000 | 22,791,268 | |||||
Canadian Government Bond | ||||||||
0.875% 2/14/17 | $ | 130,000 | 129,650 | |||||
Development Bank of Japan | ||||||||
5.125% 2/1/17 | 100,000 | 111,935 | ||||||
Eksportfinans ASA | ||||||||
1.600% 3/20/14 | JPY | 1,000,000 | 9,446 | |||||
3.000% 11/17/14 | $ | 145,000 | 145,544 | |||||
2.000% 9/15/15 | 435,000 | 428,475 | ||||||
2.375% 5/25/16 | 290,000 | 285,650 | ||||||
5.500% 5/25/16 | 109,000 | 114,927 | ||||||
2.875% 11/16/16 | CHF | 35,000 | 39,069 | |||||
5.500% 6/26/17 | $ | 254,000 | 267,811 | |||||
Export Development Canada | ||||||||
2.250% 5/28/15 | 91,000 | 93,324 | ||||||
1.250% 10/26/16 | 91,000 | 92,090 | ||||||
Export-Import Bank of China | ||||||||
5.250% 7/29/14§ | 1,341,000 | 1,373,052 | ||||||
Export-Import Bank of Korea | ||||||||
5.875% 1/14/15 | 91,000 | 95,560 | ||||||
4.125% 9/9/15 | 73,000 | 76,545 | ||||||
4.000% 1/29/21 | 545,000 | 556,957 | ||||||
Federative Republic of Brazil | ||||||||
6.000% 1/17/17 | 182,000 | 202,748 | ||||||
8.000% 1/15/18 | 303,000 | 336,330 | ||||||
4.875% 1/22/21 | 123,000 | 129,765 | ||||||
FMS Wertmanagement AoeR | ||||||||
1.125% 10/14/16 | 200,000 | 201,101 | ||||||
Inter-American Development Bank |
| |||||||
2.125% 11/9/20 | 100,000 | 96,858 | ||||||
International Bank for Reconstruction & Development |
| |||||||
2.125% 11/1/20 | 150,000 | 145,706 | ||||||
International Finance Corp. | ||||||||
0.625% 11/15/16 | 250,000 | 248,116 | ||||||
Italy Buoni Poliennali Del Tesoro |
| |||||||
2.550% 10/22/16 (b) | EUR | 179,298 | 252,622 | |||||
4.000% 2/1/37 (m) | 145,000 | 183,806 | ||||||
Japan Bank for International Cooperation |
| |||||||
1.750% 11/13/18 | $ | 200,000 | 196,098 | |||||
Japan Finance Corp. | ||||||||
2.500% 1/21/16 | $ | 250,000 | $ | 258,895 | ||||
2.250% 7/13/16 | 182,000 | 187,987 | ||||||
Japan Finance Organization for Municipalities |
| |||||||
5.000% 5/16/17 | 200,000 | 223,070 | ||||||
Korea Development Bank | ||||||||
3.250% 3/9/16 | 109,000 | 113,095 | ||||||
Korea Finance Corp. | ||||||||
2.875% 8/22/18 | 200,000 | 200,917 | ||||||
4.625% 11/16/21 | 50,000 | 52,617 | ||||||
Province of British Columbia | ||||||||
2.850% 6/15/15 | 109,000 | 112,566 | ||||||
2.100% 5/18/16 | 109,000 | 112,488 | ||||||
2.000% 10/23/22 | 36,000 | 31,960 | ||||||
Province of Manitoba | ||||||||
4.900% 12/6/16 | 182,000 | 202,759 | ||||||
Province of New Brunswick | ||||||||
2.750% 6/15/18 | 91,000 | 93,731 | ||||||
Province of Nova Scotia | ||||||||
5.125% 1/26/17 | 91,000 | 101,783 | ||||||
Province of Ontario | ||||||||
1.875% 9/15/15 | 638,000 | 651,460 | ||||||
1.100% 10/25/17 | 91,000 | 89,582 | ||||||
2.000% 9/27/18 | 100,000 | 99,662 | ||||||
4.000% 10/7/19 | 273,000 | 293,904 | ||||||
4.400% 4/14/20 | 91,000 | 99,386 | ||||||
2.450% 6/29/22 | 91,000 | 83,435 | ||||||
Province of Quebec | ||||||||
4.600% 5/26/15 | 273,000 | 288,701 | ||||||
3.500% 7/29/20 | 182,000 | 186,190 | ||||||
2.625% 2/13/23 | 55,000 | 49,974 | ||||||
Republic of Chile | ||||||||
3.875% 8/5/20 | 91,000 | 95,459 | ||||||
Republic of Colombia | ||||||||
4.375% 7/12/21 | 219,000 | 225,570 | ||||||
Republic of Italy | ||||||||
4.500% 1/21/15 | 219,000 | 226,508 | ||||||
5.250% 9/20/16 | 273,000 | 295,611 | ||||||
Republic of Korea | ||||||||
5.750% 4/16/14 (b) | 906,000 | 920,840 | ||||||
5.750% 4/16/14 | 544,000 | 552,911 | ||||||
4.875% 9/22/14 | 109,000 | 112,419 | ||||||
7.125% 4/16/19 | 3,499,000 | 4,274,366 | ||||||
Republic of Panama | ||||||||
5.200% 1/30/20 | 109,000 | 118,810 | ||||||
9.375% 4/1/29 | 108,000 | 149,040 | ||||||
Republic of Peru | ||||||||
8.375% 5/3/16 | 36,000 | 41,634 | ||||||
7.125% 3/30/19 | 73,000 | 88,184 | ||||||
Republic of Philippines | ||||||||
4.000% 1/15/21 | 273,000 | 283,238 | ||||||
Republic of Poland | ||||||||
6.375% 7/15/19 | 273,000 | 318,135 | ||||||
5.125% 4/21/21 | 91,000 | 98,249 | ||||||
Republic of Slovenia | ||||||||
4.700% 11/1/16§(b) | EUR | 800,000 | 1,140,521 | |||||
Republic of South Africa | ||||||||
6.500% 6/2/14 | $ | 537,000 | 548,411 | |||||
6.875% 5/27/19 | 109,000 | 124,533 | ||||||
5.500% 3/9/20 | 109,000 | 116,085 | ||||||
Republic of Turkey | ||||||||
7.500% 7/14/17 | 364,000 | 408,135 | ||||||
3.250% 3/23/23 | 364,000 | 300,300 | ||||||
See Notes to Financial Statements.
50
AXA PREMIER VIP TRUST
MULTIMANAGER CORE BOND PORTFOLIO
PORTFOLIO OF INVESTMENTS (Continued)
December 31, 2013
| Principal Amount | Value (Note 1) | |||||||
Republic of Uruguay | ||||||||
8.000% 11/18/22 | $ | 91,000 | $ | 112,840 | ||||
Spain Government Bond | ||||||||
4.400% 10/31/23 | EUR | 190,000 | 266,375 | |||||
State of Israel | ||||||||
5.500% 11/9/16 | $ | 182,000 | 204,022 | |||||
Svensk Exportkredit AB | ||||||||
1.750% 10/20/15 | 182,000 | 185,762 | ||||||
United Kingdom Gilt | ||||||||
1.750% 9/7/22 (m) | GBP | 10,795 | 16,363 | |||||
United Mexican States | ||||||||
(Zero Coupon), 6/12/14 | MXN | 60,676,000 | 457,562 | |||||
(Zero Coupon), 6/26/14 | 128,000,000 | 968,786 | ||||||
5.625% 1/15/17 | $ | 92,000 | 102,810 | |||||
3.625% 3/15/22 | 382,000 | 376,270 | ||||||
4.000% 10/2/23 | 449,000 | 443,612 | ||||||
|
| |||||||
| 45,811,628 | ||||||||
|
| |||||||
Municipal Bonds (2.4%) | ||||||||
California State University Trustees for Systemwide Refunding, Revenue Bonds, |
| |||||||
Series 2005A, AMBAC | 110,000 | 113,893 | ||||||
City of New York Municipal Water Finance Authority, Water & Sewer System, |
| |||||||
Series 2010GG | 180,000 | 191,668 | ||||||
City of New York Municipal Water Finance Authority, Water & Sewer System, |
| |||||||
Revenue Bonds, | 230,000 | 242,593 | ||||||
5.500% 6/15/43 | 270,000 | 287,612 | ||||||
City of New York Transitional Finance Authority, Future Tax Secured Bonds, Revenue Bonds, |
| |||||||
Series 2011B | 290,000 | 301,716 | ||||||
4.325% 11/1/21 | 470,000 | 493,557 | ||||||
4.525% 11/1/22 | 655,000 | 697,234 | ||||||
City of New York, General Obligation Bonds, |
| |||||||
6.246% 6/1/35 | 1,960,000 | 2,086,067 | ||||||
County of Los Angeles Community College District, General Obligation Bonds, |
| |||||||
Series 2001A, NATL | 400,000 | 424,564 | ||||||
County of Los Angeles Public Works Financing Authority, Revenue Bonds, |
| |||||||
Series 2010-B | 1,340,000 | 1,436,172 | ||||||
5.841% 8/1/21 | 145,000 | 157,800 | ||||||
County of Los Angeles Unified School District, General Obligation Bonds, |
| |||||||
Series 2007A-1, AGM | 545,000 | 589,423 | ||||||
County of San Diego Regional Airport Authority, |
| |||||||
Revenue Bonds, | $ | 255,000 | $ | 274,161 | ||||
Dallas Area Rapid Transit, Senior Lien, Revenue Bonds, | ||||||||
Series 2009B | 145,000 | 156,094 | ||||||
Florida Hurricane Catastrophe Fund Finance Corp., Revenue Bonds, |
| |||||||
Series 2013A | 100,000 | 94,647 | ||||||
New Jersey Transportation Trust Fund Authority, Transportation System Bonds, |
| |||||||
Series 2009B | ||||||||
6.875% 12/15/39 | 1,595,000 | 1,720,303 | ||||||
New Jersey Turnpike Authority, Revenue Bonds, |
| |||||||
7.414% 1/1/40 | 363,000 | 477,944 | ||||||
Northern California Power Agency, Lodi Energy Center, Revenue Bonds, |
| |||||||
Series 2010B | 750,000 | 827,940 | ||||||
Regents of the University of California Medical Center, Revenue Bonds, |
| |||||||
Series 2010H | 545,000 | 595,946 | ||||||
5.435% 5/15/23 | 715,000 | 783,204 | ||||||
San Francisco Bay Area Toll Authority, |
| |||||||
6.793% 4/1/30 | 1,485,000 | 1,750,384 | ||||||
State of California, Various Purposes, |
| |||||||
Series 2009 | 15,000 | 16,608 | ||||||
5.750% 3/1/17 | 36,000 | 40,622 | ||||||
6.200% 3/1/19 | 36,000 | 41,769 | ||||||
6.200% 10/1/19 | 36,000 | 41,958 | ||||||
7.550% 4/1/39 | 1,090,000 | 1,409,882 | ||||||
State of Illinois, General Obligation Bonds, |
| |||||||
4.421% 1/1/15 | 35,000 | 36,051 | ||||||
State of Illinois, General Obligation Bonds, |
| |||||||
4.961% 3/1/16 | 110,000 | 117,094 | ||||||
5.665% 3/1/18 | 110,000 | 119,788 | ||||||
State of Illinois, Revenue Bonds, |
| |||||||
6.184% 1/1/34 | 363,000 | 410,135 | ||||||
State of Iowa IJOBS Program, Revenue Bonds, |
| |||||||
6.750% 6/1/34 | 655,000 | 718,987 | ||||||
|
| |||||||
| 16,655,816 | ||||||||
|
| |||||||
See Notes to Financial Statements.
51
AXA PREMIER VIP TRUST
MULTIMANAGER CORE BOND PORTFOLIO
PORTFOLIO OF INVESTMENTS (Continued)
December 31, 2013
| Principal Amount | Value (Note 1) | |||||||
Supranational (1.2%) | ||||||||
African Development Bank | ||||||||
2.500% 3/15/16 | $ | 182,000 | $ | 189,575 | ||||
Asian Development Bank | ||||||||
2.625% 2/9/15 | 182,000 | 186,618 | ||||||
2.500% 3/15/16 | 182,000 | 189,493 | ||||||
1.125% 3/15/17 | 128,000 | 128,584 | ||||||
1.750% 9/11/18 | 200,000 | 199,696 | ||||||
1.875% 10/23/18 | 91,000 | 91,202 | ||||||
1.375% 3/23/20 | 55,000 | 51,493 | ||||||
Corp. Andina de Fomento | ||||||||
3.750% 1/15/16 | 73,000 | 76,102 | ||||||
8.125% 6/4/19 | 91,000 | 111,475 | ||||||
Council of Europe Development Bank |
| |||||||
2.625% 2/16/16 | 82,000 | 85,472 | ||||||
1.500% 6/19/17 | 91,000 | 91,627 | ||||||
1.000% 3/7/18 | 128,000 | 124,535 | ||||||
European Bank for Reconstruction & Development |
| |||||||
1.625% 9/3/15 | 55,000 | 56,028 | ||||||
2.500% 3/15/16 | 146,000 | 151,959 | ||||||
1.375% 10/20/16 | 73,000 | 73,845 | ||||||
1.000% 2/16/17 | 109,000 | 108,856 | ||||||
0.750% 9/1/17 | 55,000 | 53,529 | ||||||
1.625% 4/10/18 | 100,000 | 98,695 | ||||||
1.000% 6/15/18 | 36,000 | 35,106 | ||||||
1.500% 3/16/20 | 55,000 | 52,121 | ||||||
European Investment Bank | ||||||||
1.000% 7/15/15 | 273,000 | 275,282 | ||||||
1.625% 9/1/15 | 273,000 | 278,102 | ||||||
4.875% 2/16/16 | 486,000 | 529,442 | ||||||
2.500% 5/16/16 | 546,000 | 568,681 | ||||||
0.500% 8/15/16 | 364,000 | 360,917 | ||||||
4.875% 1/17/17 | 182,000 | 202,964 | ||||||
1.125% 9/15/17 | 182,000 | 180,532 | ||||||
1.000% 12/15/17 | 164,000 | 161,015 | ||||||
1.000% 6/15/18 | 273,000 | 264,787 | ||||||
2.875% 9/15/20 | 182,000 | 183,976 | ||||||
4.000% 2/16/21 | 182,000 | 195,700 | ||||||
Inter-American Development Bank | ||||||||
1.375% 10/18/16 | 364,000 | 369,428 | ||||||
0.875% 11/15/16 | 200,000 | 200,146 | ||||||
4.250% 9/10/18 | 273,000 | 303,328 | ||||||
1.375% 7/15/20 | 182,000 | 169,464 | ||||||
International Bank for Reconstruction & Development |
| |||||||
2.375% 5/26/15 | 364,000 | 374,269 | ||||||
2.125% 3/15/16 | 364,000 | 376,495 | ||||||
5.000% 4/1/16 | 55,000 | 60,455 | ||||||
0.500% 4/15/16 | 182,000 | 181,633 | ||||||
0.875% 4/17/17 | 182,000 | 181,350 | ||||||
2.125% 2/13/23 | 36,000 | 33,059 | ||||||
International Finance Corp. | ||||||||
1.000% 4/24/17 | 182,000 | 181,498 | ||||||
2.125% 11/17/17 | 182,000 | 187,303 | ||||||
0.875% 6/15/18 | 91,000 | 88,044 | ||||||
Nordic Investment Bank | ||||||||
2.500% 7/15/15 | 109,000 | 112,406 | ||||||
0.500% 4/14/16 | 100,000 | 99,663 | ||||||
5.000% 2/1/17 | 109,000 | 122,355 | ||||||
|
| |||||||
| 8,398,305 | ||||||||
|
| |||||||
U.S. Government Agencies (3.3%) | ||||||||
Federal Farm Credit Bank | ||||||||
0.450% 7/12/16 | $ | 182,000 | $ | 181,077 | ||||
5.125% 8/25/16 | 250,000 | 278,429 | ||||||
4.875% 1/17/17 | 306,000 | 343,567 | ||||||
Federal Home Loan Bank | ||||||||
5.500% 8/13/14 | 2,000 | 2,066 | ||||||
0.250% 1/16/15 | 182,000 | 182,006 | ||||||
2.875% 6/12/15 | 729,000 | 755,776 | ||||||
1.630% 8/20/15 | 182,000 | 185,479 | ||||||
0.500% 11/20/15 | 130,000 | 130,311 | ||||||
5.625% 6/13/16 | 182,000 | 203,009 | ||||||
4.750% 12/16/16 | 182,000 | 203,095 | ||||||
0.625% 12/28/16 | 250,000 | 248,684 | ||||||
5.250% 6/5/17 | 492,000 | 557,583 | ||||||
1.000% 6/21/17 | 130,000 | 129,727 | ||||||
1.050% 7/26/17 | 360,000 | 358,402 | ||||||
5.000% 11/17/17 | 710,000 | 810,964 | ||||||
4.125% 3/13/20 | 546,000 | 595,373 | ||||||
Federal Home Loan Mortgage Corp. | ||||||||
0.800% 1/13/15 | 36,000 | 36,007 | ||||||
4.500% 1/15/15 | 364,000 | 380,057 | ||||||
2.875% 2/9/15 | 729,000 | 750,075 | ||||||
0.550% 2/27/15 | 182,000 | 182,106 | ||||||
0.300% 4/29/15 | 128,000 | 128,006 | ||||||
0.500% 8/28/15 | 273,000 | 273,124 | ||||||
0.420% 9/18/15 | 182,000 | 181,926 | ||||||
0.500% 9/25/15 | 437,000 | 437,964 | ||||||
4.750% 11/17/15 | 338,000 | 365,619 | ||||||
0.850% 2/24/16 | 182,000 | 182,114 | ||||||
5.500% 7/18/16 | 364,000 | 408,636 | ||||||
5.125% 10/18/16 | 205,000 | 229,671 | ||||||
2.250% 1/23/17 | 73,000 | 73,087 | ||||||
5.000% 2/16/17 | 273,000 | 307,181 | ||||||
1.000% 3/8/17 | 364,000 | 364,620 | ||||||
0.750% 1/12/18 | 182,000 | 177,078 | ||||||
0.875% 3/7/18 | 364,000 | 354,609 | ||||||
4.875% 6/13/18 | 546,000 | 621,788 | ||||||
3.750% 3/27/19 | 273,000 | 297,667 | ||||||
1.750% 5/30/19 | 273,000 | 269,242 | ||||||
2.000% 7/30/19 | 36,000 | 35,405 | ||||||
1.250% 10/2/19 | 273,000 | 258,812 | ||||||
2.500% 10/17/19 | 182,000 | 182,980 | ||||||
1.375% 5/1/20 | 182,000 | 170,814 | ||||||
2.375% 1/13/22 | 461,000 | 439,443 | ||||||
4.500% 2/15/44 TBA | 800,000 | 844,250 | ||||||
5.000% 1/15/44 TBA | 600,000 | 648,094 | ||||||
Federal National Mortgage Association |
| |||||||
5.125% 1/2/14 | 220,000 | 220,044 | ||||||
0.550% 2/27/15 | 109,000 | 109,064 | ||||||
0.375% 3/16/15 | 364,000 | 364,399 | ||||||
0.500% 7/2/15 | 546,000 | 547,604 | ||||||
2.375% 7/28/15 | 546,000 | 563,456 | ||||||
2.150% 8/4/15 | 36,000 | 37,046 | ||||||
2.000% 9/21/15 | 73,000 | 75,066 | ||||||
1.875% 10/15/15 | 73,000 | 74,917 | ||||||
4.375% 10/15/15 | 364,000 | 389,842 | ||||||
1.625% 10/26/15 | 546,000 | 558,253 | ||||||
0.375% 12/21/15 | 182,000 | 181,938 | ||||||
0.550% 2/26/16 | 546,000 | 544,554 | ||||||
0.500% 5/20/16 | 300,000 | 299,341 | ||||||
See Notes to Financial Statements.
52
AXA PREMIER VIP TRUST
MULTIMANAGER CORE BOND PORTFOLIO
PORTFOLIO OF INVESTMENTS (Continued)
December 31, 2013
| Principal Amount | Value (Note 1) | |||||||
1.375% 11/15/16 | $ | 364,000 | $ | 370,048 | ||||
4.875% 12/15/16 | 747,000 | 835,291 | ||||||
5.375% 6/12/17 | 729,000 | 833,923 | ||||||
0.875% 8/28/17 | 364,000 | 359,591 | ||||||
1.125% 9/12/17 | 182,000 | 181,183 | ||||||
0.875% 10/26/17 | 364,000 | 358,104 | ||||||
0.900% 11/7/17 | 182,000 | 178,398 | ||||||
0.875% 12/20/17 | 273,000 | 267,720 | ||||||
1.000% 12/28/17 | 91,000 | 87,861 | ||||||
0.875% 2/8/18 | 364,000 | 355,513 | ||||||
1.200% 2/28/18 | 182,000 | 179,116 | ||||||
1.875% 9/18/18 | 200,000 | 201,065 | ||||||
1.750% 1/30/19 | 73,000 | 71,909 | ||||||
1.700% 10/4/19 | 109,000 | 105,275 | ||||||
1.500% 10/9/19 | 182,000 | 173,798 | ||||||
2.250% 10/17/22 | 91,000 | 82,997 | ||||||
2.200% 10/25/22 | 36,000 | 32,806 | ||||||
2.500% 3/27/23 | 364,000 | 335,117 | ||||||
3.329% 10/25/23 (l) | 115,000 | 112,848 | ||||||
5.500% 1/25/44 TBA | 100,000 | 110,023 | ||||||
Financing Corp. | ||||||||
10.700% 10/6/17 | 220,000 | 296,223 | ||||||
Resolution Funding Corp. | ||||||||
(Zero Coupon), | 27,000 | 24,921 | ||||||
(Zero Coupon), | 27,000 | 24,678 | ||||||
|
| |||||||
| 23,309,855 | ||||||||
|
| |||||||
U.S. Treasuries (43.6%) | ||||||||
U.S. Treasury Bonds | ||||||||
11.250% 2/15/15 | 443,000 | 497,562 | ||||||
9.250% 2/15/16 | 978,000 | 1,159,236 | ||||||
7.500% 11/15/16 | 618,000 | 736,201 | ||||||
8.875% 8/15/17 | 1,496,000 | 1,908,802 | ||||||
8.500% 2/15/20 | 1,093,000 | 1,498,477 | ||||||
7.875% 2/15/21 | 182,000 | 247,634 | ||||||
2.000% 1/15/26 TIPS | 1,113,502 | 1,231,950 | ||||||
2.375% 1/15/27 TIPS | 797,692 | 918,404 | ||||||
1.750% 1/15/28 TIPS | 3,960,884 | 4,237,776 | ||||||
2.500% 1/15/29 TIPS | 1,135,860 | 1,333,448 | ||||||
3.875% 4/15/29 TIPS | 582,040 | 797,214 | ||||||
0.750% 2/15/42 TIPS | 382,214 | 306,960 | ||||||
2.750% 8/15/42 | 141,400 | 112,037 | ||||||
2.750% 11/15/42 | 12,700 | 10,041 | ||||||
0.625% 2/15/43 TIPS | 2,147,118 | 1,649,442 | ||||||
3.125% 2/15/43# | 6,303,400 | 5,396,794 | ||||||
2.875% 5/15/43 | 8,400 | 6,808 | ||||||
U.S. Treasury Notes | ||||||||
0.250% 1/15/15 | 729,000 | 729,598 | ||||||
0.250% 1/31/15 | 1,639,000 | 1,640,344 | ||||||
2.250% 1/31/15 | 1,457,000 | 1,489,441 | ||||||
0.250% 2/15/15 | 2,550,000 | 2,551,793 | ||||||
0.250% 2/28/15 | 1,548,000 | 1,548,957 | ||||||
0.375% 3/15/15 | 1,712,000 | 1,715,544 | ||||||
0.250% 3/31/15 | 1,530,000 | 1,530,837 | ||||||
0.375% 4/15/15 | 2,095,000 | 2,099,801 | ||||||
0.125% 4/30/15 | 1,275,000 | 1,273,506 | ||||||
2.500% 4/30/15 | 364,000 | 374,989 | ||||||
0.250% 5/15/15 | 1,275,000 | 1,275,797 | ||||||
0.250% 5/31/15 | 1,366,000 | 1,366,622 | ||||||
2.125% 5/31/15 | $ | 3,540,000 | $ | 3,634,216 | ||||
0.375% 6/15/15 | 729,000 | 730,547 | ||||||
0.375% 6/30/15 | 2,281,000 | 2,285,722 | ||||||
1.875% 6/30/15 | 3,825,000 | 3,917,662 | ||||||
0.250% 7/15/15 | 2,186,000 | 2,186,085 | ||||||
0.250% 7/31/15 | 750,000 | 749,966 | ||||||
0.250% 8/15/15 | 1,822,000 | 1,821,288 | ||||||
0.375% 8/31/15 | 1,200,000 | 1,201,828 | ||||||
1.250% 8/31/15 | 1,822,000 | 1,850,967 | ||||||
0.250% 9/15/15 | 729,000 | 728,402 | ||||||
0.250% 9/30/15 | 2,000,000 | 1,998,190 | ||||||
0.250% 10/15/15 | 1,275,000 | 1,273,340 | ||||||
0.250% 10/31/15 | 1,000,000 | 998,594 | ||||||
1.250% 10/31/15 | 1,822,000 | 1,852,177 | ||||||
0.375% 11/15/15 | 2,186,000 | 2,187,281 | ||||||
4.500% 11/15/15 | 1,350,000 | 1,454,370 | ||||||
0.250% 11/30/15 | 925,000 | 923,151 | ||||||
1.375% 11/30/15 | 3,300,000 | 3,363,809 | ||||||
0.250% 12/15/15 | 1,275,000 | 1,272,145 | ||||||
0.250% 12/31/15 | 1,000,000 | 997,245 | ||||||
0.375% 1/15/16 | 3,695,800 | 3,694,260 | ||||||
0.375% 2/15/16 | 1,457,000 | 1,455,748 | ||||||
4.500% 2/15/16 | 1,822,000 | 1,979,574 | ||||||
2.625% 2/29/16 | 2,186,000 | 2,289,835 | ||||||
0.375% 3/15/16 | 364,000 | 363,441 | ||||||
2.375% 3/31/16 | 2,186,000 | 2,280,214 | ||||||
0.250% 4/15/16 | 729,000 | 725,137 | ||||||
2.625% 4/30/16 | 911,000 | 955,684 | ||||||
0.250% 5/15/16 | 1,202,000 | 1,194,613 | ||||||
5.125% 5/15/16 | 396,000 | 438,843 | ||||||
1.750% 5/31/16 | 1,822,000 | 1,874,762 | ||||||
3.250% 5/31/16 | 1,093,000 | 1,163,974 | ||||||
0.500% 6/15/16 | 2,000,000 | 1,997,865 | ||||||
0.625% 7/15/16 | 1,607,600 | 1,609,505 | ||||||
1.500% 7/31/16 | 2,915,000 | 2,981,536 | ||||||
0.875% 9/15/16 | 1,000,000 | 1,005,951 | ||||||
1.000% 9/30/16 | 1,457,000 | 1,469,483 | ||||||
3.000% 9/30/16 | 1,822,000 | 1,936,445 | ||||||
0.625% 10/15/16 | 2,000,000 | 1,996,276 | ||||||
3.125% 10/31/16 | 1,822,000 | 1,944,202 | ||||||
0.625% 11/15/16 | 500,000 | 498,483 | ||||||
0.625% 12/15/16 | 1,000,000 | 995,925 | ||||||
0.875% 12/31/16 | 1,822,000 | 1,826,009 | ||||||
0.875% 1/31/17 | 729,000 | 729,693 | ||||||
3.125% 1/31/17 | 1,822,000 | 1,947,832 | ||||||
0.875% 2/28/17 | 1,822,000 | 1,821,763 | ||||||
1.000% 3/31/17 | 2,550,000 | 2,555,578 | ||||||
3.125% 4/30/17 | 1,457,000 | 1,559,768 | ||||||
4.500% 5/15/17 | 1,275,000 | 1,422,804 | ||||||
2.750% 5/31/17 | 2,186,000 | 2,314,371 | ||||||
0.500% 7/31/17 | 2,186,000 | 2,140,060 | ||||||
4.750% 8/15/17 | 1,161,000 | 1,311,673 | ||||||
0.625% 8/31/17 | 1,822,000 | 1,787,861 | ||||||
1.875% 8/31/17 | 2,004,000 | 2,057,153 | ||||||
0.625% 9/30/17 | 911,000 | 892,033 | ||||||
1.875% 9/30/17 | 1,275,000 | 1,307,572 | ||||||
0.750% 10/31/17 | 1,457,000 | 1,430,592 | ||||||
1.875% 10/31/17 | 1,822,000 | 1,867,526 | ||||||
4.250% 11/15/17 | 419,000 | 466,498 | ||||||
0.625% 11/30/17 | 1,457,000 | 1,420,575 | ||||||
0.750% 12/31/17 | 1,457,000 | 1,424,673 | ||||||
See Notes to Financial Statements.
53
AXA PREMIER VIP TRUST
MULTIMANAGER CORE BOND PORTFOLIO
PORTFOLIO OF INVESTMENTS (Continued)
December 31, 2013
| Principal Amount | Value (Note 1) | |||||||
2.750% 12/31/17 | $ | 1,275,000 | $ | 1,347,499 | ||||
0.875% 1/31/18 | 1,457,000 | 1,429,226 | ||||||
3.500% 2/15/18 | 1,093,000 | 1,186,631 | ||||||
0.750% 2/28/18 | 729,000 | 709,797 | ||||||
0.750% 3/31/18 | 911,000 | 885,117 | ||||||
0.625% 4/30/18 | 729,000 | 703,020 | ||||||
2.625% 4/30/18 | 455,000 | 477,590 | ||||||
1.000% 5/31/18 | 1,093,000 | 1,069,148 | ||||||
2.375% 5/31/18 | 729,000 | 756,698 | ||||||
1.375% 6/30/18 | 4,812,000 | 4,775,283 | ||||||
1.375% 7/31/18 | 5,200,000 | 5,153,688 | ||||||
2.250% 7/31/18 | 364,000 | 375,247 | ||||||
4.000% 8/15/18 | 656,000 | 727,579 | ||||||
1.500% 8/31/18 | 63,200,000 | 62,875,771 | ||||||
1.375% 9/30/18 | 1,202,000 | 1,187,304 | ||||||
1.250% 10/31/18 | 2,000,000 | 1,960,833 | ||||||
3.750% 11/15/18 | 1,457,000 | 1,598,906 | ||||||
1.250% 11/30/18 | 1,325,000 | 1,296,619 | ||||||
1.375% 12/31/18 | 1,093,000 | 1,074,769 | ||||||
1.500% 12/31/18 | 840,000 | 830,390 | ||||||
1.250% 1/31/19 | 729,000 | 710,927 | ||||||
2.750% 2/15/19 | 1,822,000 | 1,909,091 | ||||||
1.500% 3/31/19 | 1,450,000 | 1,425,890 | ||||||
1.250% 4/30/19 | 546,000 | 528,980 | ||||||
1.000% 6/30/19 | 1,093,000 | 1,039,332 | ||||||
1.000% 8/31/19 | 729,000 | 689,437 | ||||||
1.000% 9/30/19 | 1,093,000 | 1,031,860 | ||||||
1.250% 10/31/19 | 1,093,000 | 1,045,437 | ||||||
3.375% 11/15/19 | 2,131,000 | 2,292,323 | ||||||
1.000% 11/30/19 | 3,206,400 | 3,012,680 | ||||||
1.125% 12/31/19 | 1,093,000 | 1,032,373 | ||||||
1.375% 1/31/20 | 1,093,000 | 1,045,452 | ||||||
3.625% 2/15/20 | 3,461,000 | 3,767,172 | ||||||
1.250% 2/29/20 | 1,093,000 | 1,034,621 | ||||||
1.125% 3/31/20 | 729,000 | 683,096 | ||||||
1.125% 4/30/20 | 364,000 | 340,188 | ||||||
3.500% 5/15/20 | 2,550,000 | 2,751,111 | ||||||
1.875% 6/30/20 | 110,000 | 107,326 | ||||||
2.625% 8/15/20 | 2,929,000 | 2,988,571 | ||||||
2.125% 8/31/20 | 1,000,000 | 987,240 | ||||||
2.000% 9/30/20 | 2,850,000 | 2,785,912 | ||||||
1.750% 10/31/20 | 8,100,000 | 7,771,043 | ||||||
2.625% 11/15/20 | 1,822,000 | 1,851,631 | ||||||
2.000% 11/30/20 | 1,670,000 | 1,625,728 | ||||||
2.375% 12/31/20 | 1,000,000 | 995,943 | ||||||
3.125% 5/15/21 | 2,847,000 | 2,967,775 | ||||||
2.125% 8/15/21 | 2,004,000 | 1,941,323 | ||||||
2.000% 11/15/21 | 1,275,000 | 1,216,911 | ||||||
2.000% 2/15/22 | 2,004,000 | 1,901,739 | ||||||
1.750% 5/15/22 | 1,457,000 | 1,347,251 | ||||||
1.625% 8/15/22 | 2,073,300 | 1,883,598 | ||||||
1.625% 11/15/22 | 6,247,900 | 5,639,299 | ||||||
0.125% 1/15/23 TIPS | 224,923 | 212,384 | ||||||
2.000% 2/15/23 | 3,758,600 | 3,486,689 | ||||||
1.750% 5/15/23 | 4,074,400 | 3,672,318 | ||||||
0.375% 7/15/23 TIPS | 1,329,717 | 1,281,913 | ||||||
2.500% 8/15/23 | 1,750,000 | 1,680,547 | ||||||
2.750% 11/15/23 | 3,030,000 | 2,964,113 | ||||||
3.750% 11/15/43 | 1,670,000 | 1,614,159 | ||||||
|
| |||||||
| 305,893,288 | ||||||||
|
| |||||||
Total Government Securities |
| 530,520,836 | ||||||
|
| |||||||
Total Long-Term Debt Securities (108.9%) |
| |||||||
(Cost $769,927,159) | 764,624,022 | |||||||
|
| |||||||
| Number of Shares | Value (Note 1) | |||||||
CONVERTIBLE PREFERRED STOCK: |
| |||||||
Financials (0.3%) | ||||||||
Commercial Banks (0.3%) | ||||||||
Wells Fargo & Co. | 2,000 | $ | 2,210,000 | |||||
|
| |||||||
Total Convertible Preferred Stocks (0.3%) |
| |||||||
(Cost $2,000,000) | 2,210,000 | |||||||
|
| |||||||
| Principal Amount | Value (Note 1) | |||||||
SHORT-TERM INVESTMENTS: | ||||||||
Certificate of Deposit (0.9%) | ||||||||
Banco do Brasil S.A. | $ | 3,843,055 | 3,843,263 | |||||
0.59%, 3/27/14 (p) | 2,483,483 | 2,479,981 | ||||||
|
| |||||||
Total Certificate of Deposit | 6,323,244 | |||||||
|
| |||||||
Government Securities (0.2%) | ||||||||
U.S. Treasury Bills | ||||||||
0.02%, 2/6/14 (p) | 1,000,000 | 999,981 | ||||||
United Mexican States Bills | ||||||||
0.00%, 1/16/14 | MXN | 4,324,000 | 33,064 | |||||
0.00%, 3/27/14 | 92,000,000 | 699,134 | ||||||
|
| |||||||
Total Government Securities | 1,732,179 | |||||||
|
| |||||||
Total Short-Term Investments (1.1%) |
| |||||||
(Cost $8,054,835) | 8,055,423 | |||||||
|
| |||||||
| Number of Contracts | Value (Note 1) | |||||||
OPTIONS PURCHASED: | ||||||||
Call Option Purchased (0.0%) | ||||||||
Eurodollar | 377 | 18,850 | ||||||
|
| |||||||
Put Option Purchased (0.0%) | ||||||||
Eurodollar 2 Year Mid Curve | 49 | 33,075 | ||||||
|
| |||||||
Total Options Purchased (0.0%) | 51,925 | |||||||
|
| |||||||
Total Investments Before Options Written and Securities Sold Short (110.3%) |
| |||||||
(Cost $780,029,793) | 774,941,370 | |||||||
|
| |||||||
OPTIONS WRITTEN: | ||||||||
Put Options Written (0.0%) | ||||||||
Eurodollar | (377 | ) | (37,700 | ) | ||||
Eurodollar 2 Year Mid Curve | (49 | ) | (7,963 | ) | ||||
|
| |||||||
| (45,663 | ) | |||||||
|
| |||||||
Total Options Written (0.0%) | (45,663 | ) | ||||||
|
| |||||||
Total Investments Before Securities Sold |
| |||||||
(Cost $779,985,489) | 774,895,707 | |||||||
|
| |||||||
See Notes to Financial Statements.
54
AXA PREMIER VIP TRUST
MULTIMANAGER CORE BOND PORTFOLIO
PORTFOLIO OF INVESTMENTS (Continued)
December 31, 2013
| Principal Amount | Value (Note 1) | |||||||
SECURITIES SOLD SHORT: | ||||||||
Agency CMO (-4.0%) | ||||||||
Federal Home Loan Mortgage Corp. |
| |||||||
3.000%, 1/15/43 TBA | $ | (600,000 | ) | $ | (568,453 | ) | ||
Federal National Mortgage Association |
| |||||||
4.000%, 1/25/29 TBA | (500,000 | ) | (529,453 | ) | ||||
2.500%, 1/25/29 TBA | (600,000 | ) | (593,813 | ) | ||||
6.500%, 1/25/44 TBA | (400,000 | ) | (448,000 | ) | ||||
4.500%, 2/25/44 TBA | (500,000 | ) | (528,594 | ) | ||||
6.000%, 2/25/44 TBA | (1,000,000 | ) | (1,109,531 | ) | ||||
4.000%, 1/25/44 TBA | (5,000,000 | ) | (5,152,344 | ) | ||||
4.500%, 1/25/44 TBA | (14,000,000 | ) | (14,846,563 | ) | ||||
5.000%, 1/25/44 TBA | (1,000,000 | ) | (1,086,719 | ) | ||||
3.500%, 2/25/44 TBA (z) | (300,000 | ) | (297,340 | ) | ||||
5.000%, 2/25/44 TBA | (700,000 | ) | (758,242 | ) | ||||
Government National Mortgage Association |
| |||||||
4.000%, 1/15/42 TBA | (900,000 | ) | (936,562 | ) | ||||
4.500%, 1/15/42 TBA | (1,000,000 | ) | (1,068,750 | ) | ||||
4.000%, 1/15/43 TBA | (400,000 | ) | (415,688 | ) | ||||
|
| |||||||
Total Securities Sold Short (-4.0%) | (28,340,052 | ) | ||||||
|
| |||||||
Total Investments after Options Written and Securities Sold Short (106.3%) | 746,555,655 | |||||||
Other Assets Less Liabilities (-6.3%) | (44,334,391 | ) | ||||||
|
| |||||||
Net Assets (100%) | $ | 702,221,264 | ||||||
|
| |||||||
| * | Non-income producing. |
| † | Securities (totaling $976 or 0.0% of net assets) at fair value by management. |
| § | Securities exempt from registration under Rule 144A of the Securities Act of 1933. These securities may only be resold to qualified institutional buyers. At December 31, 2013, the market value of these securities amounted to $47,428,382 or 6.8% of net assets. Securities denoted with “§” but without “b” have been determined to be liquid under the guidelines established by the Board of Trustees. To the extent any securities might provide a right to demand registration, such rights have not been relied upon when determining liquidity. |
| # | All, or a portion of security held by broker as collateral for financial futures contracts, with a total collateral value of $184,077. |
| (b) | Illiquid security. |
| (h) | Defaulted security. A security is classified as defaulted if the issuer files for bankruptcy or fails to make a scheduled interest or principal payment within the grace period set forth in the security’s governing documents. |
| (l) | Floating Rate Security. Rate disclosed is as of December 31, 2013. |
| (m) | Regulation S is an exemption for securities offerings that are made outside of the United States and do not involve direct selling efforts in the United States. Resale restrictions may apply for purposes of the Securities Act of 1933. At December 31, 2013, the market value of these securities amounted to $4,745,511 or 0.7% of net assets. |
| (p) | Yield to maturity. |
| (z) | All or a portion of the Security is held as a Sale-Buyback position. See Note 1. |
| Glossary: | ||||||
| ABS | — | Asset-Backed Security | ||||
| AGM | — | Insured by Assured Guaranty Municipal Corp. | ||||
| AMBAC | — | Insured by American Municipal Bond Assurance Corp. | ||||
| AUD | — | Australian Dollar | ||||
| CHF | — | Swiss Franc | ||||
| CMO | — | Collateralized Mortgage Obligation | ||||
| EUR | — | European Currency Unit | ||||
| GBP | — | British Pound | ||||
| IO | — | Interest Only | ||||
| JPY | — | Japanese Yen | ||||
| MXN | — | Mexican Peso | ||||
| NATL | — | Insured by National Public Finance Guarantee Corp. | ||||
| STRIPS | — | Separate Trading of Registered Interest and Principal Securities. The STRIPS Program lets investors hold and trade individual interest and principal components of eligible notes and bonds as separate securities. | ||||
| TBA | — | To Be Announced; Security is subject to delayed delivery | ||||
| TIPS | — | Treasury Inflation Protected Security | ||||
At December 31, 2013, the Portfolio had the following futures contracts open: (Note 1)
Purchases | Number of Contracts | Expiration Date | Original Value | Value at 12/31/2013 | Unrealized Appreciation/ (Depreciation) | |||||||||||||||
2 Year U.S. Treasury Notes | 31 | March-14 | $ | 6,824,171 | $ | 6,814,187 | $ | (9,984 | ) | |||||||||||
U.S. Long Bond | 27 | March-14 | 3,517,393 | 3,464,438 | (52,955 | ) | ||||||||||||||
|
| |||||||||||||||||||
| $ | (62,939 | ) | ||||||||||||||||||
|
| |||||||||||||||||||
Sales | ||||||||||||||||||||
10 Year U.S. Treasury Notes | 92 | March-14 | $ | 11,544,138 | $ | 11,320,312 | $ | 223,826 | ||||||||||||
5 Year U.S. Treasury Notes | 30 | March-14 | 3,596,581 | 3,579,375 | 17,206 | |||||||||||||||
90 Day Eurodollar | 6 | December-15 | 1,485,741 | 1,483,125 | 2,616 | |||||||||||||||
Euro-Bund | 44 | March-14 | 8,514,612 | 8,424,072 | 90,540 | |||||||||||||||
U.S. Long Bond | 58 | March-14 | 7,602,420 | 7,442,125 | 160,295 | |||||||||||||||
U.S. Ultra Bond | 33 | March-14 | 4,570,921 | 4,496,250 | 74,671 | |||||||||||||||
|
| |||||||||||||||||||
| $ | 569,154 | |||||||||||||||||||
|
| |||||||||||||||||||
| $ | 506,215 | |||||||||||||||||||
|
| |||||||||||||||||||
See Notes to Financial Statements.
55
AXA PREMIER VIP TRUST
MULTIMANAGER CORE BOND PORTFOLIO
PORTFOLIO OF INVESTMENTS (Continued)
December 31, 2013
At December 31, 2013, the Portfolio had outstanding foreign currency contracts to buy/sell foreign currencies as follows: (Note 1)
Foreign Currency Buy Contracts | Counterparty | Local Contract Buy Amount (000’s) | U.S. $ Current Value | U.S. $ Settlement Value | Unrealized Appreciation/ (Depreciation) | |||||||||||||
Australian Dollar vs. U.S. Dollar, | Bank of America | 28,732 | $ | 25,649,754 | $ | 25,464,396 | $ | 185,358 | ||||||||||
European Union Euro vs. U.S. Dollar, | BNP Paribas | 362 | 497,998 | 497,833 | 165 | |||||||||||||
|
| |||||||||||||||||
| $ | 185,523 | |||||||||||||||||
|
| |||||||||||||||||
Foreign Currency Sell Contracts | Counterparty | Local Contract Sell Amount (000’s) | U.S. $ Settlement Value | U.S. $ Current Value | Unrealized Appreciation/ (Depreciation) | |||||||||||||
Australian Dollar vs. U.S. Dollar, | Citibank N.A. | 28,732 | $ | 26,221,340 | $ | 25,649,754 | $ | 571,586 | ||||||||||
Australian Dollar vs. U.S. Dollar, | Bank of America | 28,732 | 25,415,321 | 25,599,637 | (184,316 | ) | ||||||||||||
Canadian Dollar vs. U.S. Dollar, | Citibank N.A. | 1,450 | 1,366,230 | 1,362,492 | 3,738 | |||||||||||||
European Union Euro vs. U.S. Dollar, | Barclays Bank plc | 791 | 1,068,146 | 1,088,167 | (20,021 | ) | ||||||||||||
European Union Euro vs. U.S. Dollar, | Citibank N.A. | 2,931 | 4,040,267 | 4,032,088 | 8,179 | |||||||||||||
Mexican Peso vs. U.S. Dollar, expiring 6/12/14 | Goldman Sachs & Co. | 6,398 | 487,612 | 483,859 | 3,753 | |||||||||||||
Mexican Peso vs. U.S. Dollar, expiring 6/26/14 | Morgan Stanley | 21,703 | 1,650,636 | 1,639,566 | 11,070 | |||||||||||||
|
| |||||||||||||||||
| $ | 393,989 | |||||||||||||||||
|
| |||||||||||||||||
| $ | 579,512 | |||||||||||||||||
|
| |||||||||||||||||
Options Written:
Options written for the year ended December 31, 2013 were as follows:
| Total Number of Contracts | Total Premiums Received | |||||||
Options Outstanding - January 1, 2013 | — | $ | — | |||||
Options Written | 1,709 | 467,083 | ||||||
Options Terminated in Closing Purchase Transactions | (1,283 | ) | (422,779 | ) | ||||
Options Expired | — | — | ||||||
Options Exercised | — | — | ||||||
|
|
|
| |||||
Options Outstanding - December 31, 2013 | 426 | $ | 44,304 | |||||
|
|
|
| |||||
See Notes to Financial Statements.
56
AXA PREMIER VIP TRUST
MULTIMANAGER CORE BOND PORTFOLIO
PORTFOLIO OF INVESTMENTS (Continued)
December 31, 2013
The following is a summary of the inputs used to value the Portfolio’s assets and liabilities carried at fair value as of December 31, 2013:
The inputs or methodology used for valuing securities are not necessarily an indication of the risk associated with investing in those securities.
Various inputs are used in determining the value of the Portfolio’s investments. These inputs are summarized in the three broad levels listed below:
| Investment Type | Level 1 Quoted Prices in Active Markets for Identical Securities | Level 2 Significant Other Observable Inputs (including quoted prices for similar securities, interest rates, prepayment speeds, credit risk, etc.) (a) | Level 3 Significant Unobservable Inputs (including the Portfolio’s own assumptions in determining the fair value of investments) | Total | ||||||||||||
Assets: |
| |||||||||||||||
Asset-Backed and Mortgage- | ||||||||||||||||
Asset-Backed Securities | $ | — | $ | 18,937,149 | $ | 976 | $ | 18,938,125 | ||||||||
Non-Agency CMO | — | 36,081,489 | 454,524 | 36,536,013 | ||||||||||||
Convertible Preferred Stocks | ||||||||||||||||
Financials | 2,210,000 | — | — | 2,210,000 | ||||||||||||
Corporate Bonds | ||||||||||||||||
Consumer Discretionary | — | 8,271,496 | — | 8,271,496 | ||||||||||||
Consumer Staples | — | 10,931,981 | — | 10,931,981 | ||||||||||||
Energy | — | 16,021,565 | — | 16,021,565 | ||||||||||||
Financials | — | 89,125,363 | — | † | 89,125,363 | |||||||||||
Health Care | — | 12,636,759 | — | 12,636,759 | ||||||||||||
Industrials | — | 7,143,706 | — | 7,143,706 | ||||||||||||
Information Technology | — | 8,714,463 | — | 8,714,463 | ||||||||||||
Materials | — | 6,588,375 | — | 6,588,375 | ||||||||||||
Telecommunication Services | — | 10,299,391 | — | 10,299,391 | ||||||||||||
Utilities | — | 8,895,949 | — | 8,895,949 | ||||||||||||
Forward Currency Contracts | — | 783,849 | — | 783,849 | ||||||||||||
Futures | 569,154 | — | — | 569,154 | ||||||||||||
Government Securities | ||||||||||||||||
Agency ABS | — | 3,079,675 | — | 3,079,675 | ||||||||||||
Agency CMO | — | 127,372,269 | — | 127,372,269 | ||||||||||||
Foreign Governments | — | 45,811,628 | — | 45,811,628 | ||||||||||||
Municipal Bonds | — | 16,655,816 | — | 16,655,816 | ||||||||||||
Supranational | — | 8,398,305 | — | 8,398,305 | ||||||||||||
U.S. Government Agencies | — | 23,309,855 | — | 23,309,855 | ||||||||||||
U.S. Treasuries | — | 305,893,288 | — | 305,893,288 | ||||||||||||
Options Purchased | ||||||||||||||||
Call Options Purchased | 18,850 | — | — | 18,850 | ||||||||||||
Put Options Purchased | 33,075 | — | — | 33,075 | ||||||||||||
Short-Term Investments | — | 8,055,423 | — | 8,055,423 | ||||||||||||
|
|
|
|
|
|
|
| |||||||||
Total Assets | $ | 2,831,079 | $ | 773,007,794 | $ | 455,500 | $ | 776,294,373 | ||||||||
|
|
|
|
|
|
|
| |||||||||
Liabilities: |
| |||||||||||||||
Forward Currency Contracts | $ | — | $ | (204,337 | ) | $ | — | $ | (204,337 | ) | ||||||
Futures | (62,939 | ) | — | — | (62,939 | ) | ||||||||||
Government Securities | ||||||||||||||||
Agency CMO | — | (28,340,052 | ) | — | (28,340,052 | ) | ||||||||||
Options Written | ||||||||||||||||
Put Options Written | (45,663 | ) | — | — | (45,663 | ) | ||||||||||
|
|
|
|
|
|
|
| |||||||||
Total Liabilities | $ | (108,602 | ) | $ | (28,544,389 | ) | $ | — | $ | (28,652,991 | ) | |||||
|
|
|
|
|
|
|
| |||||||||
Total | $ | 2,722,477 | $ | 744,463,405 | $ | 455,500 | $ | 747,641,382 | ||||||||
|
|
|
|
|
|
|
| |||||||||
| † | Value is zero. |
| (a) | Securities with a market value of $604,630 transferred from Level 3 to Level 2 during the year ended December 31,2013 due to the securities being currently priced by a third party pricing vendor. |
There were no additional transfers between Levels 1, 2 or 3 during the year ended December 31, 2013.
See Notes to Financial Statements.
57
AXA PREMIER VIP TRUST
MULTIMANAGER CORE BOND PORTFOLIO
PORTFOLIO OF INVESTMENTS (Continued)
December 31, 2013
Fair Values of Derivative Instruments as of December 31, 2013:
Statement of Assets and Liabilities | ||||||
Derivatives Not Accounted for as | Asset Derivatives | Fair Value | ||||
Interest rate contracts | Receivables, Net assets - Unrealized appreciation | $ | 621,079 | * | ||
Foreign exchange contracts | Receivables | 783,849 | ||||
Credit contracts | Receivables | — | ||||
Equity contracts | Receivables, Net assets - Unrealized appreciation | — | * | |||
Commodity contracts | Receivables | — | ||||
Other contracts | Receivables | — | ||||
|
| |||||
Total | $ | 1,404,928 | ||||
|
| |||||
Liability Derivatives | ||||||
Interest rate contracts | Payables, Net assets - Unrealized | |||||
| depreciation | $ | (108,602 | )* | |||
Foreign exchange contracts | Payables | (204,337 | ) | |||
Credit contracts | Payables | — | ||||
Equity contracts | Payables, Net assets - Unrealized | |||||
| depreciation | — | * | ||||
Commodity contracts | Payables | — | ||||
Other contracts | Payables | — | ||||
|
| |||||
Total | $ | (312,939 | ) | |||
|
| |||||
| * | Includes cumulative appreciation/depreciation of futures contracts as reported in the Portfolio of Investments. Only current day’s variation margin is reported within the Statement of Assets & Liabilities. |
The effect of Derivative Instruments on the Statement of Operations for the year ended December 31, 2013:
| Amount of Realized Gain or (Loss) on Derivatives Recognized in Income | ||||||||||||||||||||
Derivatives Not Accounted for as | Options | Futures | Forward Currency Contracts | Swaps | Total | |||||||||||||||
Interest rate contracts | $ | 279,196 | $ | 4,918,107 | $ | — | $ | — | $ | 5,197,303 | ||||||||||
Foreign exchange contracts | — | — | 1,351,129 | — | 1,351,129 | |||||||||||||||
Credit contracts | — | — | — | — | — | |||||||||||||||
Equity contracts | — | — | — | — | — | |||||||||||||||
Commodity contracts | — | — | — | — | — | |||||||||||||||
Other contracts | — | — | — | — | — | |||||||||||||||
|
|
|
|
|
|
|
|
|
| |||||||||||
Total | $ | 279,196 | $ | 4,918,107 | $ | 1,351,129 | $ | — | $ | 6,548,432 | ||||||||||
|
|
|
|
|
|
|
|
|
| |||||||||||
| Amount of Unrealized Appreciation or (Depreciation) on Derivatives Recognized in Income | ||||||||||||||||||||
Derivatives Not Accounted for as | Options | Futures | Forward Currency Contracts | Swaps | Total | |||||||||||||||
Interest rate contracts | $ | (5,214 | ) | $ | 187,966 | $ | — | $ | — | $ | 182,752 | |||||||||
Foreign exchange contracts | — | — | 878,051 | — | 878,051 | |||||||||||||||
Credit contracts | — | — | — | — | — | |||||||||||||||
Equity contracts | — | — | — | — | — | |||||||||||||||
Commodity contracts | — | — | — | — | — | |||||||||||||||
Other contracts | — | — | — | — | — | |||||||||||||||
|
|
|
|
|
|
|
|
|
| |||||||||||
Total | $ | (5,214 | ) | $ | 187,966 | $ | 878,051 | $ | — | $ | 1,060,803 | |||||||||
|
|
|
|
|
|
|
|
|
| |||||||||||
^ This Portfolio held options, forward foreign currency and futures contracts as a substitute for investing in conventional securities, hedging and in an attempt to enhance returns.
See Notes to Financial Statements.
58
AXA PREMIER VIP TRUST
MULTIMANAGER CORE BOND PORTFOLIO
PORTFOLIO OF INVESTMENTS (Continued)
December 31, 2013
The Portfolio held forward foreign currency contracts with an average settlement value of approximately $119,670,000, and options and futures contracts with an average notional balance of approximately $122,000 and $173,466,000, respectively, during the year ended December 31, 2013.
The following table presents the Portfolio’s gross derivative assets and liabilities by counterparty net of amounts available for offset under netting arrangements and any related collateral received or pledged by the Portfolio as of December 31, 2013:
Counterparty | Gross Amount of Derivative Assets Presented in the Statement of Assets and Liabilities (a) | Derivatives Available for Offset | Collateral Received | Net Amount Due from Counterparty | ||||||||||||
Bank of America | $ | 185,358 | $ | (184,316 | ) | $ | — | $ | 1,042 | |||||||
BNP Paribas | 165 | — | — | 165 | ||||||||||||
Citibank N.A. | 583,503 | — | — | 583,503 | ||||||||||||
Goldman Sachs & Co. | 3,753 | — | — | 3,753 | ||||||||||||
Morgan Stanley | 11,070 | — | — | 11,070 | ||||||||||||
Exchange Traded Futures & Options Contracts (b) | 621,079 | (c) | — | — | 621,079 | |||||||||||
|
|
|
|
|
|
|
| |||||||||
| $ | 1,404,928 | $ | (184,316 | ) | $ | — | $ | 1,220,612 | ||||||||
|
|
|
|
|
|
|
| |||||||||
Counterparty | Gross Amount of Derivative Liabilities Presented in the Statement of Assets and Liabilities (a) | Derivatives Available for Offset | Collateral Pledged | Net Amount Due to Counterparty | ||||||||||||
Bank of America | $ | 184,316 | $ | (184,316 | ) | $ | — | $ | — | |||||||
Barclays Bank plc | 20,021 | — | — | 20,021 | ||||||||||||
Exchange Traded Futures & Options Contracts (b) | 108,602 | (c) | — | — | 108,602 | |||||||||||
|
|
|
|
|
|
|
| |||||||||
| $ | 312,939 | $ | (184,316 | ) | $ | — | $ | 128,623 | ||||||||
|
|
|
|
|
|
|
| |||||||||
| (a) | For financial reporting purposes the Portfolio does not offset derivative assets and derivative liabilities subject to master netting arrangements in the Statement of Assets and Liabilities. |
| (b) | These derivatives are traded on an exchange, therefore they are not subject to master netting arrangements. |
| (c) | This amount represents the cumulative appreciation (depreciation) of futures contracts as reported in the Portfolio of Investments. The Statement of Assets and Liabilities only reflects the current day variation margin receivable/payable to brokers for futures contracts. |
Investment security transactions for the year ended December 31, 2013 were as follows:
Cost of Purchases: | ||||
Long-term investments other than U.S. government debt securities | $ | 5,300,577,780 | ||
Long-term U.S. government debt securities | 1,209,476,580 | |||
|
| |||
| $ | 6,510,054,360 | |||
|
| |||
Net Proceeds of Sales and Redemptions: | ||||
Long-term investments other than U.S. government debt securities | $ | 5,600,264,737 | ||
Long-term U.S. government debt securities | 1,215,204,055 | |||
|
| |||
| $ | 6,815,468,792 | |||
|
|
As of December 31, 2013, the gross unrealized appreciation (depreciation) of investments based on the aggregate cost of investments for Federal income tax purposes was as follows:
Aggregate gross unrealized appreciation | $ | 18,364,454 | ||
Aggregate gross unrealized depreciation | (23,894,635 | ) | ||
|
| |||
Net unrealized depreciation | $ | (5,530,181 | ) | |
|
| |||
Federal income tax cost of investments | $ | 780,471,551 | ||
|
|
See Notes to Financial Statements.
59
AXA PREMIER VIP TRUST
MULTIMANAGER CORE BOND PORTFOLIO
STATEMENT OF ASSETS AND LIABILITIES
December 31, 2013
ASSETS | ||||
Investments at value (Cost $780,029,793) | $ | 774,941,370 | ||
Cash | 6,230,215 | |||
Foreign cash (Cost $219,039) | 220,280 | |||
Cash held as collateral at broker | 372,000 | |||
Receivable for forward commitments | 78,928,910 | |||
Dividends, interest and other receivables | 4,850,005 | |||
Receivable for securities sold | 1,645,155 | |||
Receivable for sale-buyback financing transactions | 1,510,531 | |||
Unrealized appreciation on forward foreign currency contracts | 783,849 | |||
Receivable from Separate Accounts for Trust shares sold | 143,799 | |||
Due from broker for futures variation margin | 61,674 | |||
Other assets | 5,605 | |||
|
| |||
Total assets | 869,693,393 | |||
|
| |||
LIABILITIES | ||||
Payable for forward commitments | 128,265,340 | |||
Securities sold short (Proceeds received $28,474,934) | 28,340,052 | |||
Payable for securities purchased | 4,920,908 | |||
Payable for sale-buyback financing transactions. | 3,054,730 | |||
Payable to Separate Accounts for Trust shares redeemed | 1,050,801 | |||
Payable for return of cash collateral on forward commitments | 615,000 | |||
Investment management fees payable | 329,997 | |||
Unrealized depreciation on forward foreign currency contracts | 204,337 | |||
Administrative fees payable | 122,500 | |||
Distribution fees payable - Class B | 62,106 | |||
Options written, at value (Premiums received $44,304) | 45,663 | |||
Trustees’ fees payable | 42,298 | |||
Distribution fees payable - Class A | 7,743 | |||
Other liabilities | 247,472 | |||
Accrued expenses | 163,182 | |||
|
| |||
Total liabilities | 167,472,129 | |||
|
| |||
NET ASSETS | $ | 702,221,264 | ||
|
| |||
Net assets were comprised of: | ||||
Paid in capital | $ | 720,473,837 | ||
Accumulated undistributed net investment income (loss) | 930,944 | |||
Accumulated undistributed net realized gain (loss) on investments, securities sold short, options written, futures and foreign currency transactions | (15,292,114 | ) | ||
Net unrealized appreciation (depreciation) on investments, securities sold short, options written, futures and foreign currency translations | (3,891,403 | ) | ||
|
| |||
Net assets | $ | 702,221,264 | ||
|
| |||
Class A | ||||
Net asset value, offering and redemption price per share, $37,566,304 / 3,805,313 shares outstanding (unlimited amount authorized: $0.001 par value) | $ | 9.87 | ||
|
| |||
Class B | ||||
Net asset value, offering and redemption price per share, $291,698,951 / 29,482,122 shares outstanding (unlimited amount authorized: $0.001 par value) | $ | 9.89 | ||
|
| |||
Class K | ||||
Net asset value, offering and redemption price per share, $372,956,009 / 37,775,661 shares outstanding (unlimited amount authorized: $0.001 par value) | $ | 9.87 | ||
|
|
STATEMENT OF OPERATIONS
For the Year Ended December 31, 2013
INVESTMENT INCOME | ||||
Interest | $ | 36,886,847 | ||
Dividends | 262,300 | |||
|
| |||
Total income | 37,149,147 | |||
|
| |||
EXPENSES | ||||
Investment management fees | 8,028,324 | |||
Distribution fees - Class B | 2,651,227 | |||
Administrative fees | 2,254,265 | |||
Printing and mailing expenses | 191,957 | |||
Custodian fees | 177,500 | |||
Professional fees | 101,651 | |||
Interest expense | 99,143 | |||
Distribution fees - Class A | 95,607 | |||
Trustees’ fees | 37,706 | |||
Miscellaneous | 82,547 | |||
|
| |||
Total expenses | 13,719,927 | |||
|
| |||
NET INVESTMENT INCOME (LOSS) | 23,429,220 | |||
|
| |||
REALIZED AND UNREALIZED GAIN (LOSS) | ||||
Realized gain (loss) on: | ||||
Investments | 20,623,979 | |||
Futures | 4,918,107 | |||
Foreign currency transactions | 2,257,494 | |||
Options written | 84,894 | |||
Securities sold short | 1,229,757 | |||
|
| |||
Net realized gain (loss) | 29,114,231 | |||
|
| |||
Change in unrealized appreciation (depreciation) on: | ||||
Investments | (97,255,211 | ) | ||
Futures | 187,966 | |||
Foreign currency translations | 852,859 | |||
Options written | (1,359 | ) | ||
Securities sold short | 151,529 | |||
|
| |||
Net change in unrealized appreciation (depreciation) | (96,064,216 | ) | ||
|
| |||
NET REALIZED AND UNREALIZED GAIN (LOSS) | (66,949,985 | ) | ||
|
| |||
NET INCREASE (DECREASE) IN NET ASSETS RESULTING FROM OPERATIONS | $ | (43,520,765 | ) | |
|
|
See Notes to Financial Statements.
60
AXA PREMIER VIP TRUST
MULTIMANAGER CORE BOND PORTFOLIO
STATEMENT OF CHANGES IN NET ASSETS
| Year Ended December 31, | ||||||||
| 2013 | 2012 | |||||||
INCREASE (DECREASE) IN NET ASSETS FROM OPERATIONS: | ||||||||
Net investment income (loss) | $ | 23,429,220 | $ | 38,554,969 | ||||
Net realized gain (loss) on investments, securities sold short, options written, futures and foreign currency transactions | 29,114,231 | 65,707,572 | ||||||
Net change in unrealized appreciation (depreciation) on investments, securities sold short, options written, futures and foreign currency translations | (96,064,216 | ) | 9,670,932 | |||||
|
|
|
| |||||
NET INCREASE (DECREASE) IN NET ASSETS RESULTING FROM OPERATIONS | (43,520,765 | ) | 113,933,473 | |||||
|
|
|
| |||||
DIVIDENDS AND DISTRIBUTIONS: | ||||||||
Dividends from net investment income | ||||||||
Class A | (583,540 | ) | (885,943 | ) | ||||
Class B | (16,209,460 | ) | (33,873,146 | ) | ||||
Class K | (6,822,629 | ) | (10,027,620 | ) | ||||
|
|
|
| |||||
| (23,615,629 | ) | (44,786,709 | ) | |||||
|
|
|
| |||||
Distributions from net realized capital gains | ||||||||
Class A | (99,729 | ) | (2,019,975 | ) | ||||
Class B | (777,785 | ) | (80,138,257 | ) | ||||
Class K | (1,048,369 | ) | (17,683,787 | ) | ||||
|
|
|
| |||||
| (1,925,883 | ) | (99,842,019 | ) | |||||
|
|
|
| |||||
TOTAL DIVIDENDS AND DISTRIBUTIONS | (25,541,512 | ) | (144,628,728 | ) | ||||
|
|
|
| |||||
CAPITAL SHARES TRANSACTIONS: | ||||||||
Class A | ||||||||
Capital shares sold [ 625,663 and 587,138 shares, respectively ] | 6,296,054 | 6,241,327 | ||||||
Capital shares issued in reinvestment of dividends and distributions [ 68,132 and 278,806 shares, respectively ] | 683,269 | 2,905,918 | ||||||
Capital shares repurchased [ (969,640) and (786,991) shares, respectively ] | (9,799,676 | ) | (8,310,613 | ) | ||||
|
|
|
| |||||
Total Class A transactions | (2,820,353 | ) | 836,632 | |||||
|
|
|
| |||||
Class B | ||||||||
Capital shares sold [ 14,254,119 and 40,462,307 shares, respectively ] | 145,274,207 | 429,425,805 | ||||||
Capital shares issued in reinvestment of dividends and distributions [ 1,676,522 and 10,923,779 shares, respectively ] | 16,987,245 | 114,011,403 | ||||||
Capital shares repurchased [ (35,500,361) and (25,671,893) shares, respectively ] | (361,630,662 | ) | (272,133,380 | ) | ||||
Capital shares repurchased in-kind (Note 10)[ (123,318,096) and 0 shares, respectively ] | (1,233,559,078 | ) | — | |||||
|
|
|
| |||||
Total Class B transactions | (1,432,928,288 | ) | 271,303,828 | |||||
|
|
|
| |||||
Class K | ||||||||
Capital shares sold [ 6,507,127 and 3,288,228 shares, respectively ] | 65,701,610 | 34,728,605 | ||||||
Capital shares issued in reinvestment of dividends and distributions [ 784,690 and 2,656,002 shares, respectively ] | 7,870,998 | 27,711,407 | ||||||
Capital shares repurchased [ (6,154,929) and (96,290,582) shares, respectively ] | (61,933,454 | ) | (1,009,828,974 | ) | ||||
|
|
|
| |||||
Total Class K transactions | 11,639,154 | (947,388,962 | ) | |||||
|
|
|
| |||||
NET INCREASE (DECREASE) IN NET ASSETS RESULTING FROM CAPITAL SHARE TRANSACTIONS | (1,424,109,487 | ) | (675,248,502 | ) | ||||
|
|
|
| |||||
TOTAL INCREASE (DECREASE) IN NET ASSETS | (1,493,171,764 | ) | (705,943,757 | ) | ||||
NET ASSETS: | ||||||||
Beginning of year | 2,195,393,028 | 2,901,336,785 | ||||||
|
|
|
| |||||
End of year (a) | $ | 702,221,264 | $ | 2,195,393,028 | ||||
|
|
|
|
| ||||
(a) Includes accumulated undistributed (overdistributed) net investment income (loss) of | $ | 930,944 | $ | (1,493,491 | ) | |||
|
|
|
| |||||
See Notes to Financial Statements.
61
AXA PREMIER VIP TRUST
MULTIMANAGER CORE BOND PORTFOLIO
FINANCIAL HIGHLIGHTS
| Year Ended December 31, | ||||||||||||||||||||
| Class A | 2013 | 2012 | 2011 | 2010 | 2009 | |||||||||||||||
Net asset value, beginning of year | $ | 10.29 | $ | 10.44 | $ | 10.48 | $ | 10.27 | $ | 9.86 | ||||||||||
|
|
|
|
|
|
|
|
|
| |||||||||||
Income (loss) from investment operations: | ||||||||||||||||||||
Net investment income (loss) | 0.15 | (e) | 0.19 | (e) | 0.24 | (e) | 0.30 | (e) | 0.36 | (e) | ||||||||||
Net realized and unrealized gain (loss) on investments, securities sold short, options written, futures and foreign currency transactions | (0.38 | ) | 0.38 | 0.39 | 0.37 | 0.46 | ||||||||||||||
|
|
|
|
|
|
|
|
|
| |||||||||||
Total from investment operations | (0.23 | ) | 0.57 | 0.63 | 0.67 | 0.82 | ||||||||||||||
|
|
|
|
|
|
|
|
|
| |||||||||||
Less distributions: | ||||||||||||||||||||
Dividends from net investment income | (0.16 | ) | (0.22 | ) | (0.30 | ) | (0.32 | ) | (0.38 | ) | ||||||||||
Distributions from net realized gains | (0.03 | ) | (0.50 | ) | (0.37 | ) | (0.14 | ) | (0.03 | ) | ||||||||||
|
|
|
|
|
|
|
|
|
| |||||||||||
Total dividends and distributions | (0.19 | ) | (0.72 | ) | (0.67 | ) | (0.46 | ) | (0.41 | ) | ||||||||||
|
|
|
|
|
|
|
|
|
| |||||||||||
Net asset value, end of year | $ | 9.87 | $ | 10.29 | $ | 10.44 | $ | 10.48 | $ | 10.27 | ||||||||||
|
|
|
|
|
|
|
|
|
| |||||||||||
Total return | (2.33 | )% | 5.50 | % | 6.10 | % | 6.60 | % | 8.44 | % | ||||||||||
|
|
|
|
|
|
|
|
|
| |||||||||||
Ratios/Supplemental Data: | ||||||||||||||||||||
Net assets, end of year (000’s) | $ | 37,566 | $ | 41,985 | $ | 41,783 | $ | 2,826,132 | $ | 2,796,284 | ||||||||||
Ratio of expenses to average net assets: | 1.00 | % | 0.98 | % | 0.69 | % | 0.69 | % | 0.71 | % | ||||||||||
Ratio of net investment income (loss) to average net assets: | 1.52 | % | 1.77 | % | 2.28 | % | 2.80 | % | 3.51 | % | ||||||||||
Portfolio turnover rate | 410 | % | 376 | % | 384 | % | 492 | % | 623 | % | ||||||||||
| Year Ended December 31, | ||||||||||||||||||||
| Class B | 2013 | 2012 | 2011 | 2010 | 2009 | |||||||||||||||
Net asset value, beginning of year | $ | 10.31 | $ | 10.46 | $ | 10.50 | $ | 10.29 | $ | 9.88 | ||||||||||
|
|
|
|
|
|
|
|
|
| |||||||||||
Income (loss) from investment operations: | ||||||||||||||||||||
Net investment income (loss) | 0.15 | (e) | 0.19 | (e) | 0.23 | (e) | 0.27 | (e) | 0.33 | (e) | ||||||||||
Net realized and unrealized gain (loss) on investments, securities sold short, options written, futures and foreign currency transactions | (0.38 | ) | 0.38 | 0.37 | 0.38 | 0.47 | ||||||||||||||
|
|
|
|
|
|
|
|
|
| |||||||||||
Total from investment operations | (0.23 | ) | 0.57 | 0.60 | 0.65 | 0.80 | ||||||||||||||
|
|
|
|
|
|
|
|
|
| |||||||||||
Less distributions: | ||||||||||||||||||||
Dividends from net investment income | (0.16 | ) | (0.22 | ) | (0.27 | ) | (0.30 | ) | (0.36 | ) | ||||||||||
Distributions from net realized gains | (0.03 | ) | (0.50 | ) | (0.37 | ) | (0.14 | ) | (0.03 | ) | ||||||||||
|
|
|
|
|
|
|
|
|
| |||||||||||
Total dividends and distributions | (0.19 | ) | (0.72 | ) | (0.64 | ) | (0.44 | ) | (0.39 | ) | ||||||||||
|
|
|
|
|
|
|
|
|
| |||||||||||
Net asset value, end of year | $ | 9.89 | $ | 10.31 | $ | 10.46 | $ | 10.50 | $ | 10.29 | ||||||||||
|
|
|
|
|
|
|
|
|
| |||||||||||
Total return | (2.31 | )% | 5.50 | % | 5.83 | % | 6.33 | % | 8.16 | % | ||||||||||
|
|
|
|
|
|
|
|
|
| |||||||||||
Ratios/Supplemental Data: | ||||||||||||||||||||
Net assets, end of year (000’s) | $ | 291,699 | $ | 1,776,443 | $ | 1,533,747 | $ | 1,388,875 | $ | 1,252,270 | ||||||||||
Ratio of expenses to average net assets: | 1.00 | % | 0.98 | % | 0.94 | % | 0.94 | % | 0.96 | % | ||||||||||
Ratio of net investment income (loss) to average net assets: | 1.52 | % | 1.76 | % | 2.19 | % | 2.55 | % | 3.25 | % | ||||||||||
Portfolio turnover rate | 410 | % | 376 | % | 384 | % | 492 | % | 623 | % | ||||||||||
See Notes to Financial Statements.
62
AXA PREMIER VIP TRUST
MULTIMANAGER CORE BOND PORTFOLIO
FINANCIAL HIGHLIGHTS (Continued)
| Year Ended December 31, | August 26, 2011* to December 31, 2011 | |||||||||||
| Class K | 2013 | 2012 | ||||||||||
Net asset value, beginning of period | $ | 10.29 | $ | 10.44 | $ | 10.81 | ||||||
|
|
|
|
|
| |||||||
Income (loss) from investment operations: | ||||||||||||
Net investment income (loss) | 0.18 | (e) | 0.22 | (e) | 0.11 | (e) | ||||||
Net realized and unrealized gain (loss) on investments, securities sold short, options written, futures and foreign currency transactions | (0.39 | ) | 0.38 | 0.02 | ||||||||
|
|
|
|
|
| |||||||
Total from investment operations | (0.21 | ) | 0.60 | 0.13 | ||||||||
|
|
|
|
|
| |||||||
Less distributions: | ||||||||||||
Dividends from net investment income | (0.18 | ) | (0.25 | ) | (0.13 | ) | ||||||
Distributions from net realized gains | (0.03 | ) | (0.50 | ) | (0.37 | ) | ||||||
|
|
|
|
|
| |||||||
Total dividends and distributions | (0.21 | ) | (0.75 | ) | (0.50 | ) | ||||||
|
|
|
|
|
| |||||||
Net asset value, end of period | $ | 9.87 | $ | 10.29 | $ | 10.44 | ||||||
|
|
|
|
|
| |||||||
Total return (b) | (2.08 | )% | 5.76 | % | 1.17 | % | ||||||
|
|
|
|
|
| |||||||
Ratios/Supplemental Data: | ||||||||||||
Net assets, end of period (000’s) | $ | 372,956 | $ | 376,965 | $ | 1,325,807 | ||||||
Ratio of expenses to average net assets (a): | 0.75 | % | 0.72 | % | 0.69 | % | ||||||
Ratio of net investment income (loss) to average net assets (a): | 1.77 | % | 2.06 | % | 2.78 | % | ||||||
Portfolio turnover rate | 410 | % | 376 | % | 384 | % | ||||||
| * | Commencement of Operations. |
| (a) | Ratios for periods less than one year are annualized. |
| (b) | Total returns for periods less than one year are not annualized. |
| (e) | Net investment income (loss) per share is based on average shares outstanding. |
See Notes to Financial Statements.
63
MULTIMANAGER INTERNATIONAL EQUITY PORTFOLIO (Unaudited)
PORTFOLIO ADVISERS
| Ø | BlackRock Investment Management, LLC |
| Ø | EARNEST Partners, LLC |
| Ø | J.P. Morgan Investment Management Inc. |
| Ø | Marsico Capital Management, LLC |
PERFORMANCE RESULTS
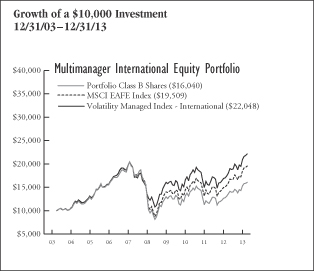
| Annualized Total Returns as of 12/31/13 | ||||||||||||
1 Year | 5 Years | 10 Years/ Incept. | ||||||||||
Portfolio – Class A Shares* | 18.18 | % | 9.83 | % | 5.05 | % | ||||||
Portfolio – Class B Shares* | 18.10 | 9.66 | 4.84 | |||||||||
Portfolio – Class K Shares** | 18.48 | N/A | 12.78 | |||||||||
MSCI EAFE Index | 22.78 | 12.44 | 6.91 | |||||||||
40% DJ Euro STOXX 50/ | ||||||||||||
25% FTSE 100/25% TOPIX/10% S&P/ASX 200 | 23.45 | 11.29 | N/A | |||||||||
Volatility Managed Index – International | 22.66 | 11.27 | 8.23 | |||||||||
Volatility Managed Index – International Proxy | 23.67 | 10.88 | N/A | |||||||||
* Date of inception 12/31/01.
** Date of inception 8/26/11.
Returns for periods greater than one year are annualized. |
| |||||||||||
Past performance is not indicative of future results.
PERFORMANCE SUMMARY
The Portfolio’s Class A shares returned 18.18% for the year ended December 31, 2013. The Portfolio’s benchmarks, the MSCI EAFE Index, returned 22.78%, the 40% DJ Euro STOXX 50/25% FTSE 100/25% TOPIX/10% S&P/ASX 200 index returned 23.45%, and the Volatility Managed Index — International returned 22.66%, the Volatility Managed Index — International Proxy returned 23.67% over the same period.
The following commentary describes key factors (such as stock selection and sector allocation decisions) that helped or hurt the Portfolio’s performance relative to its primary benchmark.
Portfolio Highlights
For the year ended December 31, 2013
What helped performance during the year:
| • | Materials was the weakest-performing sector of the benchmark and the Portfolio benefited from a relative underweight position in the sector. |
| • | Stock selection was strongest in the Energy sector, led by a position in Core Laboratories N.V. |
| • | Information Technology sector holdings Yandex N.V., ARM Holdings plc, MasterCard, Inc. and Amadeus IT Holding S.A. all added to relative performance. |
| • | Sector-wise, underweight allocations in Utilities and Consumer Staples aided returns. |
| • | In the Consumer Discretionary sector, Rakuten Inc., a Japan-based e-commerce company, posted a strong return as consumer spending improved. South African based Naspers Limited also added to relative returns. |
What hurt performance during the year:
| • | Stock selection in Financials was the leading detractor from relative performance. In the sector, India based YES Bank Ltd. was a notable detractor. |
| • | From a sector allocation perspective, the Portfolio’s performance was hampered by having an underweight allocation to the Telecommunication Services sector, as it was the strongest-performing sector of the benchmark. |
| • | Stock selection in the Industrials and Consumer Discretionary sectors also detracted from performance. |
| • | Another notable individual detractor was Samsung Electronics, which was not a benchmark component, and relative underweight allocations to Softbank Corp. and Vodafone Group. |
64
MULTIMANAGER INTERNATIONAL EQUITY PORTFOLIO (Unaudited)
| Sector Weightings as of December 31, 2013 | % of Net Assets | |||
Financials | 16.9 | % | ||
Consumer Discretionary | 13.2 | |||
Industrials | 9.4 | |||
Health Care | 8.9 | |||
Information Technology | 8.5 | |||
Energy | 7.4 | |||
Consumer Staples | 6.4 | |||
Materials | 5.8 | |||
Telecommunication Services | 2.4 | |||
Utilities | 1.2 | |||
Exchange Traded Funds | 0.2 | |||
Cash and Other | 19.7 | |||
|
| |||
| 100.0 | % | |||
|
| |||
UNDERSTANDING YOUR EXPENSES:
As a shareholder of the Portfolio, you incur two types of costs:
(1)transaction costs, including applicable sales charges and redemption fees; and (2)ongoing costs, including management fees, distribution (12b-1) fees (in the case of Class A and Class B shares of the Trust), and other Portfolio expenses. These examples are intended to help you understand your ongoing costs (in dollars) of investing in the Portfolio and to compare these costs with the ongoing costs of investing in other mutual funds.
The examples are based on an investment of $1,000 invested at the beginning of the six-month period ended December 31, 2013 and held for the entire six-month period.
Actual Expenses
The first line of the table to the right provides information about actual account values and actual expenses. You may use the information in this line, together with the amount you invested, to estimate the expenses that you paid over the period. Simply divide your account value by $1,000 (for example, an $8,600 account value divided by $1,000 = 8.6), then multiply the result by the number in the first line under the heading entitled ‘‘Expenses Paid During Period’’ to estimate the expenses you paid on your account during this period.
Hypothetical Example for Comparison Purposes
The second line of the table below provides information about hypothetical account values and hypothetical expenses based on the Portfolio’s actual expense ratio and an assumed rate of return of 5% per year before expenses, which is not the Portfolio’s actual return. The hypothetical account values and expenses may not be used to estimate the actual ending account balance or expenses you paid for the period. You may use this information to compare the ongoing costs of investing in the Portfolio and other funds. To do so, compare this 5% hypothetical example with the 5% hypothetical examples that appear in the shareholder reports of the other funds.
Please note that the expenses shown in the table are meant to highlight your ongoing costs only and do not reflect any transactional costs, such as sales charges (loads), redemption fees, or exchange fees. Therefore, the second line of the table is useful in comparing ongoing costs only, and will not help you determine the relative total costs of owning different funds. In addition, if these transactional costs were included, your costs would have been higher. Also note that the table does not reflect any variable life insurance or variable annuity contract-related fees and expenses, which would increase overall fees and expenses.
EXAMPLE
Beginning Account Value 7/1/13 | Ending Account Value 12/31/13 | Expenses Paid During Period* 12/31/13 | ||||||||||
Class A | ||||||||||||
Actual | $1,000.00 | $1,161.50 | $7.09 | |||||||||
Hypothetical (5% average annual return before expenses) | 1,000.00 | 1,018.65 | 6.62 | |||||||||
Class B | ||||||||||||
Actual | 1,000.00 | 1,161.78 | 7.09 | |||||||||
Hypothetical (5% average annual return before expenses) | 1,000.00 | 1,018.65 | 6.62 | |||||||||
Class K | ||||||||||||
Actual | 1,000.00 | 1,163.33 | 5.73 | |||||||||
Hypothetical (5% average annual return before expenses) | 1,000.00 | 1,019.91 | 5.35 | |||||||||
* Expenses are equal to the Portfolio’s Class A, Class B and Class K shares annualized expense ratios of 1.30%, 1.30% and 1.05%, respectively, multiplied by the average account value over the period, and multiplied by 184/365 (to reflect the one-half year period). |
| |||||||||||
65
AXA PREMIER VIP TRUST
MULTIMANAGER INTERNATIONAL EQUITY PORTFOLIO
PORTFOLIO OF INVESTMENTS
December 31, 2013
| Number of Shares | Value (Note 1) | |||||||
COMMON STOCKS: | ||||||||
Argentina (0.2%) | ||||||||
MercadoLibre, Inc. | 5,323 | $ | 573,766 | |||||
|
| |||||||
Australia (3.1%) | ||||||||
AGL Energy Ltd. | 4,677 | 62,767 | ||||||
ALS Ltd. | 3,778 | 29,719 | ||||||
Alumina Ltd.* | 23,455 | 23,351 | ||||||
Amcor Ltd. | 10,554 | 99,420 | ||||||
AMP Ltd. | 25,757 | 100,963 | ||||||
APA Group | 6,581 | 35,257 | ||||||
Asciano Ltd. | 7,632 | 39,252 | ||||||
ASX Ltd. | 1,581 | 51,893 | ||||||
Aurizon Holdings Ltd. | 17,277 | 75,282 | ||||||
Australia & New Zealand Banking Group Ltd. | 24,028 | 691,482 | ||||||
Bank of Queensland Ltd. | 2,434 | 26,428 | ||||||
Bendigo and Adelaide Bank Ltd. | 3,990 | 41,861 | ||||||
BHP Billiton Ltd. | 53,554 | 1,816,620 | ||||||
BHP Billiton Ltd. (ADR) | 16,062 | 1,095,428 | ||||||
Boral Ltd. (b) | 7,581 | 32,289 | ||||||
Brambles Ltd. | 13,623 | 111,300 | ||||||
Caltex Australia Ltd. | 1,314 | 23,524 | ||||||
CFS Retail Property Trust Group (REIT) | 20,372 | 35,380 | ||||||
Coca-Cola Amatil Ltd. | 4,721 | 50,711 | ||||||
Cochlear Ltd. | 530 | 27,883 | ||||||
Commonwealth Bank of Australia | 14,116 | 980,605 | ||||||
Computershare Ltd. | 4,643 | 47,178 | ||||||
Crown Resorts Ltd. | 3,801 | 57,187 | ||||||
CSL Ltd. | 4,305 | 265,078 | ||||||
Dexus Property Group (REIT) | 37,629 | 33,767 | ||||||
Echo Entertainment Group Ltd. | 7,243 | 15,910 | ||||||
Federation Centres Ltd. (REIT) | 14,183 | 29,634 | ||||||
Flight Centre Travel Group Ltd. | 584 | 24,795 | ||||||
Fortescue Metals Group Ltd. | 13,057 | 67,853 | ||||||
Goodman Group (REIT) | 14,416 | 60,885 | ||||||
GPT Group (REIT) | 13,986 | 42,460 | ||||||
Harvey Norman Holdings Ltd. | 5,804 | 16,376 | ||||||
Iluka Resources Ltd. | 3,850 | 29,667 | ||||||
Incitec Pivot Ltd. | 15,770 | 37,737 | ||||||
Insurance Australia Group Ltd. | 18,183 | 94,491 | ||||||
Leighton Holdings Ltd. | 1,510 | 21,721 | ||||||
Lend Lease Group | 4,267 | 42,443 | ||||||
Macquarie Group Ltd. | 2,525 | 123,917 | ||||||
Metcash Ltd. | 8,915 | 25,154 | ||||||
Mirvac Group (REIT) | 30,290 | 45,437 | ||||||
National Australia Bank Ltd. | 20,517 | 638,073 | ||||||
Newcrest Mining Ltd. | 6,569 | 45,751 | ||||||
Orica Ltd. | 3,035 | 64,659 | ||||||
Origin Energy Ltd. | 9,606 | 120,681 | ||||||
Qantas Airways Ltd.* | 9,940 | 9,719 | ||||||
QBE Insurance Group Ltd. | 10,500 | 107,911 | ||||||
Ramsay Health Care Ltd. | 1,200 | 46,352 | ||||||
REA Group Ltd. | 348 | 11,733 | ||||||
Rio Tinto Ltd. | 10,776 | 656,021 | ||||||
Santos Ltd. | 8,457 | 110,475 | ||||||
Seek Ltd. | 3,069 | 36,748 | ||||||
Sonic Healthcare Ltd. | 3,562 | 52,733 | ||||||
SP AusNet | 16,117 | 17,917 | ||||||
Stockland Corp., Ltd. (REIT) | 21,500 | 69,302 | ||||||
Suncorp Group Ltd. | 11,257 | 131,673 | ||||||
Sydney Airport | 8,967 | $ | 30,425 | |||||
Tabcorp Holdings Ltd. | 6,766 | 21,930 | ||||||
Tatts Group Ltd. | 10,563 | 29,238 | ||||||
Telstra Corp., Ltd. | 38,112 | 178,659 | ||||||
Toll Holdings Ltd. | 5,143 | 26,084 | ||||||
Transurban Group | 12,050 | 73,595 | ||||||
Treasury Wine Estates Ltd. | 6,195 | 26,662 | ||||||
Wesfarmers Ltd. | 8,703 | 342,231 | ||||||
Westfield Group (REIT) | 18,242 | 164,349 | ||||||
Westfield Retail Trust (REIT) | 26,412 | 70,042 | ||||||
Westpac Banking Corp. | 27,179 | 785,802 | ||||||
Woodside Petroleum Ltd. | 5,769 | 200,379 | ||||||
Woolworths Ltd. | 10,905 | 329,600 | ||||||
WorleyParsons Ltd. | 1,998 | 29,615 | ||||||
|
| |||||||
| 10,961,464 | ||||||||
|
| |||||||
Austria (1.0%) | ||||||||
Andritz AG | 578 | 36,251 | ||||||
Conwert Immobilien Invest SE* | 45,537 | 584,417 | ||||||
Erste Group Bank AG | 32,888 | 1,146,031 | ||||||
Immofinanz AG* | 7,346 | 34,037 | ||||||
OMV AG | 1,237 | 59,204 | ||||||
Raiffeisen Bank International AG | 441 | 15,543 | ||||||
Schoeller-Bleckmann Oilfield Equipment AG | 13,247 | 1,468,117 | ||||||
Telekom Austria AG | 1,808 | 13,690 | ||||||
Vienna Insurance Group AG Wiener Versicherung Gruppe | 350 | 17,442 | ||||||
Voestalpine AG | 921 | 44,257 | ||||||
|
| |||||||
| 3,418,989 | ||||||||
|
| |||||||
Belgium (0.6%) | ||||||||
Ageas | 2,009 | 85,539 | ||||||
Anheuser-Busch InBev N.V. | 13,418 | 1,426,153 | ||||||
Belgacom S.A. | 1,410 | 41,714 | ||||||
Colruyt S.A. | 601 | 33,551 | ||||||
Delhaize Group S.A. | 957 | 56,875 | ||||||
Groupe Bruxelles Lambert S.A. | 671 | 61,598 | ||||||
KBC Groep N.V. | 2,128 | 120,759 | ||||||
Solvay S.A. | 514 | 81,318 | ||||||
Telenet Group Holding N.V. | 502 | 29,955 | ||||||
UCB S.A. | 905 | 67,405 | ||||||
Umicore S.A. | 903 | 42,181 | ||||||
|
| |||||||
| 2,047,048 | ||||||||
|
| |||||||
Bermuda (0.5%) | ||||||||
Everest Reinsurance Group Ltd. | 10,267 | 1,600,317 | ||||||
Seadrill Ltd. | 3,285 | 134,102 | ||||||
|
| |||||||
| 1,734,419 | ||||||||
|
| |||||||
Brazil (0.6%) | ||||||||
Banco Bradesco S.A. (ADR) | 49,589 | 621,350 | ||||||
Banco do Brasil S.A. | 71,200 | 736,370 | ||||||
BR Malls Participacoes S.A. | 89,700 | 648,250 | ||||||
|
| |||||||
| 2,005,970 | ||||||||
|
| |||||||
Canada (2.3%) | ||||||||
Canadian Pacific Railway Ltd. | 16,354 | 2,473,307 | ||||||
Dollarama, Inc. | 8,024 | 666,319 | ||||||
Imax Corp.* | 22,722 | 669,845 | ||||||
Lululemon Athletica, Inc.* | 32,483 | 1,917,471 | ||||||
See Notes to Financial Statements.
66
AXA PREMIER VIP TRUST
MULTIMANAGER INTERNATIONAL EQUITY PORTFOLIO
PORTFOLIO OF INVESTMENTS (Continued)
December 31, 2013
| Number of Shares | Value (Note 1) | |||||||
Rogers Communications, Inc., Class B | 14,241 | $ | 644,405 | |||||
Suncor Energy, Inc. | 52,680 | 1,846,837 | ||||||
|
| |||||||
| 8,218,184 | ||||||||
|
| |||||||
China (2.5%) | ||||||||
Anhui Conch Cement Co., Ltd., Class H | 248,500 | 921,344 | ||||||
Anton Oilfield Services Group/ | 48,000 | 29,217 | ||||||
China Construction Bank Corp., Class H | 524,000 | 395,316 | ||||||
China Oilfield Services Ltd., Class H | 539,500 | 1,673,262 | ||||||
China Shipping Container Lines Co., Ltd., Class H* | 2,047,000 | 533,245 | ||||||
CNOOC Ltd. | 237,000 | 440,728 | ||||||
Daphne International Holdings Ltd. | 718,000 | 323,152 | ||||||
Industrial & Commercial Bank of China Ltd., Class H | 1,394,135 | 942,093 | ||||||
Mindray Medical International Ltd. (ADR) | 25,335 | 921,181 | ||||||
Ping An Insurance Group Co. of China Ltd., Class H | 38,500 | 344,818 | ||||||
Qunar Cayman Islands Ltd. (ADR)* | 23,099 | 612,817 | ||||||
Weichai Power Co., Ltd., Class H | 262,080 | 1,056,188 | ||||||
Yangzijiang Shipbuilding Holdings Ltd. | 16,182 | 15,195 | ||||||
Youku Tudou, Inc. (ADR)* | 25,991 | 787,527 | ||||||
|
| |||||||
| 8,996,083 | ||||||||
|
| |||||||
Colombia (0.2%) | ||||||||
Bancolombia S.A. (ADR) | 14,406 | 706,182 | ||||||
|
| |||||||
Czech Republic (0.2%) | ||||||||
Komercni Banka A/S | 2,981 | 663,617 | ||||||
|
| |||||||
Denmark (0.5%) | ||||||||
A. P. Moller - Maersk A/S, Class A | 4 | 41,234 | ||||||
A. P. Moller - Maersk A/S, Class B | 11 | 119,377 | ||||||
Carlsberg A/S, Class B | 936 | 103,564 | ||||||
Coloplast A/S, Class B | 933 | 61,767 | ||||||
Danske Bank A/S* | 5,736 | 131,586 | ||||||
DSV A/S | 1,443 | 47,313 | ||||||
Novo Nordisk A/S, Class B | 5,357 | 981,948 | ||||||
Novozymes A/S, Class B | 1,962 | 82,818 | ||||||
TDC A/S | 6,880 | 66,735 | ||||||
Tryg A/S | 223 | 21,569 | ||||||
William Demant Holding A/S* | 233 | 22,643 | ||||||
|
| |||||||
| 1,680,554 | ||||||||
|
| |||||||
Finland (0.3%) | ||||||||
Elisa Oyj | 1,419 | 37,598 | ||||||
Fortum Oyj | 3,884 | 88,858 | ||||||
Kone Oyj, Class B | 2,726 | 123,005 | ||||||
Metso Oyj | 1,241 | 52,959 | ||||||
Neste Oil Oyj | 1,168 | 23,090 | ||||||
Nokia Oyj* | 32,778 | 262,440 | ||||||
Nokian Renkaat Oyj | 1,053 | 50,513 | ||||||
Orion Oyj, Class B | 887 | $ | 24,917 | |||||
Pohjola Bank plc, Class A | 1,307 | 26,287 | ||||||
Sampo Oyj, Class A | 3,667 | 180,196 | ||||||
Stora Enso Oyj, Class R | 4,992 | 50,098 | ||||||
UPM-Kymmene Oyj | 4,422 | 74,704 | ||||||
Wartsila Oyj | 1,523 | 74,945 | ||||||
|
| |||||||
| 1,069,610 | ||||||||
|
| |||||||
France (5.3%) | ||||||||
Accor S.A. | 11,715 | 552,790 | ||||||
Aeroports de Paris S.A. | 284 | 32,233 | ||||||
Air Liquide S.A. | 2,729 | 385,941 | ||||||
Airbus Group N.V. | 5,094 | 391,106 | ||||||
Alcatel-Lucent* | 23,253 | 104,221 | ||||||
Alstom S.A. | 1,798 | 65,486 | ||||||
Arkema S.A. | 524 | 61,122 | ||||||
AtoS | 562 | 50,865 | ||||||
AXA S.A.‡ | 15,703 | 436,589 | ||||||
BNP Paribas S.A. | 14,714 | 1,146,712 | ||||||
Bouygues S.A. | 1,540 | 58,091 | ||||||
Bureau Veritas S.A. | 1,845 | 53,923 | ||||||
Cap Gemini S.A. | 1,199 | 81,038 | ||||||
Carrefour S.A. | 5,276 | 209,109 | ||||||
Casino Guichard Perrachon S.A. | 539 | 62,116 | ||||||
CGG S.A.* | 1,486 | 25,717 | ||||||
Christian Dior S.A. | 477 | 90,130 | ||||||
Cie de Saint-Gobain S.A. | 3,486 | 191,708 | ||||||
Cie Generale des Etablissements Michelin | 1,598 | 169,824 | ||||||
CNP Assurances S.A. | 1,397 | 28,636 | ||||||
Credit Agricole S.A.* | 8,738 | 111,854 | ||||||
Criteo S.A. (ADR)* | 7,492 | 256,226 | ||||||
Danone S.A. | 5,006 | 360,315 | ||||||
Dassault Systemes S.A. | 532 | 66,037 | ||||||
Edenred | 1,647 | 55,126 | ||||||
EDF S.A. | 2,255 | 79,680 | ||||||
Essilor International S.A. | 4,729 | 502,759 | ||||||
Eurazeo S.A. | 270 | 21,165 | ||||||
Eutelsat Communications S.A. | 1,400 | 43,652 | ||||||
Fonciere des Regions (REIT) | 287 | 24,775 | ||||||
GDF Suez S.A. | 11,617 | 273,204 | ||||||
Gecina S.A. (REIT) | 211 | 27,875 | ||||||
Groupe Eurotunnel S.A. (Registered) | 5,257 | 55,253 | ||||||
Groupe Fnac* | 92 | 3,017 | ||||||
ICADE (REIT) | 345 | 32,117 | ||||||
Iliad S.A. | 212 | 43,426 | ||||||
Imerys S.A. | 4,306 | 374,441 | ||||||
J.C. Decaux S.A. | 594 | 24,490 | ||||||
Kering | 2,849 | 602,211 | ||||||
Klepierre S.A. (REIT) | 975 | 45,182 | ||||||
Lafarge S.A. | 6,902 | 517,197 | ||||||
Lagardere S.C.A. | 1,020 | 37,915 | ||||||
Legrand S.A. | 2,236 | 123,227 | ||||||
L’Oreal S.A. | 2,117 | 371,908 | ||||||
LVMH Moet Hennessy Louis Vuitton S.A. | 4,918 | 897,131 | ||||||
Natixis S.A. | 7,300 | 42,922 | ||||||
Orange S.A. | 16,229 | 200,936 | ||||||
Pernod-Ricard S.A. | 5,013 | 571,090 | ||||||
Publicis Groupe S.A. | 1,562 | 142,920 | ||||||
See Notes to Financial Statements.
67
AXA PREMIER VIP TRUST
MULTIMANAGER INTERNATIONAL EQUITY PORTFOLIO
PORTFOLIO OF INVESTMENTS (Continued)
December 31, 2013
| Number of Shares | Value (Note 1) | |||||||
Remy Cointreau S.A. | 11,001 | $ | 923,027 | |||||
Renault S.A. | 1,682 | 135,249 | ||||||
Rexel S.A. | 1,661 | 43,587 | ||||||
Safran S.A. | 2,316 | 160,931 | ||||||
Sanofi S.A. | 17,984 | 1,907,994 | ||||||
Schneider Electric S.A. | 11,264 | 982,439 | ||||||
SCOR SE | 1,231 | 44,988 | ||||||
Societe BIC S.A. | 290 | 35,531 | ||||||
Societe Generale S.A. | 24,356 | 1,414,647 | ||||||
Sodexo S.A. | 812 | 82,261 | ||||||
Suez Environnement Co. S.A. | 2,227 | 39,905 | ||||||
Technip S.A. | 6,469 | 621,712 | ||||||
Thales S.A. | 732 | 47,128 | ||||||
Total S.A. | 18,732 | 1,147,521 | ||||||
Unibail-Rodamco SE (REIT) | 846 | 216,766 | ||||||
Valeo S.A. | 620 | 68,602 | ||||||
Vallourec S.A. | 854 | 46,524 | ||||||
Veolia Environnement S.A. | 3,088 | 50,362 | ||||||
Vinci S.A. | 4,059 | 266,467 | ||||||
Vivendi S.A. | 10,438 | 275,057 | ||||||
Wendel S.A. | 258 | 37,605 | ||||||
Zodiac Aerospace | 270 | 47,823 | ||||||
|
| |||||||
| 18,701,534 | ||||||||
|
| |||||||
Germany (5.7%) | ||||||||
Adidas AG | 13,898 | 1,771,229 | ||||||
Allianz SE (Registered) | 7,937 | 1,423,283 | ||||||
Axel Springer SE | 356 | 22,871 | ||||||
BASF SE | 8,043 | 857,408 | ||||||
Bayer AG (Registered) | 12,114 | 1,699,020 | ||||||
Bayerische Motoren Werke (BMW) AG | 13,200 | 1,547,531 | ||||||
Bayerische Motoren Werke (BMW) AG (Preference) | 529 | 45,186 | ||||||
Beiersdorf AG | 870 | 88,137 | ||||||
Brenntag AG | 443 | 82,121 | ||||||
Celesio AG | 714 | 22,592 | ||||||
Commerzbank AG* | 8,464 | 136,350 | ||||||
Continental AG | 978 | 214,462 | ||||||
Daimler AG (Registered) | 8,424 | 728,942 | ||||||
Deutsche Bank AG (Registered) | 8,926 | 425,792 | ||||||
Deutsche Boerse AG | 1,688 | 139,795 | ||||||
Deutsche Lufthansa AG (Registered)* | 2,144 | 45,481 | ||||||
Deutsche Post AG (Registered) | 7,937 | 289,352 | ||||||
Deutsche Telekom AG (Registered) | 25,116 | 429,482 | ||||||
Deutsche Wohnen AG | 2,608 | 50,355 | ||||||
E.ON SE | 15,765 | 290,943 | ||||||
Fraport AG | 341 | 25,515 | ||||||
Fresenius Medical Care AG & Co. KGaA | 5,874 | 418,023 | ||||||
Fresenius SE & Co. KGaA | 1,093 | 167,806 | ||||||
Fuchs Petrolub SE (Preference) | 339 | 33,130 | ||||||
GEA Group AG | 1,711 | 81,442 | ||||||
Hannover Rueck SE | 570 | 48,915 | ||||||
HeidelbergCement AG | 1,230 | 93,320 | ||||||
Henkel AG & Co. KGaA | 1,136 | 118,210 | ||||||
Henkel AG & Co. KGaA (Preference) | 5,370 | 622,841 | ||||||
Hochtief AG | 288 | 24,588 | ||||||
Hugo Boss AG | 304 | $ | 43,285 | |||||
Infineon Technologies AG | 9,452 | 100,904 | ||||||
K+S AG (Registered) | 1,682 | 51,774 | ||||||
Kabel Deutschland Holding AG | 216 | 27,998 | ||||||
Lanxess AG | 662 | 44,147 | ||||||
Linde AG | 3,674 | 768,510 | ||||||
MAN SE | 341 | 41,868 | ||||||
Merck KGaA | 565 | 101,240 | ||||||
Metro AG | 1,193 | 57,771 | ||||||
Muenchener Rueckversicherungs AG (Registered) | 1,570 | 345,900 | ||||||
OSRAM Licht AG* | 766 | 43,205 | ||||||
Porsche Automobil Holding SE (Preference) | 1,339 | 139,371 | ||||||
ProSiebenSat.1 Media AG (Registered) | 1,532 | 75,873 | ||||||
RWE AG | 4,282 | 156,723 | ||||||
SAP AG | 19,045 | 1,632,535 | ||||||
Siemens AG (Registered) | 10,439 | 1,425,897 | ||||||
Sky Deutschland AG* | 3,415 | 37,584 | ||||||
Suedzucker AG | 789 | 21,296 | ||||||
Telefonica Deutschland Holding AG | 2,653 | 21,898 | ||||||
ThyssenKrupp AG* | 3,351 | 81,550 | ||||||
United Internet AG (Registered) | 1,020 | 43,387 | ||||||
Volkswagen AG | 244 | 66,094 | ||||||
Volkswagen AG (Preference) | 4,148 | 1,164,962 | ||||||
Wirecard AG | 43,811 | 1,730,676 | ||||||
|
| |||||||
| 20,168,570 | ||||||||
|
| |||||||
Hong Kong (2.1%) | ||||||||
AIA Group Ltd. | 472,327 | 2,369,462 | ||||||
ASM Pacific Technology Ltd. | 2,300 | 19,250 | ||||||
Bank of East Asia Ltd. | 11,847 | 50,188 | ||||||
Belle International Holdings Ltd. | 133,000 | 153,851 | ||||||
BOC Hong Kong Holdings Ltd. | 32,500 | 104,152 | ||||||
Cathay Pacific Airways Ltd. | 11,000 | 23,264 | ||||||
Cheung Kong Holdings Ltd. | 69,000 | 1,089,151 | ||||||
Cheung Kong Infrastructure Holdings Ltd. | 6,000 | 37,876 | ||||||
CLP Holdings Ltd. | 15,500 | 122,532 | ||||||
First Pacific Co., Ltd. | 23,000 | 26,161 | ||||||
Galaxy Entertainment Group | 18,000 | 161,446 | ||||||
Hang Lung Properties Ltd. | 159,000 | 502,366 | ||||||
Hang Seng Bank Ltd. | 6,700 | 108,609 | ||||||
Henderson Land Development Co., Ltd. | 9,800 | 55,924 | ||||||
HKT Trust/HKT Ltd. | 20,000 | 19,757 | ||||||
Hong Kong & China Gas Co., | 50,014 | 114,678 | ||||||
Hong Kong Exchanges and Clearing Ltd. | 9,600 | 160,076 | ||||||
Hopewell Holdings Ltd. | 5,500 | 18,619 | ||||||
Hutchison Whampoa Ltd. | 19,000 | 258,257 | ||||||
Hysan Development Co., Ltd. | 5,448 | 23,466 | ||||||
Kerry Properties Ltd. | 6,000 | 20,814 | ||||||
Li & Fung Ltd. | 48,000 | 61,901 | ||||||
Link REIT (REIT) | 19,813 | 96,072 | ||||||
MTR Corp., Ltd. | 11,089 | 41,972 | ||||||
See Notes to Financial Statements.
68
AXA PREMIER VIP TRUST
MULTIMANAGER INTERNATIONAL EQUITY PORTFOLIO
PORTFOLIO OF INVESTMENTS (Continued)
December 31, 2013
| Number of Shares | Value (Note 1) | |||||||
New World Development Co., | 36,212 | $ | 45,719 | |||||
Noble Group Ltd. | 39,454 | 33,453 | ||||||
NWS Holdings Ltd. | 12,947 | 19,736 | ||||||
Orient Overseas International Ltd. | 207,200 | 1,040,770 | ||||||
PCCW Ltd. | 43,974 | 19,678 | ||||||
Power Assets Holdings Ltd. | 12,000 | 95,405 | ||||||
Shangri-La Asia Ltd. | 15,166 | 29,572 | ||||||
Sino Land Co., Ltd. | 27,910 | 38,152 | ||||||
SJM Holdings Ltd. | 16,000 | 53,648 | ||||||
Sun Hung Kai Properties Ltd. | 14,000 | 177,566 | ||||||
Swire Pacific Ltd., Class A | 5,500 | 64,474 | ||||||
Swire Properties Ltd. | 11,600 | 29,320 | ||||||
Wharf Holdings Ltd. | 13,000 | 99,416 | ||||||
Wheelock & Co., Ltd. | 7,000 | 32,182 | ||||||
Yue Yuen Industrial Holdings | 7,000 | 23,381 | ||||||
|
| |||||||
| 7,442,316 | ||||||||
|
| |||||||
India (0.9%) | ||||||||
HDFC Bank Ltd. (ADR) | 8,200 | 282,408 | ||||||
ICICI Bank Ltd. (ADR) | 33,535 | 1,246,496 | ||||||
Tata Motors Ltd. (ADR) | 22,528 | 693,862 | ||||||
Yes Bank Ltd. | 150,190 | 898,882 | ||||||
|
| |||||||
| 3,121,648 | ||||||||
|
| |||||||
Indonesia (0.1%) | ||||||||
PT Astra International Tbk | 393,500 | 219,869 | ||||||
|
| |||||||
Ireland (1.3%) | ||||||||
Bank of Ireland* | 167,579 | 58,096 | ||||||
CRH plc | 6,417 | 161,838 | ||||||
Experian plc | 8,835 | 162,982 | ||||||
ICON plc* | 38,086 | 1,539,055 | ||||||
James Hardie Industries plc (CDI) | 4,007 | 46,297 | ||||||
Kerry Group plc, Class A | 1,288 | 89,463 | ||||||
Shire plc | 54,360 | 2,567,297 | ||||||
|
| |||||||
| 4,625,028 | ||||||||
|
| |||||||
Israel (0.3%) | ||||||||
Bank Hapoalim B.M. | 9,964 | 55,818 | ||||||
Bank Leumi Le-Israel B.M.* | 11,649 | 47,576 | ||||||
Bezeq Israeli Telecommunication Corp., Ltd. | 17,050 | 28,899 | ||||||
Delek Group Ltd. | 39 | 14,895 | ||||||
Israel Chemicals Ltd. | 4,337 | 36,137 | ||||||
Israel Corp., Ltd.* | 25 | 13,155 | ||||||
Mizrahi Tefahot Bank Ltd. | 1,371 | 17,943 | ||||||
NICE Systems Ltd. | 534 | 21,871 | ||||||
Teva Pharmaceutical Industries Ltd. | 7,507 | 300,107 | ||||||
Teva Pharmaceutical Industries Ltd. (ADR) | 9,250 | 370,740 | ||||||
|
| |||||||
| 907,141 | ||||||||
|
| |||||||
Italy (0.7%) | ||||||||
Assicurazioni Generali S.p.A. | 10,220 | 240,420 | ||||||
Atlantia S.p.A. | 2,742 | 61,524 | ||||||
Banca Monte dei Paschi di Siena S.p.A.* | 64,730 | 15,619 | ||||||
Enel Green Power S.p.A. | 13,119 | $ | 33,046 | |||||
Enel S.p.A. | 57,614 | 251,570 | ||||||
Eni S.p.A. | 22,275 | 535,959 | ||||||
Exor S.p.A. | 694 | 27,601 | ||||||
Fiat S.p.A.* | 7,032 | 57,511 | ||||||
Finmeccanica S.p.A.* | 3,874 | 29,339 | ||||||
Intesa Sanpaolo S.p.A. | 101,760 | 251,144 | ||||||
Luxottica Group S.p.A. | 1,421 | 76,142 | ||||||
Mediobanca S.p.A.* | 3,862 | 33,790 | ||||||
Pirelli & C. S.p.A. | 2,203 | 38,126 | ||||||
Prysmian S.p.A. | 1,870 | 48,133 | ||||||
Saipem S.p.A. | 2,135 | 45,702 | ||||||
Snam S.p.A. | 17,569 | 98,274 | ||||||
Telecom Italia S.p.A. | 85,302 | 84,609 | ||||||
Telecom Italia S.p.A. (RNC) | 56,219 | 44,007 | ||||||
Terna Rete Elettrica Nazionale S.p.A. | 12,294 | 61,427 | ||||||
UniCredit S.p.A. | 38,006 | 281,293 | ||||||
Unione di Banche Italiane S.c.p.A. | 7,861 | 53,380 | ||||||
|
| |||||||
| 2,368,616 | ||||||||
|
| |||||||
Japan (12.5%) | ||||||||
ABC-Mart, Inc. | 300 | 13,090 | ||||||
Acom Co., Ltd.* | 4,100 | 13,899 | ||||||
Advantest Corp. | 1,300 | 16,134 | ||||||
Aeon Co., Ltd. | 5,100 | 69,011 | ||||||
AEON Financial Service Co., Ltd. | 600 | 16,067 | ||||||
Aeon Mall Co., Ltd. | 1,060 | 29,703 | ||||||
Air Water, Inc. | 1,000 | 13,522 | ||||||
Aisin Seiki Co., Ltd. | 1,600 | 64,875 | ||||||
Ajinomoto Co., Inc. | 5,000 | 72,263 | ||||||
Alfresa Holdings Corp. | 400 | 19,827 | ||||||
Amada Co., Ltd. | 3,000 | 26,408 | ||||||
ANA Holdings, Inc. | 12,000 | 23,929 | ||||||
Aozora Bank Ltd. | 11,000 | 31,127 | ||||||
Asahi Glass Co., Ltd. | 8,000 | 49,682 | ||||||
Asahi Group Holdings Ltd. | 3,400 | 95,695 | ||||||
Asahi Kasei Corp. | 12,000 | 93,894 | ||||||
Asics Corp. | 1,600 | 27,272 | ||||||
Astellas Pharma, Inc. | 13,400 | 792,726 | ||||||
Bank of Kyoto Ltd. | 2,000 | 16,675 | ||||||
Bank of Yokohama Ltd. | 10,000 | 55,645 | ||||||
Benesse Holdings, Inc. | 700 | 28,084 | ||||||
Bridgestone Corp. | 5,700 | 215,421 | ||||||
Brother Industries Ltd. | 2,200 | 30,020 | ||||||
Calbee, Inc. | 800 | 19,409 | ||||||
Canon, Inc. | 16,300 | 515,421 | ||||||
Casio Computer Co., Ltd. | 2,000 | 24,442 | ||||||
Central Japan Railway Co. | 1,300 | 152,825 | ||||||
Chiba Bank Ltd. | 6,000 | 40,395 | ||||||
Chiyoda Corp. | 1,000 | 14,491 | ||||||
Chubu Electric Power Co., Inc. | 5,500 | 70,976 | ||||||
Chugai Pharmaceutical Co., Ltd. | 1,800 | 39,740 | ||||||
Chugoku Bank Ltd. | 1,000 | 12,686 | ||||||
Chugoku Electric Power Co., Inc. | 2,700 | 41,945 | ||||||
Citizen Holdings Co., Ltd. | 2,100 | 17,668 | ||||||
Coca-Cola West Co., Ltd. | 500 | 10,574 | ||||||
Credit Saison Co., Ltd. | 1,500 | 39,398 | ||||||
Dai Nippon Printing Co., Ltd. | 5,000 | 52,986 | ||||||
Daicel Corp. | 3,000 | 24,385 | ||||||
See Notes to Financial Statements.
69
AXA PREMIER VIP TRUST
MULTIMANAGER INTERNATIONAL EQUITY PORTFOLIO
PORTFOLIO OF INVESTMENTS (Continued)
December 31, 2013
| Number of Shares | Value (Note 1) | |||||||
Daido Steel Co., Ltd. | 3,000 | $ | 14,870 | |||||
Daihatsu Motor Co., Ltd. | 2,000 | 33,843 | ||||||
Dai-ichi Life Insurance Co., Ltd. | 7,600 | 126,799 | ||||||
Daiichi Sankyo Co., Ltd. | 5,900 | 107,736 | ||||||
Daikin Industries Ltd. | 8,300 | 516,238 | ||||||
Dainippon Sumitomo Pharma Co., Ltd. | 1,500 | 23,431 | ||||||
Daito Trust Construction Co., | 600 | 56,006 | ||||||
Daiwa House Industry Co., Ltd. | 5,000 | 96,619 | ||||||
Daiwa Securities Group, Inc. | 14,000 | 139,588 | ||||||
DeNA Co., Ltd. | 1,000 | 21,005 | ||||||
Denso Corp. | 45,000 | 2,371,570 | ||||||
Dentsu, Inc. | 1,783 | 72,803 | ||||||
Don Quijote Holdings Co., Ltd. | 400 | 24,195 | ||||||
East Japan Railway Co. | 10,005 | 796,144 | ||||||
Eisai Co., Ltd. | 2,200 | 85,130 | ||||||
Electric Power Development Co., Ltd. | 800 | 23,284 | ||||||
FamilyMart Co., Ltd. | 500 | 22,814 | ||||||
FANUC Corp. | 4,900 | 895,689 | ||||||
Fast Retailing Co., Ltd. | 500 | 206,058 | ||||||
Fuji Electric Co., Ltd. | 6,000 | 28,032 | ||||||
Fuji Heavy Industries Ltd. | 5,200 | 148,875 | ||||||
Fujifilm Holdings Corp. | 4,000 | 113,228 | ||||||
Fujitsu Ltd.* | 15,000 | 77,485 | ||||||
Fukuoka Financial Group, Inc. | 5,000 | 21,888 | ||||||
Gree, Inc. | 1,100 | 10,853 | ||||||
GungHo Online Entertainment, Inc.* | 2,600 | 18,690 | ||||||
Gunma Bank Ltd. | 4,000 | 22,296 | ||||||
Hachijuni Bank Ltd. | 4,000 | 23,284 | ||||||
Hakuhodo DY Holdings, Inc. | 2,600 | 20,122 | ||||||
Hamamatsu Photonics KK | 700 | 27,951 | ||||||
Hankyu Hanshin Holdings, Inc. | 9,000 | 48,542 | ||||||
Hino Motors Ltd. | 2,000 | 31,374 | ||||||
Hirose Electric Co., Ltd. | 300 | 42,674 | ||||||
Hiroshima Bank Ltd. | 3,000 | 12,392 | ||||||
Hisamitsu Pharmaceutical Co., | 600 | 30,197 | ||||||
Hitachi Chemical Co., Ltd. | 1,200 | 19,109 | ||||||
Hitachi Construction Machinery Co., Ltd. | 1,000 | 21,318 | ||||||
Hitachi High-Technologies Corp. | 700 | 17,555 | ||||||
Hitachi Ltd. | 188,000 | 1,421,024 | ||||||
Hitachi Metals Ltd. | 2,000 | 28,221 | ||||||
Hokkaido Electric Power Co., | 1,200 | 13,776 | ||||||
Hokuhoku Financial Group, Inc. | 11,000 | 21,935 | ||||||
Hokuriku Electric Power Co. | 1,500 | 20,326 | ||||||
Honda Motor Co., Ltd. | 35,600 | 1,463,755 | ||||||
Hoya Corp. | 3,800 | 105,437 | ||||||
Hulic Co., Ltd. | 2,000 | 29,532 | ||||||
Ibiden Co., Ltd. | 1,000 | 18,669 | ||||||
Idemitsu Kosan Co., Ltd. | 800 | 18,179 | ||||||
IHI Corp. | 10,000 | 43,111 | ||||||
Iida Group Holdings Co., Ltd.* | 1,000 | 19,960 | ||||||
INPEX Corp. | 7,700 | 98,562 | ||||||
Isetan Mitsukoshi Holdings Ltd. | 2,900 | 41,169 | ||||||
Isuzu Motors Ltd. | 10,000 | 62,102 | ||||||
ITOCHU Corp. | 13,200 | 162,822 | ||||||
ITOCHU Techno-Solutions Corp. | 300 | $ | 12,150 | |||||
Iyo Bank Ltd. | 2,000 | 19,580 | ||||||
J. Front Retailing Co., Ltd. | 5,000 | 37,793 | ||||||
Japan Airlines Co., Ltd. | 564 | 27,796 | ||||||
Japan Exchange Group, Inc. | 45,800 | 1,299,935 | ||||||
Japan Petroleum Exploration Co. | 100 | 3,784 | ||||||
Japan Prime Realty Investment Corp. (REIT) | 8 | 25,601 | ||||||
Japan Real Estate Investment Corp. (REIT) | 10 | 53,556 | ||||||
Japan Retail Fund Investment Corp. (REIT) | 19 | 38,646 | ||||||
Japan Steel Works Ltd. | 3,000 | 16,751 | ||||||
Japan Tobacco, Inc. | 27,300 | 886,582 | ||||||
JFE Holdings, Inc. | 4,300 | 102,161 | ||||||
JGC Corp. | 2,000 | 78,340 | ||||||
Jin Co., Ltd. | 16,600 | 701,453 | ||||||
Joyo Bank Ltd. | 6,000 | 30,595 | ||||||
JSR Corp. | 1,800 | 34,800 | ||||||
JTEKT Corp. | 2,000 | 33,995 | ||||||
JX Holdings, Inc. | 19,644 | 100,915 | ||||||
Kajima Corp. | 8,000 | 30,007 | ||||||
Kakaku.com, Inc. | 1,100 | 19,293 | ||||||
Kamigumi Co., Ltd. | 2,000 | 18,308 | ||||||
Kaneka Corp. | 3,000 | 19,656 | ||||||
Kansai Electric Power Co., Inc.* | 5,900 | 67,734 | ||||||
Kansai Paint Co., Ltd. | 2,000 | 29,532 | ||||||
Kao Corp. | 4,600 | 144,583 | ||||||
Kawasaki Heavy Industries Ltd. | 13,000 | 54,439 | ||||||
KDDI Corp. | 4,700 | 288,757 | ||||||
Keikyu Corp. | 4,000 | 32,931 | ||||||
Keio Corp. | 4,000 | 26,626 | ||||||
Keisei Electric Railway Co., Ltd. | 2,000 | 18,365 | ||||||
Keyence Corp. | 430 | 183,743 | ||||||
Kikkoman Corp. | 1,000 | 18,859 | ||||||
Kinden Corp. | 1,000 | 10,445 | ||||||
Kintetsu Corp. | 16,000 | 56,063 | ||||||
Kirin Holdings Co., Ltd. | 8,000 | 114,937 | ||||||
Kobe Steel Ltd.* | 24,000 | 41,022 | ||||||
Koito Manufacturing Co., Ltd. | 1,000 | 19,058 | ||||||
Komatsu Ltd. | 36,700 | 744,734 | ||||||
Konami Corp. | 900 | 20,759 | ||||||
Konica Minolta, Inc. | 3,500 | 34,864 | ||||||
Kubota Corp. | 45,500 | 751,348 | ||||||
Kuraray Co., Ltd. | 3,200 | 38,074 | ||||||
Kurita Water Industries Ltd. | 1,100 | 22,792 | ||||||
Kyocera Corp. | 2,900 | 144,573 | ||||||
Kyowa Hakko Kirin Co., Ltd. | 2,000 | 22,011 | ||||||
Kyushu Electric Power Co., Inc.* | 3,900 | 49,699 | ||||||
Lawson, Inc. | 600 | 44,839 | ||||||
LIXIL Group Corp. | 2,100 | 57,490 | ||||||
M3, Inc. | 7 | 17,515 | ||||||
Mabuchi Motor Co., Ltd. | 300 | 17,805 | ||||||
Makita Corp. | 7,700 | 403,608 | ||||||
Marubeni Corp. | 14,000 | 100,503 | ||||||
Marui Group Co., Ltd. | 1,900 | 19,269 | ||||||
Maruichi Steel Tube Ltd. | 400 | 10,088 | ||||||
Mazda Motor Corp.* | 24,000 | 123,977 | ||||||
McDonald’s Holdings Co. Japan Ltd. | 600 | 15,309 | ||||||
Medipal Holdings Corp. | 1,300 | 17,134 | ||||||
See Notes to Financial Statements.
70
AXA PREMIER VIP TRUST
MULTIMANAGER INTERNATIONAL EQUITY PORTFOLIO
PORTFOLIO OF INVESTMENTS (Continued)
December 31, 2013
| Number of Shares | Value (Note 1) | |||||||
MEIJI Holdings Co., Ltd. | 582 | $ | 37,359 | |||||
Miraca Holdings, Inc. | 500 | 23,549 | ||||||
Mitsubishi Chemical Holdings Corp. | 11,000 | 50,764 | ||||||
Mitsubishi Corp. | 38,700 | 741,220 | ||||||
Mitsubishi Electric Corp. | 17,000 | 213,085 | ||||||
Mitsubishi Estate Co., Ltd. | 11,000 | 328,506 | ||||||
Mitsubishi Gas Chemical Co., | 3,000 | 22,049 | ||||||
Mitsubishi Heavy Industries Ltd. | 27,000 | 166,907 | ||||||
Mitsubishi Logistics Corp. | 1,000 | 15,772 | ||||||
Mitsubishi Materials Corp. | 10,000 | 36,844 | ||||||
Mitsubishi Motors Corp.* | 4,000 | 42,883 | ||||||
Mitsubishi Tanabe Pharma Corp. | 2,200 | 30,626 | ||||||
Mitsubishi UFJ Financial Group, Inc. | 111,600 | 735,451 | ||||||
Mitsubishi UFJ Lease & Finance Co., Ltd. | 5,600 | 34,299 | ||||||
Mitsui & Co., Ltd. | 15,200 | 211,452 | ||||||
Mitsui Chemicals, Inc. | 8,000 | 19,295 | ||||||
Mitsui Fudosan Co., Ltd. | 7,000 | 251,591 | ||||||
Mitsui O.S.K. Lines Ltd. | 8,000 | 36,008 | ||||||
Mizuho Financial Group, Inc. | 201,050 | 435,281 | ||||||
MS&AD Insurance Group Holdings, Inc. | 4,438 | 118,925 | ||||||
Murata Manufacturing Co., Ltd. | 1,800 | 159,643 | ||||||
Nabtesco Corp. | 1,100 | 25,330 | ||||||
Namco Bandai Holdings, Inc. | 1,700 | 37,677 | ||||||
NEC Corp. | 25,000 | 56,262 | ||||||
Nexon Co., Ltd. | 1,300 | 11,999 | ||||||
NGK Insulators Ltd. | 3,000 | 56,918 | ||||||
NGK Spark Plug Co., Ltd. | 2,000 | 47,289 | ||||||
NHK Spring Co., Ltd. | 1,700 | 19,145 | ||||||
Nidec Corp. | 4,100 | 401,007 | ||||||
Nikon Corp. | 2,700 | 51,508 | ||||||
Nintendo Co., Ltd. | 900 | 119,732 | ||||||
Nippon Building Fund, Inc. (REIT) | 12 | 69,737 | ||||||
Nippon Electric Glass Co., Ltd. | 4,000 | 20,967 | ||||||
Nippon Express Co., Ltd. | 7,000 | 33,833 | ||||||
Nippon Meat Packers, Inc. | 1,000 | 17,149 | ||||||
Nippon Paint Co., Ltd. | 1,000 | 16,608 | ||||||
Nippon Prologis REIT, Inc. (REIT) | 2 | 19,105 | ||||||
Nippon Steel & Sumitomo Metal Corp. | 392,595 | 1,312,254 | ||||||
Nippon Telegraph & Telephone Corp. | 3,292 | 176,932 | ||||||
Nippon Yusen KK | 13,000 | 41,478 | ||||||
Nishi-Nippon City Bank Ltd. | 6,000 | 16,124 | ||||||
Nissan Motor Co., Ltd. | 21,800 | 182,995 | ||||||
Nisshin Seifun Group, Inc. | 2,200 | 22,708 | ||||||
Nissin Foods Holdings Co., Ltd. | 500 | 21,081 | ||||||
Nitori Holdings Co., Ltd. | 350 | 33,135 | ||||||
Nitto Denko Corp. | 7,800 | 328,487 | ||||||
NKSJ Holdings, Inc. | 2,823 | 78,382 | ||||||
NOK Corp. | 900 | 14,699 | ||||||
Nomura Holdings, Inc. | 31,800 | 244,290 | ||||||
Nomura Real Estate Holdings, Inc. | 900 | 20,237 | ||||||
Nomura Real Estate Office Fund, Inc. (REIT) | 3 | $ | 13,930 | |||||
Nomura Research Institute Ltd. | 900 | 28,331 | ||||||
NSK Ltd. | 4,000 | 49,682 | ||||||
NTT Data Corp. | 1,000 | 36,844 | ||||||
NTT DOCOMO, Inc. | 13,600 | 222,771 | ||||||
NTT Urban Development Corp. | 900 | 10,332 | ||||||
Obayashi Corp. | 5,000 | 28,440 | ||||||
Odakyu Electric Railway Co., Ltd. | 5,000 | 45,152 | ||||||
Oji Holdings Corp. | 8,000 | 40,946 | ||||||
Olympus Corp.* | 1,900 | 60,080 | ||||||
Omron Corp. | 1,800 | 79,394 | ||||||
Ono Pharmaceutical Co., Ltd. | 800 | 69,965 | ||||||
Oracle Corp. Japan | 300 | 10,953 | ||||||
Oriental Land Co., Ltd. | 400 | 57,620 | ||||||
ORIX Corp. | 10,900 | 191,172 | ||||||
Osaka Gas Co., Ltd. | 15,000 | 58,826 | ||||||
Otsuka Corp. | 100 | 12,734 | ||||||
Otsuka Holdings Co., Ltd. | 3,200 | 92,375 | ||||||
Panasonic Corp. | 19,300 | 224,321 | ||||||
Park24 Co., Ltd. | 1,100 | 20,713 | ||||||
Rakuten, Inc. | 127,400 | 1,892,067 | ||||||
Resona Holdings, Inc. | 16,357 | 83,253 | ||||||
Ricoh Co., Ltd. | 6,000 | 63,698 | ||||||
Rinnai Corp. | 300 | 23,331 | ||||||
Rohm Co., Ltd. | 900 | 43,757 | ||||||
Sankyo Co., Ltd. | 300 | 13,816 | ||||||
Sanrio Co., Ltd. | 300 | 12,606 | ||||||
Santen Pharmaceutical Co., Ltd. | 700 | 32,604 | ||||||
SBI Holdings, Inc. | 2,130 | 32,159 | ||||||
Secom Co., Ltd. | 24,500 | 1,474,979 | ||||||
Sega Sammy Holdings, Inc. | 1,400 | 35,588 | ||||||
Sekisui Chemical Co., Ltd. | 4,000 | 48,998 | ||||||
Sekisui House Ltd. | 5,000 | 69,794 | ||||||
Seven & I Holdings Co., Ltd. | 6,600 | 261,969 | ||||||
Seven Bank Ltd. | 5,800 | 22,636 | ||||||
Sharp Corp.* | 13,000 | 41,231 | ||||||
Shikoku Electric Power Co., Inc.* | 1,600 | 23,929 | ||||||
Shimadzu Corp. | 2,000 | 17,377 | ||||||
Shimamura Co., Ltd. | 200 | 18,726 | ||||||
Shimano, Inc. | 600 | 51,448 | ||||||
Shimizu Corp. | 5,000 | 25,211 | ||||||
Shin-Etsu Chemical Co., Ltd. | 12,500 | 728,801 | ||||||
Shinsei Bank Ltd. | 12,000 | 29,285 | ||||||
Shionogi & Co., Ltd. | 2,400 | 51,961 | ||||||
Shiseido Co., Ltd. | 3,400 | 54,595 | ||||||
Shizuoka Bank Ltd. | 5,000 | 53,271 | ||||||
Showa Denko KK | 13,000 | 18,393 | ||||||
Showa Shell Sekiyu KK | 1,500 | 15,212 | ||||||
SMC Corp. | 2,900 | 729,750 | ||||||
SoftBank Corp. | 8,400 | 733,833 | ||||||
Sojitz Corp. | 11,200 | 19,888 | ||||||
Sony Corp. | 8,900 | 154,320 | ||||||
Sony Financial Holdings, Inc. | 1,200 | 21,810 | ||||||
Stanley Electric Co., Ltd. | 1,300 | 29,726 | ||||||
Start Today Co., Ltd. | 45,400 | 1,125,623 | ||||||
Sumco Corp. | 1,000 | 8,812 | ||||||
Sumitomo Chemical Co., Ltd. | 14,000 | 54,772 | ||||||
Sumitomo Corp. | 44,100 | 553,187 | ||||||
See Notes to Financial Statements.
71
AXA PREMIER VIP TRUST
MULTIMANAGER INTERNATIONAL EQUITY PORTFOLIO
PORTFOLIO OF INVESTMENTS (Continued)
December 31, 2013
| Number of Shares | Value (Note 1) | |||||||
Sumitomo Electric Industries Ltd. | 6,600 | $ | 109,927 | |||||
Sumitomo Heavy Industries Ltd. | 5,000 | 22,980 | ||||||
Sumitomo Metal Mining Co., Ltd. | 5,000 | 65,378 | ||||||
Sumitomo Mitsui Financial Group, Inc. | 11,184 | 575,608 | ||||||
Sumitomo Mitsui Trust Holdings, Inc. | 28,070 | 147,667 | ||||||
Sumitomo Realty & Development Co., Ltd. | 3,000 | 148,989 | ||||||
Sumitomo Rubber Industries Ltd. | 1,500 | 21,280 | ||||||
Suntory Beverage & Food Ltd. | 1,200 | 38,230 | ||||||
Suruga Bank Ltd. | 2,000 | 35,818 | ||||||
Suzuken Co., Ltd. | 700 | 22,633 | ||||||
Suzuki Motor Corp. | 3,000 | 80,562 | ||||||
Sysmex Corp. | 700 | 41,278 | ||||||
T&D Holdings, Inc. | 4,900 | 68,352 | ||||||
Taiheiyo Cement Corp. | 9,000 | 34,527 | ||||||
Taisei Corp. | 7,000 | 31,773 | ||||||
Taisho Pharmaceutical Holdings Co., Ltd. | 200 | 13,731 | ||||||
Taiyo Nippon Sanso Corp. | 2,000 | 14,206 | ||||||
Takashimaya Co., Ltd. | 2,000 | 19,884 | ||||||
Takeda Pharmaceutical Co., Ltd. | 6,900 | 316,138 | ||||||
TDK Corp. | 900 | 43,073 | ||||||
Teijin Ltd. | 8,000 | 17,776 | ||||||
Terumo Corp. | 1,300 | 62,587 | ||||||
THK Co., Ltd. | 1,100 | 27,409 | ||||||
Tobu Railway Co., Ltd. | 8,000 | 38,743 | ||||||
Toho Co., Ltd. | 1,100 | 24,160 | ||||||
Toho Gas Co., Ltd. | 4,000 | 19,447 | ||||||
Tohoku Electric Power Co., Inc.* | 4,200 | 47,181 | ||||||
Tokio Marine Holdings, Inc. | 6,100 | 203,604 | ||||||
Tokyo Electric Power Co., Inc.* | 12,100 | 59,403 | ||||||
Tokyo Electron Ltd. | 1,500 | 82,043 | ||||||
Tokyo Gas Co., Ltd. | 21,000 | 103,295 | ||||||
Tokyo Tatemono Co., Ltd. | 4,000 | 44,364 | ||||||
Tokyu Corp. | 9,000 | 58,200 | ||||||
Tokyu Fudosan Holdings Corp.* | 5,000 | 47,004 | ||||||
TonenGeneral Sekiyu KK | 2,000 | 18,327 | ||||||
Toppan Printing Co., Ltd. | 4,000 | 31,944 | ||||||
Toray Industries, Inc. | 12,000 | 82,955 | ||||||
Toshiba Corp. | 35,000 | 146,900 | ||||||
TOTO Ltd. | 2,000 | 31,659 | ||||||
Toyo Seikan Kaisha Ltd. | 1,400 | 30,031 | ||||||
Toyo Suisan Kaisha Ltd. | 1,000 | 30,007 | ||||||
Toyoda Gosei Co., Ltd. | 700 | 16,265 | ||||||
Toyota Boshoku Corp. | 700 | 8,728 | ||||||
Toyota Industries Corp. | 1,500 | 67,586 | ||||||
Toyota Motor Corp. | 42,300 | 2,578,729 | ||||||
Toyota Tsusho Corp. | 2,000 | 49,435 | ||||||
Trend Micro, Inc. | 1,000 | 34,944 | ||||||
Tsumura & Co. | 300 | 7,942 | ||||||
Ube Industries Ltd. | 9,000 | 19,229 | ||||||
Unicharm Corp. | 1,000 | 56,975 | ||||||
United Urban Investment Corp. (REIT) | 22 | 31,608 | ||||||
USS Co., Ltd. | 2,000 | 27,424 | ||||||
West Japan Railway Co. | 1,400 | 60,621 | ||||||
Yahoo! Japan Corp. | 55,100 | 306,082 | ||||||
Yakult Honsha Co., Ltd. | 800 | 40,338 | ||||||
Yamada Denki Co., Ltd. | 8,800 | 28,746 | ||||||
Yamaguchi Financial Group, Inc. | 1,000 | $ | 9,249 | |||||
Yamaha Corp. | 1,300 | 20,603 | ||||||
Yamaha Motor Co., Ltd. | 2,100 | 31,447 | ||||||
Yamato Holdings Co., Ltd. | 3,200 | 64,602 | ||||||
Yamato Kogyo Co., Ltd. | 200 | 6,381 | ||||||
Yamazaki Baking Co., Ltd. | 1,000 | 10,246 | ||||||
Yaskawa Electric Corp. | 2,000 | 31,583 | ||||||
Yokogawa Electric Corp. | 1,600 | 24,537 | ||||||
Yokohama Rubber Co., Ltd. | 1,000 | 9,809 | ||||||
|
| |||||||
| 44,023,515 | ||||||||
|
| |||||||
Luxembourg (0.1%) | ||||||||
ArcelorMittal S.A. | 8,741 | 155,964 | ||||||
Millicom International Cellular S.A. (SDR) | 607 | 60,447 | ||||||
RTL Gorup S.A. | 304 | 39,283 | ||||||
SES S.A. (FDR) | 2,617 | 84,713 | ||||||
Tenaris S.A. | 4,130 | 90,224 | ||||||
|
| |||||||
| 430,631 | ||||||||
|
| |||||||
Macau (0.6%) | ||||||||
MGM China Holdings Ltd. | 8,400 | 35,856 | ||||||
Sands China Ltd. | 270,133 | 2,206,895 | ||||||
Wynn Macau Ltd. | 14,400 | 65,275 | ||||||
|
| |||||||
| 2,308,026 | ||||||||
|
| |||||||
Mexico (0.0%) | ||||||||
Fresnillo plc | 1,678 | 20,715 | ||||||
|
| |||||||
Netherlands (4.8%) | ||||||||
Aegon N.V. | 15,560 | 146,887 | ||||||
Akzo Nobel N.V. | 8,323 | 645,090 | ||||||
ASML Holding N.V. | 31,773 | 2,974,036 | ||||||
Core Laboratories N.V. | 15,565 | 2,972,137 | ||||||
Corio N.V. (REIT) | 641 | 28,725 | ||||||
Delta Lloyd N.V. | 1,755 | 43,555 | ||||||
Fugro N.V. (CVA) | 553 | 32,952 | ||||||
Gemalto N.V. | 681 | 74,958 | ||||||
Heineken Holding N.V. | 826 | 52,254 | ||||||
Heineken N.V. | 2,016 | 136,119 | ||||||
ING Groep N.V. (CVA)* | 71,273 | 990,308 | ||||||
Koninklijke (Royal) KPN N.V.* | 27,836 | 89,723 | ||||||
Koninklijke Ahold N.V. | 8,820 | 158,344 | ||||||
Koninklijke Boskalis Westminster N.V. | 557 | 29,428 | ||||||
Koninklijke DSM N.V. | 1,349 | 106,079 | ||||||
Koninklijke Philips N.V. | 8,379 | 307,137 | ||||||
Koninklijke Vopak N.V. | 671 | 39,250 | ||||||
OCI* | 879 | 39,585 | ||||||
QIAGEN N.V.* | 2,217 | 51,651 | ||||||
Randstad Holding N.V. | 1,136 | 73,686 | ||||||
Reed Elsevier N.V. | 6,058 | 128,343 | ||||||
Royal Dutch Shell plc (BATS Europe Exchange), Class A | 61,321 | 2,185,328 | ||||||
Royal Dutch Shell plc (Euro Comp Exchange), Class A | 33,260 | 1,191,313 | ||||||
Royal Dutch Shell plc, Class B | 22,041 | 832,173 | ||||||
Sensata Technologies Holding N.V.* | 32,255 | 1,250,526 | ||||||
TNT Express N.V. | 3,305 | 30,681 | ||||||
Unilever N.V. (CVA) | 14,264 | 574,463 | ||||||
Wolters Kluwer N.V. | 2,563 | 73,145 | ||||||
See Notes to Financial Statements.
72
AXA PREMIER VIP TRUST
MULTIMANAGER INTERNATIONAL EQUITY PORTFOLIO
PORTFOLIO OF INVESTMENTS (Continued)
December 31, 2013
| Number of Shares | Value (Note 1) | |||||||
Yandex N.V., Class A* | 39,355 | $ | 1,698,168 | |||||
Ziggo N.V. | 1,310 | 59,832 | ||||||
|
| |||||||
| 17,015,876 | ||||||||
|
| |||||||
New Zealand (0.0%) | ||||||||
Auckland International Airport Ltd. | 10,172 | 29,530 | ||||||
Contact Energy Ltd. | 3,894 | 16,428 | ||||||
Fletcher Building Ltd. | 6,502 | 45,505 | ||||||
Ryman Healthcare Ltd. | 2,579 | 16,650 | ||||||
Telecom Corp. of New Zealand Ltd. | 17,025 | 32,273 | ||||||
|
| |||||||
| 140,386 | ||||||||
|
| |||||||
Norway (1.2%) | ||||||||
Aker Solutions ASA | 1,572 | 28,095 | ||||||
DNB ASA | 108,401 | 1,939,147 | ||||||
Gjensidige Forsikring ASA | 1,904 | 36,320 | ||||||
Norsk Hydro ASA | 155,666 | 694,752 | ||||||
Orkla ASA | 6,116 | 47,716 | ||||||
Statoil ASA | 9,768 | 236,739 | ||||||
Statoil ASA (ADR) | 45,787 | 1,104,840 | ||||||
Telenor ASA | 6,142 | 146,429 | ||||||
Yara International ASA | 1,565 | 67,345 | ||||||
|
| |||||||
| 4,301,383 | ||||||||
|
| |||||||
Panama (0.3%) | ||||||||
Copa Holdings S.A., Class A | 5,809 | 930,079 | ||||||
|
| |||||||
Portugal (0.5%) | ||||||||
Banco Espirito Santo S.A. (Registered)* | 16,313 | 23,317 | ||||||
EDP - Energias de Portugal S.A. | 18,569 | 68,206 | ||||||
Galp Energia SGPS S.A., Class B | 2,763 | 45,290 | ||||||
Jeronimo Martins SGPS S.A. | 80,378 | 1,571,838 | ||||||
Portugal Telecom SGPS S.A. (Registered) | 6,319 | 27,470 | ||||||
|
| |||||||
| 1,736,121 | ||||||||
|
| |||||||
Russia (0.1%) | ||||||||
Magnit OJSC (GDR)§(b) | 9,285 | 522,175 | ||||||
|
| |||||||
Singapore (0.5%) | ||||||||
Ascendas Real Estate Investment Trust (REIT) | 19,000 | 33,123 | ||||||
CapitaCommercial Trust (REIT) | 19,000 | 21,831 | ||||||
CapitaLand Ltd. | 21,000 | 50,422 | ||||||
CapitaMall Trust (REIT) | 24,000 | 36,230 | ||||||
CapitaMalls Asia Ltd. | 13,032 | 20,241 | ||||||
City Developments Ltd. | 4,000 | 30,429 | ||||||
ComfortDelGro Corp., Ltd. | 18,000 | 28,670 | ||||||
DBS Group Holdings Ltd. | 15,000 | 203,257 | ||||||
Genting Singapore plc | 50,677 | 60,036 | ||||||
Global Logistic Properties Ltd. | 25,000 | 57,253 | ||||||
Golden Agri-Resources Ltd. | 67,576 | 29,184 | ||||||
Hutchison Port Holdings Trust, | 48,000 | 32,400 | ||||||
Jardine Cycle & Carriage Ltd. | 1,000 | 28,488 | ||||||
Keppel Corp., Ltd. | 12,800 | 113,501 | ||||||
Keppel Land Ltd. | 6,000 | 15,880 | ||||||
Olam International Ltd. | 14,962 | 18,199 | ||||||
Oversea-Chinese Banking Corp., Ltd. | 22,525 | 182,064 | ||||||
Sembcorp Industries Ltd. | 8,000 | $ | 34,803 | |||||
Sembcorp Marine Ltd. | 8,000 | 28,210 | ||||||
Singapore Airlines Ltd. | 5,000 | 41,246 | ||||||
Singapore Exchange Ltd. | 8,000 | 46,024 | ||||||
Singapore Press Holdings Ltd. | 12,000 | 39,177 | ||||||
Singapore Technologies Engineering Ltd. | 13,000 | 40,794 | ||||||
Singapore Telecommunications Ltd. | 70,000 | 203,019 | ||||||
StarHub Ltd. | 6,000 | 20,397 | ||||||
United Overseas Bank Ltd. | 11,000 | 185,142 | ||||||
UOL Group Ltd. | 4,000 | 19,620 | ||||||
Wilmar International Ltd. | 15,000 | 40,651 | ||||||
|
| |||||||
| 1,660,291 | ||||||||
|
| |||||||
South Africa (0.5%) | ||||||||
Naspers Ltd., Class N | 17,056 | 1,782,035 | ||||||
|
| |||||||
South Korea (1.1%) | ||||||||
Hyundai Mobis* | 5,496 | 1,528,475 | ||||||
POSCO | 3,052 | 944,216 | ||||||
Samsung Electronics Co., Ltd. | 1,125 | 1,462,548 | ||||||
|
| |||||||
| 3,935,239 | ||||||||
|
| |||||||
Spain (1.6%) | ||||||||
Abertis Infraestructuras S.A. | 3,243 | 72,052 | ||||||
ACS Actividades de Construccion y Servicios S.A. | 1,214 | 41,786 | ||||||
Amadeus IT Holding S.A., | 45,274 | 1,937,326 | ||||||
Banco Bilbao Vizcaya Argentaria S.A. | 50,254 | 618,615 | ||||||
Banco de Sabadell S.A. | 29,468 | 76,862 | ||||||
Banco Popular Espanol S.A.* | 12,113 | 73,071 | ||||||
Banco Santander S.A. | 99,904 | 894,171 | ||||||
Bankia S.A.* | 38,520 | 65,392 | ||||||
CaixaBank S.A. | 14,477 | 75,442 | ||||||
Distribuidora Internacional de Alimentacion S.A. | 5,733 | 51,265 | ||||||
Enagas S.A. | 1,867 | 48,787 | ||||||
Ferrovial S.A. | 3,386 | 65,516 | ||||||
Gas Natural SDG S.A. | 2,942 | 75,664 | ||||||
Grifols S.A. | 1,197 | 57,248 | ||||||
Iberdrola S.A. | 41,587 | 265,174 | ||||||
Inditex S.A. | 1,910 | 314,785 | ||||||
Mapfre S.A. | 7,424 | 31,794 | ||||||
Red Electrica Corporacion S.A. | 883 | 58,915 | ||||||
Repsol S.A. | 7,487 | 188,694 | ||||||
Telefonica S.A. | 35,864 | 583,917 | ||||||
Zardoya Otis S.A. | 1,497 | 27,081 | ||||||
|
| |||||||
| 5,623,557 | ||||||||
|
| |||||||
Sweden (1.6%) | ||||||||
Alfa Laval AB | 2,635 | 67,597 | ||||||
Assa Abloy AB, Class B | 2,923 | 154,425 | ||||||
Atlas Copco AB, Class A | 15,262 | 423,084 | ||||||
Atlas Copco AB, Class B | 3,412 | 86,575 | ||||||
Boliden AB | 2,609 | 39,935 | ||||||
Electrolux AB | 1,981 | 51,898 | ||||||
Elekta AB, Class B | 3,489 | 53,351 | ||||||
Getinge AB, Class B | 53,177 | 1,818,907 | ||||||
Hennes & Mauritz AB, Class B | 8,312 | 382,785 | ||||||
Hexagon AB, Class B | 1,980 | 62,585 | ||||||
See Notes to Financial Statements.
73
AXA PREMIER VIP TRUST
MULTIMANAGER INTERNATIONAL EQUITY PORTFOLIO
PORTFOLIO OF INVESTMENTS (Continued)
December 31, 2013
| Number of Shares | Value (Note 1) | |||||||
Husqvarna AB, Class B | 3,864 | $ | 23,261 | |||||
Industrivarden AB, Class C | 1,279 | 24,320 | ||||||
Investment AB Kinnevik, Class B | 1,928 | 89,298 | ||||||
Investor AB, Class B | 3,985 | 137,111 | ||||||
Lundin Petroleum AB* | 2,145 | 41,820 | ||||||
Nordea Bank AB | 26,203 | 353,007 | ||||||
Sandvik AB | 9,328 | 131,541 | ||||||
Scania AB, Class B | 2,667 | 52,205 | ||||||
Securitas AB, Class B | 3,070 | 32,624 | ||||||
Skandinaviska Enskilda Banken AB, Class A | 13,291 | 175,234 | ||||||
Skanska AB, Class B | 3,200 | 65,375 | ||||||
SKF AB, Class B | 3,431 | 89,991 | ||||||
Svenska Cellulosa AB S.C.A., Class B | 5,106 | 157,185 | ||||||
Svenska Handelsbanken AB, Class A | 4,366 | 214,504 | ||||||
Swedbank AB, Class A | 7,925 | 223,019 | ||||||
Swedish Match AB | 1,733 | 55,693 | ||||||
Tele2 AB, Class B | 3,061 | 34,670 | ||||||
Telefonaktiebolaget LM Ericsson, Class B | 26,644 | 325,187 | ||||||
TeliaSonera AB | 20,840 | 173,509 | ||||||
Volvo AB, Class B | 13,247 | 173,933 | ||||||
|
| |||||||
| 5,714,629 | ||||||||
|
| |||||||
Switzerland (7.8%) | ||||||||
ABB Ltd. (Registered)* | 39,961 | 1,051,829 | ||||||
Actelion Ltd. (Registered)* | 908 | 76,697 | ||||||
Adecco S.A. (Registered)* | 1,149 | 90,936 | ||||||
Aryzta AG* | 830 | 63,642 | ||||||
Baloise Holding AG (Registered) | 438 | 55,778 | ||||||
Barry Callebaut AG (Registered)* | 16 | 20,053 | ||||||
Cie Financiere Richemont S.A. (Registered), Class A | 8,735 | 869,534 | ||||||
Coca-Cola HBC AG (ADR) | 1,592 | 46,439 | ||||||
Credit Suisse Group AG (Registered)* | 34,009 | 1,039,656 | ||||||
Credit Suisse Group AG (ADR)* | 29,720 | 922,509 | ||||||
EMS-Chemie Holding AG (Registered) | 71 | 25,231 | ||||||
Geberit AG (Registered)* | 339 | 102,796 | ||||||
Givaudan S.A. (Registered)* | 73 | 104,257 | ||||||
Glencore Xstrata plc* | 186,270 | 964,535 | ||||||
Holcim Ltd. (Registered)* | 5,980 | 447,469 | ||||||
Julius Baer Group Ltd.* | 1,900 | 91,246 | ||||||
Kuehne + Nagel International AG (Registered) | 452 | 59,334 | ||||||
Lindt & Spruengli AG | 8 | 36,061 | ||||||
Lindt & Spruengli AG (Registered) | 1 | 53,921 | ||||||
Lonza Group AG (Registered)* | 503 | 47,703 | ||||||
Nestle S.A. (Registered) | 44,305 | 3,243,222 | ||||||
Novartis AG (Registered) | 33,348 | 2,661,709 | ||||||
Novartis AG (ADR) | 17,294 | 1,390,092 | ||||||
Pargesa Holding S.A. | 246 | 19,828 | ||||||
Partners Group Holding AG | 170 | 45,337 | ||||||
Roche Holding AG | 24,583 | 6,867,422 | ||||||
Schindler Holding AG | 407 | 59,906 | ||||||
Schindler Holding AG (Registered) | 215 | 31,718 | ||||||
SGS S.A. (Registered) | 124 | $ | 285,240 | |||||
Sika AG | 20 | 71,095 | ||||||
Sonova Holding AG (Registered)* | 398 | 53,540 | ||||||
STMicroelectronics N.V. | 5,056 | 40,620 | ||||||
Sulzer AG (Registered) | 182 | 29,359 | ||||||
Swatch Group AG | 3,175 | 2,098,159 | ||||||
Swatch Group AG (Registered) | 399 | 44,907 | ||||||
Swiss Life Holding AG (Registered)* | 262 | 54,394 | ||||||
Swiss Prime Site AG (Registered)* | 417 | 32,278 | ||||||
Swiss Reinsurance AG* | 3,083 | 283,572 | ||||||
Swisscom AG (Registered) | 204 | 107,689 | ||||||
Syngenta AG (Registered) | 816 | 324,918 | ||||||
Transocean Ltd. (BATS Europe Exchange) | 3,153 | 153,541 | ||||||
Transocean Ltd. (New York Exchange) | 21,527 | 1,063,864 | ||||||
UBS AG (Registered)* | 69,735 | 1,322,702 | ||||||
Wolseley plc | 2,321 | 131,639 | ||||||
Zurich Insurance Group AG* | 3,288 | 952,803 | ||||||
|
| |||||||
| 27,539,180 | ||||||||
|
| |||||||
Taiwan (1.0%) | ||||||||
Advanced Semiconductor Engineering, Inc. (ADR) | 273,945 | 1,314,936 | ||||||
Taiwan Semiconductor Manufacturing Co., Ltd. (ADR) | 125,954 | 2,196,638 | ||||||
|
| |||||||
| 3,511,574 | ||||||||
|
| |||||||
Turkey (0.4%) | ||||||||
Akbank TAS | 262,087 | 817,116 | ||||||
Turkiye Garanti Bankasi A/S | 220,407 | 713,836 | ||||||
|
| |||||||
| 1,530,952 | ||||||||
|
| |||||||
United Kingdom (14.9%) | ||||||||
3i Group plc | 8,968 | 57,189 | ||||||
Aberdeen Asset Management plc | 7,881 | 65,253 | ||||||
Admiral Group plc | 1,837 | 39,850 | ||||||
Aggreko plc | 13,864 | 392,354 | ||||||
AMEC plc | 2,337 | 42,105 | ||||||
Anglo American plc | 12,201 | 266,696 | ||||||
Antofagasta plc | 3,118 | 42,545 | ||||||
ARM Holdings plc | 51,087 | 929,727 | ||||||
ARM Holdings plc (ADR) | 53,206 | 2,912,496 | ||||||
Associated British Foods plc | 3,115 | 126,120 | ||||||
AstraZeneca plc | 10,964 | 648,980 | ||||||
Aviva plc | 59,161 | 440,561 | ||||||
Babcock International Group plc | 2,984 | 66,955 | ||||||
BAE Systems plc | 28,343 | 204,165 | ||||||
Barclays plc | 311,011 | 1,400,593 | ||||||
BG Group plc | 83,681 | 1,797,966 | ||||||
BHP Billiton plc | 18,494 | 572,384 | ||||||
BP plc | 165,080 | 1,334,154 | ||||||
British American Tobacco plc | 27,403 | 1,469,340 | ||||||
British Land Co. plc (REIT) | 7,967 | 82,984 | ||||||
British Sky Broadcasting Group plc | 9,068 | 126,736 | ||||||
BT Group plc | 68,995 | 433,473 | ||||||
Bunzl plc | 2,778 | 66,703 | ||||||
Burberry Group plc | 24,324 | 610,635 | ||||||
Capita plc | 5,752 | 98,870 | ||||||
See Notes to Financial Statements.
74
AXA PREMIER VIP TRUST
MULTIMANAGER INTERNATIONAL EQUITY PORTFOLIO
PORTFOLIO OF INVESTMENTS (Continued)
December 31, 2013
| Number of Shares | Value (Note 1) | |||||||
Carnival plc | 1,483 | $ | 61,419 | |||||
Centrica plc | 94,742 | 545,500 | ||||||
CNH Industrial N.V.* | 8,350 | 95,171 | ||||||
Cobham plc | 9,952 | 45,238 | ||||||
Compass Group plc | 15,930 | 255,351 | ||||||
Croda International plc | 1,269 | 51,631 | ||||||
Diageo plc | 72,486 | 2,400,664 | ||||||
Direct Line Insurance Group plc | 7,869 | 32,525 | ||||||
Domino’s Pizza Group plc | 146,995 | 1,248,726 | ||||||
easyJet plc | 1,515 | 38,535 | ||||||
G4S plc | 13,780 | 59,900 | ||||||
GKN plc | 13,544 | 83,724 | ||||||
GlaxoSmithKline plc | 42,835 | 1,143,079 | ||||||
Hammerson plc (REIT) | 5,664 | 47,084 | ||||||
Hargreaves Lansdown plc | 46,805 | 1,049,441 | ||||||
HSBC Holdings plc (Hong Kong Exchange) | 127,033 | 1,378,568 | ||||||
HSBC Holdings plc (London Stock Exchange) | 234,317 | 2,570,226 | ||||||
ICAP plc | 5,369 | 40,151 | ||||||
IMI plc | 2,649 | 66,896 | ||||||
Imperial Tobacco Group plc | 21,636 | 837,662 | ||||||
Inmarsat plc | 4,173 | 52,242 | ||||||
InterContinental Hotels Group plc | 2,283 | 76,102 | ||||||
International Consolidated Airlines Group S.A.* | 7,315 | 48,696 | ||||||
Intertek Group plc | 1,383 | 72,095 | ||||||
Intu Properties plc (REIT) | 6,621 | 33,978 | ||||||
Invensys plc | 6,044 | 50,894 | ||||||
Investec plc | 5,540 | 40,145 | ||||||
ITV plc | 32,664 | 104,934 | ||||||
J Sainsbury plc | 10,417 | 62,963 | ||||||
Johnson Matthey plc | 1,781 | 96,735 | ||||||
Kingfisher plc | 20,759 | 132,244 | ||||||
Land Securities Group plc (REIT) | 6,850 | 109,292 | ||||||
Legal & General Group plc | 51,758 | 190,873 | ||||||
Liberty Global plc* | 29,799 | 2,512,652 | ||||||
Lloyds Banking Group plc* | 432,966 | 565,546 | ||||||
London Stock Exchange Group plc | 1,368 | 39,258 | ||||||
Marks & Spencer Group plc | 69,217 | 495,846 | ||||||
Meggitt plc | 42,723 | 373,191 | ||||||
Melrose Industries plc | 10,456 | 52,931 | ||||||
National Grid plc | 32,110 | 419,000 | ||||||
Next plc | 1,398 | 126,168 | ||||||
Old Mutual plc | 42,826 | 134,105 | ||||||
Pearson plc | 7,153 | 158,842 | ||||||
Persimmon plc* | 2,911 | 59,726 | ||||||
Petrofac Ltd. | 2,087 | 42,301 | ||||||
Prudential plc | 61,724 | 1,369,639 | ||||||
Randgold Resources Ltd. | 715 | 44,874 | ||||||
Reckitt Benckiser Group plc | 5,663 | 449,470 | ||||||
Reed Elsevier plc | 10,391 | 154,691 | ||||||
Resolution Ltd. | 11,528 | 67,578 | ||||||
Rexam plc | 6,428 | 56,469 | ||||||
Rightmove plc | 15,503 | 703,418 | ||||||
Rio Tinto plc | 20,471 | 1,155,785 | ||||||
Rio Tinto plc (ADR) | 23,183 | 1,308,217 | ||||||
Rolls-Royce Holdings plc* | 116,086 | 2,450,966 | ||||||
Rolls-Royce Holdings plc (Preference)*†(b) | 9,650,146 | 15,980 | ||||||
Royal Bank of Scotland Group plc* | 18,736 | $ | 104,898 | |||||
RSA Insurance Group plc | 29,812 | 45,122 | ||||||
SABMiller plc | 8,418 | 432,273 | ||||||
Sage Group plc | 9,401 | 62,846 | ||||||
Schroders plc | 985 | 42,376 | ||||||
Segro plc (REIT) | 7,343 | 40,613 | ||||||
Serco Group plc | 4,631 | 38,282 | ||||||
Severn Trent plc | 1,972 | 55,677 | ||||||
Smith & Nephew plc | 7,913 | 112,821 | ||||||
Smiths Group plc | 3,392 | 83,131 | ||||||
SSE plc | 8,440 | 191,474 | ||||||
Standard Chartered plc | 62,468 | 1,406,837 | ||||||
Standard Life plc | 20,628 | 122,836 | ||||||
Subsea 7 S.A. | 57,729 | 1,105,030 | ||||||
Tate & Lyle plc | 3,699 | 49,554 | ||||||
Telecity Group plc | 193,572 | 2,325,558 | ||||||
Tesco plc | 133,251 | 737,767 | ||||||
Travis Perkins plc | 1,975 | 61,224 | ||||||
TUI Travel plc | 4,171 | 28,533 | ||||||
Tullow Oil plc | 28,906 | 409,262 | ||||||
Unilever plc | 24,545 | 1,008,816 | ||||||
United Utilities Group plc | 5,754 | 63,983 | ||||||
Vodafone Group plc | 715,490 | 2,808,013 | ||||||
Weir Group plc | 1,812 | 63,972 | ||||||
Whitbread plc | 1,538 | 95,532 | ||||||
William Hill plc | 8,291 | 55,179 | ||||||
WM Morrison Supermarkets plc | 19,301 | 83,419 | ||||||
WPP plc | 44,897 | 1,025,991 | ||||||
|
| |||||||
| 52,769,190 | ||||||||
|
| |||||||
United States (2.2%) | ||||||||
Carnival Corp. | 28,314 | 1,137,373 | ||||||
Catamaran Corp.* | 27,347 | 1,298,435 | ||||||
Gilead Sciences, Inc.* | 15,832 | 1,189,775 | ||||||
MasterCard, Inc., Class A | 2,183 | 1,823,809 | ||||||
Perrigo Co. plc | 1 | 78 | ||||||
Schlumberger Ltd. | 27,716 | 2,497,489 | ||||||
|
| |||||||
| 7,946,959 | ||||||||
|
| |||||||
Total Common Stocks (80.1%) | 283,073,121 | |||||||
|
| |||||||
INVESTMENT COMPANY: | ||||||||
Exchange Traded Fund (ETF) (0.2%) |
| |||||||
iShares® MSCI United Kingdom ETF | ||||||||
(Cost $509,462) | 28,155 | 587,876 | ||||||
|
| |||||||
Number of Rights | Value (Note 1) | |||||||
RIGHTS: | ||||||||
Spain (0.0%) | ||||||||
Repsol S.A., expiring 1/9/14* | 7,487 | 5,109 | ||||||
|
| |||||||
Total Investments (80.3%) | 283,666,106 | |||||||
Other Assets Less Liabilities (19.7%) | 69,598,913 | |||||||
|
| |||||||
Net Assets (100%) | $ | 353,265,019 | ||||||
|
| |||||||
See Notes to Financial Statements.
75
AXA PREMIER VIP TRUST
MULTIMANAGER INTERNATIONAL EQUITY PORTFOLIO
PORTFOLIO OF INVESTMENTS (Continued)
December 31, 2013
| * | Non-income producing. |
| † | Securities (totaling $15,980 or 0.0% of net assets) at fair value by management. |
| ‡ | Affiliated company as defined under the Investment Company Act of 1940. |
| § | Securities exempt from registration under Rule 144A of the Securities Act of 1933. These securities may only be resold to qualified institutional buyers. At December 31, 2013, the market value of these securities amounted to $522,175 or 0.1% of net assets. Securities denoted with “§” but without “b” have been determined to be liquid under the guidelines established by the Board of Trustees. To the extent any securities might provide a right to demand registration, such rights have not been relied upon when determining liquidity. |
| (b) | Illiquid security. |
Glossary:
| ADR | — American Depositary Receipt |
| CDI | — CHESS Depositary Interest |
| CVA | — Dutch Certification |
| FDR | — Finnish Depositary Receipt |
| GDR | — Global Depositary Receipt |
| REIT | — Real Estate Investment Trust |
| RNC | — Risparmio Non-Convertible Savings Shares |
| SDR | — Swedish Certification |
Investments in companies which were affiliates for the year ended December 31, 2013, were as follows:
Securities | Value December 31, 2012 | Purchases at Cost | Sales at Cost | Value December 31, 2013 | Dividend Income | Realized Gain (Loss) | ||||||||||||||||||
AXA S.A. | $ | 732,309 | $ | — | $ | 498,681 | $ | 436,589 | $ | 27,173 | $ | (22,804 | ) | |||||||||||
|
|
|
|
|
|
|
|
|
|
|
| |||||||||||||
At December 31, 2013, the Portfolio had the following futures contracts open: (Note 1)
Purchases | Number of Contracts | Expiration Date | Original Value | Value at 12/31/2013 | Unrealized Appreciation/ (Depreciation) | |||||||||||||||
DJ EURO Stoxx 50 Index | 605 | March-14 | $ | 24,642,278 | $ | 25,867,838 | $ | 1,225,560 | ||||||||||||
FTSE 100 Index | 147 | March-14 | 15,692,016 | 16,303,366 | 611,350 | |||||||||||||||
SPI 200 Index | 54 | March-14 | 6,123,373 | 6,410,397 | 287,024 | |||||||||||||||
TOPIX Index | 127 | March-14 | 15,155,104 | 15,707,672 | 552,568 | |||||||||||||||
|
| |||||||||||||||||||
| $ | 2,676,502 | |||||||||||||||||||
|
| |||||||||||||||||||
At December 31, 2013, the Portfolio had outstanding foreign currency contracts to buy/sell foreign currencies as follows: (Note 1)
Foreign Currency Buy Contract | Counterparty | Local Contract Buy Amount (000’s) | U.S. $ Current Value | U.S. $ Settlement Value | Unrealized Appreciation/ (Depreciation) | |||||||||||||
European Union Euro vs. U.S. Dollar, | Credit Suisse | 9,000 | $ | 12,381,030 | $ | 12,408,525 | $ | (27,495 | ) | |||||||||
|
| |||||||||||||||||
Foreign Currency Sell Contract | Counterparty | Local Contract Sell Amount (000’s) | U.S. $ Settlement Value | U.S. $ Current Value | Unrealized Appreciation/ (Depreciation) | |||||||||||||
Danish Krone vs. U.S. Dollar, | State Street Bank & Trust | 1,241 | $ | 227,996 | $ | 228,910 | $ | (914 | ) | |||||||||
|
| |||||||||||||||||
| $ | (28,409 | ) | ||||||||||||||||
|
| |||||||||||||||||
The following is a summary of the inputs used to value the Portfolio’s assets and liabilities carried at fair value as of December 31, 2013:
The inputs or methodology used for valuing securities are not necessarily an indication of the risk associated with investing in those securities.
See Notes to Financial Statements.
76
AXA PREMIER VIP TRUST
MULTIMANAGER INTERNATIONAL EQUITY PORTFOLIO
PORTFOLIO OF INVESTMENTS (Continued)
December 31, 2013
Various inputs are used in determining the value of the Portfolio’s investments. These inputs are summarized in the three broad levels listed below:
| Investment Type | Level 1 Quoted Prices in Active Markets for Identical Securities(a) | Level 2 Significant Other Observable Inputs (including quoted prices for similar securities, interest rates, prepayment speeds, credit risk, etc.) | Level 3 Significant Unobservable Inputs (including the Portfolio’s own assumptions in determining the fair value of investments) | Total | ||||||||||||
Assets: | ||||||||||||||||
Common Stocks | ||||||||||||||||
Consumer Discretionary | $ | 8,210,339 | $ | 38,570,927 | $ | — | $ | 46,781,266 | ||||||||
Consumer Staples | 46,439 | 22,470,040 | — | 22,516,479 | ||||||||||||
Energy | 9,485,167 | 16,715,866 | — | 26,201,033 | ||||||||||||
Financials | 6,763,882 | 52,920,269 | — | 59,684,151 | ||||||||||||
Health Care | 6,709,356 | 24,911,056 | — | 31,620,412 | ||||||||||||
Industrials | 4,653,912 | 28,563,432 | 15,980 | 33,233,324 | ||||||||||||
Information Technology | 11,563,566 | 18,417,754 | — | 29,981,320 | ||||||||||||
Materials | 2,403,645 | 17,926,492 | — | 20,330,137 | ||||||||||||
Telecommunication Services | 644,405 | 7,761,541 | — | 8,405,946 | ||||||||||||
Utilities | — | 4,319,053 | — | 4,319,053 | ||||||||||||
Futures | 2,676,502 | — | — | 2,676,502 | ||||||||||||
Investment Companies | ||||||||||||||||
Exchange Traded Funds (ETFs) | 587,876 | — | — | 587,876 | ||||||||||||
Rights | ||||||||||||||||
Energy | — | 5,109 | — | 5,109 | ||||||||||||
|
|
|
|
|
|
|
| |||||||||
Total Assets | $ | 53,745,089 | $ | 232,581,539 | $ | 15,980 | $ | 286,342,608 | ||||||||
|
|
|
|
|
|
|
| |||||||||
Liabilities: | ||||||||||||||||
Forward Currency Contracts | $ | — | $ | (28,409 | ) | $ | — | $ | (28,409 | ) | ||||||
|
|
|
|
|
|
|
| |||||||||
Total Liabilities | $ | — | $ | (28,409 | ) | $ | — | $ | (28,409 | ) | ||||||
|
|
|
|
|
|
|
| |||||||||
Total | $ | 53,745,089 | $ | 232,553,130 | $ | 15,980 | $ | 286,314,199 | ||||||||
|
|
|
|
|
|
|
| |||||||||
(a) A security with a market value of $1,384,620 transferred from Level 2 to Level 1 during the year ended December 31, 2013 due to active trading.
There were no additional transfers between Levels 1, 2 or 3 during the year ended December 31, 2013.
Fair Values of Derivative Instruments as of December 31, 2013:
Statement of Assets and Liabilities | ||||||
Derivatives Not Accounted for as | Asset Derivatives | Fair Value | ||||
Interest rate contracts | Receivables, Net Assets - Unrealized | |||||
| appreciation | $ | — | * | |||
Foreign exchange contracts | Receivables | — | ||||
Credit contracts | Receivables | — | ||||
Equity contracts | Receivables, Net Assets - Unrealized appreciation | 2,676,502 | * | |||
Commodity contracts | Receivables | — | ||||
Other contracts | Receivables | — | ||||
|
| |||||
Total | $ | 2,676,502 | ||||
|
| |||||
Liability Derivatives | ||||||
Interest rate contracts | Payables, Net Assets - Unrealized depreciation | $ | — | * | ||
Foreign exchange contracts | Payables | (28,409 | ) | |||
Credit contracts | Payables | — | ||||
Equity contracts | Payables, Net Assets - Unrealized depreciation | — | * | |||
Commodity contracts | Payables | — | ||||
Other contracts | Payables | — | ||||
|
| |||||
Total | $ | (28,409 | ) | |||
|
| |||||
| * | Includes cumulative appreciation/depreciation of futures contracts as reported in the Portfolio of Investments. Only current day’s variation margin is reported within the Statement of Assets & Liabilities. |
See Notes to Financial Statements.
77
AXA PREMIER VIP TRUST
MULTIMANAGER INTERNATIONAL EQUITY PORTFOLIO
PORTFOLIO OF INVESTMENTS (Continued)
December 31, 2013
The effect of Derivative Instruments on the Statement of Operations for the year ended December 31, 2013:
| Amount of Realized Gain or (Loss) on Derivatives Recognized in Income | ||||||||||||||||||||
Derivatives Not Accounted for as | Options | Futures | Forward Currency Contracts | Swaps | Total | |||||||||||||||
Interest rate contracts | $ | — | $ | — | $ | — | $ | — | $ | — | ||||||||||
Foreign exchange contracts | — | — | 741,450 | — | 741,450 | |||||||||||||||
Credit contracts | — | — | — | — | — | |||||||||||||||
Equity contracts | — | 23,687,113 | — | — | 23,687,113 | |||||||||||||||
Commodity contracts | — | — | — | — | — | |||||||||||||||
Other contracts | — | — | — | — | — | |||||||||||||||
|
|
|
|
|
|
|
|
|
| |||||||||||
Total | $ | — | $ | 23,687,113 | $ | 741,450 | $ | — | $ | 24,428,563 | ||||||||||
|
|
|
|
|
|
|
|
|
| |||||||||||
| Amount of Unrealized Appreciation or (Depreciation) on Derivatives Recognized in Income | ||||||||||||||||||||
Derivatives Not Accounted for as | Options | Futures | Forward Currency Contracts | Swaps | Total | |||||||||||||||
Interest rate contracts | $ | — | $ | — | $ | — | $ | — | $ | — | ||||||||||
Foreign exchange contracts | — | — | (167,742 | ) | — | (167,742 | ) | |||||||||||||
Credit contracts | — | — | — | — | — | |||||||||||||||
Equity contracts | — | (442,081 | ) | — | — | (442,081 | ) | |||||||||||||
Commodity contracts | — | — | — | — | — | |||||||||||||||
Other contracts | — | — | — | — | — | |||||||||||||||
|
|
|
|
|
|
|
|
|
| |||||||||||
Total | $ | — | $ | (442,081 | ) | $ | (167,742 | ) | $ | — | $ | (609,823 | ) | |||||||
|
|
|
|
|
|
|
|
|
| |||||||||||
^ This Portfolio held forward foreign currency and futures contracts as a substitute for investing in conventional securities, hedging and in an attempt to enhance returns.
The Portfolio held forward foreign currency contracts with an average settlement value of approximately $11,933,000 and futures contracts with an average notional balance of approximately $101,545,000 for the year ended December 31, 2013.
The following table presents the Portfolio’s gross derivative assets and liabilities by counterparty net of amounts available for offset under netting arrangements and any related collateral received or pledged by the Portfolio as of December 31, 2013:
Counterparty | Gross Amount of Derivative Assets Presented in the Statement of Assets and Liabilities (a) | Derivatives Available for Offset | Collateral Received | Net Amount Due from Counterparty | ||||||||||||
Exchange Traded Futures & Options Contracts (b) | $ | 2,676,502 (c | ) | $ | — | $ | — | $ | 2,676,502 | |||||||
|
|
|
|
|
|
|
| |||||||||
Counterparty | Gross Amount of Derivative Liabilities Presented in the Statement of Assets and Liabilities (a) | Derivatives Available for Offset | Collateral Pledged | Net Amount Due to Counterparty | ||||||||||||
Credit Suisse | $ | 27,495 | $ | — | $ | — | $ | 27,495 | ||||||||
State Street Bank & Trust | 914 | — | — | 914 | ||||||||||||
|
|
|
|
|
|
|
| |||||||||
| $ | 28,409 | $ | — | $ | — | $ | 28,409 | |||||||||
|
|
|
|
|
|
|
| |||||||||
| (a) | For financial reporting purposes the Portfolio does not offset derivative assets and derivative liabilities subject to master netting arrangements in the Statement of Assets and Liabilities. |
| (b) | These derivatives are traded on an exchange, therefore they are not subject to master netting arrangements. |
| (c) | This amount represents the cumulative appreciation (depreciation) of futures contracts as reported in the Portfolio of Investments. The Statement of Assets and Liabilities only reflects the current day variation margin receivable/payable to brokers for futures contracts. |
See Notes to Financial Statements.
78
AXA PREMIER VIP TRUST
MULTIMANAGER INTERNATIONAL EQUITY PORTFOLIO
PORTFOLIO OF INVESTMENTS (Continued)
December 31, 2013
Investment security transactions for the year ended December 31, 2013 were as follows:
Cost of Purchases: | ||||
Long-term investments other than U.S. government debt securities | $ | 162,352,856 | ||
Net Proceeds of Sales and Redemptions: | ||||
Long-term investments other than U.S. government debt securities | $ | 267,935,852 |
As of December 31, 2013, the gross unrealized appreciation (depreciation) of investments based on the aggregate cost of investments for Federal income tax purposes was as follows:
Aggregate gross unrealized appreciation | $ | 85,423,856 | ||
Aggregate gross unrealized depreciation | (10,158,798 | ) | ||
|
| |||
Net unrealized appreciation | $ | 75,265,058 | ||
|
| |||
Federal income tax cost of investments | $ | 208,401,048 | ||
|
|
The Portfolio has a net capital loss carryforward of $1,051,476,094 of which $79,721,486 expires in the year 2016 and $971,754,608 expires in the year 2017. The Portfolio utilized net capital loss carryforward of $47,357,294 during 2013.
The Portfolio utilized net capital loss carryforward under the provisions of the Regulated Investment Company Modernization Act of 2010 of $763,049 for Short Term and $9,006,540 for Long Term during 2013.
See Notes to Financial Statements.
79
AXA PREMIER VIP TRUST
MULTIMANAGER INTERNATIONAL EQUITY PORTFOLIO
STATEMENT OF ASSETS AND LIABILITIES
December 31, 2013
ASSETS | ||||
Investments at value: | ||||
Affiliated Issuers (Cost $315,975) | $ | 436,589 | ||
Unaffiliated Issuers (Cost $205,412,435) | 283,229,517 | |||
Cash | 12,066,649 | |||
Foreign cash (Cost $56,104,318) | 51,299,555 | |||
Cash held as collateral at broker | 4,189,000 | |||
Receivable for securities sold | 1,344,255 | |||
Dividends, interest and other receivables | 1,254,435 | |||
Due from broker for futures variation margin | 189,595 | |||
Receivable from Separate Accounts for Trust shares sold | 82,206 | |||
Other assets | 1,901 | |||
|
| |||
Total assets | 354,093,702 | |||
|
| |||
LIABILITIES | ||||
Payable to Separate Accounts for Trust shares redeemed | 224,953 | |||
Investment management fees payable | 195,916 | |||
Payable for securities purchased | 112,675 | |||
Administrative fees payable | 76,344 | |||
Trustees’ fees payable | 34,359 | |||
Unrealized depreciation on forward foreign currency contracts | 28,409 | |||
Distribution fees payable - Class B | 21,977 | |||
Distribution fees payable - Class A | 2,845 | |||
Accrued expenses | 131,205 | |||
|
| |||
Total liabilities | 828,683 | |||
|
| |||
NET ASSETS | $ | 353,265,019 | ||
|
| |||
Net assets were comprised of: | ||||
Paid in capital | $ | 1,358,685,009 | ||
Accumulated undistributed net investment income (loss) | (519,478 | ) | ||
Accumulated undistributed net realized gain (loss) on investments, futures and foreign currency transactions | (1,080,723,166 | ) | ||
Net unrealized appreciation (depreciation) on investments, futures and foreign currency translations | 75,822,654 | |||
|
| |||
Net assets | $ | 353,265,019 | ||
|
| |||
Class A | ||||
Net asset value, offering and redemption price per share, $13,704,389 / 1,138,735 shares outstanding (unlimited amount authorized: $0.001 par value) | $ | 12.03 | ||
|
| |||
Class B | ||||
Net asset value, offering and redemption price per share, $106,515,068 / 8,867,746 shares outstanding (unlimited amount authorized: $0.001 par value) | $ | 12.01 | ||
|
| |||
Class K | ||||
Net asset value, offering and redemption price per share, $233,045,562 / 19,365,240 shares outstanding (unlimited amount authorized: $0.001 par value) | $ | 12.03 | ||
|
|
STATEMENT OF OPERATIONS
For the Year Ended December 31, 2013
INVESTMENT INCOME | ||||
Dividends ($27,173 of dividend income received from affiliates) (net of $920,062 foreign withholding tax) | $ | 11,808,844 | ||
Interest | 64,878 | |||
|
| |||
Total income | 11,873,722 | |||
|
| |||
EXPENSES | ||||
Investment management fees | 4,585,952 | |||
Administrative fees | 841,959 | |||
Distribution fees - Class B | 684,232 | |||
Custodian fees | 265,100 | |||
Professional fees | 79,676 | |||
Printing and mailing expenses | 61,427 | |||
Distribution fees - Class A | 32,169 | |||
Trustees’ fees | 13,458 | |||
Miscellaneous | 197,022 | |||
|
| |||
Gross expenses | 6,760,995 | |||
Less: Waiver from investment manager | (374,445 | ) | ||
Fees paid indirectly | (32,600 | ) | ||
|
| |||
Net expenses | 6,353,950 | |||
|
| |||
NET INVESTMENT INCOME (LOSS) | 5,519,772 | |||
|
| |||
REALIZED AND UNREALIZED GAIN (LOSS) | ||||
Realized gain (loss) on: Investments ($(22,804) of realized gain (loss) from affiliates) | 75,393,471 | |||
Futures | 23,687,113 | |||
Foreign currency transactions | (901,126 | ) | ||
|
| |||
Net realized gain (loss) | 98,179,458 | |||
|
| |||
Change in unrealized appreciation (depreciation) on: Investments ($202,961 of change in unrealized appreciation (depreciation) from affiliates) | (30,914,340 | ) | ||
Futures | (442,081 | ) | ||
Foreign currency translations | (5,674,428 | ) | ||
|
| |||
Net change in unrealized appreciation (depreciation) | (37,030,849 | ) | ||
|
| |||
NET REALIZED AND UNREALIZED GAIN (LOSS) | 61,148,609 | |||
|
| |||
NET INCREASE (DECREASE) IN NET ASSETS RESULTING FROM OPERATIONS | $ | 66,668,381 | ||
|
|
See Notes to Financial Statements.
80
AXA PREMIER VIP TRUST
MULTIMANAGER INTERNATIONAL EQUITY PORTFOLIO
STATEMENT OF CHANGES IN NET ASSETS
| Year Ended December 31, | ||||||||
| 2013 | 2012 | |||||||
INCREASE (DECREASE) IN NET ASSETS FROM OPERATIONS: | ||||||||
Net investment income (loss) | $ | 5,519,772 | $ | 9,935,697 | ||||
Net realized gain (loss) on investments, futures and foreign currency transactions | 98,179,458 | 33,488,361 | ||||||
Net change in unrealized appreciation (depreciation) on investments, futures and foreign currency translations | (37,030,849 | ) | 79,694,841 | |||||
|
|
|
| |||||
NET INCREASE (DECREASE) IN NET ASSETS RESULTING FROM OPERATIONS | 66,668,381 | 123,118,899 | ||||||
|
|
|
| |||||
DIVIDENDS: | ||||||||
Dividends from net investment income | ||||||||
Class A | (153,657 | ) | (166,961 | ) | ||||
Class B | (1,188,449 | ) | (6,209,773 | ) | ||||
Class K | (3,167,330 | ) | (4,833,330 | ) | ||||
|
|
|
| |||||
TOTAL DIVIDENDS | (4,509,436 | ) | (11,210,064 | ) | ||||
|
|
|
| |||||
CAPITAL SHARES TRANSACTIONS: | ||||||||
Class A | ||||||||
Capital shares sold [ 137,073 and 72,228 shares, respectively ] | 1,513,830 | 686,041 | ||||||
Capital shares issued in reinvestment of dividends [ 13,325 and 16,291 shares, respectively ] | 153,657 | 166,961 | ||||||
Capital shares repurchased [ (195,020) and (181,957) shares, respectively ] | (2,172,196 | ) | (1,738,020 | ) | ||||
|
|
|
| |||||
Total Class A transactions | (504,709 | ) | (885,018 | ) | ||||
|
|
|
| |||||
Class B | ||||||||
Capital shares sold [ 2,112,883 and 3,096,586 shares, respectively ] | 23,009,784 | 29,240,314 | ||||||
Capital shares issued in reinvestment of dividends [ 103,264 and 607,084 shares, respectively ] | 1,188,449 | 6,209,773 | ||||||
Capital shares repurchased [ (4,991,250) and (7,815,664) shares, respectively ] | (54,131,008 | ) | (74,451,766 | ) | ||||
Capital shares repurchased in-kind (Note 10)[ (32,482,272) and 0 shares, respectively ] | (336,328,768 | ) | — | |||||
|
|
|
| |||||
Total Class B transactions | (366,261,543 | ) | (39,001,679 | ) | ||||
|
|
|
| |||||
Class K | ||||||||
Capital shares sold [ 256,300 and 149,048 shares, respectively ] | 2,991,808 | 1,467,615 | ||||||
Capital shares issued in reinvestment of dividends [ 274,715 and 471,082 shares, respectively ] | 3,167,330 | 4,833,330 | ||||||
Capital shares repurchased [ (10,185,616) and (5,127,342) shares, respectively ] | (113,396,415 | ) | (49,240,272 | ) | ||||
|
|
|
| |||||
Total Class K transactions | (107,237,277 | ) | (42,939,327 | ) | ||||
|
|
|
| |||||
NET INCREASE (DECREASE) IN NET ASSETS RESULTING FROM CAPITAL SHARE TRANSACTIONS | (474,003,529 | ) | (82,826,024 | ) | ||||
|
|
|
| |||||
TOTAL INCREASE (DECREASE) IN NET ASSETS | (411,844,584 | ) | 29,082,811 | |||||
NET ASSETS: | ||||||||
Beginning of year | 765,109,603 | 736,026,792 | ||||||
|
|
|
| |||||
End of year (a) | $ | 353,265,019 | $ | 765,109,603 | ||||
|
|
|
|
| ||||
(a) Includes accumulated undistributed (overdistributed) net investment income (loss) of | $ | (519,478 | ) | $ | (1,389,148 | ) | ||
|
|
|
| |||||
See Notes to Financial Statements.
81
AXA PREMIER VIP TRUST
MULTIMANAGER INTERNATIONAL EQUITY PORTFOLIO
FINANCIAL HIGHLIGHTS
| Year Ended December 31, | ||||||||||||||||||||
| Class A | 2013 | 2012 | 2011 | 2010 | 2009 | |||||||||||||||
Net asset value, beginning of year | $ | 10.30 | $ | 8.87 | $ | 11.04 | $ | 10.62 | $ | 8.29 | ||||||||||
|
|
|
|
|
|
|
|
|
| |||||||||||
Income (loss) from investment operations: | ||||||||||||||||||||
Net investment income (loss) | 0.07 | (e) | 0.12 | (e) | 0.20 | (e) | 0.13 | (e) | 0.14 | (e) | ||||||||||
Net realized and unrealized gain (loss) on investments, futures and foreign currency transactions | 1.80 | 1.45 | (2.17 | ) | 0.64 | 2.37 | ||||||||||||||
|
|
|
|
|
|
|
|
|
| |||||||||||
Total from investment operations | 1.87 | 1.57 | (1.97 | ) | 0.77 | 2.51 | ||||||||||||||
|
|
|
|
|
|
|
|
|
| |||||||||||
Less distributions: | ||||||||||||||||||||
Dividends from net investment income | (0.14 | ) | (0.14 | ) | (0.20 | ) | (0.35 | ) | (0.18 | ) | ||||||||||
|
|
|
|
|
|
|
|
|
| |||||||||||
Net asset value, end of year | $ | 12.03 | $ | 10.30 | $ | 8.87 | $ | 11.04 | $ | 10.62 | ||||||||||
|
|
|
|
|
|
|
|
|
| |||||||||||
Total return | 18.18 | % | 17.73 | % | (17.84 | )% | 7.32 | % | 30.28 | % | ||||||||||
|
|
|
|
|
|
|
|
|
| |||||||||||
Ratios/Supplemental Data: | ||||||||||||||||||||
Net assets, end of year (000’s) | $ | 13,704 | $ | 12,193 | $ | 11,328 | $ | 416,772 | $ | 592,797 | ||||||||||
Ratio of expenses to average net assets: | ||||||||||||||||||||
After waivers and reimbursements (f) | 1.30 | % | 1.30 | % | 1.04 | % | 1.04 | % | 0.97 | % | ||||||||||
After waivers, reimbursements and fees paid indirectly (f) | 1.30 | % | 1.30 | % | 1.04 | % | 1.04 | % | 0.97 | % | ||||||||||
Before waivers, reimbursements and fees paid indirectly (f) | 1.40 | % | 1.31 | % | 1.04 | % | 1.04 | % | 1.06 | % | ||||||||||
Ratio of net investment income (loss) to average net assets: | ||||||||||||||||||||
After waivers and reimbursements (f) | 0.65 | % | 1.22 | % | 1.81 | % | 1.29 | % | 1.65 | % | ||||||||||
After waivers, reimbursements and fees paid indirectly (f) | 0.65 | % | 1.22 | % | 1.81 | % | 1.29 | % | 1.65 | % | ||||||||||
Before waivers, reimbursements and fees paid indirectly (f) | 0.55 | % | 1.22 | % | 1.81 | % | 1.29 | % | 1.56 | % | ||||||||||
Portfolio turnover rate | 38 | % | 22 | % | 55 | % | 47 | % | 87 | % | ||||||||||
| Year Ended December 31, | ||||||||||||||||||||
| Class B | 2013 | 2012 | 2011 | 2010 | 2009 | |||||||||||||||
Net asset value, beginning of year | $ | 10.29 | $ | 8.86 | $ | 11.02 | $ | 10.61 | $ | 8.28 | ||||||||||
|
|
|
|
|
|
|
|
|
| |||||||||||
Income (loss) from investment operations: | ||||||||||||||||||||
Net investment income (loss) | 0.12 | (e) | 0.12 | (e) | 0.13 | (e) | 0.11 | (e) | 0.15 | (e) | ||||||||||
Net realized and unrealized gain (loss) on investments, futures and foreign currency transactions | 1.74 | 1.45 | (2.11 | ) | 0.62 | 2.33 | ||||||||||||||
|
|
|
|
|
|
|
|
|
| |||||||||||
Total from investment operations | 1.86 | 1.57 | (1.98 | ) | 0.73 | 2.48 | ||||||||||||||
|
|
|
|
|
|
|
|
|
| |||||||||||
Less distributions: | ||||||||||||||||||||
Dividends from net investment income | (0.14 | ) | (0.14 | ) | (0.18 | ) | (0.32 | ) | (0.15 | ) | ||||||||||
|
|
|
|
|
|
|
|
|
| |||||||||||
Net asset value, end of year | $ | 12.01 | $ | 10.29 | $ | 8.86 | $ | 11.02 | $ | 10.61 | ||||||||||
|
|
|
|
|
|
|
|
|
| |||||||||||
Total return | 18.10 | % | 17.74 | % | (17.99 | )% | 6.95 | % | 29.99 | % | ||||||||||
|
|
|
|
|
|
|
|
|
| |||||||||||
Ratios/Supplemental Data: | ||||||||||||||||||||
Net assets, end of year (000’s) | $ | 106,515 | $ | 453,899 | $ | 427,242 | $ | 575,326 | $ | 594,043 | ||||||||||
Ratio of expenses to average net assets: | ||||||||||||||||||||
After waivers and reimbursements (f) | 1.30 | % | 1.30 | % | 1.29 | % | 1.29 | % | 1.25 | % | ||||||||||
After waivers, reimbursements and fees paid indirectly (f) | 1.29 | % | 1.30 | % | 1.29 | % | 1.29 | % | 1.25 | % | ||||||||||
Before waivers, reimbursements and fees paid indirectly (f) | 1.35 | % | 1.31 | % | 1.29 | % | 1.29 | % | 1.31 | %(c) | ||||||||||
Ratio of net investment income (loss) to average net assets: | ||||||||||||||||||||
After waivers and reimbursements (f) | 1.12 | % | 1.23 | % | 1.22 | % | 1.09 | % | 1.66 | % | ||||||||||
After waivers, reimbursements and fees paid indirectly (f) | 1.13 | % | 1.23 | % | 1.22 | % | 1.09 | % | 1.66 | % | ||||||||||
Before waivers, reimbursements and fees paid indirectly (f) | 1.07 | % | 1.22 | % | 1.22 | % | 1.09 | % | 1.62 | % | ||||||||||
Portfolio turnover rate | 38 | % | 22 | % | 55 | % | 47 | % | 87 | % | ||||||||||
See Notes to Financial Statements.
82
AXA PREMIER VIP TRUST
MULTIMANAGER INTERNATIONAL EQUITY PORTFOLIO
FINANCIAL HIGHLIGHTS (Continued)
| Year Ended December 31, | August 26, 2011* to December 31, 2011 | |||||||||||
| Class K | 2013 | 2012 | ||||||||||
Net asset value, beginning of period | $ | 10.30 | $ | 8.87 | $ | 9.52 | ||||||
|
|
|
|
|
| |||||||
Income (loss) from investment operations: | ||||||||||||
Net investment income (loss) | 0.10 | (e) | 0.14 | (e) | 0.02 | (e) | ||||||
Net realized and unrealized gain (loss) on investments, futures and foreign currency transactions | 1.80 | 1.46 | (0.51 | ) | ||||||||
|
|
|
|
|
| |||||||
Total from investment operations | 1.90 | 1.60 | (0.49 | ) | ||||||||
|
|
|
|
|
| |||||||
Less distributions: | ||||||||||||
Dividends from net investment income | (0.17 | ) | (0.17 | ) | (0.16 | ) | ||||||
|
|
|
|
|
| |||||||
Net asset value, end of period | $ | 12.03 | $ | 10.30 | $ | 8.87 | ||||||
|
|
|
|
|
| |||||||
Total return (b) | 18.48 | % | 18.02 | % | (5.11 | )% | ||||||
|
|
|
|
|
| |||||||
Ratios/Supplemental Data: | ||||||||||||
Net assets, end of period (000’s) | $ | 233,046 | $ | 299,017 | $ | 297,457 | ||||||
Ratio of expenses to average net assets: | ||||||||||||
After waivers and reimbursements (a)(f) | 1.05 | % | 1.05 | % | 1.06 | % | ||||||
After waivers, reimbursements and fees paid indirectly (a)(f) | 1.05 | % | 1.05 | % | 1.06 | % | ||||||
Before waivers, reimbursements and fees paid indirectly (a)(f) | 1.15 | % | 1.06 | % | 1.06 | % | ||||||
Ratio of net investment income (loss) to average net assets: | ||||||||||||
After waivers and reimbursements (a)(f) | 0.92 | % | 1.48 | % | 0.57 | % | ||||||
After waivers, reimbursements and fees paid indirectly (a)(f) | 0.93 | % | 1.48 | % | 0.57 | % | ||||||
Before waivers, reimbursements and fees paid indirectly (a)(f) | 0.83 | % | 1.48 | % | 0.57 | % | ||||||
Portfolio turnover rate | 38 | % | 22 | % | 55 | % | ||||||
| * | Commencement of Operations. |
| (a) | Ratios for periods less than one year are annualized. |
| (b) | Total returns for periods less than one year are not annualized. |
| (c) | Reflects overall fund ratios for non-class specific expenses. |
| (e) | Net investment income (loss) per share is based on average shares outstanding. |
| (f) | Expenses do not include the expenses of the underlying funds (“indirect expenses”). |
See Notes to Financial Statements.
83
MULTIMANAGER LARGE CAP CORE EQUITY PORTFOLIO (Unaudited)
PORTFOLIO ADVISERS
| Ø | AllianceBernstein L.P. |
| Ø | Janus Capital Management LLC |
| Ø | Thornburg Investment Management, Inc. |
PERFORMANCE RESULTS
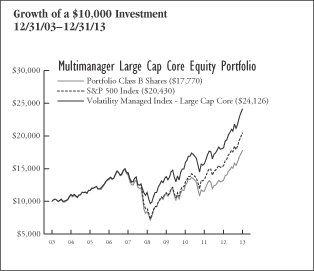
| Annualized Total Returns as of 12/31/13 | ||||||||||||
| 1 Year | 5 Years | 10 Years/ Since Incept. | ||||||||||
Portfolio – Class A Shares* | 34.31 | % | 16.26 | % | 6.14 | % | ||||||
Portfolio – Class B Shares* | 34.22 | 16.07 | 5.92 | |||||||||
Portfolio – Class K Shares** | 34.65 | N/A | 21.80 | |||||||||
S&P 500 Index | 32.39 | 17.94 | 7.41 | |||||||||
Volatility Managed Index – Large Cap Core | 32.39 | 16.27 | 9.21 | |||||||||
* Date of inception 12/31/01.
** Date of inception 8/26/11.
Returns for periods greater than one year are annualized. |
| |||||||||||
Past performance is not indicative of future results.
PERFORMANCE SUMMARY
The Portfolio’s Class A shares returned 34.31% for the year ended December 31, 2013. The Portfolio’s benchmarks, the S&P 500 Index, returned 32.39%, and the Volatility Managed Index — Large Cap Core returned 32.39%, over the same period.
The following commentary describes key factors (such as stock selection and sector allocation decisions) that helped or hurt the Portfolio’s performance relative to its primary benchmark.
Portfolio Highlights
For the year ended December 31, 2013
What helped performance during the year:
| • | Individual stock selection was the most important contributor to relative performance across multiple sectors of the Portfolio. |
| • | The top individual Portfolio contributors were Health Care holdings Gilead Sciences, Inc. and Thermo Fisher Scientific, Inc. and Gogo Inc., a provider of in-flight wireless technology, in the Information Technology sector. |
| • | A relative overweight in the Consumer Discretionary sector was also positive. |
| • | Health Care holdings Valeant Pharmaceutical International, Inc. and Community Health Systems were additive to relative performance. |
| • | An underweight to weak performing global technology company International Business Machines Corp. was positive for the Portfolio. |
| • | The two top contributors for the year within the Financials sector were Hartford Financial Services, Inc. and MetLife, Inc. . Within Telecommunication Services, Japanese firm Softbank Corp. was a notable contributor. |
What hurt performance during the year:
| • | Holdings in the Industrials and Energy sectors weighed the most on relative performance. Industrial holding ADT Corporation was the leading relative detractor. |
| • | Utilities holding Exelon Corp, Materials holding Newcrest Mining Ltd., Consumer Discretionary holding Life Time Fitness, Inc., Information Technology holding Liquidity Services, Inc. and Industrials holding Covanta Holding Corp. were also top detractors. |
| • | From a sector perspective, the Portfolio’s underweight position in the Industrials sector detracted from relative performance. |
84
MULTIMANAGER LARGE CAP CORE EQUITY PORTFOLIO (Unaudited)
Sector Weightings as of December 31, 2013 | % of Net Assets | |||
Information Technology | 17.9 | % | ||
Consumer Discretionary | 14.6 | |||
Health Care | 13.9 | |||
Financials | 12.9 | |||
Energy | 9.1 | |||
Industrials | 8.7 | |||
Consumer Staples | 7.4 | |||
Telecommunication Services | 2.9 | |||
Materials | 2.8 | |||
Utilities | 2.0 | |||
Cash and Other | 7.8 | |||
|
| |||
| 100.0 | % | |||
|
| |||
UNDERSTANDING YOUR EXPENSES:
As a shareholder of the Portfolio, you incur two types of costs:
(1)transaction costs, including applicable sales charges and redemption fees; and (2)ongoing costs, including management fees, distribution (12b-1) fees (in the case of Class A and Class B shares of the Trust), and other Portfolio expenses. These examples are intended to help you understand your ongoing costs (in dollars) of investing in the Portfolio and to compare these costs with the ongoing costs of investing in other mutual funds.
The examples are based on an investment of $1,000 invested at the beginning of the six-month period ended December 31, 2013 and held for the entire six-month period.
Actual Expenses
The first line of the table to the right provides information about actual account values and actual expenses. You may use the information in this line, together with the amount you invested, to estimate the expenses that you paid over the period. Simply divide your account value by $1,000 (for example, an $8,600 account value divided by $1,000 = 8.6), then multiply the result by the number in the first line under the heading entitled ‘‘Expenses Paid During Period’’ to estimate the expenses you paid on your account during this period.
Hypothetical Example for Comparison Purposes
The second line of the table below provides information about hypothetical account values and hypothetical expenses based on the Portfolio’s actual expense ratio and an assumed rate of return of 5% per year before expenses, which is not the Portfolio’s actual return. The hypothetical account values and expenses may not be used to estimate the actual ending account balance or expenses you paid for the period. You may use this information to compare the ongoing costs of investing in the Portfolio and other funds. To do so, compare this 5% hypothetical example with the 5% hypothetical examples that appear in the shareholder reports of the other funds.
Please note that the expenses shown in the table are meant to highlight your ongoing costs only and do not reflect any transactional costs, such as sales charges (loads), redemption fees, or exchange fees. Therefore, the second line of the table is useful in comparing ongoing costs only, and will not help you determine the relative total costs of owning different funds. In addition, if these transactional costs were included, your costs would have been higher. Also note that the table does not reflect any variable life insurance or variable annuity contract-related fees and expenses, which would increase overall fees and expenses.
EXAMPLE
| Beginning Account Value 7/1/13 | Ending Account Value 12/31/13 | Expenses Paid During Period* 7/1/13 - 12/31/13 | ||||||||||
Class A | ||||||||||||
Actual | $1,000.00 | $1,183.67 | $6.37 | |||||||||
Hypothetical (5% average annual return before expenses) | 1,000.00 | 1,019.37 | 5.89 | |||||||||
Class B | ||||||||||||
Actual | 1,000.00 | 1,182.84 | 6.39 | |||||||||
Hypothetical (5% average annual return before expenses) | 1,000.00 | 1,019.35 | 5.91 | |||||||||
Class K | ||||||||||||
Actual | 1,000.00 | 1,185.66 | 5.00 | |||||||||
Hypothetical (5% average annual return before expenses) | 1,000.00 | 1,020.63 | 4.62 | |||||||||
* Expenses are equal to the Portfolio’s Class A, Class B and Class K shares annualized expense ratios of 1.15%, 1.15%, and 0.90%, respectively, multiplied by the average account value over the period, and multiplied by 184/365 (to reflect the one-half year period). |
| |||||||||||
85
AXA PREMIER VIP TRUST
MULTIMANAGER LARGE CAP CORE EQUITY PORTFOLIO
PORTFOLIO OF INVESTMENTS
December 31, 2013
| Number of Shares | Value (Note 1) | |||||||
COMMON STOCKS: | ||||||||
Consumer Discretionary (14.6%) |
| |||||||
Auto Components (0.6%) | ||||||||
BorgWarner, Inc | 3,628 | $ | 202,842 | |||||
Delphi Automotive plc | 38,899 | 2,338,997 | ||||||
Goodyear Tire & Rubber Co | 3,773 | 89,986 | ||||||
Johnson Controls, Inc | 10,697 | 548,756 | ||||||
Lear Corp | 2,600 | 210,522 | ||||||
TRW Automotive Holdings Corp.* | 6,500 | 483,535 | ||||||
|
| |||||||
| 3,874,638 | ||||||||
|
| |||||||
Automobiles (0.6%) |
| |||||||
Ford Motor Co | 112,095 | 1,729,626 | ||||||
General Motors Co.* | 36,377 | 1,486,728 | ||||||
Harley-Davidson, Inc | 3,432 | 237,632 | ||||||
|
| |||||||
| 3,453,986 | ||||||||
|
| |||||||
Distributors (0.0%) | ||||||||
Genuine Parts Co | 2,409 | 200,405 | ||||||
|
| |||||||
Diversified Consumer Services (0.3%) |
| |||||||
Bright Horizons Family Solutions, Inc.* | 46,484 | 1,707,822 | ||||||
H&R Block, Inc | 4,175 | 121,242 | ||||||
|
| |||||||
| 1,829,064 | ||||||||
|
| |||||||
Hotels, Restaurants & Leisure (3.0%) |
| |||||||
Carnival Corp | 6,804 | 273,317 | ||||||
Chipotle Mexican Grill, Inc.* | 560 | 298,357 | ||||||
Darden Restaurants, Inc | 2,007 | 109,120 | ||||||
International Game Technology | 3,794 | 68,899 | ||||||
Las Vegas Sands Corp | 40,714 | 3,211,113 | ||||||
Life Time Fitness, Inc.* | 48,346 | 2,272,262 | ||||||
Marriott International, Inc., Class A | 3,462 | 170,884 | ||||||
McDonald’s Corp | 18,044 | 1,750,809 | ||||||
MGM Resorts International* | 102,800 | 2,417,856 | ||||||
Starbucks Corp | 80,903 | 6,341,986 | ||||||
Starwood Hotels & Resorts Worldwide, Inc | 2,951 | 234,457 | ||||||
Wyndham Worldwide Corp | 2,068 | 152,391 | ||||||
Wynn Resorts Ltd | 1,285 | 249,560 | ||||||
Yum! Brands, Inc | 6,965 | 526,624 | ||||||
|
| |||||||
| 18,077,635 | ||||||||
|
| |||||||
Household Durables (1.0%) | ||||||||
D.R. Horton, Inc.* | 4,355 | 97,204 | ||||||
Garmin Ltd | 23,018 | 1,063,892 | ||||||
Harman International Industries, Inc | 1,044 | 85,451 | ||||||
Leggett & Platt, Inc | 2,168 | 67,078 | ||||||
Lennar Corp., Class A | 2,589 | 102,421 | ||||||
Mohawk Industries, Inc.* | 1,000 | 148,900 | ||||||
Newell Rubbermaid, Inc | 4,416 | 143,123 | ||||||
PulteGroup, Inc | 40,224 | 819,363 | ||||||
Tupperware Brands Corp | 35,959 | 3,399,204 | ||||||
Whirlpool Corp | 1,204 | 188,859 | ||||||
|
| |||||||
| 6,115,495 | ||||||||
|
| |||||||
Internet & Catalog Retail (1.7%) | ||||||||
Amazon.com, Inc.* | 11,719 | 4,673,420 | ||||||
Expedia, Inc | 1,585 | 110,411 | ||||||
Netflix, Inc.* | 983 | $ | 361,911 | |||||
priceline.com, Inc.* | 4,360 | 5,068,064 | ||||||
TripAdvisor, Inc.* | 1,746 | 144,621 | ||||||
|
| |||||||
| 10,358,427 | ||||||||
|
| |||||||
Leisure Equipment & Products (0.1%) |
| |||||||
Hasbro, Inc | 1,766 | 97,148 | ||||||
Mattel, Inc | 5,218 | 248,272 | ||||||
|
| |||||||
| 345,420 | ||||||||
|
| |||||||
Media (3.1%) | ||||||||
Cablevision Systems Corp. - New York Group, Class A | 3,292 | 59,025 | ||||||
CBS Corp. (Non-Voting), Class B | 48,196 | 3,072,013 | ||||||
Comcast Corp., Class A | 49,226 | 2,558,029 | ||||||
DIRECTV* | 7,614 | 526,051 | ||||||
Discovery Communications, Inc., Class A* | 3,567 | 322,528 | ||||||
Gannett Co., Inc | 24,332 | 719,740 | ||||||
Graham Holdings Co., Class B* | 80 | 53,066 | ||||||
Interpublic Group of Cos., Inc | 6,444 | 114,059 | ||||||
Liberty Global plc* | 5,941 | 500,945 | ||||||
Liberty Global plc, Class A* | 3,399 | 302,477 | ||||||
News Corp., Class A* | 7,687 | 138,520 | ||||||
Omnicom Group, Inc | 3,994 | 297,034 | ||||||
Regal Entertainment Group, Class A | 9,072 | 176,450 | ||||||
Scripps Networks Interactive, Inc., Class A | 1,665 | 143,873 | ||||||
Time Warner Cable, Inc | 4,432 | 600,536 | ||||||
Time Warner, Inc | 18,373 | 1,280,966 | ||||||
Twenty-First Century Fox, Inc., Class A | 122,871 | 4,322,602 | ||||||
Viacom, Inc., Class B | 14,406 | 1,258,220 | ||||||
Walt Disney Co | 25,490 | 1,947,436 | ||||||
|
| |||||||
| 18,393,570 | ||||||||
|
| |||||||
Multiline Retail (0.4%) | ||||||||
Dollar General Corp.* | 4,549 | 274,396 | ||||||
Dollar Tree, Inc.* | 3,249 | 183,309 | ||||||
Family Dollar Stores, Inc | 1,525 | 99,079 | ||||||
Kohl’s Corp | 3,172 | 180,011 | ||||||
Macy’s, Inc | 18,882 | 1,008,299 | ||||||
Nordstrom, Inc | 2,228 | 137,690 | ||||||
Target Corp | 9,816 | 621,058 | ||||||
|
| |||||||
| 2,503,842 | ||||||||
|
| |||||||
Specialty Retail (2.8%) |
| |||||||
AutoNation, Inc.* | 962 | 47,802 | ||||||
AutoZone, Inc.* | 12,704 | 6,071,750 | ||||||
Bed Bath & Beyond, Inc.* | 3,313 | 266,034 | ||||||
Best Buy Co., Inc | 4,194 | 167,257 | ||||||
CarMax, Inc.* | 3,515 | 165,275 | ||||||
GameStop Corp., Class A | 13,047 | 642,695 | ||||||
Gap, Inc | 4,076 | 159,290 | ||||||
Home Depot, Inc | 33,263 | 2,738,875 | ||||||
L Brands, Inc | 3,793 | 234,597 | ||||||
Lowe’s Cos., Inc | 22,765 | 1,128,006 | ||||||
O’Reilly Automotive, Inc.* | 1,647 | 211,985 | ||||||
PetSmart, Inc | 1,614 | 117,419 | ||||||
Ross Stores, Inc | 3,352 | 251,165 | ||||||
Staples, Inc | 10,217 | 162,348 | ||||||
Tiffany & Co | 1,747 | 162,087 | ||||||
See Notes to Financial Statements.
86
AXA PREMIER VIP TRUST
MULTIMANAGER LARGE CAP CORE EQUITY PORTFOLIO
PORTFOLIO OF INVESTMENTS (Continued)
December 31, 2013
| Number of Shares | Value (Note 1) | |||||||
TJX Cos., Inc. | 63,134 | $ | 4,023,530 | |||||
Urban Outfitters, Inc.* | 1,643 | 60,955 | ||||||
|
| |||||||
| 16,611,070 | ||||||||
|
| |||||||
Textiles, Apparel & Luxury Goods (1.0%) |
| |||||||
Coach, Inc. | 4,316 | 242,257 | ||||||
Fossil Group, Inc.* | 780 | 93,553 | ||||||
Michael Kors Holdings Ltd.* | 2,807 | 227,900 | ||||||
NIKE, Inc., Class B | 57,668 | 4,535,012 | ||||||
PVH Corp. | 1,333 | 181,315 | ||||||
Ralph Lauren Corp. | 963 | 170,037 | ||||||
VF Corp. | 5,460 | 340,376 | ||||||
|
| |||||||
| 5,790,450 | ||||||||
|
| |||||||
Total Consumer Discretionary | 87,554,002 | |||||||
|
| |||||||
Consumer Staples (7.4%) |
| |||||||
Beverages (1.2%) | ||||||||
Beam, Inc. | 2,589 | 176,208 | ||||||
Brown-Forman Corp., Class B | 2,528 | 191,041 | ||||||
Coca-Cola Co. | 59,272 | 2,448,526 | ||||||
Coca-Cola Enterprises, Inc. | 3,755 | 165,708 | ||||||
Constellation Brands, Inc., Class A* | 2,648 | 186,366 | ||||||
Diageo plc (ADR) | 9,065 | 1,200,387 | ||||||
Dr. Pepper Snapple Group, Inc. | 3,111 | 151,568 | ||||||
Molson Coors Brewing Co., Class B | 2,409 | 135,266 | ||||||
Monster Beverage Corp.* | 2,109 | 142,927 | ||||||
PepsiCo, Inc. | 31,266 | 2,593,202 | ||||||
|
| |||||||
| 7,391,199 | ||||||||
|
| |||||||
Food & Staples Retailing (2.6%) |
| |||||||
Costco Wholesale Corp. | 6,844 | 814,504 | ||||||
CVS Caremark Corp. | 25,393 | 1,817,377 | ||||||
Koninklijke Ahold N.V | 44,391 | 796,947 | ||||||
Kroger Co. | 34,630 | 1,368,924 | ||||||
Safeway, Inc. | 3,793 | 123,538 | ||||||
Sysco Corp. | 9,072 | 327,499 | ||||||
Walgreen Co. | 126,907 | 7,289,538 | ||||||
Wal-Mart Stores, Inc. | 32,864 | 2,586,068 | ||||||
Whole Foods Market, Inc. | 5,799 | 335,356 | ||||||
|
| |||||||
| 15,459,751 | ||||||||
|
| |||||||
Food Products (1.5%) | ||||||||
Archer-Daniels-Midland Co. | 10,196 | 442,507 | ||||||
Campbell Soup Co. | 2,730 | 118,154 | ||||||
ConAgra Foods, Inc. | 6,562 | 221,139 | ||||||
General Mills, Inc. | 9,835 | 490,865 | ||||||
Hershey Co. | 2,328 | 226,352 | ||||||
Hormel Foods Corp. | 2,107 | 95,173 | ||||||
J.M. Smucker Co. | 1,686 | 174,703 | ||||||
Kellogg Co. | 4,054 | 247,578 | ||||||
Kraft Foods Group, Inc. | 11,901 | 641,702 | ||||||
McCormick & Co., Inc. | 2,087 | 143,836 | ||||||
Mead Johnson Nutrition Co. | 3,125 | 261,750 | ||||||
Mondelez International, Inc., Class A | 156,550 | 5,526,215 | ||||||
Tyson Foods, Inc., Class A | 4,216 | 141,067 | ||||||
|
| |||||||
| 8,731,041 | ||||||||
|
| |||||||
Household Products (1.2%) | ||||||||
Clorox Co. | 2,007 | $ | 186,169 | |||||
Colgate-Palmolive Co. | 33,112 | 2,159,234 | ||||||
Kimberly-Clark Corp. | 8,330 | 870,152 | ||||||
Procter & Gamble Co. | 52,511 | 4,274,920 | ||||||
|
| |||||||
| 7,490,475 | ||||||||
|
| |||||||
Personal Products (0.1%) |
| |||||||
Avon Products, Inc. | 6,764 | 116,476 | ||||||
Estee Lauder Cos., Inc., Class A | 3,993 | 300,753 | ||||||
|
| |||||||
| 417,229 | ||||||||
|
| |||||||
Tobacco (0.8%) | ||||||||
Altria Group, Inc. | 31,171 | 1,196,655 | ||||||
Lorillard, Inc. | 5,721 | 289,940 | ||||||
Philip Morris International, Inc. | 37,757 | 3,289,767 | ||||||
Reynolds American, Inc. | 4,858 | 242,852 | ||||||
|
| |||||||
| 5,019,214 | ||||||||
|
| |||||||
Total Consumer Staples | 44,508,909 | |||||||
|
| |||||||
Energy (9.1%) | ||||||||
Energy Equipment & Services (1.9%) |
| |||||||
Baker Hughes, Inc. | 6,894 | 380,962 | ||||||
Cameron International Corp.* | 3,673 | 218,654 | ||||||
Diamond Offshore Drilling, Inc. | 1,044 | 59,424 | ||||||
Dresser-Rand Group, Inc.* | 61,400 | 3,661,282 | ||||||
Ensco plc, Class A | 3,621 | 207,049 | ||||||
FMC Technologies, Inc.* | 3,693 | 192,812 | ||||||
Frank’s International N.V | 67,906 | 1,833,462 | ||||||
Halliburton Co. | 29,471 | 1,495,653 | ||||||
Helmerich & Payne, Inc. | 1,700 | 142,936 | ||||||
Nabors Industries Ltd. | 3,996 | 67,892 | ||||||
National Oilwell Varco, Inc. | 6,683 | 531,499 | ||||||
Noble Corp. plc | 3,948 | 147,932 | ||||||
Rowan Cos., plc, Class A* | 1,927 | 68,139 | ||||||
Schlumberger Ltd. | 20,539 | 1,850,769 | ||||||
Transocean Ltd. | 5,219 | 257,923 | ||||||
|
| |||||||
| 11,116,388 | ||||||||
|
| |||||||
Oil, Gas & Consumable Fuels (7.2%) |
| |||||||
Anadarko Petroleum Corp. | 7,888 | 625,676 | ||||||
Antero Resources Corp.* | 25,900 | 1,643,096 | ||||||
Apache Corp. | 6,202 | 533,000 | ||||||
Bankers Petroleum Ltd.* | 266,381 | 1,095,867 | ||||||
Cabot Oil & Gas Corp. | 6,522 | 252,793 | ||||||
Chesapeake Energy Corp. | 7,828 | 212,452 | ||||||
Chevron Corp. | 62,332 | 7,785,890 | ||||||
ConocoPhillips Co. | 19,086 | 1,348,426 | ||||||
CONSOL Energy, Inc. | 3,552 | 135,118 | ||||||
Denbury Resources, Inc.* | 5,725 | 94,062 | ||||||
Devon Energy Corp. | 5,961 | 368,807 | ||||||
EOG Resources, Inc. | 4,275 | 717,516 | �� | |||||
EQT Corp. | 2,328 | 209,008 | ||||||
Exxon Mobil Corp.# | 75,886 | 7,679,663 | ||||||
Hess Corp. | 18,176 | 1,508,608 | ||||||
HollyFrontier Corp. | 66,500 | 3,304,385 | ||||||
INPEX Corp. | 133,600 | 1,710,121 | ||||||
Kinder Morgan, Inc. | 10,431 | 375,516 | ||||||
Marathon Oil Corp. | 10,819 | 381,911 | ||||||
Marathon Petroleum Corp. | 14,659 | 1,344,670 | ||||||
Murphy Oil Corp. | 2,690 | 174,527 | ||||||
See Notes to Financial Statements.
87
AXA PREMIER VIP TRUST
MULTIMANAGER LARGE CAP CORE EQUITY PORTFOLIO
PORTFOLIO OF INVESTMENTS (Continued)
December 31, 2013
| Number of Shares | Value (Note 1) | |||||||
Newfield Exploration Co.* | 2,087 | $ | 51,403 | |||||
Noble Energy, Inc. | 5,559 | 378,623 | ||||||
Occidental Petroleum Corp. | 22,905 | 2,178,265 | ||||||
Pacific Rubiales Energy Corp. | 44,021 | 760,033 | ||||||
Peabody Energy Corp. | 4,194 | 81,909 | ||||||
Phillips 66 | 12,204 | 941,294 | ||||||
Pioneer Natural Resources Co. | 2,227 | 409,924 | ||||||
QEP Resources, Inc. | 2,787 | 85,422 | ||||||
Range Resources Corp. | 2,589 | 218,279 | ||||||
Southwestern Energy Co.* | 5,479 | 215,489 | ||||||
Spectra Energy Corp. | 10,416 | 371,018 | ||||||
Tesoro Corp. | 2,068 | 120,978 | ||||||
Total S.A | 72,122 | 4,418,188 | ||||||
Valero Energy Corp. | 25,810 | 1,300,824 | ||||||
Williams Cos., Inc. | 10,634 | 410,153 | ||||||
WPX Energy, Inc.* | 3,051 | 62,179 | ||||||
|
| |||||||
| 43,505,093 | ||||||||
|
| |||||||
Total Energy | 54,621,481 | |||||||
|
| |||||||
Financials (12.9%) | ||||||||
Capital Markets (1.2%) |
| |||||||
Ameriprise Financial, Inc. | 3,092 | 355,735 | ||||||
Bank of New York Mellon Corp. | 17,905 | 625,601 | ||||||
BlackRock, Inc. | 1,977 | 625,661 | ||||||
Blackstone Group LP | 29,865 | 940,747 | ||||||
Charles Schwab Corp. | 18,040 | 469,040 | ||||||
E*TRADE Financial Corp.* | 17,002 | 333,919 | ||||||
Franklin Resources, Inc. | 6,304 | 363,930 | ||||||
Goldman Sachs Group, Inc. | 8,630 | 1,529,754 | ||||||
Invesco Ltd. | 6,824 | 248,394 | ||||||
Legg Mason, Inc. | 1,647 | 71,611 | ||||||
Morgan Stanley | 21,555 | 675,965 | ||||||
Northern Trust Corp. | 3,472 | 214,882 | ||||||
State Street Corp. | 9,054 | 664,473 | ||||||
T. Rowe Price Group, Inc. | 4,034 | 337,928 | ||||||
|
| |||||||
| 7,457,640 | ||||||||
|
| |||||||
Commercial Banks (2.0%) |
| |||||||
BB&T Corp. | 10,958 | 408,952 | ||||||
CIT Group, Inc. | 13,900 | 724,607 | ||||||
Comerica, Inc. | 2,870 | 136,440 | ||||||
Fifth Third BanCorp | 13,710 | 288,321 | ||||||
First Republic Bank/California | 47,700 | 2,497,095 | ||||||
Huntington Bancshares, Inc./Ohio | 12,947 | 124,938 | ||||||
KeyCorp | 13,912 | 186,699 | ||||||
M&T Bank Corp. | 2,047 | 238,312 | ||||||
PNC Financial Services Group, Inc. | 8,339 | 646,940 | ||||||
Regions Financial Corp. | 21,437 | 212,012 | ||||||
SunTrust Banks, Inc. | 8,269 | 304,382 | ||||||
U.S. Bancorp/Minnesota | 32,604 | 1,317,201 | ||||||
Wells Fargo & Co. | 104,009 | 4,722,009 | ||||||
Zions Bancorp | 2,810 | 84,188 | ||||||
|
| |||||||
| 11,892,096 | ||||||||
|
| |||||||
Consumer Finance (0.9%) |
| |||||||
American Express Co. | 31,558 | 2,863,257 | ||||||
Capital One Financial Corp. | 20,192 | 1,546,909 | ||||||
Discover Financial Services | 19,348 | 1,082,521 | ||||||
SLM Corp. | 6,726 | 176,759 | ||||||
|
| |||||||
| 5,669,446 | ||||||||
|
| |||||||
Diversified Financial Services (3.2%) |
| |||||||
Bank of America Corp. | 254,179 | $ | 3,957,567 | |||||
Citigroup, Inc. | 73,967 | 3,854,420 | ||||||
CME Group, Inc./Illinois | 4,937 | 387,357 | ||||||
ING US, Inc. | 4,700 | 165,205 | ||||||
IntercontinentalExchange Group, Inc.. | 1,866 | 419,701 | ||||||
JPMorgan Chase & Co. | 160,330 | 9,376,099 | ||||||
Leucadia National Corp. | 4,851 | 137,477 | ||||||
McGraw Hill Financial, Inc. | 5,435 | 425,017 | ||||||
Moody’s Corp. | 2,970 | 233,056 | ||||||
NASDAQ OMX Group, Inc. | 1,766 | 70,287 | ||||||
|
| |||||||
| 19,026,186 | ||||||||
|
| |||||||
Insurance (4.5%) | ||||||||
ACE Ltd. | 5,371 | 556,060 | ||||||
Aflac, Inc. | 7,226 | 482,697 | ||||||
Allstate Corp. | 7,066 | 385,380 | ||||||
American Financial Group, Inc./Ohio | 9,800 | 565,656 | ||||||
American International Group, Inc. | 43,170 | 2,203,828 | ||||||
Aon plc | 14,178 | 1,189,392 | ||||||
Assurant, Inc. | 6,104 | 405,122 | ||||||
Berkshire Hathaway, Inc., Class B* | 28,154 | 3,337,938 | ||||||
Chubb Corp. | 12,294 | 1,187,969 | ||||||
Cincinnati Financial Corp. | 2,248 | 117,728 | ||||||
Everest Reinsurance Group Ltd. | 1,100 | 171,457 | ||||||
Genworth Financial, Inc., Class A* | 42,547 | 660,755 | ||||||
Hartford Financial Services Group, Inc.. | 130,271 | 4,719,718 | ||||||
Lincoln National Corp. | 17,755 | 916,513 | ||||||
Loews Corp. | 4,717 | 227,548 | ||||||
Marsh & McLennan Cos., Inc. | 8,530 | 412,511 | ||||||
MetLife, Inc. | 123,414 | 6,654,483 | ||||||
PartnerReinsurance Ltd. | 6,904 | 727,889 | ||||||
Principal Financial Group, Inc. | 4,255 | 209,814 | ||||||
Progressive Corp. | 8,571 | 233,731 | ||||||
Prudential Financial, Inc. | 7,226 | 666,382 | ||||||
Torchmark Corp. | 1,445 | 112,927 | ||||||
Travelers Cos., Inc. | 7,748 | 701,504 | ||||||
Unum Group | 4,035 | 141,548 | ||||||
XL Group plc | 4,337 | 138,090 | ||||||
|
| |||||||
| 27,126,640 | ||||||||
|
| |||||||
Real Estate Investment Trusts (REITs) (0.8%) |
| |||||||
American Tower Corp. (REIT) | 6,202 | 495,044 | ||||||
Apartment Investment & Management Co. (REIT), Class A | 2,248 | 58,246 | ||||||
AvalonBay Communities, Inc. (REIT) | 1,925 | 227,593 | ||||||
Boston Properties, Inc. (REIT) | 2,428 | 243,698 | ||||||
Equity Residential (REIT) | 5,256 | 272,629 | ||||||
General Growth Properties, Inc. (REIT) . | 8,394 | 168,468 | ||||||
HCP, Inc. (REIT) | 7,064 | 256,564 | ||||||
Health Care REIT, Inc. (REIT) | 4,532 | 242,779 | ||||||
Host Hotels & Resorts, Inc. (REIT) | 11,726 | 227,953 | ||||||
Kimco Realty Corp. (REIT) | 6,362 | 125,650 | ||||||
Macerich Co. (REIT) | 2,152 | 126,731 | ||||||
See Notes to Financial Statements.
88
AXA PREMIER VIP TRUST
MULTIMANAGER LARGE CAP CORE EQUITY PORTFOLIO
PORTFOLIO OF INVESTMENTS (Continued)
December 31, 2013
| Number of Shares | Value (Note 1) | |||||||
Plum Creek Timber Co., Inc. (REIT) | 2,689 | $ | 125,065 | |||||
Prologis, Inc. (REIT) | 7,703 | 284,626 | ||||||
Public Storage (REIT) | 2,248 | 338,369 | ||||||
Simon Property Group, Inc. (REIT) | 4,844 | 737,063 | ||||||
Ventas, Inc. (REIT) | 4,583 | 262,514 | ||||||
Vornado Realty Trust (REIT) | 2,724 | 241,864 | ||||||
Weyerhaeuser Co. (REIT) | 9,087 | 286,877 | ||||||
|
| |||||||
| 4,721,733 | ||||||||
|
| |||||||
Real Estate Management & Development (0.0%) |
| |||||||
CBRE Group, Inc., Class A* | 4,256 | 111,933 | ||||||
|
| |||||||
Thrifts & Mortgage Finance (0.3%) |
| |||||||
Essent Group Ltd.* | 69,846 | 1,680,495 | ||||||
Hudson City Bancorp, Inc. | 7,406 | 69,839 | ||||||
People’s United Financial, Inc. | 4,879 | 73,770 | ||||||
|
| |||||||
| 1,824,104 | ||||||||
|
| |||||||
Total Financials | 77,829,778 | |||||||
|
| |||||||
Health Care (13.9%) | ||||||||
Biotechnology (3.7%) | ||||||||
Alexion Pharmaceuticals, Inc.* | 3,035 | 403,837 | ||||||
Amgen, Inc. | 11,826 | 1,350,056 | ||||||
Biogen Idec, Inc.* | 3,693 | 1,033,117 | ||||||
Celgene Corp.* | 29,289 | 4,948,669 | ||||||
Gilead Sciences, Inc.* | 166,259 | 12,494,364 | ||||||
Regeneron Pharmaceuticals, Inc.* | 1,287 | 354,234 | ||||||
Vertex Pharmaceuticals, Inc.* | 18,972 | 1,409,620 | ||||||
|
| |||||||
| 21,993,897 | ||||||||
|
| |||||||
Health Care Equipment & Supplies (1.1%) |
| |||||||
Abbott Laboratories | 24,126 | 924,750 | ||||||
Baxter International, Inc. | 8,510 | 591,871 | ||||||
Becton, Dickinson and Co. | 3,031 | 334,895 | ||||||
Boston Scientific Corp.* | 20,817 | 250,220 | ||||||
C.R. Bard, Inc. | 1,204 | 161,264 | ||||||
CareFusion Corp.* | 3,212 | 127,902 | ||||||
Covidien plc | 9,395 | 639,799 | ||||||
DENTSPLY International, Inc. | 2,168 | 105,105 | ||||||
Edwards Lifesciences Corp.* | 1,697 | 111,595 | ||||||
Intuitive Surgical, Inc.* | 642 | 246,579 | ||||||
Medtronic, Inc. | 32,616 | 1,871,832 | ||||||
St. Jude Medical, Inc. | 4,517 | 279,828 | ||||||
Stryker Corp. | 4,596 | 345,343 | ||||||
Varian Medical Systems, Inc.* | 1,686 | 130,985 | ||||||
Zimmer Holdings, Inc. | 2,630 | 245,090 | ||||||
|
| |||||||
| 6,367,058 | ||||||||
|
| |||||||
Health Care Providers & Services (2.3%) |
| |||||||
Aetna, Inc. | 15,149 | 1,039,070 | ||||||
AmerisourceBergen Corp. | 3,554 | 249,882 | ||||||
Cardinal Health, Inc. | 5,299 | 354,026 | ||||||
Cigna Corp. | 4,316 | 377,564 | ||||||
DaVita HealthCare Partners, Inc.* | 2,730 | 173,000 | ||||||
Express Scripts Holding Co.* | 122,824 | 8,627,158 | ||||||
Health Net, Inc.* | 7,788 | 231,070 | ||||||
Humana, Inc. | 2,489 | 256,914 | ||||||
Laboratory Corp. of America Holdings* | 1,325 | 121,065 | ||||||
McKesson Corp. | 3,593 | $ | 579,910 | |||||
Patterson Cos., Inc. | 1,285 | 52,942 | ||||||
Quest Diagnostics, Inc. | 2,289 | 122,553 | ||||||
Tenet Healthcare Corp.* | 1,506 | 63,433 | ||||||
UnitedHealth Group, Inc. | 15,676 | 1,180,403 | ||||||
WellPoint, Inc. | 5,958 | 550,460 | ||||||
|
| |||||||
| 13,979,450 | ||||||||
|
| |||||||
Health Care Technology (0.0%) |
| |||||||
Cerner Corp.* | 4,612 | 257,073 | ||||||
|
| |||||||
Life Sciences Tools & Services (1.2%) |
| |||||||
Agilent Technologies, Inc. | 5,179 | 296,187 | ||||||
Life Technologies Corp.* | 2,730 | 206,934 | ||||||
PerkinElmer, Inc. | 1,666 | 68,689 | ||||||
Thermo Fisher Scientific, Inc. | 60,078 | 6,689,685 | ||||||
Waters Corp.* | 1,365 | 136,500 | ||||||
|
| |||||||
| 7,397,995 | ||||||||
|
| |||||||
Pharmaceuticals (5.6%) | ||||||||
AbbVie, Inc. | 24,826 | 1,311,061 | ||||||
Actavis plc* | 2,717 | 456,456 | ||||||
Allergan, Inc. | 18,271 | 2,029,543 | ||||||
Bristol-Myers Squibb Co. | 51,987 | 2,763,109 | ||||||
Eli Lilly and Co. | 15,416 | 786,216 | ||||||
Forest Laboratories, Inc.* | 3,713 | 222,891 | ||||||
GlaxoSmithKline plc (ADR) | 12,800 | 683,392 | ||||||
Hospira, Inc.* | 2,589 | 106,874 | ||||||
Johnson & Johnson | 60,411 | 5,533,044 | ||||||
Merck & Co., Inc. | 59,769 | 2,991,438 | ||||||
Mylan, Inc.* | 5,962 | 258,751 | ||||||
Perrigo Co. plc | 1,990 | 305,385 | ||||||
Pfizer, Inc. | 160,703 | 4,922,333 | ||||||
Roche Holding AG | 11,303 | 3,157,567 | ||||||
Roche Holding AG (ADR) | 7,065 | 495,963 | ||||||
Valeant Pharmaceuticals International, Inc.* | 20,695 | 2,429,593 | ||||||
Zoetis, Inc. | 162,154 | 5,300,814 | ||||||
|
| |||||||
| 33,754,430 | ||||||||
|
| |||||||
Total Health Care | 83,749,903 | |||||||
|
| |||||||
Industrials (8.7%) | ||||||||
Aerospace & Defense (1.9%) |
| |||||||
Boeing Co. | 32,586 | 4,447,663 | ||||||
General Dynamics Corp. | 5,238 | 500,491 | ||||||
Honeywell International, Inc. | 12,223 | 1,116,815 | ||||||
L-3 Communications Holdings, Inc. | 1,425 | 152,275 | ||||||
Lockheed Martin Corp. | 4,275 | 635,521 | ||||||
Northrop Grumman Corp. | 4,739 | 543,137 | ||||||
Precision Castparts Corp. | 7,135 | 1,921,455 | ||||||
Raytheon Co. | 5,038 | 456,947 | ||||||
Rockwell Collins, Inc. | 2,068 | 152,867 | ||||||
Textron, Inc. | 4,335 | 159,355 | ||||||
United Technologies Corp. | 13,206 | 1,502,843 | ||||||
|
| |||||||
| 11,589,369 | ||||||||
|
| |||||||
Air Freight & Logistics (0.3%) |
| |||||||
C.H. Robinson Worldwide, Inc. | 2,389 | 139,374 | ||||||
Expeditors International of Washington, Inc. | 3,211 | 142,087 | ||||||
FedEx Corp. | 4,696 | 675,144 | ||||||
See Notes to Financial Statements.
89
AXA PREMIER VIP TRUST
MULTIMANAGER LARGE CAP CORE EQUITY PORTFOLIO
PORTFOLIO OF INVESTMENTS (Continued)
December 31, 2013
| Number of Shares | Value (Note 1) | |||||||
United Parcel Service, Inc., Class B | 11,159 | $ | 1,172,588 | |||||
|
| |||||||
| 2,129,193 | ||||||||
|
| |||||||
Airlines (0.6%) | ||||||||
American Airlines Group, Inc.* | 104,000 | 2,626,000 | ||||||
Delta Air Lines, Inc. | 23,731 | 651,891 | ||||||
Southwest Airlines Co. | 10,881 | 204,998 | ||||||
|
| |||||||
| 3,482,889 | ||||||||
|
| |||||||
Building Products (0.0%) | ||||||||
Allegion plc* | 1,372 | 60,629 | ||||||
Masco Corp. | 5,559 | 126,578 | ||||||
|
| |||||||
| 187,207 | ||||||||
|
| |||||||
Commercial Services & Supplies (1.6%) |
| |||||||
ADT Corp. | 84,375 | 3,414,656 | ||||||
ARAMARK Holdings Corp.* | 112,732 | 2,955,833 | ||||||
Cintas Corp. | 1,546 | 92,126 | ||||||
Covanta Holding Corp. | 110,700 | 1,964,925 | ||||||
Iron Mountain, Inc. | 2,591 | 78,637 | ||||||
Pitney Bowes, Inc. | 3,091 | 72,021 | ||||||
Republic Services, Inc. | 4,176 | 138,643 | ||||||
Stericycle, Inc.* | 1,325 | 153,925 | ||||||
Tyco International Ltd. | 7,261 | 297,992 | ||||||
Waste Management, Inc. | 6,744 | 302,603 | ||||||
|
| |||||||
| 9,471,361 | ||||||||
|
| |||||||
Construction & Engineering (0.1%) |
| |||||||
Fluor Corp. | 2,569 | 206,265 | ||||||
Jacobs Engineering Group, Inc.* | 2,007 | 126,421 | ||||||
Quanta Services, Inc.* | 3,292 | 103,896 | ||||||
|
| |||||||
| 436,582 | ||||||||
|
| |||||||
Electrical Equipment (0.3%) |
| |||||||
AMETEK, Inc. | 3,787 | 199,461 | ||||||
Eaton Corp. plc | 7,446 | 566,790 | ||||||
Emerson Electric Co. | 10,940 | 767,769 | ||||||
Rockwell Automation, Inc. | 2,168 | 256,171 | ||||||
Roper Industries, Inc. | 1,525 | 211,487 | ||||||
|
| |||||||
| 2,001,678 | ||||||||
|
| |||||||
Industrial Conglomerates (1.4%) |
| |||||||
3M Co. | 11,375 | 1,595,344 | ||||||
Danaher Corp. | 9,372 | 723,518 | ||||||
General Electric Co. | 209,942 | 5,884,674 | ||||||
|
| |||||||
| 8,203,536 | ||||||||
|
| |||||||
Machinery (0.9%) | ||||||||
Caterpillar, Inc. | 9,916 | 900,472 | ||||||
Cummins, Inc. | 2,730 | 384,848 | ||||||
Deere & Co. | 6,002 | 548,163 | ||||||
Dover Corp. | 2,710 | 261,623 | ||||||
Flowserve Corp. | 2,209 | 174,136 | ||||||
Illinois Tool Works, Inc. | 17,372 | 1,460,638 | ||||||
Ingersoll-Rand plc | 5,581 | 343,790 | ||||||
Joy Global, Inc. | 1,615 | 94,461 | ||||||
PACCAR, Inc. | 5,559 | 328,926 | ||||||
Pall Corp. | 1,766 | 150,728 | ||||||
Parker Hannifin Corp. | 3,091 | 397,626 | ||||||
Pentair Ltd. (Registered) | 3,149 | 244,583 | ||||||
Snap-on, Inc. | 883 | 96,706 | ||||||
Stanley Black & Decker, Inc. | 2,431 | $ | 196,157 | |||||
Xylem, Inc. | 2,810 | 97,226 | ||||||
|
| |||||||
| 5,680,083 | ||||||||
|
| |||||||
Professional Services (0.4%) |
| |||||||
Dun & Bradstreet Corp. | 623 | 76,473 | ||||||
Equifax, Inc. | 1,847 | 127,609 | ||||||
Nielsen Holdings N.V | 45,274 | 2,077,624 | ||||||
Robert Half International, Inc. | 2,128 | 89,355 | ||||||
|
| |||||||
| 2,371,061 | ||||||||
|
| |||||||
Road & Rail (0.9%) | ||||||||
CSX Corp. | 15,757 | 453,329 | ||||||
Kansas City Southern | 1,710 | 211,749 | ||||||
Norfolk Southern Corp. | 4,878 | 452,825 | ||||||
Ryder System, Inc. | 803 | 59,245 | ||||||
Union Pacific Corp. | 24,543 | 4,123,224 | ||||||
|
| |||||||
| 5,300,372 | ||||||||
|
| |||||||
Trading Companies & Distributors (0.3%) |
| |||||||
Fastenal Co. | 4,275 | 203,105 | ||||||
Fly Leasing Ltd. (ADR) | 69,588 | 1,118,279 | ||||||
W.W. Grainger, Inc. | 963 | 245,970 | ||||||
|
| |||||||
| 1,567,354 | ||||||||
|
| |||||||
Total Industrials | 52,420,685 | |||||||
|
| |||||||
Information Technology (17.9%) |
| |||||||
Communications Equipment (1.2%) |
| |||||||
Cisco Systems, Inc. | 105,970 | 2,379,027 | ||||||
F5 Networks, Inc.* | 1,204 | 109,395 | ||||||
Harris Corp. | 10,666 | 744,593 | ||||||
Juniper Networks, Inc.* | 7,809 | 176,249 | ||||||
Motorola Solutions, Inc. | 3,592 | 242,460 | ||||||
QUALCOMM, Inc. | 49,355 | 3,664,609 | ||||||
|
| |||||||
| 7,316,333 | ||||||||
|
| |||||||
Computers & Peripherals (3.8%) |
| |||||||
Apple, Inc. | 33,580 | 18,842,074 | ||||||
EMC Corp. | 32,115 | 807,692 | ||||||
Hewlett-Packard Co. | 74,624 | 2,087,979 | ||||||
NetApp, Inc. | 5,320 | 218,865 | ||||||
SanDisk Corp. | 3,493 | 246,396 | ||||||
Seagate Technology plc | 5,119 | 287,483 | ||||||
Western Digital Corp. | 3,252 | 272,843 | ||||||
|
| |||||||
| 22,763,332 | ||||||||
|
| |||||||
Electronic Equipment, Instruments & Components (1.5%) |
| |||||||
Amphenol Corp., Class A | 33,777 | 3,012,233 | ||||||
Arrow Electronics, Inc.* | 8,189 | 444,253 | ||||||
CDW Corp. | 85,000 | 1,985,600 | ||||||
Corning, Inc. | 22,541 | 401,681 | ||||||
FLIR Systems, Inc. | 2,128 | 64,053 | ||||||
Jabil Circuit, Inc. | 2,790 | 48,658 | ||||||
TE Connectivity Ltd. | 60,659 | 3,342,917 | ||||||
|
| |||||||
| 9,299,395 | ||||||||
|
| |||||||
Internet Software & Services (4.4%) |
| |||||||
Akamai Technologies, Inc.* | 2,730 | 128,801 | ||||||
eBay, Inc.* | 38,893 | 2,134,837 | ||||||
Facebook, Inc., Class A* | 74,877 | 4,092,777 | ||||||
Google, Inc., Class A* | 13,193 | 14,785,527 | ||||||
Marin Software, Inc.* | 40,500 | 414,720 | ||||||
See Notes to Financial Statements.
90
AXA PREMIER VIP TRUST
MULTIMANAGER LARGE CAP CORE EQUITY PORTFOLIO
PORTFOLIO OF INVESTMENTS (Continued)
December 31, 2013
| Number of Shares | Value (Note 1) | |||||||
VeriSign, Inc.* | 74,324 | $ | 4,443,089 | |||||
Yahoo!, Inc.* | 14,737 | 595,964 | ||||||
|
| |||||||
| 26,595,715 | ||||||||
|
| |||||||
IT Services (2.2%) | ||||||||
Accenture plc, Class A | 9,911 | 814,882 | ||||||
Alliance Data Systems Corp.* | 800 | 210,344 | ||||||
Amdocs Ltd. | 9,072 | 374,129 | ||||||
Automatic Data Processing, Inc. | 7,566 | 611,409 | ||||||
Cognizant Technology Solutions Corp., Class A* | 4,756 | 480,261 | ||||||
Computer Sciences Corp. | 2,228 | 124,501 | ||||||
Fidelity National Information Services, Inc. | 4,554 | 244,459 | ||||||
Fiserv, Inc.* | 4,174 | 246,475 | ||||||
International Business Machines Corp. | 19,351 | 3,629,667 | ||||||
MasterCard, Inc., Class A | 4,999 | 4,176,465 | ||||||
Paychex, Inc. | 5,078 | 231,201 | ||||||
Teradata Corp.* | 2,549 | 115,954 | ||||||
Total System Services, Inc. | 2,589 | 86,162 | ||||||
Visa, Inc., Class A | 7,993 | 1,779,881 | ||||||
Western Union Co. | 8,613 | 148,574 | ||||||
|
| |||||||
| 13,274,364 | ||||||||
|
| |||||||
Office Electronics (0.2%) |
| |||||||
Xerox Corp. | 84,115 | 1,023,680 | ||||||
|
| |||||||
Semiconductors & Semiconductor Equipment (1.3%) |
| |||||||
Altera Corp. | 4,997 | 162,552 | ||||||
Analog Devices, Inc. | 4,876 | 248,335 | ||||||
Applied Materials, Inc. | 52,107 | 921,773 | ||||||
ARM Holdings plc (ADR) | 28,642 | 1,567,863 | ||||||
Broadcom Corp., Class A | 8,348 | 247,518 | ||||||
First Solar, Inc.* | 1,083 | 59,175 | ||||||
Intel Corp. | 77,622 | 2,015,067 | ||||||
KLA-Tencor Corp. | 2,569 | 165,598 | ||||||
Lam Research Corp.* | 4,812 | 262,013 | ||||||
Linear Technology Corp. | 3,632 | 165,438 | ||||||
LSI Corp. | 8,490 | 93,560 | ||||||
Microchip Technology, Inc. | 3,070 | 137,382 | ||||||
Micron Technology, Inc.* | 30,836 | 670,991 | ||||||
NVIDIA Corp. | 8,954 | 143,443 | ||||||
Texas Instruments, Inc. | 17,082 | 750,071 | ||||||
Xilinx, Inc. | 4,114 | 188,915 | ||||||
|
| |||||||
| 7,799,694 | ||||||||
|
| |||||||
Software (3.3%) | ||||||||
Activision Blizzard, Inc. | 194,206 | 3,462,693 | ||||||
Adobe Systems, Inc.* | 7,247 | 433,951 | ||||||
Autodesk, Inc.* | 3,452 | 173,739 | ||||||
CA, Inc. | 4,999 | 168,216 | ||||||
Citrix Systems, Inc.* | 2,890 | 182,793 | ||||||
Electronic Arts, Inc.* | 35,797 | 821,183 | ||||||
Intuit, Inc. | 33,448 | 2,552,751 | ||||||
Microsoft Corp. | 217,747 | 8,150,270 | ||||||
Oracle Corp. | 76,008 | 2,908,066 | ||||||
Red Hat, Inc.* | 2,970 | 166,439 | ||||||
Salesforce.com, Inc.* | 8,628 | 476,179 | ||||||
Symantec Corp. | 17,938 | 422,978 | ||||||
|
| |||||||
| 19,919,258 | ||||||||
|
| |||||||
Total Information Technology | 107,991,771 | |||||||
|
| |||||||
Materials (2.8%) | ||||||||
Chemicals (2.4%) | ||||||||
Air Products and Chemicals, Inc. | 3,292 | $ | 367,980 | |||||
Airgas, Inc. | 1,024 | 114,534 | ||||||
CF Industries Holdings, Inc. | 963 | 224,418 | ||||||
Dow Chemical Co. | 18,946 | 841,202 | ||||||
E.I. du Pont de Nemours & Co. | 46,939 | 3,049,627 | ||||||
Eastman Chemical Co. | 2,428 | 195,940 | ||||||
Ecolab, Inc. | 4,262 | 444,399 | ||||||
FMC Corp. | 2,087 | 157,485 | ||||||
International Flavors & Fragrances, Inc. | 1,285 | 110,484 | ||||||
LyondellBasell Industries N.V., Class A | 70,474 | 5,657,653 | ||||||
Monsanto Co. | 8,269 | 963,752 | ||||||
Mosaic Co. | 5,255 | 248,404 | ||||||
PPG Industries, Inc. | 2,209 | 418,959 | ||||||
Praxair, Inc. | 4,656 | 605,420 | ||||||
Sherwin-Williams Co. | 1,365 | 250,477 | ||||||
Sigma-Aldrich Corp. | 1,847 | 173,636 | ||||||
Syngenta AG (ADR) | 10,094 | 806,914 | ||||||
|
| |||||||
| 14,631,284 | ||||||||
|
| |||||||
Construction Materials (0.0%) | ||||||||
Vulcan Materials Co. | 2,007 | 119,256 | ||||||
|
| |||||||
Containers & Packaging (0.1%) | ||||||||
Avery Dennison Corp. | 1,466 | 73,579 | ||||||
Ball Corp. | 2,209 | 114,117 | ||||||
Bemis Co., Inc. | 1,525 | 62,464 | ||||||
MeadWestvaco Corp. | 2,749 | 101,521 | ||||||
Owens-Illinois, Inc.* | 2,489 | 89,056 | ||||||
Sealed Air Corp. | 3,049 | 103,818 | ||||||
|
| |||||||
| 544,555 | ||||||||
|
| |||||||
Metals & Mining (0.2%) | ||||||||
Alcoa, Inc. | 16,658 | 177,075 | ||||||
Allegheny Technologies, Inc. | 1,606 | 57,222 | ||||||
Cliffs Natural Resources, Inc. | 2,368 | 62,065 | ||||||
Freeport-McMoRan Copper & Gold, Inc. | 16,192 | 611,086 | ||||||
Newmont Mining Corp. | 7,707 | 177,492 | ||||||
Nucor Corp. | 4,997 | 266,740 | ||||||
United States Steel Corp. | 2,168 | 63,956 | ||||||
|
| |||||||
| 1,415,636 | ||||||||
|
| |||||||
Paper & Forest Products (0.1%) |
| |||||||
International Paper Co. | 6,944 | 340,464 | ||||||
|
| |||||||
Total Materials | 17,051,195 | |||||||
|
| |||||||
Telecommunication Services (2.9%) |
| |||||||
Diversified Telecommunication Services (1.8%) |
| |||||||
AT&T, Inc. | 107,147 | 3,767,288 | ||||||
CenturyLink, Inc. | 9,141 | 291,141 | ||||||
Frontier Communications Corp. | 15,519 | 72,163 | ||||||
Level 3 Communications, Inc.* | 122,160 | 4,052,047 | ||||||
Verizon Communications, Inc. | 44,656 | 2,194,396 | ||||||
Windstream Holdings, Inc. | 9,272 | 73,991 | ||||||
|
| |||||||
| 10,451,026 | ||||||||
|
| |||||||
See Notes to Financial Statements.
91
AXA PREMIER VIP TRUST
MULTIMANAGER LARGE CAP CORE EQUITY PORTFOLIO
PORTFOLIO OF INVESTMENTS (Continued)
December 31, 2013
| Number of Shares | Value (Note 1) | |||||||
Wireless Telecommunication Services (1.1%) |
| |||||||
China Mobile Ltd. | 203,999 | $ | 2,115,152 | |||||
Crown Castle International Corp.* | 5,236 | 384,479 | ||||||
SoftBank Corp. | 20,685 | 1,807,065 | ||||||
Sprint Corp.* | 160,638 | 1,726,859 | ||||||
Vodafone Group plc (ADR) | 18,100 | 711,511 | ||||||
|
| |||||||
| 6,745,066 | ||||||||
|
| |||||||
Total Telecommunication Services | 17,196,092 | |||||||
|
| |||||||
Utilities (2.0%) | ||||||||
Electric Utilities (1.3%) |
| |||||||
American Electric Power Co., Inc. | 11,566 | 540,595 | ||||||
Duke Energy Corp. | 11,052 | 762,699 | ||||||
Edison International | 20,558 | 951,835 | ||||||
Entergy Corp. | 2,730 | 172,727 | ||||||
Exelon Corp. | 67,680 | 1,853,755 | ||||||
FirstEnergy Corp. | 6,523 | 215,129 | ||||||
ITC Holdings Corp. | 16,000 | 1,533,120 | ||||||
NextEra Energy, Inc. | 6,683 | 572,198 | ||||||
Northeast Utilities | 4,833 | 204,871 | ||||||
Pepco Holdings, Inc. | 3,832 | 73,306 | ||||||
Pinnacle West Capital Corp. | 1,686 | 89,223 | ||||||
PPL Corp. | 9,792 | 294,641 | ||||||
Southern Co. | 13,768 | 566,003 | ||||||
Xcel Energy, Inc. | 7,747 | 216,451 | ||||||
|
| |||||||
| 8,046,553 | ||||||||
|
| |||||||
Gas Utilities (0.1%) | ||||||||
AGL Resources, Inc. | 1,830 | 86,431 | ||||||
Atmos Energy Corp. | 9,795 | 444,889 | ||||||
ONEOK, Inc. | 3,173 | 197,297 | ||||||
|
| |||||||
| 728,617 | ||||||||
|
| |||||||
Independent Power Producers & Energy Traders (0.1%) |
| |||||||
AES Corp. | 10,254 | $ | 148,785 | |||||
NRG Energy, Inc. | 4,975 | 142,882 | ||||||
|
| |||||||
| 291,667 | ||||||||
|
| |||||||
Multi-Utilities (0.5%) | ||||||||
Ameren Corp. | 3,693 | 133,539 | ||||||
CenterPoint Energy, Inc. | 6,683 | 154,912 | ||||||
CMS Energy Corp. | 4,094 | 109,596 | ||||||
Consolidated Edison, Inc. | 4,596 | 254,067 | ||||||
Dominion Resources, Inc. | 9,011 | 582,922 | ||||||
DTE Energy Co. | 2,749 | 182,506 | ||||||
Integrys Energy Group, Inc. | 1,204 | 65,510 | ||||||
NiSource, Inc. | 4,816 | 158,350 | ||||||
PG&E Corp. | 6,983 | 281,275 | ||||||
Public Service Enterprise Group, Inc. | 7,888 | 252,732 | ||||||
SCANA Corp. | 2,207 | 103,574 | ||||||
Sempra Energy | 4,756 | 426,899 | ||||||
TECO Energy, Inc. | 3,131 | 53,978 | ||||||
Wisconsin Energy Corp. | 3,532 | 146,013 | ||||||
|
| |||||||
| 2,905,873 | ||||||||
|
| |||||||
Total Utilities | 11,972,710 | |||||||
|
| |||||||
Total Investments (92.2%) | $ | 554,896,526 | ||||||
Other Assets Less Liabilities (7.8%) | 47,234,631 | |||||||
|
| |||||||
Net Assets (100%) | $ | 602,131,157 | ||||||
|
| |||||||
| * | Non-income producing. |
| # | All, or a portion of security held by broker as collateral for financial futures contracts, with a total collateral value of $4,048,000. |
Glossary:
| ADR | — American Depositary Receipt |
At December 31, 2013, the Portfolio had the following futures contracts open: (Note 1)
Purchase | Number of Contracts | Expiration Date | Original Value | Value at 12/31/2013 | Unrealized Appreciation/ (Depreciation) | |||||||||||||||
S&P 500 E-Mini Index | 468 | March-14 | $ | 42,139,064 | $ | 43,081,740 | $ | 942,676 | ||||||||||||
|
| |||||||||||||||||||
See Notes to Financial Statements.
92
AXA PREMIER VIP TRUST
MULTIMANAGER LARGE CAP CORE EQUITY PORTFOLIO
PORTFOLIO OF INVESTMENTS (Continued)
December 31, 2013
The following is a summary of the inputs used to value the Portfolio’s assets and liabilities carried at fair value as of December 31, 2013:
The inputs or methodology used for valuing securities are not necessarily an indication of the risk associated with investing in those securities.
Various inputs are used in determining the value of the Portfolio’s investments. These inputs are summarized in the three broad levels listed below:
| Investment Type | Level 1 Securities | Level 2 Significant Other Observable Inputs (including quoted prices for similar securities, interest rates, prepayment speeds, credit risk, etc.)(a) | Level 3 Significant Unobservable Inputs (including the Portfolio’s own assumptions in determining the fair value of investments) | Total | ||||||||||||
Assets: | ||||||||||||||||
Common Stocks | ||||||||||||||||
Consumer Discretionary | $ | 87,554,002 | $ | — | $ | — | $ | 87,554,002 | ||||||||
Consumer Staples | 43,520,921 | 987,988 | — | 44,508,909 | ||||||||||||
Energy | 48,493,172 | 6,128,309 | — | 54,621,481 | ||||||||||||
Financials | 77,829,778 | — | — | 77,829,778 | ||||||||||||
Health Care | 80,592,336 | 3,157,567 | — | 83,749,903 | ||||||||||||
Industrials | 52,420,685 | — | — | 52,420,685 | ||||||||||||
Information Technology | 107,991,771 | — | — | 107,991,771 | ||||||||||||
Materials | 17,051,195 | — | — | 17,051,195 | ||||||||||||
Telecommunication Services | 13,273,875 | 3,922,217 | — | 17,196,092 | ||||||||||||
Utilities | 11,972,710 | — | — | 11,972,710 | ||||||||||||
Futures | 942,676 | — | — | 942,676 | ||||||||||||
|
|
|
|
|
|
|
| |||||||||
Total Assets | $ | 541,643,121 | $ | 14,196,081 | $ | — | $ | 555,839,202 | ||||||||
|
|
|
|
|
|
|
| |||||||||
Total Liabilities | $ | — | $ | — | $ | — | $ | — | ||||||||
|
|
|
|
|
|
|
| |||||||||
Total | $ | 541,643,121 | $ | 14,196,081 | $ | — | $ | 555,839,202 | ||||||||
|
|
|
|
|
|
|
| |||||||||
(a) A security with a market value of $191,041 transferred from Level 1 to Level 2 during the year ended December 31, 2013 due to inactive trading.
There were no additional transfers between Levels 1, 2 or 3 during the year ended December 31, 2013.
Fair Values of Derivative Instruments as of December 31, 2013:
Statement of Assets and Liabilities | ||||||
Derivatives Not Accounted for as Hedging Instrument^ | Asset Derivatives | Fair Value | ||||
Interest rate contracts | Receivables, Net assets - Unrealized appreciation | $ | — | * | ||
Foreign exchange contracts | Receivables | — | ||||
Credit contracts | Receivables | — | ||||
Equity contracts | Receivables, Net assets - Unrealized appreciation | 942,676 | * | |||
Commodity contracts | Receivables | — | ||||
Other contracts | Receivables | — | ||||
|
| |||||
Total | $ | 942,676 | ||||
|
| |||||
Liability Derivatives | ||||||
Interest rate contracts | Payables, Net assets - Unrealized depreciation | $ | — | * | ||
Foreign exchange contracts | Payables | — | ||||
Credit contracts | Payables | — | ||||
Equity contracts | Payables, Net assets - Unrealized depreciation | — | * | |||
Commodity contracts | Payables | — | ||||
Other contracts | Payables | — | ||||
|
| |||||
Total | $ | — | ||||
|
| |||||
| * | Includes cumulative appreciation/depreciation of futures contracts as reported in the Portfolio of Investments. Only current day’s variation margin is reported within the Statement of Assets & Liabilities. |
See Notes to Financial Statements.
93
AXA PREMIER VIP TRUST
MULTIMANAGER LARGE CAP CORE EQUITY PORTFOLIO
PORTFOLIO OF INVESTMENTS (Continued)
December 31, 2013
The effect of Derivative Instruments on the Statement of Operations for the year ended December 31, 2013:
| Amount of Realized Gain or (Loss) on Derivatives Recognized in Income | ||||||||||||||||||||
Derivatives Not Accounted for as Hedging Instruments^ | Options | Futures | Forward Currency Contracts | Swaps | Total | |||||||||||||||
Interest rate contracts | $ | — | $ | — | $ | — | $ | — | $ | — | ||||||||||
Foreign exchange contracts | — | — | — | — | — | |||||||||||||||
Credit contracts | — | — | — | — | — | |||||||||||||||
Equity contracts | — | 14,891,682 | — | — | 14,891,682 | |||||||||||||||
Commodity contracts | — | — | — | — | — | |||||||||||||||
Other contracts | — | — | — | — | — | |||||||||||||||
|
|
|
|
|
|
|
|
|
| |||||||||||
Total | $ | — | $ | 14,891,682 | $ | — | $ | — | $ | 14,891,682 | ||||||||||
|
|
|
|
|
|
|
|
|
| |||||||||||
| Amount of Unrealized Appreciation or (Depreciation) on Derivatives Recognized in Income | ||||||||||||||||||||
Derivatives Not Accounted for as Hedging Instruments^ | Options | Futures | Forward Currency Contracts | Swaps | Total | |||||||||||||||
Interest rate contracts | $ | — | $ | — | $ | — | $ | — | $ | — | ||||||||||
Foreign exchange contracts | — | — | — | — | — | |||||||||||||||
Credit contracts | — | — | — | — | — | |||||||||||||||
Equity contracts | — | 990,866 | — | — | 990,866 | |||||||||||||||
Commodity contracts | — | — | — | — | — | |||||||||||||||
Other contracts | — | — | — | — | — | |||||||||||||||
|
|
|
|
|
|
|
|
|
| |||||||||||
Total | $ | — | $ | 990,866 | $ | — | $ | — | $ | 990,866 | ||||||||||
|
|
|
|
|
|
|
|
|
| |||||||||||
^ This Portfolio held futures contracts as a substitute for investing in conventional securities, hedging and in an attempt to enhance returns.
The Portfolio held futures contracts with an average notional balance of approximately $55,079,000 for the year ended December 31, 2013.
The following table presents the Portfolio’s gross derivative assets and liabilities by counterparty net of amounts available for offset under netting arrangements and any related collateral received or pledged by the Portfolio as of December 31, 2013:
Counterparty | Gross Amount of Derivative Assets Presented in the Statement of Assets and Liabilities (a) | Derivatives Available for Offset | Collateral Received | Net Amount Due from Counterparty | ||||||||||||
Exchange Traded Futures & Options Contracts (b) | $ | 942,676 | (c) | $ | — | $ | — | $ | 942,676 | |||||||
|
|
|
|
|
|
|
| |||||||||
| (a) | For financial reporting purposes the Portfolio does not offset derivative assets and derivative liabilities subject to master netting arrangements in the Statement of Assets and Liabilities. |
| (b) | These derivatives are traded on an exchange, therefore they are not subject to master netting arrangements. |
| (c) | This amount represents the cumulative appreciation (depreciation) of futures contracts as reported in the Portfolio of Investments. The Statement of Assets and Liabilities only reflects the current day variation margin receivable/payable to brokers for futures contracts. |
Investment security transactions for the year ended December 31, 2013 were as follows:
Cost of Purchases: | ||||
Long-term investments other than U.S. government debt securities | $ | 194,212,267 | ||
Net Proceeds of Sales and Redemptions: | ||||
Long-term investments other than U.S. government debt securities | $ | 254,543,553 |
See Notes to Financial Statements.
94
AXA PREMIER VIP TRUST
MULTIMANAGER LARGE CAP CORE EQUITY PORTFOLIO
PORTFOLIO OF INVESTMENTS (Continued)
December 31, 2013
As of December 31, 2013, the gross unrealized appreciation (depreciation) of investments based on the aggregate cost of investments for Federal income tax purposes was as follows:
Aggregate gross unrealized appreciation | $ | 217,558,460 | ||
Aggregate gross unrealized depreciation | (3,811,832 | ) | ||
|
| |||
Net unrealized appreciation | $ | 213,746,628 | ||
|
| |||
Federal income tax cost of investments | $ | 341,149,898 | ||
|
|
For the year ended December 31, 2013, the Portfolio incurred approximately $3,375 as brokerage commissions with Sanford C. Bernstein & Co., LLC, an affiliated broker/dealer.
The Portfolio has a net capital loss carryforward of $266,575,852, which expires in the year 2017. The Portfolio utilized net capital loss carryforward of $64,996,827 during 2013.
See Notes to Financial Statements.
95
AXA PREMIER VIP TRUST
MULTIMANAGER LARGE CAP CORE EQUITY PORTFOLIO
STATEMENT OF ASSETS AND LIABILITIES
December 31, 2013
ASSETS | ||||
Investments at value (Cost $340,374,166) | $ | 554,896,526 | ||
Cash | 36,385,367 | |||
Cash held as collateral at broker | 10,120,000 | |||
Receivable for securities sold | 2,092,535 | |||
Dividends, interest and other receivables | 635,245 | |||
Due from broker for futures variation margin | 149,760 | |||
Receivable from Separate Accounts for Trust shares sold | 3,284 | |||
Other assets | 1,777 | |||
|
| |||
Total assets | 604,284,494 | |||
|
| |||
LIABILITIES | ||||
Payable for securities purchased | 1,108,190 | |||
Payable to Separate Accounts for Trust shares redeemed | 532,613 | |||
Investment management fees payable | 342,671 | |||
Administrative fees payable | 108,042 | |||
Trustees’ fees payable | 14,538 | |||
Distribution fees payable - Class B | 5,141 | |||
Distribution fees payable - Class A | 931 | |||
Accrued expenses | 41,211 | |||
|
| |||
Total liabilities | 2,153,337 | |||
|
| |||
NET ASSETS | $ | 602,131,157 | ||
|
| |||
Net assets were comprised of: | ||||
Paid in capital | $ | 667,575,786 | ||
Accumulated undistributed net investment income (loss) | 210,490 | |||
Accumulated undistributed net realized gain (loss) on investments, futures and foreign currency transactions | (281,122,717 | ) | ||
Net unrealized appreciation (depreciation) on investments, futures and foreign currency translations | 215,467,598 | |||
|
| |||
Net assets | $ | 602,131,157 | ||
|
| |||
Class A | ||||
Net asset value, offering and redemption price per share, $4,514,522 / 316,458 shares outstanding (unlimited amount authorized: $0.001 par value) | $ | 14.27 | ||
|
| |||
Class B | ||||
Net asset value, offering and redemption price per share, $24,759,378 / 1,735,710 shares outstanding (unlimited amount authorized: $0.001 par value) | $ | 14.26 | ||
|
| |||
Class K | ||||
Net asset value, offering and redemption price per share, $572,857,257 / 40,157,043 shares outstanding (unlimited amount authorized: $0.001 par value) | $ | 14.27 | ||
|
|
STATEMENT OF OPERATIONS
For the Year Ended December 31, 2013
INVESTMENT INCOME | ||||
Dividends (net of $71,173 foreign withholding tax) | $ | 10,330,379 | ||
Interest | 79,453 | |||
|
| |||
Total income | 10,409,832 | |||
|
| |||
EXPENSES | ||||
Investment management fees | 4,424,005 | |||
Administrative fees | 980,502 | |||
Distribution fees - Class B | 223,656 | |||
Custodian fees | 99,499 | |||
Professional fees | 82,992 | |||
Printing and mailing expenses | 80,145 | |||
Trustees’ fees | 14,457 | |||
Distribution fees - Class A | 10,130 | |||
Miscellaneous | 22,116 | |||
|
| |||
Gross expenses | 5,937,502 | |||
Less: Waiver from investment manager | (12,273 | ) | ||
Fees paid indirectly | (28,184 | ) | ||
|
| |||
Net expenses | 5,897,045 | |||
|
| |||
NET INVESTMENT INCOME (LOSS) | 4,512,787 | |||
|
| |||
REALIZED AND UNREALIZED GAIN (LOSS) | ||||
Realized gain (loss) on: | ||||
Investments | 86,021,318 | |||
Futures | 14,891,682 | |||
Foreign currency transactions | (4,415 | ) | ||
|
| |||
Net realized gain (loss) | 100,908,585 | |||
|
| |||
Change in unrealized appreciation (depreciation) on: | ||||
Investments | 76,923,905 | |||
Futures | 990,866 | |||
Foreign currency translations | 1,726 | |||
|
| |||
Net change in unrealized appreciation (depreciation) | 77,916,497 | |||
|
| |||
NET REALIZED AND UNREALIZED GAIN (LOSS) | 178,825,082 | |||
|
| |||
NET INCREASE (DECREASE) IN NET ASSETS RESULTING FROM OPERATIONS | $ | 183,337,869 | ||
|
|
See Notes to Financial Statements.
96
AXA PREMIER VIP TRUST
MULTIMANAGER LARGE CAP CORE EQUITY PORTFOLIO
STATEMENT OF CHANGES IN NET ASSETS
| Year Ended December 31, | ||||||||
| 2013 | 2012 | |||||||
| INCREASE (DECREASE) IN NET ASSETS FROM OPERATIONS: | ||||||||
Net investment income (loss) | $ | 4,512,787 | $ | 5,021,866 | ||||
Net realized gain (loss) on investments, futures and foreign currency transactions | 100,908,585 | 8,552,539 | ||||||
Net change in unrealized appreciation (depreciation) on investments, futures and foreign currency translations | 77,916,497 | 78,310,930 | ||||||
|
|
|
| |||||
NET INCREASE (DECREASE) IN NET ASSETS RESULTING FROM OPERATIONS | 183,337,869 | 91,885,335 | ||||||
|
|
|
| |||||
DIVIDENDS: | ||||||||
Dividends from net investment income | ||||||||
Class A | (26,114 | ) | (21,484 | ) | ||||
Class B | (144,548 | ) | (890,222 | ) | ||||
Class K | (4,767,468 | ) | (4,118,714 | ) | ||||
|
|
|
| |||||
TOTAL DIVIDENDS | (4,938,130 | ) | (5,030,420 | ) | ||||
|
|
|
| |||||
CAPITAL SHARES TRANSACTIONS: | ||||||||
Class A | ||||||||
Capital shares sold [ 26,626 and 26,918 shares, respectively ] | 333,094 | 277,336 | ||||||
Capital shares issued in reinvestment of dividends [ 1,932 and 1,989 shares, respectively ] | 26,114 | 21,484 | ||||||
Capital shares repurchased [ (54,362) and (80,601) shares, respectively ] | (672,014 | ) | (827,036 | ) | ||||
|
|
|
| |||||
Total Class A transactions | (312,806 | ) | (528,216 | ) | ||||
|
|
|
| |||||
Class B | ||||||||
Capital shares sold [ 581,462 and 1,082,960 shares, respectively ] | 6,788,111 | 11,148,421 | ||||||
Capital shares issued in reinvestment of dividends [ 10,699 and 82,402 shares, respectively ] | 144,548 | 890,222 | ||||||
Capital shares repurchased [ (1,820,852) and (2,796,224) shares, respectively ] | (21,816,461 | ) | (28,777,003 | ) | ||||
Capital shares repurchased in-kind (Note 10)[ (11,183,768) and 0 shares, respectively ] | (134,096,571 | ) | — | |||||
|
|
|
| |||||
Total Class B transactions | (148,980,373 | ) | (16,738,360 | ) | ||||
|
|
|
| |||||
Class K | ||||||||
Capital shares sold [ 224,065 and 414,483 shares, respectively ] | 2,777,617 | 4,247,833 | ||||||
Capital shares issued in reinvestment of dividends [ 351,279 and 381,398 shares, respectively ] | 4,767,468 | 4,118,714 | ||||||
Capital shares repurchased [ (6,143,079) and (8,202,746) shares, respectively ] | (78,070,404 | ) | (85,020,457 | ) | ||||
Capital shares repurchased in-kind (Note 10)[ (11) and 0 shares, respectively ] | (130 | ) | — | |||||
|
|
|
| |||||
Total Class K transactions | (70,525,449 | ) | (76,653,910 | ) | ||||
|
|
|
| |||||
NET INCREASE (DECREASE) IN NET ASSETS RESULTING FROM CAPITAL SHARE TRANSACTIONS | (219,818,628 | ) | (93,920,486 | ) | ||||
|
|
|
| |||||
TOTAL INCREASE (DECREASE) IN NET ASSETS | (41,418,889 | ) | (7,065,571 | ) | ||||
NET ASSETS: | ||||||||
Beginning of year | 643,550,046 | 650,615,617 | ||||||
|
|
|
| |||||
End of year (a) | $ | 602,131,157 | $ | 643,550,046 | ||||
|
|
|
|
| ||||
(a) Includes accumulated undistributed (overdistributed) net investment income (loss) of | $ | 210,490 | $ | 888,070 | ||||
|
|
|
| |||||
See Notes to Financial Statements.
97
AXA PREMIER VIP TRUST
MULTIMANAGER LARGE CAP CORE EQUITY PORTFOLIO
FINANCIAL HIGHLIGHTS
| Year Ended December 31, | ||||||||||||||||||||
| Class A | 2013 | 2012 | 2011 | 2010 | 2009 | |||||||||||||||
Net asset value, beginning of year | $ | 10.69 | $ | 9.39 | $ | 10.17 | $ | 9.14 | $ | 6.98 | ||||||||||
|
|
|
|
|
|
|
|
|
| |||||||||||
Income (loss) from investment operations: | ||||||||||||||||||||
Net investment income (loss) | 0.06 | (e) | 0.06 | (e) | 0.04 | (e) | 0.06 | (e) | 0.12 | (e) | ||||||||||
Net realized and unrealized gain (loss) on investments, futures and foreign currency transactions | 3.60 | 1.30 | (0.76 | ) | 1.02 | 2.18 | ||||||||||||||
|
|
|
|
|
|
|
|
|
| |||||||||||
Total from investment operations | 3.66 | 1.36 | (0.72 | ) | 1.08 | 2.30 | ||||||||||||||
|
|
|
|
|
|
|
|
|
| |||||||||||
Less distributions: | ||||||||||||||||||||
Dividends from net investment income | (0.08 | ) | (0.06 | ) | (0.06 | ) | (0.05 | ) | (0.14 | ) | ||||||||||
|
|
|
|
|
|
|
|
|
| |||||||||||
Net asset value, end of year | $ | 14.27 | $ | 10.69 | $ | 9.39 | $ | 10.17 | $ | 9.14 | ||||||||||
|
|
|
|
|
|
|
|
|
| |||||||||||
Total return | 34.31 | % | 14.51 | % | (7.11 | )% | 11.84 | % | 32.92 | % | ||||||||||
|
|
|
|
|
|
|
|
|
| |||||||||||
Ratios/Supplemental Data: | ||||||||||||||||||||
Net assets, end of year (000’s) | $ | 4,515 | $ | 3,658 | $ | 3,698 | $ | 585,508 | $ | 554,828 | ||||||||||
Ratio of expenses to average net assets: | ||||||||||||||||||||
After waivers | 1.15 | % | 1.14 | % | 0.88 | % | 0.90 | % | 0.92 | % | ||||||||||
After waivers and fees paid indirectly | 1.14 | % | 1.14 | % | 0.88 | % | 0.90 | % | 0.81 | % | ||||||||||
Before waivers and fees paid indirectly | 1.15 | % | 1.14 | % | 0.88 | % | 0.90 | % | 0.92 | % | ||||||||||
Ratio of net investment income (loss) to average net assets: | ||||||||||||||||||||
After waivers | 0.49 | % | 0.57 | % | 0.35 | % | 0.59 | % | 1.42 | % | ||||||||||
After waivers and fees paid indirectly | 0.50 | % | 0.57 | % | 0.36 | % | 0.60 | % | 1.54 | % | ||||||||||
Before waivers and fees paid indirectly | 0.49 | % | 0.57 | % | 0.35 | % | 0.59 | % | 1.42 | % | ||||||||||
Portfolio turnover rate | 34 | % | 36 | % | 44 | % | 44 | % | 85 | % | ||||||||||
| Year Ended December 31, | ||||||||||||||||||||
| Class B | 2013 | 2012 | 2011 | 2010 | 2009 | |||||||||||||||
Net asset value, beginning of year | $ | 10.69 | $ | 9.39 | $ | 10.17 | $ | 9.14 | $ | 6.98 | ||||||||||
|
|
|
|
|
|
|
|
|
| |||||||||||
Income (loss) from investment operations: | ||||||||||||||||||||
Net investment income (loss) | 0.06 | (e) | 0.06 | (e) | 0.03 | (e) | 0.03 | (e) | 0.09 | (e) | ||||||||||
Net realized and unrealized gain (loss) on investments, futures and foreign currency transactions | 3.59 | 1.30 | (0.78 | ) | 1.03 | 2.18 | ||||||||||||||
|
|
|
|
|
|
|
|
|
| |||||||||||
Total from investment operations | 3.65 | 1.36 | (0.75 | ) | 1.06 | 2.27 | ||||||||||||||
|
|
|
|
|
|
|
|
|
| |||||||||||
Less distributions: | ||||||||||||||||||||
Dividends from net investment income | (0.08 | ) | (0.06 | ) | (0.03 | ) | (0.03 | ) | (0.11 | ) | ||||||||||
|
|
|
|
|
|
|
|
|
| |||||||||||
Net asset value, end of year | $ | 14.26 | $ | 10.69 | $ | 9.39 | $ | 10.17 | $ | 9.14 | ||||||||||
|
|
|
|
|
|
|
|
|
| |||||||||||
Total return | 34.22 | % | 14.51 | % | (7.34 | )% | 11.56 | % | 32.58 | % | ||||||||||
|
|
|
|
|
|
|
|
|
| |||||||||||
Ratios/Supplemental Data: | ||||||||||||||||||||
Net assets, end of year (000’s) | $ | 24,759 | $ | 151,248 | $ | 148,166 | $ | 170,662 | $ | 157,673 | ||||||||||
Ratio of expenses to average net assets: | ||||||||||||||||||||
After waivers | 1.15 | % | 1.14 | % | 1.13 | % | 1.15 | % | 1.17 | %(c) | ||||||||||
After waivers and fees paid indirectly | 1.14 | % | 1.14 | % | 1.13 | % | 1.15 | % | 1.10 | % | ||||||||||
Before fees paid indirectly | 1.15 | % | 1.14 | % | 1.13 | % | 1.15 | % | 1.17 | %(c) | ||||||||||
Ratio of net investment income (loss) to average net assets: | ||||||||||||||||||||
After waivers | 0.52 | % | 0.57 | % | 0.26 | % | 0.34 | % | 1.14 | % | ||||||||||
After waivers and fees paid indirectly | 0.53 | % | 0.57 | % | 0.26 | % | 0.35 | % | 1.22 | % | ||||||||||
Before waivers and fees paid indirectly | 0.52 | % | 0.57 | % | 0.26 | % | 0.34 | % | 1.14 | % | ||||||||||
Portfolio turnover rate | 34 | % | 36 | % | 44 | % | 44 | % | 85 | % | ||||||||||
See Notes to Financial Statements.
98
AXA PREMIER VIP TRUST
MULTIMANAGER LARGE CAP CORE EQUITY PORTFOLIO
FINANCIAL HIGHLIGHTS (Continued)
| Year Ended December 31, | August 26, 2011* to December 31, 2011 | |||||||||||
| Class K | 2013 | 2012 | ||||||||||
Net asset value, beginning of period | $ | 10.69 | $ | 9.39 | $ | 9.18 | ||||||
|
|
|
|
|
| |||||||
Income (loss) from investment operations: | ||||||||||||
Net investment income (loss) | 0.09 | (e) | 0.08 | (e) | 0.03 | (e) | ||||||
Net realized and unrealized gain (loss) on investments, futures and foreign currency transactions | 3.61 | 1.31 | 0.23 | |||||||||
|
|
|
|
|
| |||||||
Total from investment operations | 3.70 | 1.39 | 0.26 | |||||||||
|
|
|
|
|
| |||||||
Less distributions: | ||||||||||||
Dividends from net investment income | (0.12 | ) | (0.09 | ) | (0.05 | ) | ||||||
|
|
|
|
|
| |||||||
Net asset value, end of period | $ | 14.27 | $ | 10.69 | $ | 9.39 | ||||||
|
|
|
|
|
| |||||||
Total return (b) | 34.65 | % | 14.80 | % | 2.86 | % | ||||||
|
|
|
|
|
| |||||||
Ratios/Supplemental Data: | ||||||||||||
Net assets, end of period (000’s) | $ | 572,857 | $ | 488,644 | $ | 498,752 | ||||||
Ratio of expenses to average net assets: | ||||||||||||
After waivers (a) | 0.90 | % | 0.89 | % | 0.89 | % | ||||||
After waivers and fees paid indirectly (a) | 0.89 | % | 0.89 | % | 0.88 | % | ||||||
Before waivers and fees paid indirectly (a) | 0.90 | % | 0.89 | % | 0.89 | % | ||||||
Ratio of net investment income (loss) to average net assets: | ||||||||||||
After waivers (a) | 0.74 | % | 0.81 | % | 0.88 | % | ||||||
After waivers and fees paid indirectly (a) | 0.75 | % | 0.82 | % | 0.88 | % | ||||||
Before waivers and fees paid indirectly (a) | 0.74 | % | 0.81 | % | 0.88 | % | ||||||
Portfolio turnover rate | 34 | % | 36 | % | 44 | % | ||||||
| * | Commencement of Operations. |
| (a) | Ratios for periods less than one year are annualized. |
| (b) | Total returns for periods less than one year are not annualized. |
| (c) | Reflects overall fund ratios for non-class specific expenses. |
| (e) | Net investment income (loss) per share is based on average shares outstanding. |
See Notes to Financial Statements.
99
MULTIMANAGER LARGE CAP VALUE PORTFOLIO (Unaudited)
PORTFOLIO ADVISERS
| Ø | AllianceBernstein L.P. |
| Ø | Institutional Capital LLC |
| Ø | MFS Investment Management |
PERFORMANCE RESULTS
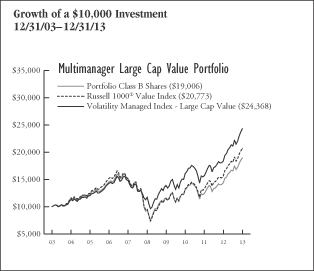
| Annualized Total Returns as of 12/31/13 | ||||||||||||
| 1 Year | 5 Years | 10 Years/ Since Incept. | ||||||||||
Portfolio – Class A Shares* | 32.20 | % | 15.12 | % | 6.85 | % | ||||||
Portfolio – Class B Shares* | 32.07 | 14.95 | 6.63 | |||||||||
Portfolio – Class K Shares** | 32.53 | N/A | 22.32 | |||||||||
Russell 1000® Value Index | 32.53 | 16.67 | 7.58 | |||||||||
Volatility Managed Index – Large Cap Value | 32.46 | 15.67 | 9.32 | |||||||||
* Date of inception 12/31/01.
** Date of inception 8/26/11.
Returns for periods greater than one year are annualized. |
| |||||||||||
Past performance is not indicative of future results.
PERFORMANCE SUMMARY
The Portfolio’s Class A shares returned 32.20% for the year ended December 31, 2013. The Portfolio’s benchmarks, the Russell 1000® Value Index, returned 32.53%, and the Volatility Managed Index — Large Cap Value returned 32.46%, over the same period.
The following commentary describes key factors (such as stock selection and sector allocation decisions) that helped or hurt the Portfolio’s performance relative to its primary benchmark.
Portfolio Highlights
For the year ended December 31, 2013
What helped performance during the year:
| • | Overall stock selection was positive, with the Portfolio’s Financials and Telecommunication Services holdings contributing most. |
| • | Underweight positions in the Utilities and Energy sectors also contributed to performance. |
| • | In the Consumer Discretionary sector, Viacom, Inc. outperformed. Viacom has seen improved ratings and advertising revenues and returned cash to shareholders via stock repurchase and dividends. |
| • | Overweighting the Consumer Discretionary sector also added value. |
| • | Shares of voice and data communications services company Vodafone Group (security is not a benchmark constituent) supported relative returns, as did a relative underweight in AT&T Inc. |
| • | Stock selection in the Industrials sector also benefited relative returns. Within this sector, an overweight position in defense contractor Lockheed Martin Corp. bolstered relative results. |
| • | Automotive manufacturer Johnson Controls, Inc. contributed positively as the firm continued restructuring, announcing the sale of its automotive electronics business and completing headcount reductions in its European auto business. |
What hurt performance during the year:
| • | Stock selection in the Information Technology sector detracted from relative performance. Within this sector, a relative underweight position in strong-performing computer and personal electronics maker Apple, Inc. hurt relative results. |
| • | In the Materials sector, Barrick Gold Corp. lagged due to cost overruns and production delays. |
| • | Stock selection in the Consumer Staples sector also hampered relative returns. An overweight position in tobacco company Philip Morris International, Inc. weighed on relative performance. |
| • | Stock selection in Health Care weighed on relative returns as Baxter International, Inc. lagged the broader sector. The stock has been hindered by increased competition. |
| • | Individual positions that detracted from relative performance included electric utility Exelon Corp., which was hampered by a weakened outlook for power prices. |
100
MULTIMANAGER LARGE CAP VALUE PORTFOLIO (Unaudited)
Sector Weightings as of December 31, 2013 | % of Net Assets | |||
Financials | 23.8 | % | ||
Energy | 12.0 | |||
Health Care | 12.0 | |||
Industrials | 10.4 | |||
Consumer Discretionary | 9.2 | |||
Information Technology | 8.5 | |||
Consumer Staples | 6.0 | |||
Utilities | 3.2 | |||
Telecommunication Services | 3.0 | |||
Materials | 2.5 | |||
Cash and Other | 9.4 | |||
|
| |||
| 100.0 | % | |||
|
| |||
UNDERSTANDING YOUR EXPENSES:
As a shareholder of the Portfolio, you incur two types of costs:
(1)transaction costs, including applicable sales charges and redemption fees; and (2)ongoing costs, including management fees, distribution (12b-1) fees (in the case of Class A and Class B shares of the Trust), and other Portfolio expenses. These examples are intended to help you understand your ongoing costs (in dollars) of investing in the Portfolio and to compare these costs with the ongoing costs of investing in other mutual funds.
The examples are based on an investment of $1,000 invested at the beginning of the six-month period ended December 31, 2013 and held for the entire six-month period.
Actual Expenses
The first line of the table to the right provides information about actual account values and actual expenses. You may use the information in this line, together with the amount you invested, to estimate the expenses that you paid over the period. Simply divide your account value by $1,000 (for example, an $8,600 account value divided by $1,000 = 8.6), then multiply the result by the number in the first line under the heading entitled ‘‘Expenses Paid During Period’’ to estimate the expenses you paid on your account during this period.
Hypothetical Example for Comparison Purposes
The second line of the table below provides information about hypothetical account values and hypothetical expenses based on the Portfolio’s actual expense ratio and an assumed rate of return of 5% per year before expenses, which is not the Portfolio’s actual return. The hypothetical account values and expenses may not be used to estimate the actual ending account balance or expenses you paid for the period. You may use this information to compare the ongoing costs of investing in the Portfolio and other funds. To do so, compare this 5% hypothetical example with the 5% hypothetical examples that appear in the shareholder reports of the other funds.
Please note that the expenses shown in the table are meant to highlight your ongoing costs only and do not reflect any transactional costs, such as sales charges (loads), redemption fees, or exchange fees. Therefore, the second line of the table is useful in comparing ongoing costs only, and will not help you determine the relative total costs of owning different funds. In addition, if these transactional costs were included, your costs would have been higher. Also note that the table does not reflect any variable life insurance or variable annuity contract-related fees and expenses, which would increase overall fees and expenses.
EXAMPLE
| Beginning Account Value 7/1/13 | Ending Account Value 12/31/13 | Expenses Paid | ||||||||||
Class A | ||||||||||||
Actual | $1,000.00 | $1,146.17 | $6.23 | |||||||||
Hypothetical (5% average annual return before expenses) | 1,000.00 | 1,019.40 | 5.86 | |||||||||
Class B | ||||||||||||
Actual | 1,000.00 | 1,145.22 | 6.22 | |||||||||
Hypothetical (5% average annual return before expenses) | 1,000.00 | 1,019.40 | 5.86 | |||||||||
Class K | ||||||||||||
Actual | 1,000.00 | 1,147.17 | 4.88 | |||||||||
Hypothetical (5% average annual return before expenses) | 1,000.00 | 1,020.66 | 4.59 | |||||||||
* Expenses are equal to the Portfolio’s Class A, Class B and Class K shares annualized expense ratios of 1.15%, 1.15% and 0.90%, respectively, multiplied by the average account value over the period, and multiplied by 184/365 (to reflect the one-half year period). |
| |||||||||||
101
AXA PREMIER VIP TRUST
MULTIMANAGER LARGE CAP VALUE PORTFOLIO
PORTFOLIO OF INVESTMENTS
December 31, 2013
| Number of Shares | Value (Note 1) | |||||||
COMMON STOCKS: | ||||||||
Consumer Discretionary (9.2%) | ||||||||
Auto Components (1.3%) | ||||||||
Allison Transmission Holdings, Inc. | 783 | $ | 21,619 | |||||
Delphi Automotive plc | 13,234 | 795,760 | ||||||
Gentex Corp. | 1,697 | 55,984 | ||||||
Johnson Controls, Inc. | 133,143 | 6,830,236 | ||||||
Lear Corp. | 7,317 | 592,458 | ||||||
TRW Automotive Holdings Corp.* | 15,977 | 1,188,529 | ||||||
|
| |||||||
| 9,484,586 | ||||||||
|
| |||||||
Automobiles (1.2%) | ||||||||
Ford Motor Co. | 381,667 | 5,889,122 | ||||||
General Motors Co.* | 65,550 | 2,679,028 | ||||||
|
| |||||||
| 8,568,150 | ||||||||
|
| |||||||
Distributors (0.0%) | ||||||||
Genuine Parts Co. | 228 | 18,967 | ||||||
|
| |||||||
Diversified Consumer Services (0.0%) |
| |||||||
Apollo Education Group, Inc., Class A* | 2,742 | 74,911 | ||||||
DeVry Education Group, Inc. | 1,762 | 62,551 | ||||||
Service Corp. International | 1,272 | 23,061 | ||||||
Weight Watchers International, Inc. | 293 | 9,649 | ||||||
|
| |||||||
| 170,172 | ||||||||
|
| |||||||
Hotels, Restaurants & Leisure (0.4%) |
| |||||||
Carnival Corp. | 12,114 | 486,619 | ||||||
Choice Hotels International, Inc. | 717 | 35,212 | ||||||
Darden Restaurants, Inc. | 1,272 | 69,159 | ||||||
Hyatt Hotels Corp., Class A* | 1,307 | 64,644 | ||||||
Marriott International, Inc., Class A | 817 | 40,327 | ||||||
McDonald’s Corp. | 12,655 | 1,227,915 | ||||||
MGM Resorts International* | 10,742 | 252,652 | ||||||
Norwegian Cruise Line Holdings Ltd.* | 59 | 2,093 | ||||||
Penn National Gaming, Inc.* | 1,959 | 28,072 | ||||||
Royal Caribbean Cruises Ltd. | 4,735 | 224,534 | ||||||
Starwood Hotels & Resorts Worldwide, Inc. | 3,266 | 259,484 | ||||||
Wendy’s Co. | 8,163 | 71,181 | ||||||
|
| |||||||
| 2,761,892 | ||||||||
|
| |||||||
Household Durables (0.4%) | ||||||||
D.R. Horton, Inc.* | 8,097 | 180,725 | ||||||
Garmin Ltd. | 3,493 | 161,447 | ||||||
Harman International Industries, Inc. | 1,959 | 160,344 | ||||||
Leggett & Platt, Inc. | 4,114 | 127,287 | ||||||
Lennar Corp., Class A | 4,800 | 189,888 | ||||||
Mohawk Industries, Inc.* | 1,797 | 267,573 | ||||||
Newell Rubbermaid, Inc. | 3,493 | 113,208 | ||||||
NVR, Inc.* | 66 | 67,717 | ||||||
PulteGroup, Inc. | 63,200 | 1,287,384 | ||||||
Taylor Morrison Home Corp., Class A* | 31 | 696 | ||||||
Toll Brothers, Inc.* | 4,831 | 178,747 | ||||||
Whirlpool Corp. | 2,155 | 338,033 | ||||||
|
| |||||||
| 3,073,049 | ||||||||
|
| |||||||
Internet & Catalog Retail (0.1%) | ||||||||
Liberty Interactive Corp., Class A* | 14,073 | $ | 413,042 | |||||
zulily, Inc., Class A* | 190 | 7,872 | ||||||
|
| |||||||
| 420,914 | ||||||||
|
| |||||||
Leisure Equipment & Products (0.1%) |
| |||||||
Hasbro, Inc. | 11,986 | 659,350 | ||||||
|
| |||||||
Media (4.2%) | ||||||||
CBS Corp. (Non-Voting), Class B | 1,469 | 93,634 | ||||||
Comcast Corp., Class A | 31,690 | 1,592,749 | ||||||
DreamWorks Animation SKG, Inc., Class A* | 2,090 | 74,195 | ||||||
Gannett Co., Inc. | 42,860 | 1,267,799 | ||||||
Graham Holdings Co., Class B* | 197 | 130,674 | ||||||
Interpublic Group of Cos., Inc. | 6,759 | 119,634 | ||||||
John Wiley & Sons, Inc., Class A | 1,272 | 70,214 | ||||||
Liberty Global plc* | 10,352 | 872,881 | ||||||
Liberty Global plc, Class A* | 7,772 | 691,630 | ||||||
Liberty Media Corp., Class A* | 2,986 | 437,300 | ||||||
News Corp., Class A* | 3,772 | 67,971 | ||||||
Omnicom Group, Inc. | 21,093 | 1,568,686 | ||||||
Regal Entertainment Group, Class A | 18,208 | 354,146 | ||||||
Sirius XM Holdings, Inc.* | 47,182 | 164,665 | ||||||
Starz, Class A* | 306 | 8,947 | ||||||
Thomson Reuters Corp. | 10,807 | 408,721 | ||||||
Time Warner, Inc. | 117,091 | 8,163,585 | ||||||
Twenty-First Century Fox, Inc., Class A | 47,920 | 1,685,826 | ||||||
Viacom, Inc., Class B | 76,998 | 6,725,005 | ||||||
Walt Disney Co. | 64,168 | 4,902,435 | ||||||
|
| |||||||
| 29,400,697 | ||||||||
|
| |||||||
Multiline Retail (0.6%) | ||||||||
Big Lots, Inc.* | 1,241 | 40,072 | ||||||
Dillard’s, Inc., Class A | 228 | 22,164 | ||||||
J.C. Penney Co., Inc.* | 4,897 | 44,808 | ||||||
Kohl’s Corp. | 12,395 | 703,416 | ||||||
Macy’s, Inc. | 19,948 | 1,065,223 | ||||||
Sears Holdings Corp.* | 1,307 | 64,095 | ||||||
Target Corp. | 33,950 | 2,148,017 | ||||||
|
| |||||||
| 4,087,795 | ||||||||
|
| |||||||
Specialty Retail (0.9%) | ||||||||
Aaron’s, Inc. | 1,828 | 53,743 | ||||||
Abercrombie & Fitch Co., Class A | 1,959 | 64,471 | ||||||
Advance Auto Parts, Inc. | 7,572 | 838,069 | ||||||
American Eagle Outfitters, Inc. | 1,959 | 28,210 | ||||||
Ascena Retail Group, Inc.* | 3,135 | 66,337 | ||||||
Best Buy Co., Inc. | 5,780 | 230,506 | ||||||
Chico’s FAS, Inc. | 228 | 4,296 | ||||||
CST Brands, Inc. | 1,682 | 61,763 | ||||||
DSW, Inc., Class A | 262 | 11,195 | ||||||
Foot Locker, Inc. | 3,786 | 156,892 | ||||||
GameStop Corp., Class A | 24,228 | 1,193,471 | ||||||
Guess?, Inc. | 1,631 | 50,675 | ||||||
Lowe’s Cos., Inc. | 7,600 | 376,580 | ||||||
Murphy USA, Inc.* | 1,354 | 56,272 | ||||||
Signet Jewelers Ltd. | 2,155 | 169,598 | ||||||
See Notes to Financial Statements.
102
AXA PREMIER VIP TRUST
MULTIMANAGER LARGE CAP VALUE PORTFOLIO
PORTFOLIO OF INVESTMENTS (Continued)
December 31, 2013
| Number of Shares | Value (Note 1) | |||||||
Staples, Inc. | 65,126 | $ | 1,034,852 | |||||
TJX Cos., Inc. | 28,500 | 1,816,305 | ||||||
|
| |||||||
| 6,213,235 | ||||||||
|
| |||||||
Textiles, Apparel & Luxury Goods (0.0%) |
| |||||||
Deckers Outdoor Corp.* | 555 | 46,875 | ||||||
PVH Corp. | 328 | 44,615 | ||||||
|
| |||||||
| 91,490 | ||||||||
|
| |||||||
Total Consumer Discretionary | 64,950,297 | |||||||
|
| |||||||
Consumer Staples (6.0%) | ||||||||
Beverages (0.5%) | ||||||||
Beam, Inc. | 4,669 | 317,772 | ||||||
Coca-Cola Enterprises, Inc. | 10,841 | 478,413 | ||||||
Constellation Brands, Inc., Class A* | 228 | 16,047 | ||||||
Diageo plc | 61,006 | 2,020,458 | ||||||
Dr. Pepper Snapple Group, Inc. | 11,874 | 578,501 | ||||||
Molson Coors Brewing Co., | 4,049 | 227,352 | ||||||
|
| |||||||
| 3,638,543 | ||||||||
|
| |||||||
Food & Staples Retailing (1.8%) | ||||||||
CVS Caremark Corp. | 123,330 | 8,826,728 | ||||||
Kroger Co. | 43,300 | 1,711,649 | ||||||
Safeway, Inc. | 6,366 | 207,341 | ||||||
Sprouts Farmers Market, Inc.* | 206 | 7,916 | ||||||
Sysco Corp. | 11,232 | 405,475 | ||||||
Walgreen Co. | 6,759 | 388,237 | ||||||
Wal-Mart Stores, Inc. | 15,698 | 1,235,276 | ||||||
|
| |||||||
| 12,782,622 | ||||||||
|
| |||||||
Food Products (1.3%) | ||||||||
Archer-Daniels-Midland Co. | 17,632 | 765,229 | ||||||
Bunge Ltd. | 4,311 | 353,976 | ||||||
Campbell Soup Co. | 1,731 | 74,918 | ||||||
ConAgra Foods, Inc. | 848 | 28,578 | ||||||
Danone S.A. | 14,345 | 1,032,505 | ||||||
Dean Foods Co.* | 2,610 | 44,866 | ||||||
General Mills, Inc. | 35,265 | 1,760,076 | ||||||
Ingredion, Inc. | 1,959 | 134,113 | ||||||
J.M. Smucker Co. | 2,710 | 280,810 | ||||||
Kellogg Co. | 6,796 | 415,032 | ||||||
Mondelez International, Inc., Class A | 51,655 | 1,823,421 | ||||||
Nestle S.A. (Registered) | 30,702 | 2,247,453 | ||||||
Pinnacle Foods, Inc. | 359 | 9,858 | ||||||
Tyson Foods, Inc., Class A | 8,031 | 268,717 | ||||||
|
| |||||||
| 9,239,552 | ||||||||
|
| |||||||
Household Products (1.3%) | ||||||||
Clorox Co. | 686 | 63,633 | ||||||
Energizer Holdings, Inc. | 1,862 | 201,543 | ||||||
Kimberly-Clark Corp. | 1,828 | 190,953 | ||||||
Procter & Gamble Co. | 101,759 | 8,284,200 | ||||||
|
| |||||||
| 8,740,329 | ||||||||
|
| |||||||
Personal Products (0.0%) | ||||||||
Coty, Inc., Class A | 548 | 8,357 | ||||||
|
| |||||||
Tobacco (1.1%) | ||||||||
Altria Group, Inc. | 15,602 | $ | 598,961 | |||||
Imperial Tobacco Group plc | 6,364 | 246,389 | ||||||
Lorillard, Inc. | 29,666 | 1,503,473 | ||||||
Philip Morris International, Inc. | 63,280 | 5,513,586 | ||||||
Reynolds American, Inc. | 2,221 | 111,028 | ||||||
|
| |||||||
| 7,973,437 | ||||||||
|
| |||||||
Total Consumer Staples | 42,382,840 | |||||||
|
| |||||||
Energy (12.0%) | ||||||||
Energy Equipment & Services (1.2%) |
| |||||||
Atwood Oceanics, Inc.* | 1,338 | 71,436 | ||||||
Baker Hughes, Inc. | 11,978 | 661,904 | ||||||
Cameron International Corp.* | 2,710 | 161,326 | ||||||
Diamond Offshore Drilling, Inc. | 1,959 | 111,506 | ||||||
Frank’s International N.V. | 462 | 12,474 | ||||||
Halliburton Co. | 93,192 | 4,729,494 | ||||||
Helmerich & Payne, Inc. | 2,776 | 233,406 | ||||||
McDermott International, Inc.* | 6,825 | 62,517 | ||||||
Nabors Industries Ltd. | 45,056 | 765,502 | ||||||
National Oilwell Varco, Inc. | 12,408 | 986,808 | ||||||
Oil States International, Inc.* | 1,600 | 162,752 | ||||||
Patterson-UTI Energy, Inc. | 4,245 | 107,483 | ||||||
Rowan Cos., plc, Class A* | 3,559 | 125,846 | ||||||
RPC, Inc. | 293 | 5,230 | ||||||
Superior Energy Services, Inc.* | 4,604 | 122,513 | ||||||
Tidewater, Inc. | 1,404 | 83,215 | ||||||
Unit Corp.* | 1,404 | 72,475 | ||||||
|
| |||||||
| 8,475,887 | ||||||||
|
| |||||||
Oil, Gas & Consumable Fuels (10.8%) |
| |||||||
Anadarko Petroleum Corp. | 13,780 | 1,093,030 | ||||||
Antero Resources Corp.* | 596 | 37,810 | ||||||
Apache Corp. | 18,595 | 1,598,054 | ||||||
Chesapeake Energy Corp. | 24,284 | 659,068 | ||||||
Chevron Corp. | 98,142 | 12,258,917 | ||||||
Cimarex Energy Co. | 2,514 | 263,744 | ||||||
Cobalt International Energy, Inc.* | 586 | 9,640 | ||||||
ConocoPhillips Co. | 35,451 | 2,504,613 | ||||||
CONSOL Energy, Inc. | 6,562 | 249,618 | ||||||
Denbury Resources, Inc.* | 10,778 | 177,083 | ||||||
Devon Energy Corp. | 11,721 | 725,178 | ||||||
Encana Corp. | 85,851 | 1,549,611 | ||||||
Energen Corp. | 2,090 | 147,867 | ||||||
EOG Resources, Inc. | 3,233 | 542,627 | ||||||
EQT Corp. | 359 | 32,231 | ||||||
Exxon Mobil Corp. | 265,410 | 26,859,492 | ||||||
Golar LNG Ltd. | 1,207 | 43,802 | ||||||
Gulfport Energy Corp.* | 424 | 26,776 | ||||||
Hess Corp. | 34,214 | 2,839,762 | ||||||
HollyFrontier Corp. | 8,990 | 446,713 | ||||||
Kinder Morgan, Inc. | 1,600 | 57,600 | ||||||
Laredo Petroleum Holdings, Inc.* | 131 | 3,627 | ||||||
Marathon Oil Corp. | 120,230 | 4,244,119 | ||||||
Marathon Petroleum Corp. | 30,731 | 2,818,955 | ||||||
Murphy Oil Corp. | 5,518 | 358,008 | ||||||
Newfield Exploration Co.* | 3,852 | 94,875 | ||||||
Noble Energy, Inc. | 9,111 | 620,550 | ||||||
Occidental Petroleum Corp. | 64,988 | 6,180,359 | ||||||
PBF Energy, Inc., Class A | 680 | 21,393 | ||||||
See Notes to Financial Statements.
103
AXA PREMIER VIP TRUST
MULTIMANAGER LARGE CAP VALUE PORTFOLIO
PORTFOLIO OF INVESTMENTS (Continued)
December 31, 2013
| Number of Shares | Value (Note 1) | |||||||
Peabody Energy Corp. | 7,804 | $ | 152,412 | |||||
Phillips 66 | 27,094 | 2,089,760 | ||||||
Pioneer Natural Resources Co. | 1,045 | 192,353 | ||||||
QEP Resources, Inc. | 4,669 | 143,105 | ||||||
SandRidge Energy, Inc.* | 14,235 | 86,406 | ||||||
Southwestern Energy Co.* | 55,958 | 2,200,828 | ||||||
Spectra Energy Corp. | 19,329 | 688,499 | ||||||
Teekay Corp. | 1,110 | 53,291 | ||||||
Tesoro Corp. | 3,917 | 229,145 | ||||||
Ultra Petroleum Corp.* | 4,342 | 94,004 | ||||||
Valero Energy Corp. | 56,296 | 2,837,318 | ||||||
Whiting Petroleum Corp.* | 3,135 | 193,962 | ||||||
Williams Cos., Inc. | 8,914 | 343,813 | ||||||
World Fuel Services Corp. | 1,731 | 74,710 | ||||||
WPX Energy, Inc.* | 5,757 | 117,328 | ||||||
|
| |||||||
| 75,962,056 | ||||||||
|
| |||||||
Total Energy | 84,437,943 | |||||||
|
| |||||||
Financials (23.8%) | ||||||||
Capital Markets (2.9%) | ||||||||
American Capital Ltd.* | 8,718 | 136,349 | ||||||
Ameriprise Financial, Inc. | 3,983 | 458,244 | ||||||
Ares Capital Corp. | 7,738 | 137,504 | ||||||
Artisan Partners Asset Management, Inc., Class A | 162 | 10,561 | ||||||
Bank of New York Mellon Corp. | 87,890 | 3,070,877 | ||||||
BlackRock, Inc. | 6,285 | 1,989,014 | ||||||
Charles Schwab Corp. | 27,460 | 713,960 | ||||||
E*TRADE Financial Corp.* | 31,294 | 614,614 | ||||||
Federated Investors, Inc., Class B | 686 | 19,757 | ||||||
Franklin Resources, Inc. | 20,908 | 1,207,019 | ||||||
Goldman Sachs Group, Inc. | 34,976 | 6,199,846 | ||||||
Invesco Ltd. | 12,832 | 467,085 | ||||||
Legg Mason, Inc. | 3,200 | 139,136 | ||||||
LPL Financial Holdings, Inc. | 314 | 14,767 | ||||||
Morgan Stanley | 44,070 | 1,382,035 | ||||||
Northern Trust Corp. | 6,956 | 430,507 | ||||||
Raymond James Financial, Inc. | 3,493 | 182,300 | ||||||
SEI Investments Co. | 162 | 5,626 | ||||||
State Street Corp. | 37,602 | 2,759,611 | ||||||
TD Ameritrade Holding Corp. | 6,693 | 205,073 | ||||||
|
| |||||||
| 20,143,885 | ||||||||
|
| |||||||
Commercial Banks (4.5%) | ||||||||
Associated Banc-Corp. | 4,766 | 82,928 | ||||||
Bank of Hawaii Corp. | 1,272 | 75,226 | ||||||
BankUnited, Inc. | 1,828 | 60,178 | ||||||
BB&T Corp. | 20,343 | 759,201 | ||||||
BOK Financial Corp. | 817 | 54,184 | ||||||
CapitalSource, Inc. | 5,649 | 81,176 | ||||||
CIT Group, Inc. | 32,245 | 1,680,932 | ||||||
City National Corp./California | 1,338 | 105,996 | ||||||
Comerica, Inc. | 5,421 | 257,714 | ||||||
Commerce Bancshares, Inc./Missouri | 2,349 | 105,494 | ||||||
Cullen/Frost Bankers, Inc. | 1,535 | 114,250 | ||||||
East West Bancorp, Inc. | 3,952 | 138,201 | ||||||
Fifth Third Bancorp | 36,705 | 771,906 | ||||||
First Citizens BancShares, Inc./North Carolina, Class A | 262 | 58,329 | ||||||
First Horizon National Corp. | 6,981 | 81,329 | ||||||
First Niagara Financial Group, Inc. | 10,187 | $ | 108,186 | |||||
First Republic Bank/California | 3,397 | 177,833 | ||||||
Fulton Financial Corp. | 5,583 | 73,026 | ||||||
Huntington Bancshares, Inc./Ohio | 24,260 | 234,109 | ||||||
KeyCorp | 43,612 | 585,273 | ||||||
M&T Bank Corp. | 3,799 | 442,280 | ||||||
PNC Financial Services Group, Inc. | 85,218 | 6,611,212 | ||||||
Popular, Inc.* | 2,951 | 84,782 | ||||||
Regions Financial Corp. | 65,942 | 652,166 | ||||||
Signature Bank/New York* | 1,207 | 129,656 | ||||||
SunTrust Banks, Inc. | 28,173 | 1,037,048 | ||||||
SVB Financial Group* | 1,372 | 143,868 | ||||||
Synovus Financial Corp. | 28,287 | 101,833 | ||||||
TCF Financial Corp. | 4,735 | 76,944 | ||||||
U.S. Bancorp/Minnesota | 69,918 | 2,824,687 | ||||||
Valley National Bancorp | 5,727 | 57,957 | ||||||
Wells Fargo & Co. | 308,589 | 14,009,941 | ||||||
Zions Bancorp | 5,255 | 157,440 | ||||||
|
| |||||||
| 31,935,285 | ||||||||
|
| |||||||
Consumer Finance (1.4%) | ||||||||
Capital One Financial Corp. | 101,263 | 7,757,758 | ||||||
Discover Financial Services | 36,770 | 2,057,282 | ||||||
SLM Corp. | 12,832 | 337,225 | ||||||
|
| |||||||
| 10,152,265 | ||||||||
|
| |||||||
Diversified Financial Services (6.4%) |
| |||||||
Bank of America Corp. | 819,027 | 12,752,250 | ||||||
Citigroup, Inc. | 233,259 | 12,155,127 | ||||||
CME Group, Inc./Illinois | 9,242 | 725,127 | ||||||
ING US, Inc. | 11,355 | 399,128 | ||||||
Interactive Brokers Group, Inc., Class A | 1,272 | 30,961 | ||||||
IntercontinentalExchange Group, Inc. | 1,428 | 321,186 | ||||||
JPMorgan Chase & Co. | 280,791 | 16,420,658 | ||||||
Leucadia National Corp. | 7,329 | 207,704 | ||||||
McGraw Hill Financial, Inc. | 10,985 | 859,027 | ||||||
Moody’s Corp. | 6,722 | 527,475 | ||||||
MSCI, Inc.* | 2,024 | 88,489 | ||||||
NASDAQ OMX Group, Inc. | 16,419 | 653,476 | ||||||
|
| |||||||
| 45,140,608 | ||||||||
|
| |||||||
Insurance (7.0%) | ||||||||
ACE Ltd. | 58,302 | 6,036,006 | ||||||
Aflac, Inc. | 13,518 | 903,002 | ||||||
Alleghany Corp.* | 534 | 213,579 | ||||||
Allied World Assurance Co. Holdings AG | 686 | 77,388 | ||||||
Allstate Corp. | 13,584 | 740,871 | ||||||
American Financial Group, Inc./Ohio | 19,493 | 1,125,136 | ||||||
American International Group, Inc. | 84,640 | 4,320,872 | ||||||
American National Insurance Co. | 262 | 30,009 | ||||||
Aon plc | 32,934 | 2,762,833 | ||||||
Arch Capital Group Ltd.* | 3,624 | 216,317 | ||||||
Aspen Insurance Holdings Ltd. | 1,893 | 78,200 | ||||||
Assurant, Inc. | 12,186 | 808,785 | ||||||
Assured Guaranty Ltd. | 4,866 | 114,789 | ||||||
See Notes to Financial Statements.
104
AXA PREMIER VIP TRUST
MULTIMANAGER LARGE CAP VALUE PORTFOLIO
PORTFOLIO OF INVESTMENTS (Continued)
December 31, 2013
| Number of Shares | Value (Note 1) | |||||||
Axis Capital Holdings Ltd. | 2,579 | $ | 122,683 | |||||
Berkshire Hathaway, Inc., Class B* | 59,945 | 7,107,079 | ||||||
Brown & Brown, Inc. | 1,862 | 58,448 | ||||||
Chubb Corp. | 30,188 | 2,917,066 | ||||||
Cincinnati Financial Corp. | 4,735 | 247,972 | ||||||
CNA Financial Corp. | 717 | 30,752 | ||||||
Endurance Specialty Holdings Ltd. | 783 | 45,939 | ||||||
Everest Reinsurance Group Ltd. | 3,969 | 618,648 | ||||||
Fidelity National Financial, Inc., Class A | 6,562 | 212,937 | ||||||
Genworth Financial, Inc., Class A* | 88,935 | 1,381,161 | ||||||
Hanover Insurance Group, Inc. | 914 | 54,575 | ||||||
Hartford Financial Services Group, Inc. | 13,125 | 475,519 | ||||||
HCC Insurance Holdings, Inc. | 2,873 | 132,560 | ||||||
Kemper Corp. | 1,338 | 54,697 | ||||||
Lincoln National Corp. | 37,138 | 1,917,064 | ||||||
Loews Corp. | 8,163 | 393,783 | ||||||
Markel Corp.* | 424 | 246,068 | ||||||
Marsh & McLennan Cos., Inc. | 5,290 | 255,824 | ||||||
MBIA, Inc.* | 4,049 | 48,345 | ||||||
Mercury General Corp. | 817 | 40,613 | ||||||
MetLife, Inc. | 73,334 | 3,954,169 | ||||||
Old Republic International Corp. | 7,511 | 129,715 | ||||||
PartnerReinsurance Ltd. | 15,652 | 1,650,190 | ||||||
Principal Financial Group, Inc. | 8,456 | 416,965 | ||||||
ProAssurance Corp. | 1,762 | 85,422 | ||||||
Progressive Corp. | 3,362 | 91,682 | ||||||
Protective Life Corp. | 2,286 | 115,809 | ||||||
Prudential Financial, Inc. | 26,053 | 2,402,608 | ||||||
Reinsurance Group of America, Inc. | 14,146 | 1,095,042 | ||||||
RenaissanceReinsurance Holdings Ltd. | 1,272 | 123,816 | ||||||
StanCorp Financial Group, Inc. | 1,307 | 86,589 | ||||||
Torchmark Corp. | 2,710 | 211,787 | ||||||
Travelers Cos., Inc. | 35,205 | 3,187,461 | ||||||
Unum Group | 11,073 | 388,441 | ||||||
Validus Holdings Ltd. | 2,776 | 111,845 | ||||||
W. R. Berkley Corp. | 3,135 | 136,028 | ||||||
White Mountains Insurance Group Ltd. | 262 | 158,007 | ||||||
XL Group plc | 32,108 | 1,022,319 | ||||||
|
| |||||||
| 49,157,415 | ||||||||
|
| |||||||
Real Estate Investment Trusts (REITs) (1.4%) |
| |||||||
Alexandria Real Estate Equities, Inc. (REIT) | 2,090 | 132,966 | ||||||
American Campus Communities, Inc. (REIT) | 3,004 | 96,759 | ||||||
American Capital Agency Corp. (REIT) | 11,400 | 219,906 | ||||||
American Homes 4 Rent (REIT), Class A | 1,137 | 18,419 | ||||||
Annaly Capital Management, Inc. (REIT) | 27,420 | 273,377 | ||||||
Apartment Investment & Management Co. (REIT), Class A | 1,828 | 47,363 | ||||||
AvalonBay Communities, Inc. (REIT) | 3,795 | $ | 448,683 | |||||
BioMed Realty Trust, Inc. (REIT) | 5,321 | 96,417 | ||||||
Boston Properties, Inc. (REIT) | 3,983 | 399,774 | ||||||
Brandywine Realty Trust (REIT) | 4,473 | 63,025 | ||||||
BRE Properties, Inc. (REIT) | 2,186 | 119,596 | ||||||
Brixmor Property Group, Inc. (REIT)* | 1,106 | 22,485 | ||||||
Camden Property Trust (REIT) | 2,448 | 139,242 | ||||||
CBL & Associates Properties, Inc. (REIT) | 3,135 | 56,305 | ||||||
Chimera Investment Corp. (REIT) | 29,712 | 92,107 | ||||||
CommonWealth REIT (REIT) | 3,379 | 78,764 | ||||||
Corporate Office Properties Trust/Maryland (REIT) | 2,448 | 57,993 | ||||||
Corrections Corp. of America (REIT) | 1,215 | 38,965 | ||||||
DDR Corp. (REIT) | 7,607 | 116,920 | ||||||
Digital Realty Trust, Inc. (REIT) | 783 | 38,461 | ||||||
Douglas Emmett, Inc. (REIT) | 4,114 | 95,815 | ||||||
Duke Realty Corp. (REIT) | 9,273 | 139,466 | ||||||
Equity Lifestyle Properties, Inc. (REIT) | 686 | 24,854 | ||||||
Equity Residential (REIT) | 10,449 | 541,990 | ||||||
Essex Property Trust, Inc. (REIT) | 1,110 | 159,296 | ||||||
Extra Space Storage, Inc. (REIT) | 2,938 | 123,778 | ||||||
Federal Realty Investment Trust (REIT) | 686 | 69,567 | ||||||
Gaming and Leisure Properties, Inc. (REIT)* | 1,959 | 99,537 | ||||||
General Growth Properties, Inc. (REIT) | 17,147 | 344,140 | ||||||
Hatteras Financial Corp. (REIT) | 2,807 | 45,866 | ||||||
HCP, Inc. (REIT) | 13,199 | 479,388 | ||||||
Health Care REIT, Inc. (REIT) | 8,228 | 440,774 | ||||||
Healthcare Trust of America, Inc. (REIT), Class A | 3,200 | 31,488 | ||||||
Home Properties, Inc. (REIT) | 1,635 | 87,669 | ||||||
Hospitality Properties Trust (REIT) | 3,983 | 107,660 | ||||||
Host Hotels & Resorts, Inc. (REIT) | 21,490 | 417,766 | ||||||
Kilroy Realty Corp. (REIT) | 2,321 | 116,468 | ||||||
Kimco Realty Corp. (REIT) | 11,787 | 232,793 | ||||||
Liberty Property Trust (REIT) | 3,769 | 127,656 | ||||||
Macerich Co. (REIT) | 3,940 | 232,027 | ||||||
Mack-Cali Realty Corp. (REIT) | 2,514 | 54,001 | ||||||
MFA Financial, Inc. (REIT) | 10,449 | 73,770 | ||||||
Mid-America Apartment Communities, Inc. (REIT) | 2,207 | 134,053 | ||||||
National Retail Properties, Inc. (REIT) | 3,362 | 101,969 | ||||||
Piedmont Office Realty Trust, Inc. (REIT), Class A | 4,766 | 78,734 | ||||||
Post Properties, Inc. (REIT) | 1,600 | 72,368 | ||||||
Prologis, Inc. (REIT) | 14,442 | 533,632 | ||||||
Public Storage (REIT) | 328 | 49,371 | ||||||
Realty Income Corp. (REIT) | 5,649 | 210,877 | ||||||
Regency Centers Corp. (REIT) | 1,535 | 71,071 | ||||||
Retail Properties of America, Inc. (REIT), Class A | 3,786 | 48,158 | ||||||
See Notes to Financial Statements.
105
AXA PREMIER VIP TRUST
MULTIMANAGER LARGE CAP VALUE PORTFOLIO
PORTFOLIO OF INVESTMENTS (Continued)
December 31, 2013
| Number of Shares | Value (Note 1) | |||||||
Senior Housing Properties Trust (REIT) | 4,962 | $ | 110,305 | |||||
Simon Property Group, Inc. (REIT) | 2,302 | 350,272 | ||||||
SL Green Realty Corp. (REIT) | 2,710 | 250,350 | ||||||
Spirit Realty Capital, Inc. (REIT) | 8,573 | 84,273 | ||||||
Taubman Centers, Inc. (REIT) | 1,535 | 98,117 | ||||||
Two Harbors Investment Corp. (REIT) | 10,580 | 98,182 | ||||||
UDR, Inc. (REIT) | 7,249 | 169,264 | ||||||
Ventas, Inc. (REIT) | 4,673 | 267,669 | ||||||
Vornado Realty Trust (REIT) | 4,414 | 391,919 | ||||||
Weingarten Realty Investors (REIT) | 3,493 | 95,778 | ||||||
WP Carey, Inc. (REIT) | 1,666 | 102,209 | ||||||
|
| |||||||
| 9,921,867 | ||||||||
|
| |||||||
Real Estate Management & Development (0.1%) |
| |||||||
Forest City Enterprises, Inc., Class A* | 4,538 | 86,676 | ||||||
Howard Hughes Corp.* | 1,166 | 140,036 | ||||||
Jones Lang LaSalle, Inc. | 1,307 | 133,824 | ||||||
Realogy Holdings Corp.* | 359 | 17,760 | ||||||
St. Joe Co.* | 1,797 | 34,484 | ||||||
|
| |||||||
| 412,780 | ||||||||
|
| |||||||
Thrifts & Mortgage Finance (0.1%) |
| |||||||
Hudson City Bancorp, Inc. | 18,870 | 177,944 | ||||||
New York Community Bancorp, Inc. | 12,701 | 214,012 | ||||||
People’s United Financial, Inc. | 8,901 | 134,583 | ||||||
TFS Financial Corp.* | 2,186 | 26,484 | ||||||
Washington Federal, Inc. | 2,938 | 68,426 | ||||||
|
| |||||||
| 621,449 | ||||||||
|
| |||||||
Total Financials | 167,485,554 | |||||||
|
| |||||||
Health Care (12.0%) | ||||||||
Biotechnology (0.1%) | ||||||||
Quintiles Transnational Holdings, Inc.* | 424 | 19,648 | ||||||
Vertex Pharmaceuticals, Inc.* | 6,814 | 506,281 | ||||||
|
| |||||||
| 525,929 | ||||||||
|
| |||||||
Health Care Equipment & Supplies (3.0%) |
| |||||||
Abbott Laboratories | 82,678 | 3,169,048 | ||||||
Alere, Inc.* | 2,352 | 85,142 | ||||||
Baxter International, Inc. | 67,841 | 4,718,342 | ||||||
Boston Scientific Corp.* | 39,085 | 469,802 | ||||||
CareFusion Corp.* | 6,300 | 250,866 | ||||||
Cooper Cos., Inc. | 359 | 44,459 | ||||||
Covidien plc | 67,265 | 4,580,746 | ||||||
DENTSPLY International, Inc. | 2,938 | 142,434 | ||||||
Hill-Rom Holdings, Inc. | 1,731 | 71,559 | ||||||
Hologic, Inc.* | 5,452 | 121,852 | ||||||
Medtronic, Inc. | 89,022 | 5,108,973 | ||||||
St. Jude Medical, Inc. | 19,911 | 1,233,486 | ||||||
Stryker Corp. | 3,983 | 299,283 | ||||||
Teleflex, Inc. | 1,241 | 116,480 | ||||||
Zimmer Holdings, Inc. | 4,604 | 429,047 | ||||||
|
| |||||||
| 20,841,519 | ||||||||
|
| |||||||
Health Care Providers & Services (1.5%) |
| |||||||
Aetna, Inc | 29,525 | $ | 2,025,120 | |||||
Cardinal Health, Inc. | 9,894 | 661,018 | ||||||
Cigna Corp. | 7,804 | 682,694 | ||||||
Community Health Systems, Inc.* | 2,514 | 98,725 | ||||||
Envision Healthcare Holdings, Inc.* | 397 | 14,101 | ||||||
Express Scripts Holding Co.* | 18,791 | 1,319,880 | ||||||
HCA Holdings, Inc.* | 7,183 | 342,701 | ||||||
Health Net, Inc.* | 22,236 | 659,742 | ||||||
Humana, Inc. | 4,538 | 468,412 | ||||||
LifePoint Hospitals, Inc.* | 1,338 | 70,700 | ||||||
MEDNAX, Inc.* | 1,110 | 59,252 | ||||||
Omnicare, Inc. | 3,004 | 181,321 | ||||||
Patterson Cos., Inc. | 228 | 9,394 | ||||||
Premier, Inc., Class A* | 335 | 12,315 | ||||||
Quest Diagnostics, Inc. | 12,603 | 674,765 | ||||||
UnitedHealth Group, Inc. | 29,555 | 2,225,491 | ||||||
Universal Health Services, Inc., Class B. | 848 | 68,908 | ||||||
VCA Antech, Inc.* | 2,514 | 78,839 | ||||||
WellPoint, Inc | 12,518 | 1,156,538 | ||||||
|
| |||||||
| 10,809,916 | ||||||||
|
| |||||||
Health Care Technology (0.0%) | ||||||||
Allscripts Healthcare Solutions, Inc.* | 5,093 | 78,738 | ||||||
Veeva Systems, Inc., Class A* | 152 | 4,879 | ||||||
|
| |||||||
| 83,617 | ||||||||
|
| |||||||
Life Sciences Tools & Services (0.6%) |
| |||||||
Agilent Technologies, Inc. | 8,914 | 509,792 | ||||||
Bio-Rad Laboratories, Inc., Class A* | 621 | 76,762 | ||||||
Charles River Laboratories International, Inc.* | 817 | 43,334 | ||||||
Life Technologies Corp.* | 2,097 | 158,952 | ||||||
PerkinElmer, Inc | 3,266 | 134,657 | ||||||
QIAGEN N.V.* | 6,759 | 160,932 | ||||||
Techne Corp. | 621 | 58,790 | ||||||
Thermo Fisher Scientific, Inc. | 25,927 | 2,886,971 | ||||||
|
| |||||||
| 4,030,190 | ||||||||
|
| |||||||
Pharmaceuticals (6.8%) | ||||||||
Bristol-Myers Squibb Co. | 6,587 | 350,099 | ||||||
Eli Lilly and Co. | 22,432 | 1,144,032 | ||||||
Forest Laboratories, Inc.* | 7,738 | 464,512 | ||||||
GlaxoSmithKline plc (ADR) | 21,900 | 1,169,241 | ||||||
Hospira, Inc.* | 4,800 | 198,144 | ||||||
Johnson & Johnson | 155,844 | 14,273,752 | ||||||
Mallinckrodt plc* | 1,739 | 90,880 | ||||||
Merck & Co., Inc. | 131,642 | 6,588,682 | ||||||
Pfizer, Inc. | 714,341 | 21,880,265 | ||||||
Roche Holding AG | 2,651 | 740,574 | ||||||
Roche Holding AG (ADR) | 14,349 | 1,007,300 | ||||||
Zoetis, Inc. | 1,136 | 37,136 | ||||||
|
| |||||||
| 47,944,617 | ||||||||
|
| |||||||
Total Health Care | 84,235,788 | |||||||
|
| |||||||
See Notes to Financial Statements.
106
AXA PREMIER VIP TRUST
MULTIMANAGER LARGE CAP VALUE PORTFOLIO
PORTFOLIO OF INVESTMENTS (Continued)
December 31, 2013
| Number of Shares | Value (Note 1) | |||||||
Industrials (10.4%) | ||||||||
Aerospace & Defense (3.2%) | ||||||||
Alliant Techsystems, Inc. | 914 | $ | 111,215 | |||||
B/E Aerospace, Inc.* | 197 | 17,145 | ||||||
Boeing Co. | 29,850 | 4,074,226 | ||||||
Exelis, Inc. | 5,387 | 102,676 | ||||||
General Dynamics Corp. | 8,652 | 826,699 | ||||||
Honeywell International, Inc. | 68,244 | 6,235,454 | ||||||
L-3 Communications Holdings, Inc. | 2,645 | 282,645 | ||||||
Lockheed Martin Corp. | 26,516 | 3,941,869 | ||||||
Northrop Grumman Corp. | 22,308 | 2,556,720 | ||||||
Raytheon Co. | 9,404 | 852,943 | ||||||
Rockwell Collins, Inc. | 424 | 31,342 | ||||||
Spirit AeroSystems Holdings, Inc., Class A* | 2,938 | 100,127 | ||||||
Textron, Inc. | 7,966 | 292,830 | ||||||
Triumph Group, Inc. | 1,241 | 94,403 | ||||||
United Technologies Corp. | 24,548 | 2,793,562 | ||||||
|
| |||||||
| 22,313,856 | ||||||||
|
| |||||||
Air Freight & Logistics (0.5%) | ||||||||
FedEx Corp. | 9,242 | 1,328,723 | ||||||
United Parcel Service, Inc., Class B | 20,415 | 2,145,208 | ||||||
|
| |||||||
| 3,473,931 | ||||||||
|
| |||||||
Airlines (0.2%) | ||||||||
Alaska Air Group, Inc. | 197 | 14,454 | ||||||
American Airlines Group, Inc.* | 4,880 | 123,220 | ||||||
Delta Air Lines, Inc. | 30,687 | 842,972 | ||||||
Southwest Airlines Co. | 18,611 | 350,631 | ||||||
|
| |||||||
| 1,331,277 | ||||||||
|
| |||||||
Building Products (0.0%) | ||||||||
A.O. Smith Corp. | 1,307 | 70,500 | ||||||
Allegion plc* | 849 | 37,532 | ||||||
Fortune Brands Home & Security, Inc. . | 555 | 25,363 | ||||||
Owens Corning, Inc.* | 3,428 | 139,588 | ||||||
|
| |||||||
| 272,983 | ||||||||
|
| |||||||
Commercial Services & Supplies (0.4%) |
| |||||||
ADT Corp. | 6,335 | 256,377 | ||||||
Cintas Corp. | 2,155 | 128,416 | ||||||
Covanta Holding Corp. | 3,004 | 53,321 | ||||||
Iron Mountain, Inc. | 453 | 13,749 | ||||||
KAR Auction Services, Inc. | 1,338 | 39,538 | ||||||
Pitney Bowes, Inc. | 3,231 | 75,282 | ||||||
R.R. Donnelley & Sons Co. | 2,317 | 46,989 | ||||||
Republic Services, Inc. | 7,804 | 259,093 | ||||||
Tyco International Ltd. | 34,627 | 1,421,092 | ||||||
Waste Connections, Inc. | 229 | 9,991 | ||||||
Waste Management, Inc. | 12,473 | 559,664 | ||||||
|
| |||||||
| 2,863,512 | ||||||||
|
| |||||||
Construction & Engineering (0.1%) | ||||||||
AECOM Technology Corp.* | 2,710 | 79,755 | ||||||
Fluor Corp. | 1,893 | 151,989 | ||||||
Jacobs Engineering Group, Inc.* | 3,821 | 240,685 | ||||||
KBR, Inc. | 4,211 | $ | 134,289 | |||||
Quanta Services, Inc.* | 4,700 | 148,332 | ||||||
URS Corp. | 2,221 | 117,691 | ||||||
|
| |||||||
| 872,741 | ||||||||
|
| |||||||
Electrical Equipment (0.4%) | ||||||||
Babcock & Wilcox Co. | 979 | 33,472 | ||||||
Eaton Corp. plc | 29,093 | 2,214,559 | ||||||
Emerson Electric Co. | 5,290 | 371,252 | ||||||
Hubbell, Inc., Class B | 490 | 53,361 | ||||||
Regal-Beloit Corp. | 1,272 | 93,772 | ||||||
|
| |||||||
| 2,766,416 | ||||||||
|
| |||||||
Industrial Conglomerates (3.7%) | ||||||||
3M Co. | 22,016 | 3,087,744 | ||||||
Carlisle Cos., Inc | 1,797 | 142,682 | ||||||
Danaher Corp. | 35,529 | 2,742,839 | ||||||
General Electric Co. | 718,920 | 20,151,327 | ||||||
|
| |||||||
| 26,124,592 | ||||||||
|
| |||||||
Machinery (1.4%) | ||||||||
AGCO Corp. | 2,842 | 168,218 | ||||||
Caterpillar, Inc. | 15,608 | 1,417,362 | ||||||
Crane Co. | 131 | 8,810 | ||||||
Cummins, Inc. | 979 | 138,010 | ||||||
Donaldson Co., Inc. | 293 | 12,734 | ||||||
Dover Corp. | 1,272 | 122,799 | ||||||
Harsco Corp. | 2,155 | 60,405 | ||||||
IDEX Corp. | 197 | 14,548 | ||||||
Illinois Tool Works, Inc. | 32,754 | 2,753,956 | ||||||
Ingersoll-Rand plc | 2,548 | 156,957 | ||||||
Joy Global, Inc. | 3,069 | 179,506 | ||||||
Kennametal, Inc. | 2,286 | 119,032 | ||||||
Navistar International Corp.* | 1,338 | 51,098 | ||||||
Oshkosh Corp. | 2,514 | 126,655 | ||||||
PACCAR, Inc. | 8,880 | 525,430 | ||||||
Parker Hannifin Corp. | 4,376 | 562,929 | ||||||
Pentair Ltd. (Registered) | 13,722 | 1,065,788 | ||||||
Snap-on, Inc. | 1,569 | 171,837 | ||||||
SPX Corp. | 1,338 | 133,278 | ||||||
Stanley Black & Decker, Inc. | 15,738 | 1,269,899 | ||||||
Terex Corp. | 3,200 | 134,368 | ||||||
Timken Co. | 2,514 | 138,446 | ||||||
Trinity Industries, Inc. | 2,252 | 122,779 | ||||||
Xylem, Inc. | 4,962 | 171,685 | ||||||
|
| |||||||
| 9,626,529 | ||||||||
|
| |||||||
Marine (0.0%) | ||||||||
Kirby Corp.* | 686 | 68,085 | ||||||
|
| |||||||
Professional Services (0.1%) | ||||||||
Dun & Bradstreet Corp. | 131 | 16,080 | ||||||
Manpowergroup, Inc. | 2,286 | 196,276 | ||||||
Nielsen Holdings N.V. | 5,440 | 249,642 | ||||||
Towers Watson & Co., Class A | 1,893 | 241,566 | ||||||
|
| |||||||
| 703,564 | ||||||||
|
| |||||||
Road & Rail (0.3%) | ||||||||
Amerco, Inc.* | 131 | 31,157 | ||||||
Canadian National Railway Co. | 14,194 | 809,342 | ||||||
See Notes to Financial Statements.
107
AXA PREMIER VIP TRUST
MULTIMANAGER LARGE CAP VALUE PORTFOLIO
PORTFOLIO OF INVESTMENTS (Continued)
December 31, 2013
| Number of Shares | Value (Note 1) | |||||||
Con-way, Inc. | 1,045 | $ | 41,497 | |||||
CSX Corp. | 14,790 | 425,508 | ||||||
Genesee & Wyoming, Inc., Class A* | 752 | 72,230 | ||||||
Norfolk Southern Corp. | 7,511 | 697,246 | ||||||
Ryder System, Inc | 1,469 | 108,383 | ||||||
|
| |||||||
| 2,185,363 | ||||||||
|
| |||||||
Trading Companies & Distributors (0.1%) |
| |||||||
Air Lease Corp. | 2,024 | 62,906 | ||||||
GATX Corp. | 1,338 | 69,803 | ||||||
HD Supply Holdings, Inc.* | 599 | 14,382 | ||||||
MRC Global, Inc.* | 1,338 | 43,164 | ||||||
WESCO International, Inc.* | 1,307 | 119,029 | ||||||
|
| |||||||
| 309,284 | ||||||||
|
| |||||||
Total Industrials | 72,912,133 | |||||||
|
| |||||||
Information Technology (8.5%) |
| |||||||
Communications Equipment (1.4%) |
| |||||||
Brocade Communications Systems, Inc.* | 12,832 | 113,820 | ||||||
Cisco Systems, Inc. | 351,373 | 7,888,324 | ||||||
CommScope Holding Co., Inc.* | 512 | 9,687 | ||||||
EchoStar Corp., Class A* | 1,176 | 58,471 | ||||||
Harris Corp. | 18,445 | 1,287,645 | ||||||
JDS Uniphase Corp.* | 1,535 | 19,924 | ||||||
Juniper Networks, Inc.* | 11,918 | 268,989 | ||||||
Motorola Solutions, Inc. | 359 | 24,233 | ||||||
Polycom, Inc.* | 4,962 | 55,723 | ||||||
Riverbed Technology, Inc.* | 162 | 2,929 | ||||||
|
| |||||||
| 9,729,745 | ||||||||
|
| |||||||
Computers & Peripherals (1.5%) |
| |||||||
Apple, Inc. | 8,228 | 4,616,813 | ||||||
Diebold, Inc. | 1,762 | 58,164 | ||||||
EMC Corp. | 30,398 | 764,510 | ||||||
Hewlett-Packard Co. | 158,013 | 4,421,204 | ||||||
Lexmark International, Inc., Class A | 1,762 | 62,586 | ||||||
SanDisk Corp. | 3,886 | 274,118 | ||||||
Stratasys Ltd.* | 485 | 65,330 | ||||||
Western Digital Corp. | 6,138 | 514,978 | ||||||
|
| |||||||
| 10,777,703 | ||||||||
|
| |||||||
Electronic Equipment, Instruments & Components (0.3%) |
| |||||||
Arrow Electronics, Inc.* | 16,004 | 868,217 | ||||||
Avnet, Inc. | 3,917 | 172,779 | ||||||
AVX Corp. | 1,272 | 17,719 | ||||||
CDW Corp. | 494 | 11,540 | ||||||
Corning, Inc. | 42,675 | 760,468 | ||||||
Dolby Laboratories, Inc., Class A* | 717 | 27,648 | ||||||
FLIR Systems, Inc. | 1,241 | 37,354 | ||||||
Ingram Micro, Inc., Class A* | 4,342 | 101,863 | ||||||
Jabil Circuit, Inc. | 5,845 | 101,937 | ||||||
Tech Data Corp.* | 1,110 | 57,276 | ||||||
Vishay Intertechnology, Inc.* | 3,721 | 49,340 | ||||||
|
| |||||||
| 2,206,141 | ||||||||
|
| |||||||
Internet Software & Services (0.2%) | ||||||||
AOL, Inc.* | 2,170 | $ | 101,165 | |||||
Twitter, Inc.* | 589 | 37,490 | ||||||
Yahoo!, Inc.* | 25,893 | 1,047,113 | ||||||
|
| |||||||
| 1,185,768 | ||||||||
|
| |||||||
IT Services (1.2%) | ||||||||
Accenture plc, Class A | 32,493 | 2,671,574 | ||||||
Amdocs Ltd. | 17,169 | 708,050 | ||||||
Booz Allen Hamilton Holding Corp. | 8 | 153 | ||||||
Computer Sciences Corp. | 4,376 | 244,531 | ||||||
CoreLogic, Inc.* | 2,676 | 95,078 | ||||||
DST Systems, Inc. | 197 | 17,876 | ||||||
Fidelity National Information Services, Inc. | 14,422 | 774,173 | ||||||
Fiserv, Inc.* | 12,346 | 729,031 | ||||||
International Business Machines Corp. . | 12,913 | 2,422,091 | ||||||
Leidos Holdings, Inc. | 2,122 | 98,652 | ||||||
Lender Processing Services, Inc. | 524 | 19,587 | ||||||
Paychex, Inc. | 914 | 41,614 | ||||||
Science Applications International Corp. | 1,141 | 37,733 | ||||||
Total System Services, Inc. | 1,045 | 34,778 | ||||||
VeriFone Systems, Inc.* | 3,135 | 84,081 | ||||||
Western Union Co. | 21,680 | 373,980 | ||||||
|
| |||||||
| 8,352,982 | ||||||||
|
| |||||||
Office Electronics (0.3%) | ||||||||
Xerox Corp. | 162,888 | 1,982,347 | ||||||
Zebra Technologies Corp., Class A* | 1,372 | 74,198 | ||||||
|
| |||||||
| 2,056,545 | ||||||||
|
| |||||||
Semiconductors & Semiconductor Equipment (2.0%) |
| |||||||
Altera Corp. | 6,007 | 195,408 | ||||||
Analog Devices, Inc. | 5,028 | 256,076 | ||||||
Applied Materials, Inc. | 71,021 | 1,256,362 | ||||||
Avago Technologies Ltd. | 621 | 32,845 | ||||||
Broadcom Corp., Class A | 9,273 | 274,944 | ||||||
Fairchild Semiconductor International, Inc.* | 3,590 | 47,927 | ||||||
First Solar, Inc.* | 1,897 | 103,652 | ||||||
Freescale Semiconductor Ltd.* | 848 | 13,610 | ||||||
Intel Corp. | 166,782 | 4,329,661 | ||||||
KLA-Tencor Corp. | 4,766 | 307,216 | ||||||
Lam Research Corp.* | 16,132 | 878,387 | ||||||
LSI Corp. | 14,073 | 155,085 | ||||||
Marvell Technology Group Ltd. | 11,428 | 164,335 | ||||||
Micron Technology, Inc.* | 55,978 | 1,218,081 | ||||||
NVIDIA Corp. | 24,218 | 387,972 | ||||||
ON Semiconductor Corp.* | 621 | 5,117 | ||||||
Silicon Laboratories, Inc.* | 197 | 8,532 | ||||||
Skyworks Solutions, Inc.* | 914 | 26,104 | ||||||
Teradyne, Inc.* | 5,452 | 96,064 | ||||||
Texas Instruments, Inc. | 97,555 | 4,283,640 | ||||||
|
| |||||||
| 14,041,018 | ||||||||
|
| |||||||
See Notes to Financial Statements.
108
AXA PREMIER VIP TRUST
MULTIMANAGER LARGE CAP VALUE PORTFOLIO
PORTFOLIO OF INVESTMENTS (Continued)
December 31, 2013
| Number of Shares | Value (Note 1) | |||||||
Software (1.6%) | ||||||||
Activision Blizzard, Inc. | 7,889 | $ | 140,661 | |||||
Adobe Systems, Inc.* | 8,849 | 529,878 | ||||||
Autodesk, Inc.* | 1,272 | 64,020 | ||||||
CA, Inc. | 9,435 | 317,488 | ||||||
Compuware Corp. | 6,138 | 68,807 | ||||||
Electronic Arts, Inc.* | 53,424 | 1,225,547 | ||||||
FireEye, Inc.* | 125 | 5,451 | ||||||
MICROS Systems, Inc.* | 1,893 | 108,601 | ||||||
Nuance Communications, Inc.* | 7,476 | 113,635 | ||||||
Oracle Corp. | 146,321 | 5,598,242 | ||||||
Rovi Corp.* | 2,645 | 52,080 | ||||||
Symantec Corp. | 122,495 | 2,888,432 | ||||||
Synopsys, Inc.* | 4,407 | 178,792 | ||||||
Zynga, Inc., Class A* | 16,815 | 63,897 | ||||||
|
| |||||||
| 11,355,531 | ||||||||
|
| |||||||
Total Information Technology | 59,705,433 | |||||||
|
| |||||||
Materials (2.5%) | ||||||||
Chemicals (1.9%) | ||||||||
Air Products and Chemicals, Inc | 8,922 | 997,301 | ||||||
Albemarle Corp. | 1,500 | 95,085 | ||||||
Ashland, Inc. | 2,352 | 228,238 | ||||||
Cabot Corp. | 1,862 | 95,707 | ||||||
CF Industries Holdings, Inc. | 1,784 | 415,743 | ||||||
Cytec Industries, Inc. | 1,041 | 96,980 | ||||||
Dow Chemical Co. | 30,398 | 1,349,671 | ||||||
Huntsman Corp | 5,518 | 135,743 | ||||||
Kronos Worldwide, Inc. | 555 | 10,573 | ||||||
LyondellBasell Industries N.V., Class A | 24,243 | 1,946,228 | ||||||
Monsanto Co. | 32,031 | 3,733,213 | ||||||
Mosaic Co. | 42,917 | 2,028,687 | ||||||
PPG Industries, Inc. | 9,244 | 1,753,217 | ||||||
Rockwood Holdings, Inc. | 621 | 44,662 | ||||||
RPM International, Inc. | 262 | 10,876 | ||||||
Sigma-Aldrich Corp. | 262 | 24,631 | ||||||
Valspar Corp. | 1,660 | 118,341 | ||||||
W.R. Grace & Co.* | 328 | 32,429 | ||||||
Westlake Chemical Corp. | 131 | 15,991 | ||||||
|
| |||||||
| 13,133,316 | ||||||||
|
| |||||||
Construction Materials (0.0%) |
| |||||||
Vulcan Materials Co. | 3,721 | 221,102 | ||||||
|
| |||||||
Containers & Packaging (0.2%) |
| |||||||
AptarGroup, Inc. | 621 | 42,110 | ||||||
Avery Dennison Corp. | 1,959 | 98,322 | ||||||
Bemis Co., Inc. | 1,666 | 68,239 | ||||||
Crown Holdings, Inc.* | 9,001 | 401,175 | ||||||
Greif, Inc., Class A | 752 | 39,405 | ||||||
MeadWestvaco Corp | 5,093 | 188,084 | ||||||
Owens-Illinois, Inc.* | 1,893 | 67,732 | ||||||
Rock-Tenn Co., Class A | 621 | 65,211 | ||||||
Sonoco Products Co. | 2,873 | 119,862 | ||||||
|
| |||||||
| 1,090,140 | ||||||||
|
| |||||||
Metals & Mining (0.4%) | ||||||||
Alcoa, Inc. | 30,953 | 329,030 | ||||||
Allegheny Technologies, Inc. | 3,069 | 109,349 | ||||||
Carpenter Technology Corp. | 1,372 | 85,338 | ||||||
Cliffs Natural Resources, Inc. | 4,342 | $ | 113,804 | |||||
Freeport-McMoRan Copper & Gold, Inc. | 29,888 | 1,127,973 | ||||||
Newmont Mining Corp. | 14,170 | 326,335 | ||||||
Nucor Corp. | 9,207 | 491,470 | ||||||
Reliance Steel & Aluminum Co. | 2,186 | 165,786 | ||||||
Royal Gold, Inc. | 1,338 | 61,642 | ||||||
Steel Dynamics, Inc. | 6,300 | 123,102 | ||||||
Tahoe Resources, Inc.* | 2,055 | 34,195 | ||||||
United States Steel Corp. | 4,180 | 123,310 | ||||||
|
| |||||||
| 3,091,334 | ||||||||
|
| |||||||
Paper & Forest Products (0.0%) | ||||||||
Domtar Corp. | 979 | 92,358 | ||||||
International Paper Co. | 1,762 | 86,391 | ||||||
|
| |||||||
| 178,749 | ||||||||
|
| |||||||
Total Materials | 17,714,641 | |||||||
|
| |||||||
Telecommunication Services (3.0%) |
| |||||||
Diversified Telecommunication Services (1.6%) |
| |||||||
AT&T, Inc. | 260,823 | 9,170,537 | ||||||
CenturyLink, Inc. | 17,608 | 560,815 | ||||||
Frontier Communications Corp. | 28,824 | 134,031 | ||||||
Intelsat S.A.* | 521 | 11,743 | ||||||
Level 3 Communications, Inc.* | 3,095 | 102,661 | ||||||
Verizon Communications, Inc. | 30,235 | 1,485,748 | ||||||
Windstream Holdings, Inc. | 914 | 7,294 | ||||||
|
| |||||||
| 11,472,829 | ||||||||
|
| |||||||
Wireless Telecommunication Services (1.4%) |
| |||||||
Sprint Corp.* | 20,113 | 216,215 | ||||||
Telephone & Data Systems, Inc. | 2,728 | 70,328 | ||||||
T-Mobile US, Inc.* | 4,943 | 166,282 | ||||||
U.S. Cellular Corp. | 359 | 15,013 | ||||||
Vodafone Group plc | 412,317 | 1,618,180 | ||||||
Vodafone Group plc (ADR) | 186,186 | 7,318,972 | ||||||
|
| |||||||
| 9,404,990 | ||||||||
|
| |||||||
Total Telecommunication Services | 20,877,819 | |||||||
|
| |||||||
Utilities (3.2%) | ||||||||
Electric Utilities (1.9%) | ||||||||
American Electric Power Co., Inc. | 14,073 | 657,772 | ||||||
Duke Energy Corp. | 26,551 | 1,832,284 | ||||||
Edison International | 37,569 | 1,739,445 | ||||||
Entergy Corp. | 5,159 | 326,410 | ||||||
Exelon Corp. | 123,770 | 3,390,060 | ||||||
FirstEnergy Corp. | 12,060 | 397,739 | ||||||
Great Plains Energy, Inc. | 4,407 | 106,826 | ||||||
Hawaiian Electric Industries, Inc. | 2,842 | 74,062 | ||||||
NextEra Energy, Inc. | 12,277 | 1,051,157 | ||||||
Northeast Utilities | 9,062 | 384,138 | ||||||
OGE Energy Corp. | 5,714 | 193,705 | ||||||
Pepco Holdings, Inc. | 7,183 | 137,411 | ||||||
Pinnacle West Capital Corp. | 3,200 | 169,344 | ||||||
PPL Corp. | 32,103 | 965,979 | ||||||
Southern Co. | 25,174 | 1,034,903 | ||||||
Westar Energy, Inc. | 3,590 | 115,490 | ||||||
Xcel Energy, Inc. | 14,366 | 401,386 | ||||||
|
| |||||||
| 12,978,111 | ||||||||
|
| |||||||
See Notes to Financial Statements.
109
AXA PREMIER VIP TRUST
MULTIMANAGER LARGE CAP VALUE PORTFOLIO
PORTFOLIO OF INVESTMENTS (Continued)
December 31, 2013
| Number of Shares | Value (Note 1) | |||||||
Gas Utilities (0.3%) | ||||||||
AGL Resources, Inc. | 3,462 | $ | 163,510 | |||||
Atmos Energy Corp. | 24,136 | 1,096,257 | ||||||
National Fuel Gas Co. | 2,155 | 153,867 | ||||||
ONEOK, Inc. | 393 | 24,437 | ||||||
Questar Corp. | 4,342 | 99,823 | ||||||
UGI Corp. | 17,631 | 730,981 | ||||||
|
| |||||||
| 2,268,875 | ||||||||
|
| |||||||
Independent Power Producers & Energy Traders (0.1%) |
| |||||||
AES Corp. | 17,925 | 260,092 | ||||||
Calpine Corp.* | 10,056 | 196,193 | ||||||
NRG Energy, Inc. | 9,338 | 268,187 | ||||||
|
| |||||||
| 724,472 | ||||||||
|
| |||||||
Multi-Utilities (0.9%) | ||||||||
Alliant Energy Corp. | 3,166 | 163,366 | ||||||
Ameren Corp. | 6,987 | 252,650 | ||||||
CenterPoint Energy, Inc. | 38,408 | 890,297 | ||||||
CMS Energy Corp. | 7,673 | 205,406 | ||||||
Consolidated Edison, Inc. | 8,456 | 467,448 | ||||||
Dominion Resources, Inc. | 16,784 | 1,085,757 | ||||||
DTE Energy Co. | 7,845 | 520,830 | ||||||
Integrys Energy Group, Inc. | 2,252 | 122,531 | ||||||
MDU Resources Group, Inc. | 5,387 | 164,573 | ||||||
NiSource, Inc. | 9,045 | 297,400 | ||||||
PG&E Corp. | 12,766 | 514,214 | ||||||
Public Service Enterprise Group, Inc. | 20,720 | 663,869 | ||||||
SCANA Corp. | 4,049 | 190,020 | ||||||
Sempra Energy | 7,052 | 632,987 | ||||||
TECO Energy, Inc. | 6,269 | 108,078 | ||||||
Vectren Corp. | 2,317 | 82,253 | ||||||
Wisconsin Energy Corp. | 6,628 | 274,001 | ||||||
|
| |||||||
| 6,635,680 | ||||||||
|
| |||||||
Water Utilities (0.0%) | ||||||||
American Water Works Co., Inc. | 5,159 | $ | 218,019 | |||||
Aqua America, Inc. | 537 | 12,668 | ||||||
|
| |||||||
| 230,687 | ||||||||
|
| |||||||
Total Utilities | 22,837,825 | |||||||
|
| |||||||
Total Common Stocks (90.6%) | 637,540,273 | |||||||
|
| |||||||
CONVERTIBLE PREFERRED STOCK: |
| |||||||
Industrials (0.0%) | ||||||||
Aerospace & Defense (0.0%) | ||||||||
United Technologies Corp. 7.500% | 3,427 | 224,366 | ||||||
|
| |||||||
Total Convertible Preferred Stock (0.0%) | 224,366 | |||||||
|
| |||||||
| Principal Amount | Value (Note 1) | |||||||
SHORT-TERM INVESTMENT: | ||||||||
Commercial Paper (0.1%) | ||||||||
HSBC USA, Inc. | ||||||||
0.05%, 1/2/14(p) | $ | 1,012,000 | 1,011,997 | |||||
|
| |||||||
Total Commercial Paper | 1,011,997 | |||||||
|
| |||||||
Total Short-Term Investments (0.1%) | 1,011,997 | |||||||
|
| |||||||
Total Investments (90.7%) | 638,776,636 | |||||||
Other Assets Less Liabilities (9.3%) | 65,148,811 | |||||||
|
| |||||||
Net Assets (100%) | $ | 703,925,447 | ||||||
|
| |||||||
| * | Non-income producing. |
| (p) | Yield to maturity. |
Glossary:
| ADR | — American Depositary Receipt |
At December 31, 2013, the Portfolio had the following futures contracts open: (Note 1)
Purchases | Number of Contracts | Expiration Date | Original Value | Value at 12/31/2013 | Unrealized Appreciation/ (Depreciation) | |||||||||||||||
S&P MidCap 400 E-Mini Index | 83 | March-14 | $ | 10,858,160 | $ | 11,117,020 | $ | 258,860 | ||||||||||||
S&P 500 E-Mini Index | 554 | March-14 | 49,882,732 | 50,998,470 | 1,115,738 | |||||||||||||||
|
| |||||||||||||||||||
| $ | 1,374,598 | |||||||||||||||||||
|
| |||||||||||||||||||
See Notes to Financial Statements.
110
AXA PREMIER VIP TRUST
MULTIMANAGER LARGE CAP VALUE PORTFOLIO
PORTFOLIO OF INVESTMENTS (Continued)
December 31, 2013
The following is a summary of the inputs used to value the Portfolio’s assets and liabilities carried at fair value as of December 31, 2013:
The inputs or methodology used for valuing securities are not necessarily an indication of the risk associated with investing in those securities.
Various inputs are used in determining the value of the Portfolio’s investments. These inputs are summarized in the three broad levels listed below:
| Investment Type | Level 1 Securities | Level 2 Significant Other Observable Inputs (including quoted prices for similar securities, interest rates, prepayment speeds, credit risk, etc.) | Level 3 Significant Unobservable Inputs (including the Portfolio’s own assumptions in determining the fair value of investments) | Total | ||||||||||||
Assets: | ||||||||||||||||
Common Stocks | ||||||||||||||||
Consumer Discretionary | $ | 64,950,297 | $ | — | $ | — | $ | 64,950,297 | ||||||||
Consumer Staples | 36,836,035 | 5,546,805 | — | 42,382,840 | ||||||||||||
Energy | 84,437,943 | — | — | 84,437,943 | ||||||||||||
Financials | 167,485,554 | — | — | 167,485,554 | ||||||||||||
Health Care | 83,495,214 | 740,574 | — | 84,235,788 | ||||||||||||
Industrials | 72,912,133 | — | — | 72,912,133 | ||||||||||||
Information Technology | 59,705,433 | — | — | 59,705,433 | ||||||||||||
Materials | 17,714,641 | — | — | 17,714,641 | ||||||||||||
Telecommunication Services | 19,259,639 | 1,618,180 | — | 20,877,819 | ||||||||||||
Utilities | 22,837,825 | — | — | 22,837,825 | ||||||||||||
Convertible Preferred Stocks | ||||||||||||||||
Industrials | 224,366 | — | — | 224,366 | ||||||||||||
Futures | 1,374,598 | — | — | 1,374,598 | ||||||||||||
Short-Term Investments | — | 1,011,997 | — | 1,011,997 | ||||||||||||
|
|
|
|
|
|
|
| |||||||||
Total Assets | $ | 631,233,678 | $ | 8,917,556 | $ | — | 640,151,234 | |||||||||
|
|
|
|
|
|
|
| |||||||||
Total Liabilities | $ | — | $ | — | $ | — | — | |||||||||
|
|
|
|
|
|
|
| |||||||||
Total | $ | 631,233,678 | $ | 8,917,556 | $ | — | 640,151,234 | |||||||||
|
|
|
|
|
|
|
| |||||||||
There were no transfers between Levels 1, 2 or 3 during the year ended December 31, 2013.
Fair Values of Derivative Instruments as of December 31, 2013:
Statement of Assets and Liabilities | ||||||
Derivatives Not Accounted for as Hedging | Asset Derivatives | Fair Value | ||||
Interest rate contracts | Receivables, Net assets - Unrealized appreciation | $ | — | * | ||
Foreign exchange contracts | Receivables | — | ||||
Credit contracts | Receivables | — | ||||
Equity contracts | Receivables, Net assets - Unrealized appreciation | 1,374,598 | * | |||
Commodity contracts | Receivables | — | ||||
Other contracts | Receivables | — | ||||
|
| |||||
Total | $ | 1,374,598 | ||||
|
| |||||
Liability Derivatives | ||||||
Interest rate contracts | Payables, Net assets - Unrealized depreciation | $ | — | * | ||
Foreign exchange contracts | Payables | — | ||||
Credit contracts | Payables | — | ||||
Equity contracts | Payables, Net assets - Unrealized depreciation | — | * | |||
Commodity contracts | Payables | — | ||||
Other contracts | Payables | — | ||||
|
| |||||
Total | $ | — | ||||
|
| |||||
| * | Includes cumulative appreciation/depreciation of futures contracts as reported in the Portfolio of Investments. Only current day’s variation margin is reported within the Statement of Assets & Liabilities. |
See Notes to Financial Statements.
111
AXA PREMIER VIP TRUST
MULTIMANAGER LARGE CAP VALUE PORTFOLIO
PORTFOLIO OF INVESTMENTS (Continued)
December 31, 2013
The effect of Derivative Instruments on the Statement of Operations for the year ended December 31, 2013:
| Amount of Realized Gain or (Loss) on Derivatives Recognized in Income | ||||||||||||||||||||
Derivatives Not Accounted for as Hedging Instruments^ | Options | Futures | Forward Currency Contracts | Swaps | Total | |||||||||||||||
Interest rate contracts | $ | — | $ | — | $ | — | $ | — | $ | — | ||||||||||
Foreign exchange contracts | — | — | — | — | — | |||||||||||||||
Credit contracts | — | — | — | — | — | |||||||||||||||
Equity contracts | — | 21,607,656 | — | — | 21,607,656 | |||||||||||||||
Commodity contracts | — | — | — | — | — | |||||||||||||||
Other contracts | — | — | — | — | — | |||||||||||||||
|
|
|
|
|
|
|
|
|
| |||||||||||
Total | $ | — | $ | 21,607,656 | $ | — | $ | — | $ | 21,607,656 | ||||||||||
|
|
|
|
|
|
|
|
|
| |||||||||||
| Amount of Unrealized Appreciation or (Depreciation) on Derivatives Recognized in Income | ||||||||||||||||||||
Derivatives Not Accounted for as Hedging Instruments^ | Options | Futures | Forward Currency Contracts | Swaps | Total | |||||||||||||||
Interest rate contracts | $ | — | $ | — | $ | — | $ | — | $ | — | ||||||||||
Foreign exchange contracts | — | — | — | — | — | |||||||||||||||
Credit contracts | — | — | — | — | — | |||||||||||||||
Equity contracts | — | 1,270,089 | — | — | 1,270,089 | |||||||||||||||
Commodity contracts | — | — | — | — | — | |||||||||||||||
Other contracts | — | — | — | — | — | |||||||||||||||
|
|
|
|
|
|
|
|
|
| |||||||||||
Total | $ | — | $ | 1,270,089 | $ | — | $ | — | $ | 1,270,089 | ||||||||||
|
|
|
|
|
|
|
|
|
| |||||||||||
^ This Portfolio held futures contracts as a substitute for investing in conventional securities, hedging and in an attempt to enhance returns.
The Portfolio held futures contracts with an average notional balance of approximately $69,311,000 during the year ended December 31, 2013.
The following table presents the Portfolio’s gross derivative assets and liabilities by counterparty net of amounts available for offset under netting arrangements and any related collateral received or pledged by the Portfolio as of December 31, 2013:
Counterparty | Gross Amount of Derivative Assets Presented in the Statement of Assets and Liabilities (a) | Derivatives Available for Offset | Collateral Received | Net Amount Due from Counterparty | ||||||||||||
Exchange Traded Futures & Options Contracts (b) | $ 1,374,598 | (c) | $ | — | $ | — | $ | 1,374,598 | ||||||||
|
|
|
|
|
|
|
| |||||||||
| (a) | For financial reporting purposes the Portfolio does not offset derivative assets and derivative liabilities subject to master netting arrangements in the Statement of Assets and Liabilities. |
| (b) | These derivatives are traded on an exchange, therefore they are not subject to master netting arrangements. |
| (c) | This amount represents the cumulative appreciation (depreciation) of futures contracts as reported in the Portfolio of Investments. The Statement of Assets and Liabilities only reflects the current day variation margin receivable/payable to brokers for futures contracts. |
Investment security transactions for the year ended December 31, 2013 were as follows:
Cost of Purchases: | ||||
Long-term investments other than U.S. government debt securities | $ | 234,151,692 | ||
Net Proceeds of Sales and Redemptions: | ||||
Long-term investments other than U.S. government debt securities | $ | 463,468,847 |
See Notes to Financial Statements.
112
AXA PREMIER VIP TRUST
MULTIMANAGER LARGE CAP VALUE PORTFOLIO
PORTFOLIO OF INVESTMENTS (Continued)
December 31, 2013
As of December 31, 2013, the gross unrealized appreciation (depreciation) of investments based on the aggregate cost of investments for Federal income tax purposes was as follows:
Aggregate gross unrealized appreciation | $ | 221,521,620 | ||
Aggregate gross unrealized depreciation | (5,963,551 | ) | ||
|
| |||
Net unrealized appreciation | $ | 215,558,069 | ||
|
| |||
Federal income tax cost of investments | $ | 423,218,567 | ||
|
|
For the year ended December 31, 2013, the Portfolio incurred approximately $4,912 as brokerage commissions with Sanford C. Bernstein & Co., LLC, an affiliated broker/dealer.
The Portfolio has a net capital loss carryforward of $457,024,645, which expires in the year 2017. The Portfolio utilized net capital loss carryforward of $120,241,567 during 2013.
See Notes to Financial Statements.
113
AXA PREMIER VIP TRUST
MULTIMANAGER LARGE CAP VALUE PORTFOLIO
STATEMENT OF ASSETS AND LIABILITIES
December 31, 2013
ASSETS | ||||
Investments at value (Cost $416,691,276) | $ | 638,776,636 | ||
Cash | 53,370,521 | |||
Cash held as collateral at broker | 12,010,000 | |||
Dividends, interest and other receivables | 1,061,605 | |||
Due from broker for futures variation margin | 206,330 | |||
Receivable from Separate Accounts for Trust shares sold | 22,456 | |||
Other assets | 2,934 | |||
|
| |||
Total assets | 705,450,482 | |||
|
| |||
LIABILITIES | ||||
Payable to Separate Accounts for Trust shares redeemed | 881,485 | |||
Investment management fees payable | 389,701 | |||
Administrative fees payable | 120,614 | |||
Trustees’ fees payable | 28,161 | |||
Distribution fees payable - Class B | 19,759 | |||
Payable for securities purchased | 9,305 | |||
Distribution fees payable - Class A | 2,671 | |||
Accrued expenses | 73,339 | |||
|
| |||
Total liabilities | 1,525,035 | |||
|
| |||
NET ASSETS | $ | 703,925,447 | ||
|
| |||
Net assets were comprised of: | ||||
Paid in capital | $ | 963,700,985 | ||
Accumulated undistributed net investment income (loss) | 344,576 | |||
Accumulated undistributed net realized gain (loss) on investments, futures and foreign currency transactions | (483,582,561 | ) | ||
Net unrealized appreciation (depreciation) on investments, futures and foreign currency translations | 223,462,447 | |||
|
| |||
Net assets | $ | 703,925,447 | ||
|
| |||
Class A | ||||
Net asset value, offering and redemption price per share, $12,709,263 / 935,116 shares outstanding (unlimited amount authorized: $0.001 par value) | $ | 13.59 | ||
|
| |||
Class B | ||||
Net asset value, offering and redemption price per share, $94,861,975 / 6,978,472 shares outstanding (unlimited amount authorized: $0.001 par value) | $ | 13.59 | ||
|
| |||
Class K | ||||
Net asset value, offering and redemption price per share, $596,354,209 / 43,875,783 shares outstanding (unlimited amount authorized: $0.001 par value) | $ | 13.59 | ||
|
|
STATEMENT OF OPERATIONS
For the Year Ended December 31, 2013
INVESTMENT INCOME | ||||
Dividends (net of $54,724 foreign withholding tax) | $ | 20,269,178 | ||
Interest | 63,846 | |||
|
| |||
Total income | 20,333,024 | |||
|
| |||
EXPENSES | ||||
Investment management fees | 6,851,703 | |||
Administrative fees | 1,423,346 | |||
Distribution fees - Class B | 723,006 | |||
Custodian fees | 125,600 | |||
Printing and mailing expenses | 116,102 | |||
Professional fees | 93,390 | |||
Distribution fees - Class A | 29,461 | |||
Trustees’ fees | 21,814 | |||
Miscellaneous | 29,118 | |||
|
| |||
Gross expenses | 9,413,540 | |||
Less: Waiver from investment manager | (305,080 | ) | ||
Feespaid indirectly | (55,308 | ) | ||
|
| |||
Net expenses | 9,053,152 | |||
|
| |||
NET INVESTMENT INCOME (LOSS) | 11,279,872 | |||
|
| |||
REALIZED AND UNREALIZED GAIN (LOSS) | ||||
Realized gain (loss) on: | ||||
Investments | 208,860,907 | |||
Futures | 21,607,656 | |||
Foreign currency transactions | (1,895 | ) | ||
|
| |||
Net realized gain (loss) | 230,466,668 | |||
|
| |||
Change in unrealized appreciation (depreciation) on: | ||||
Investments | 34,369,379 | |||
Futures | 1,270,089 | |||
Foreign currency translations | 1,286 | |||
|
| |||
Net change in unrealized appreciation (depreciation) | 35,640,754 | |||
|
| |||
NET REALIZED AND UNREALIZED GAIN (LOSS) | 266,107,422 | |||
|
| |||
NET INCREASE (DECREASE) IN NET ASSETS RESULTING FROM OPERATIONS | $ | 277,387,294 | ||
|
|
See Notes to Financial Statements.
114
AXA PREMIER VIP TRUST
MULTIMANAGER LARGE CAP VALUE PORTFOLIO
STATEMENT OF CHANGES IN NET ASSETS
| Year Ended December 31, | ||||||||
| 2013 | 2012 | |||||||
INCREASE (DECREASE) IN NET ASSETS FROM OPERATIONS: | ||||||||
Net investment income (loss) | $ | 11,279,872 | $ | 14,998,231 | ||||
Net realized gain (loss) on investments, futures and foreign currency transactions | 230,466,668 | 67,006,656 | ||||||
Net change in unrealized appreciation (depreciation) on investments, futures and foreign currency translations | 35,640,754 | 84,753,393 | ||||||
|
|
|
| |||||
NET INCREASE (DECREASE) IN NET ASSETS RESULTING FROM OPERATIONS | 277,387,294 | 166,758,280 | ||||||
|
|
|
| |||||
DIVIDENDS: | ||||||||
Dividends from net investment income | ||||||||
Class A | (178,302 | ) | (126,467 | ) | ||||
Class B | (1,319,479 | ) | (4,854,673 | ) | ||||
Class K | (9,742,015 | ) | (10,046,122 | ) | ||||
|
|
|
| |||||
TOTAL DIVIDENDS | (11,239,796 | ) | (15,027,262 | ) | ||||
|
|
|
| |||||
CAPITAL SHARES TRANSACTIONS: | ||||||||
Class A | ||||||||
Capital shares sold [ 52,317 and 456,295 shares, respectively ] | 637,195 | 4,429,876 | ||||||
Capital shares issued in reinvestment of dividends [ 13,625 and 11,965 shares, respectively ] | 178,302 | 126,467 | ||||||
Capital shares repurchased [ (141,664) and (3,092,163) shares, respectively ] | (1,728,323 | ) | (31,056,622 | ) | ||||
|
|
|
| |||||
Total Class A transactions | (912,826 | ) | (26,500,279 | ) | ||||
|
|
|
| |||||
Class B | ||||||||
Capital shares sold [ 1,138,690 and 1,797,474 shares, respectively ] | 13,596,260 | 17,682,733 | ||||||
Capital shares issued in reinvestment of dividends [ 100,815 and 459,167 shares, respectively ] | 1,319,479 | 4,854,673 | ||||||
Capital shares repurchased [ (4,555,986) and (7,526,693) shares, respectively ] | (54,005,655 | ) | (75,128,646 | ) | ||||
Capital shares repurchased in-kind (Note 10)[ (28,622,535) and 0 shares, respectively ] | (364,189,649 | ) | — | |||||
|
|
|
| |||||
Total Class B transactions | (403,279,565 | ) | (52,591,240 | ) | ||||
|
|
|
| |||||
Class K | ||||||||
Capital shares sold [ 1,099,566 and 2,875,336 shares, respectively ] | 13,540,856 | 28,983,175 | ||||||
Capital shares issued in reinvestment of dividends [ 744,499 and 950,578 shares, respectively ] | 9,742,015 | 10,046,122 | ||||||
Capital shares repurchased [ (24,476,953) and (11,848,056) shares, respectively ] | (292,001,701 | ) | (118,857,296 | ) | ||||
Capital shares repurchased in-kind (Note 10)[ (9) and 0 shares, respectively ] | (121 | ) | — | |||||
|
|
|
| |||||
Total Class K transactions | (268,718,951 | ) | (79,827,999 | ) | ||||
|
|
|
| |||||
NET INCREASE (DECREASE) IN NET ASSETS RESULTING FROM CAPITAL SHARE TRANSACTIONS | (672,911,342 | ) | (158,919,518 | ) | ||||
|
|
|
| |||||
TOTAL INCREASE (DECREASE) IN NET ASSETS | (406,763,844 | ) | (7,188,500 | ) | ||||
NET ASSETS: | ||||||||
Beginning of year | 1,110,689,291 | 1,117,877,791 | ||||||
|
|
|
| |||||
End of year (a) | $ | 703,925,447 | $ | 1,110,689,291 | ||||
|
|
|
|
| ||||
(a) Includes accumulated undistributed (overdistributed) net investment income (loss) of | $ | 344,576 | $ | 479,143 | ||||
|
|
|
| |||||
See Notes to Financial Statements.
115
AXA PREMIER VIP TRUST
MULTIMANAGER LARGE CAP VALUE PORTFOLIO
FINANCIAL HIGHLIGHTS
| Year Ended December 31, | ||||||||||||||||||||
| Class A | 2013 | 2012 | 2011 | 2010 | 2009 | |||||||||||||||
Net asset value, beginning of year | $ | 10.43 | $ | 9.14 | $ | 9.78 | $ | 8.72 | $ | 7.21 | ||||||||||
|
|
|
|
|
|
|
|
|
| |||||||||||
Income (loss) from investment operations: | ||||||||||||||||||||
Net investment income (loss) | 0.13 | (e) | 0.11 | (e) | 0.10 | (e) | 0.10 | (e) | 0.15 | (e) | ||||||||||
Net realized and unrealized gain (loss) on investments, futures and foreign currency transactions | 3.22 | 1.31 | (0.62 | ) | 1.07 | 1.53 | ||||||||||||||
|
|
|
|
|
|
|
|
|
| |||||||||||
Total from investment operations | 3.35 | 1.42 | (0.52 | ) | 1.17 | 1.68 | ||||||||||||||
|
|
|
|
|
|
|
|
|
| |||||||||||
Less distributions: | ||||||||||||||||||||
Dividends from net investment income | (0.19 | ) | (0.13 | ) | (0.12 | ) | (0.11 | ) | (0.17 | ) | ||||||||||
|
|
|
|
|
|
|
|
|
| |||||||||||
Net asset value, end of year | $ | 13.59 | $ | 10.43 | $ | 9.14 | $ | 9.78 | $ | 8.72 | ||||||||||
|
|
|
|
|
|
|
|
|
| |||||||||||
Total return | 32.20 | % | 15.47 | % | (5.23 | )% | 13.39 | % | 23.29 | % | ||||||||||
|
|
|
|
|
|
|
|
|
| |||||||||||
Ratios/Supplemental Data: | ||||||||||||||||||||
Net assets, end of year (000’s) | $ | 12,709 | $ | 10,546 | $ | 33,205 | $ | 885,584 | $ | 1,018,251 | ||||||||||
Ratio of expenses to average net assets: | ||||||||||||||||||||
After waivers | 1.15 | % | 1.16 | % | 0.91 | % | 0.91 | % | 0.93 | % | ||||||||||
After waivers and fees paid indirectly | 1.14 | % | 1.16 | % | 0.90 | % | 0.91 | % | 0.82 | %(c) | ||||||||||
Before waivers and fees paid indirectly | 1.19 | % | 1.17 | % | 0.91 | % | 0.91 | % | 0.93 | % | ||||||||||
Ratio of net investment income (loss) to average net assets: | ||||||||||||||||||||
After waivers | 1.06 | % | 1.07 | % | 1.01 | % | 1.13 | % | 1.92 | % | ||||||||||
After waivers and fees paid indirectly | 1.06 | % | 1.08 | % | 1.01 | % | 1.14 | % | 2.04 | % | ||||||||||
Before waivers and fees paid indirectly | 1.02 | % | 1.07 | % | 1.01 | % | 1.13 | % | 1.92 | % | ||||||||||
Portfolio turnover rate | 28 | % | 28 | % | 37 | % | 35 | % | 77 | % | ||||||||||
| Year Ended December 31, | ||||||||||||||||||||
| Class B | 2013 | 2012 | 2011 | 2010 | 2009 | |||||||||||||||
Net asset value, beginning of year | $ | 10.44 | $ | 9.14 | $ | 9.78 | $ | 8.72 | $ | 7.21 | ||||||||||
|
|
|
|
|
|
|
|
|
| |||||||||||
Income (loss) from investment operations: | ||||||||||||||||||||
Net investment income (loss) | 0.12 | (e) | 0.12 | (e) | 0.09 | (e) | 0.08 | (e) | 0.13 | (e) | ||||||||||
Net realized and unrealized gain (loss) on investments, futures and foreign currency transactions | 3.22 | 1.31 | (0.63 | ) | 1.06 | 1.53 | ||||||||||||||
|
|
|
|
|
|
|
|
|
| |||||||||||
Total from investment operations | 3.34 | 1.43 | (0.54 | ) | 1.14 | 1.66 | ||||||||||||||
|
|
|
|
|
|
|
|
|
| |||||||||||
Less distributions: | ||||||||||||||||||||
Dividends from net investment income | (0.19 | ) | (0.13 | ) | (0.10 | ) | (0.08 | ) | (0.15 | ) | ||||||||||
|
|
|
|
|
|
|
|
|
| |||||||||||
Net asset value, end of year | $ | 13.59 | $ | 10.44 | $ | 9.14 | $ | 9.78 | $ | 8.72 | ||||||||||
|
|
|
|
|
|
|
|
|
| |||||||||||
Total return | 32.07 | % | 15.58 | % | (5.47 | )% | 13.11 | % | 22.97 | % | ||||||||||
|
|
|
|
|
|
|
|
|
| |||||||||||
Ratios/Supplemental Data: | ||||||||||||||||||||
Net assets, end of year (000’s) | $ | 94,862 | $ | 406,197 | $ | 403,797 | $ | 489,324 | $ | 484,944 | ||||||||||
Ratio of expenses to average net assets: | ||||||||||||||||||||
After waivers | 1.15 | % | 1.16 | % | 1.16 | % | 1.16 | % | 1.18 | % | ||||||||||
After waivers and fees paid indirectly | 1.14 | % | 1.16 | % | 1.15 | %(c) | 1.16 | % | 1.07 | %(c) | ||||||||||
Before waivers and fees paid indirectly | 1.19 | % | 1.17 | % | 1.16 | % | 1.16 | % | 1.18 | % | ||||||||||
Ratio of net investment income (loss) to average net assets: | ||||||||||||||||||||
After waivers | 1.02 | % | 1.17 | % | 0.95 | % | 0.88 | % | 1.63 | % | ||||||||||
After waivers and fees paid indirectly | 1.02 | % | 1.18 | % | 0.95 | % | 0.89 | % | 1.73 | % | ||||||||||
Before waivers and fees paid indirectly | 0.99 | % | 1.16 | % | 0.95 | % | 0.88 | % | 1.63 | % | ||||||||||
Portfolio turnover rate | 28 | % | 28 | % | 37 | % | 35 | % | 77 | % | ||||||||||
See Notes to Financial Statements.
116
AXA PREMIER VIP TRUST
MULTIMANAGER LARGE CAP VALUE PORTFOLIO
FINANCIAL HIGHLIGHTS (Continued)
| Year Ended December 31, | August 26, 2011* to December 31, 2011 | |||||||||||
| Class K | 2013 | 2012 | ||||||||||
Net asset value, beginning of period | $ | 10.43 | $ | 9.14 | $ | 8.85 | ||||||
|
|
|
|
|
| |||||||
Income (loss) from investment operations: | ||||||||||||
Net investment income (loss) | 0.16 | (e) | 0.14 | (e) | 0.05 | (e) | ||||||
Net realized and unrealized gain (loss) on investments, futures and foreign currency transactions | 3.22 | 1.30 | 0.36 | |||||||||
|
|
|
|
|
| |||||||
Total from investment operations | 3.38 | 1.44 | 0.41 | |||||||||
|
|
|
|
|
| |||||||
Less distributions: | ||||||||||||
Dividends from net investment income | (0.22 | ) | (0.15 | ) | (0.12 | ) | ||||||
|
|
|
|
|
| |||||||
Net asset value, end of period | $ | 13.59 | $ | 10.43 | $ | 9.14 | ||||||
|
|
|
|
|
| |||||||
Total return (b) | 32.53 | % | 15.76 | % | 4.66 | % | ||||||
|
|
|
|
|
| |||||||
Ratios/Supplemental Data: | ||||||||||||
Net assets, end of period (000’s) | $ | 596,354 | $ | 693,946 | $ | 680,876 | ||||||
Ratio of expenses to average net assets: | ||||||||||||
After waivers (a) | 0.90 | % | 0.91 | % | 0.91 | % | ||||||
After waivers and fees paid indirectly (a) | 0.89 | % | 0.91 | % | 0.90 | % | ||||||
Before waivers and fees paid indirectly (a) | 0.94 | % | 0.92 | % | 0.91 | % | ||||||
Ratio of net investment income (loss) to average net assets: | ||||||||||||
After waivers (a) | 1.30 | % | 1.42 | % | 1.65 | % | ||||||
After waivers and fees paid indirectly (a) | 1.31 | % | 1.43 | % | 1.65 | % | ||||||
Before waivers and fees paid indirectly(a) | 1.27 | % | 1.42 | % | 1.65 | % | ||||||
Portfolio turnover rate | 28 | % | 28 | % | 37 | % | ||||||
| * | Commencement of Operations. |
| (a) | Ratios for periods less than one year are annualized. |
| (b) | Total returns for periods less than one year are not annualized. |
| (c) | Reflects overall fund ratios for non-class specific expenses. |
| (e) | Net investment income (loss) per share is based on average shares outstanding. |
See Notes to Financial Statements.
117
MULTIMANAGER MID CAP GROWTH PORTFOLIO (Unaudited)
PORTFOLIO ADVISERS
| Ø | AllianceBernstein L.P. |
| Ø | BlackRock Investment Management, LLC |
| Ø | Franklin Advisers, Inc. |
| Ø | Wellington Management Company, LLP |
PERFORMANCE RESULTS
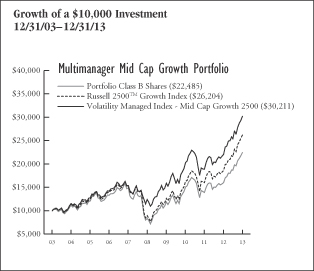
| Annualized Total Returns as of 12/31/13 | ||||||||||||
| 1 Year | 5 Years | 10 Years/ Since Incept. | ||||||||||
Portfolio – Class A Shares* | 40.15 | % | 21.99 | % | 8.65 | % | ||||||
Portfolio – Class B Shares* | 40.14 | 21.84 | 8.44 | |||||||||
Portfolio – Class K Shares** | 40.57 | N/A | 24.99 | |||||||||
Russell 2500TM Growth Index | 40.65 | 24.03 | 10.11 | |||||||||
Volatility Managed Index – Mid Cap Growth 2500 | 36.69 | 19.42 | 11.69 | |||||||||
* Date of inception 12/31/01.
** Date of inception 8/26/11.
Returns for periods greater than one year are annualized. |
| |||||||||||
Past performance is not indicative of future results.
PERFORMANCE SUMMARY
The Portfolio’s Class A shares returned 40.15% for the year ended December 31, 2013. The Portfolio’s benchmarks, the Russell 2500TM Growth Index, returned 40.65%, and the Volatility Managed Index — Mid Cap Growth 2500 returned 36.69%, over the same period.
The following commentary describes key factors (such as stock selection and sector allocation decisions) that helped or hurt the Portfolio’s performance relative to its primary benchmark.
Portfolio Highlights
For the year ended December 31, 2013
What helped performance during the year:
| • | Overall stock selection was positive. An underweight position and strong stock selection in the Financials sector contributed most. |
| • | Strong stock selection in the Health Care and Materials sectors contributed to performance. An underweight position relative to the benchmark in the Materials sector also added to performance. |
| • | Yelp, Inc. was a major contributor as the online urban guide reported strong revenues for the second and third quarters. Other individual contributors to benchmark-relative performance included positions in subscription music streaming website Pandora Media, Inc., low-fare airline Spirit Airlines, Inc., medical device company DexCom, Inc., biopharmaceutical firm Puma Biotechnology, Inc., on-demand digital commerce solutions provider Demandware Inc. and U.S.-based career networking website LinkedIn Corp. A relative underweight in Materials sector holding Royal Gold, Inc. also added to performance. |
What hurt performance during the year:
| • | Consumer Staples stock selection was the leading detractor from relative performance, led by an underweight position in Nu Skin Enterprises, Inc. An underweight to the sector was also detrimental. |
| • | Relative underweight positions in Netflix, Inc., Tesla Motors, Inc. and 3D Systems Corp. were detrimental, as all three were strong performers for the benchmark. |
| • | Other detractors from benchmark-relative performance during the year included Internet provider of company reviews Angie’s List, database management company Teradata Corp. and BroadSoft, Inc., a communications software and services company offering cloud-based, hosted, Internet-protocol (IP) and fixed line services. |
| • | Also detracting was biopharmaceutical company Amarin Corp., whose share price fell after the U.S. Food and Drug Administration denied approval to expand the use of its fish-oil drug Vascepa to heart-disease patients. |
118
MULTIMANAGER MID CAP GROWTH PORTFOLIO (Unaudited)
Sector Weightings as of 12/31/13 | % of Net Assets | |||
Information Technology | 19.5 | % | ||
Consumer Discretionary | 17.3 | |||
Industrials | 15.2 | |||
Health Care | 12.8 | |||
Financials | 5.9 | |||
Energy | 4.0 | |||
Consumer Staples | 3.3 | |||
Materials | 3.2 | |||
Telecommunication Services | 0.3 | |||
Utilities | 0.2 | |||
Cash and Other | 18.3 | |||
|
| |||
| 100.0 | % | |||
|
| |||
UNDERSTANDING YOUR EXPENSES:
As a shareholder of the Portfolio, you incur two types of costs:
(1)transaction costs, including applicable sales charges and redemption fees; and (2)ongoing costs, including management fees, distribution (12b-1) fees (in the case of Class A and Class B shares of the Trust), and other Portfolio expenses. These examples are intended to help you understand your ongoing costs (in dollars) of investing in the Portfolio and to compare these costs with the ongoing costs of investing in other mutual funds.
The examples are based on an investment of $1,000 invested at the beginning of the six-month period ended December 31, 2013 and held for the entire six-month period.
Actual Expenses
The first line of the table to the right provides information about actual account values and actual expenses. You may use the information in this line, together with the amount you invested, to estimate the expenses that you paid over the period. Simply divide your account value by $1,000 (for example, an $8,600 account value divided by $1,000 = 8.6), then multiply the result by the number in the first line under the heading entitled ‘‘Expenses Paid During Period’’ to estimate the expenses you paid on your account during this period.
Hypothetical Example for Comparison Purposes
The second line of the table below provides information about hypothetical account values and hypothetical expenses based on the Portfolio’s actual expense ratio and an assumed rate of return of 5% per year before expenses, which is not the Portfolio’s actual return. The hypothetical account values and expenses may not be used to estimate the actual ending account balance or expenses you paid for the period. You may use this information to compare the ongoing costs of investing in the Portfolio and other funds. To do so, compare this 5% hypothetical example with the 5% hypothetical examples that appear in the shareholder reports of the other funds.
Please note that the expenses shown in the table are meant to highlight your ongoing costs only and do not reflect any transactional costs, such as sales charges (loads), redemption fees, or exchange fees. Therefore, the second line of the table is useful in comparing ongoing costs only, and will not help you determine the relative total costs of owning different funds. In addition, if these transactional costs were included, your costs would have been higher. Also note that the table does not reflect any variable life insurance or variable annuity contract-related fees and expenses, which would increase overall fees and expenses.
EXAMPLE
| Beginning Account Value 7/1/13 | Ending Account Value 12/31/13 | Expenses Paid During Period* 7/1/13 - 12/31/13 | ||||||||||
Class A | ||||||||||||
Actual | $1,000.00 | $1,204.64 | $6.95 | |||||||||
Hypothetical (5% average annual return before expenses) | 1,000.00 | 1,018.90 | 6.37 | |||||||||
Class B | ||||||||||||
Actual | 1,000.00 | 1,204.82 | 6.95 | |||||||||
Hypothetical (5% average annual return before expenses) | 1,000.00 | 1,018.90 | 6.36 | |||||||||
Class K | ||||||||||||
Actual | 1,000.00 | 1,206.59 | 5.57 | |||||||||
Hypothetical (5% average annual return before expenses) | 1,000.00 | 1,020.16 | 5.10 | |||||||||
* Expenses are equal to the Portfolio’s Class A, Class B and Class K shares annualized expense ratios of 1.25%, 1.25% and 1.00%, respectively, multiplied by the average account value over the period, and multiplied by 184/365 (to reflect the one-half year period). |
| |||||||||||
119
AXA PREMIER VIP TRUST
MULTIMANAGER MID CAP GROWTH PORTFOLIO
PORTFOLIO OF INVESTMENTS
December 31, 2013
Number of Shares | Value (Note 1) | |||||||
COMMON STOCKS: | ||||||||
Consumer Discretionary (17.3%) | ||||||||
Auto Components (0.9%) | ||||||||
Allison Transmission Holdings, Inc. | 144 | $ | 3,976 | |||||
American Axle & Manufacturing Holdings, Inc.* | 16,595 | 339,368 | ||||||
Cooper Tire & Rubber Co. | 224 | 5,385 | ||||||
Dana Holding Corp. | 366 | 7,181 | ||||||
Dorman Products, Inc.* | 745 | 41,772 | ||||||
Drew Industries, Inc. | 683 | 34,969 | ||||||
Fox Factory Holding Corp.* | 130 | 2,291 | ||||||
Gentex Corp | 2,420 | 79,836 | ||||||
Gentherm, Inc.* | 995 | 26,676 | ||||||
Goodyear Tire & Rubber Co. | 7,246 | 172,817 | ||||||
Lear Corp. | 264 | 21,376 | ||||||
Standard Motor Products, Inc. | 424 | 15,603 | ||||||
Stoneridge, Inc.* | 716 | 9,129 | ||||||
Tenneco, Inc.* | 15,146 | 856,809 | ||||||
Tower International, Inc.* | 183 | 3,916 | ||||||
Visteon Corp.* | 1,457 | 119,314 | ||||||
|
| |||||||
| 1,740,418 | ||||||||
|
| |||||||
Automobiles (0.1%) | ||||||||
Thor Industries, Inc. | 1,284 | 70,915 | ||||||
Winnebago Industries, Inc.* | 837 | 22,976 | ||||||
|
| |||||||
| 93,891 | ||||||||
|
| |||||||
Distributors (0.5%) | ||||||||
Core-Mark Holding Co., Inc. | 47 | 3,569 | ||||||
LKQ Corp.* | 27,982 | 920,608 | ||||||
Pool Corp | 1,380 | 80,233 | ||||||
Stock Building Supply Holdings, Inc.* | 151 | 2,751 | ||||||
Weyco Group, Inc. | 13 | 383 | ||||||
|
| |||||||
| 1,007,544 | ||||||||
|
| |||||||
Diversified Consumer Services (0.9%) |
| |||||||
American Public Education, Inc.* | 4,527 | 196,789 | ||||||
Ascent Capital Group, Inc., Class A* | 55 | 4,706 | ||||||
Bright Horizons Family Solutions, Inc.* | 354 | 13,006 | ||||||
Capella Education Co. | 331 | 21,992 | ||||||
Carriage Services, Inc. | 468 | 9,140 | ||||||
Education Management Corp.* | 715 | 7,214 | ||||||
Grand Canyon Education, Inc.* | 21,209 | 924,712 | ||||||
Hillenbrand, Inc. | 1,619 | 47,631 | ||||||
Houghton Mifflin Harcourt Co.* | 425 | 7,208 | ||||||
ITT Educational Services, Inc.* | 699 | 23,472 | ||||||
JTH Holding, Inc., Class A* | 120 | 2,916 | ||||||
K12, Inc.* | 813 | 17,683 | ||||||
LifeLock, Inc.* | 1,811 | 29,718 | ||||||
Lincoln Educational Services Corp | 214 | 1,066 | ||||||
Mac-Gray Corp. | 56 | 1,189 | ||||||
Matthews International Corp., Class A | 365 | 15,553 | ||||||
Outerwall, Inc.* | 830 | 55,834 | ||||||
Service Corp. International | 4,844 | 87,822 | ||||||
Sotheby’s, Inc. | 2,001 | 106,453 | ||||||
Steiner Leisure Ltd.* | 140 | 6,887 | ||||||
Strayer Education, Inc.* | 324 | $ | 11,168 | |||||
Weight Watchers International, Inc. | 439 | 14,456 | ||||||
|
| |||||||
| 1,606,615 | ||||||||
|
| |||||||
Hotels, Restaurants & Leisure (3.2%) |
| |||||||
AFC Enterprises, Inc.* | 715 | 27,527 | ||||||
Bally Technologies, Inc.* | 1,147 | 89,982 | ||||||
BJ’s Restaurants, Inc.* | 737 | 22,891 | ||||||
Bloomin’ Brands, Inc.* | 19,342 | 464,401 | ||||||
Bob Evans Farms, Inc. | 93 | 4,705 | ||||||
Boyd Gaming Corp.* | 2,042 | 22,993 | ||||||
Bravo Brio Restaurant Group, Inc.* | 545 | 8,867 | ||||||
Brinker International, Inc. | 1,964 | 91,012 | ||||||
Buffalo Wild Wings, Inc.* | 3,884 | 571,725 | ||||||
Burger King Worldwide, Inc. | 2,972 | 67,940 | ||||||
Caesars Entertainment Corp.* | 1,041 | 22,423 | ||||||
CEC Entertainment, Inc. | 532 | 23,557 | ||||||
Cheesecake Factory, Inc. | 1,577 | 76,122 | ||||||
Choice Hotels International, Inc. | 43 | 2,112 | ||||||
Churchill Downs, Inc. | 410 | 36,756 | ||||||
Chuy’s Holdings, Inc.* | 484 | 17,434 | ||||||
Cracker Barrel Old Country Store, Inc. | 581 | 63,951 | ||||||
Del Frisco’s Restaurant Group, Inc.* | 145 | 3,418 | ||||||
Denny’s Corp.* | 2,129 | 15,308 | ||||||
Diamond Resorts International, Inc.* | 234 | 4,320 | ||||||
DineEquity, Inc | 259 | 21,639 | ||||||
Diversified Restaurant Holdings, Inc.* | 312 | 1,488 | ||||||
Domino’s Pizza, Inc | 1,654 | 115,201 | ||||||
Dunkin’ Brands Group, Inc | 3,144 | 151,541 | ||||||
Einstein Noah Restaurant Group, Inc. | 176 | 2,552 | ||||||
Fiesta Restaurant Group, Inc.* | 652 | 34,060 | ||||||
Ignite Restaurant Group, Inc.* | 223 | 2,787 | ||||||
International Game Technology | 7,672 | 139,324 | ||||||
Interval Leisure Group, Inc. | 1,180 | 36,462 | ||||||
Jack in the Box, Inc.* | 8,681 | 434,224 | ||||||
Jamba, Inc.* | 502 | 6,240 | ||||||
Krispy Kreme Doughnuts, Inc.* | 1,902 | 36,690 | ||||||
Life Time Fitness, Inc.* | 7,292 | 342,724 | ||||||
Melco Crown Entertainment Ltd. (ADR)* | 9,283 | 364,079 | ||||||
Monarch Casino & Resort, Inc.* | 136 | 2,731 | ||||||
Morgans Hotel Group Co.* | 322 | 2,618 | ||||||
Multimedia Games Holding Co., Inc.* | 865 | 27,126 | ||||||
Nathan’s Famous, Inc.* | 81 | 4,083 | ||||||
Noodles & Co.* | 9,211 | 330,859 | ||||||
Norwegian Cruise Line Holdings Ltd.* | 12,618 | 447,560 | ||||||
Panera Bread Co., Class A* | 2,985 | 527,420 | ||||||
Papa John’s International, Inc. | 916 | 41,586 | ||||||
Pinnacle Entertainment, Inc.* | 1,616 | 42,000 | ||||||
Potbelly Corp. | 10,196 | 247,559 | ||||||
Red Robin Gourmet Burgers, Inc.* | 369 | 27,136 | ||||||
See Notes to Financial Statements.
120
AXA PREMIER VIP TRUST
MULTIMANAGER MID CAP GROWTH PORTFOLIO
PORTFOLIO OF INVESTMENTS (Continued)
December 31, 2013
Number of Shares | Value (Note 1) | |||||||
Ruth’s Hospitality Group, Inc. | 1,074 | $ | 15,262 | �� | ||||
Scientific Games Corp., Class A* | 1,064 | 18,014 | ||||||
SeaWorld Entertainment, Inc. | 910 | 26,181 | ||||||
Six Flags Entertainment Corp. | 1,959 | 72,130 | ||||||
Sonic Corp.* | 1,337 | 26,994 | ||||||
Starwood Hotels & Resorts Worldwide, Inc. | 3,850 | 305,882 | ||||||
Texas Roadhouse, Inc. | 1,843 | 51,235 | ||||||
Vail Resorts, Inc. | 1,064 | 80,045 | ||||||
Wyndham Worldwide Corp. | 4,661 | 343,469 | ||||||
|
| |||||||
| 5,966,345 | ||||||||
|
| |||||||
Household Durables (1.3%) | ||||||||
Beazer Homes USA, Inc.* | 422 | 10,305 | ||||||
Blyth, Inc. | 279 | 3,036 | ||||||
Cavco Industries, Inc.* | 188 | 12,916 | ||||||
Ethan Allen Interiors, Inc. | 639 | 19,438 | ||||||
EveryWare Global, Inc.* | 293 | 2,426 | ||||||
Hovnanian Enterprises, Inc., Class A* | 2,386 | 15,795 | ||||||
iRobot Corp.* | 846 | 29,416 | ||||||
Jarden Corp.* | 3,748 | 229,940 | ||||||
KB Home | 2,471 | 45,170 | ||||||
La-Z-Boy, Inc. | 409 | 12,679 | ||||||
Lennar Corp., Class A | 5,994 | 237,123 | ||||||
Libbey, Inc.* | 630 | 13,230 | ||||||
M.D.C. Holdings, Inc.* | 235 | 7,576 | ||||||
M/I Homes, Inc.* | 12,107 | 308,123 | ||||||
Meritage Homes Corp.* | 892 | 42,807 | ||||||
NVR, Inc.* | 116 | 119,017 | ||||||
PulteGroup, Inc. | 13,834 | 281,799 | ||||||
Ryland Group, Inc. | 1,366 | 59,298 | ||||||
Taylor Morrison Home Corp., Class A*. | 10,783 | 242,078 | ||||||
Tempur Sealy International, Inc.* | 1,791 | 96,642 | ||||||
TRI Pointe Homes, Inc.* | 26 | 518 | ||||||
Tupperware Brands Corp. | 1,563 | 147,750 | ||||||
UCP, Inc., Class A* | 101 | 1,479 | ||||||
Universal Electronics, Inc.* | 43 | 1,639 | ||||||
WCI Communities, Inc.* | 114 | 2,176 | ||||||
Whirlpool Corp. | 2,464 | 386,503 | ||||||
William Lyon Homes, Class A* | 410 | 9,078 | ||||||
|
| |||||||
| 2,337,957 | ||||||||
|
| |||||||
Internet & Catalog Retail (2.4%) | ||||||||
1-800-FLOWERS.COM, Inc., Class A* | 591 | 3,197 | ||||||
Blue Nile, Inc.* | 3,922 | 184,687 | ||||||
Groupon, Inc.* | 49,025 | 577,024 | ||||||
HomeAway, Inc.* | 35,080 | 1,434,070 | ||||||
HSN, Inc. | 999 | 62,238 | ||||||
Liberty Ventures* | 1,092 | 133,868 | ||||||
Netflix, Inc.* | 1,068 | 393,206 | ||||||
Nutrisystem, Inc. | 860 | 14,138 | ||||||
Orbitz Worldwide, Inc.* | 723 | 5,191 | ||||||
Overstock.com, Inc.* | 336 | 10,346 | ||||||
PetMed Express, Inc. | 604 | 10,045 | ||||||
RetailMeNot, Inc.* | 198 | 5,701 | ||||||
Shutterfly, Inc.* | 20,909 | 1,064,895 | ||||||
TripAdvisor, Inc.* | 5,918 | 490,188 | ||||||
ValueVision Media, Inc., Class A* | 1,021 | 7,137 | ||||||
Vitacost.com, Inc.* | 666 | 3,856 | ||||||
zulily, Inc., Class A* | 230 | $ | 9,529 | |||||
|
| |||||||
| 4,409,316 | ||||||||
|
| |||||||
Leisure Equipment & Products (0.4%) |
| |||||||
Arctic Cat, Inc. | 395 | 22,507 | ||||||
Brunswick Corp. | 2,538 | 116,900 | ||||||
Marine Products Corp. | 304 | 3,055 | ||||||
Nautilus, Inc.* | 925 | 7,798 | ||||||
Polaris Industries, Inc. | 3,981 | 579,793 | ||||||
Smith & Wesson Holding Corp.* | 1,601 | 21,598 | ||||||
Sturm Ruger & Co., Inc | 570 | 41,661 | ||||||
|
| |||||||
| 793,312 | ||||||||
|
| |||||||
Media (1.2%) | ||||||||
AMC Networks, Inc., Class A* | 1,769 | 120,487 | ||||||
Cablevision Systems Corp. - New York Group, Class A | 5,787 | 103,761 | ||||||
Carmike Cinemas, Inc.* | 181 | 5,039 | ||||||
Cinemark Holdings, Inc. | 3,422 | 114,055 | ||||||
Clear Channel Outdoor Holdings, Inc., Class A | 1,262 | 12,797 | ||||||
Crown Media Holdings, Inc., Class A* | 193 | 681 | ||||||
Cumulus Media, Inc., Class A* | 2,062 | 15,939 | ||||||
Entravision Communications Corp., Class A | 1,650 | 10,048 | ||||||
Global Sources Ltd.* | 54 | 439 | ||||||
Gray Television, Inc.* | 102 | 1,518 | ||||||
Hemisphere Media Group, Inc.* | 256 | 3,039 | ||||||
Imax Corp.* | 25,670 | 756,752 | ||||||
Interpublic Group of Cos., Inc. | 5,717 | 101,191 | ||||||
Lamar Advertising Co., Class A* | 2,317 | 121,063 | ||||||
Lions Gate Entertainment Corp. | 2,400 | 75,984 | ||||||
Loral Space & Communications, Inc.* | 390 | 31,582 | ||||||
Madison Square Garden Co., Class A* | 1,818 | 104,680 | ||||||
McClatchy Co., Class A* | 1,447 | 4,920 | ||||||
MDC Partners, Inc., Class A | 389 | 9,911 | ||||||
Morningstar, Inc. | 612 | 47,791 | ||||||
National CineMedia, Inc. | 17,173 | 342,773 | ||||||
Nexstar Broadcasting Group, Inc., Class A | 858 | 47,816 | ||||||
ReachLocal, Inc.* | 314 | 3,991 | ||||||
Regal Entertainment Group, Class A | 542 | 10,542 | ||||||
Rentrak Corp.* | 291 | 11,026 | ||||||
Saga Communications, Inc., Class A | 40 | 2,012 | ||||||
Sinclair Broadcast Group, Inc., Class A | 2,027 | 72,425 | ||||||
Starz, Class A* | 2,784 | 81,404 | ||||||
World Wrestling Entertainment, Inc., Class A | 99 | 1,641 | ||||||
|
| |||||||
| 2,215,307 | ||||||||
|
| |||||||
Multiline Retail (0.0%) | ||||||||
Big Lots, Inc.* | 462 | 14,918 | ||||||
Bon-Ton Stores, Inc. | 377 | 6,137 | ||||||
Burlington Stores, Inc.* | 251 | 8,032 | ||||||
Dillard’s, Inc., Class A | 536 | 52,105 | ||||||
See Notes to Financial Statements.
121
AXA PREMIER VIP TRUST
MULTIMANAGER MID CAP GROWTH PORTFOLIO
PORTFOLIO OF INVESTMENTS (Continued)
December 31, 2013
Number of Shares | Value (Note 1) | |||||||
Gordmans Stores, Inc. | 69 | $ | 529 | |||||
|
| |||||||
| 81,721 | ||||||||
|
| |||||||
Specialty Retail (4.5%) | ||||||||
Aaron’s, Inc. | 343 | 10,084 | ||||||
Abercrombie & Fitch Co., Class A | 273 | 8,984 | ||||||
Aeropostale, Inc.* | 2,347 | 21,334 | ||||||
American Eagle Outfitters, Inc. | 3,668 | 52,819 | ||||||
America’s Car-Mart, Inc.* | 184 | 7,770 | ||||||
ANN, Inc.* | 1,395 | 51,001 | ||||||
Asbury Automotive Group, Inc.* | 812 | 43,637 | ||||||
Ascena Retail Group, Inc.* | 552 | 11,680 | ||||||
AutoNation, Inc.* | 1,506 | 74,833 | ||||||
Barnes & Noble, Inc.* | 83 | 1,241 | ||||||
Big 5 Sporting Goods Corp. | 501 | 9,930 | ||||||
Brown Shoe Co., Inc. | 800 | 22,512 | ||||||
Buckle, Inc. | 823 | 43,257 | ||||||
Cabela’s, Inc.* | 7,308 | 487,151 | ||||||
CarMax, Inc.* | 5,839 | 274,550 | ||||||
Cato Corp., Class A | 167 | 5,311 | ||||||
Chico’s FAS, Inc. | 4,491 | 84,610 | ||||||
Children’s Place Retail Stores, Inc.* | 236 | 13,445 | ||||||
Christopher & Banks Corp.* | 1,082 | 9,240 | ||||||
Citi Trends, Inc.* | 15,197 | 258,349 | ||||||
Conn’s, Inc.* | 656 | 51,686 | ||||||
Container Store Group, Inc.* | 235 | 10,953 | ||||||
Destination Maternity Corp. | 361 | 10,787 | ||||||
Dick’s Sporting Goods, Inc. | 18,812 | 1,092,977 | ||||||
DSW, Inc., Class A | 1,922 | 82,127 | ||||||
Express, Inc.* | 2,523 | 47,104 | ||||||
Finish Line, Inc., Class A | 504 | 14,198 | ||||||
Five Below, Inc.* | 9,591 | 414,331 | ||||||
Foot Locker, Inc. | 530 | 21,963 | ||||||
Francesca’s Holdings Corp.* | 1,316 | 24,228 | ||||||
Genesco, Inc.* | 490 | 35,799 | ||||||
GNC Holdings, Inc., Class A | 2,900 | 169,505 | ||||||
Haverty Furniture Cos., Inc. | 138 | 4,319 | ||||||
Hibbett Sports, Inc.* | 767 | 51,550 | ||||||
Jos. A. Bank Clothiers, Inc.* | 124 | 6,787 | ||||||
Kirkland’s, Inc.* | 293 | 6,935 | ||||||
Lithia Motors, Inc., Class A | 6,001 | 416,589 | ||||||
Lumber Liquidators Holdings, Inc.* | 8,876 | 913,252 | ||||||
Mattress Firm Holding Corp.* | 8,222 | 353,875 | ||||||
Monro Muffler Brake, Inc. | 923 | 52,020 | ||||||
New York & Co., Inc.* | 516 | 2,255 | ||||||
Office Depot, Inc.* | 1,839 | 9,728 | ||||||
Pacific Sunwear of California, Inc.* | 1,213 | 4,051 | ||||||
Penske Automotive Group, Inc. | 284 | 13,393 | ||||||
Pier 1 Imports, Inc. | 14,214 | 328,059 | ||||||
Restoration Hardware Holdings, Inc.* | 5,369 | 361,334 | ||||||
Ross Stores, Inc. | 3,820 | 286,233 | ||||||
Sally Beauty Holdings, Inc.* | 5,013 | 151,543 | ||||||
Sears Hometown and Outlet Stores, Inc.* | 167 | 4,259 | ||||||
Select Comfort Corp.* | 1,544 | 32,563 | ||||||
Signet Jewelers Ltd. | 173 | 13,615 | ||||||
Sonic Automotive, Inc., Class A | 297 | 7,271 | ||||||
Stein Mart, Inc. | 437 | $ | 5,878 | |||||
Tile Shop Holdings, Inc.* | 23,051 | 416,532 | ||||||
Tilly’s, Inc., Class A* | 275 | 3,149 | ||||||
Tractor Supply Co. | 6,470 | 501,943 | ||||||
Ulta Salon Cosmetics & Fragrance, Inc.* | 1,878 | 181,265 | ||||||
Urban Outfitters, Inc.* | 3,165 | 117,422 | ||||||
Vitamin Shoppe, Inc.* | 6,905 | 359,129 | ||||||
Wet Seal, Inc., Class A* | 2,655 | 7,248 | ||||||
Williams-Sonoma, Inc. | 2,879 | 167,788 | ||||||
Winmark Corp. | 67 | 6,206 | ||||||
Zumiez, Inc.* | 632 | 16,432 | ||||||
|
| |||||||
| 8,270,019 | ||||||||
|
| |||||||
Textiles, Apparel & Luxury Goods (1.9%) |
| |||||||
Carter’s, Inc. | 1,613 | 115,797 | ||||||
Crocs, Inc.* | 2,279 | 36,282 | ||||||
Culp, Inc. | 211 | 4,315 | ||||||
Deckers Outdoor Corp.* | 453 | 38,260 | ||||||
Fossil Group, Inc.* | 1,428 | 171,274 | ||||||
G-III Apparel Group Ltd.* | 380 | 28,040 | ||||||
Hanesbrands, Inc. | 2,909 | 204,415 | ||||||
Iconix Brand Group, Inc.* | 8,880 | 352,536 | ||||||
Lululemon Athletica, Inc.* | 8,001 | 472,299 | ||||||
Movado Group, Inc. | 31 | 1,364 | ||||||
Oxford Industries, Inc. | 403 | 32,510 | ||||||
PVH Corp. | 2,834 | 385,481 | ||||||
Quiksilver, Inc.* | 2,895 | 25,389 | ||||||
R.G. Barry Corp. | 26 | 502 | ||||||
Samsonite International S.A | 119,060 | 362,356 | ||||||
Steven Madden Ltd.* | 1,779 | 65,094 | ||||||
Tumi Holdings, Inc.* | 1,430 | 32,247 | ||||||
Under Armour, Inc., Class A* | 7,634 | 666,448 | ||||||
Vera Bradley, Inc.* | 648 | 15,578 | ||||||
Wolverine World Wide, Inc. | 13,662 | 463,962 | ||||||
|
| |||||||
| 3,474,149 | ||||||||
|
| |||||||
Total Consumer Discretionary | 31,996,594 | |||||||
|
| |||||||
Consumer Staples (3.3%) | ||||||||
Beverages (0.2%) | ||||||||
Boston Beer Co., Inc., Class A* | 1,641 | 396,777 | ||||||
Coca-Cola Bottling Co. Consolidated | 140 | 10,247 | ||||||
Craft Brew Alliance, Inc.* | 110 | 1,806 | ||||||
National Beverage Corp.* | 342 | 6,895 | ||||||
|
| |||||||
| 415,725 | ||||||||
|
| |||||||
Food & Staples Retailing (0.6%) | ||||||||
Arden Group, Inc., Class A | 34 | 4,301 | ||||||
Casey’s General Stores, Inc. | 1,117 | 78,469 | ||||||
Chefs’ Warehouse, Inc.* | 475 | 13,851 | ||||||
Fairway Group Holdings Corp.* | 194 | 3,515 | ||||||
Fresh Market, Inc.* | 1,216 | 49,248 | ||||||
Harris Teeter Supermarkets, Inc. | 169 | 8,340 | ||||||
Natural Grocers by Vitamin Cottage, Inc.* | 263 | 11,165 | ||||||
Pantry, Inc.* | 56 | 940 | ||||||
PriceSmart, Inc. | 559 | 64,587 | ||||||
Rite Aid Corp.* | 13,139 | 66,483 | ||||||
Sprouts Farmers Market, Inc.* | 8,317 | 319,622 | ||||||
SUPERVALU, Inc.* | 4,452 | 32,455 | ||||||
See Notes to Financial Statements.
122
AXA PREMIER VIP TRUST
MULTIMANAGER MID CAP GROWTH PORTFOLIO
PORTFOLIO OF INVESTMENTS (Continued)
December 31, 2013
Number of Shares | Value (Note 1) | |||||||
Susser Holdings Corp.* | 539 | $ | 35,299 | |||||
United Natural Foods, Inc.* | 1,442 | 108,713 | ||||||
Village Super Market, Inc., Class A | 121 | 3,752 | ||||||
Whole Foods Market, Inc. | 5,965 | 344,956 | ||||||
|
| |||||||
| 1,145,696 | ||||||||
|
| |||||||
Food Products (1.8%) | ||||||||
Alico, Inc. | 74 | 2,876 | ||||||
Annie’s, Inc.* | 408 | 17,560 | ||||||
B&G Foods, Inc. | 1,566 | 53,103 | ||||||
Boulder Brands, Inc.* | 1,681 | 26,661 | ||||||
Calavo Growers, Inc. | 367 | 11,105 | ||||||
Cal-Maine Foods, Inc. | 379 | 22,827 | ||||||
Darling International, Inc.* | 1,251 | 26,121 | ||||||
Farmer Bros Co.* | 173 | 4,024 | ||||||
Flowers Foods, Inc. | 5,030 | 107,994 | ||||||
Green Mountain Coffee Roasters, Inc.* | 12,164 | 919,355 | ||||||
Hain Celestial Group, Inc.* | 4,416 | 400,885 | ||||||
Hillshire Brands Co. | 3,625 | 121,220 | ||||||
Ingredion, Inc. | 283 | 19,374 | ||||||
Inventure Foods, Inc.* | 443 | 5,874 | ||||||
J&J Snack Foods Corp. | 432 | 38,271 | ||||||
Lancaster Colony Corp. | 547 | 48,218 | ||||||
Lifeway Foods, Inc. | 139 | 2,221 | ||||||
Limoneira Co. | 301 | 8,004 | ||||||
Omega Protein Corp.* | 45 | 553 | ||||||
Pilgrim’s Pride Corp.* | 1,811 | 29,429 | ||||||
Pinnacle Foods, Inc. | 575 | 15,790 | ||||||
Sanderson Farms, Inc. | 680 | 49,184 | ||||||
Snyders-Lance, Inc. | 217 | 6,232 | ||||||
SunOpta, Inc.* | 44,020 | 440,640 | ||||||
Tootsie Roll Industries, Inc. | 550 | 17,897 | ||||||
TreeHouse Foods, Inc.* | 6,328 | 436,126 | ||||||
WhiteWave Foods Co., Class A* | 22,723 | 521,266 | ||||||
|
| |||||||
| 3,352,810 | ||||||||
|
| |||||||
Household Products (0.2%) | ||||||||
Central Garden & Pet Co., Class A* | 152 | 1,026 | ||||||
Oil-Dri Corp. of America | 33 | 1,249 | ||||||
Orchids Paper Products Co. | 155 | 5,090 | ||||||
Spectrum Brands Holdings, Inc. | 4,268 | 301,108 | ||||||
WD-40 Co. | 446 | 33,307 | ||||||
|
| |||||||
| 341,780 | ||||||||
|
| |||||||
Personal Products (0.5%) | ||||||||
Coty, Inc., Class A | 15,975 | 243,619 | ||||||
Elizabeth Arden, Inc.* | 651 | 23,078 | ||||||
Female Health Co. | 636 | 5,406 | ||||||
Herbalife Ltd. | 2,511 | 197,616 | ||||||
Inter Parfums, Inc. | 344 | 12,319 | ||||||
Lifevantage Corp.* | 2,750 | 4,537 | ||||||
Medifast, Inc.* | 414 | 10,818 | ||||||
Nu Skin Enterprises, Inc., Class A | 1,722 | 238,015 | ||||||
Prestige Brands Holdings, Inc.* | 1,511 | 54,094 | ||||||
Revlon, Inc., Class A* | 110 | 2,745 | ||||||
Star Scientific, Inc.* | 4,937 | 5,727 | ||||||
Synutra International, Inc.* | 479 | 4,253 | ||||||
USANA Health Sciences, Inc.* | 181 | 13,680 | ||||||
|
| |||||||
| 815,907 | ||||||||
|
| |||||||
Tobacco (0.0%) | ||||||||
Vector Group Ltd. | 1,396 | $ | 22,852 | |||||
|
| |||||||
Total Consumer Staples | 6,094,770 | |||||||
|
| |||||||
Energy (4.0%) | ||||||||
Energy Equipment & Services (1.7%) |
| |||||||
Atwood Oceanics, Inc.* | 319 | 17,031 | ||||||
C&J Energy Services, Inc.* | 15,053 | 347,724 | ||||||
CARBO Ceramics, Inc. | 243 | 28,317 | ||||||
Dresser-Rand Group, Inc.* | 2,243 | 133,750 | ||||||
Dril-Quip, Inc.* | 1,194 | 131,257 | ||||||
FMC Technologies, Inc.* | 4,533 | 236,668 | ||||||
Forum Energy Technologies, Inc.* | 589 | 16,645 | ||||||
Frank’s International N.V | 443 | 11,961 | ||||||
Geospace Technologies Corp.* | 386 | 36,604 | ||||||
Global Geophysical Services, Inc.* | 68 | 110 | ||||||
Hornbeck Offshore Services, Inc.* | 57 | 2,806 | ||||||
ION Geophysical Corp.* | 877 | 2,894 | ||||||
Key Energy Services, Inc.* | 41,451 | 327,463 | ||||||
Matrix Service Co.* | 129 | 3,157 | ||||||
Newpark Resources, Inc.* | 2,077 | 25,526 | ||||||
Nuverra Environmental Solutions, Inc.* | 21 | 353 | ||||||
Oceaneering International, Inc. | 8,460 | 667,325 | ||||||
Oil States International, Inc.* | 2,370 | 241,076 | ||||||
Patterson-UTI Energy, Inc. | 8,669 | 219,499 | ||||||
PHI, Inc. (Non-Voting)* | 24 | 1,042 | ||||||
Pioneer Energy Services Corp.* | 41,313 | 330,917 | ||||||
RigNet, Inc.* | 356 | 17,063 | ||||||
RPC, Inc. | 1,444 | 25,775 | ||||||
SEACOR Holdings, Inc.* | 51 | 4,651 | ||||||
Superior Energy Services, Inc.* | 12,370 | 329,166 | ||||||
TGC Industries, Inc.* | 417 | 3,044 | ||||||
|
| |||||||
| 3,161,824 | ||||||||
|
| |||||||
Oil, Gas & Consumable Fuels (2.3%) |
| |||||||
Abraxas Petroleum Corp.* | 2,476 | 8,121 | ||||||
Adams Resources & Energy, Inc. | 5 | 342 | ||||||
Amyris, Inc.* | 771 | 4,079 | ||||||
Apco Oil and Gas International, Inc.* | 49 | 764 | ||||||
Approach Resources, Inc.* | 585 | 11,285 | ||||||
Athlon Energy, Inc.* | 198 | 5,989 | ||||||
Bill Barrett Corp.* | 421 | 11,274 | ||||||
Bonanza Creek Energy, Inc.* | 879 | 38,210 | ||||||
Carrizo Oil & Gas, Inc.* | 1,132 | 50,680 | ||||||
Cheniere Energy, Inc.* | 7,122 | 307,101 | ||||||
Clean Energy Fuels Corp.* | 2,040 | 26,275 | ||||||
Cobalt International Energy, Inc.* | 5,976 | 98,305 | ||||||
Concho Resources, Inc.* | 2,297 | 248,076 | ||||||
Contango Oil & Gas Co.* | 74 | �� | 3,497 | |||||
Crosstex Energy, Inc. | 1,300 | 47,008 | ||||||
CVR Energy, Inc. | 467 | 20,282 | ||||||
Delek U.S. Holdings, Inc. | 726 | 24,982 | ||||||
Diamondback Energy, Inc.* | 569 | 30,077 | ||||||
EPL Oil & Gas, Inc.* | 289 | 8,236 | ||||||
Evolution Petroleum Corp. | 512 | 6,318 | ||||||
EXCO Resources, Inc. | 2,081 | 11,050 | ||||||
Forest Oil Corp.* | 461 | 1,664 | ||||||
See Notes to Financial Statements.
123
AXA PREMIER VIP TRUST
MULTIMANAGER MID CAP GROWTH PORTFOLIO
PORTFOLIO OF INVESTMENTS (Continued)
December 31, 2013
Number of Shares | Value (Note 1) | |||||||
FX Energy, Inc.* | 1,607 | $ | 5,882 | |||||
Gastar Exploration, Inc.* | 1,602 | 11,086 | ||||||
Goodrich Petroleum Corp.* | 937 | 15,948 | ||||||
Gulfport Energy Corp.* | 2,045 | 129,142 | ||||||
Isramco, Inc.* | 28 | 3,557 | ||||||
Jones Energy, Inc., Class A* | 164 | 2,375 | ||||||
KiOR, Inc., Class A* | 1,303 | 2,189 | ||||||
Kodiak Oil & Gas Corp.* | 7,871 | 88,234 | ||||||
Kosmos Energy Ltd.* | 3,017 | 33,730 | ||||||
Laredo Petroleum Holdings, Inc.* | 1,117 | 30,930 | ||||||
Magnum Hunter Resources Corp.* | 1,623 | 11,864 | ||||||
Oasis Petroleum, Inc.* | 10,290 | 483,321 | ||||||
Panhandle Oil and Gas, Inc., Class A | 197 | 6,582 | ||||||
PetroQuest Energy, Inc.* | 1,583 | 6,839 | ||||||
Pioneer Natural Resources Co. | 1,666 | 306,661 | ||||||
QEP Resources, Inc. | 540 | 16,551 | ||||||
Quicksilver Resources, Inc.* | 625 | 1,919 | ||||||
Range Resources Corp. | 4,717 | 397,690 | ||||||
Renewable Energy Group, Inc.* | 130 | 1,490 | ||||||
Rentech, Inc.* | 5,326 | 9,321 | ||||||
REX American Resources Corp.* | 21 | 939 | ||||||
Rex Energy Corp.* | 15,261 | 300,794 | ||||||
Rosetta Resources, Inc.* | 1,810 | 86,952 | ||||||
Sanchez Energy Corp.* | 13,393 | 328,262 | ||||||
SemGroup Corp., Class A | 1,152 | 75,145 | ||||||
SM Energy Co. | 5,296 | 440,151 | ||||||
Solazyme, Inc.* | 1,428 | 15,551 | ||||||
Synergy Resources Corp.* | 36,468 | 337,694 | ||||||
Targa Resources Corp. | 976 | 86,054 | ||||||
Triangle Petroleum Corp.* | 345 | 2,870 | ||||||
Uranium Energy Corp.* | 2,551 | 5,102 | ||||||
Ur-Energy, Inc.* | 716 | 988 | ||||||
VAALCO Energy, Inc.* | 879 | 6,056 | ||||||
Western Refining, Inc. | 888 | 37,660 | ||||||
World Fuel Services Corp. | 411 | 17,739 | ||||||
ZaZa Energy Corp.* | 389 | 372 | ||||||
|
| |||||||
| 4,271,255 | ||||||||
|
| |||||||
Total Energy | 7,433,079 | |||||||
|
| |||||||
Financials (5.9%) | ||||||||
Capital Markets (1.9%) | ||||||||
Affiliated Managers Group, Inc.* | 1,775 | 384,962 | ||||||
Artisan Partners Asset Management, Inc., Class A | 1,858 | 121,123 | ||||||
BGC Partners, Inc., Class A | 3,794 | 22,992 | ||||||
Cohen & Steers, Inc. | 563 | 22,554 | ||||||
Diamond Hill Investment Group, Inc. | 85 | 10,059 | ||||||
Eaton Vance Corp. | 3,541 | 151,519 | ||||||
Evercore Partners, Inc., Class A | 6,956 | 415,830 | ||||||
Federated Investors, Inc., Class B | 2,026 | 58,349 | ||||||
Financial Engines, Inc. | 1,437 | 99,843 | ||||||
FXCM, Inc., Class A | 1,089 | 19,428 | ||||||
GAMCO Investors, Inc., Class A | 181 | 15,742 | ||||||
Greenhill & Co., Inc. | 833 | 48,264 | ||||||
Hannon Armstrong Sustainable Infrastructure Capital, Inc. | 436 | 6,086 | ||||||
HFF, Inc., Class A* | 839 | 22,527 | ||||||
ICG Group, Inc.* | 65 | 1,211 | ||||||
INTL FCStone, Inc.* | 129 | $ | 2,392 | |||||
KCG Holdings, Inc., Class A* | 923 | 11,039 | ||||||
Ladenburg Thalmann Financial Services, Inc.* | 3,109 | 9,731 | ||||||
Lazard Ltd., Class A | 13,869 | 628,543 | ||||||
LPL Financial Holdings, Inc. | 1,816 | 85,406 | ||||||
Main Street Capital Corp. | 68 | 2,223 | ||||||
Manning & Napier, Inc. | 14,336 | 253,030 | ||||||
Pzena Investment Management, Inc., Class A | 331 | 3,892 | ||||||
SEI Investments Co. | 4,020 | 139,615 | ||||||
Stifel Financial Corp.* | 7,379 | 353,602 | ||||||
Virtus Investment Partners, Inc.* | 2,428 | 485,721 | ||||||
Waddell & Reed Financial, Inc., Class A | 2,537 | 165,209 | ||||||
Westwood Holdings Group, Inc. | 209 | 12,939 | ||||||
WisdomTree Investments, Inc.* | 2,929 | 51,873 | ||||||
|
| |||||||
| 3,605,704 | ||||||||
|
| |||||||
Commercial Banks (1.3%) | ||||||||
Bank of the Ozarks, Inc. | 651 | 36,840 | ||||||
BBCN Bancorp, Inc. | 5,000 | 82,950 | ||||||
First Financial Bankshares, Inc. | 610 | 40,455 | ||||||
First Republic Bank/California | 7,265 | 380,323 | ||||||
Home BancShares, Inc./Arkansas | 354 | 13,222 | ||||||
IBERIABANK Corp. | 5,141 | 323,112 | ||||||
Independent Bank Group, Inc. | 3,415 | 169,589 | ||||||
Investors Bancorp, Inc. | 167 | 4,272 | ||||||
Penns Woods Bancorp, Inc. | 9 | 459 | ||||||
Signature Bank/New York* | 3,647 | 391,761 | ||||||
SVB Financial Group* | 3,800 | 398,468 | ||||||
Texas Capital Bancshares, Inc.* | 2,200 | 136,840 | ||||||
Western Alliance Bancorp* | 17,904 | 427,189 | ||||||
|
| |||||||
| 2,405,480 | ||||||||
|
| |||||||
Consumer Finance (0.1%) | ||||||||
Consumer Portfolio Services, Inc.* | 287 | 2,695 | ||||||
Credit Acceptance Corp.* | 213 | 27,688 | ||||||
Encore Capital Group, Inc.* | 576 | 28,950 | ||||||
First Cash Financial Services, Inc.* | 863 | 53,368 | ||||||
Portfolio Recovery Associates, Inc.* | 1,504 | 79,471 | ||||||
Regional Management Corp.* | 84 | 2,850 | ||||||
Springleaf Holdings, Inc.* | 313 | 7,913 | ||||||
World Acceptance Corp.* | 252 | 22,057 | ||||||
|
| |||||||
| 224,992 | ||||||||
|
| |||||||
Diversified Financial Services (0.5%) |
| |||||||
CBOE Holdings, Inc. | 2,573 | 133,693 | ||||||
IntercontinentalExchange Group, Inc. | 1,240 | 278,901 | ||||||
MarketAxess Holdings, Inc. | 1,113 | 74,426 | ||||||
MSCI, Inc.* | 1,499 | 65,536 | ||||||
Platform Acquisition Holdings Ltd.*†(b) | 25,089 | 351,246 | ||||||
|
| |||||||
| 903,802 | ||||||||
|
| |||||||
Insurance (0.7%) | ||||||||
Allied World Assurance Co. Holdings AG | 337 | 38,017 | ||||||
Ambac Financial Group, Inc.* | 278 | 6,828 | ||||||
See Notes to Financial Statements.
124
AXA PREMIER VIP TRUST
MULTIMANAGER MID CAP GROWTH PORTFOLIO
PORTFOLIO OF INVESTMENTS (Continued)
December 31, 2013
Number of Shares | Value (Note 1) | |||||||
American Equity Investment Life Holding Co. | 145 | $ | 3,825 | |||||
American Financial Group, Inc./Ohio | 298 | 17,201 | ||||||
Amtrust Financial Services, Inc. | 746 | 24,387 | ||||||
Arch Capital Group Ltd.* | 251 | 14,982 | ||||||
Argo Group International Holdings Ltd. | 270 | 12,552 | ||||||
Arthur J. Gallagher & Co. | 3,742 | 175,612 | ||||||
Assured Guaranty Ltd. | 12,046 | 284,165 | ||||||
Axis Capital Holdings Ltd. | 864 | 41,100 | ||||||
Brown & Brown, Inc. | 1,578 | 49,533 | ||||||
Crawford & Co., Class B | 282 | 2,606 | ||||||
Eastern Insurance Holdings, Inc. | 32 | 784 | ||||||
eHealth, Inc.* | 533 | 24,779 | ||||||
Employers Holdings, Inc. | 624 | 19,750 | ||||||
Endurance Specialty Holdings Ltd. | 438 | 25,697 | ||||||
Enstar Group Ltd.* | 100 | 13,891 | ||||||
Erie Indemnity Co., Class A | 737 | 53,889 | ||||||
Greenlight Capital Reinsurance Ltd., Class A* | 208 | 7,012 | ||||||
Hallmark Financial Services, Inc.* | 16 | 142 | ||||||
Hanover Insurance Group, Inc. | 4,281 | 255,619 | ||||||
HCI Group, Inc | 277 | 14,820 | ||||||
Health Insurance Innovations, Inc., Class A* | 135 | 1,365 | ||||||
Infinity Property & Casualty Corp. | 168 | 12,054 | ||||||
Maiden Holdings Ltd. | 187 | 2,044 | ||||||
Meadowbrook Insurance Group, Inc. | 93 | 647 | ||||||
National Interstate Corp. | 52 | 1,196 | ||||||
Third Point Reinsurance Ltd.* | 237 | 4,392 | ||||||
Tower Group International Ltd. | 133 | 450 | ||||||
United Fire Group, Inc. | 49 | 1,404 | ||||||
Universal Insurance Holdings, Inc. | 71 | 1,028 | ||||||
Validus Holdings Ltd. | 232 | 9,347 | ||||||
XL Group plc | 6,942 | 221,033 | ||||||
|
| |||||||
| 1,342,151 | ||||||||
|
| |||||||
Real Estate Investment Trusts (REITs) (1.0%) |
| |||||||
Acadia Realty Trust (REIT) | 306 | 7,598 | ||||||
Alexander’s, Inc. (REIT) | 63 | 20,790 | ||||||
American Homes 4 Rent (REIT), Class A | 291 | 4,714 | ||||||
American Realty Capital Properties, Inc. (REIT) | 770 | 9,902 | ||||||
Apartment Investment & Management Co. (REIT), Class A | 2,375 | 61,536 | ||||||
Aviv REIT, Inc. (REIT) | 33 | 782 | ||||||
Brixmor Property Group, Inc. (REIT)* | 270 | 5,489 | ||||||
CBL & Associates Properties, Inc. (REIT) | 1,594 | 28,628 | ||||||
CoreSite Realty Corp. (REIT) | 619 | 19,926 | ||||||
Corrections Corp. of America (REIT) | 2,131 | 68,341 | ||||||
DuPont Fabros Technology, Inc. (REIT) | 766 | 18,928 | ||||||
EastGroup Properties, Inc. (REIT) | 835 | $ | 48,372 | |||||
Empire State Realty Trust, Inc. (REIT), Class A | 450 | 6,885 | ||||||
Equity Lifestyle Properties, Inc. | 1,779 | 64,453 | ||||||
Extra Space Storage, Inc. (REIT) | 268 | 11,291 | ||||||
Federal Realty Investment Trust (REIT). | 1,264 | 128,182 | ||||||
GEO Group, Inc. (REIT) | 920 | 29,642 | ||||||
Glimcher Realty Trust (REIT) | 3,886 | 36,373 | ||||||
Healthcare Realty Trust, Inc. (REIT) | 1,092 | 23,271 | ||||||
Highwoods Properties, Inc. (REIT) | 800 | 28,936 | ||||||
Host Hotels & Resorts, Inc. (REIT) | 17,306 | 336,429 | ||||||
Inland Real Estate Corp. (REIT) | 2,181 | 22,944 | ||||||
Investors Real Estate Trust (REIT) | 144 | 1,236 | ||||||
LTC Properties, Inc. (REIT) | 896 | 31,709 | ||||||
National Health Investors, Inc. (REIT) | 861 | 48,302 | ||||||
Omega Healthcare Investors, Inc. (REIT) | 3,551 | 105,820 | ||||||
Physicians Realty Trust (REIT) | 171 | 2,179 | ||||||
Potlatch Corp. (REIT) | 1,207 | 50,380 | ||||||
PS Business Parks, Inc. (REIT) | 559 | 42,719 | ||||||
Rayonier, Inc. (REIT) | 3,721 | 156,654 | ||||||
Regency Centers Corp. (REIT) | 1,135 | 52,550 | ||||||
Rexford Industrial Realty, Inc. (REIT) | 193 | 2,548 | ||||||
Ryman Hospitality Properties, Inc. (REIT) | 828 | 34,594 | ||||||
Sabra Health Care REIT, Inc. (REIT) | 456 | 11,920 | ||||||
Saul Centers, Inc. (REIT) | 237 | 11,312 | ||||||
Senior Housing Properties Trust (REIT). | 408 | 9,070 | ||||||
Sovran Self Storage, Inc. (REIT) | 843 | 54,938 | ||||||
Spirit Realty Capital, Inc. (REIT) | 2,135 | 20,987 | ||||||
Strategic Hotels & Resorts, Inc. (REIT)* | 4,568 | 43,168 | ||||||
Sun Communities, Inc. (REIT) | 1,074 | 45,795 | ||||||
Tanger Factory Outlet Centers (REIT) | 2,795 | 89,496 | ||||||
Taubman Centers, Inc. (REIT) | 349 | 22,308 | ||||||
UMH Properties, Inc. (REIT) | 95 | 895 | ||||||
Universal Health Realty Income | ||||||||
Trust (REIT) | 356 | 14,261 | ||||||
Urstadt Biddle Properties, Inc. (REIT), Class A | 564 | 10,406 | ||||||
Washington Real Estate Investment | ||||||||
Trust (REIT) | 559 | 13,058 | ||||||
Winthrop Realty Trust (REIT) | 52 | 575 | ||||||
ZAIS Financial Corp. (REIT) | 147 | 2,356 | ||||||
|
| |||||||
| 1,862,648 | ||||||||
|
| |||||||
Real Estate Management & Development (0.1%) |
| |||||||
Forestar Group, Inc.* | 117 | 2,488 | ||||||
Kennedy-Wilson Holdings, Inc. | 151 | 3,360 | ||||||
Realogy Holdings Corp.* | 3,164 | 156,523 | ||||||
St. Joe Co.* | 133 | 2,552 | ||||||
Tejon Ranch Co.* | 384 | 14,116 | ||||||
|
| |||||||
| 179,039 | ||||||||
|
| |||||||
See Notes to Financial Statements.
125
AXA PREMIER VIP TRUST
MULTIMANAGER MID CAP GROWTH PORTFOLIO
PORTFOLIO OF INVESTMENTS (Continued)
December 31, 2013
Number of Shares | Value (Note 1) | |||||||
Thrifts & Mortgage Finance (0.3%) |
| |||||||
BofI Holding, Inc.* | 361 | $ | 28,313 | |||||
Essent Group Ltd.* | 6,700 | 161,202 | ||||||
First Federal Bancshares of Arkansas, Inc.* | 31 | 270 | ||||||
Meridian Interstate Bancorp, Inc.* | 16 | 361 | ||||||
MGIC Investment Corp.* | 5,334 | 45,019 | ||||||
Nationstar Mortgage Holdings, Inc.* | 636 | 23,507 | ||||||
Northfield Bancorp, Inc./New Jersey | 386 | 5,095 | ||||||
Ocwen Financial Corp.* | 3,063 | 169,843 | ||||||
Oritani Financial Corp. | 430 | 6,901 | ||||||
Radian Group, Inc. | 1,413 | 19,952 | ||||||
Tree.com, Inc.* | 103 | 3,383 | ||||||
|
| |||||||
| 463,846 | ||||||||
|
| |||||||
Total Financials | 10,987,662 | |||||||
|
| |||||||
Health Care (12.8%) | ||||||||
Biotechnology (3.3%) | ||||||||
ACADIA Pharmaceuticals, Inc.* | 1,959 | 48,955 | ||||||
Achillion Pharmaceuticals, Inc.* | 2,884 | 9,575 | ||||||
Acorda Therapeutics, Inc.* | 1,198 | 34,982 | ||||||
Aegerion Pharmaceuticals, Inc.* | 2,175 | 154,338 | ||||||
Agios Pharmaceuticals, Inc.* | 166 | 3,976 | ||||||
Alkermes plc* | 3,723 | 151,377 | ||||||
Alnylam Pharmaceuticals, Inc.* | 3,491 | 224,576 | ||||||
AMAG Pharmaceuticals, Inc.* | 644 | 15,630 | ||||||
Amicus Therapeutics, Inc.* | 868 | 2,040 | ||||||
Anacor Pharmaceuticals, Inc.* | 756 | 12,686 | ||||||
AP Pharma, Inc.* | 118,783 | 52,858 | ||||||
Arena Pharmaceuticals, Inc.* | 5,741 | 33,585 | ||||||
ARIAD Pharmaceuticals, Inc.* | 5,476 | 37,346 | ||||||
ArQule, Inc.* | 1,683 | 3,618 | ||||||
Array BioPharma, Inc.* | 3,768 | 18,878 | ||||||
BioMarin Pharmaceutical, Inc.* | 3,855 | 270,891 | ||||||
Biotime, Inc.* | 1,120 | 4,032 | ||||||
Bluebird Bio, Inc.* | 166 | 3,483 | ||||||
Cell Therapeutics, Inc.* | 3,988 | 7,657 | ||||||
Celldex Therapeutics, Inc.* | 16,148 | 390,943 | ||||||
Cellular Dynamics International, Inc.* | 89 | 1,469 | ||||||
Cepheid, Inc.* | 1,986 | 92,786 | ||||||
Chelsea Therapeutics International Ltd.* | 2,370 | 10,499 | ||||||
ChemoCentryx, Inc.* | 730 | 4,227 | ||||||
Chimerix, Inc.* | 251 | 3,793 | ||||||
Clovis Oncology, Inc.* | 530 | 31,943 | ||||||
Conatus Pharmaceuticals, Inc.* | 123 | 793 | ||||||
Coronado Biosciences, Inc.* | 799 | 2,101 | ||||||
Cubist Pharmaceuticals, Inc.* | 8,461 | 582,709 | ||||||
Curis, Inc.* | 1,835 | 5,175 | ||||||
Cytokinetics, Inc.* | 639 | 4,153 | ||||||
Cytori Therapeutics, Inc.* | 1,439 | 3,698 | ||||||
Dendreon Corp.* | 4,719 | 14,110 | ||||||
Durata Therapeutics, Inc.* | 389 | 4,975 | ||||||
Dyax Corp.* | 3,627 | 27,311 | ||||||
Dynavax Technologies Corp.* | 6,893 | 13,510 | ||||||
Emergent Biosolutions, Inc.* | 144 | 3,311 | ||||||
Enanta Pharmaceuticals, Inc.* | 106 | 2,892 | ||||||
Epizyme, Inc.* | 176 | $ | 3,661 | |||||
Esperion Therapeutics, Inc.* | 96 | 1,319 | ||||||
Exact Sciences Corp.* | 16,492 | 192,791 | ||||||
Exelixis, Inc.* | 5,506 | 33,752 | ||||||
Fibrocell Science, Inc.* | 842 | 3,418 | ||||||
Foundation Medicine, Inc.* | 1,300 | 30,966 | ||||||
Galena Biopharma, Inc.* | 2,919 | 14,478 | ||||||
Genomic Health, Inc.* | 500 | 14,635 | ||||||
GTx, Inc.* | 768 | 1,267 | ||||||
Halozyme Therapeutics, Inc.* | 2,662 | 39,903 | ||||||
Harvard Apparatus Regenerative Technology, Inc.* | 13 | 62 | ||||||
Hyperion Therapeutics, Inc.* | 250 | 5,055 | ||||||
Idenix Pharmaceuticals, Inc.* | 2,565 | 15,339 | ||||||
ImmunoGen, Inc.* | 1,939 | 28,445 | ||||||
Immunomedics, Inc.* | 2,076 | 9,550 | ||||||
Incyte Corp.* | 3,051 | 154,472 | ||||||
Infinity Pharmaceuticals, Inc.* | 1,431 | 19,762 | ||||||
Insmed, Inc.* | 1,012 | 17,214 | ||||||
Insys Therapeutics, Inc.* | 151 | 5,845 | ||||||
Intercept Pharmaceuticals, Inc.* | 210 | 14,339 | ||||||
InterMune, Inc.* | 13,990 | 206,073 | ||||||
Intrexon Corp.* | 281 | 6,688 | ||||||
Ironwood Pharmaceuticals, Inc.* | 2,784 | 32,322 | ||||||
Isis Pharmaceuticals, Inc.* | 5,193 | 206,889 | ||||||
KaloBios Pharmaceuticals, Inc.* | 610 | 2,696 | ||||||
Keryx Biopharmaceuticals, Inc.* | 2,448 | 31,702 | ||||||
Kindred Biosciences, Inc.* | 6,500 | 72,410 | ||||||
KYTHERA Biopharmaceuticals, Inc.* | 360 | 13,410 | ||||||
Lexicon Pharmaceuticals, Inc.* | 6,303 | 11,345 | ||||||
Ligand Pharmaceuticals, Inc., Class B* | 534 | 28,088 | ||||||
MannKind Corp.* | 4,454 | 23,205 | ||||||
Medivation, Inc.* | 2,209 | 140,978 | ||||||
MEI Pharma, Inc.* | 403 | 3,228 | ||||||
Merrimack Pharmaceuticals, Inc.* | 2,858 | 15,262 | ||||||
MiMedx Group, Inc.* | 2,739 | 23,939 | ||||||
Momenta Pharmaceuticals, Inc.* | 1,177 | 20,809 | ||||||
Myriad Genetics, Inc.* | 2,209 | 46,345 | ||||||
Nanosphere, Inc.* | 1,492 | 3,417 | ||||||
Neurocrine Biosciences, Inc.* | 1,999 | 18,671 | ||||||
NewLink Genetics Corp.* | 507 | 11,159 | ||||||
Novavax, Inc.* | 5,535 | 28,339 | ||||||
NPS Pharmaceuticals, Inc.* | 11,762 | 357,094 | ||||||
OncoGenex Pharmaceutical, Inc.* | 443 | 3,695 | ||||||
OncoMed Pharmaceuticals, Inc.* | 144 | 4,251 | ||||||
Onconova Therapeutics, Inc.* | 142 | 1,630 | ||||||
Ophthotech Corp.* | 224 | 7,246 | ||||||
Opko Health, Inc.* | 5,583 | 47,121 | ||||||
Orexigen Therapeutics, Inc.* | 3,028 | 17,048 | ||||||
Osiris Therapeutics, Inc.* | 500 | 8,040 | ||||||
OvaScience, Inc.* | 265 | 2,422 | ||||||
PDL BioPharma, Inc. | 4,172 | 35,212 | ||||||
Peregrine Pharmaceuticals, Inc.* | 5,245 | 7,291 | ||||||
Pharmacyclics, Inc.* | 3,299 | 348,968 | ||||||
Portola Pharmaceuticals, Inc.* | 331 | 8,523 | ||||||
Progenics Pharmaceuticals, Inc.* | 1,355 | 7,222 | ||||||
PTC Therapeutics, Inc.* | 230 | 3,903 | ||||||
Puma Biotechnology, Inc.* | 2,232 | 231,079 | ||||||
Quintiles Transnational Holdings, Inc.* | 6,950 | 322,063 | ||||||
See Notes to Financial Statements.
126
AXA PREMIER VIP TRUST
MULTIMANAGER MID CAP GROWTH PORTFOLIO
PORTFOLIO OF INVESTMENTS (Continued)
December 31, 2013
Number of Shares | Value (Note 1) | |||||||
Raptor Pharmaceutical Corp.* | 1,756 | $ | 22,863 | |||||
Receptos, Inc.* | 171 | 4,957 | ||||||
Regeneron Pharmaceuticals, Inc.* | 957 | 263,405 | ||||||
Regulus Therapeutics, Inc.* | 271 | 2,003 | ||||||
Repligen Corp.* | 940 | 12,822 | ||||||
Sangamo BioSciences, Inc.* | 1,781 | 24,738 | ||||||
Sarepta Therapeutics, Inc.* | 1,121 | 22,835 | ||||||
Seattle Genetics, Inc.* | 2,954 | 117,835 | ||||||
SIGA Technologies, Inc.* | 1,021 | 3,339 | ||||||
Stemline Therapeutics, Inc.* | 273 | 5,351 | ||||||
Sunesis Pharmaceuticals, Inc.* | 966 | 4,579 | ||||||
Synageva BioPharma Corp.* | 583 | 37,732 | ||||||
Synergy Pharmaceuticals, Inc.* | 2,401 | 13,518 | ||||||
Synta Pharmaceuticals Corp.* | 1,525 | 7,991 | ||||||
Tesaro, Inc.* | 400 | 11,296 | ||||||
Tetraphase Pharmaceuticals, Inc.* | 471 | 6,368 | ||||||
TG Therapeutics, Inc.* | 467 | 1,821 | ||||||
Theravance, Inc.* | 2,343 | 83,528 | ||||||
Threshold Pharmaceuticals, Inc.* | 1,415 | 6,608 | ||||||
United Therapeutics Corp.* | 1,379 | 155,937 | ||||||
Vanda Pharmaceuticals, Inc.* | 968 | 12,013 | ||||||
Verastem, Inc.* | 562 | 6,407 | ||||||
Vical, Inc.* | 2,085 | 2,460 | ||||||
XOMA Corp.* | 2,066 | 13,904 | ||||||
ZIOPHARM Oncology, Inc.* | 2,441 | 10,594 | ||||||
|
| |||||||
| 6,111,841 | ||||||||
|
| |||||||
Health Care Equipment & Supplies (3.2%) |
| |||||||
Abaxis, Inc.* | 661 | 26,453 | ||||||
ABIOMED, Inc.* | 1,157 | 30,938 | ||||||
Accuray, Inc.* | 2,224 | 19,371 | ||||||
Align Technology, Inc.* | 8,206 | 468,973 | ||||||
Analogic Corp. | 165 | 14,612 | ||||||
Anika Therapeutics, Inc.* | 213 | 8,128 | ||||||
Antares Pharma, Inc.* | 3,383 | 15,156 | ||||||
ArthroCare Corp.* | 691 | 27,806 | ||||||
AtriCure, Inc.* | 619 | 11,563 | ||||||
Atrion Corp. | 47 | 13,924 | ||||||
Biolase, Inc.* | 872 | 2,469 | ||||||
Cantel Medical Corp. | 982 | 33,300 | ||||||
Cardiovascular Systems, Inc.* | 741 | 25,409 | ||||||
Cerus Corp.* | 2,071 | 13,358 | ||||||
Cooper Cos., Inc. | 1,055 | 130,651 | ||||||
CryoLife, Inc. | 56 | 621 | ||||||
Cyberonics, Inc.* | 816 | 53,456 | ||||||
Cynosure, Inc., Class A* | 198 | 5,283 | ||||||
DexCom, Inc.* | 26,465 | 937,126 | ||||||
Endologix, Inc.* | 1,878 | 32,752 | ||||||
Exactech, Inc.* | 54 | 1,283 | ||||||
GenMark Diagnostics, Inc.* | 1,041 | 13,856 | ||||||
Globus Medical, Inc., Class A* | 1,630 | 32,893 | ||||||
Greatbatch, Inc.* | 10,570 | 467,617 | ||||||
Haemonetics Corp.* | 1,511 | 63,658 | ||||||
HeartWare International, Inc.* | 9,979 | 937,627 | ||||||
Hologic, Inc.* | 2,333 | 52,143 | ||||||
ICU Medical, Inc.* | 351 | 22,362 | ||||||
IDEXX Laboratories, Inc.* | 1,597 | 169,873 | ||||||
Insulet Corp.* | 1,582 | 58,692 | ||||||
Integra LifeSciences Holdings Corp.* | 363 | 17,319 | ||||||
LDR Holding Corp.* | 3,800 | 89,680 | ||||||
Masimo Corp.* | 1,432 | 41,857 | ||||||
Medical Action Industries, Inc.* | 171 | $ | 1,464 | |||||
Meridian Bioscience, Inc. | 1,242 | 32,950 | ||||||
Natus Medical, Inc.* | 537 | 12,082 | ||||||
Navidea Biopharmaceuticals, Inc.* | 3,061 | 6,336 | ||||||
Neogen Corp.* | 6,809 | 311,171 | ||||||
NuVasive, Inc.* | 284 | 9,182 | ||||||
NxStage Medical, Inc.* | 1,785 | 17,850 | ||||||
Oxford Immunotec Global plc* | 137 | 2,655 | ||||||
PhotoMedex, Inc.* | 136 | 1,761 | ||||||
Quidel Corp.* | 841 | 25,978 | ||||||
ResMed, Inc. | 4,206 | 198,018 | ||||||
Rockwell Medical, Inc.* | 199 | 2,078 | ||||||
Sirona Dental Systems, Inc.* | 6,029 | 423,236 | ||||||
Spectranetics Corp.* | 1,209 | 30,225 | ||||||
STAAR Surgical Co.* | 1,029 | 16,660 | ||||||
STERIS Corp. | 1,743 | 83,751 | ||||||
SurModics, Inc.* | 430 | 10,488 | ||||||
Tandem Diabetes Care, Inc.* | 6,500 | 167,505 | ||||||
TearLab Corp.* | 845 | 7,892 | ||||||
Thoratec Corp.* | 7,768 | 284,309 | ||||||
Unilife Corp.* | 2,890 | 12,716 | ||||||
Utah Medical Products, Inc. | 100 | 5,716 | ||||||
Vascular Solutions, Inc.* | 497 | 11,506 | ||||||
Volcano Corp.* | 13,690 | 299,126 | ||||||
West Pharmaceutical Services, Inc. | 2,025 | 99,347 | ||||||
Zeltiq Aesthetics, Inc.* | 522 | 9,871 | ||||||
|
| |||||||
| 5,924,082 | ||||||||
|
| |||||||
Health Care Providers & Services (2.4%) |
| |||||||
Acadia Healthcare Co., Inc.* | 16,837 | 796,895 | ||||||
Accretive Health, Inc.* | 1,761 | 16,131 | ||||||
Addus HomeCare Corp.* | 18 | 404 | ||||||
Air Methods Corp.* | 1,149 | 67,021 | ||||||
Alliance HealthCare Services, Inc.* | 58 | 1,435 | ||||||
AMN Healthcare Services, Inc.* | 1,374 | 20,198 | ||||||
Amsurg Corp.* | 280 | 12,858 | ||||||
Bio-Reference Labs, Inc.* | 733 | 18,721 | ||||||
BioScrip, Inc.* | 417 | 3,086 | ||||||
Brookdale Senior Living, Inc.* | 2,946 | 80,072 | ||||||
Capital Senior Living Corp.* | 856 | 20,535 | ||||||
Catamaran Corp.* | 8,505 | 403,817 | ||||||
Centene Corp.* | 1,589 | 93,672 | ||||||
Chemed Corp. | 506 | 38,770 | ||||||
Chindex International, Inc.* | 75 | 1,307 | ||||||
Community Health Systems, Inc.* | 220 | 8,639 | ||||||
Corvel Corp.* | 329 | 15,364 | ||||||
Emeritus Corp.* | 1,206 | 26,086 | ||||||
Ensign Group, Inc. | 551 | 24,393 | ||||||
Envision Healthcare Holdings, Inc.* | 9,750 | 346,320 | ||||||
ExamWorks Group, Inc.* | 904 | 27,003 | ||||||
Gentiva Health Services, Inc.* | 933 | 11,579 | ||||||
Hanger, Inc.* | 447 | 17,585 | ||||||
Health Management Associates, Inc., | ||||||||
Class A* | 7,591 | 99,442 | ||||||
HealthSouth Corp. | 2,164 | 72,104 | ||||||
Healthways, Inc.* | 669 | 10,269 | ||||||
IPC The Hospitalist Co., Inc.* | 502 | 29,814 | ||||||
See Notes to Financial Statements.
127
AXA PREMIER VIP TRUST
MULTIMANAGER MID CAP GROWTH PORTFOLIO
PORTFOLIO OF INVESTMENTS (Continued)
December 31, 2013
Number of Shares | Value (Note 1) | |||||||
Landauer, Inc. | 286 | $ | 15,046 | |||||
MEDNAX, Inc.* | 9,162 | 489,068 | ||||||
Molina Healthcare, Inc.* | 803 | 27,904 | ||||||
MWI Veterinary Supply, Inc.* | 2,498 | 426,134 | ||||||
National Research Corp., Class A* | 77 | 1,449 | ||||||
National Research Corp., Class B | 42 | 1,458 | ||||||
Owens & Minor, Inc. | 403 | 14,734 | ||||||
Patterson Cos., Inc. | 2,319 | 95,543 | ||||||
Premier, Inc., Class A* | 6,328 | 232,617 | ||||||
Providence Service Corp.* | 317 | 8,153 | ||||||
Skilled Healthcare Group, Inc., Class A* | 556 | 2,674 | ||||||
Surgical Care Affiliates, Inc.* | 162 | 5,644 | ||||||
Team Health Holdings, Inc.* | 7,776 | 354,197 | ||||||
Tenet Healthcare Corp.* | 3,046 | 128,298 | ||||||
Triple-S Management Corp., Class B* | 38 | 739 | ||||||
U.S. Physical Therapy, Inc. | 362 | 12,764 | ||||||
Universal Health Services, Inc., Class B. | 1,796 | 145,943 | ||||||
WellCare Health Plans, Inc.* | 3,513 | 247,385 | ||||||
|
| |||||||
| 4,473,270 | ||||||||
|
| |||||||
Health Care Technology (0.4%) | ||||||||
athenahealth, Inc.* | 1,079 | 145,125 | ||||||
Computer Programs & Systems, Inc. | 331 | 20,459 | ||||||
HealthStream, Inc.* | 604 | 19,793 | ||||||
HMS Holdings Corp.* | 16,826 | 382,455 | ||||||
MedAssets, Inc.* | 1,820 | 36,091 | ||||||
Medidata Solutions, Inc.* | 1,578 | 95,579 | ||||||
Merge Healthcare, Inc.* | 1,948 | 4,519 | ||||||
Omnicell, Inc.* | 581 | 14,833 | ||||||
Quality Systems, Inc. | 1,194 | 25,146 | ||||||
Veeva Systems, Inc., Class A* | 286 | 9,181 | ||||||
Vocera Communications, Inc.* | 531 | 8,289 | ||||||
|
| |||||||
| 761,470 | ||||||||
|
| |||||||
Life Sciences Tools & Services (1.1%) |
| |||||||
Accelerate Diagnostics, Inc.* | 338 | 4,124 | ||||||
Bruker Corp.* | 3,242 | 64,094 | ||||||
Cambrex Corp.* | 438 | 7,810 | ||||||
Charles River Laboratories International, Inc.* | 661 | 35,059 | ||||||
Covance, Inc.* | 5,144 | 452,981 | ||||||
Fluidigm Corp.* | 763 | 29,238 | ||||||
Furiex Pharmaceuticals, Inc.* | 200 | 8,402 | ||||||
Harvard Bioscience, Inc.* | 54 | 254 | ||||||
ICON plc* | 9,138 | 369,267 | ||||||
Illumina, Inc.* | 2,241 | 247,899 | ||||||
Luminex Corp.* | 1,118 | 21,689 | ||||||
Mettler-Toledo International, Inc.* | 890 | 215,905 | ||||||
NeoGenomics, Inc.* | 971 | 3,515 | ||||||
PAREXEL International Corp.* | 12,016 | 542,883 | ||||||
Sequenom, Inc.* | 3,440 | 8,050 | ||||||
Techne Corp | 505 | 47,808 | ||||||
|
| |||||||
| 2,058,978 | ||||||||
|
| |||||||
Pharmaceuticals (2.4%) | ||||||||
AcelRx Pharmaceuticals, Inc.* | 674 | $ | 7,623 | |||||
Actavis plc* | 3,548 | 596,064 | ||||||
Akorn, Inc.* | 15,166 | 373,539 | ||||||
Alimera Sciences, Inc.* | 503 | 2,369 | ||||||
Ampio Pharmaceuticals, Inc.* | 999 | 7,123 | ||||||
Aratana Therapeutics, Inc.* | 742 | 14,172 | ||||||
Auxilium Pharmaceuticals, Inc.* | 1,475 | 30,591 | ||||||
AVANIR Pharmaceuticals, Inc., Class A* | 4,348 | 14,609 | ||||||
BioDelivery Sciences International, Inc.* | 875 | 5,154 | ||||||
Cadence Pharmaceuticals, Inc.* | 1,851 | 16,751 | ||||||
Cempra, Inc.* | 574 | 7,112 | ||||||
Corcept Therapeutics, Inc.* | 1,650 | 5,313 | ||||||
Depomed, Inc.* | 1,695 | 17,933 | ||||||
Endo Health Solutions, Inc.* | 3,315 | 223,630 | ||||||
Endocyte, Inc.* | 914 | 9,771 | ||||||
Forest Laboratories, Inc.* | 6,440 | 386,593 | ||||||
Hi-Tech Pharmacal Co., Inc.* | 116 | 5,033 | ||||||
Horizon Pharma, Inc.* | 741 | 5,646 | ||||||
Impax Laboratories, Inc.* | 15,022 | 377,653 | ||||||
Jazz Pharmaceuticals plc* | 6,021 | 762,018 | ||||||
Lannett Co., Inc.* | 559 | 18,503 | ||||||
Medicines Co.* | 1,868 | 72,142 | ||||||
Nektar Therapeutics* | 2,391 | 27,138 | ||||||
Omeros Corp.* | 898 | 10,138 | ||||||
Ono Pharmaceutical Co., Ltd. | 3,117 | 272,601 | ||||||
Pacira Pharmaceuticals, Inc.* | 824 | 47,372 | ||||||
Questcor Pharmaceuticals, Inc. | 1,538 | 83,744 | ||||||
Repros Therapeutics, Inc.* | 669 | 12,243 | ||||||
Sagent Pharmaceuticals, Inc.* | 14,497 | 367,934 | ||||||
Salix Pharmaceuticals Ltd.* | 4,480 | 402,931 | ||||||
Santarus, Inc.* | 1,626 | 51,967 | ||||||
Sciclone Pharmaceuticals, Inc.* | 1,191 | 6,003 | ||||||
Sucampo Pharmaceuticals, Inc., Class A* | 405 | 3,807 | ||||||
Supernus Pharmaceuticals, Inc.* | 589 | 4,441 | ||||||
TherapeuticsMD, Inc.* | 2,527 | 13,166 | ||||||
ViroPharma, Inc.* | 1,933 | 96,360 | ||||||
Vivus, Inc.* | 3,012 | 27,349 | ||||||
XenoPort, Inc.* | 203 | 1,167 | ||||||
Zogenix, Inc.* | 2,948 | 10,141 | ||||||
|
| |||||||
| 4,397,844 | ||||||||
|
| |||||||
Total Health Care | 23,727,485 | |||||||
|
| |||||||
Industrials (15.2%) | ||||||||
Aerospace & Defense (2.3%) | ||||||||
American Science & Engineering, | 39 | 2,804 | ||||||
Astronics Corp.* | 8,655 | 441,405 | ||||||
B/E Aerospace, Inc.* | 2,725 | 237,157 | ||||||
Cubic Corp | �� | 41 | 2,159 | |||||
DigitalGlobe, Inc.* | 27,884 | 1,147,427 | ||||||
Erickson Air-Crane, Inc.* | 79 | 1,642 | ||||||
GenCorp, Inc.* | 1,417 | 25,534 | ||||||
HEICO Corp | 1,940 | 112,423 | ||||||
Hexcel Corp.* | 22,923 | 1,024,429 | ||||||
Huntington Ingalls Industries, Inc. | 1,486 | 133,755 | ||||||
Innovative Solutions & Support, Inc.* | 367 | 2,675 | ||||||
See Notes to Financial Statements.
128
AXA PREMIER VIP TRUST
MULTIMANAGER MID CAP GROWTH PORTFOLIO
PORTFOLIO OF INVESTMENTS (Continued)
December 31, 2013
Number of Shares | Value (Note 1) | |||||||
KEYW Holding Corp.* | 23,459 | $ | 315,289 | |||||
LMI Aerospace, Inc.* | 40 | 590 | ||||||
Moog, Inc., Class A* | 125 | 8,493 | ||||||
National Presto Industries, Inc.* | 12 | 966 | ||||||
Spirit AeroSystems Holdings, Inc., Class A* | 465 | 15,847 | ||||||
Taser International, Inc.* | 1,537 | 24,408 | ||||||
Teledyne Technologies, Inc.* | 342 | 31,416 | ||||||
TransDigm Group, Inc. | 3,865 | 622,342 | ||||||
Triumph Group, Inc. | 313 | 23,810 | ||||||
|
| |||||||
| 4,174,571 | ||||||||
|
| |||||||
Air Freight & Logistics (0.7%) | ||||||||
Echo Global Logistics, Inc.* | 21,181 | 454,968 | ||||||
Expeditors International of Washington, Inc. | 7,843 | 347,053 | ||||||
Forward Air Corp. | 867 | 38,070 | ||||||
Hub Group, Inc., Class A* | 9,614 | 383,406 | ||||||
Pacer International, Inc.* | 81 | 669 | ||||||
Park-Ohio Holdings Corp.* | 260 | 13,624 | ||||||
UTi Worldwide, Inc. | 1,930 | 33,891 | ||||||
XPO Logistics, Inc.* | 221 | 5,810 | ||||||
|
| |||||||
| 1,277,491 | ||||||||
|
| |||||||
Airlines (0.7%) | ||||||||
Alaska Air Group, Inc. | 1,913 | 140,357 | ||||||
Allegiant Travel Co. | 2,127 | 224,271 | ||||||
Copa Holdings S.A., Class A | 974 | 155,947 | ||||||
Republic Airways Holdings, Inc.* | 766 | 8,188 | ||||||
SkyWest, Inc. | 83 | 1,231 | ||||||
Spirit Airlines, Inc.* | 15,774 | 716,297 | ||||||
|
| |||||||
| 1,246,291 | ||||||||
|
| |||||||
Building Products (0.8%) | ||||||||
A.O. Smith Corp. | 970 | 52,322 | ||||||
AAON, Inc. | 842 | 26,902 | ||||||
American Woodmark Corp.* | 296 | 11,701 | ||||||
Apogee Enterprises, Inc. | 609 | 21,869 | ||||||
Armstrong World Industries, Inc.* | 8,147 | 469,349 | ||||||
Builders FirstSource, Inc.* | 1,348 | 9,625 | ||||||
Fortune Brands Home & Security, Inc. | 4,276 | 195,413 | ||||||
Insteel Industries, Inc. | 501 | 11,388 | ||||||
Lennox International, Inc. | 1,485 | 126,314 | ||||||
NCI Building Systems, Inc.* | 519 | 9,103 | ||||||
Nortek, Inc.* | 269 | 20,067 | ||||||
Owens Corning, Inc.* | 9,309 | 379,062 | ||||||
Patrick Industries, Inc.* | 199 | 5,757 | ||||||
PGT, Inc.* | 991 | 10,029 | ||||||
Ply Gem Holdings, Inc.* | 422 | 7,609 | ||||||
Simpson Manufacturing Co., Inc. | 100 | 3,673 | ||||||
Trex Co., Inc.* | 514 | 40,878 | ||||||
USG Corp.* | 2,271 | 64,451 | ||||||
|
| |||||||
| 1,465,512 | ||||||||
|
| |||||||
Commercial Services & Supplies (1.6%) |
| |||||||
Acorn Energy, Inc. | 546 | 2,222 | ||||||
ADT Corp. | 8,405 | 340,150 | ||||||
Brink’s Co. | 943 | 32,194 | ||||||
Casella Waste Systems, Inc., Class A* | 1,041 | 6,038 | ||||||
CECO Environmental Corp. | 255 | $ | 4,123 | |||||
Cenveo, Inc.* | 802 | 2,759 | ||||||
Cintas Corp. | 856 | 51,009 | ||||||
Clean Harbors, Inc.* | 6,580 | 394,537 | ||||||
Copart, Inc.* | 3,284 | 120,359 | ||||||
Costa, Inc.* | 268 | 5,824 | ||||||
Deluxe Corp. | 975 | 50,885 | ||||||
EnerNOC, Inc.* | 275 | 4,733 | ||||||
G&K Services, Inc., Class A | 96 | 5,974 | ||||||
Healthcare Services Group, Inc. | 2,019 | 57,279 | ||||||
Heritage-Crystal Clean, Inc.* | 239 | 4,897 | ||||||
Herman Miller, Inc. | 1,729 | 51,040 | ||||||
HNI Corp. | 1,266 | 49,159 | ||||||
InnerWorkings, Inc.* | 1,323 | 10,306 | ||||||
Interface, Inc. | 23,281 | 511,251 | ||||||
KAR Auction Services, Inc. | 848 | 25,058 | ||||||
Knoll, Inc. | 977 | 17,889 | ||||||
McGrath RentCorp. | 365 | 14,527 | ||||||
Mine Safety Appliances Co. | 834 | 42,709 | ||||||
Mobile Mini, Inc.* | 12,559 | 517,180 | ||||||
Multi-Color Corp. | 221 | 8,341 | ||||||
Performant Financial Corp.* | 664 | 6,839 | ||||||
Pitney Bowes, Inc. | 2,588 | 60,300 | ||||||
R.R. Donnelley & Sons Co. | 2,903 | 58,873 | ||||||
Rollins, Inc. | 1,883 | 57,036 | ||||||
SP Plus Corp.* | 302 | 7,864 | ||||||
Steelcase, Inc., Class A | 290 | 4,599 | ||||||
Team, Inc.* | 616 | 26,082 | ||||||
Tetra Tech, Inc.* | 152 | 4,253 | ||||||
U.S. Ecology, Inc. | 7,228 | 268,809 | ||||||
UniFirst Corp. | 241 | 25,787 | ||||||
Waste Connections, Inc. | 3,443 | 150,218 | ||||||
West Corp. | 417 | 10,721 | ||||||
|
| |||||||
| 3,011,824 | ||||||||
|
| |||||||
Construction & Engineering (0.3%) |
| |||||||
AECOM Technology Corp.* | 295 | 8,682 | ||||||
Aegion Corp.* | 139 | 3,043 | ||||||
Chicago Bridge & Iron Co. N.V. (N.Y. Shares) | 2,954 | 245,596 | ||||||
Comfort Systems USA, Inc. | 292 | 5,662 | ||||||
Dycom Industries, Inc.* | 369 | 10,254 | ||||||
Furmanite Corp.* | 686 | 7,285 | ||||||
Great Lakes Dredge & Dock Corp.* | 167 | 1,536 | ||||||
KBR, Inc. | 4,727 | 150,744 | ||||||
MasTec, Inc.* | 1,758 | 57,522 | ||||||
Pike Corp.* | 419 | 4,429 | ||||||
Primoris Services Corp. | 1,052 | 32,749 | ||||||
Quanta Services, Inc.* | 1,278 | 40,334 | ||||||
Sterling Construction Co., Inc.* | 32 | 375 | ||||||
|
| |||||||
| 568,211 | ||||||||
|
| |||||||
Electrical Equipment (0.6%) | ||||||||
Acuity Brands, Inc. | 1,255 | 137,197 | ||||||
AMETEK, Inc. | 8,290 | 436,634 | ||||||
AZZ, Inc. | 728 | 35,570 | ||||||
Babcock & Wilcox Co. | 2,267 | 77,509 | ||||||
Capstone Turbine Corp.* | 9,136 | 11,785 | ||||||
Coleman Cable, Inc. | 258 | 6,765 | ||||||
Encore Wire Corp. | 74 | 4,011 | ||||||
EnerSys, Inc. | 439 | 30,769 | ||||||
See Notes to Financial Statements.
129
AXA PREMIER VIP TRUST
MULTIMANAGER MID CAP GROWTH PORTFOLIO
PORTFOLIO OF INVESTMENTS (Continued)
December 31, 2013
Number of Shares | Value (Note 1) | |||||||
Enphase Energy, Inc.* | 476 | $ | 3,018 | |||||
Franklin Electric Co., Inc. | 1,328 | 59,282 | ||||||
FuelCell Energy, Inc.* | 4,732 | 6,672 | ||||||
Generac Holdings, Inc. | 1,528 | 86,546 | ||||||
General Cable Corp. | 116 | 3,412 | ||||||
Hubbell, Inc., Class B | 1,264 | 137,650 | ||||||
Polypore International, Inc.* | 1,381 | 53,721 | ||||||
Power Solutions International, Inc.* | 72 | 5,407 | ||||||
PowerSecure International, Inc.* | 615 | 10,560 | ||||||
Preformed Line Products Co. | 9 | 658 | ||||||
Revolution Lighting Technologies, Inc.* | 831 | 2,846 | ||||||
SolarCity Corp.* | 692 | 39,319 | ||||||
Thermon Group Holdings, Inc.* | 807 | 22,055 | ||||||
|
| |||||||
| 1,171,386 | ||||||||
|
| |||||||
Industrial Conglomerates (0.3%) |
| |||||||
Carlisle Cos., Inc. | 6,072 | 482,117 | ||||||
Raven Industries, Inc. | 1,070 | 44,020 | ||||||
|
| |||||||
| 526,137 | ||||||||
|
| |||||||
Machinery (3.9%) | ||||||||
Accuride Corp.* | 1,117 | 4,166 | ||||||
Actuant Corp., Class A | 10,239 | 375,157 | ||||||
Albany International Corp., Class A | 126 | 4,527 | ||||||
Altra Industrial Motion Corp. | 14,366 | 491,605 | ||||||
Blount International, Inc.* | 1,475 | 21,343 | ||||||
Chart Industries, Inc.* | 4,959 | 474,279 | ||||||
CIRCOR International, Inc. | 31 | 2,504 | ||||||
CLARCOR, Inc. | 1,432 | 92,149 | ||||||
Colfax Corp.* | 2,525 | 160,817 | ||||||
Columbus McKinnon Corp.* | 82 | 2,225 | ||||||
Commercial Vehicle Group, Inc.* | 510 | 3,708 | ||||||
Crane Co. | 1,312 | 88,232 | ||||||
Donaldson Co., Inc. | 3,982 | 173,058 | ||||||
Douglas Dynamics, Inc. | 603 | 10,142 | ||||||
Energy Recovery, Inc.* | 560 | 3,114 | ||||||
EnPro Industries, Inc.* | 309 | 17,814 | ||||||
ESCO Technologies, Inc. | 225 | 7,708 | ||||||
ExOne Co.* | 168 | 10,157 | ||||||
Federal Signal Corp.* | 1,859 | 27,234 | ||||||
Flow International Corp.* | 276 | 1,115 | ||||||
Global Brass & Copper Holdings, Inc. | 51 | 844 | ||||||
Gorman-Rupp Co. | 406 | 13,573 | ||||||
Graco, Inc. | 1,805 | 141,007 | ||||||
Graham Corp. | 300 | 10,887 | ||||||
Harsco Corp. | 165 | 4,625 | ||||||
Hyster-Yale Materials Handling, Inc. | 313 | 29,159 | ||||||
IDEX Corp. | 9,693 | 715,828 | ||||||
ITT Corp. | 2,609 | 113,283 | ||||||
John Bean Technologies Corp. | 868 | 25,458 | ||||||
Joy Global, Inc. | 3,054 | 178,628 | ||||||
Lincoln Electric Holdings, Inc. | 8,911 | 635,711 | ||||||
Lindsay Corp. | 379 | 31,362 | ||||||
Manitex International, Inc.* | 437 | 6,940 | ||||||
Manitowoc Co., Inc. | 25,019 | 583,443 | ||||||
Middleby Corp.* | 2,412 | 578,808 | ||||||
Mueller Industries, Inc | 797 | 50,219 | ||||||
Mueller Water Products, Inc., Class A | 4,717 | $ | 44,198 | |||||
Navistar International Corp.* | 220 | 8,402 | ||||||
Nordson Corp. | 1,892 | 140,576 | ||||||
Omega Flex, Inc. | 81 | 1,657 | ||||||
Pall Corp. | 3,690 | 314,942 | ||||||
Proto Labs, Inc.* | 510 | 36,302 | ||||||
RBC Bearings, Inc.* | 678 | 47,969 | ||||||
Rexnord Corp.* | 903 | 24,390 | ||||||
Snap-on, Inc. | 197 | 21,575 | ||||||
Standex International Corp. | 75 | 4,716 | ||||||
Sun Hydraulics Corp. | 644 | 26,295 | ||||||
Tennant Co. | 542 | 36,753 | ||||||
Titan International, Inc. | 1,218 | 21,900 | ||||||
Toro Co. | 1,712 | 108,883 | ||||||
Trimas Corp.* | 1,325 | 52,854 | ||||||
Valmont Industries, Inc. | 4,181 | 623,471 | ||||||
Wabash National Corp.* | 169 | 2,087 | ||||||
WABCO Holdings, Inc.* | 1,720 | 160,665 | ||||||
Wabtec Corp. | 2,837 | 210,704 | ||||||
Watts Water Technologies, Inc., Class A | 63 | 3,898 | ||||||
Woodward, Inc. | 2,034 | 92,771 | ||||||
Xerium Technologies, Inc.* | 325 | 5,359 | ||||||
Xylem, Inc. | 335 | 11,591 | ||||||
|
| |||||||
| 7,092,787 | ||||||||
|
| |||||||
Marine (0.4%) | ||||||||
Kirby Corp.* | 6,952 | 689,986 | ||||||
Matson, Inc. | 1,272 | 33,212 | ||||||
|
| |||||||
| 723,198 | ||||||||
|
| |||||||
Professional Services (1.7%) | ||||||||
Acacia Research Corp. | 423 | 6,150 | ||||||
Advisory Board Co.* | 7,978 | 507,959 | ||||||
Barrett Business Services, Inc. | 212 | 19,661 | ||||||
Corporate Executive Board Co. | 996 | 77,120 | ||||||
Dun & Bradstreet Corp. | 1,097 | 134,657 | ||||||
Equifax, Inc. | 3,556 | 245,684 | ||||||
Exponent, Inc. | 2,261 | 175,092 | ||||||
Franklin Covey Co.* | 190 | 3,777 | ||||||
GP Strategies Corp.* | 440 | 13,108 | ||||||
Huron Consulting Group, Inc.* | 4,874 | 305,697 | ||||||
IHS, Inc., Class A* | 3,745 | 448,277 | ||||||
Insperity, Inc. | 673 | 24,316 | ||||||
Kforce, Inc. | 740 | 15,140 | ||||||
Mistras Group, Inc.* | 477 | 9,960 | ||||||
Odyssey Marine Exploration, Inc.* | 2,209 | 4,462 | ||||||
On Assignment, Inc.* | 1,350 | 47,142 | ||||||
Pendrell Corp.* | 701 | 1,409 | ||||||
Robert Half International, Inc. | 14,475 | 607,805 | ||||||
RPX Corp.* | 136 | 2,298 | ||||||
TrueBlue, Inc.* | 1,214 | 31,297 | ||||||
WageWorks, Inc.* | 8,829 | 524,796 | ||||||
|
| |||||||
| 3,205,807 | ||||||||
|
| |||||||
Road & Rail (0.7%) | ||||||||
Amerco, Inc.* | 117 | 27,827 | ||||||
Avis Budget Group, Inc.* | 3,166 | 127,970 | ||||||
Celadon Group, Inc. | 45 | 877 | ||||||
Con-way, Inc. | 617 | 24,501 | ||||||
See Notes to Financial Statements.
130
AXA PREMIER VIP TRUST
MULTIMANAGER MID CAP GROWTH PORTFOLIO
PORTFOLIO OF INVESTMENTS (Continued)
December 31, 2013
Number of Shares | Value (Note 1) | |||||||
Genesee & Wyoming, Inc., | 5,139 | $ | 493,601 | |||||
Heartland Express, Inc. | 1,046 | 20,523 | ||||||
Hertz Global Holdings, Inc.* | 11,773 | 336,943 | ||||||
Knight Transportation, Inc. | 1,756 | 32,205 | ||||||
Landstar System, Inc. | 1,382 | 79,396 | ||||||
Old Dominion Freight Line, Inc.* | 2,090 | 110,812 | ||||||
Quality Distribution, Inc.* | 216 | 2,771 | ||||||
Roadrunner Transportation Systems, Inc.* | 259 | 6,980 | ||||||
Saia, Inc.* | 725 | 23,236 | ||||||
Swift Transportation Co.* | 2,482 | 55,125 | ||||||
Universal Truckload Services, Inc. | 158 | 4,821 | ||||||
Werner Enterprises, Inc. | 388 | 9,595 | ||||||
YRC Worldwide, Inc.* | 65 | 1,129 | ||||||
|
| |||||||
| 1,358,312 | ||||||||
|
| |||||||
Trading Companies & Distributors (1.2%) |
| |||||||
Aceto Corp. | 168 | 4,202 | ||||||
Aircastle Ltd. | 832 | 15,941 | ||||||
Applied Industrial Technologies, Inc. | 1,144 | 56,159 | ||||||
Beacon Roofing Supply, Inc.* | 1,437 | 57,882 | ||||||
BlueLinx Holdings, Inc.* | 999 | 1,948 | ||||||
CAI International, Inc.* | 190 | 4,478 | ||||||
DXP Enterprises, Inc.* | 284 | 32,717 | ||||||
H&E Equipment Services, Inc.* | 886 | 26,252 | ||||||
HD Supply Holdings, Inc.* | 18,383 | 441,376 | ||||||
Houston Wire & Cable Co. | 174 | 2,328 | ||||||
Kaman Corp. | 527 | 20,938 | ||||||
MRC Global, Inc.* | 1,064 | 34,325 | ||||||
MSC Industrial Direct Co., Inc., Class A | 1,389 | 112,328 | ||||||
Rush Enterprises, Inc., Class A* | 382 | 11,326 | ||||||
TAL International Group, Inc. | 474 | 27,184 | ||||||
Textainer Group Holdings Ltd. | 214 | 8,607 | ||||||
United Rentals, Inc.* | 10,666 | 831,415 | ||||||
Watsco, Inc. | 760 | 73,006 | ||||||
WESCO International, Inc.* | 4,565 | 415,734 | ||||||
|
| |||||||
| 2,178,146 | ||||||||
|
| |||||||
Transportation Infrastructure (0.0%) |
| |||||||
Wesco Aircraft Holdings, Inc.* | 263 | 5,765 | ||||||
|
| |||||||
Total Industrials | 28,005,438 | |||||||
|
| |||||||
Information Technology (19.5%) |
| |||||||
Communications Equipment (1.2%) |
| |||||||
ADTRAN, Inc. | 1,153 | 31,143 | ||||||
Alliance Fiber Optic Products, Inc. | 342 | 5,147 | ||||||
Anaren, Inc.* | 39 | 1,092 | ||||||
ARRIS Group, Inc.* | 3,034 | 73,923 | ||||||
Aruba Networks, Inc.* | 3,372 | 60,359 | ||||||
CalAmp Corp.* | 1,051 | 29,396 | ||||||
Calix, Inc.* | 1,033 | 9,958 | ||||||
Ciena Corp.* | 13,754 | 329,133 | ||||||
CommScope Holding Co., Inc.* | 705 | 13,339 | ||||||
Infinera Corp.* | 3,108 | 30,396 | ||||||
InterDigital, Inc. | 1,214 | 35,801 | ||||||
Ixia* | 37,701 | 501,800 | ||||||
JDS Uniphase Corp.* | 5,277 | 68,495 | ||||||
KVH Industries, Inc.* | 396 | $ | 5,160 | |||||
Oplink Communications, Inc.* | 48 | 893 | ||||||
Palo Alto Networks, Inc.* | 4,478 | 257,351 | ||||||
Parkervision, Inc.* | 2,677 | 12,180 | ||||||
PC-Tel, Inc. | 73 | 699 | ||||||
Plantronics, Inc. | 1,175 | 54,579 | ||||||
Procera Networks, Inc.* | 116 | 1,742 | ||||||
Riverbed Technology, Inc.* | 4,572 | 82,662 | ||||||
Ruckus Wireless, Inc.* | 1,371 | 19,468 | ||||||
ShoreTel, Inc.* | 21,719 | 201,552 | ||||||
Sonus Networks, Inc.* | 461 | 1,452 | ||||||
Tessco Technologies, Inc. | 14 | 565 | ||||||
Ubiquiti Networks, Inc.* | 375 | 17,235 | ||||||
ViaSat, Inc.* | 6,018 | 377,028 | ||||||
|
| |||||||
| 2,222,548 | ||||||||
|
| |||||||
Computers & Peripherals (0.5%) | ||||||||
3D Systems Corp.* | 2,966 | 275,630 | ||||||
Cray, Inc.* | 608 | 16,696 | ||||||
Datalink Corp.* | 556 | 6,060 | ||||||
Electronics for Imaging, Inc.* | 744 | 28,815 | ||||||
Fusion-io, Inc.* | 1,713 | 15,263 | ||||||
Immersion Corp.* | 780 | 8,096 | ||||||
NCR Corp.* | 4,851 | 165,225 | ||||||
SanDisk Corp. | 4,242 | 299,231 | ||||||
Silicon Graphics International Corp.* | 1,009 | 13,531 | ||||||
Stratasys Ltd.* | 574 | 77,318 | ||||||
Synaptics, Inc.* | 960 | 49,738 | ||||||
|
| |||||||
| 955,603 | ||||||||
|
| |||||||
Electronic Equipment, Instruments & Components (1.8%) |
| |||||||
Anixter International, Inc. | 466 | 41,866 | ||||||
Badger Meter, Inc. | 430 | 23,435 | ||||||
Belden, Inc. | 1,156 | 81,440 | ||||||
CDW Corp. | 272 | 6,354 | ||||||
Cognex Corp.* | 17,644 | 673,648 | ||||||
Coherent, Inc.* | 5,493 | 408,624 | ||||||
Control4 Corp.* | 40 | 708 | ||||||
Daktronics, Inc. | 234 | 3,669 | ||||||
Dolby Laboratories, Inc., Class A* | 536 | 20,668 | ||||||
DTS, Inc.* | 547 | 13,117 | ||||||
Electro Rent Corp. | 284 | 5,260 | ||||||
Fabrinet* | 8,101 | 166,557 | ||||||
FARO Technologies, Inc.* | 9,409 | 548,545 | ||||||
FEI Co. | 1,235 | 110,360 | ||||||
FLIR Systems, Inc. | 2,897 | 87,200 | ||||||
InvenSense, Inc.* | 1,696 | 35,243 | ||||||
IPG Photonics Corp.* | 959 | 74,428 | ||||||
Littelfuse, Inc. | 588 | 54,643 | ||||||
Maxwell Technologies, Inc.* | 877 | 6,814 | ||||||
Measurement Specialties, Inc.* | 407 | 24,701 | ||||||
Mesa Laboratories, Inc. | 80 | 6,286 | ||||||
Methode Electronics, Inc. | 8,916 | 304,838 | ||||||
MTS Systems Corp. | 473 | 33,701 | ||||||
National Instruments Corp. | 8,560 | 274,091 | ||||||
Neonode, Inc.* | 763 | 4,822 | ||||||
OSI Systems, Inc.* | 545 | 28,945 | ||||||
RealD, Inc.* | 1,036 | 8,847 | ||||||
Rofin-Sinar Technologies, Inc.* | 57 | 1,540 | ||||||
Rogers Corp.* | 197 | 12,116 | ||||||
See Notes to Financial Statements.
131
AXA PREMIER VIP TRUST
MULTIMANAGER MID CAP GROWTH PORTFOLIO
PORTFOLIO OF INVESTMENTS (Continued)
December 31, 2013
Number of Shares | Value (Note 1) | |||||||
Trimble Navigation Ltd.* | 7,539 | $ | 261,603 | |||||
Uni-Pixel, Inc.* | 302 | 3,023 | ||||||
Universal Display Corp.* | 1,187 | 40,785 | ||||||
|
| |||||||
| 3,367,877 | ||||||||
|
| |||||||
Internet Software & Services (4.7%) |
| |||||||
Akamai Technologies, Inc.* | 8,214 | 387,537 | ||||||
Angie’s List, Inc.* | 20,129 | 304,954 | ||||||
Bankrate, Inc.* | 21,056 | 377,745 | ||||||
Bazaarvoice, Inc.* | 44,694 | 353,976 | ||||||
Benefitfocus, Inc.* | 1,710 | 98,735 | ||||||
Blucora, Inc.* | 772 | 22,511 | ||||||
Brightcove, Inc.* | 838 | 11,849 | ||||||
Carbonite, Inc.* | 354 | 4,188 | ||||||
ChannelAdvisor Corp.* | 213 | 8,884 | ||||||
comScore, Inc.* | 1,052 | 30,098 | ||||||
Constant Contact, Inc.* | 919 | 28,553 | ||||||
Cornerstone OnDemand, Inc.* | 7,691 | 410,238 | ||||||
CoStar Group, Inc.* | 5,211 | 961,846 | ||||||
Criteo S.A. (ADR)* | 3,719 | 127,190 | ||||||
Cvent, Inc.* | 2,364 | 86,026 | ||||||
Dealertrack Technologies, Inc.* | 1,144 | 55,004 | ||||||
Demandware, Inc.* | 11,922 | 764,439 | ||||||
Dice Holdings, Inc.* | 1,045 | 7,576 | ||||||
E2open, Inc.* | 438 | 10,473 | ||||||
eGain Corp.* | 388 | 3,973 | ||||||
Envestnet, Inc.* | 677 | 27,283 | ||||||
Global Eagle Entertainment, Inc.* | 8,011 | 119,124 | ||||||
Gogo, Inc.* | 214 | 5,309 | ||||||
IAC/InterActiveCorp. | 2,216 | 152,217 | ||||||
j2 Global, Inc. | 1,360 | 68,014 | ||||||
LinkedIn Corp., Class A* | 2,028 | 439,731 | ||||||
Liquidity Services, Inc.* | 743 | 16,836 | ||||||
LivePerson, Inc.* | 1,651 | 24,468 | ||||||
LogMeIn, Inc.* | 728 | 24,424 | ||||||
Marin Software, Inc.* | 274 | 2,806 | ||||||
Marketo, Inc.* | 208 | 7,711 | ||||||
Millennial Media, Inc.* | 1,052 | 7,648 | ||||||
Move, Inc.* | 1,196 | 19,124 | ||||||
Net Element International, Inc.* | 61 | 267 | ||||||
NIC, Inc. | 1,917 | 47,676 | ||||||
OpenTable, Inc.* | 4,363 | 346,291 | ||||||
Pandora Media, Inc.* | 26,655 | 709,023 | ||||||
Perficient, Inc.* | 137 | 3,209 | ||||||
Rackspace Hosting, Inc.* | 3,332 | 130,381 | ||||||
Reis, Inc.* | 245 | 4,711 | ||||||
Responsys, Inc.* | 1,019 | 27,931 | ||||||
Rocket Fuel, Inc.* | 107 | 6,579 | ||||||
SciQuest, Inc.* | 679 | 19,338 | ||||||
Shutterstock, Inc.* | 3,122 | 261,093 | ||||||
Spark Networks, Inc.* | 524 | 3,228 | ||||||
SPS Commerce, Inc.* | 466 | 30,430 | ||||||
Stamps.com, Inc.* | 392 | 16,503 | ||||||
support.com, Inc.* | 1,496 | 5,670 | ||||||
Textura Corp.* | 138 | 4,132 | ||||||
Travelzoo, Inc.* | 241 | 5,138 | ||||||
Tremor Video, Inc.* | 138 | 800 | ||||||
Trulia, Inc.* | 9,620 | 339,297 | ||||||
Unwired Planet, Inc.* | 2,632 | 3,632 | ||||||
ValueClick, Inc.* | 1,999 | 46,717 | ||||||
VistaPrint N.V.* | 966 | 54,917 | ||||||
Vocus, Inc.* | 53 | $ | 604 | |||||
Web.com Group, Inc.* | 1,238 | 39,356 | ||||||
WebMD Health Corp.* | 854 | 33,733 | ||||||
XO Group, Inc.* | 805 | 11,962 | ||||||
Xoom Corp.* | 235 | 6,432 | ||||||
Yelp, Inc.* | 13,885 | 957,371 | ||||||
YuMe, Inc.* | 88 | 656 | ||||||
Zillow, Inc., Class A* | 6,955 | 568,432 | ||||||
Zix Corp.* | 1,858 | 8,472 | ||||||
|
| |||||||
| 8,664,471 | ||||||||
|
| |||||||
IT Services (2.0%) | ||||||||
Acxiom Corp.* | 6,294 | 232,752 | ||||||
Blackhawk Network Holdings, Inc.* | 342 | 8,639 | ||||||
Booz Allen Hamilton Holding Corp. | 864 | 16,546 | ||||||
Broadridge Financial Solutions, Inc. | 3,570 | 141,086 | ||||||
Cardtronics, Inc.* | 1,327 | 57,658 | ||||||
Cass Information Systems, Inc. | 309 | 20,811 | ||||||
CIBER, Inc.* | 51,011 | 211,186 | ||||||
Computer Task Group, Inc. | 461 | 8,713 | ||||||
CSG Systems International, Inc. | 557 | 16,376 | ||||||
DST Systems, Inc. | 821 | 74,498 | ||||||
EPAM Systems, Inc.* | 652 | 22,781 | ||||||
Euronet Worldwide, Inc.* | 1,475 | 70,579 | ||||||
EVERTEC, Inc. | 7,553 | 186,257 | ||||||
ExlService Holdings, Inc.* | 974 | 26,902 | ||||||
FleetCor Technologies, Inc.* | 2,007 | 235,160 | ||||||
Forrester Research, Inc. | 376 | 14,386 | ||||||
Gartner, Inc.* | 2,766 | 196,524 | ||||||
Genpact Ltd.* | 4,979 | 91,464 | ||||||
Global Payments, Inc. | 2,248 | 146,098 | ||||||
Hackett Group, Inc. | 250 | 1,552 | ||||||
Heartland Payment Systems, Inc. | 1,073 | 53,478 | ||||||
Higher One Holdings, Inc.* | 924 | 9,018 | ||||||
iGATE Corp.* | 1,043 | 41,887 | ||||||
Jack Henry & Associates, Inc. | 2,540 | 150,393 | ||||||
Lender Processing Services, Inc. | 2,173 | 81,227 | ||||||
Lionbridge Technologies, Inc.* | 1,644 | 9,798 | ||||||
Luxoft Holding, Inc.* | 115 | 4,368 | ||||||
MAXIMUS, Inc. | 9,051 | 398,153 | ||||||
MoneyGram International, Inc.* | 161 | 3,346 | ||||||
NeuStar, Inc., Class A* | 1,953 | 97,377 | ||||||
Planet Payment, Inc.* | 1,250 | 3,475 | ||||||
Sapient Corp.* | 30,632 | 531,772 | ||||||
ServiceSource International, Inc.* | 1,824 | 15,285 | ||||||
Syntel, Inc.* | 455 | 41,382 | ||||||
TeleTech Holdings, Inc.* | 385 | 9,217 | ||||||
Total System Services, Inc. | 3,730 | 124,134 | ||||||
Unisys Corp.* | 67 | 2,249 | ||||||
Vantiv, Inc., Class A* | 2,595 | 84,623 | ||||||
Virtusa Corp.* | 613 | 23,349 | ||||||
WEX, Inc.* | 1,148 | 113,686 | ||||||
|
| |||||||
| 3,578,185 | ||||||||
|
| |||||||
Office Electronics (0.0%) | ||||||||
Zebra Technologies Corp., Class A* | 136 | 7,355 | ||||||
|
| |||||||
See Notes to Financial Statements.
132
AXA PREMIER VIP TRUST
MULTIMANAGER MID CAP GROWTH PORTFOLIO
PORTFOLIO OF INVESTMENTS (Continued)
December 31, 2013
Number of Shares | Value (Note 1) | |||||||
Semiconductors & Semiconductor Equipment (2.8%) |
| |||||||
Advanced Energy Industries, Inc.* | 1,099 | $ | 25,123 | |||||
Advanced Micro Devices, Inc.* | 17,958 | 69,498 | ||||||
Ambarella, Inc.* | 552 | 18,729 | ||||||
Applied Micro Circuits Corp.* | 2,170 | 29,035 | ||||||
Atmel Corp.* | 12,569 | 98,415 | ||||||
Cabot Microelectronics Corp.* | 656 | 29,979 | ||||||
Cavium, Inc.* | 18,616 | 642,438 | ||||||
Cirrus Logic, Inc.* | 770 | 15,731 | ||||||
Cree, Inc.* | 3,469 | 217,055 | ||||||
Cypress Semiconductor Corp.* | 4,394 | 46,137 | ||||||
Diodes, Inc.* | 837 | 19,720 | ||||||
Entegris, Inc.* | 622 | 7,215 | ||||||
Exar Corp.* | 1,139 | 13,429 | ||||||
Freescale Semiconductor Ltd.* | 761 | 12,214 | ||||||
GT Advanced Technologies, Inc.* | 3,277 | 28,575 | ||||||
Hittite Microwave Corp.* | 934 | 57,656 | ||||||
Inphi Corp.* | 289 | 3,728 | ||||||
Integrated Device Technology, Inc.* | 1,152 | 11,739 | ||||||
Intermolecular, Inc.* | 497 | 2,445 | ||||||
Intersil Corp., Class A | 17,000 | 194,990 | ||||||
Lattice Semiconductor Corp.* | 94,052 | 518,227 | ||||||
LSI Corp. | 1,918 | 21,136 | ||||||
MA-COM Technology Solutions Holdings, Inc.* | 293 | 4,978 | ||||||
MaxLinear, Inc., Class A* | 682 | 7,113 | ||||||
Micrel, Inc. | 1,401 | 13,828 | ||||||
Microsemi Corp.* | 2,137 | 53,318 | ||||||
Monolithic Power Systems, Inc.* | 1,052 | 36,462 | ||||||
MoSys, Inc.* | 1,217 | 6,718 | ||||||
Nanometrics, Inc.* | 15,467 | 294,646 | ||||||
NVE Corp.* | 145 | 8,451 | ||||||
NXP Semiconductor N.V.* | 10,295 | 472,849 | ||||||
OmniVision Technologies, Inc.* | 139 | 2,391 | ||||||
ON Semiconductor Corp.* | 12,688 | 104,549 | ||||||
PDF Solutions, Inc.* | 754 | 19,318 | ||||||
Peregrine Semiconductor Corp.* | 786 | 5,824 | ||||||
PLX Technology, Inc.* | 1,272 | 8,370 | ||||||
PMC-Sierra, Inc.* | 2,607 | 16,763 | ||||||
Power Integrations, Inc. | 7,245 | 404,416 | ||||||
Rambus, Inc.* | 3,335 | 31,583 | ||||||
RF Micro Devices, Inc.* | 7,260 | 37,462 | ||||||
Rubicon Technology, Inc.* | 59 | 587 | ||||||
Rudolph Technologies, Inc.* | 164 | 1,925 | ||||||
Semtech Corp.* | 15,623 | 394,949 | ||||||
Silicon Image, Inc.* | 2,304 | 14,170 | ||||||
Silicon Laboratories, Inc.* | 9,943 | 430,631 | ||||||
Skyworks Solutions, Inc.* | 4,663 | 133,175 | ||||||
SunEdison, Inc.* | 20,439 | 266,729 | ||||||
SunPower Corp.* | 1,197 | 35,683 | ||||||
Teradyne, Inc.* | 15,687 | 276,405 | ||||||
TriQuint Semiconductor, Inc.* | 482 | 4,020 | ||||||
Ultra Clean Holdings, Inc.* | 52 | 522 | ||||||
Ultratech, Inc.* | 830 | 24,070 | ||||||
Veeco Instruments, Inc.* | 263 | 8,655 | ||||||
|
| |||||||
| 5,203,774 | ||||||||
|
| |||||||
Software (6.5%) | ||||||||
ACI Worldwide, Inc.* | 1,180 | 76,700 | ||||||
Activision Blizzard, Inc. | 20,861 | 371,952 | ||||||
Actuate Corp.* | 1,331 | $ | 10,262 | |||||
Advent Software, Inc. | 941 | 32,926 | ||||||
American Software, Inc., Class A | 725 | 7,156 | ||||||
ANSYS, Inc.* | 7,265 | 633,508 | ||||||
Aspen Technology, Inc.* | 10,436 | 436,225 | ||||||
Autodesk, Inc.* | 13,529 | 680,915 | ||||||
AVG Technologies N.V.* | 714 | 12,288 | ||||||
Blackbaud, Inc. | 1,349 | 50,790 | ||||||
Bottomline Technologies (de), Inc.* | 15,898 | 574,872 | ||||||
BroadSoft, Inc.* | 16,370 | 447,556 | ||||||
Cadence Design Systems, Inc.* | 43,847 | 614,735 | ||||||
Callidus Software, Inc.* | 1,213 | 16,654 | ||||||
CommVault Systems, Inc.* | 1,364 | 102,136 | ||||||
Comverse, Inc.* | 664 | 25,763 | ||||||
Concur Technologies, Inc.* | 10,119 | 1,044,078 | ||||||
Cyan, Inc.* | 45 | 238 | ||||||
Digimarc Corp. | 190 | 3,659 | ||||||
Ebix, Inc. | 698 | 10,275 | ||||||
Ellie Mae, Inc.* | 788 | 21,174 | ||||||
EPIQ Systems, Inc. | 52 | 843 | ||||||
ePlus, Inc.* | 7 | 398 | ||||||
FactSet Research Systems, Inc. | 1,296 | 140,720 | ||||||
Fair Isaac Corp. | 1,062 | 66,736 | ||||||
FireEye, Inc.* | 3,385 | 147,620 | ||||||
FleetMatics Group plc* | 9,997 | 432,370 | ||||||
Fortinet, Inc.* | 4,020 | 76,903 | ||||||
Gigamon, Inc.* | 78 | 2,190 | ||||||
Glu Mobile, Inc.* | 1,787 | 6,951 | ||||||
Guidance Software, Inc.* | 487 | 4,919 | ||||||
Guidewire Software, Inc.* | 14,469 | 709,994 | ||||||
Imperva, Inc.* | 603 | 29,022 | ||||||
Infoblox, Inc.* | 10,738 | 354,569 | ||||||
Informatica Corp.* | 9,577 | 397,445 | ||||||
Interactive Intelligence Group, Inc.* | 464 | 31,255 | ||||||
Jive Software, Inc.* | 1,182 | 13,297 | ||||||
Manhattan Associates, Inc.* | 576 | 67,668 | ||||||
MICROS Systems, Inc.* | 351 | 20,137 | ||||||
MicroStrategy, Inc., Class A* | 271 | 33,669 | ||||||
Mitek Systems, Inc.* | 758 | 4,502 | ||||||
Model N, Inc.* | 240 | 2,830 | ||||||
Monotype Imaging Holdings, Inc. | 1,106 | 35,237 | ||||||
NetScout Systems, Inc.* | 1,084 | 32,076 | ||||||
NetSuite, Inc.* | 3,499 | 360,467 | ||||||
Pegasystems, Inc. | 521 | 25,623 | ||||||
Progress Software Corp.* | 725 | 18,727 | ||||||
Proofpoint, Inc.* | 686 | 22,755 | ||||||
PROS Holdings, Inc.* | 673 | 26,853 | ||||||
PTC, Inc.* | 3,499 | 123,830 | ||||||
QAD, Inc., Class A | 119 | 2,101 | ||||||
QAD, Inc., Class B | 37 | 593 | ||||||
Qlik Technologies, Inc.* | 2,580 | 68,705 | ||||||
Qualys, Inc.* | 444 | 10,261 | ||||||
Rally Software Development Corp.* | 206 | 4,007 | ||||||
RealPage, Inc.* | 1,389 | 32,475 | ||||||
Rosetta Stone, Inc.* | 344 | 4,204 | ||||||
Rovi Corp.* | 363 | 7,147 | ||||||
Sapiens International Corp. N.V. | 79 | 609 | ||||||
ServiceNow, Inc.* | 14,032 | 785,932 | ||||||
Silver Spring Networks, Inc.* | 176 | 3,696 | ||||||
See Notes to Financial Statements.
133
AXA PREMIER VIP TRUST
MULTIMANAGER MID CAP GROWTH PORTFOLIO
PORTFOLIO OF INVESTMENTS (Continued)
December 31, 2013
Number of Shares | Value (Note 1) | |||||||
SolarWinds, Inc.* | 1,939 | $ | 73,352 | |||||
Solera Holdings, Inc. | 6,229 | 440,764 | ||||||
Splunk, Inc.* | 5,170 | 355,024 | ||||||
SS&C Technologies Holdings, Inc.* | 1,725 | 76,348 | ||||||
Synchronoss Technologies, Inc.* | 858 | 26,658 | ||||||
Tableau Software, Inc., Class A* | 9,509 | 655,455 | ||||||
Take-Two Interactive Software, Inc.* | 2,394 | 41,584 | ||||||
Tangoe, Inc.* | 928 | 16,713 | ||||||
TIBCO Software, Inc.* | 4,825 | 108,466 | ||||||
TiVo, Inc.* | 1,766 | 23,170 | ||||||
Tyler Technologies, Inc.* | 2,522 | 257,572 | ||||||
Ultimate Software Group, Inc.* | 3,629 | 556,035 | ||||||
VASCO Data Security International, Inc.* | 361 | 2,790 | ||||||
Verint Systems, Inc.* | 1,558 | 66,900 | ||||||
VirnetX Holding Corp.* | 1,263 | 24,515 | ||||||
Vringo, Inc.* | 360 | 1,066 | ||||||
|
| |||||||
| 12,009,610 | ||||||||
|
| |||||||
Total Information Technology | 36,009,423 | |||||||
|
| |||||||
Materials (3.2%) | ||||||||
Chemicals (1.6%) | ||||||||
Advanced Emissions Solutions, Inc.* | 324 | 17,571 | ||||||
Albemarle Corp. | 915 | 58,002 | ||||||
American Pacific Corp.* | 175 | 6,520 | ||||||
American Vanguard Corp. | 857 | 20,817 | ||||||
Arabian American Development Co.* | 550 | 6,902 | ||||||
Balchem Corp. | 878 | 51,539 | ||||||
Calgon Carbon Corp.* | 1,614 | 33,200 | ||||||
Chase Corp. | 57 | 2,012 | ||||||
Chemtura Corp.* | 2,907 | 81,163 | ||||||
Ferro Corp.* | 2,164 | 27,764 | ||||||
Flotek Industries, Inc.* | 1,429 | 28,680 | ||||||
FutureFuel Corp. | 151 | 2,386 | ||||||
H.B. Fuller Co. | 11,354 | 590,862 | ||||||
Hawkins, Inc. | 283 | 10,525 | ||||||
Innophos Holdings, Inc. | 646 | 31,396 | ||||||
Innospec, Inc. | 663 | 30,644 | ||||||
International Flavors & Fragrances, Inc. | 2,400 | 206,352 | ||||||
KMG Chemicals, Inc. | 201 | 3,395 | ||||||
Koppers Holdings, Inc. | 620 | 28,365 | ||||||
Landec Corp.* | 771 | 9,345 | ||||||
LSB Industries, Inc.* | 314 | 12,880 | ||||||
Marrone Bio Innovations, Inc.* | 83 | 1,476 | ||||||
NewMarket Corp. | 278 | 92,894 | ||||||
Olin Corp. | 1,571 | 45,323 | ||||||
OM Group, Inc.* | 62 | 2,257 | ||||||
OMNOVA Solutions, Inc.* | 1,413 | 12,872 | ||||||
Penford Corp.* | 44 | 565 | ||||||
PolyOne Corp. | 18,113 | 640,295 | ||||||
Quaker Chemical Corp. | 2,197 | 169,323 | ||||||
Rockwood Holdings, Inc. | 1,566 | 112,627 | ||||||
RPM International, Inc. | 3,651 | 151,553 | ||||||
Scotts Miracle-Gro Co., Class A | 1,274 | 79,268 | ||||||
Stepan Co. | 336 | 22,052 | ||||||
Taminco Corp.* | 418 | 8,448 | ||||||
Tredegar Corp. | 268 | $ | 7,721 | |||||
Valspar Corp. | 2,627 | 187,279 | ||||||
W.R. Grace & Co.* | 1,950 | 192,796 | ||||||
Westlake Chemical Corp. | 519 | 63,354 | ||||||
Zep, Inc. | 258 | 4,685 | ||||||
|
| |||||||
| 3,055,108 | ||||||||
|
| |||||||
Construction Materials (0.2%) | ||||||||
Eagle Materials, Inc. | 1,455 | 112,661 | ||||||
Headwaters, Inc.* | 2,193 | 21,469 | ||||||
Martin Marietta Materials, Inc. | 1,357 | 135,619 | ||||||
Texas Industries, Inc.* | 606 | 41,681 | ||||||
United States Lime & Minerals, Inc.* | 55 | 3,364 | ||||||
US Concrete, Inc.* | 401 | 9,075 | ||||||
|
| |||||||
| 323,869 | ||||||||
|
| |||||||
Containers & Packaging (0.9%) | ||||||||
AEP Industries, Inc.* | 131 | 6,921 | ||||||
AptarGroup, Inc. | 1,371 | 92,967 | ||||||
Avery Dennison Corp. | 922 | 46,275 | ||||||
Ball Corp. | 4,386 | 226,581 | ||||||
Bemis Co., Inc. | 1,337 | 54,764 | ||||||
Berry Plastics Group, Inc.* | 1,654 | 39,349 | ||||||
Crown Holdings, Inc.* | 3,616 | 161,165 | ||||||
Graphic Packaging Holding Co.* | 5,686 | 54,586 | ||||||
Greif, Inc., Class A | 187 | 9,799 | ||||||
Myers Industries, Inc. | 118 | 2,492 | ||||||
Owens-Illinois, Inc.* | 2,868 | 102,617 | ||||||
Packaging Corp. of America | 2,894 | 183,132 | ||||||
Rock-Tenn Co., Class A | 3,705 | 389,062 | ||||||
Sealed Air Corp. | 5,787 | 197,047 | ||||||
Silgan Holdings, Inc. | 1,305 | 62,666 | ||||||
|
| |||||||
| 1,629,423 | ||||||||
|
| |||||||
Metals & Mining (0.1%) | ||||||||
AMCOL International Corp. | 323 | 10,975 | ||||||
Coeur Mining, Inc.* | 1,140 | 12,369 | ||||||
Compass Minerals International, Inc. | 988 | 79,089 | ||||||
Globe Specialty Metals, Inc. | 114 | 2,053 | ||||||
Gold Resource Corp. | 975 | 4,417 | ||||||
Handy & Harman Ltd.* | 141 | 3,414 | ||||||
Hecla Mining Co. | 1,431 | 4,407 | ||||||
Materion Corp. | 321 | 9,903 | ||||||
Midway Gold Corp.* | 3,069 | 2,486 | ||||||
Olympic Steel, Inc. | 70 | 2,029 | ||||||
Paramount Gold and Silver Corp.* | 4,153 | 3,870 | ||||||
Royal Gold, Inc. | 466 | 21,469 | ||||||
Schnitzer Steel Industries, Inc., Class A . | 40 | 1,307 | ||||||
Tahoe Resources, Inc.* | 330 | 5,491 | ||||||
U.S. Silica Holdings, Inc. | 641 | 21,864 | ||||||
Walter Energy, Inc. | 654 | 10,876 | ||||||
Worthington Industries, Inc. | 1,563 | 65,771 | ||||||
|
| |||||||
| 261,790 | ||||||||
|
| |||||||
Paper & Forest Products (0.4%) | ||||||||
Boise Cascade Co.* | 361 | 10,642 | ||||||
Clearwater Paper Corp.* | 474 | 24,885 | ||||||
See Notes to Financial Statements.
134
AXA PREMIER VIP TRUST
MULTIMANAGER MID CAP GROWTH PORTFOLIO
PORTFOLIO OF INVESTMENTS (Continued)
December 31, 2013
Number of Shares | Value (Note 1) | |||||||
Deltic Timber Corp. | 334 | $ | 22,692 | |||||
KapStone Paper and Packaging Corp.* | 4,422 | 247,013 | ||||||
Louisiana-Pacific Corp.* | 16,172 | 299,344 | ||||||
Neenah Paper, Inc. | 52 | 2,224 | ||||||
P.H. Glatfelter Co. | 1,092 | 30,183 | ||||||
Schweitzer-Mauduit International, Inc. | .670 | 34,485 | ||||||
Wausau Paper Corp. | 1,389 | 17,612 | ||||||
|
| |||||||
| 689,080 | ||||||||
|
| |||||||
Total Materials | 5,959,270 | |||||||
|
| |||||||
Telecommunication Services (0.3%) | ||||||||
Diversified Telecommunication Services (0.3%) |
| |||||||
8x8, Inc.* | 2,531 | 25,715 | ||||||
Atlantic Tele-Network, Inc. | 275 | 15,557 | ||||||
Cbeyond, Inc.* | 35 | 242 | ||||||
Cincinnati Bell, Inc.* | 2,019 | 7,188 | ||||||
Cogent Communications Group, Inc. | 1,396 | 56,412 | ||||||
Consolidated Communications Holdings, Inc. | 1,194 | 23,438 | ||||||
Fairpoint Communications, Inc.* | 537 | 6,073 | ||||||
General Communication, Inc., Class A* . | 948 | 10,570 | ||||||
HickoryTech Corp. | 413 | 5,299 | ||||||
IDT Corp., Class B | 433 | 7,738 | ||||||
inContact, Inc.* | 1,485 | 11,598 | ||||||
Inteliquent, Inc. | 379 | 4,328 | ||||||
Intelsat S.A.* | 39 | 879 | ||||||
Level 3 Communications, Inc.* | 1,609 | 53,371 | ||||||
Lumos Networks Corp. | 465 | 9,765 | ||||||
magicJack VocalTec Ltd.* | 372 | 4,434 | ||||||
Premiere Global Services, Inc.* | 288 | 3,338 | ||||||
Straight Path Communications, Inc., | ||||||||
Class B* | 216 | 1,769 | ||||||
Towerstream Corp.* | 1,548 | 4,582 | ||||||
tw telecom, Inc.* | 4,432 | 135,043 | ||||||
Windstream Holdings, Inc. | 16,494 | 131,622 | ||||||
|
| |||||||
| 518,961 | ||||||||
|
| |||||||
Wireless Telecommunication Services (0.0%) |
| |||||||
Leap Wireless International, Inc.* | 366 | 6,368 | ||||||
NTELOS Holdings Corp. | 460 | 9,306 | ||||||
Shenandoah Telecommunications Co. | 637 | 16,352 | ||||||
|
| |||||||
| 32,026 | ||||||||
|
| |||||||
Total Telecommunication Services | 550,987 | |||||||
|
| |||||||
Utilities (0.2%) | ||||||||
Electric Utilities (0.1%) | ||||||||
ITC Holdings Corp. | 1,565 | 149,958 | ||||||
UNS Energy Corp. | 74 | 4,429 | ||||||
|
| |||||||
| 154,387 | ||||||||
|
| |||||||
Gas Utilities (0.0%) | ||||||||
Questar Corp. | 677 | $ | 15,564 | |||||
South Jersey Industries, Inc. | 179 | 10,017 | ||||||
|
| |||||||
| 25,581 | ||||||||
|
| |||||||
Water Utilities (0.1%) | ||||||||
American States Water Co. | 98 | 2,816 | ||||||
Aqua America, Inc. | 4,537 | 107,028 | ||||||
Pure Cycle Corp.* | 507 | 3,209 | ||||||
SJW Corp. | 129 | 3,843 | ||||||
York Water Co. | 290 | 6,070 | ||||||
|
| |||||||
| 122,966 | ||||||||
|
| |||||||
Total Utilities | 302,934 | |||||||
|
| |||||||
Total Common Stocks (81.7%) | 151,067,642 | |||||||
|
| |||||||
| Number of Rights | Value (Note 1) | |||||||
RIGHTS: | ||||||||
Energy (0.0%) | ||||||||
Oil, Gas & Consumable Fuels (0.0%) |
| |||||||
EXCO Resources, Inc., expiring 1/9/14* | 2,081 | 333 | ||||||
|
| |||||||
| Number of Warrants | Value (Note 1) | |||||||
WARRANTS: | ||||||||
Energy (0.0%) | ||||||||
Oil, Gas & Consumable Fuels (0.0%) |
| |||||||
Magnum Hunter Resources Corp.,expiring 4/15/16*(b) | 162 | — | ||||||
|
| |||||||
Total Energy | — | |||||||
|
| |||||||
Financials (0.0%) | ||||||||
Diversified Financial Services (0.0%) |
| |||||||
Platform Acquisition Holdings Ltd.,expiring 7/31/20* | 10,753 | 8,952 | ||||||
|
| |||||||
Total Financials | 8,952 | |||||||
|
| |||||||
Total Warrants (0.0%) | 8,952 | |||||||
|
| |||||||
Total Investments (81.7%) | 151,076,927 | |||||||
Other Assets Less Liabilities (18.3%) | 33,748,101 | |||||||
|
| |||||||
Net Assets (100%) | $ | 184,825,028 | ||||||
|
| |||||||
| * | Non-income producing. |
| † | Securities (totaling $351,246 or 0.2% of net assets) at fair value by management. |
| (b) | Illiquid security. |
Glossary:
| ADR | — American Depositary Receipt |
See Notes to Financial Statements.
135
AXA PREMIER VIP TRUST
MULTIMANAGER MID CAP GROWTH PORTFOLIO
PORTFOLIO OF INVESTMENTS (Continued)
December 31, 2013
At December 31, 2013, the Portfolio had the following futures contracts open: (Note 1)
Purchases | Number of Contracts | Expiration Date | Original Value | Value at 12/31/2013 | Unrealized Appreciation/ (Depreciation) | |||||||||||||||
NASDAQ 100 E-Mini Index | 44 | March-14 | $ | 3,089,676 | $ | 3,153,700 | $ | 64,024 | ||||||||||||
Russell 2000 Mini Index | 84 | March-14 | 9,257,131 | 9,755,760 | 498,629 | |||||||||||||||
S&P MidCap 400 E-Mini Index | 149 | March-14 | 19,394,581 | 19,957,060 | 562,479 | |||||||||||||||
|
| |||||||||||||||||||
| $ | 1,125,132 | |||||||||||||||||||
|
| |||||||||||||||||||
The following is a summary of the inputs used to value the Portfolio’s assets and liabilities carried at fair value as of December 31, 2013:
The inputs or methodology used for valuing securities are not necessarily an indication of the risk associated with investing in those securities.
Various inputs are used in determining the value of the Portfolio’s investments. These inputs are summarized in the three broad levels listed below:
| Investment Type | Level 1 Quoted Prices in Active Markets for Identical Securities | Level 2 Significant Other Observable Inputs (including quoted prices for similar securities, interest rates, prepayment speeds, credit risk, etc.) | Level 3 Significant Unobservable Inputs (including the Portfolio’s own assumptions in determining the fair value of investments) | Total | ||||||||||||
Assets: | ||||||||||||||||
Common Stocks | ||||||||||||||||
Consumer Discretionary | $ | 31,634,238 | $ | 362,356 | $ | — | $ | 31,996,594 | ||||||||
Consumer Staples | 6,094,770 | — | — | 6,094,770 | ||||||||||||
Energy | 7,433,079 | — | — | 7,433,079 | ||||||||||||
Financials | 10,636,416 | — | 351,246 | 10,987,662 | ||||||||||||
Health Care | 23,454,884 | 272,601 | — | 23,727,485 | ||||||||||||
Industrials | 28,005,438 | — | — | 28,005,438 | ||||||||||||
Information Technology | 36,009,423 | — | — | 36,009,423 | ||||||||||||
Materials | 5,959,270 | — | — | 5,959,270 | ||||||||||||
Telecommunication Services | 550,987 | — | — | 550,987 | ||||||||||||
Utilities | 302,934 | — | — | 302,934 | ||||||||||||
Futures | 1,125,132 | — | — | 1,125,132 | ||||||||||||
Rights | ||||||||||||||||
Energy | 333 | — | — | 333 | ||||||||||||
Warrants | ||||||||||||||||
Energy | — | — | — | — | ||||||||||||
Financials | — | 8,952 | — | 8,952 | ||||||||||||
|
|
|
|
|
|
|
| |||||||||
Total Assets | $ | 151,206,904 | $ | 643,909 | $ | 351,246 | $ | 152,202,059 | ||||||||
|
|
|
|
|
|
|
| |||||||||
Total Liabilities | $ | — | $ | — | $ | — | $ | — | ||||||||
|
|
|
|
|
|
|
| |||||||||
Total | $ | 151,206,904 | $ | 643,909 | $ | 351,246 | $ | 152,202,059 | ||||||||
|
|
|
|
|
|
|
| |||||||||
There were no transfers between Levels 1, 2 or 3 during the year ended December 31, 2013.
See Notes to Financial Statements.
136
AXA PREMIER VIP TRUST
MULTIMANAGER MID CAP GROWTH PORTFOLIO
PORTFOLIO OF INVESTMENTS (Continued)
December 31, 2013
Fair Values of Derivative Instruments as of December 31, 2013:
Statement of Assets and Liabilities | ||||||
Derivatives Not Accounted for as | Asset Derivatives | Fair Value | ||||
Interest rate contracts | Receivables, Net assets - Unrealized appreciation | $ | — | * | ||
Foreign exchange contracts | Receivables | — | ||||
Credit contracts | Receivables | — | ||||
Equity contracts | Receivables, Net assets - Unrealized appreciation | 1,125,132 | * | |||
Commodity contracts | Receivables | — | ||||
Other contracts | Receivables | — | ||||
|
| |||||
Total | $ | 1,125,132 | ||||
|
| |||||
Liability Derivatives | ||||||
Interest rate contracts | Payables, Net assets - Unrealized depreciation | $ | — | * | ||
Foreign exchange contracts | Payables | — | ||||
Credit contracts | Payables | — | ||||
Equity contracts | Payables, Net assets - Unrealized depreciation | — | * | |||
Commodity contracts | Payables | — | ||||
Other contracts | Payables | — | ||||
|
| |||||
Total | $ | — | ||||
|
| |||||
| * | Includes cumulative appreciation/depreciation of futures contracts as reported in the Portfolio of Investments. Only current day’s variation margin is reported within the Statement of Assets & Liabilities. |
The effect of Derivative Instruments on the Statement of Operations for the year ended December 31, 2013:
| Amount of Realized Gain or (Loss) on Derivatives Recognized in Income | ||||||||||||||||||||
Derivatives Not Accounted for as Hedging Instruments^ | Options | Futures | Forward Currency Contracts | Swaps | Total | |||||||||||||||
Interest rate contracts | $ | — | $ | — | $ | — | $ | — | $ | — | ||||||||||
Foreign exchange contracts | — | — | — | — | — | |||||||||||||||
Credit contracts | — | — | — | — | — | |||||||||||||||
Equity contracts | — | 22,902,289 | — | – | 22,902,289 | |||||||||||||||
Commodity contracts | — | — | — | — | — | |||||||||||||||
Other contracts | — | — | — | — | — | |||||||||||||||
|
|
|
|
|
|
|
|
|
| |||||||||||
Total | $ | — | $ | 22,902,289 | $ | — | $ | — | $ | 22,902,289 | ||||||||||
|
|
|
|
|
|
|
|
|
| |||||||||||
| Amount of Unrealized Appreciation or (Depreciation) on Derivatives Recognized in Income | ||||||||||||||||||||
Derivatives Not Accounted for as Hedging Instruments^ | Options | Futures | Forward Currency Contracts | Swaps | Total | |||||||||||||||
Interest rate contracts | $ | — | $ | — | $ | — | $ | — | $ | — | ||||||||||
Foreign exchange contracts | — | — | — | — | — | |||||||||||||||
Credit contracts | — | — | — | — | — | |||||||||||||||
Equity contracts | — | 85,038 | — | — | 85,038 | |||||||||||||||
Commodity contracts | — | — | — | — | — | |||||||||||||||
Other contracts | — | — | — | — | — | |||||||||||||||
|
|
|
|
|
|
|
|
|
| |||||||||||
Total | $ | — | $ | 85,038 | $ | — | $ | — | $ | 85,038 | ||||||||||
|
|
|
|
|
|
|
|
|
| |||||||||||
^ This Portfolio held futures contracts as a substitute for investing in conventional securities, hedging and in an attempt to enhance returns.
The Portfolio held futures contracts with an average notional balance of approximately $68,478,000 during the year ended December 31, 2013.
See Notes to Financial Statements.
137
AXA PREMIER VIP TRUST
MULTIMANAGER MID CAP GROWTH PORTFOLIO
PORTFOLIO OF INVESTMENTS (Continued)
December 31, 2013
The following table presents the Portfolio’s gross derivative assets and liabilities by counterparty net of amounts available for offset under netting arrangements and any related collateral received or pledged by the Portfolio as of December 31, 2013:
Counterparty | Gross Amount of Derivative Assets Presented in the Statement of Assets and Liabilities (a) | Derivatives Available for Offset | Collateral Received | Net Amount Due from Counterparty | ||||||||||||
Exchange Traded Futures & Options Contracts (b) | $ | 1,125,132 | (c) | $ | — | $ | — | $ | 1,125,132 | |||||||
|
|
|
|
|
|
|
| |||||||||
| (a) | For financial reporting purposes the Portfolio does not offset derivative assets and derivative liabilities subject to master netting arrangements in the Statement of Assets and Liabilities. |
| (b) | These derivatives are traded on an exchange, therefore they are not subject to master netting arrangements. |
| (c) | This amount represents the cumulative appreciation (depreciation) of futures contracts as reported in the Portfolio of Investments. The Statement of Assets and Liabilities only reflects the current day variation margin receivable/payable to brokers for futures contracts. |
Investment security transactions for the year ended December 31, 2013 were as follows::
Cost of Purchases: | ||||
Long-term investments other than U.S. government debt securities | $ | 181,224,349 | ||
Net Proceeds of Sales and Redemptions: | ||||
Long-term investments other than U.S. government debt securities | $ | 198,547,632 |
As of December 31, 2013, the gross unrealized appreciation (depreciation) of investments based on the aggregate cost of investments for Federal income tax purposes was as follows:
Aggregate gross unrealized appreciation | $ | 56,387,493 | ||
Aggregate gross unrealized depreciation | (1,861,732 | ) | ||
|
| |||
Net unrealized appreciation | $ | 54,525,761 | ||
|
| |||
Federal income tax cost of investments | $ | 96,551,166 | ||
|
|
For the year ended December 31, 2013, the Portfolio incurred approximately $128 as brokerage commissions with Sanford C. Bernstein & Co., LLC, an affiliated broker/dealer.
The Portfolio utilized net capital loss carryforward of $9,756,813 during 2013.
See Notes to Financial Statements.
138
AXA PREMIER VIP TRUST
MULTIMANAGER MID CAP GROWTH PORTFOLIO
STATEMENT OF ASSETS AND LIABILITIES December 31, 2013
ASSETS | ||||
Investments at value (Cost $95,762,112) | $ | 151,076,927 | ||
Cash | 32,791,452 | |||
Foreign cash (Cost $2) | 2 | |||
Cash held as collateral at broker | 1,414,000 | |||
Due from broker for futures variation margin | 108,310 | |||
Dividends, interest and other receivables | 52,397 | |||
Receivable from Separate Accounts for Trust shares sold | 41,567 | |||
Receivable for securities sold | 37,967 | |||
Other assets | 1,303 | |||
|
| |||
Total assets | 185,523,925 | |||
|
| |||
LIABILITIES | ||||
Payable to Separate Accounts for Trust shares redeemed | 301,861 | |||
Payable for securities purchased | 173,804 | |||
Investment management fees payable | 80,251 | |||
Administrative fees payable | 55,451 | |||
Distribution fees payable - Class B | 25,231 | |||
Trustees’ fees payable | 12,954 | |||
Distribution fees payable - Class A | 3,292 | |||
Accrued expenses | 46,053 | |||
|
| |||
Total liabilities | 698,897 | |||
|
| |||
NET ASSETS | $ | 184,825,028 | ||
|
| |||
Net assets were comprised of: | ||||
Paid in capital | $ | 127,152,528 | ||
Accumulated undistributed net investment income (loss) | 21,123 | |||
Accumulated undistributed net realized gain (loss) on investments, futures and foreign currency transactions | 1,211,430 | |||
Net unrealized appreciation (depreciation) on investments and futures | 56,439,947 | |||
|
| |||
Net assets | $ | 184,825,028 | ||
|
| |||
Class A | ||||
Net asset value, offering and redemption price per share, $15,676,828 / 1,554,788 shares outstanding (unlimited amount authorized: $0.001 par value) | $ | 10.08 | ||
|
| |||
Class B | ||||
Net asset value, offering and redemption price per share, $122,031,972 / 12,618,787 shares outstanding (unlimited amount authorized: $0.001 par value) | $ | 9.67 | ||
|
| |||
Class K | ||||
Net asset value, offering and redemption price per share, $47,116,228 / 4,638,912 shares outstanding (unlimited amount authorized: $0.001 par value) | $ | 10.16 | ||
|
|
STATEMENT OF OPERATIONS
For the Year Ended December 31, 2013
INVESTMENT INCOME | ||||
Dividends (net of $3,625 foreign withholding tax) | $ | 1,516,944 | ||
Interest | 71,168 | |||
|
| |||
Total income | 1,588,112 | |||
|
| |||
EXPENSES | ||||
Investment management fees | 2,849,399 | |||
Distribution fees - Class B | 742,258 | |||
Administrative fees | 566,764 | |||
Custodian fees | 136,000 | |||
Professional fees | 66,773 | |||
Printing and mailing expenses | 52,643 | |||
Distribution fees - Class A | 35,355 | |||
Trustees’ fees | 8,712 | |||
Miscellaneous | 22,110 | |||
|
| |||
Gross expenses | 4,480,014 | |||
Less: Waiver from investment manager | (136,893 | ) | ||
Fees paid indirectly | (10,795 | ) | ||
|
| |||
Net expenses | 4,332,326 | |||
|
| |||
NET INVESTMENT INCOME (LOSS) | (2,744,214 | ) | ||
|
| |||
REALIZED AND UNREALIZED GAIN (LOSS) | ||||
Realized gain (loss) on: | ||||
Investments | 138,214,582 | |||
Futures | 22,902,289 | |||
Foreign currency transactions | (15,223 | ) | ||
|
| |||
Net realized gain (loss) | 161,101,648 | |||
|
| |||
Change in unrealized appreciation (depreciation) on: | ||||
Investments | (28,920,361 | ) | ||
Futures | 85,038 | |||
|
| |||
Net change in unrealized appreciation (depreciation) | (28,835,323 | ) | ||
|
| |||
NET REALIZED AND UNREALIZED GAIN (LOSS) | 132,266,325 | |||
|
| |||
NET INCREASE (DECREASE) IN NET ASSETS RESULTING FROM OPERATIONS | $ | 129,522,111 | ||
|
|
See Notes to Financial Statements.
139
AXA PREMIER VIP TRUST
MULTIMANAGER MID CAP GROWTH PORTFOLIO
STATEMENT OF CHANGES IN NET ASSETS
| Year Ended December 31, | ||||||||
| 2013 | 2012 | |||||||
INCREASE (DECREASE) IN NET ASSETS FROM OPERATIONS: | ||||||||
Net investment income (loss) | $ | (2,744,214 | ) | $ | (2,294,279 | ) | ||
Net realized gain (loss) on investments, futures and foreign currency transactions | 161,101,648 | 44,078,446 | ||||||
Net change in unrealized appreciation (depreciation) on investments and futures | (28,835,323 | ) | 22,753,739 | |||||
|
|
|
| |||||
NET INCREASE (DECREASE) IN NET ASSETS RESULTING FROM OPERATIONS | 129,522,111 | 64,537,906 | ||||||
|
|
|
| |||||
DISTRIBUTIONS: | ||||||||
Distributions from net realized capital gains | ||||||||
Class A | (4,136,710 | ) | — | |||||
Class B | (32,588,099 | ) | — | |||||
Class K | (12,151,832 | ) | — | |||||
|
|
|
| |||||
TOTAL DISTRIBUTIONS | (48,876,641 | ) | — | |||||
|
|
|
| |||||
CAPITAL SHARES TRANSACTIONS: | ||||||||
Class A | ||||||||
Capital shares sold [ 56,278 and 63,099 shares, respectively ] | 661,290 | 609,616 | ||||||
Capital shares issued in reinvestment of distributions [ 427,094 and 0 shares, respectively ] | 4,136,710 | — | ||||||
Capital shares repurchased [ (166,219) and (215,887) shares, respectively ] | (1,917,003 | ) | (2,042,888 | ) | ||||
|
|
|
| |||||
Total Class A transactions | 2,880,997 | (1,433,272 | ) | |||||
|
|
|
| |||||
Class B | ||||||||
Capital shares sold [ 3,776,462 and 4,386,789 shares, respectively ] | 41,265,928 | 40,681,465 | ||||||
Capital shares issued in reinvestment of distributions [ 3,508,234 and 0 shares, respectively ] | 32,588,099 | — | ||||||
Capital shares repurchased [ (5,214,670) and (7,892,480) shares, respectively ] | (57,163,491 | ) | (72,148,514 | ) | ||||
Capital shares repurchased in-kind (Note 10)[ (31,508,327) and 0 shares, respectively ] | (373,483,914 | ) | — | |||||
|
|
|
| |||||
Total Class B transactions | (356,793,378 | ) | (31,467,049 | ) | ||||
|
|
|
| |||||
Class K | ||||||||
Capital shares sold [ 21,981 and 59,306 shares, respectively ] | 252,718 | 558,767 | ||||||
Capital shares issued in reinvestment of distributions [ 1,245,703 and 0 shares, respectively ] | 12,151,832 | — | ||||||
Capital shares repurchased [ (789,505) and (2,573,285) shares, respectively ] | (9,629,663 | ) | (23,046,461 | ) | ||||
Capital shares repurchased in-kind (Note 10)[ (12) and 0 shares, respectively ] | (149 | ) | — | |||||
|
|
|
| |||||
Total Class K transactions | 2,774,738 | (22,487,694 | ) | |||||
|
|
|
| |||||
NET INCREASE (DECREASE) IN NET ASSETS RESULTING FROM CAPITAL SHARE TRANSACTIONS | (351,137,643 | ) | (55,388,015 | ) | ||||
|
|
|
| |||||
TOTAL INCREASE (DECREASE) IN NET ASSETS | (270,492,173 | ) | 9,149,891 | |||||
NET ASSETS: | ||||||||
Beginning of year | 455,317,201 | 446,167,310 | ||||||
|
|
|
| |||||
End of year (a) | $ | 184,825,028 | $ | 455,317,201 | ||||
|
|
|
|
| ||||
(a) Includes accumulated undistributed (overdistributed) net investment income (loss) of | $ | 21,123 | $ | 85,231 | ||||
|
|
|
| |||||
See Notes to Financial Statements.
140
AXA PREMIER VIP TRUST
MULTIMANAGER MID CAP GROWTH PORTFOLIO
FINANCIAL HIGHLIGHTS
| Year Ended December 31, | ||||||||||||||||||||
| Class A | 2013 | 2012 | 2011 | 2010 | 2009 | |||||||||||||||
Net asset value, beginning of year | $ | 9.85 | $ | 8.54 | $ | 9.24 | $ | 7.27 | $ | 5.11 | ||||||||||
|
|
|
|
|
|
|
|
|
| |||||||||||
Income (loss) from investment operations: | ||||||||||||||||||||
Net investment income (loss) | (0.10 | )(e) | (0.05 | )(e) | (0.06 | )(e) | (0.03 | )(e) | — | #(e) | ||||||||||
Net realized and unrealized gain (loss) on investments, futures and foreign currency transactions | 3.91 | 1.36 | (0.64 | ) | 2.00 | 2.16 | ||||||||||||||
|
|
|
|
|
|
|
|
|
| |||||||||||
Total from investment operations | 3.81 | 1.31 | (0.70 | ) | 1.97 | 2.16 | ||||||||||||||
|
|
|
|
|
|
|
|
|
| |||||||||||
Less distributions: | ||||||||||||||||||||
Distributions from net realized gains | (3.58 | ) | — | — | — | �� | — | |||||||||||||
|
|
|
|
|
|
|
|
|
| |||||||||||
Net asset value, end of year | $ | 10.08 | $ | 9.85 | $ | 8.54 | $ | 9.24 | $ | 7.27 | ||||||||||
|
|
|
|
|
|
|
|
|
| |||||||||||
Total return | 40.15 | % | 15.34 | % | (7.58 | )% | 27.10 | % | 42.27 | % | ||||||||||
|
|
|
|
|
|
|
|
|
| |||||||||||
Ratios/Supplemental Data: | ||||||||||||||||||||
Net assets, end of year (000’s) | $ | 15,677 | $ | 12,192 | $ | 11,871 | $ | 78,095 | $ | 84,705 | ||||||||||
Ratio of expenses to average net assets: | ||||||||||||||||||||
After waivers and reimbursements | 1.25 | % | 1.26 | % | 0.99 | % | 1.04 | % | 0.78 | % | ||||||||||
After waivers, reimbursements and fees paid indirectly | 1.25 | % | 1.26 | % | 0.99 | % | 1.03 | % | 0.78 | % | ||||||||||
Before waivers, reimbursements and fees paid indirectly | 1.32 | % | 1.27 | % | 1.01 | % | 1.04 | % | 1.07 | % | ||||||||||
Ratio of net investment income (loss) to average net assets: | ||||||||||||||||||||
After waivers and reimbursements | (0.82 | )% | (0.54 | )% | (0.59 | )% | (0.43 | )% | (0.05 | )% | ||||||||||
After waivers, reimbursements and fees paid indirectly | (0.82 | )% | (0.53 | )% | (0.59 | )% | (0.43 | )% | (0.05 | )% | ||||||||||
Before waivers, reimbursements and fees paid indirectly | (0.89 | )% | (0.54 | )% | (0.60 | )% | (0.44 | )% | (0.34 | )% | ||||||||||
Portfolio turnover rate | 66 | % | 54 | % | 64 | % | 65 | % | 122 | % | ||||||||||
| Year Ended December 31, | ||||||||||||||||||||
| Class B | 2013 | 2012 | 2011 | 2010 | 2009 | |||||||||||||||
Net asset value, beginning of year | $ | 9.56 | $ | 8.28 | $ | 8.99 | $ | 7.08 | $ | 4.99 | ||||||||||
|
|
|
|
|
|
|
|
|
| |||||||||||
Income (loss) from investment operations: | ||||||||||||||||||||
Net investment income (loss) | (0.09 | )(e) | (0.05 | )(e) | (0.07 | )(e) | (0.05 | )(e) | (0.02 | )(e) | ||||||||||
Net realized and unrealized gain (loss) on investments, futures and foreign currency transactions | 3.78 | 1.33 | (0.64 | ) | 1.96 | 2.11 | ||||||||||||||
|
|
|
|
|
|
|
|
|
| |||||||||||
Total from investment operations | 3.69 | 1.28 | (0.71 | ) | 1.91 | 2.09 | ||||||||||||||
|
|
|
|
|
|
|
|
|
| |||||||||||
Less distributions: | ||||||||||||||||||||
Distributions from net realized gains | (3.58 | ) | — | — | — | — | ||||||||||||||
|
|
|
|
|
|
|
|
|
| |||||||||||
Net asset value, end of year | $ | 9.67 | $ | 9.56 | $ | 8.28 | $ | 8.99 | $ | 7.08 | ||||||||||
|
|
|
|
|
|
|
|
|
| |||||||||||
Total return | 40.14 | % | 15.46 | % | (7.90 | )% | 26.98 | % | 41.88 | % | ||||||||||
|
|
|
|
|
|
|
|
|
| |||||||||||
Ratios/Supplemental Data: | ||||||||||||||||||||
Net assets, end of year (000’s. | $ | 122,032 | $ | 402,021 | $ | 377,314 | $ | 464,630 | $ | 394,599 | ||||||||||
Ratio of expenses to average net assets: | ||||||||||||||||||||
After waivers and reimbursements | 1.25 | % | 1.26 | % | 1.24 | %(c) | 1.29 | % | 1.15 | % | ||||||||||
After waivers, reimbursements and fees paid indirectly | 1.25 | % | 1.26 | % | 1.24 | % | 1.28 | % | 1.15 | % | ||||||||||
Before waivers, reimbursements and fees paid indirectly | 1.28 | % | 1.27 | % | 1.26 | %(c) | 1.29 | % | 1.32 | % | ||||||||||
Ratio of net investment income (loss) to average net assets: | ||||||||||||||||||||
After waivers and reimbursements | (0.80 | )% | (0.53 | )% | (0.81 | )% | (0.67 | )% | (0.42 | )% | ||||||||||
After waivers, reimbursements and fees paid indirectly | (0.80 | )% | (0.53 | )% | (0.81 | )% | (0.67 | )% | (0.42 | )% | ||||||||||
Before waivers, reimbursements and fees paid indirectly | (0.83 | )% | (0.54 | )% | (0.82 | )% | (0.68 | )% | (0.59 | )% | ||||||||||
Portfolio turnover rate | 66 | % | 54 | % | 64 | % | 65 | % | 122 | % | ||||||||||
See Notes to Financial Statements.
141
AXA PREMIER VIP TRUST
MULTIMANAGER MID CAP GROWTH PORTFOLIO
FINANCIAL HIGHLIGHTS (Continued)
| Year Ended December 31, | August 26, 2011* to December 31, 2011 | |||||||||||
| Class K | 2013 | 2012 | ||||||||||
Net asset value, beginning of period | $ | 9.88 | $ | 8.54 | $ | 8.22 | ||||||
|
|
|
|
|
| |||||||
Income (loss) from investment operations: | ||||||||||||
Net investment income (loss) | (0.07 | )(e) | (0.03 | )(e) | (0.01 | )(e) | ||||||
Net realized and unrealized gain (loss) on investments, futures and foreign currency transactions | 3.93 | 1.37 | 0.33 | |||||||||
|
|
|
|
|
| |||||||
Total from investment operations | 3.86 | 1.34 | 0.32 | |||||||||
|
|
|
|
|
| |||||||
Less distributions: | ||||||||||||
Distributions from net realized gains | (3.58 | ) | — | — | ||||||||
|
|
|
|
|
| |||||||
Net asset value, end of period | $ | 10.16 | $ | 9.88 | $ | 8.54 | ||||||
|
|
|
|
|
| |||||||
Total return (b) | 40.57 | % | 15.69 | % | 3.89 | % | ||||||
|
|
|
|
|
| |||||||
Ratios/Supplemental Data: | ||||||||||||
Net assets, end of period (000’s) | $ | 47,116 | $ | 41,104 | $ | 56,983 | ||||||
Ratio of expenses to average net assets: | ||||||||||||
After waivers and reimbursements (a) | 1.00 | % | 1.01 | % | 1.00 | % | ||||||
After waivers, reimbursements and fees paid indirectly (a) | 1.00 | % | 1.01 | % | 1.00 | % | ||||||
Before waivers, reimbursements and fees paid indirectly (a) | 1.07 | % | 1.02 | % | 1.01 | %(c) | ||||||
Ratio of net investment income (loss) to average net assets: | ||||||||||||
After waivers and reimbursements (a) | (0.57 | )% | (0.29 | )% | (0.48 | )% | ||||||
After waivers, reimbursements and fees paid indirectly (a) | (0.56 | )% | (0.29 | )% | (0.48 | )% | ||||||
Before waivers, reimbursements and fees paid indirectly (a) | (0.64 | )% | (0.30 | )% | (0.48 | )% | ||||||
Portfolio turnover rate | 66 | % | 54 | % | 64 | % | ||||||
| * | Commencement of Operations. |
| # | Per share amount is less than $0.005. |
| (a) | Ratios for periods less than one year are annualized. |
| (b) | Total returns for periods less than one year are not annualized. |
| (c) | Reflects overall fund ratios for non-class specific expenses. |
| (e) | Net investment income (loss) per share is based on average shares outstanding. |
See Notes to Financial Statements.
142
MULTIMANAGER MID CAP VALUE PORTFOLIO (Unaudited)
PORTFOLIO ADVISERS
| Ø | BlackRock Investment Management, LLC |
| Ø | Diamond Hill Capital Management, Inc. |
| Ø | Knightsbridge Asset Management LLC |
| Ø | Lord, Abbett & Co. LLC |
PERFORMANCE RESULTS

| Annualized Total Returns as of 12/31/13 | ||||||||||||
| 1 Year | 5 Years | 10 Years/ Since Incept. | ||||||||||
Portfolio – Class A Shares* | 35.64 | % | 19.67 | % | 8.48 | % | ||||||
Portfolio – Class B Shares* | 35.50 | 19.47 | 8.26 | |||||||||
Portfolio – Class K Shares** | 35.98 | N/A | 21.27 | |||||||||
Russell 2500TM Value Index | 33.32 | 19.61 | 9.29 | |||||||||
Volatility Managed Index – Mid Cap Value 2500 | 33.07 | 17.29 | 11.24 | |||||||||
* Date of inception 12/31/01.
** Date of inception 8/26/11.
Returns for periods greater than one year are annualized. |
| |||||||||||
Past performance is not indicative of future results.
PERFORMANCE SUMMARY
The Portfolio’s Class A shares returned 35.64% for the year ended December 31, 2013. The Portfolio’s benchmarks, the Russell 2500TM Value Index, returned 33.32%, and the Volatility Managed Index — Mid Cap Value 2500 returned 33.07%, over the same period.
The following commentary describes key factors (such as stock selection and sector allocation decisions) that helped or hurt the Portfolio’s performance relative to its primary benchmark.
Portfolio Highlights
For the year ended December 31, 2013
What helped performance during the year:
| • | Stock selection within the Financials sector was a key contributor to the Portfolio’s relative performance. Notable holdings within the sector included MGIC Investment Corp., Howard Hughes Corp. and Assured Guaranty Ltd. |
| • | Within the Energy sector, strong results were provided by holdings in Cimarex Energy Co., an exploration and production company that has assets in the West Texas area that are providing higher production growth, and lower costs of extraction versus initial forecasts. |
| • | A significant underweight in the Utilities sector also added to the Portfolio’s relative outperformance. |
| • | Other notable individual relative contributors included Sealed Air Corp., New York Times, Southwest Airlines, Boston Scientific Corp. and Forest Laboratories, Inc. |
What hurt performance during the year:
| • | Weak stock selection within the Consumer Staples sector was a major detractor from relative performance during the period. |
| • | The biggest detractors from individual performance were Barrick Gold, Layne Christensen Co., Quest Diagnostics Inc., Orthofix International N.V., Chemtura Corp. and Central European Distribution Corp. |
| • | Underweight positions in the Industrials and Consumer Discretionary sectors were also detrimental. |
| Sector Weightings as of December 31, 2013 | % of Net Assets | |||
Financials | 27.0 | % | ||
Consumer Discretionary | 10.6 | |||
Industrials | 10.6 | |||
Information Technology | 6.9 | |||
Energy | 5.9 | |||
Health Care | 5.9 | |||
Consumer Staples | 4.6 | |||
Materials | 4.0 | |||
Utilities | 3.8 | |||
Telecommunication Services | 0.3 | |||
Cash and Other | 20.4 | |||
|
| |||
| 100.0 | % | |||
|
| |||
143
MULTIMANAGER MID CAP VALUE PORTFOLIO (Unaudited)
UNDERSTANDING YOUR EXPENSES:
As a shareholder of the Portfolio, you incur two types of costs:
(1)transaction costs, including applicable sales charges and redemption fees; and (2)ongoing costs, including management fees, distribution (12b-1) fees (in the case of Class A and Class B shares of the Trust), and other Portfolio expenses. These examples are intended to help you understand your ongoing costs (in dollars) of investing in the Portfolio and to compare these costs with the ongoing costs of investing in other mutual funds.
The examples are based on an investment of $1,000 invested at the beginning of the six-month period ended December 31, 2013 and held for the entire six-month period.
Actual Expenses
The first line of the table to the right provides information about actual account values and actual expenses. You may use the information in this line, together with the amount you invested, to estimate the expenses that you paid over the period. Simply divide your account value by $1,000 (for example, an $8,600 account value divided by $1,000 = 8.6), then multiply the result by the number in the first line under the heading entitled ‘‘Expenses Paid During Period’’ to estimate the expenses you paid on your account during this period.
Hypothetical Example for Comparison Purposes
The second line of the table below provides information about hypothetical account values and hypothetical expenses based on the Portfolio’s actual expense ratio and an assumed rate of return of 5% per year before expenses, which is not the Portfolio’s actual return. The hypothetical account values and expenses may not be used to estimate the actual ending account balance or expenses you paid for the period. You may use this information to compare the ongoing costs of investing in the Portfolio and other funds. To do so, compare this 5% hypothetical example with the 5% hypothetical examples that appear in the shareholder reports of the other funds.
Please note that the expenses shown in the table are meant to highlight your ongoing costs only and do not reflect any transactional costs, such as sales charges (loads), redemption fees, or exchange fees. Therefore, the second line of the table is useful in comparing ongoing costs only, and will not help you determine the relative total costs of owning different funds. In addition, if these transactional costs were included, your costs would have been higher. Also note that the table does not reflect any variable life insurance or variable annuity contract-related fees and expenses, which would increase overall fees and expenses.
EXAMPLE
| Beginning Account Value 7/1/13 | Ending Account Value 12/31/13 | Expenses Paid 12/31/13 | ||||||||||
Class A | ||||||||||||
Actual | $1,000.00 | $1,165.97 | $6.83 | |||||||||
Hypothetical (5% average annual return before expenses) | 1,000.00 | 1,018.90 | 6.37 | |||||||||
Class B | ||||||||||||
Actual | 1,000.00 | 1,165.67 | 6.83 | |||||||||
Hypothetical (5% average annual return before expenses) | 1,000.00 | 1,018.90 | 6.36 | |||||||||
Class K | ||||||||||||
Actual | 1,000.00 | 1,167.88 | 5.47 | |||||||||
Hypothetical (5% average annual return before expenses) | 1,000.00 | 1,020.16 | 5.10 | |||||||||
* Expenses are equal to the Portfolio’s Class A, Class B and Class K shares annualized expense ratios of 1.25%, 1.25% and 1.00%, respectively, multiplied by the average account value over the period, and multiplied by 184/365 (to reflect the one-half year period). |
| |||||||||||
144
AXA PREMIER VIP TRUST
MULTIMANAGER MID CAP VALUE PORTFOLIO
PORTFOLIO OF INVESTMENTS
December 31, 2013
| Number of Shares | Value (Note 1) | |||||||
COMMON STOCKS: | ||||||||
Consumer Discretionary (10.6%) | ||||||||
Auto Components (0.5%) | ||||||||
Allison Transmission Holdings, Inc. | 1,125 | $ | 31,061 | |||||
American Axle & Manufacturing Holdings, Inc.* | 806 | 16,483 | ||||||
Cooper Tire & Rubber Co. | 2,125 | 51,085 | ||||||
Dana Holding Corp. | 5,125 | 100,553 | ||||||
Federal-Mogul Corp.* | 705 | 13,874 | ||||||
Fox Factory Holding Corp.* | 218 | 3,841 | ||||||
Fuel Systems Solutions, Inc.* | 546 | 7,573 | ||||||
Gentex Corp. | 2,353 | 77,625 | ||||||
Lear Corp. | 2,717 | 219,995 | ||||||
Modine Manufacturing Co.* | 1,816 | 23,281 | ||||||
Remy International, Inc. | 526 | 12,266 | ||||||
Shiloh Industries, Inc.* | 199 | 3,881 | ||||||
Spartan Motors, Inc. | 1,245 | 8,342 | ||||||
Standard Motor Products, Inc. | 226 | 8,317 | ||||||
Stoneridge, Inc.* | 192 | 2,448 | ||||||
Superior Industries International, Inc. | 801 | 16,525 | ||||||
Tenneco, Inc.* | 3,957 | 223,847 | ||||||
TRW Automotive Holdings Corp.* | 4,094 | 304,553 | ||||||
|
| |||||||
| 1,125,550 | ||||||||
|
| |||||||
Distributors (0.0%) | ||||||||
Core-Mark Holding Co., Inc. | 381 | 28,929 | ||||||
Stock Building Supply Holdings, Inc.* | 80 | 1,458 | ||||||
VOXX International Corp.* | 687 | 11,473 | ||||||
Weyco Group, Inc. | 256 | 7,534 | ||||||
|
| |||||||
| 49,394 | ||||||||
|
| |||||||
Diversified Consumer Services (0.6%) |
| |||||||
Apollo Education Group, Inc., | 3,706 | 101,248 | ||||||
Ascent Capital Group, Inc., Class A* | 476 | 40,727 | ||||||
Bridgepoint Education, Inc.* | 671 | 11,883 | ||||||
Career Education Corp.* | 2,106 | 12,004 | ||||||
Corinthian Colleges, Inc.* | 3,036 | 5,404 | ||||||
DeVry Education Group, Inc. | 2,393 | 84,952 | ||||||
Hillenbrand, Inc. | 6,922 | 203,645 | ||||||
Lincoln Educational Services Corp. | 679 | 3,382 | ||||||
Mac-Gray Corp. | 410 | 8,704 | ||||||
Matthews International Corp., Class A | 571 | 24,330 | ||||||
Regis Corp. | 1,750 | 25,393 | ||||||
Service Corp. International | 1,795 | 32,543 | ||||||
Steiner Leisure Ltd.* | 15,654 | 770,020 | ||||||
Universal Technical Institute, Inc. | 800 | 11,128 | ||||||
Weight Watchers International, Inc. | 470 | 15,477 | ||||||
|
| |||||||
| 1,350,840 | ||||||||
|
| |||||||
Hotels, Restaurants & Leisure (0.5%) |
| |||||||
Biglari Holdings, Inc.* | 56 | 28,372 | ||||||
Bob Evans Farms, Inc. | 936 | 47,352 | ||||||
Bravo Brio Restaurant Group, Inc.* | 51 | $ | 830 | |||||
Caesars Entertainment Corp.* | 168 | 3,619 | ||||||
Carrols Restaurant Group, Inc.* | 881 | 5,823 | ||||||
Choice Hotels International, Inc. | 986 | 48,422 | ||||||
Del Frisco’s Restaurant Group, Inc.* | 231 | 5,445 | ||||||
Denny’s Corp.* | 753 | 5,414 | ||||||
Diamond Resorts International, Inc.* | 379 | 6,996 | ||||||
DineEquity, Inc. | 303 | 25,316 | ||||||
Einstein Noah Restaurant Group, Inc. | 53 | 768 | ||||||
International Speedway Corp., Class A | 1,029 | 36,519 | ||||||
Isle of Capri Casinos, Inc.* | 773 | 6,957 | ||||||
Jack in the Box, Inc.* | 354 | 17,707 | ||||||
Life Time Fitness, Inc.* | 7,730 | 363,310 | ||||||
Luby’s, Inc.* | 794 | 6,130 | ||||||
Marcus Corp. | 744 | 9,999 | ||||||
Marriott Vacations Worldwide Corp.* | 1,110 | 58,564 | ||||||
Monarch Casino & Resort, Inc.* | 171 | 3,434 | ||||||
Morgans Hotel Group Co.* | 580 | 4,715 | ||||||
Noodles & Co.* | 70 | 2,514 | ||||||
Orient-Express Hotels Ltd., | 3,607 | 54,502 | ||||||
Penn National Gaming, Inc.* | 2,526 | 36,198 | ||||||
Pinnacle Entertainment, Inc.* | 180 | 4,678 | ||||||
Red Robin Gourmet Burgers, Inc.* | 4,363 | 320,855 | ||||||
Ruby Tuesday, Inc.* | 2,357 | 16,334 | ||||||
Scientific Games Corp., Class A* | 456 | 7,720 | ||||||
Sonic Corp.* | 426 | 8,601 | ||||||
Speedway Motorsports, Inc. | 465 | 9,230 | ||||||
Town Sports International Holdings, Inc. | 889 | 13,122 | ||||||
Wendy’s Co. | 10,766 | 93,880 | ||||||
|
| |||||||
| 1,253,326 | ||||||||
|
| |||||||
Household Durables (2.5%) | ||||||||
Bassett Furniture Industries, Inc. | 385 | 5,883 | ||||||
Beazer Homes USA, Inc.* | 431 | 10,525 | ||||||
Blyth, Inc. | 125,000 | 1,360,000 | ||||||
Cavco Industries, Inc.* | 30 | 2,061 | ||||||
CSS Industries, Inc. | 326 | 9,350 | ||||||
D.R. Horton, Inc.* | 10,749 | 239,918 | ||||||
Ethan Allen Interiors, Inc. | 135 | 4,107 | ||||||
Flexsteel Industries, Inc. | 173 | 5,316 | ||||||
Harman International Industries, Inc. | 2,598 | 212,646 | ||||||
Helen of Troy Ltd.* | 1,196 | 59,214 | ||||||
Hooker Furniture Corp. | 423 | 7,056 | ||||||
Hovnanian Enterprises, Inc., | 1,318 | 8,725 | ||||||
Jarden Corp.* | 23,814 | 1,460,989 | ||||||
La-Z-Boy, Inc. | 1,459 | 45,229 | ||||||
Leggett & Platt, Inc. | 5,466 | 169,118 | ||||||
Lennar Corp., Class A | 7,712 | 305,087 | ||||||
Lifetime Brands, Inc. | 392 | 6,166 | ||||||
M.D.C. Holdings, Inc.* | 1,176 | 37,914 | ||||||
M/I Homes, Inc.* | 680 | 17,306 | ||||||
See Notes to Financial Statements.
145
AXA PREMIER VIP TRUST
MULTIMANAGER MID CAP VALUE PORTFOLIO
PORTFOLIO OF INVESTMENTS (Continued)
December 31, 2013
| Number of Shares | Value (Note 1) | |||||||
Meritage Homes Corp.* | 252 | $ | 12,093 | |||||
Mohawk Industries, Inc.* | 7,410 | 1,103,349 | ||||||
NACCO Industries, Inc., Class A | 170 | 10,572 | ||||||
NVR, Inc.* | 32 | 32,832 | ||||||
Skullcandy, Inc.* | 686 | 4,946 | ||||||
Standard Pacific Corp.* | 5,596 | 50,644 | ||||||
Taylor Morrison Home Corp., | 149 | 3,345 | ||||||
Toll Brothers, Inc.* | 6,466 | 239,242 | ||||||
TRI Pointe Homes, Inc.* | 563 | 11,221 | ||||||
UCP, Inc., Class A* | 203 | 2,972 | ||||||
Universal Electronics, Inc.* | 526 | 20,046 | ||||||
WCI Communities, Inc.* | 115 | 2,195 | ||||||
Whirlpool Corp. | 2,608 | 409,091 | ||||||
Zagg, Inc.* | 1,190 | 5,176 | ||||||
|
| |||||||
| 5,874,334 | ||||||||
|
| |||||||
Internet & Catalog Retail (0.0%) | ||||||||
1-800-FLOWERS.COM, Inc., | 255 | 1,380 | ||||||
FTD Cos., Inc.* | 716 | 23,327 | ||||||
RetailMeNot, Inc.* | 124 | 3,570 | ||||||
ValueVision Media, Inc., Class A* | 186 | 1,300 | ||||||
zulily, Inc., Class A* | 237 | 9,819 | ||||||
|
| |||||||
| 39,396 | ||||||||
|
| |||||||
Leisure Equipment & Products (0.3%) |
| |||||||
Black Diamond, Inc.* | 860 | 11,464 | ||||||
Brunswick Corp. | 9,389 | 432,457 | ||||||
Callaway Golf Co. | 27,862 | 234,877 | ||||||
JAKKS Pacific, Inc. | 793 | 5,337 | ||||||
Johnson Outdoors, Inc., Class A | 205 | 5,525 | ||||||
LeapFrog Enterprises, Inc.* | 2,457 | 19,508 | ||||||
|
| |||||||
| 709,168 | ||||||||
|
| |||||||
Media (2.7%) | ||||||||
AH Belo Corp., Class A | 682 | 5,095 | ||||||
Beasley Broadcasting Group, Inc., Class A | 157 | 1,371 | ||||||
Carmike Cinemas, Inc.* | 639 | 17,790 | ||||||
Central European Media Enterprises Ltd., Class A* | 2,923 | 11,224 | ||||||
Crown Media Holdings, Inc., Class A* | 1,146 | 4,045 | ||||||
Cumulus Media, Inc., Class A* | 692 | 5,349 | ||||||
Daily Journal Corp.* | 40 | 7,400 | ||||||
Dex Media, Inc.* | 663 | 4,495 | ||||||
Digital Generation, Inc.* | 905 | 11,539 | ||||||
DreamWorks Animation SKG, Inc., Class A* | 2,821 | 100,145 | ||||||
Entercom Communications Corp., Class A* | 923 | 9,701 | ||||||
EW Scripps Co., Class A* | 1,200 | 26,064 | ||||||
Gannett Co., Inc. | 70,231 | 2,077,433 | ||||||
Global Sources Ltd.* | 642 | 5,219 | ||||||
Graham Holdings Co., Class B* | 167 | 110,774 | ||||||
Gray Television, Inc.* | 1,794 | 26,695 | ||||||
Harte-Hanks, Inc. | 1,649 | 12,895 | ||||||
Interpublic Group of Cos., Inc. | 32,561 | 576,330 | ||||||
John Wiley & Sons, Inc., Class A | 1,714 | $ | 94,613 | |||||
Journal Communications, Inc., | 1,680 | 15,641 | ||||||
Live Nation Entertainment, Inc.* | 5,348 | 105,676 | ||||||
Martha Stewart Living Omnimedia, Inc., | ||||||||
Class A* | 820 | 3,444 | ||||||
McClatchy Co., Class A* | 508 | 1,727 | ||||||
MDC Partners, Inc., Class A | 954 | 24,337 | ||||||
Media General, Inc., Class A* | 734 | 16,588 | ||||||
Meredith Corp. | 1,361 | 70,500 | ||||||
National CineMedia, Inc. | 1,614 | 32,215 | ||||||
New York Times Co., Class A | 177,833 | 2,822,210 | ||||||
Reading International, Inc., Class A* | 706 | 5,288 | ||||||
Regal Entertainment Group, Class A | 2,507 | 48,761 | ||||||
Rentrak Corp.* | 37 | 1,402 | ||||||
Saga Communications, Inc., Class A | 138 | 6,941 | ||||||
Salem Communications Corp., Class A | 410 | 3,567 | ||||||
Scholastic Corp. | 972 | 33,058 | ||||||
Speed Commerce, Inc.* | 1,773 | 8,280 | ||||||
Starz, Class A* | 469 | 13,714 | ||||||
Valassis Communications, Inc. | 1,501 | 51,409 | ||||||
World Wrestling Entertainment, Inc., Class A | 971 | 16,099 | ||||||
|
| |||||||
| 6,389,034 | ||||||||
|
| |||||||
Multiline Retail (0.8%) | ||||||||
Big Lots, Inc.* | 1,620 | 52,310 | ||||||
Bon-Ton Stores, Inc. | 40 | 651 | ||||||
Burlington Stores, Inc.* | 260 | 8,320 | ||||||
Dillard’s, Inc., Class A | 342 | 33,246 | ||||||
Fred’s, Inc., Class A | 1,407 | 26,057 | ||||||
Gordmans Stores, Inc. | 255 | 1,956 | ||||||
J.C. Penney Co., Inc.* | 9,051 | 82,817 | ||||||
Sears Holdings Corp.* | 36,665 | 1,798,051 | ||||||
Tuesday Morning Corp.* | 1,654 | 26,398 | ||||||
|
| |||||||
| 2,029,806 | ||||||||
|
| |||||||
Specialty Retail (2.3%) | ||||||||
Aaron’s, Inc. | 44,382 | 1,304,831 | ||||||
Abercrombie & Fitch Co., Class A | 2,618 | 86,158 | ||||||
American Eagle Outfitters, Inc. | 2,654 | 38,218 | ||||||
America’s Car-Mart, Inc.* | 71 | 2,998 | ||||||
Asbury Automotive Group, Inc.* | 145 | 7,792 | ||||||
Ascena Retail Group, Inc.* | 4,130 | 87,391 | ||||||
Barnes & Noble, Inc.* | 1,464 | 21,887 | ||||||
bebe stores, Inc. | 1,322 | 7,033 | ||||||
Body Central Corp.* | 628 | 2,474 | ||||||
Brown Shoe Co., Inc. | 598 | 16,828 | ||||||
Cato Corp., Class A | 856 | 27,221 | ||||||
Chico’s FAS, Inc. | 16,894 | 318,283 | ||||||
Children’s Place Retail Stores, Inc.* | 590 | 33,612 | ||||||
Citi Trends, Inc.* | 555 | 9,435 | ||||||
Container Store Group, Inc.* | 244 | 11,373 | ||||||
CST Brands, Inc. | 10,492 | 385,266 | ||||||
See Notes to Financial Statements.
146
AXA PREMIER VIP TRUST
MULTIMANAGER MID CAP VALUE PORTFOLIO
PORTFOLIO OF INVESTMENTS (Continued)
December 31, 2013
| Number of Shares | Value (Note 1) | |||||||
Destination Maternity Corp. | 58 | $ | 1,733 | |||||
Destination XL Group, Inc.* | 1,613 | 10,597 | ||||||
Dick’s Sporting Goods, Inc. | 5,171 | 300,435 | ||||||
DSW, Inc., Class A | 252 | 10,768 | ||||||
Finish Line, Inc., Class A | 1,202 | 33,860 | ||||||
Foot Locker, Inc. | 5,046 | 209,106 | ||||||
GameStop Corp., Class A | 4,539 | 223,591 | ||||||
Genesco, Inc.* | 262 | 19,142 | ||||||
Group 1 Automotive, Inc. | 824 | 58,521 | ||||||
Guess?, Inc. | 2,251 | 69,939 | ||||||
Haverty Furniture Cos., Inc. | 558 | 17,465 | ||||||
hhgregg, Inc.* | 498 | 6,957 | ||||||
Jos. A. Bank Clothiers, Inc.* | 900 | 49,257 | ||||||
Kirkland’s, Inc.* | 172 | 4,071 | ||||||
MarineMax, Inc.* | 894 | 14,376 | ||||||
Men’s Wearhouse, Inc. | 1,805 | 92,199 | ||||||
New York & Co., Inc.* | 424 | 1,853 | ||||||
Office Depot, Inc.* | 15,922 | 84,227 | ||||||
Pacific Sunwear of California, Inc.* | 240 | 802 | ||||||
Penske Automotive Group, Inc. | 5,816 | 274,283 | ||||||
PEP Boys-Manny, Moe & Jack* | 2,051 | 24,899 | ||||||
RadioShack Corp.* | 3,919 | 10,189 | ||||||
Rent-A-Center, Inc. | 2,014 | 67,147 | ||||||
Sears Hometown and Outlet Stores, Inc.* | 121 | 3,086 | ||||||
Select Comfort Corp.* | 135 | 2,847 | ||||||
Shoe Carnival, Inc. | 579 | 16,797 | ||||||
Signet Jewelers Ltd. | 2,809 | 221,068 | ||||||
Sonic Automotive, Inc., Class A | 1,077 | 26,365 | ||||||
Stage Stores, Inc. | 1,263 | 28,064 | ||||||
Staples, Inc. | 57,771 | 917,981 | ||||||
Stein Mart, Inc. | 529 | 7,115 | ||||||
Systemax, Inc.* | 303 | 3,409 | ||||||
Trans World Entertainment Corp.* | 313 | 1,384 | ||||||
Urban Outfitters, Inc.* | 5,000 | 185,500 | ||||||
West Marine, Inc.* | 632 | 8,993 | ||||||
Zale Corp.* | 1,249 | 19,697 | ||||||
|
| |||||||
| 5,388,523 | ||||||||
|
| |||||||
Textiles, Apparel & Luxury Goods (0.4%) |
| |||||||
American Apparel, Inc.* | 2,165 | 2,663 | ||||||
Columbia Sportswear Co. | 497 | 39,139 | ||||||
Crocs, Inc.* | 467 | 7,435 | ||||||
Culp, Inc. | 51 | 1,043 | ||||||
Deckers Outdoor Corp.* | 751 | 63,429 | ||||||
Fifth & Pacific Cos., Inc.* | 4,555 | 146,079 | ||||||
G-III Apparel Group Ltd.* | 163 | 12,028 | ||||||
Iconix Brand Group, Inc.* | 1,047 | 41,566 | ||||||
Jones Group, Inc. | 3,001 | 44,895 | ||||||
Movado Group, Inc. | 646 | 28,430 | ||||||
Perry Ellis International, Inc.* | 487 | 7,690 | ||||||
PVH Corp. | 2,747 | 373,647 | ||||||
Quiksilver, Inc.* | 1,413 | 12,392 | ||||||
R.G. Barry Corp. | 392 | 7,565 | ||||||
Skechers U.S.A., Inc., Class A* | 1,499 | 49,662 | ||||||
Unifi, Inc.* | 571 | 15,554 | ||||||
|
| |||||||
| 853,217 | ||||||||
|
| |||||||
Total Consumer Discretionary | 25,062,588 | |||||||
|
| |||||||
Consumer Staples (4.6%) | ||||||||
Beverages (0.6%) | ||||||||
Beam, Inc. | 5,848 | $ | 398,015 | |||||
Craft Brew Alliance, Inc.* | 253 | 4,154 | ||||||
Molson Coors Brewing Co., Class B | 16,459 | 924,173 | ||||||
|
| |||||||
| 1,326,342 | ||||||||
|
| |||||||
Food & Staples Retailing (0.5%) | ||||||||
Andersons, Inc. | 709 | 63,222 | ||||||
Fairway Group Holdings Corp.* | 350 | 6,342 | ||||||
Harris Teeter Supermarkets, Inc. | 21,246 | 1,048,490 | ||||||
Ingles Markets, Inc., Class A | 426 | 11,545 | ||||||
Pantry, Inc.* | 806 | 13,525 | ||||||
Rite Aid Corp.* | 10,864 | 54,972 | ||||||
Roundy’s, Inc. | 977 | 9,633 | ||||||
Spartan Stores, Inc. | 1,362 | 33,069 | ||||||
Sprouts Farmers Market, Inc.* | 232 | 8,916 | ||||||
SUPERVALU, Inc.* | 2,013 | 14,675 | ||||||
Village Super Market, Inc., Class A | 53 | 1,643 | ||||||
Weis Markets, Inc. | 395 | 20,761 | ||||||
|
| |||||||
| 1,286,793 | ||||||||
|
| |||||||
Food Products (2.9%) | ||||||||
Alico, Inc. | 14 | 544 | ||||||
B&G Foods, Inc. | 26,705 | 905,566 | ||||||
Boulder Brands, Inc.* | 152 | 2,411 | ||||||
Bunge Ltd. | 5,064 | 415,805 | ||||||
Cal-Maine Foods, Inc. | 83 | 4,999 | ||||||
Chiquita Brands International, Inc.* | 1,794 | 20,990 | ||||||
ConAgra Foods, Inc. | 40,234 | 1,355,886 | ||||||
Darling International, Inc.* | 4,407 | 92,018 | ||||||
Dean Foods Co.* | 3,528 | 60,646 | ||||||
Diamond Foods, Inc.* | 847 | 21,886 | ||||||
Flowers Foods, Inc. | 20,507 | 440,285 | ||||||
Fresh Del Monte Produce, Inc. | 1,403 | 39,705 | ||||||
Griffin Land & Nurseries, Inc. | 102 | 3,405 | ||||||
Ingredion, Inc. | 2,603 | 178,201 | ||||||
John B. Sanfilippo & Son, Inc. | 321 | 7,922 | ||||||
Omega Protein Corp.* | 751 | 9,230 | ||||||
Pinnacle Foods, Inc. | 10,932 | 300,193 | ||||||
Post Holdings, Inc.* | 59,149 | 2,914,271 | ||||||
Seaboard Corp.* | 10 | 27,950 | ||||||
Seneca Foods Corp., Class A* | 304 | 9,695 | ||||||
Snyders-Lance, Inc. | 1,518 | 43,597 | ||||||
Tootsie Roll Industries, Inc. | 15 | 488 | ||||||
TreeHouse Foods, Inc.* | 492 | 33,909 | ||||||
|
| |||||||
| 6,889,602 | ||||||||
|
| |||||||
Household Products (0.6%) | ||||||||
Central Garden & Pet Co., Class A* | 1,407 | 9,497 | ||||||
Energizer Holdings, Inc. | 11,643 | 1,260,238 | ||||||
Harbinger Group, Inc.* | 1,275 | 15,109 | ||||||
Oil-Dri Corp. of America | 147 | 5,563 | ||||||
Orchids Paper Products Co. | 48 | 1,576 | ||||||
|
| |||||||
| 1,291,983 | ||||||||
|
| |||||||
Personal Products (0.0%) | ||||||||
Coty, Inc., Class A | 728 | 11,102 | ||||||
See Notes to Financial Statements.
147
AXA PREMIER VIP TRUST
MULTIMANAGER MID CAP VALUE PORTFOLIO
PORTFOLIO OF INVESTMENTS (Continued)
December 31, 2013
| Number of Shares | Value (Note 1) | |||||||
Elizabeth Arden, Inc.* | 155 | $ | 5,495 | |||||
Inter Parfums, Inc. | 200 | 7,162 | ||||||
Nature’s Sunshine Products, Inc. | 402 | 6,962 | ||||||
Nutraceutical International Corp.* | 359 | 9,614 | ||||||
Revlon, Inc., Class A* | 303 | 7,563 | ||||||
|
| |||||||
| 47,898 | ||||||||
|
| |||||||
Tobacco (0.0%) | ||||||||
Alliance One International, Inc.* | 3,182 | 9,705 | ||||||
Universal Corp. | 874 | 47,721 | ||||||
Vector Group Ltd. | 663 | 10,853 | ||||||
|
| |||||||
| 68,279 | ||||||||
|
| |||||||
Total Consumer Staples | 10,910,897 | |||||||
|
| |||||||
Energy (5.9%) | ||||||||
Energy Equipment & Services (2.1%) |
| |||||||
Atwood Oceanics, Inc.* | 1,780 | 95,034 | ||||||
Basic Energy Services, Inc.* | 1,131 | 17,847 | ||||||
Bolt Technology Corp. | 296 | 6,515 | ||||||
Bristow Group, Inc. | 6,169 | 463,045 | ||||||
C&J Energy Services, Inc.* | 1,749 | 40,402 | ||||||
Cal Dive International, Inc.* | 3,827 | 7,692 | ||||||
CARBO Ceramics, Inc. | 424 | 49,409 | ||||||
Dawson Geophysical Co.* | 311 | 10,518 | ||||||
Era Group, Inc.* | 776 | 23,947 | ||||||
Exterran Holdings, Inc.* | 2,163 | 73,975 | ||||||
Forum Energy Technologies, Inc.* | 721 | 20,375 | ||||||
Frank’s International N.V. | 7,528 | 203,256 | ||||||
Global Geophysical Services, Inc.* | 760 | 1,224 | ||||||
Gulf Island Fabrication, Inc. | 514 | 11,935 | ||||||
Gulfmark Offshore, Inc., Class A | 8,571 | 403,951 | ||||||
Helix Energy Solutions Group, Inc.* | 20,148 | 467,031 | ||||||
Helmerich & Payne, Inc. | 10,688 | 898,647 | ||||||
Hercules Offshore, Inc.* | 5,961 | 38,925 | ||||||
Hornbeck Offshore Services, Inc.* | 1,286 | 63,310 | ||||||
ION Geophysical Corp.* | 4,015 | 13,250 | ||||||
Key Energy Services, Inc.* | 5,742 | 45,362 | ||||||
Matrix Service Co.* | 847 | 20,726 | ||||||
McDermott International, Inc.* | 8,930 | 81,799 | ||||||
Mitcham Industries, Inc.* | 489 | 8,660 | ||||||
Nabors Industries Ltd. | 11,170 | 189,778 | ||||||
Natural Gas Services Group, Inc.* | 490 | 13,509 | ||||||
Newpark Resources, Inc.* | 585 | 7,190 | ||||||
Nuverra Environmental Solutions, | 522 | 8,764 | ||||||
Oil States International, Inc.* | 2,102 | 213,815 | ||||||
Parker Drilling Co.* | 4,590 | 37,317 | ||||||
Patterson-UTI Energy, Inc. | 5,601 | 141,817 | ||||||
PHI, Inc. (Non-Voting)* | 465 | 20,181 | ||||||
Pioneer Energy Services Corp.* | 2,386 | 19,112 | ||||||
Rowan Cos., plc, Class A* | 4,699 | 166,157 | ||||||
RPC, Inc. | 473 | 8,443 | ||||||
SEACOR Holdings, Inc.* | 696 | 63,475 | ||||||
Solar Cayman Ltd.*†§(b) | 50,828 | 5,083 | ||||||
Superior Energy Services, Inc.* | 23,552 | 626,719 | ||||||
Tesco Corp.* | 1,132 | 22,391 | ||||||
TETRA Technologies, Inc.* | 2,924 | 36,141 | ||||||
TGC Industries, Inc.* | 89 | $ | 650 | |||||
Tidewater, Inc. | 1,887 | 111,842 | ||||||
Unit Corp.* | 1,845 | 95,239 | ||||||
Vantage Drilling Co.* | 7,681 | 14,133 | ||||||
Willbros Group, Inc.* | 1,535 | 14,460 | ||||||
|
| |||||||
| 4,883,051 | ||||||||
|
| |||||||
Oil, Gas & Consumable Fuels (3.8%) |
| |||||||
Adams Resources & Energy, Inc. | 78 | 5,343 | ||||||
Alon USA Energy, Inc. | 886 | 14,654 | ||||||
Alpha Natural Resources, Inc.* | 8,346 | 59,590 | ||||||
Apco Oil and Gas International, Inc.* | 273 | 4,256 | ||||||
Approach Resources, Inc.* | 600 | 11,574 | ||||||
Arch Coal, Inc. | 7,924 | 35,262 | ||||||
Athlon Energy, Inc.* | 429 | 12,977 | ||||||
Bill Barrett Corp.* | 1,311 | 35,109 | ||||||
BPZ Resources, Inc.* | 4,538 | 8,259 | ||||||
Callon Petroleum Co.* | 1,604 | 10,474 | ||||||
Carrizo Oil & Gas, Inc.* | 256 | 11,461 | ||||||
Cimarex Energy Co. | 16,585 | 1,739,932 | ||||||
Clayton Williams Energy, Inc.* | 225 | 18,439 | ||||||
Cloud Peak Energy, Inc.* | 2,291 | 41,238 | ||||||
Comstock Resources, Inc. | 1,870 | 34,202 | ||||||
Contango Oil & Gas Co.* | 6,371 | 301,094 | ||||||
Crosstex Energy, Inc. | 157 | 5,677 | ||||||
Delek U.S. Holdings, Inc. | 506 | 17,411 | ||||||
Denbury Resources, Inc.* | 28,130 | 462,176 | ||||||
Emerald Oil, Inc.* | 2,113 | 16,186 | ||||||
Endeavour International Corp.* | 1,770 | 9,293 | ||||||
Energen Corp. | 10,397 | 735,588 | ||||||
Energy XXI Bermuda Ltd. | 3,014 | 81,559 | ||||||
EPL Oil & Gas, Inc.* | 788 | 22,458 | ||||||
EQT Corp. | 3,734 | 335,239 | ||||||
Equal Energy Ltd. | 1,291 | 6,894 | ||||||
EXCO Resources, Inc. | 2,568 | 13,636 | ||||||
Forest Oil Corp.* | 4,037 | 14,574 | ||||||
Frontline Ltd.* | 2,080 | 7,779 | ||||||
GasLog Ltd. | 950 | 16,236 | ||||||
Golar LNG Ltd. | 1,663 | 60,350 | ||||||
Green Plains Renewable Energy, Inc. | 983 | 19,060 | ||||||
Gulfport Energy Corp.* | 609 | 38,458 | ||||||
Halcon Resources Corp.* | 8,744 | 33,752 | ||||||
Hallador Energy Co. | 371 | 2,990 | ||||||
Jones Energy, Inc., Class A* | 246 | 3,562 | ||||||
Knightsbridge Tankers Ltd. | 1,188 | 10,918 | ||||||
L&L Energy, Inc.*†(b) | 1,156 | 1,942 | ||||||
Laredo Petroleum Holdings, Inc.* | 176 | 4,873 | ||||||
Magnum Hunter Resources Corp.* | 4,587 | 33,531 | ||||||
Matador Resources Co.* | 2,248 | 41,903 | ||||||
Midstates Petroleum Co., Inc.* | 1,277 | 8,454 | ||||||
Miller Energy Resources, Inc.* | 1,174 | 8,265 | ||||||
Newfield Exploration Co.* | 5,157 | 127,017 | ||||||
Noble Energy, Inc. | 6,956 | 473,773 | ||||||
Nordic American Tankers Ltd. | 2,829 | 27,441 | ||||||
Northern Oil and Gas, Inc.* | 2,469 | 37,208 | ||||||
PBF Energy, Inc., Class A | 911 | 28,660 | ||||||
PDC Energy, Inc.* | 1,348 | 71,741 | ||||||
Peabody Energy Corp. | 10,243 | 200,046 | ||||||
Pengrowth Energy Corp. | 294,248 | 1,819,919 | ||||||
See Notes to Financial Statements.
148
AXA PREMIER VIP TRUST
MULTIMANAGER MID CAP VALUE PORTFOLIO
PORTFOLIO OF INVESTMENTS (Continued)
December 31, 2013
| Number of Shares | Value (Note 1) | |||||||
Penn Virginia Corp.* | 2,055 | $ | 19,379 | |||||
PetroQuest Energy, Inc.* | 197 | 851 | ||||||
QEP Resources, Inc. | 6,133 | 187,976 | ||||||
Quicksilver Resources, Inc.* | 3,913 | 12,013 | ||||||
Renewable Energy Group, Inc.* | 645 | 7,392 | ||||||
Resolute Energy Corp.* | 2,607 | 23,541 | ||||||
REX American Resources Corp.* | 191 | 8,540 | ||||||
Sanchez Energy Corp.* | 1,339 | 32,819 | ||||||
SandRidge Energy, Inc.* | 18,801 | 114,122 | ||||||
Scorpio Tankers, Inc. | 7,047 | 83,084 | ||||||
SemGroup Corp., Class A | 118 | 7,697 | ||||||
Ship Finance International Ltd. | 2,145 | 35,135 | ||||||
Southwestern Energy Co.* | 4,874 | 191,694 | ||||||
Stone Energy Corp.* | 1,895 | 65,548 | ||||||
Swift Energy Co.* | 1,675 | 22,613 | ||||||
Teekay Corp. | 1,436 | 68,942 | ||||||
Teekay Tankers Ltd., Class A | 2,543 | 9,994 | ||||||
Triangle Petroleum Corp.* | 2,199 | 18,296 | ||||||
Ultra Petroleum Corp.* | 5,849 | 126,631 | ||||||
Ur-Energy, Inc.* | 3,638 | 5,020 | ||||||
VAALCO Energy, Inc.* | 1,102 | 7,593 | ||||||
W&T Offshore, Inc. | 1,260 | 20,160 | ||||||
Warren Resources, Inc.* | 2,763 | 8,676 | ||||||
Western Refining, Inc. | 937 | 39,738 | ||||||
Westmoreland Coal Co.* | 445 | 8,584 | ||||||
Whiting Petroleum Corp.* | 9,013 | 557,634 | ||||||
World Fuel Services Corp. | 2,220 | 95,815 | ||||||
WPX Energy, Inc.* | 7,647 | 155,846 | ||||||
ZaZa Energy Corp.* | 532 | 508 | ||||||
|
| |||||||
| 9,078,274 | ||||||||
|
| |||||||
Total Energy | 13,961,325 | |||||||
|
| |||||||
Financials (27.0%) | ||||||||
Capital Markets (1.5%) | ||||||||
American Capital Ltd.* | 10,722 | 167,692 | ||||||
Apollo Investment Corp. | 8,517 | 72,224 | ||||||
Ares Capital Corp. | 33,711 | 599,044 | ||||||
Arlington Asset Investment Corp., Class A | 530 | 13,987 | ||||||
Artisan Partners Asset Management, Inc., Class A | 284 | 18,514 | ||||||
BlackRock Kelso Capital Corp. | 2,857 | 26,656 | ||||||
Calamos Asset Management, Inc., Class A | 768 | 9,093 | ||||||
Capital Southwest Corp. | 504 | 17,574 | ||||||
Capitala Finance Corp. | 126 | 2,507 | ||||||
CIFC Corp. | 266 | 2,069 | ||||||
Cowen Group, Inc., Class A* | 3,742 | 14,631 | ||||||
E*TRADE Financial Corp.* | 10,899 | 214,056 | ||||||
FBR & Co.* | 330 | 8,705 | ||||||
Federated Investors, Inc., Class B | 1,015 | 29,232 | ||||||
Fidus Investment Corp. | 591 | 12,848 | ||||||
Fifth Street Finance Corp. | 5,344 | 49,432 | ||||||
Firsthand Technology Value Fund, Inc. | 347 | 8,040 | ||||||
Garrison Capital, Inc. | 222 | 3,081 | ||||||
GFI Group, Inc. | 2,435 | 9,521 | ||||||
Gladstone Capital Corp. | 869 | 8,342 | ||||||
Gladstone Investment Corp. | 1,043 | 8,407 | ||||||
Golub Capital BDC, Inc. | 1,445 | $ | 27,614 | |||||
GSV Capital Corp.* | 689 | 8,330 | ||||||
Hercules Technology Growth Capital, Inc. | 2,403 | 39,409 | ||||||
HFF, Inc., Class A* | 203 | 5,451 | ||||||
Horizon Technology Finance Corp. | 360 | 5,116 | ||||||
ICG Group, Inc.* | 1,432 | 26,678 | ||||||
INTL FCStone, Inc.* | 320 | 5,933 | ||||||
Investment Technology Group, Inc.* | 1,424 | 29,277 | ||||||
Janus Capital Group, Inc. | 5,667 | 70,101 | ||||||
JMP Group, Inc. | 626 | 4,632 | ||||||
KCAP Financial, Inc. | 1,093 | 8,821 | ||||||
KCG Holdings, Inc., Class A* | 1,551 | 18,550 | ||||||
Legg Mason, Inc. | 4,222 | 183,573 | ||||||
LPL Financial Holdings, Inc. | 457 | 21,493 | ||||||
Main Street Capital Corp. | 1,384 | 45,243 | ||||||
Manning & Napier, Inc. | 533 | 9,407 | ||||||
MCG Capital Corp. | 2,839 | 12,492 | ||||||
Medallion Financial Corp. | 816 | 11,710 | ||||||
Medley Capital Corp. | 1,665 | 23,060 | ||||||
MVC Capital, Inc. | 795 | 10,733 | ||||||
New Mountain Finance Corp. | 1,843 | 27,719 | ||||||
NGP Capital Resources Co. | 785 | 5,864 | ||||||
Oppenheimer Holdings, Inc., Class A | 329 | 8,153 | ||||||
PennantPark Floating Rate Capital Ltd. | 563 | 7,730 | ||||||
PennantPark Investment Corp. | 2,611 | 30,288 | ||||||
Piper Jaffray Cos., Inc.* | 602 | 23,809 | ||||||
Prospect Capital Corp. | 10,811 | 121,299 | ||||||
Raymond James Financial, Inc. | 14,412 | 752,162 | ||||||
RCS Capital Corp., Class A | 70 | 1,285 | ||||||
Safeguard Scientifics, Inc.* | 803 | 16,132 | ||||||
SEI Investments Co. | 291 | 10,106 | ||||||
Silvercrest Asset Management Group, Inc., Class A | 208 | 3,546 | ||||||
Solar Capital Ltd. | 1,701 | 38,358 | ||||||
Solar Senior Capital Ltd. | 473 | 8,618 | ||||||
Stellus Capital Investment Corp. | 445 | 6,653 | ||||||
Stifel Financial Corp.* | 2,403 | 115,152 | ||||||
SWS Group, Inc.* | 1,102 | 6,700 | ||||||
TCP Capital Corp. | 1,367 | 22,938 | ||||||
THL Credit, Inc. | 1,337 | 22,047 | ||||||
TICC Capital Corp. | 2,078 | 21,487 | ||||||
Triangle Capital Corp. | 1,078 | 29,807 | ||||||
Waddell & Reed Financial, Inc., Class A | 5,498 | 358,030 | ||||||
Walter Investment Management Corp.* | 1,399 | 49,469 | ||||||
WhiteHorse Finance, Inc. | 247 | 3,732 | ||||||
|
| |||||||
| 3,554,362 | ||||||||
|
| |||||||
Commercial Banks (6.7%) | ||||||||
1st Source Corp. | 585 | 18,685 | ||||||
1st United Bancorp, Inc./Florida | 1,101 | 8,379 | ||||||
Access National Corp. | 288 | 4,306 | ||||||
American National Bankshares, Inc. | 307 | 8,059 | ||||||
Ameris Bancorp* | 913 | 19,273 | ||||||
See Notes to Financial Statements.
149
AXA PREMIER VIP TRUST
MULTIMANAGER MID CAP VALUE PORTFOLIO
PORTFOLIO OF INVESTMENTS (Continued)
December 31, 2013
| Number of Shares | Value (Note 1) | |||||||
Ames National Corp. | 353 | $ | 7,904 | |||||
Arrow Financial Corp. | 417 | 11,076 | ||||||
Associated Banc-Corp. | 6,284 | 109,342 | ||||||
BancFirst Corp. | 256 | 14,351 | ||||||
Banco Latinoamericano de Comercio Exterior S.A., Class E | 1,135 | 31,803 | ||||||
Bancorp, Inc./Delaware* | 1,268 | 22,710 | ||||||
BancorpSouth, Inc. | 3,626 | 92,173 | ||||||
Bank of Hawaii Corp. | 1,711 | 101,189 | ||||||
Bank of Kentucky Financial Corp. | 242 | 8,930 | ||||||
Bank of Marin Bancorp/California | 215 | 9,329 | ||||||
Bank of the Ozarks, Inc. | 351 | 19,863 | ||||||
BankUnited, Inc. | 2,485 | 81,806 | ||||||
Banner Corp. | 727 | 32,584 | ||||||
Bar Harbor Bankshares | 163 | 6,518 | ||||||
BBCN Bancorp, Inc. | 2,994 | 49,670 | ||||||
BNC Bancorp | 662 | 11,347 | ||||||
BOK Financial Corp. | 5,486 | 363,832 | ||||||
Boston Private Financial Holdings, Inc. | 3,076 | 38,819 | ||||||
Bridge Bancorp, Inc. | 433 | 11,258 | ||||||
Bridge Capital Holdings* | 363 | 7,456 | ||||||
Bryn Mawr Bank Corp. | 518 | 15,633 | ||||||
C&F Financial Corp. | 125 | 5,709 | ||||||
Camden National Corp. | 300 | 12,666 | ||||||
Capital Bank Financial Corp., Class A* | 892 | 20,293 | ||||||
Capital City Bank Group, Inc.* | 488 | 5,744 | ||||||
CapitalSource, Inc. | 59,246 | 851,365 | ||||||
Cardinal Financial Corp. | 1,165 | 20,970 | ||||||
Cascade Bancorp* | 209 | 1,093 | ||||||
Cathay General Bancorp | 3,013 | 80,537 | ||||||
Center Bancorp, Inc. | 465 | 8,723 | ||||||
Centerstate Banks, Inc. | 1,178 | 11,957 | ||||||
Central Pacific Financial Corp. | 840 | 16,867 | ||||||
Century Bancorp, Inc./Massachusetts, Class A | 109 | 3,624 | ||||||
Chemical Financial Corp. | 1,111 | 35,185 | ||||||
Chemung Financial Corp. | 162 | 5,536 | ||||||
Citizens & Northern Corp. | 484 | 9,985 | ||||||
City Holding Co. | 614 | 28,447 | ||||||
City National Corp./California | 5,211 | 412,815 | ||||||
CNB Financial Corp./Pennsylvania | 568 | 10,792 | ||||||
CoBiz Financial, Inc. | 1,341 | 16,038 | ||||||
Columbia Banking System, Inc. | 1,931 | 53,122 | ||||||
Comerica, Inc. | 11,494 | 546,425 | ||||||
Commerce Bancshares, Inc./Missouri | 3,109 | 139,625 | ||||||
Community Bank System, Inc. | 1,526 | 60,552 | ||||||
Community Trust Bancorp, Inc. | 522 | 23,574 | ||||||
CommunityOne Bancorp* | 377 | 4,807 | ||||||
ConnectOne Bancorp, Inc.* | 69 | 2,734 | ||||||
CU Bancorp* | 359 | 6,275 | ||||||
Cullen/Frost Bankers, Inc. | 1,999 | 148,786 | ||||||
Customers Bancorp, Inc.* | 772 | 15,795 | ||||||
CVB Financial Corp. | 3,459 | 59,045 | ||||||
Eagle Bancorp, Inc.* | 870 | 26,648 | ||||||
East West Bancorp, Inc. | 18,453 | 645,301 | ||||||
Enterprise Bancorp, Inc./Massachusetts | 264 | $ | 5,589 | |||||
Enterprise Financial Services Corp. | 750 | 15,315 | ||||||
F.N.B. Corp./Pennsylvania | 5,680 | 71,682 | ||||||
Farmers Capital Bank Corp.* | 276 | 6,003 | ||||||
Fidelity Southern Corp. | 555 | 9,219 | ||||||
Financial Institutions, Inc. | 547 | 13,516 | ||||||
First Bancorp, Inc./Maine | 372 | 6,480 | ||||||
First Bancorp/North Carolina | 752 | 12,498 | ||||||
First BanCorp/Puerto Rico* | 2,595 | 16,063 | ||||||
First Busey Corp. | 2,727 | 15,817 | ||||||
First Citizens BancShares, Inc./North Carolina, Class A | 275 | 61,223 | ||||||
First Commonwealth Financial Corp. | 3,650 | 32,193 | ||||||
First Community Bancshares, Inc./Virginia | 578 | 9,653 | ||||||
First Connecticut Bancorp, Inc./Connecticut | 640 | 10,317 | ||||||
First Financial Bancorp | 2,199 | 38,329 | ||||||
First Financial Bankshares, Inc. | 389 | 25,798 | ||||||
First Financial Corp./Indiana | 437 | 15,977 | ||||||
First Financial Holdings, Inc. | 916 | 60,923 | ||||||
First Horizon National Corp. | 9,167 | 106,796 | ||||||
First Interstate Bancsystem, Inc. | 682 | 19,348 | ||||||
First Merchants Corp. | 1,310 | 29,816 | ||||||
First Midwest Bancorp, Inc./Illinois | 2,822 | 49,470 | ||||||
First NBC Bank Holding Co.* | 163 | 5,265 | ||||||
First Niagara Financial Group, Inc. | 79,580 | 845,140 | ||||||
First of Long Island Corp. | 304 | 13,032 | ||||||
First Republic Bank/California | 19,713 | 1,031,976 | ||||||
First Security Group, Inc./Tennessee* | 2,357 | 5,421 | ||||||
FirstMerit Corp. | 26,567 | 590,584 | ||||||
Flushing Financial Corp. | 1,194 | 24,716 | ||||||
Fulton Financial Corp. | 35,048 | 458,428 | ||||||
German American Bancorp, Inc. | 497 | 14,164 | ||||||
Glacier Bancorp, Inc. | 2,742 | 81,684 | ||||||
Great Southern Bancorp, Inc. | 401 | 12,194 | ||||||
Guaranty Bancorp | 532 | 7,475 | ||||||
Hampton Roads Bankshares, Inc.* | 1,128 | 1,974 | ||||||
Hancock Holding Co. | 3,202 | 117,449 | ||||||
Hanmi Financial Corp. | 1,220 | 26,706 | ||||||
Heartland Financial USA, Inc. | 570 | 16,410 | ||||||
Heritage Commerce Corp. | 747 | 6,155 | ||||||
Heritage Financial Corp./Washington | 566 | 9,684 | ||||||
Heritage Oaks Bancorp* | 830 | 6,225 | ||||||
Home BancShares, Inc./Arkansas | 1,266 | 47,285 | ||||||
Home Federal Bancorp, Inc./Idaho | 558 | 8,314 | ||||||
HomeTrust Bancshares, Inc.* | 776 | 12,408 | ||||||
Horizon Bancorp/Indiana | 317 | 8,030 | ||||||
Hudson Valley Holding Corp. | 637 | 12,963 | ||||||
Huntington Bancshares, Inc./Ohio | 31,918 | 308,009 | ||||||
IBERIABANK Corp. | 1,115 | 70,078 | ||||||
Independent Bank Corp./Massachusetts | 890 | 34,879 | ||||||
See Notes to Financial Statements.
150
AXA PREMIER VIP TRUST
MULTIMANAGER MID CAP VALUE PORTFOLIO
PORTFOLIO OF INVESTMENTS (Continued)
December 31, 2013
| Number of Shares | Value (Note 1) | |||||||
Independent Bank Group, Inc. | 151 | $ | 7,499 | |||||
International Bancshares Corp. | 2,021 | 53,334 | ||||||
Intervest Bancshares Corp., Class A* | 652 | 4,897 | ||||||
Investors Bancorp, Inc. | 1,690 | 43,230 | ||||||
KeyCorp. | 16,911 | 226,946 | ||||||
Lakeland Bancorp, Inc. | 1,292 | 15,982 | ||||||
Lakeland Financial Corp. | 637 | 24,843 | ||||||
LCNB Corp. | 285 | 5,093 | ||||||
Macatawa Bank Corp.* | 859 | 4,295 | ||||||
MainSource Financial Group, Inc. | 779 | 14,045 | ||||||
MB Financial, Inc. | 2,080 | 66,747 | ||||||
Mercantile Bank Corp. | 356 | 7,682 | ||||||
Merchants Bancshares, Inc. | 218 | 7,303 | ||||||
Metro Bancorp, Inc.* | 552 | 11,890 | ||||||
MetroCorp Bancshares, Inc. | 569 | 8,575 | ||||||
Middleburg Financial Corp. | 208 | 3,752 | ||||||
MidSouth Bancorp, Inc. | 328 | 5,858 | ||||||
MidWestOne Financial Group, Inc. | 240 | 6,528 | ||||||
National Bank Holdings Corp., Class A | 1,730 | 37,022 | ||||||
National Bankshares, Inc./Virginia | 265 | 9,776 | ||||||
National Penn Bancshares, Inc. | 46,354 | 525,191 | ||||||
NBT Bancorp, Inc. | 1,644 | 42,580 | ||||||
NewBridge Bancorp* | 913 | 6,847 | ||||||
Northrim BanCorp, Inc. | 251 | 6,586 | ||||||
OFG Bancorp | 1,768 | 30,657 | ||||||
Old National Bancorp/Indiana | 3,830 | 58,867 | ||||||
OmniAmerican Bancorp, Inc.* | 443 | 9,471 | ||||||
Pacific Continental Corp. | 704 | 11,222 | ||||||
Pacific Premier Bancorp, Inc.* | 647 | 10,184 | ||||||
PacWest Bancorp | 1,437 | 60,670 | ||||||
Palmetto Bancshares, Inc.* | 154 | 1,996 | ||||||
Park National Corp. | 438 | 37,261 | ||||||
Park Sterling Corp. | 1,668 | 11,910 | ||||||
Peapack-Gladstone Financial Corp. | 310 | 5,921 | ||||||
Penns Woods Bancorp, Inc. | 193 | 9,843 | ||||||
Peoples Bancorp, Inc./Ohio | 424 | 9,544 | ||||||
Pinnacle Financial Partners, Inc. | 1,322 | 43,005 | ||||||
Popular, Inc.* | 76,652 | 2,202,212 | ||||||
Preferred Bank/California* | 470 | 9,423 | ||||||
PrivateBancorp, Inc. | 2,476 | 71,631 | ||||||
Prosperity Bancshares, Inc. | 2,282 | 144,656 | ||||||
Renasant Corp. | 1,174 | 36,934 | ||||||
Republic Bancorp, Inc./Kentucky, Class A | 396 | 9,718 | ||||||
S&T Bancorp, Inc. | 1,104 | 27,942 | ||||||
Sandy Spring Bancorp, Inc. | 976 | 27,513 | ||||||
Seacoast Banking Corp. of Florida* | 640 | 7,808 | ||||||
Sierra Bancorp | 442 | 7,112 | ||||||
Signature Bank/New York* | 5,894 | 633,133 | ||||||
Simmons First National Corp., Class A | 632 | 23,479 | ||||||
Southside Bancshares, Inc. | 698 | 19,083 | ||||||
Southwest Bancorp, Inc./Oklahoma* | 765 | 12,179 | ||||||
State Bank Financial Corp. | 1,247 | 22,683 | ||||||
StellarOne Corp. | 839 | 20,195 | ||||||
Sterling Financial Corp./Washington | 1,268 | $ | 43,213 | |||||
Suffolk Bancorp* | 439 | 9,131 | ||||||
Sun Bancorp, Inc./New Jersey* | 1,462 | 5,146 | ||||||
Susquehanna Bancshares, Inc. | 7,010 | 90,008 | ||||||
SVB Financial Group* | 1,720 | 180,359 | ||||||
SY Bancorp, Inc. | 537 | 17,141 | ||||||
Synovus Financial Corp. | 37,380 | 134,568 | ||||||
Taylor Capital Group, Inc.* | 656 | 17,436 | ||||||
TCF Financial Corp. | 6,236 | 101,335 | ||||||
Texas Capital Bancshares, Inc.* | 1,555 | 96,721 | ||||||
Tompkins Financial Corp. | 563 | 28,933 | ||||||
TowneBank/Virginia | 931 | 14,328 | ||||||
Trico Bancshares | 618 | 17,533 | ||||||
Tristate Capital Holdings, Inc.* | 243 | 2,882 | ||||||
Trustmark Corp. | 2,563 | 68,791 | ||||||
UMB Financial Corp. | 1,348 | 86,649 | ||||||
Umpqua Holdings Corp. | 4,247 | 81,288 | ||||||
Union First Market Bankshares Corp. | 785 | 19,476 | ||||||
United Bankshares, Inc./West Virginia | 1,683 | 52,930 | ||||||
United Community Banks, Inc./Georgia* | 1,660 | 29,465 | ||||||
Univest Corp. of Pennsylvania | 665 | 13,752 | ||||||
Valley National Bancorp | 7,658 | 77,499 | ||||||
VantageSouth Bancshares, Inc.* | 420 | 2,213 | ||||||
ViewPoint Financial Group, Inc. | 1,507 | 41,367 | ||||||
Virginia Commerce Bancorp, Inc.* | 1,048 | 17,806 | ||||||
Washington Banking Co. | 611 | 10,833 | ||||||
Washington Trust Bancorp, Inc. | 559 | 20,806 | ||||||
Webster Financial Corp. | 3,435 | 107,103 | ||||||
WesBanco, Inc. | 968 | 30,976 | ||||||
West Bancorp, Inc. | 572 | 9,049 | ||||||
Westamerica Bancorp | 1,020 | 57,589 | ||||||
Western Alliance Bancorp* | 25,100 | 598,886 | ||||||
Wilshire Bancorp, Inc. | 2,563 | 28,014 | ||||||
Wintrust Financial Corp. | 1,414 | 65,214 | ||||||
Yadkin Financial Corp.* | 530 | 9,031 | ||||||
Zions Bancorp | 7,016 | 210,199 | ||||||
|
| |||||||
| 15,926,426 | ||||||||
|
| |||||||
Consumer Finance (0.1%) | ||||||||
Cash America International, Inc. | 1,076 | 41,211 | ||||||
Consumer Portfolio Services, Inc.* | 262 | 2,460 | ||||||
DFC Global Corp.* | 1,560 | 17,862 | ||||||
Encore Capital Group, Inc.* | 206 | 10,354 | ||||||
EZCORP, Inc., Class A* | 1,978 | 23,123 | ||||||
First Marblehead Corp.* | 348 | 2,572 | ||||||
Green Dot Corp., Class A* | 1,003 | 25,225 | ||||||
Imperial Holdings, Inc.* | 656 | 4,290 | ||||||
Nelnet, Inc., Class A | 871 | 36,704 | ||||||
Nicholas Financial, Inc. | 496 | 7,807 | ||||||
Regional Management Corp.* | 97 | 3,291 | ||||||
Springleaf Holdings, Inc.* | 518 | 13,095 | ||||||
|
| |||||||
| 187,994 | ||||||||
|
| |||||||
Diversified Financial Services (0.2%) |
| |||||||
California First National Bancorp | 103 | 1,555 | ||||||
Gain Capital Holdings, Inc. | 482 | 3,620 | ||||||
See Notes to Financial Statements.
151
AXA PREMIER VIP TRUST
MULTIMANAGER MID CAP VALUE PORTFOLIO
PORTFOLIO OF INVESTMENTS (Continued)
December 31, 2013
| Number of Shares | Value (Note 1) | |||||||
Marlin Business Services Corp. | 327 | $ | 8,241 | |||||
MSCI, Inc.* | 2,680 | 117,170 | ||||||
NASDAQ OMX Group, Inc. | 4,255 | 169,349 | ||||||
NewStar Financial, Inc.* | 990 | 17,592 | ||||||
PHH Corp.* | 2,157 | 52,523 | ||||||
PICO Holdings, Inc.* | 871 | 20,129 | ||||||
Resource America, Inc., Class A | 451 | 4,221 | ||||||
|
| |||||||
| 394,400 | ||||||||
|
| |||||||
Insurance (9.3%) | ||||||||
Alleghany Corp.* | 1,100 | 439,956 | ||||||
Allied World Assurance Co. Holdings AG | 872 | 98,370 | ||||||
Ambac Financial Group, Inc.* | 1,384 | 33,991 | ||||||
American Equity Investment Life Holding Co. | 27,131 | 715,716 | ||||||
American Financial Group, Inc./Ohio | 2,562 | 147,879 | ||||||
American National Insurance Co. | 269 | 30,811 | ||||||
AMERISAFE, Inc. | 710 | 29,990 | ||||||
Amtrust Financial Services, Inc. | 214 | 6,996 | ||||||
Arch Capital Group Ltd.* | 13,073 | 780,327 | ||||||
Argo Group International Holdings Ltd. | 666 | 30,962 | ||||||
Aspen Insurance Holdings Ltd. | 2,505 | 103,482 | ||||||
Assurant, Inc. | 2,784 | 184,774 | ||||||
Assured Guaranty Ltd. | 22,027 | 519,617 | ||||||
Axis Capital Holdings Ltd. | 3,363 | 159,978 | ||||||
Baldwin & Lyons, Inc., Class B | 351 | 9,589 | ||||||
Brown & Brown, Inc. | 2,479 | 77,816 | ||||||
Citizens, Inc./Texas* | 1,654 | 14,473 | ||||||
CNO Financial Group, Inc. | 8,470 | 149,834 | ||||||
Crawford & Co., Class B | 636 | 5,877 | ||||||
Donegal Group, Inc., Class A | 277 | 4,404 | ||||||
Eastern Insurance Holdings, Inc. | 208 | 5,094 | ||||||
EMC Insurance Group, Inc. | 162 | 4,960 | ||||||
Employers Holdings, Inc. | 336 | 10,634 | ||||||
Endurance Specialty Holdings Ltd. | 17,013 | 998,153 | ||||||
Enstar Group Ltd.* | 1,819 | 252,677 | ||||||
Everest Reinsurance Group Ltd. | 5,101 | 795,093 | ||||||
FBL Financial Group, Inc., Class A | 328 | 14,691 | ||||||
Fidelity National Financial, Inc., Class A | 9,541 | 309,606 | ||||||
First American Financial Corp. | 74,086 | 2,089,225 | ||||||
Fortegra Financial Corp.* | 290 | 2,398 | ||||||
Genworth Financial, Inc., Class A* | 18,800 | 291,964 | ||||||
Global Indemnity plc* | 286 | 7,236 | ||||||
Greenlight Capital Reinsurance Ltd., Class A* | 20,464 | 689,842 | ||||||
Hallmark Financial Services, Inc.* | 527 | 4,682 | ||||||
Hanover Insurance Group, Inc. | 1,196 | 71,413 | ||||||
Hartford Financial Services Group, Inc. | 17,101 | 619,569 | ||||||
HCC Insurance Holdings, Inc. | 32,585 | 1,503,472 | ||||||
Hilltop Holdings, Inc.* | 2,405 | 55,628 | ||||||
Horace Mann Educators Corp. | 1,532 | 48,319 | ||||||
Independence Holding Co. | 282 | 3,804 | ||||||
Infinity Property & Casualty Corp. | 2,821 | 202,407 | ||||||
Investors Title Co. | 60 | $ | 4,859 | |||||
Kansas City Life Insurance Co. | 135 | 6,445 | ||||||
Kemper Corp. | 1,793 | 73,298 | ||||||
Maiden Holdings Ltd. | 1,619 | 17,696 | ||||||
Markel Corp.* | 1,300 | 754,455 | ||||||
MBIA, Inc.* | 120,837 | 1,442,794 | ||||||
Meadowbrook Insurance Group, Inc. | 1,816 | 12,639 | ||||||
Mercury General Corp. | 995 | 49,462 | ||||||
Montpelier Reinsurance Holdings Ltd. | 1,684 | 49,004 | ||||||
National Interstate Corp. | 195 | 4,485 | ||||||
National Western Life Insurance Co., Class A | 79 | 17,661 | ||||||
Navigators Group, Inc.* | 7,315 | 462,015 | ||||||
Old Republic International Corp. | 129,357 | 2,233,995 | ||||||
OneBeacon Insurance Group Ltd., Class A | 862 | 13,637 | ||||||
PartnerReinsurance Ltd. | 2,054 | 216,553 | ||||||
Phoenix Cos., Inc.* | 222 | 13,631 | ||||||
Platinum Underwriters Holdings Ltd. | 1,106 | 67,776 | ||||||
Primerica, Inc. | 2,166 | 92,943 | ||||||
ProAssurance Corp. | 2,340 | 113,443 | ||||||
Protective Life Corp. | 2,994 | 151,676 | ||||||
Reinsurance Group of America, Inc. | 16,284 | 1,260,544 | ||||||
RenaissanceReinsurance Holdings Ltd. | 1,695 | 164,991 | ||||||
RLI Corp. | 809 | 78,780 | ||||||
Safety Insurance Group, Inc. | 500 | 28,150 | ||||||
Selective Insurance Group, Inc. | 2,082 | 56,339 | ||||||
StanCorp Financial Group, Inc. | 1,682 | 111,433 | ||||||
State Auto Financial Corp. | 548 | 11,640 | ||||||
Stewart Information Services Corp. | 822 | 26,526 | ||||||
Symetra Financial Corp. | 3,066 | 58,131 | ||||||
Third Point Reinsurance Ltd.* | 717 | 13,286 | ||||||
Tower Group International Ltd. | 2,056 | 6,949 | ||||||
United Fire Group, Inc. | 720 | 20,635 | ||||||
Universal Insurance Holdings, Inc. | 943 | 13,655 | ||||||
Validus Holdings Ltd. | 3,673 | 147,985 | ||||||
W. R. Berkley Corp. | 4,122 | 178,854 | ||||||
White Mountains Insurance Group Ltd. | 232 | 139,915 | ||||||
Willis Group Holdings plc | 42,080 | 1,885,605 | ||||||
XL Group plc | 16,368 | 521,157 | ||||||
|
| |||||||
| 22,048,751 | ||||||||
|
| |||||||
Real Estate Investment Trusts (REITs) (6.4%) |
| |||||||
Acadia Realty Trust (REIT) | 1,753 | 43,527 | ||||||
AG Mortgage Investment Trust, Inc. (REIT) | 1,251 | 19,566 | ||||||
Agree Realty Corp. (REIT) | 629 | 18,254 | ||||||
Alexandria Real Estate Equities, Inc. (REIT) | 2,766 | 175,973 | ||||||
American Assets Trust, Inc. (REIT) | 1,309 | 41,142 | ||||||
American Campus Communities, Inc. (REIT) | 4,003 | 128,937 | ||||||
See Notes to Financial Statements.
152
AXA PREMIER VIP TRUST
MULTIMANAGER MID CAP VALUE PORTFOLIO
PORTFOLIO OF INVESTMENTS (Continued)
December 31, 2013
| Number of Shares | Value (Note 1) | |||||||
American Capital Mortgage Investment Corp. (REIT) | 2,155 | $ | 37,626 | |||||
American Homes 4 Rent (REIT), Class A | 1,700 | 27,540 | ||||||
American Realty Capital Properties, Inc. (REIT) | 5,163 | 66,396 | ||||||
American Residential Properties, Inc. (REIT)* | 564 | 9,678 | ||||||
AmREIT, Inc. (REIT) | 836 | 14,045 | ||||||
Anworth Mortgage Asset Corp. (REIT) | 5,826 | 24,527 | ||||||
Apartment Investment & Management Co. (REIT), Class A | 2,547 | 65,993 | ||||||
Apollo Commercial Real Estate Finance, Inc. (REIT) | 1,699 | 27,609 | ||||||
Apollo Residential Mortgage, Inc. (REIT) | 1,239 | 18,312 | ||||||
Ares Commercial Real Estate Corp. (REIT) | 805 | 10,546 | ||||||
Armada Hoffler Properties, Inc. (REIT) | 874 | 8,111 | ||||||
ARMOUR Residential REIT, Inc. (REIT) | 14,699 | 58,943 | ||||||
Ashford Hospitality Prime, Inc. (REIT) | 452 | 8,226 | ||||||
Ashford Hospitality Trust, Inc. (REIT) | 2,407 | 19,930 | ||||||
Associated Estates Realty Corp. (REIT) | 2,232 | 35,824 | ||||||
Aviv REIT, Inc. (REIT) | 425 | 10,073 | ||||||
BioMed Realty Trust, Inc. (REIT) | 27,323 | 495,093 | ||||||
Brandywine Realty Trust (REIT) | 31,008 | 436,903 | ||||||
BRE Properties, Inc. (REIT) | 2,989 | 163,528 | ||||||
Brixmor Property Group, Inc. (REIT)* | 1,582 | 32,162 | ||||||
Camden Property Trust (REIT) | 6,631 | 377,171 | ||||||
Campus Crest Communities, Inc. (REIT) | 2,503 | 23,553 | ||||||
Capstead Mortgage Corp. (REIT) | 3,920 | 47,354 | ||||||
CBL & Associates Properties, Inc. (REIT) | 4,174 | 74,965 | ||||||
Cedar Realty Trust, Inc. (REIT) | 2,650 | 16,589 | ||||||
Chambers Street Properties (REIT) | 9,144 | 69,952 | ||||||
Chatham Lodging Trust (REIT) | 1,072 | 21,922 | ||||||
Chesapeake Lodging Trust (REIT) | 1,917 | 48,481 | ||||||
Chimera Investment Corp. (REIT) | 40,216 | 124,670 | ||||||
Colony Financial, Inc. (REIT) | 3,111 | 63,122 | ||||||
CommonWealth REIT (REIT) | 4,559 | 106,270 | ||||||
Corporate Office Properties Trust/Maryland (REIT) | 3,264 | 77,324 | ||||||
Corrections Corp. of America (REIT) | 21,057 | 675,298 | ||||||
Cousins Properties, Inc. (REIT) | 193,434 | 1,992,370 | ||||||
CubeSmart (REIT) | 5,099 | 81,278 | ||||||
CyrusOne, Inc. (REIT) | 737 | 16,457 | ||||||
CYS Investments, Inc. (REIT) | 7,006 | 51,914 | ||||||
DCT Industrial Trust, Inc. (REIT) | 11,188 | 79,770 | ||||||
DDR Corp. (REIT) | 34,035 | 523,118 | ||||||
DiamondRock Hospitality Co. (REIT) | 7,435 | $ | 85,874 | |||||
Douglas Emmett, Inc. (REIT) | 5,482 | 127,676 | ||||||
Duke Realty Corp. (REIT) | 12,353 | 185,789 | ||||||
DuPont Fabros Technology, Inc. (REIT) | 1,411 | 34,866 | ||||||
Dynex Capital, Inc. (REIT) | 2,318 | 18,544 | ||||||
EastGroup Properties, Inc. (REIT) | 97 | 5,619 | ||||||
Education Realty Trust, Inc. (REIT) | 4,503 | 39,716 | ||||||
Ellington Residential Mortgage REIT (REIT) | 270 | 4,153 | ||||||
Empire State Realty Trust, Inc. (REIT), Class A | 2,636 | 40,331 | ||||||
EPR Properties (REIT) | 1,997 | 98,173 | ||||||
Equity Lifestyle Properties, Inc. (REIT) | 907 | 32,861 | ||||||
Equity One, Inc. (REIT) | 2,347 | 52,667 | ||||||
Essex Property Trust, Inc. (REIT) | 1,473 | 211,390 | ||||||
Excel Trust, Inc. (REIT) | 1,922 | 21,892 | ||||||
Extra Space Storage, Inc. (REIT) | 3,955 | 166,624 | ||||||
Federal Realty Investment Trust (REIT) | 878 | 89,038 | ||||||
FelCor Lodging Trust, Inc. (REIT)* | 4,796 | 39,135 | ||||||
First Industrial Realty Trust, Inc. (REIT) | 4,089 | 71,353 | ||||||
First Potomac Realty Trust (REIT) | 2,335 | 27,156 | ||||||
Franklin Street Properties Corp. (REIT) | 3,626 | 43,331 | ||||||
Gaming and Leisure Properties, Inc. (REIT)* | 3,007 | 152,786 | ||||||
GEO Group, Inc. (REIT) | 1,569 | 50,553 | ||||||
Getty Realty Corp. (REIT) | 1,038 | 19,068 | ||||||
Gladstone Commercial Corp. (REIT) | 690 | 12,399 | ||||||
Glimcher Realty Trust (REIT) | 541 | 5,064 | ||||||
Government Properties Income Trust (REIT) | 2,066 | 51,340 | ||||||
Gramercy Property Trust, Inc. (REIT)* | 2,307 | 13,265 | ||||||
Hatteras Financial Corp. (REIT) | 3,844 | 62,811 | ||||||
Healthcare Realty Trust, Inc. (REIT) | 2,300 | 49,013 | ||||||
Healthcare Trust of America, Inc. (REIT), Class A | 4,337 | 42,676 | ||||||
Hersha Hospitality Trust (REIT) | 7,750 | 43,168 | ||||||
Highwoods Properties, Inc. (REIT) | 2,417 | 87,423 | ||||||
Home Properties, Inc. (REIT) | 2,188 | 117,321 | ||||||
Hospitality Properties Trust (REIT) | 5,692 | 153,855 | ||||||
Hudson Pacific Properties, Inc. (REIT) | 1,743 | 38,119 | ||||||
Inland Real Estate Corp. (REIT) | 549 | 5,775 | ||||||
Invesco Mortgage Capital, Inc. (REIT) | 5,397 | 79,228 | ||||||
Investors Real Estate Trust (REIT) | 3,857 | 33,093 | ||||||
See Notes to Financial Statements.
153
AXA PREMIER VIP TRUST
MULTIMANAGER MID CAP VALUE PORTFOLIO
PORTFOLIO OF INVESTMENTS (Continued)
December 31, 2013
| Number of Shares | Value (Note 1) | |||||||
iStar Financial, Inc. (REIT)* | 68,087 | $ | 971,601 | |||||
JAVELIN Mortgage Investment Corp. (REIT) | 646 | 8,999 | ||||||
Kilroy Realty Corp. (REIT) | 3,164 | 158,770 | ||||||
Kite Realty Group Trust (REIT) | 4,971 | 32,659 | ||||||
LaSalle Hotel Properties (REIT) | 3,956 | 122,082 | ||||||
Lexington Realty Trust (REIT) | 6,596 | 67,345 | ||||||
Liberty Property Trust (REIT) | 15,325 | 519,058 | ||||||
LTC Properties, Inc. (REIT) | 245 | 8,671 | ||||||
Mack-Cali Realty Corp. (REIT) | 3,407 | 73,182 | ||||||
Medical Properties Trust, Inc. (REIT) | 6,232 | 76,155 | ||||||
MFA Financial, Inc. (REIT) | 14,297 | 100,937 | ||||||
Mid-America Apartment Communities, Inc. (REIT) | 11,774 | 715,153 | ||||||
Monmouth Real Estate Investment Corp. (REIT), Class A | 1,870 | 16,998 | ||||||
National Retail Properties, Inc. (REIT) | 4,633 | 140,519 | ||||||
New Residential Investment Corp. (REIT) | 9,743 | 65,083 | ||||||
New York Mortgage Trust, Inc. (REIT) | 2,761 | 19,299 | ||||||
NorthStar Realty Finance Corp. (REIT) | 11,225 | 150,976 | ||||||
One Liberty Properties, Inc. (REIT) | 495 | 9,964 | ||||||
Parkway Properties, Inc./Maryland (REIT) | 2,152 | 41,514 | ||||||
Pebblebrook Hotel Trust (REIT) | 2,391 | 73,547 | ||||||
Pennsylvania Real Estate Investment Trust (REIT) | 2,570 | 48,779 | ||||||
PennyMac Mortgage Investment Trust (REIT) | 2,403 | 55,173 | ||||||
Physicians Realty Trust (REIT) | 642 | 8,179 | ||||||
Piedmont Office Realty Trust, Inc. (REIT), Class A | 6,409 | 105,877 | ||||||
Post Properties, Inc. (REIT) | 2,075 | 93,852 | ||||||
QTS Realty Trust, Inc. (REIT), Class A | 496 | 12,291 | ||||||
RAIT Financial Trust (REIT) | 2,706 | 24,273 | ||||||
Ramco-Gershenson Properties Trust (REIT) | 2,560 | 40,294 | ||||||
Redwood Trust, Inc. (REIT) | 3,152 | 61,054 | ||||||
Regency Centers Corp. (REIT) | 2,081 | 96,350 | ||||||
Resource Capital Corp. (REIT) | 5,094 | 30,207 | ||||||
Retail Opportunity Investments Corp. (REIT) | 2,730 | 40,186 | ||||||
Retail Properties of America, Inc. (REIT), Class A | 5,190 | 66,017 | ||||||
Rexford Industrial Realty, Inc. (REIT) | 473 | 6,244 | ||||||
RLJ Lodging Trust (REIT) | 4,685 | 113,939 | ||||||
Rouse Properties, Inc. (REIT) | 882 | 19,572 | ||||||
Ryman Hospitality Properties, Inc. (REIT) | 637 | 26,614 | ||||||
Sabra Health Care REIT, Inc. (REIT) | 921 | 24,075 | ||||||
Select Income REIT (REIT) | 965 | 25,804 | ||||||
Senior Housing Properties Trust (REIT) | 6,834 | 151,920 | ||||||
Silver Bay Realty Trust Corp. (REIT) | 58,218 | $ | 930,906 | |||||
Sovran Self Storage, Inc. (REIT) | 123 | 8,016 | ||||||
Spirit Realty Capital, Inc. (REIT) | 11,373 | 111,797 | ||||||
STAG Industrial, Inc. (REIT) | 1,680 | 34,255 | ||||||
Strategic Hotels & Resorts, Inc. (REIT)* | 1,159 | 10,953 | ||||||
Summit Hotel Properties, Inc. (REIT) | 3,044 | 27,396 | ||||||
Sunstone Hotel Investors, Inc. (REIT) | 6,958 | 93,237 | ||||||
Taubman Centers, Inc. (REIT) | 2,019 | 129,054 | ||||||
Terreno Realty Corp. (REIT) | 1,064 | 18,833 | ||||||
Two Harbors Investment Corp. (REIT) | 13,875 | 128,760 | ||||||
UMH Properties, Inc. (REIT) | 726 | 6,839 | ||||||
Urstadt Biddle Properties, Inc. (REIT), Class A | 222 | 4,096 | ||||||
Washington Real Estate Investment Trust (REIT) | 1,867 | 43,613 | ||||||
Weingarten Realty Investors (REIT) | 4,698 | 128,819 | ||||||
Western Asset Mortgage Capital Corp. (REIT) | 1,096 | 16,308 | ||||||
Whitestone REIT (REIT) | 971 | 12,982 | ||||||
Winthrop Realty Trust (REIT) | 1,223 | 13,514 | ||||||
WP Carey, Inc. (REIT) | 2,264 | 138,896 | ||||||
ZAIS Financial Corp. (REIT) | 81 | 1,298 | ||||||
|
| |||||||
| 15,165,971 | ||||||||
|
| |||||||
Real Estate Management & Development (1.3%) |
| |||||||
Alexander & Baldwin, Inc. | 1,653 | 68,980 | ||||||
Altisource Residential Corp. | 1,657 | 49,892 | ||||||
AV Homes, Inc.* | 380 | 6,905 | ||||||
Consolidated-Tomoka Land Co. | 220 | 7,984 | ||||||
Forest City Enterprises, Inc., Class A* | 6,032 | 115,211 | ||||||
Forestar Group, Inc.* | 1,200 | 25,524 | ||||||
Howard Hughes Corp.* | 18,414 | 2,211,521 | ||||||
Jones Lang LaSalle, Inc. | 1,710 | 175,087 | ||||||
Kennedy-Wilson Holdings, Inc. | 1,962 | 43,655 | ||||||
RE/MAX Holdings, Inc., Class A* | 315 | 10,102 | ||||||
Realogy Holdings Corp.* | 6,803 | 336,544 | ||||||
St. Joe Co.* | 2,110 | 40,491 | ||||||
Tejon Ranch Co.* | 42 | 1,544 | ||||||
|
| |||||||
| 3,093,440 | ||||||||
|
| |||||||
Thrifts & Mortgage Finance (1.5%) | ||||||||
Astoria Financial Corp. | 3,302 | 45,667 | ||||||
Banc of California, Inc. | 655 | 8,784 | ||||||
Bank Mutual Corp. | 1,794 | 12,576 | ||||||
BankFinancial Corp. | 775 | 7,099 | ||||||
BBX Capital Corp., Class A* | 264 | 4,118 | ||||||
Beneficial Mutual Bancorp, Inc.* | 1,235 | 13,486 | ||||||
Berkshire Hills Bancorp, Inc. | 974 | 26,561 | ||||||
Brookline Bancorp, Inc. | 2,724 | 26,069 | ||||||
Capitol Federal Financial, Inc. | 5,560 | 67,332 | ||||||
Charter Financial Corp./Maryland | 855 | 9,208 | ||||||
Clifton Savings Bancorp, Inc. | 326 | 4,173 | ||||||
Dime Community Bancshares, Inc. | 1,228 | 20,778 | ||||||
See Notes to Financial Statements.
154
AXA PREMIER VIP TRUST
MULTIMANAGER MID CAP VALUE PORTFOLIO
PORTFOLIO OF INVESTMENTS (Continued)
December 31, 2013
| Number of Shares | Value (Note 1) | |||||||
Doral Financial Corp.* | 265 | $ | 4,150 | |||||
ESB Financial Corp. | 447 | 6,347 | ||||||
ESSA Bancorp, Inc. | 368 | 4,254 | ||||||
Essent Group Ltd.* | 13,525 | 325,411 | ||||||
EverBank Financial Corp. | 3,075 | 56,395 | ||||||
Farmer Mac, Class C | 392 | 13,426 | ||||||
First Defiance Financial Corp. | 388 | 10,076 | ||||||
First Federal Bancshares of Arkansas, Inc.* | 95 | 827 | ||||||
First Financial Northwest, Inc. | 619 | 6,419 | ||||||
Flagstar Bancorp, Inc.* | 756 | 14,833 | ||||||
Fox Chase Bancorp, Inc. | 452 | 7,856 | ||||||
Franklin Financial Corp./Virginia* | 437 | 8,644 | ||||||
Hingham Institution for Savings | 62 | 4,866 | ||||||
Home Bancorp, Inc.* | 242 | 4,562 | ||||||
Home Loan Servicing Solutions Ltd. | 2,740 | 62,938 | ||||||
HomeStreet, Inc. | 492 | 9,840 | ||||||
Hudson City Bancorp, Inc. | 20,062 | 189,185 | ||||||
Kearny Financial Corp.* | 578 | 6,722 | ||||||
Meridian Interstate Bancorp, Inc.* | 298 | 6,729 | ||||||
Meta Financial Group, Inc. | 236 | 9,518 | ||||||
MGIC Investment Corp.* | 176,036 | 1,485,744 | ||||||
NASB Financial, Inc. | 166 | 5,013 | ||||||
Nationstar Mortgage Holdings, Inc.* | 6,570 | 242,827 | ||||||
Northfield Bancorp, Inc./New Jersey | 1,726 | 22,783 | ||||||
Northwest Bancshares, Inc. | 3,583 | 52,957 | ||||||
OceanFirst Financial Corp. | 521 | 8,925 | ||||||
Oritani Financial Corp. | 1,223 | 19,629 | ||||||
PennyMac Financial Services, Inc., Class A* | 487 | 8,547 | ||||||
People’s United Financial, Inc. | 11,844 | 179,081 | ||||||
Provident Financial Holdings, Inc. | 343 | 5,145 | ||||||
Provident Financial Services, Inc. | 2,250 | 43,470 | ||||||
Radian Group, Inc. | 4,793 | 67,677 | ||||||
Rockville Financial, Inc. | 967 | 13,741 | ||||||
Sterling Bancorp/Delaware | 3,212 | 42,944 | ||||||
Territorial Bancorp, Inc. | 400 | 9,280 | ||||||
TFS Financial Corp.* | 3,034 | 36,757 | ||||||
Tree.com, Inc.* | 124 | 4,072 | ||||||
TrustCo Bank Corp. | 3,692 | 26,509 | ||||||
United Community Financial Corp./Ohio* | 1,758 | 6,276 | ||||||
United Financial Bancorp, Inc. | 760 | 14,356 | ||||||
Walker & Dunlop, Inc.* | 647 | 10,462 | ||||||
Washington Federal, Inc. | 3,929 | 91,506 | ||||||
Waterstone Financial, Inc.* | 273 | 3,030 | ||||||
Westfield Financial, Inc. | 591 | 4,409 | ||||||
WSFS Financial Corp. | 298 | 23,104 | ||||||
|
| |||||||
| 3,427,093 | ||||||||
|
| |||||||
Total Financials | 63,798,437 | |||||||
|
| |||||||
Health Care (5.9%) | ||||||||
Biotechnology (0.2%) | ||||||||
ACADIA Pharmaceuticals, Inc.* | 154 | 3,848 | ||||||
Agios Pharmaceuticals, Inc.* | 44 | 1,054 | ||||||
Alnylam Pharmaceuticals, Inc.* | 131 | 8,427 | ||||||
Arena Pharmaceuticals, Inc.* | 1,007 | 5,891 | ||||||
AVEO Pharmaceuticals, Inc.* | 1,992 | $ | 3,665 | |||||
Bluebird Bio, Inc.* | 47 | 986 | ||||||
Celldex Therapeutics, Inc.* | 259 | 6,270 | ||||||
Curis, Inc.* | 733 | 2,067 | ||||||
Cytokinetics, Inc.* | 185 | 1,202 | ||||||
Cytori Therapeutics, Inc.* | 533 | 1,370 | ||||||
Dynavax Technologies Corp.* | 1,484 | 2,909 | ||||||
Emergent Biosolutions, Inc.* | 878 | 20,185 | ||||||
Enzon Pharmaceuticals, Inc. | 1,441 | 1,672 | ||||||
Esperion Therapeutics, Inc.* | 64 | 879 | ||||||
Geron Corp.* | 5,041 | 23,894 | ||||||
Harvard Apparatus Regenerative Technology, Inc.* | 234 | 1,112 | ||||||
Idenix Pharmaceuticals, Inc.* | 558 | 3,337 | ||||||
ImmunoGen, Inc.* | 804 | 11,795 | ||||||
Immunomedics, Inc.* | 146 | 672 | ||||||
InterMune, Inc.* | 241 | 3,550 | ||||||
Intrexon Corp.* | 54 | 1,285 | ||||||
Lexicon Pharmaceuticals, Inc.* | 765 | 1,377 | ||||||
Momenta Pharmaceuticals, Inc.* | 322 | 5,693 | ||||||
NPS Pharmaceuticals, Inc.* | 1,382 | 41,958 | ||||||
Onconova Therapeutics, Inc.* | 44 | 505 | ||||||
Progenics Pharmaceuticals, Inc.* | 368 | 1,961 | ||||||
Prothena Corp. plc* | 553 | 14,666 | ||||||
PTC Therapeutics, Inc.* | 56 | 950 | ||||||
Quintiles Transnational Holdings, Inc.* | 8,093 | 375,030 | ||||||
Rigel Pharmaceuticals, Inc.* | 3,360 | 9,576 | ||||||
Spectrum Pharmaceuticals, Inc.* | 2,465 | 21,815 | ||||||
Targacept, Inc.* | 1,095 | 4,544 | ||||||
Vical, Inc.* | 338 | 399 | ||||||
XOMA Corp.* | 305 | 2,053 | ||||||
|
| |||||||
| 586,597 | ||||||||
|
| |||||||
Health Care Equipment & Supplies (1.5%) |
| |||||||
Alere, Inc.* | 3,078 | 111,424 | ||||||
Alphatec Holdings, Inc.* | 2,345 | 4,713 | ||||||
Analogic Corp. | 256 | 22,671 | ||||||
AngioDynamics, Inc.* | 946 | 16,262 | ||||||
Anika Therapeutics, Inc.* | 189 | 7,212 | ||||||
ArthroCare Corp.* | 200 | 8,048 | ||||||
Boston Scientific Corp.* | 112,602 | 1,353,476 | ||||||
CareFusion Corp.* | 5,907 | 235,217 | ||||||
CONMED Corp. | 1,051 | 44,667 | ||||||
Cooper Cos., Inc. | 486 | 60,186 | ||||||
CryoLife, Inc. | 965 | 10,702 | ||||||
Cutera, Inc.* | 551 | 5,609 | ||||||
Cynosure, Inc., Class A* | 484 | 12,913 | ||||||
Derma Sciences, Inc.* | 527 | 5,702 | ||||||
Exactech, Inc.* | 283 | 6,724 | ||||||
Greatbatch, Inc.* | 11,628 | 514,423 | ||||||
Hill-Rom Holdings, Inc. | 2,252 | 93,098 | ||||||
Hologic, Inc.* | 7,295 | 163,043 | ||||||
ICU Medical, Inc.* | 50 | 3,185 | ||||||
Integra LifeSciences Holdings Corp.* | 392 | 18,702 | ||||||
Invacare Corp. | 1,234 | 28,641 | ||||||
Medical Action Industries, Inc.* | 326 | 2,791 | ||||||
Merit Medical Systems, Inc.* | 1,642 | 25,845 | ||||||
Natus Medical, Inc.* | 485 | 10,913 | ||||||
Navidea Biopharmaceuticals, Inc.* | 633 | 1,310 | ||||||
See Notes to Financial Statements.
155
AXA PREMIER VIP TRUST
MULTIMANAGER MID CAP VALUE PORTFOLIO
PORTFOLIO OF INVESTMENTS (Continued)
December 31, 2013
| Number of Shares | Value (Note 1) | |||||||
NuVasive, Inc.* | 1,347 | $ | 43,549 | |||||
OraSure Technologies, Inc.* | 2,117 | 13,316 | ||||||
Orthofix International N.V.* | 22,805 | 520,410 | ||||||
PhotoMedex, Inc.* | 363 | 4,701 | ||||||
Rockwell Medical, Inc.* | 1,260 | 13,154 | ||||||
RTI Surgical, Inc.* | 2,145 | 7,593 | ||||||
Solta Medical, Inc.* | 2,608 | 7,694 | ||||||
STAAR Surgical Co.* | 92 | 1,489 | ||||||
Symmetry Medical, Inc.* | 1,433 | 14,445 | ||||||
Teleflex, Inc. | 1,582 | 148,487 | ||||||
Tornier N.V.* | 997 | 18,734 | ||||||
Wright Medical Group, Inc.* | 1,566 | 48,092 | ||||||
|
| |||||||
| 3,609,141 | ||||||||
|
| |||||||
Health Care Providers & Services (1.9%) |
| |||||||
Addus HomeCare Corp.* | 185 | 4,153 | ||||||
Alliance HealthCare Services, Inc.* | 101 | 2,499 | ||||||
Almost Family, Inc.* | 327 | 10,572 | ||||||
Amedisys, Inc.* | 1,208 | 17,673 | ||||||
Amsurg Corp.* | 851 | 39,078 | ||||||
BioScrip, Inc.* | 1,719 | 12,721 | ||||||
Chindex International, Inc.* | 364 | 6,345 | ||||||
Community Health Systems, Inc.* | 7,455 | 292,758 | ||||||
Cross Country Healthcare, Inc.* | 1,039 | 10,369 | ||||||
Ensign Group, Inc. | 52 | 2,302 | ||||||
Envision Healthcare Holdings, Inc.* | 676 | 24,012 | ||||||
ExamWorks Group, Inc.* | 13,100 | 391,297 | ||||||
Five Star Quality Care, Inc.* | 1,591 | 8,735 | ||||||
Hanger, Inc.* | 8,944 | 351,857 | ||||||
Health Net, Inc.* | 3,025 | 89,752 | ||||||
HealthSouth Corp. | 538 | 17,926 | ||||||
Healthways, Inc.* | 464 | 7,122 | ||||||
Kindred Healthcare, Inc. | 2,023 | 39,934 | ||||||
LHC Group, Inc.* | 427 | 10,265 | ||||||
LifePoint Hospitals, Inc.* | 1,801 | 95,165 | ||||||
Magellan Health Services, Inc.* | 1,025 | 61,408 | ||||||
MEDNAX, Inc.* | 10,470 | 558,889 | ||||||
National Healthcare Corp. | 385 | 20,755 | ||||||
National Research Corp., Class A* | 221 | 4,159 | ||||||
Omnicare, Inc. | 3,999 | 241,380 | ||||||
Owens & Minor, Inc. | 1,877 | 68,623 | ||||||
Patterson Cos., Inc. | 371 | 15,285 | ||||||
PharMerica Corp.* | 1,147 | 24,660 | ||||||
Premier, Inc., Class A* | 436 | 16,027 | ||||||
Quest Diagnostics, Inc. | 17,088 | 914,892 | ||||||
Select Medical Holdings Corp. | 1,909 | 22,163 | ||||||
Skilled Healthcare Group, Inc., Class A* | 63 | 303 | ||||||
Surgical Care Affiliates, Inc.* | 220 | 7,665 | ||||||
Team Health Holdings, Inc.* | 8,481 | 386,310 | ||||||
Triple-S Management Corp., Class B* | 789 | 15,338 | ||||||
Universal American Corp. | 45,998 | 335,785 | ||||||
Universal Health Services, Inc., Class B | 1,132 | 91,986 | ||||||
USMD Holdings, Inc.* | 36 | 724 | ||||||
VCA Antech, Inc.* | 3,378 | 105,934 | ||||||
WellCare Health Plans, Inc.* | 1,660 | 116,897 | ||||||
|
| |||||||
| 4,443,718 | ||||||||
|
| |||||||
Health Care Technology (0.6%) | ||||||||
Allscripts Healthcare Solutions, Inc.* | 6,795 | $ | 105,051 | |||||
Omnicell, Inc.* | 588 | 15,012 | ||||||
Quality Systems, Inc. | 55,756 | 1,174,221 | ||||||
Vocera Communications, Inc.* | 163 | 2,544 | ||||||
|
| |||||||
| 1,296,828 | ||||||||
|
| |||||||
Life Sciences Tools & Services (0.9%) |
| |||||||
Affymetrix, Inc.* | 2,764 | 23,687 | ||||||
Albany Molecular Research, Inc.* | 890 | 8,971 | ||||||
Bio-Rad Laboratories, Inc., Class A* | 791 | 97,776 | ||||||
Cambrex Corp.* | 600 | 10,698 | ||||||
Charles River Laboratories International, Inc.* | 1,042 | 55,268 | ||||||
Harvard Bioscience, Inc.* | 58,080 | 272,976 | ||||||
Life Technologies Corp.* | 6,633 | 502,781 | ||||||
Pacific Biosciences of California, Inc.* | 1,771 | 9,262 | ||||||
PerkinElmer, Inc. | 18,331 | 755,787 | ||||||
QIAGEN N.V.* | 8,892 | 211,719 | ||||||
Techne Corp. | 758 | 71,760 | ||||||
|
| |||||||
| 2,020,685 | ||||||||
|
| |||||||
Pharmaceuticals (0.8%) | ||||||||
Actavis plc* | 4,081 | 685,608 | ||||||
Aratana Therapeutics, Inc.* | 79 | 1,509 | ||||||
Cornerstone Therapeutics, Inc.* | 428 | 4,062 | ||||||
Forest Laboratories, Inc.* | 19,004 | 1,140,810 | ||||||
Hi-Tech Pharmacal Co., Inc.* | 285 | 12,366 | ||||||
Horizon Pharma, Inc.* | 945 | 7,201 | ||||||
Impax Laboratories, Inc.* | 2,606 | 65,515 | ||||||
Nektar Therapeutics* | 1,380 | 15,663 | ||||||
Pernix Therapeutics Holdings* | 650 | 1,638 | ||||||
Pozen, Inc.* | 1,010 | 8,120 | ||||||
Sciclone Pharmaceuticals, Inc.* | 556 | 2,802 | ||||||
XenoPort, Inc.* | 1,405 | 8,079 | ||||||
|
| |||||||
| 1,953,373 | ||||||||
|
| |||||||
Total Health Care | 13,910,342 | |||||||
|
| |||||||
Industrials (10.6%) | ||||||||
Aerospace & Defense (1.4%) | ||||||||
AAR Corp. | 1,493 | 41,819 | ||||||
Aerovironment, Inc.* | 714 | 20,799 | ||||||
Alliant Techsystems, Inc. | 1,234 | 150,153 | ||||||
American Science & Engineering, Inc. | 267 | 19,200 | ||||||
API Technologies Corp.* | 1,308 | 4,460 | ||||||
B/E Aerospace, Inc.* | 243 | 21,148 | ||||||
Cubic Corp. | 711 | 37,441 | ||||||
Curtiss-Wright Corp. | 1,759 | 109,462 | ||||||
DigitalGlobe, Inc.* | 2,847 | 117,154 | ||||||
Ducommun, Inc.* | 405 | 12,073 | ||||||
Engility Holdings, Inc.* | 658 | 21,977 | ||||||
Erickson Air-Crane, Inc.* | 44 | 915 | ||||||
Esterline Technologies Corp.* | 1,182 | 120,517 | ||||||
Exelis, Inc. | 111,745 | 2,129,860 | ||||||
GenCorp, Inc.* | 509 | 9,172 | ||||||
KEYW Holding Corp.* | 755 | 10,147 | ||||||
Kratos Defense & Security Solutions, Inc.* | 1,678 | 12,887 | ||||||
LMI Aerospace, Inc.* | 355 | 5,233 | ||||||
See Notes to Financial Statements.
156
AXA PREMIER VIP TRUST
MULTIMANAGER MID CAP VALUE PORTFOLIO
PORTFOLIO OF INVESTMENTS (Continued)
December 31, 2013
| Number of Shares | Value (Note 1) | |||||||
Moog, Inc., Class A* | 1,568 | $ | 106,530 | |||||
National Presto Industries, Inc.* | 152 | 12,236 | ||||||
Orbital Sciences Corp.* | 2,272 | 52,938 | ||||||
Sparton Corp.* | 383 | 10,705 | ||||||
Spirit AeroSystems Holdings, Inc., Class A* | 3,987 | 135,877 | ||||||
Teledyne Technologies, Inc.* | 983 | 90,298 | ||||||
Triumph Group, Inc. | 1,566 | 119,126 | ||||||
|
| |||||||
| 3,372,127 | ||||||||
|
| |||||||
Air Freight & Logistics (0.6%) | ||||||||
Air Transport Services Group, Inc.* | 1,968 | 15,921 | ||||||
Atlas Air Worldwide Holdings, Inc.* | 961 | 39,545 | ||||||
Hub Group, Inc., Class A* | 32,247 | 1,286,010 | ||||||
Pacer International, Inc.* | 1,201 | 9,920 | ||||||
UTi Worldwide, Inc. | 937 | 16,454 | ||||||
XPO Logistics, Inc.* | 851 | 22,373 | ||||||
|
| |||||||
| 1,390,223 | ||||||||
|
| |||||||
Airlines (1.2%) | ||||||||
Alaska Air Group, Inc. | 218 | 15,995 | ||||||
American Airlines Group, Inc.* | 21,700 | 547,925 | ||||||
Hawaiian Holdings, Inc.* | 1,991 | 19,173 | ||||||
JetBlue Airways Corp.* | 8,804 | 75,274 | ||||||
Republic Airways Holdings, Inc.* | 908 | 9,706 | ||||||
SkyWest, Inc. | 1,796 | 26,635 | ||||||
Southwest Airlines Co. | 93,670 | 1,764,743 | ||||||
Spirit Airlines, Inc.* | 6,622 | 300,705 | ||||||
|
| |||||||
| 2,760,156 | ||||||||
|
| |||||||
Building Products (0.3%) | ||||||||
A.O. Smith Corp. | 1,689 | 91,105 | ||||||
Apogee Enterprises, Inc. | 303 | 10,881 | ||||||
Fortune Brands Home & Security, Inc. | 6,693 | 305,870 | ||||||
Gibraltar Industries, Inc.* | 1,180 | 21,936 | ||||||
Griffon Corp. | 1,605 | 21,202 | ||||||
Insteel Industries, Inc. | 65 | 1,477 | ||||||
NCI Building Systems, Inc.* | 134 | 2,350 | ||||||
Owens Corning, Inc.* | 4,529 | 184,421 | ||||||
Ply Gem Holdings, Inc.* | 59 | 1,064 | ||||||
Quanex Building Products Corp. | 1,420 | 28,286 | ||||||
Simpson Manufacturing Co., Inc. | 1,389 | 51,018 | ||||||
Universal Forest Products, Inc. | 742 | 38,688 | ||||||
|
| |||||||
| 758,298 | ||||||||
|
| |||||||
Commercial Services & Supplies (0.7%) |
| |||||||
ABM Industries, Inc. | 2,047 | 58,524 | ||||||
ACCO Brands Corp.* | 4,375 | 29,400 | ||||||
ARC Document Solutions, Inc.* | 1,419 | 11,664 | ||||||
Brink’s Co. | 15,057 | 514,046 | ||||||
Casella Waste Systems, Inc., Class A* | 166 | 963 | ||||||
CECO Environmental Corp. | 330 | 5,336 | ||||||
Cenveo, Inc.* | 1,062 | 3,653 | ||||||
Cintas Corp. | 2,817 | 167,865 | ||||||
CompX International, Inc. | 50 | 704 | ||||||
Consolidated Graphics, Inc.* | 285 | 19,220 | ||||||
Costa, Inc.* | 58 | 1,260 | ||||||
Courier Corp. | 436 | 7,887 | ||||||
Covanta Holding Corp. | 4,014 | $ | 71,249 | |||||
Deluxe Corp. | 666 | 34,759 | ||||||
EnerNOC, Inc.* | 664 | 11,427 | ||||||
Ennis, Inc. | 1,008 | 17,842 | ||||||
G&K Services, Inc., Class A | 606 | 37,711 | ||||||
Heritage-Crystal Clean, Inc.* | 49 | 1,004 | ||||||
HNI Corp. | 61 | 2,369 | ||||||
Intersections, Inc. | 374 | 2,913 | ||||||
KAR Auction Services, Inc. | 1,826 | 53,958 | ||||||
Kimball International, Inc., Class B | 1,213 | 18,231 | ||||||
Knoll, Inc. | 596 | 10,913 | ||||||
McGrath RentCorp | 500 | 19,900 | ||||||
Mobile Mini, Inc.* | 1,304 | 53,699 | ||||||
Multi-Color Corp. | 193 | 7,284 | ||||||
NL Industries, Inc. | 312 | 3,488 | ||||||
Pitney Bowes, Inc. | 4,364 | 101,681 | ||||||
Quad/Graphics, Inc. | 921 | 25,079 | ||||||
R.R. Donnelley & Sons Co. | 3,135 | 63,578 | ||||||
Schawk, Inc. | 492 | 7,316 | ||||||
SP Plus Corp.* | 198 | 5,156 | ||||||
Steelcase, Inc., Class A | 2,794 | 44,313 | ||||||
Swisher Hygiene, Inc.* | 3,980 | 2,046 | ||||||
Tetra Tech, Inc.* | 2,273 | 63,599 | ||||||
TRC Cos., Inc.* | 564 | 4,027 | ||||||
UniFirst Corp. | 248 | 26,536 | ||||||
United Stationers, Inc. | 1,538 | 70,579 | ||||||
Viad Corp. | 776 | 21,557 | ||||||
Waste Connections, Inc. | 4,336 | 189,180 | ||||||
West Corp. | 279 | 7,173 | ||||||
|
| |||||||
| 1,799,089 | ||||||||
|
| |||||||
Construction & Engineering (1.0%) | ||||||||
AECOM Technology Corp.* | 3,516 | 103,476 | ||||||
Aegion Corp.* | 1,276 | 27,932 | ||||||
Ameresco, Inc., Class A* | 744 | 7,187 | ||||||
Argan, Inc. | 526 | 14,497 | ||||||
Comfort Systems USA, Inc. | 1,062 | 20,592 | ||||||
Dycom Industries, Inc.* | 804 | 22,343 | ||||||
EMCOR Group, Inc. | 2,525 | 107,161 | ||||||
Furmanite Corp.* | 608 | 6,457 | ||||||
Granite Construction, Inc. | 1,449 | 50,686 | ||||||
Great Lakes Dredge & Dock Corp.* | 2,092 | 19,247 | ||||||
Jacobs Engineering Group, Inc.* | 6,874 | 432,993 | ||||||
KBR, Inc. | 5,627 | 179,445 | ||||||
Layne Christensen Co.* | 49,689 | 848,688 | ||||||
MYR Group, Inc.* | 811 | 20,340 | ||||||
Northwest Pipe Co.* | 370 | 13,971 | ||||||
Orion Marine Group, Inc.* | 1,061 | 12,764 | ||||||
Pike Corp.* | 512 | 5,412 | ||||||
Quanta Services, Inc.* | 6,309 | 199,112 | ||||||
Sterling Construction Co., Inc.* | 607 | 7,120 | ||||||
Tutor Perini Corp.* | 1,384 | 36,399 | ||||||
URS Corp. | 2,887 | 152,982 | ||||||
|
| |||||||
| 2,288,804 | ||||||||
|
| |||||||
Electrical Equipment (1.0%) | ||||||||
American Superconductor Corp.* | 1,755 | 2,878 | ||||||
Babcock & Wilcox Co. | 49,903 | 1,706,184 | ||||||
Brady Corp., Class A | 1,716 | 53,076 | ||||||
See Notes to Financial Statements.
157
AXA PREMIER VIP TRUST
MULTIMANAGER MID CAP VALUE PORTFOLIO
PORTFOLIO OF INVESTMENTS (Continued)
December 31, 2013
| Number of Shares | Value (Note 1) | |||||||
Encore Wire Corp. | 677 | $ | 36,693 | |||||
EnerSys, Inc. | 1,238 | 86,772 | ||||||
Franklin Electric Co., Inc. | 62 | 2,768 | ||||||
General Cable Corp. | 1,737 | 51,085 | ||||||
Global Power Equipment Group, Inc. | 669 | 13,092 | ||||||
GrafTech International Ltd.* | 4,380 | 49,187 | ||||||
Hubbell, Inc., Class B | 628 | 68,389 | ||||||
II-VI, Inc.* | 1,973 | 34,725 | ||||||
LSI Industries, Inc. | 801 | 6,945 | ||||||
Powell Industries, Inc. | 355 | 23,782 | ||||||
Preformed Line Products Co. | 89 | 6,511 | ||||||
Regal-Beloit Corp. | 1,713 | 126,282 | ||||||
Vicor Corp.* | 627 | 8,414 | ||||||
|
| |||||||
| 2,276,783 | ||||||||
|
| |||||||
Industrial Conglomerates (0.1%) | ||||||||
Carlisle Cos., Inc. | 2,302 | 182,779 | ||||||
|
| |||||||
Machinery (2.5%) | ||||||||
Accuride Corp.* | 130 | 485 | ||||||
Actuant Corp., Class A | 2,778 | 101,786 | ||||||
AGCO Corp. | 3,713 | 219,772 | ||||||
Alamo Group, Inc. | 272 | 16,508 | ||||||
Albany International Corp., Class A | 917 | 32,948 | ||||||
American Railcar Industries, Inc. | 348 | 15,921 | ||||||
Ampco-Pittsburgh Corp. | 330 | 6,419 | ||||||
Astec Industries, Inc. | 741 | 28,625 | ||||||
Barnes Group, Inc. | 2,040 | 78,152 | ||||||
Briggs & Stratton Corp. | 1,794 | 39,037 | ||||||
CIRCOR International, Inc. | 625 | 50,488 | ||||||
Columbus McKinnon Corp.* | 630 | 17,098 | ||||||
Commercial Vehicle Group, Inc.* | 249 | 1,810 | ||||||
Crane Co. | 146 | 9,819 | ||||||
Donaldson Co., Inc. | 430 | 18,688 | ||||||
Douglas Dynamics, Inc. | 109 | 1,833 | ||||||
Dover Corp. | 14,789 | 1,427,730 | ||||||
Dynamic Materials Corp. | 508 | 11,044 | ||||||
Energy Recovery, Inc.* | 1,038 | 5,771 | ||||||
EnPro Industries, Inc.* | 409 | 23,579 | ||||||
ESCO Technologies, Inc. | 685 | 23,468 | ||||||
ExOne Co.* | 33 | 1,995 | ||||||
Flow International Corp.* | 1,494 | 6,036 | ||||||
FreightCar America, Inc. | 440 | 11,713 | ||||||
Global Brass & Copper Holdings, Inc. | 220 | 3,641 | ||||||
Gorman-Rupp Co. | 192 | 6,419 | ||||||
Greenbrier Cos., Inc.* | 947 | 31,099 | ||||||
Hardinge, Inc. | 432 | 6,251 | ||||||
Harsco Corp. | 2,863 | 80,250 | ||||||
Hurco Cos., Inc. | 249 | 6,227 | ||||||
IDEX Corp. | 217 | 16,025 | ||||||
ITT Corp. | 14,209 | 616,955 | ||||||
Kadant, Inc. | 428 | 17,343 | ||||||
Kennametal, Inc. | 17,594 | 916,120 | ||||||
L.B. Foster Co., Class A | 392 | 18,538 | ||||||
Lydall, Inc.* | 631 | 11,118 | ||||||
Meritor, Inc.* | 3,759 | 39,206 | ||||||
Miller Industries, Inc. | 435 | 8,104 | ||||||
Navistar International Corp.* | 1,848 | 70,575 | ||||||
NN, Inc. | 671 | 13,547 | ||||||
Oshkosh Corp. | 3,364 | $ | 169,478 | |||||
Parker Hannifin Corp. | 2,496 | 321,085 | ||||||
PMFG, Inc.* | 832 | 7,530 | ||||||
Snap-on, Inc. | 1,975 | 216,302 | ||||||
SPX Corp. | 1,784 | 177,704 | ||||||
Standex International Corp. | 390 | 24,523 | ||||||
Tecumseh Products Co., Class A* | 687 | 6,217 | ||||||
Terex Corp. | 4,248 | 178,374 | ||||||
Timken Co. | 3,289 | 181,125 | ||||||
Titan International, Inc. | 497 | 8,936 | ||||||
Trinity Industries, Inc. | 3,033 | 165,359 | ||||||
Twin Disc, Inc. | 311 | 8,052 | ||||||
Wabash National Corp.* | 2,430 | 30,011 | ||||||
Watts Water Technologies, Inc., Class A | 986 | 61,004 | ||||||
Xylem, Inc. | 12,131 | 419,733 | ||||||
|
| |||||||
| 5,987,576 | ||||||||
|
| |||||||
Marine (0.0%) | ||||||||
International Shipholding Corp. | 222 | 6,549 | ||||||
Kirby Corp.* | 897 | 89,028 | ||||||
Ultrapetrol Bahamas Ltd.* | 753 | 2,816 | ||||||
|
| |||||||
| 98,393 | ||||||||
|
| |||||||
Professional Services (0.6%) | ||||||||
Acacia Research Corp. | 1,363 | 19,818 | ||||||
CBIZ, Inc.* | 1,325 | 12,084 | ||||||
CDI Corp. | 546 | 10,117 | ||||||
CRA International, Inc.* | 401 | 7,940 | ||||||
Dun & Bradstreet Corp. | 125 | 15,344 | ||||||
Franklin Covey Co.* | 90 | 1,789 | ||||||
FTI Consulting, Inc.* | 1,526 | 62,780 | ||||||
Heidrick & Struggles International, Inc. | 704 | 14,179 | ||||||
Huron Consulting Group, Inc.* | 762 | 47,793 | ||||||
ICF International, Inc.* | 764 | 26,518 | ||||||
Kelly Services, Inc., Class A | 1,035 | 25,813 | ||||||
Kforce, Inc. | 89 | 1,821 | ||||||
Korn/Ferry International* | 1,835 | 47,930 | ||||||
Manpowergroup, Inc. | 2,939 | 252,343 | ||||||
Navigant Consulting, Inc.* | 1,909 | 36,653 | ||||||
Odyssey Marine Exploration, Inc.* | 238 | 481 | ||||||
Pendrell Corp.* | 5,360 | 10,774 | ||||||
Resources Connection, Inc. | 1,555 | 22,283 | ||||||
Robert Half International, Inc. | 8,949 | 375,768 | ||||||
RPX Corp.* | 1,080 | 18,252 | ||||||
Towers Watson & Co., Class A | 2,481 | 316,600 | ||||||
VSE Corp. | 153 | 7,345 | ||||||
|
| |||||||
| 1,334,425 | ||||||||
|
| |||||||
Road & Rail (0.6%) | ||||||||
Amerco, Inc.* | 129 | 30,681 | ||||||
Arkansas Best Corp. | 987 | 33,242 | ||||||
Celadon Group, Inc. | 712 | 13,870 | ||||||
Con-way, Inc. | 1,345 | 53,410 | ||||||
Genesee & Wyoming, Inc., Class A* | 4,062 | 390,155 | ||||||
Heartland Express, Inc. | 378 | 7,416 | ||||||
Marten Transport Ltd. | 920 | 18,575 | ||||||
Patriot Transportation Holding, Inc.* | 236 | 9,796 | ||||||
See Notes to Financial Statements.
158
AXA PREMIER VIP TRUST
MULTIMANAGER MID CAP VALUE PORTFOLIO
PORTFOLIO OF INVESTMENTS (Continued)
December 31, 2013
| Number of Shares | Value (Note 1) | |||||||
Quality Distribution, Inc.* | 548 | $ | 7,031 | |||||
Roadrunner Transportation Systems, Inc.* | 343 | 9,244 | ||||||
Ryder System, Inc. | 5,979 | 441,131 | ||||||
Swift Transportation Co.* | 16,700 | 370,907 | ||||||
Werner Enterprises, Inc. | 1,198 | 29,627 | ||||||
YRC Worldwide, Inc.* | 359 | 6,236 | ||||||
|
| |||||||
| 1,421,321 | ||||||||
|
| |||||||
Trading Companies & Distributors (0.6%) |
| |||||||
Aceto Corp. | 832 | 20,808 | ||||||
Air Lease Corp. | 2,699 | 83,885 | ||||||
Aircastle Ltd. | 1,513 | 28,989 | ||||||
Applied Industrial Technologies, Inc. | 106 | 5,204 | ||||||
CAI International, Inc.* | 417 | 9,829 | ||||||
GATX Corp. | 1,754 | 91,506 | ||||||
HD Supply Holdings, Inc.* | 892 | 21,417 | ||||||
Houston Wire & Cable Co. | 457 | 6,115 | ||||||
Kaman Corp. | 360 | 14,303 | ||||||
MRC Global, Inc.* | 1,788 | 57,681 | ||||||
Rush Enterprises, Inc., Class A* | 810 | 24,016 | ||||||
TAL International Group, Inc. | 4,167 | 238,977 | ||||||
Textainer Group Holdings Ltd. | 548 | 22,041 | ||||||
Titan Machinery, Inc.* | 660 | 11,761 | ||||||
United Rentals, Inc.* | 7,130 | 555,783 | ||||||
WESCO International, Inc.* | 1,689 | 153,817 | ||||||
|
| |||||||
| 1,346,132 | ||||||||
|
| |||||||
Transportation Infrastructure (0.0%) |
| |||||||
Wesco Aircraft Holdings, Inc.* | 1,246 | 27,312 | ||||||
|
| |||||||
Total Industrials | 25,043,418 | |||||||
|
| |||||||
Information Technology (6.9%) | ||||||||
Communications Equipment (0.8%) |
| |||||||
ADTRAN, Inc. | 806 | 21,770 | ||||||
Anaren, Inc.* | 412 | 11,532 | ||||||
ARRIS Group, Inc.* | 536 | 13,060 | ||||||
Aviat Networks, Inc.* | 2,375 | 5,368 | ||||||
Bel Fuse, Inc., Class B | 408 | 8,694 | ||||||
Black Box Corp. | 592 | 17,642 | ||||||
Brocade Communications Systems, Inc.* | 16,926 | 150,134 | ||||||
Calix, Inc.* | 241 | 2,323 | ||||||
Ciena Corp.* | 1,023 | 24,480 | ||||||
CommScope Holding Co., Inc.* | 677 | 12,809 | ||||||
Comtech Telecommunications Corp. | 652 | 20,551 | ||||||
Digi International, Inc.* | 1,018 | 12,338 | ||||||
EchoStar Corp., Class A* | 1,530 | 76,072 | ||||||
Emulex Corp.* | 3,019 | 21,616 | ||||||
Extreme Networks, Inc.* | 3,528 | 24,696 | ||||||
Finisar Corp.* | 3,563 | 85,227 | ||||||
Harmonic, Inc.* | 3,875 | 28,598 | ||||||
Infinera Corp.* | 464 | 4,538 | ||||||
JDS Uniphase Corp.* | 2,120 | 27,518 | ||||||
Juniper Networks, Inc.* | 44,567 | 1,005,877 | ||||||
KVH Industries, Inc.* | 99 | 1,290 | ||||||
NETGEAR, Inc.* | 1,447 | 47,664 | ||||||
Numerex Corp., Class A* | 515 | 6,669 | ||||||
Oplink Communications, Inc.* | 630 | 11,718 | ||||||
PC-Tel, Inc. | 624 | 5,972 | ||||||
Plantronics, Inc. | 114 | 5,295 | ||||||
Polycom, Inc.* | 6,571 | $ | 73,792 | |||||
Procera Networks, Inc.* | 647 | 9,718 | ||||||
Riverbed Technology, Inc.* | 343 | 6,201 | ||||||
ShoreTel, Inc.* | 1,954 | 18,133 | ||||||
Sonus Networks, Inc.* | 7,788 | 24,532 | ||||||
Tessco Technologies, Inc. | 201 | 8,104 | ||||||
Westell Technologies, Inc., Class A* | 1,614 | 6,537 | ||||||
|
| |||||||
| 1,800,468 | ||||||||
|
| |||||||
Computers & Peripherals (0.3%) | ||||||||
Avid Technology, Inc.* | 1,210 | 9,862 | ||||||
Cray, Inc.* | 745 | 20,458 | ||||||
Diebold, Inc. | 2,416 | 79,752 | ||||||
Electronics for Imaging, Inc.* | 808 | 31,294 | ||||||
Fusion-io, Inc.* | 888 | 7,912 | ||||||
Hutchinson Technology, Inc.* | 883 | 2,826 | ||||||
Imation Corp.* | 1,277 | 5,976 | ||||||
Immersion Corp.* | 95 | 986 | ||||||
Lexmark International, Inc., Class A | 2,408 | 85,532 | ||||||
QLogic Corp.* | 3,439 | 40,683 | ||||||
Quantum Corp.* | 8,022 | 9,626 | ||||||
Stratasys Ltd.* | 606 | 81,628 | ||||||
Super Micro Computer, Inc.* | 1,217 | 20,884 | ||||||
Synaptics, Inc.* | 7,303 | 378,369 | ||||||
|
| |||||||
| 775,788 | ||||||||
|
| |||||||
Electronic Equipment, Instruments & Components (0.9%) |
| |||||||
Aeroflex Holding Corp.* | 699 | 4,544 | ||||||
Agilysys, Inc.* | 514 | 7,155 | ||||||
Amphenol Corp., Class A | 3,489 | 311,149 | ||||||
Anixter International, Inc. | 425 | 38,182 | ||||||
Arrow Electronics, Inc.* | 3,977 | 215,752 | ||||||
Audience, Inc.* | 371 | 4,319 | ||||||
Avnet, Inc. | 5,206 | 229,637 | ||||||
AVX Corp. | 1,725 | 24,029 | ||||||
Belden, Inc. | 181 | 12,752 | ||||||
Benchmark Electronics, Inc.* | 2,033 | 46,922 | ||||||
CDW Corp. | 681 | 15,908 | ||||||
Checkpoint Systems, Inc.* | 1,582 | 24,948 | ||||||
Coherent, Inc.* | 134 | 9,968 | ||||||
Control4 Corp.* | 143 | 2,531 | ||||||
CTS Corp. | 1,298 | 25,843 | ||||||
Daktronics, Inc. | 1,133 | 17,766 | ||||||
Dolby Laboratories, Inc., Class A* | 1,008 | 38,869 | ||||||
Electro Rent Corp. | 382 | 7,075 | ||||||
Electro Scientific Industries, Inc. | 956 | 10,000 | ||||||
Fabrinet* | 1,094 | 22,493 | ||||||
FARO Technologies, Inc.* | 61 | 3,556 | ||||||
FLIR Systems, Inc. | 1,654 | 49,785 | ||||||
Gerber Scientific, Inc. (Escrow Shares)*†(b) | 1,097 | — | ||||||
GSI Group, Inc.* | 1,159 | 13,027 | ||||||
Ingram Micro, Inc., Class A* | 5,783 | 135,669 | ||||||
Insight Enterprises, Inc.* | 1,625 | 36,904 | ||||||
Itron, Inc.* | 1,494 | 61,896 | ||||||
Jabil Circuit, Inc. | 7,759 | 135,317 | ||||||
Kemet Corp.* | 1,651 | 9,312 | ||||||
Littelfuse, Inc. | 84 | 7,806 | ||||||
Measurement Specialties, Inc.* | 73 | 4,430 | ||||||
See Notes to Financial Statements.
159
AXA PREMIER VIP TRUST
MULTIMANAGER MID CAP VALUE PORTFOLIO
PORTFOLIO OF INVESTMENTS (Continued)
December 31, 2013
| Number of Shares | Value (Note 1) | |||||||
Mercury Systems, Inc.* | 1,241 | $ | 13,589 | |||||
Methode Electronics, Inc. | 604 | 20,651 | ||||||
Multi-Fineline Electronix, Inc.* | 334 | 4,639 | ||||||
Newport Corp.* | 1,504 | 27,177 | ||||||
OSI Systems, Inc.* | 60 | 3,187 | ||||||
Park Electrochemical Corp. | 801 | 23,005 | ||||||
PC Connection, Inc. | 362 | 8,996 | ||||||
Plexus Corp.* | 1,286 | 55,671 | ||||||
RadiSys Corp.* | 933 | 2,137 | ||||||
RealD, Inc.* | 206 | 1,759 | ||||||
Richardson Electronics Ltd. | 462 | 5,248 | ||||||
Rofin-Sinar Technologies, Inc.* | 972 | 26,263 | ||||||
Rogers Corp.* | 406 | 24,969 | ||||||
Sanmina Corp.* | 3,147 | 52,555 | ||||||
ScanSource, Inc.* | 1,045 | 44,339 | ||||||
SYNNEX Corp.* | 1,001 | 67,467 | ||||||
Tech Data Corp.* | 1,432 | 73,891 | ||||||
TTM Technologies, Inc.* | 2,045 | 17,546 | ||||||
Viasystems Group, Inc.* | 152 | 2,079 | ||||||
Vishay Intertechnology, Inc.* | 4,963 | 65,809 | ||||||
Vishay Precision Group, Inc.* | 445 | 6,626 | ||||||
Zygo Corp.* | 631 | 9,326 | ||||||
|
| |||||||
| 2,084,473 | ||||||||
|
| |||||||
Internet Software & Services (0.4%) | ||||||||
Akamai Technologies, Inc.* | 11,865 | 559,791 | ||||||
Angie’s List, Inc.* | 713 | 10,802 | ||||||
AOL, Inc.* | 3,009 | 140,280 | ||||||
Bankrate, Inc.* | 1,787 | 32,059 | ||||||
Bazaarvoice, Inc.* | 824 | 6,526 | ||||||
Blucora, Inc.* | 595 | 17,350 | ||||||
Cvent, Inc.* | 96 | 3,494 | ||||||
Dealertrack Technologies, Inc.* | 188 | 9,039 | ||||||
Demand Media, Inc.* | 1,373 | 7,922 | ||||||
Digital River, Inc.* | 1,346 | 24,901 | ||||||
EarthLink Holdings Corp. | 4,016 | 20,361 | ||||||
Gogo, Inc.* | 203 | 5,036 | ||||||
Internap Network Services Corp.* | 2,045 | 15,378 | ||||||
IntraLinks Holdings, Inc.* | 1,464 | 17,729 | ||||||
Limelight Networks, Inc.* | 2,033 | 4,025 | ||||||
Marchex, Inc., Class B* | 874 | 7,560 | ||||||
Monster Worldwide, Inc.* | 3,946 | 28,135 | ||||||
Perficient, Inc.* | 1,115 | 26,113 | ||||||
QuinStreet, Inc.* | 1,191 | 10,350 | ||||||
RealNetworks, Inc.* | 894 | 6,750 | ||||||
Responsys, Inc.* | 172 | 4,715 | ||||||
Shutterstock, Inc.* | 97 | 8,112 | ||||||
TechTarget, Inc.* | 491 | 3,368 | ||||||
Textura Corp.* | 72 | 2,156 | ||||||
United Online, Inc. | 512 | 7,045 | ||||||
Unwired Planet, Inc.* | 256 | 353 | ||||||
Vocus, Inc.* | 655 | 7,461 | ||||||
|
| |||||||
| 986,811 | ||||||||
|
| |||||||
IT Services (2.7%) | ||||||||
Acxiom Corp.* | 8,741 | 323,242 | ||||||
Alliance Data Systems Corp.* | 1,771 | 465,649 | ||||||
Amdocs Ltd. | 10,551 | 435,123 | ||||||
Broadridge Financial Solutions, Inc. | 11,216 | 443,256 | ||||||
CACI International, Inc., Class A* | 879 | 64,360 | ||||||
Cardtronics, Inc.* | 4,700 | $ | 204,215 | |||||
CIBER, Inc.* | 2,883 | 11,936 | ||||||
Convergys Corp. | 3,985 | 83,884 | ||||||
CoreLogic, Inc.* | 3,612 | 128,334 | ||||||
CSG Systems International, Inc. | 8,143 | 239,404 | ||||||
DST Systems, Inc. | 236 | 21,415 | ||||||
Fidelity National Information Services, Inc. | 10,468 | 561,922 | ||||||
Global Cash Access Holdings, Inc.* | 2,553 | 25,504 | ||||||
Hackett Group, Inc. | 637 | 3,956 | ||||||
iGATE Corp.* | 2,700 | 108,432 | ||||||
Leidos Holdings, Inc. | 29,683 | 1,379,963 | ||||||
Lender Processing Services, Inc. | 532 | 19,886 | ||||||
Luxoft Holding, Inc.* | 46 | 1,747 | ||||||
ManTech International Corp., Class A | 868 | 25,979 | ||||||
ModusLink Global Solutions, Inc.* | 1,557 | 8,922 | ||||||
MoneyGram International, Inc.* | 625 | 12,988 | ||||||
PRGX Global, Inc.* | 1,068 | 7,177 | ||||||
Sapient Corp.* | 23,672 | 410,946 | ||||||
Science Applications International Corp. | 16,939 | 560,173 | ||||||
Sykes Enterprises, Inc.* | 1,462 | 31,886 | ||||||
TeleTech Holdings, Inc.* | 257 | 6,153 | ||||||
Total System Services, Inc. | 1,406 | 46,792 | ||||||
Unisys Corp.* | 1,620 | 54,383 | ||||||
Vantiv, Inc., Class A* | 19,790 | 645,352 | ||||||
VeriFone Systems, Inc.* | 4,138 | 110,981 | ||||||
|
| |||||||
| 6,443,960 | ||||||||
|
| |||||||
Office Electronics (0.0%) | ||||||||
Zebra Technologies Corp., Class A* | 1,763 | 95,343 | ||||||
|
| |||||||
Semiconductors & Semiconductor Equipment (1.0%) |
| |||||||
Advanced Energy Industries, Inc.* | 113 | 2,583 | ||||||
Alpha & Omega Semiconductor Ltd.* | 630 | 4,857 | ||||||
Amkor Technology, Inc.* | 2,698 | 16,539 | ||||||
ANADIGICS, Inc.* | 3,159 | 5,813 | ||||||
ATMI, Inc.* | 1,234 | 37,279 | ||||||
Axcelis Technologies, Inc.* | 4,313 | 10,524 | ||||||
Brooks Automation, Inc. | 2,549 | 26,739 | ||||||
CEVA, Inc.* | 853 | 12,983 | ||||||
Cirrus Logic, Inc.* | 1,462 | 29,869 | ||||||
Cohu, Inc. | 926 | 9,723 | ||||||
Diodes, Inc.* | 317 | 7,469 | ||||||
DSP Group, Inc.* | 774 | 7,516 | ||||||
Entegris, Inc.* | 4,532 | 52,571 | ||||||
Entropic Communications, Inc.* | 3,462 | 16,306 | ||||||
Fairchild Semiconductor International, Inc.* | 4,801 | 64,093 | ||||||
First Solar, Inc.* | 2,598 | 141,955 | ||||||
FormFactor, Inc.* | 2,053 | 12,359 | ||||||
Freescale Semiconductor Ltd.* | 1,190 | 19,100 | ||||||
GSI Technology, Inc.* | 755 | 5,013 | ||||||
GT Advanced Technologies, Inc.* | 886 | 7,726 | ||||||
Inphi Corp.* | 634 | 8,179 | ||||||
Integrated Device Technology, Inc.* | 3,491 | 35,573 | ||||||
Integrated Silicon Solution, Inc.* | 1,079 | 13,045 | ||||||
See Notes to Financial Statements.
160
AXA PREMIER VIP TRUST
MULTIMANAGER MID CAP VALUE PORTFOLIO
PORTFOLIO OF INVESTMENTS (Continued)
December 31, 2013
| Number of Shares | Value (Note 1) | |||||||
International Rectifier Corp.* | 2,618 | $ | 68,251 | |||||
Intersil Corp., Class A | 4,792 | 54,964 | ||||||
IXYS Corp. | 908 | 11,777 | ||||||
Kopin Corp.* | 2,466 | 10,407 | ||||||
Lam Research Corp.* | 7,410 | 403,474 | ||||||
Lattice Semiconductor Corp.* | 3,371 | 18,574 | ||||||
Linear Technology Corp. | 7,788 | 354,743 | ||||||
LSI Corp. | 18,483 | 203,683 | ||||||
LTX-Credence Corp.* | 1,795 | 14,342 | ||||||
MA-COM Technology Solutions Holdings, Inc.* | 47 | 799 | ||||||
Microsemi Corp.* | 800 | 19,960 | ||||||
MKS Instruments, Inc. | 1,986 | 59,461 | ||||||
MoSys, Inc.* | 296 | 1,634 | ||||||
Nanometrics, Inc.* | 302 | 5,753 | ||||||
NeoPhotonics Corp.* | 772 | 5,450 | ||||||
OmniVision Technologies, Inc.* | 1,851 | 31,837 | ||||||
ON Semiconductor Corp.* | 897 | 7,391 | ||||||
Pericom Semiconductor Corp.* | 858 | 7,602 | ||||||
Photronics, Inc.* | 2,345 | 21,175 | ||||||
PLX Technology, Inc.* | 126 | 829 | ||||||
PMC-Sierra, Inc.* | 4,328 | 27,829 | ||||||
RF Micro Devices, Inc.* | 1,424 | 7,348 | ||||||
Rubicon Technology, Inc.* | 576 | 5,731 | ||||||
Rudolph Technologies, Inc.* | 1,064 | 12,491 | ||||||
Sigma Designs, Inc.* | 1,210 | 5,711 | ||||||
Silicon Laboratories, Inc.* | 221 | 9,572 | ||||||
Skyworks Solutions, Inc.* | 1,249 | 35,671 | ||||||
Spansion, Inc., Class A* | 1,825 | 25,349 | ||||||
Supertex, Inc.* | 375 | 9,394 | ||||||
Teradyne, Inc.* | 7,282 | 128,309 | ||||||
Tessera Technologies, Inc. | 1,968 | 38,789 | ||||||
TriQuint Semiconductor, Inc.* | 5,541 | 46,212 | ||||||
Ultra Clean Holdings, Inc.* | 883 | 8,856 | ||||||
Veeco Instruments, Inc.* | 1,142 | 37,583 | ||||||
|
| |||||||
| 2,248,765 | ||||||||
|
| |||||||
Software (0.8%) | ||||||||
Accelrys, Inc.* | 2,151 | 20,520 | ||||||
Actuate Corp.* | 153 | 1,180 | ||||||
Aspen Technology, Inc.* | 189 | 7,900 | ||||||
Compuware Corp. | 8,104 | 90,846 | ||||||
Cyan, Inc.* | 234 | 1,238 | ||||||
Ebix, Inc. | 25,226 | 371,327 | ||||||
EPIQ Systems, Inc. | 1,133 | 18,366 | ||||||
ePlus, Inc.* | 135 | 7,673 | ||||||
Gigamon, Inc.* | 227 | 6,374 | ||||||
Glu Mobile, Inc.* | 146 | 568 | ||||||
Mentor Graphics Corp. | 3,618 | 87,085 | ||||||
MICROS Systems, Inc.* | 2,562 | 146,982 | ||||||
Nuance Communications, Inc.* | 9,934 | 150,997 | ||||||
Progress Software Corp.* | 979 | 25,287 | ||||||
Rovi Corp.* | 28,694 | 564,985 | ||||||
Sapiens International Corp. N.V. | 694 | 5,351 | ||||||
SeaChange International, Inc.* | 1,256 | 15,273 | ||||||
Synopsys, Inc.* | 5,877 | 238,430 | ||||||
TeleCommunication Systems, Inc., Class A* | 1,793 | 4,160 | ||||||
Telenav, Inc.* | 703 | 4,633 | ||||||
TiVo, Inc.* | 2,633 | 34,545 | ||||||
VASCO Data Security International, Inc.* | 647 | 5,001 | ||||||
Vringo, Inc.* | 2,127 | $ | 6,296 | |||||
Zynga, Inc., Class A* | 22,515 | 85,557 | ||||||
|
| |||||||
| 1,900,574 | ||||||||
|
| |||||||
Total Information Technology | 16,336,182 | |||||||
|
| |||||||
Materials (4.0%) | ||||||||
Chemicals (0.8%) | ||||||||
A. Schulman, Inc. | 1,094 | 38,574 | ||||||
Albemarle Corp. | 1,927 | 122,152 | ||||||
Arabian American Development Co.* | 87 | 1,092 | ||||||
Ashland, Inc. | 3,008 | 291,896 | ||||||
Axiall Corp. | 2,658 | 126,095 | ||||||
Cabot Corp. | 2,420 | 124,388 | ||||||
Chase Corp. | 182 | 6,424 | ||||||
Chemtura Corp.* | 6,625 | 184,970 | ||||||
Cytec Industries, Inc. | 1,387 | 129,213 | ||||||
FutureFuel Corp. | 656 | 10,365 | ||||||
GSE Holding, Inc.* | 267 | 553 | ||||||
Huntsman Corp. | 7,365 | 181,179 | ||||||
Innospec, Inc. | 36 | 1,664 | ||||||
Intrepid Potash, Inc.* | 2,075 | 32,868 | ||||||
KMG Chemicals, Inc. | 55 | 929 | ||||||
Kraton Performance Polymers, Inc.* | 1,255 | 28,928 | ||||||
Kronos Worldwide, Inc. | 828 | 15,773 | ||||||
LSB Industries, Inc.* | 336 | 13,783 | ||||||
Marrone Bio Innovations, Inc.* | 70 | 1,245 | ||||||
Minerals Technologies, Inc. | 1,326 | 79,653 | ||||||
Olin Corp. | 1,009 | 29,110 | ||||||
OM Group, Inc.* | 6,723 | 244,784 | ||||||
Penford Corp.* | 273 | 3,508 | ||||||
Quaker Chemical Corp. | 383 | 29,518 | ||||||
Rockwood Holdings, Inc. | 775 | 55,738 | ||||||
RPM International, Inc. | 335 | 13,906 | ||||||
Sensient Technologies Corp. | 1,905 | 92,430 | ||||||
Stepan Co. | 273 | 17,917 | ||||||
Taminco Corp.* | 67 | 1,354 | ||||||
Tredegar Corp. | 589 | 16,969 | ||||||
W.R. Grace & Co.* | 379 | 37,472 | ||||||
Westlake Chemical Corp. | 110 | 13,428 | ||||||
Zep, Inc. | 530 | 9,625 | ||||||
Zoltek Cos., Inc.* | 1,069 | 17,906 | ||||||
|
| |||||||
| 1,975,409 | ||||||||
|
| |||||||
Construction Materials (0.0%) | ||||||||
Texas Industries, Inc.* | 63 | 4,333 | ||||||
United States Lime & Minerals, Inc.* | 7 | 428 | ||||||
|
| |||||||
| 4,761 | ||||||||
|
| |||||||
Containers & Packaging (1.6%) | ||||||||
AptarGroup, Inc. | 765 | 51,875 | ||||||
Avery Dennison Corp. | 2,591 | 130,042 | ||||||
Bemis Co., Inc. | 2,209 | 90,481 | ||||||
Berry Plastics Group, Inc.* | 13,807 | 328,469 | ||||||
Crown Holdings, Inc.* | 820 | 36,547 | ||||||
Greif, Inc., Class A | 963 | 50,461 | ||||||
Myers Industries, Inc. | 915 | 19,325 | ||||||
Owens-Illinois, Inc.* | 2,580 | 92,312 | ||||||
Rock-Tenn Co., Class A | 6,513 | 683,930 | ||||||
See Notes to Financial Statements.
161
AXA PREMIER VIP TRUST
MULTIMANAGER MID CAP VALUE PORTFOLIO
PORTFOLIO OF INVESTMENTS (Continued)
December 31, 2013
| Number of Shares | Value (Note 1) | |||||||
Sealed Air Corp. | 65,538 | $ | 2,231,569 | |||||
Sonoco Products Co. | 3,874 | 161,623 | ||||||
UFP Technologies, Inc.* | 219 | 5,523 | ||||||
|
| |||||||
| 3,882,157 | ||||||||
|
| |||||||
Metals & Mining (1.5%) | ||||||||
A.M. Castle & Co.* | 671 | 9,911 | ||||||
African Barrick Gold plc | 151,081 | 464,839 | ||||||
AK Steel Holding Corp.* | 5,226 | 42,853 | ||||||
Allegheny Technologies, Inc. | 15,807 | 563,203 | ||||||
Allied Nevada Gold Corp.* | 4,026 | 14,292 | ||||||
AMCOL International Corp. | 654 | 22,223 | ||||||
Carpenter Technology Corp. | 5,716 | 355,535 | ||||||
Century Aluminum Co.* | 1,990 | 20,815 | ||||||
Cliffs Natural Resources, Inc. | 5,832 | 152,857 | ||||||
Coeur Mining, Inc.* | 2,370 | 25,715 | ||||||
Commercial Metals Co. | 4,396 | 89,371 | ||||||
General Moly, Inc.* | 2,302 | 3,085 | ||||||
Globe Specialty Metals, Inc. | 2,349 | 42,306 | ||||||
Handy & Harman Ltd.* | 45 | 1,089 | ||||||
Haynes International, Inc. | 470 | 25,963 | ||||||
Hecla Mining Co. | 10,649 | 32,799 | ||||||
Horsehead Holding Corp.* | 1,912 | 30,994 | ||||||
Kaiser Aluminum Corp. | 718 | 50,432 | ||||||
Materion Corp. | 361 | 11,137 | ||||||
Molycorp, Inc.* | 5,552 | 31,202 | ||||||
Noranda Aluminum Holding Corp. | 1,248 | 4,106 | ||||||
Olympic Steel, Inc. | 269 | 7,796 | ||||||
Reliance Steel & Aluminum Co. | 10,061 | 763,026 | ||||||
Royal Gold, Inc. | 1,827 | 84,170 | ||||||
RTI International Metals, Inc.* | 1,216 | 41,599 | ||||||
Schnitzer Steel Industries, Inc., Class A | 932 | 30,448 | ||||||
Steel Dynamics, Inc. | 8,398 | 164,097 | ||||||
Stillwater Mining Co.* | 4,479 | 55,271 | ||||||
SunCoke Energy, Inc.* | 2,649 | 60,424 | ||||||
Tahoe Resources, Inc.* | 2,863 | 47,640 | ||||||
United States Steel Corp. | 5,494 | 162,073 | ||||||
Universal Stainless & Alloy Products, Inc.* | 277 | 9,989 | ||||||
Walter Energy, Inc. | 1,508 | 25,078 | ||||||
|
| |||||||
| 3,446,338 | ||||||||
|
| |||||||
Paper & Forest Products (0.1%) | ||||||||
Clearwater Paper Corp.* | 164 | 8,610 | ||||||
Domtar Corp. | 1,252 | 118,114 | ||||||
Louisiana-Pacific Corp.* | 1,438 | 26,617 | ||||||
Neenah Paper, Inc. | 548 | 23,438 | ||||||
P.H. Glatfelter Co. | 154 | 4,257 | ||||||
Resolute Forest Products, Inc.* | 2,611 | 41,828 | ||||||
Schweitzer-Mauduit International, Inc. | 340 | 17,500 | ||||||
Wausau Paper Corp. | 93 | 1,179 | ||||||
|
| |||||||
| 241,543 | ||||||||
|
| |||||||
Total Materials | 9,550,208 | |||||||
|
| |||||||
Telecommunication Services (0.3%) | ||||||||
Diversified Telecommunication Services (0.2%) |
| |||||||
Cbeyond, Inc.* | 958 | 6,610 | ||||||
Cincinnati Bell, Inc.* | 5,453 | 19,413 | ||||||
Fairpoint Communications, Inc.* | 112 | $ | 1,267 | |||||
Frontier Communications Corp. | 38,037 | 176,872 | ||||||
Hawaiian Telcom Holdco, Inc.* | 394 | 11,572 | ||||||
IDT Corp., Class B | 59 | 1,054 | ||||||
inContact, Inc.* | 214 | 1,671 | ||||||
Inteliquent, Inc. | 781 | 8,919 | ||||||
Intelsat S.A.* | 799 | 18,009 | ||||||
Iridium Communications, Inc.* | 2,457 | 15,381 | ||||||
Level 3 Communications, Inc.* | 4,100 | 135,997 | ||||||
magicJack VocalTec Ltd.* | 234 | 2,789 | ||||||
ORBCOMM, Inc.* | 1,371 | 8,692 | ||||||
Premiere Global Services, Inc.* | 1,489 | 17,258 | ||||||
Straight Path Communications, Inc., Class B* | 29 | 237 | ||||||
Towerstream Corp.* | 537 | 1,590 | ||||||
Vonage Holdings Corp.* | 6,087 | 20,270 | ||||||
Windstream Holdings, Inc. | 1,348 | 10,757 | ||||||
|
| |||||||
| 458,358 | ||||||||
|
| |||||||
Wireless Telecommunication Services (0.1%) |
| |||||||
Boingo Wireless, Inc.* | 883 | 5,660 | ||||||
Leap Wireless International, Inc.* | 1,597 | 27,788 | ||||||
NII Holdings, Inc.* | 6,653 | 18,296 | ||||||
Shenandoah Telecommunications Co. | 104 | 2,670 | ||||||
Telephone & Data Systems, Inc. | 3,581 | 92,318 | ||||||
U.S. Cellular Corp. | 475 | 19,864 | ||||||
USA Mobility, Inc. | 909 | 12,981 | ||||||
|
| |||||||
| 179,577 | ||||||||
|
| |||||||
Total Telecommunication Services | 637,935 | |||||||
|
| |||||||
Utilities (3.8%) | ||||||||
Electric Utilities (1.4%) | ||||||||
ALLETE, Inc. | 1,508 | 75,219 | ||||||
Cleco Corp. | 10,340 | 482,051 | ||||||
El Paso Electric Co. | 1,526 | 53,578 | ||||||
Empire District Electric Co. | 1,596 | 36,213 | ||||||
Great Plains Energy, Inc. | 5,871 | 142,313 | ||||||
Hawaiian Electric Industries, Inc. | 3,687 | 96,083 | ||||||
IDACORP, Inc. | 1,894 | 98,185 | ||||||
ITC Holdings Corp. | 7,250 | 694,695 | ||||||
MGE Energy, Inc. | 856 | 49,563 | ||||||
NRG Yield, Inc., Class A | 836 | 33,448 | ||||||
OGE Energy Corp. | 7,566 | 256,487 | ||||||
Otter Tail Corp. | 1,349 | 39,485 | ||||||
Pepco Holdings, Inc. | 9,531 | 182,328 | ||||||
Pinnacle West Capital Corp. | 4,218 | 223,217 | ||||||
PNM Resources, Inc. | 2,984 | 71,974 | ||||||
Portland General Electric Co. | 16,463 | 497,183 | ||||||
UIL Holdings Corp. | 2,135 | 82,731 | ||||||
Unitil Corp. | 547 | 16,678 | ||||||
UNS Energy Corp. | 1,467 | 87,800 | ||||||
Westar Energy, Inc. | 4,898 | 157,569 | ||||||
|
| |||||||
| 3,376,800 | ||||||||
|
| |||||||
Gas Utilities (0.9%) | ||||||||
AGL Resources, Inc. | 4,543 | 214,566 | ||||||
Atmos Energy Corp. | 3,470 | 157,607 | ||||||
Chesapeake Utilities Corp. | 375 | 22,508 | ||||||
Delta Natural Gas Co., Inc. | 258 | 5,774 | ||||||
See Notes to Financial Statements.
162
AXA PREMIER VIP TRUST
MULTIMANAGER MID CAP VALUE PORTFOLIO
PORTFOLIO OF INVESTMENTS (Continued)
December 31, 2013
| Number of Shares | Value (Note 1) | |||||||
Laclede Group, Inc. | 1,249 | $ | 56,879 | |||||
National Fuel Gas Co. | 2,807 | 200,420 | ||||||
New Jersey Resources Corp. | 1,570 | 72,597 | ||||||
Northwest Natural Gas Co. | 1,031 | 44,147 | ||||||
Piedmont Natural Gas Co., Inc. | 2,832 | 93,909 | ||||||
Questar Corp. | 5,827 | 133,963 | ||||||
South Jersey Industries, Inc. | 971 | 54,337 | ||||||
Southwest Gas Corp. | 1,747 | 97,675 | ||||||
UGI Corp. | 19,915 | 825,676 | ||||||
WGL Holdings, Inc. | 1,991 | 79,759 | ||||||
|
| |||||||
| 2,059,817 | ||||||||
|
| |||||||
Independent Power Producers & Energy Traders (0.1%) |
| |||||||
Atlantic Power Corp. | 4,658 | 16,210 | ||||||
Dynegy, Inc.* | 3,756 | 80,829 | ||||||
Genie Energy Ltd., Class B* | 534 | 5,452 | ||||||
Ormat Technologies, Inc. | 672 | 18,285 | ||||||
Pattern Energy Group, Inc. | 700 | 21,217 | ||||||
|
| |||||||
| 141,993 | ||||||||
|
| |||||||
Multi-Utilities (1.0%) | ||||||||
Alliant Energy Corp. | 4,246 | 219,094 | ||||||
Avista Corp. | 2,284 | 64,386 | ||||||
Black Hills Corp. | 1,671 | 87,744 | ||||||
CMS Energy Corp. | 24,298 | 650,457 | ||||||
Integrys Energy Group, Inc. | 3,022 | 164,427 | ||||||
MDU Resources Group, Inc. | 7,168 | 218,982 | ||||||
NorthWestern Corp. | 1,450 | 62,814 | ||||||
SCANA Corp. | 5,334 | 250,325 | ||||||
TECO Energy, Inc. | 8,413 | 145,040 | ||||||
Vectren Corp. | 3,173 | 112,642 | ||||||
Wisconsin Energy Corp. | 9,014 | 372,639 | ||||||
|
| |||||||
| 2,348,550 | ||||||||
|
| |||||||
Water Utilities (0.4%) | ||||||||
American States Water Co. | 1,334 | 38,326 | ||||||
American Water Works Co., Inc. | 19,305 | 815,829 | ||||||
Aqua America, Inc. | 879 | 20,736 | ||||||
Artesian Resources Corp., Class A | 272 | 6,242 | ||||||
California Water Service Group | 1,799 | 41,503 | ||||||
Connecticut Water Service, Inc. | 410 | 14,559 | ||||||
Consolidated Water Co., Ltd. | 531 | 7,487 | ||||||
Middlesex Water Co. | 614 | 12,857 | ||||||
SJW Corp. | 388 | $ | 11,559 | |||||
York Water Co. | 133 | 2,784 | ||||||
|
| |||||||
| 971,882 | ||||||||
|
| |||||||
Total Utilities | 8,899,042 | |||||||
|
| |||||||
Total Common Stocks (79.6%) | 188,110,374 | |||||||
|
| |||||||
| Number of Rights | Value (Note 1) | |||||||
RIGHTS: | ||||||||
Energy (0.0%) | ||||||||
Oil, Gas & Consumable Fuels (0.0%) |
| |||||||
EXCO Resources, Inc., expiring 1/9/14* | 2,568 | 411 | ||||||
|
| |||||||
| Number of Warrants | Value (Note 1) | |||||||
WARRANTS: | ||||||||
Energy (0.0%) | ||||||||
Oil, Gas & Consumable Fuels (0.0%) |
| |||||||
Magnum Hunter Resources Corp., expiring 4/15/16*(b) | 458 | — | ||||||
|
| |||||||
Total Investments (79.6%) | 188,110,785 | |||||||
Other Assets Less Liabilities (20.4%) |
| 48,186,053 | ||||||
|
| |||||||
Net Assets (100%) | $ | 236,296,838 | ||||||
|
| |||||||
| * | Non-income producing. |
| † | Securities (totaling $7,025 or 0.0% of net assets) at fair value by management. |
| § | Securities exempt from registration under Rule 144A of the Securities Act of 1933. These securities may only be resold to qualified institutional buyers. At December 31, 2013, the market value of these securities amounted to $5,083 or 0.0% of net assets. Securities denoted with “§” but without “b” have been determined to be liquid under the guidelines established by the Board of Trustees. To the extent any securities might provide a right to demand registration, such rights have not been relied upon when determining liquidity. |
| (b) | Illiquid security. |
At December 31, 2013, the Portfolio had the following futures contracts open: (Note 1)
Purchases | Number of Contracts | Expiration Date | Original Value | Value at 12/31/2013 | Unrealized Appreciation/ (Depreciation) | |||||||||||||||
Russell 2000 Mini Index | 76 | March-14 | $ | 8,374,781 | $ | 8,826,640 | $ | 451,859 | ||||||||||||
S&P MidCap 400 E-Mini Index | 263 | March-14 | 34,223,861 | 35,226,220 | 1,002,359 | |||||||||||||||
|
| |||||||||||||||||||
| $ | 1,454,218 | |||||||||||||||||||
|
| |||||||||||||||||||
See Notes to Financial Statements.
163
AXA PREMIER VIP TRUST
MULTIMANAGER MID CAP VALUE PORTFOLIO
PORTFOLIO OF INVESTMENTS (Continued)
December 31, 2013
The following is a summary of the inputs used to value the Portfolio’s assets and liabilities carried at fair value as of December 31, 2013:
The inputs or methodology used for valuing securities are not necessarily an indication of the risk associated with investing in those securities.
Various inputs are used in determining the value of the Portfolio’s investments. These inputs are summarized in the three broad levels listed below:
| Investment Type | Level 1 Quoted Prices in Active Markets for Identical Securities | Level 2 Significant Other Observable Inputs (including quoted prices for similar securities, interest rates, prepayment speeds, credit risk, etc.) | Level 3 Significant Unobservable Inputs (including the Portfolio’s own assumptions in determining the fair value of investments) | Total | ||||||||||||
Assets: | ||||||||||||||||
Common Stocks | ||||||||||||||||
Consumer Discretionary | $ | 25,062,588 | $ | — | $ | — | $ | 25,062,588 | ||||||||
Consumer Staples | 10,910,897 | — | — | 10,910,897 | ||||||||||||
Energy | 13,954,300 | — | 7,025 | 13,961,325 | ||||||||||||
Financials | 63,798,437 | — | — | 63,798,437 | ||||||||||||
Health Care | 13,910,342 | — | — | 13,910,342 | ||||||||||||
Industrials | 25,043,418 | — | — | 25,043,418 | ||||||||||||
Information Technology | 16,336,182 | — | — | 16,336,182 | ||||||||||||
Materials | 9,085,369 | 464,839 | — | 9,550,208 | ||||||||||||
Telecommunication Services | 637,935 | — | — | 637,935 | ||||||||||||
Utilities | 8,899,042 | — | — | 8,899,042 | ||||||||||||
Futures | 1,454,218 | — | — | 1,454,218 | ||||||||||||
Rights | ||||||||||||||||
Energy | 411 | — | — | 411 | ||||||||||||
Warrants | ||||||||||||||||
Energy | — | — | — | — | ||||||||||||
|
|
|
|
|
|
|
| |||||||||
Total Assets | $ | 189,093,139 | $ | 464,839 | $ | 7,025 | $ | 189,565,003 | ||||||||
|
|
|
|
|
|
|
| |||||||||
Total Liabilities | $ | — | $ | — | $ | — | $ | — | ||||||||
|
|
|
|
|
|
|
| |||||||||
Total | $ | 189,093,139 | $ | 464,839 | $ | 7,025 | $ | 189,565,003 | ||||||||
|
|
|
|
|
|
|
| |||||||||
There were no transfers between Levels 1, 2 or 3 during the year ended December 31, 2013.
Fair Values of Derivative Instruments as of December 31, 2013:
Statement of Assets and Liabilities | ||||||
Derivatives Not Accounted for as | Asset Derivatives | Fair Value | ||||
Interest rate contracts | Receivables, Net assets - Unrealized appreciation | $ | — | * | ||
Foreign exchange contracts | Receivables | — | ||||
Credit contracts | Receivables | — | ||||
Equity contracts | Receivables, Net assets - Unrealized appreciation | 1,454,218 | * | |||
Commodity contracts | Receivables | — | ||||
Other contracts | Receivables | — | ||||
|
| |||||
Total | $ | 1,454,218 | ||||
|
| |||||
Liability Derivatives | ||||||
Interest rate contracts | Payables, Net assets - Unrealized depreciation | $ | — | * | ||
Foreign exchange contracts | Payables | — | ||||
Credit contracts | Payables | — | ||||
Equity contracts | Payables, Net assets - Unrealized depreciation | — | * | |||
Commodity contracts | Payables | — | ||||
Other contracts | Payables | — | ||||
|
| |||||
Total | $ | — | ||||
|
| |||||
| * | Includes cumulative appreciation/depreciation of futures contracts as reported in the Portfolio of Investments. Only current day’s variation margin is reported within the Statement of Assets & Liabilities. |
See Notes to Financial Statements.
164
AXA PREMIER VIP TRUST
MULTIMANAGER MID CAP VALUE PORTFOLIO
PORTFOLIO OF INVESTMENTS (Continued)
December 31, 2013
The effect of Derivative Instruments on the Statement of Operations for the year ended December 31, 2013:
| Amount of Realized Gain or (Loss) on Derivatives Recognized in Income | ||||||||||||||||||||
Derivatives Not Accounted for as | Options | Futures | Forward Currency Contracts | Swaps | Total | |||||||||||||||
Interest rate contracts | $ | — | $ | — | $ | — | $ | — | $ | — | ||||||||||
Foreign exchange contracts | — | — | — | — | — | |||||||||||||||
Credit contracts | — | — | — | — | — | |||||||||||||||
Equity contracts | — | 26,951,409 | — | — | 26,951,409 | |||||||||||||||
Commodity contracts | — | — | — | — | — | |||||||||||||||
Other contracts | — | — | — | — | — | |||||||||||||||
|
|
|
|
|
|
|
|
|
| |||||||||||
Total | $ | — | $ | 26,951,409 | $ | — | $ | — | $ | 26,951,409 | ||||||||||
|
|
|
|
|
|
|
|
|
| |||||||||||
| Amount of Unrealized Appreciation or (Depreciation) on Derivatives Recognized in Income | ||||||||||||||||||||
Derivatives Not Accounted for as | Options | Futures | Forward Currency Contracts | Swaps | Total | |||||||||||||||
Interest rate contracts | $ | — | $ | — | $ | — | $ | — | $ | — | ||||||||||
Foreign exchange contracts | — | — | — | — | — | |||||||||||||||
Credit contracts | — | — | — | — | — | |||||||||||||||
Equity contracts | — | 207,154 | — | — | 207,154 | |||||||||||||||
Commodity contracts | — | — | — | — | — | |||||||||||||||
Other contracts | — | — | — | — | — | |||||||||||||||
|
|
|
|
|
|
|
|
|
| |||||||||||
Total | $ | — | $ | 207,154 | $ | — | $ | — | $ | 207,154 | ||||||||||
|
|
|
|
|
|
|
|
|
| |||||||||||
^ This Portfolio held futures contracts as a substitute for investing in conventional securities, hedging and in an attempt to enhance returns.
The Portfolio held futures contracts with an average notional balance of approximately $82,091,000 during the year ended December 31, 2013.
The following table presents the Portfolio’s gross derivative assets and liabilities by counterparty net of amounts available for offset under netting arrangements and any related collateral received or pledged by the Portfolio as of December 31, 2013:
Counterparty | Gross Amount of Derivative Assets Presented in the Statement of Assets and Liabilities (a) | Derivatives Available for Offset | Collateral Received | Net Amount Due from Counterparty | ||||||||||||
Exchange Traded Futures & Options Contracts (b) | $ 1,454,218 | (c) | $ | — | $ | — | $ | 1,454,218 | ||||||||
|
|
|
|
|
|
|
| |||||||||
| (a) | For financial reporting purposes the Portfolio does not offset derivative assets and derivative liabilities subject to master netting arrangements in the Statement of Assets and Liabilities. |
| (b) | These derivatives are traded on an exchange, therefore they are not subject to master netting arrangements. |
| (c) | This amount represents the cumulative appreciation (depreciation) of futures contracts as reported in the Portfolio of Investments. The Statement of Assets and Liabilities only reflects the current day variation margin receivable/payable to brokers for futures contracts. |
Investment security transactions for the year ended December 31, 2013 were as follows:
Cost of Purchases: | ||||
Long-term investments other than U.S. government debt securities | $ | 123,323,978 | ||
Net Proceeds of Sales and Redemptions: | ||||
Long-term investments other than U.S. government debt securities | $ | 182,183,585 |
See Notes to Financial Statements.
165
AXA PREMIER VIP TRUST
MULTIMANAGER MID CAP VALUE PORTFOLIO
PORTFOLIO OF INVESTMENTS (Continued)
December 31, 2013
As of December 31, 2013, the gross unrealized appreciation (depreciation) of investments based on the aggregate cost of investments for Federal income tax purposes was as follows:
Aggregate gross unrealized appreciation | $ | 57,091,099 | ||
Aggregate gross unrealized depreciation | (4,204,441 | ) | ||
|
| |||
Net unrealized appreciation | $ | 52,886,658 | ||
|
| |||
Federal income tax cost of investments | $ | 135,224,127 | ||
|
|
For the year ended December 31, 2013, the Portfolio incurred approximately $2,762 as brokerage commissions with Sanford C. Bernstein & Co., LLC an affiliated broker/dealer.
The Portfolio has a net capital loss carryforward of $67,638,259, which expires in the year 2017. The Portfolio utilized net capital loss carryforward of $69,362,580 during 2013.
See Notes to Financial Statements.
166
AXA PREMIER VIP TRUST
MULTIMANAGER MID CAP VALUE PORTFOLIO
STATEMENT OF ASSETS AND LIABILITIES
December 31, 2013
ASSETS | ||||
Investments at value (Cost $135,239,092) | $ | 188,110,785 | ||
Cash | 46,350,624 | |||
Cash held as collateral at broker | 1,907,000 | |||
Dividends, interest and other receivables | 256,194 | |||
Due from broker for futures variation margin | 128,531 | |||
Receivable from Separate Accounts for Trust shares sold | 64,104 | |||
Receivable for securities sold | 19,458 | |||
Other assets | 1,596 | |||
|
| |||
Total assets | 236,838,292 | |||
|
| |||
LIABILITIES | ||||
Payable to Separate Accounts for Trust shares redeemed | 276,884 | |||
Investment management fees payable | 113,869 | |||
Administrative fees payable | 62,080 | |||
Distribution fees payable - Class B | 26,129 | |||
Trustees’ fees payable | 17,565 | |||
Distribution fees payable - Class A | 2,954 | |||
Accrued expenses | 41,973 | |||
|
| |||
Total liabilities | 541,454 | |||
|
| |||
NET ASSETS | $ | 236,296,838 | ||
|
| |||
Net assets were comprised of: | ||||
Paid in capital | $ | 251,235,641 | ||
Accumulated undistributed net investment income (loss) | 172,395 | |||
Accumulated undistributed net realized gain (loss) on investments, futures and foreign currency transactions | (69,437,109 | ) | ||
Net unrealized appreciation (depreciation) on investments and futures | 54,325,911 | |||
|
| |||
Net assets | $ | 236,296,838 | ||
|
| |||
Class A | ||||
Net asset value, offering and redemption price per share, $14,095,872 / 1,044,774 shares outstanding (unlimited amount authorized: $0.001 par value) | $ | 13.49 | ||
|
| |||
Class B | ||||
Net asset value, offering and redemption price per share, $125,035,651 / 9,456,068 shares outstanding (unlimited amount authorized: $0.001 par value) | $ | 13.22 | ||
|
| |||
Class K | ||||
Net asset value, offering and redemption price per share, $97,165,315 / 7,200,575 shares outstanding (unlimited amount authorized: $0.001 par value) | $ | 13.49 | ||
|
|
STATEMENT OF OPERATIONS
For the Year Ended December 31, 2013
INVESTMENT INCOME | ||||
Dividends (net of $36,970 foreign withholding tax) | $ | 5,638,015 | ||
Interest | 89,865 | |||
|
| |||
Total income | 5,727,880 | |||
|
| |||
EXPENSES | ||||
Investment management fees | 3,475,059 | |||
Distribution fees - Class B | 825,105 | |||
Administrative fees | 684,075 | |||
Custodian fees | 131,500 | |||
Professional fees | 72,921 | |||
Printing and mailing expenses | 61,476 | |||
Distribution fees - Class A | 33,649 | |||
Trustees’ fees | 10,623 | |||
Miscellaneous | 26,926 | |||
|
| |||
Gross expenses | 5,321,334 | |||
Less: Waiver from investment manager | (112,642 | ) | ||
Fees paid indirectly | (17,164 | ) | ||
|
| |||
Net expenses | 5,191,528 | |||
|
| |||
NET INVESTMENT INCOME (LOSS) | 536,352 | |||
|
| |||
REALIZED AND UNREALIZED GAIN (LOSS) | ||||
Realized gain (loss) on: | ||||
Investments | 117,612,858 | |||
Futures | 26,951,409 | |||
Foreign currency transactions | (2,244 | ) | ||
|
| |||
Net realized gain (loss) | 144,562,023 | |||
|
| |||
Change in unrealized appreciation (depreciation) on: | ||||
Investments | 2,940,869 | |||
Futures | 207,154 | |||
|
| |||
Net change in unrealized appreciation (depreciation) | 3,148,023 | |||
|
| |||
NET REALIZED AND UNREALIZED GAIN (LOSS) | 147,710,046 | |||
|
| |||
NET INCREASE (DECREASE) IN NET ASSETS RESULTING FROM OPERATIONS | $ | 148,246,398 | ||
|
|
See Notes to Financial Statements.
167
AXA PREMIER VIP TRUST
MULTIMANAGER MID CAP VALUE PORTFOLIO
STATEMENT OF CHANGES IN NET ASSETS
| Year Ended December 31, | ||||||||
| 2013 | 2012 | |||||||
INCREASE (DECREASE) IN NET ASSETS FROM OPERATIONS: | ||||||||
Net investment income (loss) | $ | 536,352 | $ | 1,271,459 | ||||
Net realized gain (loss) on investments, futures and foreign currency transactions | 144,562,023 | 19,547,399 | ||||||
Net change in unrealized appreciation (depreciation) on investments and futures | 3,148,023 | 56,643,435 | ||||||
|
|
|
| |||||
NET INCREASE (DECREASE) IN NET ASSETS RESULTING FROM OPERATIONS | 148,246,398 | 77,462,293 | ||||||
|
|
|
| |||||
DIVIDENDS: | ||||||||
Dividends from net investment income | ||||||||
Class A | (47,703 | ) | (46,698 | ) | ||||
Class B | (413,686 | ) | (1,683,805 | ) | ||||
Class K | (559,320 | ) | (516,565 | ) | ||||
|
|
|
| |||||
TOTAL DIVIDENDS | (1,020,709 | ) | (2,247,068 | ) | ||||
|
|
|
| |||||
CAPITAL SHARES TRANSACTIONS: | ||||||||
Class A | ||||||||
Capital shares sold [ 87,840 and 149,848 shares, respectively ] | 1,059,789 | 1,391,639 | ||||||
Capital shares issued in reinvestment of dividends [ 3,667 and 4,636 shares, respectively ] | 47,703 | 46,698 | ||||||
Capital shares repurchased [ (291,641) and (308,956) shares, respectively ] | (3,474,996 | ) | (2,939,769 | ) | ||||
|
|
|
| |||||
Total Class A transactions | (2,367,504 | ) | (1,501,432 | ) | ||||
|
|
|
| |||||
Class B | ||||||||
Capital shares sold [ 3,093,239 and 3,689,634 shares, respectively ] | 34,503,992 | 33,816,701 | ||||||
Capital shares issued in reinvestment of dividends [ 32,448 and 170,565 shares, respectively ] | 413,686 | 1,683,805 | ||||||
Capital shares repurchased [ (7,747,786) and (9,183,287) shares, respectively ] | (86,514,105 | ) | (84,721,910 | ) | ||||
Capital shares repurchased in-kind (Note 10)[ (33,292,932) and 0 shares, respectively ] | (403,124,369 | ) | — | |||||
|
|
|
| |||||
Total Class B transactions | (454,720,796 | ) | (49,221,404 | ) | ||||
|
|
|
| |||||
Class K | ||||||||
Capital shares sold [ 183,583 and 171,795 shares, respectively ] | 2,267,799 | 1,594,708 | ||||||
Capital shares issued in reinvestment of dividends [ 42,993 and 51,288 shares, respectively ] | 559,320 | 516,565 | ||||||
Capital shares repurchased [ (1,436,928) and (1,457,856) shares, respectively ] | (16,620,621 | ) | (13,730,223 | ) | ||||
Capital shares repurchased in-kind (Note 10)[ (13) and 0 shares, respectively ] | (163 | ) | — | |||||
|
|
|
| |||||
Total Class K transactions | (13,793,665 | ) | (11,618,950 | ) | ||||
|
|
|
| |||||
NET INCREASE (DECREASE) IN NET ASSETS RESULTING FROM CAPITAL SHARE TRANSACTIONS | (470,881,965 | ) | (62,341,786 | ) | ||||
|
|
|
| |||||
TOTAL INCREASE (DECREASE) IN NET ASSETS | (323,656,276 | ) | 12,873,439 | |||||
NET ASSETS: | ||||||||
Beginning of year | 559,953,114 | 547,079,675 | ||||||
|
|
|
| |||||
End of year (a) | $ | 236,296,838 | $ | 559,953,114 | ||||
|
|
|
|
| ||||
(a) Includes accumulated undistributed (overdistributed) net investment income (loss) of | $ | 172,395 | $ | 109,979 | ||||
|
|
|
| |||||
See Notes to Financial Statements.
168
AXA PREMIER VIP TRUST
MULTIMANAGER MID CAP VALUE PORTFOLIO
FINANCIAL HIGHLIGHTS
| Year Ended December 31, | ||||||||||||||||||||
| Class A | 2013 | 2012 | 2011 | 2010 | 2009 | |||||||||||||||
Net asset value, beginning of year | $ | 9.98 | $ | 8.73 | $ | 10.07 | $ | 8.12 | $ | 5.77 | ||||||||||
|
|
|
|
|
|
|
|
|
| |||||||||||
Income (loss) from investment operations: | ||||||||||||||||||||
Net investment income (loss) | 0.01 | (e) | 0.02 | (e) | 0.02 | (e) | 0.06 | (e) | 0.11 | (e) | ||||||||||
Net realized and unrealized gain (loss) on investments, futures and foreign currency transactions | 3.55 | 1.27 | (1.34 | ) | 1.98 | 2.47 | ||||||||||||||
|
|
|
|
|
|
|
|
|
| |||||||||||
Total from investment operations | 3.56 | 1.29 | (1.32 | ) | 2.04 | 2.58 | ||||||||||||||
|
|
|
|
|
|
|
|
|
| |||||||||||
Less distributions: | ||||||||||||||||||||
Dividends from net investment income | (0.05 | ) | (0.04 | ) | (0.02 | ) | (0.09 | ) | (0.23 | ) | ||||||||||
|
|
|
|
|
|
|
|
|
| |||||||||||
Net asset value, end of year | $ | 13.49 | $ | 9.98 | $ | 8.73 | $ | 10.07 | $ | 8.12 | ||||||||||
|
|
|
|
|
|
|
|
|
| |||||||||||
Total return | 35.64 | % | 14.73 | % | (13.07 | )% | 25.19 | % | 44.90 | % | ||||||||||
|
|
|
|
|
|
|
|
|
| |||||||||||
Ratios/Supplemental Data: | ||||||||||||||||||||
Net assets, end of year (000’s) | $ | 14,096 | $ | 12,428 | $ | 12,213 | $ | 64,756 | $ | 95,496 | ||||||||||
Ratio of expenses to average net assets: | ||||||||||||||||||||
After waivers and reimbursements (f) | 1.25 | % | 1.25 | % | 0.98 | % | 1.02 | % | 0.58 | % | ||||||||||
After waivers, reimbursements and fees paid indirectly (f) | 1.25 | % | 1.23 | % | 0.96 | % | 1.00 | % | 0.58 | % | ||||||||||
Before waivers, reimbursements and fees paid indirectly (f) | 1.30 | % | 1.26 | % | 0.99 | % | 1.02 | % | 1.04 | % | ||||||||||
Ratio of net investment income (loss) to average net assets: | ||||||||||||||||||||
After waivers and reimbursements (f) | 0.09 | % | 0.17 | % | 0.20 | % | 0.64 | % | 1.76 | % | ||||||||||
After waivers, reimbursements and fees paid indirectly (f) | 0.09 | % | 0.19 | % | 0.22 | % | 0.65 | % | 1.76 | % | ||||||||||
Before waivers, reimbursements and fees paid indirectly (f) | 0.04 | % | 0.16 | % | 0.19 | % | 0.63 | % | 1.29 | % | ||||||||||
Portfolio turnover rate | 37 | % | 60 | % | 95 | % | 51 | % | 95 | % | ||||||||||
| Year Ended December 31, | ||||||||||||||||||||
| Class B | 2013 | 2012 | 2011 | 2010 | 2009 | |||||||||||||||
Net asset value, beginning of year | $ | 9.79 | $ | 8.55 | $ | 9.87 | $ | 7.96 | $ | 5.66 | ||||||||||
|
|
|
|
|
|
|
|
|
| |||||||||||
Income (loss) from investment operations: | ||||||||||||||||||||
Net investment income (loss) | 0.01 | (e) | 0.02 | (e) | — | #(e) | 0.03 | (e) | 0.08 | (e) | ||||||||||
Net realized and unrealized gain (loss) on investments, futures and foreign currency transactions | 3.46 | 1.26 | (1.32 | ) | 1.95 | 2.42 | ||||||||||||||
|
|
|
|
|
|
|
|
|
| |||||||||||
Total from investment operations | 3.47 | 1.28 | (1.32 | ) | 1.98 | 2.50 | ||||||||||||||
|
|
|
|
|
|
|
|
|
| |||||||||||
Less distributions: | ||||||||||||||||||||
Dividends from net investment income | (0.04 | ) | (0.04 | ) | — | # | (0.07 | ) | (0.20 | ) | ||||||||||
|
|
|
|
|
|
|
|
|
| |||||||||||
Net asset value, end of year | $ | 13.22 | $ | 9.79 | $ | 8.55 | $ | 9.87 | $ | 7.96 | ||||||||||
|
|
|
|
|
|
|
|
|
| |||||||||||
Total return | 35.50 | % | 14.92 | % | (13.36 | )% | 24.86 | % | 44.46 | % | ||||||||||
|
|
|
|
|
|
|
|
|
| |||||||||||
Ratios/Supplemental Data: | ||||||||||||||||||||
Net assets, end of year (000’s) | $ | 125,036 | $ | 463,546 | $ | 450,690 | $ | 553,947 | $ | 461,709 | ||||||||||
Ratio of expenses to average net assets: | ||||||||||||||||||||
After waivers and reimbursements (f) | 1.25 | % | 1.25 | % | 1.23 | % | 1.27 | % | 1.13 | % | ||||||||||
After waivers, reimbursements and fees paid indirectly (f) | 1.25 | % | 1.23 | % | 1.21 | % | 1.25 | % | 1.13 | % | ||||||||||
Before waivers, reimbursements and fees paid indirectly (f) | 1.27 | % | 1.26 | % | 1.24 | % | 1.27 | % | 1.29 | %(c) | ||||||||||
Ratio of net investment income (loss) to average net assets: | ||||||||||||||||||||
After waivers and reimbursements (f) | 0.06 | % | 0.17 | % | — | %‡‡ | 0.38 | % | 1.25 | % | ||||||||||
After waivers, reimbursements and fees paid indirectly (f) | 0.07 | % | 0.19 | % | 0.03 | % | 0.39 | % | 1.25 | % | ||||||||||
Before waivers, reimbursements and fees paid indirectly (f) | 0.04 | % | 0.16 | % | — | %‡‡ | 0.37 | % | 1.05 | % | ||||||||||
Portfolio turnover rate | 37 | % | 60 | % | 95 | % | 51 | % | 95 | % | ||||||||||
See Notes to Financial Statements.
169
AXA PREMIER VIP TRUST
MULTIMANAGER MID CAP VALUE PORTFOLIO
FINANCIAL HIGHLIGHTS (Continued)
| Year Ended December 31, | August 26, 2011* to December 31, 2011 | |||||||||||
| Class K | 2013 | 2012 | ||||||||||
Net asset value, beginning of period | $ | 9.98 | $ | 8.73 | $ | 8.70 | ||||||
|
|
|
|
|
| |||||||
Income (loss) from investment operations: | ||||||||||||
Net investment income (loss) | 0.04 | (e) | 0.04 | (e) | 0.01 | (e) | ||||||
Net realized and unrealized gain (loss) on investments, futures and foreign currency transactions | 3.55 | 1.27 | 0.04 | |||||||||
|
|
|
|
|
| |||||||
Total from investment operations | 3.59 | 1.31 | 0.05 | |||||||||
|
|
|
|
|
| |||||||
Less distributions: | ||||||||||||
Dividends from net investment income | (0.08 | ) | (0.06 | ) | (0.02 | ) | ||||||
|
|
|
|
|
| |||||||
Net asset value, end of period | $ | 13.49 | $ | 9.98 | $ | 8.73 | ||||||
|
|
|
|
|
| |||||||
Total return (b) | 35.98 | % | 15.02 | % | 0.62 | % | ||||||
|
|
|
|
|
| |||||||
Ratios/Supplemental Data: | ||||||||||||
Net assets, end of period (000’s) | $ | 97,165 | $ | 83,979 | $ | 84,176 | ||||||
Ratio of expenses to average net assets: | ||||||||||||
After waivers and reimbursements (a)(f) | 1.00 | % | 1.00 | % | 0.99 | % | ||||||
After waivers, reimbursements and fees paid indirectly (a)(f) | 1.00 | % | 0.98 | % | 0.94 | % | ||||||
Before waivers, reimbursements and fees paid indirectly (a)(f) | 1.05 | % | 1.01 | % | 0.99 | % | ||||||
Ratio of net investment income (loss) to average net assets: | ||||||||||||
After waivers and reimbursements (a)(f) | 0.34 | % | 0.42 | % | 0.35 | % | ||||||
After waivers, reimbursements and fees paid indirectly (a)(f) | 0.34 | % | 0.44 | % | 0.40 | % | ||||||
Before waivers, reimbursements and fees paid indirectly (a)(f) | 0.29 | % | 0.41 | % | 0.35 | % | ||||||
Portfolio turnover rate | 37 | % | 60 | % | 95 | % | ||||||
| * | Commencement of Operations. |
| # | Per share amount is less than $0.005. |
| ‡‡ | Percent shown is less than 0.005%. |
| (a) | Ratios for periods less than one year are annualized. |
| (b) | Total returns for periods less than one year are not annualized. |
| (c) | Reflects overall fund ratios for non-class specific expenses. |
| (e) | Net investment income (loss) per share is based on average shares outstanding. |
| (f) | Expenses do not include the expenses of the underlying portfolios (“indirect expenses”). |
See Notes to Financial Statements.
170
MULTIMANAGER TECHNOLOGY PORTFOLIO (Unaudited)
PORTFOLIO ADVISERS
| Ø | Allianz Global Investors U.S. LLC |
| Ø | AXA Equitable Funds Management Group, LLC |
| Ø | SSgA Funds Management, Inc. |
| Ø | Wellington Management Company, LLP |
PERFORMANCE RESULTS
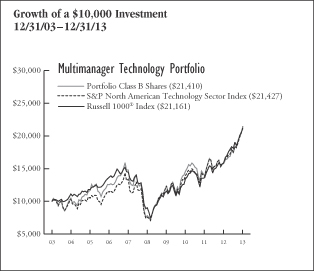
| Annualized Total Returns as of 12/31/13 | ||||||||||||
| 1 Year | 5 Years | 10 Years/ Since Incept. | ||||||||||
Portfolio – Class A Shares* | 35.61 | % | 22.43 | % | 8.12 | % | ||||||
Portfolio – Class B Shares* | 35.57 | 22.27 | 7.91 | |||||||||
Portfolio – Class K Shares** | 36.41 | N/A | 24.20 | |||||||||
S&P North American Technology Sector Index | 34.57 | 23.09 | 7.92 | |||||||||
Russell 1000® Index | 33.11 | 18.59 | 7.78 | |||||||||
* Date of inception 12/31/01.
** Date of inception 8/29/12.
Returns for periods greater than one year are annualized.
|
| |||||||||||
Past performance is not indicative of future results.
PERFORMANCE SUMMARY
The Portfolio’s Class A shares returned 35.61% for the year ended December 31, 2013. The Portfolio’s benchmarks, the S&P North American Technology Sector Index returned 34.57% and the Russell 1000® Index returned 33.11%, over the same period.
Portfolio Highlights
For the year ended December 31, 2013
What helped performance during the year:
| • | For the year, sector allocation was the primary driver of outperformance. Positive results came from underweights to the Computers & Peripherals industry and the IT Services sector and from an out-of-benchmark allocation to the Automobiles sector. |
| • | Electric vehicle and powertrain manufacturer Tesla Motors, Inc. was the largest contributor to active returns during the year. Tesla’s share price rose over the period amid reports of strong demand for the company’s flagship Model S sedan. |
| • | Social networking website operator Facebook, Inc. surged on reports indicating the company’s efforts on mobile are driving increases in user engagement and marketers are taking notice. Marketers have shifted ad dollars toward Facebook’s solutions, which helped the company grow its share of the mobile ad market. |
What hurt performance during the year:
| • | On the negative side, data-storage computer and software maker Fusion-io, Inc. was a detractor. The company’s shares fell over the period as expectations of a pickup in enterprise spending continued to be pushed-out and competition from lower priced products wore on operating margins. In addition, the departure of several key members of management over the year weighed on investor sentiment. |
| • | Other top active detractors during the period included underweight positions in PC maker Hewlett-Packard Co., software and services company Microsoft Corp. and Internet search provider Google, Inc. |
171
MULTIMANAGER TECHNOLOGY PORTFOLIO (Unaudited)
Sector Weightings as of December 31, 2013 | % of Net Assets | |||
Information Technology | 69.5 | % | ||
Mutual Funds | 19.5 | |||
Consumer Discretionary | 8.7 | |||
Industrials | 0.5 | |||
Telecommunication Services | 0.3 | |||
Health Care | 0.1 | |||
Cash and Other | 1.4 | |||
|
| |||
| 100.0 | % | |||
|
| |||
UNDERSTANDING YOUR EXPENSES:
As a shareholder of the Portfolio, you incur two types of costs:
(1)transaction costs, including applicable sales charges and redemption fees; and (2)ongoing costs, including management fees, distribution (12b-1) fees (in the case of Class A and Class B shares of the Trust), and other Portfolio expenses. These examples are intended to help you understand your ongoing costs (in dollars) of investing in the Portfolio and to compare these costs with the ongoing costs of investing in other mutual funds.
The examples are based on an investment of $1,000 invested at the beginning of the six-month period ended December 31, 2013 and held for the entire six-month period.
Actual Expenses
The first line of the table to the right provides information about actual account values and actual expenses. You may use the information in this line, together with the amount you invested, to estimate the expenses that you paid over the period. Simply divide your account value by $1,000 (for example, an $8,600 account value divided by $1,000 = 8.6), then multiply the result by the number in the first line under the heading entitled ‘‘Expenses Paid During Period’’ to estimate the expenses you paid on your account during this period.
Hypothetical Example for Comparison Purposes
The second line of the table below provides information about hypothetical account values and hypothetical expenses based on the Portfolio’s actual expense ratio and an assumed rate of return of 5% per year before expenses, which is not the Portfolio’s actual return. The hypothetical account values and expenses may not be used to estimate the actual ending account balance or expenses you paid for the period. You may use this information to compare the ongoing costs of investing in the Portfolio and other funds. To do so, compare this 5% hypothetical example with the 5% hypothetical examples that appear in the shareholder reports of the other funds.
Please note that the expenses shown in the table are meant to highlight your ongoing costs only and do not reflect any transactional costs, such as sales charges (loads), redemption fees, or exchange fees. Therefore, the second line of the table is useful in comparing ongoing costs only, and will not help you determine the relative total costs of owning different funds. In addition, if these transactional costs were included, your costs would have been higher. Also note that the table does not reflect any variable life insurance or variable annuity contract-related fees and expenses, which would increase overall fees and expenses.
EXAMPLE
| Beginning Account Value 7/1/13 | Ending Account Value 12/31/13 | Expenses Paid During Period* 7/1/13 - | ||||||||||
Class A | ||||||||||||
Actual | $1,000.00 | $1,227.97 | $7.88 | |||||||||
Hypothetical (5% average annual return before expenses) | 1,000.00 | 1,018.13 | 7.14 | |||||||||
Class B | ||||||||||||
Actual | 1,000.00 | 1,227.90 | 7.88 | |||||||||
Hypothetical (5% average annual return before expenses) | 1,000.00 | 1,018.13 | 7.14 | |||||||||
Class K | ||||||||||||
Actual | 1,000.00 | 1,229.84 | 6.49 | |||||||||
Hypothetical (5% average annual return before expenses) | 1,000.00 | 1,019.39 | 5.87 | |||||||||
* Expenses are equal to the Portfolio’s Class A, Class B and Class K shares annualized expense ratios of 1.40%, 1.40% and 1.15%, respectively, multiplied by the average account value over the period, and multiplied by 184/365 (to reflect the one-half year period). |
| |||||||||||
172
AXA PREMIER VIP TRUST
MULTIMANAGER TECHNOLOGY PORTFOLIO
PORTFOLIO OF INVESTMENTS
December 31, 2013
| Number of Shares | Value (Note 1) | |||||||
COMMON STOCKS: | ||||||||
Consumer Discretionary (8.7%) | ||||||||
Automobiles (1.0%) | ||||||||
Tesla Motors, Inc.* | 51,254 | $ | 7,707,576 | |||||
Toyota Motor Corp. (ADR) | 964 | 117,531 | ||||||
|
| |||||||
| 7,825,107 | ||||||||
|
| |||||||
Household Durables (0.2%) | ||||||||
Harman International Industries, Inc. | 15,830 | 1,295,686 | ||||||
|
| |||||||
Internet & Catalog Retail (7.4%) | ||||||||
Amazon.com, Inc.* | 69,736 | 27,810,019 | ||||||
Ctrip.com International Ltd. (ADR)* | 11,130 | 552,271 | ||||||
Expedia, Inc. | 6,206 | 432,310 | ||||||
Groupon, Inc.* | 23,262 | 273,794 | ||||||
HomeAway, Inc.* | 3,672 | 150,111 | ||||||
Netflix, Inc.* | 16,510 | 6,078,487 | ||||||
priceline.com, Inc.* | 12,037 | 13,991,809 | ||||||
Rakuten, Inc. | 266,500 | 3,957,896 | ||||||
Shutterfly, Inc.* | 2,000 | 101,860 | ||||||
TripAdvisor, Inc.* | 6,676 | 552,973 | ||||||
Vipshop Holdings Ltd. (ADR)* | 8,635 | 722,577 | ||||||
zulily, Inc., Class A* | 5,206 | 215,684 | ||||||
|
| |||||||
| 54,839,791 | ||||||||
|
| |||||||
Media (0.1%) | ||||||||
CyberAgent, Inc. | 21,100 | 857,544 | ||||||
|
| |||||||
Total Consumer Discretionary | 64,818,128 | |||||||
|
| |||||||
Health Care (0.1%) | ||||||||
Health Care Technology (0.1%) | ||||||||
M3, Inc. | 376 | 940,803 | ||||||
|
| |||||||
Total Health Care | 940,803 | |||||||
|
| |||||||
Industrials (0.5%) | ||||||||
Commercial Services & Supplies (0.2%) |
| |||||||
ADT Corp. | 34,045 | 1,377,801 | ||||||
|
| |||||||
Construction & Engineering (0.1%) | ||||||||
Quanta Services, Inc.* | 32,740 | 1,033,274 | ||||||
|
| |||||||
Professional Services (0.2%) | ||||||||
Equifax, Inc. | 6,425 | 443,903 | ||||||
Huron Consulting Group, Inc.* | 16,705 | 1,047,738 | ||||||
|
| |||||||
| 1,491,641 | ||||||||
|
| |||||||
Total Industrials | 3,902,716 | |||||||
|
| |||||||
Information Technology (69.5%) | ||||||||
Communications Equipment (6.5%) | ||||||||
AAC Technologies Holdings, Inc. | 168,500 | 818,130 | ||||||
ADTRAN, Inc. | 3,700 | 99,937 | ||||||
Alcatel-Lucent (ADR)* | 1,969,311 | 8,664,968 | ||||||
ARRIS Group, Inc.* | 6,700 | 163,246 | ||||||
Aruba Networks, Inc.* | 162,485 | 2,908,482 | ||||||
BlackBerry Ltd.* | 30,752 | 229,103 | ||||||
Brocade Communications Systems, Inc.* | 26,400 | 234,168 | ||||||
Calix, Inc.* | 36,500 | 351,860 | ||||||
Ciena Corp.* | 5,800 | 138,794 | ||||||
Cisco Systems, Inc. | 476,345 | 10,693,945 | ||||||
EchoStar Corp., Class A* | 2,600 | $ | 129,272 | |||||
F5 Networks, Inc.* | 9,590 | 871,347 | ||||||
Finisar Corp.* | 5,900 | 141,128 | ||||||
Harris Corp. | 6,500 | 453,765 | ||||||
Infinera Corp.* | 6,800 | 66,504 | ||||||
InterDigital, Inc. | 2,600 | 76,674 | ||||||
Ixia* | 3,500 | 46,585 | ||||||
JDS Uniphase Corp.* | 14,800 | 192,104 | ||||||
Juniper Networks, Inc.* | 99,265 | 2,240,411 | ||||||
Motorola Solutions, Inc. | 13,942 | 941,085 | ||||||
NETGEAR, Inc.* | 2,100 | 69,174 | ||||||
Palo Alto Networks, Inc.* | 23,936 | 1,375,602 | ||||||
Plantronics, Inc. | 2,800 | 130,060 | ||||||
Polycom, Inc.* | 7,962 | 89,413 | ||||||
QUALCOMM, Inc. | 221,595 | 16,453,429 | ||||||
Riverbed Technology, Inc.* | 10,328 | 186,730 | ||||||
ViaSat, Inc.* | 2,500 | 156,625 | ||||||
|
| |||||||
| 47,922,541 | ||||||||
|
| |||||||
Computers & Peripherals (11.4%) | ||||||||
3D Systems Corp.* | 5,700 | 529,701 | ||||||
Advantech Co., Ltd. | 108,000 | 748,301 | ||||||
Apple, Inc. | 72,044 | 40,424,609 | ||||||
Diebold, Inc. | 3,800 | 125,438 | ||||||
Electronics for Imaging, Inc.* | 2,700 | 104,571 | ||||||
EMC Corp. | 202,610 | 5,095,641 | ||||||
Fusion-io, Inc.* | 4,683 | 41,726 | ||||||
Hewlett-Packard Co. | 116,600 | 3,262,468 | ||||||
Lenovo Group Ltd. | 3,573,000 | 4,345,123 | ||||||
Lexmark International, Inc., Class A | 4,000 | 142,080 | ||||||
NCR Corp.* | 10,100 | 344,006 | ||||||
NEC Corp. | 22,000 | 49,511 | ||||||
NetApp, Inc. | 20,578 | 846,579 | ||||||
QLogic Corp.* | 5,000 | 59,150 | ||||||
SanDisk Corp. | 117,770 | 8,307,496 | ||||||
Seagate Technology plc | 145,815 | 8,188,970 | ||||||
Stratasys Ltd.* | 3,885 | 523,310 | ||||||
Synaptics, Inc.* | 2,000 | 103,620 | ||||||
Western Digital Corp. | 138,670 | 11,634,413 | ||||||
|
| |||||||
| 84,876,713 | ||||||||
|
| |||||||
Electronic Equipment, Instruments & Components (2.1%) |
| |||||||
Amphenol Corp., Class A | 9,507 | 847,834 | ||||||
Anixter International, Inc. | 1,600 | 143,744 | ||||||
Arrow Electronics, Inc.* | 6,100 | 330,925 | ||||||
Avnet, Inc. | 8,200 | 361,702 | ||||||
AVX Corp. | 2,800 | 39,004 | ||||||
Belden, Inc. | 2,600 | 183,170 | ||||||
Benchmark Electronics, Inc.* | 3,500 | 80,780 | ||||||
CDW Corp. | 2,296 | 53,635 | ||||||
Celestica, Inc.* | 9,600 | 99,840 | ||||||
Cognex Corp.* | 5,200 | 198,536 | ||||||
Coherent, Inc.* | 1,500 | 111,585 | ||||||
Corning, Inc. | 87,900 | 1,566,378 | ||||||
Delta Electronics, Inc. | 97,000 | 553,291 | ||||||
Dolby Laboratories, Inc., Class A* | 2,763 | 106,541 | ||||||
FEI Co. | 2,500 | 223,400 | ||||||
FLIR Systems, Inc. | 8,308 | 250,071 | ||||||
Hirose Electric Co., Ltd. | 12,900 | 1,834,982 | ||||||
Ingram Micro, Inc., Class A* | 9,000 | 211,140 | ||||||
InvenSense, Inc.* | 3,184 | 66,164 | ||||||
See Notes to Financial Statements.
173
AXA PREMIER VIP TRUST
MULTIMANAGER TECHNOLOGY PORTFOLIO
PORTFOLIO OF INVESTMENTS (Continued)
December 31, 2013
| Number of Shares | Value (Note 1) | |||||||
IPG Photonics Corp.* | 1,900 | $ | 147,459 | |||||
Itron, Inc.* | 2,300 | 95,289 | ||||||
Jabil Circuit, Inc. | 11,500 | 200,560 | ||||||
Keyence Corp. | 4,200 | 1,794,701 | ||||||
Littelfuse, Inc. | 1,400 | 130,102 | ||||||
Murata Manufacturing Co., Ltd. | 10,700 | 948,989 | ||||||
National Instruments Corp. | 11,400 | 365,028 | ||||||
Omron Corp. | 32,400 | 1,429,095 | ||||||
OSI Systems, Inc.* | 1,100 | 58,421 | ||||||
Plexus Corp.* | 2,200 | 95,238 | ||||||
RealD, Inc.* | 3,000 | 25,620 | ||||||
Rofin-Sinar Technologies, Inc.* | 1,700 | 45,934 | ||||||
Sanmina Corp.* | 5,500 | 91,850 | ||||||
Sunny Optical Technology Group Co. Ltd. | 659,435 | 641,211 | ||||||
SYNNEX Corp.* | 1,600 | 107,840 | ||||||
TE Connectivity Ltd. | 25,011 | 1,378,356 | ||||||
Tech Data Corp.* | 2,200 | 113,520 | ||||||
Trimble Navigation Ltd.* | 15,700 | 544,790 | ||||||
Universal Display Corp.* | 2,700 | 92,772 | ||||||
Vishay Intertechnology, Inc.* | 8,500 | 112,710 | ||||||
|
| |||||||
| 15,682,207 | ||||||||
|
| |||||||
Internet Software & Services (16.1%) |
| |||||||
Akamai Technologies, Inc.* | 41,020 | 1,935,324 | ||||||
AOL, Inc.* | 4,649 | 216,736 | ||||||
Autohome, Inc. (ADR)* | 1,280 | 46,835 | ||||||
Bankrate, Inc.* | 2,583 | 46,339 | ||||||
Cornerstone OnDemand, Inc.* | 2,792 | 148,925 | ||||||
CoStar Group, Inc.* | 1,700 | 313,786 | ||||||
Dealertrack Technologies, Inc.* | 2,800 | 134,624 | ||||||
Demandware, Inc.* | 1,632 | 104,644 | ||||||
eBay, Inc.* | 114,730 | 6,297,530 | ||||||
Equinix, Inc.* | 3,000 | 532,350 | ||||||
Facebook, Inc., Class A* | 425,732 | 23,270,511 | ||||||
Google, Inc., Class A* | 38,472 | 43,115,955 | ||||||
IAC/InterActiveCorp. | 4,600 | 315,974 | ||||||
j2 Global, Inc. | 2,600 | 130,026 | ||||||
LinkedIn Corp., Class A* | 12,174 | 2,639,689 | ||||||
Liquidity Services, Inc.* | 1,600 | 36,256 | ||||||
NetEase, Inc. (ADR) | 67,395 | 5,297,247 | ||||||
NIC, Inc. | 3,600 | 89,532 | ||||||
OpenTable, Inc.* | 1,300 | 103,181 | ||||||
Pandora Media, Inc.* | 109,479 | 2,912,141 | ||||||
Rackspace Hosting, Inc.* | 7,000 | 273,910 | ||||||
Renren, Inc. (ADR)* | 878 | 2,678 | ||||||
Shutterstock, Inc.* | 637 | 53,272 | ||||||
SINA Corp.* | 43,825 | 3,692,256 | ||||||
SouFun Holdings Ltd. (ADR) | 81,215 | 6,692,928 | ||||||
Tencent Holdings Ltd. | 100,100 | 6,384,775 | ||||||
ValueClick, Inc.* | 3,600 | 84,132 | ||||||
VeriSign, Inc.* | 7,800 | 466,284 | ||||||
Web.com Group, Inc.* | 2,722 | 86,532 | ||||||
WebMD Health Corp.* | 2,382 | 94,089 | ||||||
Yahoo!, Inc.* | 225,960 | 9,137,822 | ||||||
Yandex N.V., Class A* | 40,410 | 1,743,692 | ||||||
Yelp, Inc.* | 52,189 | 3,598,432 | ||||||
Zillow, Inc., Class A* | 1,387 | 113,360 | ||||||
|
| |||||||
| 120,111,767 | ||||||||
|
| |||||||
IT Services (10.2%) | ||||||||
Accenture plc, Class A | 63,503 | 5,221,217 | ||||||
Acxiom Corp.* | 4,200 | $ | 155,316 | |||||
Alliance Data Systems Corp.* | 9,814 | 2,580,395 | ||||||
Automatic Data Processing, Inc. | 48,626 | 3,929,467 | ||||||
Booz Allen Hamilton Holding Corp. | 2,565 | 49,120 | ||||||
Broadridge Financial Solutions, Inc. | 7,000 | 276,640 | ||||||
CACI International, Inc., Class A* | 1,400 | 102,508 | ||||||
Cardtronics, Inc.* | 2,600 | 112,970 | ||||||
Cognizant Technology Solutions Corp., Class A* | 44,808 | 4,524,712 | ||||||
Computer Sciences Corp. | 33,855 | 1,891,817 | ||||||
Convergys Corp. | 6,200 | 130,510 | ||||||
CoreLogic, Inc.* | 5,800 | 206,074 | ||||||
DST Systems, Inc. | 1,800 | 163,332 | ||||||
EPAM Systems, Inc.* | 1,467 | 51,257 | ||||||
Euronet Worldwide, Inc.* | 2,800 | 133,980 | ||||||
EVERTEC, Inc. | 3,083 | 76,027 | ||||||
Fidelity National Information Services, Inc. | 17,650 | 947,452 | ||||||
Fiserv, Inc.* | 45,550 | 2,689,727 | ||||||
FleetCor Technologies, Inc.* | 4,442 | 520,469 | ||||||
Gartner, Inc.* | 5,700 | 404,985 | ||||||
Genpact Ltd.* | 67,329 | 1,236,834 | ||||||
Global Payments, Inc. | 4,500 | 292,455 | ||||||
Heartland Payment Systems, Inc. | 23,305 | 1,161,521 | ||||||
iGATE Corp.* | 1,800 | 72,288 | ||||||
International Business Machines | 61,700 | 11,573,069 | ||||||
Jack Henry & Associates, Inc. | 5,200 | 307,892 | ||||||
Leidos Holdings, Inc. | 4,325 | 201,069 | ||||||
Lender Processing Services, Inc. | 5,300 | 198,114 | ||||||
ManTech International Corp., Class A | 1,400 | 41,902 | ||||||
MasterCard, Inc., Class A | 15,882 | 13,268,776 | ||||||
MAXIMUS, Inc. | 4,000 | 175,960 | ||||||
NeuStar, Inc., Class A* | 3,954 | 197,146 | ||||||
Paychex, Inc. | 19,700 | 896,941 | ||||||
QIWI plc (ADR) | 2,000 | 112,000 | ||||||
Sapient Corp.* | 6,600 | 114,576 | ||||||
Science Applications International Corp. | 2,642 | 87,371 | ||||||
SCSK Corp. | 30,000 | 785,396 | ||||||
Syntel, Inc.* | 1,000 | 90,950 | ||||||
TeleTech Holdings, Inc.* | 1,300 | 31,122 | ||||||
Teradata Corp.* | 9,995 | 454,673 | ||||||
Total System Services, Inc. | 10,200 | 339,456 | ||||||
Unisys Corp.* | 2,700 | 90,639 | ||||||
Vantiv, Inc., Class A* | 7,420 | 241,966 | ||||||
VeriFone Systems, Inc.* | 6,600 | 177,012 | ||||||
Visa, Inc., Class A | 77,780 | 17,320,050 | ||||||
Western Union Co | 105,955 | 1,827,724 | ||||||
WEX, Inc.* | 4,733 | 468,709 | ||||||
|
| |||||||
| 75,933,586 | ||||||||
|
| |||||||
Office Electronics (0.1%) | ||||||||
Xerox Corp. | 70,054 | 852,557 | ||||||
Zebra Technologies Corp., Class A* | 3,100 | 167,648 | ||||||
|
| |||||||
| 1,020,205 | ||||||||
|
| |||||||
See Notes to Financial Statements.
174
AXA PREMIER VIP TRUST
MULTIMANAGER TECHNOLOGY PORTFOLIO
PORTFOLIO OF INVESTMENTS (Continued)
December 31, 2013
| Number of Shares | Value (Note 1) | |||||||
Semiconductors & Semiconductor Equipment (10.9%) |
| |||||||
Advanced Micro Devices, Inc.* | 38,200 | $ | 147,834 | |||||
Altera Corp. | 19,500 | 634,335 | ||||||
Analog Devices, Inc. | 25,675 | 1,307,628 | ||||||
Applied Materials, Inc. | 288,430 | 5,102,327 | ||||||
ASM Pacific Technology Ltd. | 34,200 | 286,239 | ||||||
ASML Holding N.V. | 10,364 | 971,107 | ||||||
Atmel Corp.* | 25,500 | 199,665 | ||||||
Avago Technologies Ltd. | 95,340 | 5,042,532 | ||||||
Broadcom Corp., Class A | 56,575 | 1,677,449 | ||||||
Cabot Microelectronics Corp.* | 1,400 | 63,980 | ||||||
Cavium, Inc.* | 3,200 | 110,432 | ||||||
Cirrus Logic, Inc.* | 3,800 | 77,634 | ||||||
Cree, Inc.* | 7,345 | 459,577 | ||||||
Cypress Semiconductor Corp.* | 8,926 | 93,723 | ||||||
Diodes, Inc.* | 2,200 | 51,832 | ||||||
Entegris, Inc.* | 7,600 | 88,160 | ||||||
Fairchild Semiconductor International, Inc.* | 8,000 | 106,800 | ||||||
First Solar, Inc.* | 4,300 | 234,952 | ||||||
Freescale Semiconductor Ltd.* | 3,141 | 50,413 | ||||||
Hittite Microwave Corp.* | 1,700 | 104,941 | ||||||
Integrated Device Technology, Inc.* | 8,200 | 83,558 | ||||||
Intel Corp. | 523,390 | 13,587,204 | ||||||
International Rectifier Corp.* | 11,015 | 287,161 | ||||||
Intersil Corp., Class A | 7,900 | 90,613 | ||||||
KLA-Tencor Corp. | 10,000 | 644,600 | ||||||
Lam Research Corp.* | 100,310 | 5,461,879 | ||||||
Linear Technology Corp. | 14,200 | 646,810 | ||||||
LSI Corp. | 32,300 | 355,946 | ||||||
Marvell Technology Group Ltd. | 24,500 | 352,310 | ||||||
Maxim Integrated Products, Inc. | 30,775 | 858,930 | ||||||
MediaTek, Inc. | 415,000 | 6,175,533 | ||||||
Microchip Technology, Inc. | 11,900 | 532,525 | ||||||
Micron Technology, Inc.* | 402,835 | 8,765,689 | ||||||
Microsemi Corp.* | 5,600 | 139,720 | ||||||
MKS Instruments, Inc. | 3,200 | 95,808 | ||||||
Montage Technology Group Ltd.* | 4,590 | 74,863 | ||||||
NVIDIA Corp. | 35,200 | 563,904 | ||||||
NXP Semiconductor N.V.* | 110,980 | 5,097,311 | ||||||
OmniVision Technologies, Inc.* | 3,568 | 61,370 | ||||||
ON Semiconductor Corp.* | 28,141 | 231,882 | ||||||
PMC-Sierra, Inc.* | 13,000 | 83,590 | ||||||
Power Integrations, Inc. | 1,900 | 106,058 | ||||||
Rambus, Inc.* | 7,400 | 70,078 | ||||||
RF Micro Devices, Inc.* | 15,300 | 78,948 | ||||||
Semtech Corp.* | 4,300 | 108,704 | ||||||
Silicon Laboratories, Inc.* | 11,800 | 511,058 | ||||||
SK Hynix, Inc.* | 64,330 | 2,243,184 | ||||||
Skyworks Solutions, Inc.* | 11,100 | 317,016 | ||||||
Spansion, Inc., Class A* | 2,700 | 37,503 | ||||||
SunEdison, Inc.* | 15,002 | 195,776 | ||||||
SunPower Corp.* | 99,716 | 2,972,534 | ||||||
Taiwan Semiconductor Manufacturing Co., Ltd. | 768,000 | 2,718,607 | ||||||
Taiwan Semiconductor Manufacturing Co., Ltd. (ADR) | 155,320 | 2,708,781 | ||||||
Teradyne, Inc.* | 11,500 | 202,630 | ||||||
Tessera Technologies, Inc. | 3,000 | 59,130 | ||||||
Texas Instruments, Inc. | 156,455 | 6,869,939 | ||||||
TriQuint Semiconductor, Inc.* | 10,400 | $ | 86,736 | |||||
Veeco Instruments, Inc.* | 2,500 | 82,275 | ||||||
Xilinx, Inc. | 16,100 | 739,312 | ||||||
|
| |||||||
| 81,111,035 | ||||||||
|
| |||||||
Software (12.2%) | ||||||||
ACI Worldwide, Inc.* | 2,300 | 149,500 | ||||||
Activision Blizzard, Inc. | 150,402 | 2,681,668 | ||||||
Adobe Systems, Inc.* | 78,000 | 4,670,640 | ||||||
Advent Software, Inc. | 2,000 | 69,980 | ||||||
ANSYS, Inc.* | 5,600 | 488,320 | ||||||
Aspen Technology, Inc.* | 131,053 | 5,478,015 | ||||||
Autodesk, Inc.* | 38,600 | 1,942,738 | ||||||
Blackbaud, Inc. | 2,900 | 109,185 | ||||||
BroadSoft, Inc.* | 1,733 | 47,380 | ||||||
CA, Inc. | 20,000 | 673,000 | ||||||
Cadence Design Systems, Inc.* | 66,400 | 930,928 | ||||||
Citrix Systems, Inc.* | 11,400 | 721,050 | ||||||
CommVault Systems, Inc.* | 2,600 | 194,688 | ||||||
Compuware Corp. | 13,000 | 145,730 | ||||||
Concur Technologies, Inc.* | 2,900 | 299,222 | ||||||
Electronic Arts, Inc.* | 18,800 | 431,272 | ||||||
FactSet Research Systems, Inc. | 2,500 | 271,450 | ||||||
Fair Isaac Corp. | 2,100 | 131,964 | ||||||
Fortinet, Inc.* | 7,800 | 149,214 | ||||||
Guidewire Software, Inc.* | 3,985 | 195,544 | ||||||
Infoblox, Inc.* | 2,888 | 95,362 | ||||||
Informatica Corp.* | 6,300 | 261,450 | ||||||
Intuit, Inc. | 38,775 | 2,959,308 | ||||||
Jive Software, Inc.* | 1,812 | 20,385 | ||||||
Manhattan Associates, Inc.* | 1,200 | 140,976 | ||||||
Mavenir Systems, Inc.* | 41,540 | 463,586 | ||||||
Mentor Graphics Corp. | 6,000 | 144,420 | ||||||
MICROS Systems, Inc.* | 9,700 | 556,489 | ||||||
Microsoft Corp. | 811,370 | 30,369,579 | ||||||
MicroStrategy, Inc., Class A* | 600 | 74,544 | ||||||
NetScout Systems, Inc.* | 2,400 | 71,016 | ||||||
NetSuite, Inc.* | 1,800 | 185,436 | ||||||
Nuance Communications, Inc.* | 15,300 | 232,560 | ||||||
Open Text Corp. | 3,484 | 320,389 | ||||||
Oracle Corp. | 236,170 | 9,035,864 | ||||||
Pegasystems, Inc. | 1,200 | 59,016 | ||||||
Progress Software Corp.* | 3,404 | 87,925 | ||||||
PTC, Inc.* | 7,462 | 264,080 | ||||||
Qlik Technologies, Inc.* | 4,900 | 130,487 | ||||||
RealPage, Inc.* | 2,400 | 56,112 | ||||||
Red Hat, Inc.* | 11,600 | 650,064 | ||||||
Rovi Corp.* | 5,927 | 116,703 | ||||||
Salesforce.com, Inc.* | 218,030 | 12,033,076 | ||||||
ServiceNow, Inc.* | 109,249 | 6,119,036 | ||||||
SolarWinds, Inc.* | 4,000 | 151,320 | ||||||
Solera Holdings, Inc. | 4,269 | 302,074 | ||||||
Splunk, Inc.* | 4,889 | 335,728 | ||||||
SS&C Technologies Holdings, Inc.* | 3,600 | 159,336 | ||||||
Symantec Corp. | 42,300 | 997,434 | ||||||
Synchronoss Technologies, Inc.* | 1,600 | 49,712 | ||||||
Synopsys, Inc.* | 9,100 | 369,187 | ||||||
Tableau Software, Inc., Class A* | 933 | 64,312 | ||||||
Take-Two Interactive Software, Inc.* | 5,500 | 95,535 | ||||||
See Notes to Financial Statements.
175
AXA PREMIER VIP TRUST
MULTIMANAGER TECHNOLOGY PORTFOLIO
PORTFOLIO OF INVESTMENTS (Continued)
December 31, 2013
| Number of Shares | Value (Note 1) | |||||||
TIBCO Software, Inc.* | 9,500 | $ | 213,560 | |||||
TiVo, Inc.* | 7,900 | 103,648 | ||||||
Tyler Technologies, Inc.* | 1,700 | 173,621 | ||||||
Ultimate Software Group, Inc.* | 1,700 | 260,474 | ||||||
Verint Systems, Inc.* | 3,169 | 136,077 | ||||||
VirnetX Holding Corp.* | 2,700 | 52,407 | ||||||
VMware, Inc., Class A* | 5,200 | 466,492 | ||||||
Workday, Inc., Class A* | 30,135 | 2,506,027 | ||||||
Zynga, Inc., Class A* | 38,072 | 144,673 | ||||||
|
| |||||||
| 90,810,968 | ||||||||
|
| |||||||
Total Information Technology | 517,469,022 | |||||||
|
| |||||||
Telecommunication Services (0.3%) | ||||||||
Wireless Telecommunication Services (0.3%) |
| |||||||
T-Mobile US, Inc.* | 58,520 | 1,968,613 | ||||||
|
| |||||||
Total Telecommunication | 1,968,613 | |||||||
|
| |||||||
Total Common Stocks (79.1%) | 589,099,282 | |||||||
|
| |||||||
INVESTMENT COMPANIES: | ||||||||
Exchange Traded Funds (ETFs)(19.5%) |
| |||||||
iShares® North American Tech ETF | 318,450 | $ | 28,539,489 | |||||
Technology Select Sector SPDR® Fund | 1,705,400 | 60,950,996 | ||||||
Vanguard Information Technology Index ETF | 619,000 | 55,412,880 | ||||||
|
| |||||||
Total Investment Companies (19.5%) | 144,903,365 | |||||||
|
| |||||||
Total Investments (98.6%) | 734,002,647 | |||||||
Other Assets Less Liabilities (1.4%) | 10,222,589 | |||||||
|
| |||||||
Net Assets (100%) | $ | 744,225,236 | ||||||
|
| |||||||
| * | Non-income producing. |
Glossary:
| ADR | — American Depositary Receipt |
At December 31, 2013, the Portfolio had outstanding foreign currency contracts to buy/sell foreign currencies as follows: (Note 1)
Foreign Currency Buy Contracts | Counterparty | Local Contract Buy Amount (000’s) | U.S. $ Current Value | U.S. $ Settlement Value | Unrealized Appreciation/ (Depreciation) | |||||||||||||
Japanese Yen vs. U.S. Dollar,expiring 1/6/14 | Barclays Bank plc | 7,849 | $ | 74,532 | $ | 74,912 | $ | (380 | ) | |||||||||
Japanese Yen vs. U.S. Dollar,expiring 1/8/14 | UBS AG | 2,467 | 23,422 | 23,433 | (11 | ) | ||||||||||||
|
| |||||||||||||||||
| $ | (391 | ) | ||||||||||||||||
|
| |||||||||||||||||
The following is a summary of the inputs used to value the Portfolio’s assets and liabilities carried at fair value as of December 31, 2013:
The inputs or methodology used for valuing securities are not necessarily an indication of the risk associated with investing in those securities.
Various inputs are used in determining the value of the Portfolio’s investments. These inputs are summarized in the three broad levels listed below:
| Investment Type | Level 1 Quoted Prices in Active Markets for identical securities | Level 2 Significant Other Observable Inputs (including quoted prices for similar securities, interest rates, | Level 3 Significant Unobservable Portfolio’s own assumptions in determining the fair | Total | ||||||||||||
Assets: | ||||||||||||||||
Common Stocks | ||||||||||||||||
Consumer Discretionary | $ | 60,002,688 | $ | 4,815,440 | $ | — | $ | 64,818,128 | ||||||||
Health Care | — | 940,803 | — | 940,803 | ||||||||||||
Industrials | 3,902,716 | — | — | 3,902,716 | ||||||||||||
Information Technology | 485,711,954 | 31,757,068 | — | 517,469,022 | ||||||||||||
Telecommunication Services | 1,968,613 | — | — | 1,968,613 | ||||||||||||
Investment Companies | ||||||||||||||||
Exchange Traded Funds (ETFs) | 144,903,365 | — | — | 144,903,365 | ||||||||||||
|
|
|
|
|
|
|
| |||||||||
Total Assets | $ | 696,489,336 | $ | 37,513,311 | $ | — | $ | 734,002,647 | ||||||||
|
|
|
|
|
|
|
| |||||||||
See Notes to Financial Statements.
176
AXA PREMIER VIP TRUST
MULTIMANAGER TECHNOLOGY PORTFOLIO
PORTFOLIO OF INVESTMENTS (Continued)
December 31, 2013
| Investment Type | Level 1 Quoted Prices in Active Markets for identical securities | Level 2 Significant Other Observable Inputs (including quoted prices for similar securities, interest rates, | Level 3 Significant Unobservable Portfolio’s own assumptions in determining the fair | Total | ||||||||||||
Liabilities: |
| |||||||||||||||
Forward Currency Contracts | $ | — | $ | (391 | ) | $ | — | $ | (391 | ) | ||||||
|
|
|
|
|
|
|
| |||||||||
Total Liabilities | $ | — | $ | (391 | ) | $ | — | $ | (391 | ) | ||||||
|
|
|
|
|
|
|
| |||||||||
Total | $ | 696,489,336 | $ | 37,512,920 | $ | – | $ | 734,002,256 | ||||||||
|
|
|
|
|
|
|
| |||||||||
There were no transfers between Levels 1, 2 or 3 during the year ended December 31, 2013.
Fair Values of Derivative Instruments as of December 31, 2013:
Statement of Assets and Liabilities | ||||||
Derivatives Not Accounted for as | Asset Derivatives | Fair Value | ||||
Interest rate contracts | Receivables, Net Assets - Unrealized appreciation | $ | — | * | ||
Foreign exchange contracts | Receivables | — | ||||
Credit contracts | Receivables | — | ||||
Equity contracts | Receivables, Net Assets - Unrealized appreciation | — | * | |||
Commodity contracts | Receivables | — | ||||
Other contracts | Receivables | — | ||||
|
| |||||
Total | $ | — | ||||
|
| |||||
Liability Derivatives | ||||||
Interest rate contracts | Payables, Net Assets - Unrealized depreciation | $ | — | * | ||
Foreign exchange contracts | Payables | (391 | ) | |||
Credit contracts | Payables | — | ||||
| Payables, Net Assets - Unrealized | ||||||
Equity contracts | depreciation | — | * | |||
Commodity contracts | Payables | — | ||||
Other contracts | Payables | — | ||||
|
| |||||
Total | $ | (391 | ) | |||
|
| |||||
| * | Includes cumulative appreciation/depreciation of futures contracts as reported in the Portfolio of Investments. Only current day’s variation margin is reported within the Statement of Assets & Liabilities. |
See Notes to Financial Statements.
177
AXA PREMIER VIP TRUST
MULTIMANAGER TECHNOLOGY PORTFOLIO
PORTFOLIO OF INVESTMENTS (Continued)
December 31, 2013
The effect of Derivative Instruments on the Statement of Operations for the year ended December 31, 2013:
| Amount of Realized Gain or (Loss) on Derivatives Recognized in Income | ||||||||||||||||||||
Derivatives Not Accounted for as Hedging Instruments^ | Options | Futures | Forward Currency Contracts | Swaps | Total | |||||||||||||||
Interest rate contracts | $ | — | $ | — | $ | — | $ | — | $ | — | ||||||||||
Foreign exchange contracts | — | — | (23,356 | ) | — | (23,356 | ) | |||||||||||||
Credit contracts | — | — | — | — | — | |||||||||||||||
Equity contracts | — | — | — | — | — | |||||||||||||||
Commodity contracts | — | — | — | — | — | |||||||||||||||
Other contracts | — | — | — | — | — | |||||||||||||||
|
|
|
|
|
|
|
|
|
| |||||||||||
Total | $ | — | $ | — | $ | (23,356 | ) | $ | — | $ | (23,356 | ) | ||||||||
|
|
|
|
|
|
|
|
|
| |||||||||||
| Amount of Unrealized Appreciation or (Depreciation) on Derivatives Recognized in Income | ||||||||||||||||||||
Derivatives Not Accounted for as Hedging Instruments^ | Options | Futures | Forward Currency Contracts | Swaps | Total | |||||||||||||||
Interest rate contracts | $ | — | $ | — | $ | — | $ | — | $ | — | ||||||||||
Foreign exchange contracts | — | — | 210 | — | 210 | |||||||||||||||
Credit contracts | — | — | — | — | — | |||||||||||||||
Equity contracts | — | — | — | — | — | |||||||||||||||
Commodity contracts | — | — | — | — | — | |||||||||||||||
Other contracts | — | — | — | — | — | |||||||||||||||
|
|
|
|
|
|
|
|
|
| |||||||||||
Total | $ | — | $ | — | $ | 210 | $ | — | $ | 210 | ||||||||||
|
|
|
|
|
|
|
|
|
| |||||||||||
^ This Portfolio held forward foreign currency contracts as hedging.
The Portfolio held forward foreign currency contracts with an average settlement value of approximately $73,000 for two months during the year ended December 31, 2013.
The following table presents the Portfolio’s gross derivative assets and liabilities by counterparty net of amounts available for offset under netting arrangements and any related collateral received or pledged by the Portfolio as of December 31, 2013:
Counterparty | Gross Amount of Derivative Liabilities Presented in the Statement of Assets and Liabilities (a) | Derivatives Available for Offset | Collateral Pledged | Net Amount Due to Counterparty | ||||||||||||
Barclays Bank plc | $ | 380 | $ | — | $ | — | $ | 380 | ||||||||
UBS AG | 11 | — | — | 11 | ||||||||||||
|
|
|
|
|
|
|
| |||||||||
| $ | 391 | $ | — | $ | — | $ | 391 | |||||||||
|
|
|
|
|
|
|
| |||||||||
| (a) | For financial reporting purposes the Portfolio does not offset derivative assets and derivative liabilities subject to master netting arrangements in the Statement of Assets and Liabilities. |
Investment security transactions for the year ended December 31, 2013 were as follows:
Cost of Purchases: | ||||
Long-term investments other than U.S. government debt securities | $ | 419,354,980 | ||
Net Proceeds of Sales and Redemptions: | ||||
Long-term investments other than U.S. government debt securities | $ | 501,569,521 |
See Notes to Financial Statements.
178
AXA PREMIER VIP TRUST
MULTIMANAGER TECHNOLOGY PORTFOLIO
PORTFOLIO OF INVESTMENTS (Continued)
December 31, 2013
As of December 31, 2013, the gross unrealized appreciation (depreciation) of investments based on the aggregate cost of investments for Federal income tax purposes was as follows:
Aggregate gross unrealized appreciation | $ | 278,720,087 | ||
Aggregate gross unrealized depreciation | (4,429,422 | ) | ||
|
| |||
Net unrealized appreciation | $ | 274,290,665 | ||
|
| |||
Federal income tax cost of investments | $ | 459,711,982 | ||
|
|
For the year ended December 31, 2013, the Portfolio incurred approximately $303 as brokerage commissions with Sanford C. Bernstein & Co., LLC, an affiliated broker/dealer.
The Portfolio has a net capital loss carryforward of $8,018,940, which expires in the year 2017. The Portfolio utilized net capital loss carryforward of $60,020,154 during 2013.
See Notes to Financial Statements.
179
AXA PREMIER VIP TRUST
MULTIMANAGER TECHNOLOGY PORTFOLIO
STATEMENT OF ASSETS AND LIABILITIES
December 31, 2013
ASSETS | ||||
Investments at value (Cost $444,284,844) | $ | 734,002,647 | ||
Cash | 11,244,250 | |||
Foreign cash (Cost $923,645) | 917,395 | |||
Receivable for securities sold | 623,741 | |||
Dividends, interest and other receivables | 120,426 | |||
Receivable from Separate Accounts for Trust shares sold | 113,193 | |||
Other assets | 1,649 | |||
|
| |||
Total assets | 747,023,301 | |||
|
| |||
LIABILITIES | ||||
Payable to Separate Accounts for Trust shares redeemed | 1,090,769 | |||
Payable for securities purchased | 760,219 | |||
Investment management fees payable | 587,889 | |||
Distribution fees payable - Class B | 151,336 | |||
Administrative fees payable | 125,326 | |||
Trustees’ fees payable | 10,888 | |||
Distribution fees payable - Class A | 3,136 | |||
Unrealized depreciation on forward foreign currency contracts | 391 | |||
Accrued expenses | 68,111 | |||
|
| |||
Total liabilities | 2,798,065 | |||
|
| |||
NET ASSETS | $ | 744,225,236 | ||
|
| |||
Net assets were comprised of: | ||||
Paid in capital | $ | 478,108,854 | ||
Accumulated undistributed net investment income (loss) | (181,220 | ) | ||
Accumulated undistributed net realized gain (loss) on investments and foreign currency transactions | (23,413,801 | ) | ||
Net unrealized appreciation (depreciation) on investments and foreign currency translations | 289,711,403 | |||
|
| |||
Net assets | $ | 744,225,236 | ||
|
| |||
Class A | ||||
Net asset value, offering and redemption price per share, $15,170,417 / 788,928 shares outstanding (unlimited amount authorized: $0.001 par value) | $ | 19.23 | ||
|
| |||
Class B | ||||
Net asset value, offering and redemption price per share, $727,651,000 / 38,807,623 shares outstanding (unlimited amount authorized: $0.001 par value) | $ | 18.75 | ||
|
| |||
Class K | ||||
Net asset value, offering and redemption price per share, $1,403,819 / 72,480 shares outstanding (unlimited amount authorized: $0.001 par value) | $ | 19.37 | ||
|
|
STATEMENT OF OPERATIONS
For the Year Ended December 31, 2013
INVESTMENT INCOME | ||||
Dividends (net of $55,109 foreign withholding tax) | $ | 8,200,353 | ||
Interest | 9,536 | |||
|
| |||
Total income | 8,209,889 | |||
|
| |||
EXPENSES | ||||
Investment management fees | 6,359,108 | |||
Distribution fees - Class B | 1,639,029 | |||
Administrative fees | 1,036,572 | |||
Custodian fees | 96,399 | |||
Professional fees | 86,314 | |||
Printing and mailing expenses | 81,402 | |||
Distribution fees - Class A | 33,397 | |||
Trustees’ fees | 14,819 | |||
Miscellaneous | 18,074 | |||
|
| |||
Gross expenses | 9,365,114 | |||
Less: Waiver from investment manager | (8 | ) | ||
Fees paid indirectly | (67,766 | ) | ||
|
| |||
Net expenses | 9,297,340 | |||
|
| |||
NET INVESTMENT INCOME (LOSS) | (1,087,451 | ) | ||
|
| |||
REALIZED AND UNREALIZED GAIN (LOSS) | ||||
Realized gain (loss) on: | ||||
Investments | 63,597,145 | |||
Foreign currency transactions | (35,082 | ) | ||
|
| |||
Net realized gain (loss) | 63,562,063 | |||
|
| |||
Change in unrealized appreciation (depreciation) on: | ||||
Investments | 144,009,662 | |||
Foreign currency translations | (6,364 | ) | ||
|
| |||
Net change in unrealized appreciation (depreciation) | 144,003,298 | |||
|
| |||
NET REALIZED AND UNREALIZED GAIN (LOSS) | 207,565,361 | |||
|
| |||
NET INCREASE (DECREASE) IN NET ASSETS RESULTING FROM OPERATIONS | $ | 206,477,910 | ||
|
|
See Notes to Financial Statements.
180
AXA PREMIER VIP TRUST
MULTIMANAGER TECHNOLOGY PORTFOLIO
STATEMENT OF CHANGES IN NET ASSETS
| Year Ended December 31, | ||||||||
| 2013 | 2012 | |||||||
INCREASE (DECREASE) IN NET ASSETS FROM OPERATIONS: | ||||||||
Net investment income (loss) | $ | (1,087,451 | ) | $ | (595,694 | ) | ||
Net realized gain (loss) on investments and foreign currency transactions | 63,562,063 | 43,695,170 | ||||||
Net change in unrealized appreciation (depreciation) on investments and foreign currency translations | 144,003,298 | 35,257,436 | ||||||
|
|
|
| |||||
NET INCREASE (DECREASE) IN NET ASSETS RESULTING FROM OPERATIONS | 206,477,910 | 78,356,912 | ||||||
|
|
|
| |||||
CAPITAL SHARES TRANSACTIONS: | ||||||||
Class A | ||||||||
Capital shares sold [ 52,418 and 96,471 shares, respectively ] | 827,534 | 1,354,037 | ||||||
Capital shares repurchased [ (119,627) and (219,475) shares, respectively ] | (1,928,307 | ) | (3,096,312 | ) | ||||
|
|
|
| |||||
Total Class A transactions | (1,100,773 | ) | (1,742,275 | ) | ||||
|
|
|
| |||||
Class B | ||||||||
Capital shares sold [ 4,053,036 and 6,340,123 shares, respectively ] | 63,877,215 | 86,860,710 | ||||||
Capital shares repurchased [ (9,168,577) and (10,033,910) shares, respectively ] | (145,825,651 | ) | (136,787,550 | ) | ||||
|
|
|
| |||||
Total Class B transactions | (81,948,436 | ) | (49,926,840 | ) | ||||
|
|
|
| |||||
Class K † | ||||||||
Capital shares sold [ 98,361 and 5,123 shares, respectively ] | 1,679,781 | 70,083 | ||||||
Capital shares repurchased [ (27,659) and (3,345) shares, respectively ] | (446,684 | ) | (47,007 | ) | ||||
|
|
|
| |||||
Total Class K transactions | 1,233,097 | 23,076 | ||||||
|
|
|
| |||||
NET INCREASE (DECREASE) IN NET ASSETS RESULTING FROM CAPITAL SHARE TRANSACTIONS | (81,816,112 | ) | (51,646,039 | ) | ||||
|
|
|
| |||||
TOTAL INCREASE (DECREASE) IN NET ASSETS | 124,661,798 | 26,710,873 | ||||||
NET ASSETS: | ||||||||
Beginning of year | 619,563,438 | 592,852,565 | ||||||
|
|
|
| |||||
End of year (a) | $ | 744,225,236 | $ | 619,563,438 | ||||
|
|
|
|
| ||||
(a) Includes accumulated undistributed (overdistributed) net investment income (loss) of | $ | (181,220 | ) | $ | 84,456 | |||
|
|
|
| |||||
† Class K commenced operations on August 29, 2012. | ||||||||
See Notes to Financial Statements.
181
AXA PREMIER VIP TRUST
MULTIMANAGER TECHNOLOGY PORTFOLIO
FINANCIAL HIGHLIGHTS
| Year Ended December 31, | ||||||||||||||||||||
| Class A | 2013 | 2012 | 2011 | 2010 | 2009 | |||||||||||||||
Net asset value, beginning of year | $ | 14.18 | $ | 12.50 | $ | 13.10 | $ | 11.10 | $ | 6.99 | ||||||||||
|
|
|
|
|
|
|
|
|
| |||||||||||
Income (loss) from investment operations: | ||||||||||||||||||||
Net investment income (loss) | (0.03 | )(e) | (0.01 | )(e) | (0.03 | )(e) | (0.04 | )(e) | (0.01 | )(e) | ||||||||||
Net realized and unrealized gain (loss) on investments and foreign currency transactions | 5.08 | 1.69 | (0.57 | ) | 2.04 | 4.12 | ||||||||||||||
|
|
|
|
|
|
|
|
|
| |||||||||||
Total from investment operations | 5.05 | 1.68 | (0.60 | ) | 2.00 | 4.11 | ||||||||||||||
|
|
|
|
|
|
|
|
|
| |||||||||||
Net asset value, end of year | $ | 19.23 | $ | 14.18 | $ | 12.50 | $ | 13.10 | $ | 11.10 | ||||||||||
|
|
|
|
|
|
|
|
|
| |||||||||||
Total return | 35.61 | % | 13.44 | % | (4.58 | )% | 18.02 | % | 58.80 | % | ||||||||||
|
|
|
|
|
|
|
|
|
| |||||||||||
Ratios/Supplemental Data: | ||||||||||||||||||||
Net assets, end of year (000’s) | $ | 15,170 | $ | 12,142 | $ | 12,244 | $ | 12,776 | $ | 11,949 | ||||||||||
Ratio of expenses to average net assets: | ||||||||||||||||||||
After waivers (f) | 1.40 | % | 1.40 | % | 1.14 | % | 1.16 | % | 1.19 | % | ||||||||||
After waivers and fees paid indirectly (f) | 1.39 | % | 1.39 | % | 1.13 | % | 1.14 | % | 1.09 | % | ||||||||||
Before waivers and fees paid indirectly (f) | 1.40 | % | 1.40 | % | 1.14 | % | 1.16 | % | 1.19 | % | ||||||||||
Ratio of net investment income (loss) to average net assets: | ||||||||||||||||||||
After waivers (f) | (0.17 | )% | (0.11 | )% | (0.27 | )% | (0.35 | )% | (0.19 | )% | ||||||||||
After waivers and fees paid indirectly (f) | (0.16 | )% | (0.10 | )% | (0.26 | )% | (0.34 | )% | (0.08 | )% | ||||||||||
Before waivers and fees paid indirectly (f) | (0.17 | )% | (0.11 | )% | (0.27 | )% | (0.35 | )% | (0.19 | )% | ||||||||||
Portfolio turnover rate | 64 | % | 62 | % | 78 | % | 84 | % | 129 | % | ||||||||||
| Year Ended December 31, | ||||||||||||||||||||
| Class B | 2013 | 2012 | 2011 | 2010 | 2009 | |||||||||||||||
Net asset value, beginning of year | $ | 13.83 | $ | 12.19 | $ | 12.81 | $ | 10.88 | $ | 6.86 | ||||||||||
|
|
|
|
|
|
|
|
|
| |||||||||||
Income (loss) from investment operations: | ||||||||||||||||||||
Net investment income (loss) | (0.03 | )(e) | (0.01 | )(e) | (0.07 | )(e) | (0.06 | )(e) | (0.03 | )(e) | ||||||||||
Net realized and unrealized gain (loss) on investments and foreign currency transactions | 4.95 | 1.65 | (0.55 | ) | 1.99 | 4.05 | ||||||||||||||
|
|
|
|
|
|
|
|
|
| |||||||||||
Total from investment operations | 4.92 | 1.64 | (0.62 | ) | 1.93 | 4.02 | ||||||||||||||
|
|
|
|
|
|
|
|
|
| |||||||||||
Net asset value, end of year | $ | 18.75 | $ | 13.83 | $ | 12.19 | $ | 12.81 | $ | 10.88 | ||||||||||
|
|
|
|
|
|
|
|
|
| |||||||||||
Total return | 35.57 | % | 13.45 | % | (4.84 | )% | 17.74 | % | 58.60 | % | ||||||||||
|
|
|
|
|
|
|
|
|
| |||||||||||
Ratios/Supplemental Data: | ||||||||||||||||||||
Net assets, end of year (000’s) | $ | 727,651 | $ | 607,397 | $ | 580,608 | $ | 663,895 | $ | 602,145 | ||||||||||
Ratio of expenses to average net assets: | ||||||||||||||||||||
After waivers (f) | 1.40 | % | 1.40 | % | 1.39 | % | 1.41 | % | 1.44 | % | ||||||||||
After waivers and fees paid indirectly (f) | 1.39 | % | 1.39 | % | 1.38 | % | 1.39 | % | 1.34 | % | ||||||||||
Before waivers and fees paid indirectly (f) | 1.40 | % | 1.40 | % | 1.39 | % | 1.41 | % | 1.44 | % | ||||||||||
Ratio of net investment income (loss) to average net assets: | ||||||||||||||||||||
After waivers (f) | (0.17 | )% | (0.10 | )% | (0.53 | )% | (0.60 | )% | (0.43 | )% | ||||||||||
After waivers and fees paid indirectly (f) | (0.16 | )% | (0.09 | )% | (0.52 | )% | (0.58 | )% | (0.33 | )% | ||||||||||
Before waivers and fees paid indirectly (f) | (0.17 | )% | (0.10 | )% | (0.53 | )% | (0.60 | )% | (0.43 | )% | ||||||||||
Portfolio turnover rate | 64 | % | 62 | % | 78 | % | 84 | % | 129 | % | ||||||||||
See Notes to Financial Statements.
182
AXA PREMIER VIP TRUST
MULTIMANAGER TECHNOLOGY PORTFOLIO
FINANCIAL HIGHLIGHTS (Continued)
| Year Ended December 31, 2013 | August 29, 2012* to December 31,2012 | |||||||
| Class K | ||||||||
Net asset value, beginning of period | $ | 14.20 | $ | 14.48 | ||||
|
|
|
| |||||
Income (loss) from investment operations: | ||||||||
Net investment income (loss) | 0.05 | (e) | 0.03 | (e) | ||||
Net realized and unrealized gain (loss) on investments and foreign currency transactions | 5.12 | (0.31 | ) | |||||
|
|
|
| |||||
Total from investment operations | 5.17 | (0.28 | ) | |||||
|
|
|
| |||||
Net asset value, end of period | $ | 19.37 | $ | 14.20 | ||||
|
|
|
| |||||
Total return (b) | 36.41 | % | (1.93 | )% | ||||
|
|
|
| |||||
Ratios/Supplemental Data: | ||||||||
Net assets, end of period (000’s) | $ | 1,404 | $ | 25 | ||||
Ratio of expenses to average net assets: | ||||||||
After waivers (a)(f) | 1.15 | % | 1.14 | % | ||||
After waivers and fees paid indirectly (a)(f) | 1.14 | % | 1.13 | % | ||||
Before waivers and fees paid indirectly (a)(f) | 1.15 | % | 1.14 | % | ||||
Ratio of net investment income (loss) to average net assets: | ||||||||
After waivers (a)(f) | 0.29 | % | 0.58 | % | ||||
After waivers and fees paid indirectly (a)(f) | 0.30 | % | 0.59 | % | ||||
Before waivers and fees paid indirectly (a)(f) | 0.29 | % | 0.58 | % | ||||
Portfolio turnover rate | 64 | % | 62 | % | ||||
| * | Commencement of Operations. |
| (a) | Ratios for periods less than one year are annualized. |
| (b) | Total returns for periods less than one year are not annualized. |
| (e) | Net investment income (loss) per share is based on average shares outstanding. |
| (f) | Expenses do not include the expenses of the underlying funds (“indirect expenses”). |
See Notes to Financial Statements.
183
AXA PREMIER VIP TRUST
December 31, 2013
| Note 1 | Organization and Significant Accounting Policies |
AXA Premier VIP Trust (the “Trust”) was organized as a Delaware statutory trust on October 2, 2001 and is registered under the Investment Company Act of 1940, as amended (the “1940 Act”), as an open-end management investment company with thirty-six diversified Portfolios (each a “Portfolio”). These financial statements present eight of the diversified Portfolios: Multimanager Aggressive Equity Portfolio, Multimanager Core Bond Portfolio, Multimanager International Equity Portfolio, Multimanager Large Cap Core Equity Portfolio, Multimanager Large Cap Value Portfolio, Multimanager Mid Cap Growth Portfolio, Multimanager Mid Cap Value Portfolio and Multimanager Technology Portfolio. The investment manager to each Portfolio is AXA Equitable Funds Management Group, LLC (“FMG LLC” or the “Manager”), a wholly-owned subsidiary of AXA Equitable Life Insurance Company (“AXA Equitable”). The day-to-day portfolio management of each Portfolio, other than an allocated portion of the Multimanager Technology Portfolio, is provided by multiple investment sub-advisers (each an “Adviser”).
On August 29, 2012, AXA Equitable contributed $10,000 in seed capital into Class K shares of the Multimanager Technology Portfolio.
Under the Trust’s organizational documents, its officers and trustees are indemnified against certain liabilities arising out of the performance of their duties to the Trust. In addition, in the normal course of business, the Trust enters into contracts with certain vendors and others that provide for general indemnifications. The Trust’s maximum exposure under these arrangements is unknown as this would involve future claims that may be made against the Trust. However, based on experience, the Trust and management expect the risk of loss to be remote.
All of the Portfolios employ multiple Advisers. Each of the Advisers independently chooses and maintains a portfolio of securities for the Portfolio and each is responsible for investing a specific allocated portion of the Portfolio’s assets. Because each Adviser will be managing its allocated portion of the Portfolio independently from the other Advisers, the same security may be held in different portions of the Portfolio, or may be acquired for one portion of the Portfolio at a time when the Adviser of another portion deems it appropriate to dispose of the security. Similarly, under some market conditions, one Adviser may believe that temporary defensive investments in short-term instruments or cash are appropriate when the other Adviser or Advisers believe continued exposure to the equity or fixed-income markets is appropriate for their portions of the Portfolio. Because each Adviser directs the trading for its own portion of the Portfolio, and does not aggregate its transactions with those of the other Advisers, the Portfolio may incur higher brokerage costs, and have higher portfolio turnover, than would be the case if a single Adviser were managing the entire Portfolio.
The Trust issues three classes of shares, Class A, Class B and Class K. The Class A and Class B shares are each subject to distribution fees imposed under a distribution plan (“Distribution Plan”) adopted pursuant to Rule 12b-1 under the 1940 Act. Under the Trust’s multiple class distribution system, each class of shares has identical voting, dividend, liquidation and other rights, other than the payment of distribution fees under the applicable Distribution Plan. The Trust’s shares are currently sold only to insurance company separate accounts in connection with variable life insurance contracts and variable annuity certificates and contracts issued by AXA Equitable, AXA Life and Annuity Company and other affiliated or unaffiliated insurance companies and to the AXA Equitable 401(k) Plan. Shares also may be sold to other tax-qualified retirement plans, to other portfolios of the Trust and to portfolios of EQ Advisors Trust.
The investment objectives of each Portfolio are as follows:
Multimanager Aggressive Equity Portfolio (advised by AllianceBernstein L.P. (“AllianceBernstein”) (an affiliate of FMG LLC), ClearBridge Investments, LLC, Scotia Institutional Asset Management US, Ltd. (formerly GCIC US Ltd.), Marsico Capital Management, LLC (“Marsico”), T. Rowe Price Associates, Inc. and Westfield Capital Management Company, L.P.) — Seeks to achieve long-term growth of capital with an emphasis on risk-adjusted returns and managing volatility in the Portfolio. Effective September 1, 2013, AllianceBernstein no longer serves as an adviser to the Active Allocated Portion of the Portfolio.
184
AXA PREMIER VIP TRUST
NOTES TO FINANCIAL STATEMENTS (Continued)
December 31, 2013
Multimanager Core Bond Portfolio (advised by BlackRock Financial Management, Inc., Pacific Investment Management Company LLC, and SSgA Funds Management, Inc. (“SSgA FM”)) — Seeks to achieve a balance of high current income and capital appreciation, consistent with a prudent level of risk.
Multimanager International Equity Portfolio (advised by BlackRock Investment Management, LLC (“BlackRock”), EARNEST Partners, LLC, J.P. Morgan Investment Management Inc., and Marsico) — Seeks to achieve long-term growth of capital with an emphasis on risk-adjusted returns and managing volatility in the Portfolio.
Multimanager Large Cap Core Equity Portfolio (advised by AllianceBernstein, Janus Capital Management LLC, and Thornburg Investment Management, Inc.) — Seeks to achieve long-term growth of capital with an emphasis on risk-adjusted returns and managing volatility in the Portfolio.
Multimanager Large Cap Value Portfolio (advised by AllianceBernstein, Institutional Capital LLC, and MFS Investment Management) — Seeks to achieve long-term growth of capital with an emphasis on risk-adjusted returns and managing volatility in the Portfolio.
Multimanager Mid Cap Growth Portfolio (advised by AllianceBernstein, BlackRock, Franklin Advisers, Inc. and Wellington Management Company, LLP (“Wellington Management”)) — Seeks to achieve long-term growth of capital with an emphasis on risk-adjusted returns and managing volatility in the Portfolio.
Multimanager Mid Cap Value Portfolio (advised by BlackRock, Diamond Hill Capital Management, Inc., Knightsbridge Asset Management LLC and Lord, Abbett & Co. LLC) — Seeks to achieve long-term growth of capital with an emphasis on risk-adjusted returns and managing volatility in the Portfolio.
Multimanager Technology Portfolio (advised by FMG LLC, Allianz Global Investors U.S. LLC, SSgA FM and Wellington Management) — Seeks to achieve long-term growth of capital.
The following is a summary of the significant accounting policies of the Trust:
The preparation of financial statements in accordance with accounting principles generally accepted in the United States of America requires management to make estimates and assumptions that affect the reported amounts and disclosures. Actual results could differ from those estimates.
Valuation:
Equity securities (including securities issued by Exchange Traded Funds (“ETFs”)) listed on national securities exchanges are valued at the last sale price or official closing price on the date of valuation or, if there is no sale or official closing price, at the latest available bid price. Securities listed on the NASDAQ stock market will be valued using the NASDAQ Official Closing Price (“NOCP”). Generally, the NOCP will be the last sale price unless the reported trade for the security is outside the range of the bid/ask price. In such cases, the NOCP will be normalized to the nearer of the bid or ask price. Other unlisted stocks are valued at their last sale price or official closing price, or if there is no such price, at a bid price estimated by a broker.
Convertible preferred stocks listed on national securities exchanges are valued as of their last sale price or, if there is no sale, at the latest available bid price.
Convertible bonds and unlisted convertible preferred stocks are valued at prices obtained from a pricing service for such instruments or, if a pricing service price is not available, at bid prices obtained from one or more of the major dealers in such bonds or stocks. Where there is a discrepancy between dealers, values may be adjusted based on recent premium spreads to the underlying common stocks. Convertible bonds may be matrix-priced based upon the conversion value to the underlying common stocks and market premiums.
Mortgage-backed and asset-backed securities are valued at prices obtained from a bond pricing service where available, or at a bid price obtained from one or more of the major dealers in such securities. The pricing service may utilize data such as issuer type, coupon, cash flows, mortgage
185
AXA PREMIER VIP TRUST
NOTES TO FINANCIAL STATEMENTS (Continued)
December 31, 2013
prepayment projection tables and Adjustable Rate Mortgage evaluations that incorporate index data, periodic and life caps, the next coupon reset date, and the convertibility of the bond in making evaluations. If a quoted price is unavailable, an equivalent yield or yield spread quotes will be obtained from a broker and converted to a price.
Options that are traded on an exchange are valued at their last sales price or, if not available, previous day’s sales price. Options not traded on an exchange or actively traded are valued according to fair value methods. The market value of a put or call option will usually reflect, among other factors, the market price of the underlying security.
Corporate and Municipal bonds and notes may be valued on the basis of prices provided by a pricing service when such prices are believed to reflect the fair value of such securities. The pricing service may utilize many factors in making evaluations, trading in similar groups of securities and any developments related to specific securities. However, when such prices are not available, such bonds and notes are valued at a bid price estimated by a broker.
U.S. Treasury securities and other obligations issued or guaranteed by the U.S. Government, its agencies or instrumentalities, are valued at prices obtained from a bond pricing service where available. The pricing service may utilize data received from active market makers and broker-dealers, yield curves, and the spread over comparable U.S. Treasury issues in making evaluations.
Foreign securities, including foreign government securities, not traded directly in the U.S., or traded in American Depository Receipt (“ADR”) or similar form, are valued at representative quoted prices from the primary exchange in the currency of the country of origin. Foreign currency is converted into U.S. dollar equivalent at current exchange rates.
Investments in shares of open-end mutual funds (other than ETFs) held by a Portfolio will be valued at the net asset value of the shares of such funds as described in these funds’ prospectuses.
Futures contracts are valued at their last settlement price or, if there is no sale, at the latest available bid price.
Forward foreign exchange contracts are valued by interpolating between the forward and spot currency rates as quoted by a pricing service as of a designated hour on the valuation date. The pricing service may utilize data such as actual trading information and foreign currency exchange rates gathered from leading market makers and foreign currency exchange trading centers throughout the world in making valuations.
During the year ended December 31, 2013, each of the Multimanager Core Bond Portfolio, Multimanager International Equity Portfolio and Multimanager Technology Portfolio held forward foreign currency contracts to either enter into exposure to certain currencies, or enter into an economic hedge against changes in the values of securities held in the Portfolio, that do not qualify for hedge accounting under Accounting Standards Codification (“ASC”) 815. The Statement of Operations for each Portfolio reflects realized gains or losses, if any, in forward currency transactions and unrealized gains or losses in forward currency exchange transactions. Further information on the impact of these positions on the Portfolios’ financial statements can be found in the Statement of Operations and Portfolio of Investments for each Portfolio.
If market quotations are not readily available for a security or other financial instruments, such securities and instruments shall be referred to the Trust’s Valuation Committee (“Committee”), who will value the assets in good faith pursuant to procedures adopted by the Board of Trustees (“Pricing Procedures”) of the Trust (the “Board”).
The Board is responsible for ensuring that appropriate valuation methods are used to price securities for the Trust’s Portfolios. The Board has delegated the responsibility of calculating the NAVs of the Trust’s Portfolios and classes pursuant to these Pricing Procedures to the Trust’s administrator, FMG LLC (in its capacity as administrator, the “Administrator”). The Administrator has entered into a sub-administration agreement with JPMorgan Investor Services Co. (the “Sub-Administrator”) to assist in performing certain of the duties described herein. The Committee,
186
AXA PREMIER VIP TRUST
NOTES TO FINANCIAL STATEMENTS (Continued)
December 31, 2013
established by the Board, determines the value of the Trust’s securities and assets for which market quotations are not readily available or for which valuation cannot otherwise be provided in accordance with procedures adopted by the Board. The Committee is comprised of senior employees from FMG LLC.
Due to the inherent uncertainty of valuations of such securities, the fair value may differ significantly from the values that would have been used had a ready market for such securities existed.
Various inputs are used in determining the value of the Trust’s assets or liabilities carried at fair value. These inputs are summarized in three broad levels below:
| • | Level 1 - quoted prices in active markets for identical assets |
| • | Level 2 - other significant observable inputs (including quoted prices of similar securities, interest rates, prepayment speeds, credit risk, etc.) |
| • | Level 3 - significant unobservable inputs (including the Portfolio’s own assumptions in determining the fair value of investments) |
A summary of inputs used to value each Portfolio’s assets and liabilities carried at fair value as of December 31, 2013 is included in the Portfolio of Investments.
Changes in valuation techniques may result in transfers into or out of an investment’s assigned level. The Portfolios’ policy is to recognize transfers into and transfers out of the valuation levels as of the end of the reporting period. Transfers between levels are included after the Summary of Level 1, Level 2 and Level 3 inputs, following the Portfolio of Investments for each Portfolio. Transfers between levels may be due to a decline or an increase in market activity (e.g., frequency of trades), which may result in a lack of, or increase in, available market inputs to determine price. Transfers into and transfers out of Level 3 are included in the Level 3 reconciliation following the Portfolio of Investments for each Portfolio. Transfers into or out of Level 3 may be due to a decline or increase in market activity (e.g., frequency of trades).
The inputs or methodology used to value securities are not necessarily an indication of the risk associated with investing in those securities. An investment’s level within the fair value hierarchy is based on the lowest level of any input, both individually and in aggregate, that is significant to the fair value measurement.
The Committee meets and reviews reports based on the valuation technique used to value each particular Level 3 security. In connection with this review, the Committee obtains, when available, updates from its pricing vendors and Advisers for each fair valued security. For example, with respect to model driven prices, the Committee receives a report regarding a review and recalculation of pricing models and related discounts. For securities valued based on broker quotes, the Committee evaluates variances between existing broker quotes and any alternative broker quotes provided by an Adviser or other pricing source.
To substantiate unobservable inputs used in fair valuation, the Secretary of the Committee performs an independent verification and additional research for all fair value notifications received from its pricing agent. Among other factors, particular areas of focus include: description of security, historical pricing, intra-day price movement, last trade information, corporate actions, related securities, any available company news and announcements, any available trade data and actions taken by other clients of the pricing vendor. The Committee also notes the materiality of holdings and price changes on portfolio NAV.
The Committee reviews and considers changes in value for all fair valued securities that have occurred since the last review.
Pursuant to procedures approved by the Board, events or circumstances affecting the values of portfolio securities that occur between the closing of their principal markets and the time the net
187
AXA PREMIER VIP TRUST
NOTES TO FINANCIAL STATEMENTS (Continued)
December 31, 2013
asset value is determined may be reflected in the Trust’s calculation of net asset values for each applicable Portfolio when the Trust’s Manager deems that the particular event or circumstance would materially affect such Portfolio’s net asset value. At December 31, 2013, none of the Portfolios applied these procedures.
Security Transactions and Investment Income:
Securities transactions are recorded on the trade date net of brokerage fees, commissions, and transfer fees. Dividend income (net of withholding taxes) and distributions to shareholders are recorded on the ex-dividend date except that certain dividends from foreign securities, if any, are recognized as soon as the fund is informed of the ex-dividend date. Interest income (including amortization of premium and accretion of discount on long-term securities using the effective yield method) and interest expense are accrued daily. The Trust records paydown gains and losses realized on prepayments received on mortgage-backed securities as an adjustment to interest income.
The Portfolios record distributions received in excess of income from underlying investments as a reduction of cost of investments and/or realized gain. Such amounts are based on estimates if actual amounts are not available and actual amounts of income, realized gain and return of capital may differ from the estimated amounts. The Portfolios adjust the estimated amounts of components of distributions (and consequently its net investment income) as necessary once the issuers provide information about the actual composition of the distributions.
Realized gains and losses on the sale of investments are computed on the basis of the specific identified cost method of the investments sold. Unrealized appreciation (depreciation) on investments and foreign currency denominated assets and liabilities, if any, is presented net of deferred taxes on unrealized gains in the Statement of Assets and Liabilities.
Capital Gains Taxes:
Certain Portfolios may be subject to capital gains and repatriation taxes imposed by certain countries in which they invest. These Portfolios have recorded a deferred tax liability with respect to unrealized appreciation on foreign securities for potential capital gains and repatriation taxes at December 31, 2013. The accrual for capital gains and repatriation taxes for securities is included in net unrealized appreciation (depreciation) on investments in the Statements of Assets and Liabilities for the Portfolios. The amounts related to capital gain taxes for securities that have been sold are included in the net realized gain (loss) on investments in the Statements of Operations for the Portfolios.
Allocation of Expenses and Income:
Expenses attributable to a single Portfolio or class are charged to that Portfolio or class. Expenses of the Trust not attributable to a single Portfolio or class are charged to each Portfolio or class in proportion to the average net assets of each Portfolio or other appropriate allocation methods.
All income earned and expenses incurred by each Portfolio are borne on a pro-rata basis by each outstanding class of shares, based on the proportionate interest in the Portfolio represented by the daily net assets of such class, except for distribution fees which are charged on a class specific basis.
Foreign Currency Valuation:
The books and records of the Trust are kept in U.S. dollars. Foreign currency amounts are translated into U.S. dollars at current exchange rates at the following dates:
(i) market value of investment securities, other assets and liabilities — at the valuation date.
(ii) purchases and sales of investment securities, income and expenses — at the date of such transactions.
188
AXA PREMIER VIP TRUST
NOTES TO FINANCIAL STATEMENTS (Continued)
December 31, 2013
The Portfolios do not isolate that portion of the results of operations resulting from changes in foreign exchange rates on investments from the fluctuations arising from changes in market prices of securities held. Such fluctuations are included with the net realized and unrealized gain or loss on securities.
Net currency gains or losses realized and unrealized as a result of differences between interest or dividends, withholding taxes, security payables/receivables, forward foreign currency exchange contracts and foreign cash recorded on a Portfolio’s books and the U.S. dollar equivalent amount actually received or paid are presented under foreign currency transactions and foreign currency translations, in the realized and unrealized gains and losses section, respectively, of the Statements of Operations. Net realized gains (losses) on foreign currency transactions represent net foreign exchange gains (losses) from forward foreign currency contracts, disposition of foreign currencies, currency gains or losses realized between the trade and settlement dates on securities transactions, and the difference between the amount of investment income and foreign withholding taxes recorded on a Portfolio’s books and the U.S. dollar equivalent of amounts actually received or paid.
Taxes:
The Trust intends to comply with the requirements of the Internal Revenue Code of 1986, as amended, applicable to regulated investment companies (“RICS”) and to distribute substantially all of its net investment income and net realized capital gains to shareholders of each Portfolio. Therefore, no Federal income tax provision is required.
The Portfolios are not aware of any tax positions for which it is reasonably possible that the total amounts of unrecognized tax benefits will significantly change in the next twelve months. However, the Portfolios’ conclusions may be subject to future review based on changes in, or the interpretation of, the accounting standards or tax laws and regulations. The Portfolios recognize interest and penalties, if any, related to uncertain tax positions as income tax expense in the Statements of Operations. During the year, the Portfolios did not incur any interest or penalties. Each of the tax years in the four year period ended December 31, 2013 remains subject to examination by the Internal Revenue Service and state taxing authorities.
Dividends from net investment income, if any, are declared and distributed at least annually for all Portfolios (Multimanager Core Bond declares and distributes monthly). Dividends from net realized short-term and long-term capital gains are declared and distributed at least annually to the shareholders of the Portfolios to which such gains are attributable. All dividends are reinvested in additional full and fractional shares of the related Portfolios. All distributions are calculated on a tax basis and, as such, the amounts may differ from financial statement investment income and realized gains. Those differences are primarily due to differing book and tax treatments for losses due to wash sales transactions (on all Portfolios), straddle loss deferrals (Multimanager Aggressive Equity Portfolio, Multimanager Core Bond Portfolio, Multimanager International Equity Portfolio, Multimanager Large Cap Core Equity Portfolio and Multimanager Large Cap Value Portfolio) and mark-to-market of futures contracts (Multimanager International Equity Portfolio, Multimanager Mid Cap Growth Portfolio and Multimanager Mid Cap Value Portfolio). In addition, short-term capital gains and foreign currency gains are treated as capital gains for accounting purposes but are considered ordinary income for tax purposes. Capital and net specified losses incurred after October 31 and within the taxable year are deemed to arise on the first business day of a Portfolio’s next taxable year. The tax composition of distributed and undistributed income and gains for the years ended December 31, 2013 and December 31, 2012, were as follows:
| Year Ended December 31, 2013 | Year Ended December 31, 2012 | |||||||||||||||||||||||||||||||
| Distributed Ordinary Income | Distributed Long Term Gains | Accumulated Undistributed Ordinary Income | Accumulated Undistributed Long Term Gains | Distributed Ordinary Income | Distributed Long Term Gains | Accumulated Undistributed Ordinary Income | Accumulated Undistributed Long Term Gains | |||||||||||||||||||||||||
Multimanager Aggressive Equity | $ | 1,183,430 | $ | — | $ | — | $ | — | $ | — | $ | — | $ | — | $ | — | ||||||||||||||||
Multimanager Core Bond | 25,012,231 | 529,281 | 8,764,758 | — | 107,636,612 | 36,992,116 | 1,373,747 | 529,281 | ||||||||||||||||||||||||
Multimanager International Equity | 4,509,436 | — | 157,272 | — | 11,210,064 | — | 60,764 | — | ||||||||||||||||||||||||
189
AXA PREMIER VIP TRUST
NOTES TO FINANCIAL STATEMENTS (Continued)
December 31, 2013
| Year Ended December 31, 2013 | Year Ended December 31, 2012 | |||||||||||||||||||||||||||||||
| Distributed Ordinary Income | Distributed Long Term Gains | Accumulated Undistributed Ordinary Income | Accumulated Undistributed Long Term Gains | Distributed Ordinary Income | Distributed Long Term Gains | Accumulated Undistributed Ordinary Income | Accumulated Undistributed Long Term Gains | |||||||||||||||||||||||||
Multimanager Large Cap Core Equity | $ | 4,938,130 | $ | — | $ | 2,347 | $ | — | $ | 5,030,420 | $ | — | $ | 817,592 | $ | — | ||||||||||||||||
Multimanager Large Cap Value | 11,239,796 | — | — | — | 15,027,262 | — | 1,728 | — | ||||||||||||||||||||||||
Multimanager Mid Cap Growth | 5,352,941 | 43,523,700 | 536,841 | 2,621,951 | — | — | — | — | ||||||||||||||||||||||||
Multimanager Mid Cap Value | 1,020,709 | — | — | — | 2,247,068 | — | — | — | ||||||||||||||||||||||||
Multimanager Technology | — | — | — | — | — | — | — | — | ||||||||||||||||||||||||
Permanent book and tax basis differences relating to shareholder distributions resulted in reclassifications to undistributed (overdistributed) net investment income (loss), accumulated net realized gain (loss) and paid-in capital at December 31, 2013 as follows:
Portfolios: | Undistributed Net Investment Income (Loss) | Accumulated Net Realized Gain (Loss) | Paid In Capital | |||||||||
Multimanager Aggressive Equity | $ | (156,994 | ) | $ | (159,329,572 | ) | $ | 159,486,566 | ||||
Multimanager Core Bond | 2,610,844 | (19,429,870 | ) | 16,819,026 | ||||||||
Multimanager International Equity | (140,666 | ) | (39,750,764 | ) | 39,891,430 | |||||||
Multimanager Large Cap Core Equity | (252,237 | ) | (34,660,026 | ) | 34,912,263 | |||||||
Multimanager Large Cap Value | (174,643 | ) | (101,820,516 | ) | 101,995,159 | |||||||
Multimanager Mid Cap Growth | 2,680,106 | (96,086,830 | ) | 93,406,724 | ||||||||
Multimanager Mid Cap Value | 546,773 | (73,703,758 | ) | 73,156,985 | ||||||||
Multimanager Technology | 821,775 | 45,605 | (867,380 | ) | ||||||||
The significant permanent book and tax differences related to the adjustments above are related to ordinary loss netting to reduce short-term capital gains (Multimanager Mid Cap Growth Portfolio) and redemptions in-kind (Multimanager Aggressive Equity Portfolio, Multimanager Core Bond Portfolio, Multimanager International Equity Portfolio, Multimanager Large Cap Core Equity Portfolio, Multimanager Large Cap Value Portfolio, Multimanager Mid Cap Growth Portfolio and Multimanager Mid Cap Value Portfolio).
Capital and net specified losses incurred after October 31 and within the taxable year are deemed to arise on the first business day of the Portfolio’s next taxable year. For the period from November 1, 2013 to December 31, 2013, the Portfolios elected to defer until the first business day of 2014 for U.S. Federal income tax purposes capital and net specified losses as stated below:
Portfolios: | Specified Loss | Short-Term Capital Loss | Long-Term Capital Loss |
| ||||||||||
Multimanager Aggressive Equity | $ | — | $ | — | $ | — | ||||||||
Multimanager Core Bond | — | — | 17,755,482 | |||||||||||
Multimanager International Equity | — | — | — | |||||||||||
Multimanager Large Cap Core Equity | — | — | — | |||||||||||
Multimanager Large Cap Value | 3,938 | — | — | |||||||||||
Multimanager Mid Cap Growth | — | — | — | |||||||||||
Multimanager Mid Cap Value | 4,479 | — | — | |||||||||||
Multimanager Technology | 138,243 | — | — | |||||||||||
Under the Regulated Investment Company Modernization Act of 2010 (the “RIC Mod Act”), net capital losses recognized by the Portfolios after December 31, 2010, may get carried forward indefinitely, and retain their character as short-term and/or long term. Prior to the RIC Mod Act, net
190
AXA PREMIER VIP TRUST
NOTES TO FINANCIAL STATEMENTS (Continued)
December 31, 2013
capital losses incurred by the Portfolios were carried forward for up to eight years and treated as 100% short-term. The RIC Mod Act requires that post-enactment net capital losses be used before pre-enactment net capital losses, therefore some net capital loss carryforwards that would have been utilized under prior law may expire unused. Pre-enactment and post-enactment net capital losses that will be carried forward, if any, are presented in the Portfolios of Investments.
Fees Paid Indirectly:
For all Portfolios, the Board had approved the payment of certain Trust expenses using brokerage service arrangements. These payments are reflected in the Statements of Operations. Effective October 31, 2013, brokerage service arrangements were terminated for all Portfolios.
Sale-Buybacks:
The Multimanager Core Bond Portfolio entered into financing transactions referred to as `sale-buybacks’ during the year ended December 31, 2013. A sale-buyback transaction consists of a sale of a security by a Portfolio to a financial institution, the counterparty, with a simultaneous agreement to repurchase the same or substantially the same security at an agreed-upon price and date. The Portfolio is not entitled to receive principal and interest payments, if any, made on the security sold to the counterparty during the term of the agreement. The agreed-upon proceeds for securities to be repurchased by the Portfolio are reflected as a liability on the Portfolio’s Statement of Assets and Liabilities. The Portfolio will recognize net income represented by the price differential between the price received for the transferred security and the agreed-upon repurchase price. This is commonly referred to as the `price drop’. A price drop consists of (i) the foregone interest and inflationary income adjustments, if any, the Portfolio would have otherwise received had the security not been sold and (ii) the negotiated financing terms between the Portfolio and counterparty. Foregone interest and inflationary income adjustments, if any, are recorded as components of interest income on the Portfolio’s Statement of Operations. Interest payments based upon negotiated financing terms made by the Portfolio to counterparties are recorded as a component of interest expense on the Portfolio’s Statement of Operations. In periods of increased demand for the security, the Portfolio may receive a fee for use of the security by the counterparty, which may result in interest income to the Portfolio. The Portfolio will segregate assets determined to be liquid to cover its obligations under sale-buyback transactions. Multimanager Core Bond had open sale-buybacks at December 31, 2013.
Short Sales Against the Box:
Certain Portfolios may enter into a “short sale” of securities in circumstances where, at the time the short position is open, the Portfolio owns at least an equal amount of the securities sold short or owns preferred stocks or debt securities, convertible or exchangeable without payment of further consideration, into at least an equal number of securities sold short. This kind of short sale, which is referred to as one “against the box,” may be entered into by a Portfolio to, for example, lock in a sale price for a security the Portfolio does not wish to sell immediately. The Portfolio will designate the segregation, either on its records or with the Trust’s custodian, of the securities sold short or convertible or exchangeable preferred stocks or debt securities sold in connection with short sales against the box. Liabilities for securities sold short are reported at market value in the financial statements. Such liabilities are subject to off-balance sheet risk to the extent of any future increases in market value of the securities sold short. The ultimate liability for securities sold short could exceed the liabilities recorded in the Statement of Assets and Liabilities. The Portfolio bears the risk of potential inability of the broker to meet their obligation to perform.
Accounting for Derivative Instruments:
Following is a description of how and why the Portfolios use derivative instruments, the type of derivatives utilized by the Portfolios during the reporting period, as well as the primary underlying risk exposures related to each instrument type. Derivatives accounted for as hedging instruments must be disclosed separately from those that do not qualify for hedge accounting. Even though the Portfolios may use derivatives in an attempt to achieve an economic hedge, a Portfolio’s derivatives are not accounted for as hedging instruments because the Portfolios account for their derivatives at
191
AXA PREMIER VIP TRUST
NOTES TO FINANCIAL STATEMENTS (Continued)
December 31, 2013
fair value and record any changes in fair value in current period earnings. All open derivative positions at period end are reflected on each respective Portfolio’s Portfolio of Investments. The volume of derivative activity, based on month-end notional amounts during the period is also noted in each respective Portfolio’s Portfolio of Investments.
Futures Contracts, Options on Futures Contracts, Forward Commitments and Foreign Currency Exchange Contracts:
The futures contracts used by the Portfolios are agreements to buy or sell a financial instrument for a set price in the future. Options on futures contracts used by the Portfolios are rights to buy or sell a futures contract for a set price in the future. Certain Portfolios buy or sell futures contracts and options on futures contracts for the purpose of protecting their portfolio securities against future changes in interest rates and indices which might adversely affect the value of a Portfolio’s securities or the price of securities that it intends to purchase at a later date. Initial margin deposits are made upon entering into futures contracts and can be in cash, certain money market instruments, treasury securities or other liquid, high grade debt securities. During the period the futures contracts and options on futures contracts are open, changes in the market price of the contracts are recognized as unrealized gains or losses by “marking-to-market” at the end of each trading day. Variation margin payments on futures contracts and options on futures contracts are received or made, depending upon whether unrealized gains or losses are incurred. When the contract is closed, a Portfolio records a realized gain or loss equal to the difference between the proceeds from (or cost of) the closing transactions and the Portfolio’s basis in the contract. Should interest rates or indices move unexpectedly, the Portfolio may not achieve the anticipated benefits of the futures contracts and may incur a loss. The use of futures contracts transactions involves the risk of imperfect correlation in movements in the price of futures contracts, interest rates and the underlying hedged assets. Use of long futures contracts subjects the Portfolios to risk of loss in excess of the amounts shown on the Statement of Assets and Liabilities, up to the notional value of the futures contracts. Use of short futures contracts subjects the Portfolios to unlimited risk of loss. The Portfolios enter into futures contracts only on exchanges or boards of trade. The exchange or board of trade acts as the counterparty to each futures transaction; therefore, a Portfolio’s credit risk is limited to failure of the exchange or board of trade.
Each of the Multimanager Aggressive Equity Portfolio, Multimanager International Equity Portfolio, Multimanager Large Cap Core Equity Portfolio, Multimanager Large Cap Value Portfolio, Multimanager Mid Cap Growth Portfolio and Multimanager Mid Cap Value Portfolio used futures contracts during the year ended December 31, 2013 to equitize cash, or to increase or decrease the level of equity exposure during periods when market volatility differed from specific thresholds set for each Portfolio. At December 31, 2013, certain Portfolios had entered into exchange-traded long futures contracts. The market value of investments pledged and/or cash pledged to cover margin requirements can be found in the Portfolio of Investments and/or Statement of Assets and Liabilities for each Portfolio. Further information on the impact of these positions on the Portfolios’ financial statements can be found in the Statement of Operations and Portfolio of Investments for each Portfolio.
Certain Portfolios make contracts to purchase or sell securities for a fixed price at a future date beyond customary settlement time (“forward commitments”). Portfolios may designate the segregation, either on their records or with the Trust’s custodian, of cash or other liquid securities in an amount sufficient to meet the purchase price, or may enter into offsetting contracts for the forward sale of other securities they own. These commitments are reported at market value in the financial statements. Forward commitments may be considered securities in themselves and involve a risk of loss if the value of the security to be purchased declines or if the value of the security to be sold increases prior to the settlement date, which is a risk in addition to the risk of decline in value of a Portfolio’s other assets. Where such purchases or sales are made through dealers, a Portfolio relies on the dealer to consummate the sale. The dealer’s failure to do so may result in the loss to a Portfolio of an advantageous yield or price. Market risk exists on these commitments to the same extent as if the securities were owned on a settled basis and gains and losses are recorded and reported in the same manner. However, during the commitment period, these investments earn no interest or dividends. The use of forward commitments may result in market risk to the Portfolios that is greater than if the Portfolios had engaged solely in transactions that settle in the customary time.
192
AXA PREMIER VIP TRUST
NOTES TO FINANCIAL STATEMENTS (Continued)
December 31, 2013
The Portfolios may be exposed to foreign currency risks associated with portfolio investments. During the reporting period, the Portfolios entered into certain forward foreign currency exchange contracts for the purchase or sale of a specific foreign currency at a fixed price on a future date to hedge or otherwise manage these exposures. Unrealized gains or losses on forward foreign currency exchange contracts are recorded by the Portfolios on a daily basis and realized gains or losses are recorded on the settlement date of a contract.
Certain Portfolios purchase foreign currency on a spot (or cash) basis. In addition, certain Portfolios enter into contracts to purchase or sell foreign currencies at a future date (“forward contracts”). A forward foreign currency exchange contract is a commitment to purchase or sell a foreign currency at a future date at a negotiated forward rate. Daily fluctuations in the value of such contracts are recognized as unrealized appreciation or depreciation by “marking to market.” The gain or loss arising from the difference between the original contracts and the closing of such contracts is included in realized gains or losses from foreign currency transactions in the Statement of Operations. The Advisers may engage in these forward contracts to protect against uncertainty in the level of future exchange rates in connection with the purchase and sale of portfolio securities (“transaction hedging”) and to protect the value of specific portfolio positions (“position hedging”). The Portfolios also buy forward foreign currency exchange contracts to gain exposure to currencies. The Portfolios are subject to off-balance sheet risk to the extent of the value of the contracts for purchase of foreign currency and in an unlimited amount for sales of foreign currency.
Options Written:
Certain Portfolios write (sell) covered options as a hedge to provide protection against adverse movements in the price of securities in the Portfolio or to enhance investment performance. Certain Portfolios purchase and sell exchange traded options on foreign currencies. When a Portfolio writes an option, an amount equal to the premium received by the Portfolio is recorded as a liability and is subsequently adjusted on a daily basis to the current market price of the option written. Premiums received from writing options which expire unexercised are recognized as gains on the expiration date. Premiums received from writing options which are exercised or are cancelled in closing purchase transactions are offset against the cost of any securities purchased or added to the proceeds or netted against the amount paid on the transaction to determine the realized gain or loss. In writing options, a Portfolio must assume that the option may be exercised at any time prior to the expiration of its obligation as a writer, and that in such circumstances the net proceeds of the sale or cost of purchase of the underlying securities and currencies pursuant to the call or put option may be substantially below or above the prevailing market price. By writing a covered call option, a Portfolio, in exchange for the premium, foregoes the opportunity for capital appreciation above the exercise price should the market price of the underlying security increase. A Portfolio also has the additional risk of not being able to enter into a closing purchase transaction if a liquid secondary market does not exist and bears the risk of unfavorable changes in the price of the financial instruments underlying the options. The Portfolios, however, are not subject to credit risk on written options as the counterparty has already performed its obligation by paying the premium at the inception of the contract.
Market and Credit Risk:
Written options, futures contracts, forward commitments and forward foreign currency exchange contracts involve elements of both market and credit risk in excess of the amounts reflected in the Statements of Assets and Liabilities. The risk involved in writing an option on a security is that, if the option is exercised, the underlying security is then purchased or sold by the Portfolio at the contract price, which could be disadvantageous relative to the market price. The Portfolio bears the market risk, which arises from any changes in security values. The credit risk for futures contracts and exchange traded options is limited to failure of the exchange or board of trade which acts as the counterparty to the Portfolio’s futures transactions. Forward commitments, forward foreign currency exchange contracts and over-the-counter options are executed directly with the counterparty and not through an exchange and can be terminated only by agreement of both parties to such contracts. With respect to such transactions there is no daily margin settlement and the Portfolio is exposed to the risk of default by the counterparty.
193
AXA PREMIER VIP TRUST
NOTES TO FINANCIAL STATEMENTS (Continued)
December 31, 2013
Offsetting Assets and Liabilities:
During the fiscal year, the Portfolios adopted Accounting Standards Update (“ASU”) No. 2011-11: Disclosures about Offsetting Assets and Liabilities (“netting”) on the Statements of Assets and Liabilities that are subject to master netting arrangements or similar agreements. ASU 2011-11 was amended by ASU No. 2013-01, clarifying which investments and transactions are subject to the netting disclosure. The scope of the disclosure requirements is limited to derivative instruments, repurchase agreements and reverse repurchase agreements, and securities borrowing and securities lending transactions. This information will enable users of the Portfolios’ financial statements to evaluate the effect or potential effect of netting arrangements on the Portfolios’ financial position.
For financial reporting purposes, the Portfolios do not offset financial assets and financial liabilities that are subject to master netting arrangements or similar agreements on the Statement of Assets and Liabilities.
| Note 2 | Management of the Trust |
The Trust has entered into two separate investment management agreements (the “Management Agreements”) with FMG LLC. The Management Agreement for the Portfolios obligates the Manager to, among other things: (i) provide investment management services to the Trust; (ii) search for and select the Advisers for each Portfolio; (iii) monitor each Adviser’s investment programs and results; (iv) review brokerage matters; (v) oversee each Portfolio’s compliance with investment objectives and policies as well as the Trust’s compliance with various federal and state statutes; and (vi) carry out the directives of the Board. For the year ended December 31, 2013, for its services under the Management Agreements, the Manager was entitled to receive an annual fee as a percentage of average daily net assets, for each of the following Portfolios, calculated daily and payable monthly as follows:
| (as a percentage of average daily net assets) | ||||||||||||||||||||
Portfolios: | First $750 Million | Next $1 Billion | Next $3 Billion | Next $5 Billion | Thereafter | |||||||||||||||
Multimanager Aggressive Equity | 0.600 | % | 0.550 | % | 0.525 | % | 0.500 | % | 0.475 | % | ||||||||||
Multimanager International Equity | 0.850 | % | 0.800 | % | 0.775 | % | 0.750 | % | 0.725 | % | ||||||||||
Multimanager Large Cap Core Equity | 0.700 | % | 0.650 | % | 0.625 | % | 0.600 | % | 0.575 | % | ||||||||||
Multimanager Large Cap Value | 0.750 | % | 0.700 | % | 0.675 | % | 0.650 | % | 0.625 | % | ||||||||||
Multimanager Mid Cap Growth | 0.800 | % | 0.750 | % | 0.725 | % | 0.700 | % | 0.675 | % | ||||||||||
Multimanager Mid Cap Value | 0.800 | % | 0.750 | % | 0.725 | % | 0.700 | % | 0.675 | % | ||||||||||
Multimanager Technology | 0.950 | % | 0.900 | % | 0.875 | % | 0.850 | % | 0.825 | % | ||||||||||
| (as a percentage of average daily net assets) | ||||||||||||||||||||
Portfolio: | First $1.25 Billion | Next $1 Billion | Next $1 Billion | Next $2.5 Billion | Thereafter | |||||||||||||||
Multimanager Core Bond | 0.550 | % | 0.525 | % | 0.500 | % | 0.475 | % | 0.450 | % | ||||||||||
On behalf of the Trust, the Manager has entered into investment advisory agreements (“Advisory Agreements”) with each of the Advisers for the Trust’s Portfolios. Each of the Advisory Agreements obligates the Advisers for the respective Portfolios to: (i) continuously furnish investment programs for the Portfolios; (ii) place all orders for the purchase and sale of investments for the Portfolios with brokers or dealers selected by the Manager or the respective Advisers; and (iii) perform certain limited related administrative functions in connection therewith. The Manager pays the expenses of providing investment advisory services to the Portfolios, including the fees of the Advisers of each Portfolio.
194
AXA PREMIER VIP TRUST
NOTES TO FINANCIAL STATEMENTS (Continued)
December 31, 2013
| Note 3 | Administrative Fees |
Pursuant to an administrative agreement (“Mutual Funds Service Agreement”), the Administrator provides the Trust with necessary administrative, fund accounting, and compliance services. In addition, the Administrator makes available the office space, equipment, personnel and facilities required to provide such administrative services to the Trust. FMG LLC may carry out its responsibilities either directly or through sub-contracting with third party providers. For these services, the Trust pays to FMG LLC, as Administrator, an annual fee in accordance with the following schedule:
(i) $32,500 for each Portfolio whose total average annual net assets are less than $5 billion; plus
(ii) With respect to all Portfolios (“Multimanager Portfolios”) (including Multimanager Portfolios of the Trust not presented in these financial statements) the following annual fee is payable monthly:
0.150% of total average net assets of the Multimanager Portfolios up to and including $15 billion;
0.125% of total average net assets of the Multimanager Portfolios in excess of $15 billion and up to and including $30 billion;
0.100% of total average net assets of the Multimanager Portfolios in excess of $30 billion.
Pursuant to a sub-administration agreement with FMG LLC, the Sub-Administrator provides the Trust with administrative services, including monitoring of portfolio compliance and portfolio accounting services.
| Note 4 | Custody Fees |
JPMorgan Chase, an affiliate of J.P. Morgan Investor Services Co., serves as custodian of the Trust’s portfolio securities and other assets pursuant to a Custody Agreement. The Custody Agreement provides for an annual fee based on the amount of assets under custody plus transaction charges. Under the terms of the Custody Agreement between the Trust and JPMorgan Chase, JPMorgan Chase maintains and deposits in each Portfolio’s account, cash, securities and other assets of the Portfolios. JPMorgan Chase is also required, upon the order of the Trust, to deliver securities held by JPMorgan Chase, and to make payments for securities purchased by the Trust. JPMorgan Chase has also entered into sub-custodian agreements with a number of foreign banks and clearing agencies, pursuant to which portfolio securities purchased outside the U.S. are maintained in the custody of these entities.
| Note 5 | Concentration of Credit Risk |
At December 31, 2013, certain Portfolios maintained significant cash balances or significant foreign currency balances with JPMorgan Chase or its affiliates. The Portfolios are subject to credit risk should JPMorgan Chase or its affiliates be unable to fulfill their obligations. Additionally, at December 31, 2013, certain Portfolios held significant collateral balances with Goldman Sachs. The Portfolios are subject to credit risk should JPMorgan Chase or its affiliates or Goldman Sachs be unable to fulfill their obligations.
| Note 6 | Distribution Plans |
The Trust has entered into distribution agreements with AXA Distributors, LLC (“AXA Distributors”), an indirect wholly-owned subsidiary of AXA Equitable (the “Distributor”) and an affiliate of FMG LLC, pursuant to which the Distributor serves as the principal underwriter of the Class A, Class B and Class K shares of the Trust. The Trust has adopted in the manner prescribed under Rule 12b-1 under the 1940 Act a plan of distribution pertaining to each of the Class A and Class B shares of the Trust (“Distribution Plans”). The Distribution Plans provide that the
195
AXA PREMIER VIP TRUST
NOTES TO FINANCIAL STATEMENTS (Continued)
December 31, 2013
Distributor will be entitled to receive a maximum distribution fee at the annual rate of 0.25% of the average daily net assets attributable to each of the Trust’s Class A and Class B shares for which it provides service.
| Note 7 | Expense Limitation |
The Manager has contractually agreed to make payments or waive its fees to limit the expenses of certain Portfolios (exclusive of taxes, interest, brokerage commissions, capitalized expenses, fees and expenses of other investment companies in which a Portfolio invests, and extraordinary expenses) through April 30, 2014 (“Expense Limitation Agreement”). The Manager first waives its management fees, then waives its administration fees, and then reimburses a Portfolio’s expenses out of its own resources. FMG LLC may be reimbursed the amount of any such payments and waivers in the future provided that the payments and waivers are reimbursed within three years of the payment or waiver being made and the combination of the Portfolio’s expense ratio and such reimbursements do not exceed the Portfolio’s expense ratio cap. If the actual expense ratio is less than the expense cap and FMG LLC has recouped any eligible previous payments and waivers made, the Portfolio will be charged such lower expenses. The expenses as a percentage of daily average net assets (Class A and Class B shares would be 0.25% higher due to the annual fee under the Trust’s Distribution Plans) for Class K shares of each Portfolio are limited to:
Portfolios: | ||||
Multimanager Aggressive Equity | 0.80 | % | ||
Multimanager Core Bond | 0.75 | % | ||
Multimanager International Equity | 1.05 | % | ||
Multimanager Large Cap Core Equity | 0.90 | % | ||
Multimanager Large Cap Value | 0.90 | % | ||
Multimanager Mid Cap Growth | 1.00 | % | ||
Multimanager Mid Cap Value | 1.00 | % | ||
Multimanager Technology | 1.15 | % | ||
During the year ended December 31, 2013, the Manager received $1,718,197 in recoupment for all of the Portfolios within the Trust. Recoupments in excess of waivers during the period would be presented as Recoupment Fees in the Statement of Operations. At December 31, 2013, under the Expense Limitation Agreement, the amount that would be recoverable from each Portfolio is as follows:
Portfolios: | 2014 | 2015 | 2016 | Total Eligible For Reimbursement | ||||||||||||
Multimanager International Equity | $ | — | $ | — | $ | 332,730 | $ | 332,730 | ||||||||
Multimanager Large Cap Core Equity | — | — | 12,273 | 12,273 | ||||||||||||
Multimanager Large Cap Value | — | — | 243,290 | 243,290 | ||||||||||||
Multimanager Mid Cap Growth | — | — | 118,291 | 118,291 | ||||||||||||
Multimanager Mid Cap Value | — | — | 111,628 | 111,628 | ||||||||||||
Multimanager Technology | — | — | 8 | 8 | ||||||||||||
Prior to May 1, 2013, the following Portfolios currently subject to an expense limitation were not subject to an expense limitation: Multimanager Aggressive Equity, Multimanager International Equity, Multimanager Large Cap Core Equity, Multimanager Large Cap Value, Multimanager Mid Cap Growth, Multimanager Mid Cap Value and Multimanager Technology.
196
AXA PREMIER VIP TRUST
NOTES TO FINANCIAL STATEMENTS (Continued)
December 31, 2013
Prior to May 1, 2013, the Manager voluntarily waived Investment Management fees for certain Portfolios. These amounts are as follows and are not eligible for recoupment:
Portfolios: | Voluntary Waivers | |
Multimanager International Equity | $41,715 | |
Multimanager Large Cap Value | 61,790 | |
Multimanager Mid Cap Growth | 18,602 | |
Multimanager Mid Cap Value | 1,014 |
| Note 8 | Trustees Deferred Compensation Plan |
A deferred compensation plan (the “Plan”) for the benefit of the Independent Trustees has been adopted by the Trust. Under the Plan, each Trustee may defer payment of all or part of the fees payable for such Trustee’s services. Each Trustee may defer payment of such fees until their retirement as a Trustee or until the earlier attainment of a specified age. Fees deferred under the Plan, together with accrued earnings thereon, will be disbursed to a participating Trustee in monthly installments over a five- to twenty-year period elected by such Trustee. At December 31, 2013, the total amount deferred by the Trustees participating in the Plan was $767,657.
| Note 9 | Percentage of Ownership by Affiliates |
Shares of some of the Portfolios may be held by the All Asset Moderate Growth-Alt 15 Portfolio, All Asset Growth-Alt 20 Portfolio, All Asset Aggressive-Alt 25 Portfolio, All Asset Aggressive-Alt 50 Portfolio and All Asset Aggressive-Alt-75 Portfolio (collectively the “All Asset Portfolios”) of the EQ Advisors Trust, also managed by FMG LLC, and the AXA Conservative Allocation Portfolio, AXA Conservative-Plus Allocation Portfolio, AXA Moderate Allocation Portfolio, AXA Moderate-Plus Allocation and AXA Aggressive Allocation Portfolio (“AXA Allocation Portfolios”), the CharterSM Fixed Income Portfolio, CharterSM Conservative Portfolio, CharterSM Moderate Portfolio, CharterSM Moderate Growth Portfolio, CharterSM Growth Portfolio, CharterSM Aggressive Growth Portfolio, CharterSM Equity Portfolio and CharterSM Income Strategies Portfolio (“Charter Allocation Portfolios”) and the Target 2015 Allocation Portfolio, Target 2025 Allocation Portfolio, Target 2035 Allocation Portfolio and Target 2045 Allocation Portfolio (“Target Allocation Portfolios”), none of which are presented in these financial statements. The following tables represent the percentage of ownership that the All Asset Portfolios, and each AXA Allocation Portfolio, Charter Allocation Portfolio and Target Allocation Portfolio has in each respective underlying investment company’s net assets as of December 31, 2013.
| All Asset Moderate Growth-Alt 15 | All Asset Growth-Alt 20 | All Asset Aggressive-Alt 25 | ||||||||||
Multimanager Core Bond Portfolio | 0.03 | % | 1.10 | % | — | %# | ||||||
| # | Less than 0.005%. |
| AXA Conservative Allocation | AXA Conservative- Plus Allocation | AXA Moderate Allocation | AXA Moderate- Plus Allocation | AXA Aggressive Allocation | ||||||||||||||||
Multimanager Core Bond Portfolio | 6.72 | % | 5.08 | % | 22.32 | % | 15.56 | % | 1.37 | % | ||||||||||
Multimanager International Equity Portfolio | 0.92 | 2.00 | 19.93 | 32.53 | 10.59 | |||||||||||||||
Multimanager Large Cap Core Equity Portfolio | 3.68 | 4.17 | 19.79 | 47.61 | 19.88 | |||||||||||||||
Multimanager Large Cap Value Portfolio | 0.32 | 0.81 | 14.98 | 38.76 | 24.67 | |||||||||||||||
Multimanager Mid Cap Growth Portfolio | 1.36 | 1.88 | 7.47 | 7.64 | 4.93 | |||||||||||||||
Multimanager Mid Cap Value Portfolio | 0.76 | 4.48 | 20.65 | 7.37 | 3.39 | |||||||||||||||
197
AXA PREMIER VIP TRUST
NOTES TO FINANCIAL STATEMENTS (Continued)
December 31, 2013
| CharterSM Fixed Income | CharterSM Conservative | CharterSM Moderate | CharterSM Moderate Growth | CharterSM Growth | CharterSM Aggressive Growth | CharterSM Equity | CharterSM Income Strategies | |||||||||||||||||||||||||
Multimanager Core Bond Portfolio | 0.05 | % | 0.06 | % | 0.03 | % | 0.02 | % | 0.02 | % | 0.01 | % | — | % | 0.05 | % | ||||||||||||||||
Multimanager Mid Cap Value Portfolio | — | 0.03 | 0.05 | 0.06 | 0.10 | 0.09 | 0.13 | — | ||||||||||||||||||||||||
| Target 2015 Allocation | Target 2025 Allocation | Target 2035 Allocation | Target 2045 Allocation | |||||||||||||
Multimanager Aggressive Equity Portfolio | 0.21 | % | 0.35 | % | 0.12 | % | 0.04 | % | ||||||||
Multimanager Large Cap Value Portfolio | 0.24 | 0.24 | 0.11 | 0.10 | ||||||||||||
Multimanager Mid Cap Growth Portfolio | 0.92 | 0.61 | 0.43 | 0.26 | ||||||||||||
Multimanager Mid Cap Value Portfolio | 1.01 | 1.71 | 0.72 | 0.55 | ||||||||||||
| Note 10 | Substitution, Reorganization and In-Kind Transactions |
At a meeting held on March 14, 2013, the Board approved a redemption in-kind transfer from Multimanager International Equity Portfolio (“IE”) to the EQ/International Core PLUS Portfolio (“ICP”), a portfolio of EQ Advisors Trust. On June 24, 2013, shareholders of IE redeemed shares through an in-kind redemption of securities and currency and contributed the securities and currency to ICP. Valuation of these securities at the time of the redemption and subscription in-kind was in accordance with the Portfolios’ valuation policy. For GAAP purposes, the transaction was treated as a sale and the resulting gain of $43,213,095 was recognized based on the value of the securities and currency of $336,328,768 on the date of the redemption in-kind. The realized gain is recorded in Net Realized Gain on Securities on the redeeming Portfolio’s Statement of Operations. For tax purposes, the gain is not recognized by the redeeming Portfolio. Additionally, the value of securities redeemed in-kind and contributed in-kind is excluded from the respective Portfolio’s portfolio turnover calculation and excluded from cost of purchases and net proceeds of sales and redemptions.
At a meeting held on March 14, 2013, the Board approved a redemption in-kind transfer from Multimanager Large Cap Core Equity Portfolio (“LCCE”) to the EQ/Large Cap Core PLUS Portfolio (“LCCP”), a portfolio of EQ Advisors Trust. On June 24, 2013, shareholders of LCCE redeemed shares through an in-kind redemption of securities and currency and contributed the securities and currency to LCCP. Valuation of these securities at the time of the redemption and subscription in-kind was in accordance with the Portfolios’ valuation policy. For GAAP purposes, the transaction was treated as a sale and the resulting gain of $35,136,462 was recognized based on the value of the securities and currency of $134,096,701 on the date of the redemption in-kind. The realized gain is recorded in Net Realized Gain on Securities on the redeeming Portfolio’s Statement of Operations. For tax purposes, the gain is not recognized by the redeeming Portfolio. Additionally, the value of securities redeemed in-kind and contributed in-kind is excluded from the respective Portfolio’s portfolio turnover calculation and excluded from cost of purchases and net proceeds of sales and redemptions.
At a meeting held on March 14, 2013, the Board approved a redemption in-kind transfer from Multimanager Aggressive Equity Portfolio (“AE”) to the EQ/Large Cap Growth PLUS Portfolio (“LCGP”), a portfolio of EQ Advisors Trust. On July 15, 2013, shareholders of AE redeemed shares through an in-kind redemption of securities and currency and contributed the securities and currency to LCGP. Valuation of these securities at the time of the redemption and subscription in-kind was in accordance with the Portfolios’ valuation policy. For GAAP purposes, the transaction was treated as a sale and the resulting gain of $162,708,424 was recognized based on the value of the securities and currency of $544,434,083 on the date of the redemption in-kind. The realized gain is recorded in Net Realized Gain on Securities on the redeeming Portfolio’s Statement of Operations. For tax purposes, the gain is not recognized by the redeeming Portfolio. Additionally, the value of securities redeemed in-kind
198
AXA PREMIER VIP TRUST
NOTES TO FINANCIAL STATEMENTS (Continued)
December 31, 2013
and contributed in-kind is excluded from the respective Portfolio’s portfolio turnover calculation and excluded from cost of purchases and net proceeds of sales and redemptions.
At a meeting held on March 14, 2013, the Board approved a redemption in-kind transfer from Multimanager Mid Cap Growth Portfolio (“MCG”) to the AXA Tactical Manager 400 Portfolio (“TM400”), a portfolio of EQ Advisors Trust. On July 22, 2013, shareholders of MCG redeemed shares through an in-kind redemption of securities and currency and contributed the securities and currency to TM400. Valuation of these securities at the time of the redemption and subscription in-kind was in accordance with the Portfolios’ valuation policy. For GAAP purposes, the transaction was treated as a sale and the resulting gain of $95,778,820 was recognized based on the value of the securities and currency of $373,484,063 on the date of the redemption in-kind. The realized gain is recorded in Net Realized Gain on Securities on the redeeming Portfolio’s Statement of Operations. For tax purposes, the gain is not recognized by the redeeming Portfolio. Additionally, the value of securities redeemed in-kind and contributed in-kind is excluded from the respective Portfolio’s portfolio turnover calculation and excluded from cost of purchases and net proceeds of sales and redemptions.
At a meeting held on March 14, 2013, the Board approved a redemption in-kind transfer from Multimanager Mid Cap Value Portfolio (“MCV”) to the EQ/Mid Cap Value PLUS Portfolio (“MCVP”), a portfolio of EQ Advisors Trust. On July 22, 2013, shareholders of MCV redeemed shares through an in-kind redemption of securities and currency and contributed the securities and currency to MCVP. Valuation of these securities at the time of the redemption and subscription in-kind was in accordance with the Portfolios’ valuation policy. For GAAP purposes, the transaction was treated as a sale and the resulting gain of $75,250,186 was recognized based on the value of the securities and currency of $403,124,532 on the date of the redemption in-kind. The realized gain is recorded in Net Realized Gain on Securities on the redeeming Portfolio’s Statement of Operations. For tax purposes, the gain is not recognized by the redeeming Portfolio. Additionally, the value of securities redeemed in-kind and contributed in-kind is excluded from the respective Portfolio’s portfolio turnover calculation and excluded from cost of purchases and net proceeds of sales and redemptions.
At a meeting held on March 14, 2013, the Board approved a redemption in-kind transfer from Multimanager Core Bond Portfolio (“CB”) to the EQ/Quality Bond PLUS Portfolio (“QBP”), a portfolio of EQ Advisors Trust. On July 22, 2013, shareholders of CB redeemed shares through an in-kind redemption of securities and currency and contributed the securities and currency to QBP. Valuation of these securities at the time of the redemption and subscription in-kind was in accordance with the Portfolios’ valuation policy. For GAAP purposes, the transaction was treated as a sale and the resulting gain of $17,675,873 was recognized based on the value of the securities and currency of $1,233,559,078 on the date of the redemption in-kind. The realized gain is recorded in Net Realized Gain on Securities on the redeeming Portfolio’s Statement of Operations. For tax purposes, the gain is not recognized by the redeeming Portfolio. Additionally, the value of securities redeemed in-kind and contributed in-kind is excluded from the respective Portfolio’s portfolio turnover calculation and excluded from cost of purchases and net proceeds of sales and redemptions.
At a meeting held on March 14, 2013, the Board approved a redemption in-kind transfer from Multimanager Large Cap Value Portfolio (“LCV”) to the EQ/Large Cap Value PLUS Portfolio (“LCVP”), a portfolio of EQ Advisors Trust. On July 29, 2013, shareholders of LCV redeemed shares through an in-kind redemption of securities and currency and contributed the securities and currency to LCVP. Valuation of these securities at the time of the redemption and subscription in-kind was in accordance with the Portfolios’ valuation policy. For GAAP purposes, the transaction was treated as a sale and the resulting gain of $107,364,869 was recognized based on the value of the securities and currency of $364,189,770 on the date of the redemption in-kind. The realized gain is recorded in Net Realized Gain on Securities on the redeeming Portfolio’s Statement of Operations. For tax purposes, the gain is not recognized by the redeeming Portfolio. Additionally, the value of securities redeemed in-kind and contributed in-kind is excluded from the respective Portfolio’s portfolio turnover calculation and excluded from cost of purchases and net proceeds of sales and redemptions.
199
AXA PREMIER VIP TRUST
NOTES TO FINANCIAL STATEMENTS (Continued)
December 31, 2013
| Note 11 | Subsequent Events |
The Manager evaluated subsequent events from December 31, 2013, the date of these financial statements, through the date these financial statements were issued and available. The subsequent events include the following:
At a meeting held on December 4, 2013, the Board approved an Agreement and Plan of Reorganization and Termination to reorganize three Portfolios of the Trust into three corresponding existing portfolios of EQAT as follows:
| a. | Multimanager Large Cap Core Portfolio into EQ/Large Cap Core PLUS Portfolio; |
| b. | Multimanager Large Cap Value Portfolio into EQ/Large Cap Value PLUS Portfolio; and |
| c. | Multimanager International Equity Portfolio into EQ/International Core PLUS Portfolio. |
At a meeting held on December 4, 2013, the Board also approved an Agreement and Plan of Reorganization and Termination of five Portfolios of the Trust into five corresponding newly-created “shell” Portfolios of EQAT as follows:
| a. | Multimanager Aggressive Equity Portfolio; |
| b. | Multimanager Technology Portfolio |
| c. | Multimanager Core Bond Portfolio; |
| d. | Multimanager Mid Cap Growth Portfolio; and |
| e. | Multimanager Mid Cap Value Portfolio. |
Each of the reorganizations listed above require the approval of the shareholders of the applicable Trust Portfolio. Pending shareholder approval, it is anticipated that the reorganizations will occur on or before June 20, 2014.
At a meeting held on December 4, 2013, the Board also approved changes to the investment objectives of the Portfolios listed below in connection with a change to each such Portfolio’s principal investment strategies and risks. The investment objective changes are anticipated to take effect on or before April 30, 2014.
Current Name | Current Objective | Proposed Objective | ||
Multimanager Aggressive Equity Portfolio | Seeks to achieve long-term growth of capital with an emphasis on risk adjusted returns and managing volatility in the Portfolio | Seeks to achieve long-term growth of capital | ||
Multimanager Mid Cap Growth Portfolio | Seeks to achieve long-term growth of capital with an emphasis on risk adjusted returns and managing volatility in the Portfolio | Seeks to achieve long-term growth of capital | ||
Multimanager Mid Cap Value Portfolio | Seeks to achieve long-term growth of capital with an emphasis on risk adjusted returns and managing volatility in the Portfolio | Seeks to achieve long-term growth of capital |
200
AXA PREMIER VIP TRUST
NOTES TO FINANCIAL STATEMENTS (Continued)
December 31, 2013
| Note 12 | Pending Legal Proceedings |
In July 2011, a lawsuit was filed in the United States District Court of the District of New Jersey, entitled Mary Ann Sivolella v. AXA Equitable Life Insurance Company and AXA Equitable Funds Management Group, LLC (“Sivolella Litigation”). The lawsuit was filed derivatively on behalf of eight portfolios of EQ Advisors Trust, which is also managed by FMG LLC: EQ/Common Stock Index Portfolio; EQ/Equity Growth PLUS Portfolio; EQ/Equity 500 Index Portfolio; EQ/Large Cap Value PLUS Portfolio; EQ/Global Multi-Sector Equity Portfolio; EQ/Mid Cap Value PLUS Portfolio; EQ/Intermediate Government Bond Index Portfolio; and EQ/GAMCO Small Company Value Portfolio (the “Sivolella Portfolios”). The lawsuit seeks recovery under Section 36(b) of the 1940 Act, for alleged excessive fees paid to FMG LLC and AXA Equitable (the “Defendants”) for investment management services. The Plaintiff seeks recovery of the alleged overpayments, or alternatively, rescission of the contracts and restitution of all fees paid, interest, costs and fees. In October 2011, FMG LLC and AXA Equitable filed a motion to dismiss the complaint. In November 2011, plaintiff filed an amended complaint seeking the same relief, but adding new claims under (1) Section 26(f) of the 1940 Act alleging that the variable annuity contracts sold by the Defendants charged excessive management fees, and seeking restitution and rescission of those contracts under Section 47(b) of the 1940 Act; and (2) a claim for unjust enrichment. The Defendants filed a motion to dismiss the Amended Complaint in December 2011. In May 2012, the Plaintiff voluntarily dismissed the Section 26(f) claim seeking restitution and rescission under Section 47(b). In September 2012, the United States District Court for the District of New Jersey denied the motion to dismiss the Amended Complaint as it related to the Section 36(b) claim and granted the motion as it related to the unjust enrichment claim.
In January 2013, a second lawsuit was filed in the United States District Court of the District of New Jersey by a group of plaintiffs asserting substantially similar claims under Section 36(b) and seeking substantially similar damages as in the Sivolella Litigation. The lawsuit entitled Glenn D. Sanford, et al. v. AXA Equitable Funds Management Group, LLC (“Sanford Litigation”), was filed derivatively on behalf of the EQ/PIMCO Ultra Short Bond Portfolio, the EQ/T. Rowe Price Growth Stock Portfolio, the EQ/Global Bond PLUS Portfolio, and the EQ/Core Bond Index Portfolio, in addition to four of the Sivolella Portfolios. In light of the similarities of the allegations in the Sivolella and Sanford Litigations, the court consolidated the two lawsuits.
In April 2013, the Plaintiffs in the Sivolella and Sanford Litigations amended the complaints to add additional claims under Section 36(b) of the 1940 Act for recovery of alleged excessive fees paid to FMG LLC in its capacity as the Administrator of EQ Advisors Trust. The Plaintiffs seek recovery of the alleged overpayments, or alternatively, rescission of the contract and restitution of the excessive fees paid, interest, costs, and fees.
No portfolios within the Trust are a party to the Sivolella or Sanford Matters and any potential damages would be the responsibility of the defendants. Therefore, no liability for litigation relating to these matters has been accrued in the financial statements of the Portfolios.
On November 1, 2010, the Trust and EQ Advisors Trust, and several of their respective portfolios, were named as defendants and putative members of the proposed defendant class of shareholders in a lawsuit brought by The Official Committee of Unsecured Creditors of Tribune Company (the “Committee”) in the United States Bankruptcy Court for the District of Delaware regarding Tribune Company’s Chapter 11 bankruptcy proceeding (In re Tribune Company). The lawsuit relates to amounts paid to the Trust and EQ Advisors Trust, and several of their respective portfolios, as holders of publicly-traded shares of Tribune Company, which were components of certain broad-based securities market indices, for which there were public tender offers during 2007. The suit seeks return of the share price received by Tribune Company shareholders in the tender offers plus interest and attorneys’ fees and expenses.
On July 1, 2011, retiree participants in certain Tribune-defined compensation plans (the “Retirees”) initiated a lawsuit in the United States District Court for the Southern District of
201
AXA PREMIER VIP TRUST
NOTES TO FINANCIAL STATEMENTS (Continued)
December 31, 2013
New York against certain Tribune Company shareholders who sold their shares as part of the 2007 public tender offers (the “Retiree Suit”). This Retiree Suit also seeks return of the share price received by Tribune Company shareholders in connection with the tender offers plus interest and attorneys’ fees and expenses.
On August 24, 2011, the trustees of certain trusts that hold notes issued by Tribune Company (the “Noteholders”) initiated a separate lawsuit in the United States District Court for the Southern District of New York against certain Tribune Company shareholders who sold their shares as part of the 2007 public tender offers (the “Noteholder Suit”). This Noteholder Suit also seeks return of the share price received by Tribune Company shareholders in connection with the tender offers plus interest and attorneys’ fees and expenses.
The Committee’s suit, the Retiree Suit, and the Noteholder Suit have each been consolidated with a number of related lawsuits filed by the Noteholders and Retirees around the United States into a single multi-district litigation proceeding now pending in the United States District Court for the Southern District of New York (In re: Tribune Company Fraudulent Conveyance Litigation).
With respect to the Trust, the Multimanager Large Cap Core Equity Portfolio and the Multimanager Large Cap Value Portfolio are named as defendants in the Noteholder Suit and are also named, along with the Trust, as putative members of the proposed defendant class of shareholders in the Committee’s suit (and named separately in the Committee’s suit, in the event it is not certified as a class action). The amounts paid to the Multimanager Large Cap Core Equity Portfolio and the Multimanager Large Cap Value Portfolio in connection with the public tender offers were approximately $1,768,000 and $3,359,200, respectively.
The lawsuits do not allege any misconduct by the Trust, or its portfolios. In September 2013, the United States District Court for the Southern District of New York dismissed the Noteholder and Retiree Suits for lack of standing. An appeal to this decision filed by the Noteholders and Retirees and a cross-appeal to this decision filed by the defendants are currently pending in the United States Court of Appeals for the Second Circuit. The portfolios cannot predict the outcome of these lawsuits. If the lawsuits were to be decided or settled in a manner adverse to the portfolios, the payment of such judgments or settlements could have an adverse effect on each portfolio’s net asset value. However, no liability for litigation relating to this matter has been accrued in the financial statements of the Portfolios as the Manager believes a loss is not probable.
202
Report of Independent Registered Public Accounting Firm
To the Board of Trustees and Shareholders of AXA Premier VIP Trust
In our opinion, the accompanying statements of assets and liabilities, including the portfolios of investments, and the related statements of operations and of changes in net assets and the financial highlights (hereafter referred to as “financial statements”) present fairly, in all material respects, the financial position of each of the portfolios of AXA Premier VIP Trust listed in the Table of Contents to the Annual Report in which these financial statements appear (collectively referred to as the “Trust”) at December 31, 2013, and the results of each of their operations, the changes in each of their net assets and the financial highlights for each of the periods presented, in conformity with accounting principles generally accepted in the United States of America. These financial statements and financial highlights are the responsibility of the Trust’s management. Our responsibility is to express an opinion on these financial statements based on our audits. We conducted our audits of these financial statements in accordance with the standards of the Public Company Accounting Oversight Board (United States). Those standards require that we plan and perform the audit to obtain reasonable assurance about whether the financial statements are free of material misstatement. An audit includes examining, on a test basis, evidence supporting the amounts and disclosures in the financial statements, assessing the accounting principles used and significant estimates made by management, and evaluating the overall financial statement presentation. We believe that our audits, which included confirmation of securities at December 31, 2013 by correspondence with the custodian, transfer agents and brokers, provide a reasonable basis for our opinion.
PricewaterhouseCoopers LLP
New York, New York
February 19, 2014
203
Federal Income Tax Information (Unaudited)
For the year ended December 31, 2013, the percentage of dividends paid that qualify for the 70% dividends received deductions for corporate shareholders, foreign taxes which are expected to be passed through to shareholders for foreign tax credits, gross income derived from sources within foreign countries, and long-term capital gain dividends for the purpose of the dividend paid deduction on its Federal income tax return were as follows:
| 70% Dividend Received Deduction | Foreign Taxes | Foreign Source Income | Long Term Capital Gain | |||||||||||||
Multimanager Aggressive Equity | 100.00 | % | $ | — | $ | — | $ | — | ||||||||
Multimanager Core Bond | 0.79 | — | — | 529,281 | ||||||||||||
Multimanager International Equity | 0.49 | 860,629 | 12,710,696 | — | ||||||||||||
Multimanager Large Cap Core Equity | 100.00 | — | — | — | ||||||||||||
Multimanager Large Cap Value | 100.00 | — | — | — | ||||||||||||
Multimanager Mid Cap Growth | 29.47 | — | — | 43,523,700 | ||||||||||||
Multimanager Mid Cap Value | 100.00 | — | — | — | ||||||||||||
Multimanager Technology | 0.00 | — | — | — | ||||||||||||
204
MANAGEMENT OF THE TRUST (UNAUDITED)
The Trust’s Board is responsible for the overall management of the Trust and the Portfolios, including general supervision and review of the Portfolios’ investment activities and their conformity with federal and state law as well as the stated policies of the Portfolios. The Board elects the officers of the Trust who are responsible for administering the Trust’s day-to-day operations. The Trustees of the Trust are identified in the table below along with information as to their principal business occupations held during the last five years and certain other information.
The Trustees
| Name, Address and Age | Position(s) Held With Fund | Term of Office** and Length of Time Served | Principal Occupation(s) During Past 5 Years | Number of Portfolios in Fund Complex Overseen by Trustee*** | Other Directorships Held by Trustee | |||||
| Interested Trustee | ||||||||||
Steven M. Joenk* 1290 Avenue of the Americas New York, New York 10104 (55) | Trustee, Chairman, President and Chief Executive Officer | Trustee and Chairman from September 2004 to present; Chief Executive Officer from December 2002 to present; President from November 2001 to present | From May 2011 to present, Director, President, Chief Executive Officer and Chairman, FMG LLC; from September 1999 to present, Managing Director, AXA Equitable; from September 2004 to April 2011, President, AXA Equitable’s FMG; from July 2004 to October 1, 2013, Senior Vice President, MONY Life Insurance Company; from July 2004 to present, Senior Vice President, MONY Life Insurance Company of America and Director, MONY Capital Management, Inc., Director and President, 1740 Advisers, Inc; Director, Chairman of the Board and President, MONY Asset Management, Inc. and Enterprise Capital Management (from July 2004 to January 2011); from January 2005 to January 2011, Director, MONY Financial Resources of Americas Limited; and from November 2005 to present, Director MONY International Holdings, LLC. | 113 | None | |||||
| Independent Trustees | ||||||||||
Gerald C. Crotty c/o AXA Premier VIP Trust 1290 Avenue of the Americas New York, New York 10104 (62) | Trustee | From November 2001 to present | Since 2001, President of Weichert Enterprise, LLC, a private equity investment firm. | 36 | From 2005 to present, director of The Jones Group, Inc.; from 2002 to 2011, director of Cinedigm Digital Cinema Corp. | |||||
205
| Name, Address and Age | Position(s) Held With Fund | Term of Office** and Length of Time Served | Principal Occupation(s) During Past 5 Years | Number of Portfolios in Fund Complex Overseen by Trustee*** | Other Directorships Held by Trustee | |||||
Barry Hamerling c/o AXA Premier VIP Trust 1290 Avenue of the Americas New York, New York 10104 (68) | Trustee | From November 2001 to present | Since 1998, Managing Partner of Premium Ice Cream of America; from 1970 to 1998, President of Ayco Co. L.P., the largest independent financial counseling firm in the United States. | 36 | From 2014 to present, Lead Independent Trustee of the Westchester Event Driven Fund; from 2007 to present, Independent Lead Director of The Merger Fund; from 1998 to 2013, Chairman of Ayco Charitable Foundation. | |||||
Thomas P. Lemke 1290 Avenue of the Americas New York, New York 10104 (59) | Trustee | From January 1, 2014 to present | From 2005 to 2013, Executive Vice President, General Counsel, and Head of the Governance Group of Legg Mason, Inc. | 36 | From January 2014 to present, Independent Trustee of the Munder Funds; from 2009 to 2013, member of Board of Directors, ICI Mutual Insurance Company | |||||
Cynthia R. Plouché c/o AXA Premier VIP Trust 1290 Avenue of the Americas New York, New York 10104 (57) | Lead Independent Trustee | Since March 2010; Trustee from November 2001 to March 2010 | From January 2014 to present, Assessor, Moraine Township (IL); from June 2006 to April 2012, Portfolio Manager at Williams Capital Management, Inc.; from June 2003 to 2006, Managing Director and Chief Investment Officer of Blaylock-Abacus Asset Management, Inc.; prior thereto, Founder, Chief Investment Officer and Managing Director of Abacus Financial Group from May 1991 to 2003, a manager of fixed income portfolios for institutional clients. | 36 | None | |||||
Rayman L. Solomon c/o AXA Premier VIP Trust 1290 Avenue of the Americas New York, New York 10104 (66) | Trustee | From November 2001 to present | From January 2014 to present, Provost of the Camden Campus of Rutgers University School of Law; since 1998, Dean and a Professor of Law at Rutgers University School of Law; prior thereto, an Associate Dean for Academic Affairs at Northwestern University School of Law. | 36 | None |
| * | Affiliated with the portfolios’ investment manager and the distributor. |
| ** | Each Trustee serves until his or her resignation or retirement. |
| *** | The registered investment companies in the fund complex include EQ Advisors Trust and the Trust. Mr. Joenk serves as Trustee, President and Chief Executive Officer for each of the registered investment companies in the fund complex, as well as Chairman for each such company. |
206
Qualifications and Experience
In addition to the information set forth in the table above, the following sets forth additional information about the qualifications and experience of each of the Trustees.
Steven M. Joenk — Mr. Joenk has a background in the financial services industry; senior management experience with multiple insurance companies, investment management firms and investment companies; multiple years of service as officer, Trustee and Chairman of the Trust and other registered investment companies.
Gerald C. Crotty — Mr. Crotty has a background in the financial services industry; business management experience, including chief executive and chief operating officer experience, with multiple years of service as a Trustee of the Trust and as a director of publicly-traded operating companies; multiple years of executive experience with a publicly-traded operating company and private equity investment firm; and legal and governmental experience.
Barry Hamerling — Mr. Hamerling has a background in the financial services industry; business management experience, including chief executive officer experience, with multiple years of service as a Trustee of the Trust and another registered investment company; and prior executive experience with a financial consulting firm.
Thomas P. Lemke — Mr. Lemke has a legal background and served as General Counsel in the financial services industry, experience in senior management positions with financial services firms in addition to multiple years of service with a regulatory agency.
Cynthia R. Plouché — Ms. Plouché has a background in the financial services industry; business management experience with multiple years of service as a Trustee of the Trust; and multiple years of executive experience as a chief investment officer and portfolio manager with investment management firms.
Rayman L. Solomon — Mr. Solomon has a legal and higher education background, including executive management experience as Provost and Dean of the Rutgers School of Law — Camden and Associate Dean of Northwestern University School of Law; and multiple years of service as a Trustee of the Trust.
207
The Trust’s Officers
No officer of the Trust receives any compensation paid by the Trust. Each officer of the Trust is an employee of AXA Equitable, FMG LLC, and/or AXA Distributors, LLC (“AXA Distributors”). The Trust’s principal officers are:
| Name, Address and Age | Position(s) Held With Fund* | Term of Office and Length of Time Served** | Principal Occupation(s) During Past 5 Years | |||
Steven M. Joenk 1290 Avenue of the Americas, New York, New York 10104 (55) | Trustee, Chairman, President and Chief Executive Officer | Trustee and Chairman from September 2004 to present; Chief Executive Officer from December 2002 to present; President from November 2001 to present | From May 2011 to present, Director, President, Chief Executive Officer and Chairman, FMG LLC; from September 1999 to present, Managing Director of AXA Equitable; from September 2004 to April 2011, President, AXA Equitable’s FMG; from July 2004 to October 1, 2013, Senior Vice President, MONY Life Insurance Company; from July 2004 to present, Senior Vice President MONY Life Insurance Company of America and Director, MONY Capital Management, Inc., Director and President, 1740 Advisers, Inc; Director, Chairman of the Board and President, MONY Asset Management, Inc. and Enterprise Capital Management (from July 2004 to January 2011); from January 2005 to January 2011, Director, MONY Financial Resources of Americas Limited; and from November 2005 to present, Director MONY International Holdings, LLC. | |||
Brian E. Walsh 525 Washington Boulevard Jersey City, New Jersey 07310 (46) | Chief Financial Officer and Treasurer | From June 2007 to present | From May 2011 to present, Senior Vice President of FMG LLC; from February 2003 to present, Lead Director of AXA Financial and AXA Equitable. | |||
Joseph J. Paolo 1290 Avenue of the Americas New York, New York 10104 (43) | Chief Compliance Officer, Vice President and Anti-Money Laundering (“AML”) Compliance Officer | Chief Compliance Officer from May 2007 to present; Vice President and AML Compliance Officer from December 2005 to present | From May 2011 to present, Senior Vice President and Chief Compliance Officer of FMG LLC; from June 2007 to present, Lead Director of AXA Equitable and Chief Compliance Officer of AXA Equitable’s FMG. | |||
Patricia Louie, Esq. 1290 Avenue of the Americas, New York, New York 10104 (58) | Vice President and Secretary | From November 2001 to present | From June 2012 to present, Executive Vice President and General Counsel of FMG LLC; from May 2011 to June 2012, Senior Vice President and Corporate Counsel of FMG LLC; from February 2011 to present Managing Director and Associate General Counsel of AXA Financial and AXA Equitable; from May 2003 to February 2011, Vice President and Associate General Counsel of AXA Financial and AXA Equitable. | |||
Alwi Chan 1290 Avenue of the Americas New York, New York 10104 (39) | Vice President | From June 2007 to present | From June 2012 to present, Senior Vice President and Deputy Chief Investment Officer of FMG LLC; from May 2011 to June 2012, Vice President of FMG LLC; from February 2007 to present, Lead Director of AXA Financial and AXA Equitable; | |||
Mary E. Cantwell 1290 Avenue of the Americas, New York, New York 10104 (52) | Vice President | From November 2001 to present | From June 2012 to present, Senior Vice President of FMG LLC; from May 2011 to June 2012, Vice President of FMG LLC; from February 2001 to present, Lead Director of AXA Equitable; from July 2004 to January 2011, a Director of Enterprise Capital Management, Inc. | |||
William T. MacGregor, Esq. 1290 Avenue of the Americas, New York, New York 10104 (38) | Vice President and Assistant Secretary | From May 2008 to present | From June 2012 to present, Senior Vice President, Secretary and Associate General Counsel of FMG LLC; from May 2011 to June 2012, Vice President and Associate Corporate Counsel of FMG LLC; from May 2008 to present, Lead Director and Counsel of AXA Equitable. |
208
| Name, Address and Age | Position(s) Held With Fund* | Term of Office and Length of Time Served** | Principal Occupation(s) During Past 5 Years | |||
Gariel Nahoum, Esq. 1290 Avenue of the Americas, New York, New York 10104 | Vice President and Assistant Secretary | From September 2011 to present | From June 2012 to present, Vice President, Assistant Secretary and Associate General Counsel of FMG LLC; from September 2011 to June 2012, Vice President and Assistant Secretary of FMG LLC; from August 2011 to present, Senior Director and Counsel of AXA Equitable; from September 2008 to August 2011, Associate, Kramer Levin Naftalis & Frankel LLP. | |||
Kenneth T. Kozlowski 1290 Avenue of the Americas New York, New York 10104 (52) | Vice President | From June 2010 to present | From June 2012 to present, Executive Vice President and Chief Investment Officer of FMG LLC; from May 2011 to June 2012, Senior Vice President of FMG LLC; from September 2011 to present, Managing Director of AXA Financial and AXA Equitable; from February 2001 to September 2011, Vice President, AXA Financial and AXA Equitable; from July 2004 to January 2011, Director, Enterprise Capital Management, Inc. | |||
Richard Guinnessey 1290 Avenue of the Americas New York, New York 10104 (50) | Vice President | From March 2010 to present | From June 2012 to present, Vice President of FMG LLC, from September 2010 to present, Senior Director of AXA Equitable; from November 2005 to September 2010 Assistant Vice President of AXA Equitable. | |||
James Kelly 525 Washington Boulevard Jersey City, New Jersey 07310 (45) | Controller | From June 2007 to present | From May 2011 to present, Vice President of FMG LLC; from September 2008 to present, Senior Director of AXA Equitable. | |||
Roselle Ibanga 525 Washington Boulevard Jersey City, New Jersey 07310 (35) | Assistant Controller | From February 2009 to present | From February 2009 to present, Director of AXA Equitable; from December 2008 to February 2009, Director of AXA Equitable’s FMG. | |||
Lisa Perrelli 525 Washington Boulevard Jersey City, New Jersey 07310 (39) | Assistant Controller | From February 2009 to present | From November 2012 to present, Senior Director of AXA Equitable; from September 2008 to November 2012, Assistant Vice President of AXA Equitable; from February 2008 to September 2008, Director of AXA Equitable’s FMG. | |||
Jennifer Mastronardi 1290 Avenue of the Americas, New York, New York 10104 (28) | Assistant Vice President | From March 2012 to present | From February 2009 to present, Director of AXA Equitable; from June 2007 to February 2009, Operations Associate in Managed Futures Department, Morgan Stanley. | |||
Judy Guhring 1290 Avenue of the Americas, New York, New York 10104 (42) | Assistant Secretary | From December 2005 to present | From June 2012 to present, Assistant Vice President and Assistant Secretary of FMG LLC; from May 2011 to June 2012, Assistant Secretary of FMG LLC; from August 2001 to present, Lead Manager/Senior Legal Assistant of AXA Equitable. |
| * | Each officer (except Ms. Guhring) holds a similar position with other funds within the Trust complex. |
| ** | Each officer is elected on an annual basis. |
209
PROXY VOTING POLICIES AND PROCEDURES (UNAUDITED)
A description of the policies and procedures that the Portfolios use to determine how to vote proxies relating to portfolio securities is available (i) without charge, upon request, by calling a toll-free number at 1-877-222-2144 and (ii) on the Securities and Exchange Commission’s website at http://www.sec.gov. Information regarding how the Portfolios voted proxies relating to portfolio securities during the most recent 12-month period ended June 30 is available without charge (i) on the Trust’s website at www.axa-equitablefunds.com and (ii) on the Securities and Exchange Commission’s website at http://www.sec.gov.
QUARTERLY PORTFOLIO HOLDINGS INFORMATION (UNAUDITED)
The Portfolios file their complete schedule of portfolio holdings with the Securities and Exchange Commission for the first and third quarters of each fiscal year on Form N-Q. The Portfolios’ Forms N-Q are available on the Securities and Exchange Commission’s website at http://www.sec.gov. You may also review and obtain copies at the Securities and Exchange Commission’s Public Reference Room in Washington, D.C. Information about the Public Reference Room may be obtained by calling 1-800-SEC-0330.
210
EQ Advisors Trust
Annual Report
December 31, 2013
EQ Advisors Trust Annual Report
December 31, 2013
| 4 | ||
Portfolios | ||
| 5 | ||
| 25 | ||
| 41 | ||
| 59 | ||
| 74 | ||
| 75 | ||
| 76 | ||
| 82 | ||
2013 Market Overview
Economy
The employment picture in the U.S. continued to brighten in 2013. Three of the final four months of the year showed non-farm payroll gains of more than 200,000, and the unemployment rate dropped to 7.0%, a rate last seen in 2008. Housing continued to show a meaningful recovery in most markets and the automobile sector showed its best year since 2007. Nonetheless, the economy showed some worrisome trends, namely the increasing dependence of retailers on major markdowns in order to move merchandise, and the fact that much of the upward revision to the fourth quarter’s GDP report was tied to inventory growth, rather than to legitimate consumer demand.
At its final meeting of 2013, the Federal Reserve decided to begin to reduce the $85 billion per month it had been buying in longer-term Treasury and mortgage securities. While this move was long expected, it was the first sign that the Fed itself felt confident enough in the strength of the economy to begin unwinding its unprecedented easing posture.
Fixed Income
In the first half of the year, Japan flooded the global financial markets with liquidity, which served to buoy all assets, including the very expensive risk-free rates in the beginning of the year. In the spring, interest rates rose sharply when markets reacted to the announcement that Fed might consider tapering its quantitative easing program in the fourth quarter. The uncertainty and resulting volatility also had an impact on credit markets, which witnessed spread widening across all sectors including corporate credit and structured products.
By mid-year, two events led to an uptick in risk sentiment within fixed-income markets. Larry Summers withdrew from the race for the Chairmanship of the Federal Reserve, and the Fed surprised markets by deciding to refrain from tapering its quantitative easing program due to a perceived tightening of financial conditions. However, volatility returned to the markets towards the end of September due to the U.S. government shut down and prolonged political wrangling over the debt ceiling issue.
At the end of the year, U.S. Treasury rates generally rose across the yield curve. In light of stronger U.S. economic data, consistent labor market improvement, and reduced political risk, the Fed announced that it would slow the pace of purchases beginning in January 2014 by $10bn per month, split evenly between agency mortgage-backed securities and Treasuries.
US Equity
In 2013, U.S. equities, as represented by the S&P 500 Index, posted an impressive gain of 32.4% for the year, as the world’s largest central banks continued stimulus measures and corporate profits benefited from slow-but-positive economic growth. Mid-cap U.S. equities, as represented by the S&P MidCap 400 Index, posted an impressive gain of 33.5% in 2013, as mid-cap company profits benefited from the growth environment. Small companies benefited even more, as the Russell 2000® Index of U.S. small-cap stocks gained 38.8% for the year.
The U.S. equity markets began 2013 with a powerful relief rally after the United States averted the worst of its potential fiscal crisis with a last-minute tax deal. Moving into spring, the ascent of equities persevered as increased global liquidity kept interest rates low and investors turned to riskier asset classes in search of yield. As the year progressed, the direction of stock markets became increasingly dominated by speculation around the future of monetary policy. Sluggish U.S. growth, ironically, was often conducive to positive stock market performance as weak economic data reinforced investors’ expectations that the U.S. Federal Reserve would maintain its accommodative stance. Additionally, the U.S. recovery was strong enough to support corporate revenues while nearly stagnant wage growth kept costs low.
The waning months of the year brought another sharp rally as the Fed defied market expectations with its September decision to delay tapering its asset purchases. Turmoil in Egypt and Syria subsided and the re-election of Angela Merkel as Chancellor of Germany was welcomed as a continuation of the status quo. As economic indicators improved later in the fall, investors grappled with rising uncertainty around the timing of the anticipated Fed taper, ultimately commencing in mid-December. Investors reacted positively to this policy move as it signaled the Fed’s perception of real improvement in U.S. growth. Sentiment was also buoyed by the extension of the Fed’s expected time horizon for maintaining low short-term interest rates.
International Equity
International equities, as represented by the MSCI EAFE Index, posted an impressive gain of 22.8% (in US dollar terms) for the 12-month period ended December 31, 2013 as the world’s largest central banks continued to shore up their economies with stimulus measures.
Building on a year of gains that followed roughly in step with the U.S. stock market, world equity markets closed the year on a strong note, fuelled by signs that the global economy continued to improve, but at a pace sufficiently modest to allow most major central banks to maintain accommodative policies. With conditions in the periphery having stabilized and Germany continuing to motor along, the Eurozone emerged from recession. However, the fragile recovery, combined with a lack of inflationary pressures, prompted a surprise rate cut by the
2
European Central Bank. The Bank of England kept interest rates and its asset purchase target unchanged despite the U.K. having racked up three straight quarters of gross domestic product (GDP) growth. Japan appears to be responding, at least partially, to policymakers’ attempts to reflate the economy. Economic growth has slowed in recent months, but remains positive. The Bank of Japan’s asset purchase program continued to put pressure on the yen, helping boost the profitability of export-oriented corporations even as year-over-year consumer price index readings rose to their highest levels since 2008.
In contrast to strength exhibited in developed markets, emerging market equities generally posted weak returns. In particular, countries with high deficits have been hurt by the U.S. Federal Reserve’s steps to begin to unwind its monetary stimulus and the potential for higher interest rates. For the 12-month period, the MSCI Emerging Markets GR Index sagged -2.3%
Source: AXA Equitable Funds Management Group, LLC. As of 12/31/2013.
This information is provided for general information only and is not intended to provide specific advice or recommendations for any individual investor. The S&P 500 Index is a widely recognized index that is considered representative of the performance of the large-cap sector of the U.S. stock market. The S&P MidCap 400 Index is a widely recognized index that is considered representative of the performance of the mid-cap sector of the U.S. stock market. The Russell 2000® Index measures the performance of the small-cap segment of the U.S. equity universe. The MSCI EAFE Index measures equity performance in foreign developed markets. The MSCI Emerging Markets Index measures equity performance in global emerging market countries.
PAST PERFORMANCE IS NO GUARANTEE OF FUTURE RESULTS. No investment is risk-free. International securities carry additional risks including currency exchange fluctuation and different government regulations, economic conditions or accounting standards. Smaller company stocks involve a greater risk than is customarily associated with more established companies. Bond investments are subject to interest rate risk so that when interest rates rise, the prices of bonds can decrease and the investor can lose principal value. High yield bonds are subject to a high degree of credit and market risk. Index performance is shown for illustrative purposes only. You cannot invest directly in an index.
AXA Equitable Life Insurance Company (New York, NY). Distributors: AXA Distributors, LLC.
AXA Equitable Funds Management Group, LLC is a wholly owned subsidiary of AXA Equitable Life Insurance Company.
AXA Equitable Life Insurance Company, AXA Advisors and AXA Distributors are affiliated companies.
GE 91457 (2/14) (Exp. 2/16)
3
NOTES ON PERFORMANCE (Unaudited)
Total Returns
Performance of the EQ Advisors Trust Portfolios as shown on the following pages compares each Portfolio’s performance to that of a broad-based securities index. Each of the Portfolio’s annualized rates of return is net of investment management fees and expenses of the Portfolio. Rates of return are not representative of the actual return you would receive under your variable life insurance policy or annuity contract. No policyholder or contractholder can invest directly in the EQ Advisors Trust Portfolios. Changes in policy values depend not only on the investment performance of the EQ Advisors Trust Portfolios, but also on the insurance and administrative charges, applicable sales charges, and the mortality and expense risk charge applicable under a policy. These policy charges effectively reduce the dollar amount of any net gains and increase the dollar amount of any net losses. Each of the EQ Advisors Trust Portfolios has a separate investment objective it seeks to achieve by following a separate investment policy. There is no guarantee that these objectives will be attained. The objectives and policies of each Portfolio will affect its return and its risk. Keep in mind that past performance is not an indication of future results.
Growth of $10,000 Investment
The charts shown on the following pages illustrate the total value of an assumed investment in Class IA, Class IB and/or Class K shares of each Portfolio of the EQ Advisors Trust. The periods illustrated are from the inception dates shown, or for a ten year period if the inception date is prior to December 31, 2003, through December 31, 2013. These results assume reinvestment of dividends and capital gains. The total value shown for each Portfolio reflects management fees and operating expenses of the Portfolios and 12b-1 fees which are applicable to Class IB shares. Effective January 1, 2012, 12b-1 fees are applicable to Class IA shares. 12b-1 fees are not applicable to Class K shares. The values have not been adjusted for insurance-related charges and expenses associated with life insurance policies or annuity contracts, which would lower the total values shown. Results should not be considered representative of future gains or losses.
The Benchmarks
Broad-based securities indices are unmanaged and are not subject to fees and expenses typically associated with actively-managed funds. An investment cannot be made directly in a broad-based securities index. Comparisons with these benchmarks, therefore, are of limited use. They are included because they are widely known and may help you to understand the universe of securities from which each Portfolio is likely to select its holdings.
DJ EuroSTOXX 50 Index (“EuroSTOXX 50”)
The EuroSTOXX 50 Index is designed to represent the performance of some of the largest companies across all components of the 18 EURO STOXX Supersector Indexes. The EURO STOXX TMI Supersector Indexes represent the Eurozone portion of the EURO STOXX Total Market Index. The index covers approximately 95% of the freefloat market capitalization of the investable universe in the Eurozone. Index composition is reviewed annually and weights are reviewed quarterly.
The 50 companies in the index are selected by first identifying the companies that equal approximately 60% of the free-float market capitalization of each corresponding EURO STOXX TMI Supersector Index. In addition, any stocks that are currently components of the index are added to the list. From that list, the 40 largest stocks are selected to be components of the index. In addition, any stocks that are current components of the Index (and ranked 41-60 on the list) are included as components.
FTSE 100 Index (“FTSE 100”)
The FTSE 100 Index is a market-capitalization weighted index representing the performance of the 100 largest UK-domiciled blue chip companies, which pass screening for size and liquidity. As of August 31, 2010, the FTSE 100 Index represents approximately 81% of the UK’s market capitalization.
Morgan Stanley Capital International (MSCI) EAFE Index
An unmanaged index considered representative of the market structure of the developed equity markets in Europe, Australia and the Far East.
Russell 1000® Value Index
An unmanaged index which contains those Russell 1000 securities (1,000 largest securities in the Russell 3000® Index) with a less-than average growth orientation. It represents the universe of stocks from which value managers typically select. Securities in this index tend to exhibit lower price-to-book and price-to-earnings ratios,
higher dividend yields and lower forecasted growth values than the growth universe.
Standard & Poor’s (S&P) 500 Index
An unmanaged index which contains 500 of the largest U.S. industrial, transportation, utility and financial companies deemed by Standard and Poor’s to be representative of the larger capitalization portion of the U.S. stock market.
S&P/ASX 200 Index (“S&P/ASX 200”)
The Standard & Poor’s Australian Security Exchange 200 (a.k.a. S&P/ASX 200 Index) is recognized as the primary investable benchmark in Australia. The index represents the 200 largest and most liquid publicly listed companies in Australia and represents approximately 78% of Australian equity market capitalization.
TOPIX Index (“TOPIX”)
The TOPIX, also known as the Tokyo Price Index, is a capitalization weighted index of all companies listed on the First Section of the Tokyo Stock Exchange.
Volatility Managed Index — International (“VMI — Intl”)
An index that utilizes the MSCI EAFE Index methodology with an overlying formulaic adjustment that dynamically modifies the equity exposure to the MSCI EAFE Index based on its observed historic volatility.
Volatility Managed Index — International Proxy (“VMI —International Proxy”)
An index that utilizes a blend of 40% DJ Euro Stoxx 50®, 25% FTSE 100, 25% TOPIX®, and 10% S&P/ ASX 200® (“International Proxy”) with an overlying formulaic adjustment that dynamically modifies the equity exposure to the International Proxy based on its observed historic volatility.
Volatility Managed Index — Large Cap Core (“VMI — LCC”)
An index that utilizes the S&P 500 Index adjusting the equity exposure of the S&P 500 Index when certain volatility levels are reached.
Volatility Managed Index — Large Cap Value (“VMI — LCV”)
An index that utilizes a blend of the S&P 500 Index and the Russell 1000® Value Index methodologies with an overlying formulaic adjustment that dynamically modifies the S&P 500 Index equity exposure of the index based on observed historic volatility.
4
EQ/INTERNATIONAL CORE PLUS PORTFOLIO (Unaudited)
PORTFOLIO ADVISERS
| Ø | AXA Equitable Funds Management Group, LLC |
| Ø | BlackRock Investment Management, LLC |
| Ø | Hirayama Investments, LLC |
| Ø | MFS Investment Management |
| Ø | WHV Investment Management |
PERFORMANCE RESULTS
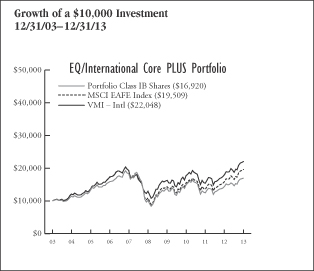
| Annualized Total Returns as of 12/31/13 | ||||||||||||
| 1 Year | 5 Years | 10 Years/ | ||||||||||
Portfolio – Class IA Shares** | 17.49 | % | 11.05 | % | 5.61 | % | ||||||
Portfolio – Class IB Shares* | 17.47 | 10.90 | 5.40 | |||||||||
Portfolio – Class K Shares*** | 17.78 | N/A | 11.62 | |||||||||
MSCI EAFE Index | 22.78 | 12.44 | 6.91 | |||||||||
40% DJ EuroSTOXX 50/ | ||||||||||||
25% FTSE 100/25% TOPIX/10% S&P/ASX 200 | 23.45 | 11.29 | N/A | |||||||||
VMI – Intl | 22.66 | 11.27 | 8.23 | |||||||||
VMI – International Proxy | 23.67 | 10.88 | N/A | |||||||||
* Date of inception 5/1/99. |
| |||||||||||
** Date of inception 3/25/02. |
| |||||||||||
*** Date of inception 8/26/11. | ||||||||||||
Returns for periods greater than one year are annualized. |
| |||||||||||
Past performance is not indicative of future results.
PERFORMANCE SUMMARY
The Portfolio’s Class IA shares returned 17.49% for the year ended December 31, 2013. The Portfolio’s benchmarks, the MSCI EAFE Index returned 22.78%, the 40% DJ EuroSTOXX 50/25% FTSE 100/25% TOPIX/10% S&P/ASX 200 returned 23.45%, the VMI — Intl returned 22.66% and the VMI –– International Proxy returned 23.67% over the same period.
The following commentary describes key factors (such as stock selection and sector allocation decisions) that helped or hurt the Portfolio’s performance relative to its primary benchmark.
Portfolio Highlights
For the year ended December 31, 2013
What helped performance during the year:
| • | Strong stock selection in the Energy sector resulted in the highest positive contribution to performance. Stock selection within the Industrials sector was also notably positive. |
| • | Individual stock contributors to performance were led by Canadian Pacific Railway, Core Laboratories and Eaton Corporation. |
| • | An underweight position in the Utilities sector aided relative performance. |
What hurt performance during the year:
| • | Stock selection in the Materials sectors was a primary detractor from performance relative to the benchmark. Individual holdings within the sector which detracted included Agrium Inc., BHP Billiton and Potash Corp. of Saskatchewan. An overweight to the sector was also detrimental. |
| • | An underweighting of the market performing Consumer Discretionary and Telecommunication Services sectors detracted from performance. |
| • | An overweight position in the Energy sector resulted in a negative relative contribution to performance. |
| • | Stock selection within the Financials and Consumer Staples sectors was also detrimental to performance. |
| Sector Weightings as of December 31, 2013 | % of Net Assets | |||
Financials | 12.7 | % | ||
Industrials | 10.6 | |||
Consumer Staples | 9.9 | |||
Energy | 9.1 | |||
Materials | 8.0 | |||
Consumer Discretionary | 7.9 | |||
Exchange Traded Funds | 7.0 | |||
Health Care | 6.2 | |||
Information Technology | 3.7 | |||
Telecommunication Services | 2.7 | |||
Utilities | 1.5 | |||
Cash and Other | 20.7 | |||
|
| |||
| 100.0 | % | |||
|
| |||
5
EQ/INTERNATIONAL CORE PLUS PORTFOLIO (Unaudited)
UNDERSTANDING YOUR EXPENSES:
As a shareholder of the Portfolio, you incur two types of costs:
(1)transaction costs, including applicable sales charges and redemption fees; and (2)ongoing costs, including management fees, distribution (12b-1) fees (in the case of Class IA and Class IB shares of the Trust), and other Portfolio expenses. These examples are intended to help you understand your ongoing costs (in dollars) of investing in the Portfolio and to compare these costs with the ongoing costs of investing in other mutual funds.
The examples are based on an investment of $1,000 invested at the beginning of the six-month period ended December 31, 2013 and held for the entire six-month period.
Actual Expenses
The first line of the table to the right provides information about actual account values and actual expenses. You may use the information in this line, together with the amount you invested, to estimate the expenses that you paid over the period. Simply divide your account value by $1,000 (for example, an $8,600 account value divided by $1,000 = 8.6), then multiply the result by the number in the first line under the heading entitled ‘‘Expenses Paid During Period’’ to estimate the expenses you paid on your account during this period.
Hypothetical Example for Comparison Purposes
The second line of the table below provides information about hypothetical account values and hypothetical expenses based on the Portfolio’s actual expense ratio and an assumed rate of return of 5% per year before expenses, which is not the Portfolio’s actual return. The hypothetical account values and expenses may not be used to estimate the actual ending account balance or expenses you paid for the period. You may use this information to compare the ongoing costs of investing in the Portfolio and other funds. To do so, compare this 5% hypothetical example with the 5% hypothetical examples that appear in the shareholder reports of the other funds.
Please note that the expenses shown in the table are meant to highlight your ongoing costs only and do not reflect any transactional costs, such as sales charges (loads), redemption fees, or exchange fees. Therefore, the second line of the table is useful in comparing ongoing costs only, and will not help you determine the relative total costs of owning different funds. In addition, if these transactional costs were included, your costs would have been higher. Also note that the table does not reflect any variable life insurance or variable annuity contract-related fees and expenses, which would increase overall fees and expenses.
EXAMPLE
Beginning Value 7/1/13 | Ending Account Value 12/31/13 | Expenses Paid During 12/31/13 | ||||||||
Class IA | ||||||||||
Actual | $1,000.00 | $1,160.46 | $5.66 | |||||||
Hypothetical (5% average annual return before expenses) | 1,000.00 | 1,019.96 | 5.30 | |||||||
Class IB | ||||||||||
Actual | 1,000.00 | 1,159.00 | 5.66 | |||||||
Hypothetical (5% average annual return before expenses) | 1,000.00 | 1,019.96 | 5.30 | |||||||
Class K | ||||||||||
Actual | 1,000.00 | 1,160.78 | 4.30 | |||||||
Hypothetical (5% average annual return before expenses) | 1,000.00 | 1,021.22 | 4.03 | |||||||
* Expenses are equal to the Portfolio’s Class IA, Class IB and Class K shares annualized expense ratios of 1.04%, 1.04% and 0.79%, respectively, multiplied by the average account value over the period, and multiplied by 184/365 (to reflect the one-half year period). |
| |||||||||
6
EQ ADVISORS TRUST
EQ/INTERNATIONAL CORE PLUS PORTFOLIO
PORTFOLIO OF INVESTMENTS
December 31, 2013
| Number of Shares | Value (Note 1) | |||||||
COMMON STOCKS: | ||||||||
Australia (4.3%) | ||||||||
AGL Energy Ltd. | 35,266 | $ | 473,280 | |||||
ALS Ltd. | 23,592 | 185,585 | ||||||
Alumina Ltd.* | 165,537 | 164,806 | ||||||
Amcor Ltd. | 77,349 | 728,635 | ||||||
AMP Ltd. | 187,842 | 736,309 | ||||||
APA Group | 52,851 | 283,144 | ||||||
Asciano Ltd. | 62,521 | 321,552 | ||||||
ASX Ltd. | 12,408 | 407,268 | ||||||
Aurizon Holdings Ltd. | 129,427 | 563,959 | ||||||
Australia & New Zealand Banking Group Ltd. | 173,931 | 5,005,415 | ||||||
Bank of Queensland Ltd. | 17,487 | 189,868 | ||||||
Bendigo and Adelaide Bank Ltd. | 26,599 | 279,065 | ||||||
BHP Billiton Ltd. | 755,938 | 25,642,378 | ||||||
BHP Billiton Ltd. (ADR) | 16,138 | 1,100,612 | ||||||
Boral Ltd. (b) | 46,927 | 199,868 | ||||||
Brambles Ltd. | 99,768 | 815,108 | ||||||
Caltex Australia Ltd. | 8,311 | 148,789 | ||||||
CFS Retail Property Trust Group (REIT) | 135,700 | 235,669 | ||||||
Coca-Cola Amatil Ltd. | 36,640 | 393,572 | ||||||
Cochlear Ltd. | 3,656 | 192,341 | ||||||
Commonwealth Bank of Australia | 102,203 | 7,099,799 | ||||||
Computershare Ltd. | 30,523 | 310,150 | ||||||
Crown Resorts Ltd. | 25,679 | 386,350 | ||||||
CSL Ltd. | 30,905 | 1,902,956 | ||||||
Dexus Property Group (REIT) | 313,930 | 281,710 | ||||||
Echo Entertainment Group Ltd. | 47,844 | 105,091 | ||||||
Federation Centres Ltd. (REIT) | 88,520 | 184,952 | ||||||
Flight Centre Travel Group Ltd. | 3,344 | 141,978 | ||||||
Fortescue Metals Group Ltd. | 99,201 | 515,516 | ||||||
Goodman Group (REIT) | 109,336 | 461,772 | ||||||
GPT Group (REIT) | 112,728 | 342,226 | ||||||
Harvey Norman Holdings Ltd. | 30,496 | 86,046 | ||||||
Iluka Resources Ltd. | 26,838 | 206,806 | ||||||
Incitec Pivot Ltd. | 104,400 | 249,826 | ||||||
Insurance Australia Group Ltd. | 133,267 | 692,546 | ||||||
Leighton Holdings Ltd. | 10,751 | 154,649 | ||||||
Lend Lease Group | 34,975 | 347,893 | ||||||
Macquarie Group Ltd. | 18,367 | 901,516 | ||||||
Metcash Ltd. | 55,669 | 157,074 | ||||||
Mirvac Group (REIT) | 234,128 | 351,209 | ||||||
National Australia Bank Ltd. | 149,299 | 4,643,155 | ||||||
Newcrest Mining Ltd. | 49,095 | 341,928 | ||||||
Orica Ltd. | 23,463 | 499,870 | ||||||
Origin Energy Ltd. | 70,114 | 880,849 | ||||||
Qantas Airways Ltd.* | 73,806 | 72,162 | ||||||
QBE Insurance Group Ltd. | 76,712 | 788,391 | ||||||
Ramsay Health Care Ltd. | 8,344 | 322,302 | ||||||
REA Group Ltd. | 2,831 | 95,450 | ||||||
Rio Tinto Ltd. | 83,568 | 5,087,446 | ||||||
Santos Ltd. | 61,618 | 804,924 | ||||||
Seek Ltd. | 20,436 | 244,696 | ||||||
Sonic Healthcare Ltd. | 24,100 | 356,783 | ||||||
SP AusNet | 111,403 | 123,842 | ||||||
Stockland Corp., Ltd. (REIT) | 141,190 | 455,107 | ||||||
Suncorp Group Ltd. | 82,472 | 964,674 | ||||||
Sydney Airport | 63,698 | 216,129 | ||||||
Tabcorp Holdings Ltd. | 48,171 | 156,133 | ||||||
Tatts Group Ltd. | 88,860 | 245,964 | ||||||
Telstra Corp., Ltd. | 275,996 | $ | 1,293,793 | |||||
Toll Holdings Ltd. | 43,669 | 221,475 | ||||||
Transurban Group | 89,727 | 548,002 | ||||||
Treasury Wine Estates Ltd. | 40,986 | 176,395 | ||||||
Wesfarmers Ltd. | 63,350 | 2,491,132 | ||||||
Westfield Group (REIT) | 131,280 | 1,182,749 | ||||||
Westfield Retail Trust (REIT) | 194,698 | 516,322 | ||||||
Westpac Banking Corp. | 196,812 | 5,690,249 | ||||||
Woodside Petroleum Ltd. | 41,825 | 1,452,742 | ||||||
Woolworths Ltd. | 79,228 | 2,394,640 | ||||||
WorleyParsons Ltd. | 13,242 | 196,275 | ||||||
|
| |||||||
| 85,410,867 | ||||||||
|
| |||||||
Austria (0.1%) | ||||||||
Andritz AG | 4,666 | 292,643 | ||||||
Erste Group Bank AG | 16,426 | 572,388 | ||||||
Immofinanz AG* | 60,292 | 279,354 | ||||||
OMV AG | 9,440 | 451,804 | ||||||
Raiffeisen Bank International AG | 3,249 | 114,512 | ||||||
Telekom Austria AG | 13,333 | 100,956 | ||||||
Vienna Insurance Group AG Wiener Versicherung Gruppe | 2,550 | 127,079 | ||||||
Voestalpine AG | 6,996 | 336,180 | ||||||
|
| |||||||
| 2,274,916 | ||||||||
|
| |||||||
Belgium (0.5%) | ||||||||
Ageas | 14,087 | 599,795 | ||||||
Anheuser-Busch InBev N.V. | 50,884 | 5,408,286 | ||||||
Belgacom S.A. | 9,707 | 287,176 | ||||||
Colruyt S.A. | 4,784 | 267,071 | ||||||
Delhaize Group S.A. | 6,532 | 388,198 | ||||||
Groupe Bruxelles Lambert S.A. | 5,171 | 474,700 | ||||||
KBC Groep N.V. | 15,712 | 891,619 | ||||||
Solvay S.A. | 3,800 | 601,181 | ||||||
Telenet Group Holding N.V. | 3,283 | 195,900 | ||||||
UCB S.A. | 7,052 | 525,236 | ||||||
Umicore S.A. | 7,307 | 341,324 | ||||||
|
| |||||||
| 9,980,486 | ||||||||
|
| |||||||
Bermuda (0.2%) | ||||||||
Nabors Industries Ltd. | 133,959 | 2,275,963 | ||||||
Seadrill Ltd. | 23,936 | 977,125 | ||||||
|
| |||||||
| 3,253,088 | ||||||||
|
| |||||||
Brazil (0.9%) | ||||||||
AMBEV S.A. (ADR) | 148,025 | 1,087,984 | ||||||
BM&F Bovespa S.A. | 373,800 | 1,752,348 | ||||||
Cia. Hering | 78,200 | 991,069 | ||||||
Itau Unibanco Holding S.A. (Preference) (ADR) | 200,450 | 2,720,107 | ||||||
Lojas Renner S.A. | 25,400 | 656,734 | ||||||
LPS Brasil Consultoria de | 42,700 | 261,349 | ||||||
M Dias Branco S.A. | 34,100 | 1,445,375 | ||||||
Vale S.A. (ADR) | 639,936 | 9,759,024 | ||||||
|
| |||||||
| 18,673,990 | ||||||||
|
| |||||||
Canada (5.2%) | ||||||||
Agrium, Inc. | 66,525 | 6,085,707 | ||||||
Brookfield Asset Management, Inc., Class A | 84,134 | 3,266,923 | ||||||
Canadian National Railway Co. | 492,682 | 28,092,728 | ||||||
See Notes to Financial Statements.
7
EQ ADVISORS TRUST
EQ/INTERNATIONAL CORE PLUS PORTFOLIO
PORTFOLIO OF INVESTMENTS (Continued)
December 31, 2013
| Number of Shares | Value (Note 1) | |||||||
Canadian Natural Resources Ltd. | 308,152 | $ | 10,427,864 | |||||
Canadian Natural Resources Ltd. (Toronto Exchange) | 73,184 | 2,476,096 | ||||||
Canadian Pacific Railway Ltd. | 54,960 | 8,316,547 | ||||||
Canadian Pacific Railway Ltd. (Toronto Exchange) | 92,807 | 14,035,721 | ||||||
Cenovus Energy, Inc. | 52,326 | 1,499,140 | ||||||
Dollarama, Inc. | 35,088 | 2,913,732 | ||||||
Finning International, Inc. | 40,822 | 1,043,368 | ||||||
Potash Corp. of Saskatchewan, Inc. | 177,072 | 5,837,667 | ||||||
Suncor Energy, Inc. | 397,987 | 13,949,444 | ||||||
Suncor Energy, Inc. | 152,950 | 5,362,069 | ||||||
|
| |||||||
| 103,307,006 | ||||||||
|
| |||||||
Chile (0.1%) | ||||||||
Banco Santander Chile S.A. (ADR) | 53,490 | 1,260,759 | ||||||
|
| |||||||
China (0.1%) | ||||||||
Guangzhou Automobile Group Co., Ltd., Class H | 1,174,068 | 1,283,945 | ||||||
Yangzijiang Shipbuilding Holdings Ltd. | 127,652 | 119,868 | ||||||
|
| |||||||
| 1,403,813 | ||||||||
|
| |||||||
Denmark (1.0%) | ||||||||
A. P. Moller - Maersk A/S, Class A | 35 | 360,795 | ||||||
A. P. Moller - Maersk A/S, | 84 | 911,604 | ||||||
Carlsberg A/S, Class B | 43,340 | 4,795,353 | ||||||
Chr Hansen Holding A/S | 57,166 | 2,270,722 | ||||||
Coloplast A/S, Class B | 6,976 | 461,829 | ||||||
Danske Bank A/S* | 42,024 | 964,047 | ||||||
DSV A/S | 12,050 | 395,093 | ||||||
Novo Nordisk A/S, Class B | 41,766 | 7,655,784 | ||||||
Novozymes A/S, Class B | 14,010 | 591,377 | ||||||
TDC A/S | 50,204 | 486,972 | ||||||
Tryg A/S | 1,627 | 157,367 | ||||||
William Demant Holding A/S* | 1,573 | 152,869 | ||||||
|
| |||||||
| 19,203,812 | ||||||||
|
| |||||||
Finland (0.5%) | ||||||||
Elisa Oyj | 8,822 | 233,747 | ||||||
Fortum Oyj | 27,388 | 626,580 | ||||||
Kone Oyj, Class B | 55,838 | 2,519,576 | ||||||
Metso Oyj | 8,192 | 349,587 | ||||||
Neste Oil Oyj | 8,496 | 167,956 | ||||||
Nokia Oyj* | 236,958 | 1,897,222 | ||||||
Nokian Renkaat Oyj | 7,196 | 345,197 | ||||||
Orion Oyj, Class B | 6,464 | 181,585 | ||||||
Pohjola Bank plc, Class A | 9,195 | 184,937 | ||||||
Sampo Oyj, Class A | 26,294 | 1,292,087 | ||||||
Stora Enso Oyj, Class R | 35,328 | 354,542 | ||||||
UPM-Kymmene Oyj | 33,723 | 569,703 | ||||||
Wartsila Oyj | 11,316 | 556,847 | ||||||
|
| |||||||
| 9,279,566 | ||||||||
|
| |||||||
France (6.3%) | ||||||||
Accor S.A. | 10,150 | $ | 478,943 | |||||
Aeroports de Paris S.A. | 1,852 | 210,193 | ||||||
Air Liquide S.A. | 39,429 | 5,576,127 | ||||||
Airbus Group N.V. | 37,461 | 2,876,174 | ||||||
Alcatel-Lucent* | 175,228 | 785,377 | ||||||
Alstom S.A. | 13,820 | 503,347 | ||||||
Arkema S.A. | 4,024 | 469,382 | ||||||
AtoS | 4,047 | 366,283 | ||||||
AXA S.A.‡ | 113,867 | 3,165,832 | ||||||
BNP Paribas S.A. | 63,370 | 4,938,640 | ||||||
Bouygues S.A. | 12,235 | 461,525 | ||||||
Bureau Veritas S.A. | 14,186 | 414,611 | ||||||
Cap Gemini S.A. | 9,151 | 618,499 | ||||||
Carrefour S.A. | 38,642 | 1,531,534 | ||||||
Casino Guichard Perrachon S.A. | 3,611 | 416,140 | ||||||
CGG S.A.* | 10,176 | 176,109 | ||||||
Christian Dior S.A. | 3,495 | 660,389 | ||||||
Cie de Saint-Gobain S.A. | 26,010 | 1,430,384 | ||||||
Cie Generale des Etablissements Michelin | 11,679 | 1,241,160 | ||||||
CNP Assurances S.A. | 10,289 | 210,903 | ||||||
Credit Agricole S.A.* | 64,050 | 819,897 | ||||||
Danone S.A. | 144,156 | 10,375,862 | ||||||
Dassault Systemes S.A. | 19,575 | 2,429,833 | ||||||
Edenred | 12,957 | 433,681 | ||||||
EDF S.A. | 15,407 | 544,404 | ||||||
Essilor International S.A. | 34,931 | 3,713,658 | ||||||
Eurazeo S.A. | 2,068 | 162,105 | ||||||
Eutelsat Communications S.A. | 9,195 | 286,702 | ||||||
Fonciere des Regions (REIT) | 1,883 | 162,550 | ||||||
GDF Suez S.A. | 84,333 | 1,983,309 | ||||||
Gecina S.A. (REIT) | 1,344 | 177,554 | ||||||
Groupe Eurotunnel S.A. (Registered) | 35,696 | 375,177 | ||||||
ICADE (REIT) | 1,984 | 184,698 | ||||||
Iliad S.A. | 1,581 | 323,855 | ||||||
Imerys S.A. | 2,253 | 195,916 | ||||||
J.C. Decaux S.A. | 4,428 | 182,565 | ||||||
Kering | 4,846 | 1,024,330 | ||||||
Klepierre S.A. (REIT) | 6,489 | 300,703 | ||||||
Lafarge S.A. | 11,969 | 896,890 | ||||||
Lagardere S.C.A. | 7,357 | 273,470 | ||||||
Legrand S.A. | 40,637 | 2,239,527 | ||||||
L’Oreal S.A. | 29,340 | 5,154,360 | ||||||
LVMH Moet Hennessy Louis Vuitton S.A. | 55,291 | 10,086,064 | ||||||
Natixis S.A. | 58,519 | 344,077 | ||||||
Orange S.A. | 118,857 | 1,471,604 | ||||||
Pernod-Ricard S.A. | 62,209 | 7,086,956 | ||||||
Publicis Groupe S.A. | 66,270 | 6,063,560 | ||||||
Remy Cointreau S.A. | 1,565 | 131,310 | ||||||
Renault S.A. | 12,322 | 990,808 | ||||||
Rexel S.A. | 11,750 | 308,337 | ||||||
Safran S.A. | 16,608 | 1,154,034 | ||||||
Sanofi S.A. | 75,865 | 8,048,820 | ||||||
Schneider Electric S.A. | 73,683 | 6,426,586 | ||||||
SCOR SE | 9,741 | 355,989 | ||||||
Societe BIC S.A. | 1,802 | 220,781 | ||||||
Societe Generale S.A. | 45,315 | 2,631,988 | ||||||
Sodexo S.A. | 6,043 | 612,195 | ||||||
Suez Environnement Co. S.A. | 17,727 | 317,641 | ||||||
See Notes to Financial Statements.
8
EQ ADVISORS TRUST
EQ/INTERNATIONAL CORE PLUS PORTFOLIO
PORTFOLIO OF INVESTMENTS (Continued)
December 31, 2013
| Number of Shares | Value (Note 1) | |||||||
Technip S.A. | 26,793 | $ | 2,574,979 | |||||
Thales S.A. | 5,805 | 373,742 | ||||||
Total S.A. | 135,797 | 8,318,914 | ||||||
Unibail-Rodamco SE (REIT) | 6,148 | 1,575,266 | ||||||
Valeo S.A. | 4,518 | 499,906 | ||||||
Vallourec S.A. | 6,690 | 364,456 | ||||||
Veolia Environnement S.A. | 21,753 | 354,768 | ||||||
Vinci S.A. | 29,612 | 1,943,981 | ||||||
Vivendi S.A. | 75,920 | 2,000,608 | ||||||
Wendel S.A. | 2,053 | 299,236 | ||||||
Zodiac Aerospace | 2,164 | 383,291 | ||||||
|
| |||||||
| 123,712,495 | ||||||||
|
| |||||||
Germany (5.6%) | ||||||||
Adidas AG | 40,327 | 5,139,468 | ||||||
Allianz SE (Registered) | 28,864 | 5,175,965 | ||||||
Axel Springer SE | 2,639 | 169,543 | ||||||
BASF SE | 105,253 | 11,220,285 | ||||||
BASF SE (ADR) | 6,500 | 700,635 | ||||||
Bayer AG (Registered) | 92,902 | 13,029,749 | ||||||
Bayerische Motoren Werke (BMW) AG | 21,062 | 2,469,249 | ||||||
Bayerische Motoren Werke (BMW) AG (Preference) | 3,370 | 287,856 | ||||||
Beiersdorf AG | 6,461 | 654,542 | ||||||
Brenntag AG | 23,941 | 4,438,077 | ||||||
Celesio AG | 5,634 | 178,266 | ||||||
Commerzbank AG* | 61,669 | 993,454 | ||||||
Continental AG | 7,051 | 1,546,190 | ||||||
Daimler AG (Registered) | 60,974 | 5,276,174 | ||||||
Deutsche Bank AG (Registered) | 65,004 | 3,100,847 | ||||||
Deutsche Boerse AG | 12,371 | 1,024,531 | ||||||
Deutsche Lufthansa AG (Registered)* | 14,742 | 312,726 | ||||||
Deutsche Post AG (Registered) | 57,549 | 2,098,009 | ||||||
Deutsche Telekom AG (Registered) | 182,568 | 3,121,904 | ||||||
Deutsche Wohnen AG | 18,918 | 365,268 | ||||||
E.ON SE | 113,242 | 2,089,883 | ||||||
Fraport AG | 2,210 | 165,362 | ||||||
Fresenius Medical Care AG & Co. KGaA | 35,180 | 2,503,583 | ||||||
Fresenius SE & Co. KGaA | 7,992 | 1,226,997 | ||||||
Fuchs Petrolub SE (Preference) | 2,259 | 220,771 | ||||||
GEA Group AG | 11,539 | 549,247 | ||||||
Hannover Rueck SE | 3,865 | 331,679 | ||||||
HeidelbergCement AG | 9,014 | 683,891 | ||||||
Henkel AG & Co. KGaA | 8,067 | 839,435 | ||||||
Henkel AG & Co. KGaA (Preference) | 11,192 | 1,298,107 | ||||||
Hochtief AG | 1,911 | 163,153 | ||||||
Hugo Boss AG | 2,017 | 287,190 | ||||||
Infineon Technologies AG | 69,256 | 739,338 | ||||||
K+S AG (Registered) | 11,041 | 339,856 | ||||||
Kabel Deutschland Holding AG | 1,419 | 183,929 | ||||||
Lanxess AG | 5,333 | 355,642 | ||||||
Linde AG | 38,534 | 8,060,357 | ||||||
MAN SE | 2,237 | 274,662 | ||||||
Merck KGaA | 4,142 | 742,184 | ||||||
Metro AG | 8,310 | 402,409 | ||||||
Muenchener Rueckversicherungs AG (Registered) | 11,416 | 2,515,154 | ||||||
OSRAM Licht AG* | 5,056 | $ | 285,177 | |||||
Porsche Automobil Holding SE (Preference) | 9,563 | 995,369 | ||||||
ProSiebenSat.1 Media AG (Registered) | 11,609 | 574,938 | ||||||
RWE AG | 30,725 | 1,124,550 | ||||||
SAP AG | 99,643 | 8,541,385 | ||||||
Siemens AG (Registered) | 50,191 | 6,855,752 | ||||||
Sky Deutschland AG* | 27,353 | 301,036 | ||||||
Suedzucker AG | 5,196 | 140,246 | ||||||
Symrise AG | 67,741 | 3,121,908 | ||||||
Telefonica Deutschland Holding AG | 17,763 | 146,619 | ||||||
ThyssenKrupp AG* | 24,734 | 601,930 | ||||||
United Internet AG (Registered) | 6,794 | 288,994 | ||||||
Volkswagen AG | 1,792 | 485,409 | ||||||
Volkswagen AG (Preference) | 9,201 | 2,584,093 | ||||||
|
| |||||||
| 111,322,973 | ||||||||
|
| |||||||
Hong Kong (1.7%) | ||||||||
AIA Group Ltd. | 1,598,725 | 8,020,118 | ||||||
ASM Pacific Technology Ltd. | 15,307 | 128,113 | ||||||
Bank of East Asia Ltd. | 86,380 | 365,937 | ||||||
BOC Hong Kong Holdings Ltd. | 237,043 | 759,645 | ||||||
Cathay Pacific Airways Ltd. | 87,575 | 185,217 | ||||||
Cheung Kong Holdings Ltd. | 88,899 | 1,403,252 | ||||||
Cheung Kong Infrastructure Holdings Ltd. | 39,340 | 248,339 | ||||||
China Unicom Hong Kong Ltd. | 2,068,023 | 3,093,647 | ||||||
CLP Holdings Ltd. | 111,564 | 881,946 | ||||||
Dairy Farm International Holdings Ltd. | 86,219 | 819,081 | ||||||
First Pacific Co., Ltd. | 166,250 | 189,098 | ||||||
Galaxy Entertainment Group Ltd.* | 135,000 | 1,210,844 | ||||||
Hang Lung Properties Ltd. | 143,438 | 453,198 | ||||||
Hang Seng Bank Ltd. | 49,074 | 795,507 | ||||||
Henderson Land Development Co., Ltd. | 68,209 | 389,235 | ||||||
HKT Trust/HKT Ltd. | 136,000 | 134,346 | ||||||
Hong Kong & China Gas Co., Ltd. | 367,747 | 843,215 | ||||||
Hong Kong Exchanges and Clearing Ltd. | 44,727 | 745,806 | ||||||
Hopewell Holdings Ltd. | 37,351 | 126,441 | ||||||
Hutchison Whampoa Ltd. | 136,571 | 1,856,336 | ||||||
Hysan Development Co., Ltd. | 39,459 | 169,961 | ||||||
Kerry Properties Ltd. | 40,732 | 141,301 | ||||||
Li & Fung Ltd. | 2,911,503 | 3,754,695 | ||||||
Link REIT (REIT) | 146,186 | 708,845 | ||||||
MTR Corp., Ltd. | 93,029 | 352,114 | ||||||
New World Development Co., | 238,170 | 300,696 | ||||||
Noble Group Ltd. | 269,979 | 228,914 | ||||||
NWS Holdings Ltd. | 95,383 | 145,394 | ||||||
PCCW Ltd. | 265,585 | 118,848 | ||||||
Power Assets Holdings Ltd. | 88,996 | 707,556 | ||||||
Shangri-La Asia Ltd. | 99,859 | 194,714 | ||||||
Sino Land Co., Ltd. | 189,241 | 258,689 | ||||||
SJM Holdings Ltd. | 124,000 | 415,769 | ||||||
Sun Hung Kai Properties Ltd. | 103,278 | 1,309,904 | ||||||
Swire Pacific Ltd., Class A | 43,331 | 507,949 | ||||||
See Notes to Financial Statements.
9
EQ ADVISORS TRUST
EQ/INTERNATIONAL CORE PLUS PORTFOLIO
PORTFOLIO OF INVESTMENTS (Continued)
December 31, 2013
| Number of Shares | Value (Note 1) | |||||||
Swire Properties Ltd. | 75,000 | $ | 189,572 | |||||
Wharf Holdings Ltd. | 97,330 | 744,319 | ||||||
Wheelock & Co., Ltd. | 58,116 | 267,185 | ||||||
Yue Yuen Industrial Holdings Ltd. | 46,199 | 154,308 | ||||||
|
| |||||||
| 33,320,054 | ||||||||
|
| |||||||
India (0.1%) | ||||||||
HDFC Bank Ltd. (ADR) | 71,480 | 2,461,771 | ||||||
|
| |||||||
Ireland (1.5%) | ||||||||
Accenture plc, Class A | 66,686 | 5,482,923 | ||||||
Bank of Ireland* | 1,343,976 | 465,925 | ||||||
CRH plc | 46,557 | 1,172,087 | ||||||
Eaton Corp. plc | 163,471 | 12,443,412 | ||||||
Experian plc | 228,826 | 4,221,218 | ||||||
James Hardie Industries plc (CDI) | 27,899 | 322,349 | ||||||
Kerry Group plc (BATS Eaurope Exchange), Class A | 6,232 | 432,955 | ||||||
Kerry Group plc (Irish Stock Exchange), Class A | 3,337 | 231,785 | ||||||
Paddy Power plc | 22,277 | 1,900,081 | ||||||
Shire plc | 59,251 | 2,798,288 | ||||||
|
| |||||||
| 29,471,023 | ||||||||
|
| |||||||
Israel (0.3%) | ||||||||
Bank Hapoalim B.M. | 67,673 | 379,101 | ||||||
Bank Leumi Le-Israel B.M.* | 80,023 | 326,822 | ||||||
Bezeq Israeli Telecommunication Corp., Ltd. | 115,948 | 196,531 | ||||||
Delek Group Ltd. | 229 | 87,458 | ||||||
Israel Chemicals Ltd. | 28,547 | 237,864 | ||||||
Israel Corp., Ltd.* | 166 | 87,351 | ||||||
Mizrahi Tefahot Bank Ltd. | 8,173 | 106,965 | ||||||
NICE Systems Ltd. | 3,657 | 149,777 | ||||||
NICE Systems Ltd. (ADR) | 62,249 | 2,549,719 | ||||||
Teva Pharmaceutical Industries Ltd. | 54,148 | 2,164,672 | ||||||
|
| |||||||
| 6,286,260 | ||||||||
|
| |||||||
Italy (1.1%) | ||||||||
Assicurazioni Generali S.p.A. | 74,049 | 1,741,963 | ||||||
Atlantia S.p.A. | 21,212 | 475,948 | ||||||
Banca Monte dei Paschi di Siena S.p.A.* | 428,122 | 103,305 | ||||||
Enel Green Power S.p.A. | 109,584 | 276,032 | ||||||
Enel S.p.A. | 418,044 | 1,825,377 | ||||||
Eni S.p.A. | 161,154 | 3,877,525 | ||||||
Exor S.p.A. | 5,733 | 228,010 | ||||||
Fiat S.p.A.* | 56,105 | 458,857 | ||||||
Finmeccanica S.p.A.* | 26,882 | 203,584 | ||||||
Intesa Sanpaolo S.p.A. | 741,393 | 1,829,762 | ||||||
Luxottica Group S.p.A. | 10,584 | 567,128 | ||||||
Mediobanca S.p.A.* | 32,379 | 283,299 | ||||||
Pirelli & C. S.p.A. | 14,626 | 253,122 | ||||||
Prysmian S.p.A. | 103,074 | 2,653,057 | ||||||
Saipem S.p.A. | 119,185 | 2,551,261 | ||||||
Snam S.p.A. | 129,346 | 723,509 | ||||||
Telecom Italia S.p.A. | 641,433 | 636,224 | ||||||
Telecom Italia S.p.A. (RNC) | 384,457 | 300,943 | ||||||
Terna Rete Elettrica Nazionale S.p.A. | 96,078 | 480,058 | ||||||
UniCredit S.p.A. | 276,788 | $ | 2,048,582 | |||||
Unione di Banche Italiane | 54,312 | 368,803 | ||||||
|
| |||||||
| 21,886,349 | ||||||||
|
| |||||||
Japan (10.7%) | ||||||||
ABC-Mart, Inc. | 1,840 | 80,285 | ||||||
Acom Co., Ltd.* | 23,500 | 79,665 | ||||||
Advantest Corp. | 8,998 | 111,674 | ||||||
Aeon Co., Ltd. | 38,452 | 520,312 | ||||||
AEON Financial Service Co., | 27,538 | 737,415 | ||||||
Aeon Mall Co., Ltd. | 6,908 | 193,576 | ||||||
Air Water, Inc. | 10,000 | 135,220 | ||||||
Aisin Seiki Co., Ltd. | 12,338 | 500,268 | ||||||
Ajinomoto Co., Inc. | 38,168 | 551,626 | ||||||
Alfresa Holdings Corp. | 2,366 | 117,278 | ||||||
Amada Co., Ltd. | 23,148 | 203,762 | ||||||
ANA Holdings, Inc. | 76,302 | 152,155 | ||||||
Aozora Bank Ltd. | 68,918 | 195,020 | ||||||
Asahi Glass Co., Ltd. | 64,752 | 402,125 | ||||||
Asahi Group Holdings Ltd. | 24,787 | 697,642 | ||||||
Asahi Kasei Corp. | 81,078 | 634,396 | ||||||
Asics Corp. | 10,548 | 179,790 | ||||||
Astellas Pharma, Inc. | 27,330 | 1,616,807 | ||||||
Bank of Kyoto Ltd. | 21,082 | 175,767 | ||||||
Bank of Yokohama Ltd. | 73,700 | 410,105 | ||||||
Benesse Holdings, Inc. | 4,774 | 191,531 | ||||||
Bridgestone Corp. | 41,164 | 1,555,719 | ||||||
Brother Industries Ltd. | 14,515 | 198,063 | ||||||
Calbee, Inc. | 4,400 | 106,751 | ||||||
Canon, Inc. | 72,130 | 2,280,818 | ||||||
Casio Computer Co., Ltd. | 14,827 | 181,202 | ||||||
Central Japan Railway Co. | 9,200 | 1,081,531 | ||||||
Chiba Bank Ltd. | 48,672 | 327,684 | ||||||
Chiyoda Corp. | 10,000 | 144,906 | ||||||
Chubu Electric Power Co., Inc. | 41,254 | 532,373 | ||||||
Chugai Pharmaceutical Co., Ltd. | 14,347 | 316,748 | ||||||
Chugoku Bank Ltd. | 9,511 | 120,660 | ||||||
Chugoku Electric Power Co., Inc. | 18,962 | 294,576 | ||||||
Citizen Holdings Co., Ltd. | 17,552 | 147,669 | ||||||
Coca-Cola West Co., Ltd. | 4,048 | 85,603 | ||||||
Credit Saison Co., Ltd. | 9,816 | 257,820 | ||||||
Dai Nippon Printing Co., Ltd. | 36,162 | 383,219 | ||||||
Daicel Corp. | 17,955 | 145,945 | ||||||
Daido Steel Co., Ltd. | 18,519 | 91,795 | ||||||
Daihatsu Motor Co., Ltd. | 12,200 | 206,442 | ||||||
Dai-ichi Life Insurance Co., Ltd. | 54,500 | 909,282 | ||||||
Daiichi Sankyo Co., Ltd. | 43,287 | 790,437 | ||||||
Daikin Industries Ltd. | 15,023 | 934,390 | ||||||
Dainippon Sumitomo Pharma Co., Ltd. | 10,592 | 165,453 | ||||||
Daito Trust Construction Co., Ltd. | 4,638 | 432,927 | ||||||
Daiwa House Industry Co., Ltd. | 36,658 | 708,376 | ||||||
Daiwa Securities Group, Inc. | 106,476 | 1,061,626 | ||||||
DeNA Co., Ltd. | 6,500 | 136,530 | ||||||
Denso Corp. | 30,812 | 1,623,840 | ||||||
Dentsu, Inc. | 13,291 | 542,696 | ||||||
Don Quijote Holdings Co., Ltd. | 3,300 | 199,611 | ||||||
East Japan Railway Co. | 21,120 | 1,680,615 | ||||||
Eisai Co., Ltd. | 16,154 | 625,084 | ||||||
See Notes to Financial Statements.
10
EQ ADVISORS TRUST
EQ/INTERNATIONAL CORE PLUS PORTFOLIO
PORTFOLIO OF INVESTMENTS (Continued)
December 31, 2013
| Number of Shares | Value (Note 1) | |||||||
Electric Power Development Co., Ltd. | 7,603 | $ | 221,282 | |||||
FamilyMart Co., Ltd. | 3,604 | 164,440 | ||||||
FANUC Corp. | 12,044 | 2,201,567 | ||||||
Fast Retailing Co., Ltd. | 3,316 | 1,366,579 | ||||||
Fuji Electric Co., Ltd. | 37,288 | 174,207 | ||||||
Fuji Heavy Industries Ltd. | 37,480 | 1,073,043 | ||||||
Fujifilm Holdings Corp. | 29,768 | 842,640 | ||||||
Fujitsu Ltd.* | 119,742 | 618,551 | ||||||
Fukuoka Financial Group, Inc. | 47,983 | 210,048 | ||||||
Gree, Inc. | 6,500 | 64,130 | ||||||
GungHo Online Entertainment, Inc.* | 21,500 | 154,548 | ||||||
Gunma Bank Ltd. | 22,274 | 124,156 | ||||||
Hachijuni Bank Ltd. | 25,088 | 146,035 | ||||||
Hakuhodo DY Holdings, Inc. | 14,060 | 108,811 | ||||||
Hamamatsu Photonics KK | 4,400 | 175,691 | ||||||
Hankyu Hanshin Holdings, Inc. | 74,000 | 399,126 | ||||||
Hino Motors Ltd. | 16,830 | 264,013 | ||||||
Hirose Electric Co., Ltd. | 1,866 | 265,432 | ||||||
Hiroshima Bank Ltd. | 30,000 | 123,920 | ||||||
Hisamitsu Pharmaceutical Co., Inc. | 3,867 | 194,617 | ||||||
Hitachi Chemical Co., Ltd. | 6,888 | 109,687 | ||||||
Hitachi Construction Machinery Co., Ltd. | 6,451 | 137,522 | ||||||
Hitachi High-Technologies Corp. | 3,618 | 90,733 | ||||||
Hitachi Ltd. | 305,211 | 2,306,979 | ||||||
Hitachi Metals Ltd. | 11,386 | 160,665 | ||||||
Hokkaido Electric Power Co., Inc.* | 11,268 | 129,361 | ||||||
Hokuhoku Financial Group, Inc. | 75,000 | 149,558 | ||||||
Hokuriku Electric Power Co. | 10,138 | 137,375 | ||||||
Honda Motor Co., Ltd. | 265,904 | 10,933,096 | ||||||
Hoya Corp. | 27,902 | 774,187 | ||||||
Hulic Co., Ltd. | 16,400 | 242,161 | ||||||
Ibiden Co., Ltd. | 6,834 | 127,582 | ||||||
Idemitsu Kosan Co., Ltd. | 5,160 | 117,253 | ||||||
IHI Corp. | 83,834 | 361,415 | ||||||
Iida Group Holdings Co., Ltd.* | 7,500 | 149,701 | ||||||
INPEX Corp. | 266,900 | 3,416,401 | ||||||
Isetan Mitsukoshi Holdings Ltd. | 22,748 | 322,935 | ||||||
Isuzu Motors Ltd. | 76,138 | 472,835 | ||||||
ITOCHU Corp. | 96,532 | 1,190,723 | ||||||
ITOCHU Techno-Solutions Corp. | 1,734 | 70,226 | ||||||
Iyo Bank Ltd. | 15,578 | 152,511 | ||||||
J. Front Retailing Co., Ltd. | 29,068 | 219,714 | ||||||
Japan Airlines Co., Ltd. | 4,015 | 197,872 | ||||||
Japan Exchange Group, Inc. | 16,000 | 454,126 | ||||||
Japan Petroleum Exploration Co. | 1,910 | 72,276 | ||||||
Japan Prime Realty Investment Corp. (REIT) | 48 | 153,604 | ||||||
Japan Real Estate Investment Corp. (REIT) | 76 | 407,027 | ||||||
Japan Retail Fund Investment Corp. (REIT) | 145 | 294,929 | ||||||
Japan Steel Works Ltd. | 18,022 | 100,626 | ||||||
Japan Tobacco, Inc. | 267,100 | 8,674,219 | ||||||
JFE Holdings, Inc. | 31,476 | 747,820 | ||||||
JGC Corp. | 13,326 | 521,980 | ||||||
Joyo Bank Ltd. | 43,480 | 221,715 | ||||||
JSR Corp. | 11,418 | 220,749 | ||||||
JTEKT Corp. | 12,982 | 220,661 | ||||||
JX Holdings, Inc. | 143,978 | 739,646 | ||||||
Kajima Corp. | 51,739 | $ | 194,064 | |||||
Kakaku.com, Inc. | 8,800 | 154,341 | ||||||
Kamigumi Co., Ltd. | 13,704 | 125,445 | ||||||
Kaneka Corp. | 15,644 | 102,501 | ||||||
Kansai Electric Power Co., Inc.* | 44,723 | 513,438 | ||||||
Kansai Paint Co., Ltd. | 14,452 | 213,397 | ||||||
Kao Corp. | 32,367 | 1,017,328 | ||||||
Kawasaki Heavy Industries Ltd. | 90,840 | 380,405 | ||||||
KDDI Corp. | 34,000 | 2,088,880 | ||||||
Keikyu Corp. | 29,466 | 242,589 | ||||||
Keio Corp. | 37,347 | 248,602 | ||||||
Keisei Electric Railway Co., Ltd. | 16,955 | 155,688 | ||||||
Keyence Corp. | 2,853 | 1,219,115 | ||||||
Kikkoman Corp. | 10,823 | 204,107 | ||||||
Kinden Corp. | 8,696 | 90,833 | ||||||
Kintetsu Corp. | 110,980 | 388,867 | ||||||
Kirin Holdings Co., Ltd. | 54,991 | 790,062 | ||||||
Kobe Steel Ltd.* | 160,095 | 273,641 | ||||||
Koito Manufacturing Co., Ltd. | 6,000 | 114,348 | ||||||
Komatsu Ltd. | 59,272 | 1,202,775 | ||||||
Konami Corp. | 5,988 | 138,115 | ||||||
Konica Minolta, Inc. | 29,936 | 298,194 | ||||||
Kubota Corp. | 67,508 | 1,114,770 | ||||||
Kuraray Co., Ltd. | 22,092 | 262,855 | ||||||
Kurita Water Industries Ltd. | 7,514 | 155,688 | ||||||
Kyocera Corp. | 20,608 | 1,027,367 | ||||||
Kyowa Hakko Kirin Co., Ltd. | 13,267 | 146,011 | ||||||
Kyushu Electric Power Co., Inc.* | 27,288 | 347,740 | ||||||
Lawson, Inc. | 44,880 | 3,353,961 | ||||||
LIXIL Group Corp. | 17,023 | 466,027 | ||||||
M3, Inc. | 46 | 115,098 | ||||||
Mabuchi Motor Co., Ltd. | 1,652 | 98,044 | ||||||
Makita Corp. | 7,146 | 374,570 | ||||||
Marubeni Corp. | 105,668 | 758,570 | ||||||
Marui Group Co., Ltd. | 14,886 | 150,966 | ||||||
Maruichi Steel Tube Ltd. | 3,116 | 78,588 | ||||||
Mazda Motor Corp.* | 170,679 | 881,677 | ||||||
McDonald’s Holdings Co. Japan Ltd. | 4,480 | 114,308 | ||||||
Medipal Holdings Corp. | 8,322 | 109,685 | ||||||
MEIJI Holdings Co., Ltd. | 3,834 | 246,110 | ||||||
Miraca Holdings, Inc. | 3,700 | 174,266 | ||||||
Mitsubishi Chemical Holdings Corp. | 86,859 | 400,850 | ||||||
Mitsubishi Corp. | 89,184 | 1,708,139 | ||||||
Mitsubishi Electric Corp. | 123,371 | 1,546,384 | ||||||
Mitsubishi Estate Co., Ltd. | 79,011 | 2,359,601 | ||||||
Mitsubishi Gas Chemical Co., | 26,711 | 196,319 | ||||||
Mitsubishi Heavy Industries Ltd. | 192,256 | 1,188,478 | ||||||
Mitsubishi Logistics Corp. | 7,008 | 110,534 | ||||||
Mitsubishi Materials Corp. | 70,819 | 260,923 | ||||||
Mitsubishi Motors Corp.* | 26,821 | 287,541 | ||||||
Mitsubishi Tanabe Pharma Corp. | 14,290 | 198,928 | ||||||
Mitsubishi UFJ Financial Group, Inc. | 805,816 | 5,310,382 | ||||||
Mitsubishi UFJ Lease & Finance Co., Ltd. | 35,900 | 219,879 | ||||||
Mitsui & Co., Ltd. | 110,154 | 1,532,386 | ||||||
Mitsui Chemicals, Inc. | 51,288 | 123,703 | ||||||
Mitsui Fudosan Co., Ltd. | 53,427 | 1,920,247 | ||||||
Mitsui O.S.K. Lines Ltd. | 68,575 | 308,656 | ||||||
See Notes to Financial Statements.
11
EQ ADVISORS TRUST
EQ/INTERNATIONAL CORE PLUS PORTFOLIO
PORTFOLIO OF INVESTMENTS (Continued)
December 31, 2013
| Number of Shares | Value (Note 1) | |||||||
Mizuho Financial Group, Inc. | 1,458,602 | $ | 3,157,927 | |||||
MS&AD Insurance Group Holdings, Inc. | 32,498 | 870,851 | ||||||
Murata Manufacturing Co., Ltd. | 12,971 | 1,150,405 | ||||||
Nabtesco Corp. | 7,000 | 161,191 | ||||||
Namco Bandai Holdings, Inc. | 11,219 | 248,648 | ||||||
NEC Corp. | 163,742 | 368,501 | ||||||
Nexon Co., Ltd. | 7,200 | 66,455 | ||||||
NGK Insulators Ltd. | 18,267 | 346,572 | ||||||
NGK Spark Plug Co., Ltd. | 10,948 | 258,860 | ||||||
NHK Spring Co., Ltd. | 9,675 | 108,960 | ||||||
Nidec Corp. | 6,446 | 630,461 | ||||||
Nikon Corp. | 21,859 | 417,004 | ||||||
Nintendo Co., Ltd. | 6,839 | 909,832 | ||||||
Nippon Building Fund, Inc. (REIT) | 86 | 499,782 | ||||||
Nippon Electric Glass Co., Ltd. | 22,022 | 115,432 | ||||||
Nippon Express Co., Ltd. | 48,427 | 234,065 | ||||||
Nippon Meat Packers, Inc. | 10,075 | 172,780 | ||||||
Nippon Paint Co., Ltd. | 9,000 | 149,473 | ||||||
Nippon Prologis REIT, Inc. (REIT) | 16 | 152,844 | ||||||
Nippon Steel & Sumitomo Metal Corp. | 481,698 | 1,610,082 | ||||||
Nippon Telegraph & Telephone Corp. | 23,587 | 1,267,709 | ||||||
Nippon Yusen KK | 101,442 | 323,659 | ||||||
Nishi-Nippon City Bank Ltd. | 44,480 | 119,531 | ||||||
Nissan Motor Co., Ltd. | 158,048 | 1,326,697 | ||||||
Nisshin Seifun Group, Inc. | 13,901 | 143,485 | ||||||
Nissin Foods Holdings Co., Ltd. | 3,506 | 147,817 | ||||||
Nitori Holdings Co., Ltd. | 2,075 | 196,446 | ||||||
Nitto Denko Corp. | 10,611 | 446,869 | ||||||
NKSJ Holdings, Inc. | 21,104 | 585,966 | ||||||
NOK Corp. | 5,864 | 95,775 | ||||||
Nomura Holdings, Inc. | 230,908 | 1,773,854 | ||||||
Nomura Real Estate Holdings, Inc. | 7,875 | 177,077 | ||||||
Nomura Real Estate Office Fund, Inc. (REIT) | 19 | 88,225 | ||||||
Nomura Research Institute Ltd. | 6,288 | 197,937 | ||||||
NSK Ltd. | 29,970 | 372,242 | ||||||
NTT Data Corp. | 8,000 | 294,749 | ||||||
NTT DOCOMO, Inc. | 96,800 | 1,585,604 | ||||||
NTT Urban Development Corp. | 6,600 | 75,771 | ||||||
Obayashi Corp. | 40,666 | 231,307 | ||||||
Obic Co., Ltd. | 102,400 | 3,019,200 | ||||||
Odakyu Electric Railway Co., Ltd. | 40,103 | 362,149 | ||||||
Oji Holdings Corp. | 49,612 | 253,925 | ||||||
Olympus Corp.* | 14,952 | 472,796 | ||||||
Omron Corp. | 13,044 | 575,343 | ||||||
Ono Pharmaceutical Co., Ltd. | 5,275 | 461,331 | ||||||
Oracle Corp. Japan | 2,540 | 92,739 | ||||||
Oriental Land Co., Ltd. | 3,186 | 458,946 | ||||||
ORIX Corp. | 79,510 | 1,394,502 | ||||||
Osaka Gas Co., Ltd. | 119,868 | 470,093 | ||||||
Otsuka Corp. | 1,139 | 145,038 | ||||||
Otsuka Holdings Co., Ltd. | 23,200 | 669,718 | ||||||
Panasonic Corp. | 139,186 | 1,617,735 | ||||||
Park24 Co., Ltd. | 6,700 | 126,162 | ||||||
Rakuten, Inc. | 46,500 | 690,590 | ||||||
Resona Holdings, Inc. | 120,902 | 615,359 | ||||||
Ricoh Co., Ltd. | 43,480 | 461,596 | ||||||
Rinnai Corp. | 2,084 | $ | 162,073 | |||||
Rohm Co., Ltd. | 6,126 | 297,836 | ||||||
Sankyo Co., Ltd. | 3,398 | 156,493 | ||||||
Sanrio Co., Ltd. | 2,600 | 109,249 | ||||||
Santen Pharmaceutical Co., Ltd. | 29,931 | 1,394,089 | ||||||
SBI Holdings, Inc. | 13,030 | 196,731 | ||||||
Secom Co., Ltd. | 13,427 | 808,348 | ||||||
Sega Sammy Holdings, Inc. | 11,775 | 299,323 | ||||||
Sekisui Chemical Co., Ltd. | 27,214 | 333,359 | ||||||
Sekisui House Ltd. | 32,970 | 460,221 | ||||||
Seven & I Holdings Co., Ltd. | 47,712 | 1,893,801 | ||||||
Seven Bank Ltd. | 36,800 | 143,622 | ||||||
Sharp Corp.* | 88,938 | 282,075 | ||||||
Shikoku Electric Power Co., Inc.* | 11,543 | 172,635 | ||||||
Shimadzu Corp. | 15,140 | 131,546 | ||||||
Shimamura Co., Ltd. | 1,546 | 144,749 | ||||||
Shimano, Inc. | 5,036 | 431,821 | ||||||
Shimizu Corp. | 38,910 | 196,194 | ||||||
Shin-Etsu Chemical Co., Ltd. | 26,064 | 1,519,637 | ||||||
Shinsei Bank Ltd. | 107,173 | 261,546 | ||||||
Shionogi & Co., Ltd. | 19,207 | 415,839 | ||||||
Shiseido Co., Ltd. | 23,022 | 369,672 | ||||||
Shizuoka Bank Ltd. | 36,724 | 391,267 | ||||||
Showa Denko KK | 97,382 | 137,783 | ||||||
Showa Shell Sekiyu KK | 12,475 | 126,515 | ||||||
SMC Corp. | 3,248 | 817,320 | ||||||
SoftBank Corp. | 87,372 | 7,632,916 | ||||||
Sojitz Corp. | 75,442 | 133,963 | ||||||
Sony Corp. | 64,564 | 1,119,494 | ||||||
Sony Financial Holdings, Inc. | 10,900 | 198,107 | ||||||
Stanley Electric Co., Ltd. | 8,784 | 200,853 | ||||||
Sumco Corp. | 7,652 | 67,430 | ||||||
Sumitomo Chemical Co., Ltd. | 95,158 | 372,283 | ||||||
Sumitomo Corp. | 72,228 | 906,022 | ||||||
Sumitomo Electric Industries Ltd. | 48,360 | 805,464 | ||||||
Sumitomo Heavy Industries Ltd. | 32,784 | 150,674 | ||||||
Sumitomo Metal Mining Co., Ltd. | 32,784 | 428,673 | ||||||
Sumitomo Mitsui Financial Group, Inc. | 80,468 | 4,141,454 | ||||||
Sumitomo Mitsui Trust Holdings, Inc. | 210,268 | 1,106,148 | ||||||
Sumitomo Realty & Development Co., Ltd. | 22,526 | 1,118,706 | ||||||
Sumitomo Rubber Industries Ltd. | 10,436 | 148,052 | ||||||
Sundrug Co., Ltd. | 41,800 | 1,867,524 | ||||||
Suntory Beverage & Food Ltd. | 7,900 | 251,681 | ||||||
Suruga Bank Ltd. | 11,890 | 212,938 | ||||||
Suzuken Co., Ltd. | 4,306 | 139,226 | ||||||
Suzuki Motor Corp. | 23,436 | 629,352 | ||||||
Sysmex Corp. | 4,500 | 265,359 | ||||||
T&D Holdings, Inc. | 37,068 | 517,072 | ||||||
Taiheiyo Cement Corp. | 75,000 | 287,722 | ||||||
Taisei Corp. | 62,183 | 282,247 | ||||||
Taisho Pharmaceutical Holdings Co., Ltd. | 2,071 | 142,183 | ||||||
Taiyo Nippon Sanso Corp. | 15,392 | 109,327 | ||||||
Takashimaya Co., Ltd. | 15,955 | 158,626 | ||||||
Takeda Pharmaceutical Co., Ltd. | 50,223 | 2,301,073 | ||||||
TDK Corp. | 7,871 | 376,696 | ||||||
Teijin Ltd. | 56,250 | 124,988 | ||||||
Terumo Corp. | 9,750 | 469,400 | ||||||
See Notes to Financial Statements.
12
EQ ADVISORS TRUST
EQ/INTERNATIONAL CORE PLUS PORTFOLIO
PORTFOLIO OF INVESTMENTS (Continued)
December 31, 2013
| Number of Shares | Value (Note 1) | |||||||
THK Co., Ltd. | 7,208 | $ | 179,601 | |||||
Tobu Railway Co., Ltd. | 65,991 | 319,584 | ||||||
Toho Co., Ltd. | 7,546 | 165,738 | ||||||
Toho Gas Co., Ltd. | 24,592 | 119,562 | ||||||
Tohoku Electric Power Co., Inc.* | 28,559 | 320,818 | ||||||
Tokio Marine Holdings, Inc. | 43,915 | 1,465,779 | ||||||
Tokyo Electric Power Co., Inc.* | 93,058 | 456,851 | ||||||
Tokyo Electron Ltd. | 10,936 | 598,152 | ||||||
Tokyo Gas Co., Ltd. | 148,711 | 731,481 | ||||||
Tokyo Tatemono Co., Ltd. | 26,000 | 288,368 | ||||||
Tokyu Corp. | 72,011 | 465,668 | ||||||
Tokyu Fudosan Holdings Corp.* | 32,292 | 303,571 | ||||||
TonenGeneral Sekiyu KK | 18,830 | 172,547 | ||||||
Toppan Printing Co., Ltd. | 37,910 | 302,747 | ||||||
Toray Industries, Inc. | 91,774 | 634,427 | ||||||
Toshiba Corp. | 257,683 | 1,081,530 | ||||||
TOTO Ltd. | 19,267 | 304,986 | ||||||
Toyo Seikan Kaisha Ltd. | 10,304 | 221,031 | ||||||
Toyo Suisan Kaisha Ltd. | 5,756 | 172,718 | ||||||
Toyoda Gosei Co., Ltd. | 4,442 | 103,215 | ||||||
Toyota Boshoku Corp. | 4,492 | 56,006 | ||||||
Toyota Industries Corp. | 10,418 | 469,409 | ||||||
Toyota Motor Corp. | 209,336 | 12,761,724 | ||||||
Toyota Tsusho Corp. | 13,614 | 336,504 | ||||||
Trend Micro, Inc. | 6,582 | 230,004 | ||||||
Tsumura & Co. | 3,904 | 103,355 | ||||||
Ube Industries Ltd. | 60,123 | 128,456 | ||||||
Unicharm Corp. | 48,794 | 2,780,021 | ||||||
United Urban Investment Corp. (REIT) | 146 | 209,760 | ||||||
USS Co., Ltd. | 13,610 | 186,619 | ||||||
West Japan Railway Co. | 10,800 | 467,648 | ||||||
Yahoo! Japan Corp. | 688,600 | 3,825,192 | ||||||
Yakult Honsha Co., Ltd. | 5,507 | 277,677 | ||||||
Yamada Denki Co., Ltd. | 59,420 | 194,098 | ||||||
Yamaguchi Financial Group, Inc. | 14,763 | 136,541 | ||||||
Yamaha Corp. | 10,479 | 166,076 | ||||||
Yamaha Motor Co., Ltd. | 17,532 | 262,539 | ||||||
Yamato Holdings Co., Ltd. | 23,036 | 465,051 | ||||||
Yamato Kogyo Co., Ltd | 2,754 | 87,869 | ||||||
Yamazaki Baking Co., Ltd. | 5,571 | 57,080 | ||||||
Yaskawa Electric Corp. | 14,140 | 223,291 | ||||||
Yokogawa Electric Corp. | 13,703 | 210,145 | ||||||
Yokohama Rubber Co., Ltd. | 13,000 | 127,519 | ||||||
|
| |||||||
| 211,113,924 | ||||||||
|
| |||||||
Luxembourg (0.7%) | ||||||||
ArcelorMittal S.A. | 63,901 | 1,140,175 | ||||||
Millicom International Cellular S.A. (SDR) | 4,044 | 402,712 | ||||||
RTL Gorup S.A. | 2,190 | 282,991 | ||||||
SES S.A. (FDR) | 19,477 | 630,475 | ||||||
Tenaris S.A. | 30,269 | 661,260 | ||||||
Tenaris S.A. (ADR) | 246,195 | 10,756,259 | ||||||
|
| |||||||
| 13,873,872 | ||||||||
|
| |||||||
Macau (0.2%) | ||||||||
MGM China Holdings Ltd. | 64,800 | 276,605 | ||||||
Sands China Ltd. | 431,719 | 3,526,998 | ||||||
Wynn Macau Ltd. | 99,200 | 449,670 | ||||||
|
| |||||||
| 4,253,273 | ||||||||
|
| |||||||
Mexico (0.0%) | ||||||||
Fresnillo plc | 11,493 | $ | 141,882 | |||||
|
| |||||||
Netherlands (2.8%) | ||||||||
Aegon N.V. | 113,767 | 1,073,967 | ||||||
Akzo Nobel N.V. | 44,572 | 3,454,639 | ||||||
ASML Holding N.V. | 22,729 | 2,127,494 | ||||||
Core Laboratories N.V. | 51,400 | 9,814,830 | ||||||
Corio N.V. (REIT) | 4,400 | 197,179 | ||||||
Delta Lloyd N.V. | 11,498 | 285,353 | ||||||
Fugro N.V. (CVA) | 4,383 | 261,176 | ||||||
Gemalto N.V. | 5,078 | 558,934 | ||||||
Heineken Holding N.V. | 6,462 | 408,796 | ||||||
Heineken N.V. | 55,524 | 3,748,945 | ||||||
ING Groep N.V. (CVA)* | 243,902 | 3,388,913 | ||||||
Koninklijke (Royal) KPN N.V.* | 205,282 | 661,678 | ||||||
Koninklijke Ahold N.V. | 63,167 | 1,134,030 | ||||||
Koninklijke Boskalis Westminster N.V. | 4,874 | 257,512 | ||||||
Koninklijke DSM N.V. | 9,885 | 777,307 | ||||||
Koninklijke Philips N.V. | 61,550 | 2,256,148 | ||||||
Koninklijke Vopak N.V | 4,507 | 263,636 | ||||||
OCI* | 5,777 | 260,159 | ||||||
QIAGEN N.V.* | 15,156 | 353,097 | ||||||
Randstad Holding N.V. | 7,720 | 500,752 | ||||||
Reed Elsevier N.V. | 44,171 | 935,797 | ||||||
Royal Dutch Shell plc, Class A | 240,828 | 8,626,025 | ||||||
Royal Dutch Shell plc, Class B | 159,217 | 6,011,343 | ||||||
TNT Express N.V. | 22,881 | 212,409 | ||||||
Unilever N.V. (N.Y. Shares) | 61,315 | 2,466,703 | ||||||
Unilever N.V. (CVA) | 102,762 | 4,138,598 | ||||||
Wolters Kluwer N.V. | 19,351 | 552,256 | ||||||
Ziggo N.V. | 9,588 | 437,915 | ||||||
|
| |||||||
| 55,165,591 | ||||||||
|
| |||||||
New Zealand (0.1%) | ||||||||
Auckland International Airport Ltd. | 64,786 | 188,078 | ||||||
Contact Energy Ltd. | 24,133 | 101,815 | ||||||
Fletcher Building Ltd. | 43,852 | 306,904 | ||||||
Ryman Healthcare Ltd. | 19,057 | 123,029 | ||||||
Telecom Corp. of New Zealand Ltd. | 116,409 | 220,669 | ||||||
|
| |||||||
| 940,495 | ||||||||
|
| |||||||
Norway (0.3%) | ||||||||
Aker Solutions ASA | 10,260 | 183,368 | ||||||
DNB ASA | 62,644 | 1,120,616 | ||||||
Gjensidige Forsikring ASA | 12,461 | 237,703 | ||||||
Norsk Hydro ASA | 79,572 | 355,137 | ||||||
Orkla ASA | 48,985 | 382,169 | ||||||
Statoil ASA | 69,782 | 1,691,253 | ||||||
Telenor ASA | 43,797 | 1,044,144 | ||||||
Yara International ASA | 11,841 | 509,538 | ||||||
Yara International ASA (ADR) | 5,000 | 214,650 | ||||||
|
| |||||||
| 5,738,578 | ||||||||
|
| |||||||
Panama (0.2%) | ||||||||
Copa Holdings S.A., Class A | 27,125 | 4,342,984 | ||||||
|
| |||||||
Peru (0.2%) | ||||||||
Credicorp Ltd. | 26,852 | 3,564,066 | ||||||
|
| |||||||
See Notes to Financial Statements.
13
EQ ADVISORS TRUST
EQ/INTERNATIONAL CORE PLUS PORTFOLIO
PORTFOLIO OF INVESTMENTS (Continued)
December 31, 2013
| Number of Shares | Value (Note 1) | |||||||
Portugal (0.1%) | ||||||||
Banco Espirito Santo S.A. (Registered)* | 113,889 | $ | 162,787 | |||||
EDP - Energias de Portugal S.A. | 129,130 | 474,310 | ||||||
Galp Energia SGPS S.A., Class B | 21,762 | 356,711 | ||||||
Jeronimo Martins SGPS S.A. | 70,572 | 1,380,076 | ||||||
Portugal Telecom SGPS S.A. (Registered) | 40,099 | 174,319 | ||||||
|
| |||||||
| 2,548,203 | ||||||||
|
| |||||||
Russia (0.1%) | ||||||||
Sberbank of Russia (ADR) | 140,550 | 1,766,714 | ||||||
|
| |||||||
Singapore (0.6%) | ||||||||
Ascendas Real Estate Investment Trust (REIT) | 131,522 | 229,287 | ||||||
CapitaCommercial Trust (REIT) | 124,000 | 142,478 | ||||||
CapitaLand Ltd. | 163,502 | 392,576 | ||||||
CapitaMall Trust (REIT) | 151,267 | 228,348 | ||||||
CapitaMalls Asia Ltd. | 80,421 | 124,906 | ||||||
City Developments Ltd. | 26,280 | 199,919 | ||||||
ComfortDelGro Corp., Ltd. | 128,550 | 204,751 | ||||||
DBS Group Holdings Ltd. | 108,860 | 1,475,103 | ||||||
Genting Singapore plc | 392,261 | 464,702 | ||||||
Global Logistic Properties Ltd. | 197,000 | 451,151 | ||||||
Golden Agri-Resources Ltd. | 466,537 | 201,484 | ||||||
Hutchison Port Holdings Trust, | 335,000 | 226,125 | ||||||
Jardine Cycle & Carriage Ltd. | 6,449 | 183,717 | ||||||
Keppel Corp., Ltd. | 91,685 | 812,992 | ||||||
Keppel Land Ltd. | 44,000 | 116,455 | ||||||
Olam International Ltd. | 94,924 | 115,463 | ||||||
Oversea-Chinese Banking Corp., Ltd. | 163,922 | 1,324,937 | ||||||
Sembcorp Industries Ltd. | 62,812 | 273,258 | ||||||
Sembcorp Marine Ltd. | 51,626 | 182,048 | ||||||
Singapore Airlines Ltd. | 34,682 | 286,097 | ||||||
Singapore Exchange Ltd. | 64,302 | 369,929 | ||||||
Singapore Press Holdings Ltd. | 67,523 | 220,448 | ||||||
Singapore Technologies Engineering Ltd. | 99,019 | 310,722 | ||||||
Singapore Telecommunications Ltd. | 506,119 | 1,467,883 | ||||||
StarHub Ltd. | 39,724 | 135,042 | ||||||
United Overseas Bank Ltd. | 80,826 | 1,360,390 | ||||||
UOL Group Ltd. | 27,532 | 135,047 | ||||||
Wilmar International Ltd. | 123,455 | 334,574 | ||||||
|
| |||||||
| 11,969,832 | ||||||||
|
| |||||||
South Korea (0.3%) | ||||||||
NAVER Corp.* | 2,877 | 1,973,704 | ||||||
Samsung Electronics Co., Ltd. | 2,511 | 3,264,407 | ||||||
|
| |||||||
| 5,238,111 | ||||||||
|
| |||||||
Spain (1.6%) | ||||||||
Abertis Infraestructuras S.A. | 24,678 | 548,285 | ||||||
ACS Actividades de Construccion y Servicios S.A. | 9,392 | 323,273 | ||||||
Amadeus IT Holding S.A., Class A . | 47,909 | 2,050,081 | ||||||
Banco Bilbao Vizcaya Argentaria S.A. | 365,519 | 4,499,453 | ||||||
Banco de Sabadell S.A. | 213,310 | 556,382 | ||||||
Banco Popular Espanol S.A.* | 80,366 | $ | 484,803 | |||||
Banco Santander S.A | 720,675 | 6,450,261 | ||||||
Bankia S.A.* | 256,647 | 435,687 | ||||||
CaixaBank S.A. | 108,119 | 563,424 | ||||||
Distribuidora Internacional de Alimentacion S.A. | 39,166 | 350,224 | ||||||
Enagas S.A. | 12,242 | 319,901 | ||||||
Ferrovial S.A. | 25,860 | 500,371 | ||||||
Gas Natural SDG S.A. | 22,451 | 577,411 | ||||||
Grifols S.A. | 9,560 | 457,219 | ||||||
Iberdrola S.A. | 295,650 | 1,885,174 | ||||||
Inditex S.A. | 32,927 | 5,426,661 | ||||||
Mapfre S.A | 63,293 | 271,056 | ||||||
Red Electrica Corporacion S.A. | 6,937 | 462,847 | ||||||
Repsol S.A. | 53,356 | 1,344,722 | ||||||
Telefonica S.A. | 259,551 | 4,225,856 | ||||||
Zardoya Otis S.A. | 10,680 | 193,206 | ||||||
|
| |||||||
| 31,926,297 | ||||||||
|
| |||||||
Sweden (1.5%) | ||||||||
Alfa Laval AB | 20,012 | 513,380 | ||||||
Assa Abloy AB, Class B | 21,416 | 1,131,425 | ||||||
Atlas Copco AB, Class A | 41,633 | 1,154,126 | ||||||
Atlas Copco AB, Class B | 25,013 | 634,673 | ||||||
Boliden AB | 17,532 | 268,356 | ||||||
Electrolux AB | 15,420 | 403,969 | ||||||
Elekta AB, Class B | 23,625 | 361,252 | ||||||
Getinge AB, Class B | 12,829 | 438,813 | ||||||
Hennes & Mauritz AB, Class B | 59,802 | 2,754,006 | ||||||
Hexagon AB, Class B | 15,178 | 479,751 | ||||||
Husqvarna AB, Class B | 24,374 | 146,733 | ||||||
Industrivarden AB, Class C | 7,832 | 148,924 | ||||||
Investment AB Kinnevik, Class B | 13,922 | 644,817 | ||||||
Investor AB, Class B | 29,196 | 1,004,544 | ||||||
Lundin Petroleum AB* | 14,264 | 278,101 | ||||||
Nordea Bank AB | 187,398 | 2,524,629 | ||||||
Sandvik AB | 67,985 | 958,704 | ||||||
Scania AB, Class B | 20,512 | 401,511 | �� | |||||
Securitas AB, Class B | 19,382 | 205,969 | ||||||
Skandinaviska Enskilda Banken AB, Class A | 96,858 | 1,277,013 | ||||||
Skanska AB, Class B | 24,355 | 497,562 | ||||||
SKF AB, Class B | 25,132 | 659,183 | ||||||
Svenska Cellulosa AB S.C.A., Class B | 37,271 | 1,147,362 | ||||||
Svenska Handelsbanken AB, Class A | 31,853 | 1,564,954 | ||||||
Swedbank AB, Class A | 57,751 | 1,625,183 | ||||||
Swedish Match AB | 13,205 | 424,368 | ||||||
Tele2 AB, Class B | 20,387 | 230,912 | ||||||
Telefonaktiebolaget LM Ericsson, Class B | 423,625 | 5,170,295 | ||||||
TeliaSonera AB | 151,858 | 1,264,332 | ||||||
Volvo AB, Class B | 95,427 | 1,252,954 | ||||||
|
| |||||||
| 29,567,801 | ||||||||
|
| |||||||
Switzerland (7.6%) | ||||||||
ABB Ltd. (Registered)* | 138,908 | 3,656,252 | ||||||
Actelion Ltd. (Registered)* | 6,494 | 548,538 | ||||||
Adecco S.A. (Registered)* | 8,492 | 672,087 | ||||||
Aryzta AG* | 5,591 | 428,703 | ||||||
Baloise Holding AG (Registered) | 3,026 | 385,352 | ||||||
See Notes to Financial Statements.
14
EQ ADVISORS TRUST
EQ/INTERNATIONAL CORE PLUS PORTFOLIO
PORTFOLIO OF INVESTMENTS (Continued)
December 31, 2013
| Number of Shares | Value (Note 1) | |||||||
Barry Callebaut AG (Registered)* | 117 | $ | 146,635 | |||||
Cie Financiere Richemont S.A. (Registered), Class A | 62,682 | 6,239,742 | ||||||
Coca-Cola HBC AG (ADR) | 8,416 | 245,495 | ||||||
Coca-Cola HBC AG (CDI)* | 4,506 | 131,475 | ||||||
Credit Suisse Group AG (Registered)* | 95,558 | 2,921,212 | ||||||
EMS-Chemie Holding AG (Registered) | 503 | 178,747 | ||||||
Geberit AG (Registered)* | 2,380 | 721,697 | ||||||
Givaudan S.A. (Registered)* | 533 | 761,215 | ||||||
Glencore Xstrata plc* | 659,748 | 3,416,278 | ||||||
Holcim Ltd. (Registered)* | 14,677 | 1,098,245 | ||||||
Julius Baer Group Ltd.* | 72,892 | 3,500,581 | ||||||
Kuehne + Nagel International AG (Registered) | 16,674 | 2,188,807 | ||||||
Lindt & Spruengli AG | 54 | 243,410 | ||||||
Lindt & Spruengli AG (Registered) | 7 | 377,445 | ||||||
Lonza Group AG (Registered)* | 3,300 | 312,965 | ||||||
Nestle S.A. (Registered) | 397,470 | 29,095,668 | ||||||
Nestle S.A. (Registered) (ADR) | 120,470 | 8,865,387 | ||||||
Novartis AG (Registered) | 170,353 | 13,596,921 | ||||||
Novartis AG (ADR) | 112,876 | 9,072,973 | ||||||
Pargesa Holding S.A. | 1,798 | 144,920 | ||||||
Partners Group Holding AG | 1,111 | 296,292 | ||||||
Roche Holding AG | 61,596 | 17,207,245 | ||||||
Schindler Holding AG | 14,703 | 2,164,121 | ||||||
Schindler Holding AG (Registered) | 1,120 | 165,228 | ||||||
SGS S.A. (Registered) | 351 | 807,412 | ||||||
Sika AG | 138 | 490,553 | ||||||
Sonova Holding AG (Registered)* | 32,908 | 4,426,837 | ||||||
STMicroelectronics N.V. | 40,856 | 328,241 | ||||||
Sulzer AG (Registered) | 1,527 | 246,326 | ||||||
Swatch Group AG | 1,977 | 1,306,476 | ||||||
Swatch Group AG (Registered) | 2,782 | 313,113 | ||||||
Swiss Life Holding AG (Registered)* | 2,073 | 430,379 | ||||||
Swiss Prime Site AG | 3,444 | 266,586 | ||||||
Swiss Reinsurance AG* | 22,369 | 2,057,482 | ||||||
Swisscom AG (Registered) | 1,494 | 788,661 | ||||||
Syngenta AG (Registered) | 5,865 | 2,335,349 | ||||||
Syngenta AG (ADR) | 18,584 | 1,485,605 | ||||||
Transocean Ltd. | 22,527 | 1,096,993 | ||||||
UBS AG (Registered)* | 388,093 | 7,361,172 | ||||||
Weatherford International Ltd.* | 817,491 | 12,662,936 | ||||||
Wolseley plc | 16,996 | 963,950 | ||||||
Zurich Insurance Group AG* | 9,368 | 2,714,678 | ||||||
|
| |||||||
| 148,866,385 | ||||||||
|
| |||||||
Taiwan (0.3%) | ||||||||
Taiwan Semiconductor Manufacturing Co., Ltd. (ADR) | 298,851 | 5,211,961 | ||||||
|
| |||||||
United Kingdom (14.1%) | ||||||||
3i Group plc | 62,034 | 395,595 | ||||||
Aberdeen Asset Management plc | 236,093 | 1,954,791 | ||||||
Admiral Group plc | 11,871 | 257,517 | ||||||
Aggreko plc | 17,205 | 486,905 | ||||||
AMEC plc | 19,305 | 347,813 | ||||||
Anglo American plc | 88,562 | 1,935,836 | ||||||
Antofagasta plc | 25,278 | $ | 344,919 | |||||
ARM Holdings plc | 88,807 | 1,616,189 | ||||||
Associated British Foods plc | 22,836 | 924,583 | ||||||
AstraZeneca plc | 79,592 | 4,711,204 | ||||||
Aviva plc | 188,818 | 1,406,091 | ||||||
Babcock International Group plc | 23,093 | 518,164 | ||||||
BAE Systems plc | 205,890 | 1,483,104 | ||||||
Barclays plc | 974,136 | 4,386,881 | ||||||
Bellway plc | 45,695 | 1,187,998 | ||||||
BG Group plc | 425,832 | 9,149,406 | ||||||
BHP Billiton plc | 134,628 | 4,166,697 | ||||||
BP plc | 1,193,688 | 9,647,224 | ||||||
British American Tobacco plc | 261,134 | 14,001,917 | ||||||
British Land Co. plc (REIT) | 59,737 | 622,216 | ||||||
British Sky Broadcasting Group plc | 66,594 | 930,732 | ||||||
BT Group plc | 501,852 | 3,152,973 | ||||||
Bunzl plc | 21,285 | 511,080 | ||||||
Burberry Group plc | 65,498 | 1,644,275 | ||||||
Capita plc | 266,441 | 4,579,791 | ||||||
Carnival plc | 11,714 | 485,139 | ||||||
Centrica plc | 326,151 | 1,877,892 | ||||||
CNH Industrial N.V.* | 57,744 | 658,147 | ||||||
Cobham plc | 68,418 | 311,000 | ||||||
Compass Group plc | 591,913 | 9,488,126 | ||||||
Croda International plc | 58,218 | 2,368,698 | ||||||
Diageo plc | 663,272 | 21,966,906 | ||||||
Diageo plc (ADR) | 42,038 | 5,566,672 | ||||||
Direct Line Insurance Group plc | 52,510 | 217,037 | ||||||
easyJet plc | 10,095 | 256,770 | ||||||
Ensco plc, Class A | 16,550 | 946,329 | ||||||
G4S plc | 90,423 | 393,057 | ||||||
GKN plc | 104,570 | 646,416 | ||||||
GlaxoSmithKline plc | 310,907 | 8,296,751 | ||||||
Hammerson plc (REIT) | 45,692 | 379,832 | ||||||
Hargreaves Lansdown plc | 13,410 | 300,673 | ||||||
HSBC Holdings plc | 1,429,576 | 15,681,038 | ||||||
ICAP plc | 34,056 | 254,680 | ||||||
IMI plc | 20,611 | 520,494 | ||||||
Imperial Tobacco Group plc | 61,621 | 2,385,725 | ||||||
Inmarsat plc | 28,581 | 357,805 | ||||||
InterContinental Hotels Group plc | 17,230 | 574,350 | ||||||
International Consolidated Airlines Group S.A.* | 61,871 | 411,876 | ||||||
Intertek Group plc | 47,694 | 2,486,255 | ||||||
Intu Properties plc (REIT) | 42,550 | 218,358 | ||||||
Invensys plc | 41,513 | 349,560 | ||||||
Investec plc | 37,008 | 268,176 | ||||||
ITV plc | 238,205 | 765,244 | ||||||
J Sainsbury plc | 78,683 | 475,577 | ||||||
Johnson Matthey plc | 13,135 | 713,430 | ||||||
Kingfisher plc | 151,951 | 967,995 | ||||||
Land Securities Group plc (REIT) | 50,020 | 798,073 | ||||||
Legal & General Group plc | 378,977 | 1,397,592 | ||||||
Lloyds Banking Group plc* | 3,114,949 | 4,068,788 | ||||||
London Stock Exchange Group plc | 11,094 | 318,371 | ||||||
Marks & Spencer Group plc | 103,203 | 739,309 | ||||||
Meggitt plc | 50,320 | 439,552 | ||||||
Melrose Industries plc | 82,314 | 416,693 | ||||||
National Grid plc | 233,803 | 3,050,869 | ||||||
Next plc | 10,338 | 932,997 | ||||||
See Notes to Financial Statements.
15
EQ ADVISORS TRUST
EQ/INTERNATIONAL CORE PLUS PORTFOLIO
PORTFOLIO OF INVESTMENTS (Continued)
December 31, 2013
| Number of Shares | Value (Note 1) | |||||||
Noble Corp. plc | 476,782 | $ | 17,865,021 | |||||
Old Mutual plc | 313,638 | 982,126 | ||||||
Pearson plc | 52,382 | 1,163,210 | ||||||
Persimmon plc* | 19,303 | 396,044 | ||||||
Petrofac Ltd. | 16,629 | 337,050 | ||||||
Prudential plc | 163,046 | 3,617,947 | ||||||
Randgold Resources Ltd. | 5,604 | 351,710 | ||||||
Reckitt Benckiser Group plc | 101,725 | 8,073,881 | ||||||
Reed Elsevier plc | 75,497 | 1,123,923 | ||||||
Resolution Ltd. | 90,901 | 532,867 | ||||||
Rexam plc | 50,653 | 444,977 | ||||||
Rio Tinto plc | 332,688 | 18,783,437 | ||||||
Rio Tinto plc (ADR) | 120,653 | 6,808,449 | ||||||
Rolls-Royce Holdings plc* | 322,195 | 6,802,620 | ||||||
Rolls-Royce Holdings plc (Preference)*(b)† | 29,785,756 | 49,324 | ||||||
Royal Bank of Scotland Group plc* | 136,250 | 762,832 | ||||||
RSA Insurance Group plc | 230,334 | 348,619 | ||||||
SABMiller plc | 61,099 | 3,137,495 | ||||||
Sage Group plc | 70,794 | 473,263 | ||||||
Schroders plc | 6,424 | 276,371 | ||||||
Segro plc (REIT) | 46,877 | 259,271 | ||||||
Serco Group plc | 31,953 | 264,140 | ||||||
Severn Trent plc | 15,278 | 431,358 | ||||||
Smith & Nephew plc | 57,910 | 825,665 | ||||||
Smiths Group plc | 25,202 | 617,652 | ||||||
SSE plc | 60,821 | 1,379,817 | ||||||
Standard Chartered plc | 303,171 | 6,827,690 | ||||||
Standard Life plc | 151,148 | 900,056 | ||||||
Subsea 7 S.A. | 16,775 | 321,102 | ||||||
Tate & Lyle plc | 29,884 | 400,345 | ||||||
Tesco plc | 513,173 | 2,841,269 | ||||||
Travis Perkins plc | 15,608 | 483,838 | ||||||
TUI Travel plc | 27,743 | 189,782 | ||||||
Tullow Oil plc | 58,183 | 823,777 | ||||||
Unilever plc | 81,839 | 3,363,638 | ||||||
United Utilities Group plc | 43,709 | 486,031 | ||||||
Vodafone Group plc | 3,074,495 | 12,066,168 | ||||||
Weir Group plc | 112,150 | 3,959,439 | ||||||
Whitbread plc | 54,319 | 3,374,008 | ||||||
William Hill plc | 54,981 | 365,913 | ||||||
WM Morrison Supermarkets plc | 139,375 | 602,383 | ||||||
WPP plc | 84,604 | 1,933,380 | ||||||
|
| |||||||
| 278,164,041 | ||||||||
|
| |||||||
United States (1.4%) | ||||||||
Bunge Ltd. | 29,718 | 2,440,145 | ||||||
Mettler-Toledo International, | 13,138 | 3,187,148 | ||||||
Perrigo Co. plc | — | # | 50 | |||||
Schlumberger Ltd. | 252,844 | 22,783,773 | ||||||
|
| |||||||
| 28,411,116 | ||||||||
|
| |||||||
Total Common Stocks (72.3%) | 1,425,314,354 | |||||||
|
| |||||||
INVESTMENT COMPANIES: | ||||||||
Exchange Traded Funds(ETFs) (7.0%) |
| |||||||
iShares® China Large-Cap ETF | 110,910 | 4,253,399 | ||||||
iShares® Europe ETF | 335,566 | 15,922,607 | ||||||
iShares® Latin America 40 ETF | 33,047 | 1,224,061 | ||||||
iShares® MSCI Australia ETF | 95,215 | $ | 2,320,390 | |||||
iShares® MSCI Austria Capped ETF | 131,337 | 2,601,786 | ||||||
iShares® MSCI Belgium Capped ETF | 68,797 | 1,127,576 | ||||||
iShares® MSCI BRIC ETF | 68,616 | 2,586,137 | ||||||
iShares® MSCI Canada ETF | 47,158 | 1,375,127 | ||||||
iShares® MSCI EAFE ETF | 515,466 | 34,567,150 | ||||||
iShares® MSCI EAFE Small-Cap ETF | 55,100 | 2,808,998 | ||||||
iShares® MSCI Emerging Markets ETF | 64,132 | 2,678,794 | ||||||
iShares® MSCI France ETF | 165,867 | 4,718,916 | ||||||
iShares® MSCI Germany ETF | 286,710 | 9,105,910 | ||||||
iShares® MSCI Hong Kong ETF | 21,077 | 434,186 | ||||||
iShares® MSCI Indonesia ETF | 21,400 | 488,776 | ||||||
iShares® MSCI Ireland Capped ETF | 11,600 | 415,860 | ||||||
iShares® MSCI Israel Capped ETF | 19,400 | 935,468 | ||||||
iShares® MSCI Italy Capped ETF | 354,948 | 5,533,639 | ||||||
iShares® MSCI Japan ETF | 819,380 | 9,939,079 | ||||||
iShares® MSCI Malaysia ETF | 20,262 | 320,545 | ||||||
iShares® MSCI Mexico Capped ETF | 9,348 | 635,664 | ||||||
iShares® MSCI Netherlands ETF | 88,693 | 2,299,809 | ||||||
iShares® MSCI New Zealand Capped ETF | 39,400 | 1,471,984 | ||||||
iShares® MSCI Pacific ex-Japan ETF | 119,192 | 5,569,842 | ||||||
iShares® MSCI Poland Capped ETF | 7,700 | 228,536 | ||||||
iShares® MSCI Singapore ETF | 58,226 | 766,836 | ||||||
iShares® MSCI South Korea Capped ETF | 6,000 | 388,020 | ||||||
iShares® MSCI Spain Capped ETF | 65,421 | 2,523,288 | ||||||
iShares® MSCI Sweden ETF | 49,603 | 1,777,276 | ||||||
iShares® MSCI Switzerland Capped ETF | 24,200 | 798,358 | ||||||
iShares® MSCI Thailand Capped ETF | 5,568 | 382,243 | ||||||
iShares® MSCI Turkey ETF | 11,984 | 571,157 | ||||||
iShares® MSCI United Kingdom ETF | 66,400 | 1,386,432 | ||||||
SPDR® DJ EURO Stoxx 50 ETF | 40,364 | 1,703,361 | ||||||
SPDR® S&P Emerging Asia Pacific ETF | 36,279 | 2,798,925 | ||||||
SPDR® S&P Emerging Europe ETF | 11,967 | 481,660 | ||||||
Vanguard FTSE Developed Markets ETF | 174,400 | 7,268,992 | ||||||
Vanguard FTSE Emerging Markets ETF | 15,200 | 625,328 | ||||||
Vanguard FTSE Europe ETF | 33,800 | 1,987,440 | ||||||
Vanguard FTSE Pacific ETF | 9,600 | 588,480 | ||||||
|
| |||||||
Total Investment Companies (7.0%) | 137,612,035 | |||||||
|
| |||||||
See Notes to Financial Statements.
16
EQ ADVISORS TRUST
EQ/INTERNATIONAL CORE PLUS PORTFOLIO
PORTFOLIO OF INVESTMENTS (Continued)
December 31, 2013
| Number of Rights | Value (Note 1) | |||||||
RIGHTS: | ||||||||
Spain (0.0%) | ||||||||
Repsol S.A., expiring 1/9/14* | 53,356 | $ | 36,407 | |||||
|
| |||||||
Total Investments (79.3%) | 1,562,962,796 | |||||||
Other Assets Less Liabilities (20.7%) | 408,483,617 | |||||||
|
| |||||||
Net Assets (100%) | $ | 1,971,446,413 | ||||||
|
| |||||||
| * | Non-income producing. |
| # | Number of shares is less than 0.50. |
| † | Securities (totaling $49,324 or 0.0% of net assets) at fair value by management. |
| ‡ | Affiliated company as defined under the Investment Company Act of 1940. |
| (b) | Illiquid security. |
Glossary:
| ADR | — American Depositary Receipt |
| CDI | — CHESS Depositary Interest |
| CVA | — Dutch Certification |
| FDR | — Finnish Depositary Receipt |
| REIT — | Real Estate Investment Trust |
| RNC | — Risparmio Non-Convertible Savings Shares |
| SDR | — Swedish Certification |
Investments in companies which were affiliates for the year ended December 31, 2013, were as follows:
Securities | Value December 31, 2012 | Purchases at Cost | Sales at Cost | Value December 31, 2013 | Dividend Income | Realized Gain (Loss) | ||||||||||||||||||
AXA S.A. | $ | 1,446,113 | $ | 784,794 | $ | 123,267 | $ | 3,165,832 | $ | 58,883 | $ | (16,811 | ) | |||||||||||
|
|
|
|
|
|
|
|
|
|
|
| |||||||||||||
At December 31, 2013, the Portfolio had the following futures contracts open: (Note 1)
Purchases | Number of Contracts | Expiration Date | Original Value | Value at 12/31/2013 | Unrealized Appreciation/ (Depreciation) | |||||||||||||||
DJ EURO Stoxx 50 Index | 3,922 | March-14 | $ | 159,581,564 | $ | 167,691,999 | $ | 8,110,435 | ||||||||||||
FTSE 100 Index | 923 | March-14 | 98,632,476 | 102,367,394 | 3,734,918 | |||||||||||||||
SPI 200 Index | 317 | March-14 | 35,883,812 | 37,631,405 | 1,747,593 | |||||||||||||||
TOPIX Index | 810 | March-14 | 96,658,548 | 100,182,793 | 3,524,245 | |||||||||||||||
|
| |||||||||||||||||||
| $ | 17,117,191 | |||||||||||||||||||
|
| |||||||||||||||||||
At December 31, 2013, the Portfolio had outstanding foreign currency contracts to buy/sell foreign currencies as follows: (Note 1)
Foreign Currency Buy Contracts | Counterparty | Local Contract Buy Amount (000’s) | U.S. $ Current Value | U.S. $ Settlement Value | Unrealized Appreciation/ (Depreciation) | |||||||||||||
Australian Dollar vs. U.S. Dollar, | BNP Paribas | 2,300 | $ | 2,044,324 | $ | 2,073,224 | $ | (28,900 | ) | |||||||||
British Pound vs. U.S. Dollar, | JPMorgan Chase Bank | 7,000 | 11,585,980 | 11,458,783 | 127,197 | |||||||||||||
European Union Euro vs. U.S. Dollar, | Barclays Bank plc | 10,300 | 14,169,401 | 14,199,333 | (29,932 | ) | ||||||||||||
Japanese Yen vs. U.S. Dollar, expiring 3/14/14 | Goldman Sachs & Co. | 418,000 | 3,970,624 | 4,078,168 | (107,544 | ) | ||||||||||||
|
| |||||||||||||||||
| $ | (39,179 | ) | ||||||||||||||||
|
| |||||||||||||||||
See Notes to Financial Statements.
17
EQ ADVISORS TRUST
EQ/INTERNATIONAL CORE PLUS PORTFOLIO
PORTFOLIO OF INVESTMENTS (Continued)
December 31, 2013
Foreign Currency Sell Contracts | Counterparty | Local Contract Sell Amount (000’s) | U.S. $ Settlement Value | U.S. $ Current Value | Unrealized Appreciation/ (Depreciation) | |||||||||||||
Japanese Yen vs. U.S. Dollar, expiring 1/6/14 | Goldman Sachs & Co. | 3,369 | $ | 32,149 | $ | 31,992 | $ | 157 | ||||||||||
Japanese Yen vs. U.S. Dollar, expiring 1/7/14 | Barclays Bank plc | 4,359 | 41,510 | 41,388 | 122 | |||||||||||||
Japanese Yen vs. U.S. Dollar, expiring 1/8/14 | Deutsche Bank AG | 3,429 | 32,605 | 32,557 | 48 | |||||||||||||
|
| |||||||||||||||||
| 327 | ||||||||||||||||||
|
| |||||||||||||||||
| $ | (38,852 | ) | ||||||||||||||||
|
| |||||||||||||||||
The following is a summary of the inputs used to value the Portfolio’s assets and liabilities carried at fair value as of December 31, 2013:
The inputs or methodology used for valuing securities are not necessarily an indication of the risk associated with investing in those securities.
Various inputs are used in determining the value of the Portfolio’s investments. These inputs are summarized in the three broad levels listed below:
| Investment Type | Level 1 Securities | Level 2 Significant Other Observable Inputs (including quoted prices for similar securities, interest rates, prepayment speeds, credit risk, etc.) | Level 3 Significant Unobservable Inputs (including the Portfolio’s own assumptions in determining the fair value of investments) | Total | ||||||||||||
Assets: | ||||||||||||||||
Common Stocks | ||||||||||||||||
Consumer Discretionary | $ | 4,561,535 | $ | 151,680,590 | $ | — | $ | 156,242,125 | ||||||||
Consumer Staples | 22,117,761 | 172,896,004 | — | 195,013,765 | ||||||||||||
Energy | 110,819,724 | 68,448,672 | — | 179,268,396 | ||||||||||||
Financials | 17,054,037 | 232,738,276 | — | 249,792,313 | ||||||||||||
Health Care | 12,260,171 | 109,813,596 | — | 122,073,767 | ||||||||||||
Industrials | 68,274,760 | 141,260,159 | 49,324 | 209,584,243 | ||||||||||||
Information Technology | 13,244,603 | 58,857,434 | — | 72,102,037 | ||||||||||||
Materials | 31,992,349 | 126,688,965 | — | 158,681,314 | ||||||||||||
Telecommunication Services | — | 53,153,951 | — | 53,153,951 | ||||||||||||
Utilities | — | 29,402,443 | — | 29,402,443 | ||||||||||||
Forward Currency Contracts | — | 127,524 | — | 127,524 | ||||||||||||
Futures | 17,117,191 | — | — | 17,117,191 | ||||||||||||
Investment Companies | ||||||||||||||||
Exchange Traded Funds (ETFs) | 137,612,035 | — | — | 137,612,035 | ||||||||||||
Rights | ||||||||||||||||
Energy | — | 36,407 | — | 36,407 | ||||||||||||
|
|
|
|
|
|
|
| |||||||||
Total Assets | $ | 435,054,166 | $ | 1,145,104,021 | $ | 49,324 | $ | 1,580,207,511 | ||||||||
|
|
|
|
|
|
|
| |||||||||
Liabilities: | ||||||||||||||||
Forward Currency Contracts | $ | — | $ | (166,376 | ) | $ | — | $ | (166,376 | ) | ||||||
|
|
|
|
|
|
|
| |||||||||
Total Liabilities | $ | — | $ | (166,376 | ) | $ | — | $ | (166,376 | ) | ||||||
|
|
|
|
|
|
|
| |||||||||
Total | $ | 435,054,166 | $ | 1,144,937,645 | $ | 49,324 | $ | 1,580,041,135 | ||||||||
|
|
|
|
|
|
|
| |||||||||
There were no transfers between Levels 1, 2 or 3 during the year ended December 31, 2013.
See Notes to Financial Statements.
18
EQ ADVISORS TRUST
EQ/INTERNATIONAL CORE PLUS PORTFOLIO
PORTFOLIO OF INVESTMENTS (Continued)
December 31, 2013
Fair Values of Derivative Instruments as of December 31, 2013:
Statement of Assets and Liabilities | ||||||
Derivatives Not Accounted for as | Asset Derivatives | Fair Value | ||||
Interest rate contracts | Receivables, Net assets - Unrealized appreciation | $ | — | * | ||
Foreign exchange contracts | Receivables | 127,524 | ||||
Credit contracts | Receivables | — | ||||
Equity contracts | Receivables, Net assets - Unrealized appreciation | 17,117,191 | * | |||
Commodity contracts | Receivables | — | ||||
Other contracts | Receivables | — | ||||
|
| |||||
Total | $ | 17,244,715 | ||||
|
| |||||
Liability Derivatives | ||||||
Interest rate contracts | Payables, Net assets - Unrealized depreciation | $ | — | * | ||
Foreign exchange contracts | Payables | (166,376 | ) | |||
Credit contracts | Payables | — | ||||
Equity contracts | Payables, Net assets - Unrealized depreciation | — | * | |||
Commodity contracts | Payables | — | ||||
Other contracts | Payables | — | ||||
|
| |||||
Total | $ | (166,376 | ) | |||
|
| |||||
| * | Includes cumulative appreciation/depreciation of futures contracts as reported in the Portfolio of Investments. Only current day’s variation margin is reported within the Statement of Assets & Liabilities. |
The effect of Derivative Instruments on the Statement of Operations for the year ended December 31, 2013:
| Amount of Realized Gain or (Loss) on Derivatives Recognized in Income | ||||||||||||||||||||
Derivatives Not Accounted for as Hedging Instruments^ | Options | Futures | Forward Currency Contracts | Swaps | Total | |||||||||||||||
Interest rate contracts | $ | — | $ | — | $ | — | $ | — | $ | — | ||||||||||
Foreign exchange contracts | — | — | 1,114,531 | — | 1,114,531 | |||||||||||||||
Credit contracts | — | — | — | — | — | |||||||||||||||
Equity contracts | — | 68,192,885 | — | — | 68,192,885 | |||||||||||||||
Commodity contracts | — | — | — | — | — | |||||||||||||||
Other contracts | — | — | — | — | — | |||||||||||||||
|
|
|
|
|
|
|
|
|
| |||||||||||
Total | $ | — | $ | 68,192,885 | $ | 1,114,531 | $ | — | $ | 69,307,416 | ||||||||||
|
|
|
|
|
|
|
|
|
| |||||||||||
| Amount of Unrealized Appreciation or (Depreciation) on Derivatives Recognized in Income | ||||||||||||||||||||
Derivatives Not Accounted for as Hedging Instruments^ | Options | Futures | Forward Currency Contracts | Swaps | Total | |||||||||||||||
Interest rate contracts | $ | — | $ | — | $ | — | $ | — | $ | — | ||||||||||
Foreign exchange contracts | — | — | (126,899 | ) | — | (126,899 | ) | |||||||||||||
Credit contracts | — | — | — | — | — | |||||||||||||||
Equity contracts | — | 12,555,120 | — | — | 12,555,120 | |||||||||||||||
Commodity contracts | — | — | — | — | — | |||||||||||||||
Other contracts | — | — | — | — | — | |||||||||||||||
|
|
|
|
|
|
|
|
|
| |||||||||||
Total | $ | — | $ | 12,555,120 | $ | (126,899 | ) | $ | — | $ | 12,428,221 | |||||||||
|
|
|
|
|
|
|
|
|
| |||||||||||
^ This Portfolio held forward foreign currency and futures contracts as a substitute for investing in conventional securities, hedging and in an attempt to enhance returns.
See Notes to Financial Statements.
19
EQ ADVISORS TRUST
EQ/INTERNATIONAL CORE PLUS PORTFOLIO
PORTFOLIO OF INVESTMENTS (Continued)
December 31, 2013
The Portfolio held forward foreign currency contracts with an average settlement value of approximately $24,896,000 and futures contracts with an average notional balance of approximately $307,664,000 during the year ended December 31, 2013.
The following table presents the Portfolio’s gross derivative assets and liabilities by counterparty net of amounts available for offset under netting arrangements and any related collateral received or pledged by the Portfolio as of December 31, 2013:
Counterparty | Gross Amount of Derivative Assets Presented in the Statement of Assets and Liabilities (a) | Derivatives Available for Offset | Collateral Received | Net Amount Due from Counterparty | ||||||||||||
JPMorgan Chase Bank | $ | 127,197 | $ | — | $ | — | $ | 127,197 | ||||||||
Goldman Sachs & Co. | 157 | (157 | ) | — | — | |||||||||||
Barclays Bank plc | 122 | (122 | ) | — | — | |||||||||||
Deutsche Bank AG | 48 | — | — | 48 | ||||||||||||
Exchange Traded Futures & Options Contracts (b) | 17,117,191 | (c) | — | — | 17,117,191 | |||||||||||
|
|
|
|
|
|
|
| |||||||||
| $ | 17,244,715 | $ | (279 | ) | $ | — | $ | 17,244,436 | ||||||||
|
|
|
|
|
|
|
| |||||||||
Counterparty | Gross Amount of Derivative Liabilities Presented in the Statement of Assets and Liabilities (a) | Derivatives Available for Offset | Collateral Pledged | Net Amount Due to Counterparty | ||||||||||||
BNP Paribas | $ | 28,900 | $ | — | $ | — | $ | 28,900 | ||||||||
Barclays Bank plc | 29,932 | (122 | ) | — | 29,810 | |||||||||||
Goldman Sachs & Co. | 107,544 | (157 | ) | — | 107,387 | |||||||||||
|
|
|
|
|
|
|
| |||||||||
| $ | 166,376 | $ | (279 | ) | $ | — | $ | 166,097 | ||||||||
|
|
|
|
|
|
|
| |||||||||
| (a) | For financial reporting purposes the Portfolio does not offset derivative assets and derivative liabilities subject to master netting arrangements in the Statement of Assets and Liabilities. |
| (b) | These derivatives are traded on an exchange, therefore they are not subject to master netting arrangements. |
| (c) | This amount represents the cumulative appreciation (depreciation) of futures contracts as reported in the Portfolio of Investments. The Statement of Assets and Liabilities only reflects the current day variation margin receivable/payable to brokers for futures contracts. |
Investment security transactions for the year ended December 31, 2013 were as follows:
Cost of Purchases: | ||||
Long-term investments other than U.S. government debt securities | $ | 189,671,887 | ||
Net Proceeds of Sales and Redemptions: | ||||
Long-term investments other than U.S. government debt securities | $ | 455,404,219 |
As of December 31, 2013, the gross unrealized appreciation (depreciation) of investments based on the aggregate cost of investments for Federal income tax purposes was as follows:
Aggregate gross unrealized appreciation | $ | 397,660,799 | ||
Aggregate gross unrealized depreciation | (27,413,421 | ) | ||
|
| |||
Net unrealized appreciation | $ | 370,247,378 | ||
|
| |||
Federal income tax cost of investments | $ | 1,192,715,418 | ||
|
|
The Portfolio has net capital loss carryforwards of $269,709,849 of which $228,456,280 expires in the year 2017 and $41,253,569 expires in the year 2018. The Portfolio utilized net capital loss carryforward of $80,531,828 during 2013.
The Portfolio utilized net capital loss carryforward under the provisions of the Regulated Investment Company Modernization Act of 2010 of $38,985,742 for Short Term and $10,476,217 for Long Term during 2013.
See Notes to Financial Statements.
20
EQ ADVISORS TRUST
EQ/INTERNATIONAL CORE PLUS PORTFOLIO
STATEMENT OF ASSETS AND LIABILITIES
December 31, 2013
ASSETS | ||||
Investments at value: | ||||
Affiliated Issuers (Cost $2,272,962) | $ | 3,165,832 | ||
Unaffiliated Issuers | 1,559,796,964 | |||
Cash | 7,169,826 | |||
Foreign cash (Cost $383,010,560) | 375,822,857 | |||
Cash held as collateral at broker | 23,864,000 | |||
Dividends, interest and other receivables | 2,187,886 | |||
Receivable for securities sold | 2,129,122 | |||
Due from broker for futures variation margin | 1,096,599 | |||
Unrealized appreciation on forward foreign currency contracts | 127,524 | |||
Receivable from Separate Accounts for Trust shares sold | 69,772 | |||
Other assets | 76,821 | |||
|
| |||
Total assets | 1,975,507,203 | |||
|
| |||
LIABILITIES | ||||
Payable to Separate Accounts for Trust shares redeemed | 1,888,305 | |||
Investment management fees payable | 986,515 | |||
Payable for securities purchased | 378,257 | |||
Distribution fees payable - Class IB | 326,765 | |||
Administrative fees payable | 233,679 | |||
Unrealized depreciation on forward foreign currency contracts | 166,376 | |||
Distribution fees payable - Class IA | 2,312 | |||
Trustees’ fees payable | 1,658 | |||
Accrued expenses | 76,923 | |||
|
| |||
Total liabilities | 4,060,790 | |||
|
| |||
NET ASSETS | $ | 1,971,446,413 | ||
|
| |||
Net assets were comprised of: | ||||
Paid in capital | $ | 1,881,888,800 | ||
Accumulated undistributed net investment income (loss) | (4,041,940 | ) | ||
Accumulated undistributed net realized gain (loss) on investments, futures and foreign currency transactions | (326,670,200 | ) | ||
Net unrealized appreciation (depreciation) on investments, futures and foreign currency translations | 420,269,753 | |||
|
| |||
Net assets | $ | 1,971,446,413 | ||
|
| |||
Class IA | ||||
Net asset value, offering and redemption price per share, $11,118,362 / 1,078,274 shares outstanding (unlimited amount authorized: $0.01 par value) | $ | 10.31 | ||
|
| |||
Class IB | ||||
Net asset value, offering and redemption price per share, $1,566,557,155 / 151,745,858 shares outstanding (unlimited amount authorized: $0.01 par value) | $ | 10.32 | ||
|
| |||
Class K | ||||
Net asset value, offering and redemption price per share, $393,770,896 / 38,184,268 shares outstanding (unlimited amount authorized: $0.01 par value) | $ | 10.31 | ||
|
| |||
STATEMENT OF OPERATIONS
For the Year Ended December 31, 2013
INVESTMENT INCOME | ||||
Dividends ($58,883 of dividend income received from affiliates) (net of $1,788,074 foreign withholding tax) | $ | 30,417,507 | ||
Interest | 139,189 | |||
|
| |||
Total income | 30,556,696 | |||
|
| |||
EXPENSES | ||||
Investment management fees | 9,538,391 | |||
Distribution fees - Class IB | 2,993,685 | |||
Administrative fees | 2,376,183 | |||
Custodian fees | 200,000 | |||
Printing and mailing expenses | 171,727 | |||
Professional fees | 89,464 | |||
Trustees’ fees | 38,500 | |||
Distribution fees - Class IA | 27,541 | |||
Miscellaneous | 255,596 | |||
|
| |||
Gross expenses | 15,691,087 | |||
Less: Fees paid indirectly | (8,713 | ) | ||
|
| |||
Net expenses | 15,682,374 | |||
|
| |||
NET INVESTMENT INCOME (LOSS) | 14,874,322 | |||
|
| |||
REALIZED AND UNREALIZED GAIN (LOSS) |
| |||
Realized gain (loss) on: | ||||
Investments ($(16,811) of realized gain (loss) from affiliates) | 52,905,718 | |||
Futures | 68,192,885 | |||
Foreign currency transactions | 543,384 | |||
|
| |||
Net realized gain (loss) | 121,641,987 | |||
|
| |||
Change in unrealized appreciation (depreciation) on: | ||||
Investments ($1,058,191 of change in unrealized appreciation (depreciation) from affiliates) | 167,933,192 | |||
Futures | 12,555,120 | |||
Foreign currency translations | (5,155,937 | ) | ||
|
| |||
Net change in unrealized appreciation (depreciation) | 175,332,375 | |||
|
| |||
NET REALIZED AND UNREALIZED GAIN (LOSS) | 296,974,362 | |||
|
| |||
NET INCREASE (DECREASE) IN NET ASSETS RESULTING FROM OPERATIONS | $ | 311,848,684 | ||
|
| |||
See Notes to Financial Statements.
21
EQ ADVISORS TRUST
EQ/INTERNATIONAL CORE PLUS PORTFOLIO
| Year Ended December 31, | ||||||||
| 2013 | 2012 | |||||||
INCREASE (DECREASE) IN NET ASSETS FROM OPERATIONS: | ||||||||
Net investment income (loss) | $ | 14,874,322 | $ | 16,476,950 | ||||
Net realized gain (loss) on investments, futures and foreign currency transactions | 121,641,987 | 35,686,111 | ||||||
Net change in unrealized appreciation (depreciation) on investments, futures and foreign currency translations | 175,332,375 | 122,493,360 | ||||||
|
|
|
| |||||
NET INCREASE (DECREASE) IN NET ASSETS RESULTING FROM OPERATIONS | 311,848,684 | 174,656,421 | ||||||
|
|
|
| |||||
DIVIDENDS: | ||||||||
Dividends from net investment income | ||||||||
Class IA | (90,737 | ) | (151,125 | ) | ||||
Class IB | (12,853,556 | ) | (11,389,384 | ) | ||||
Class K | (4,171,440 | ) | (6,292,020 | ) | ||||
|
|
|
| |||||
TOTAL DIVIDENDS | (17,115,733 | ) | (17,832,529 | ) | ||||
|
|
|
| |||||
CAPITAL SHARES TRANSACTIONS: | ||||||||
Class IA | ||||||||
Capital shares sold [ 168,154 and 237,451 shares, respectively ] | 1,594,911 | 1,961,775 | ||||||
Capital shares issued in reinvestment of dividends [ 9,111 and 17,148 shares, respectively ] | 90,737 | 151,125 | ||||||
Capital shares repurchased [ (289,049) and (217,966) shares, respectively ] | (2,789,140 | ) | (1,825,430 | ) | ||||
|
|
|
| |||||
Total Class IA transactions | (1,103,492 | ) | 287,470 | |||||
|
|
|
| |||||
Class IB | ||||||||
Capital shares sold [ 4,488,612 and 4,260,500 shares, respectively ] | 43,099,682 | 35,104,049 | ||||||
Capital shares sold in-kind (Note 9)[ 81,282,207 and 0 shares, respectively ] | 723,719,258 | — | ||||||
Capital shares issued in reinvestment of dividends [ 1,289,109 and 1,291,053 shares, | 12,853,556 | 11,389,384 | ||||||
Capital shares repurchased [ (25,669,623) and (14,453,989) shares, respectively ] | (247,935,656 | ) | (120,148,509 | ) | ||||
|
|
|
| |||||
Total Class IB transactions | 531,736,840 | (73,655,076 | ) | |||||
|
|
|
| |||||
Class K | ||||||||
Capital shares sold [ 585,684 and 2,875,399 shares, respectively ] | 5,686,229 | 23,786,513 | ||||||
Capital shares issued in reinvestment of dividends [ 418,834 and 713,803 shares, respectively ] | 4,171,440 | 6,292,020 | ||||||
Capital shares repurchased [ (5,326,872) and (4,591,667) shares, respectively ] | (50,982,561 | ) | (38,037,004 | ) | ||||
|
|
|
| |||||
Total Class K transactions | (41,124,892 | ) | (7,958,471 | ) | ||||
|
|
|
| |||||
NET INCREASE (DECREASE) IN NET ASSETS RESULTING FROM CAPITAL SHARE TRANSACTIONS | 489,508,456 | (81,326,077 | ) | |||||
|
|
|
| |||||
TOTAL INCREASE (DECREASE) IN NET ASSETS | 784,241,407 | 75,497,815 | ||||||
NET ASSETS: | ||||||||
Beginning of year | 1,187,205,006 | 1,111,707,191 | ||||||
|
|
|
| |||||
End of year (a) | $ | 1,971,446,413 | $ | 1,187,205,006 | ||||
|
|
|
|
| ||||
(a) Includes accumulated undistributed (overdistributed) net investment income (loss) of | $ | (4,041,940 | ) | $ | (2,611,217 | ) | ||
|
|
|
| |||||
See Notes to Financial Statements.
22
EQ ADVISORS TRUST
EQ/INTERNATIONAL CORE PLUS PORTFOLIO
FINANCIAL HIGHLIGHTS
| Year Ended December 31, | ||||||||||||||||||||
| Class IA | 2013 | 2012 | 2011 | 2010 | 2009 | |||||||||||||||
Net asset value, beginning of year | $ | 8.85 | $ | 7.72 | $ | 9.61 | $ | 8.95 | $ | 6.80 | ||||||||||
|
|
|
|
|
|
|
|
|
| |||||||||||
Income (loss) from investment operations: | ||||||||||||||||||||
Net investment income (loss) | 0.09 | (e) | 0.11 | (e) | 0.13 | (e)�� | 0.11 | (e) | 0.15 | (e) | ||||||||||
Net realized and unrealized gain (loss) on investments, futures and foreign currency transactions | 1.45 | 1.15 | (1.74 | ) | 0.74 | 2.26 | ||||||||||||||
|
|
|
|
|
|
|
|
|
| |||||||||||
Total from investment operations | 1.54 | 1.26 | (1.61 | ) | 0.85 | 2.41 | ||||||||||||||
|
|
|
|
|
|
|
|
|
| |||||||||||
Less distributions: | ||||||||||||||||||||
Dividends from net investment income | (0.08 | ) | (0.13 | ) | (0.28 | ) | (0.19 | ) | (0.26 | ) | ||||||||||
|
|
|
|
|
|
|
|
|
| |||||||||||
Net asset value, end of year | $ | 10.31 | $ | 8.85 | $ | 7.72 | $ | 9.61 | $ | 8.95 | ||||||||||
|
|
|
|
|
|
|
|
|
| |||||||||||
Total return | 17.49 | % | 16.29 | % | (16.73 | )% | 9.52 | % | 35.55 | % | ||||||||||
|
|
|
|
|
|
|
|
|
| |||||||||||
Ratios/Supplemental Data: | ||||||||||||||||||||
Net assets, end of year (000’s) | $ | 11,118 | $ | 10,531 | $ | 8,903 | $ | 445,820 | $ | 404,122 | ||||||||||
Ratio of expenses to average net assets: | ||||||||||||||||||||
After waivers and reimbursements (f) | 1.05 | % | 1.05 | % | 0.78 | % | 0.85 | % | 0.85 | % | ||||||||||
After waivers, reimbursements and fees paid indirectly (f) | 1.05 | % | 1.05 | % | 0.78 | % | 0.85 | % | 0.84 | % | ||||||||||
Before waivers, reimbursements and fees paid indirectly (f) | 1.05 | % | 1.05 | % | 0.78 | % | 0.85 | % | 0.85 | % | ||||||||||
Ratio of net investment income (loss) to average net assets: | ||||||||||||||||||||
After waivers and reimbursements (f) | 0.97 | % | 1.33 | % | 1.29 | % | 1.30 | % | 2.11 | % | ||||||||||
After waivers, reimbursements and fees paid indirectly (f) | 0.97 | % | 1.33 | % | 1.30 | % | 1.30 | % | 2.12 | % | ||||||||||
Before waivers, reimbursements and fees paid indirectly (f) | 0.97 | % | 1.33 | % | 1.29 | % | 1.30 | % | 2.11 | % | ||||||||||
Portfolio turnover rate | 15 | % | 3 | % | 3 | % | 12 | % | 17 | % | ||||||||||
| Year Ended December 31, | ||||||||||||||||||||
| Class IB | 2013 | 2012 | 2011 | 2010 | 2009 | |||||||||||||||
Net asset value, beginning of year | $ | 8.86 | $ | 7.73 | $ | 9.62 | $ | 8.96 | $ | 6.80 | ||||||||||
|
|
|
|
|
|
|
|
|
| |||||||||||
Income (loss) from investment operations: | ||||||||||||||||||||
Net investment income (loss) | 0.08 | (e) | 0.11 | (e) | 0.12 | (e) | 0.09 | (e) | 0.13 | (e) | ||||||||||
Net realized and unrealized gain (loss) on investments, futures and foreign currency transactions | 1.46 | 1.15 | (1.75 | ) | 0.73 | 2.27 | ||||||||||||||
|
|
|
|
|
|
|
|
|
| |||||||||||
Total from investment operations | 1.54 | 1.26 | (1.63 | ) | 0.82 | 2.40 | ||||||||||||||
|
|
|
|
|
|
|
|
|
| |||||||||||
Less distributions: | ||||||||||||||||||||
Dividends from net investment income | (0.08 | ) | (0.13 | ) | (0.26 | ) | (0.16 | ) | (0.24 | ) | ||||||||||
|
|
|
|
|
|
|
|
|
| |||||||||||
Net asset value, end of year | $ | 10.32 | $ | 8.86 | $ | 7.73 | $ | 9.62 | $ | 8.96 | ||||||||||
|
|
|
|
|
|
|
|
|
| |||||||||||
Total return | 17.47 | % | 16.27 | % | (16.92 | )% | 9.23 | % | 35.34 | % | ||||||||||
|
|
|
|
|
|
|
|
|
| |||||||||||
Ratios/Supplemental Data: | ||||||||||||||||||||
Net assets, end of year (000’s) | $ | 1,566,557 | $ | 800,489 | $ | 766,952 | $ | 984,130 | $ | 943,631 | ||||||||||
Ratio of expenses to average net assets: | ||||||||||||||||||||
After waivers and reimbursements (f) | 1.05 | % | 1.05 | % | 1.03 | % | 1.10 | % | 1.10 | % | ||||||||||
After waivers, reimbursements and fees paid indirectly (f) | 1.05 | % | 1.05 | % | 1.03 | % | 1.10 | % | 1.10 | % | ||||||||||
Before waivers, reimbursements and fees paid indirectly (f) | 1.05 | % | 1.05 | % | 1.03 | % | 1.10 | % | 1.10 | % | ||||||||||
Ratio of net investment income (loss) to average net assets: | ||||||||||||||||||||
After waivers and reimbursements (f) | 0.84 | % | 1.34 | % | 1.25 | % | 1.00 | % | 1.63 | % | ||||||||||
After waivers, reimbursements and fees paid indirectly (f) | 0.85 | % | 1.34 | % | 1.25 | % | 1.01 | % | 1.64 | % | ||||||||||
Before waivers, reimbursements and fees paid indirectly (f) | 0.84 | % | 1.34 | % | 1.25 | % | 1.00 | % | 1.63 | % | ||||||||||
Portfolio turnover rate | 15 | % | 3 | % | 3 | % | 12 | % | 17 | % | ||||||||||
See Notes to Financial Statements.
23
EQ ADVISORS TRUST
EQ/INTERNATIONAL CORE PLUS PORTFOLIO
FINANCIAL HIGHLIGHTS (Continued)
| Year Ended December 31, | August 26, 2011* to December 31, 2011 | |||||||||||
| Class K | 2013 | 2012 | ||||||||||
Net asset value, beginning of period | $ | 8.85 | $ | 7.72 | $ | 8.45 | ||||||
|
|
|
|
|
| |||||||
Income (loss) from investment operations: | ||||||||||||
Net investment income (loss) | 0.12 | (e) | 0.13 | (e) | 0.06 | (e) | ||||||
Net realized and unrealized gain (loss) on investments, futures and foreign currency transactions | 1.45 | 1.15 | (0.55 | ) | ||||||||
|
|
|
|
|
| |||||||
Total from investment operations | 1.57 | 1.28 | (0.49 | ) | ||||||||
|
|
|
|
|
| |||||||
Less distributions: | ||||||||||||
Dividends from net investment income | (0.11 | ) | (0.15 | ) | (0.24 | ) | ||||||
|
|
|
|
|
| |||||||
Net asset value, end of period | $ | 10.31 | $ | 8.85 | $ | 7.72 | ||||||
|
|
|
|
|
| |||||||
Total return (b) | 17.78 | % | 16.59 | % | (5.70 | )% | ||||||
|
|
|
|
|
| |||||||
Ratios/Supplemental Data: | ||||||||||||
Net assets, end of period (000’s) | $ | 393,771 | $ | 376,185 | $ | 335,852 | ||||||
Ratio of expenses to average net assets: | ||||||||||||
After waivers and reimbursements (a)(f) | 0.80 | % | 0.80 | % | 0.78 | % | ||||||
After waivers, reimbursements and fees paid indirectly (a)(f) | 0.80 | % | 0.80 | % | 0.77 | % | ||||||
Before waivers, reimbursements and fees paid indirectly (a)(f) | 0.80 | % | 0.80 | % | 0.78 | % | ||||||
Ratio of net investment income (loss) to average net assets: | ||||||||||||
After waivers and reimbursements (a)(f) | 1.22 | % | 1.60 | % | 2.10 | % | ||||||
After waivers, reimbursements and fees paid indirectly (a)(f) | 1.22 | % | 1.60 | % | 2.10 | % | ||||||
Before waivers, reimbursements and fees paid indirectly(a)(f) | 1.22 | % | 1.60 | % | 2.10 | % | ||||||
Portfolio turnover rate | 15 | % | 3 | % | 3 | % | ||||||
| * | Commencement of Operations. |
| (a) | Ratios for periods less than one year are annualized. |
| (b) | Total returns for periods less than one year are not annualized. |
| (e) | Net investment income (loss) per share is based on average shares outstanding. |
| (f) | Expenses do not include the expenses of the underlying funds (“indirect expenses”). |
See Notes to Financial Statements.
24
EQ/LARGE CAP CORE PLUS PORTFOLIO (Unaudited)
PORTFOLIO ADVISERS
| Ø | AXA Equitable Funds Management Group, LLC |
| Ø | BlackRock Investment Management, LLC |
| Ø | Capital Guardian Trust Company |
| Ø | Institutional Capital LLC |
PERFORMANCE RESULTS
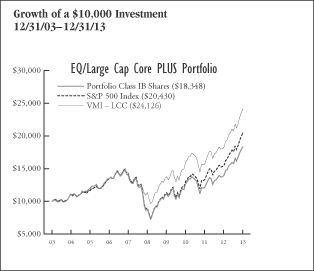
| Annualized Total Returns as of 12/31/13 | ||||||||||||
| 1 Year | 5 Years | 10 Years/ Since Incept. | ||||||||||
Portfolio – Class IA Shares** | 31.62 | % | 16.11 | % | 6.49 | % | ||||||
Portfolio – Class IB Shares* | 31.61 | 15.93 | 6.26 | |||||||||
Portfolio – Class K Shares*** | 31.95 | N/A | 21.92 | |||||||||
S&P 500 Index | 32.39 | 17.94 | 7.41 | |||||||||
VMI – LCC | 32.39 | 16.27 | 9.21 | |||||||||
* Date of inception 1/1/99.
** Date of inception 3/25/02.
*** Date of inception 8/26/11.
Returns for periods greater than one year are annualized. |
| |||||||||||
Past performance is not indicative of future results.
PERFORMANCE SUMMARY
The Portfolio’s Class IA shares returned 31.62% for the year ended December 31, 2013. The Portfolio’s benchmarks, the S&P 500 Index, returned 32.39% and the VMI — LCC returned 32.39% over the same period.
The following commentary describes key factors (such as stock selection and sector allocation decisions) that helped or hurt the Portfolio’s performance relative to its primary benchmark.
Portfolio Highlights
For the year ended December 31, 2013
What helped performance during the year:
| • | From a sector allocation standpoint, both stock selection and a sector underweight in Information Technology benefited the Portfolio. An underweight in Apple, Inc. and IBM were notable contributors relative to the benchmark. |
| • | Consumer Discretionary and Telecommunication Services stock selection were both positive. |
| • | In the Consumer Services sector, Time Warner, Inc. and Viacom outperformed. Time Warner has benefited from growth in affiliate fees and Viacom has seen improved ratings and advertising revenues. Both have returned cash to shareholders via stock repurchase and dividends. |
| • | Health Care holding Gilead Sciences, Inc. saw its share price double over the year as it reported strong sales growth. |
What hurt performance during the year:
| • | Several key factors detracted from relative performance. Stock selection in Basic Industries was negative as Barrick Gold, Inc. lagged due to cost overruns and production delays. Stock selection in the Financials and Energy sectors also detracted from performance. |
| • | Other individual positions that detracted from relative performance included electric utility Exelon Corp., which was hampered by a weakened outlook for power prices, and Canadian energy firm Encana Corporation. Underweighting Google was also detrimental to performance. |
Sector Weightings as of December 31, 2013 | % of Net Assets | |||
Information Technology | 12.6 | % | ||
Financials | 11.9 | |||
Consumer Discretionary | 11.8 | |||
Health Care | 9.3 | |||
Industrials | 9.0 | |||
Energy | 7.8 | |||
Exchange Traded Funds | 5.4 | |||
Consumer Staples | 5.4 | |||
Materials | 2.7 | |||
Utilities | 1.9 | |||
Telecommunication Services | 1.7 | |||
Cash and Other | 20.5 | |||
|
| |||
| 100.0 | % | |||
|
| |||
25
EQ/LARGE CAP CORE PLUS PORTFOLIO (Unaudited)
UNDERSTANDING YOUR EXPENSES:
As a shareholder of the Portfolio, you incur two types of costs:
(1) transaction costs, including applicable sales charges and redemption fees; and (2) ongoing costs, including management fees, distribution (12b-1) fees (in the case of Class IA and Class IB shares of the Trust), and other Portfolio expenses. These examples are intended to help you understand your ongoing costs (in dollars) of investing in the Portfolio and to compare these costs with the ongoing costs of investing in other mutual funds.
The examples are based on an investment of $1,000 invested at the beginning of the six-month period ended December 31, 2013 and held for the entire six-month period.
Actual Expenses
The first line of the table to the right provides information about actual account values and actual expenses. You may use the information in this line, together with the amount you invested, to estimate the expenses that you paid over the period. Simply divide your account value by $1,000 (for example, an $8,600 account value divided by $1,000 = 8.6), then multiply the result by the number in the first line under the heading entitled ‘‘Expenses Paid During Period’’ to estimate the expenses you paid on your account during this period.
Hypothetical Example for Comparison Purposes
The second line of the table below provides information about hypothetical account values and hypothetical expenses based on the Portfolio’s actual expense ratio and an assumed rate of return of 5% per year before expenses, which is not the Portfolio’s actual return. The hypothetical account values and expenses may not be used to estimate the actual ending account balance or expenses you paid for the period. You may use this information to compare the ongoing costs of investing in the Portfolio and other funds. To do so, compare this 5% hypothetical example with the 5% hypothetical examples that appear in the shareholder reports of the other funds.
Please note that the expenses shown in the table are meant to highlight your ongoing costs only and do not reflect any transactional costs, such as sales charges (loads), redemption fees, or exchange fees. Therefore, the second line of the table is useful in comparing ongoing costs only, and will not help you determine the relative total costs of owning different funds. In addition, if these transactional costs were included, your costs would have been higher. Also note that the table does not reflect any variable life insurance or variable annuity contract-related fees and expenses, which would increase overall fees and expenses.
EXAMPLE
| Beginning Account Value 7/1/13 | Ending Account Value 12/31/13 | Expenses Paid During Period* 7/1/13 - 12/31/13 | ||||||||||
Class IA | ||||||||||||
Actual | $1,000.00 | $1,163.23 | $4.95 | |||||||||
Hypothetical (5% average annual return before expenses) | 1,000.00 | 1,020.63 | 4.62 | |||||||||
Class IB | ||||||||||||
Actual | 1,000.00 | 1,163.17 | 4.95 | |||||||||
Hypothetical (5% average annual return before expenses) | 1,000.00 | 1,020.63 | 4.63 | |||||||||
Class K | ||||||||||||
Actual | 1,000.00 | 1,164.63 | 3.59 | |||||||||
Hypothetical (5% average annual return before expenses) | 1,000.00 | 1,021.89 | 3.35 | |||||||||
* Expenses are equal to the Portfolio’s Class IA, Class IB and Class K shares annualized expense ratios of 0.91%, 0.91% and 0.66%, respectively, multiplied by the average account value over the period, and multiplied by 184/365 (to reflect the one-half year period). |
| |||||||||||
26
EQ ADVISORS TRUST
EQ/LARGE CAP CORE PLUS PORTFOLIO
PORTFOLIO OF INVESTMENTS
December 31, 2013
| Number of Shares | Value (Note 1) | |||||||
COMMON STOCKS: | ||||||||
Consumer Discretionary (11.8%) | ||||||||
Auto Components (0.9%) | ||||||||
BorgWarner, Inc. | 14,331 | $ | 801,246 | |||||
Delphi Automotive plc | 110,558 | 6,647,853 | ||||||
Goodyear Tire & Rubber Co. | 15,549 | 370,844 | ||||||
Johnson Controls, Inc. | 291,955 | 14,977,291 | ||||||
|
| |||||||
| 22,797,234 | ||||||||
|
| |||||||
Automobiles (0.7%) | ||||||||
Ford Motor Co. | 614,548 | 9,482,476 | ||||||
General Motors Co.* | 146,430 | 5,984,594 | ||||||
Harley-Davidson, Inc. | 13,921 | 963,890 | ||||||
|
| |||||||
| 16,430,960 | ||||||||
|
| |||||||
Distributors (0.0%) | ||||||||
Genuine Parts Co. | 9,718 | 808,440 | ||||||
|
| |||||||
Diversified Consumer Services (0.0%) |
| |||||||
H&R Block, Inc. | 17,200 | 499,488 | ||||||
|
| |||||||
Hotels, Restaurants & Leisure (1.2%) |
| |||||||
Carnival Corp. | 128,373 | 5,156,743 | ||||||
Chipotle Mexican Grill, Inc.* | 1,948 | 1,037,856 | ||||||
Darden Restaurants, Inc. | 8,218 | 446,813 | ||||||
International Game Technology | 15,659 | 284,367 | ||||||
Marriott International, Inc., Class A | 14,142 | 698,049 | ||||||
McDonald’s Corp. | 62,663 | 6,080,191 | ||||||
Starbucks Corp. | 131,998 | 10,347,323 | ||||||
Starwood Hotels & Resorts Worldwide, Inc. | 12,058 | 958,008 | ||||||
Wyndham Worldwide Corp. | 8,203 | 604,479 | ||||||
Wynn Resorts Ltd. | 5,085 | 987,558 | ||||||
Yum! Brands, Inc. | 28,042 | 2,120,256 | ||||||
|
| |||||||
| 28,721,643 | ||||||||
|
| |||||||
Household Durables (1.2%) | ||||||||
D.R. Horton, Inc.* | 176,683 | 3,943,565 | ||||||
Garmin Ltd. | 7,740 | 357,743 | ||||||
Harman International Industries, Inc. | 4,251 | 347,944 | ||||||
Leggett & Platt, Inc. | 8,884 | 274,871 | ||||||
Lennar Corp., Class A | 98,430 | 3,893,891 | ||||||
Mohawk Industries, Inc.* | 3,842 | 572,074 | ||||||
Newell Rubbermaid, Inc. | 295,474 | 9,576,312 | ||||||
PulteGroup, Inc. | 21,697 | 441,968 | ||||||
Whirlpool Corp. | 60,312 | 9,460,540 | ||||||
|
| |||||||
| 28,868,908 | ||||||||
|
| |||||||
Internet & Catalog Retail (0.8%) | ||||||||
Amazon.com, Inc.* | 34,285 | 13,672,515 | ||||||
Expedia, Inc. | 6,481 | 451,467 | ||||||
Netflix, Inc.* | 3,732 | 1,374,010 | ||||||
priceline.com, Inc.* | 3,239 | 3,765,014 | ||||||
TripAdvisor, Inc.* | 6,975 | 577,739 | ||||||
|
| |||||||
| 19,840,745 | ||||||||
|
| |||||||
Leisure Equipment & Products (0.1%) |
| |||||||
Hasbro, Inc. | 7,268 | 399,813 | ||||||
Mattel, Inc. | 21,308 | 1,013,834 | ||||||
|
| |||||||
| 1,413,647 | ||||||||
|
| |||||||
Media (3.7%) | ||||||||
Cablevision Systems Corp. - | 13,466 | $ | 241,445 | |||||
CBS Corp. (Non-Voting), Class B | 35,142 | 2,239,951 | ||||||
Charter Communications, Inc., Class A* | 39,968 | 5,466,024 | ||||||
Comcast Corp., Class A | 244,825 | 12,722,331 | ||||||
DIRECTV* | 30,771 | 2,125,968 | ||||||
Discovery Communications, Inc., | ||||||||
Class A* | 14,209 | 1,284,778 | ||||||
DreamWorks Animation SKG, Inc., | ||||||||
Class A* | 75,760 | 2,689,480 | ||||||
Gannett Co., Inc. | 267,586 | 7,915,194 | ||||||
Graham Holdings Co., Class B* | 274 | 181,750 | ||||||
Interpublic Group of Cos., Inc. | 26,197 | 463,687 | ||||||
News Corp., Class A* | 31,336 | 564,675 | ||||||
Omnicom Group, Inc. | 16,204 | 1,205,091 | ||||||
Scripps Networks Interactive, Inc., | ||||||||
Class A | 94,402 | 8,157,277 | ||||||
Sirius XM Holdings, Inc.* | 1,704,865 | 5,949,979 | ||||||
Time Warner Cable, Inc. | 17,751 | 2,405,260 | ||||||
Time Warner, Inc. | 190,438 | 13,277,337 | ||||||
Twenty-First Century Fox, Inc., Class A | 123,578 | 4,347,474 | ||||||
Viacom, Inc., Class B | 120,184 | 10,496,871 | ||||||
Walt Disney Co. | 102,920 | 7,863,088 | ||||||
|
| |||||||
| 89,597,660 | ||||||||
|
| |||||||
Multiline Retail (0.3%) | ||||||||
Dollar General Corp.* | 18,551 | 1,118,996 | ||||||
Dollar Tree, Inc.* | 13,101 | 739,158 | ||||||
Family Dollar Stores, Inc. | 6,085 | 395,343 | ||||||
Kohl’s Corp. | 12,672 | 719,136 | ||||||
Macy’s, Inc. | 23,201 | 1,238,933 | ||||||
Nordstrom, Inc. | 9,007 | 556,633 | ||||||
Target Corp. | 39,803 | 2,518,336 | ||||||
|
| |||||||
| 7,286,535 | ||||||||
|
| |||||||
Specialty Retail (1.8%) | ||||||||
AutoNation, Inc.* | 4,066 | 202,040 | ||||||
AutoZone, Inc.* | 2,142 | 1,023,748 | ||||||
Bed Bath & Beyond, Inc.* | 13,521 | 1,085,736 | ||||||
Best Buy Co., Inc. | 17,215 | 686,534 | ||||||
CarMax, Inc.* | 14,061 | 661,148 | ||||||
GameStop Corp., Class A | 7,356 | 362,357 | ||||||
Gap, Inc. | 16,676 | 651,698 | ||||||
Home Depot, Inc. | 174,192 | 14,342,969 | ||||||
L Brands, Inc. | 15,352 | 949,521 | ||||||
Lowe’s Cos., Inc. | 65,859 | 3,263,313 | ||||||
O’Reilly Automotive, Inc.* | 6,757 | 869,693 | ||||||
PetSmart, Inc. | 6,529 | 474,985 | ||||||
Ross Stores, Inc. | 79,843 | 5,982,636 | ||||||
Signet Jewelers Ltd. | 60,671 | 4,774,808 | ||||||
Staples, Inc. | 41,579 | 660,690 | ||||||
Tiffany & Co. | 39,068 | 3,624,729 | ||||||
TJX Cos., Inc. | 44,786 | 2,854,212 | ||||||
Urban Outfitters, Inc.* | 6,860 | 254,506 | ||||||
|
| |||||||
| 42,725,323 | ||||||||
|
| |||||||
See Notes to Financial Statements.
27
EQ ADVISORS TRUST
EQ/LARGE CAP CORE PLUS PORTFOLIO
PORTFOLIO OF INVESTMENTS (Continued)
December 31, 2013
| Number of Shares | Value (Note 1) | |||||||
Textiles, Apparel & Luxury Goods (1.1%) |
| |||||||
Coach, Inc. | 119,956 | $ | 6,733,130 | |||||
Fossil Group, Inc.* | 3,092 | 370,854 | ||||||
Lululemon Athletica, Inc.* | 36,658 | 2,163,922 | ||||||
Michael Kors Holdings Ltd.* | 11,298 | 917,285 | ||||||
NIKE, Inc., Class B | 161,562 | 12,705,236 | ||||||
PVH Corp. | 5,135 | 698,463 | ||||||
Ralph Lauren Corp. | 3,753 | 662,667 | ||||||
VF Corp. | 22,180 | 1,382,701 | ||||||
|
| |||||||
| 25,634,258 | ||||||||
|
| |||||||
Total Consumer Discretionary | 284,624,841 | |||||||
|
| |||||||
Consumer Staples (5.4%) | ||||||||
Beverages (1.1%) | ||||||||
Beam, Inc. | 66,347 | 4,515,577 | ||||||
Brown-Forman Corp., Class B | 10,201 | 770,890 | ||||||
Coca-Cola Co. | 239,166 | 9,879,947 | ||||||
Coca-Cola Enterprises, Inc. | 15,201 | 670,820 | ||||||
Constellation Brands, Inc., Class A* | 10,493 | 738,497 | ||||||
Dr. Pepper Snapple Group, Inc. | 12,630 | 615,334 | ||||||
Molson Coors Brewing Co., Class B | 9,953 | 558,861 | ||||||
Monster Beverage Corp.* | 8,549 | 579,366 | ||||||
PepsiCo, Inc. | 96,580 | 8,010,345 | ||||||
|
| |||||||
| 26,339,637 | ||||||||
|
| |||||||
Food & Staples Retailing (1.4%) |
| |||||||
Costco Wholesale Corp. | 27,515 | 3,274,560 | ||||||
CVS Caremark Corp. | 180,106 | 12,890,186 | ||||||
Kroger Co. | 32,775 | 1,295,596 | ||||||
Safeway, Inc. | 15,543 | 506,235 | ||||||
Sprouts Farmers Market, Inc.* | 58,500 | 2,248,155 | ||||||
Sysco Corp. | 36,619 | 1,321,946 | ||||||
Walgreen Co. | 54,841 | 3,150,067 | ||||||
Wal-Mart Stores, Inc. | 101,888 | 8,017,567 | ||||||
Whole Foods Market, Inc. | 23,432 | 1,355,073 | ||||||
|
| |||||||
| 34,059,385 | ||||||||
|
| |||||||
Food Products (0.9%) | ||||||||
Archer-Daniels-Midland Co. | 41,431 | 1,798,105 | ||||||
Campbell Soup Co. | 11,308 | 489,410 | ||||||
ConAgra Foods, Inc. | 26,561 | 895,106 | ||||||
General Mills, Inc. | 39,939 | 1,993,356 | ||||||
Hershey Co. | 9,432 | 917,073 | ||||||
Hormel Foods Corp. | 8,471 | 382,635 | ||||||
J.M. Smucker Co. | 6,619 | 685,861 | ||||||
Kellogg Co. | 16,191 | 988,784 | ||||||
Kraft Foods Group, Inc. | 37,522 | 2,023,186 | ||||||
McCormick & Co., Inc. | 8,312 | 572,863 | ||||||
Mead Johnson Nutrition Co. | 12,717 | 1,065,176 | ||||||
Mondelez International, Inc., Class A | 228,466 | 8,064,850 | ||||||
Tyson Foods, Inc., Class A | 17,098 | 572,099 | ||||||
|
| |||||||
| 20,448,504 | ||||||||
|
| |||||||
Household Products (1.1%) | ||||||||
Clorox Co. | 8,124 | 753,582 | ||||||
Colgate-Palmolive Co. | 55,351 | 3,609,439 | ||||||
Kimberly-Clark Corp. | 24,032 | $ | 2,510,383 | |||||
Procter & Gamble Co. | 254,201 | 20,694,503 | ||||||
|
| |||||||
| 27,567,907 | ||||||||
|
| |||||||
Personal Products (0.2%) | ||||||||
Avon Products, Inc. | 266,835 | 4,594,899 | ||||||
Estee Lauder Cos., Inc., Class A | 16,122 | 1,214,309 | ||||||
|
| |||||||
| 5,809,208 | ||||||||
|
| |||||||
Tobacco (0.7%) | ||||||||
Altria Group, Inc. | 125,951 | 4,835,259 | ||||||
Lorillard, Inc. | 23,193 | 1,175,421 | ||||||
Philip Morris International, Inc. | 100,899 | 8,791,330 | ||||||
Reynolds American, Inc. | 19,736 | 986,603 | ||||||
|
| |||||||
| 15,788,613 | ||||||||
|
| |||||||
Total Consumer Staples | 130,013,254 | |||||||
|
| |||||||
Energy (7.8%) | ||||||||
Energy Equipment & Services (1.8%) |
| |||||||
Baker Hughes, Inc. | 27,908 | 1,542,196 | ||||||
Cameron International Corp.* | 14,976 | 891,521 | ||||||
Diamond Offshore Drilling, Inc. | 4,373 | 248,911 | ||||||
Ensco plc, Class A | 87,122 | 4,981,636 | ||||||
FMC Technologies, Inc.* | 14,895 | 777,668 | ||||||
Halliburton Co. | 303,459 | 15,400,544 | ||||||
Helmerich & Payne, Inc. | 6,748 | 567,372 | ||||||
Nabors Industries Ltd. | 16,341 | 277,634 | ||||||
National Oilwell Varco, Inc. | 26,958 | 2,143,970 | ||||||
Noble Corp. plc | 15,952 | 597,722 | ||||||
Rowan Cos., plc, Class A* | 7,816 | 276,374 | ||||||
Schlumberger Ltd. | 152,767 | 13,765,834 | ||||||
Transocean Ltd. | 21,341 | 1,054,672 | ||||||
|
| |||||||
| 42,526,054 | ||||||||
|
| |||||||
Oil, Gas & Consumable Fuels (6.0%) |
| |||||||
Anadarko Petroleum Corp. | 31,692 | 2,513,809 | ||||||
Apache Corp. | 25,140 | 2,160,532 | ||||||
Cabot Oil & Gas Corp. | 26,516 | 1,027,760 | ||||||
Cenovus Energy, Inc. | 170,551 | 4,886,286 | ||||||
Chesapeake Energy Corp. | 31,824 | 863,703 | ||||||
Chevron Corp. | 246,688 | 30,813,798 | ||||||
Cobalt International Energy, Inc.* | 106,624 | 1,753,965 | ||||||
ConocoPhillips Co. | 77,151 | 5,450,718 | ||||||
CONSOL Energy, Inc. | 14,411 | 548,194 | ||||||
Denbury Resources, Inc.* | 23,076 | 379,139 | ||||||
Devon Energy Corp. | 24,031 | 1,486,798 | ||||||
Enbridge, Inc. | 61,000 | 2,664,480 | ||||||
Encana Corp. | 149,400 | 2,696,670 | ||||||
EOG Resources, Inc. | 17,190 | 2,885,170 | ||||||
EQT Corp. | 9,489 | 851,922 | ||||||
Exxon Mobil Corp. | 395,420 | 40,016,504 | ||||||
Hess Corp. | 17,910 | 1,486,530 | ||||||
Kinder Morgan, Inc. | 42,395 | 1,526,220 | ||||||
Marathon Oil Corp. | 218,165 | 7,701,225 | ||||||
Marathon Petroleum Corp. | 18,955 | 1,738,742 | ||||||
Murphy Oil Corp. | 11,065 | 717,897 | ||||||
Newfield Exploration Co.* | 8,561 | 210,857 | ||||||
Noble Energy, Inc. | 126,776 | 8,634,713 | ||||||
Occidental Petroleum Corp. | 50,761 | 4,827,371 | ||||||
Peabody Energy Corp. | 16,979 | 331,600 | ||||||
See Notes to Financial Statements.
28
EQ ADVISORS TRUST
EQ/LARGE CAP CORE PLUS PORTFOLIO
PORTFOLIO OF INVESTMENTS (Continued)
December 31, 2013
| Number of Shares | Value (Note 1) | |||||||
Phillips 66 | 37,754 | $ | 2,911,966 | |||||
Pioneer Natural Resources Co. | 8,982 | 1,653,317 | ||||||
QEP Resources, Inc. | 11,282 | 345,793 | ||||||
Range Resources Corp. | 10,289 | 867,466 | ||||||
Southwestern Energy Co.* | 119,429 | 4,697,143 | ||||||
Spectra Energy Corp. | 42,190 | 1,502,808 | ||||||
Tesoro Corp. | 8,361 | 489,119 | ||||||
Valero Energy Corp. | 33,975 | 1,712,340 | ||||||
Williams Cos., Inc. | 43,034 | 1,659,821 | ||||||
WPX Energy, Inc.* | 12,633 | 257,461 | ||||||
|
| |||||||
| 144,271,837 | ||||||||
|
| |||||||
Total Energy | 186,797,891 | |||||||
|
| |||||||
Financials (11.9%) | ||||||||
Capital Markets (1.5%) | ||||||||
Ameriprise Financial, Inc. | 12,249 | 1,409,247 | ||||||
Bank of New York Mellon Corp. | 72,324 | 2,527,001 | ||||||
BlackRock, Inc. | 21,856 | 6,916,768 | ||||||
Charles Schwab Corp. | 73,074 | 1,899,924 | ||||||
E*TRADE Financial Corp.* | 18,073 | 354,954 | ||||||
Franklin Resources, Inc. | 25,422 | 1,467,612 | ||||||
Goldman Sachs Group, Inc. | 75,586 | 13,398,374 | ||||||
Invesco Ltd. | 27,909 | 1,015,888 | ||||||
Legg Mason, Inc. | 6,679 | 290,403 | ||||||
Morgan Stanley | 87,245 | 2,736,003 | ||||||
Northern Trust Corp. | 14,143 | 875,310 | ||||||
State Street Corp. | 27,644 | 2,028,793 | ||||||
T. Rowe Price Group, Inc. | 16,432 | 1,376,509 | ||||||
|
| |||||||
| 36,296,786 | ||||||||
|
| |||||||
Commercial Banks (1.8%) | ||||||||
BB&T Corp. | 138,027 | 5,151,168 | ||||||
Comerica, Inc. | 11,513 | 547,328 | ||||||
Fifth Third Bancorp | 55,586 | 1,168,974 | ||||||
Huntington Bancshares, Inc./Ohio | �� | 52,275 | 504,454 | |||||
KeyCorp | 56,450 | 757,559 | ||||||
M&T Bank Corp. | 8,199 | 954,528 | ||||||
PNC Financial Services Group, Inc. | 136,011 | 10,551,733 | ||||||
Regions Financial Corp. | 86,727 | 857,730 | ||||||
SunTrust Banks, Inc. | 33,703 | 1,240,607 | ||||||
U.S. Bancorp/Minnesota | 115,011 | 4,646,444 | ||||||
Wells Fargo & Co. | 376,281 | 17,083,157 | ||||||
Zions Bancorp | 11,617 | 348,045 | ||||||
|
| |||||||
| 43,811,727 | ||||||||
|
| |||||||
Consumer Finance (0.8%) | ||||||||
American Express Co. | 58,018 | 5,263,973 | ||||||
Capital One Financial Corp. | 142,357 | 10,905,970 | ||||||
Discover Financial Services | 30,162 | 1,687,564 | ||||||
SLM Corp. | 27,464 | 721,754 | ||||||
|
| |||||||
| 18,579,261 | ||||||||
|
| |||||||
Diversified Financial Services (3.1%) |
| |||||||
Bank of America Corp. | 1,176,019 | 18,310,616 | ||||||
Citigroup, Inc. | 334,408 | 17,426,001 | ||||||
CME Group, Inc./Illinois | 70,214 | 5,508,990 | ||||||
IntercontinentalExchange Group, Inc. | 28,945 | 6,510,309 | ||||||
JPMorgan Chase & Co. | 411,814 | $ | 24,082,883 | |||||
Leucadia National Corp. | 19,734 | 559,262 | ||||||
McGraw Hill Financial, Inc. | 17,051 | 1,333,388 | ||||||
Moody’s Corp. | 11,917 | 935,127 | ||||||
NASDAQ OMX Group, Inc. | 7,275 | 289,545 | ||||||
|
| |||||||
| 74,956,121 | ||||||||
|
| |||||||
Insurance (3.2%) | ||||||||
ACE Ltd. | 142,637 | 14,767,209 | ||||||
Aflac, Inc. | 29,349 | 1,960,513 | ||||||
Allstate Corp. | 28,640 | 1,562,026 | ||||||
American International Group, Inc. | 92,721 | 4,733,407 | ||||||
Aon plc | 123,299 | 10,343,553 | ||||||
Assurant, Inc. | 4,575 | 303,643 | ||||||
Berkshire Hathaway, Inc., Class B* | 113,361 | 13,440,080 | ||||||
Chubb Corp. | 15,852 | 1,531,779 | ||||||
Cincinnati Financial Corp. | 9,281 | 486,046 | ||||||
Genworth Financial, Inc., Class A* | 31,109 | 483,123 | ||||||
Hartford Financial Services Group, Inc. . | 28,149 | 1,019,838 | ||||||
Lincoln National Corp. | 16,517 | 852,607 | ||||||
Loews Corp. | 19,257 | 928,958 | ||||||
Marsh & McLennan Cos., Inc. | 161,102 | 7,790,893 | ||||||
MetLife, Inc. | 70,597 | 3,806,590 | ||||||
Principal Financial Group, Inc. | 17,235 | 849,858 | ||||||
Progressive Corp. | 151,775 | 4,138,904 | ||||||
Prudential Financial, Inc. | 29,156 | 2,688,766 | ||||||
Torchmark Corp. | 5,691 | 444,752 | ||||||
Travelers Cos., Inc. | 22,925 | 2,075,629 | ||||||
Unum Group | 16,440 | 576,715 | ||||||
XL Group plc | 17,802 | 566,816 | ||||||
|
| |||||||
| 75,351,705 | ||||||||
|
| |||||||
Real Estate Investment Trusts (REITs) (1.5%) |
| |||||||
American Tower Corp. (REIT) | 238,643 | 19,048,484 | ||||||
Apartment Investment & Management | ||||||||
Co. (REIT), Class A | 9,179 | 237,828 | ||||||
AvalonBay Communities, Inc. (REIT) | 7,659 | 905,524 | ||||||
Boston Properties, Inc. (REIT) | 9,628 | 966,362 | ||||||
Equity Residential (REIT) | 21,104 | 1,094,665 | ||||||
General Growth Properties, Inc. (REIT). | 33,843 | 679,229 | ||||||
HCP, Inc. (REIT) | 28,728 | 1,043,401 | ||||||
Health Care REIT, Inc. (REIT) | 18,180 | 973,903 | ||||||
Host Hotels & Resorts, Inc. (REIT) | 47,630 | 925,927 | ||||||
Kimco Realty Corp. (REIT) | 25,788 | 509,313 | ||||||
Macerich Co. (REIT) | 8,846 | 520,941 | ||||||
Plum Creek Timber Co., Inc. (REIT) | 11,142 | 518,214 | ||||||
Prologis, Inc. (REIT) | 31,401 | 1,160,267 | ||||||
Public Storage (REIT) | 9,101 | 1,369,883 | ||||||
Simon Property Group, Inc. (REIT) | 19,542 | 2,973,511 | ||||||
Ventas, Inc. (REIT) | 18,516 | 1,060,596 | ||||||
See Notes to Financial Statements.
29
EQ ADVISORS TRUST
EQ/LARGE CAP CORE PLUS PORTFOLIO
PORTFOLIO OF INVESTMENTS (Continued)
December 31, 2013
| Number of Shares | Value (Note 1) | |||||||
Vornado Realty Trust (REIT) | 10,952 | $ | 972,428 | |||||
Weyerhaeuser Co. (REIT) | 36,692 | 1,158,366 | ||||||
|
| |||||||
| 36,118,842 | ||||||||
|
| |||||||
Real Estate Management & Development (0.0%) |
| |||||||
CBRE Group, Inc., Class A* | 17,520 | 460,776 | ||||||
|
| |||||||
Thrifts & Mortgage Finance (0.0%) |
| |||||||
Hudson City Bancorp, Inc. | 29,921 | 282,155 | ||||||
People’s United Financial, Inc. | 19,996 | 302,340 | ||||||
|
| |||||||
| 584,495 | ||||||||
|
| |||||||
Total Financials | 286,159,713 | |||||||
|
| |||||||
Health Care (9.3%) | ||||||||
Biotechnology (2.5%) | ||||||||
Alexion Pharmaceuticals, Inc.* | 12,346 | 1,642,759 | ||||||
Amgen, Inc. | 47,491 | 5,421,573 | ||||||
Biogen Idec, Inc.* | 14,875 | 4,161,281 | ||||||
Celgene Corp.* | 25,950 | 4,384,512 | ||||||
Gilead Sciences, Inc.* | 434,996 | 32,689,949 | ||||||
Regeneron Pharmaceuticals, Inc.* | 4,946 | 1,361,337 | ||||||
Seattle Genetics, Inc.* | 223,127 | 8,900,536 | ||||||
Vertex Pharmaceuticals, Inc.* | 14,722 | 1,093,845 | ||||||
|
| |||||||
| 59,655,792 | ||||||||
|
| |||||||
Health Care Equipment & Supplies (1.4%) |
| |||||||
Abbott Laboratories | 97,369 | 3,732,154 | ||||||
Baxter International, Inc. | 152,824 | 10,628,909 | ||||||
Becton, Dickinson and Co. | 12,221 | 1,350,298 | ||||||
Boston Scientific Corp.* | 84,066 | 1,010,473 | ||||||
C.R. Bard, Inc. | 4,903 | 656,708 | ||||||
CareFusion Corp.* | 13,303 | 529,726 | ||||||
Covidien plc | 103,661 | 7,059,314 | ||||||
DENTSPLY International, Inc. | 8,978 | 435,254 | ||||||
Edwards Lifesciences Corp.* | 6,886 | 452,823 | ||||||
Intuitive Surgical, Inc.* | 2,396 | 920,256 | ||||||
Medtronic, Inc. | 62,870 | 3,608,109 | ||||||
St. Jude Medical, Inc. | 18,378 | 1,138,517 | ||||||
Stryker Corp. | 18,585 | 1,396,477 | ||||||
Varian Medical Systems, Inc.* | 6,654 | 516,949 | ||||||
Zimmer Holdings, Inc. | 10,768 | 1,003,470 | ||||||
|
| |||||||
| 34,439,437 | ||||||||
|
| |||||||
Health Care Providers & Services (1.3%) |
| |||||||
Aetna, Inc. | 23,140 | 1,587,173 | ||||||
AmerisourceBergen Corp. | 14,483 | 1,018,300 | ||||||
Cardinal Health, Inc. | 21,506 | 1,436,816 | ||||||
Centene Corp.* | 50,730 | 2,990,533 | ||||||
Cigna Corp. | 17,405 | 1,522,589 | ||||||
DaVita HealthCare Partners, Inc.* | 11,114 | 704,294 | ||||||
Express Scripts Holding Co.* | 116,851 | 8,207,614 | ||||||
Humana, Inc. | 9,816 | 1,013,208 | ||||||
Laboratory Corp. of America Holdings* | 5,501 | 502,626 | ||||||
McKesson Corp. | 14,467 | 2,334,974 | ||||||
Molina Healthcare, Inc.* | 100,308 | 3,485,703 | ||||||
Patterson Cos., Inc. | 5,244 | 216,053 | ||||||
Quest Diagnostics, Inc. | 9,154 | 490,105 | ||||||
Tenet Healthcare Corp.* | 6,242 | 262,913 | ||||||
UnitedHealth Group, Inc. | 63,400 | $ | 4,774,020 | |||||
WellPoint, Inc. | 18,602 | 1,718,639 | ||||||
|
| |||||||
| 32,265,560 | ||||||||
|
| |||||||
Health Care Technology (0.4%) | ||||||||
Cerner Corp.* | 152,541 | 8,502,635 | ||||||
|
| |||||||
Life Sciences Tools & Services (0.2%) |
| |||||||
Agilent Technologies, Inc. | 20,828 | 1,191,153 | ||||||
Life Technologies Corp.* | 10,870 | 823,946 | ||||||
PerkinElmer, Inc. | 7,078 | 291,826 | ||||||
Thermo Fisher Scientific, Inc. | 22,756 | 2,533,881 | ||||||
Waters Corp.* | 5,358 | 535,800 | ||||||
|
| |||||||
| 5,376,606 | ||||||||
|
| |||||||
Pharmaceuticals (3.5%) | ||||||||
AbbVie, Inc. | 100,190 | 5,291,034 | ||||||
Actavis plc.* | 10,961 | 1,841,448 | ||||||
Allergan, Inc. | 18,712 | 2,078,529 | ||||||
Bristol-Myers Squibb Co. | 311,647 | 16,564,038 | ||||||
Eli Lilly and Co. | 62,435 | 3,184,185 | ||||||
Forest Laboratories, Inc.* | 14,931 | 896,308 | ||||||
Hospira, Inc.* | 10,440 | 430,963 | ||||||
Johnson & Johnson | 177,687 | 16,274,352 | ||||||
Merck & Co., Inc. | 184,013 | 9,209,851 | ||||||
Mylan, Inc.* | 24,105 | 1,046,157 | ||||||
Perrigo Co. plc | 8,378 | 1,285,688 | ||||||
Pfizer, Inc. | 849,302 | 26,014,120 | ||||||
Zoetis, Inc. | 31,481 | 1,029,114 | ||||||
|
| |||||||
| 85,145,787 | ||||||||
|
| |||||||
Total Health Care | 225,385,817 | |||||||
|
| |||||||
Industrials (9.0%) | ||||||||
Aerospace & Defense (2.6%) | ||||||||
B/E Aerospace, Inc.* | 70,036 | 6,095,233 | ||||||
Boeing Co. | 159,023 | 21,705,049 | ||||||
General Dynamics Corp. | 21,072 | 2,013,430 | ||||||
Hexcel Corp.* | 153,025 | 6,838,687 | ||||||
Honeywell International, Inc. | 122,826 | 11,222,612 | ||||||
L-3 Communications Holdings, Inc. | 5,579 | 596,172 | ||||||
Lockheed Martin Corp. | 16,943 | 2,518,746 | ||||||
Northrop Grumman Corp. | 13,978 | 1,602,019 | ||||||
Precision Castparts Corp. | 9,147 | 2,463,287 | ||||||
Raytheon Co. | 20,117 | 1,824,612 | ||||||
Rockwell Collins, Inc. | 8,506 | 628,763 | ||||||
Textron, Inc. | 17,698 | 650,578 | ||||||
United Technologies Corp. | 53,162 | 6,049,836 | ||||||
|
| |||||||
| 64,209,024 | ||||||||
|
| |||||||
Air Freight & Logistics (0.3%) | ||||||||
C.H. Robinson Worldwide, Inc. | 9,545 | 556,856 | ||||||
Expeditors International of Washington, Inc. | 12,941 | 572,639 | ||||||
FedEx Corp. | 18,743 | 2,694,681 | ||||||
United Parcel Service, Inc., Class B | 45,016 | 4,730,281 | ||||||
|
| |||||||
| 8,554,457 | ||||||||
|
| |||||||
See Notes to Financial Statements.
30
EQ ADVISORS TRUST
EQ/LARGE CAP CORE PLUS PORTFOLIO
PORTFOLIO OF INVESTMENTS (Continued)
December 31, 2013
| Number of Shares | Value (Note 1) | |||||||
Airlines (0.1%) | ||||||||
Delta Air Lines, Inc. | 53,871 | $ | 1,479,836 | |||||
Southwest Airlines Co | 43,863 | 826,379 | ||||||
|
| |||||||
| 2,306,215 | ||||||||
|
| |||||||
Building Products (0.0%) | ||||||||
Allegion plc* | 5,619 | 248,289 | ||||||
Masco Corp. | 22,469 | 511,619 | ||||||
|
| |||||||
| 759,908 | ||||||||
|
| |||||||
Commercial Services & Supplies (0.6%) |
| |||||||
ADT Corp. | 12,588 | 509,436 | ||||||
Cintas Corp. | 6,337 | 377,622 | ||||||
Iron Mountain, Inc. | 180,344 | 5,473,441 | ||||||
Pitney Bowes, Inc. | 12,709 | 296,120 | ||||||
Republic Services, Inc. | 17,000 | 564,400 | ||||||
Stericycle, Inc.* | 5,395 | 626,737 | ||||||
Tyco International Ltd | 29,304 | 1,202,636 | ||||||
Waste Connections, Inc. | 102,263 | 4,461,735 | ||||||
Waste Management, Inc. | 27,474 | 1,232,758 | ||||||
|
| |||||||
| 14,744,885 | ||||||||
|
| |||||||
Construction & Engineering (0.1%) |
| |||||||
Fluor Corp. | 10,284 | 825,703 | ||||||
Jacobs Engineering Group, Inc.* | 8,290 | 522,187 | ||||||
Quanta Services, Inc.* | 13,595 | 429,058 | ||||||
|
| |||||||
| 1,776,948 | ||||||||
|
| |||||||
Electrical Equipment (1.0%) | ||||||||
AMETEK, Inc. | 15,409 | 811,592 | ||||||
Eaton Corp. plc | 169,149 | 12,875,622 | ||||||
Emerson Electric Co. | 44,330 | 3,111,080 | ||||||
Polypore International, Inc.* | 138,819 | 5,400,059 | ||||||
Rockwell Automation, Inc. | 8,731 | 1,031,655 | ||||||
Roper Industries, Inc. | 6,252 | 867,027 | ||||||
|
| |||||||
| 24,097,035 | ||||||||
|
| |||||||
Industrial Conglomerates (2.0%) | ||||||||
3M Co. | 40,279 | 5,649,130 | ||||||
Danaher Corp. | 127,789 | 9,865,311 | ||||||
General Electric Co. | 1,145,617 | 32,111,644 | ||||||
|
| |||||||
| 47,626,085 | ||||||||
|
| |||||||
Machinery (1.1%) | ||||||||
Caterpillar, Inc. | 77,485 | 7,036,413 | ||||||
Cummins, Inc. | 10,972 | 1,546,723 | ||||||
Deere & Co. | 24,108 | 2,201,784 | ||||||
Dover Corp. | 10,726 | 1,035,488 | ||||||
Flowserve Corp. | 8,780 | 692,127 | ||||||
IDEX Corp. | 64,737 | 4,780,827 | ||||||
Illinois Tool Works, Inc. | 25,713 | 2,161,949 | ||||||
Ingersoll-Rand plc | 16,868 | 1,039,069 | ||||||
Joy Global, Inc. | 6,688 | 391,181 | ||||||
PACCAR, Inc. | 22,295 | 1,319,195 | ||||||
Pall Corp. | 6,974 | 595,231 | ||||||
Parker Hannifin Corp. | 9,396 | 1,208,701 | ||||||
Pentair Ltd. (Registered) | 12,550 | 974,759 | ||||||
Snap-on, Inc. | 3,660 | 400,843 | ||||||
Stanley Black & Decker, Inc. | 9,772 | 788,503 | ||||||
Xylem, Inc. | 11,611 | 401,741 | ||||||
|
| |||||||
| 26,574,534 | ||||||||
|
| |||||||
Professional Services (0.6%) | ||||||||
Dun & Bradstreet Corp. | 2,401 | $ | 294,722 | |||||
Equifax, Inc. | 7,664 | 529,506 | ||||||
Nielsen Holdings N.V. | 150,035 | 6,885,106 | ||||||
Robert Half International, Inc. | 8,722 | 366,237 | ||||||
Towers Watson & Co., Class A | 44,700 | 5,704,167 | ||||||
|
| |||||||
| 13,779,738 | ||||||||
|
| |||||||
Road & Rail (0.5%) | ||||||||
CSX Corp. | 63,830 | 1,836,389 | ||||||
Kansas City Southern | 6,938 | 859,133 | ||||||
Norfolk Southern Corp. | 39,836 | 3,697,976 | ||||||
Ryder System, Inc. | 3,312 | 244,359 | ||||||
Union Pacific Corp. | 29,004 | 4,872,672 | ||||||
|
| |||||||
| 11,510,529 | ||||||||
|
| |||||||
Trading Companies & Distributors (0.1%) |
| |||||||
Fastenal Co. | 17,187 | 816,554 | ||||||
W.W. Grainger, Inc. | 3,890 | 993,584 | ||||||
|
| |||||||
| 1,810,138 | ||||||||
|
| |||||||
Total Industrials | 217,749,496 | |||||||
|
| |||||||
Information Technology (12.6%) | ||||||||
Communications Equipment (1.0%) |
| |||||||
Cisco Systems, Inc. | 578,259 | 12,981,915 | ||||||
F5 Networks, Inc.* | 4,884 | 443,760 | ||||||
Harris Corp. | 6,727 | 469,612 | ||||||
Juniper Networks, Inc.* | 31,791 | 717,523 | ||||||
Motorola Solutions, Inc. | 14,497 | 978,547 | ||||||
QUALCOMM, Inc. | 106,394 | 7,899,754 | ||||||
|
| |||||||
| 23,491,111 | ||||||||
|
| |||||||
Computers & Peripherals (2.6%) | ||||||||
Apple, Inc. | 82,112 | 46,073,864 | ||||||
EMC Corp. | 129,588 | 3,259,138 | ||||||
Hewlett-Packard Co. | 121,024 | 3,386,252 | ||||||
NetApp, Inc. | 21,457 | 882,741 | ||||||
SanDisk Corp. | 14,222 | 1,003,220 | ||||||
Seagate Technology plc | 20,540 | 1,153,526 | ||||||
Western Digital Corp. | 80,083 | 6,718,964 | ||||||
|
| |||||||
| 62,477,705 | ||||||||
|
| |||||||
Electronic Equipment, Instruments & Components (0.3%) |
| |||||||
Amphenol Corp., Class A | 9,965 | 888,679 | ||||||
Corning, Inc. | 91,127 | 1,623,883 | ||||||
FLIR Systems, Inc. | 8,912 | 268,251 | ||||||
Jabil Circuit, Inc. | 200,413 | 3,495,203 | ||||||
TE Connectivity Ltd. | 25,839 | 1,423,987 | ||||||
|
| |||||||
| 7,700,003 | ||||||||
|
| |||||||
Internet Software & Services (2.1%) |
| |||||||
Akamai Technologies, Inc.* | 11,272 | 531,813 | ||||||
eBay, Inc.* | 73,373 | 4,027,444 | ||||||
Facebook, Inc., Class A* | 103,583 | 5,661,847 | ||||||
Google, Inc., Class A* | 23,812 | 26,686,346 | ||||||
Twitter, Inc.* | 21,500 | 1,368,475 | ||||||
VeriSign, Inc.* | 157,382 | 9,408,296 | ||||||
Yahoo!, Inc.* | 59,409 | 2,402,500 | ||||||
|
| |||||||
| 50,086,721 | ||||||||
|
| |||||||
See Notes to Financial Statements.
31
EQ ADVISORS TRUST
EQ/LARGE CAP CORE PLUS PORTFOLIO
PORTFOLIO OF INVESTMENTS (Continued)
December 31, 2013
| Number of Shares | Value (Note 1) | |||||||
IT Services (2.1%) | ||||||||
Accenture plc, Class A | 66,486 | $ | 5,466,479 | |||||
Alliance Data Systems Corp.* | 3,068 | 806,669 | ||||||
Automatic Data Processing, Inc. | 30,316 | 2,449,836 | ||||||
Cognizant Technology Solutions Corp., Class A* | 19,051 | 1,923,770 | ||||||
Computer Sciences Corp. | 9,266 | 517,784 | ||||||
Fidelity National Information Services, Inc. | 18,330 | 983,955 | ||||||
Fiserv, Inc.* | 16,245 | 959,267 | ||||||
International Business Machines Corp. | 64,281 | 12,057,187 | ||||||
Jack Henry & Associates, Inc. | 67,659 | 4,006,089 | ||||||
MasterCard, Inc., Class A | 6,520 | 5,447,199 | ||||||
Paychex, Inc. | 20,463 | 931,681 | ||||||
Teradata Corp.* | 10,284 | 467,819 | ||||||
Total System Services, Inc. | 10,509 | 349,740 | ||||||
Visa, Inc., Class A | 62,118 | 13,832,436 | ||||||
Western Union Co. | 34,763 | 599,662 | ||||||
|
| |||||||
| 50,799,573 | ||||||||
|
| |||||||
Office Electronics (0.0%) | ||||||||
Xerox Corp. | 72,858 | 886,682 | ||||||
|
| |||||||
Semiconductors & Semiconductor Equipment (2.0%) |
| |||||||
Altera Corp. | 20,224 | 657,887 | ||||||
Analog Devices, Inc. | 19,584 | 997,413 | ||||||
Applied Materials, Inc. | 75,821 | 1,341,273 | ||||||
ASML Holding N.V. | 46,941 | 4,398,372 | ||||||
Avago Technologies Ltd. | 80,900 | 4,278,801 | ||||||
Broadcom Corp., Class A | 272,820 | 8,089,113 | ||||||
First Solar, Inc.* | 4,446 | 242,929 | ||||||
Intel Corp. | 313,055 | 8,126,908 | ||||||
KLA-Tencor Corp. | 10,495 | 676,508 | ||||||
Lam Research Corp.* | 10,222 | 556,588 | ||||||
Linear Technology Corp. | 14,747 | 671,726 | ||||||
LSI Corp. | 34,294 | 377,920 | ||||||
Microchip Technology, Inc. | 12,493 | 559,062 | ||||||
Micron Technology, Inc.* | 66,244 | 1,441,469 | ||||||
NVIDIA Corp. | 36,421 | 583,464 | ||||||
ON Semiconductor Corp.* | 472,254 | 3,891,373 | ||||||
Texas Instruments, Inc. | 239,715 | 10,525,886 | ||||||
Xilinx, Inc. | 16,898 | 775,956 | ||||||
|
| |||||||
| 48,192,648 | ||||||||
|
| |||||||
Software (2.5%) | ||||||||
Adobe Systems, Inc.* | 29,274 | 1,752,927 | ||||||
Autodesk, Inc.* | 14,208 | 715,089 | ||||||
CA, Inc. | 20,454 | 688,277 | ||||||
Citrix Systems, Inc.* | 11,734 | 742,176 | ||||||
Electronic Arts, Inc.* | 19,468 | 446,596 | ||||||
Intuit, Inc. | 17,936 | 1,368,876 | ||||||
Microsoft Corp. | 478,418 | 17,907,186 | ||||||
Oracle Corp. | 691,209 | 26,445,656 | ||||||
Red Hat, Inc.* | 11,929 | 668,501 | ||||||
Salesforce.com, Inc.* | 34,938 | 1,928,228 | ||||||
Symantec Corp. | 228,573 | 5,389,751 | ||||||
Workday, Inc., Class A* | 22,602 | 1,879,582 | ||||||
|
| |||||||
| 59,932,845 | ||||||||
|
| |||||||
Total Information Technology | 303,567,288 | |||||||
|
| |||||||
Materials (2.7%) | ||||||||
Chemicals (2.0%) | ||||||||
Air Products and Chemicals, | 29,327 | $ | 3,278,172 | |||||
Airgas, Inc. | 4,180 | 467,533 | ||||||
CF Industries Holdings, Inc. | 3,608 | 840,808 | ||||||
Dow Chemical Co. | 76,378 | 3,391,183 | ||||||
E.I. du Pont de Nemours & Co. | 58,320 | 3,789,051 | ||||||
Eastman Chemical Co. | 9,690 | 781,983 | ||||||
Ecolab, Inc. | 17,075 | 1,780,410 | ||||||
FMC Corp. | 8,390 | 633,109 | ||||||
International Flavors & Fragrances, Inc. | 5,130 | 441,077 | ||||||
LyondellBasell Industries N.V., Class A | 94,505 | 7,586,862 | ||||||
Monsanto Co. | 128,659 | 14,995,207 | ||||||
Mosaic Co. | 81,206 | 3,838,608 | ||||||
PPG Industries, Inc. | 8,943 | 1,696,129 | ||||||
Praxair, Inc. | 18,536 | 2,410,236 | ||||||
Sherwin-Williams Co. | 5,423 | 995,121 | ||||||
Sigma-Aldrich Corp. | 7,533 | 708,177 | ||||||
|
| |||||||
| 47,633,666 | ||||||||
|
| |||||||
Construction Materials (0.0%) | ||||||||
Vulcan Materials Co. | 8,182 | 486,174 | ||||||
|
| |||||||
Containers & Packaging (0.1%) | ||||||||
Avery Dennison Corp. | 6,079 | 305,105 | ||||||
Ball Corp. | 9,103 | 470,261 | ||||||
Bemis Co., Inc. | 6,476 | 265,257 | ||||||
MeadWestvaco Corp. | 11,195 | 413,431 | ||||||
Owens-Illinois, Inc.* | 10,391 | 371,790 | ||||||
Sealed Air Corp. | 12,346 | 420,381 | ||||||
|
| |||||||
| 2,246,225 | ||||||||
|
| |||||||
Metals & Mining (0.6%) | ||||||||
Alcoa, Inc. | 67,334 | 715,761 | ||||||
Allegheny Technologies, Inc. | 96,879 | 3,451,799 | ||||||
Barrick Gold Corp. | 72,756 | 1,282,688 | ||||||
Cliffs Natural Resources, Inc. | 40,524 | 1,062,134 | ||||||
Freeport-McMoRan Copper & Gold, Inc. | 101,026 | 3,812,721 | ||||||
Newmont Mining Corp. | 31,343 | 721,829 | ||||||
Nucor Corp. | 56,145 | 2,997,020 | ||||||
United States Steel Corp. | 9,101 | 268,480 | ||||||
|
| |||||||
| 14,312,432 | ||||||||
|
| |||||||
Paper & Forest Products (0.0%) | ||||||||
International Paper Co. | 27,933 | 1,369,555 | ||||||
|
| |||||||
Total Materials | 66,048,052 | |||||||
|
| |||||||
Telecommunication Services (1.7%) |
| |||||||
Diversified Telecommunication Services (1.2%) |
| |||||||
AT&T, Inc. | 331,763 | 11,664,787 | ||||||
CenturyLink, Inc. | 75,641 | 2,409,166 | ||||||
Frontier Communications Corp. | 62,892 | 292,448 | ||||||
Verizon Communications, Inc. | 276,823 | 13,603,082 | ||||||
Windstream Holdings, Inc. | 37,540 | 299,569 | ||||||
|
| |||||||
| 28,269,052 | ||||||||
|
| |||||||
See Notes to Financial Statements.
32
EQ ADVISORS TRUST
EQ/LARGE CAP CORE PLUS PORTFOLIO
PORTFOLIO OF INVESTMENTS (Continued)
December 31, 2013
| Number of Shares | Value (Note 1) | |||||||
Wireless Telecommunication Services (0.5%) |
| |||||||
Crown Castle International Corp.* | 21,039 | $ | 1,544,894 | |||||
Vodafone Group plc (ADR) | 266,368 | 10,470,926 | ||||||
|
| |||||||
| 12,015,820 | ||||||||
|
| |||||||
Total Telecommunication Services | 40,284,872 | |||||||
|
| |||||||
Utilities (1.9%) | ||||||||
Electric Utilities (1.0%) | ||||||||
American Electric Power Co., Inc. | 30,683 | 1,434,123 | ||||||
Duke Energy Corp. | 44,458 | 3,068,047 | ||||||
Edison International | 71,713 | 3,320,312 | ||||||
Entergy Corp. | 11,226 | 710,269 | ||||||
Exelon Corp. | 226,307 | 6,198,549 | ||||||
FirstEnergy Corp. | 26,331 | 868,396 | ||||||
NextEra Energy, Inc. | 27,124 | 2,322,357 | ||||||
Northeast Utilities | 19,838 | 840,933 | ||||||
Pepco Holdings, Inc. | 15,729 | 300,896 | ||||||
Pinnacle West Capital Corp. | 6,925 | 366,471 | ||||||
PPL Corp. | 39,683 | 1,194,061 | ||||||
Southern Co. | 55,531 | 2,282,879 | ||||||
Xcel Energy, Inc | 31,331 | 875,388 | ||||||
|
| |||||||
| 23,782,681 | ||||||||
|
| |||||||
Gas Utilities (0.0%) | ||||||||
AGL Resources, Inc. | 7,475 | 353,044 | ||||||
ONEOK, Inc. | 12,987 | 807,532 | ||||||
|
| |||||||
| 1,160,576 | ||||||||
|
| |||||||
Independent Power Producers & Energy Traders (0.3%) |
| |||||||
AES Corp. | 41,354 | 600,046 | ||||||
Calpine Corp.* | 113,359 | 2,211,634 | ||||||
NRG Energy, Inc. | 185,044 | 5,314,464 | ||||||
|
| |||||||
| 8,126,144 | ||||||||
|
| |||||||
Multi-Utilities (0.6%) | ||||||||
Ameren Corp. | 15,273 | 552,272 | ||||||
CenterPoint Energy, Inc. | 26,983 | 625,466 | ||||||
CMS Energy Corp. | 16,742 | 448,183 | ||||||
Consolidated Edison, Inc. | 18,441 | 1,019,419 | ||||||
Dominion Resources, Inc. | 36,551 | 2,364,484 | ||||||
DTE Energy Co. | 11,134 | 739,186 | ||||||
Integrys Energy Group, Inc. | 5,021 | 273,193 | ||||||
NiSource, Inc. | 19,722 | 648,459 | ||||||
PG&E Corp. | 79,991 | 3,222,038 | ||||||
Public Service Enterprise Group, Inc. | 31,850 | 1,020,474 | ||||||
SCANA Corp. | 8,852 | 415,424 | ||||||
Sempra Energy | 14,311 | 1,284,555 | ||||||
TECO Energy, Inc. | 12,848 | 221,500 | ||||||
Wisconsin Energy Corp. | 14,259 | 589,467 | ||||||
|
| |||||||
| 13,424,120 | ||||||||
|
| |||||||
Total Utilities | 46,493,521 | |||||||
|
| |||||||
Total Common Stocks (74.1%) | 1,787,124,745 | |||||||
|
| |||||||
INVESTMENT COMPANIES: | ||||||||
Exchange Traded Funds (ETFs)(5.4%) |
| |||||||
iShares® Core S&P 500 ETF | 244,444 | $ | 45,381,029 | |||||
iShares® Morningstar Large-Cap ETF | 131,702 | 14,202,744 | ||||||
iShares® Morningstar Large-Cap Growth ETF | 40,098 | 4,009,399 | ||||||
iShares® Morningstar Large-Cap Value ETF | 25,863 | 2,079,385 | ||||||
iShares® NYSE 100 ETF | 5,536 | 468,888 | ||||||
iShares® Russell 1000 ETF | 198,599 | 20,489,459 | ||||||
iShares® Russell 1000 Growth ETF | 25,197 | 2,165,682 | ||||||
iShares® Russell 1000 Value ETF | 14,025 | 1,320,594 | ||||||
iShares® S&P 100 ETF | 83,815 | 6,902,165 | ||||||
iShares® S&P 500 Growth ETF | 27,748 | 2,739,560 | ||||||
iShares® S&P 500 Value ETF | 22,346 | 1,909,689 | ||||||
Vanguard Growth ETF | 44,300 | 4,122,115 | ||||||
Vanguard Large-Cap ETF | 280,213 | 23,762,062 | ||||||
Vanguard Value ETF | 11,300 | 863,207 | ||||||
|
| |||||||
Total Investment Companies (5.4%) (Cost $93,539,422) | 130,415,978 | |||||||
|
| |||||||
Total Investments (79.5%) | 1,917,540,723 | |||||||
Other Assets Less | 494,245,645 | |||||||
|
| |||||||
Net Assets (100%) | $ | 2,411,786,368 | ||||||
|
| |||||||
| * | Non-income producing. |
Glossary:
| ADR | — American Depositary Receipt |
33
EQ ADVISORS TRUST
EQ/LARGE CAP CORE PLUS PORTFOLIO
PORTFOLIO OF INVESTMENTS (Continued)
December 31, 2013
At December 31, 2013, the Portfolio had the following futures contracts open: (Note 1)
Purchase | Number of Contracts | Expiration Date | Original Value | Value at 12/31/2013 | Unrealized Appreciation/ (Depreciation) | |||||||||||||||
S&P 500 E-Mini Index | 5,238 | March-14 | $ | 471,103,089 | $ | 482,184,090 | $ | 11,081,001 | ||||||||||||
|
| |||||||||||||||||||
The following is a summary of the inputs used to value the Portfolio’s assets and liabilities carried at fair value as of December 31, 2013:
The inputs or methodology used for valuing securities are not necessarily an indication of the risk associated with investing in those securities.
Various inputs are used in determining the value of the Portfolio’s investments. These inputs are summarized in the three broad levels listed below:
| Investment Type | Level 1 Securities | Level 2 Significant Other Observable Inputs (including quoted prices for similar securities, interest rates, prepayment speeds, credit risk, etc.)(a) | Level 3 Significant unobservable Inputs (including the Portfolio’s own assumptions in determining the fair value of investments) | Total | ||||||||||||
Assets: |
| |||||||||||||||
Common Stocks | ||||||||||||||||
Consumer Discretionary | $ | 284,624,841 | $ | — | $ | — | $ | 284,624,841 | ||||||||
Consumer Staples | 129,242,364 | 770,890 | — | 130,013,254 | ||||||||||||
Energy | 186,797,891 | — | — | 186,797,891 | ||||||||||||
Financials | 286,159,713 | — | — | 286,159,713 | ||||||||||||
Health Care | 225,385,817 | — | — | 225,385,817 | ||||||||||||
Industrials | 217,749,496 | — | — | 217,749,496 | ||||||||||||
Information Technology | 303,567,288 | — | — | 303,567,288 | ||||||||||||
Materials | 66,048,052 | — | — | 66,048,052 | ||||||||||||
Telecommunication Services | 40,284,872 | — | — | 40,284,872 | ||||||||||||
Utilities | 46,493,521 | — | — | 46,493,521 | ||||||||||||
Futures | 11,081,001 | — | — | 11,081,001 | ||||||||||||
Investment Companies | ||||||||||||||||
Exchange Traded Funds (ETFs) | 130,415,978 | — | — | 130,415,978 | ||||||||||||
|
|
|
|
|
|
|
| |||||||||
Total Assets | $ | 1,927,850,834 | $ | 770,890 | $ | — | $ | 1,928,621,724 | ||||||||
|
|
|
|
|
|
|
| |||||||||
Total Liabilities | $ | — | $ | — | $ | — | $ | — | ||||||||
|
|
|
|
|
|
|
| |||||||||
Total | $ | 1,927,850,834 | $ | 770,890 | $ | — | $ | 1,928,621,724 | ||||||||
|
|
|
|
|
|
|
| |||||||||
| (a) | A security with a market value of $770, 890 transferred from Level 1 to Level 2 during the year ended December 31, 2013 due to inactive trading. |
There were no additional transfers between Levels 1, 2 or 3 during the year ended December 31, 2013.
See Notes to Financial Statements.
34
EQ ADVISORS TRUST
EQ/LARGE CAP CORE PLUS PORTFOLIO
PORTFOLIO OF INVESTMENTS (Continued)
December 31, 2013
Fair Values of Derivative Instruments as of December 31, 2013:
Statement of Assets and Liabilities | ||||||
Derivatives Not Accounted for as | Asset Derivatives | Fair Value | ||||
Interest rate contracts | Receivables, Net assets - Unrealized appreciation | $ | — | * | ||
Foreign exchange contracts | Receivables | — | ||||
Credit contracts | Receivables | — | ||||
Equity contracts | Receivables, Net assets - Unrealized appreciation | 11,081,001 | * | |||
Commodity contracts | Receivables | — | ||||
Other contracts | Receivables | — | ||||
|
| |||||
Total | $ | 11,081,001 | ||||
|
| |||||
Liability Derivatives | ||||||
Interest rate contracts | Payables, Net assets - Unrealized depreciation | $ | — | * | ||
Foreign exchange contracts | Payables | — | ||||
Credit contracts | Payables | — | ||||
Equity contracts | Payables, Net assets - Unrealized depreciation | — | * | |||
Commodity contracts | Payables | — | ||||
Other contracts | Payables | — | ||||
|
| |||||
Total | $ | — | ||||
|
| |||||
| * | Includes cumulative appreciation/depreciation of futures contracts as reported in the Portfolio of Investments. Only current day’s variation margin is reported within the Statement of Assets & Liabilities. |
The effect of Derivative Instruments on the Statement of Operations for the year ended December 31, 2013:
| Amount of Realized Gain or (Loss) on Derivatives Recognized in Income | ||||||||||||||||||||
Derivatives Not Accounted for as Hedging Instruments^ | Options | Futures | Forward Currency Contracts | Swaps | Total | |||||||||||||||
Interest rate contracts | $ | — | $ | — | $ | — | $ | — | $ | — | ||||||||||
Foreign exchange contracts | — | — | — | — | — | |||||||||||||||
Credit contracts | — | — | — | — | — | |||||||||||||||
Equity contracts | — | 74,950,692 | — | — | 74,950,692 | |||||||||||||||
Commodity contracts | — | — | — | — | — | |||||||||||||||
Other contracts | — | — | — | — | — | |||||||||||||||
|
|
|
|
|
|
|
|
|
| |||||||||||
Total | $ | — | $ | 74,950,692 | $ | — | $ | — | $ | 74,950,692 | ||||||||||
|
|
|
|
|
|
|
|
|
| |||||||||||
| Amount of Unrealized Appreciation or (Depreciation) on Derivatives Recognized in Income | ||||||||||||||||||||
Derivatives Not Accounted for as Hedging Instruments^ | Options | Futures | Forward Currency Contracts | Swaps | Total | |||||||||||||||
Interest rate contracts | $ | — | $ | — | $ | — | $ | — | $ | — | ||||||||||
Foreign exchange contracts | — | — | — | — | — | |||||||||||||||
Credit contracts | — | — | — | — | — | |||||||||||||||
Equity contracts | — | 11,325,658 | — | — | 11,325,658 | |||||||||||||||
Commodity contracts | — | — | — | — | — | |||||||||||||||
Other contracts | — | — | — | — | — | |||||||||||||||
|
|
|
|
|
|
|
|
|
| |||||||||||
Total | $ | — | $ | 11,325,658 | $ | — | $ | — | $ | 11,325,658 | ||||||||||
|
|
|
|
|
|
|
|
|
| |||||||||||
^ This Portfolio held futures contracts as a substitute for investing in conventional securities, hedging and in an attempt to enhance returns.
The Portfolio held futures contracts with an average notional balance of approximately $299,432,000 during the year ended December 31, 2013.
See Notes to Financial Statements.
35
EQ ADVISORS TRUST
EQ/LARGE CAP CORE PLUS PORTFOLIO
PORTFOLIO OF INVESTMENTS (Continued)
December 31, 2013
The following table presents the Portfolio’s gross derivative assets and liabilities by counterparty net of amounts available for offset under netting arrangements and any related collateral received or pledged by the Portfolio as of December 31, 2013:
Counterparty | Gross Amount of Derivative Assets Presented in the Statement of Assets and Liabilities (a) | Derivatives Available for Offset | Collateral Received | Net Amount Due from Counterparty | ||||||||||||
Exchange Traded Futures & Options Contracts (b) | $ 11,081,001 | (c) | $ | — | $ | — | $ | 11,081,001 | ||||||||
|
|
|
|
|
|
|
| |||||||||
| (a) | For financial reporting purposes the Portfolio does not offset derivative assets and derivative liabilities subject to master netting arrangements in the Statement of Assets and Liabilities. |
| (b) | These derivatives are traded on an exchange, therefore they are not subject to master netting arrangements. |
| (c) | This amount represents the cumulative appreciation (depreciation) of futures contracts as reported in the Portfolio of Investments. The Statement of Assets and Liabilities only reflects the current day variation margin receivable/payable to brokers for futures contracts. |
Investment security transactions for the year ended December 31, 2013 were as follows:
Cost of Purchases: | ||||
Long-term investments other than U.S. government debt securities | $ | 564,995,993 | ||
Net Proceeds of Sales and Redemptions: | ||||
Long-term investments other than U.S. government debt securities | $ | 1,059,050,424 |
As of December 31, 2013, the gross unrealized appreciation (depreciation) of investments based on the aggregate cost of investments for Federal income tax purposes was as follows:
Aggregate gross unrealized appreciation | $ | 447,076,136 | ||
Aggregate gross unrealized depreciation | (8,067,780 | ) | ||
|
| |||
Net unrealized appreciation | $ | 439,008,356 | ||
|
| |||
Federal income tax cost of investments | $ | 1,478,532,367 | ||
|
|
For the year ended December 31, 2013, the Portfolio incurred approximately $6,832 as brokerage commissions with Sanford C. Bernstein & Co., Inc., an affiliated broker/dealer.
See Notes to Financial Statements.
36
EQ ADVISORS TRUST
EQ/LARGE CAP CORE PLUS PORTFOLIO
STATEMENT OF ASSETS AND LIABILITIES
December 31, 2013
ASSETS | ||||
Investments at value (Cost $1,476,170,638) | $ | 1,917,540,723 | ||
Cash | 472,108,049 | |||
Foreign cash (Cost $7) | 7 | |||
Cash held as collateral at broker | 21,773,000 | |||
Dividends, interest and other receivables | 2,389,966 | |||
Due from broker for futures variation margin | 1,679,034 | |||
Receivable from Separate Accounts for Trust shares sold | 5,336 | |||
Other assets | 2,456 | |||
|
| |||
Total assets | 2,415,498,571 | |||
|
| |||
LIABILITIES | ||||
Payable to Separate Accounts for Trust shares redeemed | 1,834,979 | |||
Investment management fees payable | 994,075 | |||
Distribution fees payable - Class IB | 409,285 | |||
Administrative fees payable | 284,651 | |||
Trustees’ fees payable | 2,461 | |||
Distribution fees payable - Class IA | 259 | |||
Accrued expenses | 186,493 | |||
|
| |||
Total liabilities | 3,712,203 | |||
|
| |||
NET ASSETS | $ | 2,411,786,368 | ||
|
| |||
Net assets were comprised of: | ||||
Paid in capital | $ | 1,950,609,982 | ||
Accumulated undistributed net investment income (loss) | 142,853 | |||
Accumulated undistributed net realized gain (loss) on investments, futures and foreign currency transactions | 8,582,447 | |||
Net unrealized appreciation (depreciation) on investments and futures | 452,451,086 | |||
|
| |||
Net assets | $ | 2,411,786,368 | ||
|
| |||
Class IA | ||||
Net asset value, offering and redemption price per share, $1,160,812 / 133,284 shares outstanding (unlimited amount authorized: $0.01 par value) | $ | 8.71 | ||
|
| |||
Class IB | ||||
Net asset value, offering and redemption price per share, $1,953,736,571 / 224,291,286 shares outstanding (unlimited amount authorized: $0.01 par value) | $ | 8.71 | ||
|
| |||
Class K | ||||
Net asset value, offering and redemption price per share, $456,888,985 / 52,461,008 shares outstanding (unlimited amount authorized: $0.01 par value) | $ | 8.71 | ||
|
|
STATEMENT OF OPERATIONS
For the Year Ended December 31, 2013
INVESTMENT INCOME | ||||
Dividends (net of $48,524 foreign withholding tax) | $ | 24,887,702 | ||
Interest | 276,359 | |||
|
| |||
Total income | 25,164,061 | |||
|
| |||
EXPENSES | ||||
Investment management fees | 7,525,692 | |||
Distribution fees - Class IB | 2,731,977 | |||
Administrative fees | 2,255,180 | |||
Printing and mailing expenses | 180,352 | |||
Custodian fees | 96,000 | |||
Professional fees | 87,990 | |||
Trustees’ fees | 30,462 | |||
Distribution fees - Class IA | 2,674 | |||
Miscellaneous | 15,537 | |||
|
| |||
Gross expenses | 12,925,864 | |||
Less: Fees paid indirectly | (18,766 | ) | ||
|
| |||
Net expenses | 12,907,098 | |||
|
| |||
NET INVESTMENT INCOME (LOSS) | 12,256,963 | |||
|
| |||
REALIZED AND UNREALIZED GAIN (LOSS) | ||||
Realized gain (loss) on: | ||||
Investments | 45,796,584 | |||
Futures | 74,950,692 | |||
Foreign currency transactions | (23,219 | ) | ||
|
| |||
Net realized gain (loss) | 120,724,057 | |||
|
| |||
Change in unrealized appreciation (depreciation) on: | ||||
Investments | 299,760,852 | |||
Futures | 11,325,658 | |||
|
| |||
Net change in unrealized appreciation (depreciation) | 311,086,510 | |||
|
| |||
NET REALIZED AND UNREALIZED GAIN (LOSS) | 431,810,567 | |||
|
| |||
NET INCREASE (DECREASE) IN NET ASSETS RESULTING FROM OPERATIONS | $ | 444,067,530 | ||
|
|
See Notes to Financial Statements.
37
EQ ADVISORS TRUST
EQ/LARGE CAP CORE PLUS PORTFOLIO
STATEMENT OF CHANGES IN NET ASSETS
| Year Ended December 31, | ||||||||
| 2013 | 2012 | |||||||
INCREASE (DECREASE) IN NET ASSETS FROM OPERATIONS: | ||||||||
Net investment income (loss) | $ | 12,256,963 | $ | 7,229,478 | ||||
Net realized gain (loss) on investments, futures and foreign currency transactions | 120,724,057 | 44,952,062 | ||||||
Net change in unrealized appreciation (depreciation) on investments and futures | 311,086,510 | 28,446,576 | ||||||
|
|
|
| |||||
NET INCREASE (DECREASE) IN NET ASSETS RESULTING FROM OPERATIONS | 444,067,530 | 80,628,116 | ||||||
|
|
|
| |||||
DIVIDENDS AND DISTRIBUTIONS: | ||||||||
Dividends from net investment income | ||||||||
Class IA | (5,780 | ) | (10,154 | ) | ||||
Class IB | (8,954,353 | ) | (1,897,322 | ) | ||||
Class K | (3,199,450 | ) | (5,386,656 | ) | ||||
|
|
|
| |||||
| (12,159,583 | ) | (7,294,132 | ) | |||||
|
|
|
| |||||
Distributions from net realized capital gains | ||||||||
Class IA | (48,498 | ) | (69,461 | ) | ||||
Class IB | (75,225,982 | ) | (12,991,477 | ) | ||||
Class K | (17,518,289 | ) | (30,058,176 | ) | ||||
|
|
|
| |||||
| (92,792,769 | ) | (43,119,114 | ) | |||||
|
|
|
| |||||
TOTAL DIVIDENDS AND DISTRIBUTIONS | (104,952,352 | ) | (50,413,246 | ) | ||||
|
|
|
| |||||
CAPITAL SHARES TRANSACTIONS: | ||||||||
Class IA | ||||||||
Capital shares sold [ 21,442 and 18,169 shares, respectively ] | 175,888 | 136,643 | ||||||
Capital shares issued in reinvestment of dividends and distributions [ 6,373 and 11,456 shares, respectively ] | 54,278 | 79,615 | ||||||
Capital shares repurchased [ (25,330) and (18,423) shares, respectively ] | (209,687 | ) | (133,390 | ) | ||||
|
|
|
| |||||
Total Class IA transactions | 20,479 | 82,868 | ||||||
|
|
|
| |||||
Class IB | ||||||||
Capital shares sold [ 5,685,185 and 1,935,833 shares, respectively ] | 45,152,360 | 14,005,316 | ||||||
Capital shares sold in-kind (Note 9)[ 213,226,977 and 0 shares, respectively ] | 1,655,878,473 | — | ||||||
Capital shares issued in reinvestment of dividends and distributions [ 9,883,227 and 2,141,957 shares, respectively ] | 84,180,335 | 14,888,799 | ||||||
Capital shares repurchased [ (28,855,468) and (4,163,022) shares, respectively ] | (241,453,860 | ) | (30,030,844 | ) | ||||
|
|
|
| |||||
Total Class IB transactions | 1,543,757,308 | (1,136,729 | ) | |||||
|
|
|
| |||||
Class K | ||||||||
Capital shares sold [ 244,643 and 459,711 shares, respectively ] | 1,954,353 | 3,295,998 | ||||||
Capital shares sold in-kind (Note 9)[ 33 and 0 shares, respectively ] | 260 | — | ||||||
Capital shares issued in reinvestment of dividends and distributions [ 2,432,807 and 5,100,185 shares, respectively ] | 20,717,739 | 35,444,832 | ||||||
Capital shares repurchased [ (6,739,045) and (8,891,075) shares, respectively ] | (54,592,772 | ) | (64,159,784 | ) | ||||
|
|
|
| |||||
Total Class K transactions | (31,920,420 | ) | (25,418,954 | ) | ||||
|
|
|
| |||||
NET INCREASE (DECREASE) IN NET ASSETS RESULTING FROM CAPITAL SHARE TRANSACTIONS | 1,511,857,367 | (26,472,815 | ) | |||||
|
|
|
| |||||
TOTAL INCREASE (DECREASE) IN NET ASSETS | 1,850,972,545 | 3,742,055 | ||||||
NET ASSETS: | ||||||||
Beginning of year | 560,813,823 | 557,071,768 | ||||||
|
|
|
| |||||
End of year (a) | $ | 2,411,786,368 | $ | 560,813,823 | ||||
|
|
|
|
| ||||
(a) Includes accumulated undistributed (overdistributed) net investment income (loss) of | $ | 142,853 | $ | 95,663 | ||||
|
|
|
| |||||
See Notes to Financial Statements.
38
EQ ADVISORS TRUST
EQ/LARGE CAP CORE PLUS PORTFOLIO
FINANCIAL HIGHLIGHTS
| Year Ended December 31, | ||||||||||||||||||||
| Class IA | 2013 | 2012 | 2011 | 2010 | 2009 | |||||||||||||||
Net asset value, beginning of year | $ | 6.92 | $ | 6.60 | $ | 7.22 | $ | 6.88 | $ | 5.66 | ||||||||||
|
|
|
|
|
|
|
|
|
| |||||||||||
Income (loss) from investment operations: | ||||||||||||||||||||
Net investment income (loss) | 0.06 | (e) | 0.08 | (e) | 0.08 | (e) | 0.08 | (e) | 0.09 | (e) | ||||||||||
Net realized and unrealized gain (loss) on investments, futures and foreign currency transactions | 2.12 | 0.90 | (0.38 | ) | 0.91 | 1.42 | ||||||||||||||
|
|
|
|
|
|
|
|
|
| |||||||||||
Total from investment operations | 2.18 | 0.98 | (0.30 | ) | 0.99 | 1.51 | ||||||||||||||
|
|
|
|
|
|
|
|
|
| |||||||||||
Less distributions: | ||||||||||||||||||||
Dividends from net investment income | (0.04 | ) | (0.08 | ) | (0.09 | ) | (0.09 | ) | (0.29 | ) | ||||||||||
Distributions from net realized gains | (0.35 | ) | (0.58 | ) | (0.23 | ) | (0.56 | ) | — | |||||||||||
|
|
|
|
|
|
|
|
|
| |||||||||||
Total dividends and distributions | (0.39 | ) | (0.66 | ) | (0.32 | ) | (0.65 | ) | (0.29 | ) | ||||||||||
|
|
|
|
|
|
|
|
|
| |||||||||||
Net asset value, end of year | $ | 8.71 | $ | 6.92 | $ | 6.60 | $ | 7.22 | $ | 6.88 | ||||||||||
|
|
|
|
|
|
|
|
|
| |||||||||||
Total return | 31.62 | % | 14.92 | % | (4.00 | )% | 14.56 | % | 26.84 | % | ||||||||||
|
|
|
|
|
|
|
|
|
| |||||||||||
Ratios/Supplemental Data: | ||||||||||||||||||||
Net assets, end of year (000’s) | $ | 1,161 | $ | 906 | $ | 789 | $ | 450,116 | $ | 423,167 | ||||||||||
Ratio of expenses to average net assets: | ||||||||||||||||||||
After waivers and reimbursements (f) | 0.93 | % | 0.96 | % | 0.69 | % | 0.70 | % | 0.70 | % | ||||||||||
After waivers, reimbursements and fees paid indirectly (f) | 0.93 | % | 0.96 | % | 0.69 | % | 0.70 | % | 0.68 | % | ||||||||||
Before waivers, reimbursements and fees paid indirectly (f) | 0.93 | % | 0.96 | % | 0.70 | % | 0.71 | % | 0.70 | % | ||||||||||
Ratio of net investment income (loss) to average net assets: | ||||||||||||||||||||
After waivers and reimbursements (f) | 0.76 | % | 1.08 | % | 1.10 | % | 1.19 | % | 1.60 | % | ||||||||||
After waivers, reimbursements and fees paid indirectly (f) | 0.76 | % | 1.09 | % | 1.11 | % | 1.19 | % | 1.62 | % | ||||||||||
Before waivers, reimbursements and fees paid indirectly (f) | 0.76 | % | 1.08 | % | 1.09 | % | 1.18 | % | 1.60 | % | ||||||||||
Portfolio turnover rate | 46 | % | 24 | % | 29 | % | 24 | % | 36 | % | ||||||||||
| Year Ended December 31, | ||||||||||||||||||||
| Class IB | 2013 | 2012 | 2011 | 2010 | 2009 | |||||||||||||||
Net asset value, beginning of year | $ | 6.92 | $ | 6.60 | $ | 7.22 | $ | 6.88 | $ | 5.66 | ||||||||||
|
|
|
|
|
|
|
|
|
| |||||||||||
Income (loss) from investment operations: | ||||||||||||||||||||
Net investment income (loss) | 0.06 | (e) | 0.08 | (e) | 0.08 | (e) | 0.07 | (e) | 0.09 | (e) | ||||||||||
Net realized and unrealized gain (loss) on investments, futures and foreign currency transactions | 2.12 | 0.90 | (0.39 | ) | 0.90 | 1.41 | ||||||||||||||
|
|
|
|
|
|
|
|
|
| |||||||||||
Total from investment operations | 2.18 | 0.98 | (0.31 | ) | 0.97 | 1.50 | ||||||||||||||
|
|
|
|
|
|
|
|
|
| |||||||||||
Less distributions: | ||||||||||||||||||||
Dividends from net investment income | (0.04 | ) | (0.08 | ) | (0.08 | ) | (0.07 | ) | (0.28 | ) | ||||||||||
Distributions from net realized gains | (0.35 | ) | (0.58 | ) | (0.23 | ) | (0.56 | ) | — | |||||||||||
|
|
|
|
|
|
|
|
|
| |||||||||||
Total dividends and distributions | (0.39 | ) | (0.66 | ) | (0.31 | ) | (0.63 | ) | (0.28 | ) | ||||||||||
|
|
|
|
|
|
|
|
|
| |||||||||||
Net asset value, end of year | $ | 8.71 | $ | 6.92 | $ | 6.60 | $ | 7.22 | $ | 6.88 | ||||||||||
|
|
|
|
|
|
|
|
|
| |||||||||||
Total return | 31.61 | % | 14.92 | % | (4.24 | )% | 14.27 | % | 26.50 | % | ||||||||||
|
|
|
|
|
|
|
|
|
| |||||||||||
Ratios/Supplemental Data: | ||||||||||||||||||||
Net assets, end of year (000’s) | $ | 1,953,737 | $ | 168,607 | $ | 161,281 | $ | 190,389 | $ | 183,149 | ||||||||||
Ratio of expenses to average net assets: | ||||||||||||||||||||
After waivers and reimbursements (f) | 0.93 | % | 0.96 | % | 0.94 | %(c) | 0.95 | % | 0.95 | %(c) | ||||||||||
After waivers, reimbursements and fees paid indirectly (f) | 0.93 | % | 0.96 | % | 0.94 | % | 0.95 | % | 0.93 | %(c) | ||||||||||
Before waivers, reimbursements and fees paid indirectly (f) | 0.93 | % | 0.96 | % | 0.95 | %(c) | 0.96 | % | 0.95 | %(c) | ||||||||||
Ratio of net investment income (loss) to average net assets: | ||||||||||||||||||||
After waivers and reimbursements (f) | 0.72 | % | 1.08 | % | 1.04 | % | 0.94 | % | 1.40 | % | ||||||||||
After waivers, reimbursements and fees paid indirectly (f) | 0.72 | % | 1.08 | % | 1.05 | % | 0.94 | % | 1.43 | % | ||||||||||
Before waivers, reimbursements and fees paid indirectly (f) | 0.72 | % | 1.08 | % | 1.04 | % | 0.93 | % | 1.40 | % | ||||||||||
Portfolio turnover rate | 46 | % | 24 | % | 29 | % | 24 | % | 36 | % | ||||||||||
See Notes to Financial Statements.
39
EQ ADVISORS TRUST
EQ/LARGE CAP CORE PLUS PORTFOLIO
FINANCIAL HIGHLIGHTS (Continued)
| Year Ended December 31, | August 26, 2011* to December 31, 2011 | |||||||||||
| Class K | 2013 | 2012 | ||||||||||
Net asset value, beginning of period | $ | 6.92 | $ | 6.60 | $ | 6.49 | ||||||
|
|
|
|
|
| |||||||
Income (loss) from investment operations: | ||||||||||||
Net investment income (loss) | 0.08 | (e) | 0.10 | (e) | 0.04 | (e) | ||||||
Net realized and unrealized gain (loss) on investments, futures and foreign currency transactions | 2.12 | 0.90 | 0.26 | |||||||||
|
|
|
|
|
| |||||||
Total from investment operations | 2.20 | 1.00 | 0.30 | |||||||||
|
|
|
|
|
| |||||||
Less distributions: | ||||||||||||
Dividends from net investment income | (0.06 | ) | (0.10 | ) | (0.09 | ) | ||||||
Distributions from net realized gains | (0.35 | ) | (0.58 | ) | (0.10 | ) | ||||||
|
|
|
|
|
| |||||||
Total dividends and distributions | (0.41 | ) | (0.68 | ) | (0.19 | ) | ||||||
|
|
|
|
|
| |||||||
Net asset value, end of period | $ | 8.71 | $ | 6.92 | $ | 6.60 | ||||||
|
|
|
|
|
| |||||||
Total return (b) | 31.95 | % | 15.21 | % | 4.82 | % | ||||||
|
|
|
|
|
| |||||||
Ratios/Supplemental Data: | ||||||||||||
Net assets, end of period (000’s) | $ | 456,889 | $ | 391,301 | $ | 395,001 | ||||||
Ratio of expenses to average net assets: | ||||||||||||
After waivers and reimbursements (a)(f) | 0.68 | % | 0.71 | % | 0.71 | % | ||||||
After waivers, reimbursements and fees paid indirectly (a)(f) | 0.68 | % | 0.71 | % | 0.70 | % | ||||||
Before waivers, reimbursements and fees paid indirectly (a)(f) | 0.68 | % | 0.71 | % | 0.71 | % | ||||||
Ratio of net investment income (loss) to average net assets: | ||||||||||||
After waivers and reimbursements (a)(f) | 1.01 | % | 1.33 | % | 1.73 | % | ||||||
After waivers, reimbursements and fees paid indirectly (a)(f) | 1.01 | % | 1.33 | % | 1.73 | % | ||||||
Before waivers, reimbursements and fees paid indirectly (a)(f) | 1.01 | % | 1.33 | % | 1.73 | % | ||||||
Portfolio turnover rate | 46 | % | 24 | % | 29 | % | ||||||
| * | Commencement of Operations. |
| (a) | Ratios for periods less than one year are annualized. |
| (b) | Total returns for periods less than one year are not annualized. |
| (c) | Reflects overall fund ratios for non-class specific expenses. |
| (e) | Net investment income (loss) per share is based on average shares outstanding. |
| (f) | Expenses do not include the expenses of the underlying funds (“indirect expenses”). |
See Notes to Financial Statements.
40
EQ/LARGE CAP VALUE PLUS PORTFOLIO (Unaudited)
PORTFOLIO ADVISERS
| Ø | AllianceBernstein L.P. |
| Ø | AXA Equitable Funds Management Group, LLC |
| Ø | BlackRock Investment Management, LLC |
PERFORMANCE RESULTS
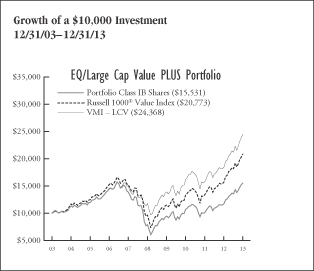
| Annualized Total Returns as of 12/31/13 | ||||||||||||
| 1 Year | 5 Years | 10 Years/ Since Incept. | ||||||||||
Portfolio – Class IA Shares** | 32.54 | % | 14.77 | % | 4.73 | % | ||||||
Portfolio – Class IB Shares* | 32.50 | 14.60 | 4.50 | |||||||||
Portfolio – Class K Shares*** | 32.87 | N/A | 22.76 | |||||||||
Russell 1000® Value Index | 32.53 | 16.67 | 7.58 | |||||||||
VMI – LCV | 32.46 | 15.67 | 9.32 | |||||||||
* Date of inception 1/1/98.
** Date of inception 5/18/01.
***Date of inception 8/26/11.
Returnsfor periods greater than one year are annualized. |
| |||||||||||
Past performance is not indicative of future results.
PERFORMANCE SUMMARY
The Portfolio’s Class IA shares returned 32.54% for the year ended December 31, 2013. The Portfolio’s benchmarks, the Russell 1000® Value Index, returned 32.53% and the VMI – LCV returned 32.46% over the same period.
The following commentary describes key factors (such as stock selection and sector allocation decisions) that helped or hurt the Portfolio’s performance relative to its primary benchmark.
Portfolio Highlights
For the year ended December 31, 2013
What helped performance during the year:
| • | Stock selection in Financials had the biggest impact on performance during the period. |
| • | Underweight positions in the Utilities and Energy sectors and overweight positions in the Information Technology and Consumer Discretionary sectors contributed positively. |
| • | Leading contributors included Hewlett-Packard, GameStop, and Viacom. |
What hurt performance during the year:
| • | Stock selection in Information Technology and Energy had a negative impact during the period. |
| • | An underweight position in Industrials, one of the top performing sectors during the period, detracted from relative performance comparisons. |
| • | Leading detractors include McGraw Hill Financial, Philip Morris, IBM, Oracle and Royal Dutch Shell. |
Portfolio Positioning and Outlook — BlackRock Investment Management, LLC
The U.S. equity market has steadily increased throughout 2013, delivering excellent performance as a number of perceived risks have waned. While earnings growth has been positive, the majority of the return in 2013 has come from valuation expansion as investors have grown increasingly comfortable with the global economic outlook. In the U.S., the sequestration and debt ceiling debates have passed without derailing the economy, and we no longer see daily headlines impacting sentiment. We continue to see moderate growth in the U.S., and are now beginning to see some momentum in Europe. In addition, China appears to have stabilized, having completed the transition to a new government. Economic weakness in emerging markets is better understood now than it was earlier in the year. With equities meaningfully more expensive than at the beginning of 2013 our outlook going into 2014 is positive but more muted. While many risks have passed, several remain on the horizon including regulation, removal of liquidity by global central banks, potential margin compression, and geopolitical risks. We believe U.S. equities are fairly valued versus history, but are very attractively valued relative to the current low interest rates.
Sector Weightings as of December 31, 2013 | % of Net Assets | |||
Financials | 25.6 | % | ||
Energy | 13.4 | |||
Health Care | 12.6 | |||
Information Technology | 9.9 | |||
Consumer Discretionary | 8.3 | |||
Industrials | 8.2 | |||
Consumer Staples | 5.6 | |||
Utilities | 4.3 | |||
Materials | 2.4 | |||
Telecommunication Services | 1.9 | |||
Exchange Traded Funds | 0.3 | |||
Cash and Other | 7.5 | |||
|
| |||
| 100.0 | % | |||
|
| |||
41
EQ/LARGE CAP VALUE PLUS PORTFOLIO (Unaudited)
UNDERSTANDING YOUR EXPENSES:
As a shareholder of the Portfolio, you incur two types of costs:
(1)transaction costs, including applicable sales charges and redemption fees; and (2)ongoing costs, including management fees, distribution (12b-1) fees (in the case of Class IA and Class IB shares of the Trust), and other Portfolio expenses. These examples are intended to help you understand your ongoing costs (in dollars) of investing in the Portfolio and to compare these costs with the ongoing costs of investing in other mutual funds.
The examples are based on an investment of $1,000 invested at the beginning of the six-month period ended December 31, 2013 and held for the entire six-month period.
Actual Expenses
The first line of the table to the right provides information about actual account values and actual expenses. You may use the information in this line, together with the amount you invested, to estimate the expenses that you paid over the period. Simply divide your account value by $1,000 (for example, an $8,600 account value divided by $1,000 = 8.6), then multiply the result by the number in the first line under the heading entitled ‘‘Expenses Paid During Period’’ to estimate the expenses you paid on your account during this period.
Hypothetical Example for Comparison Purposes
The second line of the table below provides information about hypothetical account values and hypothetical expenses based on the Portfolio’s actual expense ratio and an assumed rate of return of 5% per year before expenses, which is not the Portfolio’s actual return. The hypothetical account values and expenses may not be used to estimate the actual ending account balance or expenses you paid for the period. You may use this information to compare the ongoing costs of investing in the Portfolio and other funds. To do so, compare this 5% hypothetical example with the 5% hypothetical examples that appear in the shareholder reports of the other funds.
Please note that the expenses shown in the table are meant to highlight your ongoing costs only and do not reflect any transactional costs, such as sales charges (loads), redemption fees, or exchange fees. Therefore, the second line of the table is useful in comparing ongoing costs only, and will not help you determine the relative total costs of owning different funds. In addition, if these transactional costs were included, your costs would have been higher. Also note that the table does not reflect any variable life insurance or variable annuity contract-related fees and expenses, which would increase overall fees and expenses.
EXAMPLE
| Beginning Account Value 7/1/13 | Ending Account Value 12/31/13 | Expenses 12/31/13 | ||||||||||
Class IA | ||||||||||||
Actual | $1,000.00 | $1,145.50 | $4.70 | |||||||||
Hypothetical (5% average annual return before expenses) | 1,000.00 | 1,020.82 | 4.43 | |||||||||
Class IB | ||||||||||||
Actual | 1,000.00 | 1,145.82 | 4.68 | |||||||||
Hypothetical (5% average annual return before expenses) | 1,000.00 | 1,020.84 | 4.41 | |||||||||
Class K | ||||||||||||
Actual | 1,000.00 | 1,147.45 | 3.36 | |||||||||
Hypothetical (5% average annual return before expenses) | 1,000.00 |
| 1,022.08 |
| 3.16 | |||||||
* Expenses are equal to the Portfolio’s Class IA, Class IB and Class K shares annualized expense ratios of 0.87%, 0.87% and 0.62%, respectively, multiplied by the average account value over the period, and multiplied by 184/365 (to reflect the one-half year period). |
| |||||||||||
42
EQ ADVISORS TRUST
EQ/LARGE CAP VALUE PLUS PORTFOLIO
PORTFOLIO OF INVESTMENTS
December 31, 2013
| Number of Shares | Value (Note 1) | |||||||
COMMON STOCKS: | ||||||||
Consumer Discretionary (8.3%) | ||||||||
Auto Components (0.8%) | ||||||||
Allison Transmission Holdings, Inc. | 10,690 | $ | 295,151 | |||||
Gentex Corp. | 21,954 | 724,262 | ||||||
Johnson Controls, Inc. | 246,170 | 12,628,521 | ||||||
Lear Corp. | 198,867 | 16,102,261 | ||||||
TRW Automotive Holdings Corp.* | 177,584 | 13,210,474 | ||||||
|
| |||||||
| 42,960,669 | ||||||||
|
| |||||||
Automobiles (1.1%) | ||||||||
Ford Motor Co. | 1,740,533 | 26,856,424 | ||||||
General Motors Co.* | 866,230 | 35,402,820 | ||||||
|
| |||||||
| 62,259,244 | ||||||||
|
| |||||||
Distributors (0.0%) | ||||||||
Genuine Parts Co. | 3,134 | 260,718 | ||||||
|
| |||||||
Diversified Consumer Services (0.0%) |
| |||||||
Apollo Education Group, Inc., Class A* | 35,053 | 957,648 | ||||||
DeVry Education Group, Inc. | 22,626 | 803,223 | ||||||
Service Corp. International | 16,668 | 302,191 | ||||||
Weight Watchers International, Inc. | 4,487 | 147,757 | ||||||
|
| |||||||
| 2,210,819 | ||||||||
|
| |||||||
Hotels, Restaurants & Leisure (0.4%) |
| |||||||
Carnival Corp. | 150,148 | 6,031,445 | ||||||
Choice Hotels International, Inc. | 9,485 | 465,808 | ||||||
Darden Restaurants, Inc. | 16,260 | 884,056 | ||||||
Hyatt Hotels Corp., Class A* | 16,085 | 795,564 | ||||||
Marriott International, Inc., Class A | 9,832 | 485,308 | ||||||
McDonald’s Corp. | 36,500 | 3,541,595 | ||||||
MGM Resorts International* | 133,620 | 3,142,742 | ||||||
Norwegian Cruise Line Holdings Ltd.* | 623 | 22,098 | ||||||
Penn National Gaming, Inc.* | 24,412 | 349,824 | ||||||
Royal Caribbean Cruises Ltd. | 58,751 | 2,785,973 | ||||||
Starwood Hotels & Resorts Worldwide, Inc. | 40,283 | 3,200,484 | ||||||
Wendy’s Co. | 101,729 | 887,077 | ||||||
|
| |||||||
| 22,591,974 | ||||||||
|
| |||||||
Household Durables (0.8%) | ||||||||
D.R. Horton, Inc.* | 101,368 | 2,262,534 | ||||||
Garmin Ltd. | 65,617 | 3,032,818 | ||||||
Harman International Industries, Inc. | 24,454 | 2,001,560 | ||||||
Leggett & Platt, Inc. | 51,377 | 1,589,604 | ||||||
Lennar Corp., Class A | 59,486 | 2,353,266 | ||||||
Mohawk Industries, Inc.* | 21,790 | 3,244,531 | ||||||
Newell Rubbermaid, Inc. | 383,707 | 12,435,944 | ||||||
NVR, Inc.* | 340 | 348,843 | ||||||
PulteGroup, Inc. | 501,500 | 10,215,555 | ||||||
Taylor Morrison Home Corp., Class A* | 1,377 | 30,914 | ||||||
Toll Brothers, Inc.* | 60,829 | $ | 2,250,673 | |||||
Whirlpool Corp. | 26,517 | 4,159,457 | ||||||
|
| |||||||
| 43,925,699 | ||||||||
|
| |||||||
Internet & Catalog Retail (0.1%) | ||||||||
Liberty Interactive Corp.* | 174,938 | 5,134,430 | ||||||
zulily, Inc., Class A* | 2,365 | 97,982 | ||||||
|
| |||||||
| 5,232,412 | ||||||||
|
| |||||||
Leisure Equipment & Products (0.0%) |
| |||||||
Hasbro, Inc. | 6,178 | 339,852 | ||||||
|
| |||||||
Media (3.4%) | ||||||||
CBS Corp. (Non-Voting), Class B | 18,566 | 1,183,397 | ||||||
Comcast Corp., Class A | 306,725 | 15,674,036 | ||||||
DreamWorks Animation SKG, Inc., Class A* | 26,542 | 942,241 | ||||||
Gannett Co., Inc. | 375,876 | 11,118,412 | ||||||
Graham Holdings Co., Class B* | 1,629 | 1,080,548 | ||||||
Interpublic Group of Cos., Inc. | 83,964 | 1,486,163 | ||||||
John Wiley & Sons, Inc., Class A | 16,340 | 901,968 | ||||||
Liberty Global plc* | 87,200 | 7,352,704 | ||||||
Liberty Global plc, Class A* | 70,587 | 6,281,537 | ||||||
Liberty Media Corp., Class A* | 36,270 | 5,311,741 | ||||||
News Corp., Class A* | 46,960 | 846,219 | ||||||
Regal Entertainment Group, Class A | 153,084 | 2,977,484 | ||||||
Sirius XM Holdings, Inc.* | 585,078 | 2,041,922 | ||||||
Starz, Class A* | 4,762 | 139,241 | ||||||
Thomson Reuters Corp. | 134,129 | 5,072,759 | ||||||
Time Warner, Inc. | 545,647 | 38,042,509 | ||||||
Twenty-First Century Fox, Inc., Class A | 522,548 | 18,383,239 | ||||||
Viacom, Inc., Class B | 332,743 | 29,061,774 | ||||||
Walt Disney Co. | 503,429 | 38,461,975 | ||||||
|
| |||||||
| 186,359,869 | ||||||||
|
| |||||||
Multiline Retail (0.5%) | ||||||||
Big Lots, Inc.* | 15,414 | 497,718 | ||||||
Dillard’s, Inc., Class A | 3,187 | 309,808 | ||||||
J.C. Penney Co., Inc.* | 61,480 | 562,542 | ||||||
Kohl’s Corp. | 163,944 | 9,303,822 | ||||||
Macy’s, Inc. | 230,488 | 12,308,059 | ||||||
Sears Holdings Corp.* | 15,661 | 768,016 | ||||||
Target Corp. | 49,878 | 3,155,781 | ||||||
|
| |||||||
| 26,905,746 | ||||||||
|
| |||||||
Specialty Retail (1.1%) | ||||||||
Aaron’s, Inc. | 23,214 | 682,492 | ||||||
Abercrombie & Fitch Co., Class A | 24,848 | 817,748 | ||||||
American Eagle Outfitters, Inc. | 24,678 | 355,363 | ||||||
Ascena Retail Group, Inc.* | 39,248 | 830,488 | ||||||
Best Buy Co., Inc. | 71,981 | 2,870,602 | ||||||
Chico’s FAS, Inc. | 3,823 | 72,025 | ||||||
CST Brands, Inc. | 21,722 | 797,632 | ||||||
DSW, Inc., Class A | 2,282 | 97,510 | ||||||
Foot Locker, Inc. | 47,619 | 1,973,331 | ||||||
See Notes to Financial Statements.
43
EQ ADVISORS TRUST
EQ/LARGE CAP VALUE PLUS PORTFOLIO
PORTFOLIO OF INVESTMENTS (Continued)
December 31, 2013
| Number of Shares | Value (Note 1) | |||||||
GameStop Corp., Class A | 204,868 | $ | 10,091,798 | |||||
Guess?, Inc. | 21,399 | 664,867 | ||||||
Home Depot, Inc. | 168,500 | 13,874,290 | ||||||
Lowe’s Cos., Inc. | 100,700 | 4,989,685 | ||||||
Murphy USA, Inc.* | 17,176 | 713,834 | ||||||
Signet Jewelers Ltd. | 26,542 | 2,088,855 | ||||||
Staples, Inc. | 238,564 | 3,790,782 | ||||||
TJX Cos., Inc. | 300,300 | 19,138,119 | ||||||
|
| |||||||
| 63,849,421 | ||||||||
|
| |||||||
Textiles, Apparel & Luxury Goods (0.1%) |
| |||||||
Deckers Outdoor Corp.* | 6,968 | 588,517 | ||||||
NIKE, Inc., Class B | 46,400 | 3,648,896 | ||||||
PVH Corp. | 3,354 | 456,211 | ||||||
|
| |||||||
| 4,693,624 | ||||||||
|
| |||||||
Total Consumer Discretionary | 461,590,047 | |||||||
|
| |||||||
Consumer Staples (5.6%) | ||||||||
Beverages (0.3%) | ||||||||
Beam, Inc. | 57,876 | 3,939,040 | ||||||
Constellation Brands, Inc., Class A* | 3,320 | 233,662 | ||||||
Molson Coors Brewing Co., Class B | 50,273 | 2,822,829 | ||||||
PepsiCo, Inc. | 110,900 | 9,198,046 | ||||||
|
| |||||||
| 16,193,577 | ||||||||
|
| |||||||
Food & Staples Retailing (2.0%) | ||||||||
CVS Caremark Corp. | 546,531 | 39,115,224 | ||||||
Kroger Co. | 793,800 | 31,378,914 | ||||||
Safeway, Inc. | 79,917 | 2,602,897 | ||||||
Sprouts Farmers Market, Inc.* | 2,223 | 85,430 | ||||||
Sysco Corp. | 139,518 | 5,036,600 | ||||||
Walgreen Co. | 107,999 | 6,203,462 | ||||||
Wal-Mart Stores, Inc. | 307,476 | 24,195,286 | ||||||
|
| |||||||
| 108,617,813 | ||||||||
|
| |||||||
Food Products (1.0%) | ||||||||
Archer-Daniels-Midland Co. | 218,837 | 9,497,526 | ||||||
Bunge Ltd. | 52,903 | 4,343,865 | ||||||
Campbell Soup Co. | 21,520 | 931,386 | ||||||
ConAgra Foods, Inc. | 11,272 | 379,866 | ||||||
Dean Foods Co.* | 33,585 | 577,326 | ||||||
Ingredion, Inc. | 24,497 | 1,677,065 | ||||||
J.M. Smucker Co. | 33,561 | 3,477,591 | ||||||
Kellogg Co. | 7,299 | 445,750 | ||||||
Kraft Foods Group, Inc. | 39,300 | 2,119,056 | ||||||
Mondelez International, Inc., Class A | 758,974 | 26,791,782 | ||||||
Pinnacle Foods, Inc. | 5,122 | 140,650 | ||||||
Tyson Foods, Inc., Class A | 100,625 | 3,366,912 | ||||||
|
| |||||||
| 53,748,775 | ||||||||
|
| |||||||
Household Products (2.0%) | ||||||||
Clorox Co. | 7,791 | 722,693 | ||||||
Colgate-Palmolive Co. | 19,800 | 1,291,158 | ||||||
Energizer Holdings, Inc. | 118,846 | 12,863,891 | ||||||
Kimberly-Clark Corp. | 61,224 | 6,395,459 | ||||||
Procter & Gamble Co. | 1,112,792 | 90,592,397 | ||||||
|
| |||||||
| 111,865,598 | ||||||||
|
| |||||||
Personal Products (0.0%) | ||||||||
Coty, Inc., Class A | 6,937 | $ | 105,789 | |||||
|
| |||||||
Tobacco (0.3%) | ||||||||
Philip Morris International, Inc. | 192,600 | 16,781,238 | ||||||
Reynolds American, Inc. | 27,537 | 1,376,575 | ||||||
|
| |||||||
| 18,157,813 | ||||||||
|
| |||||||
Total Consumer Staples | 308,689,365 | |||||||
|
| |||||||
Energy (13.4%) | ||||||||
Energy Equipment & Services (1.0%) |
| |||||||
Atwood Oceanics, Inc.* | 16,786 | 896,205 | ||||||
Baker Hughes, Inc. | 148,813 | 8,223,407 | ||||||
Cameron International Corp.* | 33,002 | 1,964,609 | ||||||
Diamond Offshore Drilling, Inc. | 24,744 | 1,408,429 | ||||||
Frank’s International N.V. | 6,895 | 186,165 | ||||||
Halliburton Co. | 321,507 | 16,316,480 | ||||||
Helmerich & Payne, Inc. | 34,107 | 2,867,717 | ||||||
McDermott International, Inc.* | 85,025 | 778,829 | ||||||
Nabors Industries Ltd. | 105,869 | 1,798,714 | ||||||
National Oilwell Varco, Inc. | 153,497 | 12,207,617 | ||||||
Oil States International, Inc.* | 19,814 | 2,015,480 | ||||||
Patterson-UTI Energy, Inc. | 52,804 | 1,336,997 | ||||||
Rowan Cos., plc, Class A* | 44,687 | 1,580,132 | ||||||
RPC, Inc. | 4,480 | 79,968 | ||||||
Superior Energy Services, Inc.* | 57,358 | 1,526,296 | ||||||
Tidewater, Inc. | 17,879 | 1,059,688 | ||||||
Unit Corp.* | 17,699 | 913,622 | ||||||
|
| |||||||
| 55,160,355 | ||||||||
|
| |||||||
Oil, Gas & Consumable Fuels (12.4%) |
| |||||||
Anadarko Petroleum Corp. | 170,326 | 13,510,258 | ||||||
Antero Resources Corp.* | 7,394 | 469,075 | ||||||
Apache Corp. | 227,919 | 19,587,359 | ||||||
Chesapeake Energy Corp. | 208,199 | 5,650,521 | ||||||
Chevron Corp. | 843,174 | 105,320,864 | ||||||
Cimarex Energy Co. | 31,058 | 3,258,295 | ||||||
Cobalt International Energy, Inc.* | 369,877 | 6,084,477 | ||||||
ConocoPhillips Co. | 439,302 | 31,036,686 | ||||||
CONSOL Energy, Inc. | 82,168 | 3,125,671 | ||||||
Denbury Resources, Inc.* | 134,146 | 2,204,019 | ||||||
Devon Energy Corp. | 145,920 | 9,028,070 | ||||||
Energen Corp. | 25,998 | 1,839,359 | ||||||
EOG Resources, Inc. | 6,348 | 1,065,448 | ||||||
EQT Corp. | 4,654 | 417,836 | ||||||
Exxon Mobil Corp. | 1,997,144 | 202,110,973 | ||||||
Golar LNG Ltd. | 15,811 | 573,781 | ||||||
Gulfport Energy Corp.* | 139,519 | 8,810,625 | ||||||
Hess Corp. | 305,791 | 25,380,653 | ||||||
HollyFrontier Corp. | 72,981 | 3,626,426 | ||||||
Kinder Morgan, Inc. | 20,058 | 722,088 | ||||||
Laredo Petroleum Holdings, Inc.* | 1,725 | 47,765 | ||||||
Marathon Oil Corp. | 1,000,128 | 35,304,518 | ||||||
Marathon Petroleum Corp. | 425,377 | 39,019,832 | ||||||
Murphy Oil Corp. | 68,704 | 4,457,516 | ||||||
Newfield Exploration Co.* | 48,679 | 1,198,964 | ||||||
Noble Energy, Inc. | 112,483 | 7,661,217 | ||||||
Occidental Petroleum Corp. | 435,695 | 41,434,595 | ||||||
PBF Energy, Inc., Class A | 8,538 | 268,606 | ||||||
Peabody Energy Corp. | 96,936 | 1,893,160 | ||||||
Phillips 66 | 296,260 | 22,850,534 | ||||||
See Notes to Financial Statements.
44
EQ ADVISORS TRUST
EQ/LARGE CAP VALUE PLUS PORTFOLIO
PORTFOLIO OF INVESTMENTS (Continued)
December 31, 2013
| Number of Shares | Value (Note 1) | |||||||
Pioneer Natural Resources Co. | 12,881 | $ | 2,371,006 | |||||
QEP Resources, Inc. | 57,934 | 1,775,677 | ||||||
SandRidge Energy, Inc.* | 177,579 | 1,077,905 | ||||||
Spectra Energy Corp. | 240,497 | 8,566,503 | ||||||
Suncor Energy, Inc. | 319,833 | 11,210,147 | ||||||
Teekay Corp. | 13,683 | 656,921 | ||||||
Tesoro Corp. | 48,816 | 2,855,736 | ||||||
Total S.A. (ADR) | 182,181 | 11,162,230 | ||||||
Ultra Petroleum Corp.* | 54,960 | 1,189,884 | ||||||
Valero Energy Corp. | 693,968 | 34,975,987 | ||||||
Whiting Petroleum Corp.* | 39,013 | 2,413,734 | ||||||
Williams Cos., Inc. | 110,699 | 4,269,660 | ||||||
World Fuel Services Corp. | 21,159 | 913,222 | ||||||
WPX Energy, Inc.* | 71,946 | 1,466,259 | ||||||
|
| |||||||
| 682,864,062 | ||||||||
|
| |||||||
Total Energy | 738,024,417 | |||||||
|
| |||||||
Financials (25.6%) | ||||||||
Capital Markets (2.6%) | ||||||||
American Capital Ltd.* | 108,907 | 1,703,306 | ||||||
Ameriprise Financial, Inc. | 49,380 | 5,681,169 | ||||||
Ares Capital Corp. | 96,371 | 1,712,513 | ||||||
Artisan Partners Asset Management, Inc., Class A | 2,657 | 173,210 | ||||||
Bank of New York Mellon Corp. | 417,004 | 14,570,120 | ||||||
BlackRock, Inc. | 30,402 | 9,621,321 | ||||||
Charles Schwab Corp. | 340,806 | 8,860,956 | ||||||
E*TRADE Financial Corp.* | 305,257 | 5,995,247 | ||||||
Federated Investors, Inc., Class B | 8,803 | 253,526 | ||||||
Goldman Sachs Group, Inc. | 194,155 | 34,415,915 | ||||||
Invesco Ltd. | 159,775 | 5,815,810 | ||||||
Legg Mason, Inc. | 40,015 | 1,739,852 | ||||||
LPL Financial Holdings, Inc. | 4,373 | 205,662 | ||||||
Morgan Stanley | 703,213 | 22,052,760 | ||||||
Northern Trust Corp. | 85,998 | 5,322,416 | ||||||
Raymond James Financial, Inc. | 43,837 | 2,287,853 | ||||||
SEI Investments Co. | 2,837 | 98,529 | ||||||
State Street Corp. | 232,533 | 17,065,597 | ||||||
TD Ameritrade Holding Corp. | 83,660 | 2,563,342 | ||||||
|
| |||||||
| 140,139,104 | ||||||||
|
| |||||||
Commercial Banks (4.7%) | ||||||||
Associated Banc-Corp | 60,318 | 1,049,533 | ||||||
Bank of Hawaii Corp. | 16,156 | 955,466 | ||||||
BankUnited, Inc. | 23,180 | 763,086 | ||||||
BB&T Corp. | 252,147 | 9,410,126 | ||||||
BOK Financial Corp. | 9,527 | 631,831 | ||||||
CapitalSource, Inc. | 70,441 | 1,012,237 | ||||||
CIT Group, Inc. | 270,163 | 14,083,597 | ||||||
City National Corp./California | 16,801 | 1,330,975 | ||||||
Comerica, Inc. | 67,130 | 3,191,360 | ||||||
Commerce Bancshares, Inc./Missouri | 29,043 | 1,304,321 | ||||||
Cullen/Frost Bankers, Inc. | 18,732 | 1,394,223 | ||||||
East West Bancorp, Inc. | 48,977 | 1,712,726 | ||||||
Fifth Third Bancorp | 314,219 | 6,608,025 | ||||||
First Citizens BancShares, Inc./North Carolina, Class A | 2,770 | 616,685 | ||||||
First Horizon National Corp. | 86,711 | 1,010,183 | ||||||
First Niagara Financial Group, Inc. | 127,177 | 1,350,620 | ||||||
First Republic Bank/California | 41,916 | $ | 2,194,303 | |||||
Fulton Financial Corp. | 70,178 | 917,928 | ||||||
Huntington Bancshares, Inc./Ohio | 301,341 | 2,907,941 | ||||||
KeyCorp | 330,714 | 4,438,182 | ||||||
M&T Bank Corp. | 46,372 | 5,398,628 | ||||||
PNC Financial Services Group, Inc. | 190,242 | 14,758,974 | ||||||
Popular, Inc.* | 37,089 | 1,065,567 | ||||||
Regions Financial Corp. | 1,192,053 | 11,789,404 | ||||||
Signature Bank/New York* | 15,410 | 1,655,342 | ||||||
SunTrust Banks, Inc. | 194,084 | 7,144,232 | ||||||
SVB Financial Group* | 16,278 | 1,706,911 | ||||||
Synovus Financial Corp. | 351,458 | 1,265,249 | ||||||
TCF Financial Corp. | 58,901 | 957,141 | ||||||
U.S. Bancorp/Minnesota | 811,103 | 32,768,561 | ||||||
Valley National Bancorp | 71,666 | 725,260 | ||||||
Wells Fargo & Co. | 2,601,709 | 118,117,589 | ||||||
Zions Bancorp | 66,259 | 1,985,120 | ||||||
|
| |||||||
| 256,221,326 | ||||||||
|
| |||||||
Consumer Finance (1.6%) | ||||||||
Capital One Financial Corp. | 600,199 | 45,981,246 | ||||||
Discover Financial Services | 645,376 | 36,108,787 | ||||||
SLM Corp. | 159,661 | 4,195,891 | ||||||
|
| |||||||
| 86,285,924 | ||||||||
|
| |||||||
Diversified Financial Services (6.2%) |
| |||||||
Bank of America Corp. | 5,125,058 | 79,797,153 | ||||||
Citigroup, Inc. | 2,081,717 | 108,478,273 | ||||||
CME Group, Inc./Illinois | 113,866 | 8,933,926 | ||||||
ING US, Inc. | 95,106 | 3,342,976 | ||||||
Interactive Brokers Group, Inc., Class A | 16,822 | 409,448 | ||||||
IntercontinentalExchange Group, Inc. | 16,255 | 3,656,075 | ||||||
JPMorgan Chase & Co. | 2,020,053 | 118,132,699 | ||||||
Leucadia National Corp. | 91,976 | 2,606,600 | ||||||
McGraw Hill Financial, Inc. | 70,127 | 5,483,931 | ||||||
MSCI, Inc.* | 25,231 | 1,103,099 | ||||||
NASDAQ OMX Group, Inc. | 298,987 | 11,899,683 | ||||||
|
| |||||||
| 343,843,863 | ||||||||
|
| |||||||
Insurance (8.0%) | ||||||||
ACE Ltd. | 226,827 | 23,483,399 | ||||||
Aflac, Inc. | 313,557 | 20,945,608 | ||||||
Alleghany Corp.* | 6,100 | 2,439,756 | ||||||
Allied World Assurance Co. Holdings AG | 8,404 | 948,055 | ||||||
Allstate Corp. | 168,426 | 9,185,954 | ||||||
American Financial Group, Inc./Ohio | 165,232 | 9,537,191 | ||||||
American International Group, Inc. | 814,710 | 41,590,945 | ||||||
American National Insurance Co. | 2,617 | 299,751 | ||||||
Aon plc | 175,342 | 14,709,440 | ||||||
Arch Capital Group Ltd.* | 44,840 | 2,676,500 | ||||||
Aspen Insurance Holdings Ltd. | 23,831 | 984,459 | ||||||
Assurant, Inc. | 106,483 | 7,067,277 | ||||||
Assured Guaranty Ltd. | 60,626 | 1,430,167 | ||||||
Axis Capital Holdings Ltd. | 31,915 | 1,518,196 | ||||||
See Notes to Financial Statements.
45
EQ ADVISORS TRUST
EQ/LARGE CAP VALUE PLUS PORTFOLIO
PORTFOLIO OF INVESTMENTS (Continued)
December 31, 2013
| Number of Shares | Value (Note 1) | |||||||
Berkshire Hathaway, Inc., Class B* | 646,573 | $ | 76,657,695 | |||||
Brown & Brown, Inc. | 23,000 | 721,970 | ||||||
Chubb Corp. | 194,563 | 18,800,623 | ||||||
Cincinnati Financial Corp. | 58,786 | 3,078,623 | ||||||
CNA Financial Corp. | 9,505 | 407,669 | ||||||
Endurance Specialty Holdings Ltd. | 10,251 | 601,426 | ||||||
Everest Reinsurance Group Ltd. | 33,706 | 5,253,754 | ||||||
Fidelity National Financial, Inc., Class A | 81,793 | 2,654,183 | ||||||
Genworth Financial, Inc., Class A* | 1,375,093 | 21,355,194 | ||||||
Hanover Insurance Group, Inc. | 11,387 | 679,918 | ||||||
Hartford Financial Services Group, Inc. | 500,794 | 18,143,767 | ||||||
HCC Insurance Holdings, Inc. | 36,071 | 1,664,316 | ||||||
Kemper Corp. | 17,117 | 699,743 | ||||||
Lincoln National Corp. | 514,415 | 26,554,102 | ||||||
Loews Corp. | 101,577 | 4,900,074 | ||||||
Markel Corp.* | 5,025 | 2,916,259 | ||||||
Marsh & McLennan Cos., Inc. | 65,782 | 3,181,217 | ||||||
MBIA, Inc.* | 50,974 | 608,630 | ||||||
Mercury General Corp. | 9,724 | 483,380 | ||||||
MetLife, Inc. | 394,639 | 21,278,935 | ||||||
Old Republic International Corp. | 93,280 | 1,610,946 | ||||||
PartnerReinsurance Ltd. | 127,796 | 13,473,532 | ||||||
Principal Financial Group, Inc. | 105,441 | 5,199,296 | ||||||
ProAssurance Corp. | 22,208 | 1,076,644 | ||||||
Progressive Corp. | 42,514 | 1,159,357 | ||||||
Protective Life Corp. | 28,225 | 1,429,878 | ||||||
Prudential Financial, Inc. | 249,213 | 22,982,423 | ||||||
Reinsurance Group of America, Inc. | 26,055 | 2,016,918 | ||||||
RenaissanceReinsurance Holdings Ltd. | 16,064 | 1,563,670 | ||||||
StanCorp Financial Group, Inc. | 15,938 | 1,055,892 | ||||||
Torchmark Corp. | 33,271 | 2,600,129 | ||||||
Travelers Cos., Inc. | 238,385 | 21,583,378 | ||||||
Unum Group | 95,980 | 3,366,978 | ||||||
Validus Holdings Ltd. | 34,302 | 1,382,028 | ||||||
W. R. Berkley Corp. | 39,019 | 1,693,034 | ||||||
White Mountains Insurance Group Ltd. | 2,234 | 1,347,281 | ||||||
XL Group plc | 335,645 | 10,686,937 | ||||||
|
| |||||||
| 441,686,497 | ||||||||
|
| |||||||
Real Estate Investment Trusts (REITs) (2.2%) |
| |||||||
Alexandria Real Estate Equities, Inc. (REIT) | 25,716 | 1,636,052 | ||||||
American Campus Communities, Inc. (REIT) | 37,707 | 1,214,543 | ||||||
American Capital Agency Corp. (REIT) | 142,448 | 2,747,822 | ||||||
American Homes 4 Rent (REIT), Class A | 14,771 | 239,290 | ||||||
Annaly Capital Management, Inc. (REIT) | 340,360 | 3,393,389 | ||||||
Apartment Investment & Management Co. (REIT), Class A | 23,721 | 614,611 | ||||||
AvalonBay Communities, Inc. (REIT) | 46,553 | $ | 5,503,961 | |||||
BioMed Realty Trust, Inc. (REIT) | 67,024 | 1,214,475 | ||||||
Boston Properties, Inc. (REIT) | 49,392 | 4,957,475 | ||||||
Brandywine Realty Trust (REIT) | 56,271 | 792,858 | ||||||
BRE Properties, Inc. (REIT) | 27,737 | 1,517,491 | ||||||
Brixmor Property Group, Inc. (REIT)* | 13,715 | 278,826 | ||||||
Camden Property Trust (REIT) | 30,519 | 1,735,921 | ||||||
CBL & Associates Properties, Inc. (REIT) | 39,520 | 709,779 | ||||||
Chimera Investment Corp. (REIT) | 369,168 | 1,144,421 | ||||||
CommonWealth REIT (REIT) | 42,567 | 992,237 | ||||||
Corporate Office Properties Trust/Maryland (REIT) | 30,849 | 730,813 | ||||||
Corrections Corp. of America (REIT) | 15,274 | 489,837 | ||||||
DDR Corp. (REIT) | 94,862 | 1,458,029 | ||||||
Digital Realty Trust, Inc. (REIT) | 9,877 | 485,158 | ||||||
Douglas Emmett, Inc. (REIT) | 51,230 | 1,193,147 | ||||||
Duke Realty Corp. (REIT) | 115,566 | 1,738,113 | ||||||
Equity Lifestyle Properties, Inc. (REIT) | 8,302 | 300,782 | ||||||
Equity Residential (REIT) | 129,390 | 6,711,459 | ||||||
Essex Property Trust, Inc. (REIT) | 13,680 | 1,963,217 | ||||||
Extra Space Storage, Inc. (REIT) | 36,686 | 1,545,581 | ||||||
Federal Realty Investment Trust (REIT) | 8,136 | 825,072 | ||||||
Gaming and Leisure Properties, Inc. (REIT)* | 24,412 | 1,240,374 | ||||||
General Growth Properties, Inc. (REIT) | 213,678 | 4,288,517 | ||||||
Hatteras Financial Corp. (REIT) | 35,519 | 580,380 | ||||||
HCP, Inc. (REIT) | 163,310 | 5,931,419 | ||||||
Health Care REIT, Inc. (REIT) | 102,284 | 5,479,354 | ||||||
Healthcare Trust of America, Inc. (REIT), Class A | 40,095 | 394,535 | ||||||
Home Properties, Inc. (REIT) | 20,446 | 1,096,315 | ||||||
Hospitality Properties Trust (REIT) | 50,200 | 1,356,906 | ||||||
Host Hotels & Resorts, Inc. (REIT) | 267,548 | 5,201,133 | ||||||
Kilroy Realty Corp. (REIT) | 29,267 | 1,468,618 | ||||||
Kimco Realty Corp. (REIT) | 146,885 | 2,900,979 | ||||||
Liberty Property Trust (REIT) | 46,578 | 1,577,597 | ||||||
Macerich Co. (REIT) | 49,469 | 2,913,229 | ||||||
Mack-Cali Realty Corp. (REIT) | 31,639 | 679,606 | ||||||
MFA Financial, Inc. (REIT) | 129,808 | 916,445 | ||||||
Mid-America Apartment Communities, Inc. (REIT) | 26,831 | 1,629,715 | ||||||
National Retail Properties, Inc. (REIT) | 42,600 | 1,292,058 | ||||||
Piedmont Office Realty Trust, Inc. (REIT), Class A | 60,322 | 996,519 | ||||||
See Notes to Financial Statements.
46
EQ ADVISORS TRUST
EQ/LARGE CAP VALUE PLUS PORTFOLIO
PORTFOLIO OF INVESTMENTS (Continued)
December 31, 2013
| Number of Shares | Value (Note 1) | |||||||
Post Properties, Inc. (REIT) | 19,615 | $ | 887,186 | |||||
Prologis, Inc. (REIT) | 179,012 | 6,614,493 | ||||||
Public Storage (REIT) | 3,522 | 530,131 | ||||||
Realty Income Corp. (REIT) | 70,539 | 2,633,221 | ||||||
Regency Centers Corp. (REIT) | 19,167 | 887,432 | ||||||
Retail Properties of America, Inc. (REIT), Class A | 48,111 | 611,972 | ||||||
Senior Housing Properties Trust (REIT) | 62,660 | 1,392,932 | ||||||
Simon Property Group, Inc. (REIT) | 28,245 | 4,297,759 | ||||||
SL Green Realty Corp. (REIT) | 32,905 | 3,039,764 | ||||||
Spirit Realty Capital, Inc. (REIT) | 107,360 | 1,055,349 | ||||||
Taubman Centers, Inc. (REIT) | 18,808 | 1,202,207 | ||||||
Two Harbors Investment Corp. (REIT) | 131,281 | 1,218,288 | ||||||
UDR, Inc. (REIT) | 90,079 | 2,103,345 | ||||||
Ventas, Inc. (REIT) | 57,825 | 3,312,216 | ||||||
Vornado Realty Trust (REIT) | 54,132 | 4,806,380 | ||||||
Weingarten Realty Investors (REIT) | 43,823 | 1,201,627 | ||||||
WP Carey, Inc. (REIT) | 20,687 | 1,269,147 | ||||||
|
| |||||||
| 123,141,507 | ||||||||
|
| |||||||
Real Estate Management & Development (0.2%) |
| |||||||
CBRE Group, Inc., Class A* | 57,800 | 1,520,140 | ||||||
Forest City Enterprises, Inc., Class A* | 56,720 | 1,083,352 | ||||||
Howard Hughes Corp.* | 14,233 | 1,709,383 | ||||||
Jones Lang LaSalle, Inc. | 72,642 | 7,437,814 | ||||||
Realogy Holdings Corp.* | 4,748 | 234,884 | ||||||
St. Joe Co.* | 22,445 | 430,720 | ||||||
|
| |||||||
| 12,416,293 | ||||||||
|
| |||||||
Thrifts & Mortgage Finance (0.1%) |
| |||||||
Hudson City Bancorp, Inc. | 208,332 | 1,964,571 | ||||||
New York Community Bancorp, Inc. | 158,437 | 2,669,663 | ||||||
People’s United Financial, Inc. | 111,247 | 1,682,055 | ||||||
TFS Financial Corp.* | 28,310 | 342,976 | ||||||
Washington Federal, Inc. | 37,460 | 872,443 | ||||||
|
| |||||||
| 7,531,708 | ||||||||
|
| |||||||
Total Financials | 1,411,266,222 | |||||||
|
| |||||||
Health Care (12.6%) | ||||||||
Biotechnology (0.3%) | ||||||||
Celgene Corp.* | 28,200 | 4,764,672 | ||||||
Gilead Sciences, Inc.* | 100,500 | 7,552,575 | ||||||
Quintiles Transnational Holdings, Inc.* | 5,442 | 252,182 | ||||||
Vertex Pharmaceuticals, Inc.* | 57,200 | 4,249,960 | ||||||
|
| |||||||
| 16,819,389 | ||||||||
|
| |||||||
Health Care Equipment & Supplies (2.8%) |
| |||||||
Abbott Laboratories | 560,034 | 21,466,103 | ||||||
Alere, Inc.* | 29,201 | 1,057,076 | ||||||
Baxter International, Inc. | 17,200 | 1,196,260 | ||||||
Boston Scientific Corp.* | 484,721 | 5,826,346 | ||||||
CareFusion Corp.* | 79,000 | 3,145,780 | ||||||
Cooper Cos., Inc. | 4,505 | 557,899 | ||||||
Covidien plc | 203,262 | $ | 13,842,142 | |||||
DENTSPLY International, Inc. | 37,149 | 1,800,984 | ||||||
Hill-Rom Holdings, Inc. | 21,534 | 890,216 | ||||||
Hologic, Inc.* | 112,473 | 2,513,772 | ||||||
Medtronic, Inc. | 1,016,649 | 58,345,486 | ||||||
St. Jude Medical, Inc. | 298,929 | 18,518,652 | ||||||
Stryker Corp. | 49,859 | 3,746,405 | ||||||
Teleflex, Inc. | 14,857 | 1,394,478 | ||||||
Zimmer Holdings, Inc. | 226,020 | 21,062,804 | ||||||
|
| |||||||
| 155,364,403 | ||||||||
|
| |||||||
Health Care Providers & Services (1.9%) |
| |||||||
Aetna, Inc. | 240,076 | 16,466,813 | ||||||
Cardinal Health, Inc. | 122,848 | 8,207,475 | ||||||
Cigna Corp. | 96,647 | 8,454,680 | ||||||
Community Health Systems, Inc.* | 31,285 | 1,228,562 | ||||||
Envision Healthcare Holdings, Inc.* | 6,162 | 218,874 | ||||||
Express Scripts Holding Co.* | 37,082 | 2,604,640 | ||||||
HCA Holdings, Inc.* | 89,146 | 4,253,156 | ||||||
Health Net, Inc.* | 163,756 | 4,858,641 | ||||||
Humana, Inc. | 56,596 | 5,841,839 | ||||||
LifePoint Hospitals, Inc.* | 17,043 | 900,552 | ||||||
MEDNAX, Inc.* | 12,896 | 688,388 | ||||||
Omnicare, Inc. | 37,744 | 2,278,228 | ||||||
Patterson Cos., Inc. | 3,357 | 138,308 | ||||||
Premier, Inc., Class A* | 4,150 | 152,554 | ||||||
Quest Diagnostics, Inc. | 154,494 | 8,271,609 | ||||||
UnitedHealth Group, Inc. | 366,499 | 27,597,375 | ||||||
Universal Health Services, Inc., Class B | 10,690 | 868,669 | ||||||
VCA Antech, Inc.* | 31,829 | 998,157 | ||||||
WellPoint, Inc. | 126,328 | 11,671,444 | ||||||
|
| |||||||
| 105,699,964 | ||||||||
|
| |||||||
Health Care Technology (0.1%) | ||||||||
Allscripts Healthcare Solutions, Inc.* | 63,957 | 988,775 | ||||||
Veeva Systems, Inc., Class A* | 1,892 | 60,733 | ||||||
|
| |||||||
| 1,049,508 | ||||||||
|
| |||||||
Life Sciences Tools & Services (0.5%) |
| |||||||
Agilent Technologies, Inc. | 110,206 | 6,302,681 | ||||||
Bio-Rad Laboratories, Inc., Class A* | 7,362 | 910,017 | ||||||
Charles River Laboratories International, Inc.* | 9,709 | 514,965 | ||||||
Life Technologies Corp.* | 23,531 | 1,783,650 | ||||||
PerkinElmer, Inc. | 40,238 | 1,659,013 | ||||||
QIAGEN N.V.* | 84,085 | 2,002,064 | ||||||
Techne Corp. | 7,141 | 676,039 | ||||||
Thermo Fisher Scientific, Inc. | 128,987 | 14,362,702 | ||||||
|
| |||||||
| 28,211,131 | ||||||||
|
| |||||||
Pharmaceuticals (7.0%) | ||||||||
AstraZeneca plc (ADR) | 232,021 | 13,775,087 | ||||||
Bristol-Myers Squibb Co. | 82,101 | 4,363,668 | ||||||
Eli Lilly and Co. | 589,623 | 30,070,773 | ||||||
Forest Laboratories, Inc.* | 95,834 | 5,752,915 | ||||||
GlaxoSmithKline plc (ADR) | 184,200 | 9,834,438 | ||||||
See Notes to Financial Statements.
47
EQ ADVISORS TRUST
EQ/LARGE CAP VALUE PLUS PORTFOLIO
PORTFOLIO OF INVESTMENTS (Continued)
December 31, 2013
| Number of Shares | Value (Note 1) | |||||||
Hospira, Inc.* | 126,887 | $ | 5,237,895 | |||||
Johnson & Johnson | 1,175,273 | 107,643,254 | ||||||
Mallinckrodt plc* | 21,223 | 1,109,114 | ||||||
Merck & Co., Inc. | 1,323,182 | 66,225,259 | ||||||
Pfizer, Inc. | 4,239,691 | 129,861,735 | ||||||
Roche Holding AG (ADR) | 109,600 | 7,693,920 | ||||||
Teva Pharmaceutical Industries Ltd. (ADR) | 139,470 | 5,589,958 | ||||||
|
| |||||||
| 387,158,016 | ||||||||
|
| |||||||
Total Health Care | 694,302,411 | |||||||
|
| |||||||
Industrials (8.2%) |
| |||||||
Aerospace & Defense (1.5%) |
| |||||||
Alliant Techsystems, Inc. | 11,595 | 1,410,879 | ||||||
B/E Aerospace, Inc.* | 2,286 | 198,950 | ||||||
Boeing Co. | 71,379 | 9,742,520 | ||||||
Exelis, Inc. | 67,586 | 1,288,189 | ||||||
General Dynamics Corp. | 107,356 | 10,257,866 | ||||||
Honeywell International, Inc. | 90,950 | 8,310,101 | ||||||
L-3 Communications Holdings, Inc. | 32,423 | 3,464,722 | ||||||
Northrop Grumman Corp. | 196,965 | 22,574,159 | ||||||
Raytheon Co. | 206,281 | 18,709,687 | ||||||
Rockwell Collins, Inc. | 5,391 | 398,503 | ||||||
Spirit AeroSystems Holdings, Inc., Class A* | 37,335 | 1,272,377 | ||||||
Textron, Inc. | 99,841 | 3,670,155 | ||||||
Triumph Group, Inc. | 14,801 | 1,125,912 | ||||||
United Technologies Corp. | 20,865 | 2,374,437 | ||||||
|
| |||||||
| 84,798,457 | ||||||||
|
| |||||||
Air Freight & Logistics (0.3%) |
| |||||||
FedEx Corp. | 113,873 | 16,371,521 | ||||||
|
| |||||||
Airlines (0.3%) |
| |||||||
Alaska Air Group, Inc. | 1,989 | 145,933 | ||||||
American Airlines Group, Inc.* | 55,182 | 1,393,345 | ||||||
Delta Air Lines, Inc. | 424,931 | 11,672,855 | ||||||
Southwest Airlines Co. | 230,989 | 4,351,833 | ||||||
|
| |||||||
| 17,563,966 | ||||||||
|
| |||||||
Building Products (0.1%) |
| |||||||
A.O. Smith Corp. | 15,952 | 860,451 | ||||||
Allegion plc* | 10,333 | 456,629 | ||||||
Fortune Brands Home & Security, Inc. | 7,241 | 330,914 | ||||||
Owens Corning, Inc.* | 42,709 | 1,739,110 | ||||||
|
| |||||||
| 3,387,104 | ||||||||
|
| |||||||
Commercial Services & Supplies (0.3%) |
| |||||||
ADT Corp. | 78,603 | 3,181,064 | ||||||
Cintas Corp. | 26,690 | 1,590,457 | ||||||
Covanta Holding Corp. | 38,165 | 677,429 | ||||||
Iron Mountain, Inc. | 6,161 | 186,986 | ||||||
KAR Auction Services, Inc. | 17,139 | 506,458 | ||||||
Pitney Bowes, Inc. | 41,047 | 956,395 | ||||||
R.R. Donnelley & Sons Co. | 29,944 | 607,264 | ||||||
Republic Services, Inc. | 97,161 | 3,225,745 | ||||||
Waste Connections, Inc. | 2,553 | 111,387 | ||||||
Waste Management, Inc. | 154,388 | 6,927,390 | ||||||
|
| |||||||
| 17,970,575 | ||||||||
|
| |||||||
Construction & Engineering (0.2%) |
| |||||||
AECOM Technology Corp.* | 33,555 | $ | 987,524 | |||||
Fluor Corp. | 23,512 | 1,887,778 | ||||||
Jacobs Engineering Group, Inc.* | 47,064 | 2,964,561 | ||||||
KBR, Inc. | 53,186 | 1,696,102 | ||||||
Quanta Services, Inc.* | 59,355 | 1,873,244 | ||||||
URS Corp. | 27,330 | 1,448,217 | ||||||
|
| |||||||
| 10,857,426 | ||||||||
|
| |||||||
Electrical Equipment (0.4%) |
| |||||||
Babcock & Wilcox Co. | 12,579 | 430,076 | ||||||
Eaton Corp. plc | 169,961 | 12,937,431 | ||||||
Emerson Electric Co. | 65,145 | 4,571,876 | ||||||
Hubbell, Inc., Class B | 5,956 | 648,609 | ||||||
Regal-Beloit Corp. | 16,221 | 1,195,812 | ||||||
|
| |||||||
| 19,783,804 | ||||||||
|
| |||||||
Industrial Conglomerates (2.9%) |
| |||||||
3M Co. | 58,004 | 8,135,061 | ||||||
Carlisle Cos., Inc. | 21,681 | 1,721,472 | ||||||
Danaher Corp. | 171,457 | 13,236,480 | ||||||
General Electric Co. | 4,803,027 | 134,628,847 | ||||||
|
| |||||||
| 157,721,860 | ||||||||
|
| |||||||
Machinery (1.7%) |
| |||||||
AGCO Corp. | 35,009 | 2,072,183 | ||||||
Caterpillar, Inc. | 193,553 | 17,576,548 | ||||||
Crane Co. | 1,343 | 90,317 | ||||||
Cummins, Inc. | 12,347 | 1,740,557 | ||||||
Donaldson Co., Inc. | 4,161 | 180,837 | ||||||
Dover Corp. | 16,167 | 1,560,762 | ||||||
Harsco Corp. | 27,024 | 757,483 | ||||||
IDEX Corp. | 2,058 | 151,983 | ||||||
Illinois Tool Works, Inc. | 260,886 | 21,935,295 | ||||||
Ingersoll-Rand plc | 51,196 | 3,153,674 | ||||||
Joy Global, Inc. | 38,243 | 2,236,833 | ||||||
Kennametal, Inc. | 28,309 | 1,474,050 | ||||||
Navistar International Corp.* | 17,503 | 668,439 | ||||||
Oshkosh Corp. | 31,685 | 1,596,290 | ||||||
PACCAR, Inc. | 110,696 | 6,549,882 | ||||||
Parker Hannifin Corp. | 71,762 | 9,231,464 | ||||||
Pentair Ltd. (Registered) | 73,450 | 5,704,861 | ||||||
Snap-on, Inc. | 18,596 | 2,036,634 | ||||||
SPX Corp. | 16,864 | 1,679,823 | ||||||
Stanley Black & Decker, Inc. | 53,132 | 4,287,221 | ||||||
Terex Corp. | 40,003 | 1,679,726 | ||||||
Timken Co. | 31,025 | 1,708,547 | ||||||
Trinity Industries, Inc. | 28,497 | 1,553,656 | ||||||
Xylem, Inc. | 62,555 | 2,164,403 | ||||||
|
| |||||||
| 91,791,468 | ||||||||
|
| |||||||
Marine (0.0%) |
| |||||||
Kirby Corp.* | 8,353 | 829,035 | ||||||
|
| |||||||
Professional Services (0.1%) |
| |||||||
Dun & Bradstreet Corp. | 1,121 | 137,603 | ||||||
Manpowergroup, Inc. | 27,722 | 2,380,211 | ||||||
Nielsen Holdings N.V. | 67,209 | 3,084,221 | ||||||
Towers Watson & Co., Class A | 23,466 | 2,994,496 | ||||||
|
| |||||||
| 8,596,531 | ||||||||
|
| |||||||
Road & Rail (0.3%) |
| |||||||
Amerco, Inc.* | 1,272 | 302,532 | ||||||
Con-way, Inc. | 12,859 | 510,631 | ||||||
See Notes to Financial Statements.
48
EQ ADVISORS TRUST
EQ/LARGE CAP VALUE PLUS PORTFOLIO
PORTFOLIO OF INVESTMENTS (Continued)
December 31, 2013
| Number of Shares | Value (Note 1) | |||||||
CSX Corp. | 184,018 | $ | 5,294,198 | |||||
Genesee & Wyoming, Inc., Class A* | 8,787 | 843,991 | ||||||
Norfolk Southern Corp. | 92,797 | 8,614,346 | ||||||
Ryder System, Inc. | 18,689 | 1,378,874 | ||||||
Union Pacific Corp. | 10,200 | 1,713,600 | ||||||
|
| |||||||
| 18,658,172 | ||||||||
|
| |||||||
Trading Companies & Distributors (0.1%) |
| |||||||
Air Lease Corp. | 25,225 | 783,993 | ||||||
GATX Corp. | 16,874 | 880,317 | ||||||
HD Supply Holdings, Inc.* | 8,247 | 198,010 | ||||||
MRC Global, Inc.* | 17,105 | 551,807 | ||||||
WESCO International, Inc.* | 15,857 | 1,444,097 | ||||||
|
| |||||||
| 3,858,224 | ||||||||
|
| |||||||
Total Industrials | 452,188,143 | |||||||
|
| |||||||
Information Technology (9.9%) | ||||||||
Communications Equipment (1.8%) |
| |||||||
Brocade Communications Systems, Inc.* | 159,444 | 1,414,268 | ||||||
Cisco Systems, Inc. | 3,239,841 | 72,734,431 | ||||||
CommScope Holding Co., Inc.* | 6,401 | 121,107 | ||||||
EchoStar Corp., Class A* | 14,607 | 726,260 | ||||||
Harris Corp. | 149,556 | 10,440,504 | ||||||
JDS Uniphase Corp.* | 19,568 | 253,993 | ||||||
Juniper Networks, Inc.* | 148,311 | 3,347,379 | ||||||
Motorola Solutions, Inc. | 4,702 | 317,385 | ||||||
Polycom, Inc.* | 62,015 | 696,428 | ||||||
Riverbed Technology, Inc.* | 3,262 | 58,977 | ||||||
Telefonaktiebolaget LM Ericsson (ADR) | 490,300 | 6,001,272 | ||||||
|
| |||||||
| 96,112,004 | ||||||||
|
| |||||||
Computers & Peripherals (2.5%) | ||||||||
Apple, Inc. | 145,777 | 81,796,932 | ||||||
Diebold, Inc. | 22,924 | 756,721 | ||||||
EMC Corp. | 377,411 | 9,491,887 | ||||||
Hewlett-Packard Co. | 1,316,664 | 36,840,259 | ||||||
Lexmark International, Inc., Class A | 22,652 | 804,599 | ||||||
SanDisk Corp. | 47,786 | 3,370,824 | ||||||
Stratasys Ltd.* | 5,166 | 695,860 | ||||||
Western Digital Corp. | 75,904 | 6,368,346 | ||||||
|
| |||||||
| 140,125,428 | ||||||||
|
| |||||||
Electronic Equipment, Instruments & Components (0.5%) |
| |||||||
Arrow Electronics, Inc.* | 155,704 | 8,446,942 | ||||||
Avnet, Inc. | 49,265 | 2,173,079 | ||||||
AVX Corp. | 17,071 | 237,799 | ||||||
CDW Corp. | 6,214 | 145,159 | ||||||
Corning, Inc. | 701,764 | 12,505,435 | ||||||
Dolby Laboratories, Inc., Class A* | 9,819 | 378,621 | ||||||
FLIR Systems, Inc. | 15,494 | 466,369 | ||||||
Ingram Micro, Inc., Class A* | 54,783 | 1,285,209 | ||||||
Jabil Circuit, Inc. | 72,829 | 1,270,138 | ||||||
Tech Data Corp.* | 13,649 | 704,288 | ||||||
Vishay Intertechnology, Inc.* | 47,227 | 626,230 | ||||||
|
| |||||||
| 28,239,269 | ||||||||
|
| |||||||
Internet Software & Services (0.4%) |
| |||||||
AOL, Inc.* | 27,833 | $ | 1,297,575 | |||||
Google, Inc., Class A* | 7,300 | 8,181,183 | ||||||
Twitter, Inc.* | 7,303 | 464,836 | ||||||
Yahoo!, Inc.* | 321,310 | 12,993,776 | ||||||
|
| |||||||
| 22,937,370 | ||||||||
|
| |||||||
IT Services (0.8%) | ||||||||
Amdocs Ltd. | 162,374 | 6,696,304 | ||||||
Booz Allen Hamilton Holding Corp. | 703 | 13,462 | ||||||
Computer Sciences Corp. | 53,994 | 3,017,185 | ||||||
CoreLogic, Inc.* | 34,349 | 1,220,420 | ||||||
DST Systems, Inc. | 2,243 | 203,530 | ||||||
Fidelity National Information Services, Inc. | 94,919 | 5,095,252 | ||||||
International Business Machines Corp. | 50,400 | 9,453,528 | ||||||
Leidos Holdings, Inc. | 26,262 | 1,220,920 | ||||||
Lender Processing Services, Inc. | 5,612 | 209,777 | ||||||
MasterCard, Inc., Class A | 7,100 | 5,931,766 | ||||||
Paychex, Inc. | 11,756 | 535,251 | ||||||
Science Applications International Corp. | 15,021 | 496,744 | ||||||
Total System Services, Inc. | 13,241 | 440,660 | ||||||
VeriFone Systems, Inc.* | 39,113 | 1,049,011 | ||||||
Western Union Co. | 435,494 | 7,512,272 | ||||||
|
| |||||||
| 43,096,082 | ||||||||
|
| |||||||
Office Electronics (0.4%) | ||||||||
Xerox Corp. | 1,899,137 | 23,112,497 | ||||||
Zebra Technologies Corp., Class A* | 16,719 | 904,164 | ||||||
|
| |||||||
| 24,016,661 | ||||||||
|
| |||||||
Semiconductors & Semiconductor Equipment (1.8%) |
| |||||||
Altera Corp. | 75,360 | 2,451,461 | ||||||
Analog Devices, Inc. | 62,967 | 3,206,909 | ||||||
Applied Materials, Inc. | 626,189 | 11,077,283 | ||||||
Avago Technologies Ltd. | 7,494 | 396,358 | ||||||
Broadcom Corp., Class A | 115,536 | 3,425,642 | ||||||
Fairchild Semiconductor International, Inc.* | 45,745 | 610,696 | ||||||
First Solar, Inc.* | 24,397 | 1,333,052 | ||||||
Freescale Semiconductor Ltd.* | 11,180 | 179,439 | ||||||
Intel Corp. | 1,669,730 | 43,346,191 | ||||||
KLA-Tencor Corp. | 68,397 | 4,408,871 | ||||||
Lam Research Corp.* | 44,832 | 2,441,102 | ||||||
LSI Corp. | 174,552 | 1,923,563 | ||||||
Marvell Technology Group Ltd. | 141,772 | 2,038,681 | ||||||
Micron Technology, Inc.* | 529,267 | 11,516,850 | ||||||
NVIDIA Corp. | 207,697 | 3,327,306 | ||||||
ON Semiconductor Corp.* | 8,172 | 67,337 | ||||||
Silicon Laboratories, Inc.* | 2,070 | 89,652 | ||||||
Skyworks Solutions, Inc.* | 11,642 | 332,496 | ||||||
Teradyne, Inc.* | 297,497 | 5,241,897 | ||||||
|
| |||||||
| 97,414,786 | ||||||||
|
| |||||||
Software (1.7%) | ||||||||
Activision Blizzard, Inc. | 89,187 | 1,590,204 | ||||||
Adobe Systems, Inc.* | 110,015 | 6,587,698 | ||||||
Autodesk, Inc.* | 16,697 | 840,360 | ||||||
See Notes to Financial Statements.
49
EQ ADVISORS TRUST
EQ/LARGE CAP VALUE PLUS PORTFOLIO
PORTFOLIO OF INVESTMENTS (Continued)
December 31, 2013
| Number of Shares | Value (Note 1) | |||||||
CA, Inc. | 117,871 | $ | 3,966,359 | |||||
Compuware Corp. | 76,687 | 859,661 | ||||||
Electronic Arts, Inc.* | 492,129 | 11,289,439 | ||||||
FireEye, Inc.* | 1,551 | 67,639 | ||||||
MICROS Systems, Inc.* | 24,055 | 1,380,036 | ||||||
Microsoft Corp. | 1,025,232 | 38,374,434 | ||||||
Nuance Communications, Inc.* | 93,959 | 1,428,177 | ||||||
Oracle Corp. | 432,971 | 16,565,471 | ||||||
Rovi Corp.* | 32,880 | 647,407 | ||||||
Symantec Corp. | 383,936 | 9,053,211 | ||||||
Synopsys, Inc.* | 55,240 | 2,241,087 | ||||||
Zynga, Inc., Class A* | 209,574 | 796,381 | ||||||
|
| |||||||
| 95,687,564 | ||||||||
|
| |||||||
Total Information Technology | 547,629,164 | |||||||
|
| |||||||
Materials (2.4%) | ||||||||
Chemicals (1.4%) | ||||||||
Air Products and Chemicals, Inc. | 74,900 | 8,372,322 | ||||||
Akzo Nobel N.V. (ADR) | 215,800 | 5,582,746 | ||||||
Albemarle Corp. | 18,221 | 1,155,029 | ||||||
Ashland, Inc. | 70,061 | 6,798,719 | ||||||
Cabot Corp. | 22,927 | 1,178,448 | ||||||
Celanese Corp. | 1,400 | 77,434 | ||||||
CF Industries Holdings, Inc. | 21,350 | 4,975,404 | ||||||
Cytec Industries, Inc. | 13,172 | 1,227,104 | ||||||
Dow Chemical Co. | 377,679 | 16,768,948 | ||||||
Huntsman Corp. | 69,495 | 1,709,577 | ||||||
Kronos Worldwide, Inc. | 7,506 | 142,989 | ||||||
LyondellBasell Industries N.V., Class A | 278,680 | 22,372,430 | ||||||
Mosaic Co. | 107,835 | 5,097,360 | ||||||
PPG Industries, Inc. | 4,673 | 886,281 | ||||||
Rockwood Holdings, Inc. | 7,708 | 554,359 | ||||||
RPM International, Inc. | 3,070 | 127,436 | ||||||
Sigma-Aldrich Corp. | 2,447 | 230,043 | ||||||
W.R. Grace & Co.* | 3,616 | 357,514 | ||||||
Westlake Chemical Corp. | 1,087 | 132,690 | ||||||
|
| |||||||
| 77,746,833 | ||||||||
|
| |||||||
Construction Materials (0.1%) |
| |||||||
Vulcan Materials Co. | 46,733 | 2,776,875 | ||||||
|
| |||||||
Containers & Packaging (0.2%) |
| |||||||
AptarGroup, Inc. | 7,171 | 486,266 | ||||||
Avery Dennison Corp. | 24,495 | 1,229,404 | ||||||
Bemis Co., Inc. | 20,764 | 850,493 | ||||||
Crown Holdings, Inc.* | 7,671 | 341,896 | ||||||
Greif, Inc., Class A | 9,145 | 479,198 | ||||||
MeadWestvaco Corp. | 63,577 | 2,347,899 | ||||||
Owens-Illinois, Inc.* | 24,394 | 872,817 | ||||||
Rock-Tenn Co., Class A | 7,292 | 765,733 | ||||||
Sonoco Products Co. | 36,394 | 1,518,358 | ||||||
|
| |||||||
| 8,892,064 | ||||||||
|
| |||||||
Metals & Mining (0.7%) | ||||||||
Alcoa, Inc. | 384,231 | 4,084,376 | ||||||
Allegheny Technologies, Inc. | 38,841 | 1,383,905 | ||||||
Carpenter Technology Corp. | 16,705 | 1,039,051 | ||||||
Cliffs Natural Resources, Inc. | 54,997 | 1,441,471 | ||||||
Freeport-McMoRan Copper & Gold, Inc. | 371,589 | 14,023,769 | ||||||
Newmont Mining Corp. | 176,931 | $ | 4,074,721 | |||||
Nucor Corp. | 114,242 | 6,098,238 | ||||||
Reliance Steel & Aluminum Co. | 61,773 | 4,684,864 | ||||||
Royal Gold, Inc. | 17,290 | 796,550 | ||||||
Steel Dynamics, Inc. | 79,216 | 1,547,881 | ||||||
Tahoe Resources, Inc.* | 26,730 | 444,787 | ||||||
United States Steel Corp. | 51,837 | 1,529,191 | ||||||
|
| |||||||
| 41,148,804 | ||||||||
|
| |||||||
Paper & Forest Products (0.0%) |
| |||||||
Domtar Corp. | 11,918 | 1,124,344 | ||||||
International Paper Co. | 27,651 | 1,355,729 | ||||||
|
| |||||||
| 2,480,073 | ||||||||
|
| |||||||
Total Materials | 133,044,649 | |||||||
|
| |||||||
Telecommunication Services (1.9%) |
| |||||||
Diversified Telecommunication Services (1.6%) |
| |||||||
AT&T, Inc. | 2,295,247 | 80,700,885 | ||||||
CenturyLink, Inc. | 218,800 | 6,968,780 | ||||||
Frontier Communications Corp. | 358,505 | 1,667,048 | ||||||
Intelsat S.A.* | 7,600 | 171,304 | ||||||
Level 3 Communications, Inc.* | 38,802 | 1,287,062 | ||||||
Windstream Holdings, Inc. | 11,722 | 93,542 | ||||||
|
| |||||||
| 90,888,621 | ||||||||
|
| |||||||
Wireless Telecommunication Services (0.3%) |
| |||||||
Sprint Corp.* | 250,068 | 2,688,231 | ||||||
Telephone & Data Systems, Inc. | 33,864 | 873,014 | ||||||
T-Mobile US, Inc.* | 61,927 | 2,083,224 | ||||||
U.S. Cellular Corp. | 4,694 | 196,303 | ||||||
Vodafone Group plc (ADR) | 263,800 | 10,369,978 | ||||||
|
| |||||||
| 16,210,750 | ||||||||
|
| |||||||
Total Telecommunication Services | 107,099,371 | |||||||
|
| |||||||
Utilities (4.3%) |
| |||||||
Electric Utilities (2.1%) |
| |||||||
American Electric Power Co., Inc. | 218,107 | 10,194,321 | ||||||
Duke Energy Corp. | 253,543 | 17,497,002 | ||||||
Edison International | 413,416 | 19,141,161 | ||||||
Entergy Corp. | 64,055 | 4,052,760 | ||||||
Exelon Corp. | 307,518 | 8,422,918 | ||||||
FirstEnergy Corp. | 150,316 | 4,957,422 | ||||||
Great Plains Energy, Inc. | 55,312 | 1,340,763 | ||||||
Hawaiian Electric Industries, Inc. | 35,422 | 923,097 | ||||||
NextEra Energy, Inc. | 152,636 | 13,068,694 | ||||||
Northeast Utilities | 113,035 | 4,791,554 | ||||||
OGE Energy Corp. | 71,246 | 2,415,239 | ||||||
Pepco Holdings, Inc. | 89,339 | 1,709,055 | ||||||
Pinnacle West Capital Corp. | 39,525 | 2,091,663 | ||||||
PPL Corp. | 226,932 | 6,828,384 | ||||||
Southern Co. | 312,731 | 12,856,371 | ||||||
Westar Energy, Inc. | 45,597 | 1,466,856 | ||||||
Xcel Energy, Inc. | 178,713 | 4,993,241 | ||||||
|
| |||||||
| 116,750,501 | ||||||||
|
| |||||||
Gas Utilities (0.4%) |
| |||||||
AGL Resources, Inc. | 42,525 | 2,008,456 | ||||||
Atmos Energy Corp. | 186,471 | 8,469,513 | ||||||
See Notes to Financial Statements.
50
EQ ADVISORS TRUST
EQ/LARGE CAP VALUE PLUS PORTFOLIO
PORTFOLIO OF INVESTMENTS (Continued)
December 31, 2013
| Number of Shares | Value (Note 1) | |||||||
National Fuel Gas Co. | 26,490 | $ | 1,891,386 | |||||
ONEOK, Inc. | 4,451 | 276,763 | ||||||
Questar Corp. | 54,782 | 1,259,438 | ||||||
UGI Corp. | 179,563 | 7,444,682 | ||||||
|
| |||||||
| 21,350,238 | ||||||||
|
| |||||||
Independent Power Producers & Energy Traders (0.4%) |
| |||||||
AES Corp. | 1,219,516 | 17,695,177 | ||||||
Calpine Corp.* | 125,486 | 2,448,232 | ||||||
NRG Energy, Inc. | 115,919 | 3,329,194 | ||||||
|
| |||||||
| 23,472,603 | ||||||||
|
| |||||||
Multi-Utilities (1.3%) |
| |||||||
Alliant Energy Corp. | 39,904 | 2,059,047 | ||||||
Ameren Corp. | 87,188 | 3,152,718 | ||||||
CenterPoint Energy, Inc. | 153,990 | 3,569,488 | ||||||
CMS Energy Corp. | 95,913 | 2,567,591 | ||||||
Consolidated Edison, Inc. | 105,314 | 5,821,758 | ||||||
Dominion Resources, Inc. | 207,528 | 13,424,986 | ||||||
DTE Energy Co. | 62,511 | 4,150,105 | ||||||
Integrys Energy Group, Inc. | 28,496 | 1,550,467 | ||||||
MDU Resources Group, Inc. | 67,907 | 2,074,559 | ||||||
NiSource, Inc. | 112,159 | 3,687,788 | ||||||
PG&E Corp. | 158,932 | 6,401,781 | ||||||
Public Service Enterprise Group, Inc. | 181,785 | 5,824,391 | ||||||
SCANA Corp. | 50,169 | 2,354,431 | ||||||
Sempra Energy | 102,927 | 9,238,728 | ||||||
TECO Energy, Inc. | 78,250 | 1,349,030 | ||||||
Vectren Corp. | 29,627 | 1,051,759 | ||||||
Wisconsin Energy Corp. | 82,179 | 3,397,280 | ||||||
|
| |||||||
| 71,675,907 | ||||||||
|
| |||||||
Water Utilities (0.1%) |
| |||||||
American Water Works Co., Inc. | 63,930 | 2,701,682 | ||||||
Aqua America, Inc. | 7,931 | 187,092 | ||||||
|
| |||||||
| 2,888,774 | ||||||||
|
| |||||||
Total Utilities | 236,138,023 | |||||||
|
| |||||||
Total Common Stocks (92.2%) | 5,089,971,812 | |||||||
|
| |||||||
PREFERRED STOCK: | ||||||||
Industrials (0.0%) |
| |||||||
Machinery (0.0%) |
| |||||||
Stanley Black & Decker, Inc. 6.250%* | 6,000 | $ | 619,200 | |||||
|
| |||||||
Total Preferred Stock (0.0%) | 619,200 | |||||||
|
| |||||||
INVESTMENT COMPANIES: | ||||||||
Exchange Traded Funds (ETFs)(0.3%) |
| |||||||
iShares® Core S&P 500 ETF | 294 | 54,581 | ||||||
iShares® Morningstar Large-Cap ETF | 499 | 53,812 | ||||||
iShares® Morningstar Large-Cap Growth ETF | 5,200 | 519,948 | ||||||
iShares® Morningstar Large-Cap Value ETF | 38,655 | 3,107,862 | ||||||
iShares® Russell 1000 ETF | 531 | 54,783 | ||||||
iShares® Russell 1000 Growth ETF | 5,670 | 487,337 | ||||||
iShares® Russell 1000 Value ETF | 59,838 | 5,634,346 | ||||||
iShares® S&P 500 Value ETF | 37,521 | 3,206,545 | ||||||
Vanguard Growth ETF | 2,150 | 200,058 | ||||||
Vanguard Large-Cap ETF | 1,964 | 166,547 | ||||||
Vanguard Value ETF | 44,621 | 3,408,598 | ||||||
|
| |||||||
Total Investment Companies (0.3%) | 16,894,417 | |||||||
|
| |||||||
Total Investments (92.5%) | 5,107,485,429 | |||||||
Other Assets Less | 411,852,237 | |||||||
|
| |||||||
Net Assets (100%) | $ | 5,519,337,666 | ||||||
|
| |||||||
| * | Non-income producing. |
Glossary:
| ADR | — American Depositary Receipt |
At December 31, 2013, the Portfolio had the following futures contracts open: (Note 1)
Purchases | Number of Contracts | Expiration Date | Original Value | Value at 12/31/2013 | Unrealized Appreciation/ (Depreciation) | |||||||||||||||
S&P 400 MidCap E-Mini Index | 579 | March-14 | $ | 75,745,477 | $ | 77,551,260 | $ | 1,805,783 | ||||||||||||
S&P 500 E-Mini Index | 3,825 | March-14 | 344,466,756 | 352,110,375 | 7,643,619 | |||||||||||||||
|
| |||||||||||||||||||
| $ | 9,449,402 | |||||||||||||||||||
|
| |||||||||||||||||||
See Notes to Financial Statements.
51
EQ ADVISORS TRUST
EQ/LARGE CAP VALUE PLUS PORTFOLIO
PORTFOLIO OF INVESTMENTS (Continued)
December 31, 2013
The following is a summary of the inputs used to value the Portfolio’s assets and liabilities carried at fair value as of December 31, 2013:
The inputs or methodology used for valuing securities are not necessarily an indication of the risk associated with investing in those securities.
Various inputs are used in determining the value of the Portfolio’s investments. These inputs are summarized in the three broad levels listed below:
| Investment Type | Level 1 Quoted Prices in Active Markets for Identical Securities | Level 2 Significant Other Observable Inputs (including quoted prices for similar securities, interest rates, prepayment speeds, credit risk, etc.) | Level 3 Significant Unobservable Inputs (including the Portfolio’s own assumptions in determining the fair value of investments) | Total | ||||||||||||
Assets: | ||||||||||||||||
Common Stocks | ||||||||||||||||
Consumer Discretionary | $ | 461,590,047 | $ | — | $ | — | $ | 461,590,047 | ||||||||
Consumer Staples | 308,689,365 | — | — | 308,689,365 | ||||||||||||
Energy | 738,024,417 | — | — | 738,024,417 | ||||||||||||
Financials | 1,411,266,222 | — | — | 1,411,266,222 | ||||||||||||
Health Care | 694,302,411 | — | — | 694,302,411 | ||||||||||||
Industrials | 452,188,143 | — | — | 452,188,143 | ||||||||||||
Information Technology | 547,629,164 | — | — | 547,629,164 | ||||||||||||
Materials | 133,044,649 | — | — | 133,044,649 | ||||||||||||
Telecommunication Services | 107,099,371 | — | — | 107,099,371 | ||||||||||||
Utilities | 236,138,023 | — | — | 236,138,023 | ||||||||||||
Futures | 9,449,402 | — | — | 9,449,402 | ||||||||||||
Investment Companies | ||||||||||||||||
Exchange Traded Funds (ETFs) | 16,894,417 | — | — | 16,894,417 | ||||||||||||
Preferred Stocks | ||||||||||||||||
Industrials | 619,200 | — | — | 619,200 | ||||||||||||
|
|
|
|
|
|
|
| |||||||||
Total Assets | $ | 5,116,934,831 | $ | — | $ | — | $ | 5,116,934,831 | ||||||||
|
|
|
|
|
|
|
| |||||||||
Total Liabilities | $ — | $ | — | $ | — | $ | — | |||||||||
|
|
|
|
|
|
|
| |||||||||
Total | $ | 5,116,934,831 | $ | — | $ | — | $ | 5,116,934,831 | ||||||||
|
|
|
|
|
|
|
| |||||||||
There were no transfers between Levels 1, 2 or 3 during the year ended December 31, 2013.
Fair Values of Derivative Instruments as of December 31, 2013:
Statement of Assets and Liabilities | ||||||
Derivatives Not Accounted for as | Asset Derivatives | Fair Value | ||||
Interest rate contracts | Receivables, Net assets - Unrealized appreciation | $ | — | * | ||
Foreign exchange contracts | Receivables | — | ||||
Credit contracts | Receivables | — | ||||
Equity contracts | Receivables, Net assets - Unrealized appreciation | 9,449,402 | * | |||
Commodity contracts | Receivables | — | ||||
Other contracts | Receivables | — | ||||
|
| |||||
Total | $ | 9,449,402 | ||||
|
| |||||
See Notes to Financial Statements.
52
EQ ADVISORS TRUST
EQ/LARGE CAP VALUE PLUS PORTFOLIO
PORTFOLIO OF INVESTMENTS (Continued)
December 31, 2013
Fair Values of Derivative Instruments as of December 31, 2013:
Statement of Assets and Liabilities | ||||||
Derivatives Not Accounted for as | Liability Derivatives | Fair Value | ||||
Interest rate contracts | Payables, Net assets - Unrealized depreciation | $ | — | * | ||
Foreign exchange contracts | Payables | — | ||||
Credit contracts | Payables | — | ||||
Equity contracts | Payables, Net assets - Unrealized depreciation | — | * | |||
Commodity contracts | Payables | — | ||||
Other contracts | Payables | — | ||||
|
| |||||
Total | $ | — | ||||
|
| |||||
| * | Includes cumulative appreciation/depreciation of futures contracts as reported in the Portfolio of Investments. Only current day’s variation margin is reported within the Statement of Assets & Liabilities. |
The effect of Derivative Instruments on the Statement of Operations for the year ended December 31, 2013:
| Amount of Realized Gain or (Loss) on Derivatives Recognized in Income | ||||||||||||||||||||
Derivatives Not Accounted for as Hedging Instruments^ | Options | Futures | Forward Currency Contracts | Swaps | Total | |||||||||||||||
Interest rate contracts | $ | — | $ | — | $ | — | $ | — | $ | — | ||||||||||
Foreign exchange contracts | — | — | — | — | — | |||||||||||||||
Credit contracts | — | — | — | — | — | |||||||||||||||
Equity contracts | — | 63,127,530 | — | — | 63,127,530 | |||||||||||||||
Commodity contracts | — | — | — | — | — | |||||||||||||||
Other contracts | — | — | — | — | — | |||||||||||||||
|
|
|
|
|
|
|
|
|
| |||||||||||
Total | $ | — | $ | 63,127,530 | $ | — | $ | — | $ | 63,127,530 | ||||||||||
|
|
|
|
|
|
|
|
|
| |||||||||||
| Amount of Unrealized Appreciation or (Depreciation) on Derivatives Recognized in Income | ||||||||||||||||||||
Derivatives Not Accounted for as Hedging Instruments^ | Options | Futures | Forward Currency Contracts | Swaps | Total | |||||||||||||||
Interest rate contracts | $ | — | $ | — | $ | — | $ | — | $ | — | ||||||||||
Foreign exchange contracts | — | — | — | — | — | |||||||||||||||
Credit contracts | — | — | — | — | — | |||||||||||||||
Equity contracts | — | 9,302,156 | — | — | 9,302,156 | |||||||||||||||
Commodity contracts | — | — | — | — | — | |||||||||||||||
Other contracts | — | — | — | — | — | |||||||||||||||
|
|
|
|
|
|
|
|
|
| |||||||||||
Total | $ | — | $ | 9,302,156 | $ | — | $ | — | $ | 9,302,156 | ||||||||||
|
|
|
|
|
|
|
|
|
| |||||||||||
^ This Portfolio held futures contracts as a substitute for investing in conventional securities, hedging and in an attempt to enhance returns.
The Portfolio held futures contracts with an average notional balance of approximately $239,794,000 during the year ended December 31, 2013.
See Notes to Financial Statements.
53
EQ ADVISORS TRUST
EQ/LARGE CAP VALUE PLUS PORTFOLIO
PORTFOLIO OF INVESTMENTS (Continued)
December 31, 2013
The following table presents the Portfolio’s gross derivative assets and liabilities by counterparty net of amounts available for offset under netting arrangements and any related collateral received or pledged by the Portfolio as of December 31, 2013:
Counterparty | Gross Amount of Derivative Assets Presented in the Statement of Assets and Liabilities (a) | Derivatives Available for Offset | Collateral Received | Net Amount Due from Counterparty | ||||||||||||
Exchange Traded Futures & Options Contracts (b) | $ 9,449,402 | (c) | $ | — | $ | — | $ | 9,449,402 | ||||||||
|
|
|
|
|
|
|
| |||||||||
| (a) | For financial reporting purposes the Portfolio does not offset derivative assets and derivative liabilities subject to master netting arrangements in the Statement of Assets and Liabilities. |
| (b) | These derivatives are traded on an exchange, therefore they are not subject to master netting arrangements. |
| (c) | This amount represents the cumulative appreciation (depreciation) of futures contracts as reported in the Portfolio of Investments. The Statement of Assets and Liabilities only reflects the current day variation margin receivable/payable to brokers for futures contracts. |
Investment security transactions for the year ended December 31, 2013 were as follows:
Cost of Purchases: | ||||
Long-term investments other than U.S. government debt securities | $ | 1,438,794,851 | ||
Net Proceeds of Sales and Redemptions: | ||||
Long-term investments other than U.S. government debt securities | $ | 2,295,121,197 |
As of December 31, 2013, the gross unrealized appreciation (depreciation) of investments based on the aggregate cost of investments for Federal income tax purposes was as follows:
Aggregate gross unrealized appreciation | $ | 1,076,734,468 | ||
Aggregate gross unrealized depreciation | (30,460,355 | ) | ||
|
| |||
Net unrealized appreciation | $ | 1,046,274,113 | ||
|
| |||
Federal income tax cost of investments | $ | 4,061,211,316 | ||
|
|
For the year ended December 31, 2013, the Portfolio incurred approximately $2,847 as brokerage commissions with Sanford C. Bernstein & Co., LLC an affiliated broker/dealer.
The Portfolio has a net capital loss carryforward of $976,913,866, which expires in the year 2017. The Portfolio utilized net capital loss carryforward of $340,850,942 during 2013.
See Notes to Financial Statements.
54
EQ ADVISORS TRUST
EQ/LARGE CAP VALUE PLUS PORTFOLIO
STATEMENT OF ASSETS AND LIABILITIES December 31, 2013
ASSETS | ||||
Investments at value (Cost $3,888,772,856) | $ | 5,107,485,429 | ||
Cash | 385,606,766 | |||
Cash held as collateral at broker | 26,440,000 | |||
Receivable for securities sold | 13,810,666 | |||
Dividends, interest and other receivables | 7,749,952 | |||
Due from broker for futures variation margin | 1,426,650 | |||
Receivable from Separate Accounts for Trust shares sold | 141,921 | |||
Other assets | 12,581 | |||
|
| |||
Total assets | 5,542,673,965 | |||
|
| |||
LIABILITIES | ||||
Payable for securities purchased | 15,316,853 | |||
Payable to Separate Accounts for Trust shares redeemed | 3,989,133 | |||
Investment management fees payable | 2,120,760 | |||
Distribution fees payable - Class IB | 807,274 | |||
Administrative fees payable | 636,991 | |||
Distribution fees payable - Class IA | 222,656 | |||
Trustees’ fees payable | 6,754 | |||
Accrued expenses | 235,878 | |||
|
| |||
Total liabilities | 23,336,299 | |||
|
| |||
NET ASSETS | $ | 5,519,337,666 | ||
|
| |||
Net assets were comprised of: | ||||
Paid in capital | $ | 5,513,357,574 | ||
Accumulated undistributed net investment income (loss) | 2,685,138 | |||
Accumulated undistributed net realized gain (loss) on investments, futures and foreign currency transactions | (1,224,867,021 | ) | ||
Net unrealized appreciation (depreciation) on investments and futures | 1,228,161,975 | |||
|
| |||
Net assets | $ | 5,519,337,666 | ||
|
| |||
Class IA | ||||
Net asset value, offering and redemption price per share, $1,068,537,379 / 74,782,216 shares outstanding (unlimited amount authorized: $0.01 par value) | $ | 14.29 | ||
|
| |||
Class IB | ||||
Net asset value, offering and redemption price per share, $3,852,949,205 / 270,277,286 shares outstanding (unlimited amount authorized: $0.01 par value) | $ | 14.26 | ||
|
| |||
Class K | ||||
Net asset value, offering and redemption price per share, $597,851,082 / 41,843,089 shares outstanding (unlimited amount authorized: $0.01 par value) | $ | 14.29 | ||
|
|
STATEMENT OF OPERATIONS
For the Year Ended December 31, 2013
INVESTMENT INCOME | ||||
Dividends (net of $87,871 foreign withholding tax) | $ | 89,879,604 | ||
Interest | 242,006 | |||
|
| |||
Total income | 90,121,610 | |||
|
| |||
EXPENSES | ||||
Investment management fees | 19,027,327 | |||
Distribution fees - Class IB | 6,123,081 | |||
Administrative fees | 5,873,192 | |||
Distribution fees - Class IA | 2,478,729 | |||
Printing and mailing expenses | 408,967 | |||
Professional fees | 137,456 | |||
Custodian fees | 105,000 | |||
Trustees’ fees | 101,001 | |||
Miscellaneous | 72,062 | |||
|
| |||
Gross expenses | 34,326,815 | |||
Less: Fees paid indirectly | (107,871 | ) | ||
|
| |||
Net expenses | 34,218,944 | |||
|
| |||
NET INVESTMENT INCOME (LOSS) | 55,902,666 | |||
|
| |||
REALIZED AND UNREALIZED GAIN (LOSS) | ||||
Realized gain (loss) on: | ||||
Investments | 276,175,335 | |||
Futures | 63,127,530 | |||
Foreign currency transactions | (16,174 | ) | ||
|
| |||
Net realized gain (loss) | 339,286,691 | |||
|
| |||
Change in unrealized appreciation (depreciation) on: | ||||
Investments | 648,527,701 | |||
Futures | 9,302,156 | |||
|
| |||
Net change in unrealized appreciation (depreciation) | 657,829,857 | |||
|
| |||
NET REALIZED AND UNREALIZED GAIN (LOSS) | 997,116,548 | |||
|
| |||
NET INCREASE (DECREASE) IN NET ASSETS RESULTING FROM OPERATIONS | $ | 1,053,019,214 | ||
|
|
See Notes to Financial Statements.
55
EQ ADVISORS TRUST
EQ/LARGE CAP VALUE PLUS PORTFOLIO
STATEMENT OF CHANGES IN NET ASSETS
| Year Ended December 31, | ||||||||
| 2013 | 2012 | |||||||
INCREASE (DECREASE) IN NET ASSETS FROM OPERATIONS: | ||||||||
Net investment income (loss) | $ | 55,902,666 | $ | 47,145,959 | ||||
Net realized gain (loss) on investments, futures and foreign currency transactions | 339,286,691 | 197,350,133 | ||||||
Net change in unrealized appreciation (depreciation) on investments and futures | 657,829,857 | 198,589,285 | ||||||
|
|
|
| |||||
NET INCREASE (DECREASE) IN NET ASSETS RESULTING FROM OPERATIONS | 1,053,019,214 | 443,085,377 | ||||||
|
|
|
| |||||
DIVIDENDS: | ||||||||
Dividends from net investment income | ||||||||
Class IA | (10,429,326 | ) | (13,919,673 | ) | ||||
Class IB | (37,788,331 | ) | (20,929,585 | ) | ||||
Class K | (7,303,309 | ) | (12,273,519 | ) | ||||
|
|
|
| |||||
TOTAL DIVIDENDS | (55,520,966 | ) | (47,122,777 | ) | ||||
|
|
|
| |||||
CAPITAL SHARES TRANSACTIONS: | ||||||||
Class IA | ||||||||
Capital shares sold [ 799,588 and 742,509 shares, respectively ] | 10,349,250 | 7,786,809 | ||||||
Capital shares sold in-kind (Note 9)[ 386,079 and 0 shares, respectively ] | 5,133,873 | — | ||||||
Capital shares issued in reinvestment of dividends [ 744,452 and 1,275,509 shares, respectively ] | 10,429,326 | 13,919,673 | ||||||
Capital shares repurchased [ (9,009,507) and (11,488,419) shares, respectively ] | (114,565,757 | ) | (120,393,217 | ) | ||||
|
|
|
| |||||
Total Class IA transactions | (88,653,308 | ) | (98,686,735 | ) | ||||
|
|
|
| |||||
Class IB | ||||||||
Capital shares sold [ 3,627,485 and 2,446,967 shares, respectively ] | 45,951,849 | 25,604,705 | ||||||
Capital shares sold in-kind (Note 9)[ 177,394,535 and 0 shares, respectively ] | 2,353,367,027 | — | ||||||
Capital shares issued in reinvestment of dividends [ 2,703,620 and 1,922,383 shares, respectively ] | 37,788,331 | 20,929,585 | ||||||
Capital shares repurchased [ (36,741,063) and (20,497,413) shares, respectively ] | (482,897,538 | ) | (214,617,733 | ) | ||||
|
|
|
| |||||
Total Class IB transactions | 1,954,209,669 | (168,083,443 | ) | |||||
|
|
|
| |||||
Class K | ||||||||
Capital shares sold [ 595,758 and 607,723 shares, respectively ] | 7,796,767 | 6,325,237 | ||||||
Capital shares sold in-kind (Note 9)[ 36 and 0 shares, respectively ] | 485 | — | ||||||
Capital shares issued in reinvestment of dividends [ 521,386 and 1,124,807 shares, respectively ] | 7,303,309 | 12,273,519 | ||||||
Capital shares repurchased [ (21,429,552) and (20,853,616) shares, respectively ] | (267,863,073 | ) | (215,967,633 | ) | ||||
|
|
|
| |||||
Total Class K transactions | (252,762,512 | ) | (197,368,877 | ) | ||||
|
|
|
| |||||
NET INCREASE (DECREASE) IN NET ASSETS RESULTING FROM CAPITAL SHARE TRANSACTIONS | 1,612,793,849 | (464,139,055 | ) | |||||
|
|
|
| |||||
TOTAL INCREASE (DECREASE) IN NET ASSETS | 2,610,292,097 | (68,176,455 | ) | |||||
NET ASSETS: | ||||||||
Beginning of year | 2,909,045,569 | 2,977,222,024 | ||||||
|
|
|
| |||||
End of year (a) | $ | 5,519,337,666 | $ | 2,909,045,569 | ||||
|
|
|
|
| ||||
(a) Includes accumulated undistributed (overdistributed) net investment income (loss) of | $ | 2,685,138 | $ | 2,229,836 | ||||
|
|
|
| |||||
See Notes to Financial Statements.
56
EQ ADVISORS TRUST
EQ/LARGE CAP VALUE PLUS PORTFOLIO
FINANCIAL HIGHLIGHTS
| Year Ended December 31, | ||||||||||||||||||||
| Class IA | 2013 | 2012 | 2011 | 2010 | 2009 | |||||||||||||||
Net asset value, beginning of year | $ | 10.89 | $ | 9.55 | $ | 10.19 | $ | 9.15 | $ | 7.75 | ||||||||||
|
|
|
|
|
|
|
|
|
| |||||||||||
Income (loss) from investment operations: | ||||||||||||||||||||
Net investment income (loss) | 0.17 | (e) | 0.16 | (e) | 0.13 | (e) | 0.13 | (e) | 0.19 | (e) | ||||||||||
Net realized and unrealized gain (loss) on investments, futures and foreign currency transactions | 3.37 | 1.35 | (0.63 | ) | 1.05 | 1.41 | ||||||||||||||
|
|
|
|
|
|
|
|
|
| |||||||||||
Total from investment operations | 3.54 | 1.51 | (0.50 | ) | 1.18 | 1.60 | ||||||||||||||
|
|
|
|
|
|
|
|
|
| |||||||||||
Less distributions: | ||||||||||||||||||||
Dividends from net investment income | (0.14 | ) | (0.17 | ) | (0.14 | ) | (0.14 | ) | (0.20 | ) | ||||||||||
|
|
|
|
|
|
|
|
|
| |||||||||||
Net asset value, end of year | $ | 14.29 | $ | 10.89 | $ | 9.55 | $ | 10.19 | $ | 9.15 | ||||||||||
|
|
|
|
|
|
|
|
|
| |||||||||||
Total return | 32.54 | % | 15.83 | % | (4.84 | )% | 12.89 | % | 20.73 | % | ||||||||||
|
|
|
|
|
|
|
|
|
| |||||||||||
Ratios/Supplemental Data: | ||||||||||||||||||||
Net assets, end of year (000’s) | $ | 1,068,537 | $ | 891,848 | $ | 872,363 | $ | 2,027,488 | $ | 2,305,328 | ||||||||||
Ratio of expenses to average net assets: | ||||||||||||||||||||
After waivers (f) | 0.89 | % | 0.91 | % | 0.65 | % | 0.66 | % | 0.70 | % | ||||||||||
After waivers and fees paid indirectly (f) | 0.88 | % | 0.91 | % | 0.64 | % | 0.66 | % | 0.69 | % | ||||||||||
Before waivers and fees paid indirectly (f) | 0.89 | % | 0.91 | % | 0.65 | % | 0.66 | % | 0.70 | % | ||||||||||
Ratio of net investment income (loss) to average net assets: | ||||||||||||||||||||
After waivers (f) | 1.31 | % | 1.52 | % | 1.26 | % | 1.33 | % | 2.35 | % | ||||||||||
After waivers and fees paid indirectly (f) | 1.32 | % | 1.52 | % | 1.27 | % | 1.34 | % | 2.36 | % | ||||||||||
Before waivers and fees paid indirectly (f) | 1.31 | % | 1.52 | % | 1.26 | % | 1.33 | % | 2.35 | % | ||||||||||
Portfolio turnover rate | 37 | % | 25 | % | 33 | % | 38 | % | 52 | % | ||||||||||
| Year Ended December 31, | ||||||||||||||||||||
| Class IB | 2013 | 2012 | 2011 | 2010 | 2009 | |||||||||||||||
Net asset value, beginning of year | $ | 10.87 | $ | 9.53 | $ | 10.17 | $ | 9.12 | $ | 7.73 | ||||||||||
|
|
|
|
|
|
|
|
|
| |||||||||||
Income (loss) from investment operations: | ||||||||||||||||||||
Net investment income (loss) | 0.18 | (e) | 0.16 | (e) | 0.11 | (e) | 0.10 | (e) | 0.17 | (e) | ||||||||||
Net realized and unrealized gain (loss) on investments, futures and foreign currency transactions | 3.35 | 1.35 | (0.63 | ) | 1.06 | 1.40 | ||||||||||||||
|
|
|
|
|
|
|
|
|
| |||||||||||
Total from investment operations | 3.53 | 1.51 | (0.52 | ) | 1.16 | 1.57 | ||||||||||||||
|
|
|
|
|
|
|
|
|
| |||||||||||
Less distributions: | ||||||||||||||||||||
Dividends from net investment income | (0.14 | ) | (0.17 | ) | (0.12 | ) | (0.11 | ) | (0.18 | ) | ||||||||||
|
|
|
|
|
|
|
|
|
| |||||||||||
Net asset value, end of year | $ | 14.26 | $ | 10.87 | $ | 9.53 | $ | 10.17 | $ | 9.12 | ||||||||||
|
|
|
|
|
|
|
|
|
| |||||||||||
Total return | 32.50 | % | 15.86 | % | (5.09 | )% | 12.76 | % | 20.34 | % | ||||||||||
|
|
|
|
|
|
|
|
|
| |||||||||||
Ratios/Supplemental Data: | ||||||||||||||||||||
Net assets, end of year (000’s) | $ | 3,852,949 | $ | 1,340,073 | $ | 1,328,547 | $ | 1,605,171 | $ | 1,634,368 | ||||||||||
Ratio of expenses to average net assets: | ||||||||||||||||||||
After waivers (f) | 0.89 | % | 0.91 | % | 0.90 | % | 0.91 | % | 0.95 | % | ||||||||||
After waivers and fees paid indirectly (f) | 0.88 | % | 0.91 | % | 0.89 | % | 0.91 | % | 0.94 | % | ||||||||||
Before waivers and fees paid indirectly (f) | 0.89 | % | 0.91 | % | 0.90 | % | 0.91 | % | 0.95 | % | ||||||||||
Ratio of net investment income (loss) to average net assets: | ||||||||||||||||||||
After waivers (f) | 1.35 | % | 1.52 | % | 1.09 | % | 1.09 | % | 2.22 | % | ||||||||||
After waivers and fees paid indirectly (f) | 1.35 | % | 1.52 | % | 1.10 | % | 1.09 | % | 2.23 | % | ||||||||||
Before waivers and fees paid indirectly (f) | 1.35 | % | 1.52 | % | 1.09 | % | 1.09 | % | 2.22 | % | ||||||||||
Portfolio turnover rate | 37 | % | 25 | % | 33 | % | 38 | % | 52 | % | ||||||||||
See Notes to Financial Statements.
57
EQ ADVISORS TRUST
EQ/LARGE CAP VALUE PLUS PORTFOLIO
FINANCIAL HIGHLIGHTS (Continued)
| Year Ended December 31, | August 26, 2011* to December 31, 2011 | |||||||||||
| Class K | 2013 | 2012 | ||||||||||
Net asset value, beginning of period | $ | 10.89 | $ | 9.55 | $ | 9.24 | ||||||
|
|
|
|
|
| |||||||
Income (loss) from investment operations: | ||||||||||||
Net investment income (loss) | 0.20 | (e) | 0.18 | (e) | 0.06 | (e) | ||||||
Net realized and unrealized gain (loss) on investments, futures and foreign currency transactions | 3.38 | 1.36 | 0.39 | |||||||||
|
|
|
|
|
| |||||||
Total from investment operations | 3.58 | 1.54 | 0.45 | |||||||||
|
|
|
|
|
| |||||||
Less distributions: | ||||||||||||
Dividends from net investment income | (0.18 | ) | (0.20 | ) | (0.14 | ) | ||||||
|
|
|
|
|
| |||||||
Net asset value, end of period | $ | 14.29 | $ | 10.89 | $ | 9.55 | ||||||
|
|
|
|
|
| |||||||
Total return (b) | 32.87 | % | 16.13 | % | 4.95 | % | ||||||
|
|
|
|
|
| |||||||
Ratios/Supplemental Data: | ||||||||||||
Net assets, end of period (000’s) | $ | 597,851 | $ | 677,124 | $ | 776,313 | ||||||
Ratio of expenses to average net assets: | ||||||||||||
After waivers (a)(f) | 0.64 | % | 0.66 | % | 0.65 | % | ||||||
After waivers and fees paid indirectly (a)(f) | 0.63 | % | 0.66 | % | 0.65 | % | ||||||
Before waivers and fees paid indirectly (a)(f) | 0.64 | % | 0.66 | % | 0.65 | % | ||||||
Ratio of net investment income (loss) to average net assets: | ||||||||||||
After waivers (a)(f) | 1.56 | % | 1.76 | % | 1.79 | % | ||||||
After waivers and fees paid indirectly (a)(f) | 1.57 | % | 1.76 | % | 1.79 | % | ||||||
Before waivers and fees paid indirectly (a)(f) | 1.56 | % | 1.76 | % | 1.79 | % | ||||||
Portfolio turnover rate | 37 | % | 25 | % | 33 | % | ||||||
| * | Commencement of Operations. |
| (a) | Ratios for periods less than one year are annualized. |
| (b) | Total returns for periods less than one year are not annualized. |
| (e) | Net investment income (loss) per share is based on average shares outstanding. |
| (f) | Expenses do not include the expenses of the underlying funds (“indirect expenses”). |
See Notes to Financial Statements.
58
EQ ADVISORS TRUST
December 31, 2013
| Note 1 | Organization and Significant Accounting Policies |
EQ Advisors Trust (the “Trust”) was organized as a Delaware statutory trust on October 31, 1996 and is registered under the Investment Company Act of 1940, as amended (the “1940 Act”), as an open-end management investment company with seventy-four diversified portfolios and three non-diversified portfolios (each a “Portfolio”). These financial statements only present three of the diversified portfolios: EQ/International Core PLUS Portfolio, EQ/Large Cap Core PLUS Portfolio and EQ/Large Cap Value PLUS Portfolio. The investment manager to each Portfolio is AXA Equitable Funds Management Group, LLC (“FMG LLC” or the “Manager”), a wholly-owned subsidiary of AXA Equitable Life Insurance Company (“AXA Equitable”).
Under the Trust’s organizational documents, its officers and trustees are indemnified against certain liabilities arising out of the performance of their duties to the Trust. In addition, in the normal course of business, the Trust enters into contracts with vendors and others that provide for general indemnifications. The Trust’s maximum exposure under these arrangements is unknown as this would involve future claims that may be made against the Trust. However, based on experience, the Trust and management expect the risk of loss to be remote.
Each of the investment sub-advisers (each an “Adviser”) independently chooses and maintains a portfolio of securities for its Portfolios.
The EQ/International Core PLUS Portfolio, EQ/Large Cap Core PLUS Portfolio and EQ/Large Cap Value PLUS Portfolio (each a “PLUS Portfolio”; together, the “PLUS Portfolios”) employ multiple Advisers (each a “Multiadviser Portfolio”; together the “Multiadviser Portfolios”). Each of the Advisers independently chooses and maintains a portfolio of securities for the Multiadviser Portfolio and each is responsible for investing a specific allocated portion of the Multiadviser Portfolio’s assets. Because each Adviser will be managing its allocated portion of the Multiadviser Portfolio independently from the other Advisers, the same security may be held in different portions of the Multiadviser Portfolio, or may be acquired for one portion of the Multiadviser Portfolio at a time when the Adviser of another portion deems it appropriate to dispose of the security. Similarly, under some market conditions, one Adviser may believe that temporary defensive investments in short-term instruments or cash are appropriate when the other Adviser or Advisers believe continued exposure to the equity or fixed income markets is appropriate for their portions of the Multiadviser Portfolio. Because each Adviser directs the trading for its own portion of the Multiadviser Portfolio, and does not aggregate its transactions with those of the other Advisers, the Multiadviser Portfolio may incur higher brokerage costs, and have higher portfolio turnover, than would be the case if a single Adviser were managing the entire Multiadviser Portfolio.
The Trust issues three classes of shares, Class IA, Class IB and Class K. As of and during the year ended December 31, 2013, the Trust had Class IA, Class IB and Class K shares outstanding for each of the three Portfolios. The Class IA and Class IB shares are subject to distribution fees imposed under a distribution plan (“Distribution Plan”) adopted pursuant to Rule 12b-1 under the 1940 Act. Under the Trust’s multiple class distribution system, all three classes of shares have identical voting, dividend, liquidation and other rights, other than the payment of distribution fees under the applicable Distribution Plan. The Trust’s shares are currently sold only to insurance company separate accounts in connection with variable life insurance contracts and variable annuity certificates and contracts issued by AXA Equitable, AXA Life and Annuity Company, other affiliated or unaffiliated insurance companies and to the AXA Equitable 401(k) Plan. Shares also may be sold to other tax-qualified retirement plans, to other series of the Trust and to series of AXA Premier VIP Trust, a separate registered investment company managed by FMG LLC.
The investment objectives of each Portfolio are as follows:
EQ/International Core PLUS Portfolio (advised by FMG LLC, BlackRock Investment Management, LLC (“BlackRock”) Hirayama Investments, Massachusetts Financial Services Company d/b/a MFS Investment Management and WHV Investment Management) — Seeks to achieve long-term growth of capital with an emphasis on risk-adjusted returns and managing volatility in the Portfolio.
59
EQ ADVISORS TRUST
NOTES TO FINANCIAL STATEMENTS (Continued)
December 31, 2013
EQ/Large Cap Core PLUS Portfolio (advised by FMG LLC, BlackRock, Capital Guardian Trust Company and Institutional Capital LLC) — Seeks to achieve long-term growth of capital with an emphasis on risk-adjusted returns and managing volatility in the Portfolio.
EQ/Large Cap Value PLUS Portfolio (advised by FMG LLC, AllianceBernstein L.P. and BlackRock) — Seeks to achieve long-term growth of capital with an emphasis on risk-adjusted returns and managing volatility in the Portfolio. On July 29, 2013 BlackRock was added as an adviser to the Portfolio.
The following is a summary of the significant accounting policies of the Trust:
The preparation of financial statements in accordance with accounting principles generally accepted in the United States of America requires management to make estimates and assumptions that affect the reported amounts and disclosures. Actual results could differ from those estimates.
Valuation:
Equity securities (including securities issued by Exchange Traded Funds (“ETFs”)) listed on national securities exchanges are valued at the last sale price or official closing price on the date of valuation or, if there is no sale or official closing price, at the latest available bid price. Securities listed on the NASDAQ stock market will be valued using the NASDAQ Official Closing Price (“NOCP”). Generally, the NOCP will be the last sale price unless the reported trade for the security is outside the range of the bid/ask price. In such cases, the NOCP will be normalized to the nearer of the bid or ask price. Other unlisted stocks are valued at their last sale price or official closing price, or if there is no such price, at a bid price estimated by a broker.
Foreign securities, including foreign government securities, not traded directly in the U.S., or traded in American Depositary Receipt (“ADR”) or similar form, are valued at representative quoted prices from the primary exchange in the currency of the country of origin. Foreign currency is converted into U.S. dollar equivalent at current exchange rates.
Investments in shares of open-end mutual funds (other than ETFs) held by a Portfolio will be valued at the net asset value of the shares of such funds as described in these funds’ prospectuses.
Futures contracts are valued at their last settlement price or, if there is no sale, at the latest available bid price.
Forward foreign exchange contracts are valued by interpolating between the forward and spot currency rates as quoted by a pricing service as of a designated hour on the valuation date. The pricing service may utilize data such as actual trading information and foreign currency exchange rates gathered from leading market makers and foreign currency exchange trading centers throughout the world in making evaluations.
During the year ended December 31, 2013, the EQ/International Core PLUS Portfolio held forward foreign currency contracts to either gain exposure to certain currencies, or enter into an economic hedge against changes in the values of securities held in the Portfolio, that do not qualify for hedge accounting under Accounting Standards Codification (“ASC”) 815. The Statement of Operations for the Portfolio reflects realized gains or losses, if any, in forward currency transactions and unrealized gains or losses in forward currency exchange transactions. Further information on the impact of these positions on the Portfolio’s financial statements can be found in the Statement of Operations and Portfolio of Investments for the Portfolio.
If market quotations are not readily available for a security or other financial instruments, such securities and instruments shall be referred to the Trust’s Valuation Committee (“Committee”), who will value the assets in good faith pursuant to procedures adopted by the Board of Trustees (“Pricing Procedures”) of the Trust (the “Board”).
The Board is responsible for ensuring that appropriate valuation methods are used to price securities for the Trust’s Portfolios. The Board has delegated the responsibility of calculating the
60
EQ ADVISORS TRUST
NOTES TO FINANCIAL STATEMENTS (Continued)
December 31, 2013
NAVs of the Trust’s Portfolios and classes pursuant to these Pricing Procedures to the Trust’s administrator, FMG LLC (in its capacity as administrator, the “Administrator”). The Administrator has entered into a sub-administration agreement with JPMorgan Investor Services Co. (the “Sub-Administrator”) to assist in performing certain of the duties described herein. The Committee, established by the Board, determines the value of the Trust’s securities and assets for which market quotations are not readily available or for which valuation cannot otherwise be provided in accordance with procedures adopted by the Board. The Committee is comprised of senior employees from FMG LLC.
Due to the inherent uncertainty of valuations of such securities, the fair value may differ significantly from the values that would have been used had a ready market for such securities existed.
Various inputs are used in determining the value of the Trust’s assets or liabilities carried at fair value. These inputs are summarized in three broad levels below:
| • | Level 1 - quoted prices in active markets for identical assets |
| • | Level 2 - other significant observable inputs (including quoted prices of similar securities, interest rates, prepayment speeds, credit risk, etc.) |
| • | Level 3 - significant unobservable inputs (including the Portfolio’s own assumptions in determining the fair value of investments) |
A summary of inputs used to value each Portfolio’s assets and liabilities carried at fair value as of December 31, 2013 is included in the Portfolio of Investments. Changes in valuation techniques may result in transfers in or out of an investment’s assigned level. Transfers into, or out of, each level are reported using values as of the end of the year.
The Portfolios’ policy is to recognize transfers into and transfers out of the valuation levels as of the end of the reporting period. Transfers between levels are included after the Summary of Level 1, Level 2 and Level 3 inputs, following the Portfolio of Investments for each Portfolio. Transfers between levels may be due to a decline or an increase in market activity (e.g., frequency of trades), which may result in a lack of, or increase in, available market inputs to determine price. Transfers into and transfers out of Level 3 are included in the Level 3 reconciliation following the Portfolio of Investments for each Portfolio.
The inputs or methodology used to value securities are not necessarily an indication of the risk associated with investing in those securities. An investment’s level within the fair value hierarchy is based on the lowest level of any input, both individually and in aggregate, that is significant to the fair value measurement.
The Committee meets and reviews reports based on the valuation technique used to value each particular Level 3 security. In connection with this review, the Committee obtains, when available, updates from its pricing vendors and Advisers for each fair valued security. For example, with respect to model driven prices, the Committee receives a report regarding a review and recalculation of pricing models and related discounts. For securities valued based on broker quotes, the Committee evaluates variances between existing broker quotes and any alternative broker quotes provided by an Adviser or other pricing source.
To substantiate unobservable inputs used in fair valuation, the Secretary of the Committee performs an independent verification and additional research for all fair value notifications received from its pricing agent. Among other factors, particular areas of focus include: description of security, historical pricing, intra-day price movement, last trade information, corporate actions, related securities, any available company news and announcements, any available trade data and actions taken by other clients of the pricing vendor. The Committee also notes the materiality of holdings and price changes on portfolio NAV.
61
EQ ADVISORS TRUST
NOTES TO FINANCIAL STATEMENTS (Continued)
December 31, 2013
The Committee reviews and considers changes in value for all fair valued securities that have occurred since the last review.
The significant unobservable inputs used in the fair value measurement of the Portfolios’ investments in Common Stocks is the discount for lack of marketability. The significant unobservable inputs used in the fair value measurement of the Portfolio’s investments in Asset-Backed Securities is comparability analysis. Significant changes in any of those inputs in isolation may result in either a higher or lower fair value measurement.
Pursuant to procedures approved by the Board, events or circumstances affecting the values of portfolio securities that occur between the closing of their principal markets and the time the net asset value is determined may be reflected in the Trust’s calculation of net asset values for each applicable Portfolio when the Trust’s Manager deems that the particular event or circumstance would materially affect such Portfolio’s net asset value. At December 31, 2013, none of the Portfolios applied these procedures.
Security Transactions and Investment Income:
Securities transactions are recorded on the trade date net of brokerage fees, commissions, and transfer fees. Dividend income (net of withholding tax) and distributions to shareholders are recorded on the ex-dividend date, except that certain dividends from foreign securities, if any, are recognized as soon as the fund is informed of the ex-dividend date. Interest income (including amortization of premium and accretion of discount on long-term securities using the effective yield method) and interest expense are accrued daily. The Trust records paydown gains and losses realized on prepayments received on mortgage-backed securities as an adjustment to interest income.
The Portfolios record distributions received in excess of income from underlying investments as a reduction of cost of investments and/or realized gain. Such amounts are based on estimates if actual amounts are not available and actual amounts of income, realized gain and return of capital may differ from the estimated amounts. The Portfolios adjust the estimated amounts of components of distributions (and consequently its net investment income) as necessary once the issuers provide information about the actual composition of the distributions.
Realized gains and losses on the sale of investments are computed on the basis of the specific identified cost of the investments sold. Unrealized appreciation (depreciation) on investments and foreign currency denominated assets and liabilities, if any, is presented net of deferred taxes on unrealized gains in the Statement of Assets and Liabilities.
Capital Gains Taxes:
Certain Portfolios may be subject to capital gains and repatriation taxes imposed by certain countries in which they invest. These Portfolios have recorded a deferred tax liability with respect to unrealized appreciation on foreign securities for potential capital gains and repatriation taxes at December 31, 2013. The accrual for capital gains and repatriation taxes is included in net unrealized appreciation (depreciation) on investments in the Statements of Assets and Liabilities for the Portfolios. The amounts related to capital gain taxes for securities that have been sold are included in the net realized gain (loss) on investments in the Statements of Operations for the Portfolios.
Allocation of Expenses and Income:
Expenses attributable to a single Portfolio or class are charged to that Portfolio or class. Expenses of the Trust not attributable to a single Portfolio or class are charged to each Portfolio or class in proportion to the average net assets of each Portfolio or other appropriate allocation methods.
All income earned and expenses incurred by each Portfolio are borne on a pro-rata basis by each outstanding class of shares, based on the proportionate interest in the Portfolio represented by the daily net assets of such class, except for distribution fees which are charged on a class specific basis.
62
EQ ADVISORS TRUST
NOTES TO FINANCIAL STATEMENTS (Continued)
December 31, 2013
Foreign Currency Valuation:
The books and records of the Trust are kept in U.S. dollars. Foreign currency amounts are translated into U.S. dollars at current exchange rates at the following dates:
(i) market value of investment securities, other assets and liabilities — at the valuation date.
(ii) purchases and sales of investment securities, income and expenses — at the date of such transactions.
The Portfolios do not isolate that portion of the results of operations resulting from changes in foreign exchange rates on investments from the fluctuations arising from changes in market prices of securities held. Such fluctuations are included with the net realized and unrealized gain or loss on investments.
Net currency gains or losses realized and unrealized as a result of differences between interest or dividends, withholding taxes, security payables/receivables, forward foreign currency exchange contracts and foreign cash recorded on the Portfolio’s books and the U.S. dollar equivalent amount actually received or paid are presented under foreign currency transactions and foreign currency translations in the realized and unrealized gains and losses section, respectively, of the Statements of Operations. Net realized gains (losses) on foreign currency transactions represent net foreign exchange gains (losses) from forward foreign currency contracts, disposition of foreign currencies, currency gains or losses realized between the trade and settlement dates on securities transactions, and the difference between the amount of investment income and foreign withholding taxes recorded on a Portfolio’s books and the U.S. dollar equivalent of amounts actually received or paid.
Taxes:
The Trust intends to comply with the requirements of the Internal Revenue Code of 1986, as amended applicable to regulated investment companies (“RICs”) and to distribute substantially all of its net investment income and net realized capital gains to shareholders of each Portfolio. Therefore, no Federal income tax provision is required.
The Portfolios are not aware of any tax positions for which it is reasonably possible that the total amounts of unrecognized tax benefits will significantly change in the next twelve months. However, the Portfolios’ conclusions may be subject to future review based on changes in, or the interpretation of, the accounting standards or tax laws and regulations. The Portfolios recognize interest and penalties, if any, related to uncertain tax positions as income tax expense in the Statements of Operations. During the year, the Portfolios did not incur any interest or penalties. Each of the tax years in the four year period ended December 31, 2013 remains subject to examination by the Internal Revenue Service and state taxing authorities.
Dividends from net investment income, if any, are declared and distributed at least annually for all Portfolios. Dividends from net realized short-term and long-term capital gains are declared and distributed at least annually to the shareholders of the Portfolios to which such gains are attributable. All dividends are reinvested in additional full and fractional shares of the related Portfolios. All distributions are calculated on a tax basis and, as such, the amounts may differ from financial statement investment income and realized gains. Those differences which are significant to the Portfolios are primarily due to differing book and tax treatments for losses due to wash sales transactions (on all Portfolios), straddle loss deferrals (EQ/Large Cap Core PLUS Portfolio and EQ/Large Cap Value PLUS Portfolio) and mark-to-market of futures contracts (EQ/International Core PLUS Portfolio and EQ/Large Cap Value PLUS Portfolio). In addition, short-term capital gains and foreign currency gains are treated as capital gains for accounting purposes but are considered ordinary income for tax purposes. Capital and net specified losses incurred after October 31 and within the taxable year are deemed to arise on the first business day of the Portfolio’s next taxable
63
EQ ADVISORS TRUST
NOTES TO FINANCIAL STATEMENTS (Continued)
December 31, 2013
year. The tax composition of distributed and undistributed income and gains for the years ended December 31, 2013 and December 31, 2012, were as follows:
| Year Ended December 31, 2013 | Year Ended December 31, 2012 | |||||||||||||||||||||||||||||||
| Distributed Ordinary Income | Distributed Long Term Gains | Accumulated Undistributed Ordinary Income | Accumulated Undistributed Long Term Gains | Distributed Ordinary Income | Distributed Long Term Gains | Accumulated Undistributed Ordinary Income | Accumulated Undistributed Long Term Gains | |||||||||||||||||||||||||
EQ/International Core PLUS | $ | 17,115,733 | $ | — | $ | — | $ | — | $ | 17,832,529 | $ | — | $ | — | $ | — | ||||||||||||||||
EQ/Large Cap Core PLUS | 50,972,756 | 53,979,596 | 24,258,448 | 16,347,368 | 15,886,939 | 34,526,307 | 343,745 | 1,232,003 | ||||||||||||||||||||||||
EQ/Large Cap Value PLUS | 55,520,966 | — | — | — | 47,122,777 | — | 132,223 | — | ||||||||||||||||||||||||
Permanent book and tax basis differences relating to shareholder distributions resulted in reclassifications to undistributed (overdistributed) net investment income (loss), accumulated net realized gain (loss) and paid-in capital at December 31, 2013 as follows:
Portfolios: | Undistributed Net Investment Income (Loss) | Accumulated Net Realized Gain (Loss) | Paid In Capital | |||||||||
EQ/International Core PLUS | $ | 810,688 | $ | (751,648 | ) | $ | (59,040 | ) | ||||
EQ/Large Cap Core PLUS | (50,190 | ) | 50,190 | — | ||||||||
EQ/Large Cap Value PLUS | 73,602 | 1,973,244 | (2,046,846 | ) | ||||||||
Net Capital losses and net specified gains/losses incurred after October 31, and within the taxable year are deemed to arise on the first business day of the Portfolios’ next taxable year. For the year ended December 31, 2013, the Portfolios deferred to January 1, 2014 post-October losses of:
Portfolios: | Specified Loss | Short-Term Capital Loss | Long-Term Capital Loss | |||||||||
EQ/International Core PLUS | $ | — | $ | — | $ | — | ||||||
EQ/Large Cap Core PLUS | — | — | — | |||||||||
EQ/Large Cap Value PLUS | 56,634 | — | — | |||||||||
Under the Regulated Investment Company Modernization Act of 2010 (the “RIC Mod Act”), net capital losses recognized by the Portfolios after December 31, 2010, may get carried forward indefinitely, and retain their character as short-term and/or long term. Prior to the RIC Mod Act, net capital losses incurred by the Portfolios were carried forward for up to eight years and treated as 100% short-term. The RIC Mod Act requires that post-enactment net capital losses be used before pre-enactment net capital losses, therefore some net capital loss carryforwards that would have been utilized under prior law may expire unused. Pre-enactment and post-enactment net capital losses that will be carried forward, if any, are presented in the Portfolios of Investments.
Fees Paid Indirectly:
For all Portfolios, the Board has approved the payment of certain Trust expenses using brokerage recapture arrangements. These payments are reflected on the Statements of Operations. Effective October 31, 2013, brokerage recapture arrangements were terminated.
Accounting for Derivative Instruments:
Following is a description of how and why the Portfolios use derivative instruments, the type of derivatives utilized by the Portfolios during the reporting period, as well as the primary underlying risk exposures related to each instrument type. Derivatives accounted for as hedging instruments must be disclosed separately from those that do not qualify for hedge accounting. Even though the Portfolios may use derivatives in an attempt to achieve an economic hedge, the Portfolio’s derivatives are not accounted for as hedging instruments because the Portfolios account for their derivatives at
64
EQ ADVISORS TRUST
NOTES TO FINANCIAL STATEMENTS (Continued)
December 31, 2013
fair value and record any changes in fair value in current period earnings. All open derivative positions at period end are reflected on each respective Portfolio’s Portfolio of Investments. The volume of derivative activity, based on month-end notional amounts during the period is also noted in each respective Portfolio’s Portfolio of Investments.
Futures Contracts and Foreign Currency Exchange Contracts:
The futures contracts used by the Portfolios are agreements to buy or sell a financial instrument for a set price in the future. Options on futures contracts used by the Portfolios are rights to buy, or sell a futures contract for a set price in the future. Certain Portfolios buy or sell futures contracts for the purpose of protecting their portfolio securities against future changes in interest rates and indices which might adversely affect the value of the Portfolios’ securities or the price of securities that they intend to purchase at a later date. Initial margin deposits are made upon entering into futures contracts and can be in cash, certain money market instruments, treasury securities or other liquid, high grade debt securities. During the period the futures contracts are open, changes in the market price of the contracts are recognized as unrealized gains or losses by “marking-to-market” at the end of each trading day. Variation margin payments on futures contracts are received or made, depending upon whether unrealized gains or losses are incurred. When the contract is closed, the Portfolio records a realized gain or loss equal to the difference between the proceeds from or cost of the closing transactions and the Portfolio’s basis in the contract. Should interest rates or indices move unexpectedly, the Portfolio may not achieve the anticipated benefits of the futures contracts and may incur a loss. The use of futures contracts transactions involves the risk of imperfect correlation in movements in the price of futures contracts, interest rates and the underlying hedged assets. Use of long futures contracts subjects the Portfolios to risk of loss in excess of the amounts shown on the Statement of Assets and Liabilities, up to the notional value of the futures contracts. Use of short futures contracts subjects the Portfolios to unlimited risk of loss. The Portfolios enter into futures contracts only on exchanges or boards of trade. The exchange or board of trade acts as the counterparty to each futures transaction; therefore, a Portfolio’s credit risk is limited to failure of the exchange or board of trade.
Each of the EQ/International Core PLUS Portfolio, EQ/Large Cap Core PLUS Portfolio and EQ/ Large Cap Value PLUS Portfolio used futures contracts during the year ended December 31, 2013 to equitize cash or to increase or decrease the level of equity exposure during periods when market volatility differed from specific thresholds set for each Portfolio. Information on the impact of these positions on the Portfolios’ financial statements can be found in the Statement of Operations and Portfolio of Investments for each Portfolio. The market value of investments pledged and/or cash pledged to cover margin requirements can be found in the Portfolio of Investments and/or Statement of Assets and Liabilities for each Portfolio. Further information on the impact of these positions on the Portfolios’ financial statements can be found in the Statement of Operations and Portfolio of Investments for each Portfolio.
The Portfolios may be exposed to foreign currency risks associated with portfolio investments. During the reporting period, the Portfolios entered into certain forward foreign currency exchange contracts for the purchase or sale of a specific foreign currency at a fixed price on a future date to hedge or otherwise manage these exposures. Unrealized gains or losses on forward foreign currency exchange contracts are recorded by the Portfolios on a daily basis and realized gains or losses are recorded on the settlement date of a contract.
Certain Portfolios purchase foreign currency on a spot (or cash) basis. In addition, certain Portfolios enter into contracts to purchase or sell foreign currencies at a future date (“forward contracts”). A forward foreign currency exchange contract is a commitment to purchase or sell a foreign currency at a future date at a negotiated forward rate. Daily fluctuations in the value of such contracts are recognized as unrealized appreciation or depreciation by “marking to market.” The gain or loss arising from the difference between the original contracts and the closing of such contracts is included in realized gains or losses from foreign currency transactions in the Statement of Operations. The Advisers may engage in these forward contracts to protect against uncertainty in the level of future exchange rates in connection with the purchase and sale of Portfolio securities (“transaction hedging”) and to protect the value of specific portfolio positions (“position hedging”). The Portfolios
65
EQ ADVISORS TRUST
NOTES TO FINANCIAL STATEMENTS (Continued)
December 31, 2013
also buy forward foreign currency exchange contracts to gain exposure to currencies. The Portfolios are subject to off-balance sheet risk to the extent of the value of the contracts for purchase of foreign currency and in an unlimited amount for sales of foreign currency.
Market and Credit Risk:
Written options, futures contracts, forward commitments and forward foreign currency exchange contracts involve elements of both market and credit risk in excess of the amounts reflected in the Statements of Assets and Liabilities. The risk involved in writing an option on a security is that, if the option is exercised, the underlying security is then purchased or sold by the Portfolio at the contract price, which could be disadvantageous relative to the market price. The Portfolio bears the market risk, which arises from any changes in security values. The credit risk for futures contracts and exchange traded options is limited to failure of the exchange or board of trade which acts as the counterparty to the Portfolio’s futures transactions. Forward commitments, forward foreign currency exchange contracts and over-the-counter options are executed directly with the counterparty and not through an exchange and can be terminated only by agreement of both parties to such contracts. With respect to such transactions there is no daily margin settlement and the Portfolio is exposed to the risk of default by the counterparty.
Offsetting Assets and Liabilities:
During the fiscal year the Portfolios adopted Accounting Standards Update (“ASU”) No. 2011-11: Disclosures about Offsetting Assets and Liabilities (“netting”) on the Statements of Assets and Liabilities that are subject to master netting arrangements or similar agreements. ASU 2011-11 was amended by ASU No. 2013-01, clarifying which investments and transactions are subject to the netting disclosure. The scope of the disclosure requirements is limited to derivative instruments, repurchase agreements and reverse repurchase agreements, and securities borrowing and securities lending transactions. This information will enable users of the Portfolios’ financial statements to evaluate the effect or potential effect of netting arrangements on the Portfolios’ financial position.
For financial reporting purposes, the Portfolios do not offset financial assets and financial liabilities that are subject to master netting arrangements or similar agreements on the Statement of Assets and Liabilities.
| Note 2 | Management of the Trust |
The Trust has entered into three separate investment management agreements (the “Management Agreements”) with FMG LLC. The Management Agreements state that the Manager will, among other things: (i) have overall supervisory responsibility for the general management and investment of each Portfolio’s assets; (ii) select and contract with the Advisers to manage the investment operations and composition of each and every Portfolio; (iii) monitor the Advisers’ investment programs and results; (iv) oversee compliance by the Trust with various federal and state statutes; and (v) carry out the directives of the Board. For the year ended December 31, 2013, for its services under the Management Agreements, the Manager was entitled to receive an annual fee as a percentage of average daily net assets, for each of the following Portfolios, calculated daily and payable monthly as follows:
| (as a percentage of average daily net assets) | ||||||||||||||||||||
Portfolios: | First $2 Billion | Next $1 Billion | Next $3 Billion | Next $5 Billion | Thereafter | |||||||||||||||
EQ/International Core PLUS | 0.600 | % | 0.550 | % | 0.525 | % | 0.500 | % | 0.475 | % | ||||||||||
EQ/Large Cap Core PLUS | 0.500 | % | 0.450 | % | 0.425 | % | 0.400 | % | 0.375 | % | ||||||||||
EQ/Large Cap Value PLUS | 0.500 | % | 0.450 | % | 0.425 | % | 0.400 | % | 0.375 | % | ||||||||||
On behalf of the Trust, the Manager has entered into an investment advisory agreement (“Advisory Agreements”) with each of the Advisers for the Trust’s Portfolios. Each of the Advisory Agreements obligates the Advisers for the respective Portfolios to: (i) continuously furnish
66
EQ ADVISORS TRUST
NOTES TO FINANCIAL STATEMENTS (Continued)
December 31, 2013
investment programs for the Portfolios; (ii) place all orders for the purchase and sale of investments for the Portfolios with brokers or dealers selected by the Manager or the respective Advisers; and (iii) perform certain limited related administrative functions in connection therewith. The Manager pays the expenses of providing investment advisory services to the Portfolios, including the fees of the Advisers of each Portfolio.
| Note 3 | Administrative Fees |
FMG LLC serves as Administrator to the Trust. As Administrator, FMG LLC provides the Trust with necessary administrative, fund accounting, and compliance services. FMG LLC may carry out its responsibilities either directly or through sub-contracting with third party providers. For these services, the Trust pays FMG LLC an annual fee payable monthly as follows:
Each Multiadviser Portfolio pays an annual fixed charge of $32,500, which only applies to those Portfolios with total average net assets of less than $5 billion, plus:
Total aggregated Average Daily Net Asset Charge of the Multiadviser Portfolios (including Multiadviser Portfolios of the Trust not presented in these financial statements)
0.15% on the first $20 billion
0.11% on the next $5 billion
0.10% in excess of $25 billion
Prior to September 1, 2013, the administration fee was the following:
Each Multiadviser Portfolio paid an annual fixed charge of $32,500 for each Multiadviser Portfolio and for each portion of the Multiadviser Portfolio for which separate administrative services are provided, (i.e., each adviser in the multi-advised structure) plus:
Total aggregated Average Daily Net Asset Charge of the Multiadviser Portfolios (including Multiadviser Portfolios of the Trust not presented in these financial statements)
0.15% on the first $20 billion
0.125% on the next $5 billion
0.10% in excess of $25 billion
Pursuant to a sub-administration arrangement with FMG LLC, JPMorgan Investor Services Co. (“Sub-administrator”) provides the Trust with administrative services, including monitoring of portfolio compliance and portfolio accounting services.
| Note 4 | Custody Fees |
The Trust has entered into a Custody Agreement with JPMorgan Chase, an affiliate of the sub-administrator. The Custody Agreement provides for an annual fee based on the amount of assets under custody plus transaction charges. JPMorgan Chase serves as custodian of the Trust’s portfolio securities and other assets. Under the terms of the Custody Agreement between the Trust and JPMorgan Chase, JPMorgan Chase maintains and deposits in each Portfolio’s account, cash, securities and other assets of the Portfolios. JPMorgan Chase is also required, upon the order of the Trust, to deliver securities held by JPMorgan Chase, and to make payments for securities purchased by the Trust. JPMorgan Chase has also entered into sub-custodian agreements with a number of foreign banks and clearing agencies, pursuant to which portfolio securities purchased outside the United States are maintained in the custody of these entities.
| Note 5 | Concentration of Credit Risk |
At December 31, 2013, certain Portfolios maintained significant cash balances or significant foreign currency balances with JPMorgan Chase Bank or its affiliates. Additionally, at December 31, 2013, certain Portfolios held significant collateral balances with limited brokers or Goldman Sachs & Co. The Portfolios are subject to credit risk should JPMorgan Chase Bank or its affiliates or Goldman Sachs & Co. be unable to fulfill their obligations.
67
EQ ADVISORS TRUST
NOTES TO FINANCIAL STATEMENTS (Continued)
December 31, 2013
| Note 6 | Distribution Plans |
The Trust has entered into distribution agreements with AXA Distributors, LLC (“AXA Distributors”), an indirect wholly-owned subsidiary of AXA Equitable ( the “Distributor”), pursuant to which the Distributor serves as the principal underwriter of the Class IA, Class IB and Class K shares of the Trust. The Trust has adopted in the manner prescribed under Rule 12b-1 under the 1940 Act a plan of distribution pertaining to each of Class IA and Class IB shares of the Trust (“Distribution Plans”). The Distribution Plans provide that the Distributor will be entitled to receive a maximum distribution fee at the annual rate of 0.25% of the average daily net assets attributable to the Trust’s Class IA and Class IB shares for which it provides service.
| Note 7 | Expense Limitation |
The Manager has contractually agreed to limit the expenses of certain Portfolios (exclusive of taxes, interest, brokerage commissions, capitalized expenses, fees and expenses of other investment companies in which a Portfolio invests and extraordinary expenses) through April 30, 2014 (unless the Board consents to an earlier revision or termination of this arrangement) (“Expense Limitation Agreement”), pursuant to which the Manager has agreed to waive or limit its fees and to assume other expenses so that the total annual operating expenses of such Portfolios’ Class K Shares (Class IA and Class IB shares would be 0.25% higher due to the annual fee under the Trust’s Distribution Plans) are limited to:
0.75% of average daily net assets of the
EQ/Large Cap Core PLUS Portfolio
EQ/Large Cap Value PLUS Portfolio
0.85% of average daily net assets of the
EQ/International Core PLUS Portfolio
The Manager first waives its management fees, then waives its administration fees, and then reimburses the Portfolio’s expenses out of its own resources. Each Portfolio may at a later date reimburse to the Manager the management fees waived or other expenses assumed and paid for by the Manager pursuant to the Expense Limitation Agreement within the prior three fiscal years, provided such Portfolio has reached a sufficient asset size to permit such reimbursement to be made without causing the total annual expense ratio of each Portfolio to exceed the percentage limits mentioned above for the respective period. Consequently, no reimbursement by a Portfolio will be made unless: (i) the Portfolio’s total annual expense ratio is less than the respective percentages stated above for the respective period; and (ii) the payment of such reimbursement has been approved by the Board. Any reimbursement, called recoupment fees on the Statement of Operations, will be based on the earliest fees waived or assumed by the Manager. During the year ended December 31, 2013, the Manager received a total of $474,230 in recoupment for all of the Portfolios within the Trust. At December 31, 2013, under the Expense Limitation Agreement, none of the Portfolios presented in these financial statements had any amounts recoverable.
| Note 8 | Percentage of Ownership by Affiliates |
Shares of some of the Portfolios are held by the All Asset Portfolios and the AXA Allocation Portfolios and Charter Allocation Portfolios of the AXA Premier VIP Trust, an entity also advised by FMG LLC. The following tables represent the percentage of ownership that the All Asset Portfolios and each AXA Allocation Portfolio and Charter Allocation Portfolio has in each respective underlying investment company’s net assets as of December 31, 2013.
| All Asset Moderate Growth- Alt 15 | All Asset Growth-Alt 20 | All Asset Aggressive-Alt 25 | All Asset Aggressive-Alt 50 | All Asset Aggressive-Alt 75 | ||||||||||||||||
EQ/International Core PLUS Portfolio | 0.01 | % | 0.62 | % | 0.01 | % | 0.01 | % | — | #% | ||||||||||
| # | Less than 0.005%. |
68
EQ ADVISORS TRUST
NOTES TO FINANCIAL STATEMENTS (Continued)
December 31, 2013
| AXA Conservative Allocation | AXA Conservative- Plus Allocation | AXA Moderate Allocation | AXA Moderate- Plus Allocation | AXA Aggressive Allocation | ||||||||||||||||
EQ/International Core PLUS Portfolio | 0.23 | % | 0.63 | % | 5.36 | % | 8.43 | % | 2.77 | % | ||||||||||
EQ/Large Cap Core PLUS Portfolio | 0.61 | 1.13 | 6.25 | 8.01 | 2.95 | |||||||||||||||
EQ/Large Cap Value PLUS Portfolio | 0.07 | 0.26 | 1.71 | 4.80 | 3.76 | |||||||||||||||
Portfolios | CharterSM Conservative | CharterSM Moderate | CharterSM Moderate Growth | CharterSM Growth | CharterSM Aggressive Growth | CharterSM Equity | CharterSM International Conservative | |||||||||||||||||||||
EQ/International Core PLUS Portfolio | — | #% | — | #% | 0.00 | % | 0.01 | % | 0.01 | % | 0.01 | % | — | #% | ||||||||||||||
Portfolios | CharterSM | CharterSM International Growth | ||||||
EQ/International Core PLUS Portfolio | 0.01 | % | 0.01 | % | ||||
| # | Less than 0.005% |
| Note 9 | Substitution, Reorganization and In-Kind Transactions |
At a meeting held on March 5-6, 2013, the Board approved a redemption in-kind from the Portfolios listed below and a subscription in-kind to EQ/International Core PLUS Portfolio (“ICP”). On June 24, 2013, shareholders of the Portfolios listed below redeemed shares through an in-kind redemption of securities and currency and contributed the securities and currency to ICP. Valuation of these securities at the time of the redemption and subscription in-kind was in accordance with the Portfolios’ valuation policy. For GAAP purposes, the transaction was treated as a sale on the date of the redemption in-kind and the resulting gains based on the values of the securities are listed in the table below.
Portfolios | Value of securities and currency transferred | Realized Gain/(Loss) | ||||||
EQ/MFS International Growth Portfolio | $ | 387,390,490 | $ | 75,268,157 | ||||
Multimanager International Equity Portfolio (a) | 336,328,768 | 43,213,095 | ||||||
|
| |||||||
Total | $ | 723,719,258 | ||||||
|
| |||||||
| (a) | A portfolio of AXA Premier VIP Trust. |
The realized gain is recorded in Net Realized Gain on Investments on the redeeming Portfolios’ Statements of Operations. For tax purposes, the gain is not recognized by the redeeming Portfolios. Additionally, the value of securities redeemed in-kind and contributed in-kind is excluded from the respective Portfolios’ portfolio turnover calculation and excluded from cost of purchases and net proceeds of sales and redemptions.
At a meeting held on March 5-6, 2013, the Board approved a redemption in-kind from the Portfolios listed below and a subscription in-kind to EQ/Large Cap Core PLUS Portfolio (“LCCP”). On June 24, 2013, shareholders of the Portfolios listed below redeemed shares through an in-kind redemption of securities and currency and contributed the securities and currency to LCCP. Valuation of these securities at the time of the redemption and subscription in-kind was in
69
EQ ADVISORS TRUST
NOTES TO FINANCIAL STATEMENTS (Continued)
December 31, 2013
accordance with the Portfolios’ valuation policy. For GAAP purposes, the transaction was treated as a sale on the date of the redemption in-kind and the resulting gains based on the values of the securities are listed in the table below.
Portfolios | Value of securities and currency transferred | Realized Gain/(Loss) | ||||||
EQ/Capital Guardian Research Portfolio | $ | 935,653,398 | $ | 250,488,053 | ||||
EQ/Davis New York Venture Portfolio | 319,295,079 | 98,658,571 | ||||||
EQ/Lord Abbett Large Cap Core Portfolio | 175,945,507 | 44,320,269 | ||||||
EQ/UBS Growth and Income Portfolio | 90,888,048 | 16,073,245 | ||||||
Multimanager Large Cap Core Equity Portfolio (a) | 134,096,701 | 35,136,462 | ||||||
|
| |||||||
Total | $ | 1,655,878,733 | ||||||
|
| |||||||
| (a) | A portfolio of AXA Premier VIP Trust. |
The realized gain is recorded in Net Realized Gain on Investments on the redeeming Portfolios’ Statements of Operations. For tax purposes, the gain is not recognized by the redeeming Portfolios. Additionally, the value of securities redeemed in-kind and contributed in-kind is excluded from the respective Portfolios’ portfolio turnover calculation and excluded from cost of purchases and net proceeds of sales and redemptions.
At a meeting held on March 5-6, 2013, the Board approved a redemption in-kind from the Portfolios listed below and a subscription in-kind to EQ/Large Cap Value PLUS Portfolio (“LCVP”). On July 29, 2013, shareholders of the Portfolios listed below redeemed shares through an in-kind redemption of securities and currency and contributed the securities and currency to LCVP. Valuation of these securities at the time of the redemption and subscription in-kind was in accordance with the Portfolios’ valuation policy. For GAAP purposes, the transaction was treated as a sale on the date of the redemption in-kind and the resulting gains based on the values of the securities are listed in the table below.
Portfolios | Value of securities and currency transferred | Realized Gain/(Loss) | ||||||
EQ/BlackRock Basic Value Equity Portfolio | $ | 1,034,625,698 | $ | 278,477,262 | ||||
EQ/Boston Advisors Equity Income Portfolio | 324,664,619 | 83,705,473 | ||||||
EQ/Invesco Comstock Portfolio | 340,684,665 | 92,549,166 | ||||||
EQ/JPMorgan Value Opportunities Portfolio | 294,336,634 | 53,872,933 | ||||||
Multimanager Large Cap Value Portfolio (a) | 364,189,770 | 107,364,869 | ||||||
|
| |||||||
Total | $ | 2,358,501,386 | ||||||
|
| |||||||
| (a) | A portfolio of AXA Premier VIP Trust. |
The realized gain is recorded in Net Realized Gain on Securities on the redeeming Portfolios’ Statements of Operations. For tax purposes, the gain is not recognized by the redeeming Portfolios. Additionally, the value of securities redeemed in-kind and contributed in-kind is excluded from the respective Portfolios’ portfolio turnover calculation and excluded from cost of purchases and net proceeds of sales and redemptions.
70
EQ ADVISORS TRUST
NOTES TO FINANCIAL STATEMENTS (Continued)
December 31, 2013
Note 10 Subsequent Events
The Manager evaluated subsequent events from December 31, 2013, the date of these financial statements, through the date these financial statements were issued and available. The subsequent events include the following:
At meetings held on December 4-5, 2013 and December 10-11, 2013, the Boards of AXA Premier VIP Trust (“VIP Trust”) and the Trust, respectively approved (1) an Agreement and Plan of Reorganization and Termination, relating to the following reorganizations:
| Proposed Acquired Portfolios | Proposed Acquiring Portfolios | |
Multimanager Large Cap Core Portfolio Multimanager Large Cap Value Portfolio Multimanager International Equity Portfolio (each an “Acquired Portfolio”) | EQ/Large Cap Core PLUS Portfolio EQ/Large Cap Value PLUS Portfolio EQ/International Core PLUS Portfolio (each, an “Acquiring Portfolio”) |
Each of the reorganizations requires the approval of the shareholders of the Acquired Portfolio. Pending shareholder approval, it is anticipated that the reorganizations will occur on or about June 20, 2014.
and;
At that same meeting, the Board approved the appointment of the following new sub-advisers for the following Trust Portfolios, to be effective on or about May 1, 2014.
| Portfolio | Additional Adviser | |
EQ/Large Cap Core PLUS Portfolio EQ/Large Cap Value PLUS Portfolio EQ/International Core PLUS Portfolio | Thornburg Investment Management, Inc. MFS Investment Management EARNEST Partners, LLC |
At that same meeting, the Board approved the following name changes which will be effective on or about May 1, 2014.
| Current Name | New Name | |
| EQ/International Core PLUS Portfolio | AXA International Core Managed Volatility Portfolio | |
| EQ/Large Cap Core PLUS Portfolio | AXA Large Cap Core Managed Volatility Portfolio | |
| EQ/Large Cap Value PLUS Portfolio | AXA Large Cap Value Managed Volatility Portfolio |
At a meeting held on December 10-11, 2013, the Board approved an Agreement and Plan of Reorganization and Termination to reorganize three portfolios of the AXA Premier VIP Trust (“VIP Trust”) into three corresponding existing Portfolios of the Trust as follows:
a. Multimanager Large Cap Core Portfolio into EQ/Large Cap Core PLUS Portfolio;
b. Multimanager Large Cap Value Portfolio into EQ/Large Cap Value PLUS Portfolio; and
c. Multimanager International Equity Portfolio into EQ/International Core PLUS Portfolio
Note 11 Pending Legal Proceedings
In July 2011, a lawsuit was filed in the United States District Court of the District of New Jersey, entitled Mary Ann Sivolella v. AXA Equitable Life Insurance Company and AXA Equitable Funds Management Group, LLC (“Sivolella Litigation”). The lawsuit was filed derivatively on behalf of eight Portfolios of the Trust: EQ/Common Stock Index Portfolio; EQ/Equity Growth PLUS Portfolio;
71
EQ ADVISORS TRUST
NOTES TO FINANCIAL STATEMENTS (Continued)
December 31, 2013
EQ/Equity 500 Index Portfolio; EQ/Large Cap Value PLUS Portfolio; EQ/Global Multi-Sector Equity Portfolio; EQ/Mid Cap Value PLUS Portfolio; EQ/Intermediate Government Bond Index Portfolio; and EQ/GAMCO Small Company Value Portfolio (the “Sivolella Portfolios”). The lawsuit seeks recovery under Section 36(b) of the 1940 Act, for alleged excessive fees paid to FMG LLC and AXA Equitable (the “Defendants”) for investment management services. The Plaintiff seeks recovery of the alleged overpayments, or alternatively, rescission of the contracts and restitution of all fees paid, interest, costs, and fees. In October 2011, FMG LLC and AXA Equitable filed a motion to dismiss the complaint. In November 2011, the Plaintiff filed an Amended Complaint seeking the same relief, but adding new claims under (1) Section 26(f) of the 1940 Act alleging that the variable annuity contracts sold by the Defendants charged excessive management fees, and seeking restitution and rescission of those contracts under Section 47(b) of the 1940 Act; and (2) a claim for unjust enrichment. The Defendants filed a motion to dismiss the Amended Complaint in December 2011. In May 2012, Plaintiff voluntarily dismissed the Section 26(f) claim seeking restitution and rescission under Section 47(b). In September 2012, the United States District Court for the District of New Jersey denied the motion to dismiss as it related to the unjust enrichment claim.
In January 2013, a second lawsuit against FMG LLC was filed in the United States District Court for the District of New Jersey by a group of plaintiffs asserting substantially similar claims under Section 36(b) and seeking substantially similar damages as in the Sivolella Litigation. The lawsuit, entitled Glenn D. Sanford, et al. v. AXA Equitable Funds Management Group, LLC (“Sanford Litigation”), was filed derivatively on behalf of the EQ/PIMCO Ultra Short Bond Portfolio, the EQ/T. Rowe Price Growth Stock, the EQ/Global Bond PLUS Portfolio, and the EQ/Core Bond Index Portfolio, in addition to the Sivolella Portfolios. In light of the similarities of the allegations in the Sivolella and Sanford Litigations, the parties and court agreed to consolidate the two lawsuits.
In April 2013, the Plaintiffs in the Sivolella and Sanford Litigations amended the complaints to add additional claims under Section 36(b) of the 1940 Act for recovery of alleged excessive fees paid to FMG LLC in its capacity as the Administrator of the Trust. The Plaintiffs seek recovery of the alleged overpayments, or alternatively, rescission of the contract and restitution of the excessive fees paid, interest, costs, and fees.
No liability for litigation relating to these matters have been accrued in the financial statements of the Portfolios because any potential damages would be the responsibility of the Defendants.
On November 1, 2010, the Trust and AXA Premier VIP Trust, and several of their respective portfolios, were named as defendants and putative members of the proposed defendant class of shareholders in a lawsuit brought by The Official Committee of Unsecured Creditors of Tribune Company (the “Committee”) in the United States Bankruptcy Court for the District of Delaware regarding Tribune Company’s Chapter 11 bankruptcy proceeding (In re Tribune Company). The lawsuit relates to amounts paid to the Trust and AXA Premier VIP Trust, and several of their respective portfolios, as holders of publicly-traded shares of Tribune Company, which were components of certain broad-based securities market indices, for which there were public tender offers during 2007. The suit seeks return of the share price received by Tribune Company shareholders in the tender offers plus interest and attorneys’ fees and expenses.
On July 1, 2011, retiree participants in certain Tribune-defined compensation plans (the “Retirees”) initiated a lawsuit in the United States District Court for the Southern District of New York against certain Tribune Company shareholders who sold their shares as part of the 2007 public tender offers (the “Retiree Suit”). This Retiree Suit also seeks return of the share price received by Tribune Company shareholders in connection with the tender offers plus interest and attorneys’ fees and expenses.
On August 24, 2011, the trustees of certain trusts that hold notes issued by Tribune Company (the “Noteholders”) initiated a separate lawsuit in the United States District Court for the Southern District of New York against certain Tribune Company shareholders who sold their shares as part of the 2007 public tender offers (the “Noteholder Suit”). This Noteholder Suit also seeks return of the
72
EQ ADVISORS TRUST
NOTES TO FINANCIAL STATEMENTS (Continued)
December 31, 2013
share price received by Tribune Company shareholders in connection with the tender offers plus interest and attorneys’ fees and expenses.
The Committee’s suit, the Retiree Suit, and the Noteholder Suit have each been consolidated with a number of related lawsuits filed by the Noteholders and Retirees around the United States into a single multi-district litigation proceeding now pending in the United States District Court for the Southern District of New York (In re: Tribune Company Fraudulent Conveyance Litigation).
With respect to the Trust, the EQ/Equity 500 Index Portfolio, the EQ/GAMCO Mergers and Acquisitions Portfolio and the EQ/Mid Cap Value PLUS Portfolio are named as defendants in the Noteholder Suit and the Retiree Suit. The EQ/Equity 500 Index Portfolio, the EQ/GAMCO Mergers and Acquisitions Portfolio, the EQ/Mid Cap Value PLUS Portfolio, the EQ/Large Cap Core PLUS Portfolio, the EQ/Small Company Index II Portfolio, the EQ/Common Stock Index II Portfolio, and EQ Advisors Trust are all putative members of the proposed defendant class of shareholders in the Committee’s suit. The EQ/Equity 500 Index Portfolio, the EQ/GAMCO Mergers and Acquisition Portfolio, the EQ/Large Cap Core PLUS Portfolio, and EQ Advisors Trust are also named separately in the Committee’s suit, in the event it is not certified as a class action. The amounts paid to the above six portfolios in connection with the public tender offers were approximately: (i) the EQ/Equity 500 Index Portfolio – $1,740,800; (ii) the EQ/GAMCO Mergers and Acquisitions Portfolio – $1,122,000; (iii) the EQ/Mid Cap Value PLUS Portfolio – $2,992,000; (iv) the EQ/Large Cap Core PLUS Portfolio – $64,600; (v) the EQ/Small Company Index II Portfolio – $61,200; and (vi) the EQ/Common Stock Index II Portfolio – $18,360.
The lawsuits do not allege any misconduct by the Trust or its Portfolios. Motions to dismiss the suits filed by the Noteholders and the Retirees based on certain limited defenses are currently pending before the United States District Court for the Southern District of New York. The Portfolios cannot predict the outcome of these lawsuits. If the lawsuits were to be decided or settled in a manner adverse to the portfolios, the payment of such judgments or settlements could have an adverse effect on each Portfolio’s net asset value. However, no liability for litigation relating to this matter has been accrued in the financial statements of the Portfolios, as the Manager believes a loss is not probable.
73
Report of Independent Registered Public Accounting Firm
To the Board of Trustees and Shareholders of EQ Advisors Trust
In our opinion, the accompanying statements of assets and liabilities, including the portfolios of investments, and the related statements of operations and of changes in net assets and the financial highlights (hereafter referred to as “financial statements”) present fairly, in all material respects, the financial position of each of the portfolios of EQ Advisors Trust listed in the Table of Contents to the Annual Report in which these financial statements appear (collectively referred to as the “Trust”) at December 31, 2013, and the results of each of their operations, the changes in each of their net assets and the financial highlights for each of the periods presented, in conformity with accounting principles generally accepted in the United States of America. These financial statements and financial highlights are the responsibility of the Trust’s management. Our responsibility is to express an opinion on these financial statements based on our audits. We conducted our audits of these financial statements in accordance with the standards of the Public Company Accounting Oversight Board (United States). Those standards require that we plan and perform the audit to obtain reasonable assurance about whether the financial statements are free of material misstatement. An audit includes examining, on a test basis, evidence supporting the amounts and disclosures in the financial statements, assessing the accounting principles used and significant estimates made by management, and evaluating the overall financial statement presentation. We believe that our audits, which included confirmation of securities at December 31, 2013 by correspondence with the custodian, transfer agents and brokers, provide a reasonable basis for our opinion.
PricewaterhouseCoopers LLP
New York, New York
February 19, 2014
74
Federal Income Tax Information (Unaudited)
For the year ended December 31, 2013, the percentage of dividends paid that qualify for the 70% dividends received deductions for corporate shareholders, foreign taxes which are expected to be passed through to shareholders for foreign tax credits, gross income derived from sources within foreign countries, and long-term capital gain dividends for the purpose of the dividend paid deduction on its Federal income tax return were as follows:
| 70% Dividend Received Deduction | Foreign Taxes | Foreign Source Income | Long Term Capital Gain | |||||||||||||
EQ/International Core PLUS | 0.00 | % | $ | 1,709,506 | $ | 29,186,739 | $ | — | ||||||||
EQ/Large Cap Core PLUS | 27.06 | — | — | 53,979,596 | ||||||||||||
EQ/Large Cap Value PLUS | 100.00 | — | — | — | ||||||||||||
75
MANAGEMENT OF THE TRUST (UNAUDITED)
The Trust’s Board is responsible for the overall management of the Trust and the Portfolios, including general supervision and review of the Portfolios’ investment activities and their conformity with federal and state law as well as the stated policies of the Portfolios. The Board elects the officers of the Trust who are responsible for administering the Trust’s day-to-day operations. The Trustees of the Trust are identified in the table below along with information as to their principal business occupations held during the last five years and certain other information are shown below.
The Trustees
| Name, Address and Age | Position(s) Held With Fund | Term of Office** and Length of Time Served | Principal Occupation(s) During Past 5 Years | Number of by Trustee† | Other Directorships During Past 5 Years | |||||
| Interested Trustees | ||||||||||
Steven M. Joenk* 1290 Avenue of the Americas, New York, New York | Trustee, Chairman, President and Chief Executive Officer | Trustee and Chairman from September 2004 to present, Chief Executive Officer, President from December 2002 to present | From May 2011 to present, Director, President, Chief Executive Officer and Chairman, FMG LLC; from September 1999 to present, Managing Director, AXA Equitable; from September 2004 to April 2011, President, AXA Equitable’s Funds Management Group (“FMG”) unit; from July 2004 to October 1, 2013, Senior Vice President, MONY Life Insurance Company; from July 2004 to present, Senior Vice President MONY Life Insurance Company of America and Director, MONY Capital Management, Inc., Director and President, 1740 Advisers, Inc.; Director, Chairman of the Board and President, MONY Asset Management, Inc. and Enterprise Capital Management (from July 2004 to January 2011); from January 2005 to January 2011, Director, MONY Financial Resources of Americas Limited; and from November 2005 to present, Director MONY International Holdings, LLC. | 113 | None | |||||
| * | Affiliated with the Manager and/or the Distributor. |
| ** | Each Trustee serves until his or her resignation or retirement. |
| † | The registered investment companies in the fund complex include AXA Premier VIP Trust and the Trust. Mr. Joenk serves as Trustee, President and Chief Executive Officer for each of the registered investment companies in the fund complex, as well as Chairman for each such company. |
76
| Name, Address and Age | Position(s) Held With Fund | Term of Office** and Length of Time Served | Principal Occupation(s) During Past 5 Years | Number of by Trustee† | Other Directorships Held by Trustee | |||||
| Independent Trustees | ||||||||||
Theodossios Athanassiades c/o EQ Advisors Trust 1290 Avenue of the Americas New York, New York 10104 (74) | Trustee | From March 2000 to present | Retired. 1996, Vice Chairman, Metropolitan Life Insurance Company; From 1993 to 1995, President and Chief Operating Officer Metropolitan Life Insurance Company. | 77 | From 1994 to 2006, Director of Atlantic Bank of New York. | |||||
Jettie M. Edwards c/o EQ Advisors Trust 1290 Avenue of the Americas New York, New York 10104 (67) | Trustee | From March 1997 to present | Retired. From 1986 to 2001, Partner and Consultant, Syrus Associates (business and marketing consulting firm). | 77 | From 1997 to 2010, Director, Old Mutual Funds II (12 portfolios); from 2008 to 2009, Director, Old Mutual Funds III (13 portfolios). | |||||
Donald E. Foley c/o EQ Advisors Trust 1290 Avenue of the Americas New York, New York 10104 (61) | Trustee | From January 1, 2014 to present | Retired. From 2010 to 2011, Chairman of the Board and Chief Executive Officer, Wilmington Trust Corporation; from 1996 to 2010, Senior Vice President, Treasurer and Director of Tax ITT Corporation; 1989- 1996, Assistant Treasurer, International Paper Company. | 77 | 2011-2012, Director, and from 2012 to present Advisory Committee Member M&T Corporation; from 2007-2011, Director and member of the Audit Committee and Compensation Committee, Wilmington Trust Corporation; Advisory Board member Northern Trust Company and Goldman Sachs Management Groups 2008-2010. | |||||
William M. Kearns, Jr c/o EQ Advisors Trust 1290 Avenue of the Americas New York, New York 10104 (78) | Trustee | From March 1997 to present | From 1994 to present, President, W.M. Kearns & Co., Inc. (private investment company); from 2002 to June 2007, Chairman, Keefe Managers, Inc. (money management firm); and from 2008 to present, Chairman, Keefe Ventures, LLC. | 77 | Lead Director from 2008 to present and from 1991 to present, Director, Transistor Devices, Inc. From 1999 to 2010, Advisory Director, Alexander Proudfoot (consulting firm). From 2001 to 2011, Advisory Director, Gridley & Company LLC. From 2002 to 2009, Director, United States Shipping Partners LLC. From 2005 to 2009, Lead Director, and from 1975 to 2009, Director, Selective Insurance Group, Inc. | |||||
77
| Name, Address and Age | Position(s) Held With Fund | Term of Office** and Length of Time Served | Principal Occupation(s) During Past 5 Years | Number of by Trustee† | Other Directorships Held by Trustee | |||||
| Independent Trustees | ||||||||||
Christopher P.A. Komisarjevsky c/o EQ Advisors Trust 1290 Avenue of the Americas New York, New York 10104 (68) | Trustee | From March 1997 to present | From 2006 to 2008, Senior Counselor for APCO Worldwide® (global communications consulting) and a member of its International Advisory Council. From 1998 to 2005, President and Chief Executive Officer, Burson-Marsteller Worldwide (public relations). From 1996 to 1998, President and Chief Executive Officer of Burson-Marsteller U.S.A. | 77 | None | |||||
H. Thomas McMeekin c/o EQ Advisors Trust 1290 Avenue of the Americas New York, New York 10104 (60) | Trustee | From January 1, 2014 to present | Retired. From 2000 to present, Managing Partner and Founder of Griffin Investments, LLC a private equity firm; from 2009 to 2012 Chief Investment Officer, Sun America Financial Group and United Guaranty Corporation and Senior Managing Director of AIG Asset Management; from 2001 to 2008, Managing Director, Institutional Client Relations of Prudential Investment Management, Inc. Financial Group and United Guaranty Corporation and Senior Managing Director of AIG Asset Management; from 2001 to 2008, Managing Director, Institutional Client Relations of Prudential Investment Management, Inc. | 77 | 2012 to present, Director, Achaean Financial Group; 2011 to 2012, Director US Life Insurance Company in the City of New York | |||||
Harvey Rosenthal c/o EQ Advisors Trust 1290 Avenue of the Americas New York, New York 10104 71 | Trustee | From March 1997 to present | Retired. From 1994 to 1996, President and Chief Operating Officer of Melville Corporation. From 1984-1994 President and Chief Executive Officer of the CVS Division of Melville Corporation. | 77 | From 1997 to 2012, Director, LoJack Corporation. | |||||
78
| Name, Address and Age | Position(s) Held With Fund | Term of Office** and Length of Time Served | Principal Occupation(s) During Past 5 Years | Number of Portfolios in Fund Complex Overseen by Trustee† | Other Directorships Held by Trustee | |||||
| Independent Trustees (Continued) | ||||||||||
Gary S. Schpero c/o EQ Advisors Trust 1290 Avenue of the Americas New York, New York 10104 (60) | Lead Independent Trustee | Trustee from May 2000 to present; from October 2011 to present, Lead Independent Trustee | Retired. Prior to January 1, 2000, Partner of Simpson Thacher & Bartlett (law firm) and Managing Partner of the Investment Management and Investment Company Practice Group. | 77 | From May 2012 to present, Trustee, Blackstone/GSO Senior Floating Rate Term Fund and Blackstone/GSO Long-Short Credit Income Fund. From October 2012 to present, Trustee, Blackstone/GSO Strategic Credit Fund. | |||||
Kenneth L. Walker c/o EQ Advisors Trust 1290 Avenue of the Americas New York, New York 10104 (62) | Trustee | From January 2012 | From May 2002 to present, Partner, The Capital Management Corporation (investment advisory firm). | 77 | None. | |||||
Caroline L. Williams c/o EQ Advisors Trust 1290 Avenue of the Americas New York, New York 10104 (67) | Trustee | From January 2012 | From July 2010 to December 2012, Executive Vice President, May 2005 to December 2007, Consultant and from May 2001 to May 2005, Chief Financial and Investment Officer, Nathan Cummings Foundation (non-profit organization); from 1988 to 1992, Managing Director, from 1982 to 1988, Senior Vice President, from 1978 to 1982, Vice President and from 1971 to 1976, Associate, Donaldson, Lufkin & Jenrette Securities Corporation (investment bank). | 77 | From 1997 to 2009, Director, Hearst-Argyle Television. | |||||
| ** | Each Trustee serves until his or her resignation or retirement. |
| † | The registered investment companies in the fund complex include AXA Premier VIP Trust and the Trust. Mr. Joenk serves as Trustee, President and Chief Executive Officer for each of the registered investment companies in the fund complex, as well as Chairman for each such company. |
79
The Trust’s Officers
No officer of the Trust receives any compensation paid by the Trust. Each officer of the Trust is an employee of AXA Equitable, AXA Advisors, LLC (“AXA Advisors”) or AXA Distributors, LLC (“AXA Distributors”). The Trust’s principal officers are:
| Name, Address and Age | Position(s) Held With Fund* | Term of Office and Length of Time Served** | Principal Occupation(s) During Past 5 Years | |||
Steven M. Joenk 1290 Avenue of the Americas, New York, New York 10104 (55) | Trustee, Chairman, President and Chief Executive Officer | From September 2004 to present, Trustee and Chairman and from December 2002 to present, Chief Executive Officer and President. | From May 2011 to present, Director, President, Chief Executive Officer and Chairman, FMG LLC; from September 1999 to present, Managing Director, AXA Equitable; from September 2004 to April 2011, President, AXA Equitable’s FMG; from July 2004 to October 1, 2013, Senior Vice President, MONY Life Insurance Company; from July 2004 to present, Senior Vice President MONY Life Insurance Company of America and Director, MONY Capital Management, Inc., Director and President, 1740 Advisers, Inc.; Director, Chairman of the Board and President, MONY Asset Management, Inc. and Enterprise Capital Management (from July 2004 to January 2011); from January 2005 to January 2011, Director, MONY Financial Resources of Americas Limited; and from November 2005 to present, Director MONY International Holdings, LLC. | |||
Patricia Louie, Esq. 1290 Avenue of the Americas, New York, New York 10104 (58) | Vice President and Secretary | From July 1999 to Present | From June 2012 to present, Executive Vice President and General Counsel of FMG LLC; from May 2011 to June 2012, Senior Vice President and Corporate Counsel of FMG LLC; from February 2011 to present Managing Director and Associate General Counsel of AXA Financial and AXA Equitable; from May 2003 to February 2011, Vice President and Associate General Counsel of AXA Financial and AXA Equitable. | |||
Brian Walsh 525 Washington Boulevard, Jersey City, New Jersey 07310 (46) | Chief Financial Officer and Treasurer | From June 2007 to present | From May 2011 to present, Senior Vice President of FMG LLC; from February 2003 to present, Lead Director of AXA Financial and AXA Equitable. | |||
Kenneth Kozlowski 1290 Avenue of the Americas New York, New York 10104 (52) | Vice President | From to present | From June 2012 to present, Executive Vice President and Chief Investment Officer of FMG LLC; from May 2011 to June 2012, Senior Vice President of FMG LLC; from September 2011 to present, Managing Director of AXA Financial and AXA Equitable; from February 2001 to September 2011, Vice President AXA Financial and AXA Equitable; from July 2004 to January 2011, Director, Enterprise Capital Management, Inc. | |||
Alwi Chan 1290 Avenue of the Americas, New York, New York 10104 (39) | Vice President | From June 2007 to present | From June 2012 to present, Senior Vice President and Deputy Chief Investment Officer of FMG LLC; from May 2011 to June 2012, Vice President of FMG LLC; from February 2007 to present, Lead Director of AXA Financial and AXA Equitable. | |||
James Kelly 525 Washington Boulevard, Jersey City, New Jersey 07310 (45) | Controller | From June 2007 to present | From May 2011 to present, Vice President of FMG LLC; from September 2008 to present, Senior Director of AXA Equitable. | |||
Mary E. Cantwell 1290 Avenue of the Americas, New York, New York 10104 (52) | Vice President | From July 1999 to Present | From June 2012 to present, Senior Vice President of FMG LLC; from May 2011 to June 2012, Vice President of FMG LLC; from February 2001 to present, Lead Director of AXA Equitable; from July 2004 to January 2011, a Director of Enterprise Capital Management, Inc. | |||
Roselle Ibanga 525 Washington Boulevard, Jersey City, New Jersey 07310 (35) | Assistant Controller | From March 2009 to present | From February 2009 to present, Director of AXA Equitable; from December 2008 to February 2009, Director of AXA Equitable’s FMG. | |||
Lisa Perrelli 525 Washington Boulevard, Jersey City, New Jersey 07310 (39) | Assistant Controller | From March 2009 to present | From November 2012 to present, Senior Director of AXA Equitable; from September 2008 to November 2012, Assistant Vice President of AXA Equitable; from February 2008 to September 2008, Director of AXA Equitable’s FMG. |
80
| Name, Address and Age | Position(s) Held With Fund* | Term of Office and Length of Time Served** | Principal Occupation(s) During Past 5 Years | |||
William MacGregor 1290 Avenue of the Americas, New York, New York 10104 (38) | Vice President and Assistant Secretary | From September 2006 to present | From June 2012 to present, Senior Vice President, Secretary and Associate General Counsel of FMG LLC; from May 2011 to June 2012, Vice President and Associate Corporate Counsel of FMG LLC; from May 2008 to present, Lead Director and Associate General Counsel of AXA Equitable. | |||
Gariel Nahoum 1290 Avenue of the Americas, New York, New York 10104 (30) | Vice President and Assistant Secretary | From December 2011 to present | From June 2012 to present, Vice President, Assistant Secretary and Associate General Counsel of FMG LLC; from September 2011 to June 2012, Vice President and Secretary of FMG LLC; from August 2011 to present, Senior Director and Counsel of AXA Equitable; from September 2008 to August 2011, Associate, Kramer Levin Naftalis & Frankel LLP. | |||
Joseph J. Paolo 1290 Avenue of the Americas, New York, New York 10104 (43) | Chief Compliance Officer, Vice President and Anti-Money Laundering Compliance Officer | Chief Compliance Officer from May 2007, Vice President and Anti-Money Laundering Compliance Officer from November 2005 to Present | From May 2011 to present, Senior Vice President and Chief Compliance Officer of FMG LLC; from June 2007 to present, Lead Director of AXA Equitable and Chief Compliance Officer of AXA Equitable’s FMG. | |||
Richard Guinnessey 1290 Avenue of the Americas, New York, New York 10104 (50) | Vice President | From March 2011 to present | From June 2012 to present, Vice President FMG LLC, from September 2010 to present, Senior Director of AXA Equitable; from November 2005 to September 2010 Assistant Vice President of AXA Equitable. | |||
Jennifer Mastronardi 1290 Avenue of the Americas, New York, New York 10104 (28) | Assistant Vice President | From March 2012 to present | From February 2009 to present, Director of AXA Equitable; from June 2007 to February 2009, Operations Associate in Managed Futures Department, Morgan Stanley. | |||
Paraskevou Charalambous 1290 Avenue of the Americas, New York, New York 10104 (51) | Assistant Secretary | From November 2005 to present | From March 2000 to present, Lead Manager/Senior Legal Assistant for AXA Equitable. | |||
Helen Espaillat 1290 Avenue of the Americas, New York, New York 10104 (50) | Assistant Secretary | From March 2009 to present | From July 2004 to present, Lead Manager/Senior Legal Assistant for AXA Equitable. |
| * | The officers in the table above (except Ms. Charalambous and Ms. Espaillat) hold similar positions with one other registered investment company in the fund complex. The registered investment companies in the fund complex include AXA Premier VIP Trust and the Trust. |
| ** | Each officer is elected on an annual basis. |
CONTROL PERSON AND PRINCIPAL HOLDERS OF SECURITIES
Shares of the Trust are offered to separate accounts of insurance companies in connection with the Contracts and may be offered to tax-qualified retirement plans and other qualified investors. AXA Equitable may be deemed to be a control person with respect to the Trust by virtue of its record ownership of more than 95% of the Trust’s shares as of March 31, 2011. Shareholders owning more than 25% of the outstanding shares of a portfolio may take actions without the approval of other investors in the portfolio.
81
PROXY VOTING POLICIES AND PROCEDURES (UNAUDITED)
A description of the policies and procedures that the Portfolios use to determine how to vote proxies relating to portfolio securities is available (i) without charge, upon request, by calling a toll-free number at 1-877-222-2144 and (ii) on the Securities and Exchange Commission’s website at http://www.sec.gov. Information regarding how the Portfolios voted proxies relating to portfolio securities during the most recent 12-month period ended June 30 is available without charge (i) on the Trust’s website at www.axa-equitablefunds.com and (ii) on the Securities and Exchange Commission’s website at http://www.sec.gov.
QUARTERLY PORTFOLIO HOLDINGS INFORMATION (UNAUDITED)
The Portfolios file their complete schedule of portfolio holdings with the Securities and Exchange Commission for the first and third quarters of each fiscal year on Form N-Q. The Portfolios’ Forms N-Q are available on the Securities and Exchange Commission’s website at http://www.sec.gov. You may also review and obtain copies at the Securities and Exchange Commission’s Public Reference Room in Washington, D.C. Information about the Public Reference Room may be obtained by calling 1-800-SEC-0330.
82
PRO FORMA FINANCIAL STATEMENTS (Unaudited)
The following tables set forth the pro forma combined Portfolio of Investments as of December 31, 2013, the pro forma combined Statement of Assets and Liabilities as of December 31, 2013, and the pro forma combined Statement of Operations for the twelve-month period ended December 31, 2013 for the Multimanager Large Cap Core Equity, Multimanager Large Cap Value, and Multimanager International Equity Portfolios (the “Acquired VIP Portfolios”) and the corresponding EQ/Large Cap Core PLUS, EQ/Large Cap Value PLUS, and EQ/International PLUS Portfolios (the “Acquiring EQAT Portfolios”), as adjusted giving effect to the Reorganizations.
The pro forma combined Portfolio of Investments contains information about the securities holdings of the combined Acquired VIP Portfolios and corresponding Acquiring EQAT Portfolios as of December 31, 2013, which has, and will continue to, change over time due to normal portfolio turnover in response to changes in market conditions. Thus, it is expected that some of an Acquired Portfolio’s holdings may not remain at the time of the Reorganizations. It is also expected that, if a Reorganization is approved, AXA Equitable Funds Management Group, LLC (the “Manager”) will liquidate an Acquired VIP Portfolio’s holdings that, based on market conditions and an assessment by the Manager and the investment advisers to the corresponding Acquiring EQAT Portfolio, are not compatible with the Acquiring EQAT Portfolio’s current portfolio composition, investment objective and policies, or investment strategies. The proceeds of such liquidation will be held in temporary investments or reinvested in assets that are consistent with the Acquiring EQAT Portfolio’s investment objective, policies and strategies. Although any sale of portfolio investments in connection with a Reorganization will be conducted in an orderly manner, the need for a Portfolio to sell investments may result in its selling securities at a disadvantageous time and price and could result in the Portfolio realizing gains (or losses) that otherwise would not have been realized and incurring transaction costs that otherwise would not have been incurred.
The New Multimanager Aggressive Equity, New Multimanager Technology, New Multimanager Core Bond, New Multimanager Mid Cap Growth, and New Multimanager Mid Cap Value Portfolios are newly created series of EQ Trust which do not have any assets or liabilities. As a result, pro forma financial statements are not presented with respect to the Reorganizations of the Multimanager Aggressive Equity, Multimanager Technology, Multimanager Core Bond, Multimanager Mid Cap Growth, and Multimanager Mid Cap Value Portfolios into the New Multimanager Aggressive Equity, New Multimanager Technology, New Multimanager Core Bond, New Multimanager Mid Cap Growth, and New Multimanager Mid Cap Value Portfolios, respectively.
3
| Multimanager Large Cap Core Equity Number of Shares | EQ/Large Cap Core PLUS Number of Shares | Pro-forma Combined Number of Shares | Multimanager (Note 1) | EQ/Large Cap (Note 1) | Pro-forma (Note 1) | |||||||||||||||||||
COMMON STOCKS: | ||||||||||||||||||||||||
Consumer | ||||||||||||||||||||||||
Auto Components (0.9%) | ||||||||||||||||||||||||
BorgWarner, Inc. | 3,628 | 14,331 | 17,959 | $ | 202,842 | $ | 801,246 | $ | 1,004,088 | |||||||||||||||
Delphi Automotive plc | 38,899 | 110,558 | 149,457 | 2,338,997 | 6,647,853 | 8,986,850 | ||||||||||||||||||
Goodyear Tire & Rubber Co. | 3,773 | 15,549 | 19,322 | 89,986 | 370,844 | 460,830 | ||||||||||||||||||
Johnson Controls, Inc. | 10,697 | 291,955 | 302,652 | 548,756 | 14,977,291 | 15,526,047 | ||||||||||||||||||
Lear Corp. | 2,600 | — | 2,600 | 210,522 | — | 210,522 | ||||||||||||||||||
TRW Automotive | 6,500 | — | 6,500 | 483,535 | — | 483,535 | ||||||||||||||||||
|
|
|
|
|
| |||||||||||||||||||
| 3,874,638 | 22,797,234 | 26,671,872 | ||||||||||||||||||||||
|
|
|
|
|
| |||||||||||||||||||
Automobiles (0.7%) | ||||||||||||||||||||||||
Ford Motor Co. | 112,095 | 614,548 | 726,643 | 1,729,626 | 9,482,476 | 11,212,102 | ||||||||||||||||||
General Motors Co.* | 36,377 | 146,430 | 182,807 | 1,486,728 | 5,984,594 | 7,471,322 | ||||||||||||||||||
Harley-Davidson, Inc. | 3,432 | 13,921 | 17,353 | 237,632 | 963,890 | 1,201,522 | ||||||||||||||||||
|
|
|
|
|
| |||||||||||||||||||
| 3,453,986 | 16,430,960 | 19,884,946 | ||||||||||||||||||||||
|
|
|
|
|
| |||||||||||||||||||
Distributors (0.0%) | ||||||||||||||||||||||||
Genuine Parts Co. | 2,409 | 9,718 | 12,127 | 200,405 | 808,440 | 1,008,845 | ||||||||||||||||||
|
|
|
|
|
| |||||||||||||||||||
Diversified Consumer | ||||||||||||||||||||||||
Bright Horizons Family Solutions, Inc.* | 46,484 | — | 46,484 | 1,707,822 | — | 1,707,822 | ||||||||||||||||||
H&R Block, Inc. | 4,175 | 17,200 | 21,375 | 121,242 | 499,488 | 620,730 | ||||||||||||||||||
|
|
|
|
|
| |||||||||||||||||||
| 1,829,064 | 499,488 | 2,328,552 | ||||||||||||||||||||||
|
|
|
|
|
| |||||||||||||||||||
Hotels, Restaurants & | ||||||||||||||||||||||||
Carnival Corp. | 6,804 | 128,373 | 135,177 | 273,317 | 5,156,743 | 5,430,060 | ||||||||||||||||||
Chipotle Mexican Grill, Inc.* | 560 | 1,948 | 2,508 | 298,357 | 1,037,856 | 1,336,213 | ||||||||||||||||||
Darden Restaurants, Inc. | 2,007 | 8,218 | 10,225 | 109,120 | 446,813 | 555,933 | ||||||||||||||||||
International Game Technology | 3,794 | 15,659 | 19,453 | 68,899 | 284,367 | 353,266 | ||||||||||||||||||
Las Vegas Sands Corp. | 40,714 | — | 40,714 | 3,211,113 | — | 3,211,113 | ||||||||||||||||||
Life Time Fitness, Inc.* | 48,346 | — | 48,346 | 2,272,262 | — | 2,272,262 | ||||||||||||||||||
Marriott International, Inc., Class A | 3,462 | 14,142 | 17,604 | 170,884 | 698,049 | 868,933 | ||||||||||||||||||
McDonald’s Corp. | 18,044 | 62,663 | 80,707 | 1,750,809 | 6,080,191 | 7,831,000 | ||||||||||||||||||
MGM Resorts International* | 102,800 | — | 102,800 | 2,417,856 | — | 2,417,856 | ||||||||||||||||||
Starbucks Corp. | 80,903 | 131,998 | 212,901 | 6,341,986 | 10,347,323 | 16,689,309 | ||||||||||||||||||
Starwood Hotels & Resorts Worldwide, Inc. | 2,951 | 12,058 | 15,009 | 234,457 | 958,008 | 1,192,465 | ||||||||||||||||||
Wyndham Worldwide Corp. | 2,068 | 8,203 | 10,271 | 152,391 | 604,479 | 756,870 | ||||||||||||||||||
Wynn Resorts Ltd. | 1,285 | 5,085 | 6,370 | 249,560 | 987,558 | 1,237,118 | ||||||||||||||||||
Yum! Brands, Inc. | 6,965 | 28,042 | 35,007 | 526,624 | 2,120,256 | 2,646,880 | ||||||||||||||||||
|
|
|
|
|
| |||||||||||||||||||
| 18,077,635 | 28,721,643 | 46,799,278 | ||||||||||||||||||||||
|
|
|
|
|
| |||||||||||||||||||
Household Durables (1.2%) | ||||||||||||||||||||||||
D.R. Horton, Inc.* | 4,355 | 176,683 | 181,038 | 97,204 | 3,943,565 | 4,040,769 | ||||||||||||||||||
Garmin Ltd. | 23,018 | 7,740 | 30,758 | 1,063,892 | 357,743 | 1,421,635 | ||||||||||||||||||
Harman International | 1,044 | 4,251 | 5,295 | 85,451 | 347,944 | 433,395 | ||||||||||||||||||
Leggett & Platt, Inc. | 2,168 | 8,884 | 11,052 | 67,078 | 274,871 | 341,949 | ||||||||||||||||||
Lennar Corp., Class A | 2,589 | 98,430 | 101,019 | 102,421 | 3,893,891 | 3,996,312 | ||||||||||||||||||
Mohawk Industries, Inc.* | 1,000 | 3,842 | 4,842 | 148,900 | 572,074 | 720,974 | ||||||||||||||||||
Newell Rubbermaid, Inc. | 4,416 | 295,474 | 299,890 | 143,123 | 9,576,312 | 9,719,435 | ||||||||||||||||||
PulteGroup, Inc. | 40,224 | 21,697 | 61,921 | 819,363 | 441,968 | 1,261,331 | ||||||||||||||||||
Tupperware Brands Corp. | 35,959 | — | 35,959 | 3,399,204 | — | 3,399,204 | ||||||||||||||||||
Whirlpool Corp. | 1,204 | 60,312 | 61,516 | 188,859 | 9,460,540 | 9,649,399 | ||||||||||||||||||
|
|
|
|
|
| |||||||||||||||||||
| 6,115,495 | 28,868,908 | 34,984,403 | ||||||||||||||||||||||
|
|
|
|
|
| |||||||||||||||||||
Internet & Catalog | ||||||||||||||||||||||||
Amazon.com, Inc.* | 11,719 | 34,285 | 46,004 | 4,673,420 | 13,672,515 | 18,345,935 | ||||||||||||||||||
Expedia, Inc. | 1,585 | 6,481 | 8,066 | 110,411 | 451,467 | 561,878 | ||||||||||||||||||
Netflix, Inc.* | 983 | 3,732 | 4,715 | 361,911 | 1,374,010 | 1,735,921 | ||||||||||||||||||
priceline.com, Inc.* | 4,360 | 3,239 | 7,599 | 5,068,064 | 3,765,014 | 8,833,078 | ||||||||||||||||||
TripAdvisor, Inc.* | 1,746 | 6,975 | 8,721 | 144,621 | 577,739 | 722,360 | ||||||||||||||||||
|
|
|
|
|
| |||||||||||||||||||
| 10,358,427 | 19,840,745 | 30,199,172 | ||||||||||||||||||||||
|
|
|
|
|
| |||||||||||||||||||
See Notes to Pro-forma Combined Financial Statements.
4
| Multimanager Large Cap Core Equity Number of Shares | EQ/Large Cap Core PLUS Number of Shares | Pro-forma Combined Number of Shares | Multimanager (Note 1) | EQ/Large Cap (Note 1) | Pro-forma (Note 1) | |||||||||||||||||||
Leisure Equipment & | ||||||||||||||||||||||||
Hasbro, Inc. | 1,766 | 7,268 | 9,034 | 97,148 | 399,813 | 496,961 | ||||||||||||||||||
Mattel, Inc. | 5,218 | 21,308 | 26,526 | 248,272 | 1,013,834 | 1,262,106 | ||||||||||||||||||
|
|
|
|
|
| |||||||||||||||||||
| 345,420 | 1,413,647 | 1,759,067 | ||||||||||||||||||||||
|
|
|
|
|
| |||||||||||||||||||
Media (3.6%) | ||||||||||||||||||||||||
Cablevision Systems Corp. - New York Group, | 3,292 | 13,466 | 16,758 | 59,025 | 241,445 | 300,470 | ||||||||||||||||||
CBS Corp. (Non-Voting), | 48,196 | 35,142 | 83,338 | 3,072,013 | 2,239,951 | 5,311,964 | ||||||||||||||||||
Charter Communications, | — | 39,968 | 39,968 | — | 5,466,024 | 5,466,024 | ||||||||||||||||||
Comcast Corp., Class A | 49,226 | 244,825 | 294,051 | 2,558,029 | 12,722,331 | 15,280,360 | ||||||||||||||||||
DIRECTV* | 7,614 | 30,771 | 38,385 | 526,051 | 2,125,968 | 2,652,019 | ||||||||||||||||||
Discovery Communications, | 3,567 | 14,209 | 17,776 | 322,528 | 1,284,778 | 1,607,306 | ||||||||||||||||||
DreamWorks Animation SKG, Inc., Class A* | — | 75,760 | 75,760 | — | 2,689,480 | 2,689,480 | ||||||||||||||||||
Gannett Co., Inc. | 24,332 | 267,586 | 291,918 | 719,740 | 7,915,194 | 8,634,934 | ||||||||||||||||||
Graham Holdings Co., | 80 | 274 | 354 | 53,066 | 181,750 | 234,816 | ||||||||||||||||||
Interpublic Group of Cos., Inc. | 6,444 | 26,197 | 32,641 | 114,059 | 463,687 | 577,746 | ||||||||||||||||||
Liberty Global plc, | 3,399 | — | 3,399 | 302,477 | — | 302,477 | ||||||||||||||||||
Liberty Global plc* | 5,941 | — | 5,941 | 500,945 | — | 500,945 | ||||||||||||||||||
News Corp., Class A* | 7,687 | 31,336 | 39,023 | 138,520 | 564,675 | 703,195 | ||||||||||||||||||
Omnicom Group, Inc. | 3,994 | 16,204 | 20,198 | 297,034 | 1,205,091 | 1,502,125 | ||||||||||||||||||
Regal Entertainment Group, Class A | 9,072 | — | 9,072 | 176,450 | — | 176,450 | ||||||||||||||||||
Scripps Networks Interactive, Inc., Class A | 1,665 | 94,402 | 96,067 | 143,873 | 8,157,277 | 8,301,150 | ||||||||||||||||||
Sirius XM Holdings, Inc.* | — | 1,704,865 | 1,704,865 | — | 5,949,979 | 5,949,979 | ||||||||||||||||||
Time Warner Cable, Inc. | 4,432 | 17,751 | 22,183 | 600,536 | 2,405,260 | 3,005,796 | ||||||||||||||||||
Time Warner, Inc. | 18,373 | 190,438 | 208,811 | 1,280,966 | 13,277,337 | 14,558,303 | ||||||||||||||||||
Twenty-First Century Fox, Inc., Class A | 122,871 | 123,578 | 246,449 | 4,322,602 | 4,347,474 | 8,670,076 | ||||||||||||||||||
Viacom, Inc., Class B | 14,406 | 120,184 | 134,590 | 1,258,220 | 10,496,871 | 11,755,091 | ||||||||||||||||||
Walt Disney Co. | 25,490 | 102,920 | 128,410 | 1,947,436 | 7,863,088 | 9,810,524 | ||||||||||||||||||
|
|
|
|
|
| |||||||||||||||||||
| 18,393,570 | 89,597,660 | 107,991,230 | ||||||||||||||||||||||
|
|
|
|
|
| |||||||||||||||||||
Multiline Retail (0.3%) | ||||||||||||||||||||||||
Dollar General Corp.* | 4,549 | 18,551 | 23,100 | 274,396 | 1,118,996 | 1,393,392 | ||||||||||||||||||
Dollar Tree, Inc.* | 3,249 | 13,101 | 16,350 | 183,309 | 739,158 | 922,467 | ||||||||||||||||||
Family Dollar Stores, Inc. | 1,525 | 6,085 | 7,610 | 99,079 | 395,343 | 494,422 | ||||||||||||||||||
Kohl’s Corp. | 3,172 | 12,672 | 15,844 | 180,011 | 719,136 | 899,147 | ||||||||||||||||||
Macy’s, Inc. | 18,882 | 23,201 | 42,083 | 1,008,299 | 1,238,933 | 2,247,232 | ||||||||||||||||||
Nordstrom, Inc. | 2,228 | 9,007 | 11,235 | 137,690 | 556,633 | 694,323 | ||||||||||||||||||
Target Corp. | 9,816 | 39,803 | 49,619 | 621,058 | 2,518,336 | 3,139,394 | ||||||||||||||||||
|
|
|
|
|
| |||||||||||||||||||
| 2,503,842 | 7,286,535 | 9,790,377 | ||||||||||||||||||||||
|
|
|
|
|
| |||||||||||||||||||
Specialty Retail (2.0%) | ||||||||||||||||||||||||
AutoNation, Inc.* | 962 | 4,066 | 5,028 | 47,802 | 202,040 | 249,842 | ||||||||||||||||||
AutoZone, Inc.* | 12,704 | 2,142 | 14,846 | 6,071,750 | 1,023,748 | 7,095,498 | ||||||||||||||||||
Bed Bath & Beyond, Inc.* | 3,313 | 13,521 | 16,834 | 266,034 | 1,085,736 | 1,351,770 | ||||||||||||||||||
Best Buy Co., Inc. | 4,194 | 17,215 | 21,409 | 167,257 | 686,534 | 853,791 | ||||||||||||||||||
CarMax, Inc.* | 3,515 | 14,061 | 17,576 | 165,275 | 661,148 | 826,423 | ||||||||||||||||||
GameStop Corp., Class A | 13,047 | 7,356 | 20,403 | 642,695 | 362,357 | 1,005,052 | ||||||||||||||||||
Gap, Inc. | 4,076 | 16,676 | 20,752 | 159,290 | 651,698 | 810,988 | ||||||||||||||||||
Home Depot, Inc. | 33,263 | 174,192 | 207,455 | 2,738,875 | 14,342,969 | 17,081,844 | ||||||||||||||||||
L Brands, Inc. | 3,793 | 15,352 | 19,145 | 234,597 | 949,521 | 1,184,118 | ||||||||||||||||||
Lowe’s Cos., Inc. | 22,765 | 65,859 | 88,624 | 1,128,006 | 3,263,313 | 4,391,319 | ||||||||||||||||||
O’Reilly Automotive, Inc.* | 1,647 | 6,757 | 8,404 | 211,985 | 869,693 | 1,081,678 | ||||||||||||||||||
PetSmart, Inc. | 1,614 | 6,529 | 8,143 | 117,419 | 474,985 | 592,404 | ||||||||||||||||||
Ross Stores, Inc. | 3,352 | 79,843 | 83,195 | 251,165 | 5,982,636 | 6,233,801 | ||||||||||||||||||
Signet Jewelers Ltd. | — | 60,671 | 60,671 | — | 4,774,808 | 4,774,808 | ||||||||||||||||||
Staples, Inc. | 10,217 | 41,579 | 51,796 | 162,348 | 660,690 | 823,038 | ||||||||||||||||||
Tiffany & Co. | 1,747 | 39,068 | 40,815 | 162,087 | 3,624,729 | 3,786,816 | ||||||||||||||||||
TJX Cos., Inc. | 63,134 | 44,786 | 107,920 | 4,023,530 | 2,854,212 | 6,877,742 | ||||||||||||||||||
Urban Outfitters, Inc.* | 1,643 | 6,860 | 8,503 | 60,955 | 254,506 | 315,461 | ||||||||||||||||||
|
|
|
|
|
| |||||||||||||||||||
| 16,611,070 | 42,725,323 | 59,336,393 | ||||||||||||||||||||||
|
|
|
|
|
| |||||||||||||||||||
See Notes to Pro-forma Combined Financial Statements.
5
| Multimanager Large Cap Core Equity Number of Shares | EQ/Large Cap Core PLUS Number of Shares | Pro-forma Combined Number of Shares | Multimanager (Note 1) | EQ/Large Cap (Note 1) | Pro-forma (Note 1) | |||||||||||||||||||
Textiles, Apparel & Luxury Goods (1.0%) | ||||||||||||||||||||||||
Coach, Inc. | 4,316 | 119,956 | 124,272 | 242,257 | 6,733,130 | 6,975,387 | ||||||||||||||||||
Fossil Group, Inc.* | 780 | 3,092 | 3,872 | 93,553 | 370,854 | 464,407 | ||||||||||||||||||
Lululemon Athletica, Inc.* | — | 36,658 | 36,658 | — | 2,163,922 | 2,163,922 | ||||||||||||||||||
Michael Kors Holdings Ltd.* | 2,807 | 11,298 | 14,105 | 227,900 | 917,285 | 1,145,185 | ||||||||||||||||||
NIKE, Inc., Class B | 57,668 | 161,562 | 219,230 | 4,535,012 | 12,705,236 | 17,240,248 | ||||||||||||||||||
PVH Corp. | 1,333 | 5,135 | 6,468 | 181,315 | 698,463 | 879,778 | ||||||||||||||||||
Ralph Lauren Corp. | 963 | 3,753 | 4,716 | 170,037 | 662,667 | 832,704 | ||||||||||||||||||
VF Corp. | 5,460 | 22,180 | 27,640 | 340,376 | 1,382,701 | 1,723,077 | ||||||||||||||||||
|
|
|
|
|
| |||||||||||||||||||
| 5,790,450 | 25,634,258 | 31,424,708 | ||||||||||||||||||||||
|
|
|
|
|
| |||||||||||||||||||
Total Consumer Discretionary | 87,554,002 | 284,624,841 | 372,178,843 | |||||||||||||||||||||
|
|
|
|
|
| |||||||||||||||||||
Consumer Staples (5.8%) | ||||||||||||||||||||||||
Beverages (1.1%) | ||||||||||||||||||||||||
Beam, Inc. | 2,589 | 66,347 | 68,936 | 176,208 | 4,515,577 | 4,691,785 | ||||||||||||||||||
Brown-Forman Corp., Class B | 2,528 | 10,201 | 12,729 | 191,041 | 770,890 | 961,931 | ||||||||||||||||||
Coca-Cola Co. | 59,272 | 239,166 | 298,438 | 2,448,526 | 9,879,947 | 12,328,473 | ||||||||||||||||||
Coca-Cola Enterprises, Inc. | 3,755 | 15,201 | 18,956 | 165,708 | 670,820 | 836,528 | ||||||||||||||||||
Constellation Brands, Inc., Class A* | 2,648 | 10,493 | 13,141 | 186,366 | 738,497 | 924,863 | ||||||||||||||||||
Diageo plc (ADR) | 9,065 | — | 9,065 | 1,200,387 | — | 1,200,387 | ||||||||||||||||||
Dr. Pepper Snapple Group, Inc. | 3,111 | 12,630 | 15,741 | 151,568 | 615,334 | 766,902 | ||||||||||||||||||
Molson Coors Brewing Co., Class B | 2,409 | 9,953 | 12,362 | 135,266 | 558,861 | 694,127 | ||||||||||||||||||
Monster Beverage Corp.* | 2,109 | 8,549 | 10,658 | 142,927 | 579,366 | 722,293 | ||||||||||||||||||
PepsiCo, Inc. | 31,266 | 96,580 | 127,846 | 2,593,202 | 8,010,345 | 10,603,547 | ||||||||||||||||||
|
|
|
|
|
| |||||||||||||||||||
| 7,391,199 | 26,339,637 | 33,730,836 | ||||||||||||||||||||||
|
|
|
|
|
| |||||||||||||||||||
Food& Staples Retailing (1.6%) | ||||||||||||||||||||||||
Costco Wholesale Corp. | 6,844 | 27,515 | 34,359 | 814,504 | 3,274,560 | 4,089,064 | ||||||||||||||||||
CVS Caremark Corp. | 25,393 | 180,106 | 205,499 | 1,817,377 | 12,890,186 | 14,707,563 | ||||||||||||||||||
Koninklijke Ahold N.V | 44,391 | — | 44,391 | 796,947 | — | 796,947 | ||||||||||||||||||
Kroger Co. | 34,630 | 32,775 | 67,405 | 1,368,924 | 1,295,596 | 2,664,520 | ||||||||||||||||||
Safeway, Inc. | 3,793 | 15,543 | 19,336 | 123,538 | 506,235 | 629,773 | ||||||||||||||||||
Sprouts Farmers Market, Inc.* | — | 58,500 | 58,500 | — | 2,248,155 | 2,248,155 | ||||||||||||||||||
Sysco Corp. | 9,072 | 36,619 | 45,691 | 327,499 | 1,321,946 | 1,649,445 | ||||||||||||||||||
Walgreen Co. | 126,907 | 54,841 | 181,748 | 7,289,538 | 3,150,067 | 10,439,605 | ||||||||||||||||||
Wal-Mart Stores, Inc. | 32,864 | 101,888 | 134,752 | 2,586,068 | 8,017,567 | 10,603,635 | ||||||||||||||||||
Whole Foods Market, Inc. | 5,799 | 23,432 | 29,231 | 335,356 | 1,355,073 | 1,690,429 | ||||||||||||||||||
|
|
|
|
|
| |||||||||||||||||||
| 15,459,751 | 34,059,385 | 49,519,136 | ||||||||||||||||||||||
|
|
|
|
|
| |||||||||||||||||||
Food Products (1.0%) | ||||||||||||||||||||||||
Archer-Daniels-Midland Co. | 10,196 | 41,431 | 51,627 | 442,507 | 1,798,105 | 2,240,612 | ||||||||||||||||||
Campbell Soup Co. | 2,730 | 11,308 | 14,038 | 118,154 | 489,410 | 607,564 | ||||||||||||||||||
ConAgra Foods, Inc. | 6,562 | 26,561 | 33,123 | 221,139 | 895,106 | 1,116,245 | ||||||||||||||||||
General Mills, Inc. | 9,835 | 39,939 | 49,774 | 490,865 | 1,993,356 | 2,484,221 | ||||||||||||||||||
Hershey Co. | 2,328 | 9,432 | 11,760 | 226,352 | 917,073 | 1,143,425 | ||||||||||||||||||
Hormel Foods Corp. | 2,107 | 8,471 | 10,578 | 95,173 | 382,635 | 477,808 | ||||||||||||||||||
J.M. Smucker Co. | 1,686 | 6,619 | 8,305 | 174,703 | 685,861 | 860,564 | ||||||||||||||||||
Kellogg Co. | 4,054 | 16,191 | 20,245 | 247,578 | 988,784 | 1,236,362 | ||||||||||||||||||
Kraft Foods Group, Inc. | 11,901 | 37,522 | 49,423 | 641,702 | 2,023,186 | 2,664,888 | ||||||||||||||||||
McCormick & Co., Inc. (Non-Voting) | 2,087 | 8,312 | 10,399 | 143,836 | 572,863 | 716,699 | ||||||||||||||||||
Mead Johnson Nutrition Co. | 3,125 | 12,717 | 15,842 | 261,750 | 1,065,176 | 1,326,926 | ||||||||||||||||||
Mondelez International, Inc., Class A | 156,550 | 228,466 | 385,016 | 5,526,215 | 8,064,850 | 13,591,065 | ||||||||||||||||||
Tyson Foods, Inc., Class A | 4,216 | 17,098 | 21,314 | 141,067 | 572,099 | 713,166 | ||||||||||||||||||
|
|
|
|
|
| |||||||||||||||||||
| 8,731,041 | 20,448,504 | 29,179,545 | ||||||||||||||||||||||
|
|
|
|
|
| |||||||||||||||||||
Household Products (1.2%) | ||||||||||||||||||||||||
Clorox Co. | 2,007 | 8,124 | 10,131 | 186,169 | 753,582 | 939,751 | ||||||||||||||||||
Colgate-Palmolive Co. | 33,112 | 55,351 | 88,463 | 2,159,234 | 3,609,439 | 5,768,673 | ||||||||||||||||||
Kimberly-Clark Corp. | 8,330 | 24,032 | 32,362 | 870,152 | 2,510,383 | 3,380,535 | ||||||||||||||||||
Procter & Gamble Co. | 52,511 | 254,201 | 306,712 | 4,274,920 | 20,694,503 | 24,969,423 | ||||||||||||||||||
|
|
|
|
|
| |||||||||||||||||||
| 7,490,475 | 27,567,907 | 35,058,382 | ||||||||||||||||||||||
|
|
|
|
|
| |||||||||||||||||||
See Notes to Pro-forma Combined Financial Statements.
6
| Multimanager Large Cap Core Equity Number of Shares | EQ/Large Cap Core PLUS Number of Shares | Pro-forma Combined Number of Shares | Multimanager (Note 1) | EQ/Large Cap (Note 1) | Pro-forma (Note 1) | |||||||||||||||||||
Personal Products (0.2%) | ||||||||||||||||||||||||
Avon Products, Inc. | 6,764 | 266,835 | 273,599 | 116,476 | 4,594,899 | 4,711,375 | ||||||||||||||||||
Estee Lauder Cos., Inc., Class A | 3,993 | 16,122 | 20,115 | 300,753 | 1,214,309 | 1,515,062 | ||||||||||||||||||
|
|
|
|
|
| |||||||||||||||||||
| 417,229 | 5,809,208 | 6,226,437 | ||||||||||||||||||||||
|
|
|
|
|
| |||||||||||||||||||
Tobacco (0.7%) | ||||||||||||||||||||||||
Altria Group, Inc. | 31,171 | 125,951 | 157,122 | 1,196,655 | 4,835,259 | 6,031,914 | ||||||||||||||||||
Lorillard, Inc. | 5,721 | 23,193 | 28,914 | 289,940 | 1,175,421 | 1,465,361 | ||||||||||||||||||
Philip Morris International, Inc. | 37,757 | 100,899 | 138,656 | 3,289,767 | 8,791,330 | 12,081,097 | ||||||||||||||||||
Reynolds American, Inc. | 4,858 | 19,736 | 24,594 | 242,852 | 986,603 | 1,229,455 | ||||||||||||||||||
|
|
|
|
|
| |||||||||||||||||||
| 5,019,214 | 15,788,613 | 20,807,827 | ||||||||||||||||||||||
|
|
|
|
|
| |||||||||||||||||||
Total Consumer Staples | 44,508,909 | 130,013,254 | 174,522,163 | |||||||||||||||||||||
|
|
|
|
|
| |||||||||||||||||||
Energy (8.0%) | ||||||||||||||||||||||||
Energy Equipment & Services (1.8%) | ||||||||||||||||||||||||
Baker Hughes, Inc. | 6,894 | 27,908 | 34,802 | 380,962 | 1,542,196 | 1,923,158 | ||||||||||||||||||
Cameron International Corp.* | 3,673 | 14,976 | 18,649 | 218,654 | 891,521 | 1,110,175 | ||||||||||||||||||
Diamond Offshore Drilling, Inc. | 1,044 | 4,373 | 5,417 | 59,424 | 248,911 | 308,335 | ||||||||||||||||||
Dresser-Rand Group, Inc.* | 61,400 | — | 61,400 | 3,661,282 | — | 3,661,282 | ||||||||||||||||||
Ensco plc, Class A | 3,621 | 87,122 | 90,743 | 207,049 | 4,981,636 | 5,188,685 | ||||||||||||||||||
FMC Technologies, Inc.* | 3,693 | 14,895 | 18,588 | 192,812 | 777,668 | 970,480 | ||||||||||||||||||
Frank’s International N.V | 67,906 | — | 67,906 | 1,833,462 | — | 1,833,462 | ||||||||||||||||||
Halliburton Co. | 29,471 | 303,459 | 332,930 | 1,495,653 | 15,400,544 | 16,896,197 | ||||||||||||||||||
Helmerich & Payne, Inc. | 1,700 | 6,748 | 8,448 | 142,936 | 567,372 | 710,308 | ||||||||||||||||||
Nabors Industries Ltd. | 3,996 | 16,341 | 20,337 | 67,892 | 277,634 | 345,526 | ||||||||||||||||||
National Oilwell Varco, Inc. | 6,683 | 26,958 | 33,641 | 531,499 | 2,143,970 | 2,675,469 | ||||||||||||||||||
Noble Corp. plc | 3,948 | 15,952 | 19,900 | 147,932 | 597,722 | 745,654 | ||||||||||||||||||
Rowan Cos., plc, Class A* | 1,927 | 7,816 | 9,743 | 68,139 | 276,374 | 344,513 | ||||||||||||||||||
Schlumberger Ltd. | 20,539 | 152,767 | 173,306 | 1,850,769 | 13,765,834 | 15,616,603 | ||||||||||||||||||
Transocean Ltd. | 5,219 | 21,341 | 26,560 | 257,923 | 1,054,672 | 1,312,595 | ||||||||||||||||||
|
|
|
|
|
| |||||||||||||||||||
| 11,116,388 | 42,526,054 | 53,642,442 | ||||||||||||||||||||||
|
|
|
|
|
| |||||||||||||||||||
Oil, Gas & Consumable Fuels (6.2%) | ||||||||||||||||||||||||
Anadarko Petroleum Corp. | 7,888 | 31,692 | 39,580 | 625,676 | 2,513,809 | 3,139,485 | ||||||||||||||||||
Antero Resources Corp.* | 25,900 | — | 25,900 | 1,643,096 | — | 1,643,096 | ||||||||||||||||||
Apache Corp. | 6,202 | 25,140 | 31,342 | 533,000 | 2,160,532 | 2,693,532 | ||||||||||||||||||
Bankers Petroleum Ltd.* | 266,381 | — | 266,381 | 1,095,867 | — | 1,095,867 | ||||||||||||||||||
Cabot Oil & Gas Corp. | 6,522 | 26,516 | 33,038 | 252,793 | 1,027,760 | 1,280,553 | ||||||||||||||||||
Cenovus Energy, Inc. | — | 170,551 | 170,551 | — | 4,886,286 | 4,886,286 | ||||||||||||||||||
Chesapeake Energy Corp. | 7,828 | 31,824 | 39,652 | 212,452 | 863,703 | 1,076,155 | ||||||||||||||||||
Chevron Corp. | 62,332 | 246,688 | 309,020 | 7,785,890 | 30,813,798 | 38,599,688 | ||||||||||||||||||
Cobalt International Energy, Inc.* | — | 106,624 | 106,624 | — | 1,753,965 | 1,753,965 | ||||||||||||||||||
ConocoPhillips Co. | 19,086 | 77,151 | 96,237 | 1,348,426 | 5,450,718 | 6,799,144 | ||||||||||||||||||
CONSOL Energy, Inc. | 3,552 | 14,411 | 17,963 | 135,118 | 548,194 | 683,312 | ||||||||||||||||||
Denbury Resources, Inc.* | 5,725 | 23,076 | 28,801 | 94,062 | 379,139 | 473,201 | ||||||||||||||||||
Devon Energy Corp. | 5,961 | 24,031 | 29,992 | 368,807 | 1,486,798 | 1,855,605 | ||||||||||||||||||
Enbridge, Inc. | — | 61,000 | 61,000 | — | 2,664,480 | 2,664,480 | ||||||||||||||||||
Encana Corp. | — | 149,400 | 149,400 | — | 2,696,670 | 2,696,670 | ||||||||||||||||||
EOG Resources, Inc. | 4,275 | 17,190 | 21,465 | 717,516 | 2,885,170 | 3,602,686 | ||||||||||||||||||
EQT Corp. | 2,328 | 9,489 | 11,817 | 209,008 | 851,922 | 1,060,930 | ||||||||||||||||||
Exxon Mobil Corp.# | 75,886 | 395,420 | 471,306 | 7,679,663 | 40,016,504 | 47,696,167 | ||||||||||||||||||
Hess Corp. | 18,176 | 17,910 | 36,086 | 1,508,608 | 1,486,530 | 2,995,138 | ||||||||||||||||||
HollyFrontier Corp. | 66,500 | — | 66,500 | 3,304,385 | — | 3,304,385 | ||||||||||||||||||
INPEX Corp. | 133,600 | — | 133,600 | 1,710,121 | — | 1,710,121 | ||||||||||||||||||
Kinder Morgan, Inc. | 10,431 | 42,395 | 52,826 | 375,516 | 1,526,220 | 1,901,736 | ||||||||||||||||||
Marathon Oil Corp. | 10,819 | 218,165 | 228,984 | 381,911 | 7,701,225 | 8,083,136 | ||||||||||||||||||
Marathon Petroleum Corp. | 14,659 | 18,955 | 33,614 | 1,344,670 | 1,738,742 | 3,083,412 | ||||||||||||||||||
Murphy Oil Corp. | 2,690 | 11,065 | 13,755 | 174,527 | 717,897 | 892,424 | ||||||||||||||||||
Newfield Exploration Co.* | 2,087 | 8,561 | 10,648 | 51,403 | 210,857 | 262,260 | ||||||||||||||||||
See Notes to Pro-forma Combined Financial Statements.
7
| Multimanager Large Cap Core Equity Number of Shares | EQ/Large Cap Core PLUS Number of Shares | Pro-forma Combined Number of Shares | Multimanager (Note 1) | EQ/Large Cap (Note 1) | Pro-forma (Note 1) | |||||||||||||||||||
Noble Energy, Inc. | 5,559 | 126,776 | 132,335 | 378,623 | 8,634,713 | 9,013,336 | ||||||||||||||||||
Occidental Petroleum Corp. | 22,905 | 50,761 | 73,666 | 2,178,265 | 4,827,371 | 7,005,636 | ||||||||||||||||||
Pacific Rubiales Energy Corp. | 44,021 | — | 44,021 | 760,033 | — | 760,033 | ||||||||||||||||||
Peabody Energy Corp. | 4,194 | 16,979 | 21,173 | 81,909 | 331,600 | 413,509 | ||||||||||||||||||
Phillips 66 | 12,204 | 37,754 | 49,958 | 941,294 | 2,911,966 | 3,853,260 | ||||||||||||||||||
Pioneer Natural Resources Co. | 2,227 | 8,982 | 11,209 | 409,924 | 1,653,317 | 2,063,241 | ||||||||||||||||||
QEP Resources, Inc. | 2,787 | 11,282 | 14,069 | 85,422 | 345,793 | 431,215 | ||||||||||||||||||
Range Resources Corp. | 2,589 | 10,289 | 12,878 | 218,279 | 867,466 | 1,085,745 | ||||||||||||||||||
Southwestern Energy Co.* | 5,479 | 119,429 | 124,908 | 215,489 | 4,697,143 | 4,912,632 | ||||||||||||||||||
Spectra Energy Corp. | 10,416 | 42,190 | 52,606 | 371,018 | 1,502,808 | 1,873,826 | ||||||||||||||||||
Tesoro Corp. | 2,068 | 8,361 | 10,429 | 120,978 | 489,119 | 610,097 | ||||||||||||||||||
Total S.A. | 72,122 | — | 72,122 | 4,418,188 | — | 4,418,188 | ||||||||||||||||||
Valero Energy Corp. | 25,810 | 33,975 | 59,785 | 1,300,824 | 1,712,340 | 3,013,164 | ||||||||||||||||||
Williams Cos., Inc. | 10,634 | 43,034 | 53,668 | 410,153 | 1,659,821 | 2,069,974 | ||||||||||||||||||
WPX Energy, Inc.* | 3,051 | 12,633 | 15,684 | 62,179 | 257,461 | 319,640 | ||||||||||||||||||
|
|
|
|
|
| |||||||||||||||||||
| 43,505,093 | 144,271,837 | 187,776,930 | ||||||||||||||||||||||
|
|
|
|
|
| |||||||||||||||||||
Total Energy | 54,621,481 | 186,797,891 | 241,419,372 | |||||||||||||||||||||
|
|
|
|
|
| |||||||||||||||||||
Financials (12.1%) | ||||||||||||||||||||||||
Capital Markets (1.5%) | ||||||||||||||||||||||||
Ameriprise Financial, Inc. | 3,092 | 12,249 | 15,341 | 355,735 | 1,409,247 | 1,764,982 | ||||||||||||||||||
Bank of New York Mellon Corp. | 17,905 | 72,324 | 90,229 | 625,601 | 2,527,001 | 3,152,602 | ||||||||||||||||||
BlackRock, Inc. | 1,977 | 21,856 | 23,833 | 625,661 | 6,916,768 | 7,542,429 | ||||||||||||||||||
Blackstone Group LP | 29,865 | — | 29,865 | 940,747 | — | 940,747 | ||||||||||||||||||
Charles Schwab Corp. | 18,040 | 73,074 | 91,114 | 469,040 | 1,899,924 | 2,368,964 | ||||||||||||||||||
E*TRADE Financial Corp.* | 17,002 | 18,073 | 35,075 | 333,919 | 354,954 | 688,873 | ||||||||||||||||||
Franklin Resources, Inc. | 6,304 | 25,422 | 31,726 | 363,930 | 1,467,612 | 1,831,542 | ||||||||||||||||||
Goldman Sachs Group, Inc. | 8,630 | 75,586 | 84,216 | 1,529,754 | 13,398,374 | 14,928,128 | ||||||||||||||||||
Invesco Ltd. | 6,824 | 27,909 | 34,733 | 248,394 | 1,015,888 | 1,264,282 | ||||||||||||||||||
Legg Mason, Inc. | 1,647 | 6,679 | 8,326 | 71,611 | 290,403 | 362,014 | ||||||||||||||||||
Morgan Stanley | 21,555 | 87,245 | 108,800 | 675,965 | 2,736,003 | 3,411,968 | ||||||||||||||||||
Northern Trust Corp. | 3,472 | 14,143 | 17,615 | 214,882 | 875,310 | 1,090,192 | ||||||||||||||||||
State Street Corp. | 9,054 | 27,644 | 36,698 | 664,473 | 2,028,793 | 2,693,266 | ||||||||||||||||||
T. Rowe Price Group, Inc. | 4,034 | 16,432 | 20,466 | 337,928 | 1,376,509 | 1,714,437 | ||||||||||||||||||
|
|
|
|
|
| |||||||||||||||||||
| 7,457,640 | 36,296,786 | 43,754,426 | ||||||||||||||||||||||
|
|
|
|
|
| |||||||||||||||||||
Commercial Banks (1.8%) | ||||||||||||||||||||||||
BB&T Corp. | 10,958 | 138,027 | 148,985 | 408,952 | 5,151,168 | 5,560,120 | ||||||||||||||||||
CIT Group, Inc. | 13,900 | — | 13,900 | 724,607 | — | 724,607 | ||||||||||||||||||
Comerica, Inc. | 2,870 | 11,513 | 14,383 | 136,440 | 547,328 | 683,768 | ||||||||||||||||||
Fifth Third Bancorp | 13,710 | 55,586 | 69,296 | 288,321 | 1,168,974 | 1,457,295 | ||||||||||||||||||
First Republic Bank/California | 47,700 | — | 47,700 | 2,497,095 | — | 2,497,095 | ||||||||||||||||||
Huntington Bancshares, Inc./Ohio | 12,947 | 52,275 | 65,222 | 124,938 | 504,454 | 629,392 | ||||||||||||||||||
KeyCorp. | 13,912 | 56,450 | 70,362 | 186,699 | 757,559 | 944,258 | ||||||||||||||||||
M&T Bank Corp. | 2,047 | 8,199 | 10,246 | 238,312 | 954,528 | 1,192,840 | ||||||||||||||||||
PNC Financial Services Group, Inc. | 8,339 | 136,011 | 144,350 | 646,940 | 10,551,733 | 11,198,673 | ||||||||||||||||||
Regions Financial Corp. | 21,437 | 86,727 | 108,164 | 212,012 | 857,730 | 1,069,742 | ||||||||||||||||||
SunTrust Banks, Inc. | 8,269 | 33,703 | 41,972 | 304,382 | 1,240,607 | 1,544,989 | ||||||||||||||||||
U.S. Bancorp/Minnesota | 32,604 | 115,011 | 147,615 | 1,317,201 | 4,646,444 | 5,963,645 | ||||||||||||||||||
Wells Fargo & Co. | 104,009 | 376,281 | 480,290 | 4,722,009 | 17,083,157 | 21,805,166 | ||||||||||||||||||
Zions Bancorp | 2,810 | 11,617 | 14,427 | 84,188 | 348,045 | 432,233 | ||||||||||||||||||
|
|
|
|
|
| |||||||||||||||||||
| 11,892,096 | 43,811,727 | 55,703,823 | ||||||||||||||||||||||
|
|
|
|
|
| |||||||||||||||||||
Consumer Finance (0.8%) | ||||||||||||||||||||||||
American Express Co. | 31,558 | 58,018 | 89,576 | 2,863,257 | 5,263,973 | 8,127,230 | ||||||||||||||||||
Capital One Financial Corp. | 20,192 | 142,357 | 162,549 | 1,546,909 | 10,905,970 | 12,452,879 | ||||||||||||||||||
Discover Financial Services | 19,348 | 30,162 | 49,510 | 1,082,521 | 1,687,564 | 2,770,085 | ||||||||||||||||||
SLM Corp. | 6,726 | 27,464 | 34,190 | 176,759 | 721,754 | 898,513 | ||||||||||||||||||
|
|
|
|
|
| |||||||||||||||||||
| 5,669,446 | 18,579,261 | 24,248,707 | ||||||||||||||||||||||
|
|
|
|
|
| |||||||||||||||||||
See Notes to Pro-forma Combined Financial Statements.
8
| Multimanager Large Cap Core Equity Number of Shares | EQ/Large Cap Core PLUS Number of Shares | Pro-forma Combined Number of Shares | Multimanager (Note 1) | EQ/Large Cap (Note 1) | Pro-forma (Note 1) | |||||||||||||||||||
Diversified Financial Services (3.1%) | ||||||||||||||||||||||||
Bank of America Corp. | 254,179 | 1,176,019 | 1,430,198 | 3,957,567 | 18,310,616 | 22,268,183 | ||||||||||||||||||
Citigroup, Inc. | 73,967 | 334,408 | 408,375 | 3,854,420 | 17,426,001 | 21,280,421 | ||||||||||||||||||
CME Group, Inc./Illinois | 4,937 | 70,214 | 75,151 | 387,357 | 5,508,990 | 5,896,347 | ||||||||||||||||||
ING US, Inc. | 4,700 | — | 4,700 | 165,205 | — | 165,205 | ||||||||||||||||||
IntercontinentalExchange Group, Inc. | 1,866 | 28,945 | 30,811 | 419,701 | 6,510,309 | 6,930,010 | ||||||||||||||||||
JPMorgan Chase & Co. | 160,330 | 411,814 | 572,144 | 9,376,099 | 24,082,883 | 33,458,982 | ||||||||||||||||||
Leucadia National Corp. | 4,851 | 19,734 | 24,585 | 137,477 | 559,262 | 696,739 | ||||||||||||||||||
McGraw Hill Financial, Inc. | 5,435 | 17,051 | 22,486 | 425,017 | 1,333,388 | 1,758,405 | ||||||||||||||||||
Moody’s Corp. | 2,970 | 11,917 | 14,887 | 233,056 | 935,127 | 1,168,183 | ||||||||||||||||||
NASDAQ OMX Group, Inc. | 1,766 | 7,275 | 9,041 | 70,287 | 289,545 | 359,832 | ||||||||||||||||||
|
|
|
|
|
| |||||||||||||||||||
| 19,026,186 | 74,956,121 | 93,982,307 | ||||||||||||||||||||||
|
|
|
|
|
| |||||||||||||||||||
Insurance (3.4%) | ||||||||||||||||||||||||
ACE Ltd. | 5,371 | 142,637 | 148,008 | 556,060 | 14,767,209 | 15,323,269 | ||||||||||||||||||
Aflac, Inc. | 7,226 | 29,349 | 36,575 | 482,697 | 1,960,513 | 2,443,210 | ||||||||||||||||||
Allstate Corp. | 7,066 | 28,640 | 35,706 | 385,380 | 1,562,026 | 1,947,406 | ||||||||||||||||||
American Financial Group, Inc./Ohio | 9,800 | — | 9,800 | 565,656 | — | 565,656 | ||||||||||||||||||
American International Group, Inc. | 43,170 | 92,721 | 135,891 | 2,203,828 | 4,733,407 | 6,937,235 | ||||||||||||||||||
Aon plc | 14,178 | 123,299 | 137,477 | 1,189,392 | 10,343,553 | 11,532,945 | ||||||||||||||||||
Assurant, Inc. | 6,104 | 4,575 | 10,679 | 405,122 | 303,643 | 708,765 | ||||||||||||||||||
Berkshire Hathaway, Inc., Class B* | 28,154 | 113,361 | 141,515 | 3,337,938 | 13,440,080 | 16,778,018 | ||||||||||||||||||
Chubb Corp. | 12,294 | 15,852 | 28,146 | 1,187,969 | 1,531,779 | 2,719,748 | ||||||||||||||||||
Cincinnati Financial Corp. | 2,248 | 9,281 | 11,529 | 117,728 | 486,046 | 603,774 | ||||||||||||||||||
Everest Reinsurance | 1,100 | — | 1,100 | 171,457 | — | 171,457 | ||||||||||||||||||
Genworth Financial, Inc., Class A* | 42,547 | 31,109 | 73,656 | 660,755 | 483,123 | 1,143,878 | ||||||||||||||||||
Hartford Financial Services Group, Inc. | 130,271 | 28,149 | 158,420 | 4,719,718 | 1,019,838 | 5,739,556 | ||||||||||||||||||
Lincoln National Corp. | 17,755 | 16,517 | 34,272 | 916,513 | 852,607 | 1,769,120 | ||||||||||||||||||
Loews Corp. | 4,717 | 19,257 | 23,974 | 227,548 | 928,958 | 1,156,506 | ||||||||||||||||||
Marsh & McLennan Cos., Inc. | 8,530 | 161,102 | 169,632 | 412,511 | 7,790,893 | 8,203,404 | ||||||||||||||||||
MetLife, Inc. | 123,414 | 70,597 | 194,011 | 6,654,483 | 3,806,590 | 10,461,073 | ||||||||||||||||||
PartnerReinsurance Ltd. | 6,904 | — | 6,904 | 727,889 | — | 727,889 | ||||||||||||||||||
Principal Financial | 4,255 | 17,235 | 21,490 | 209,814 | 849,858 | 1,059,672 | ||||||||||||||||||
Progressive Corp. | 8,571 | 151,775 | 160,346 | 233,731 | 4,138,904 | 4,372,635 | ||||||||||||||||||
Prudential Financial, Inc. | 7,226 | 29,156 | 36,382 | 666,382 | 2,688,766 | 3,355,148 | ||||||||||||||||||
Torchmark Corp. | 1,445 | 5,691 | 7,136 | 112,927 | 444,752 | 557,679 | ||||||||||||||||||
Travelers Cos., Inc. | 7,748 | 22,925 | 30,673 | 701,504 | 2,075,629 | 2,777,133 | ||||||||||||||||||
Unum Group | 4,035 | 16,440 | 20,475 | 141,548 | 576,715 | 718,263 | ||||||||||||||||||
XL Group plc | 4,337 | 17,802 | 22,139 | 138,090 | 566,816 | 704,906 | ||||||||||||||||||
|
|
|
|
|
| |||||||||||||||||||
| 27,126,640 | 75,351,705 | 102,478,345 | ||||||||||||||||||||||
|
|
|
|
|
| |||||||||||||||||||
Real Estate Investment Trusts (REITs) (1.4%) | ||||||||||||||||||||||||
American Tower | 6,202 | 238,643 | 244,845 | 495,044 | 19,048,484 | 19,543,528 | ||||||||||||||||||
Apartment Investment & Management Co. (REIT), Class A | 2,248 | 9,179 | 11,427 | 58,246 | 237,828 | 296,074 | ||||||||||||||||||
AvalonBay Communities, | 1,925 | 7,659 | 9,584 | 227,593 | 905,524 | 1,133,117 | ||||||||||||||||||
Boston Properties, | 2,428 | 9,628 | 12,056 | 243,698 | 966,362 | 1,210,060 | ||||||||||||||||||
Equity Residential (REIT) | 5,256 | 21,104 | 26,360 | 272,629 | 1,094,665 | 1,367,294 | ||||||||||||||||||
General Growth Properties, | 8,394 | 33,843 | 42,237 | 168,468 | 679,229 | 847,697 | ||||||||||||||||||
HCP, Inc. (REIT) | 7,064 | 28,728 | 35,792 | 256,564 | 1,043,401 | 1,299,965 | ||||||||||||||||||
Health Care REIT, Inc. (REIT) | 4,532 | 18,180 | 22,712 | 242,779 | 973,903 | 1,216,682 | ||||||||||||||||||
Host Hotels & Resorts, Inc. (REIT) | 11,726 | 47,630 | 59,356 | 227,953 | 925,927 | 1,153,880 | ||||||||||||||||||
Kimco Realty Corp. (REIT) | 6,362 | 25,788 | 32,150 | 125,650 | 509,313 | 634,963 | ||||||||||||||||||
Macerich Co. (REIT) | 2,152 | 8,846 | 10,998 | 126,731 | 520,941 | 647,672 | ||||||||||||||||||
Plum Creek Timber Co., | 2,689 | 11,142 | 13,831 | 125,065 | 518,214 | 643,279 | ||||||||||||||||||
Prologis, Inc. (REIT) | 7,703 | 31,401 | 39,104 | 284,626 | 1,160,267 | 1,444,893 | ||||||||||||||||||
Public Storage (REIT) | 2,248 | 9,101 | 11,349 | 338,369 | 1,369,883 | 1,708,252 | ||||||||||||||||||
Simon Property Group, | 4,844 | 19,542 | 24,386 | 737,063 | 2,973,511 | 3,710,574 | ||||||||||||||||||
Ventas, Inc. (REIT) | 4,583 | 18,516 | 23,099 | 262,514 | 1,060,596 | 1,323,110 | ||||||||||||||||||
Vornado Realty Trust (REIT) | 2,724 | 10,952 | 13,676 | 241,864 | 972,428 | 1,214,292 | ||||||||||||||||||
Weyerhaeuser Co. (REIT) | 9,087 | 36,692 | 45,779 | 286,877 | 1,158,366 | 1,445,243 | ||||||||||||||||||
|
|
|
|
|
| |||||||||||||||||||
| 4,721,733 | 36,118,842 | 40,840,575 | ||||||||||||||||||||||
|
|
|
|
|
| |||||||||||||||||||
See Notes to Pro-forma Combined Financial Statements.
9
| Multimanager Large Cap Core Equity Number of Shares | EQ/Large Cap Core PLUS Number of Shares | Pro-forma Combined Number of Shares | Multimanager (Note 1) | EQ/Large Cap (Note 1) | Pro-forma (Note 1) | |||||||||||||||||||
Real Estate Management & Development (0.0%) | ||||||||||||||||||||||||
CBRE Group, Inc., Class A* | 4,256 | 17,520 | 21,776 | 111,933 | 460,776 | 572,709 | ||||||||||||||||||
|
|
|
|
|
| |||||||||||||||||||
Thrifts & Mortgage Finance (0.1%) | ||||||||||||||||||||||||
Essent Group Ltd.* | 69,846 | — | 69,846 | 1,680,495 | — | 1,680,495 | ||||||||||||||||||
Hudson City Bancorp, Inc. | 7,406 | 29,921 | 37,327 | 69,839 | 282,155 | 351,994 | ||||||||||||||||||
People’s United Financial, Inc. | 4,879 | 19,996 | 24,875 | 73,770 | 302,340 | 376,110 | ||||||||||||||||||
|
|
|
|
|
| |||||||||||||||||||
| 1,824,104 | 584,495 | 2,408,599 | ||||||||||||||||||||||
|
|
|
|
|
| |||||||||||||||||||
Total Financials | 77,829,778 | 286,159,713 | 363,989,491 | |||||||||||||||||||||
|
|
|
|
|
| |||||||||||||||||||
Health Care (10.3%) | ||||||||||||||||||||||||
Biotechnology (2.7%) | ||||||||||||||||||||||||
Alexion Pharmaceuticals, Inc.* | 3,035 | 12,346 | 15,381 | 403,837 | 1,642,759 | 2,046,596 | ||||||||||||||||||
Amgen, Inc. | 11,826 | 47,491 | 59,317 | 1,350,056 | 5,421,573 | 6,771,629 | ||||||||||||||||||
Biogen Idec, Inc.* | 3,693 | 14,875 | 18,568 | 1,033,117 | 4,161,281 | 5,194,398 | ||||||||||||||||||
Celgene Corp.* | 29,289 | 25,950 | 55,239 | 4,948,669 | 4,384,512 | 9,333,181 | ||||||||||||||||||
Gilead Sciences, Inc.* | 166,259 | 434,996 | 601,255 | 12,494,364 | 32,689,949 | 45,184,313 | ||||||||||||||||||
Regeneron Pharmaceuticals, Inc.* | 1,287 | 4,946 | 6,233 | 354,234 | 1,361,337 | 1,715,571 | ||||||||||||||||||
Seattle Genetics, Inc.* | — | 223,127 | 223,127 | — | 8,900,536 | 8,900,536 | ||||||||||||||||||
Vertex Pharmaceuticals, Inc.* | 18,972 | 14,722 | 33,694 | 1,409,620 | 1,093,845 | 2,503,465 | ||||||||||||||||||
|
|
|
|
|
| |||||||||||||||||||
| 21,993,897 | 59,655,792 | 81,649,689 | ||||||||||||||||||||||
|
|
|
|
|
| |||||||||||||||||||
Health Care Equipment & Supplies (1.4%) | ||||||||||||||||||||||||
Abbott Laboratories | 24,126 | 97,369 | 121,495 | 924,750 | 3,732,154 | 4,656,904 | ||||||||||||||||||
Baxter International, Inc. | 8,510 | 152,824 | 161,334 | 591,871 | 10,628,909 | 11,220,780 | ||||||||||||||||||
Becton, Dickinson and Co. | 3,031 | 12,221 | 15,252 | 334,895 | 1,350,298 | 1,685,193 | ||||||||||||||||||
Boston Scientific Corp.* | 20,817 | 84,066 | 104,883 | 250,220 | 1,010,473 | 1,260,693 | ||||||||||||||||||
C.R. Bard, Inc. | 1,204 | 4,903 | 6,107 | 161,264 | 656,708 | 817,972 | ||||||||||||||||||
CareFusion Corp.* | 3,212 | 13,303 | 16,515 | 127,902 | 529,726 | 657,628 | ||||||||||||||||||
Covidien plc | 9,395 | 103,661 | 113,056 | 639,799 | 7,059,314 | 7,699,113 | ||||||||||||||||||
DENTSPLY International, Inc. | 2,168 | 8,978 | 11,146 | 105,105 | 435,254 | 540,359 | ||||||||||||||||||
Edwards Lifesciences Corp.* | 1,697 | 6,886 | 8,583 | 111,595 | 452,823 | 564,418 | ||||||||||||||||||
Intuitive Surgical, Inc.* | 642 | 2,396 | 3,038 | 246,579 | 920,256 | 1,166,835 | ||||||||||||||||||
Medtronic, Inc. | 32,616 | 62,870 | 95,486 | 1,871,832 | 3,608,109 | 5,479,941 | ||||||||||||||||||
St. Jude Medical, Inc. | 4,517 | 18,378 | 22,895 | 279,828 | 1,138,517 | 1,418,345 | ||||||||||||||||||
Stryker Corp. | 4,596 | 18,585 | 23,181 | 345,343 | 1,396,477 | 1,741,820 | ||||||||||||||||||
Varian Medical Systems, Inc.* | 1,686 | 6,654 | 8,340 | 130,985 | 516,949 | 647,934 | ||||||||||||||||||
Zimmer Holdings, Inc. | 2,630 | 10,768 | 13,398 | 245,090 | 1,003,470 | 1,248,560 | ||||||||||||||||||
|
|
|
|
|
| |||||||||||||||||||
| 6,367,058 | 34,439,437 | 40,806,495 | ||||||||||||||||||||||
|
|
|
|
|
| |||||||||||||||||||
Health Care Providers & Services (1.5%) | ||||||||||||||||||||||||
Aetna, Inc. | 15,149 | 23,140 | 38,289 | 1,039,070 | 1,587,173 | 2,626,243 | ||||||||||||||||||
AmerisourceBergen Corp. | 3,554 | 14,483 | 18,037 | 249,882 | 1,018,300 | 1,268,182 | ||||||||||||||||||
Cardinal Health, Inc. | 5,299 | 21,506 | 26,805 | 354,026 | 1,436,816 | 1,790,842 | ||||||||||||||||||
Centene Corp.* | — | 50,730 | 50,730 | — | 2,990,533 | 2,990,533 | ||||||||||||||||||
Cigna Corp. | 4,316 | 17,405 | 21,721 | 377,564 | 1,522,589 | 1,900,153 | ||||||||||||||||||
DaVita HealthCare Partners, Inc.* | 2,730 | 11,114 | 13,844 | 173,000 | 704,294 | 877,294 | ||||||||||||||||||
Express Scripts Holding Co.* | 122,824 | 116,851 | 239,675 | 8,627,158 | 8,207,614 | 16,834,772 | ||||||||||||||||||
Health Net, Inc.* | 7,788 | — | 7,788 | 231,070 | — | 231,070 | ||||||||||||||||||
Humana, Inc. | 2,489 | 9,816 | 12,305 | 256,914 | 1,013,208 | 1,270,122 | ||||||||||||||||||
Laboratory Corp. of America Holdings* | 1,325 | 5,501 | 6,826 | 121,065 | 502,626 | 623,691 | ||||||||||||||||||
McKesson Corp. | 3,593 | 14,467 | 18,060 | 579,910 | 2,334,974 | 2,914,884 | ||||||||||||||||||
Molina Healthcare, Inc.* | — | 100,308 | 100,308 | — | 3,485,703 | 3,485,703 | ||||||||||||||||||
Patterson Cos., Inc. | 1,285 | 5,244 | 6,529 | 52,942 | 216,053 | 268,995 | ||||||||||||||||||
Quest Diagnostics, Inc. | 2,289 | 9,154 | 11,443 | 122,553 | 490,105 | 612,658 | ||||||||||||||||||
Tenet Healthcare Corp.* | 1,506 | 6,242 | 7,748 | 63,433 | 262,913 | 326,346 | ||||||||||||||||||
UnitedHealth Group, Inc. | 15,676 | 63,400 | 79,076 | 1,180,403 | 4,774,020 | 5,954,423 | ||||||||||||||||||
WellPoint, Inc. | 5,958 | 18,602 | 24,560 | 550,460 | 1,718,639 | 2,269,099 | ||||||||||||||||||
|
|
|
|
|
| |||||||||||||||||||
| 13,979,450 | 32,265,560 | 46,245,010 | ||||||||||||||||||||||
|
|
|
|
|
| |||||||||||||||||||
See Notes to Pro-forma Combined Financial Statements.
10
| Multimanager Large Cap Core Equity Number of Shares | EQ/Large Cap Core PLUS Number of Shares | Pro-forma Combined Number of Shares | Multimanager (Note 1) | EQ/Large Cap (Note 1) | Pro-forma (Note 1) | |||||||||||||||||||
Health Care | ||||||||||||||||||||||||
Cerner Corp.* | 4,612 | 152,541 | 157,153 | 257,073 | 8,502,635 | 8,759,708 | ||||||||||||||||||
|
|
|
|
|
| |||||||||||||||||||
Life Sciences Tools & Services (0.4%) | ||||||||||||||||||||||||
Agilent Technologies, Inc. | 5,179 | 20,828 | 26,007 | 296,187 | 1,191,153 | 1,487,340 | ||||||||||||||||||
Life Technologies Corp.* | 2,730 | 10,870 | 13,600 | 206,934 | 823,946 | 1,030,880 | ||||||||||||||||||
PerkinElmer, Inc. | 1,666 | 7,078 | 8,744 | 68,689 | 291,826 | 360,515 | ||||||||||||||||||
Thermo Fisher Scientific, Inc. | 60,078 | 22,756 | 82,834 | 6,689,685 | 2,533,881 | 9,223,566 | ||||||||||||||||||
Waters Corp.* | 1,365 | 5,358 | 6,723 | 136,500 | 535,800 | 672,300 | ||||||||||||||||||
|
|
|
|
|
| |||||||||||||||||||
| 7,397,995 | 5,376,606 | 12,774,601 | ||||||||||||||||||||||
|
|
|
|
|
| |||||||||||||||||||
Pharmaceuticals (3.9%) | ||||||||||||||||||||||||
AbbVie, Inc. | 24,826 | 100,190 | 125,016 | 1,311,061 | 5,291,034 | 6,602,095 | ||||||||||||||||||
Actavis plc* | 2,717 | 10,961 | 13,678 | 456,456 | 1,841,448 | 2,297,904 | ||||||||||||||||||
Allergan, Inc. | 18,271 | 18,712 | 36,983 | 2,029,543 | 2,078,529 | 4,108,072 | ||||||||||||||||||
Bristol-Myers Squibb Co. | 51,987 | 311,647 | 363,634 | 2,763,109 | 16,564,038 | 19,327,147 | ||||||||||||||||||
Eli Lilly and Co. | 15,416 | 62,435 | 77,851 | 786,216 | 3,184,185 | 3,970,401 | ||||||||||||||||||
Forest Laboratories, Inc.* | 3,713 | 14,931 | 18,644 | 222,891 | 896,308 | 1,119,199 | ||||||||||||||||||
GlaxoSmithKline plc (ADR) | 12,800 | — | 12,800 | 683,392 | — | 683,392 | ||||||||||||||||||
Hospira, Inc.* | 2,589 | 10,440 | 13,029 | 106,874 | 430,963 | 537,837 | ||||||||||||||||||
Johnson & Johnson | 60,411 | 177,687 | 238,098 | 5,533,044 | 16,274,352 | 21,807,396 | ||||||||||||||||||
Merck & Co., Inc. | 59,769 | 184,013 | 243,782 | 2,991,438 | 9,209,851 | 12,201,289 | ||||||||||||||||||
Mylan, Inc.* | 5,962 | 24,105 | 30,067 | 258,751 | 1,046,157 | 1,304,908 | ||||||||||||||||||
Perrigo Co. plc | 1,990 | 8,378 | 10,368 | 305,385 | 1,285,688 | 1,591,073 | ||||||||||||||||||
Pfizer, Inc. | 160,703 | 849,302 | 1,010,005 | 4,922,333 | 26,014,120 | 30,936,453 | ||||||||||||||||||
Roche Holding AG (ADR) | 7,065 | — | 7,065 | 495,963 | — | 495,963 | ||||||||||||||||||
Roche Holding AG | 11,303 | — | 11,303 | 3,157,567 | — | 3,157,567 | ||||||||||||||||||
Valeant Pharmaceuticals International, Inc.* | 20,695 | — | 20,695 | 2,429,593 | — | 2,429,593 | ||||||||||||||||||
Zoetis, Inc. | 162,154 | 31,481 | 193,635 | 5,300,814 | 1,029,114 | 6,329,928 | ||||||||||||||||||
|
|
|
|
|
| |||||||||||||||||||
| 33,754,430 | 85,145,787 | 118,900,217 | ||||||||||||||||||||||
|
|
|
|
|
| |||||||||||||||||||
Total Health Care | 83,749,903 | 225,385,817 | 309,135,720 | |||||||||||||||||||||
|
|
|
|
|
| |||||||||||||||||||
Industrials (9.0%) | ||||||||||||||||||||||||
Aerospace & | ||||||||||||||||||||||||
B/E Aerospace, Inc.* | — | 70,036 | 70,036 | — | 6,095,233 | 6,095,233 | ||||||||||||||||||
Boeing Co. | 32,586 | 159,023 | 191,609 | 4,447,663 | 21,705,049 | 26,152,712 | ||||||||||||||||||
General Dynamics Corp. | 5,238 | 21,072 | 26,310 | 500,491 | 2,013,430 | 2,513,921 | ||||||||||||||||||
Hexcel Corp.* | — | 153,025 | 153,025 | — | 6,838,687 | 6,838,687 | ||||||||||||||||||
Honeywell International, Inc. | 12,223 | 122,826 | 135,049 | 1,116,815 | 11,222,612 | 12,339,427 | ||||||||||||||||||
L-3 Communications Holdings, Inc. | 1,425 | 5,579 | 7,004 | 152,275 | 596,172 | 748,447 | ||||||||||||||||||
Lockheed Martin Corp. | 4,275 | 16,943 | 21,218 | 635,521 | 2,518,746 | 3,154,267 | ||||||||||||||||||
Northrop Grumman Corp. | 4,739 | 13,978 | 18,717 | 543,137 | 1,602,019 | 2,145,156 | ||||||||||||||||||
Precision Castparts Corp. | 7,135 | 9,147 | 16,282 | 1,921,455 | 2,463,287 | 4,384,742 | ||||||||||||||||||
Raytheon Co. | 5,038 | 20,117 | 25,155 | 456,947 | 1,824,612 | 2,281,559 | ||||||||||||||||||
Rockwell Collins, Inc. | 2,068 | 8,506 | 10,574 | 152,867 | 628,763 | 781,630 | ||||||||||||||||||
Textron, Inc. | 4,335 | 17,698 | 22,033 | 159,355 | 650,578 | 809,933 | ||||||||||||||||||
United Technologies Corp. | 13,206 | 53,162 | 66,368 | 1,502,843 | 6,049,836 | 7,552,679 | ||||||||||||||||||
|
|
|
|
|
| |||||||||||||||||||
| 11,589,369 | 64,209,024 | 75,798,393 | ||||||||||||||||||||||
|
|
|
|
|
| |||||||||||||||||||
Air Freight & | ||||||||||||||||||||||||
C.H. Robinson Worldwide, Inc. | 2,389 | 9,545 | 11,934 | 139,374 | 556,856 | 696,230 | ||||||||||||||||||
Expeditors International of Washington, Inc. | 3,211 | 12,941 | 16,152 | 142,087 | 572,639 | 714,726 | ||||||||||||||||||
FedEx Corp. | 4,696 | 18,743 | 23,439 | 675,144 | 2,694,681 | 3,369,825 | ||||||||||||||||||
United Parcel Service, Inc., Class B. | 11,159 | 45,016 | 56,175 | 1,172,588 | 4,730,281 | 5,902,869 | ||||||||||||||||||
|
|
|
|
|
| |||||||||||||||||||
| 2,129,193 | 8,554,457 | 10,683,650 | ||||||||||||||||||||||
|
|
|
|
|
| |||||||||||||||||||
See Notes to Pro-forma Combined Financial Statements.
11
| Multimanager Large Cap Core Equity Number of Shares | EQ/Large Cap Core PLUS Number of Shares | Pro-forma Combined Number of Shares | Multimanager (Note 1) | EQ/Large Cap (Note 1) | Pro-forma (Note 1) | |||||||||||||||||||
Airlines (0.2%) | ||||||||||||||||||||||||
American Airlines | 104,000 | — | 104,000 | 2,626,000 | — | 2,626,000 | ||||||||||||||||||
Delta Air Lines, Inc. | 23,731 | 53,871 | 77,602 | 651,891 | 1,479,836 | 2,131,727 | ||||||||||||||||||
Southwest Airlines Co. | 10,881 | 43,863 | 54,744 | 204,998 | 826,379 | 1,031,377 | ||||||||||||||||||
|
|
|
|
|
| |||||||||||||||||||
| 3,482,889 | 2,306,215 | 5,789,104 | ||||||||||||||||||||||
|
|
|
|
|
| |||||||||||||||||||
Building Products (0.0%) | ||||||||||||||||||||||||
Allegion plc* | 1,372 | 5,619 | 6,991 | 60,629 | 248,289 | 308,918 | ||||||||||||||||||
Masco Corp. | 5,559 | 22,469 | 28,028 | 126,578 | 511,619 | 638,197 | ||||||||||||||||||
|
|
|
|
|
| |||||||||||||||||||
| 187,207 | 759,908 | 947,115 | ||||||||||||||||||||||
|
|
|
|
|
| |||||||||||||||||||
Commercial Services & | ||||||||||||||||||||||||
ADT Corp. | 84,375 | 12,588 | 96,963 | 3,414,656 | 509,436 | 3,924,092 | ||||||||||||||||||
ARAMARK Holdings Corp.* | 112,732 | — | 112,732 | 2,955,833 | — | 2,955,833 | ||||||||||||||||||
Cintas Corp. | 1,546 | 6,337 | 7,883 | 92,126 | 377,622 | 469,748 | ||||||||||||||||||
Covanta Holding Corp. | 110,700 | — | 110,700 | 1,964,925 | — | 1,964,925 | ||||||||||||||||||
Iron Mountain, Inc. | 2,591 | 180,344 | 182,935 | 78,637 | 5,473,441 | 5,552,078 | ||||||||||||||||||
Pitney Bowes, Inc. | 3,091 | 12,709 | 15,800 | 72,021 | 296,120 | 368,141 | ||||||||||||||||||
Republic Services, Inc. | 4,176 | 17,000 | 21,176 | 138,643 | 564,400 | 703,043 | ||||||||||||||||||
Stericycle, Inc.* | 1,325 | 5,395 | 6,720 | 153,925 | 626,737 | 780,662 | ||||||||||||||||||
Tyco International Ltd. | 7,261 | 29,304 | 36,565 | 297,992 | 1,202,636 | 1,500,628 | ||||||||||||||||||
Waste Connections, Inc. | — | 102,263 | 102,263 | — | 4,461,735 | 4,461,735 | ||||||||||||||||||
Waste Management, Inc. | 6,744 | 27,474 | 34,218 | 302,603 | 1,232,758 | 1,535,361 | ||||||||||||||||||
|
|
|
|
|
| |||||||||||||||||||
| 9,471,361 | 14,744,885 | 24,216,246 | ||||||||||||||||||||||
|
|
|
|
|
| |||||||||||||||||||
Construction & | ||||||||||||||||||||||||
Fluor Corp. | 2,569 | 10,284 | 12,853 | 206,265 | 825,703 | 1,031,968 | ||||||||||||||||||
Jacobs Engineering Group, Inc.* | 2,007 | 8,290 | 10,297 | 126,421 | 522,187 | 648,608 | ||||||||||||||||||
Quanta Services, Inc.* | 3,292 | 13,595 | 16,887 | 103,896 | 429,058 | 532,954 | ||||||||||||||||||
|
|
|
|
|
| |||||||||||||||||||
| 436,582 | 1,776,948 | 2,213,530 | ||||||||||||||||||||||
|
|
|
|
|
| |||||||||||||||||||
Electrical | ||||||||||||||||||||||||
AMETEK, Inc. | 3,787 | 15,409 | 19,196 | 199,461 | 811,592 | 1,011,053 | ||||||||||||||||||
Eaton Corp. plc | 7,446 | 169,149 | 176,595 | 566,790 | 12,875,622 | 13,442,412 | ||||||||||||||||||
Emerson Electric Co. | 10,940 | 44,330 | 55,270 | 767,769 | 3,111,080 | 3,878,849 | ||||||||||||||||||
Polypore International, Inc.* | — | 138,819 | 138,819 | — | 5,400,059 | 5,400,059 | ||||||||||||||||||
Rockwell Automation, Inc. | 2,168 | 8,731 | 10,899 | 256,171 | 1,031,655 | 1,287,826 | ||||||||||||||||||
Roper Industries, Inc. | 1,525 | 6,252 | 7,777 | 211,487 | 867,027 | 1,078,514 | ||||||||||||||||||
|
|
|
|
|
| |||||||||||||||||||
| 2,001,678 | 24,097,035 | 26,098,713 | ||||||||||||||||||||||
|
|
|
|
|
| |||||||||||||||||||
Industrial | ||||||||||||||||||||||||
3M Co. | 11,375 | 40,279 | 51,654 | 1,595,344 | 5,649,130 | 7,244,474 | ||||||||||||||||||
Danaher Corp. | 9,372 | 127,789 | 137,161 | 723,518 | 9,865,311 | 10,588,829 | ||||||||||||||||||
General Electric Co. | 209,942 | 1,145,617 | 1,355,559 | 5,884,674 | 32,111,644 | 37,996,318 | ||||||||||||||||||
|
|
|
|
|
| |||||||||||||||||||
| 8,203,536 | 47,626,085 | 55,829,621 | ||||||||||||||||||||||
|
|
|
|
|
| |||||||||||||||||||
Machinery (1.1%) | ||||||||||||||||||||||||
Caterpillar, Inc. | 9,916 | 77,485 | 87,401 | 900,472 | 7,036,413 | 7,936,885 | ||||||||||||||||||
Cummins, Inc. | 2,730 | 10,972 | 13,702 | 384,848 | 1,546,723 | 1,931,571 | ||||||||||||||||||
Deere & Co. | 6,002 | 24,108 | 30,110 | 548,163 | 2,201,784 | 2,749,947 | ||||||||||||||||||
Dover Corp. | 2,710 | 10,726 | 13,436 | 261,623 | 1,035,488 | 1,297,111 | ||||||||||||||||||
Flowserve Corp. | 2,209 | 8,780 | 10,989 | 174,136 | 692,127 | 866,263 | ||||||||||||||||||
IDEX Corp. | — | 64,737 | 64,737 | — | 4,780,827 | 4,780,827 | ||||||||||||||||||
Illinois Tool Works, Inc. | 17,372 | 25,713 | 43,085 | 1,460,638 | 2,161,949 | 3,622,587 | ||||||||||||||||||
Ingersoll-Rand plc | 5,581 | 16,868 | 22,449 | 343,790 | 1,039,069 | 1,382,859 | ||||||||||||||||||
Joy Global, Inc. | 1,615 | 6,688 | 8,303 | 94,461 | 391,181 | 485,642 | ||||||||||||||||||
PACCAR, Inc. | 5,559 | 22,295 | 27,854 | 328,926 | 1,319,195 | 1,648,121 | ||||||||||||||||||
Pall Corp. | 1,766 | 6,974 | 8,740 | 150,728 | 595,231 | 745,959 | ||||||||||||||||||
Parker Hannifin Corp. | 3,091 | 9,396 | 12,487 | 397,626 | 1,208,701 | 1,606,327 | ||||||||||||||||||
Pentair Ltd. (Registered) | 3,149 | 12,550 | 15,699 | 244,583 | 974,759 | 1,219,342 | ||||||||||||||||||
Snap-on, Inc. | 883 | 3,660 | 4,543 | 96,706 | 400,843 | 497,549 | ||||||||||||||||||
Stanley Black & Decker, Inc. | 2,431 | 9,772 | 12,203 | 196,157 | 788,503 | 984,660 | ||||||||||||||||||
Xylem, Inc. | 2,810 | 11,611 | 14,421 | 97,226 | 401,741 | 498,967 | ||||||||||||||||||
|
|
|
|
|
| |||||||||||||||||||
| 5,680,083 | 26,574,534 | 32,254,617 | ||||||||||||||||||||||
|
|
|
|
|
| |||||||||||||||||||
See Notes to Pro-forma Combined Financial Statements.
12
| Multimanager Large Cap Core Equity Number of Shares | EQ/Large Cap Core PLUS Number of Shares | Pro-forma Combined Number of Shares | Multimanager (Note 1) | EQ/Large Cap (Note 1) | Pro-forma (Note 1) | |||||||||||||||||||
Professional Services (0.5%) | ||||||||||||||||||||||||
Dun & Bradstreet Corp. | 623 | 2,401 | 3,024 | 76,473 | 294,722 | 371,195 | ||||||||||||||||||
Equifax, Inc. | 1,847 | 7,664 | 9,511 | 127,609 | 529,506 | 657,115 | ||||||||||||||||||
Nielsen Holdings N.V. | 45,274 | 150,035 | 195,309 | 2,077,624 | 6,885,106 | 8,962,730 | ||||||||||||||||||
Robert Half International, Inc. | 2,128 | 8,722 | 10,850 | 89,355 | 366,237 | 455,592 | ||||||||||||||||||
Towers Watson & Co., Class A | — | 44,700 | 44,700 | — | 5,704,167 | 5,704,167 | ||||||||||||||||||
|
|
|
|
|
| |||||||||||||||||||
| 2,371,061 | 13,779,738 | 16,150,799 | ||||||||||||||||||||||
|
|
|
|
|
| |||||||||||||||||||
Road & Rail (0.6%) | ||||||||||||||||||||||||
CSX Corp. | 15,757 | 63,830 | 79,587 | 453,329 | 1,836,389 | 2,289,718 | ||||||||||||||||||
Kansas City Southern | 1,710 | 6,938 | 8,648 | 211,749 | 859,133 | 1,070,882 | ||||||||||||||||||
Norfolk Southern Corp. | 4,878 | 39,836 | 44,714 | 452,825 | 3,697,976 | 4,150,801 | ||||||||||||||||||
Ryder System, Inc. | 803 | 3,312 | 4,115 | 59,245 | 244,359 | 303,604 | ||||||||||||||||||
Union Pacific Corp. | 24,543 | 29,004 | 53,547 | 4,123,224 | 4,872,672 | 8,995,896 | ||||||||||||||||||
|
|
|
|
|
| |||||||||||||||||||
| 5,300,372 | 11,510,529 | 16,810,901 | ||||||||||||||||||||||
|
|
|
|
|
| |||||||||||||||||||
Trading Companies & Distributors (0.1%) | ||||||||||||||||||||||||
Fastenal Co. | 4,275 | 17,187 | 21,462 | 203,105 | 816,554 | 1,019,659 | ||||||||||||||||||
Fly Leasing Ltd. (ADR) | 69,588 | — | 69,588 | 1,118,279 | — | 1,118,279 | ||||||||||||||||||
W.W. Grainger, Inc. | 963 | 3,890 | 4,853 | 245,970 | 993,584 | 1,239,554 | ||||||||||||||||||
|
|
|
|
|
| |||||||||||||||||||
| 1,567,354 | 1,810,138 | 3,377,492 | ||||||||||||||||||||||
|
|
|
|
|
| |||||||||||||||||||
Total Industrials | 52,420,685 | 217,749,496 | 270,170,181 | |||||||||||||||||||||
|
|
|
|
|
| |||||||||||||||||||
Information | ||||||||||||||||||||||||
Communications Equipment (1.0%) | ||||||||||||||||||||||||
Cisco Systems, Inc. | 105,970 | 578,259 | 684,229 | 2,379,027 | 12,981,915 | 15,360,942 | ||||||||||||||||||
F5 Networks, Inc.* | 1,204 | 4,884 | 6,088 | 109,395 | 443,760 | 553,155 | ||||||||||||||||||
Harris Corp. | 10,666 | 6,727 | 17,393 | 744,593 | 469,612 | 1,214,205 | ||||||||||||||||||
Juniper Networks, Inc.* | 7,809 | 31,791 | 39,600 | 176,249 | 717,523 | 893,772 | ||||||||||||||||||
Motorola Solutions, Inc. | 3,592 | 14,497 | 18,089 | 242,460 | 978,547 | 1,221,007 | ||||||||||||||||||
QUALCOMM, Inc. | 49,355 | 106,394 | 155,749 | 3,664,609 | 7,899,754 | 11,564,363 | ||||||||||||||||||
|
|
|
|
|
| |||||||||||||||||||
| 7,316,333 | 23,491,111 | 30,807,444 | ||||||||||||||||||||||
|
|
|
|
|
| |||||||||||||||||||
Computers & | ||||||||||||||||||||||||
Apple, Inc. | 33,580 | 82,112 | 115,692 | 18,842,074 | 46,073,864 | 64,915,938 | ||||||||||||||||||
EMC Corp. | 32,115 | 129,588 | 161,703 | 807,692 | 3,259,138 | 4,066,830 | ||||||||||||||||||
Hewlett-Packard Co. | 74,624 | 121,024 | 195,648 | 2,087,979 | 3,386,252 | 5,474,231 | ||||||||||||||||||
NetApp, Inc. | 5,320 | 21,457 | 26,777 | 218,865 | 882,741 | 1,101,606 | ||||||||||||||||||
SanDisk Corp. | 3,493 | 14,222 | 17,715 | 246,396 | 1,003,220 | 1,249,616 | ||||||||||||||||||
Seagate Technology plc | 5,119 | 20,540 | 25,659 | 287,483 | 1,153,526 | 1,441,009 | ||||||||||||||||||
Western Digital Corp. | 3,252 | 80,083 | 83,335 | 272,843 | 6,718,964 | 6,991,807 | ||||||||||||||||||
|
|
|
|
|
| |||||||||||||||||||
| 22,763,332 | 62,477,705 | 85,241,037 | ||||||||||||||||||||||
|
|
|
|
|
| |||||||||||||||||||
Electronic Equipment, Instruments & Components (0.6%) | ||||||||||||||||||||||||
Amphenol Corp., Class A | 33,777 | 9,965 | 43,742 | 3,012,233 | 888,679 | 3,900,912 | ||||||||||||||||||
Arrow Electronics, Inc.* | 8,189 | — | 8,189 | 444,253 | — | 444,253 | ||||||||||||||||||
CDW Corp. | 85,000 | — | 85,000 | 1,985,600 | — | 1,985,600 | ||||||||||||||||||
Corning, Inc. | 22,541 | 91,127 | 113,668 | 401,681 | 1,623,883 | 2,025,564 | ||||||||||||||||||
FLIR Systems, Inc. | 2,128 | 8,912 | 11,040 | 64,053 | 268,251 | 332,304 | ||||||||||||||||||
Jabil Circuit, Inc. | 2,790 | 200,413 | 203,203 | 48,658 | 3,495,203 | 3,543,861 | ||||||||||||||||||
TE Connectivity Ltd. | 60,659 | 25,839 | 86,498 | 3,342,917 | 1,423,987 | 4,766,904 | ||||||||||||||||||
|
|
|
|
|
| |||||||||||||||||||
| 9,299,395 | 7,700,003 | 16,999,398 | ||||||||||||||||||||||
|
|
|
|
|
| |||||||||||||||||||
Internet Software & Services (2.5%) | ||||||||||||||||||||||||
Akamai Technologies, Inc.* | 2,730 | 11,272 | 14,002 | 128,801 | 531,813 | 660,614 | ||||||||||||||||||
eBay, Inc.* | 38,893 | 73,373 | 112,266 | 2,134,837 | 4,027,444 | 6,162,281 | ||||||||||||||||||
Facebook, Inc., Class A* | 74,877 | 103,583 | 178,460 | 4,092,777 | 5,661,847 | 9,754,624 | ||||||||||||||||||
Google, Inc., Class A* | 13,193 | 23,812 | 37,005 | 14,785,527 | 26,686,346 | 41,471,873 | ||||||||||||||||||
Marin Software, Inc.* | 40,500 | — | 40,500 | 414,720 | — | 414,720 | ||||||||||||||||||
Twitter, Inc.* | — | 21,500 | 21,500 | — | 1,368,475 | 1,368,475 | ||||||||||||||||||
VeriSign, Inc.* | 74,324 | 157,382 | 231,706 | 4,443,089 | 9,408,296 | 13,851,385 | ||||||||||||||||||
Yahoo!, Inc.* | 14,737 | 59,409 | 74,146 | 595,964 | 2,402,500 | 2,998,464 | ||||||||||||||||||
|
|
|
|
|
| |||||||||||||||||||
| 26,595,715 | 50,086,721 | 76,682,436 | ||||||||||||||||||||||
|
|
|
|
|
| |||||||||||||||||||
See Notes to Pro-forma Combined Financial Statements.
13
| Multimanager Large Cap Core Equity Number of Shares | EQ/Large Cap Core PLUS Number of Shares | Pro-forma Combined Number of Shares | Multimanager (Note 1) | EQ/Large Cap (Note 1) | Pro-forma (Note 1) | |||||||||||||||||||
IT Services (2.1%) | ||||||||||||||||||||||||
Accenture plc, Class A | 9,911 | 66,486 | 76,397 | 814,882 | 5,466,479 | 6,281,361 | ||||||||||||||||||
Alliance Data Systems Corp.* | 800 | 3,068 | 3,868 | 210,344 | 806,669 | 1,017,013 | ||||||||||||||||||
Amdocs Ltd. | 9,072 | — | 9,072 | 374,129 | — | 374,129 | ||||||||||||||||||
Automatic Data Processing, Inc. | 7,566 | 30,316 | 37,882 | 611,409 | 2,449,836 | 3,061,245 | ||||||||||||||||||
Cognizant Technology Solutions Corp., Class A* | 4,756 | 19,051 | 23,807 | 480,261 | 1,923,770 | 2,404,031 | ||||||||||||||||||
Computer Sciences Corp. | 2,228 | 9,266 | 11,494 | 124,501 | 517,784 | 642,285 | ||||||||||||||||||
Fidelity National Information Services, Inc. | 4,554 | 18,330 | 22,884 | 244,459 | 983,955 | 1,228,414 | ||||||||||||||||||
Fiserv, Inc.* | 4,174 | 16,245 | 20,419 | 246,475 | 959,267 | 1,205,742 | ||||||||||||||||||
International Business Machines Corp. | 19,351 | 64,281 | 83,632 | 3,629,667 | 12,057,187 | 15,686,854 | ||||||||||||||||||
Jack Henry & Associates, Inc. | — | 67,659 | 67,659 | — | 4,006,089 | 4,006,089 | ||||||||||||||||||
MasterCard, Inc., Class A | 4,999 | 6,520 | 11,519 | 4,176,465 | 5,447,199 | 9,623,664 | ||||||||||||||||||
Paychex, Inc. | 5,078 | 20,463 | 25,541 | 231,201 | 931,681 | 1,162,882 | ||||||||||||||||||
Teradata Corp.* | 2,549 | 10,284 | 12,833 | 115,954 | 467,819 | 583,773 | ||||||||||||||||||
Total System Services, Inc. | 2,589 | 10,509 | 13,098 | 86,162 | 349,740 | 435,902 | ||||||||||||||||||
Visa, Inc., Class A | 7,993 | 62,118 | 70,111 | 1,779,881 | 13,832,436 | 15,612,317 | ||||||||||||||||||
Western Union Co. | 8,613 | 34,763 | 43,376 | 148,574 | 599,662 | 748,236 | ||||||||||||||||||
|
|
|
|
|
| |||||||||||||||||||
| 13,274,364 | 50,799,573 | 64,073,937 | ||||||||||||||||||||||
|
|
|
|
|
| |||||||||||||||||||
Office Electronics (0.1%) | ||||||||||||||||||||||||
Xerox Corp. | 84,115 | 72,858 | 156,973 | 1,023,680 | 886,682 | 1,910,362 | ||||||||||||||||||
|
|
|
|
|
| |||||||||||||||||||
Semiconductors & Semiconductor Equipment (1.9%) | ||||||||||||||||||||||||
Altera Corp. | 4,997 | 20,224 | 25,221 | 162,552 | 657,887 | 820,439 | ||||||||||||||||||
Analog Devices, Inc. | 4,876 | 19,584 | 24,460 | 248,335 | 997,413 | 1,245,748 | ||||||||||||||||||
Applied Materials, Inc. | 52,107 | 75,821 | 127,928 | 921,773 | 1,341,273 | 2,263,046 | ||||||||||||||||||
ARM Holdings plc (ADR) | 28,642 | — | 28,642 | 1,567,863 | — | 1,567,863 | ||||||||||||||||||
ASML Holding N.V. | — | 46,941 | 46,941 | — | 4,398,372 | 4,398,372 | ||||||||||||||||||
Avago Technologies Ltd. | — | 80,900 | 80,900 | — | 4,278,801 | 4,278,801 | ||||||||||||||||||
Broadcom Corp., Class A | 8,348 | 272,820 | 281,168 | 247,518 | 8,089,113 | 8,336,631 | ||||||||||||||||||
First Solar, Inc.* | 1,083 | 4,446 | 5,529 | 59,175 | 242,929 | 302,104 | ||||||||||||||||||
Intel Corp. | 77,622 | 313,055 | 390,677 | 2,015,067 | 8,126,908 | 10,141,975 | ||||||||||||||||||
KLA-Tencor Corp. | 2,569 | 10,495 | 13,064 | 165,598 | 676,508 | 842,106 | ||||||||||||||||||
Lam Research Corp.* | 4,812 | 10,222 | 15,034 | 262,013 | 556,588 | 818,601 | ||||||||||||||||||
Linear Technology Corp. | 3,632 | 14,747 | 18,379 | 165,438 | 671,726 | 837,164 | ||||||||||||||||||
LSI Corp. | 8,490 | 34,294 | 42,784 | 93,560 | 377,920 | 471,480 | ||||||||||||||||||
Microchip Technology, Inc. | 3,070 | 12,493 | 15,563 | 137,382 | 559,062 | 696,444 | ||||||||||||||||||
Micron Technology, Inc.* | 30,836 | 66,244 | 97,080 | 670,991 | 1,441,469 | 2,112,460 | ||||||||||||||||||
NVIDIA Corp. | 8,954 | 36,421 | 45,375 | 143,443 | 583,464 | 726,907 | ||||||||||||||||||
ON Semiconductor Corp.* | — | 472,254 | 472,254 | — | 3,891,373 | 3,891,373 | ||||||||||||||||||
Texas Instruments, Inc. | 17,082 | 239,715 | 256,797 | 750,071 | 10,525,886 | 11,275,957 | ||||||||||||||||||
Xilinx, Inc. | 4,114 | 16,898 | 21,012 | 188,915 | 775,956 | 964,871 | ||||||||||||||||||
|
|
|
|
|
| |||||||||||||||||||
| 7,799,694 | 48,192,648 | 55,992,342 | ||||||||||||||||||||||
|
|
|
|
|
| |||||||||||||||||||
Software (2.6%) | ||||||||||||||||||||||||
Activision Blizzard, Inc. | 194,206 | — | 194,206 | 3,462,693 | — | 3,462,693 | ||||||||||||||||||
Adobe Systems, Inc.* | 7,247 | 29,274 | 36,521 | 433,951 | 1,752,927 | 2,186,878 | ||||||||||||||||||
Autodesk, Inc.* | 3,452 | 14,208 | 17,660 | 173,739 | 715,089 | 888,828 | ||||||||||||||||||
CA, Inc. | 4,999 | 20,454 | 25,453 | 168,216 | 688,277 | 856,493 | ||||||||||||||||||
Citrix Systems, Inc.* | 2,890 | 11,734 | 14,624 | 182,793 | 742,176 | 924,969 | ||||||||||||||||||
Electronic Arts, Inc.* | 35,797 | 19,468 | 55,265 | 821,183 | 446,596 | 1,267,779 | ||||||||||||||||||
Intuit, Inc. | 33,448 | 17,936 | 51,384 | 2,552,751 | 1,368,876 | 3,921,627 | ||||||||||||||||||
Microsoft Corp. | 217,747 | 478,418 | 696,165 | 8,150,270 | 17,907,186 | 26,057,456 | ||||||||||||||||||
Oracle Corp. | 76,008 | 691,209 | 767,217 | 2,908,066 | 26,445,656 | 29,353,722 | ||||||||||||||||||
Red Hat, Inc.* | 2,970 | 11,929 | 14,899 | 166,439 | 668,501 | 834,940 | ||||||||||||||||||
Salesforce.com, Inc.* | 8,628 | 34,938 | 43,566 | 476,179 | 1,928,228 | 2,404,407 | ||||||||||||||||||
Symantec Corp. | 17,938 | 228,573 | 246,511 | 422,978 | 5,389,751 | 5,812,729 | ||||||||||||||||||
Workday, Inc., Class A* | — | 22,602 | 22,602 | — | 1,879,582 | 1,879,582 | ||||||||||||||||||
|
|
|
|
|
| |||||||||||||||||||
| 19,919,258 | 59,932,845 | 79,852,103 | ||||||||||||||||||||||
|
|
|
|
|
| |||||||||||||||||||
Total Information Technology | 107,991,771 | 303,567,288 | 411,559,059 | |||||||||||||||||||||
|
|
|
|
|
| |||||||||||||||||||
See Notes to Pro-forma Combined Financial Statements.
14
| Multimanager Large Cap Core Equity Number of Shares | EQ/Large Cap Core PLUS Number of Shares | Pro-forma Combined Number of Shares | Multimanager (Note 1) | EQ/Large Cap (Note 1) | Pro-forma (Note 1) | |||||||||||||||||||
Materials (2.8%) | ||||||||||||||||||||||||
Chemicals (2.1%) | ||||||||||||||||||||||||
Air Products and Chemicals, Inc. | 3,292 | 29,327 | 32,619 | 367,980 | 3,278,172 | 3,646,152 | ||||||||||||||||||
Airgas, Inc. | 1,024 | 4,180 | 5,204 | 114,534 | 467,533 | 582,067 | ||||||||||||||||||
CF Industries Holdings, Inc. | 963 | 3,608 | 4,571 | 224,418 | 840,808 | 1,065,226 | ||||||||||||||||||
Dow Chemical Co. | 18,946 | 76,378 | 95,324 | 841,202 | 3,391,183 | 4,232,385 | ||||||||||||||||||
E.I. du Pont de Nemours & Co. | 46,939 | 58,320 | 105,259 | 3,049,627 | 3,789,051 | 6,838,678 | ||||||||||||||||||
Eastman Chemical Co. | 2,428 | 9,690 | 12,118 | 195,940 | 781,983 | 977,923 | ||||||||||||||||||
Ecolab, Inc. | 4,262 | 17,075 | 21,337 | 444,399 | 1,780,410 | 2,224,809 | ||||||||||||||||||
FMC Corp. | 2,087 | 8,390 | 10,477 | 157,485 | 633,109 | 790,594 | ||||||||||||||||||
International Flavors & Fragrances, Inc. | 1,285 | 5,130 | 6,415 | 110,484 | 441,077 | 551,561 | ||||||||||||||||||
LyondellBasell Industries N.V., Class A. | 70,474 | 94,505 | 164,979 | 5,657,653 | 7,586,862 | 13,244,515 | ||||||||||||||||||
Monsanto Co. | 8,269 | 128,659 | 136,928 | 963,752 | 14,995,207 | 15,958,959 | ||||||||||||||||||
Mosaic Co. | 5,255 | 81,206 | 86,461 | 248,404 | 3,838,608 | 4,087,012 | ||||||||||||||||||
PPG Industries, Inc. | 2,209 | 8,943 | 11,152 | 418,959 | 1,696,129 | 2,115,088 | ||||||||||||||||||
Praxair, Inc. | 4,656 | 18,536 | 23,192 | 605,420 | 2,410,236 | 3,015,656 | ||||||||||||||||||
Sherwin-Williams Co. | 1,365 | 5,423 | 6,788 | 250,477 | 995,121 | 1,245,598 | ||||||||||||||||||
Sigma-Aldrich Corp. | 1,847 | 7,533 | 9,380 | 173,636 | 708,177 | 881,813 | ||||||||||||||||||
Syngenta AG (ADR) | 10,094 | — | 10,094 | 806,914 | — | 806,914 | ||||||||||||||||||
|
|
|
|
|
| |||||||||||||||||||
| 14,631,284 | 47,633,666 | 62,264,950 | ||||||||||||||||||||||
|
|
|
|
|
| |||||||||||||||||||
Construction Materials (0.0%) | ||||||||||||||||||||||||
Vulcan Materials Co. | 2,007 | 8,182 | 10,189 | 119,256 | 486,174 | 605,430 | ||||||||||||||||||
|
|
|
|
|
| |||||||||||||||||||
Containers & Packaging (0.1%) | ||||||||||||||||||||||||
Avery Dennison Corp. | 1,466 | 6,079 | 7,545 | 73,579 | 305,105 | 378,684 | ||||||||||||||||||
Ball Corp. | 2,209 | 9,103 | 11,312 | 114,117 | 470,261 | 584,378 | ||||||||||||||||||
Bemis Co., Inc. | 1,525 | 6,476 | 8,001 | 62,464 | 265,257 | 327,721 | ||||||||||||||||||
MeadWestvaco Corp. | 2,749 | 11,195 | 13,944 | 101,521 | 413,431 | 514,952 | ||||||||||||||||||
Owens-Illinois, Inc.* | 2,489 | 10,391 | 12,880 | 89,056 | 371,790 | 460,846 | ||||||||||||||||||
Sealed Air Corp. | 3,049 | 12,346 | 15,395 | 103,818 | 420,381 | 524,199 | ||||||||||||||||||
|
|
|
|
|
| |||||||||||||||||||
| 544,555 | 2,246,225 | 2,790,780 | ||||||||||||||||||||||
|
|
|
|
|
| |||||||||||||||||||
Metals & Mining (0.5%) | ||||||||||||||||||||||||
Alcoa, Inc. | 16,658 | 67,334 | 83,992 | 177,075 | 715,761 | 892,836 | ||||||||||||||||||
Allegheny Technologies, Inc. | 1,606 | 96,879 | 98,485 | 57,222 | 3,451,799 | 3,509,021 | ||||||||||||||||||
Barrick Gold Corp. | — | 72,756 | 72,756 | — | 1,282,688 | 1,282,688 | ||||||||||||||||||
Cliffs Natural Resources, Inc. | 2,368 | 40,524 | 42,892 | 62,065 | 1,062,134 | 1,124,199 | ||||||||||||||||||
Freeport-McMoRan Copper & Gold, Inc. | 16,192 | 101,026 | 117,218 | 611,086 | 3,812,721 | 4,423,807 | ||||||||||||||||||
Newmont Mining Corp. | 7,707 | 31,343 | 39,050 | 177,492 | 721,829 | 899,321 | ||||||||||||||||||
Nucor Corp. | 4,997 | 56,145 | 61,142 | 266,740 | 2,997,020 | 3,263,760 | ||||||||||||||||||
United States Steel Corp. | 2,168 | 9,101 | 11,269 | 63,956 | 268,480 | 332,436 | ||||||||||||||||||
|
|
|
|
|
| |||||||||||||||||||
| 1,415,636 | 14,312,432 | 15,728,068 | ||||||||||||||||||||||
|
|
|
|
|
| |||||||||||||||||||
Paper & Forest Products (0.1%) | ||||||||||||||||||||||||
International Paper Co. | 6,944 | 27,933 | 34,877 | 340,464 | 1,369,555 | 1,710,019 | ||||||||||||||||||
|
|
|
|
|
| |||||||||||||||||||
Total Materials | 17,051,195 | 66,048,052 | 83,099,247 | |||||||||||||||||||||
|
|
|
|
|
| |||||||||||||||||||
Telecommunication Services (1.9%) | ||||||||||||||||||||||||
Diversified Telecommunication | ||||||||||||||||||||||||
AT&T, Inc. | 107,147 | 331,763 | 438,910 | 3,767,288 | 11,664,787 | 15,432,075 | ||||||||||||||||||
CenturyLink, Inc. | 9,141 | 75,641 | 84,782 | 291,141 | 2,409,166 | 2,700,307 | ||||||||||||||||||
Frontier Communications Corp. | 15,519 | 62,892 | 78,411 | 72,163 | 292,448 | 364,611 | ||||||||||||||||||
Level 3 Communications, Inc.* | 122,160 | — | 122,160 | 4,052,047 | — | 4,052,047 | ||||||||||||||||||
Verizon Communications, Inc. | 44,656 | 276,823 | 321,479 | 2,194,396 | 13,603,082 | 15,797,478 | ||||||||||||||||||
Windstream Holdings, Inc. | 9,272 | 37,540 | 46,812 | 73,991 | 299,569 | 373,560 | ||||||||||||||||||
|
|
|
|
|
| |||||||||||||||||||
| 10,451,026 | 28,269,052 | 38,720,078 | ||||||||||||||||||||||
|
|
|
|
|
| |||||||||||||||||||
See Notes to Pro-forma Combined Financial Statements.
15
| Multimanager Large Cap Core Equity Number of Shares | EQ/Large Cap Core PLUS Number of Shares | Pro-forma Combined Number of Shares | Multimanager (Note 1) | EQ/Large Cap (Note 1) | Pro-forma (Note 1) | |||||||||||||||||||
Wireless Telecommunication Services (0.6%) | ||||||||||||||||||||||||
China Mobile Ltd. | 203,999 | — | 203,999 | 2,115,152 | — | 2,115,152 | ||||||||||||||||||
Crown Castle International Corp.* | 5,236 | 21,039 | 26,275 | 384,479 | 1,544,894 | 1,929,373 | ||||||||||||||||||
SoftBank Corp. | 20,685 | — | 20,685 | 1,807,065 | — | 1,807,065 | ||||||||||||||||||
Sprint Corp.* | 160,638 | — | 160,638 | 1,726,859 | — | 1,726,859 | ||||||||||||||||||
Vodafone Group plc (ADR) | 18,100 | 266,368 | 284,468 | 711,511 | 10,470,926 | 11,182,437 | ||||||||||||||||||
|
|
|
|
|
| |||||||||||||||||||
| 6,745,066 | 12,015,820 | 18,760,886 | ||||||||||||||||||||||
|
|
|
|
|
| |||||||||||||||||||
Total Telecommunication Services | 17,196,092 | 40,284,872 | 57,480,964 | |||||||||||||||||||||
|
|
|
|
|
| |||||||||||||||||||
Utilities (1.9%) | ||||||||||||||||||||||||
Electric Utilities (1.1%) | ||||||||||||||||||||||||
American Electric Power Co., Inc. | 11,566 | 30,683 | 42,249 | 540,595 | 1,434,123 | 1,974,718 | ||||||||||||||||||
Duke Energy Corp. | 11,052 | 44,458 | 55,510 | 762,699 | 3,068,047 | 3,830,746 | ||||||||||||||||||
Edison International | 20,558 | 71,713 | 92,271 | 951,835 | 3,320,312 | 4,272,147 | ||||||||||||||||||
Entergy Corp. | 2,730 | 11,226 | 13,956 | 172,727 | 710,269 | 882,996 | ||||||||||||||||||
Exelon Corp. | 67,680 | 226,307 | 293,987 | 1,853,755 | 6,198,549 | 8,052,304 | ||||||||||||||||||
FirstEnergy Corp. | 6,523 | 26,331 | 32,854 | 215,129 | 868,396 | 1,083,525 | ||||||||||||||||||
ITC Holdings Corp. | 16,000 | — | 16,000 | 1,533,120 | — | 1,533,120 | ||||||||||||||||||
NextEra Energy, Inc. | 6,683 | 27,124 | 33,807 | 572,198 | 2,322,357 | 2,894,555 | ||||||||||||||||||
Northeast Utilities | 4,833 | 19,838 | 24,671 | 204,871 | 840,933 | 1,045,804 | ||||||||||||||||||
Pepco Holdings, Inc. | 3,832 | 15,729 | 19,561 | 73,306 | 300,896 | 374,202 | ||||||||||||||||||
Pinnacle West Capital Corp. | 1,686 | 6,925 | 8,611 | 89,223 | 366,471 | 455,694 | ||||||||||||||||||
PPL Corp. | 9,792 | 39,683 | 49,475 | 294,641 | 1,194,061 | 1,488,702 | ||||||||||||||||||
Southern Co. | 13,768 | 55,531 | 69,299 | 566,003 | 2,282,879 | 2,848,882 | ||||||||||||||||||
Xcel Energy, Inc. | 7,747 | 31,331 | 39,078 | 216,451 | 875,388 | 1,091,839 | ||||||||||||||||||
|
|
|
|
|
| |||||||||||||||||||
| 8,046,553 | 23,782,681 | 31,829,234 | ||||||||||||||||||||||
|
|
|
|
|
| |||||||||||||||||||
Gas Utilities (0.1%) | ||||||||||||||||||||||||
AGL Resources, Inc. | 1,830 | 7,475 | 9,305 | 86,431 | 353,044 | 439,475 | ||||||||||||||||||
Atmos Energy Corp. | 9,795 | — | 9,795 | 444,889 | — | 444,889 | ||||||||||||||||||
ONEOK, Inc. | 3,173 | 12,987 | 16,160 | 197,297 | 807,532 | 1,004,829 | ||||||||||||||||||
|
|
|
|
|
| |||||||||||||||||||
| 728,617 | 1,160,576 | 1,889,193 | ||||||||||||||||||||||
|
|
|
|
|
| |||||||||||||||||||
Independent Power Producers & Energy Traders (0.3%) | ||||||||||||||||||||||||
AES Corp. | 10,254 | 41,354 | 51,608 | 148,785 | 600,046 | 748,831 | ||||||||||||||||||
Calpine Corp.* | — | 113,359 | 113,359 | — | 2,211,634 | 2,211,634 | ||||||||||||||||||
NRG Energy, Inc. | 4,975 | 185,044 | 190,019 | 142,882 | 5,314,464 | 5,457,346 | ||||||||||||||||||
|
|
|
|
|
| |||||||||||||||||||
| 291,667 | 8,126,144 | 8,417,811 | ||||||||||||||||||||||
|
|
|
|
|
| |||||||||||||||||||
Multi-Utilities (0.5%) | ||||||||||||||||||||||||
Ameren Corp. | 3,693 | 15,273 | 18,966 | 133,539 | 552,272 | 685,811 | ||||||||||||||||||
CenterPoint Energy, Inc. | 6,683 | 26,983 | 33,666 | 154,912 | 625,466 | 780,378 | ||||||||||||||||||
CMS Energy Corp. | 4,094 | 16,742 | 20,836 | 109,596 | 448,183 | 557,779 | ||||||||||||||||||
Consolidated Edison, Inc. | 4,596 | 18,441 | 23,037 | 254,067 | 1,019,419 | 1,273,486 | ||||||||||||||||||
Dominion Resources, Inc. | 9,011 | 36,551 | 45,562 | 582,922 | 2,364,484 | 2,947,406 | ||||||||||||||||||
DTE Energy Co. | 2,749 | 11,134 | 13,883 | 182,506 | 739,186 | 921,692 | ||||||||||||||||||
Integrys Energy Group, Inc. | 1,204 | 5,021 | 6,225 | 65,510 | 273,193 | 338,703 | ||||||||||||||||||
NiSource, Inc. | 4,816 | 19,722 | 24,538 | 158,350 | 648,459 | 806,809 | ||||||||||||||||||
PG&E Corp. | 6,983 | 79,991 | 86,974 | 281,275 | 3,222,038 | 3,503,313 | ||||||||||||||||||
Public Service Enterprise Group, Inc. | 7,888 | 31,850 | 39,738 | 252,732 | 1,020,474 | 1,273,206 | ||||||||||||||||||
SCANA Corp. | 2,207 | 8,852 | 11,059 | 103,574 | 415,424 | 518,998 | ||||||||||||||||||
Sempra Energy | 4,756 | 14,311 | 19,067 | 426,899 | 1,284,555 | 1,711,454 | ||||||||||||||||||
TECO Energy, Inc. | 3,131 | 12,848 | 15,979 | 53,978 | 221,500 | 275,478 | ||||||||||||||||||
Wisconsin Energy Corp. | 3,532 | 14,259 | 17,791 | 146,013 | 589,467 | 735,480 | ||||||||||||||||||
|
|
|
|
|
| |||||||||||||||||||
| 2,905,873 | 13,424,120 | 16,329,993 | ||||||||||||||||||||||
|
|
|
|
|
| |||||||||||||||||||
Total Utilities | 11,972,710 | 46,493,521 | 58,466,231 | |||||||||||||||||||||
|
|
|
|
|
| |||||||||||||||||||
Total Common Stock (77.7%) | ||||||||||||||||||||||||
(Cost $1,723,005,382) | 554,896,526 | 1,787,124,745 | 2,342,021,271 | |||||||||||||||||||||
|
|
|
|
|
| |||||||||||||||||||
See Notes to Pro-forma Combined Financial Statements.
16
| Multimanager Large Cap Core Equity Number of Shares | EQ/Large Cap Core PLUS Number of Shares | Pro-forma Combined Number of Shares | Multimanager (Note 1) | EQ/Large Cap (Note 1) | Pro-forma (Note 1) | |||||||||||||||||||
INVESTMENT COMPANIES: | ||||||||||||||||||||||||
Exchange Traded | ||||||||||||||||||||||||
Mutual Funds (4.3%) | ||||||||||||||||||||||||
iShares Core | — | 244,444 | 244,444 | — | 45,381,029 | 45,381,029 | ||||||||||||||||||
iShares Morningstar | — | 131,702 | 131,702 | — | 14,202,744 | 14,202,744 | ||||||||||||||||||
iShares Morningstar | — | 40,098 | 40,098 | — | 4,009,399 | 4,009,399 | ||||||||||||||||||
iShares Morningstar | — | 25,863 | 25,863 | — | 2,079,385 | 2,079,385 | ||||||||||||||||||
iShares NYSE 100 ETF | — | 5,536 | 5,536 | — | 468,888 | 468,888 | ||||||||||||||||||
iShares Russell 1000 ETF | — | 198,599 | 198,599 | — | 20,489,459 | 20,489,459 | ||||||||||||||||||
iShares Russell 1000 Growth ETF | — | 25,197 | 25,197 | — | 2,165,682 | 2,165,682 | ||||||||||||||||||
iShares Russell 1000 | — | 14,025 | 14,025 | — | 1,320,594 | 1,320,594 | ||||||||||||||||||
iShares S&P 100 ETF | — | 83,815 | 83,815 | — | 6,902,165 | 6,902,165 | ||||||||||||||||||
iShares S&P 500 | — | 27,748 | 27,748 | — | 2,739,560 | 2,739,560 | ||||||||||||||||||
iShares S&P 500 | — | 22,346 | 22,346 | — | 1,909,689 | 1,909,689 | ||||||||||||||||||
Vanguard Growth ETF | — | 44,300 | 44,300 | — | 4,122,115 | 4,122,115 | ||||||||||||||||||
Vanguard Large-Cap ETF | — | 280,213 | 280,213 | — | 23,762,062 | 23,762,062 | ||||||||||||||||||
Vanguard Value ETF | — | 11,300 | 11,300 | — | 863,207 | 863,207 | ||||||||||||||||||
|
|
|
|
|
| |||||||||||||||||||
Total Investment Companies (4.3%) | — | 130,415,978 | 130,415,978 | |||||||||||||||||||||
|
|
|
|
|
| |||||||||||||||||||
Total Investments (82.0%) | 554,896,526 | 1,917,540,723 | 2,472,437,249 | |||||||||||||||||||||
Other Assets Less Liabilities (18.0%) | 47,234,631 | 494,245,645 | 541,480,276 | |||||||||||||||||||||
|
|
|
|
|
| |||||||||||||||||||
Net Assets (100%) | $ | 602,131,157 | $ | 2,411,786,368 | $ | 3,013,917,525 | ||||||||||||||||||
|
|
|
|
|
| |||||||||||||||||||
| * | Non-income producing. |
| # | All, or a portion of security held by broker as collateral for futures contracts, with a total collateral of $4,048,000. |
Glossary
ADR - American Depositary Receipt
See Notes to Pro-forma Combined Financial Statements.
17
At December 31, 2013 the Portfolio had the following futures contracts open
Multimanager Large Cap Core Equity
Purchases | Number of Contracts | Expiration | Original Value | Value at 12/31/2013 | Unrealized Appreciation/ (Depreciation) | |||||||||||||
S&P 500 E-Mini Index | 468 | March - 14 | $ | 42,139,064 | $ | 43,081,740 | $ | 942,676 | ||||||||||
|
| |||||||||||||||||
EQ/Large Cap Core PLUS
Purchases | Number of Contracts | Expiration Date | Original Value | Value at 12/31/2013 | Unrealized Appreciation/ (Depreciation) | |||||||||||||
| S&P 500 E-Mini Index | 5,238 | March - 14 | $ | 471,103,089 | $ | 482,184,090 | $ | 11,081,001 | ||||||||||
|
| |||||||||||||||||
Pro-Forma Combined
Purchases | Number of Contracts | Expiration | Original Value | Value at 12/31/2013 | Unrealized Appreciation/ (Depreciation) | |||||||||||||
S&P 500 E-Mini Index | 5,706 | March - 14 | $ | 513,242,153 | $ | 525,265,830 | $ | 12,023,677 | ||||||||||
|
| |||||||||||||||||
See Notes to Pro-forma Combined Financial Statements.
18
The following is a summary of the inputs used to value the Portfolio’s net assets as of December 31, 2013 :
The inputs or methodology used for valuing securities are not necessarily an indication of the risk associated with investing in those securities.
Various inputs are used in determining the value of the Portfolio’s investments. These inputs are summarized in the three broad levels listed below:
| • | Level 1 - Quoted prices in active markets for identical securities |
| • | Level 2 - Significant other observable inputs (including quoted prices for similar securities, interest rates, prepayment speeds, credit risk, etc.) |
| • | Level 3 - Significant unobservable inputs (including the Portfolio’s own assumptions in determining the fair value of investments) |
Description | Quoted Prices in Active Markets for Identical Securities (Level 1) | Significant Other Observable Inputs (Level 2) (a) | Significant Unobservable Inputs (Level 3) | Total | ||||||||||||||||||||||||||||||||||||||||||||
| Multimanager Large Cap Core Equity | EQ/Large Cap Core PLUS | PRO FORMA | Multimanager Large Cap Core Equity | EQ/ Large Cap Core PLUS | PRO FORMA | Multimanager Large Cap Core Equity | EQ/Large Cap Core PLUS | PRO FORMA | Multimanager Large Cap Core Equity | EQ/Large Cap Core PLUS | PRO FORMA | |||||||||||||||||||||||||||||||||||||
Assets | ||||||||||||||||||||||||||||||||||||||||||||||||
Investments in Securities | $ | 540,700,445 | $ | 1,916,769,833 | $ | 2,457,470,278 | $ | 14,196,081 | $ | 770,890 | $ | 14,966,971 | $ | — | $ | — | $ | — | $ | 554,896,526 | $ | 1,917,540,723 | $ | 2,472,437,249 | ||||||||||||||||||||||||
Other Investments* | 942,676 | 11,081,001 | 12,023,677 | — | — | — | — | — | — | 942,676 | 11,081,001 | 12,023,677 | ||||||||||||||||||||||||||||||||||||
|
|
|
|
|
|
|
|
|
|
|
|
|
|
|
|
|
|
|
|
|
|
|
| |||||||||||||||||||||||||
Total | $ | 541,643,121 | $ | 1,927,850,834 | $ | 2,469,493,955 | $ | 14,196,081 | $ | 770,890 | $ | 14,966,971 | $ | — | $ | — | $ | — | $ | 555,839,202 | $ | 1,928,621,724 | $ | 2,484,460,926 | ||||||||||||||||||||||||
|
|
|
|
|
|
|
|
|
|
|
|
|
|
|
|
|
|
|
|
|
|
|
| |||||||||||||||||||||||||
Liabilities | ||||||||||||||||||||||||||||||||||||||||||||||||
Investments in Securities | $ | — | $ | — | $ | — | $ | — | $ | — | $ | — | $ | — | $ | — | $ | — | $ | — | $ | — | $ | — | ||||||||||||||||||||||||
Other Investments* | — | — | — | — | — | — | — | — | — | — | — | — | ||||||||||||||||||||||||||||||||||||
|
|
|
|
|
|
|
|
|
|
|
|
|
|
|
|
|
|
|
|
|
|
|
| |||||||||||||||||||||||||
Total | $ | — | $ | — | $ | — | $ | — | $ | — | $ | — | $ | — | $ | — | $ | — | $ | — | $ | — | $ | — | ||||||||||||||||||||||||
|
|
|
|
|
|
|
|
|
|
|
|
|
|
|
|
|
|
|
|
|
|
|
| |||||||||||||||||||||||||
Total Assets and Liabilities | $ | 541,643,121 | $ | 1,927,850,834 | $ | 2,469,493,955 | $ | 14,196,081 | $ | 770,890 | $ | 14,966,971 | $ | — | $ | — | $ | — | $ | 555,839,202 | $ | 1,928,621,724 | $ | 2,484,460,926 | ||||||||||||||||||||||||
|
|
|
|
|
|
|
|
|
|
|
|
|
|
|
|
|
|
|
|
|
|
|
| |||||||||||||||||||||||||
| * | Other investments are derivative instruments, such as futures, forwards and written options, which are valued at the unrealized appreciation/depreciation on the instrument. |
Multimanager Large Cap Core
| (a) | A security with a market value of $191,041 transferred from Level 1 to Level 2 during the year ended December 31, 2013 due to inactive trading. |
EQ/Large Cap Core PLUS
| (a) | A security with a market value of $770,890 transferred from Level 1 to Level 2 during the year ended December 31, 2013 due to inactive trading. |
Pro-Forma Combined
| (1) | A security with market value of $1,732,821 transferred from Level 1 to Level 2 during the year ended December 31, 2013 due to inactive trading. |
There were no additional transfers between Level 1, 2 or during the year ended December 31, 2013
See Notes to Pro-forma Combined Financial Statements.
19
Fair Values of Derivative Instruments as of December 31, 2013:
Multimanager Large Cap Core Equity
Statement of Assets and Liabilities
Derivatives Not Accounted for as Hedging Instruments^ | Asset Derivatives | Fair Value | ||||
| Interest rate contracts | Receivables, Net Assets- | |||||
| Unrealized appreciation | $ | — | * | |||
| Foreign exchange contracts | Receivables | — | ||||
| Credit contracts | Receivables | — | ||||
| Equity contracts | Receivables, Net Assets- | |||||
| Unrealized appreciation | 942,676 | * | ||||
| Commodity contracts | Receivables | — | ||||
| Other contracts | Receivables | — | ||||
|
| |||||
Total | $ | 942,676 | ||||
|
| |||||
| Liability Derivatives | ||||||
Interest rate contracts | Payables, Net Assets- | |||||
| Unrealized depreciation | $ | — | * | |||
| Foreign exchange contracts | Payables | — | ||||
Credit contracts | Payables | — | ||||
| Equity contracts | Payables, Net Assets- | |||||
| Unrealized depreciation | — | * | ||||
| Commodity contracts | Payables | — | ||||
Other contracts | Payables | — | ||||
|
| |||||
| Total | $ | — | ||||
|
| |||||
| * | Includes cumulative appreciation/depreciation of futures contracts as reported in the Portfolio of Investments. Only current day’s variation margin is reported within the Statement of Assets & Liabilities. |
The effect of Derivative Instruments on the Statement of Operations for the year ended December 31, 2013:
Amount of Realized Gain or (Loss) on Derivatives Recognized in Income
Derivatives Not Accounted for as Hedging Instruments^ | Options | Futures | Forward Currency Contracts | Swaps | Total | |||||||||||||||
Interest rate contracts | $ | — | $ | — | $ | — | $ | — | $ | — | ||||||||||
Foreign exchange contracts | — | — | — | — | — | |||||||||||||||
Credit contracts | — | — | — | — | — | |||||||||||||||
Equity contracts | — | 14,891,682 | — | — | 14,891,682 | |||||||||||||||
Commodity contracts | — | — | — | — | — | |||||||||||||||
Other contracts | — | — | — | — | — | |||||||||||||||
|
|
|
|
|
|
|
|
|
| |||||||||||
Total | $ | — | $ | 14,891,682 | $ | — | $ | — | $ | 14,891,682 | ||||||||||
|
|
|
|
|
|
|
|
|
| |||||||||||
Amount of Unrealized Appreciation or (Depreciation) on Derivatives Recognized in Income
Derivatives Not Accounted for as Hedging Instruments^ | Options | Futures | Forward Currency Contracts | Swaps | Total | |||||||||||||||
Interest rate contracts | $ | — | $ | — | $ | — | $ | — | $ | — | ||||||||||
Foreign exchange contracts | — | — | — | — | — | |||||||||||||||
Credit contracts | — | — | — | — | — | |||||||||||||||
Equity contracts | — | 990,866 | — | — | 990,866 | |||||||||||||||
Commodity contracts | — | — | — | — | — | |||||||||||||||
Other contracts | — | — | — | — | — | |||||||||||||||
|
|
|
|
|
|
|
|
|
| |||||||||||
Total | $ | — | $ | 990,866 | $ | — | $ | — | $ | 990,866 | ||||||||||
|
|
|
|
|
|
|
|
|
| |||||||||||
| ^ | This Portfolio held futures contracts as a substitute for investing in conventional securities, hedging and in an attempt to enhance returns. |
The Portfolio held futures contracts with an average notional balance of approximately $55,079,000 for the year ended December 31, 2013.
See Notes to Pro-forma Combined Financial Statements.
20
EQ/Large Cap Core PLUS
Statement of Assets and Liabilities
Derivatives Not Accounted for as Hedging Instruments^ | Asset Derivatives | Fair Value | ||||
| Interest rate contracts | Receivables, Net Assets- | |||||
| Unrealized appreciation | $ | — | * | |||
| Foreign exchange contracts | Receivables | — | ||||
| Credit contracts | Receivables | — | ||||
| Equity contracts | Receivables, Net Assets- | |||||
| Unrealized appreciation | 11,081,001 | * | ||||
| Commodity contracts | Receivables | — | ||||
| Other contracts | Receivables | — | ||||
|
| |||||
| Total | $ | 11,081,001 | ||||
|
| |||||
Liability Derivatives | ||||||
| Interest rate contracts | Payables, Net Assets- | |||||
| Unrealized depreciation | $ | — | * | |||
| Foreign exchange contracts | Payables | — | ||||
| Credit contracts | Payables | — | ||||
| Equity contracts | Payables, Net Assets- | |||||
| Unrealized depreciation | — | * | ||||
| Commodity contracts | Payables | — | ||||
| Other contracts | Payables | — | ||||
|
| |||||
| Total | $ | — | ||||
|
| |||||
| * | Includes cumulative appreciation/depreciation of futures contracts as reported in the Portfolio of Investments. Only current day’s variation margin is reported within the Statement of Assets & Liabilities. |
The effect of Derivative Instruments on the Statement of Operations for the year ended December 31, 2013:
Amount of Realized Gain or (Loss) on Derivatives Recognized in Income
Derivatives Not Accounted for as Hedging Instruments^ | Options | Futures | Forward Currency Contracts | Swaps | Total | |||||||||||||||
Interest rate contracts | $ | — | $ | — | $ | — | $ | — | $ | — | ||||||||||
Foreign exchange contracts | — | — | — | — | — | |||||||||||||||
Credit contracts | — | — | — | — | — | |||||||||||||||
Equity contracts | — | 74,950,692 | — | — | 74,950,692 | |||||||||||||||
Commodity contracts | — | — | — | — | — | |||||||||||||||
Other contracts | — | — | — | — | — | |||||||||||||||
|
|
|
|
|
|
|
|
|
| |||||||||||
Total | $ | — | $ | 74,950,692 | $ | — | $ | — | $ | 74,950,692 | ||||||||||
|
|
|
|
|
|
|
|
|
| |||||||||||
Amount of Unrealized Appreciation or (Depreciation) on Derivatives Recognized in Income
Derivatives Not Accounted for as Hedging Instruments^ | Options | Futures | Forward Currency Contracts | Swaps | Total | |||||||||||||||
Interest rate contracts | $ | — | $ | — | $ | — | $ | — | $ | — | ||||||||||
Foreign exchange contracts | — | — | — | — | — | |||||||||||||||
Credit contracts | — | — | — | — | — | |||||||||||||||
Equity contracts | — | 11,325,658 | — | — | 11,325,658 | |||||||||||||||
Commodity contracts | — | — | — | — | — | |||||||||||||||
Other contracts | — | — | — | — | — | |||||||||||||||
|
|
|
|
|
|
|
|
|
| |||||||||||
Total | $ | — | $ | 11,325,658 | $ | — | $ | — | $ | 11,325,658 | ||||||||||
|
|
|
|
|
|
|
|
|
| |||||||||||
| ^ | This Portfolio held futures contracts as a substitute for investing in conventional securities, hedging and in an attempt to enhance returns. |
The Portfolio held futures contracts with an average notional balance of approximately $299,432,000 for the year ended December 31, 2013.
See Notes to Pro-forma Combined Financial Statements.
21
Pro-Forma Combined
Fair Values of Derivative Instruments as of December 31, 2013:
Statement of Assets and Liabilities
Derivatives Not Accounted for as Hedging Instruments^ | Asset Derivatives | Fair Value | ||||
| Interest rate contracts | Receivables, Net Assets- | |||||
| Unrealized appreciation | $ | — | * | |||
| Foreign exchange contracts | Receivables | — | ||||
| Credit contracts | Receivables | — | ||||
| Equity contracts | Receivables, Net Assets- | |||||
| Unrealized appreciation | 12,023,677 | * | ||||
| Commodity contracts | Receivables | — | ||||
| Other contracts | Receivables | — | ||||
|
| |||||
| Total | $ | 12,023,677 | ||||
|
| |||||
Liability Derivatives | ||||||
| Interest rate contracts | Payables, Net Assets- | |||||
| Unrealized depreciation | $ | — | * | |||
| Foreign exchange contracts | Payables | — | ||||
| Credit contracts | Payables | — | ||||
| Equity contracts | Payables, Net Assets- | |||||
| Unrealized depreciation | — | * | ||||
| Commodity contracts | Payables | — | ||||
| Other contracts | Payables | — | ||||
|
| |||||
| Total | $ | — | ||||
|
| |||||
| * | Includes cumulative appreciation/depreciation of futures contracts as reported in the Portfolio of Investments. Only current day’s variation margin is reported within the Statement of Assets & Liabilities. |
The effect of Derivative Instruments on the Statement of Operations for the year ended December 31, 2013:
Amount of Realized Gain or (Loss) on Derivatives Recognized in Income
Derivatives Not Accounted for as Hedging Instruments^ | Options | Futures | Forward Currency Contracts | Swaps | Total | |||||||||||||||
Interest rate contracts | $ | — | $ | — | $ | — | $ | — | $ | — | ||||||||||
Foreign exchange contracts | — | — | — | — | — | |||||||||||||||
Credit contracts | — | — | — | — | — | |||||||||||||||
Equity contracts | — | 89,842,374 | — | — | 89,842,374 | |||||||||||||||
Commodity contracts | — | — | — | — | — | |||||||||||||||
Other contracts | — | — | — | — | — | |||||||||||||||
|
|
|
|
|
|
|
|
|
| |||||||||||
Total | $ | — | $ | 89,842,374 | $ | — | $ | — | $ | 89,842,374 | ||||||||||
|
|
|
|
|
|
|
|
|
| |||||||||||
Amount of Unrealized Appreciation or (Depreciation) on Derivatives Recognized in Income
Derivatives Not Accounted for as Hedging Instruments^ | Options | Futures | Forward Currency Contracts | Swaps | Total | |||||||||||||||
Interest rate contracts | $ | — | $ | — | $ | — | $ | — | $ | — | ||||||||||
Foreign exchange contracts | — | — | — | — | — | |||||||||||||||
Credit contracts | — | — | — | — | — | |||||||||||||||
Equity contracts | — | 12,316,524 | — | — | 12,316,524 | |||||||||||||||
Commodity contracts | — | — | — | — | — | |||||||||||||||
Other contracts | — | — | — | — | — | |||||||||||||||
|
|
|
|
|
|
|
|
|
| |||||||||||
Total | $ | — | $ | 12,316,524 | $ | — | $ | — | $ | 12,316,524 | ||||||||||
|
|
|
|
|
|
|
|
|
| |||||||||||
| ^ | This Portfolio held futures contracts as a substitute for investing in conventional securities, hedging and in an attempt to enhance returns. |
The Portfolio held futures contracts with an average notional balance of approximately $354,511,000 for the year ended December 31, 2013.
See Notes to Pro-forma Combined Financial Statements.
22
Multimanager Large Core Equity
The following table presents the Portfolio’s gross derivative assets and liabilities by counterparty net of amounts available for offset under netting arrangements and any related collateral received or pledged by the Portfolio as of December 31, 2013:
Counterparty | Gross Amount of Derivative Assets Presented in the Statement of Assets and Liabilities (a) | Derivatives Available for Offset | Collateral Received | Net Amount Due from Counterparty (cannot be less than zero) | ||||||||||||
Exchange Traded Futures & Options Contracts (b) | $ | 942,676 | (c) | $ | — | $ | — | $ | 942,676 | |||||||
|
|
|
|
|
|
|
| |||||||||
EQ/Large Cap Core PLUS
The following table presents the Portfolio’s gross derivative assets and liabilities by counterparty net of amounts available for offset under netting arrangements and any related collateral received or pledged by the Portfolio as of December 31, 2013:
Counterparty | Gross Amount of Derivative Assets Presented in the Statement of Assets and Liabilities (a) | Derivatives Available for Offset | Collateral Received | Net Amount Due from Counterparty (cannot be less than zero) | ||||||||||||
Exchange Traded Futures & Options Contracts (b) | $ | 11,081,001 | (c) | $ | — | $ | — | $ | 11,081,001 | |||||||
|
|
|
|
|
|
|
| |||||||||
Pro-Forma Combined
The following table presents the Portfolio’s gross derivative assets and liabilities by counterparty net of amounts available for offset under netting arrangements and any related collateral received or pledged by the Portfolio as of December 31, 2013:
Counterparty | Gross Amount of Derivative Assets Presented in the Statement of Assets and Liabilities (a) | Derivatives Available for Offset | Collateral Received | Net Amount Due from Counterparty (cannot be less than zero) | ||||||||||||
Exchange Traded Futures & Options Contracts (b) | $ | 12,023,677 | (c) | $ | — | $ | — | $ | 12,023,677 | |||||||
|
|
|
|
|
|
|
| |||||||||
| (a) | For financial reporting purposes the Portfolio does not offset derivative assets and derivative liabilities subject to master netting arrangements in the Statement of Assets and Liabilities. |
| (b) | These derivatives are traded on an exchange, therefore they are not subject to master netting arrangements. |
| (c) | This amount represents the cumulative appreciation (depreciation) of futures contracts as reported in the Portfolio of Investments. The Statement of Assets and Liabilities only reflect the current day variation margin receivable/payable to brokers for futures contracts. |
See Notes to Pro-forma Combined Financial Statements.
23
Investment security transactions for the year ended December 31, 2013 were as follows:
| 12/31/2013 | ||||||||||||
| Multimanager Large Cap Core Equity | EQ/Large Cap Core PLUS | PRO FORMA COMBINED | ||||||||||
Cost of Purchases: | ||||||||||||
Long-term investments other than U.S. government debt securities | $ | 194,212,267 | $ | 564,995,993 | $ | 759,208,260 | ||||||
Net Proceeds of Sales and Redemptions: | ||||||||||||
Long-term investments other than U.S. government debt securities | $ | 254,543,553 | $ | 1,059,050,424 | $ | 1,313,593,977 | ||||||
See Notes to Pro-forma Combined Financial Statements.
24
As of December 31, 2013, the gross unrealized appreciation (depreciation) of investments based on the aggregate cost of investments for federal income tax purposes was as follows:
| Multimanager Large Cap Core Equity | EQ/Large Cap Core PLUS | Pro Forma Combined | ||||||||||
Aggregate gross unrealized appreciation | $ | 217,558,460 | $ | 447,076,136 | $ | 664,634,596 | ||||||
Aggregate gross unrealized depreciation | (3,811,832 | ) | (8,067,780 | ) | (11,879,612 | ) | ||||||
|
|
|
|
|
| |||||||
Net unrealized appreciation | $ | 213,746,628 | $ | 439,008,356 | $ | 652,754,984 | ||||||
|
|
|
|
|
| |||||||
Federal income tax cost of investments | $ | 341,149,898 | $ | 1,478,532,367 | $ | 1,819,682,265 | ||||||
|
|
|
|
|
| |||||||
Affiliated broker/dealers
Multimanager Large Cap Core Equity
For the year ended December 31, 2013, the Portfolio incurred approximately $3,375 as brokerage commissions with Sanford C. Bernstein & Co. LLC, an affiliated broker/dealer.
EQ/Large Cap Core PLUS
For the year ended December 31, 2013, the Portfolio incurred approximately $6,832 as brokerage commissions with Sanford C. Bernstein & Co. LLC, an affiliated broker/dealer.
Pro-Forma Combined
For the year ended December 31, 2013, the Portfolio incurred approximately $10,207 as brokerage commissions with Sanford C. Bernstein & Co. LLC, an affiliated broker/dealer.
Multimanager Large Cap Core Equity/Pro-Forma Combined
The Portfolio has a net capital loss carryforward of $266,575,852, which expires in the year 2017. The Portfolio utilized net capital loss carryforward of $64,996,827 during 2013.
Certain capital loss carryforwards may be subject to limitations on use pursuant to applicable U.S. Federal Income Tax Law. Therefore, it is possible not all of these capital losses will be available for use.
See Notes to Pro-forma Combined Financial Statements.
25
STATEMENT OF ASSET AND LIABILITES
December 31, 2013
| Multimanager Large Cap Core Equity | EQ/Large Cap Core PLUS | Pro Forma Adjustment | Pro Forma Combined | |||||||||||||
Investments at cost | $ | 340,374,166 | $ | 1,476,170,638 | $ | 1,816,544,804 | ||||||||||
Foreign cash at cost | $ | — | $ | 7 | $ | 7 | ||||||||||
ASSETS | ||||||||||||||||
Investments at value | $ | 554,896,526 | $ | 1,917,540,723 | $ | 2,472,437,249 | ||||||||||
Cash | 36,385,367 | 472,108,049 | 508,493,416 | |||||||||||||
Foreign cash | — | 7 | 7 | |||||||||||||
Cash held as collateral at broker | 10,120,000 | 21,773,000 | 31,893,000 | |||||||||||||
Receivable for securities sold | 2,092,535 | — | 2,092,535 | |||||||||||||
Dividends, interest, and other receivables | 635,245 | 2,389,966 | 3,025,211 | |||||||||||||
Due from broker for futures variation margin | 149,760 | 1,679,034 | 1,828,794 | |||||||||||||
Receivable from Separate Accounts for Trust shares sold | 3,284 | 5,336 | 8,620 | |||||||||||||
Other assets | 1,777 | 2,456 | 4,233 | |||||||||||||
|
|
|
|
|
|
|
| |||||||||
Total assets | 604,284,494 | 2,415,498,571 | — | 3,019,783,065 | ||||||||||||
|
|
|
|
|
|
|
| |||||||||
LIABILITIES | ||||||||||||||||
Payable to Separate Accounts for Trust shares redeemed | 532,613 | 1,834,979 | 2,367,592 | |||||||||||||
Investment management fees payable | 342,671 | 994,075 | 1,336,746 | |||||||||||||
Payable for securities purchased | 1,108,190 | — | 1,108,190 | |||||||||||||
Distribution fees payable - Class B/IB | 5,141 | 409,285 | 414,426 | |||||||||||||
Administrative fees payable | 108,042 | 284,651 | 392,693 | |||||||||||||
Trustees’ fees payable | 14,538 | 2,461 | 16,999 | |||||||||||||
Distribution fees payable - Class A/IA | 931 | 259 | 1,190 | |||||||||||||
Accrued expenses | 41,211 | 186,493 | 227,704 | |||||||||||||
|
|
|
|
|
|
|
| |||||||||
Total liabilities | 2,153,337 | 3,712,203 | — | 5,865,540 | ||||||||||||
|
|
|
|
|
|
|
| |||||||||
NET ASSETS | $ | 602,131,157 | $ | 2,411,786,368 | $ | — | $ | 3,013,917,525 | ||||||||
|
|
|
|
|
|
|
| |||||||||
Net assets were comprised of: | ||||||||||||||||
Paid in capital | 667,575,786 | 1,950,609,982 | 2,618,185,768 | |||||||||||||
Accumulated undistributed net investment income (loss) | 210,490 | 142,853 | 353,343 | |||||||||||||
Accumulated undistributed net realized gain (loss) on investments, futures and foreign currency transactions | (281,122,717 | ) | 8,582,447 | (272,540,270 | ) | |||||||||||
Net unrealized appreciaiton (depreciation) on investments, futures and foreign currency translations | 215,467,598 | 452,451,086 | 667,918,684 | |||||||||||||
|
|
|
|
|
|
|
| |||||||||
Net Assets | $ | 602,131,157 | $ | 2,411,786,368 | $ | — | $ | 3,013,917,525 | ||||||||
|
|
|
|
|
|
|
| |||||||||
Class IA Shares: | ||||||||||||||||
Net Assets | 4,514,522 | 1,160,812 | 5,675,334 | |||||||||||||
Shares outstanding | 316,458 | 133,284 | 201,898 | a- | 651,640 | |||||||||||
|
|
|
|
|
|
|
| |||||||||
Net asset value, offering and redemption price per share | $ | 14.27 | $ | 8.71 | $ | 8.71 | ||||||||||
|
|
|
|
|
|
|
| |||||||||
Class IB Shares: | ||||||||||||||||
Net Assets | 24,759,378 | 1,953,736,571 | 1,978,495,949 | |||||||||||||
Shares outstanding | 1,735,710 | 224,291,286 | 1,106,696 | a- | 227,133,692 | |||||||||||
|
|
|
|
|
|
|
| |||||||||
Net asset value, offering and redemption price per share | $ | 14.26 | $ | 8.71 | $ | 8.71 | ||||||||||
|
|
|
|
|
|
|
| |||||||||
Class K Shares: | ||||||||||||||||
Net Assets | 572,857,257 | 456,888,985 | 1,029,746,242 | |||||||||||||
Shares outstanding | 40,157,043 | 52,461,008 | 25,619,700 | a- | 118,237,751 | |||||||||||
|
|
|
|
|
|
|
| |||||||||
Net asset value, offering and redemption price per share | $ | 14.27 | $ | 8.71 | $ | 8.71 | ||||||||||
|
|
|
|
|
|
|
| |||||||||
| a- | Reflects adjustment for additional shares issued of the acquiring Portfolio. |
See Notes to Pro-forma Combined Financial Statements.
26
STATEMENT OF OPERATIONS
For the Year Ended December 31, 2013
| Multimanager Large Cap Core Equity | EQ/Large Cap Core PLUS | Pro Forma Adjustment | Pro Forma Combined | |||||||||||||
Foreign withholding tax | $ | 71,173 | $ | 48,524 | $ | 119,697 | ||||||||||
INVESTMENT INCOME | ||||||||||||||||
Dividends | $ | 10,330,379 | $ | 24,887,702 | $ | 35,218,081 | ||||||||||
Interest | 79,453 | 276,359 | 355,812 | |||||||||||||
|
|
|
|
|
|
|
| |||||||||
Total income | 10,409,832 | 25,164,061 | — | 35,573,893 | ||||||||||||
|
|
|
|
|
|
|
| |||||||||
EXPENSES | ||||||||||||||||
Investment management fees | 4,424,005 | 7,525,692 | (1,241,082 | )c- | 10,708,615 | |||||||||||
Administrative fees | 980,502 | 2,255,180 | (297,501 | )c- | 2,938,181 | |||||||||||
Distribution fees - Class B/IB | 223,656 | 2,731,977 | 2,955,633 | |||||||||||||
Printing and mailing expenses | 80,145 | 180,352 | (196,011 | )a- | 64,486 | |||||||||||
Custodian fees | 99,499 | 96,000 | (109,423 | )a- | 86,076 | |||||||||||
Professional fees | 82,992 | 87,990 | (107,368 | )a- | 63,614 | |||||||||||
Trustees’ fees | 14,457 | 30,462 | (28,774 | )a- | 16,145 | |||||||||||
Distribution fees - Class A/IA | 10,130 | 2,674 | 12,804 | |||||||||||||
Miscellaneous | 22,116 | 15,537 | (27,259 | )a- | 10,394 | |||||||||||
|
|
|
|
|
|
|
| |||||||||
Gross expenses | 5,937,502 | 12,925,864 | (2,007,418 | ) | 16,855,948 | |||||||||||
|
|
|
|
|
|
|
| |||||||||
Less: Waiver from investment manager | (12,273 | ) | 0 | 12,273 | d- | — | ||||||||||
Fees paid indirectly | (28,184 | ) | (18,766 | ) | 46,950 | b- | — | |||||||||
|
|
|
|
|
|
|
| |||||||||
Net expenses | 5,897,045 | 12,907,098 | (1,948,195 | ) | 16,855,948 | |||||||||||
|
|
|
|
|
|
|
| |||||||||
NET INVESTMENT INCOME (LOSS) | 4,512,787 | 12,256,963 | 1,948,195 | 18,717,945 | ||||||||||||
|
|
|
|
|
|
|
| |||||||||
REALIZED AND UNREALIZED GAIN (LOSS) | ||||||||||||||||
Realized gain (loss) on: | ||||||||||||||||
Investments | 86,021,318 | 45,796,584 | 131,817,902 | |||||||||||||
Futures | 14,891,682 | 74,950,692 | 89,842,374 | |||||||||||||
Foreign currency transactions | (4,415 | ) | (23,219 | ) | (27,634 | ) | ||||||||||
|
|
|
|
|
|
|
| |||||||||
Net realized gain (loss) | 100,908,585 | 120,724,057 | — | 221,632,642 | ||||||||||||
|
|
|
|
|
|
|
| |||||||||
Change in unrealized appreciation (depreciation) on: | ||||||||||||||||
Investments | 76,923,905 | 299,760,852 | 376,684,757 | |||||||||||||
Futures | 990,866 | 11,325,658 | 12,316,524 | |||||||||||||
Foreign currency translations | 1,726 | 0 | 1,726 | |||||||||||||
|
|
|
|
|
|
|
| |||||||||
Net change in unrealized appreciation (depreciation) | 77,916,497 | 311,086,510 | — | 389,003,007 | ||||||||||||
|
|
|
|
|
|
|
| |||||||||
NET REALIZED AND UNREALIZED GAIN (LOSS) | 178,825,082 | 431,810,567 | — | 610,635,649 | ||||||||||||
|
|
|
|
|
|
|
| |||||||||
NET INCREASE (DECREASE) IN NET ASSETS RESULTING FROM OPERATIONS | $ | 183,337,869 | $ | 444,067,530 | $ | 1,948,195 | $629,353,594 | |||||||||
|
|
|
|
|
|
|
| |||||||||
| a- | Reflects adjustment due to elimination of duplicative expenes. |
| b- | Reflects adjustment due to termination of the brokerage recapture program. |
| c- | Reflects adjustment in expenses due to the effects of new contract rate for acquiring Portfolio. |
| d- | Reflects elimination of waiver due to expense adjustment. |
See Notes to Pro-forma Combined Financial Statements.
27
NOTES TO PRO FORMA COMBINED FINANCIAL STATEMENTS
As of December 31, 2013
NOTE 1 – BASIS OF COMBINATION AND SIGNIFICANT ACCOUNTING POLICIES:
EQ Advisors Trust (the “Trust’) was organized as a Delaware statutory trust on October 31, 1996 and is registered under the Investment Company Act of 1940, as amended, as an open-end management investment company with numerous portfolios. The Board of Trustees of the “Trust” and the Board of Trustees of the AXA Premier VIP Trust (“VIP Trust”), approved a proposed Agreement and Plan of Reorganization and Termination (the “Reorganization Plan”) on December 10-11, 2013 and December 4, 2013 respectively, that provides for the transfer of all assets of the Multimanager Large Cap Core Equity Portfolio, a series of VIP Trust (“Large Cap Core Equity Portfolio”) to the EQ/Large Cap Core PLUS Portfolio, a series of the Trust (“Large Cap Core PLUS Portfolio”), and the assumption by the Large Cap Core PLUS Portfolio of all of the liabilities of the Large Cap Core Equity Portfolio in exchange for shares of the Large Cap Core PLUS Portfolio having an aggregate value equal to the net assets of the Large Cap Core Equity Portfolio, the distribution of the Large Cap Core PLUS Portfolio shares to the Large Cap Core Equity Portfolio shareholders of record determined immediately after the close of business on the closing date, and the subsequent liquidation of the Large Cap Core Equity Portfolio.
The Large Cap Core Equity Portfolio’s annual contractual management fee rate equals 0.700% of average daily net assets for the first $750 million, 0.650% of average daily net assets for the next $1 billion, 0.625% for the next $3 billion, 0.600% for the next $5 billion, and 0.575% of average daily net assets thereafter. The Large Cap Core PLUS Portfolio’s annual contractual management fee rate equals 0.500% of average daily net assets for the first $2 billion, 0.450% of average daily net assets for the next $1 billion, 0.425% of average daily net assets for the next $3 billion, 0.400% of average daily net assets for the next $5 billion, and 0.375% of average daily net assets thereafter. The Reorganization Plan is subject to the approval of the Large Cap Core Equity Portfolio’s shareholders. A special meeting of shareholders of the Large Cap Core Equity Portfolio will be held on or about May 21, 2014.
The Reorganization will be accounted for as a tax-free reorganization of investment companies. The unaudited pro forma combined financial statements are presented for the information of the reader and may not necessarily be representative of what the actual combined financial statements would have been had the Reorganization occurred at December 31, 2013. The unaudited pro forma combined portfolio of investments and statement of assets and liabilities reflect the financial position of the Large Cap Core Equity Portfolio and the Large Cap Core PLUS Portfolio at December 31, 2013. The unaudited pro forma combined statement of operations reflects the results of operations of the Large Cap Core PLUS Portfolio as if it had acquired the Large Cap Core Equity Portfolio at the beginning of the year ended December 31, 2013. These statements have been derived from the Portfolios’ respective books and records utilized in calculating daily net asset value at the dates indicated above for each Portfolio under accounting principles generally accepted in the United States of America. The historical cost of investment securities will be carried forward to the surviving entity and results of operations of the Large Cap Core PLUS Portfolio for pre-combination periods will not be restated.
The unaudited pro forma combined portfolio of investments and statements of assets and liabilities and operations should be read in conjunction with the historical financial statements of the Portfolios included in the Trust’s Statement of Additional Information, each of the Portfolios has substantially the same significant accounting policies as detailed in the historical financial statements. The preparation of financial statements in accordance with accounting principles generally accepted in the United States of America requires management to make estimates and assumptions that affect the reported amounts and disclosures. Actual results could differ from those estimates.
Following the Reorganization, the Large Cap Core PLUS Portfolio is the “accounting survivor.”
28
NOTE 2 – SHARES:
The unaudited pro forma net asset value per share assumes additional common shares of beneficial interest issued in connection with the proposed acquisition of the Large Cap Core Equity Portfolio by the Large Cap Core PLUS Portfolio as of December 31, 2013. The number of additional shares issued was calculated based on the net assets of the Large Cap Core Equity Portfolio and net asset value per share of the Large Cap Core PLUS Portfolio at December 31, 2013.
NOTE 3 – Taxes:
Each Portfolio, as well as the Acquiring Portfolio after the Reorganization, intends to comply with the requirements of the Internal Revenue Code of 1986, as amended, applicable to regulated investment companies (“RICs”) and to distribute substantially all of its net investment income and net realized capital gains to shareholders of each Portfolio. Therefore, no Federal income tax provision is required.
NOTE 4 – UNAUDITED PRO FORMA COMBINED ADJUSTMENTS:
The accompanying unaudited pro forma combined financial statements reflect changes in the Large Cap Core PLUS Portfolio’s shares as if the merger had taken place on December 31, 2013. The Large Cap Core Equity Portfolio will bear the expenses, based on the fraction that its shareholder accounts will bear to the shareholder accounts of the Acquired Portfolios at the merger date, of the Reorganization (i.e., the costs associated with preparing, printing and distributing the prospectus and proxy materials, legal and accounting fees in connection with the Reorganization, and expenses of holding the shareholders meeting), such expenses, which are not reflected in the unaudited pro forma combined statement of operations, are estimated at approximately $35,000.
29
| Multimanager Large Cap Value Number of Shares | EQ/Large Cap Value PLUS Number of Shares | Pro-forma Combined | Multimanager Value ($) (Note 1) | EQ/Large Cap Value ($) (Note 1) | Pro-forma Value ($) (Note 1) | |||||||||||||||||||
COMMON STOCKS: | ||||||||||||||||||||||||
Consumer Discretionary (8.5%) | ||||||||||||||||||||||||
Auto Components (0.8%) | ||||||||||||||||||||||||
Allison Transmission Holdings, Inc. | 783 | 10,690 | 11,473 | $ | 21,619 | $ | 295,151 | $ | 316,770 | |||||||||||||||
Delphi Automotive plc | 13,234 | — | 13,234 | 795,760 | — | 795,760 | ||||||||||||||||||
Gentex Corp. | 1,697 | 21,954 | 23,651 | 55,984 | 724,262 | 780,246 | ||||||||||||||||||
Johnson Controls, Inc. | 133,143 | 246,170 | 379,313 | 6,830,236 | 12,628,521 | 19,458,757 | ||||||||||||||||||
Lear Corp. | 7,317 | 198,867 | 206,184 | 592,458 | 16,102,261 | 16,694,719 | ||||||||||||||||||
TRW Automotive Holdings Corp.* | 15,977 | 177,584 | 193,561 | 1,188,529 | 13,210,474 | 14,399,003 | ||||||||||||||||||
|
|
|
|
|
| |||||||||||||||||||
| 9,484,586 | 42,960,669 | 52,445,255 | ||||||||||||||||||||||
|
|
|
|
|
| |||||||||||||||||||
Automobiles (1.1%) | ||||||||||||||||||||||||
Ford Motor Co. | 381,667 | 1,740,533 | 2,122,200 | 5,889,122 | 26,856,424 | 32,745,546 | ||||||||||||||||||
General Motors Co.* | 65,550 | 866,230 | 931,780 | 2,679,028 | 35,402,820 | 38,081,848 | ||||||||||||||||||
|
|
|
|
|
| |||||||||||||||||||
| 8,568,150 | 62,259,244 | 70,827,394 | ||||||||||||||||||||||
|
|
|
|
|
| |||||||||||||||||||
Distributors (0.0%) | ||||||||||||||||||||||||
Genuine Parts Co. | 228 | 3,134 | 3,362 | 18,967 | 260,718 | 279,685 | ||||||||||||||||||
|
|
|
|
|
| |||||||||||||||||||
Diversified Consumer Services (0.0%) | ||||||||||||||||||||||||
Apollo Education Group, Inc., Class A* | 2,742 | 35,053 | 37,795 | 74,911 | 957,648 | 1,032,559 | ||||||||||||||||||
DeVry Education Group, Inc. | 1,762 | 22,626 | 24,388 | 62,551 | 803,223 | 865,774 | ||||||||||||||||||
Service Corp. International | 1,272 | 16,668 | 17,940 | 23,061 | 302,191 | 325,252 | ||||||||||||||||||
Weight Watchers International, Inc. | 293 | 4,487 | 4,780 | 9,649 | 147,757 | 157,406 | ||||||||||||||||||
|
|
|
|
|
| |||||||||||||||||||
| 170,172 | 2,210,819 | 2,380,991 | ||||||||||||||||||||||
|
|
|
|
|
| |||||||||||||||||||
Hotels, Restaurants & Leisure (0.4%) | ||||||||||||||||||||||||
Carnival Corp. | 12,114 | 150,148 | 162,262 | 486,619 | 6,031,445 | 6,518,064 | ||||||||||||||||||
Choice Hotels International, Inc. | 717 | 9,485 | 10,202 | 35,212 | 465,808 | 501,020 | ||||||||||||||||||
Darden Restaurants, Inc. | 1,272 | 16,260 | 17,532 | 69,159 | 884,056 | 953,215 | ||||||||||||||||||
Hyatt Hotels Corp., Class A* | 1,307 | 16,085 | 17,392 | 64,644 | 795,564 | 860,208 | ||||||||||||||||||
Marriott International, Inc., Class A | 817 | 9,832 | 10,649 | 40,327 | 485,308 | 525,635 | ||||||||||||||||||
McDonald’s Corp. | 12,655 | 36,500 | 49,155 | 1,227,915 | 3,541,595 | 4,769,510 | ||||||||||||||||||
MGM Resorts International* | 10,742 | 133,620 | 144,362 | 252,652 | 3,142,742 | 3,395,394 | ||||||||||||||||||
Norwegian Cruise Line Holdings Ltd.* | 59 | 623 | 682 | 2,093 | 22,098 | 24,191 | ||||||||||||||||||
Penn National Gaming, Inc.* | 1,959 | 24,412 | 26,371 | 28,072 | 349,824 | 377,896 | ||||||||||||||||||
Royal Caribbean Cruises Ltd | 4,735 | 58,751 | 63,486 | 224,534 | 2,785,973 | 3,010,507 | ||||||||||||||||||
Starwood Hotels & Resorts Worldwide, Inc. | 3,266 | 40,283 | 43,549 | 259,484 | 3,200,484 | 3,459,968 | ||||||||||||||||||
Wendy’s Co. | 8,163 | 101,729 | 109,892 | 71,181 | 887,077 | 958,258 | ||||||||||||||||||
|
|
|
|
|
| |||||||||||||||||||
| 2,761,892 | 22,591,974 | 25,353,866 | ||||||||||||||||||||||
|
|
|
|
|
| |||||||||||||||||||
See Notes to Pro-forma Combined Financial Statements.
30
| Multimanager Large Cap Value Number of Shares | EQ/Large Cap Value PLUS Number of Shares | Pro-forma Combined Shares | Multimanager Value ($) (Note 1) | EQ/Large Cap Value ($) (Note 1) | Pro-forma Value ($) (Note 1) | |||||||||||||||||||
Household Durables (0.8%) | ||||||||||||||||||||||||
D.R. Horton, Inc.* | 8,097 | 101,368 | 109,465 | 180,725 | 2,262,534 | 2,443,259 | ||||||||||||||||||
Garmin Ltd. | 3,493 | 65,617 | 69,110 | 161,447 | 3,032,818 | 3,194,265 | ||||||||||||||||||
Harman International Industries, Inc. | 1,959 | 24,454 | 26,413 | 160,344 | 2,001,560 | 2,161,904 | ||||||||||||||||||
Leggett & Platt, Inc. | 4,114 | 51,377 | 55,491 | 127,287 | 1,589,604 | 1,716,891 | ||||||||||||||||||
Lennar Corp., Class A | 4,800 | 59,486 | 64,286 | 189,888 | 2,353,266 | 2,543,154 | ||||||||||||||||||
Mohawk Industries, Inc.* | 1,797 | 21,790 | 23,587 | 267,573 | 3,244,531 | 3,512,104 | ||||||||||||||||||
Newell Rubbermaid, Inc. | 3,493 | 383,707 | 387,200 | 113,208 | 12,435,944 | 12,549,152 | ||||||||||||||||||
NVR, Inc.* | 66 | 340 | 406 | 67,717 | 348,843 | 416,560 | ||||||||||||||||||
PulteGroup, Inc. | 63,200 | 501,500 | 564,700 | 1,287,384 | 10,215,555 | 11,502,939 | ||||||||||||||||||
Taylor Morrison Home Corp., Class A* | 31 | 1,377 | 1,408 | 696 | 30,914 | 31,610 | ||||||||||||||||||
Toll Brothers, Inc.* | 4,831 | 60,829 | 65,660 | 178,747 | 2,250,673 | 2,429,420 | ||||||||||||||||||
Whirlpool Corp. | 2,155 | 26,517 | 28,672 | 338,033 | 4,159,457 | 4,497,490 | ||||||||||||||||||
|
|
|
|
|
| |||||||||||||||||||
| 3,073,049 | 43,925,699 | 46,998,748 | ||||||||||||||||||||||
|
|
|
|
|
| |||||||||||||||||||
Internet & Catalog Retail (0.1%) | ||||||||||||||||||||||||
Liberty Interactive Corp.,* | 14,073 | 174,938 | 189,011 | 413,042 | 5,134,430 | 5,547,472 | ||||||||||||||||||
zulily, Inc., Class A* | 190 | 2,365 | 2,555 | 7,872 | 97,982 | 105,854 | ||||||||||||||||||
|
|
|
|
|
| |||||||||||||||||||
| 420,914 | 5,232,412 | 5,653,326 | ||||||||||||||||||||||
|
|
|
|
|
| |||||||||||||||||||
Leisure Equipment & Products (0.0%) | ||||||||||||||||||||||||
Hasbro, Inc. | 11,986 | 6,178 | 18,164 | 659,350 | 339,852 | 999,202 | ||||||||||||||||||
|
|
|
|
|
| |||||||||||||||||||
Media (3.5%) | ||||||||||||||||||||||||
CBS Corp. (Non-Voting), Class B | 1,469 | 18,566 | 20,035 | 93,634 | 1,183,397 | 1,277,031 | ||||||||||||||||||
Comcast Corp., Class A | 31,690 | 306,725 | 338,415 | 1,592,749 | 15,674,036 | 17,266,785 | ||||||||||||||||||
DreamWorks Animation SKG, Inc., Class A* | 2,090 | 26,542 | 28,632 | 74,195 | 942,241 | 1,016,436 | ||||||||||||||||||
Gannett Co., Inc. | 42,860 | 375,876 | 418,736 | 1,267,799 | 11,118,412 | 12,386,211 | ||||||||||||||||||
Graham Holdings Co., Class B* | 197 | 1,629 | 1,826 | 130,674 | 1,080,548 | 1,211,222 | ||||||||||||||||||
Interpublic Group of Cos., Inc. | 6,759 | 83,964 | 90,723 | 119,634 | 1,486,163 | 1,605,797 | ||||||||||||||||||
John Wiley & Sons, Inc., Class A | 1,272 | 16,340 | 17,612 | 70,214 | 901,968 | 972,182 | ||||||||||||||||||
Liberty Global plc* | 10,352 | 87,200 | 97,552 | 872,881 | 7,352,704 | 8,225,585 | ||||||||||||||||||
Liberty Global plc, Class A* | 7,772 | 70,587 | 78,359 | 691,630 | 6,281,537 | 6,973,167 | ||||||||||||||||||
Liberty Media Corp., Class A* | 2,986 | 36,270 | 39,256 | 437,300 | 5,311,741 | 5,749,041 | ||||||||||||||||||
News Corp., Class A* | 3,772 | 46,960 | 50,732 | 67,971 | 846,219 | 914,190 | ||||||||||||||||||
Omnicom Group, Inc. | 21,093 | — | 21,093 | 1,568,686 | — | 1,568,686 | ||||||||||||||||||
Regal Entertainment Group, Class A | 18,208 | 153,084 | 171,292 | 354,146 | 2,977,484 | 3,331,630 | ||||||||||||||||||
Sirius XM Holdings, Inc.* | 47,182 | 585,078 | 632,260 | 164,665 | 2,041,922 | 2,206,587 | ||||||||||||||||||
Starz, Class A* | 306 | 4,762 | 5,068 | 8,947 | 139,241 | 148,188 | ||||||||||||||||||
Thomson Reuters Corp | 10,807 | 134,129 | 144,936 | 408,721 | 5,072,759 | 5,481,480 | ||||||||||||||||||
Time Warner, Inc. | 117,091 | 545,647 | 662,738 | 8,163,585 | 38,042,509 | 46,206,094 | ||||||||||||||||||
Twenty-First Century Fox, Inc., Class A | 47,920 | 522,548 | 570,468 | 1,685,826 | 18,383,239 | 20,069,065 | ||||||||||||||||||
Viacom, Inc., Class B | 76,998 | 332,743 | 409,741 | 6,725,005 | 29,061,774 | 35,786,779 | ||||||||||||||||||
Walt Disney Co. | 64,168 | 503,429 | 567,597 | 4,902,435 | 38,461,975 | 43,364,410 | ||||||||||||||||||
|
|
|
|
|
| |||||||||||||||||||
| 29,400,697 | 186,359,869 | 215,760,566 | ||||||||||||||||||||||
|
|
|
|
|
| |||||||||||||||||||
Multiline Retail (0.5%) | ||||||||||||||||||||||||
Big Lots, Inc.* | 1,241 | 15,414 | 16,655 | 40,072 | 497,718 | 537,790 | ||||||||||||||||||
Dillard’s, Inc., Class A | 228 | 3,187 | 3,415 | 22,164 | 309,808 | 331,972 | ||||||||||||||||||
J.C. Penney Co., Inc.* | 4,897 | 61,480 | 66,377 | 44,808 | 562,542 | 607,350 | ||||||||||||||||||
Kohl’s Corp. | 12,395 | 163,944 | 176,339 | 703,416 | 9,303,822 | 10,007,238 | ||||||||||||||||||
Macy’s, Inc. | 19,948 | 230,488 | 250,436 | 1,065,223 | 12,308,059 | 13,373,282 | ||||||||||||||||||
Sears Holdings Corp.* | 1,307 | 15,661 | 16,968 | 64,095 | 768,016 | 832,111 | ||||||||||||||||||
Target Corp. | 33,950 | 49,878 | 83,828 | 2,148,017 | 3,155,781 | 5,303,798 | ||||||||||||||||||
|
|
|
|
|
| |||||||||||||||||||
| 4,087,795 | 26,905,746 | 30,993,541 | ||||||||||||||||||||||
|
|
|
|
|
| |||||||||||||||||||
See Notes to Pro-forma Combined Financial Statements.
31
| Multimanager Large Cap Value Number of Shares | EQ/Large Cap Value PLUS Number of Shares | Pro-forma Combined Number of Shares | Multimanager Value ($) (Note 1) | EQ/Large Cap Value ($) (Note 1) | Pro-forma Value ($) (Note 1) | |||||||||||||||||||
Specialty Retail (1.1%) | ||||||||||||||||||||||||
Aaron’s, Inc. | 1,828 | 23,214 | 25,042 | 53,743 | 682,492 | 736,235 | ||||||||||||||||||
Abercrombie & Fitch Co., Class A | 1,959 | 24,848 | 26,807 | 64,471 | 817,748 | 882,219 | ||||||||||||||||||
Advance Auto Parts, Inc. | 7,572 | — | 7,572 | 838,069 | — | 838,069 | ||||||||||||||||||
American Eagle Outfitters, Inc. | 1,959 | 24,678 | 26,637 | 28,210 | 355,363 | 383,573 | ||||||||||||||||||
Ascena Retail Group, Inc.* | 3,135 | 39,248 | 42,383 | 66,337 | 830,488 | 896,825 | ||||||||||||||||||
Best Buy Co., Inc. | 5,780 | 71,981 | 77,761 | 230,506 | 2,870,602 | 3,101,108 | ||||||||||||||||||
Chico’s FAS, Inc. | 228 | 3,823 | 4,051 | 4,296 | 72,025 | 76,321 | ||||||||||||||||||
CST Brands, Inc. | 1,682 | 21,722 | 23,404 | 61,763 | 797,632 | 859,395 | ||||||||||||||||||
DSW, Inc., Class A | 262 | 2,282 | 2,544 | 11,195 | 97,510 | 108,705 | ||||||||||||||||||
Foot Locker, Inc. | 3,786 | 47,619 | 51,405 | 156,892 | 1,973,331 | 2,130,223 | ||||||||||||||||||
GameStop Corp., Class A | 24,228 | 204,868 | 229,096 | 1,193,471 | 10,091,798 | 11,285,269 | ||||||||||||||||||
Guess?, Inc. | 1,631 | 21,399 | 23,030 | 50,675 | 664,867 | 715,542 | ||||||||||||||||||
Home Depot, Inc. | — | 168,500 | 168,500 | — | 13,874,290 | 13,874,290 | ||||||||||||||||||
Lowe’s Cos., Inc. | 7,600 | 100,700 | 108,300 | 376,580 | 4,989,685 | 5,366,265 | ||||||||||||||||||
Murphy USA, Inc.* | 1,354 | 17,176 | 18,530 | 56,272 | 713,834 | 770,106 | ||||||||||||||||||
Signet Jewelers Ltd | 2,155 | 26,542 | 28,697 | 169,598 | 2,088,855 | 2,258,453 | ||||||||||||||||||
Staples, Inc. | 65,126 | 238,564 | 303,690 | 1,034,852 | 3,790,782 | 4,825,634 | ||||||||||||||||||
TJX Cos., Inc. | 28,500 | 300,300 | 328,800 | 1,816,305 | 19,138,119 | 20,954,424 | ||||||||||||||||||
|
|
|
|
|
| |||||||||||||||||||
| 6,213,235 | 63,849,421 | 70,062,656 | ||||||||||||||||||||||
|
|
|
|
|
| |||||||||||||||||||
Textiles, Apparel & Luxury Goods (0.1%) | ||||||||||||||||||||||||
Deckers Outdoor Corp.* | 555 | 6,968 | 7,523 | 46,875 | 588,517 | 635,392 | ||||||||||||||||||
NIKE, Inc., Class B | — | 46,400 | 46,400 | — | 3,648,896 | 3,648,896 | ||||||||||||||||||
PVH Corp. | 328 | 3,354 | 3,682 | 44,615 | 456,211 | 500,826 | ||||||||||||||||||
|
|
|
|
|
| |||||||||||||||||||
| 91,490 | 4,693,624 | 4,785,114 | ||||||||||||||||||||||
|
|
|
|
|
| |||||||||||||||||||
Total Consumer Discretionary | 64,950,297 | 461,590,047 | 526,540,344 | |||||||||||||||||||||
|
|
|
|
|
| |||||||||||||||||||
Consumer Staples (5.6%) | ||||||||||||||||||||||||
Beverages (0.3%) | ||||||||||||||||||||||||
Beam, Inc. | 4,669 | 57,876 | 62,545 | 317,772 | 3,939,040 | 4,256,812 | ||||||||||||||||||
Coca-Cola Enterprises, Inc. | 10,841 | — | 10,841 | 478,413 | — | 478,413 | ||||||||||||||||||
Constellation Brands, Inc., Class A* | 228 | 3,320 | 3,548 | 16,047 | 233,662 | 249,709 | ||||||||||||||||||
Diageo plc | 61,006 | — | 61,006 | 2,020,458 | — | 2,020,458 | ||||||||||||||||||
Dr. Pepper Snapple Group, Inc. | 11,874 | — | 11,874 | 578,501 | — | 578,501 | ||||||||||||||||||
Molson Coors Brewing Co., Class B | 4,049 | 50,273 | 54,322 | 227,352 | 2,822,829 | 3,050,181 | ||||||||||||||||||
PepsiCo, Inc. | — | 110,900 | 110,900 | — | 9,198,046 | 9,198,046 | ||||||||||||||||||
|
|
|
|
|
| |||||||||||||||||||
| 3,638,543 | 16,193,577 | 19,832,120 | ||||||||||||||||||||||
|
|
|
|
|
| |||||||||||||||||||
Food & Staples Retailing (2.0%) | ||||||||||||||||||||||||
CVS Caremark Corp. | 123,330 | 546,531 | 669,861 | 8,826,728 | 39,115,224 | 47,941,952 | ||||||||||||||||||
Kroger Co. | 43,300 | 793,800 | 837,100 | 1,711,649 | 31,378,914 | 33,090,563 | ||||||||||||||||||
Safeway, Inc. | 6,366 | 79,917 | 86,283 | 207,341 | 2,602,897 | 2,810,238 | ||||||||||||||||||
Sprouts Farmers Market, Inc.* | 206 | 2,223 | 2,429 | 7,916 | 85,430 | 93,346 | ||||||||||||||||||
Sysco Corp. | 11,232 | 139,518 | 150,750 | 405,475 | 5,036,600 | 5,442,075 | ||||||||||||||||||
Walgreen Co. | 6,759 | 107,999 | 114,758 | 388,237 | 6,203,462 | 6,591,699 | ||||||||||||||||||
Wal-Mart Stores, Inc. | 15,698 | 307,476 | 323,174 | 1,235,276 | 24,195,286 | 25,430,562 | ||||||||||||||||||
|
|
|
|
|
| |||||||||||||||||||
| 12,782,622 | 108,617,813 | 121,400,435 | ||||||||||||||||||||||
|
|
|
|
|
| |||||||||||||||||||
Food Products (1.0%) | ||||||||||||||||||||||||
Archer-Daniels-Midland Co. | 17,632 | 218,837 | 236,469 | 765,229 | 9,497,526 | 10,262,755 | ||||||||||||||||||
Bunge Ltd. | 4,311 | 52,903 | 57,214 | 353,976 | 4,343,865 | 4,697,841 | ||||||||||||||||||
Campbell Soup Co. | 1,731 | 21,520 | 23,251 | 74,918 | 931,386 | 1,006,304 | ||||||||||||||||||
ConAgra Foods, Inc. | 848 | 11,272 | 12,120 | 28,578 | 379,866 | 408,444 | ||||||||||||||||||
See Notes to Pro-forma Combined Financial Statements.
32
| Multimanager Large Cap Value Number of Shares | EQ/Large Cap Value PLUS Number of Shares | Pro-forma Combined | Multimanager Value ($) (Note 1) | EQ/Large Cap Value ($) (Note 1) | Pro-forma Value ($) (Note 1) | |||||||||||||||||||
Danone S.A. | 14,345 | — | 14,345 | 1,032,505 | — | 1,032,505 | ||||||||||||||||||
Dean Foods Co.* | 2,610 | 33,585 | 36,195 | 44,866 | 577,326 | 622,192 | ||||||||||||||||||
General Mills, Inc. | 35,265 | — | 35,265 | 1,760,076 | — | 1,760,076 | ||||||||||||||||||
Ingredion, Inc. | 1,959 | 24,497 | 26,456 | 134,113 | 1,677,065 | 1,811,178 | ||||||||||||||||||
J.M. Smucker Co. | 2,710 | 33,561 | 36,271 | 280,810 | 3,477,591 | 3,758,401 | ||||||||||||||||||
Kellogg Co. | 6,796 | 7,299 | 14,095 | 415,032 | 445,750 | 860,782 | ||||||||||||||||||
Kraft Foods Group, Inc. | — | 39,300 | 39,300 | — | 2,119,056 | 2,119,056 | ||||||||||||||||||
Mondelez International, Inc., Class A | 51,655 | 758,974 | 810,629 | 1,823,421 | 26,791,782 | 28,615,203 | ||||||||||||||||||
Nestle S.A. (Registered) | 30,702 | — | 30,702 | 2,247,453 | — | 2,247,453 | ||||||||||||||||||
Pinnacle Foods, Inc. | 359 | 5,122 | 5,481 | 9,858 | 140,650 | 150,508 | ||||||||||||||||||
Tyson Foods, Inc., Class A | 8,031 | 100,625 | 108,656 | 268,717 | 3,366,912 | 3,635,629 | ||||||||||||||||||
|
|
|
|
|
| |||||||||||||||||||
| 9,239,552 | 53,748,775 | 62,988,327 | ||||||||||||||||||||||
|
|
|
|
|
| |||||||||||||||||||
Household Products (1.9%) | ||||||||||||||||||||||||
Clorox Co. | 686 | 7,791 | 8,477 | 63,633 | 722,693 | 786,326 | ||||||||||||||||||
Colgate-Palmolive Co. | — | 19,800 | 19,800 | — | 1,291,158 | 1,291,158 | ||||||||||||||||||
Energizer Holdings, Inc. | 1,862 | 118,846 | 120,708 | 201,543 | 12,863,891 | 13,065,434 | ||||||||||||||||||
Kimberly-Clark Corp. | 1,828 | 61,224 | 63,052 | 190,953 | 6,395,459 | 6,586,412 | ||||||||||||||||||
Procter & Gamble Co. | 101,759 | 1,112,792 | 1,214,551 | 8,284,200 | 90,592,397 | 98,876,597 | ||||||||||||||||||
|
|
|
|
|
| |||||||||||||||||||
| 8,740,329 | 111,865,598 | 120,605,927 | ||||||||||||||||||||||
|
|
|
|
|
| |||||||||||||||||||
Personal Products (0.0%) | ||||||||||||||||||||||||
Coty, Inc., Class A | 548 | 6,937 | 7,485 | 8,357 | 105,789 | 114,146 | ||||||||||||||||||
|
|
|
|
|
| |||||||||||||||||||
Tobacco (0.4%) | ||||||||||||||||||||||||
Altria Group, Inc. | 15,602 | — | 15,602 | 598,961 | — | 598,961 | ||||||||||||||||||
Imperial Tobacco Group plc | 6,364 | — | 6,364 | 246,389 | — | 246,389 | ||||||||||||||||||
Lorillard, Inc. | 29,666 | — | 29,666 | 1,503,473 | — | 1,503,473 | ||||||||||||||||||
Philip Morris International, Inc. | 63,280 | 192,600 | 255,880 | 5,513,586 | 16,781,238 | 22,294,824 | ||||||||||||||||||
Reynolds American, Inc. | 2,221 | 27,537 | 29,758 | 111,028 | 1,376,575 | 1,487,603 | ||||||||||||||||||
|
|
|
|
|
| |||||||||||||||||||
| 7,973,437 | 18,157,813 | 26,131,250 | ||||||||||||||||||||||
|
|
|
|
|
| |||||||||||||||||||
Total Consumer Staples | 42,382,840 | 308,689,365 | 351,072,205 | |||||||||||||||||||||
|
|
|
|
|
| |||||||||||||||||||
Energy (13.2%) | ||||||||||||||||||||||||
Energy Equipment & Services (1.0%) | ||||||||||||||||||||||||
Atwood Oceanics, Inc.* | 1,338 | 16,786 | 18,124 | 71,436 | 896,205 | 967,641 | ||||||||||||||||||
Baker Hughes, Inc. | 11,978 | 148,813 | 160,791 | 661,904 | 8,223,407 | 8,885,311 | ||||||||||||||||||
Cameron International Corp.* | 2,710 | 33,002 | 35,712 | 161,326 | 1,964,609 | 2,125,935 | ||||||||||||||||||
Diamond Offshore Drilling, Inc. | 1,959 | 24,744 | 26,703 | 111,506 | 1,408,429 | 1,519,935 | ||||||||||||||||||
Frank’s International N.V | 462 | 6,895 | 7,357 | 12,474 | 186,165 | 198,639 | ||||||||||||||||||
Halliburton Co. | 93,192 | 321,507 | 414,699 | 4,729,494 | 16,316,480 | 21,045,974 | ||||||||||||||||||
Helmerich & Payne, Inc. | 2,776 | 34,107 | 36,883 | 233,406 | 2,867,717 | 3,101,123 | ||||||||||||||||||
McDermott International, Inc.* | 6,825 | 85,025 | 91,850 | 62,517 | 778,829 | 841,346 | ||||||||||||||||||
Nabors Industries Ltd | 45,056 | 105,869 | 150,925 | 765,502 | 1,798,714 | 2,564,216 | ||||||||||||||||||
National Oilwell Varco, Inc. | 12,408 | 153,497 | 165,905 | 986,808 | 12,207,617 | 13,194,425 | ||||||||||||||||||
Oil States International, Inc.* | 1,600 | 19,814 | 21,414 | 162,752 | 2,015,480 | 2,178,232 | ||||||||||||||||||
Patterson-UTI Energy, Inc. | 4,245 | 52,804 | 57,049 | 107,483 | 1,336,997 | 1,444,480 | ||||||||||||||||||
Rowan Cos., plc, | 3,559 | 44,687 | 48,246 | 125,846 | 1,580,132 | 1,705,978 | ||||||||||||||||||
RPC, Inc. | 293 | 4,480 | 4,773 | 5,230 | 79,968 | 85,198 | ||||||||||||||||||
Superior Energy Services, Inc.* | 4,604 | 57,358 | 61,962 | 122,513 | 1,526,296 | 1,648,809 | ||||||||||||||||||
Tidewater, Inc. | 1,404 | 17,879 | 19,283 | 83,215 | 1,059,688 | 1,142,903 | ||||||||||||||||||
Unit Corp.* | 1,404 | 17,699 | 19,103 | 72,475 | 913,622 | 986,097 | ||||||||||||||||||
|
|
|
|
|
| |||||||||||||||||||
| 8,475,887 | 55,160,355 | 63,636,242 | ||||||||||||||||||||||
|
|
|
|
|
| |||||||||||||||||||
See Notes to Pro-forma Combined Financial Statements.
33
| Multimanager Large Cap Value Number of Shares | EQ/Large Cap Value PLUS Number of Shares | Pro-forma Combined | Multimanager Value ($) (Note 1) | EQ/Large Cap Value ($) (Note 1) | Pro-forma Value ($) (Note 1) | |||||||||||||||||||
Oil, Gas & Consumable Fuels (12.2%) | ||||||||||||||||||||||||
Anadarko Petroleum Corp. | 13,780 | 170,326 | 184,106 | 1,093,030 | 13,510,258 | 14,603,288 | ||||||||||||||||||
Antero Resources Corp.* | 596 | 7,394 | 7,990 | 37,810 | 469,075 | 506,885 | ||||||||||||||||||
Apache Corp. | 18,595 | 227,919 | 246,514 | 1,598,054 | 19,587,359 | 21,185,413 | ||||||||||||||||||
Chesapeake Energy Corp. | 24,284 | 208,199 | 232,483 | 659,068 | 5,650,521 | 6,309,589 | ||||||||||||||||||
Chevron Corp. | 98,142 | 843,174 | 941,316 | 12,258,917 | 105,320,864 | 117,579,781 | ||||||||||||||||||
Cimarex Energy Co. | 2,514 | 31,058 | 33,572 | 263,744 | 3,258,295 | 3,522,039 | ||||||||||||||||||
Cobalt International Energy, Inc.* | 586 | 369,877 | 370,463 | 9,640 | 6,084,477 | 6,094,117 | ||||||||||||||||||
ConocoPhillips Co. | 35,451 | 439,302 | 474,753 | 2,504,613 | 31,036,686 | 33,541,299 | ||||||||||||||||||
CONSOL Energy, Inc. | 6,562 | 82,168 | 88,730 | 249,618 | 3,125,671 | 3,375,289 | ||||||||||||||||||
Denbury Resources, Inc.* | 10,778 | 134,146 | 144,924 | 177,083 | 2,204,019 | 2,381,102 | ||||||||||||||||||
Devon Energy Corp. | 11,721 | 145,920 | 157,641 | 725,178 | 9,028,070 | 9,753,248 | ||||||||||||||||||
Encana Corp. | 85,851 | — | 85,851 | 1,549,611 | — | 1,549,611 | ||||||||||||||||||
Energen Corp. | 2,090 | 25,998 | 28,088 | 147,867 | 1,839,359 | 1,987,226 | ||||||||||||||||||
EOG Resources, Inc. | 3,233 | 6,348 | 9,581 | 542,627 | 1,065,448 | 1,608,075 | ||||||||||||||||||
EQT Corp. | 359 | 4,654 | 5,013 | 32,231 | 417,836 | 450,067 | ||||||||||||||||||
Exxon Mobil Corp. | 265,410 | 1,997,144 | 2,262,554 | 26,859,492 | 202,110,973 | 228,970,465 | ||||||||||||||||||
Golar LNG Ltd. | 1,207 | 15,811 | 17,018 | 43,802 | 573,781 | 617,583 | ||||||||||||||||||
Gulfport Energy Corp.* | 424 | 139,519 | 139,943 | 26,776 | 8,810,625 | 8,837,401 | ||||||||||||||||||
Hess Corp. | 34,214 | 305,791 | 340,005 | 2,839,762 | 25,380,653 | 28,220,415 | ||||||||||||||||||
HollyFrontier Corp. | 8,990 | 72,981 | 81,971 | 446,713 | 3,626,426 | 4,073,139 | ||||||||||||||||||
Kinder Morgan, Inc. | 1,600 | 20,058 | 21,658 | 57,600 | 722,088 | 779,688 | ||||||||||||||||||
Laredo Petroleum Holdings, Inc.* | 131 | 1,725 | 1,856 | 3,627 | 47,765 | 51,392 | ||||||||||||||||||
Marathon Oil Corp. | 120,230 | 1,000,128 | 1,120,358 | 4,244,119 | 35,304,518 | 39,548,637 | ||||||||||||||||||
Marathon Petroleum Corp. | 30,731 | 425,377 | 456,108 | 2,818,955 | 39,019,832 | 41,838,787 | ||||||||||||||||||
Murphy Oil Corp. | 5,518 | 68,704 | 74,222 | 358,008 | 4,457,516 | 4,815,524 | ||||||||||||||||||
Newfield Exploration Co.* | 3,852 | 48,679 | 52,531 | 94,875 | 1,198,964 | 1,293,839 | ||||||||||||||||||
Noble Energy, Inc. | 9,111 | 112,483 | 121,594 | 620,550 | 7,661,217 | 8,281,767 | ||||||||||||||||||
Occidental Petroleum Corp. | 64,988 | 435,695 | 500,683 | 6,180,359 | 41,434,595 | 47,614,954 | ||||||||||||||||||
PBF Energy, Inc., Class A | 680 | 8,538 | 9,218 | 21,393 | 268,606 | 289,999 | ||||||||||||||||||
Peabody Energy Corp. | 7,804 | 96,936 | 104,740 | 152,412 | 1,893,160 | 2,045,572 | ||||||||||||||||||
Phillips 66 | 27,094 | 296,260 | 323,354 | 2,089,760 | 22,850,534 | 24,940,294 | ||||||||||||||||||
Pioneer Natural Resources Co. | 1,045 | 12,881 | 13,926 | 192,353 | 2,371,006 | 2,563,359 | ||||||||||||||||||
QEP Resources, Inc. | 4,669 | 57,934 | 62,603 | 143,105 | 1,775,677 | 1,918,782 | ||||||||||||||||||
SandRidge Energy, Inc.* | 14,235 | 177,579 | 191,814 | 86,406 | 1,077,905 | 1,164,311 | ||||||||||||||||||
Southwestern Energy Co.* | 55,958 | — | 55,958 | 2,200,828 | — | 2,200,828 | ||||||||||||||||||
Spectra Energy Corp. | 19,329 | 240,497 | 259,826 | 688,499 | 8,566,503 | 9,255,002 | ||||||||||||||||||
Suncor Energy, Inc. | — | 319,833 | 319,833 | — | 11,210,147 | 11,210,147 | ||||||||||||||||||
Teekay Corp. | 1,110 | 13,683 | 14,793 | 53,291 | 656,921 | 710,212 | ||||||||||||||||||
Tesoro Corp. | 3,917 | 48,816 | 52,733 | 229,145 | 2,855,736 | 3,084,881 | ||||||||||||||||||
Total S.A. (ADR) | — | 182,181 | 182,181 | — | 11,162,230 | 11,162,230 | ||||||||||||||||||
Ultra Petroleum Corp.* | 4,342 | 54,960 | 59,302 | 94,004 | 1,189,884 | 1,283,888 | ||||||||||||||||||
Valero Energy Corp. | 56,296 | 693,968 | 750,264 | 2,837,318 | 34,975,987 | 37,813,305 | ||||||||||||||||||
Whiting Petroleum Corp.* | 3,135 | 39,013 | 42,148 | 193,962 | 2,413,734 | 2,607,696 | ||||||||||||||||||
Williams Cos., Inc. | 8,914 | 110,699 | 119,613 | 343,813 | 4,269,660 | 4,613,473 | ||||||||||||||||||
World Fuel Services Corp. | 1,731 | 21,159 | 22,890 | 74,710 | 913,222 | 987,932 | ||||||||||||||||||
WPX Energy, Inc.* | 5,757 | 71,946 | 77,703 | 117,328 | 1,466,259 | 1,583,587 | ||||||||||||||||||
|
|
|
|
|
| |||||||||||||||||||
| 75,962,056 | 682,864,062 | 758,826,118 | ||||||||||||||||||||||
|
|
|
|
|
| |||||||||||||||||||
Total Energy | 84,437,943 | 738,024,417 | 822,462,360 | |||||||||||||||||||||
|
|
|
|
|
| |||||||||||||||||||
See Notes to Pro-forma Combined Financial Statements.
34
| Multimanager Large Cap Value Number of Shares | EQ/Large Cap Value PLUS Number of Shares | Pro-forma Combined | Multimanager Value ($) (Note 1) | EQ/Large Cap Value ($) (Note 1) | Pro-forma Value ($) (Note 1) | |||||||||||||||||||
Financials (25.4%) | ||||||||||||||||||||||||
Capital Markets (2.6%) | ||||||||||||||||||||||||
American Capital Ltd.* | 8,718 | 108,907 | 117,625 | 136,349 | 1,703,306 | 1,839,655 | ||||||||||||||||||
Ameriprise Financial, Inc. | 3,983 | 49,380 | 53,363 | 458,244 | 5,681,169 | 6,139,413 | ||||||||||||||||||
Ares Capital Corp. | 7,738 | 96,371 | 104,109 | 137,504 | 1,712,513 | 1,850,017 | ||||||||||||||||||
Artisan Partners Asset Management, Inc., Class A | 162 | 2,657 | 2,819 | 10,561 | 173,210 | 183,771 | ||||||||||||||||||
Bank of New York Mellon Corp. | 87,890 | 417,004 | 504,894 | 3,070,877 | 14,570,120 | 17,640,997 | ||||||||||||||||||
BlackRock, Inc. | 6,285 | 30,402 | 36,687 | 1,989,014 | 9,621,321 | 11,610,335 | ||||||||||||||||||
Charles Schwab Corp. | 27,460 | 340,806 | 368,266 | 713,960 | 8,860,956 | 9,574,916 | ||||||||||||||||||
E*TRADE Financial Corp.* | 31,294 | 305,257 | 336,551 | 614,614 | 5,995,247 | 6,609,861 | ||||||||||||||||||
Federated Investors, Inc., Class B | 686 | 8,803 | 9,489 | 19,757 | 253,526 | 273,283 | ||||||||||||||||||
Franklin Resources, Inc. | 20,908 | — | 20,908 | 1,207,019 | — | 1,207,019 | ||||||||||||||||||
Goldman Sachs Group, Inc. | 34,976 | 194,155 | 229,131 | 6,199,846 | 34,415,915 | 40,615,761 | ||||||||||||||||||
Invesco Ltd. | 12,832 | 159,775 | 172,607 | 467,085 | 5,815,810 | 6,282,895 | ||||||||||||||||||
Legg Mason, Inc. | 3,200 | 40,015 | 43,215 | 139,136 | 1,739,852 | 1,878,988 | ||||||||||||||||||
LPL Financial Holdings, Inc. | 314 | 4,373 | 4,687 | 14,767 | 205,662 | 220,429 | ||||||||||||||||||
Morgan Stanley | 44,070 | 703,213 | 747,283 | 1,382,035 | 22,052,760 | 23,434,795 | ||||||||||||||||||
Northern Trust Corp. | 6,956 | 85,998 | 92,954 | 430,507 | 5,322,416 | 5,752,923 | ||||||||||||||||||
Raymond James Financial, Inc. | 3,493 | 43,837 | 47,330 | 182,300 | 2,287,853 | 2,470,153 | ||||||||||||||||||
SEI Investments Co. | 162 | 2,837 | 2,999 | 5,626 | 98,529 | 104,155 | ||||||||||||||||||
State Street Corp. | 37,602 | 232,533 | 270,135 | 2,759,611 | 17,065,597 | 19,825,208 | ||||||||||||||||||
TD Ameritrade Holding Corp. | 6,693 | 83,660 | 90,353 | 205,073 | 2,563,342 | 2,768,415 | ||||||||||||||||||
|
|
|
|
|
| |||||||||||||||||||
| 20,143,885 | 140,139,104 | 160,282,989 | ||||||||||||||||||||||
|
|
|
|
|
| |||||||||||||||||||
Commercial Banks (4.6%) |
| |||||||||||||||||||||||
Associated Banc-Corp. | 4,766 | 60,318 | 65,084 | 82,928 | 1,049,533 | 1,132,461 | ||||||||||||||||||
Bank of Hawaii Corp. | 1,272 | 16,156 | 17,428 | 75,226 | 955,466 | 1,030,692 | ||||||||||||||||||
BankUnited, Inc. | 1,828 | 23,180 | 25,008 | 60,178 | 763,086 | 823,264 | ||||||||||||||||||
BB&T Corp. | 20,343 | 252,147 | 272,490 | 759,201 | 9,410,126 | 10,169,327 | ||||||||||||||||||
BOK Financial Corp. | 817 | 9,527 | 10,344 | 54,184 | 631,831 | 686,015 | ||||||||||||||||||
CapitalSource, Inc. | 5,649 | 70,441 | 76,090 | 81,176 | 1,012,237 | 1,093,413 | ||||||||||||||||||
CIT Group, Inc. | 32,245 | 270,163 | 302,408 | 1,680,932 | 14,083,597 | 15,764,529 | ||||||||||||||||||
City National Corp./California | 1,338 | 16,801 | 18,139 | 105,996 | 1,330,975 | 1,436,971 | ||||||||||||||||||
Comerica, Inc. | 5,421 | 67,130 | 72,551 | 257,714 | 3,191,360 | 3,449,074 | ||||||||||||||||||
Commerce Bancshares, Inc./Missouri | 2,349 | 29,043 | 31,392 | 105,494 | 1,304,321 | 1,409,815 | ||||||||||||||||||
Cullen/Frost Bankers, Inc. | 1,535 | 18,732 | 20,267 | 114,250 | 1,394,223 | 1,508,473 | ||||||||||||||||||
East West Bancorp, Inc. | 3,952 | 48,977 | 52,929 | 138,201 | 1,712,726 | 1,850,927 | ||||||||||||||||||
Fifth Third Bancorp | 36,705 | 314,219 | 350,924 | 771,906 | 6,608,025 | 7,379,931 | ||||||||||||||||||
First Citizens BancShares, Inc./North Carolina, Class A | 262 | 2,770 | 3,032 | 58,329 | 616,685 | 675,014 | ||||||||||||||||||
First Horizon National Corp. | 6,981 | 86,711 | 93,692 | 81,329 | 1,010,183 | 1,091,512 | ||||||||||||||||||
First Niagara Financial Group, Inc. | 10,187 | 127,177 | 137,364 | 108,186 | 1,350,620 | 1,458,806 | ||||||||||||||||||
First Republic Bank/California | 3,397 | 41,916 | 45,313 | 177,833 | 2,194,303 | 2,372,136 | ||||||||||||||||||
Fulton Financial Corp. | 5,583 | 70,178 | 75,761 | 73,026 | 917,928 | 990,954 | ||||||||||||||||||
Huntington Bancshares, Inc./Ohio | 24,260 | 301,341 | 325,601 | 234,109 | 2,907,941 | 3,142,050 | ||||||||||||||||||
KeyCorp. | 43,612 | 330,714 | 374,326 | 585,273 | 4,438,182 | 5,023,455 | ||||||||||||||||||
M&T Bank Corp. | 3,799 | 46,372 | 50,171 | 442,280 | 5,398,628 | 5,840,908 | ||||||||||||||||||
PNC Financial Services Group, Inc. | 85,218 | 190,242 | 275,460 | 6,611,212 | 14,758,974 | 21,370,186 | ||||||||||||||||||
Popular, Inc.* | 2,951 | 37,089 | 40,040 | 84,782 | 1,065,567 | 1,150,349 | ||||||||||||||||||
Regions Financial Corp. | 65,942 | 1,192,053 | 1,257,995 | 652,166 | 11,789,404 | 12,441,570 | ||||||||||||||||||
Signature Bank/New York* | 1,207 | 15,410 | 16,617 | 129,656 | 1,655,342 | 1,784,998 | ||||||||||||||||||
SunTrust Banks, Inc. | 28,173 | 194,084 | 222,257 | 1,037,048 | 7,144,232 | 8,181,280 | ||||||||||||||||||
SVB Financial Group* | 1,372 | 16,278 | 17,650 | 143,868 | 1,706,911 | 1,850,779 | ||||||||||||||||||
See Notes to Pro-forma Combined Financial Statements.
35
| Multimanager Large Cap Value Number of Shares | EQ/Large Cap Value PLUS Number of Shares | Pro-forma Combined | Multimanager
(Note1) | EQ/Large Cap
(Note1) | Pro-forma
(Note1) | |||||||||||||||||||
Synovus Financial Corp. | 28,287 | 351,458 | 379,745 | 101,833 | 1,265,249 | 1,367,082 | ||||||||||||||||||
TCF Financial Corp. | 4,735 | 58,901 | 63,636 | 76,944 | 957,141 | 1,034,085 | ||||||||||||||||||
U.S. Bancorp/Minnesota | 69,918 | 811,103 | 881,021 | 2,824,687 | 32,768,561 | 35,593,248 | ||||||||||||||||||
Valley National Bancorp. | 5,727 | 71,666 | 77,393 | 57,957 | 725,260 | 783,217 | ||||||||||||||||||
Wells Fargo & Co. | 308,589 | 2,601,709 | 2,910,298 | 14,009,941 | 118,117,589 | 132,127,530 | ||||||||||||||||||
Zions Bancorp | 5,255 | 66,259 | 71,514 | 157,440 | 1,985,120 | 2,142,560 | ||||||||||||||||||
|
|
|
|
|
| |||||||||||||||||||
| 31,935,285 | 256,221,326 | 288,156,611 | ||||||||||||||||||||||
|
|
|
|
|
| |||||||||||||||||||
Consumer Finance (1.5%) |
| |||||||||||||||||||||||
Capital One Financial Corp. | 101,263 | 600,199 | 701,462 | 7,757,758 | 45,981,246 | 53,739,004 | ||||||||||||||||||
Discover Financial Services | 36,770 | 645,376 | 682,146 | 2,057,282 | 36,108,787 | 38,166,069 | ||||||||||||||||||
SLM Corp. | 12,832 | 159,661 | 172,493 | 337,225 | 4,195,891 | 4,533,116 | ||||||||||||||||||
|
|
|
|
|
| |||||||||||||||||||
| 10,152,265 | 86,285,924 | 96,438,189 | ||||||||||||||||||||||
|
|
|
|
|
| |||||||||||||||||||
Diversified Financial Services (6.3%) | ||||||||||||||||||||||||
Bank of America Corp. | 819,027 | 5,125,058 | 5,944,085 | 12,752,250 | 79,797,153 | 92,549,403 | ||||||||||||||||||
Citigroup, Inc. | 233,259 | 2,081,717 | 2,314,976 | 12,155,127 | 108,478,273 | 120,633,400 | ||||||||||||||||||
CME Group, Inc./Illinois | 9,242 | 113,866 | 123,108 | 725,127 | 8,933,926 | 9,659,053 | ||||||||||||||||||
ING US, Inc. | 11,355 | 95,106 | 106,461 | 399,128 | 3,342,976 | 3,742,104 | ||||||||||||||||||
Interactive Brokers Group, Inc., Class A | 1,272 | 16,822 | 18,094 | 30,961 | 409,448 | 440,409 | ||||||||||||||||||
IntercontinentalExchange Group, Inc. | 1,428 | 16,255 | 17,683 | 321,186 | 3,656,075 | 3,977,261 | ||||||||||||||||||
JPMorgan Chase & Co. | 280,791 | 2,020,053 | 2,300,844 | 16,420,658 | 118,132,699 | 134,553,357 | ||||||||||||||||||
Leucadia National Corp. | 7,329 | 91,976 | 99,305 | 207,704 | 2,606,600 | 2,814,304 | ||||||||||||||||||
McGraw Hill Financial, Inc. | 10,985 | 70,127 | 81,112 | 859,027 | 5,483,931 | 6,342,958 | ||||||||||||||||||
Moody’s Corp. | 6,722 | — | 6,722 | 527,475 | — | 527,475 | ||||||||||||||||||
MSCI, Inc.* | 2,024 | 25,231 | 27,255 | 88,489 | 1,103,099 | 1,191,588 | ||||||||||||||||||
NASDAQ OMX Group, Inc. | 16,419 | 298,987 | 315,406 | 653,476 | 11,899,683 | 12,553,159 | ||||||||||||||||||
|
|
|
|
|
| |||||||||||||||||||
| 45,140,608 | 343,843,863 | 388,984,471 | ||||||||||||||||||||||
|
|
|
|
|
| |||||||||||||||||||
Insurance (7.9%) | ||||||||||||||||||||||||
ACE Ltd. | 58,302 | 226,827 | 285,129 | 6,036,006 | 23,483,399 | 29,519,405 | ||||||||||||||||||
Aflac, Inc. | 13,518 | 313,557 | 327,075 | 903,002 | 20,945,608 | 21,848,610 | ||||||||||||||||||
Alleghany Corp.* | 534 | 6,100 | 6,634 | 213,579 | 2,439,756 | 2,653,335 | ||||||||||||||||||
Allied World Assurance Co. Holdings AG | 686 | 8,404 | 9,090 | 77,388 | 948,055 | 1,025,443 | ||||||||||||||||||
Allstate Corp. | 13,584 | 168,426 | 182,010 | 740,871 | 9,185,954 | 9,926,825 | ||||||||||||||||||
American Financial Group, Inc./Ohio | 19,493 | 165,232 | 184,725 | 1,125,136 | 9,537,191 | 10,662,327 | ||||||||||||||||||
American International Group, Inc. | 84,640 | 814,710 | 899,350 | 4,320,872 | 41,590,945 | 45,911,817 | ||||||||||||||||||
American National Insurance Co. | 262 | 2,617 | 2,879 | 30,009 | 299,751 | 329,760 | ||||||||||||||||||
Aon plc | 32,934 | 175,342 | 208,276 | 2,762,833 | 14,709,440 | 17,472,273 | ||||||||||||||||||
Arch Capital Group Ltd.* | 3,624 | 44,840 | 48,464 | 216,317 | 2,676,500 | 2,892,817 | ||||||||||||||||||
Aspen Insurance Holdings Ltd. | 1,893 | 23,831 | 25,724 | 78,200 | 984,459 | 1,062,659 | ||||||||||||||||||
Assurant, Inc. | 12,186 | 106,483 | 118,669 | 808,785 | 7,067,277 | 7,876,062 | ||||||||||||||||||
Assured Guaranty Ltd. | 4,866 | 60,626 | 65,492 | 114,789 | 1,430,167 | 1,544,956 | ||||||||||||||||||
Axis Capital Holdings Ltd. | 2,579 | 31,915 | 34,494 | 122,683 | 1,518,196 | 1,640,879 | ||||||||||||||||||
Berkshire Hathaway, Inc., Class B* | 59,945 | 646,573 | 706,518 | 7,107,079 | 76,657,695 | 83,764,774 | ||||||||||||||||||
Brown & Brown, Inc. | 1,862 | 23,000 | 24,862 | 58,448 | 721,970 | 780,418 | ||||||||||||||||||
Chubb Corp. | 30,188 | 194,563 | 224,751 | 2,917,066 | 18,800,623 | 21,717,689 | ||||||||||||||||||
Cincinnati Financial Corp. | 4,735 | 58,786 | 63,521 | 247,972 | 3,078,623 | 3,326,595 | ||||||||||||||||||
CNA Financial Corp. | 717 | 9,505 | 10,222 | 30,752 | 407,669 | 438,421 | ||||||||||||||||||
Endurance Specialty Holdings Ltd. | 783 | 10,251 | 11,034 | 45,939 | 601,426 | 647,365 | ||||||||||||||||||
Everest Reinsurance Group Ltd. | 3,969 | 33,706 | 37,675 | 618,648 | 5,253,754 | 5,872,402 | ||||||||||||||||||
Fidelity National Financial, Inc., Class A | 6,562 | 81,793 | 88,355 | 212,937 | 2,654,183 | 2,867,120 | ||||||||||||||||||
Genworth Financial, Inc., Class A* | 88,935 | 1,375,093 | 1,464,028 | 1,381,161 | 21,355,194 | 22,736,355 | ||||||||||||||||||
Hanover Insurance Group, Inc. | 914 | 11,387 | 12,301 | 54,575 | 679,918 | 734,493 | ||||||||||||||||||
See Notes to Pro-forma Combined Financial Statements.
36
| Multimanager Large Cap Value Number of Shares | EQ/Large Cap Value PLUS Number of Shares | Pro-forma Combined | Multimanager Value ($) (Note 1) | EQ/Large Cap Value ($) (Note 1) | Pro-forma Value ($) (Note 1) | |||||||||||||||||||
Hartford Financial Services Group, Inc. | 13,125 | 500,794 | 513,919 | 475,519 | 18,143,767 | 18,619,286 | ||||||||||||||||||
HCC Insurance Holdings, Inc. | 2,873 | 36,071 | 38,944 | 132,560 | 1,664,316 | 1,796,876 | ||||||||||||||||||
Kemper Corp. | 1,338 | 17,117 | 18,455 | 54,697 | 699,743 | 754,440 | ||||||||||||||||||
Lincoln National Corp. | 37,138 | 514,415 | 551,553 | 1,917,064 | 26,554,102 | 28,471,166 | ||||||||||||||||||
Loews Corp. | 8,163 | 101,577 | 109,740 | 393,783 | 4,900,074 | 5,293,857 | ||||||||||||||||||
Markel Corp.* | 424 | 5,025 | 5,449 | 246,068 | 2,916,259 | 3,162,327 | ||||||||||||||||||
Marsh & McLennan Cos., Inc. | 5,290 | 65,782 | 71,072 | 255,824 | 3,181,217 | 3,437,041 | ||||||||||||||||||
MBIA, Inc.* | 4,049 | 50,974 | 55,023 | 48,345 | 608,630 | 656,975 | ||||||||||||||||||
Mercury General Corp. | 817 | 9,724 | 10,541 | 40,613 | 483,380 | 523,993 | ||||||||||||||||||
MetLife, Inc. | 73,334 | 394,639 | 467,973 | 3,954,169 | 21,278,935 | 25,233,104 | ||||||||||||||||||
Old Republic International Corp. | 7,511 | 93,280 | 100,791 | 129,715 | 1,610,946 | 1,740,661 | ||||||||||||||||||
PartnerReinsurance Ltd. | 15,652 | 127,796 | 143,448 | 1,650,190 | 13,473,532 | 15,123,722 | ||||||||||||||||||
Principal Financial Group, Inc. | 8,456 | 105,441 | 113,897 | 416,965 | 5,199,296 | 5,616,261 | ||||||||||||||||||
ProAssurance Corp. | 1,762 | 22,208 | 23,970 | 85,422 | 1,076,644 | 1,162,066 | ||||||||||||||||||
Progressive Corp. | 3,362 | 42,514 | 45,876 | 91,682 | 1,159,357 | 1,251,039 | ||||||||||||||||||
Protective Life Corp. | 2,286 | 28,225 | 30,511 | 115,809 | 1,429,878 | 1,545,687 | ||||||||||||||||||
Prudential Financial, Inc. | 26,053 | 249,213 | 275,266 | 2,402,608 | 22,982,423 | 25,385,031 | ||||||||||||||||||
Reinsurance Group of America, Inc. | 14,146 | 26,055 | 40,201 | 1,095,042 | 2,016,918 | 3,111,960 | ||||||||||||||||||
RenaissanceReinsurance Holdings Ltd. | 1,272 | 16,064 | 17,336 | 123,816 | 1,563,670 | 1,687,486 | ||||||||||||||||||
StanCorp Financial Group, Inc. | 1,307 | 15,938 | 17,245 | 86,589 | 1,055,892 | 1,142,481 | ||||||||||||||||||
Torchmark Corp. | 2,710 | 33,271 | 35,981 | 211,787 | 2,600,129 | 2,811,916 | ||||||||||||||||||
Travelers Cos., Inc. | 35,205 | 238,385 | 273,590 | 3,187,461 | 21,583,378 | 24,770,839 | ||||||||||||||||||
Unum Group | 11,073 | 95,980 | 107,053 | 388,441 | 3,366,978 | 3,755,419 | ||||||||||||||||||
Validus Holdings Ltd. | 2,776 | 34,302 | 37,078 | 111,845 | 1,382,028 | 1,493,873 | ||||||||||||||||||
W. R. Berkley Corp. | 3,135 | 39,019 | 42,154 | 136,028 | 1,693,034 | 1,829,062 | ||||||||||||||||||
White Mountains Insurance Group Ltd. | 262 | 2,234 | 2,496 | 158,007 | 1,347,281 | 1,505,288 | ||||||||||||||||||
XL Group plc | 32,108 | 335,645 | 367,753 | 1,022,319 | 10,686,937 | 11,709,256 | ||||||||||||||||||
|
|
|
|
|
| |||||||||||||||||||
| 49,157,415 | 441,686,497 | 490,843,912 | ||||||||||||||||||||||
|
|
|
|
|
| |||||||||||||||||||
Real Estate Investment Trusts (REITs) (2.1%) | ||||||||||||||||||||||||
Alexandria Real Estate Equities, Inc. (REIT) | 2,090 | 25,716 | 27,806 | 132,966 | 1,636,052 | 1,769,018 | ||||||||||||||||||
American Campus Communities, Inc. (REIT) | 3,004 | 37,707 | 40,711 | 96,759 | 1,214,543 | 1,311,302 | ||||||||||||||||||
American Capital Agency Corp. (REIT) | 11,400 | 142,448 | 153,848 | 219,906 | 2,747,822 | 2,967,728 | ||||||||||||||||||
American Homes 4 Rent (REIT), Class A | 1,137 | 14,771 | 15,908 | 18,419 | 239,290 | 257,709 | ||||||||||||||||||
Annaly Capital Management, Inc. (REIT) | 27,420 | 340,360 | 367,780 | 273,377 | 3,393,389 | 3,666,766 | ||||||||||||||||||
Apartment Investment & Management Co. (REIT), Class A | 1,828 | 23,721 | 25,549 | 47,363 | 614,611 | 661,974 | ||||||||||||||||||
AvalonBay Communities, Inc. (REIT) | 3,795 | 46,553 | 50,348 | 448,683 | 5,503,961 | 5,952,644 | ||||||||||||||||||
BioMed Realty Trust, Inc. (REIT) | 5,321 | 67,024 | 72,345 | 96,417 | 1,214,475 | 1,310,892 | ||||||||||||||||||
Boston Properties, Inc. (REIT) | 3,983 | 49,392 | 53,375 | 399,774 | 4,957,475 | 5,357,249 | ||||||||||||||||||
Brandywine Realty Trust (REIT) | 4,473 | 56,271 | 60,744 | 63,025 | 792,858 | 855,883 | ||||||||||||||||||
BRE Properties, Inc. (REIT) | 2,186 | 27,737 | 29,923 | 119,596 | 1,517,491 | 1,637,087 | ||||||||||||||||||
Brixmor Property Group, Inc. (REIT)* | 1,106 | 13,715 | 14,821 | 22,485 | 278,826 | 301,311 | ||||||||||||||||||
Camden Property Trust (REIT) | 2,448 | 30,519 | 32,967 | 139,242 | 1,735,921 | 1,875,163 | ||||||||||||||||||
CBL & Associates Properties, Inc. (REIT) | 3,135 | 39,520 | 42,655 | 56,305 | 709,779 | 766,084 | ||||||||||||||||||
Chimera Investment Corp. (REIT) | 29,712 | 369,168 | 398,880 | 92,107 | 1,144,421 | 1,236,528 | ||||||||||||||||||
CommonWealth REIT (REIT) | 3,379 | 42,567 | 45,946 | 78,764 | 992,237 | 1,071,001 | ||||||||||||||||||
Corporate Office Properties Trust/Maryland (REIT) | 2,448 | 30,849 | 33,297 | 57,993 | 730,813 | 788,806 | ||||||||||||||||||
Corrections Corp. of America (REIT) | 1,215 | 15,274 | 16,489 | 38,965 | 489,837 | 528,802 | ||||||||||||||||||
DDR Corp. (REIT) | 7,607 | 94,862 | 102,469 | 116,920 | 1,458,029 | 1,574,949 | ||||||||||||||||||
Digital Realty Trust, Inc. (REIT) | 783 | 9,877 | 10,660 | 38,461 | 485,158 | 523,619 | ||||||||||||||||||
Douglas Emmett, Inc. (REIT) | 4,114 | 51,230 | 55,344 | 95,815 | 1,193,147 | 1,288,962 | ||||||||||||||||||
Duke Realty Corp. (REIT) | 9,273 | 115,566 | 124,839 | 139,466 | 1,738,113 | 1,877,579 | ||||||||||||||||||
See Notes to Pro-forma Combined Financial Statements.
37
| Multimanager Large Cap Value Number of Shares | EQ/Large Cap Value PLUS Number of Shares | Pro-forma Combined | Multimanager Value ($) (Note 1) | EQ/Large Cap Value ($) (Note 1) | Pro-forma Value ($) (Note 1) | |||||||||||||||||||
Equity Lifestyle Properties, Inc. (REIT) | 686 | 8,302 | 8,988 | 24,854 | 300,782 | 325,636 | ||||||||||||||||||
Equity Residential (REIT) | 10,449 | 129,390 | 139,839 | 541,990 | 6,711,459 | 7,253,449 | ||||||||||||||||||
Essex Property Trust, Inc. (REIT) | 1,110 | 13,680 | 14,790 | 159,296 | 1,963,217 | 2,122,513 | ||||||||||||||||||
Extra Space Storage, Inc. (REIT) | 2,938 | 36,686 | 39,624 | 123,778 | 1,545,581 | 1,669,359 | ||||||||||||||||||
Federal Realty Investment Trust (REIT) | 686 | 8,136 | 8,822 | 69,567 | 825,072 | 894,639 | ||||||||||||||||||
Gaming and Leisure Properties, Inc. | 1,959 | 24,412 | 26,371 | 99,537 | 1,240,374 | 1,339,911 | ||||||||||||||||||
General Growth Properties, Inc. (REIT) | 17,147 | 213,678 | 230,825 | 344,140 | 4,288,517 | 4,632,657 | ||||||||||||||||||
Hatteras Financial Corp. (REIT) | 2,807 | 35,519 | 38,326 | 45,866 | 580,380 | 626,246 | ||||||||||||||||||
HCP, Inc. (REIT) | 13,199 | 163,310 | 176,509 | 479,388 | 5,931,419 | 6,410,807 | ||||||||||||||||||
Health Care REIT, Inc. (REIT) | 8,228 | 102,284 | 110,512 | 440,774 | 5,479,354 | 5,920,128 | ||||||||||||||||||
Healthcare Trust of America, Inc. (REIT), Class A | 3,200 | 40,095 | 43,295 | 31,488 | 394,535 | 426,023 | ||||||||||||||||||
Home Properties, Inc. (REIT) | 1,635 | 20,446 | 22,081 | 87,669 | 1,096,315 | 1,183,984 | ||||||||||||||||||
Hospitality Properties Trust (REIT) | 3,983 | 50,200 | 54,183 | 107,660 | 1,356,906 | 1,464,566 | ||||||||||||||||||
Host Hotels & Resorts, Inc. (REIT) | 21,490 | 267,548 | 289,038 | 417,766 | 5,201,133 | 5,618,899 | ||||||||||||||||||
Kilroy Realty Corp. (REIT) | 2,321 | 29,267 | 31,588 | 116,468 | 1,468,618 | 1,585,086 | ||||||||||||||||||
Kimco Realty Corp. (REIT) | 11,787 | 146,885 | 158,672 | 232,793 | 2,900,979 | 3,133,772 | ||||||||||||||||||
Liberty Property Trust (REIT) | 3,769 | 46,578 | 50,347 | 127,656 | 1,577,597 | 1,705,253 | ||||||||||||||||||
Macerich Co. (REIT) | 3,940 | 49,469 | 53,409 | 232,027 | 2,913,229 | 3,145,256 | ||||||||||||||||||
Mack-Cali Realty Corp. (REIT) | 2,514 | 31,639 | 34,153 | 54,001 | 679,606 | 733,607 | ||||||||||||||||||
MFA Financial, Inc. (REIT) | 10,449 | 129,808 | 140,257 | 73,770 | 916,445 | 990,215 | ||||||||||||||||||
Mid-America Apartment Communities, Inc. (REIT) | 2,207 | 26,831 | 29,038 | 134,053 | 1,629,715 | 1,763,768 | ||||||||||||||||||
National Retail Properties, Inc. (REIT) | 3,362 | 42,600 | 45,962 | 101,969 | 1,292,058 | 1,394,027 | ||||||||||||||||||
Piedmont Office Realty Trust, Inc. (REIT), Class A | 4,766 | 60,322 | 65,088 | 78,734 | 996,519 | 1,075,253 | ||||||||||||||||||
Post Properties, Inc. (REIT) | 1,600 | 19,615 | 21,215 | 72,368 | 887,186 | 959,554 | ||||||||||||||||||
Prologis, Inc. (REIT) | 14,442 | 179,012 | 193,454 | 533,632 | 6,614,493 | 7,148,125 | ||||||||||||||||||
Public Storage (REIT) | 328 | 3,522 | 3,850 | 49,371 | 530,131 | 579,502 | ||||||||||||||||||
Realty Income Corp. (REIT) | 5,649 | 70,539 | 76,188 | 210,877 | 2,633,221 | 2,844,098 | ||||||||||||||||||
Regency Centers Corp. (REIT) | 1,535 | 19,167 | 20,702 | 71,071 | 887,432 | 958,503 | ||||||||||||||||||
Retail Properties of America, Inc. (REIT), Class A | 3,786 | 48,111 | 51,897 | 48,158 | 611,972 | 660,130 | ||||||||||||||||||
Senior Housing Properties Trust (REIT) | 4,962 | 62,660 | 67,622 | 110,305 | 1,392,932 | 1,503,237 | ||||||||||||||||||
Simon Property Group, Inc. (REIT) | 2,302 | 28,245 | 30,547 | 350,272 | 4,297,759 | 4,648,031 | ||||||||||||||||||
SL Green Realty Corp. (REIT) | 2,710 | 32,905 | 35,615 | 250,350 | 3,039,764 | 3,290,114 | ||||||||||||||||||
Spirit Realty Capital, Inc. (REIT) | 8,573 | 107,360 | 115,933 | 84,273 | 1,055,349 | 1,139,622 | ||||||||||||||||||
Taubman Centers, Inc. (REIT) | 1,535 | 18,808 | 20,343 | 98,117 | 1,202,207 | 1,300,324 | ||||||||||||||||||
Two Harbors Investment Corp. (REIT) | 10,580 | 131,281 | 141,861 | 98,182 | 1,218,288 | 1,316,470 | ||||||||||||||||||
UDR, Inc. (REIT) | 7,249 | 90,079 | 97,328 | 169,264 | 2,103,345 | 2,272,609 | ||||||||||||||||||
Ventas, Inc. (REIT) | 4,673 | 57,825 | 62,498 | 267,669 | 3,312,216 | 3,579,885 | ||||||||||||||||||
Vornado Realty Trust (REIT) | 4,414 | 54,132 | 58,546 | 391,919 | 4,806,380 | 5,198,299 | ||||||||||||||||||
Weingarten Realty Investors (REIT) | 3,493 | 43,823 | 47,316 | 95,778 | 1,201,627 | 1,297,405 | ||||||||||||||||||
WP Carey, Inc. (REIT) | 1,666 | 20,687 | 22,353 | 102,209 | 1,269,147 | 1,371,356 | ||||||||||||||||||
|
|
|
|
|
| |||||||||||||||||||
| 9,921,867 | 123,141,507 | 133,063,374 | ||||||||||||||||||||||
|
|
|
|
|
| |||||||||||||||||||
Real Estate Management & Development (0.2%) | ||||||||||||||||||||||||
CBRE Group, Inc., | — | 57,800 | 57,800 | — | 1,520,140 | 1,520,140 | ||||||||||||||||||
Forest City Enterprises, Inc., Class A* | 4,538 | 56,720 | 61,258 | 86,676 | 1,083,352 | 1,170,028 | ||||||||||||||||||
Howard Hughes Corp.* | 1,166 | 14,233 | 15,399 | 140,036 | 1,709,383 | 1,849,419 | ||||||||||||||||||
Jones Lang LaSalle, Inc | 1,307 | 72,642 | 73,949 | 133,824 | 7,437,814 | 7,571,638 | ||||||||||||||||||
Realogy Holdings Corp.* | 359 | 4,748 | 5,107 | 17,760 | 234,884 | 252,644 | ||||||||||||||||||
St. Joe Co.* | 1,797 | 22,445 | 24,242 | 34,484 | 430,720 | 465,204 | ||||||||||||||||||
|
|
|
|
|
| |||||||||||||||||||
| 412,780 | 12,416,293 | 12,829,073 | ||||||||||||||||||||||
|
|
|
|
|
| |||||||||||||||||||
Thrifts & Mortgage Finance (0.1%) | ||||||||||||||||||||||||
Hudson City Bancorp, Inc. | 18,870 | 208,332 | 227,202 | 177,944 | 1,964,571 | 2,142,515 | ||||||||||||||||||
See Notes to Pro-forma Combined Financial Statements.
38
| Multimanager Large Cap Value Number of Shares | EQ/Large Cap Value PLUS Number of Shares | Pro-forma Combined | Multimanager Value ($) (Note 1) | EQ/Large Cap Value ($) (Note 1) | Pro-forma Value ($) (Note 1) | |||||||||||||||||||
New York Community Bancorp, Inc. | 12,701 | 158,437 | 171,138 | 214,012 | 2,669,663 | 2,883,675 | ||||||||||||||||||
People’s United Financial, Inc. | 8,901 | 111,247 | 120,148 | 134,583 | 1,682,055 | 1,816,638 | ||||||||||||||||||
TFS Financial Corp.* | 2,186 | 28,310 | 30,496 | 26,484 | 342,976 | 369,460 | ||||||||||||||||||
Washington Federal, Inc. | 2,938 | 37,460 | 40,398 | 68,426 | 872,443 | 940,869 | ||||||||||||||||||
|
|
|
|
|
| |||||||||||||||||||
| 621,449 | 7,531,708 | 8,153,157 | ||||||||||||||||||||||
|
|
|
|
|
| |||||||||||||||||||
Total Financials | 167,485,554 | 1,411,266,222 | 1,578,751,776 | |||||||||||||||||||||
|
|
|
|
|
| |||||||||||||||||||
Health Care (12.5%) |
| |||||||||||||||||||||||
Biotechnology (0.3%) |
| |||||||||||||||||||||||
Celgene Corp.* | — | 28,200 | 28,200 | — | 4,764,672 | 4,764,672 | ||||||||||||||||||
Gilead Sciences, Inc.* | — | 100,500 | 100,500 | — | 7,552,575 | 7,552,575 | ||||||||||||||||||
Quintiles Transnational Holdings, Inc.* | 424 | 5,442 | 5,866 | 19,648 | 252,182 | 271,830 | ||||||||||||||||||
Vertex Pharmaceuticals, Inc.* | 6,814 | 57,200 | 64,014 | 506,281 | 4,249,960 | 4,756,241 | ||||||||||||||||||
|
|
|
|
|
| |||||||||||||||||||
| 525,929 | 16,819,389 | 17,345,318 | ||||||||||||||||||||||
|
|
|
|
|
| |||||||||||||||||||
Health Care Equipment & Supplies (2.8%) | ||||||||||||||||||||||||
Abbott Laboratories | 82,678 | 560,034 | 642,712 | 3,169,048 | 21,466,103 | 24,635,151 | ||||||||||||||||||
Alere, Inc.* | 2,352 | 29,201 | 31,553 | 85,142 | 1,057,076 | 1,142,218 | ||||||||||||||||||
Baxter International, Inc. | 67,841 | 17,200 | 85,041 | 4,718,342 | 1,196,260 | 5,914,602 | ||||||||||||||||||
Boston Scientific Corp.* | 39,085 | 484,721 | 523,806 | 469,802 | 5,826,346 | 6,296,148 | ||||||||||||||||||
CareFusion Corp.* | 6,300 | 79,000 | 85,300 | 250,866 | 3,145,780 | 3,396,646 | ||||||||||||||||||
Cooper Cos., Inc. | 359 | 4,505 | 4,864 | 44,459 | 557,899 | 602,358 | ||||||||||||||||||
Covidien plc | 67,265 | 203,262 | 270,527 | 4,580,746 | 13,842,142 | 18,422,888 | ||||||||||||||||||
DENTSPLY International, Inc. | 2,938 | 37,149 | 40,087 | 142,434 | 1,800,984 | 1,943,418 | ||||||||||||||||||
Hill-Rom Holdings, Inc. | 1,731 | 21,534 | 23,265 | 71,559 | 890,216 | 961,775 | ||||||||||||||||||
Hologic, Inc.* | 5,452 | 112,473 | 117,925 | 121,852 | 2,513,772 | 2,635,624 | ||||||||||||||||||
Medtronic, Inc. | 89,022 | 1,016,649 | 1,105,671 | 5,108,973 | 58,345,486 | 63,454,459 | ||||||||||||||||||
St. Jude Medical, Inc. | 19,911 | 298,929 | 318,840 | 1,233,486 | 18,518,652 | 19,752,138 | ||||||||||||||||||
Stryker Corp. | 3,983 | 49,859 | 53,842 | 299,283 | 3,746,405 | 4,045,688 | ||||||||||||||||||
Teleflex, Inc. | 1,241 | 14,857 | 16,098 | 116,480 | 1,394,478 | 1,510,958 | ||||||||||||||||||
Zimmer Holdings, Inc. | 4,604 | 226,020 | 230,624 | 429,047 | 21,062,804 | 21,491,851 | ||||||||||||||||||
|
|
|
|
|
| |||||||||||||||||||
| 20,841,519 | 155,364,403 | 176,205,922 | ||||||||||||||||||||||
|
|
|
|
|
| |||||||||||||||||||
Health Care Providers & Services (1.9%) | ||||||||||||||||||||||||
Aetna, Inc. | 29,525 | 240,076 | 269,601 | 2,025,120 | 16,466,813 | 18,491,933 | ||||||||||||||||||
Cardinal Health, Inc. | 9,894 | 122,848 | 132,742 | 661,018 | 8,207,475 | 8,868,493 | ||||||||||||||||||
Cigna Corp. | 7,804 | 96,647 | 104,451 | 682,694 | 8,454,680 | 9,137,374 | ||||||||||||||||||
Community Health Systems, Inc.* | 2,514 | 31,285 | 33,799 | 98,725 | 1,228,562 | 1,327,287 | ||||||||||||||||||
Envision Healthcare Holdings, Inc.* | 397 | 6,162 | 6,559 | 14,101 | 218,874 | 232,975 | ||||||||||||||||||
Express Scripts Holding Co.* | 18,791 | 37,082 | 55,873 | 1,319,880 | 2,604,640 | 3,924,520 | ||||||||||||||||||
HCA Holdings, Inc.* | 7,183 | 89,146 | 96,329 | 342,701 | 4,253,156 | 4,595,857 | ||||||||||||||||||
Health Net, Inc.* | 22,236 | 163,756 | 185,992 | 659,742 | 4,858,641 | 5,518,383 | ||||||||||||||||||
Humana, Inc. | 4,538 | 56,596 | 61,134 | 468,412 | 5,841,839 | 6,310,251 | ||||||||||||||||||
LifePoint Hospitals, Inc.* | 1,338 | 17,043 | 18,381 | 70,700 | 900,552 | 971,252 | ||||||||||||||||||
MEDNAX, Inc.* | 1,110 | 12,896 | 14,006 | 59,252 | 688,388 | 747,640 | ||||||||||||||||||
Omnicare, Inc. | 3,004 | 37,744 | 40,748 | 181,321 | 2,278,228 | 2,459,549 | ||||||||||||||||||
Patterson Cos., Inc. | 228 | 3,357 | 3,585 | 9,394 | 138,308 | 147,702 | ||||||||||||||||||
Premier, Inc., | 335 | 4,150 | 4,485 | 12,315 | 152,554 | 164,869 | ||||||||||||||||||
Quest Diagnostics, Inc. | 12,603 | 154,494 | 167,097 | 674,765 | 8,271,609 | 8,946,374 | ||||||||||||||||||
UnitedHealth Group, Inc. | 29,555 | 366,499 | 396,054 | 2,225,491 | 27,597,375 | 29,822,866 | ||||||||||||||||||
Universal Health Services, Inc., Class B | 848 | 10,690 | 11,538 | 68,908 | 868,669 | 937,577 | ||||||||||||||||||
VCA Antech, Inc.* | 2,514 | 31,829 | 34,343 | 78,839 | 998,157 | 1,076,996 | ||||||||||||||||||
WellPoint, Inc. | 12,518 | 126,328 | 138,846 | 1,156,538 | 11,671,444 | 12,827,982 | ||||||||||||||||||
|
|
|
|
|
| |||||||||||||||||||
| 10,809,916 | 105,699,964 | 116,509,880 | ||||||||||||||||||||||
|
|
|
|
|
| |||||||||||||||||||
See Notes to Pro-forma Combined Financial Statements.
39
| Multimanager Large Cap Value Number of Shares | EQ/Large Cap Value PLUS Number of Shares | Pro-forma Combined | Multimanager Value ($) (Note 1) | EQ/Large Cap Value ($) (Note 1) | Pro-forma Value ($) (Note 1) | |||||||||||||||||||
Health Care Technology (0.0%) | ||||||||||||||||||||||||
Allscripts Healthcare Solutions, Inc.* | 5,093 | 63,957 | 69,050 | 78,738 | 988,775 | 1,067,513 | ||||||||||||||||||
Veeva Systems, Inc., Class A* | 152 | 1,892 | 2,044 | 4,879 | 60,733 | 65,612 | ||||||||||||||||||
|
|
|
|
|
| |||||||||||||||||||
| 83,617 | 1,049,508 | 1,133,125 | ||||||||||||||||||||||
|
|
|
|
|
| |||||||||||||||||||
Life Sciences Tools & Services (0.5%) | ||||||||||||||||||||||||
Agilent Technologies, Inc. | 8,914 | 110,206 | 119,120 | 509,792 | 6,302,681 | 6,812,473 | ||||||||||||||||||
Bio-Rad Laboratories, Inc., Class A* | 621 | 7,362 | 7,983 | 76,762 | 910,017 | 986,779 | ||||||||||||||||||
Charles River Laboratories International, Inc.* | 817 | 9,709 | 10,526 | 43,334 | 514,965 | 558,299 | ||||||||||||||||||
Life Technologies Corp.* | 2,097 | 23,531 | 25,628 | 158,952 | 1,783,650 | 1,942,602 | ||||||||||||||||||
PerkinElmer, Inc. | 3,266 | 40,238 | 43,504 | 134,657 | 1,659,013 | 1,793,670 | ||||||||||||||||||
QIAGEN N.V.* | 6,759 | 84,085 | 90,844 | 160,932 | 2,002,064 | 2,162,996 | ||||||||||||||||||
Techne Corp. | 621 | 7,141 | 7,762 | 58,790 | 676,039 | 734,829 | ||||||||||||||||||
Thermo Fisher Scientific, Inc. | 25,927 | 128,987 | 154,914 | 2,886,971 | 14,362,702 | 17,249,673 | ||||||||||||||||||
|
|
|
|
|
| |||||||||||||||||||
| 4,030,190 | 28,211,131 | 32,241,321 | ||||||||||||||||||||||
|
|
|
|
|
| |||||||||||||||||||
Pharmaceuticals (7.0%) | ||||||||||||||||||||||||
AstraZeneca plc (ADR) | — | 232,021 | 232,021 | — | 13,775,087 | 13,775,087 | ||||||||||||||||||
Bristol-Myers Squibb Co. | 6,587 | 82,101 | 88,688 | 350,099 | 4,363,668 | 4,713,767 | ||||||||||||||||||
Eli Lilly and Co. | 22,432 | 589,623 | 612,055 | 1,144,032 | 30,070,773 | 31,214,805 | ||||||||||||||||||
Forest Laboratories, Inc.* | 7,738 | 95,834 | 103,572 | 464,512 | 5,752,915 | 6,217,427 | ||||||||||||||||||
GlaxoSmithKline plc (ADR) | 21,900 | 184,200 | 206,100 | 1,169,241 | 9,834,438 | 11,003,679 | ||||||||||||||||||
Hospira, Inc.* | 4,800 | 126,887 | 131,687 | 198,144 | 5,237,895 | 5,436,039 | ||||||||||||||||||
Johnson & Johnson | 155,844 | 1,175,273 | 1,331,117 | 14,273,752 | 107,643,254 | 121,917,006 | ||||||||||||||||||
Mallinckrodt plc* | 1,739 | 21,223 | 22,962 | 90,880 | 1,109,114 | 1,199,994 | ||||||||||||||||||
Merck & Co., Inc. | 131,642 | 1,323,182 | 1,454,824 | 6,588,682 | 66,225,259 | 72,813,941 | ||||||||||||||||||
Pfizer, Inc. | 714,341 | 4,239,691 | 4,954,032 | 21,880,265 | 129,861,735 | 151,742,000 | ||||||||||||||||||
Roche Holding AG (ADR) | 14,349 | 109,600 | 123,949 | 1,007,300 | 7,693,920 | 8,701,220 | ||||||||||||||||||
Roche Holding AG | 2,651 | — | 2,651 | 740,574 | — | 740,574 | ||||||||||||||||||
Teva Pharmaceutical Industries Ltd. (ADR) | — | 139,470 | 139,470 | — | 5,589,958 | 5,589,958 | ||||||||||||||||||
Zoetis, Inc. | 1,136 | — | 1,136 | 37,136 | — | 37,136 | ||||||||||||||||||
|
|
|
|
|
| |||||||||||||||||||
| 47,944,617 | 387,158,016 | 435,102,633 | ||||||||||||||||||||||
|
|
|
|
|
| |||||||||||||||||||
Total Health Care | 84,235,788 | 694,302,411 | 778,538,199 | |||||||||||||||||||||
|
|
|
|
|
| |||||||||||||||||||
Industrials (8.4%) | ||||||||||||||||||||||||
Aerospace & Defense (1.7%) |
| |||||||||||||||||||||||
Alliant Techsystems, Inc. | 914 | 11,595 | 12,509 | 111,215 | 1,410,879 | 1,522,094 | ||||||||||||||||||
B/E Aerospace, Inc.* | 197 | 2,286 | 2,483 | 17,145 | 198,950 | 216,095 | ||||||||||||||||||
Boeing Co. | 29,850 | 71,379 | 101,229 | 4,074,226 | 9,742,520 | 13,816,746 | ||||||||||||||||||
Exelis, Inc. | 5,387 | 67,586 | 72,973 | 102,676 | 1,288,189 | 1,390,865 | ||||||||||||||||||
General Dynamics Corp. | 8,652 | 107,356 | 116,008 | 826,699 | 10,257,866 | 11,084,565 | ||||||||||||||||||
Honeywell International, Inc. | 68,244 | 90,950 | 159,194 | 6,235,454 | 8,310,101 | 14,545,555 | ||||||||||||||||||
L-3 Communications Holdings, Inc. | 2,645 | 32,423 | 35,068 | 282,645 | 3,464,722 | 3,747,367 | ||||||||||||||||||
Lockheed Martin Corp. | 26,516 | — | 26,516 | 3,941,869 | — | 3,941,869 | ||||||||||||||||||
Northrop Grumman Corp. | 22,308 | 196,965 | 219,273 | 2,556,720 | 22,574,159 | 25,130,879 | ||||||||||||||||||
Raytheon Co. | 9,404 | 206,281 | 215,685 | 852,943 | 18,709,687 | 19,562,630 | ||||||||||||||||||
Rockwell Collins, Inc. | 424 | 5,391 | 5,815 | 31,342 | 398,503 | 429,845 | ||||||||||||||||||
Spirit AeroSystems Holdings, Inc., | 2,938 | 37,335 | 40,273 | 100,127 | 1,272,377 | 1,372,504 | ||||||||||||||||||
Textron, Inc. | 7,966 | 99,841 | 107,807 | 292,830 | 3,670,155 | 3,962,985 | ||||||||||||||||||
Triumph Group, Inc. | 1,241 | 14,801 | 16,042 | 94,403 | 1,125,912 | 1,220,315 | ||||||||||||||||||
United Technologies Corp. | 24,548 | 20,865 | 45,413 | 2,793,562 | 2,374,437 | 5,167,999 | ||||||||||||||||||
|
|
|
|
|
| |||||||||||||||||||
| 22,313,856 | 84,798,457 | 107,112,313 | ||||||||||||||||||||||
|
|
|
|
|
| |||||||||||||||||||
See Notes to Pro-forma Combined Financial Statements.
40
| Multimanager Large Cap Value Number of Shares | EQ/Large Cap Value PLUS Number of Shares | Pro-forma Combined | Multimanager Value ($) (Note 1) | EQ/Large Cap Value ($) (Note 1) | Pro-forma Value ($) (Note 1) | |||||||||||||||||||
Air Freight & | ||||||||||||||||||||||||
FedEx Corp. | 9,242 | 113,873 | 123,115 | 1,328,723 | 16,371,521 | 17,700,244 | ||||||||||||||||||
United Parcel Service, Inc., | 20,415 | — | 20,415 | 2,145,208 | — | 2,145,208 | ||||||||||||||||||
|
|
|
|
|
| |||||||||||||||||||
| 3,473,931 | 16,371,521 | 19,845,452 | ||||||||||||||||||||||
|
|
|
|
|
| |||||||||||||||||||
Airlines (0.3%) | ||||||||||||||||||||||||
Alaska Air Group, Inc. | 197 | 1,989 | 2,186 | 14,454 | 145,933 | 160,387 | ||||||||||||||||||
American Airlines Group, Inc.* | 4,880 | 55,182 | 60,062 | 123,220 | 1,393,345 | 1,516,565 | ||||||||||||||||||
Delta Air Lines, Inc. | 30,687 | 424,931 | 455,618 | 842,972 | 11,672,855 | 12,515,827 | ||||||||||||||||||
Southwest Airlines Co. | 18,611 | 230,989 | 249,600 | 350,631 | 4,351,833 | 4,702,464 | ||||||||||||||||||
|
|
|
|
|
| |||||||||||||||||||
| 1,331,277 | 17,563,966 | 18,895,243 | ||||||||||||||||||||||
|
|
|
|
|
| |||||||||||||||||||
Building Products (0.1%) |
| |||||||||||||||||||||||
A.O. Smith Corp. | 1,307 | 15,952 | 17,259 | 70,500 | 860,451 | 930,951 | ||||||||||||||||||
Allegion plc* | 849 | 10,333 | 11,182 | 37,532 | 456,629 | 494,161 | ||||||||||||||||||
Fortune Brands Home & Security, Inc. | 555 | 7,241 | 7,796 | 25,363 | 330,914 | 356,277 | ||||||||||||||||||
Owens Corning, Inc.* | 3,428 | 42,709 | 46,137 | 139,588 | 1,739,110 | 1,878,698 | ||||||||||||||||||
|
|
|
|
|
| |||||||||||||||||||
| 272,983 | 3,387,104 | 3,660,087 | ||||||||||||||||||||||
|
|
|
|
|
| |||||||||||||||||||
Commercial Services & Supplies (0.3%) |
| |||||||||||||||||||||||
ADT Corp. | 6,335 | 78,603 | 84,938 | 256,377 | 3,181,064 | 3,437,441 | ||||||||||||||||||
Cintas Corp. | 2,155 | 26,690 | 28,845 | 128,416 | 1,590,457 | 1,718,873 | ||||||||||||||||||
Covanta Holding Corp. | 3,004 | 38,165 | 41,169 | 53,321 | 677,429 | 730,750 | ||||||||||||||||||
Iron Mountain, Inc. | 453 | 6,161 | 6,614 | 13,749 | 186,986 | 200,735 | ||||||||||||||||||
KAR Auction Services, Inc. | 1,338 | 17,139 | 18,477 | 39,538 | 506,458 | 545,996 | ||||||||||||||||||
Pitney Bowes, Inc. | 3,231 | 41,047 | 44,278 | 75,282 | 956,395 | 1,031,677 | ||||||||||||||||||
R.R. Donnelley & Sons Co. | 2,317 | 29,944 | 32,261 | 46,989 | 607,264 | 654,253 | ||||||||||||||||||
Republic Services, Inc. | 7,804 | 97,161 | 104,965 | 259,093 | 3,225,745 | 3,484,838 | ||||||||||||||||||
Tyco International Ltd. | 34,627 | — | 34,627 | 1,421,092 | — | 1,421,092 | ||||||||||||||||||
Waste Connections, Inc. | 229 | 2,553 | 2,782 | 9,991 | 111,387 | 121,378 | ||||||||||||||||||
Waste Management, Inc. | 12,473 | 154,388 | 166,861 | 559,664 | 6,927,390 | 7,487,054 | ||||||||||||||||||
|
|
|
|
|
| |||||||||||||||||||
| 2,863,512 | 17,970,575 | 20,834,087 | ||||||||||||||||||||||
|
|
|
|
|
| |||||||||||||||||||
Construction & Engineering (0.2%) |
| |||||||||||||||||||||||
AECOM Technology Corp.* | 2,710 | 33,555 | 36,265 | 79,755 | 987,524 | 1,067,279 | ||||||||||||||||||
Fluor Corp. | 1,893 | 23,512 | 25,405 | 151,989 | 1,887,778 | 2,039,767 | ||||||||||||||||||
Jacobs Engineering Group, Inc.* | 3,821 | 47,064 | 50,885 | 240,685 | 2,964,561 | 3,205,246 | ||||||||||||||||||
KBR, Inc. | 4,211 | 53,186 | 57,397 | 134,289 | 1,696,102 | 1,830,391 | ||||||||||||||||||
Quanta Services, Inc.* | 4,700 | 59,355 | 64,055 | 148,332 | 1,873,244 | 2,021,576 | ||||||||||||||||||
URS Corp. | 2,221 | 27,330 | 29,551 | 117,691 | 1,448,217 | 1,565,908 | ||||||||||||||||||
|
|
|
|
|
| |||||||||||||||||||
| 872,741 | 10,857,426 | 11,730,167 | ||||||||||||||||||||||
|
|
|
|
|
| |||||||||||||||||||
Electrical Equipment (0.4%) |
| |||||||||||||||||||||||
Babcock & Wilcox Co. | 979 | 12,579 | 13,558 | 33,472 | 430,076 | 463,548 | ||||||||||||||||||
Eaton Corp. plc. | 29,093 | 169,961 | 199,054 | 2,214,559 | 12,937,431 | 15,151,990 | ||||||||||||||||||
Emerson Electric Co. | 5,290 | 65,145 | 70,435 | 371,252 | 4,571,876 | 4,943,128 | ||||||||||||||||||
Hubbell, Inc., Class B | 490 | 5,956 | 6,446 | 53,361 | 648,609 | 701,970 | ||||||||||||||||||
Regal-Beloit Corp. | 1,272 | 16,221 | 17,493 | 93,772 | 1,195,812 | 1,289,584 | ||||||||||||||||||
|
|
|
|
|
| |||||||||||||||||||
| 2,766,416 | 19,783,804 | 22,550,220 | ||||||||||||||||||||||
|
|
|
|
|
| |||||||||||||||||||
Industrial Conglomerates (3.0%) |
| |||||||||||||||||||||||
3M Co. | 22,016 | 58,004 | 80,020 | 3,087,744 | 8,135,061 | 11,222,805 | ||||||||||||||||||
Carlisle Cos., Inc. | 1,797 | 21,681 | 23,478 | 142,682 | 1,721,472 | 1,864,154 | ||||||||||||||||||
Danaher Corp. | 35,529 | 171,457 | 206,986 | 2,742,839 | 13,236,480 | 15,979,319 | ||||||||||||||||||
General Electric Co. | 718,920 | 4,803,027 | 5,521,947 | 20,151,327 | 134,628,847 | 154,780,174 | ||||||||||||||||||
|
|
|
|
|
| |||||||||||||||||||
| 26,124,592 | 157,721,860 | 183,846,452 | ||||||||||||||||||||||
|
|
|
|
|
| |||||||||||||||||||
See Notes to Pro-forma Combined Financial Statements.
41
| Multimanager Large Cap Value Number of Shares | EQ/Large Cap Value PLUS Number of Shares | Pro-forma Combined | Multimanager Value ($) (Note 1) | EQ/Large Cap Value ($) (Note 1) | Pro-forma Value ($) (Note 1) | |||||||||||||||||||
Machinery (1.6%) | ||||||||||||||||||||||||
AGCO Corp. | 2,842 | 35,009 | 37,851 | 168,218 | 2,072,183 | 2,240,401 | ||||||||||||||||||
Caterpillar, Inc. | 15,608 | 193,553 | 209,161 | 1,417,362 | 17,576,548 | 18,993,910 | ||||||||||||||||||
Crane Co. | 131 | 1,343 | 1,474 | 8,810 | 90,317 | 99,127 | ||||||||||||||||||
Cummins, Inc. | 979 | 12,347 | 13,326 | 138,010 | 1,740,557 | 1,878,567 | ||||||||||||||||||
Donaldson Co., Inc. | 293 | 4,161 | 4,454 | 12,734 | 180,837 | 193,571 | ||||||||||||||||||
Dover Corp. | 1,272 | 16,167 | 17,439 | 122,799 | 1,560,762 | 1,683,561 | ||||||||||||||||||
Harsco Corp. | 2,155 | 27,024 | 29,179 | 60,405 | 757,483 | 817,888 | ||||||||||||||||||
IDEX Corp. | 197 | 2,058 | 2,255 | 14,548 | 151,983 | 166,531 | ||||||||||||||||||
Illinois Tool Works, Inc. | 32,754 | 260,886 | 293,640 | 2,753,956 | 21,935,295 | 24,689,251 | ||||||||||||||||||
Ingersoll-Rand plc. | 2,548 | 51,196 | 53,744 | 156,957 | 3,153,674 | 3,310,631 | ||||||||||||||||||
Joy Global, Inc. | 3,069 | 38,243 | 41,312 | 179,506 | 2,236,833 | 2,416,339 | ||||||||||||||||||
Kennametal, Inc. | 2,286 | 28,309 | 30,595 | 119,032 | 1,474,050 | 1,593,082 | ||||||||||||||||||
Navistar International Corp.* | 1,338 | 17,503 | 18,841 | 51,098 | 668,439 | 719,537 | ||||||||||||||||||
Oshkosh Corp. | 2,514 | 31,685 | 34,199 | 126,655 | 1,596,290 | 1,722,945 | ||||||||||||||||||
PACCAR, Inc. | 8,880 | 110,696 | 119,576 | 525,430 | 6,549,882 | 7,075,312 | ||||||||||||||||||
Parker Hannifin Corp. | 4,376 | 71,762 | 76,138 | 562,929 | 9,231,464 | 9,794,393 | ||||||||||||||||||
Pentair Ltd. (Registered) | 13,722 | 73,450 | 87,172 | 1,065,788 | 5,704,861 | 6,770,649 | ||||||||||||||||||
Snap-on, Inc. | 1,569 | 18,596 | 20,165 | 171,837 | 2,036,634 | 2,208,471 | ||||||||||||||||||
SPX Corp. | 1,338 | 16,864 | 18,202 | 133,278 | 1,679,823 | 1,813,101 | ||||||||||||||||||
Stanley Black & Decker, Inc. | 15,738 | 53,132 | 68,870 | 1,269,899 | 4,287,221 | 5,557,120 | ||||||||||||||||||
Terex Corp. | 3,200 | 40,003 | 43,203 | 134,368 | 1,679,726 | 1,814,094 | ||||||||||||||||||
Timken Co. | 2,514 | 31,025 | 33,539 | 138,446 | 1,708,547 | 1,846,993 | ||||||||||||||||||
Trinity Industries, Inc. | 2,252 | 28,497 | 30,749 | 122,779 | 1,553,656 | 1,676,435 | ||||||||||||||||||
Xylem, Inc. | 4,962 | 62,555 | 67,517 | 171,685 | 2,164,403 | 2,336,088 | ||||||||||||||||||
|
|
|
|
|
| |||||||||||||||||||
| 9,626,529 | 91,791,468 | 101,417,997 | ||||||||||||||||||||||
|
|
|
|
|
| |||||||||||||||||||
Marine (0.0%) | ||||||||||||||||||||||||
Kirby Corp.* | 686 | 8,353 | 9,039 | 68,085 | 829,035 | 897,120 | ||||||||||||||||||
|
|
|
|
|
| |||||||||||||||||||
Professional Services (0.1%) | ||||||||||||||||||||||||
Dun & Bradstreet Corp. | 131 | 1,121 | 1,252 | 16,080 | 137,603 | 153,683 | ||||||||||||||||||
Manpowergroup, Inc. | 2,286 | 27,722 | 30,008 | 196,276 | 2,380,211 | 2,576,487 | ||||||||||||||||||
Nielsen Holdings N.V | 5,440 | 67,209 | 72,649 | 249,642 | 3,084,221 | 3,333,863 | ||||||||||||||||||
Towers Watson & Co., Class A | 1,893 | 23,466 | 25,359 | 241,566 | 2,994,496 | 3,236,062 | ||||||||||||||||||
|
|
|
|
|
| |||||||||||||||||||
| 703,564 | 8,596,531 | 9,300,095 | ||||||||||||||||||||||
|
|
|
|
|
| |||||||||||||||||||
Road & Rail (0.3%) | ||||||||||||||||||||||||
Amerco, Inc.* | 131 | 1,272 | 1,403 | 31,157 | 302,532 | 333,689 | ||||||||||||||||||
Canadian National Railway Co. | 14,194 | — | 14,194 | 809,342 | — | 809,342 | ||||||||||||||||||
Con-way, Inc. | 1,045 | 12,859 | 13,904 | 41,497 | 510,631 | 552,128 | ||||||||||||||||||
CSX Corp. | 14,790 | 184,018 | 198,808 | 425,508 | 5,294,198 | 5,719,706 | ||||||||||||||||||
Genesee & Wyoming, Inc., | 752 | 8,787 | 9,539 | 72,230 | 843,991 | 916,221 | ||||||||||||||||||
Norfolk Southern Corp. | 7,511 | 92,797 | 100,308 | 697,246 | 8,614,346 | 9,311,592 | ||||||||||||||||||
Ryder System, Inc. | 1,469 | 18,689 | 20,158 | 108,383 | 1,378,874 | 1,487,257 | ||||||||||||||||||
Union Pacific Corp. | — | 10,200 | 10,200 | — | 1,713,600 | 1,713,600 | ||||||||||||||||||
|
|
|
|
|
| |||||||||||||||||||
| 2,185,363 | 18,658,172 | 20,843,535 | ||||||||||||||||||||||
|
|
|
|
|
| |||||||||||||||||||
Trading Companies & | ||||||||||||||||||||||||
Air Lease Corp. | 2,024 | 25,225 | 27,249 | 62,906 | 783,993 | 846,899 | ||||||||||||||||||
GATX Corp. | 1,338 | 16,874 | 18,212 | 69,803 | 880,317 | 950,120 | ||||||||||||||||||
HD Supply Holdings, Inc.* | 599 | 8,247 | 8,846 | 14,382 | 198,010 | 212,392 | ||||||||||||||||||
MRC Global, Inc.* | 1,338 | 17,105 | 18,443 | 43,164 | 551,807 | 594,971 | ||||||||||||||||||
WESCO International, Inc.* | 1,307 | 15,857 | 17,164 | 119,029 | 1,444,097 | 1,563,126 | ||||||||||||||||||
|
|
|
|
|
| |||||||||||||||||||
| 309,284 | 3,858,224 | 4,167,508 | ||||||||||||||||||||||
|
|
|
|
|
| |||||||||||||||||||
Total Industrials | 72,912,133 | 452,188,143 | 525,100,276 | |||||||||||||||||||||
|
|
|
|
|
| |||||||||||||||||||
See Notes to Pro-forma Combined Financial Statements.
42
| Multimanager Large Cap Value Number of Shares | EQ/Large Cap Value PLUS Number of Shares | Pro-forma Combined | Multimanager Value ($) (Note 1) | EQ/Large Cap Value ($) (Note 1) | Pro-forma Value ($) (Note 1) | |||||||||||||||||||
Information Technology (9.8%) | ||||||||||||||||||||||||
Communications Equipment (1.7%) | ||||||||||||||||||||||||
Brocade Communications Systems, Inc.* | 12,832 | 159,444 | 172,276 | 113,820 | 1,414,268 | 1,528,088 | ||||||||||||||||||
Cisco Systems, Inc. | 351,373 | 3,239,841 | 3,591,214 | 7,888,324 | 72,734,431 | 80,622,755 | ||||||||||||||||||
CommScope Holding Co., Inc.* | 512 | 6,401 | 6,913 | 9,687 | 121,107 | 130,794 | ||||||||||||||||||
EchoStar Corp., | 1,176 | 14,607 | 15,783 | 58,471 | 726,260 | 784,731 | ||||||||||||||||||
Harris Corp. | 18,445 | 149,556 | 168,001 | 1,287,645 | 10,440,504 | 11,728,149 | ||||||||||||||||||
JDS Uniphase Corp.* | 1,535 | 19,568 | 21,103 | 19,924 | 253,993 | 273,917 | ||||||||||||||||||
Juniper Networks, Inc.* | 11,918 | 148,311 | 160,229 | 268,989 | 3,347,379 | 3,616,368 | ||||||||||||||||||
Motorola Solutions, Inc. | 359 | 4,702 | 5,061 | 24,233 | 317,385 | 341,618 | ||||||||||||||||||
Polycom, Inc.* | 4,962 | 62,015 | 66,977 | 55,723 | 696,428 | 752,151 | ||||||||||||||||||
Riverbed Technology, Inc.* | 162 | 3,262 | 3,424 | 2,929 | 58,977 | 61,906 | ||||||||||||||||||
Telefonaktiebolaget LM Ericsson (ADR) | — | 490,300 | 490,300 | — | 6,001,272 | 6,001,272 | ||||||||||||||||||
|
|
|
|
|
| |||||||||||||||||||
| 9,729,745 | 96,112,004 | 105,841,749 | ||||||||||||||||||||||
|
|
|
|
|
| |||||||||||||||||||
Computers & Peripherals (2.4%) | ||||||||||||||||||||||||
Apple, Inc. | 8,228 | 145,777 | 154,005 | 4,616,813 | 81,796,932 | 86,413,745 | ||||||||||||||||||
Diebold, Inc. | 1,762 | 22,924 | 24,686 | 58,164 | 756,721 | 814,885 | ||||||||||||||||||
EMC Corp. | 30,398 | 377,411 | 407,809 | 764,510 | 9,491,887 | 10,256,397 | ||||||||||||||||||
Hewlett-Packard Co. | 158,013 | 1,316,664 | 1,474,677 | 4,421,204 | 36,840,259 | 41,261,463 | ||||||||||||||||||
Lexmark International, Inc., Class A | 1,762 | 22,652 | 24,414 | 62,586 | 804,599 | 867,185 | ||||||||||||||||||
SanDisk Corp. | 3,886 | 47,786 | 51,672 | 274,118 | 3,370,824 | 3,644,942 | ||||||||||||||||||
Stratasys Ltd.* | 485 | 5,166 | 5,651 | 65,330 | 695,860 | 761,190 | ||||||||||||||||||
Western Digital Corp. | 6,138 | 75,904 | 82,042 | 514,978 | 6,368,346 | 6,883,324 | ||||||||||||||||||
|
|
|
|
|
| |||||||||||||||||||
| 10,777,703 | 140,125,428 | 150,903,131 | ||||||||||||||||||||||
|
|
|
|
|
| |||||||||||||||||||
Electronic Equipment, Instruments & Components (0.5%) | ||||||||||||||||||||||||
Arrow Electronics, Inc.* | 16,004 | 155,704 | 171,708 | 868,217 | 8,446,942 | 9,315,159 | ||||||||||||||||||
Avnet, Inc. | 3,917 | 49,265 | 53,182 | 172,779 | 2,173,079 | 2,345,858 | ||||||||||||||||||
AVX Corp. | 1,272 | 17,071 | 18,343 | 17,719 | 237,799 | 255,518 | ||||||||||||||||||
CDW Corp. | 494 | 6,214 | 6,708 | 11,540 | 145,159 | 156,699 | ||||||||||||||||||
Corning, Inc. | 42,675 | 701,764 | 744,439 | 760,468 | 12,505,435 | 13,265,903 | ||||||||||||||||||
Dolby Laboratories, Inc., Class A* | 717 | 9,819 | 10,536 | 27,648 | 378,621 | 406,269 | ||||||||||||||||||
FLIR Systems, Inc. | 1,241 | 15,494 | 16,735 | 37,354 | 466,369 | 503,723 | ||||||||||||||||||
Ingram Micro, Inc., Class A* | 4,342 | 54,783 | 59,125 | 101,863 | 1,285,209 | 1,387,072 | ||||||||||||||||||
Jabil Circuit, Inc. | 5,845 | 72,829 | 78,674 | 101,937 | 1,270,138 | 1,372,075 | ||||||||||||||||||
Tech Data Corp.* | 1,110 | 13,649 | 14,759 | 57,276 | 704,288 | 761,564 | ||||||||||||||||||
Vishay Intertechnology, Inc.* | 3,721 | 47,227 | 50,948 | 49,340 | 626,230 | 675,570 | ||||||||||||||||||
|
|
|
|
|
| |||||||||||||||||||
| 2,206,141 | 28,239,269 | 30,445,410 | ||||||||||||||||||||||
|
|
|
|
|
| |||||||||||||||||||
Internet Software & Services (0.4%) | ||||||||||||||||||||||||
AOL, Inc.* | 2,170 | 27,833 | 30,003 | 101,165 | 1,297,575 | 1,398,740 | ||||||||||||||||||
Google, Inc., Class A* | — | 7,300 | 7,300 | — | 8,181,183 | 8,181,183 | ||||||||||||||||||
Twitter, Inc.* | 589 | 7,303 | 7,892 | 37,490 | 464,836 | 502,326 | ||||||||||||||||||
Yahoo!, Inc.* | 25,893 | 321,310 | 347,203 | 1,047,113 | 12,993,776 | 14,040,889 | ||||||||||||||||||
|
|
|
|
|
| |||||||||||||||||||
| 1,185,768 | 22,937,370 | 24,123,138 | ||||||||||||||||||||||
|
|
|
|
|
| |||||||||||||||||||
IT Services (0.8%) | ||||||||||||||||||||||||
Accenture plc, Class A | 32,493 | — | 32,493 | 2,671,574 | — | 2,671,574 | ||||||||||||||||||
Amdocs Ltd. | 17,169 | 162,374 | 179,543 | 708,050 | 6,696,304 | 7,404,354 | ||||||||||||||||||
Booz Allen Hamilton Holding Corp. | 8 | 703 | 711 | 153 | 13,462 | 13,615 | ||||||||||||||||||
Computer Sciences Corp. | 4,376 | 53,994 | 58,370 | 244,531 | 3,017,185 | 3,261,716 | ||||||||||||||||||
CoreLogic, Inc.* | 2,676 | 34,349 | 37,025 | 95,078 | 1,220,420 | 1,315,498 | ||||||||||||||||||
See Notes to Pro-forma Combined Financial Statements.
43
| Multimanager Large Cap Value Number of Shares | EQ/Large Cap Value PLUS Number of Shares | Pro-forma Combined | Multimanager Value ($) (Note 1) | EQ/Large Cap Value ($) (Note 1) | Pro-forma Value ($) (Note 1) | |||||||||||||||||||
DST Systems, Inc. | 197 | 2,243 | 2,440 | 17,876 | 203,530 | 221,406 | ||||||||||||||||||
Fidelity National Information Services, Inc. | 14,422 | 94,919 | 109,341 | 774,173 | 5,095,252 | 5,869,425 | ||||||||||||||||||
Fiserv, Inc.* | 12,346 | — | 12,346 | 729,031 | — | 729,031 | ||||||||||||||||||
International Business Machines Corp. | 12,913 | 50,400 | 63,313 | 2,422,091 | 9,453,528 | 11,875,619 | ||||||||||||||||||
Leidos Holdings, Inc. | 2,122 | 26,262 | 28,384 | 98,652 | 1,220,920 | 1,319,572 | ||||||||||||||||||
Lender Processing Services, Inc. | 524 | 5,612 | 6,136 | 19,587 | 209,777 | 229,364 | ||||||||||||||||||
MasterCard, Inc., Class A | — | 7,100 | 7,100 | — | 5,931,766 | 5,931,766 | ||||||||||||||||||
Paychex, Inc. | 914 | 11,756 | 12,670 | 41,614 | 535,251 | 576,865 | ||||||||||||||||||
Science Applications International Corp. | 1,141 | 15,021 | 16,162 | 37,733 | 496,744 | 534,477 | ||||||||||||||||||
Total System Services, Inc. | 1,045 | 13,241 | 14,286 | 34,778 | 440,660 | 475,438 | ||||||||||||||||||
VeriFone Systems, Inc.* | 3,135 | 39,113 | 42,248 | 84,081 | 1,049,011 | 1,133,092 | ||||||||||||||||||
Western Union Co. | 21,680 | 435,494 | 457,174 | 373,980 | 7,512,272 | 7,886,252 | ||||||||||||||||||
|
|
|
|
|
| |||||||||||||||||||
| 8,352,982 | 43,096,082 | 51,449,064 | ||||||||||||||||||||||
|
|
|
|
|
| |||||||||||||||||||
Office Electronics (0.4%) | ||||||||||||||||||||||||
Xerox Corp. | 162,888 | 1,899,137 | 2,062,025 | 1,982,347 | 23,112,497 | 25,094,844 | ||||||||||||||||||
Zebra Technologies Corp., Class A* | 1,372 | 16,719 | 18,091 | 74,198 | 904,164 | 978,362 | ||||||||||||||||||
|
|
|
|
|
| |||||||||||||||||||
| 2,056,545 | 24,016,661 | 26,073,206 | ||||||||||||||||||||||
|
|
|
|
|
| |||||||||||||||||||
Semiconductors & Semiconductor | ||||||||||||||||||||||||
Altera Corp. | 6,007 | 75,360 | 81,367 | 195,408 | 2,451,461 | 2,646,869 | ||||||||||||||||||
Analog Devices, Inc. | 5,028 | 62,967 | 67,995 | 256,076 | 3,206,909 | 3,462,985 | ||||||||||||||||||
Applied Materials, Inc. | 71,021 | 626,189 | 697,210 | 1,256,362 | 11,077,283 | 12,333,645 | ||||||||||||||||||
Avago Technologies Ltd. | 621 | 7,494 | 8,115 | 32,845 | 396,358 | 429,203 | ||||||||||||||||||
Broadcom Corp., Class A | 9,273 | 115,536 | 124,809 | 274,944 | 3,425,642 | 3,700,586 | ||||||||||||||||||
Fairchild Semiconductor International, Inc.* | 3,590 | 45,745 | 49,335 | 47,927 | 610,696 | 658,623 | ||||||||||||||||||
First Solar, Inc.* | 1,897 | 24,397 | 26,294 | 103,652 | 1,333,052 | 1,436,704 | ||||||||||||||||||
Freescale Semiconductor Ltd.* | 848 | 11,180 | 12,028 | 13,610 | 179,439 | 193,049 | ||||||||||||||||||
Intel Corp. | 166,782 | 1,669,730 | 1,836,512 | 4,329,661 | 43,346,191 | 47,675,852 | ||||||||||||||||||
KLA-Tencor Corp. | 4,766 | 68,397 | 73,163 | 307,216 | 4,408,871 | 4,716,087 | ||||||||||||||||||
Lam Research Corp.* | 16,132 | 44,832 | 60,964 | 878,387 | 2,441,102 | 3,319,489 | ||||||||||||||||||
LSI Corp. | 14,073 | 174,552 | 188,625 | 155,085 | 1,923,563 | 2,078,648 | ||||||||||||||||||
Marvell Technology Group Ltd. | 11,428 | 141,772 | 153,200 | 164,335 | 2,038,681 | 2,203,016 | ||||||||||||||||||
Micron Technology, Inc.* | 55,978 | 529,267 | 585,245 | 1,218,081 | 11,516,850 | 12,734,931 | ||||||||||||||||||
NVIDIA Corp. | 24,218 | 207,697 | 231,915 | 387,972 | 3,327,306 | 3,715,278 | ||||||||||||||||||
ON Semiconductor Corp.* | 621 | 8,172 | 8,793 | 5,117 | 67,337 | 72,454 | ||||||||||||||||||
Silicon Laboratories, Inc.* | 197 | 2,070 | 2,267 | 8,532 | 89,652 | 98,184 | ||||||||||||||||||
Skyworks Solutions, Inc.* | 914 | 11,642 | 12,556 | 26,104 | 332,496 | 358,600 | ||||||||||||||||||
Teradyne, Inc.* | 5,452 | 297,497 | 302,949 | 96,064 | 5,241,897 | 5,337,961 | ||||||||||||||||||
Texas Instruments, Inc. | 97,555 | — | 97,555 | 4,283,640 | — | 4,283,640 | ||||||||||||||||||
|
|
|
|
|
| |||||||||||||||||||
| 14,041,018 | 97,414,786 | 111,455,804 | ||||||||||||||||||||||
|
|
|
|
|
| |||||||||||||||||||
Software (1.7%) | ||||||||||||||||||||||||
Activision Blizzard, Inc. | 7,889 | 89,187 | 97,076 | 140,661 | 1,590,204 | 1,730,865 | ||||||||||||||||||
Adobe Systems, Inc.* | 8,849 | 110,015 | 118,864 | 529,878 | 6,587,698 | 7,117,576 | ||||||||||||||||||
Autodesk, Inc.* | 1,272 | 16,697 | 17,969 | 64,020 | 840,360 | 904,380 | ||||||||||||||||||
CA, Inc. | 9,435 | 117,871 | 127,306 | 317,488 | 3,966,359 | 4,283,847 | ||||||||||||||||||
Compuware Corp. | 6,138 | 76,687 | 82,825 | 68,807 | 859,661 | 928,468 | ||||||||||||||||||
Electronic Arts, Inc.* | 53,424 | 492,129 | 545,553 | 1,225,547 | 11,289,439 | 12,514,986 | ||||||||||||||||||
FireEye, Inc.* | 125 | 1,551 | 1,676 | 5,451 | 67,639 | 73,090 | ||||||||||||||||||
MICROS Systems, Inc.* | 1,893 | 24,055 | 25,948 | 108,601 | 1,380,036 | 1,488,637 | ||||||||||||||||||
Microsoft Corp. | — | 1,025,232 | 1,025,232 | — | 38,374,434 | 38,374,434 | ||||||||||||||||||
Nuance Communications, Inc.* | 7,476 | 93,959 | 101,435 | 113,635 | 1,428,177 | 1,541,812 | ||||||||||||||||||
See Notes to Pro-forma Combined Financial Statements.
44
| Multimanager Large Cap Value Number of Shares | EQ/Large Cap Value PLUS Number of Shares | Pro-forma Combined | Multimanager Value ($) (Note 1) | EQ/Large Cap Value ($) (Note 1) | Pro-forma Value ($) (Note 1) | |||||||||||||||||||
Oracle Corp. | 146,321 | 432,971 | 579,292 | 5,598,242 | 16,565,471 | 22,163,713 | ||||||||||||||||||
Rovi Corp.* | 2,645 | 32,880 | 35,525 | 52,080 | 647,407 | 699,487 | ||||||||||||||||||
Symantec Corp. | 122,495 | 383,936 | 506,431 | 2,888,432 | 9,053,211 | 11,941,643 | ||||||||||||||||||
Synopsys, Inc.* | 4,407 | 55,240 | 59,647 | 178,792 | 2,241,087 | 2,419,879 | ||||||||||||||||||
Zynga, Inc., Class A* | 16,815 | 209,574 | 226,389 | 63,897 | 796,381 | 860,278 | ||||||||||||||||||
|
|
|
|
|
| |||||||||||||||||||
| 11,355,531 | 95,687,564 | 107,043,095 | ||||||||||||||||||||||
|
|
|
|
|
| |||||||||||||||||||
Total Information Technology | 59,705,433 | 547,629,164 | 607,334,597 | |||||||||||||||||||||
|
|
|
|
|
| |||||||||||||||||||
Materials (2.4%) | ||||||||||||||||||||||||
Chemicals (1.5%) | ||||||||||||||||||||||||
Air Products and Chemicals, Inc. | 8,922 | 74,900 | 83,822 | 997,301 | 8,372,322 | 9,369,623 | ||||||||||||||||||
Akzo Nobel N.V. (ADR) | — | 215,800 | 215,800 | — | 5,582,746 | 5,582,746 | ||||||||||||||||||
Albemarle Corp. | 1,500 | 18,221 | 19,721 | 95,085 | 1,155,029 | 1,250,114 | ||||||||||||||||||
Ashland, Inc. | 2,352 | 70,061 | 72,413 | 228,238 | 6,798,719 | 7,026,957 | ||||||||||||||||||
Cabot Corp. | 1,862 | 22,927 | 24,789 | 95,707 | 1,178,448 | 1,274,155 | ||||||||||||||||||
Celanese Corp. | — | 1,400 | 1,400 | — | 77,434 | 77,434 | ||||||||||||||||||
CF Industries Holdings, Inc. | 1,784 | 21,350 | 23,134 | 415,743 | 4,975,404 | 5,391,147 | ||||||||||||||||||
Cytec Industries, Inc. | 1,041 | 13,172 | 14,213 | 96,980 | 1,227,104 | 1,324,084 | ||||||||||||||||||
Dow Chemical Co. | 30,398 | 377,679 | 408,077 | 1,349,671 | 16,768,948 | 18,118,619 | ||||||||||||||||||
Huntsman Corp. | 5,518 | 69,495 | 75,013 | 135,743 | 1,709,577 | 1,845,320 | ||||||||||||||||||
Kronos Worldwide, Inc. | 555 | 7,506 | 8,061 | 10,573 | 142,989 | 153,562 | ||||||||||||||||||
LyondellBasell Industries N.V., Class A | 24,243 | 278,680 | 302,923 | 1,946,228 | 22,372,430 | 24,318,658 | ||||||||||||||||||
Monsanto Co. | 32,031 | — | 32,031 | 3,733,213 | — | 3,733,213 | ||||||||||||||||||
Mosaic Co. | 42,917 | 107,835 | 150,752 | 2,028,687 | 5,097,360 | 7,126,047 | ||||||||||||||||||
PPG Industries, Inc. | 9,244 | 4,673 | 13,917 | 1,753,217 | 886,281 | 2,639,498 | ||||||||||||||||||
Rockwood Holdings, Inc. | 621 | 7,708 | 8,329 | 44,662 | 554,359 | 599,021 | ||||||||||||||||||
RPM International, Inc. | 262 | 3,070 | 3,332 | 10,876 | 127,436 | 138,312 | ||||||||||||||||||
Sigma-Aldrich Corp. | 262 | 2,447 | 2,709 | 24,631 | 230,043 | 254,674 | ||||||||||||||||||
Valspar Corp. | 1,660 | — | 1,660 | 118,341 | — | 118,341 | ||||||||||||||||||
W.R. Grace & Co.* | 328 | 3,616 | 3,944 | 32,429 | 357,514 | 389,943 | ||||||||||||||||||
Westlake Chemical Corp. | 131 | 1,087 | 1,218 | 15,991 | 132,690 | 148,681 | ||||||||||||||||||
|
|
|
|
|
| |||||||||||||||||||
| 13,133,316 | 77,746,833 | 90,880,149 | ||||||||||||||||||||||
|
|
|
|
|
| |||||||||||||||||||
Construction | ||||||||||||||||||||||||
Vulcan Materials Co. | 3,721 | 46,733 | 50,454 | 221,102 | 2,776,875 | 2,997,977 | ||||||||||||||||||
|
|
|
|
|
| |||||||||||||||||||
Containers & | ||||||||||||||||||||||||
AptarGroup, Inc. | 621 | 7,171 | 7,792 | 42,110 | 486,266 | 528,376 | ||||||||||||||||||
Avery Dennison Corp. | 1,959 | 24,495 | 26,454 | 98,322 | 1,229,404 | 1,327,726 | ||||||||||||||||||
Bemis Co., Inc. | 1,666 | 20,764 | 22,430 | 68,239 | 850,493 | 918,732 | ||||||||||||||||||
Crown Holdings, Inc.* | 9,001 | 7,671 | 16,672 | 401,175 | 341,896 | 743,071 | ||||||||||||||||||
Greif, Inc., Class A | 752 | 9,145 | 9,897 | 39,405 | 479,198 | 518,603 | ||||||||||||||||||
MeadWestvaco Corp. | 5,093 | 63,577 | 68,670 | 188,084 | 2,347,899 | 2,535,983 | ||||||||||||||||||
Owens-Illinois, Inc.* | 1,893 | 24,394 | 26,287 | 67,732 | 872,817 | 940,549 | ||||||||||||||||||
Rock-Tenn Co., Class A | 621 | 7,292 | 7,913 | 65,211 | 765,733 | 830,944 | ||||||||||||||||||
Sonoco Products Co. | 2,873 | 36,394 | 39,267 | 119,862 | 1,518,358 | 1,638,220 | ||||||||||||||||||
|
|
|
|
|
| |||||||||||||||||||
| 1,090,140 | 8,892,064 | 9,982,204 | ||||||||||||||||||||||
|
|
|
|
|
| |||||||||||||||||||
Metals & Mining (0.7%) | ||||||||||||||||||||||||
Alcoa, Inc. | 30,953 | 384,231 | 415,184 | 329,030 | 4,084,376 | 4,413,406 | ||||||||||||||||||
Allegheny Technologies, Inc. | 3,069 | 38,841 | 41,910 | 109,349 | 1,383,905 | 1,493,254 | ||||||||||||||||||
Carpenter Technology Corp. | 1,372 | 16,705 | 18,077 | 85,338 | 1,039,051 | 1,124,389 | ||||||||||||||||||
Cliffs Natural Resources, Inc. | 4,342 | 54,997 | 59,339 | 113,804 | 1,441,471 | 1,555,275 | ||||||||||||||||||
See Notes to Pro-forma Combined Financial Statements.
45
| Multimanager Large Cap Value Number of Shares | EQ/Large Cap Value PLUS Number of Shares | Pro-forma Combined | Multimanager Value ($) (Note 1) | EQ/Large Cap Value ($) (Note 1) | Pro-forma Combined Value ($) (Note 1) | |||||||||||||||||||
Freeport-McMoRan Copper & Gold, Inc. | 29,888 | 371,589 | 401,477 | 1,127,973 | 14,023,769 | 15,151,742 | ||||||||||||||||||
Newmont Mining Corp. | 14,170 | 176,931 | 191,101 | 326,335 | 4,074,721 | 4,401,056 | ||||||||||||||||||
Nucor Corp. | 9,207 | 114,242 | 123,449 | 491,470 | 6,098,238 | 6,589,708 | ||||||||||||||||||
Reliance Steel & Aluminum Co. | 2,186 | 61,773 | 63,959 | 165,786 | 4,684,864 | 4,850,650 | ||||||||||||||||||
Royal Gold, Inc. | 1,338 | 17,290 | 18,628 | 61,642 | 796,550 | 858,192 | ||||||||||||||||||
Steel Dynamics, Inc. | 6,300 | 79,216 | 85,516 | 123,102 | 1,547,881 | 1,670,983 | ||||||||||||||||||
Tahoe Resources, Inc.* | 2,055 | 26,730 | 28,785 | 34,195 | 444,787 | 478,982 | ||||||||||||||||||
United States Steel Corp. | 4,180 | 51,837 | 56,017 | 123,310 | 1,529,191 | 1,652,501 | ||||||||||||||||||
|
|
|
|
|
| |||||||||||||||||||
| 3,091,334 | 41,148,804 | 44,240,138 | ||||||||||||||||||||||
|
|
|
|
|
| |||||||||||||||||||
Paper & Forest | ||||||||||||||||||||||||
Domtar Corp. | 979 | 11,918 | 12,897 | 92,358 | 1,124,344 | 1,216,702 | ||||||||||||||||||
International Paper Co. | 1,762 | 27,651 | 29,413 | 86,391 | 1,355,729 | 1,442,120 | ||||||||||||||||||
|
|
|
|
|
| |||||||||||||||||||
| 178,749 | 2,480,073 | 2,658,822 | ||||||||||||||||||||||
|
|
|
|
|
| |||||||||||||||||||
Total Materials | 17,714,641 | 133,044,649 | 150,759,290 | |||||||||||||||||||||
|
|
|
|
|
| |||||||||||||||||||
Telecommunication Services (2.1%) | ||||||||||||||||||||||||
Diversified Telecommunication | ||||||||||||||||||||||||
AT&T, Inc. | 260,823 | 2,295,247 | 2,556,070 | 9,170,537 | 80,700,885 | 89,871,422 | ||||||||||||||||||
CenturyLink, Inc. | 17,608 | 218,800 | 236,408 | 560,815 | 6,968,780 | 7,529,595 | ||||||||||||||||||
Frontier Communications Corp. | 28,824 | 358,505 | 387,329 | 134,031 | 1,667,048 | 1,801,079 | ||||||||||||||||||
Intelsat S.A.* | 521 | 7,600 | 8,121 | 11,743 | 171,304 | 183,047 | ||||||||||||||||||
Level 3 Communications, Inc.* | 3,095 | 38,802 | 41,897 | 102,661 | 1,287,062 | 1,389,723 | ||||||||||||||||||
Verizon Communications, Inc. | 30,235 | — | 30,235 | 1,485,748 | — | 1,485,748 | ||||||||||||||||||
Windstream Holdings, Inc. | 914 | 11,722 | 12,636 | 7,294 | 93,542 | 100,836 | ||||||||||||||||||
|
|
|
|
|
| |||||||||||||||||||
| 11,472,829 | 90,888,621 | 102,361,450 | ||||||||||||||||||||||
|
|
|
|
|
| |||||||||||||||||||
Wireless Telecommunication | ||||||||||||||||||||||||
Sprint Corp.* | 20,113 | 250,068 | 270,181 | 216,215 | 2,688,231 | 2,904,446 | ||||||||||||||||||
Telephone & Data Systems, Inc. | 2,728 | 33,864 | 36,592 | 70,328 | 873,014 | 943,342 | ||||||||||||||||||
T-Mobile US, Inc.* | 4,943 | 61,927 | 66,870 | 166,282 | 2,083,224 | 2,249,506 | ||||||||||||||||||
U.S. Cellular Corp. | 359 | 4,694 | 5,053 | 15,013 | 196,303 | 211,316 | ||||||||||||||||||
Vodafone Group plc (ADR) | 186,186 | 263,800 | 449,986 | 7,318,972 | 10,369,978 | 17,688,950 | ||||||||||||||||||
Vodafone Group plc | 412,317 | — | 412,317 | 1,618,180 | — | 1,618,180 | ||||||||||||||||||
|
|
|
|
|
| |||||||||||||||||||
| 9,404,990 | 16,210,750 | 25,615,740 | ||||||||||||||||||||||
|
|
|
|
|
| |||||||||||||||||||
Total | 20,877,819 | 107,099,371 | 127,977,190 | |||||||||||||||||||||
|
|
|
|
|
| |||||||||||||||||||
Utilities (4.2%) | ||||||||||||||||||||||||
Electric Utilities (2.1%) | ||||||||||||||||||||||||
American Electric Power Co., Inc. | 14,073 | 218,107 | 232,180 | 657,772 | 10,194,321 | 10,852,093 | ||||||||||||||||||
Duke Energy Corp. | 26,551 | 253,543 | 280,094 | 1,832,284 | 17,497,002 | 19,329,286 | ||||||||||||||||||
Edison International | 37,569 | 413,416 | 450,985 | 1,739,445 | 19,141,161 | 20,880,606 | ||||||||||||||||||
Entergy Corp. | 5,159 | 64,055 | 69,214 | 326,410 | 4,052,760 | 4,379,170 | ||||||||||||||||||
Exelon Corp. | 123,770 | 307,518 | 431,288 | 3,390,060 | 8,422,918 | 11,812,978 | ||||||||||||||||||
FirstEnergy Corp. | 12,060 | 150,316 | 162,376 | 397,739 | 4,957,422 | 5,355,161 | ||||||||||||||||||
Great Plains Energy, Inc. | 4,407 | 55,312 | 59,719 | 106,826 | 1,340,763 | 1,447,589 | ||||||||||||||||||
Hawaiian Electric Industries, Inc. | 2,842 | 35,422 | 38,264 | 74,062 | 923,097 | 997,159 | ||||||||||||||||||
NextEra Energy, Inc. | 12,277 | 152,636 | 164,913 | 1,051,157 | 13,068,694 | 14,119,851 | ||||||||||||||||||
Northeast Utilities | 9,062 | 113,035 | 122,097 | 384,138 | 4,791,554 | 5,175,692 | ||||||||||||||||||
OGE Energy Corp. | 5,714 | 71,246 | 76,960 | 193,705 | 2,415,239 | 2,608,944 | ||||||||||||||||||
Pepco Holdings, Inc. | 7,183 | 89,339 | 96,522 | 137,411 | 1,709,055 | 1,846,466 | ||||||||||||||||||
Pinnacle West Capital Corp. | 3,200 | 39,525 | 42,725 | 169,344 | 2,091,663 | 2,261,007 | ||||||||||||||||||
PPL Corp. | 32,103 | 226,932 | 259,035 | 965,979 | 6,828,384 | 7,794,363 | ||||||||||||||||||
See Notes to Pro-forma Combined Financial Statements.
46
| Multimanager Large Cap Value Number of Shares | EQ/Large Cap Value PLUS Number of Shares | Pro-forma Combined | Multimanager Value ($) (Note 1) | EQ/Large Cap Value ($) (Note 1) | Pro-forma Combined Value ($) (Note 1) | |||||||||||||||||||
Southern Co. | 25,174 | 312,731 | 337,905 | 1,034,903 | 12,856,371 | 13,891,274 | ||||||||||||||||||
Westar Energy, Inc. | 3,590 | 45,597 | 49,187 | 115,490 | 1,466,856 | 1,582,346 | ||||||||||||||||||
Xcel Energy, Inc. | 14,366 | 178,713 | 193,079 | 401,386 | 4,993,241 | 5,394,627 | ||||||||||||||||||
|
|
|
|
|
| |||||||||||||||||||
| 12,978,111 | 116,750,501 | 129,728,612 | ||||||||||||||||||||||
|
|
|
|
|
| |||||||||||||||||||
Gas Utilities (0.4%) | ||||||||||||||||||||||||
AGL Resources, Inc. | 3,462 | 42,525 | 45,987 | 163,510 | 2,008,456 | 2,171,966 | ||||||||||||||||||
Atmos Energy Corp. | 24,136 | 186,471 | 210,607 | 1,096,257 | 8,469,513 | 9,565,770 | ||||||||||||||||||
National Fuel Gas Co. | 2,155 | 26,490 | 28,645 | 153,867 | 1,891,386 | 2,045,253 | ||||||||||||||||||
ONEOK, Inc. | 393 | 4,451 | 4,844 | 24,437 | 276,763 | 301,200 | ||||||||||||||||||
Questar Corp. | 4,342 | 54,782 | 59,124 | 99,823 | 1,259,438 | 1,359,261 | ||||||||||||||||||
UGI Corp. | 17,631 | 179,563 | 197,194 | 730,981 | 7,444,682 | 8,175,663 | ||||||||||||||||||
|
|
|
|
|
| |||||||||||||||||||
| 2,268,875 | 21,350,238 | 23,619,113 | ||||||||||||||||||||||
|
|
|
|
|
| |||||||||||||||||||
Independent Power Producers & Energy Traders (0.4%) | ||||||||||||||||||||||||
AES Corp. | 17,925 | 1,219,516 | 1,237,441 | 260,092 | 17,695,177 | 17,955,269 | ||||||||||||||||||
Calpine Corp.* | 10,056 | 125,486 | 135,542 | 196,193 | 2,448,232 | 2,644,425 | ||||||||||||||||||
NRG Energy, Inc. | 9,338 | 115,919 | 125,257 | 268,187 | 3,329,194 | 3,597,381 | ||||||||||||||||||
|
|
|
|
|
| |||||||||||||||||||
| 724,472 | 23,472,603 | 24,197,075 | ||||||||||||||||||||||
|
|
|
|
|
| |||||||||||||||||||
Multi-Utilities (1.3%) | ||||||||||||||||||||||||
Alliant Energy Corp. | 3,166 | 39,904 | 43,070 | 163,366 | 2,059,047 | 2,222,413 | ||||||||||||||||||
Ameren Corp. | 6,987 | 87,188 | 94,175 | 252,650 | 3,152,718 | 3,405,368 | ||||||||||||||||||
CenterPoint Energy, Inc. | 38,408 | 153,990 | 192,398 | 890,297 | 3,569,488 | 4,459,785 | ||||||||||||||||||
CMS Energy Corp. | 7,673 | 95,913 | 103,586 | 205,406 | 2,567,591 | 2,772,997 | ||||||||||||||||||
Consolidated Edison, Inc. | 8,456 | 105,314 | 113,770 | 467,448 | 5,821,758 | 6,289,206 | ||||||||||||||||||
Dominion Resources, Inc. | 16,784 | 207,528 | 224,312 | 1,085,757 | 13,424,986 | 14,510,743 | ||||||||||||||||||
DTE Energy Co. | 7,845 | 62,511 | 70,356 | 520,830 | 4,150,105 | 4,670,935 | ||||||||||||||||||
Integrys Energy Group, Inc. | 2,252 | 28,496 | 30,748 | 122,531 | 1,550,467 | 1,672,998 | ||||||||||||||||||
MDU Resources Group, Inc. | 5,387 | 67,907 | 73,294 | 164,573 | 2,074,559 | 2,239,132 | ||||||||||||||||||
NiSource, Inc. | 9,045 | 112,159 | 121,204 | 297,400 | 3,687,788 | 3,985,188 | ||||||||||||||||||
PG&E Corp. | 12,766 | 158,932 | 171,698 | 514,214 | 6,401,781 | 6,915,995 | ||||||||||||||||||
Public Service Enterprise Group, Inc. | 20,720 | 181,785 | 202,505 | 663,869 | 5,824,391 | 6,488,260 | ||||||||||||||||||
SCANA Corp. | 4,049 | 50,169 | 54,218 | 190,020 | 2,354,431 | 2,544,451 | ||||||||||||||||||
Sempra Energy | 7,052 | 102,927 | 109,979 | 632,987 | 9,238,728 | 9,871,715 | ||||||||||||||||||
TECO Energy, Inc. | 6,269 | 78,250 | 84,519 | 108,078 | 1,349,030 | 1,457,108 | ||||||||||||||||||
Vectren Corp. | 2,317 | 29,627 | 31,944 | 82,253 | 1,051,759 | 1,134,012 | ||||||||||||||||||
Wisconsin Energy Corp. | 6,628 | 82,179 | 88,807 | 274,001 | 3,397,280 | 3,671,281 | ||||||||||||||||||
|
|
|
|
|
| |||||||||||||||||||
| 6,635,680 | 71,675,907 | 78,311,587 | ||||||||||||||||||||||
|
|
|
|
|
| |||||||||||||||||||
Water Utilities (0.1%) | ||||||||||||||||||||||||
American Water Works Co., Inc. | 5,159 | 63,930 | 69,089 | 218,019 | 2,701,682 | 2,919,701 | ||||||||||||||||||
Aqua America, Inc. | 537 | 7,931 | 8,468 | 12,668 | 187,092 | 199,760 | ||||||||||||||||||
|
|
|
|
|
| |||||||||||||||||||
| 230,687 | 2,888,774 | 3,119,461 | ||||||||||||||||||||||
|
|
|
|
|
| |||||||||||||||||||
Total Utilities | 22,837,825 | 236,138,023 | 258,975,848 | |||||||||||||||||||||
|
|
|
|
|
| |||||||||||||||||||
Total Common Stock (92.0%) | 637,540,273 | 5,089,971,812 | 5,727,512,085 | |||||||||||||||||||||
|
|
|
|
|
| |||||||||||||||||||
PREFERRED STOCK | ||||||||||||||||||||||||
Industrials (0.0%) | ||||||||||||||||||||||||
Machinery (0.0%) | ||||||||||||||||||||||||
Stanley Black & Decker, Inc. | — | 6,000 | 6,000 | — | 619,200 | 619,200 | ||||||||||||||||||
|
|
|
|
|
| |||||||||||||||||||
Total Preferred Stock (0.0%) | — | 619,200 | 619,200 | |||||||||||||||||||||
|
|
|
|
|
| |||||||||||||||||||
See Notes to Pro-forma Combined Financial Statements.
47
| Multimanager Large Cap Value Number of Shares/ Principle Amount ($) | EQ/Large Cap Value PLUS Number of Shares/ Principle Amount ($) | Pro-forma Combined | Multimanager Value ($) (Note 1) | EQ/Large Cap Value ($) (Note 1) | Pro-forma Combined Value ($) (Note 1) | |||||||||||||||||||
CONVERTIBLE PREFERRED STOCK: | ||||||||||||||||||||||||
Industrials (0.0%) | ||||||||||||||||||||||||
Aerospace & Defense (0.0%) | ||||||||||||||||||||||||
United Technologies Corp. | ||||||||||||||||||||||||
7.500% | 3,427 | — | 3,427 | 224,366 | — | 224,366 | ||||||||||||||||||
|
|
|
|
|
| |||||||||||||||||||
Total Industrials | 224,366 | — | 224,366 | |||||||||||||||||||||
|
|
|
|
|
| |||||||||||||||||||
Total Convertible Preferred Stock (0.0%) | 224,366 | — | 224,366 | |||||||||||||||||||||
|
|
|
|
|
| |||||||||||||||||||
SHORT-TERM INVESTMENTS: | ||||||||||||||||||||||||
Commercial Paper (0.0%) | ||||||||||||||||||||||||
HSBC USA, Inc. | 1,012,000 | — | 1,012,000 | 1,011,997 | — | 1,011,997 | ||||||||||||||||||
|
|
|
|
|
| |||||||||||||||||||
Total Commercial Paper | 1,011,997 | — | 1,011,997 | |||||||||||||||||||||
|
|
|
|
|
| |||||||||||||||||||
Total Short-Term | 1,011,997 | — | 1,011,997 | |||||||||||||||||||||
|
|
|
|
|
| |||||||||||||||||||
INVESTMENT COMPANIES: | ||||||||||||||||||||||||
Exchange Traded Funds (0.3%) | ||||||||||||||||||||||||
Mutual Funds (0.3%) | ||||||||||||||||||||||||
iShares Core S&P 500 ETF | — | 294 | 294 | — | 54,581 | 54,581 | ||||||||||||||||||
iShares Morningstar Large-Cap ETF | — | 499 | 499 | — | 53,812 | 53,812 | ||||||||||||||||||
iShares Morningstar Large-Cap Growth ETF | — | 5,200 | 5,200 | — | 519,948 | 519,948 | ||||||||||||||||||
iShares Morningstar Large-Cap Value ETF | — | 38,655 | 38,655 | — | 3,107,862 | 3,107,862 | ||||||||||||||||||
iShares Russell 1000 ETF | — | 531 | 531 | — | 54,783 | 54,783 | ||||||||||||||||||
iShares Russell 1000 Growth ETF | — | 5,670 | 5,670 | — | 487,337 | 487,337 | ||||||||||||||||||
iShares Russell 1000 Value ETF | — | 59,838 | 59,838 | — | 5,634,346 | 5,634,346 | ||||||||||||||||||
iShares S&P 500 Value ETF | — | 37,521 | 37,521 | — | 3,206,545 | 3,206,545 | ||||||||||||||||||
Vanguard Growth ETF | — | 2,150 | 2,150 | — | 200,058 | 200,058 | ||||||||||||||||||
Vanguard Large-Cap ETF | — | 1,964 | 1,964 | — | 166,547 | 166,547 | ||||||||||||||||||
Vanguard Value ETF | — | 44,621 | 44,621 | — | 3,408,598 | 3,408,598 | ||||||||||||||||||
|
|
|
|
|
| |||||||||||||||||||
Total Investment Companies (0.3%) | — | 16,894,417 | 16,894,417 | |||||||||||||||||||||
|
|
|
|
|
| |||||||||||||||||||
Total Investments (92.3%) | 638,776,636 | 5,107,485,429 | 5,746,262,065 | |||||||||||||||||||||
Other Assets Less Liabilities (7.7%) | 65,148,811 | 411,852,237 | 477,001,048 | |||||||||||||||||||||
|
|
|
|
|
| |||||||||||||||||||
Net Assets (100%) | $ | 703,925,447 | $ | 5,519,337,666 | $ | 6,223,263,113 | ||||||||||||||||||
|
|
|
|
|
| |||||||||||||||||||
| * | Non-income producing. |
| (p) | Yield to maturity. |
Glossary
ADR - American Depositary Receipt
See Notes to Pro-forma Combined Financial Statements.
48
At December 31, 2013 the Portfolio had the following futures contracts open:
Multimanager Large Cap Value
Purchases | Number of Contracts | Expiration Date | Original Value | Value at 12/31/2013 | Unrealized Appreciation/ (Depreciation) | |||||||||||||||
S&P MidCap 400 E-Mini Index | 83 | March - 14 | $ | 10,858,160 | $ | 11,117,020 | $ | 258,860 | ||||||||||||
S&P 500 E-Mini Index | 554 | March - 14 | 49,882,732 | 50,998,470 | 1,115,738 | |||||||||||||||
|
| |||||||||||||||||||
| $ | 1,374,598 | |||||||||||||||||||
|
| |||||||||||||||||||
EQ/Large Cap Value PLUS
Purchases | Number of Contracts | Expiration Date | Original Value | Value at 12/31/2013 | Unrealized Appreciation/ (Depreciation) | |||||||||||||||
S&P 400 MidCap E-Mini Index | 579 | March - 14 | $ | 75,745,477 | $ | 77,551,260 | $ | 1,805,783 | ||||||||||||
S&P 500 E-Mini Index | 3,825 | March - 14 | 344,466,756 | 352,110,375 | 7,643,619 | |||||||||||||||
|
| |||||||||||||||||||
| $ | 9,449,402 | |||||||||||||||||||
|
| |||||||||||||||||||
Combined Pro-Forma
Purchases | Number of Contracts | Expiration Date | Original Value | Value at 12/31/2013 | Unrealized Appreciation/ (Depreciation) | |||||||||||||||
S&P MidCap 400 E-Mini Index | 662 | March - 14 | $ | 86,603,637 | $ | 88,668,280 | $ | 2,064,643 | ||||||||||||
S&P 500 E-Mini Index | 4,379 | March - 14 | $ | 394,349,488 | $ | 403,108,845 | $ | 8,759,357 | ||||||||||||
|
| |||||||||||||||||||
| $ | 10,824,000 | |||||||||||||||||||
|
| |||||||||||||||||||
See Notes to Pro-forma Combined Financial Statements.
49
The following is a summary of the inputs used to value the Portfolio’s net assets as of December 31, 2013 :
The inputs or methodology used for valuing securities are not necessarily an indication of the risk associated with investing in those securities.
Various inputs are used in determining the value of the Portfolio’s investments. These inputs are summarized in the three broad levels listed below:
| • | Level 1 - Quoted prices in active markets for identical securities |
| • | Level 2 - Significant other observable inputs (including quoted prices for similar securities, interest rates, prepayment speeds, credit risk, etc.) |
| • | Level 3 - Significant unobservable inputs (including the Portfolio’s own assumptions in determining the fair value of investments) |
Description | Quoted Prices in Active Markets for Identical Securities (Level 1) | Significant Other Observable Inputs (Level 2) | Significant Unobservable Inputs (Level 3) | Total | ||||||||||||||||||||||||||||||||||||||||||||
| Multimanager Large Cap Value | EQ/Large Cap Value PLUS | COMBINED PRO FORMA | Multimanager Large Cap Value | EQ/Large Cap Value PLUS | COMBINED PRO FORMA | Multimanager Large Cap Value | EQ/Large Cap Value PLUS | COMBINED PRO FORMA | Multimanager Large Cap Value | EQ/Large Cap Value PLUS | COMBINED PRO FORMA | |||||||||||||||||||||||||||||||||||||
Assets | ||||||||||||||||||||||||||||||||||||||||||||||||
Investments in Securities | $ | 629,859,080 | $ | 5,107,485,429 | $ | 5,737,344,509 | $ | 8,917,556 | $ | — | $ | 8,917,556 | $ | — | $ | — | $ | — | $ | 638,776,636 | $ | 5,107,485,429 | $ | 5,746,262,065 | ||||||||||||||||||||||||
Other Investments* | 1,374,598 | 9,449,402 | 10,824,000 | — | — | — | — | — | — | 1,374,598 | 9,449,402 | 10,824,000 | ||||||||||||||||||||||||||||||||||||
|
|
|
|
|
|
|
|
|
|
|
|
|
|
|
|
|
|
|
|
|
|
|
| |||||||||||||||||||||||||
Total | $ | 631,233,678 | $ | 5,116,934,831 | $ | 5,748,168,509 | $ | 8,917,556 | $ | — | $ | 8,917,556 | $ | — | $ | — | $ | — | $ | 640,151,234 | $ | 5,116,934,831 | $ | 5,757,086,065 | ||||||||||||||||||||||||
|
|
|
|
|
|
|
|
|
|
|
|
|
|
|
|
|
|
|
|
|
|
|
| |||||||||||||||||||||||||
Liabilities | ||||||||||||||||||||||||||||||||||||||||||||||||
Investments in Securities | $ | — | $ | — | $ | — | $ | — | $ | — | $ | — | $ | — | $ | — | $ | — | $ | — | $ | — | $ | — | ||||||||||||||||||||||||
Other Investments* | — | — | — | — | — | — | — | — | — | — | — | — | ||||||||||||||||||||||||||||||||||||
|
|
|
|
|
|
|
|
|
|
|
|
|
|
|
|
|
|
|
|
|
|
|
| |||||||||||||||||||||||||
Total | $ | — | $ | — | $ | — | $ | — | $ | — | $ | — | $ | — | $ | — | $ | — | $ | — | $ | — | $ | — | ||||||||||||||||||||||||
|
|
|
|
|
|
|
|
|
|
|
|
|
|
|
|
|
|
|
|
|
|
|
| |||||||||||||||||||||||||
Total Assets and Liabilities | $ | 631,233,678 | $ | 5,116,934,831 | $ | 5,748,168,509 | $ | 8,917,556 | $ | — | $ | 8,917,556 | $ | — | $ | — | $ | — | $ | 640,151,234 | $ | 5,116,934,831 | $ | 5,757,086,065 | ||||||||||||||||||||||||
|
|
|
|
|
|
|
|
|
|
|
|
|
|
|
|
|
|
|
|
|
|
|
| |||||||||||||||||||||||||
| * | Other investments are derivative instruments, such as futures, forwards and written options, which are valued at the unrealized appreciation/depreciation on the instrument. |
There were no transfers between Levels 1, 2 or 3 during the year ended December 31, 2013.
See Notes to Pro-forma Combined Financial Statements.
50
Fair Values of Derivative Instruments as of December 31, 2013:
Multimanager Large Cap Value
Statement of Assets and Liabilities
Derivatives Not Accounted for as Hedging Instruments^ | Asset Derivatives | Fair Value | ||||
| Interest rate contracts | Receivables, Net Assets- | |||||
| Unrealized appreciation | $ | — | * | |||
| Foreign exchange contracts | Receivables | — | ||||
| Credit contracts | Receivables | — | ||||
| Equity contracts | Receivables, Net Assets- | |||||
| Unrealized appreciation | 1,374,598 | * | ||||
| Commodity contracts | Receivables | — | ||||
| Other contracts | Receivables | — | ||||
|
| |||||
| Total | $ | 1,374,598 | ||||
|
| |||||
Liability Derivatives | ||||||
| Interest rate contracts | Payables, Net Assets- | |||||
| Unrealized depreciation | $ | — | * | |||
| Foreign exchange contracts | Payables | — | ||||
| Credit contracts | Payables | — | ||||
| Equity contracts | Payables, Net Assets- | |||||
| Unrealized depreciation | — | * | ||||
| Commodity contracts | Payables | — | ||||
| Other contracts | — | |||||
|
| |||||
| Total | $ | — | ||||
|
| |||||
| * | Includes cumulative appreciation/depreciation of futures contracts as reported in the Portfolio of Investments. Only current day’s variation margin is reported within the Statement of Assets & Liabilities. |
The effect of Derivative Instruments on the Statement of Operations for the year ended December 31, 2013:
Amount of Realized Gain or (Loss) on Derivatives Recognized in Income
Derivatives Not Accounted for as Hedging Instruments^ | Options | Futures | Forward Currency Contracts | Swaps | Total | |||||||||||||||
Interest rate contracts | $ | — | $ | — | $ | — | $ | — | $ | — | ||||||||||
Foreign exchange contracts | — | — | — | — | — | |||||||||||||||
Credit contracts | — | — | — | — | — | |||||||||||||||
Equity contracts | — | 21,607,656 | — | — | 21,607,656 | |||||||||||||||
Commodity contracts | — | — | — | — | — | |||||||||||||||
Other contracts | — | — | — | — | — | |||||||||||||||
|
|
|
|
|
|
|
|
|
| |||||||||||
Total | $ | — | $ | 21,607,656 | $ | — | $ | — | $ | 21,607,656 | ||||||||||
|
|
|
|
|
|
|
|
|
| |||||||||||
Amount of Unrealized Appreciation or (Depreciation) on Derivatives Recognized in Income
Derivatives Not Accounted for as Hedging Instruments^ | Options | Futures | Forward Currency Contracts | Swaps | Total | |||||||||||||||
Interest rate contracts | $ | — | $ | — | $ | — | $ | — | $ | — | ||||||||||
Foreign exchange contracts | — | — | — | — | — | |||||||||||||||
Credit contracts | — | — | — | — | — | |||||||||||||||
Equity contracts | — | 1,270,089 | — | — | 1,270,089 | |||||||||||||||
Commodity contracts | — | — | — | — | — | |||||||||||||||
Other contracts | — | — | — | — | — | |||||||||||||||
|
|
|
|
|
|
|
|
|
| |||||||||||
Total | $ | — | $ | 1,270,089 | $ | — | $ | — | $ | 1,270,089 | ||||||||||
|
|
|
|
|
|
|
|
|
| |||||||||||
| ^ | This Portfolio held futures contracts as a substitute for investing in conventional securities, hedging and in an attempt to enhance returns. |
The Portfolio held futures contacts with an average notional balance of approximately $69,311,000 during the year ended December 31, 2013.
See Notes to Pro-forma Combined Financial Statements
51
Fair Values of Derivative Instruments as of December 31, 2013:
EQ/Large Cap Value PLUS
Statement of Assets and Liabilities
Derivatives Not Accounted for as Hedging Instruments^ | Asset Derivatives | Fair Value | ||||
| Interest rate contracts | Receivables, Net Assets- | |||||
| Unrealized appreciation | $ | — | * | |||
| Foreign exchange contracts | Receivables | — | ||||
| Credit contracts | Receivables | — | ||||
| Equity contracts | Receivables, Net Assets- | |||||
| Unrealized appreciation | 9,449,402 | * | ||||
| Commodity contracts | Receivables | — | ||||
| Other contracts | Receivables | — | ||||
|
| |||||
| Total | $ | 9,449,402 | ||||
|
| |||||
Liability Derivatives | ||||||
| Interest rate contracts | Payables, Net Assets- | |||||
| Unrealized depreciation | $ | — | * | |||
| Foreign exchange contracts | Payables | — | ||||
| Credit contracts | Payables | — | ||||
| Equity contracts | Payables, Net Assets- | |||||
| Unrealized depreciation | — | * | ||||
| Commodity contracts | Payables | — | ||||
| Other contracts | Payables | — | ||||
|
| |||||
| Total | $ | — | ||||
|
| |||||
| * | Includes cumulative appreciation/depreciation of futures contracts as reported in the Portfolio of Investments. Only current day’s variation margin is reported within the Statement of Assets & Liabilities. |
The Effect of Derivative Instruments on the Statement of Operations for the year ended December 31, 2013:
Amount of Realized Gain or (Loss) on Derivatives Recognized in Income
Derivatives Not Accounted for as Hedging Instruments^ | Options | Futures | Forward Currency Contracts | Swaps | Total | |||||||||||||||
Interest rate contracts | $ | — | $ | — | $ | — | $ | — | $ | — | ||||||||||
Foreign exchange contracts | — | — | — | — | — | |||||||||||||||
Credit contracts | — | — | — | — | — | |||||||||||||||
Equity contracts | — | 63,127,530 | — | — | 63,127,530 | |||||||||||||||
Commodity contracts | — | — | — | — | — | |||||||||||||||
Other contracts | — | — | — | — | — | |||||||||||||||
|
|
|
|
|
|
|
|
|
| |||||||||||
Total | $ | — | $ | 63,127,530 | $ | — | $ | — | $ | 63,127,530 | ||||||||||
|
|
|
|
|
|
|
|
|
| |||||||||||
Amount of Unrealized Appreciation or (Depreciation) on Derivatives Recognized in Income
Derivatives Not Accounted for as Hedging Instruments^ | Options | Futures | Forward Currency Contracts | Swaps | Total | |||||||||||||||
Interest rate contracts | $ | — | $ | — | $ | — | $ | — | $ | — | ||||||||||
Foreign exchange contracts | — | — | — | — | — | |||||||||||||||
Credit contracts | — | — | — | — | — | |||||||||||||||
Equity contracts | — | 9,302,156 | — | — | 9,302,156 | |||||||||||||||
Commodity contracts | — | — | — | — | — | |||||||||||||||
Other contracts | — | — | — | — | — | |||||||||||||||
|
|
|
|
|
|
|
|
|
| |||||||||||
Total | $ | — | $ | 9,302,156 | $ | — | $ | — | $ | 9,302,156 | ||||||||||
|
|
|
|
|
|
|
|
|
| |||||||||||
| ^ | This Portfolio held futures contracts as a substitute for investing in conventional securities, hedging and in an attempt to enhance returns. |
The Portfolio held futures contacts with an average notional balance of approximately $239,794,000 during the year ended December 31, 2013.
See Notes to Pro-forma Combined Financial Statements
52
Combined Pro-Forma
Fair Values of Derivative Instruments as of December 31, 2013:
Statement of Assets and Liabilities
Derivatives Not Accounted for as Hedging | Asset Derivatives | Fair Value | ||||
Interest rate contracts | Receivables, Net Assets- | |||||
| Unrealized appreciation | $ | — | * | |||
Foreign exchange contracts | Receivables | — | ||||
Credit contracts | Receivables | — | ||||
Equity contracts | Receivables, Net Assets- | |||||
| Unrealized appreciation | 10,824,000 | * | ||||
Commodity contracts | Receivables | — | ||||
Other contracts | Receivables | — | ||||
|
| |||||
Total | $ | 10,824,000 | ||||
|
| |||||
Liability Derivatives | ||||||
Interest rate contracts | Payables, Net Assets- | |||||
| Unrealized depreciation | $ | — | * | |||
Foreign exchange contracts | Payables | — | ||||
Credit contracts | Payables | — | ||||
Equity contracts | Payables, Net Assets- | |||||
| Unrealized depreciation | — | * | ||||
Commodity contracts | Payables | — | ||||
Other contracts | Payables | — | ||||
|
| |||||
Total | $ | — | ||||
|
| |||||
| * | Includes cumulative appreciation/depreciation of futures contracts as reported in the Portfolio of Investments. Only current day’s variation margin is reported within the Statement of Assets & Liabilities. |
The Effect of Derivative Instruments on the Statement of Operations for the year ended December 31, 2013:
Amount of Realized Gain or (Loss) on Derivatives Recognized in Income
Derivatives Not Accounted for as Hedging Instruments^ | Options | Futures | Forward Currency Contracts | Swaps | Total | |||||||||||||||
Interest rate contracts | $ | — | $ | — | $ | — | $ | — | $ | — | ||||||||||
Foreign exchange contracts | — | — | — | — | — | |||||||||||||||
Credit contracts | — | — | — | — | — | |||||||||||||||
Equity contracts | — | 84,735,186 | — | — | 84,735,186 | |||||||||||||||
Commodity contracts | — | — | — | — | — | |||||||||||||||
Other contracts | — | — | — | — | — | |||||||||||||||
|
|
|
|
|
|
|
|
|
| |||||||||||
Total | $ | — | $ | 84,735,186 | $ | — | $ | — | $ | 84,735,186 | ||||||||||
|
|
|
|
|
|
|
|
|
| |||||||||||
Amount of Unrealized Appreciation or (Depreciation) on Derivatives Recognized in Income
Derivatives Not Accounted for as Hedging Instruments^ | Options | Futures | Forward Currency Contracts | Swaps | Total | |||||||||||||||
Interest rate contracts | $ | — | $ | — | $ | — | $ | — | $ | — | ||||||||||
Foreign exchange contracts | — | — | — | — | — | |||||||||||||||
Credit contracts | — | — | — | — | — | |||||||||||||||
Equity contracts | — | 10,572,245 | — | — | 10,572,245 | |||||||||||||||
Commodity contracts | — | — | — | — | — | |||||||||||||||
Other contracts | — | — | — | — | — | |||||||||||||||
|
|
|
|
|
|
|
|
|
| |||||||||||
Total | $ | — | $ | 10,572,245 | $ | — | $ | — | $ | 10,572,245 | ||||||||||
|
|
|
|
|
|
|
|
|
| |||||||||||
| ^ | This Portfolio held futures contracts as a substitute for investing in conventional securities, hedging and in an attempt to enhance returns. |
The Portfolio held futures contacts with an average notional balance of approximately $309,105,000 during the year ended December 31, 2013.
See Notes to Pro-forma Combined Financial Statements
53
Multimanager Large Cap Value
The following table presents the Portfolio’s gross derivative assets and liabilities by counterparty net of amounts available for offset under netting arrangements and any related collateral received or pledged by the Portfolio as of December 31, 2013:
Counterparty | Gross Amount of Derivative Assets Presented in the Statement of Assets and Liabilities (a) | Derivatives Available for Offset | Collateral Received | Net Amount Due from Counterparty (cannot be less than zero) | ||||||||||||
Exchange Traded Futures & Options Contracts (b) | $ | 1,374,598 | (c) | $ | — | $ | — | $ | 1,374,598 | |||||||
|
|
|
|
|
|
|
| |||||||||
EQ/Large Cap Value PLUS
The following table presents the Portfolio’s gross derivative assets and liabilities by counterparty net of amounts available for offset under netting arrangements and any related collateral received or pledged by the Portfolio as of December 31, 2013:
Counterparty | Gross Amount of Derivative Assets Presented in the Statement of Assets and Liabilities (a) | Derivatives Available for Offset | Collateral Received | Net Amount Due from Counterparty (cannot be less than zero) | ||||||||||||
Exchange Traded Futures & Options Contracts (b) | $ | 9,449,402 | (c) | $ | — | $ | — | $ | 9,449,402 | |||||||
|
|
|
|
|
|
|
| |||||||||
Combined Pro-Forma
The following table presents the Portfolio’s gross derivative assets and liabilities by counterparty net of amounts available for offset under netting arrangements and any related collateral received or pledged by the Portfolio as of December 31, 2013:
Counterparty | Gross Amount of Derivative Assets Presented in the Statement of Assets and Liabilities (a) | Derivatives Available for Offset | Collateral Received | Net Amount Due from Counterparty (cannot be less than zero) | ||||||||||||
Exchange Traded Futures & Options Contracts (b) | $ | 10,824,000 | (c) | $ | — | $ | — | $ | 10,824,000 | |||||||
|
|
|
|
|
|
|
| |||||||||
| (a) | For financial reporting purposes the Portfolio does not offset derivative assets and derivative liabilities subject to master netting arrangements in the Statement of Assets and Liabilities. |
| (b) | These derivatives are traded on an exchange, therefore they are not subject to master netting arrangements. |
| (c) | This amount represents the cumulative appreciation (depreciation) of futures contracts as reported in the Portfolio of Investments. The Statement of Assets and Liabilities only reflect the current day variation margin receivable/payable to brokers for futures contracts. |
See Notes to Pro-forma Combined Financial Statements.
54
Investment security transactions for the year ended December 31, 2013 were as follows:
| 12/31/2013 | ||||||||||||
| Multimanager Large Cap Value | EQ/Large Cap Value PLUS | Combined Pro Forma | ||||||||||
Cost of Purchases: | ||||||||||||
Long-term investments other than U.S. government debt securities | $ | 234,151,692 | $ | 1,438,794,851 | $ | 1,672,946,543 | ||||||
Net Proceeds of Sales and Redemptions: | ||||||||||||
Long-term investments other than U.S. government debt securities | $ | 463,468,847 | $ | 2,295,121,197 | $ | 2,758,590,044 | ||||||
55
As of December 31, 2013, the gross unrealized appreciation (depreciation) of investments based on the aggregate cost of investments for federal income tax purposes was as follows:
| Multimanager Large Cap Value | EQ/Large Cap Value PLUS | Combined Pro Forma | ||||||||||
Aggregate gross unrealized appreciation | $ | 221,521,620 | $ | 1,076,734,468 | $ | 1,298,256,088 | ||||||
Aggregate gross unrealized depreciation | (5,963,551 | ) | (30,460,355 | ) | (36,423,906 | ) | ||||||
|
|
|
|
|
| |||||||
Net unrealized appreciation | $ | 215,558,069 | $ | 1,046,274,113 | $ | 1,261,832,182 | ||||||
|
|
|
|
|
| |||||||
Federal income tax cost of investments | $ | 423,218,567 | $ | 4,061,211,316 | $ | 4,484,429,883 | ||||||
|
|
|
|
|
| |||||||
Affiliated Broker Commissions
Multimanager Large Cap Value
For the year ended December 31, 2013, the Portfolio incurred approximately $4,912 as brokerage commissions with Sanford C. Bernstein & Co., LLC, an affiliated broker/dealer.
EQ/Large Cap Value PLUS
For the year ended December 31, 2013, the Portfolio incurred approximately $2,847 as brokerage commissions with Sanford C. Bernstein & Co., LLC, an affiliated broker/dealer.
Combined Pro-Forma
For the year ended December 31, 2013, the Portfolio incurred approximately $7,759 as brokerage commissions with Sanford C. Bernstein & Co., LLC, an affiliated broker/dealer.
Capital Loss carryforward
Multimanager Large Cap Value
The Portfolio has a net capital loss carryforward of $457,024,645, which expires in the year 2017. The Portfolio utilized net capital loss carryforward of $120,241,567 during 2013.
EQ/Large Cap Value PLUS
The Portfolio has a net capital loss carryforward of $976,913,866, which expires in the year 2017. The Portfolio utilized net capital loss carryforward of $340,850,942 during 2013.
Combined Pro-Forma
The Portfolio has a net capital loss carryforward of $1,433,938,511, which expires in the year 2017. The Portfolio utilized net capital loss carryforward of $461,092,509 during 2013.
Certain capital loss carryforwards may be subject to limitations on use pursuant to applicable U.S. Federal Income Tax Law. Therefore, it is possible not all of these capital losses will be available for use.
See Notes to Pro-forma Combined Financial Statements.
56
STATEMENT OF ASSET AND LIABILITIES
December 31, 2013
| Multimanager Large Cap Value | EQ/Large Cap Value PLUS | Pro Forma Adjustment | Pro Forma Combined | |||||||||||||
Investments at cost | $ | 416,691,276 | $ | 3,888,772,856 | $ | 4,305,464,132 | ||||||||||
ASSETS | ||||||||||||||||
Investments at value | $ | 638,776,636 | $ | 5,107,485,429 | $ | 5,746,262,065 | ||||||||||
Cash | 53,370,521 | 385,606,766 | 438,977,287 | |||||||||||||
Cash held as collateral at broker | 12,010,000 | 26,440,000 | 38,450,000 | |||||||||||||
Receivable for securities sold | — | 13,810,666 | 13,810,666 | |||||||||||||
Dividends, interest, and other receivables | 1,061,605 | 7,749,952 | 8,811,557 | |||||||||||||
Due from broker for futures variation margin | 206,330 | 1,426,650 | 1,632,980 | |||||||||||||
Receivable from Separate Accounts for Trust shares sold | 22,456 | 141,921 | 164,377 | |||||||||||||
Other assets | 2,934 | 12,581 | 15,515 | |||||||||||||
|
|
|
|
|
|
|
| |||||||||
Total assets | 705,450,482 | 5,542,673,965 | — | 248,124,447 | ||||||||||||
|
|
|
|
|
|
|
| |||||||||
LIABILITIES | ||||||||||||||||
Payable for securities purchased | 9,305 | 15,316,853 | 15,326,158 | |||||||||||||
Payable to Separate Accounts for Trust shares redeemed | 881,485 | 3,989,133 | 4,870,618 | |||||||||||||
Investment management fees payable | 389,701 | 2,120,760 | 2,510,461 | |||||||||||||
Distribution fees payable - Class B/IB | 19,759 | 807,274 | 827,033 | |||||||||||||
Administrative fees payable | 120,614 | 636,991 | 757,605 | |||||||||||||
Distribution fees payable - Class A/IA | 2,671 | 222,656 | 225,327 | |||||||||||||
Trustees’ fees payable | 28,161 | 6,754 | 34,915 | |||||||||||||
Accrued expenses | 73,339 | 235,878 | 309,217 | |||||||||||||
|
|
|
|
|
|
|
| |||||||||
Total liabilities | 1,525,035 | 23,336,299 | — | 24,861,334 | ||||||||||||
|
|
|
|
|
|
|
| |||||||||
NET ASSETS | $ | 703,925,447 | $ | 5,519,337,666 | $ | — | $ | 6,223,263,113 | ||||||||
|
|
|
|
|
|
|
| |||||||||
Net assets were comprised of: | ||||||||||||||||
Paid in capital | 963,700,985 | 5,513,357,574 | 6,477,058,559 | |||||||||||||
Accumulated undistributed net investment income (loss) | 344,576 | 2,685,138 | 3,029,714 | |||||||||||||
Accumulated undistributed net realized gain (loss) on investments, futures and foreign currency transactions | (483,582,561 | ) | (1,224,867,021 | ) | (1,708,449,582 | ) | ||||||||||
Net unrealized appreciaiton (depreciation) on investments, futures and foreign currency translations | 223,462,447 | 1,228,161,975 | 1,451,624,422 | |||||||||||||
|
|
|
|
|
|
|
| |||||||||
Net Assets | $ | 703,925,447 | $ | 5,519,337,666 | $ | — | $ | 6,223,263,113 | ||||||||
|
|
|
|
|
|
|
| |||||||||
Class IA Shares: | ||||||||||||||||
Net Assets | 12,709,263 | 1,068,537,379 | 1,081,246,642 | |||||||||||||
Shares outstanding | 935,116 | 74,782,216 | (45,651 | )a- | 75,671,681 | |||||||||||
|
|
|
|
|
|
|
| |||||||||
Net asset value, offering and redemption price per share | $ | 13.59 | $ | 14.29 | $ | 14.29 | ||||||||||
|
|
|
|
|
|
|
| |||||||||
Class IB Shares: | ||||||||||||||||
Net Assets | 94,861,975 | 3,852,949,205 | 3,947,811,180 | |||||||||||||
Shares outstanding | 6,978,472 | 270,277,286 | (324,079 | )a- | 276,931,679 | |||||||||||
|
|
|
|
|
|
|
| |||||||||
Net asset value, offering and redemption price per share | $ | 13.59 | $ | 14.26 | $ | 14.26 | ||||||||||
|
|
|
|
|
|
|
| |||||||||
Class K Shares: | ||||||||||||||||
Net Assets | 596,354,209 | 597,851,082 | 1,194,205,291 | |||||||||||||
Shares outstanding | 43,875,783 | 41,843,089 | (2,137,459 | )a- | 83,581,413 | |||||||||||
|
|
|
|
|
|
|
| |||||||||
Net asset value, offering and redemption price per share | $ | 13.59 | $ | 14.29 | $ | 14.29 | ||||||||||
|
|
|
|
|
|
|
| |||||||||
| a- | Reflects adjustment for retired shares of the acquired Portfolio |
See Notes to Pro-forma Combined Financial Statements.
57
STATEMENT OF OPERATIONS
For the Year Ended December 31, 2013
| Multimanager Large CapValue | EQ/Large Cap Value PLUS | ProForma Adjustment | Pro Forma Combined | |||||||||||||
Foreign withholding tax | $ | 54,724 | $ | 87,871 | $ | 142,595 | ||||||||||
INVESTMENT INCOME | ||||||||||||||||
Dividends | $ | 20,269,178 | $ | 89,879,604 | $ | 110,148,782 | ||||||||||
Interest | 63,846 | 242,006 | 305,852 | |||||||||||||
|
|
|
|
|
|
|
| |||||||||
Total income | 20,333,024 | 90,121,610 | — | 110,454,634 | ||||||||||||
|
|
|
|
|
|
|
| |||||||||
EXPENSES | ||||||||||||||||
Investment management fees | 6,851,703 | 19,027,327 | (2,895,892 | )c- | 22,983,138 | |||||||||||
Administrative fees | 1,423,346 | 5,873,192 | (552,368 | )c- | 6,744,170 | |||||||||||
Distribution fees - Class B/IB | 723,006 | 6,123,081 | 6,846,087 | |||||||||||||
Distribution fees - Class A/IA | 29,461 | 2,478,729 | 2,508,190 | |||||||||||||
Printing and mailing expenses | 116,102 | 408,967 | 24,545 | d- | 549,614 | |||||||||||
Professional fees | 93,390 | 137,456 | (80,342 | )a- | 150,504 | |||||||||||
Custodian fees | 125,600 | 105,000 | (75,618 | )a- | 154,982 | |||||||||||
Trustees’ fees | 21,814 | 101,001 | 15,083 | d- | 137,898 | |||||||||||
Miscellaneous | 29,118 | 72,062 | (216 | )a- | 100,964 | |||||||||||
|
|
|
|
|
|
|
| |||||||||
Gross expenses | 9,413,540 | 34,326,815 | (3,564,808 | ) | 40,175,547 | |||||||||||
|
|
|
|
|
|
|
| |||||||||
Less: Waiver from investment manager | (305,080 | ) | — | 305,080 | e- | — | ||||||||||
Fees paid indirectly | (55,308 | ) | (107,871 | ) | 163,179 | b- | — | |||||||||
|
|
|
|
|
|
|
| |||||||||
Net expenses | 9,053,152 | 34,218,944 | (3,096,549 | ) | 40,175,547 | |||||||||||
|
|
|
|
|
|
|
| |||||||||
NET INVESTMENT INCOME (LOSS) | 11,279,872 | 55,902,666 | 3,096,549 | 70,279,087 | ||||||||||||
|
|
|
|
|
|
|
| |||||||||
REALIZED AND UNREALIZED GAIN (LOSS) | ||||||||||||||||
Realized gain (loss) on: | ||||||||||||||||
Investments | 208,860,907 | 276,175,335 | 485,036,242 | |||||||||||||
Futures | 21,607,656 | 63,127,530 | 84,735,186 | |||||||||||||
Foreign currency transactions | (1,895 | ) | (16,174 | ) | (18,069 | ) | ||||||||||
|
|
|
|
|
|
|
| |||||||||
Net realized gain (loss) | 230,466,668 | 339,286,691 | — | 569,753,359 | ||||||||||||
|
|
|
|
|
|
|
| |||||||||
Change in unrealized appreciation (depreciation) on: | ||||||||||||||||
Investments | 34,369,379 | 648,527,701 | 682,897,080 | |||||||||||||
Futures | 1,270,089 | 9,302,156 | 10,572,245 | |||||||||||||
Foreign currency translations | 1,286 | — | — | 1,286 | ||||||||||||
|
|
|
|
|
|
|
| |||||||||
Net change in unrealized appreciation (depreciation) | 35,640,754 | 657,829,857 | — | 693,470,611 | ||||||||||||
|
|
|
|
|
|
|
| |||||||||
NET REALIZED AND UNREALIZED GAIN (LOSS) | 266,107,422 | 997,116,548 | — | 1,263,223,970 | ||||||||||||
|
|
|
|
|
|
|
| |||||||||
NET INCREASE (DECREASE) IN NET ASSETS RESULTING FROM OPERATIONS | $ | 277,387,294 | $ | 1,053,019,214 | $ | 3,096,549 | $ | 1,333,503,057 | ||||||||
|
|
|
|
|
|
|
| |||||||||
| a- | Reflects adjustment in expenses due to elimination of duplicative expenses. |
| b- | Reflects adjustment due to termination of the brokerage recapture program. |
| c- | Reflects adjustment in expenses due to the effects of new contract rates for acquiring Portfolio. |
| d- | Reflects adjustment due to Large Cap Value PLUS paying a larger portion of trust level expenses. |
| e- | Reflects elimination of waiver due to expense adjustment. |
See Notes to Pro-forma Combined Financial Statements.
58
NOTES TO PRO FORMA COMBINED FINANCIAL STATEMENTS
As of December 31, 2013
NOTE 1 – BASIS OF COMBINATION AND SIGNIFICANT ACCOUNTING POLICIES:
EQ Advisors Trust (the “Trust’) was organized as a Delaware statutory trust on October 31, 1996 and is registered under the Investment Company Act of 1940, as amended, as an open-end management investment company with numerous portfolios. The Board of Trustees of the “Trust” and the Board of Trustees of the AXA Premier VIP Trust (“VIP Trust”), approved a proposed Agreement and Plan of Reorganization and Termination (the “Reorganization Plan”) on December 10-11, 2013 and December 4, 2013 respectively, that provides for the transfer of all assets of the Multimanager Large Cap Value Portfolio, a series of VIP Trust (“Large Cap Value Portfolio”) to the EQ/Large Cap Value PLUS Portfolio, a series of the Trust (“Large Cap Value PLUS Portfolio”), and the assumption by the Large Cap Value PLUS Portfolio of all of the liabilities of the Large Cap Value Portfolio in exchange for shares of the Large Cap Value PLUS Portfolio having an aggregate value equal to the net assets of the Large Cap Value Portfolio, the distribution of the Large Cap Value PLUS Portfolio shares to the Large Cap Value Portfolio shareholders of record determined immediately after the close of business on the closing date, and the subsequent liquidation of the Large Cap Value Portfolio.
The Large Cap Value Portfolio’s annual contractual management fee rate equals 0.750% of average daily net assets for the first $750 million, 0.700% of average daily net assets for the next $1 billion, 0.675% for the next $3 billion, 0.650% for the next $5 billion, and 0.625% of average daily net assets thereafter. The Large Cap Value PLUS Portfolio’s annual contractual management fee rate equals 0.500% of average daily net assets for the first $2 billion, 0.450% of average daily net assets for the next $1 billion, 0.425% of average daily net assets for the next $3 billion, 0.400% of average daily net assets for the next $5 billion, and 0.375% of average daily net assets thereafter. The Reorganization Plan is subject to the approval of the Large Cap Value Portfolio’s shareholders. A special meeting of shareholders of the Large Cap Value Portfolio will be held on or about May 21, 2014.
The Reorganization will be accounted for as a tax-free reorganization of investment companies. The unaudited pro forma combined financial statements are presented for the information of the reader and may not necessarily be representative of what the actual combined financial statements would have been had the Reorganization occurred at December 31, 2013. The unaudited pro forma combined portfolio of investments and statement of assets and liabilities reflect the financial position of the Large Cap Value Portfolio and the Large Cap Value PLUS Portfolio at December 31, 2013. The unaudited pro forma combined statement of operations reflects the results of operations of the Large Cap Value PLUS Portfolio as if it had acquired the Large Cap Value Portfolio at the beginning of the year ended December 31, 2013. These statements have been derived from the Portfolios’ respective books and records utilized in calculating daily net asset value at the dates indicated above for each Portfolio under accounting principles generally accepted in the United States of America. The historical cost of investment securities will be carried forward to the surviving entity and results of operations of the Large Cap Value PLUS Portfolio for pre-combination periods will not be restated.
The unaudited pro forma combined portfolio of investments and statements of assets and liabilities and operations should be read in conjunction with the historical financial statements of the Portfolios included in the Trust’s Statement of Additional Information, each of the Portfolios has substantially the same significant accounting policies as detailed in the historical financial statements. The preparation of financial statements in accordance with accounting principles generally accepted in the United States of America requires management to make estimates and assumptions that affect the reported amounts and disclosures. Actual results could differ from those estimates.
Following the Reorganization, the Large Cap Value PLUS Portfolio is the “accounting survivor.”
59
NOTE 2 – SHARES:
The unaudited pro forma net asset value per share assumes additional common shares of beneficial interest issued in connection with the proposed acquisition of the Large Cap Value Portfolio by the Large Cap Value PLUS Portfolio as of December 31, 2013. The number of additional shares issued was calculated based on the net assets of the Large Cap Value Portfolio and net asset value per share of the Large Cap Value PLUS Portfolio at December 31, 2013.
NOTE 3 – Taxes:
Each Portfolio, as well as the Acquiring Portfolio after the Reorganization, intends to comply with the requirements of the Internal Revenue Code of 1986, as amended applicable to regulated investment companies (“RICs”) and to distribute substantially all of its net investment income and net realized capital gains to shareholders of each Portfolio. Therefore, no Federal income tax provision is required.
NOTE 4 – UNAUDITED PRO FORMA COMBINED ADJUSTMENTS:
The accompanying unaudited pro forma combined financial statements reflect changes in the Large Cap Value PLUS Portfolio’s shares as if the merger had taken place on December 31, 2013. The Large Cap Value Portfolio will bear the expenses, based on the fraction that its shareholder accounts will bear to the shareholder accounts of the Acquired Portfolios at the merger date, of the Reorganization (i.e., the costs associated with preparing, printing and distributing the prospectus and proxy materials, legal and accounting fees in connection with the Reorganization, and expenses of holding the shareholders meeting), such expenses, which are not reflected in the unaudited pro forma combined statement of operations, are estimated at approximately $80,000.
60
Multimanager Equity | EQ/International Core PLUS | Pro-forma Combined | Multimanager International Equity | EQ/International Core PLUS | Pro-forma Combined | |||||||||||||||||||
| Number of Shares | Number of Shares | Number of Shares | Value ($) (Note 1) | Value ($) (Note 1) | Value ($) (Note 1) | |||||||||||||||||||
COMMON STOCKS: | ||||||||||||||||||||||||
Argentina (0.0%) | ||||||||||||||||||||||||
MercadoLibre, Inc. | 5,323 | — | 5,323 | $ | 573,766 | $ | — | $ | 573,766 | |||||||||||||||
|
|
|
|
|
| |||||||||||||||||||
Australia (4.2%) | ||||||||||||||||||||||||
AGL Energy Ltd. | 4,677 | 35,266 | 39,943 | 62,767 | 473,280 | 536,047 | ||||||||||||||||||
ALS Ltd. | 3,778 | 23,592 | 27,370 | 29,719 | 185,585 | 215,304 | ||||||||||||||||||
Alumina Ltd.* | 23,455 | 165,537 | 188,992 | 23,351 | 164,806 | 188,157 | ||||||||||||||||||
Amcor Ltd. | 10,554 | 77,349 | 87,903 | 99,420 | 728,635 | 828,055 | ||||||||||||||||||
AMP Ltd. | 25,757 | 187,842 | 213,599 | 100,963 | 736,309 | 837,272 | ||||||||||||||||||
APA Group | 6,581 | 52,851 | 59,432 | 35,257 | 283,144 | 318,401 | ||||||||||||||||||
Asciano Ltd. | 7,632 | 62,521 | 70,153 | 39,252 | 321,552 | 360,804 | ||||||||||||||||||
ASX Ltd. | 1,581 | 12,408 | 13,989 | 51,893 | 407,268 | 459,161 | ||||||||||||||||||
Aurizon Holdings Ltd. | 17,277 | 129,427 | 146,704 | 75,282 | 563,959 | 639,241 | ||||||||||||||||||
Australia & New Zealand Banking Group Ltd. | 24,028 | 173,931 | 197,959 | 691,482 | 5,005,415 | 5,696,897 | ||||||||||||||||||
Bank of Queensland Ltd. | 2,434 | 17,487 | 19,921 | 26,428 | 189,868 | 216,296 | ||||||||||||||||||
Bendigo and Adelaide Bank Ltd. | 3,990 | 26,599 | 30,589 | 41,861 | 279,065 | 320,926 | ||||||||||||||||||
BHP Billiton Ltd. | 53,554 | 755,938 | 809,492 | 1,816,620 | 25,642,378 | 27,458,998 | ||||||||||||||||||
BHP Billiton Ltd. (ADR) | 16,062 | 16,138 | 32,200 | 1,095,428 | 1,100,612 | 2,196,040 | ||||||||||||||||||
Boral Ltd.(b) | 7,581 | 46,927 | 54,508 | 32,289 | 199,868 | 232,157 | ||||||||||||||||||
Brambles Ltd. | 13,623 | 99,768 | 113,391 | 111,300 | 815,108 | 926,408 | ||||||||||||||||||
Caltex Australia Ltd. | 1,314 | 8,311 | 9,625 | 23,524 | 148,789 | 172,313 | ||||||||||||||||||
CFS Retail Property Trust Group (REIT) | 20,372 | 135,700 | 156,072 | 35,380 | 235,669 | 271,049 | ||||||||||||||||||
Coca-Cola Amatil Ltd. | 4,721 | 36,640 | 41,361 | 50,711 | 393,572 | 444,283 | ||||||||||||||||||
Cochlear Ltd. | 530 | 3,656 | 4,186 | 27,883 | 192,341 | 220,224 | ||||||||||||||||||
Commonwealth Bank of Australia | 14,116 | 102,203 | 116,319 | 980,605 | 7,099,799 | 8,080,404 | ||||||||||||||||||
Computershare Ltd. | 4,643 | 30,523 | 35,166 | 47,178 | 310,150 | 357,328 | ||||||||||||||||||
Crown Resorts Ltd. | 3,801 | 25,679 | 29,480 | 57,187 | 386,350 | 443,537 | ||||||||||||||||||
CSL Ltd. | 4,305 | 30,905 | 35,210 | 265,078 | 1,902,956 | 2,168,034 | ||||||||||||||||||
Dexus Property Group (REIT) | 37,629 | 313,930 | 351,559 | 33,767 | 281,710 | 315,477 | ||||||||||||||||||
Echo Entertainment Group Ltd. | 7,243 | 47,844 | 55,087 | 15,910 | 105,091 | 121,001 | ||||||||||||||||||
Federation Centres Ltd. (REIT) | 14,183 | 88,520 | 102,703 | 29,634 | 184,952 | 214,586 | ||||||||||||||||||
Flight Centre Travel Group Ltd. | 584 | 3,344 | 3,928 | 24,795 | 141,978 | 166,773 | ||||||||||||||||||
Fortescue Metals Group Ltd. | 13,057 | 99,201 | 112,258 | 67,853 | 515,516 | 583,369 | ||||||||||||||||||
Goodman Group (REIT) | 14,416 | 109,336 | 123,752 | 60,885 | 461,772 | 522,657 | ||||||||||||||||||
GPT Group (REIT) | 13,986 | 112,728 | 126,714 | 42,460 | 342,226 | 384,686 | ||||||||||||||||||
Harvey Norman Holdings Ltd. | 5,804 | 30,496 | 36,300 | 16,376 | 86,046 | 102,422 | ||||||||||||||||||
Iluka Resources Ltd. | 3,850 | 26,838 | 30,688 | 29,667 | 206,806 | 236,473 | ||||||||||||||||||
Incitec Pivot Ltd. | 15,770 | 104,400 | 120,170 | 37,737 | 249,826 | 287,563 | ||||||||||||||||||
Insurance Australia Group Ltd. | 18,183 | 133,267 | 151,450 | 94,491 | 692,546 | 787,037 | ||||||||||||||||||
Leighton Holdings Ltd. | 1,510 | 10,751 | 12,261 | 21,721 | 154,649 | 176,370 | ||||||||||||||||||
Lend Lease Group | 4,267 | 34,975 | 39,242 | 42,443 | 347,893 | 390,336 | ||||||||||||||||||
Macquarie Group Ltd. | 2,525 | 18,367 | 20,892 | 123,917 | 901,516 | 1,025,433 | ||||||||||||||||||
Metcash Ltd. | 8,915 | 55,669 | 64,584 | 25,154 | 157,074 | 182,228 | ||||||||||||||||||
Mirvac Group (REIT) | 30,290 | 234,128 | 264,418 | 45,437 | 351,209 | 396,646 | ||||||||||||||||||
National Australia Bank Ltd. | 20,517 | 149,299 | 169,816 | 638,073 | 4,643,155 | 5,281,228 | ||||||||||||||||||
Newcrest Mining Ltd. | 6,569 | 49,095 | 55,664 | 45,751 | 341,928 | 387,679 | ||||||||||||||||||
Orica Ltd. | 3,035 | 23,463 | 26,498 | 64,659 | 499,870 | 564,529 | ||||||||||||||||||
Origin Energy Ltd. | 9,606 | 70,114 | 79,720 | 120,681 | 880,849 | 1,001,530 | ||||||||||||||||||
Qantas Airways Ltd.* | 9,940 | 73,806 | 83,746 | 9,719 | 72,162 | 81,881 | ||||||||||||||||||
QBE Insurance Group Ltd. | 10,500 | 76,712 | 87,212 | 107,911 | 788,391 | 896,302 | ||||||||||||||||||
Ramsay Health Care Ltd. | 1,200 | 8,344 | 9,544 | 46,352 | 322,302 | 368,654 | ||||||||||||||||||
REA Group Ltd. | 348 | 2,831 | 3,179 | 11,733 | 95,450 | 107,183 | ||||||||||||||||||
Rio Tinto Ltd. | 10,776 | 83,568 | 94,344 | 656,021 | 5,087,446 | 5,743,467 | ||||||||||||||||||
Santos Ltd. | 8,457 | 61,618 | 70,075 | 110,475 | 804,924 | 915,399 | ||||||||||||||||||
Seek Ltd. | 3,069 | 20,436 | 23,505 | 36,748 | 244,696 | 281,444 | ||||||||||||||||||
Sonic Healthcare Ltd. | 3,562 | 24,100 | 27,662 | 52,733 | 356,783 | 409,516 | ||||||||||||||||||
SP AusNet | 16,117 | 111,403 | 127,520 | 17,917 | 123,842 | 141,759 | ||||||||||||||||||
Stockland Corp., Ltd. (REIT) | 21,500 | 141,190 | 162,690 | 69,302 | 455,107 | 524,409 | ||||||||||||||||||
Suncorp Group Ltd. | 11,257 | 82,472 | 93,729 | 131,673 | 964,674 | 1,096,347 | ||||||||||||||||||
Sydney Airport | 8,967 | 63,698 | 72,665 | 30,425 | 216,129 | 246,554 | ||||||||||||||||||
Tabcorp Holdings Ltd. | 6,766 | 48,171 | 54,937 | 21,930 | 156,133 | 178,063 | ||||||||||||||||||
Tatts Group Ltd. | 10,563 | 88,860 | 99,423 | 29,238 | 245,964 | 275,202 | ||||||||||||||||||
Telstra Corp., Ltd. | 38,112 | 275,996 | 314,108 | 178,659 | 1,293,793 | 1,472,452 | ||||||||||||||||||
Toll Holdings Ltd. | 5,143 | 43,669 | 48,812 | 26,084 | 221,475 | 247,559 | ||||||||||||||||||
Transurban Group | 12,050 | 89,727 | 101,777 | 73,595 | 548,002 | 621,597 | ||||||||||||||||||
Treasury Wine Estates Ltd. | 6,195 | 40,986 | 47,181 | 26,662 | 176,395 | 203,057 | ||||||||||||||||||
Wesfarmers Ltd. | 8,703 | 63,350 | 72,053 | 342,231 | 2,491,132 | 2,833,363 | ||||||||||||||||||
Westfield Group (REIT) | 18,242 | 131,280 | 149,522 | 164,349 | 1,182,749 | 1,347,098 | ||||||||||||||||||
Westfield Retail Trust (REIT) | 26,412 | 194,698 | 221,110 | 70,042 | 516,322 | 586,364 | ||||||||||||||||||
Westpac Banking Corp. | 27,179 | 196,812 | 223,991 | 785,802 | 5,690,249 | 6,476,051 | ||||||||||||||||||
Woodside Petroleum Ltd. | 5,769 | 41,825 | 47,594 | 200,379 | 1,452,742 | 1,653,121 | ||||||||||||||||||
Woolworths Ltd. | 10,905 | 79,228 | 90,133 | 329,600 | 2,394,640 | 2,724,240 | ||||||||||||||||||
WorleyParsons Ltd. | 1,998 | 13,242 | 15,240 | 29,615 | 196,275 | 225,890 | ||||||||||||||||||
|
|
|
|
|
| |||||||||||||||||||
| 10,961,464 | 85,410,867 | 96,372,331 | ||||||||||||||||||||||
|
|
|
|
|
| |||||||||||||||||||
See Notes to Pro-forma Combined Financial Statements.
61
Multimanager Equity | EQ/International Core PLUS | Pro-forma Combined | Multimanager International Equity | EQ/International Core PLUS | Pro-forma Combined | |||||||||||||||||||
| Number of Shares | Number of Shares | Number of Shares | Value ($) (Note 1) | Value ($) (Note 1) | Value ($) (Note 1) | |||||||||||||||||||
Austria (0.2%) | ||||||||||||||||||||||||
Andritz AG | 578 | 4,666 | 5,244 | 36,251 | 292,643 | 328,894 | ||||||||||||||||||
Conwert Immobilien Invest SE* | 45,537 | — | 45,537 | 584,417 | — | 584,417 | ||||||||||||||||||
Erste Group Bank AG | 32,888 | 16,426 | 49,314 | 1,146,031 | 572,388 | 1,718,419 | ||||||||||||||||||
Immofinanz AG* | 7,346 | 60,292 | 67,638 | 34,037 | 279,354 | 313,391 | ||||||||||||||||||
OMV AG | 1,237 | 9,440 | 10,677 | 59,204 | 451,804 | 511,008 | ||||||||||||||||||
Raiffeisen Bank International AG | 441 | 3,249 | 3,690 | 15,543 | 114,512 | 130,055 | ||||||||||||||||||
Schoeller-Bleckmann Oilfield Equipment AG | 13,247 | — | 13,247 | 1,468,117 | — | 1,468,117 | ||||||||||||||||||
Telekom Austria AG | 1,808 | 13,333 | 15,141 | 13,690 | 100,956 | 114,646 | ||||||||||||||||||
Vienna Insurance Group AG Wiener Versicherung Gruppe | 350 | 2,550 | 2,900 | 17,442 | 127,079 | 144,521 | ||||||||||||||||||
Voestalpine AG | 921 | 6,996 | 7,917 | 44,257 | 336,180 | 380,437 | ||||||||||||||||||
|
|
|
|
|
| |||||||||||||||||||
| 3,418,989 | 2,274,916 | 5,693,905 | ||||||||||||||||||||||
|
|
|
|
|
| |||||||||||||||||||
Belgium (0.5%) | ||||||||||||||||||||||||
Ageas | 2,009 | 14,087 | 16,096 | 85,539 | 599,795 | 685,334 | ||||||||||||||||||
Anheuser-Busch InBev N.V. | 13,418 | 50,884 | 64,302 | 1,426,153 | 5,408,286 | 6,834,439 | ||||||||||||||||||
Belgacom S.A. | 1,410 | 9,707 | 11,117 | 41,714 | 287,176 | 328,890 | ||||||||||||||||||
Colruyt S.A. | 601 | 4,784 | 5,385 | 33,551 | 267,071 | 300,622 | ||||||||||||||||||
Delhaize Group S.A. | 957 | 6,532 | 7,489 | 56,875 | 388,198 | 445,073 | ||||||||||||||||||
Groupe Bruxelles Lambert S.A. | 671 | 5,171 | 5,842 | 61,598 | 474,700 | 536,298 | ||||||||||||||||||
KBC Groep N.V. | 2,128 | 15,712 | 17,840 | 120,759 | 891,619 | 1,012,378 | ||||||||||||||||||
Solvay S.A. | 514 | 3,800 | 4,314 | 81,318 | 601,181 | 682,499 | ||||||||||||||||||
Telenet Group Holding N.V. | 502 | 3,283 | 3,785 | 29,955 | 195,900 | 225,855 | ||||||||||||||||||
UCB S.A. | 905 | 7,052 | 7,957 | 67,405 | 525,236 | 592,641 | ||||||||||||||||||
Umicore S.A. | 903 | 7,307 | 8,210 | 42,181 | 341,324 | 383,505 | ||||||||||||||||||
|
|
|
|
|
| |||||||||||||||||||
| 2,047,048 | 9,980,486 | 12,027,534 | ||||||||||||||||||||||
|
|
|
|
|
| |||||||||||||||||||
Bermuda (0.2%) | ||||||||||||||||||||||||
Everest Reinsurance Group Ltd. | 10,267 | — | 10,267 | 1,600,317 | — | 1,600,317 | ||||||||||||||||||
Nabors Industries Ltd. | — | 133,959 | 133,959 | — | 2,275,963 | 2,275,963 | ||||||||||||||||||
Seadrill Ltd. | 3,285 | 23,936 | 27,221 | 134,102 | 977,125 | 1,111,227 | ||||||||||||||||||
|
|
|
|
|
| |||||||||||||||||||
| 1,734,419 | 3,253,088 | 4,987,507 | ||||||||||||||||||||||
|
|
|
|
|
| |||||||||||||||||||
Brazil (0.9%) | ||||||||||||||||||||||||
AMBEV S.A. (ADR) | — | 148,025 | 148,025 | — | 1,087,984 | 1,087,984 | ||||||||||||||||||
Banco Bradesco S.A. (ADR) | 49,589 | — | 49,589 | 621,350 | — | 621,350 | ||||||||||||||||||
Banco do Brasil S.A. | 71,200 | — | 71,200 | 736,370 | — | 736,370 | ||||||||||||||||||
BM&F Bovespa S.A. | — | 373,800 | 373,800 | — | 1,752,348 | 1,752,348 | ||||||||||||||||||
BR Malls Participacoes S.A. | 89,700 | — | 89,700 | 648,250 | — | 648,250 | ||||||||||||||||||
Cia. Hering | — | 78,200 | 78,200 | — | 991,069 | 991,069 | ||||||||||||||||||
Itau Unibanco Holding S.A. (Preference) (ADR) | — | 200,450 | 200,450 | — | 2,720,107 | 2,720,107 | ||||||||||||||||||
Lojas Renner S.A. | — | 25,400 | 25,400 | — | 656,734 | 656,734 | ||||||||||||||||||
LPS Brasil Consultoria de Imoveis S.A. | — | 42,700 | 42,700 | — | 261,349 | 261,349 | ||||||||||||||||||
M Dias Branco S.A. | — | 34,100 | 34,100 | — | 1,445,375 | 1,445,375 | ||||||||||||||||||
Vale S.A. (ADR) | — | 639,936 | 639,936 | — | 9,759,024 | 9,759,024 | ||||||||||||||||||
|
|
|
|
|
| |||||||||||||||||||
| 2,005,970 | 18,673,990 | 20,679,960 | ||||||||||||||||||||||
|
|
|
|
|
| |||||||||||||||||||
Canada (4.8%) | ||||||||||||||||||||||||
Agrium, Inc. | — | 66,525 | 66,525 | — | 6,085,707 | 6,085,707 | ||||||||||||||||||
Brookfield Asset Management, Inc., Class A | — | 84,134 | 84,134 | — | 3,266,923 | 3,266,923 | ||||||||||||||||||
Canadian National Railway Co | — | 492,682 | 492,682 | — | 28,092,728 | 28,092,728 | ||||||||||||||||||
Canadian Natural Resources Ltd. (New York Exchange) | — | 308,152 | 308,152 | — | 10,427,864 | 10,427,864 | ||||||||||||||||||
Canadian Natural Resources Ltd. (Toronto Exchange) | — | 73,184 | 73,184 | — | 2,476,096 | 2,476,096 | ||||||||||||||||||
Canadian Pacific Railway Ltd. (New York Exchange) | — | 54,960 | 54,960 | — | 8,316,547 | 8,316,547 | ||||||||||||||||||
Canadian Pacific Railway Ltd. (Toronto Exchange) | 16,354 | 92,807 | 109,161 | 2,473,307 | 14,035,721 | 16,509,028 | ||||||||||||||||||
Cenovus Energy, Inc. | — | 52,326 | 52,326 | — | 1,499,140 | 1,499,140 | ||||||||||||||||||
Dollarama, Inc. | 8,024 | 35,088 | 43,112 | 666,319 | 2,913,732 | 3,580,051 | ||||||||||||||||||
Finning International, Inc. | — | 40,822 | 40,822 | — | 1,043,368 | 1,043,368 | ||||||||||||||||||
Imax Corp.* | 22,722 | — | 22,722 | 669,845 | — | 669,845 | ||||||||||||||||||
Lululemon Athletica, Inc.* | 32,483 | — | 32,483 | 1,917,471 | — | 1,917,471 | ||||||||||||||||||
Potash Corp. of Saskatchewan, Inc. | — | 177,072 | 177,072 | — | 5,837,667 | 5,837,667 | ||||||||||||||||||
Rogers Communications, Inc., Class B | 14,241 | — | 14,241 | 644,405 | — | 644,405 | ||||||||||||||||||
Suncor Energy, Inc. (New York Exchange) | — | 397,987 | 397,987 | — | 13,949,444 | 13,949,444 | ||||||||||||||||||
Suncor Energy, Inc. (Toronto Exchange) | 52,680 | 152,950 | 205,630 | 1,846,837 | 5,362,069 | 7,208,906 | ||||||||||||||||||
|
|
|
|
|
| |||||||||||||||||||
| 8,218,184 | 103,307,006 | 111,525,190 | ||||||||||||||||||||||
|
|
|
|
|
| |||||||||||||||||||
Chile (0.1%) | ||||||||||||||||||||||||
Banco Santander Chile S.A. (ADR) | — | 53,490 | 53,490 | — | 1,260,759 | 1,260,759 | ||||||||||||||||||
|
|
|
|
|
| |||||||||||||||||||
China (0.5%) | ||||||||||||||||||||||||
Anhui Conch Cement Co., Ltd., Class H | 248,500 | — | 248,500 | 921,344 | — | 921,344 | ||||||||||||||||||
Anton Oilfield Services Group/Hong Kong | 48,000 | — | 48,000 | 29,217 | — | 29,217 | ||||||||||||||||||
China Construction Bank Corp., Class H | 524,000 | — | 524,000 | 395,316 | — | 395,316 | ||||||||||||||||||
China Oilfield Services Ltd., Class H | 539,500 | — | 539,500 | 1,673,262 | — | 1,673,262 | ||||||||||||||||||
China Shipping Container Lines Co., Ltd., Class H* | 2,047,000 | — | 2,047,000 | 533,245 | — | 533,245 | ||||||||||||||||||
CNOOC Ltd. | 237,000 | — | 237,000 | 440,728 | — | 440,728 | ||||||||||||||||||
Daphne International Holdings Ltd. | 718,000 | — | 718,000 | 323,152 | — | 323,152 | ||||||||||||||||||
Guangzhou Automobile Group Co., Ltd., Class H | — | 1,174,068 | 1,174,068 | — | 1,283,945 | 1,283,945 | ||||||||||||||||||
Industrial & Commercial Bank of China Ltd., Class H | 1,394,135 | — | 1,394,135 | 942,093 | — | 942,093 | ||||||||||||||||||
Mindray Medical International Ltd. (ADR) | 25,335 | — | 25,335 | 921,181 | — | 921,181 | ||||||||||||||||||
See Notes to Pro-forma Combined Financial Statements.
62
Multimanager Equity | EQ/International Core PLUS | Pro-forma Combined | Multimanager International Equity | EQ/International Core PLUS | Pro-forma Combined | |||||||||||||||||||
| Number of Shares | Number of Shares | Number of Shares | Value ($) (Note 1) | Value ($) (Note 1) | Value ($) (Note 1) | |||||||||||||||||||
Ping An Insurance Group Co. of China Ltd., Class H | 38,500 | — | 38,500 | 344,818 | — | 344,818 | ||||||||||||||||||
Qunar Cayman Islands Ltd. (ADR)* | 23,099 | — | 23,099 | 612,817 | — | 612,817 | ||||||||||||||||||
Weichai Power Co., Ltd., Class H | 262,080 | — | 262,080 | 1,056,188 | — | 1,056,188 | ||||||||||||||||||
Yangzijiang Shipbuilding Holdings Ltd. | 16,182 | 127,652 | 143,834 | 15,195 | 119,868 | 135,063 | ||||||||||||||||||
Youku Tudou, Inc. (ADR)* | 25,991 | — | 25,991 | 787,527 | — | 787,527 | ||||||||||||||||||
|
|
|
|
|
| |||||||||||||||||||
| 8,996,083 | 1,403,813 | 10,399,896 | ||||||||||||||||||||||
|
|
|
|
|
| |||||||||||||||||||
Colombia (0.0%) | ||||||||||||||||||||||||
Bancolombia S.A. (ADR) | 14,406 | — | 14,406 | 706,182 | — | 706,182 | ||||||||||||||||||
|
|
|
|
|
| |||||||||||||||||||
Czech Republic (0.0%) | ||||||||||||||||||||||||
Komercni Banka A/S | 2,981 | — | 2,981 | 663,617 | — | 663,617 | ||||||||||||||||||
|
|
|
|
|
| |||||||||||||||||||
Denmark (0.9%) | ||||||||||||||||||||||||
A. P. Moller - Maersk A/S, Class A | 4 | 35 | 39 | 41,234 | 360,795 | 402,029 | ||||||||||||||||||
A. P. Moller - Maersk A/S, Class B | 11 | 84 | 95 | 119,377 | 911,604 | 1,030,981 | ||||||||||||||||||
Carlsberg A/S, Class B | 936 | 43,340 | 44,276 | 103,564 | 4,795,353 | 4,898,917 | ||||||||||||||||||
Chr Hansen Holding A/S | — | 57,166 | 57,166 | — | 2,270,722 | 2,270,722 | ||||||||||||||||||
Coloplast A/S, Class B | 933 | 6,976 | 7,909 | 61,767 | 461,829 | 523,596 | ||||||||||||||||||
Danske Bank A/S* | 5,736 | 42,024 | 47,760 | 131,586 | 964,047 | 1,095,633 | ||||||||||||||||||
DSV A/S | 1,443 | 12,050 | 13,493 | 47,313 | 395,093 | 442,406 | ||||||||||||||||||
Novo Nordisk A/S, Class B | 5,357 | 41,766 | 47,123 | 981,948 | 7,655,784 | 8,637,732 | ||||||||||||||||||
Novozymes A/S, Class B | 1,962 | 14,010 | 15,972 | 82,818 | 591,377 | 674,195 | ||||||||||||||||||
TDC A/S | 6,880 | 50,204 | 57,084 | 66,735 | 486,972 | 553,707 | ||||||||||||||||||
Tryg A/S | 223 | 1,627 | 1,850 | 21,569 | 157,367 | 178,936 | ||||||||||||||||||
William Demant Holding A/S* | 233 | 1,573 | 1,806 | 22,643 | 152,869 | 175,512 | ||||||||||||||||||
|
|
|
|
|
| |||||||||||||||||||
| 1,680,554 | 19,203,812 | 20,884,366 | ||||||||||||||||||||||
|
|
|
|
|
| |||||||||||||||||||
Finland (0.4%) | ||||||||||||||||||||||||
Elisa Oyj | 1,419 | 8,822 | 10,241 | 37,598 | 233,747 | 271,345 | ||||||||||||||||||
Fortum Oyj | 3,884 | 27,388 | 31,272 | 88,858 | 626,580 | 715,438 | ||||||||||||||||||
Kone Oyj, Class B | 2,726 | 55,838 | 58,564 | 123,005 | 2,519,576 | 2,642,581 | ||||||||||||||||||
Metso Oyj | 1,241 | 8,192 | 9,433 | 52,959 | 349,587 | 402,546 | ||||||||||||||||||
Neste Oil Oyj | 1,168 | 8,496 | 9,664 | 23,090 | 167,956 | 191,046 | ||||||||||||||||||
Nokia Oyj* | 32,778 | 236,958 | 269,736 | 262,440 | 1,897,222 | 2,159,662 | ||||||||||||||||||
Nokian Renkaat Oyj | 1,053 | 7,196 | 8,249 | 50,513 | 345,197 | 395,710 | ||||||||||||||||||
Orion Oyj, Class B | 887 | 6,464 | 7,351 | 24,917 | 181,585 | 206,502 | ||||||||||||||||||
Pohjola Bank plc, Class A | 1,307 | 9,195 | 10,502 | 26,287 | 184,937 | 211,224 | ||||||||||||||||||
Sampo Oyj, Class A | 3,667 | 26,294 | 29,961 | 180,196 | 1,292,087 | 1,472,283 | ||||||||||||||||||
Stora Enso Oyj, Class R | 4,992 | 35,328 | 40,320 | 50,098 | 354,542 | 404,640 | ||||||||||||||||||
UPM-Kymmene Oyj | 4,422 | 33,723 | 38,145 | 74,704 | 569,703 | 644,407 | ||||||||||||||||||
Wartsila Oyj | 1,523 | 11,316 | 12,839 | 74,945 | 556,847 | 631,792 | ||||||||||||||||||
|
|
|
|
|
| |||||||||||||||||||
| 1,069,610 | 9,279,566 | 10,349,176 | ||||||||||||||||||||||
|
|
|
|
|
| |||||||||||||||||||
France (6.1%) | ||||||||||||||||||||||||
Accor S.A. | 11,715 | 10,150 | 21,865 | 552,790 | 478,943 | 1,031,733 | ||||||||||||||||||
Aeroports de Paris S.A. | 284 | 1,852 | 2,136 | 32,233 | 210,193 | 242,426 | ||||||||||||||||||
Air Liquide S.A. | 2,729 | 39,429 | 42,158 | 385,941 | 5,576,127 | 5,962,068 | ||||||||||||||||||
Airbus Group N.V. | 5,094 | 37,461 | 42,555 | 391,106 | 2,876,174 | 3,267,280 | ||||||||||||||||||
Alcatel-Lucent* | 23,253 | 175,228 | 198,481 | 104,221 | 785,377 | 889,598 | ||||||||||||||||||
Alstom S.A. | 1,798 | 13,820 | 15,618 | 65,486 | 503,347 | 568,833 | ||||||||||||||||||
Arkema S.A. | 524 | 4,024 | 4,548 | 61,122 | 469,382 | 530,504 | ||||||||||||||||||
AtoS | 562 | 4,047 | 4,609 | 50,865 | 366,283 | 417,148 | ||||||||||||||||||
AXA S.A‡ | 15,703 | 113,867 | 129,570 | 436,589 | 3,165,832 | 3,602,421 | ||||||||||||||||||
BNP Paribas S.A. | 14,714 | 63,370 | 78,084 | 1,146,712 | 4,938,640 | 6,085,352 | ||||||||||||||||||
Bouygues S.A. | 1,540 | 12,235 | 13,775 | 58,091 | 461,525 | 519,616 | ||||||||||||||||||
Bureau Veritas S.A. | 1,845 | 14,186 | 16,031 | 53,923 | 414,611 | 468,534 | ||||||||||||||||||
Cap Gemini S.A. | 1,199 | 9,151 | 10,350 | 81,038 | 618,499 | 699,537 | ||||||||||||||||||
Carrefour S.A. | 5,276 | 38,642 | 43,918 | 209,109 | 1,531,534 | 1,740,643 | ||||||||||||||||||
Casino Guichard Perrachon S.A. | 539 | 3,611 | 4,150 | 62,116 | 416,140 | 478,256 | ||||||||||||||||||
CGG S.A.* | 1,486 | 10,176 | 11,662 | 25,717 | 176,109 | 201,826 | ||||||||||||||||||
Christian Dior S.A. | 477 | 3,495 | 3,972 | 90,130 | 660,389 | 750,519 | ||||||||||||||||||
Cie de Saint-Gobain S.A. | 3,486 | 26,010 | 29,496 | 191,708 | 1,430,384 | 1,622,092 | ||||||||||||||||||
Cie Generale des Etablissements Michelin | 1,598 | 11,679 | 13,277 | 169,824 | 1,241,160 | 1,410,984 | ||||||||||||||||||
CNP Assurances S.A. | 1,397 | 10,289 | 11,686 | 28,636 | 210,903 | 239,539 | ||||||||||||||||||
Credit Agricole S.A.* | 8,738 | 64,050 | 72,788 | 111,854 | 819,897 | 931,751 | ||||||||||||||||||
Criteo S.A. (ADR)* | 7,492 | — | 7,492 | 256,226 | — | 256,226 | ||||||||||||||||||
Danone S.A. | 5,006 | 144,156 | 149,162 | 360,315 | 10,375,862 | 10,736,177 | ||||||||||||||||||
Dassault Systemes S.A. | 532 | 19,575 | 20,107 | 66,037 | 2,429,833 | 2,495,870 | ||||||||||||||||||
Edenred | 1,647 | 12,957 | 14,604 | 55,126 | 433,681 | 488,807 | ||||||||||||||||||
EDF S.A. | 2,255 | 15,407 | 17,662 | 79,680 | 544,404 | 624,084 | ||||||||||||||||||
Essilor International S.A. | 4,729 | 34,931 | 39,660 | 502,759 | 3,713,658 | 4,216,417 | ||||||||||||||||||
Eurazeo S.A. | 270 | 2,068 | 2,338 | 21,165 | 162,105 | 183,270 | ||||||||||||||||||
Eutelsat Communications S.A. | 1,400 | 9,195 | 10,595 | 43,652 | 286,702 | 330,354 | ||||||||||||||||||
Fonciere des Regions (REIT) | 287 | 1,883 | 2,170 | 24,775 | 162,550 | 187,325 | ||||||||||||||||||
GDF Suez S.A. | 11,617 | 84,333 | 95,950 | 273,204 | 1,983,309 | 2,256,513 | ||||||||||||||||||
Gecina S.A. (REIT) | 211 | 1,344 | 1,555 | 27,875 | 177,554 | 205,429 | ||||||||||||||||||
Groupe Eurotunnel S.A. (Registered) | 5,257 | 35,696 | 40,953 | 55,253 | 375,177 | 430,430 | ||||||||||||||||||
See Notes to Pro-forma Combined Financial Statements.
63
Multimanager Equity | EQ/International Core PLUS | Pro-forma Combined | Multimanager International Equity | EQ/International Core PLUS | Pro-forma Combined | |||||||||||||||||||
| Number of Shares | Number of Shares | Number of Shares | Value ($) (Note 1) | Value ($) (Note 1) | Value ($) (Note 1) | |||||||||||||||||||
Groupe Fnac* | 92 | — | 92 | 3,017 | — | 3,017 | ||||||||||||||||||
ICADE (REIT) | 345 | 1,984 | 2,329 | 32,117 | 184,698 | 216,815 | ||||||||||||||||||
Iliad S.A. | 212 | 1,581 | 1,793 | 43,426 | 323,855 | 367,281 | ||||||||||||||||||
Imerys S.A. | 4,306 | 2,253 | 6,559 | 374,441 | 195,916 | 570,357 | ||||||||||||||||||
J.C. Decaux S.A. | 594 | 4,428 | 5,022 | 24,490 | 182,565 | 207,055 | ||||||||||||||||||
Kering | 2,849 | 4,846 | 7,695 | 602,211 | 1,024,330 | 1,626,541 | ||||||||||||||||||
Klepierre S.A. (REIT) | 975 | 6,489 | 7,464 | 45,182 | 300,703 | 345,885 | ||||||||||||||||||
Lafarge S.A. | 6,902 | 11,969 | 18,871 | 517,197 | 896,890 | 1,414,087 | ||||||||||||||||||
Lagardere S.C.A. | 1,020 | 7,357 | 8,377 | 37,915 | 273,470 | 311,385 | ||||||||||||||||||
Legrand S.A. | 2,236 | 40,637 | 42,873 | 123,227 | 2,239,527 | 2,362,754 | ||||||||||||||||||
L’Oreal S.A. | 2,117 | 29,340 | 31,457 | 371,908 | 5,154,360 | 5,526,268 | ||||||||||||||||||
LVMH Moet Hennessy Louis Vuitton S.A. | 4,918 | 55,291 | 60,209 | 897,131 | 10,086,064 | 10,983,195 | ||||||||||||||||||
Natixis S.A. | 7,300 | 58,519 | 65,819 | 42,922 | 344,077 | 386,999 | ||||||||||||||||||
Orange S.A. | 16,229 | 118,857 | 135,086 | 200,936 | 1,471,604 | 1,672,540 | ||||||||||||||||||
Pernod-Ricard S.A. | 5,013 | 62,209 | 67,222 | 571,090 | 7,086,956 | 7,658,046 | ||||||||||||||||||
Publicis Groupe S.A. | 1,562 | 66,270 | 67,832 | 142,920 | 6,063,560 | 6,206,480 | ||||||||||||||||||
Remy Cointreau S.A. | 11,001 | 1,565 | 12,566 | 923,027 | 131,310 | 1,054,337 | ||||||||||||||||||
Renault S.A. | 1,682 | 12,322 | 14,004 | 135,249 | 990,808 | 1,126,057 | ||||||||||||||||||
Rexel S.A. | 1,661 | 11,750 | 13,411 | 43,587 | 308,337 | 351,924 | ||||||||||||||||||
Safran S.A. | 2,316 | 16,608 | 18,924 | 160,931 | 1,154,034 | 1,314,965 | ||||||||||||||||||
Sanofi S.A. | 17,984 | 75,865 | 93,849 | 1,907,994 | 8,048,820 | 9,956,814 | ||||||||||||||||||
Schneider Electric S.A. | 11,264 | 73,683 | 84,947 | 982,439 | 6,426,586 | 7,409,025 | ||||||||||||||||||
SCOR SE | 1,231 | 9,741 | 10,972 | 44,988 | 355,989 | 400,977 | ||||||||||||||||||
Societe BIC S.A. | 290 | 1,802 | 2,092 | 35,531 | 220,781 | 256,312 | ||||||||||||||||||
Societe Generale S.A. | 24,356 | 45,315 | 69,671 | 1,414,647 | 2,631,988 | 4,046,635 | ||||||||||||||||||
Sodexo S.A. | 812 | 6,043 | 6,855 | 82,261 | 612,195 | 694,456 | ||||||||||||||||||
Suez Environnement Co. S.A. | 2,227 | 17,727 | 19,954 | 39,905 | 317,641 | 357,546 | ||||||||||||||||||
Technip S.A. | 6,469 | 26,793 | 33,262 | 621,712 | 2,574,979 | 3,196,691 | ||||||||||||||||||
Thales S.A. | 732 | 5,805 | 6,537 | 47,128 | 373,742 | 420,870 | ||||||||||||||||||
Total S.A. | 18,732 | 135,797 | 154,529 | 1,147,521 | 8,318,914 | 9,466,435 | ||||||||||||||||||
Unibail-Rodamco SE (REIT) | 846 | 6,148 | 6,994 | 216,766 | 1,575,266 | 1,792,032 | ||||||||||||||||||
Valeo S.A. | 620 | 4,518 | 5,138 | 68,602 | 499,906 | 568,508 | ||||||||||||||||||
Vallourec S.A. | 854 | 6,690 | 7,544 | 46,524 | 364,456 | 410,980 | ||||||||||||||||||
Veolia Environnement S.A. | 3,088 | 21,753 | 24,841 | 50,362 | 354,768 | 405,130 | ||||||||||||||||||
Vinci S.A. | 4,059 | 29,612 | 33,671 | 266,467 | 1,943,981 | 2,210,448 | ||||||||||||||||||
Vivendi S.A. | 10,438 | 75,920 | 86,358 | 275,057 | 2,000,608 | 2,275,665 | ||||||||||||||||||
Wendel S.A. | 258 | 2,053 | 2,311 | 37,605 | 299,236 | 336,841 | ||||||||||||||||||
Zodiac Aerospace | 270 | 2,164 | 2,434 | 47,823 | 383,291 | 431,114 | ||||||||||||||||||
|
|
|
|
|
| |||||||||||||||||||
| 18,701,534 | 123,712,495 | 142,414,029 | ||||||||||||||||||||||
|
|
|
|
|
| |||||||||||||||||||
Germany (5.7%) | ||||||||||||||||||||||||
Adidas AG | 13,898 | 40,327 | 54,225 | 1,771,229 | 5,139,468 | 6,910,697 | ||||||||||||||||||
Allianz SE (Registered) | 7,937 | 28,864 | 36,801 | 1,423,283 | 5,175,965 | 6,599,248 | ||||||||||||||||||
Axel Springer SE | 356 | 2,639 | 2,995 | 22,871 | 169,543 | 192,414 | ||||||||||||||||||
BASF SE | 8,043 | 105,253 | 113,296 | 857,408 | 11,220,285 | 12,077,693 | ||||||||||||||||||
BASF SE (ADR) | — | 6,500 | 6,500 | — | 700,635 | 700,635 | ||||||||||||||||||
Bayer AG (Registered) | 12,114 | 92,902 | 105,016 | 1,699,020 | 13,029,749 | 14,728,769 | ||||||||||||||||||
Bayerische Motoren Werke (BMW) AG | 13,200 | 21,062 | 34,262 | 1,547,531 | 2,469,249 | 4,016,780 | ||||||||||||||||||
Bayerische Motoren Werke (BMW) AG (Preference) | 529 | 3,370 | 3,899 | 45,186 | 287,856 | 333,042 | ||||||||||||||||||
Beiersdorf AG | 870 | 6,461 | 7,331 | 88,137 | 654,542 | 742,679 | ||||||||||||||||||
Brenntag AG | 443 | 23,941 | 24,384 | 82,121 | 4,438,077 | 4,520,198 | ||||||||||||||||||
Celesio AG | 714 | 5,634 | 6,348 | 22,592 | 178,266 | 200,858 | ||||||||||||||||||
Commerzbank AG* | 8,464 | 61,669 | 70,133 | 136,350 | 993,454 | 1,129,804 | ||||||||||||||||||
Continental AG | 978 | 7,051 | 8,029 | 214,462 | 1,546,190 | 1,760,652 | ||||||||||||||||||
Daimler AG (Registered) | 8,424 | 60,974 | 69,398 | 728,942 | 5,276,174 | 6,005,116 | ||||||||||||||||||
Deutsche Bank AG (Registered) | 8,926 | 65,004 | 73,930 | 425,792 | 3,100,847 | 3,526,639 | ||||||||||||||||||
Deutsche Boerse AG | 1,688 | 12,371 | 14,059 | 139,795 | 1,024,531 | 1,164,326 | ||||||||||||||||||
Deutsche Lufthansa AG (Registered)* | 2,144 | 14,742 | 16,886 | 45,481 | 312,726 | 358,207 | ||||||||||||||||||
Deutsche Post AG (Registered) | 7,937 | 57,549 | 65,486 | 289,352 | 2,098,009 | 2,387,361 | ||||||||||||||||||
Deutsche Telekom AG (Registered) | 25,116 | 182,568 | 207,684 | 429,482 | 3,121,904 | 3,551,386 | ||||||||||||||||||
Deutsche Wohnen AG | 2,608 | 18,918 | 21,526 | 50,355 | 365,268 | 415,623 | ||||||||||||||||||
E.ON SE | 15,765 | 113,242 | 129,007 | 290,943 | 2,089,883 | 2,380,826 | ||||||||||||||||||
Fraport AG | 341 | 2,210 | 2,551 | 25,515 | 165,362 | 190,877 | ||||||||||||||||||
Fresenius Medical Care AG & Co. KGaA | 5,874 | 35,180 | 41,054 | 418,023 | 2,503,583 | 2,921,606 | ||||||||||||||||||
Fresenius SE & Co. KGaA | 1,093 | 7,992 | 9,085 | 167,806 | 1,226,997 | 1,394,803 | ||||||||||||||||||
Fuchs Petrolub SE (Preference) | 339 | 2,259 | 2,598 | 33,130 | 220,771 | 253,901 | ||||||||||||||||||
GEA Group AG | 1,711 | 11,539 | 13,250 | 81,442 | 549,247 | 630,689 | ||||||||||||||||||
Hannover Rueck SE | 570 | 3,865 | 4,435 | 48,915 | 331,679 | 380,594 | ||||||||||||||||||
HeidelbergCement AG | 1,230 | 9,014 | 10,244 | 93,320 | 683,891 | 777,211 | ||||||||||||||||||
Henkel AG & Co. KGaA | 1,136 | 8,067 | 9,203 | 118,210 | 839,435 | 957,645 | ||||||||||||||||||
Henkel AG & Co. KGaA (Preference) | 5,370 | 11,192 | 16,562 | 622,841 | 1,298,107 | 1,920,948 | ||||||||||||||||||
Hochtief AG | 288 | 1,911 | 2,199 | 24,588 | 163,153 | 187,741 | ||||||||||||||||||
Hugo Boss AG | 304 | 2,017 | 2,321 | 43,285 | 287,190 | 330,475 | ||||||||||||||||||
Infineon Technologies AG | 9,452 | 69,256 | 78,708 | 100,904 | 739,338 | 840,242 | ||||||||||||||||||
K+S AG (Registered) | 1,682 | 11,041 | 12,723 | 51,774 | 339,856 | 391,630 | ||||||||||||||||||
Kabel Deutschland Holding AG | 216 | 1,419 | 1,635 | 27,998 | 183,929 | 211,927 | ||||||||||||||||||
See Notes to Pro-forma Combined Financial Statements.
64
Multimanager Equity | EQ/International Core PLUS | Pro-forma Combined | Multimanager International Equity | EQ/International Core PLUS | Pro-forma Combined | |||||||||||||||||||
| Number of Shares | Number of Shares | Number of Shares | Value ($) (Note 1) | Value ($) (Note 1) | Value ($) (Note 1) | |||||||||||||||||||
Lanxess AG | 662 | 5,333 | 5,995 | 44,147 | 355,642 | 399,789 | ||||||||||||||||||
Linde AG | 3,674 | 38,534 | 42,208 | 768,510 | 8,060,357 | 8,828,867 | ||||||||||||||||||
MAN SE | 341 | 2,237 | 2,578 | 41,868 | 274,662 | 316,530 | ||||||||||||||||||
Merck KGaA | 565 | 4,142 | 4,707 | 101,240 | 742,184 | 843,424 | ||||||||||||||||||
Metro AG | 1,193 | 8,310 | 9,503 | 57,771 | 402,409 | 460,180 | ||||||||||||||||||
Muenchener Rueckversicherungs AG (Registered) | 1,570 | 11,416 | 12,986 | 345,900 | 2,515,154 | 2,861,054 | ||||||||||||||||||
OSRAM Licht AG* | 766 | 5,056 | 5,822 | 43,205 | 285,177 | 328,382 | ||||||||||||||||||
Porsche Automobil Holding SE (Preference) | 1,339 | 9,563 | 10,902 | 139,371 | 995,369 | 1,134,740 | ||||||||||||||||||
ProSiebenSat.1 Media AG (Registered) | 1,532 | 11,609 | 13,141 | 75,873 | 574,938 | 650,811 | ||||||||||||||||||
RWE AG | 4,282 | 30,725 | 35,007 | 156,723 | 1,124,550 | 1,281,273 | ||||||||||||||||||
SAP AG | 19,045 | 99,643 | 118,688 | 1,632,535 | 8,541,385 | 10,173,920 | ||||||||||||||||||
Siemens AG (Registered) | 10,439 | 50,191 | 60,630 | 1,425,897 | 6,855,752 | 8,281,649 | ||||||||||||||||||
Sky Deutschland AG* | 3,415 | 27,353 | 30,768 | 37,584 | 301,036 | 338,620 | ||||||||||||||||||
Suedzucker AG | 789 | 5,196 | 5,985 | 21,296 | 140,246 | 161,542 | ||||||||||||||||||
Symrise AG | — | 67,741 | 67,741 | — | 3,121,908 | 3,121,908 | ||||||||||||||||||
Telefonica Deutschland Holding AG | 2,653 | 17,763 | 20,416 | 21,898 | 146,619 | 168,517 | ||||||||||||||||||
ThyssenKrupp AG* | 3,351 | 24,734 | 28,085 | 81,550 | 601,930 | 683,480 | ||||||||||||||||||
United Internet AG (Registered) | 1,020 | 6,794 | 7,814 | 43,387 | 288,994 | 332,381 | ||||||||||||||||||
Volkswagen AG | 244 | 1,792 | 2,036 | 66,094 | 485,409 | 551,503 | ||||||||||||||||||
Volkswagen AG (Preference) | 4,148 | 9,201 | 13,349 | 1,164,962 | 2,584,093 | 3,749,055 | ||||||||||||||||||
Wirecard AG | 43,811 | — | 43,811 | 1,730,676 | — | 1,730,676 | ||||||||||||||||||
|
|
|
|
|
| |||||||||||||||||||
| 20,168,570 | 111,322,973 | 131,491,543 | ||||||||||||||||||||||
|
|
|
|
|
| |||||||||||||||||||
Hong Kong (1.8%) | ||||||||||||||||||||||||
AIA Group Ltd. | 472,327 | 1,598,725 | 2,071,052 | 2,369,462 | 8,020,118 | 10,389,580 | ||||||||||||||||||
ASM Pacific Technology Ltd. | 2,300 | 15,307 | 17,607 | 19,250 | 128,113 | 147,363 | ||||||||||||||||||
Bank of East Asia Ltd. | 11,847 | 86,380 | 98,227 | 50,188 | 365,937 | 416,125 | ||||||||||||||||||
Belle International Holdings Ltd. | 133,000 | — | 133,000 | 153,851 | — | 153,851 | ||||||||||||||||||
BOC Hong Kong Holdings Ltd. | 32,500 | 237,043 | 269,543 | 104,152 | 759,645 | 863,797 | ||||||||||||||||||
Cathay Pacific Airways Ltd. | 11,000 | 87,575 | 98,575 | 23,264 | 185,217 | 208,481 | ||||||||||||||||||
Cheung Kong Holdings Ltd. | 69,000 | 88,899 | 157,899 | 1,089,151 | 1,403,252 | 2,492,403 | ||||||||||||||||||
Cheung Kong Infrastructure Holdings Ltd. | 6,000 | 39,340 | 45,340 | 37,876 | 248,339 | 286,215 | ||||||||||||||||||
China Unicom Hong Kong Ltd. | — | 2,068,023 | 2,068,023 | — | 3,093,647 | 3,093,647 | ||||||||||||||||||
CLP Holdings Ltd. | 15,500 | 111,564 | 127,064 | 122,532 | 881,946 | 1,004,478 | ||||||||||||||||||
Dairy Farm International Holdings Ltd. | — | 86,219 | 86,219 | — | 819,081 | 819,081 | ||||||||||||||||||
First Pacific Co., Ltd. | 23,000 | 166,250 | 189,250 | 26,161 | 189,098 | 215,259 | ||||||||||||||||||
Galaxy Entertainment Group Ltd.* | 18,000 | 135,000 | 153,000 | 161,446 | 1,210,844 | 1,372,290 | ||||||||||||||||||
Hang Lung Properties Ltd. | 159,000 | 143,438 | 302,438 | 502,366 | 453,198 | 955,564 | ||||||||||||||||||
Hang Seng Bank Ltd. | 6,700 | 49,074 | 55,774 | 108,609 | 795,507 | 904,116 | ||||||||||||||||||
Henderson Land Development Co., Ltd. | 9,800 | 68,209 | 78,009 | 55,924 | 389,235 | 445,159 | ||||||||||||||||||
HKT Trust/HKT Ltd. | 20,000 | 136,000 | 156,000 | 19,757 | 134,346 | 154,103 | ||||||||||||||||||
Hong Kong & China Gas Co., Ltd. | 50,014 | 367,747 | 417,761 | 114,678 | 843,215 | 957,893 | ||||||||||||||||||
Hong Kong Exchanges and Clearing Ltd. | 9,600 | 44,727 | 54,327 | 160,076 | 745,806 | 905,882 | ||||||||||||||||||
Hopewell Holdings Ltd. | 5,500 | 37,351 | 42,851 | 18,619 | 126,441 | 145,060 | ||||||||||||||||||
Hutchison Whampoa Ltd. | 19,000 | 136,571 | 155,571 | 258,257 | 1,856,336 | 2,114,593 | ||||||||||||||||||
Hysan Development Co., Ltd. | 5,448 | 39,459 | 44,907 | 23,466 | 169,961 | 193,427 | ||||||||||||||||||
Kerry Properties Ltd. | 6,000 | 40,732 | 46,732 | 20,814 | 141,301 | 162,115 | ||||||||||||||||||
Li & Fung Ltd. | 48,000 | 2,911,503 | 2,959,503 | 61,901 | 3,754,695 | 3,816,596 | ||||||||||||||||||
Link REIT (REIT) | 19,813 | 146,186 | 165,999 | 96,072 | 708,845 | 804,917 | ||||||||||||||||||
MTR Corp., Ltd. | 11,089 | 93,029 | 104,118 | 41,972 | 352,114 | 394,086 | ||||||||||||||||||
New World Development Co., Ltd. | 36,212 | 238,170 | 274,382 | 45,719 | 300,696 | 346,415 | ||||||||||||||||||
Noble Group Ltd. | 39,454 | 269,979 | 309,433 | 33,453 | 228,914 | 262,367 | ||||||||||||||||||
NWS Holdings Ltd. | 12,947 | 95,383 | 108,330 | 19,736 | 145,394 | 165,130 | ||||||||||||||||||
Orient Overseas International Ltd. | 207,200 | — | 207,200 | 1,040,770 | — | 1,040,770 | ||||||||||||||||||
PCCW Ltd. | 43,974 | 265,585 | 309,559 | 19,678 | 118,848 | 138,526 | ||||||||||||||||||
Power Assets Holdings Ltd. | 12,000 | 88,996 | 100,996 | 95,405 | 707,556 | 802,961 | ||||||||||||||||||
Shangri-La Asia Ltd. | 15,166 | 99,859 | 115,025 | 29,572 | 194,714 | 224,286 | ||||||||||||||||||
Sino Land Co., Ltd. | 27,910 | 189,241 | 217,151 | 38,152 | 258,689 | 296,841 | ||||||||||||||||||
SJM Holdings Ltd. | 16,000 | 124,000 | 140,000 | 53,648 | 415,769 | 469,417 | ||||||||||||||||||
Sun Hung Kai Properties Ltd. | 14,000 | 103,278 | 117,278 | 177,566 | 1,309,904 | 1,487,470 | ||||||||||||||||||
Swire Pacific Ltd., Class A | 5,500 | 43,331 | 48,831 | 64,474 | 507,949 | 572,423 | ||||||||||||||||||
Swire Properties Ltd. | 11,600 | 75,000 | 86,600 | 29,320 | 189,572 | 218,892 | ||||||||||||||||||
Wharf Holdings Ltd. | 13,000 | 97,330 | 110,330 | 99,416 | 744,319 | 843,735 | ||||||||||||||||||
Wheelock & Co., Ltd. | 7,000 | 58,116 | 65,116 | 32,182 | 267,185 | 299,367 | ||||||||||||||||||
Yue Yuen Industrial Holdings Ltd. | 7,000 | 46,199 | 53,199 | 23,381 | 154,308 | 177,689 | ||||||||||||||||||
|
|
|
|
|
| |||||||||||||||||||
| 7,442,316 | 33,320,054 | 40,762,370 | ||||||||||||||||||||||
|
|
|
|
|
| |||||||||||||||||||
India (0.2%) | ||||||||||||||||||||||||
HDFC Bank Ltd. (ADR) | 8,200 | 71,480 | 79,680 | 282,408 | 2,461,771 | 2,744,179 | ||||||||||||||||||
ICICI Bank Ltd. (ADR) | 33,535 | — | 33,535 | 1,246,496 | — | 1,246,496 | ||||||||||||||||||
Tata Motors Ltd. (ADR) | 22,528 | — | 22,528 | 693,862 | — | 693,862 | ||||||||||||||||||
Yes Bank Ltd. | 150,190 | — | 150,190 | 898,882 | — | 898,882 | ||||||||||||||||||
|
|
|
|
|
| |||||||||||||||||||
| 3,121,648 | 2,461,771 | 5,583,419 | ||||||||||||||||||||||
|
|
|
|
|
| |||||||||||||||||||
Indonesia (0.0%) | ||||||||||||||||||||||||
PT Astra International Tbk | 393,500 | — | 393,500 | 219,869 | — | 219,869 | ||||||||||||||||||
|
|
|
|
|
| |||||||||||||||||||
See Notes to Pro-forma Combined Financial Statements.
65
Multimanager Equity | EQ/International Core PLUS | Pro-forma Combined | Multimanager International Equity | EQ/International Core PLUS | Pro-forma Combined | |||||||||||||||||||
| Number of Shares | Number of Shares | Number of Shares | Value ($) (Note 1) | Value ($) (Note 1) | Value ($) (Note 1) | |||||||||||||||||||
Ireland (1.5%) | ||||||||||||||||||||||||
Accenture plc, Class A | — | 66,686 | 66,686 | — | 5,482,923 | 5,482,923 | ||||||||||||||||||
Bank of Ireland* | 167,579 | 1,343,976 | 1,511,555 | 58,096 | 465,925 | 524,021 | ||||||||||||||||||
CRH plc | 6,417 | 46,557 | 52,974 | 161,838 | 1,172,087 | 1,333,925 | ||||||||||||||||||
Eaton Corp. plc | — | 163,471 | 163,471 | — | 12,443,412 | 12,443,412 | ||||||||||||||||||
Experian plc | 8,835 | 228,826 | 237,661 | 162,982 | 4,221,218 | 4,384,200 | ||||||||||||||||||
ICON plc* | 38,086 | — | 38,086 | 1,539,055 | — | 1,539,055 | ||||||||||||||||||
James Hardie Industries plc (CDI) | 4,007 | 27,899 | 31,906 | 46,297 | 322,349 | 368,646 | ||||||||||||||||||
Kerry Group plc (BATS Eaurope Exchange), Class A | — | 6,232 | 6,232 | — | 432,955 | 432,955 | ||||||||||||||||||
Kerry Group plc (Irish Stock Exchange), Class A | 1,288 | 3,337 | 4,625 | 89,463 | 231,785 | 321,248 | ||||||||||||||||||
Paddy Power plc | — | 22,277 | 22,277 | — | 1,900,081 | 1,900,081 | ||||||||||||||||||
Shire plc | 54,360 | 59,251 | 113,611 | 2,567,297 | 2,798,288 | 5,365,585 | ||||||||||||||||||
|
|
|
|
|
| |||||||||||||||||||
| 4,625,028 | 29,471,023 | 34,096,051 | ||||||||||||||||||||||
|
|
|
|
|
| |||||||||||||||||||
Israel (0.3%) | ||||||||||||||||||||||||
Bank Hapoalim B.M | 9,964 | 67,673 | 77,637 | 55,818 | 379,101 | 434,919 | ||||||||||||||||||
Bank Leumi Le-Israel B.M.* | 11,649 | 80,023 | 91,672 | 47,576 | 326,822 | 374,398 | ||||||||||||||||||
Bezeq Israeli Telecommunication Corp., Ltd. | 17,050 | 115,948 | 132,998 | 28,899 | 196,531 | 225,430 | ||||||||||||||||||
Delek Group Ltd. | 39 | 229 | 268 | 14,895 | 87,458 | 102,353 | ||||||||||||||||||
Israel Chemicals Ltd. | 4,337 | 28,547 | 32,884 | 36,137 | 237,864 | 274,001 | ||||||||||||||||||
Israel Corp., Ltd.* | 25 | 166 | 191 | 13,155 | 87,351 | 100,506 | ||||||||||||||||||
Mizrahi Tefahot Bank Ltd. | 1,371 | 8,173 | 9,544 | 17,943 | 106,965 | 124,908 | ||||||||||||||||||
NICE Systems Ltd. | 534 | 3,657 | 4,191 | 21,871 | 149,777 | 171,648 | ||||||||||||||||||
NICE Systems Ltd. (ADR) | — | 62,249 | 62,249 | — | 2,549,719 | 2,549,719 | ||||||||||||||||||
Teva Pharmaceutical Industries Ltd. | 7,507 | 54,148 | 61,655 | 300,107 | 2,164,672 | 2,464,779 | ||||||||||||||||||
Teva Pharmaceutical Industries Ltd. (ADR) | 9,250 | — | 9,250 | 370,740 | — | 370,740 | ||||||||||||||||||
|
|
|
|
|
| |||||||||||||||||||
| 907,141 | 6,286,260 | 7,193,401 | ||||||||||||||||||||||
|
|
|
|
|
| |||||||||||||||||||
Italy (1.0%) | ||||||||||||||||||||||||
Assicurazioni Generali S.p.A. | 10,220 | 74,049 | 84,269 | 240,420 | 1,741,963 | 1,982,383 | ||||||||||||||||||
Atlantia S.p.A. | 2,742 | 21,212 | 23,954 | 61,524 | 475,948 | 537,472 | ||||||||||||||||||
Banca Monte dei Paschi di Siena S.p.A.* | 64,730 | 428,122 | 492,852 | 15,619 | 103,305 | 118,924 | ||||||||||||||||||
Enel Green Power S.p.A. | 13,119 | 109,584 | 122,703 | 33,046 | 276,032 | 309,078 | ||||||||||||||||||
Enel S.p.A. | 57,614 | 418,044 | 475,658 | 251,570 | 1,825,377 | 2,076,947 | ||||||||||||||||||
Eni S.p.A. | 22,275 | 161,154 | 183,429 | 535,959 | 3,877,525 | 4,413,484 | ||||||||||||||||||
Exor S.p.A. | 694 | 5,733 | 6,427 | 27,601 | 228,010 | 255,611 | ||||||||||||||||||
Fiat S.p.A.* | 7,032 | 56,105 | 63,137 | 57,511 | 458,857 | 516,368 | ||||||||||||||||||
Finmeccanica S.p.A.* | 3,874 | 26,882 | 30,756 | 29,339 | 203,584 | 232,923 | ||||||||||||||||||
Intesa Sanpaolo S.p.A. | 101,760 | 741,393 | 843,153 | 251,144 | 1,829,762 | 2,080,906 | ||||||||||||||||||
Luxottica Group S.p.A. | 1,421 | 10,584 | 12,005 | 76,142 | 567,128 | 643,270 | ||||||||||||||||||
Mediobanca S.p.A.* | 3,862 | 32,379 | 36,241 | 33,790 | 283,299 | 317,089 | ||||||||||||||||||
Pirelli & C. S.p.A. | 2,203 | 14,626 | 16,829 | 38,126 | 253,122 | 291,248 | ||||||||||||||||||
Prysmian S.p.A. | 1,870 | 103,074 | 104,944 | 48,133 | 2,653,057 | 2,701,190 | ||||||||||||||||||
Saipem S.p.A. | 2,135 | 119,185 | 121,320 | 45,702 | 2,551,261 | 2,596,963 | ||||||||||||||||||
Snam S.p.A. | 17,569 | 129,346 | 146,915 | 98,274 | 723,509 | 821,783 | ||||||||||||||||||
Telecom Italia S.p.A. | 85,302 | 641,433 | 726,735 | 84,609 | 636,224 | 720,833 | ||||||||||||||||||
Telecom Italia S.p.A. (RNC) | 56,219 | 384,457 | 440,676 | 44,007 | 300,943 | 344,950 | ||||||||||||||||||
Terna Rete Elettrica Nazionale S.p.A. | 12,294 | 96,078 | 108,372 | 61,427 | 480,058 | 541,485 | ||||||||||||||||||
UniCredit S.p.A. | 38,006 | 276,788 | 314,794 | 281,293 | 2,048,582 | 2,329,875 | ||||||||||||||||||
Unione di Banche Italiane S.c.p.A. | 7,861 | 54,312 | 62,173 | 53,380 | 368,803 | 422,183 | ||||||||||||||||||
|
|
|
|
|
| |||||||||||||||||||
| 2,368,616 | 21,886,349 | 24,254,965 | ||||||||||||||||||||||
|
|
|
|
|
| |||||||||||||||||||
Japan (11.0%) | ||||||||||||||||||||||||
ABC-Mart, Inc. | 300 | 1,840 | 2,140 | 13,090 | 80,285 | 93,375 | ||||||||||||||||||
Acom Co., Ltd.* | 4,100 | 23,500 | 27,600 | 13,899 | 79,665 | 93,564 | ||||||||||||||||||
Advantest Corp. | 1,300 | 8,998 | 10,298 | 16,134 | 111,674 | 127,808 | ||||||||||||||||||
Aeon Co., Ltd. | 5,100 | 38,452 | 43,552 | 69,011 | 520,312 | 589,323 | ||||||||||||||||||
AEON Financial Service Co., Ltd. | 600 | 27,538 | 28,138 | 16,067 | 737,415 | 753,482 | ||||||||||||||||||
Aeon Mall Co., Ltd. | 1,060 | 6,908 | 7,968 | 29,703 | 193,576 | 223,279 | ||||||||||||||||||
Air Water, Inc. | 1,000 | 10,000 | 11,000 | 13,522 | 135,220 | 148,742 | ||||||||||||||||||
Aisin Seiki Co., Ltd. | 1,600 | 12,338 | 13,938 | 64,875 | 500,268 | 565,143 | ||||||||||||||||||
Ajinomoto Co., Inc. | 5,000 | 38,168 | 43,168 | 72,263 | 551,626 | 623,889 | ||||||||||||||||||
Alfresa Holdings Corp. | 400 | 2,366 | 2,766 | 19,827 | 117,278 | 137,105 | ||||||||||||||||||
Amada Co., Ltd. | 3,000 | 23,148 | 26,148 | 26,408 | 203,762 | 230,170 | ||||||||||||||||||
ANA Holdings, Inc. | 12,000 | 76,302 | 88,302 | 23,929 | 152,155 | 176,084 | ||||||||||||||||||
Aozora Bank Ltd. | 11,000 | 68,918 | 79,918 | 31,127 | 195,020 | 226,147 | ||||||||||||||||||
Asahi Glass Co., Ltd. | 8,000 | 64,752 | 72,752 | 49,682 | 402,125 | 451,807 | ||||||||||||||||||
Asahi Group Holdings Ltd. | 3,400 | 24,787 | 28,187 | 95,695 | 697,642 | 793,337 | ||||||||||||||||||
Asahi Kasei Corp. | 12,000 | 81,078 | 93,078 | 93,894 | 634,396 | 728,290 | ||||||||||||||||||
Asics Corp. | 1,600 | 10,548 | 12,148 | 27,272 | 179,790 | 207,062 | ||||||||||||||||||
Astellas Pharma, Inc. | 13,400 | 27,330 | 40,730 | 792,726 | 1,616,807 | 2,409,533 | ||||||||||||||||||
Bank of Kyoto Ltd. | 2,000 | 21,082 | 23,082 | 16,675 | 175,767 | 192,442 | ||||||||||||||||||
Bank of Yokohama Ltd. | 10,000 | 73,700 | 83,700 | 55,645 | 410,105 | 465,750 | ||||||||||||||||||
Benesse Holdings, Inc. | 700 | 4,774 | 5,474 | 28,084 | 191,531 | 219,615 | ||||||||||||||||||
Bridgestone Corp. | 5,700 | 41,164 | 46,864 | 215,421 | 1,555,719 | 1,771,140 | ||||||||||||||||||
Brother Industries Ltd. | 2,200 | 14,515 | 16,715 | 30,020 | 198,063 | 228,083 | ||||||||||||||||||
Calbee, Inc. | 800 | 4,400 | 5,200 | 19,409 | 106,751 | 126,160 | ||||||||||||||||||
Canon, Inc. | 16,300 | 72,130 | 88,430 | 515,421 | 2,280,818 | 2,796,239 | ||||||||||||||||||
Casio Computer Co., Ltd. | 2,000 | 14,827 | 16,827 | 24,442 | 181,202 | 205,644 | ||||||||||||||||||
See Notes to Pro-forma Combined Financial Statements.
66
| Multimanager International Equity | EQ/International Core PLUS | Pro-forma Combined | Multimanager International Equity | EQ/International Core PLUS | Pro-forma Combined | |||||||||||||||||||
| Number of Shares | Number of Shares | Number of Shares | Value ($) (Note 1) | Value ($) (Note 1) | Value ($) (Note 1) | |||||||||||||||||||
Central Japan Railway Co. | 1,300 | 9,200 | 10,500 | 152,825 | 1,081,531 | 1,234,356 | ||||||||||||||||||
Chiba Bank Ltd. | 6,000 | 48,672 | 54,672 | 40,395 | 327,684 | 368,079 | ||||||||||||||||||
Chiyoda Corp. | 1,000 | 10,000 | 11,000 | 14,491 | 144,906 | 159,397 | ||||||||||||||||||
Chubu Electric Power Co., Inc. | 5,500 | 41,254 | 46,754 | 70,976 | 532,373 | 603,349 | ||||||||||||||||||
Chugai Pharmaceutical Co., Ltd. | 1,800 | 14,347 | 16,147 | 39,740 | 316,748 | 356,488 | ||||||||||||||||||
Chugoku Bank Ltd. | 1,000 | 9,511 | 10,511 | 12,686 | 120,660 | 133,346 | ||||||||||||||||||
Chugoku Electric Power Co., Inc. | 2,700 | 18,962 | 21,662 | 41,945 | 294,576 | 336,521 | ||||||||||||||||||
Citizen Holdings Co., Ltd. | 2,100 | 17,552 | 19,652 | 17,668 | 147,669 | 165,337 | ||||||||||||||||||
Coca-Cola West Co., Ltd. | 500 | 4,048 | 4,548 | 10,574 | 85,603 | 96,177 | ||||||||||||||||||
Credit Saison Co., Ltd. | 1,500 | 9,816 | 11,316 | 39,398 | 257,820 | 297,218 | ||||||||||||||||||
Dai Nippon Printing Co., Ltd. | 5,000 | 36,162 | 41,162 | 52,986 | 383,219 | 436,205 | ||||||||||||||||||
Daicel Corp. | 3,000 | 17,955 | 20,955 | 24,385 | 145,945 | 170,330 | ||||||||||||||||||
Daido Steel Co., Ltd. | 3,000 | 18,519 | 21,519 | 14,870 | 91,795 | 106,665 | ||||||||||||||||||
Daihatsu Motor Co., Ltd. | 2,000 | 12,200 | 14,200 | 33,843 | 206,442 | 240,285 | ||||||||||||||||||
Dai-ichi Life Insurance Co., Ltd. | 7,600 | 54,500 | 62,100 | 126,799 | 909,282 | 1,036,081 | ||||||||||||||||||
Daiichi Sankyo Co., Ltd. | 5,900 | 43,287 | 49,187 | 107,736 | 790,437 | 898,173 | ||||||||||||||||||
Daikin Industries Ltd. | 8,300 | 15,023 | 23,323 | 516,238 | 934,390 | 1,450,628 | ||||||||||||||||||
Dainippon Sumitomo Pharma Co., Ltd. | 1,500 | 10,592 | 12,092 | 23,431 | 165,453 | 188,884 | ||||||||||||||||||
Daito Trust Construction Co., Ltd. | 600 | 4,638 | 5,238 | 56,006 | 432,927 | 488,933 | ||||||||||||||||||
Daiwa House Industry Co., Ltd. | 5,000 | 36,658 | 41,658 | 96,619 | 708,376 | 804,995 | ||||||||||||||||||
Daiwa Securities Group, Inc. | 14,000 | 106,476 | 120,476 | 139,588 | 1,061,626 | 1,201,214 | ||||||||||||||||||
DeNA Co., Ltd. | 1,000 | 6,500 | 7,500 | 21,005 | 136,530 | 157,535 | ||||||||||||||||||
Denso Corp. | 45,000 | 30,812 | 75,812 | 2,371,570 | 1,623,840 | 3,995,410 | ||||||||||||||||||
Dentsu, Inc. | 1,783 | 13,291 | 15,074 | 72,803 | 542,696 | 615,499 | ||||||||||||||||||
Don Quijote Holdings Co., Ltd. | 400 | 3,300 | 3,700 | 24,195 | 199,611 | 223,806 | ||||||||||||||||||
East Japan Railway Co. | 10,005 | 21,120 | 31,125 | 796,144 | 1,680,615 | 2,476,759 | ||||||||||||||||||
Eisai Co., Ltd. | 2,200 | 16,154 | 18,354 | 85,130 | 625,084 | 710,214 | ||||||||||||||||||
Electric Power Development Co., Ltd. | 800 | 7,603 | 8,403 | 23,284 | 221,282 | 244,566 | ||||||||||||||||||
FamilyMart Co., Ltd. | 500 | 3,604 | 4,104 | 22,814 | 164,440 | 187,254 | ||||||||||||||||||
FANUC Corp. | 4,900 | 12,044 | 16,944 | 895,689 | 2,201,567 | 3,097,256 | ||||||||||||||||||
Fast Retailing Co., Ltd. | 500 | 3,316 | 3,816 | 206,058 | 1,366,579 | 1,572,637 | ||||||||||||||||||
Fuji Electric Co., Ltd. | 6,000 | 37,288 | 43,288 | 28,032 | 174,207 | 202,239 | ||||||||||||||||||
Fuji Heavy Industries Ltd. | 5,200 | 37,480 | 42,680 | 148,875 | 1,073,043 | 1,221,918 | ||||||||||||||||||
Fujifilm Holdings Corp. | 4,000 | 29,768 | 33,768 | 113,228 | 842,640 | 955,868 | ||||||||||||||||||
Fujitsu Ltd.* | 15,000 | 119,742 | 134,742 | 77,485 | 618,551 | 696,036 | ||||||||||||||||||
Fukuoka Financial Group, Inc. | 5,000 | 47,983 | 52,983 | 21,888 | 210,048 | 231,936 | ||||||||||||||||||
Gree, Inc. | 1,100 | 6,500 | 7,600 | 10,853 | 64,130 | 74,983 | ||||||||||||||||||
GungHo Online Entertainment, Inc.* | 2,600 | 21,500 | 24,100 | 18,690 | 154,548 | 173,238 | ||||||||||||||||||
Gunma Bank Ltd. | 4,000 | 22,274 | 26,274 | 22,296 | 124,156 | 146,452 | ||||||||||||||||||
Hachijuni Bank Ltd. | 4,000 | 25,088 | 29,088 | 23,284 | 146,035 | 169,319 | ||||||||||||||||||
Hakuhodo DY Holdings, Inc. | 2,600 | 14,060 | 16,660 | 20,122 | 108,811 | 128,933 | ||||||||||||||||||
Hamamatsu Photonics KK | 700 | 4,400 | 5,100 | 27,951 | 175,691 | 203,642 | ||||||||||||||||||
Hankyu Hanshin Holdings, Inc. | 9,000 | 74,000 | 83,000 | 48,542 | 399,126 | 447,668 | ||||||||||||||||||
Hino Motors Ltd. | 2,000 | 16,830 | 18,830 | 31,374 | 264,013 | 295,387 | ||||||||||||||||||
Hirose Electric Co., Ltd. | 300 | 1,866 | 2,166 | 42,674 | 265,432 | 308,106 | ||||||||||||||||||
Hiroshima Bank Ltd. | 3,000 | 30,000 | 33,000 | 12,392 | 123,920 | 136,312 | ||||||||||||||||||
Hisamitsu Pharmaceutical Co., Inc. | 600 | 3,867 | 4,467 | 30,197 | 194,617 | 224,814 | ||||||||||||||||||
Hitachi Chemical Co., Ltd. | 1,200 | 6,888 | 8,088 | 19,109 | 109,687 | 128,796 | ||||||||||||||||||
Hitachi Construction Machinery Co., Ltd. | 1,000 | 6,451 | 7,451 | 21,318 | 137,522 | 158,840 | ||||||||||||||||||
Hitachi High-Technologies Corp. | 700 | 3,618 | 4,318 | 17,555 | 90,733 | 108,288 | ||||||||||||||||||
Hitachi Ltd. | 188,000 | 305,211 | 493,211 | 1,421,024 | 2,306,979 | 3,728,003 | ||||||||||||||||||
Hitachi Metals Ltd. | 2,000 | 11,386 | 13,386 | 28,221 | 160,665 | 188,886 | ||||||||||||||||||
Hokkaido Electric Power Co., Inc.* | 1,200 | 11,268 | 12,468 | 13,776 | 129,361 | 143,137 | ||||||||||||||||||
Hokuhoku Financial Group, Inc. | 11,000 | 75,000 | 86,000 | 21,935 | 149,558 | 171,493 | ||||||||||||||||||
Hokuriku Electric Power Co. | 1,500 | 10,138 | 11,638 | 20,326 | 137,375 | 157,701 | ||||||||||||||||||
Honda Motor Co., Ltd. | 35,600 | 265,904 | 301,504 | 1,463,755 | 10,933,096 | 12,396,851 | ||||||||||||||||||
Hoya Corp. | 3,800 | 27,902 | 31,702 | 105,437 | 774,187 | 879,624 | ||||||||||||||||||
Hulic Co., Ltd. | 2,000 | 16,400 | 18,400 | 29,532 | 242,161 | 271,693 | ||||||||||||||||||
Ibiden Co., Ltd. | 1,000 | 6,834 | 7,834 | 18,669 | 127,582 | 146,251 | ||||||||||||||||||
Idemitsu Kosan Co., Ltd. | 800 | 5,160 | 5,960 | 18,179 | 117,253 | 135,432 | ||||||||||||||||||
IHI Corp. | 10,000 | 83,834 | 93,834 | 43,111 | 361,415 | 404,526 | ||||||||||||||||||
Iida Group Holdings Co., Ltd.* | 1,000 | 7,500 | 8,500 | 19,960 | 149,701 | 169,661 | ||||||||||||||||||
INPEX Corp. | 7,700 | 266,900 | 274,600 | 98,562 | 3,416,401 | 3,514,963 | ||||||||||||||||||
Isetan Mitsukoshi Holdings Ltd. | 2,900 | 22,748 | 25,648 | 41,169 | 322,935 | 364,104 | ||||||||||||||||||
Isuzu Motors Ltd. | 10,000 | 76,138 | 86,138 | 62,102 | 472,835 | 534,937 | ||||||||||||||||||
ITOCHU Corp. | 13,200 | 96,532 | 109,732 | 162,822 | 1,190,723 | 1,353,545 | ||||||||||||||||||
ITOCHU Techno-Solutions Corp. | 300 | 1,734 | 2,034 | 12,150 | 70,226 | 82,376 | ||||||||||||||||||
Iyo Bank Ltd. | 2,000 | 15,578 | 17,578 | 19,580 | 152,511 | 172,091 | ||||||||||||||||||
J. Front Retailing Co., Ltd. | 5,000 | 29,068 | 34,068 | 37,793 | 219,714 | 257,507 | ||||||||||||||||||
Japan Airlines Co., Ltd. | 564 | 4,015 | 4,579 | 27,796 | 197,872 | 225,668 | ||||||||||||||||||
Japan Exchange Group, Inc. | 45,800 | 16,000 | 61,800 | 1,299,935 | 454,126 | 1,754,061 | ||||||||||||||||||
Japan Petroleum Exploration Co. | 100 | 1,910 | 2,010 | 3,784 | 72,276 | 76,060 | ||||||||||||||||||
Japan Prime Realty Investment Corp. (REIT) | 8 | 48 | 56 | 25,601 | 153,604 | 179,205 | ||||||||||||||||||
Japan Real Estate Investment Corp. (REIT) | 10 | 76 | 86 | 53,556 | 407,027 | 460,583 | ||||||||||||||||||
Japan Retail Fund Investment Corp. (REIT) | 19 | 145 | 164 | 38,646 | 294,929 | 333,575 | ||||||||||||||||||
See Notes to Pro-forma Combined Financial Statements.
67
| Multimanager International Equity | EQ/International Core PLUS | Pro-forma Combined | Multimanager International Equity | EQ/International Core PLUS | Pro-forma Combined | |||||||||||||||||||
| Number of Shares | Number of Shares | Number of Shares | Value ($) (Note 1) | Value ($) (Note 1) | Value ($) (Note 1) | |||||||||||||||||||
Japan Steel Works Ltd. | 3,000 | 18,022 | 21,022 | 16,751 | 100,626 | 117,377 | ||||||||||||||||||
Japan Tobacco, Inc. | 27,300 | 267,100 | 294,400 | 886,582 | 8,674,219 | 9,560,801 | ||||||||||||||||||
JFE Holdings, Inc. | 4,300 | 31,476 | 35,776 | 102,161 | 747,820 | 849,981 | ||||||||||||||||||
JGC Corp. | 2,000 | 13,326 | 15,326 | 78,340 | 521,980 | 600,320 | ||||||||||||||||||
Jin Co., Ltd. | 16,600 | — | 16,600 | 701,453 | — | 701,453 | ||||||||||||||||||
Joyo Bank Ltd. | 6,000 | 43,480 | 49,480 | 30,595 | 221,715 | 252,310 | ||||||||||||||||||
JSR Corp. | 1,800 | 11,418 | 13,218 | 34,800 | 220,749 | 255,549 | ||||||||||||||||||
JTEKT Corp. | 2,000 | 12,982 | 14,982 | 33,995 | 220,661 | 254,656 | ||||||||||||||||||
JX Holdings, Inc. | 19,644 | 143,978 | 163,622 | 100,915 | 739,646 | 840,561 | ||||||||||||||||||
Kajima Corp. | 8,000 | 51,739 | 59,739 | 30,007 | 194,064 | 224,071 | ||||||||||||||||||
Kakaku.com, Inc. | 1,100 | 8,800 | 9,900 | 19,293 | 154,341 | 173,634 | ||||||||||||||||||
Kamigumi Co., Ltd. | 2,000 | 13,704 | 15,704 | 18,308 | 125,445 | 143,753 | ||||||||||||||||||
Kaneka Corp. | 3,000 | 15,644 | 18,644 | 19,656 | 102,501 | 122,157 | ||||||||||||||||||
Kansai Electric Power Co., Inc.* | 5,900 | 44,723 | 50,623 | 67,734 | 513,438 | 581,172 | ||||||||||||||||||
Kansai Paint Co., Ltd. | 2,000 | 14,452 | 16,452 | 29,532 | 213,397 | 242,929 | ||||||||||||||||||
Kao Corp. | 4,600 | 32,367 | 36,967 | 144,583 | 1,017,328 | 1,161,911 | ||||||||||||||||||
Kawasaki Heavy Industries Ltd. | 13,000 | 90,840 | 103,840 | 54,439 | 380,405 | 434,844 | ||||||||||||||||||
KDDI Corp. | 4,700 | 34,000 | 38,700 | 288,757 | 2,088,880 | 2,377,637 | ||||||||||||||||||
Keikyu Corp. | 4,000 | 29,466 | 33,466 | 32,931 | 242,589 | 275,520 | ||||||||||||||||||
Keio Corp. | 4,000 | 37,347 | 41,347 | 26,626 | 248,602 | 275,228 | ||||||||||||||||||
Keisei Electric Railway Co., Ltd. | 2,000 | 16,955 | 18,955 | 18,365 | 155,688 | 174,053 | ||||||||||||||||||
Keyence Corp. | 430 | 2,853 | 3,283 | 183,743 | 1,219,115 | 1,402,858 | ||||||||||||||||||
Kikkoman Corp. | 1,000 | 10,823 | 11,823 | 18,859 | 204,107 | 222,966 | ||||||||||||||||||
Kinden Corp. | 1,000 | 8,696 | 9,696 | 10,445 | 90,833 | 101,278 | ||||||||||||||||||
Kintetsu Corp. | 16,000 | 110,980 | 126,980 | 56,063 | 388,867 | 444,930 | ||||||||||||||||||
Kirin Holdings Co., Ltd. | 8,000 | 54,991 | 62,991 | 114,937 | 790,062 | 904,999 | ||||||||||||||||||
Kobe Steel Ltd.* | 24,000 | 160,095 | 184,095 | 41,022 | 273,641 | 314,663 | ||||||||||||||||||
Koito Manufacturing Co., Ltd. | 1,000 | 6,000 | 7,000 | 19,058 | 114,348 | 133,406 | ||||||||||||||||||
Komatsu Ltd. | 36,700 | 59,272 | 95,972 | 744,734 | 1,202,775 | 1,947,509 | ||||||||||||||||||
Konami Corp. | 900 | 5,988 | 6,888 | 20,759 | 138,115 | 158,874 | ||||||||||||||||||
Konica Minolta, Inc. | 3,500 | 29,936 | 33,436 | 34,864 | 298,194 | 333,058 | ||||||||||||||||||
Kubota Corp. | 45,500 | 67,508 | 113,008 | 751,348 | 1,114,770 | 1,866,118 | ||||||||||||||||||
Kuraray Co., Ltd. | 3,200 | 22,092 | 25,292 | 38,074 | 262,855 | 300,929 | ||||||||||||||||||
Kurita Water Industries Ltd. | 1,100 | 7,514 | 8,614 | 22,792 | 155,688 | 178,480 | ||||||||||||||||||
Kyocera Corp. | 2,900 | 20,608 | 23,508 | 144,573 | 1,027,367 | 1,171,940 | ||||||||||||||||||
Kyowa Hakko Kirin Co., Ltd. | 2,000 | 13,267 | 15,267 | 22,011 | 146,011 | 168,022 | ||||||||||||||||||
Kyushu Electric Power Co., Inc.* | 3,900 | 27,288 | 31,188 | 49,699 | 347,740 | 397,439 | ||||||||||||||||||
Lawson, Inc. | 600 | 44,880 | 45,480 | 44,839 | 3,353,961 | 3,398,800 | ||||||||||||||||||
LIXIL Group Corp. | 2,100 | 17,023 | 19,123 | 57,490 | 466,027 | 523,517 | ||||||||||||||||||
M3, Inc. | 7 | 46 | 53 | 17,515 | 115,098 | 132,613 | ||||||||||||||||||
Mabuchi Motor Co., Ltd. | 300 | 1,652 | 1,952 | 17,805 | 98,044 | 115,849 | ||||||||||||||||||
Makita Corp. | 7,700 | 7,146 | 14,846 | 403,608 | 374,570 | 778,178 | ||||||||||||||||||
Marubeni Corp. | 14,000 | 105,668 | 119,668 | 100,503 | 758,570 | 859,073 | ||||||||||||||||||
Marui Group Co., Ltd. | 1,900 | 14,886 | 16,786 | 19,269 | 150,966 | 170,235 | ||||||||||||||||||
Maruichi Steel Tube Ltd. | 400 | 3,116 | 3,516 | 10,088 | 78,588 | 88,676 | ||||||||||||||||||
Mazda Motor Corp.* | 24,000 | 170,679 | 194,679 | 123,977 | 881,677 | 1,005,654 | ||||||||||||||||||
McDonald’s Holdings Co. Japan Ltd. | 600 | 4,480 | 5,080 | 15,309 | 114,308 | 129,617 | ||||||||||||||||||
Medipal Holdings Corp. | 1,300 | 8,322 | 9,622 | 17,134 | 109,685 | 126,819 | ||||||||||||||||||
MEIJI Holdings Co., Ltd. | 582 | 3,834 | 4,416 | 37,359 | 246,110 | 283,469 | ||||||||||||||||||
Miraca Holdings, Inc. | 500 | 3,700 | 4,200 | 23,549 | 174,266 | 197,815 | ||||||||||||||||||
Mitsubishi Chemical Holdings Corp. | 11,000 | 86,859 | 97,859 | 50,764 | 400,850 | 451,614 | ||||||||||||||||||
Mitsubishi Corp. | 38,700 | 89,184 | 127,884 | 741,220 | 1,708,139 | 2,449,359 | ||||||||||||||||||
Mitsubishi Electric Corp. | 17,000 | 123,371 | 140,371 | 213,085 | 1,546,384 | 1,759,469 | ||||||||||||||||||
Mitsubishi Estate Co., Ltd. | 11,000 | 79,011 | 90,011 | 328,506 | 2,359,601 | 2,688,107 | ||||||||||||||||||
Mitsubishi Gas Chemical Co., Inc. | 3,000 | 26,711 | 29,711 | 22,049 | 196,319 | 218,368 | ||||||||||||||||||
Mitsubishi Heavy Industries Ltd. | 27,000 | 192,256 | 219,256 | 166,907 | 1,188,478 | 1,355,385 | ||||||||||||||||||
Mitsubishi Logistics Corp. | 1,000 | 7,008 | 8,008 | 15,772 | 110,534 | 126,306 | ||||||||||||||||||
Mitsubishi Materials Corp. | 10,000 | 70,819 | 80,819 | 36,844 | 260,923 | 297,767 | ||||||||||||||||||
Mitsubishi Motors Corp.* | 4,000 | 26,821 | 30,821 | 42,883 | 287,541 | 330,424 | ||||||||||||||||||
Mitsubishi Tanabe Pharma Corp. | 2,200 | 14,290 | 16,490 | 30,626 | 198,928 | 229,554 | ||||||||||||||||||
Mitsubishi UFJ Financial Group, Inc. | 111,600 | 805,816 | 917,416 | 735,451 | 5,310,382 | 6,045,833 | ||||||||||||||||||
Mitsubishi UFJ Lease & Finance Co., Ltd. | 5,600 | 35,900 | 41,500 | 34,299 | 219,879 | 254,178 | ||||||||||||||||||
Mitsui & Co., Ltd. | 15,200 | 110,154 | 125,354 | 211,452 | 1,532,386 | 1,743,838 | ||||||||||||||||||
Mitsui Chemicals, Inc. | 8,000 | 51,288 | 59,288 | 19,295 | 123,703 | 142,998 | ||||||||||||||||||
Mitsui Fudosan Co., Ltd. | 7,000 | 53,427 | 60,427 | 251,591 | 1,920,247 | 2,171,838 | ||||||||||||||||||
Mitsui O.S.K. Lines Ltd. | 8,000 | 68,575 | 76,575 | 36,008 | 308,656 | 344,664 | ||||||||||||||||||
Mizuho Financial Group, Inc. | 201,050 | 1,458,602 | 1,659,652 | 435,281 | 3,157,927 | 3,593,208 | ||||||||||||||||||
MS&AD Insurance Group Holdings, Inc. | 4,438 | 32,498 | 36,936 | 118,925 | 870,851 | 989,776 | ||||||||||||||||||
Murata Manufacturing Co., Ltd. | 1,800 | 12,971 | 14,771 | 159,643 | 1,150,405 | 1,310,048 | ||||||||||||||||||
Nabtesco Corp. | 1,100 | 7,000 | 8,100 | 25,330 | 161,191 | 186,521 | ||||||||||||||||||
Namco Bandai Holdings, Inc. | 1,700 | 11,219 | 12,919 | 37,677 | 248,648 | 286,325 | ||||||||||||||||||
NEC Corp. | 25,000 | 163,742 | 188,742 | 56,262 | 368,501 | 424,763 | ||||||||||||||||||
Nexon Co., Ltd. | 1,300 | 7,200 | 8,500 | 11,999 | 66,455 | 78,454 | ||||||||||||||||||
NGK Insulators Ltd. | 3,000 | 18,267 | 21,267 | 56,918 | 346,572 | 403,490 | ||||||||||||||||||
NGK Spark Plug Co., Ltd. | 2,000 | 10,948 | 12,948 | 47,289 | 258,860 | 306,149 | ||||||||||||||||||
See Notes to Pro-forma Combined Financial Statements.
68
| Multimanager International Equity | EQ/International Core PLUS | Pro-forma Combined | Multimanager International Equity | EQ/International Core PLUS | Pro-forma Combined | |||||||||||||||||||
| Number of Shares | Number of Shares | Number of Shares | Value ($) (Note 1) | Value ($) (Note 1) | Value ($) (Note 1) | |||||||||||||||||||
NHK Spring Co., Ltd. | 1,700 | 9,675 | 11,375 | 19,145 | 108,960 | 128,105 | ||||||||||||||||||
Nidec Corp. | 4,100 | 6,446 | 10,546 | 401,007 | 630,461 | 1,031,468 | ||||||||||||||||||
Nikon Corp. | 2,700 | 21,859 | 24,559 | 51,508 | 417,004 | 468,512 | ||||||||||||||||||
Nintendo Co., Ltd. | 900 | 6,839 | 7,739 | 119,732 | 909,832 | 1,029,564 | ||||||||||||||||||
Nippon Building Fund, Inc. (REIT) | 12 | 86 | 98 | 69,737 | 499,782 | 569,519 | ||||||||||||||||||
Nippon Electric Glass Co., Ltd. | 4,000 | 22,022 | 26,022 | 20,967 | 115,432 | 136,399 | ||||||||||||||||||
Nippon Express Co., Ltd. | 7,000 | 48,427 | 55,427 | 33,833 | 234,065 | 267,898 | ||||||||||||||||||
Nippon Meat Packers, Inc. | 1,000 | 10,075 | 11,075 | 17,149 | 172,780 | 189,929 | ||||||||||||||||||
Nippon Paint Co., Ltd. | 1,000 | 9,000 | 10,000 | 16,608 | 149,473 | 166,081 | ||||||||||||||||||
Nippon Prologis REIT, Inc. (REIT) | 2 | 16 | 18 | 19,105 | 152,844 | 171,949 | ||||||||||||||||||
Nippon Steel & Sumitomo Metal Corp. | 392,595 | 481,698 | 874,293 | 1,312,254 | 1,610,082 | 2,922,336 | ||||||||||||||||||
Nippon Telegraph & Telephone Corp. | 3,292 | 23,587 | 26,879 | 176,932 | 1,267,709 | 1,444,641 | ||||||||||||||||||
Nippon Yusen KK | 13,000 | 101,442 | 114,442 | 41,478 | 323,659 | 365,137 | ||||||||||||||||||
Nishi-Nippon City Bank Ltd. | 6,000 | 44,480 | 50,480 | 16,124 | 119,531 | 135,655 | ||||||||||||||||||
Nissan Motor Co., Ltd. | 21,800 | 158,048 | 179,848 | 182,995 | 1,326,697 | 1,509,692 | ||||||||||||||||||
Nisshin Seifun Group, Inc. | 2,200 | 13,901 | 16,101 | 22,708 | 143,485 | 166,193 | ||||||||||||||||||
Nissin Foods Holdings Co., Ltd. | 500 | 3,506 | 4,006 | 21,081 | 147,817 | 168,898 | ||||||||||||||||||
Nitori Holdings Co., Ltd. | 350 | 2,075 | 2,425 | 33,135 | 196,446 | 229,581 | ||||||||||||||||||
Nitto Denko Corp. | 7,800 | 10,611 | 18,411 | 328,487 | 446,869 | 775,356 | ||||||||||||||||||
NKSJ Holdings, Inc. | 2,823 | 21,104 | 23,927 | 78,382 | 585,966 | 664,348 | ||||||||||||||||||
NOK Corp. | 900 | 5,864 | 6,764 | 14,699 | 95,775 | 110,474 | ||||||||||||||||||
Nomura Holdings, Inc. | 31,800 | 230,908 | 262,708 | 244,290 | 1,773,854 | 2,018,144 | ||||||||||||||||||
Nomura Real Estate Holdings, Inc. | 900 | 7,875 | 8,775 | 20,237 | 177,077 | 197,314 | ||||||||||||||||||
Nomura Real Estate Office Fund, Inc. (REIT) | 3 | 19 | 22 | 13,930 | 88,225 | 102,155 | ||||||||||||||||||
Nomura Research Institute Ltd. | 900 | 6,288 | 7,188 | 28,331 | 197,937 | 226,268 | ||||||||||||||||||
NSK Ltd. | 4,000 | 29,970 | 33,970 | 49,682 | 372,242 | 421,924 | ||||||||||||||||||
NTT Data Corp. | 1,000 | 8,000 | 9,000 | 36,844 | 294,749 | 331,593 | ||||||||||||||||||
NTT DOCOMO, Inc. | 13,600 | 96,800 | 110,400 | 222,771 | 1,585,604 | 1,808,375 | ||||||||||||||||||
NTT Urban Development Corp. | 900 | 6,600 | 7,500 | 10,332 | 75,771 | 86,103 | ||||||||||||||||||
Obayashi Corp. | 5,000 | 40,666 | 45,666 | 28,440 | 231,307 | 259,747 | ||||||||||||||||||
Obic Co., Ltd. | — | 102,400 | 102,400 | — | 3,019,200 | 3,019,200 | ||||||||||||||||||
Odakyu Electric Railway Co., Ltd. | 5,000 | 40,103 | 45,103 | 45,152 | 362,149 | 407,301 | ||||||||||||||||||
Oji Holdings Corp. | 8,000 | 49,612 | 57,612 | 40,946 | 253,925 | 294,871 | ||||||||||||||||||
Olympus Corp.* | 1,900 | 14,952 | 16,852 | 60,080 | 472,796 | 532,876 | ||||||||||||||||||
Omron Corp. | 1,800 | 13,044 | 14,844 | 79,394 | 575,343 | 654,737 | ||||||||||||||||||
Ono Pharmaceutical Co., Ltd. | 800 | 5,275 | 6,075 | 69,965 | 461,331 | 531,296 | ||||||||||||||||||
Oracle Corp. Japan | 300 | 2,540 | 2,840 | 10,953 | 92,739 | 103,692 | ||||||||||||||||||
Oriental Land Co., Ltd. | 400 | 3,186 | 3,586 | 57,620 | 458,946 | 516,566 | ||||||||||||||||||
ORIX Corp. | 10,900 | 79,510 | 90,410 | 191,172 | 1,394,502 | 1,585,674 | ||||||||||||||||||
Osaka Gas Co., Ltd. | 15,000 | 119,868 | 134,868 | 58,826 | 470,093 | 528,919 | ||||||||||||||||||
Otsuka Corp. | 100 | 1,139 | 1,239 | 12,734 | 145,038 | 157,772 | ||||||||||||||||||
Otsuka Holdings Co., Ltd. | 3,200 | 23,200 | 26,400 | 92,375 | 669,718 | 762,093 | ||||||||||||||||||
Panasonic Corp. | 19,300 | 139,186 | 158,486 | 224,321 | 1,617,735 | 1,842,056 | ||||||||||||||||||
Park24 Co., Ltd. | 1,100 | 6,700 | 7,800 | 20,713 | 126,162 | 146,875 | ||||||||||||||||||
Rakuten, Inc. | 127,400 | 46,500 | 173,900 | 1,892,067 | 690,590 | 2,582,657 | ||||||||||||||||||
Resona Holdings, Inc. | 16,357 | 120,902 | 137,259 | 83,253 | 615,359 | 698,612 | ||||||||||||||||||
Ricoh Co., Ltd. | 6,000 | 43,480 | 49,480 | 63,698 | 461,596 | 525,294 | ||||||||||||||||||
Rinnai Corp. | 300 | 2,084 | 2,384 | 23,331 | 162,073 | 185,404 | ||||||||||||||||||
Rohm Co., Ltd. | 900 | 6,126 | 7,026 | 43,757 | 297,836 | 341,593 | ||||||||||||||||||
Sankyo Co., Ltd. | 300 | 3,398 | 3,698 | 13,816 | 156,493 | 170,309 | ||||||||||||||||||
Sanrio Co., Ltd. | 300 | 2,600 | 2,900 | 12,606 | 109,249 | 121,855 | ||||||||||||||||||
Santen Pharmaceutical Co., Ltd. | 700 | 29,931 | 30,631 | 32,604 | 1,394,089 | 1,426,693 | ||||||||||||||||||
SBI Holdings, Inc. | 2,130 | 13,030 | 15,160 | 32,159 | 196,731 | 228,890 | ||||||||||||||||||
Secom Co., Ltd. | 24,500 | 13,427 | 37,927 | 1,474,979 | 808,348 | 2,283,327 | ||||||||||||||||||
Sega Sammy Holdings, Inc. | 1,400 | 11,775 | 13,175 | 35,588 | 299,323 | 334,911 | ||||||||||||||||||
Sekisui Chemical Co., Ltd. | 4,000 | 27,214 | 31,214 | 48,998 | 333,359 | 382,357 | ||||||||||||||||||
Sekisui House Ltd. | 5,000 | 32,970 | 37,970 | 69,794 | 460,221 | 530,015 | ||||||||||||||||||
Seven & I Holdings Co., Ltd. | 6,600 | 47,712 | 54,312 | 261,969 | 1,893,801 | 2,155,770 | ||||||||||||||||||
Seven Bank Ltd. | 5,800 | 36,800 | 42,600 | 22,636 | 143,622 | 166,258 | ||||||||||||||||||
Sharp Corp.* | 13,000 | 88,938 | 101,938 | 41,231 | 282,075 | 323,306 | ||||||||||||||||||
Shikoku Electric Power Co., Inc.* | 1,600 | 11,543 | 13,143 | 23,929 | 172,635 | 196,564 | ||||||||||||||||||
Shimadzu Corp. | 2,000 | 15,140 | 17,140 | 17,377 | 131,546 | 148,923 | ||||||||||||||||||
Shimamura Co., Ltd. | 200 | 1,546 | 1,746 | 18,726 | 144,749 | 163,475 | ||||||||||||||||||
Shimano, Inc. | 600 | 5,036 | 5,636 | 51,448 | 431,821 | 483,269 | ||||||||||||||||||
Shimizu Corp. | 5,000 | 38,910 | 43,910 | 25,211 | 196,194 | 221,405 | ||||||||||||||||||
Shin-Etsu Chemical Co., Ltd. | 12,500 | 26,064 | 38,564 | 728,801 | 1,519,637 | 2,248,438 | ||||||||||||||||||
Shinsei Bank Ltd. | 12,000 | 107,173 | 119,173 | 29,285 | 261,546 | 290,831 | ||||||||||||||||||
Shionogi & Co., Ltd. | 2,400 | 19,207 | 21,607 | 51,961 | 415,839 | 467,800 | ||||||||||||||||||
Shiseido Co., Ltd. | 3,400 | 23,022 | 26,422 | 54,595 | 369,672 | 424,267 | ||||||||||||||||||
Shizuoka Bank Ltd. | 5,000 | 36,724 | 41,724 | 53,271 | 391,267 | 444,538 | ||||||||||||||||||
Showa Denko KK | 13,000 | 97,382 | 110,382 | 18,393 | 137,783 | 156,176 | ||||||||||||||||||
Showa Shell Sekiyu KK | 1,500 | 12,475 | 13,975 | 15,212 | 126,515 | 141,727 | ||||||||||||||||||
SMC Corp. | 2,900 | 3,248 | 6,148 | 729,750 | 817,320 | 1,547,070 | ||||||||||||||||||
SoftBank Corp. | 8,400 | 87,372 | 95,772 | 733,833 | 7,632,916 | 8,366,749 | ||||||||||||||||||
Sojitz Corp. | 11,200 | 75,442 | 86,642 | 19,888 | 133,963 | 153,851 | ||||||||||||||||||
See Notes to Pro-forma Combined Financial Statements.
69
| Multimanager International Equity | EQ/International Core PLUS | Pro-forma Combined | Multimanager International Equity | EQ/International Core PLUS | Pro-forma Combined | |||||||||||||||||||
| Number of Shares | Number of Shares | Number of Shares | Value ($) (Note 1) | Value ($) (Note 1) | Value ($) (Note 1) | |||||||||||||||||||
Sony Corp. | 8,900 | 64,564 | 73,464 | 154,320 | 1,119,494 | 1,273,814 | ||||||||||||||||||
Sony Financial Holdings, Inc. | 1,200 | 10,900 | 12,100 | 21,810 | 198,107 | 219,917 | ||||||||||||||||||
Stanley Electric Co., Ltd. | 1,300 | 8,784 | 10,084 | 29,726 | 200,853 | 230,579 | ||||||||||||||||||
Start Today Co., Ltd. | 45,400 | — | 45,400 | 1,125,623 | — | 1,125,623 | ||||||||||||||||||
Sumco Corp. | 1,000 | 7,652 | 8,652 | 8,812 | 67,430 | 76,242 | ||||||||||||||||||
Sumitomo Chemical Co., Ltd. | 14,000 | 95,158 | 109,158 | 54,772 | 372,283 | 427,055 | ||||||||||||||||||
Sumitomo Corp. | 44,100 | 72,228 | 116,328 | 553,187 | 906,022 | 1,459,209 | ||||||||||||||||||
Sumitomo Electric Industries Ltd. | 6,600 | 48,360 | 54,960 | 109,927 | 805,464 | 915,391 | ||||||||||||||||||
Sumitomo Heavy Industries Ltd. | 5,000 | 32,784 | 37,784 | 22,980 | 150,674 | 173,654 | ||||||||||||||||||
Sumitomo Metal Mining Co., Ltd. | 5,000 | 32,784 | 37,784 | 65,378 | 428,673 | 494,051 | ||||||||||||||||||
Sumitomo Mitsui Financial Group, Inc. | 11,184 | 80,468 | 91,652 | 575,608 | 4,141,454 | 4,717,062 | ||||||||||||||||||
Sumitomo Mitsui Trust Holdings, Inc. | 28,070 | 210,268 | 238,338 | 147,667 | 1,106,148 | 1,253,815 | ||||||||||||||||||
Sumitomo Realty & Development Co., Ltd. | 3,000 | 22,526 | 25,526 | 148,989 | 1,118,706 | 1,267,695 | ||||||||||||||||||
Sumitomo Rubber Industries Ltd. | 1,500 | 10,436 | 11,936 | 21,280 | 148,052 | 169,332 | ||||||||||||||||||
Sundrug Co., Ltd. | — | 41,800 | 41,800 | — | 1,867,524 | 1,867,524 | ||||||||||||||||||
Suntory Beverage & Food Ltd. | 1,200 | 7,900 | 9,100 | 38,230 | 251,681 | 289,911 | ||||||||||||||||||
Suruga Bank Ltd. | 2,000 | 11,890 | 13,890 | 35,818 | 212,938 | 248,756 | ||||||||||||||||||
Suzuken Co., Ltd. | 700 | 4,306 | 5,006 | 22,633 | 139,226 | 161,859 | ||||||||||||||||||
Suzuki Motor Corp. | 3,000 | 23,436 | 26,436 | 80,562 | 629,352 | 709,914 | ||||||||||||||||||
Sysmex Corp. | 700 | 4,500 | 5,200 | 41,278 | 265,359 | 306,637 | ||||||||||||||||||
T&D Holdings, Inc. | 4,900 | 37,068 | 41,968 | 68,352 | 517,072 | 585,424 | ||||||||||||||||||
Taiheiyo Cement Corp. | 9,000 | 75,000 | 84,000 | 34,527 | 287,722 | 322,249 | ||||||||||||||||||
Taisei Corp. | 7,000 | 62,183 | 69,183 | 31,773 | 282,247 | 314,020 | ||||||||||||||||||
Taisho Pharmaceutical Holdings Co., Ltd. | 200 | 2,071 | 2,271 | 13,731 | 142,183 | 155,914 | ||||||||||||||||||
Taiyo Nippon Sanso Corp. | 2,000 | 15,392 | 17,392 | 14,206 | 109,327 | 123,533 | ||||||||||||||||||
Takashimaya Co., Ltd. | 2,000 | 15,955 | 17,955 | 19,884 | 158,626 | 178,510 | ||||||||||||||||||
Takeda Pharmaceutical Co., Ltd. | 6,900 | 50,223 | 57,123 | 316,138 | 2,301,073 | 2,617,211 | ||||||||||||||||||
TDK Corp. | 900 | 7,871 | 8,771 | 43,073 | 376,696 | 419,769 | ||||||||||||||||||
Teijin Ltd. | 8,000 | 56,250 | 64,250 | 17,776 | 124,988 | 142,764 | ||||||||||||||||||
Terumo Corp. | 1,300 | 9,750 | 11,050 | 62,587 | 469,400 | 531,987 | ||||||||||||||||||
THK Co., Ltd. | 1,100 | 7,208 | 8,308 | 27,409 | 179,601 | 207,010 | ||||||||||||||||||
Tobu Railway Co., Ltd. | 8,000 | 65,991 | 73,991 | 38,743 | 319,584 | 358,327 | ||||||||||||||||||
Toho Co., Ltd. | 1,100 | 7,546 | 8,646 | 24,160 | 165,738 | 189,898 | ||||||||||||||||||
Toho Gas Co., Ltd. | 4,000 | 24,592 | 28,592 | 19,447 | 119,562 | 139,009 | ||||||||||||||||||
Tohoku Electric Power Co., Inc.* | 4,200 | 28,559 | 32,759 | 47,181 | 320,818 | 367,999 | ||||||||||||||||||
Tokio Marine Holdings, Inc. | 6,100 | 43,915 | 50,015 | 203,604 | 1,465,779 | 1,669,383 | ||||||||||||||||||
Tokyo Electric Power Co., Inc.* | 12,100 | 93,058 | 105,158 | 59,403 | 456,851 | 516,254 | ||||||||||||||||||
Tokyo Electron Ltd. | 1,500 | 10,936 | 12,436 | 82,043 | 598,152 | 680,195 | ||||||||||||||||||
Tokyo Gas Co., Ltd. | 21,000 | 148,711 | 169,711 | 103,295 | 731,481 | 834,776 | ||||||||||||||||||
Tokyo Tatemono Co., Ltd. | 4,000 | 26,000 | 30,000 | 44,364 | 288,368 | 332,732 | ||||||||||||||||||
Tokyu Corp. | 9,000 | 72,011 | 81,011 | 58,200 | 465,668 | 523,868 | ||||||||||||||||||
Tokyu Fudosan Holdings Corp.* | 5,000 | 32,292 | 37,292 | 47,004 | 303,571 | 350,575 | ||||||||||||||||||
TonenGeneral Sekiyu KK | 2,000 | 18,830 | 20,830 | 18,327 | 172,547 | 190,874 | ||||||||||||||||||
Toppan Printing Co., Ltd. | 4,000 | 37,910 | 41,910 | 31,944 | 302,747 | 334,691 | ||||||||||||||||||
Toray Industries, Inc. | 12,000 | 91,774 | 103,774 | 82,955 | 634,427 | 717,382 | ||||||||||||||||||
Toshiba Corp. | 35,000 | 257,683 | 292,683 | 146,900 | 1,081,530 | 1,228,430 | ||||||||||||||||||
TOTO Ltd. | 2,000 | 19,267 | 21,267 | 31,659 | 304,986 | 336,645 | ||||||||||||||||||
Toyo Seikan Kaisha Ltd. | 1,400 | 10,304 | 11,704 | 30,031 | 221,031 | 251,062 | ||||||||||||||||||
Toyo Suisan Kaisha Ltd. | 1,000 | 5,756 | 6,756 | 30,007 | 172,718 | 202,725 | ||||||||||||||||||
Toyoda Gosei Co., Ltd. | 700 | 4,442 | 5,142 | 16,265 | 103,215 | 119,480 | ||||||||||||||||||
Toyota Boshoku Corp. | 700 | 4,492 | 5,192 | 8,728 | 56,006 | 64,734 | ||||||||||||||||||
Toyota Industries Corp. | 1,500 | 10,418 | 11,918 | 67,586 | 469,409 | 536,995 | ||||||||||||||||||
Toyota Motor Corp. | 42,300 | 209,336 | 251,636 | 2,578,729 | 12,761,724 | 15,340,453 | ||||||||||||||||||
Toyota Tsusho Corp. | 2,000 | 13,614 | 15,614 | 49,435 | 336,504 | 385,939 | ||||||||||||||||||
Trend Micro, Inc. | 1,000 | 6,582 | 7,582 | 34,944 | 230,004 | 264,948 | ||||||||||||||||||
Tsumura & Co. | 300 | 3,904 | 4,204 | 7,942 | 103,355 | 111,297 | ||||||||||||||||||
Ube Industries Ltd. | 9,000 | 60,123 | 69,123 | 19,229 | 128,456 | 147,685 | ||||||||||||||||||
Unicharm Corp. | 1,000 | 48,794 | 49,794 | 56,975 | 2,780,021 | 2,836,996 | ||||||||||||||||||
United Urban Investment Corp. (REIT) | 22 | 146 | 168 | 31,608 | 209,760 | 241,368 | ||||||||||||||||||
USS Co., Ltd. | 2,000 | 13,610 | 15,610 | 27,424 | 186,619 | 214,043 | ||||||||||||||||||
West Japan Railway Co. | 1,400 | 10,800 | 12,200 | 60,621 | 467,648 | 528,269 | ||||||||||||||||||
Yahoo! Japan Corp. | 55,100 | 688,600 | 743,700 | 306,082 | 3,825,192 | 4,131,274 | ||||||||||||||||||
Yakult Honsha Co., Ltd. | 800 | 5,507 | 6,307 | 40,338 | 277,677 | 318,015 | ||||||||||||||||||
Yamada Denki Co., Ltd. | 8,800 | 59,420 | 68,220 | 28,746 | 194,098 | 222,844 | ||||||||||||||||||
Yamaguchi Financial Group, Inc. | 1,000 | 14,763 | 15,763 | 9,249 | 136,541 | 145,790 | ||||||||||||||||||
Yamaha Corp. | 1,300 | 10,479 | 11,779 | 20,603 | 166,076 | 186,679 | ||||||||||||||||||
Yamaha Motor Co., Ltd. | 2,100 | 17,532 | 19,632 | 31,447 | 262,539 | 293,986 | ||||||||||||||||||
Yamato Holdings Co., Ltd. | 3,200 | 23,036 | 26,236 | 64,602 | 465,051 | 529,653 | ||||||||||||||||||
Yamato Kogyo Co., Ltd. | 200 | 2,754 | 2,954 | 6,381 | 87,869 | 94,250 | ||||||||||||||||||
Yamazaki Baking Co., Ltd. | 1,000 | 5,571 | 6,571 | 10,246 | 57,080 | 67,326 | ||||||||||||||||||
Yaskawa Electric Corp. | 2,000 | 14,140 | 16,140 | 31,583 | 223,291 | 254,874 | ||||||||||||||||||
Yokogawa Electric Corp. | 1,600 | 13,703 | 15,303 | 24,537 | 210,145 | 234,682 | ||||||||||||||||||
Yokohama Rubber Co., Ltd. | 1,000 | 13,000 | 14,000 | 9,809 | 127,519 | 137,328 | ||||||||||||||||||
|
|
|
|
|
| |||||||||||||||||||
| 44,023,515 | 211,113,924 | 255,137,439 | ||||||||||||||||||||||
|
|
|
|
|
| |||||||||||||||||||
See Notes to Pro-forma Combined Financial Statements.
70
| Multimanager International Equity | EQ/ International Core PLUS | Pro-forma Combined | Multimanager International Equity | EQ/ International Core PLUS | Pro-forma Combined | |||||||||||||||||||
| Number of Shares | Number of Shares | Number of Shares | Value ($) (Note 1) | Value ($) (Note 1) | Value ($) (Note 1) | |||||||||||||||||||
Luxembourg (0.6%) | ||||||||||||||||||||||||
ArcelorMittal S.A. | 8,741 | 63,901 | 72,642 | 155,964 | 1,140,175 | 1,296,139 | ||||||||||||||||||
Millicom International Cellular S.A. (SDR) | 607 | 4,044 | 4,651 | 60,447 | 402,712 | 463,159 | ||||||||||||||||||
RTL Gorup S.A. | 304 | 2,190 | 2,494 | 39,283 | 282,991 | 322,274 | ||||||||||||||||||
SES S.A. (FDR) | 2,617 | 19,477 | 22,094 | 84,713 | 630,475 | 715,188 | ||||||||||||||||||
Tenaris S.A. | 4,130 | 30,269 | 34,399 | 90,224 | 661,260 | 751,484 | ||||||||||||||||||
Tenaris S.A. (ADR) | — | 246,195 | 246,195 | — | 10,756,259 | 10,756,259 | ||||||||||||||||||
|
|
|
|
|
| |||||||||||||||||||
| 430,631 | 13,873,872 | 14,304,503 | ||||||||||||||||||||||
|
|
|
|
|
| |||||||||||||||||||
Macau (0.3%) | ||||||||||||||||||||||||
MGM China Holdings Ltd. | 8,400 | 64,800 | 73,200 | 35,856 | 276,605 | 312,461 | ||||||||||||||||||
Sands China Ltd. | 270,133 | 431,719 | 701,852 | 2,206,895 | 3,526,998 | 5,733,893 | ||||||||||||||||||
Wynn Macau Ltd. | 14,400 | 99,200 | 113,600 | 65,275 | 449,670 | 514,945 | ||||||||||||||||||
|
|
|
|
|
| |||||||||||||||||||
| 2,308,026 | 4,253,273 | 6,561,299 | ||||||||||||||||||||||
|
|
|
|
|
| |||||||||||||||||||
Mexico (0.0%) | ||||||||||||||||||||||||
Fresnillo plc | 1,678 | 11,493 | 13,171 | 20,715 | 141,882 | 162,597 | ||||||||||||||||||
|
|
|
|
|
| |||||||||||||||||||
Netherlands (3.1%) | ||||||||||||||||||||||||
Aegon N.V. | 15,560 | 113,767 | 129,327 | 146,887 | 1,073,967 | 1,220,854 | ||||||||||||||||||
Akzo Nobel N.V. | 8,323 | 44,572 | 52,895 | 645,090 | 3,454,639 | 4,099,729 | ||||||||||||||||||
ASML Holding N.V. | 31,773 | 22,729 | 54,502 | 2,974,036 | 2,127,494 | 5,101,530 | ||||||||||||||||||
Core Laboratories N.V. | 15,565 | 51,400 | 66,965 | 2,972,137 | 9,814,830 | 12,786,967 | ||||||||||||||||||
Corio N.V. (REIT) | 641 | 4,400 | 5,041 | 28,725 | 197,179 | 225,904 | ||||||||||||||||||
Delta Lloyd N.V. | 1,755 | 11,498 | 13,253 | 43,555 | 285,353 | 328,908 | ||||||||||||||||||
Fugro N.V. (CVA) | 553 | 4,383 | 4,936 | 32,952 | 261,176 | 294,128 | ||||||||||||||||||
Gemalto N.V. | 681 | 5,078 | 5,759 | 74,958 | 558,934 | 633,892 | ||||||||||||||||||
Heineken Holding N.V. | 826 | 6,462 | 7,288 | 52,254 | 408,796 | 461,050 | ||||||||||||||||||
Heineken N.V. | 2,016 | 55,524 | 57,540 | 136,119 | 3,748,945 | 3,885,064 | ||||||||||||||||||
ING Groep N.V. (CVA)* | 71,273 | 243,902 | 315,175 | 990,308 | 3,388,913 | 4,379,221 | ||||||||||||||||||
Koninklijke (Royal) KPN N.V.* | 27,836 | 205,282 | 233,118 | 89,723 | 661,678 | 751,401 | ||||||||||||||||||
Koninklijke Ahold N.V. | 8,820 | 63,167 | 71,987 | 158,344 | 1,134,030 | 1,292,374 | ||||||||||||||||||
Koninklijke Boskalis Westminster N.V. | 557 | 4,874 | 5,431 | 29,428 | 257,512 | 286,940 | ||||||||||||||||||
Koninklijke DSM N.V. | 1,349 | 9,885 | 11,234 | 106,079 | 777,307 | 883,386 | ||||||||||||||||||
Koninklijke Philips N.V. | 8,379 | 61,550 | 69,929 | 307,137 | 2,256,148 | 2,563,285 | ||||||||||||||||||
Koninklijke Vopak N.V. | 671 | 4,507 | 5,178 | 39,250 | 263,636 | 302,886 | ||||||||||||||||||
OCI* | 879 | 5,777 | 6,656 | 39,585 | 260,159 | 299,744 | ||||||||||||||||||
QIAGEN N.V.* | 2,217 | 15,156 | 17,373 | 51,651 | 353,097 | 404,748 | ||||||||||||||||||
Randstad Holding N.V. | 1,136 | 7,720 | 8,856 | 73,686 | 500,752 | 574,438 | ||||||||||||||||||
Reed Elsevier N.V. | 6,058 | 44,171 | 50,229 | 128,343 | 935,797 | 1,064,140 | ||||||||||||||||||
Royal Dutch Shell plc (BATS Europe Exchange), Class A | 61,321 | — | 61,321 | 2,185,328 | — | 2,185,328 | ||||||||||||||||||
Royal Dutch Shell plc , Class A | 33,260 | 240,828 | 274,088 | 1,191,313 | 8,626,025 | 9,817,338 | ||||||||||||||||||
Royal Dutch Shell plc, Class B | 22,041 | 159,217 | 181,258 | 832,173 | 6,011,343 | 6,843,516 | ||||||||||||||||||
Sensata Technologies Holding N.V.* | 32,255 | — | 32,255 | 1,250,526 | — | 1,250,526 | ||||||||||||||||||
TNT Express N.V. | 3,305 | 22,881 | 26,186 | 30,681 | 212,409 | 243,090 | ||||||||||||||||||
Unilever N.V. (N.Y. Shares) | — | 61,315 | 61,315 | — | 2,466,703 | 2,466,703 | ||||||||||||||||||
Unilever N.V. (CVA) | 14,264 | 102,762 | 117,026 | 574,463 | 4,138,598 | 4,713,061 | ||||||||||||||||||
Wolters Kluwer N.V. | 2,563 | 19,351 | 21,914 | 73,145 | 552,256 | 625,401 | ||||||||||||||||||
Yandex N.V., Class A* | 39,355 | — | 39,355 | 1,698,168 | — | 1,698,168 | ||||||||||||||||||
Ziggo N.V. | 1,310 | 9,588 | 10,898 | 59,832 | 437,915 | 497,747 | ||||||||||||||||||
|
|
|
|
|
| |||||||||||||||||||
| 17,015,876 | 55,165,591 | 72,181,467 | ||||||||||||||||||||||
|
|
|
|
|
| |||||||||||||||||||
New Zealand (0.0%) | ||||||||||||||||||||||||
Auckland International Airport Ltd. | 10,172 | 64,786 | 74,958 | 29,530 | 188,078 | 217,608 | ||||||||||||||||||
Contact Energy Ltd. | 3,894 | 24,133 | 28,027 | 16,428 | 101,815 | 118,243 | ||||||||||||||||||
Fletcher Building Ltd. | 6,502 | 43,852 | 50,354 | 45,505 | 306,904 | 352,409 | ||||||||||||||||||
Ryman Healthcare Ltd. | 2,579 | 19,057 | 21,636 | 16,650 | 123,029 | 139,679 | ||||||||||||||||||
Telecom Corp. of New Zealand Ltd. | 17,025 | 116,409 | 133,434 | 32,273 | 220,669 | 252,942 | ||||||||||||||||||
|
|
|
|
|
| |||||||||||||||||||
| 140,386 | 940,495 | 1,080,881 | ||||||||||||||||||||||
|
|
|
|
|
| |||||||||||||||||||
Norway (0.4%) | ||||||||||||||||||||||||
Aker Solutions ASA | 1,572 | 10,260 | 11,832 | 28,095 | 183,368 | 211,463 | ||||||||||||||||||
DNB ASA | 108,401 | 62,644 | 171,045 | 1,939,147 | 1,120,616 | 3,059,763 | ||||||||||||||||||
Gjensidige Forsikring ASA | 1,904 | 12,461 | 14,365 | 36,320 | 237,703 | 274,023 | ||||||||||||||||||
Norsk Hydro ASA | 155,666 | 79,572 | 235,238 | 694,752 | 355,137 | 1,049,889 | ||||||||||||||||||
Orkla ASA | 6,116 | 48,985 | 55,101 | 47,716 | 382,169 | 429,885 | ||||||||||||||||||
Statoil ASA | 9,768 | 69,782 | 79,550 | 236,739 | 1,691,253 | 1,927,992 | ||||||||||||||||||
Statoil ASA (ADR) | 45,787 | — | 45,787 | 1,104,840 | — | 1,104,840 | ||||||||||||||||||
Telenor ASA | 6,142 | 43,797 | 49,939 | 146,429 | 1,044,144 | 1,190,573 | ||||||||||||||||||
Yara International ASA | 1,565 | 11,841 | 13,406 | 67,345 | 509,538 | 576,883 | ||||||||||||||||||
Yara International ASA (ADR) | — | 5,000 | 5,000 | — | 214,650 | 214,650 | ||||||||||||||||||
|
|
|
|
|
| |||||||||||||||||||
| 4,301,383 | 5,738,578 | 10,039,961 | ||||||||||||||||||||||
|
|
|
|
|
| |||||||||||||||||||
Panama (0.2%) | ||||||||||||||||||||||||
Copa Holdings S.A., Class A | 5,809 | 27,125 | 32,934 | 930,079 | 4,342,984 | 5,273,063 | ||||||||||||||||||
|
|
|
|
|
| |||||||||||||||||||
Peru (0.2%) | ||||||||||||||||||||||||
Credicorp Ltd. | — | 26,852 | 26,852 | — | 3,564,066 | 3,564,066 | ||||||||||||||||||
|
|
|
|
|
| |||||||||||||||||||
Portugal (0.2%) | ||||||||||||||||||||||||
Banco Espirito Santo S.A. (Registered)* | 16,313 | 113,889 | 130,202 | 23,317 | 162,787 | 186,104 | ||||||||||||||||||
See Notes to Pro-forma Combined Financial Statements.
71
| Multimanager International Equity | EQ/ International Core PLUS | Pro-forma Combined | Multimanager International Equity | EQ/ International Core PLUS | Pro-forma Combined | |||||||||||||||||||
| Number of Shares | Number of Shares | Number of Shares | Value ($) (Note 1) | Value ($) (Note 1) | Value ($) (Note 1) | |||||||||||||||||||
EDP - Energias de Portugal S.A. | 18,569 | 129,130 | 147,699 | 68,206 | 474,310 | 542,516 | ||||||||||||||||||
Galp Energia SGPS S.A., Class B | 2,763 | 21,762 | 24,525 | 45,290 | 356,711 | 402,001 | ||||||||||||||||||
Jeronimo Martins SGPS S.A. | 80,378 | 70,572 | 150,950 | 1,571,838 | 1,380,076 | 2,951,914 | ||||||||||||||||||
Portugal Telecom SGPS S.A. (Registered) | 6,319 | 40,099 | 46,418 | 27,470 | 174,319 | 201,789 | ||||||||||||||||||
|
|
|
|
|
| |||||||||||||||||||
| 1,736,121 | 2,548,203 | 4,284,324 | ||||||||||||||||||||||
|
|
|
|
|
| |||||||||||||||||||
Russia (0.1%) | ||||||||||||||||||||||||
Magnit OJSC (GDR)§(b) | 9,285 | — | 9,285 | 522,175 | — | 522,175 | ||||||||||||||||||
Sberbank of Russia (ADR) | — | 140,550 | 140,550 | — | 1,766,714 | 1,766,714 | ||||||||||||||||||
|
|
|
|
|
| |||||||||||||||||||
| 522,175 | 1,766,714 | 2,288,889 | ||||||||||||||||||||||
|
|
|
|
|
| |||||||||||||||||||
Singapore (0.6%) | ||||||||||||||||||||||||
Ascendas Real Estate Investment Trust (REIT) | 19,000 | 131,522 | 150,522 | 33,123 | 229,287 | 262,410 | ||||||||||||||||||
CapitaCommercial Trust (REIT) | 19,000 | 124,000 | 143,000 | 21,831 | 142,478 | 164,309 | ||||||||||||||||||
CapitaLand Ltd. | 21,000 | 163,502 | 184,502 | 50,422 | 392,576 | 442,998 | ||||||||||||||||||
CapitaMall Trust (REIT) | 24,000 | 151,267 | 175,267 | 36,230 | 228,348 | 264,578 | ||||||||||||||||||
CapitaMalls Asia Ltd. | 13,032 | 80,421 | 93,453 | 20,241 | 124,906 | 145,147 | ||||||||||||||||||
City Developments Ltd. | 4,000 | 26,280 | 30,280 | 30,429 | 199,919 | 230,348 | ||||||||||||||||||
ComfortDelGro Corp., Ltd. | 18,000 | 128,550 | 146,550 | 28,670 | 204,751 | 233,421 | ||||||||||||||||||
DBS Group Holdings Ltd. | 15,000 | 108,860 | 123,860 | 203,257 | 1,475,103 | 1,678,360 | ||||||||||||||||||
Genting Singapore plc | 50,677 | 392,261 | 442,938 | 60,036 | 464,702 | 524,738 | ||||||||||||||||||
Global Logistic Properties Ltd. | 25,000 | 197,000 | 222,000 | 57,253 | 451,151 | 508,404 | ||||||||||||||||||
Golden Agri-Resources Ltd. | 67,576 | 466,537 | 534,113 | 29,184 | 201,484 | 230,668 | ||||||||||||||||||
Hutchison Port Holdings Trust, Class U | 48,000 | 335,000 | 383,000 | 32,400 | 226,125 | 258,525 | ||||||||||||||||||
Jardine Cycle & Carriage Ltd. | 1,000 | 6,449 | 7,449 | 28,488 | 183,717 | 212,205 | ||||||||||||||||||
Keppel Corp., Ltd. | 12,800 | 91,685 | 104,485 | 113,501 | 812,992 | 926,493 | ||||||||||||||||||
Keppel Land Ltd. | 6,000 | 44,000 | 50,000 | 15,880 | 116,455 | 132,335 | ||||||||||||||||||
Olam International Ltd. | 14,962 | 94,924 | 109,886 | 18,199 | 115,463 | 133,662 | ||||||||||||||||||
Oversea-Chinese Banking Corp., Ltd. | 22,525 | 163,922 | 186,447 | 182,064 | 1,324,937 | 1,507,001 | ||||||||||||||||||
Sembcorp Industries Ltd. | 8,000 | 62,812 | 70,812 | 34,803 | 273,258 | 308,061 | ||||||||||||||||||
Sembcorp Marine Ltd. | 8,000 | 51,626 | 59,626 | 28,210 | 182,048 | 210,258 | ||||||||||||||||||
Singapore Airlines Ltd. | 5,000 | 34,682 | 39,682 | 41,246 | 286,097 | 327,343 | ||||||||||||||||||
Singapore Exchange Ltd. | 8,000 | 64,302 | 72,302 | 46,024 | 369,929 | 415,953 | ||||||||||||||||||
Singapore Press Holdings Ltd. | 12,000 | 67,523 | 79,523 | 39,177 | 220,448 | 259,625 | ||||||||||||||||||
Singapore Technologies Engineering Ltd. | 13,000 | 99,019 | 112,019 | 40,794 | 310,722 | 351,516 | ||||||||||||||||||
Singapore Telecommunications Ltd. | 70,000 | 506,119 | 576,119 | 203,019 | 1,467,883 | 1,670,902 | ||||||||||||||||||
StarHub Ltd. | 6,000 | 39,724 | 45,724 | 20,397 | 135,042 | 155,439 | ||||||||||||||||||
United Overseas Bank Ltd. | 11,000 | 80,826 | 91,826 | 185,142 | 1,360,390 | 1,545,532 | ||||||||||||||||||
UOL Group Ltd. | 4,000 | 27,532 | 31,532 | 19,620 | 135,047 | 154,667 | ||||||||||||||||||
Wilmar International Ltd. | 15,000 | 123,455 | 138,455 | 40,651 | 334,574 | 375,225 | ||||||||||||||||||
|
|
|
|
|
| |||||||||||||||||||
| 1,660,291 | 11,969,832 | 13,630,123 | ||||||||||||||||||||||
|
|
|
|
|
| |||||||||||||||||||
South Africa (0.1%) | ||||||||||||||||||||||||
Naspers Ltd., Class N | 17,056 | — | 17,056 | 1,782,035 | — | 1,782,035 | ||||||||||||||||||
|
|
|
|
|
| |||||||||||||||||||
South Korea (0.4%) | ||||||||||||||||||||||||
Hyundai Mobis* | 5,496 | — | 5,496 | 1,528,475 | — | 1,528,475 | ||||||||||||||||||
NAVER Corp.* | — | 2,877 | 2,877 | — | 1,973,704 | 1,973,704 | ||||||||||||||||||
POSCO | 3,052 | — | 3,052 | 944,216 | — | 944,216 | ||||||||||||||||||
Samsung Electronics Co., Ltd. | 1,125 | 2,511 | 3,636 | 1,462,548 | 3,264,407 | 4,726,955 | ||||||||||||||||||
|
|
|
|
|
| |||||||||||||||||||
| 3,935,239 | 5,238,111 | 9,173,350 | ||||||||||||||||||||||
|
|
|
|
|
| |||||||||||||||||||
Spain (1.6%) | ||||||||||||||||||||||||
Abertis Infraestructuras S.A. | 3,243 | 24,678 | 27,921 | 72,052 | 548,285 | 620,337 | ||||||||||||||||||
ACS Actividades de Construccion y Servicios S.A. | 1,214 | 9,392 | 10,606 | 41,786 | 323,273 | 365,059 | ||||||||||||||||||
Amadeus IT Holding S.A., Class A | 45,274 | 47,909 | 93,183 | 1,937,326 | 2,050,081 | 3,987,407 | ||||||||||||||||||
Banco Bilbao Vizcaya Argentaria S.A. | 50,254 | 365,519 | 415,773 | 618,615 | 4,499,453 | 5,118,068 | ||||||||||||||||||
Banco de Sabadell S.A. | 29,468 | 213,310 | 242,778 | 76,862 | 556,382 | 633,244 | ||||||||||||||||||
Banco Popular Espanol S.A.* | 12,113 | 80,366 | 92,479 | 73,071 | 484,803 | 557,874 | ||||||||||||||||||
Banco Santander S.A. | 99,904 | 720,675 | 820,579 | 894,171 | 6,450,261 | 7,344,432 | ||||||||||||||||||
Bankia S.A.* | 38,520 | 256,647 | 295,167 | 65,392 | 435,687 | 501,079 | ||||||||||||||||||
CaixaBank S.A. | 14,477 | 108,119 | 122,596 | 75,442 | 563,424 | 638,866 | ||||||||||||||||||
Distribuidora Internacional de Alimentacion S.A. | 5,733 | 39,166 | 44,899 | 51,265 | 350,224 | 401,489 | ||||||||||||||||||
Enagas S.A. | 1,867 | 12,242 | 14,109 | 48,787 | 319,901 | 368,688 | ||||||||||||||||||
Ferrovial S.A. | 3,386 | 25,860 | 29,246 | 65,516 | 500,371 | 565,887 | ||||||||||||||||||
Gas Natural SDG S.A. | 2,942 | 22,451 | 25,393 | 75,664 | 577,411 | 653,075 | ||||||||||||||||||
Grifols S.A. | 1,197 | 9,560 | 10,757 | 57,248 | 457,219 | 514,467 | ||||||||||||||||||
Iberdrola S.A. | 41,587 | 295,650 | 337,237 | 265,174 | 1,885,174 | 2,150,348 | ||||||||||||||||||
Inditex S.A. | 1,910 | 32,927 | 34,837 | 314,785 | 5,426,661 | 5,741,446 | ||||||||||||||||||
Mapfre S.A. | 7,424 | 63,293 | 70,717 | 31,794 | 271,056 | 302,850 | ||||||||||||||||||
Red Electrica Corporacion S.A. | 883 | 6,937 | 7,820 | 58,915 | 462,847 | 521,762 | ||||||||||||||||||
Repsol S.A. | 7,487 | 53,356 | 60,843 | 188,694 | 1,344,722 | 1,533,416 | ||||||||||||||||||
Telefonica S.A. | 35,864 | 259,551 | 295,415 | 583,917 | 4,225,856 | 4,809,773 | ||||||||||||||||||
Zardoya Otis S.A. | 1,497 | 10,680 | 12,177 | 27,081 | 193,206 | 220,287 | ||||||||||||||||||
|
|
|
|
|
| |||||||||||||||||||
| 5,623,557 | 31,926,297 | 37,549,854 | ||||||||||||||||||||||
|
|
|
|
|
| |||||||||||||||||||
Sweden (1.5%) | ||||||||||||||||||||||||
Alfa Laval AB | 2,635 | 20,012 | 22,647 | 67,597 | 513,380 | 580,977 | ||||||||||||||||||
Assa Abloy AB, Class B | 2,923 | 21,416 | 24,339 | 154,425 | 1,131,425 | 1,285,850 | ||||||||||||||||||
Atlas Copco AB, Class A | 15,262 | 41,633 | 56,895 | 423,084 | 1,154,126 | 1,577,210 | ||||||||||||||||||
See Notes to Pro-forma Combined Financial Statements.
72
| Multimanager International Equity | EQ/ International Core PLUS | Pro-forma Combined | Multimanager International Equity | EQ/ International Core PLUS | Pro-forma Combined | |||||||||||||||||||
| Number of Shares | Number of Shares | Number of Shares | Value ($) (Note 1) | Value ($) (Note 1) | Value ($) (Note 1) | |||||||||||||||||||
Atlas Copco AB, Class B | 3,412 | 25,013 | 28,425 | 86,575 | 634,673 | 721,248 | ||||||||||||||||||
Boliden AB | 2,609 | 17,532 | 20,141 | 39,935 | 268,356 | 308,291 | ||||||||||||||||||
Electrolux AB | 1,981 | 15,420 | 17,401 | 51,898 | 403,969 | 455,867 | ||||||||||||||||||
Elekta AB, Class B | 3,489 | 23,625 | 27,114 | 53,351 | 361,252 | 414,603 | ||||||||||||||||||
Getinge AB, Class B | 53,177 | 12,829 | 66,006 | 1,818,907 | 438,813 | 2,257,720 | ||||||||||||||||||
Hennes & Mauritz AB, Class B | 8,312 | 59,802 | 68,114 | 382,785 | 2,754,006 | 3,136,791 | ||||||||||||||||||
Hexagon AB, Class B | 1,980 | 15,178 | 17,158 | 62,585 | 479,751 | 542,336 | ||||||||||||||||||
Husqvarna AB, Class B | 3,864 | 24,374 | 28,238 | 23,261 | 146,733 | 169,994 | ||||||||||||||||||
Industrivarden AB, Class C | 1,279 | 7,832 | 9,111 | 24,320 | 148,924 | 173,244 | ||||||||||||||||||
Investment AB Kinnevik, Class B | 1,928 | 13,922 | 15,850 | 89,298 | 644,817 | 734,115 | ||||||||||||||||||
Investor AB, Class B | 3,985 | 29,196 | 33,181 | 137,111 | 1,004,544 | 1,141,655 | ||||||||||||||||||
Lundin Petroleum AB* | 2,145 | 14,264 | 16,409 | 41,820 | 278,101 | 319,921 | ||||||||||||||||||
Nordea Bank AB | 26,203 | 187,398 | 213,601 | 353,007 | 2,524,629 | 2,877,636 | ||||||||||||||||||
Sandvik AB | 9,328 | 67,985 | 77,313 | 131,541 | 958,704 | 1,090,245 | ||||||||||||||||||
Scania AB, Class B | 2,667 | 20,512 | 23,179 | 52,205 | 401,511 | 453,716 | ||||||||||||||||||
Securitas AB, Class B | 3,070 | 19,382 | 22,452 | 32,624 | 205,969 | 238,593 | ||||||||||||||||||
Skandinaviska Enskilda Banken AB, Class A | 13,291 | 96,858 | 110,149 | 175,234 | 1,277,013 | 1,452,247 | ||||||||||||||||||
Skanska AB, Class B | 3,200 | 24,355 | 27,555 | 65,375 | 497,562 | 562,937 | ||||||||||||||||||
SKF AB, Class B | 3,431 | 25,132 | 28,563 | 89,991 | 659,183 | 749,174 | ||||||||||||||||||
Svenska Cellulosa AB S.C.A., Class B | 5,106 | 37,271 | 42,377 | 157,185 | 1,147,362 | 1,304,547 | ||||||||||||||||||
Svenska Handelsbanken AB, Class A | 4,366 | 31,853 | 36,219 | 214,504 | 1,564,954 | 1,779,458 | ||||||||||||||||||
Swedbank AB, Class A | 7,925 | 57,751 | 65,676 | 223,019 | 1,625,183 | 1,848,202 | ||||||||||||||||||
Swedish Match AB | 1,733 | 13,205 | 14,938 | 55,693 | 424,368 | 480,061 | ||||||||||||||||||
Tele2 AB, Class B | 3,061 | 20,387 | 23,448 | 34,670 | 230,912 | 265,582 | ||||||||||||||||||
Telefonaktiebolaget LM Ericsson, Class B | 26,644 | 423,625 | 450,269 | 325,187 | 5,170,295 | 5,495,482 | ||||||||||||||||||
TeliaSonera AB | 20,840 | 151,858 | 172,698 | 173,509 | 1,264,332 | 1,437,841 | ||||||||||||||||||
Volvo AB, Class B | 13,247 | 95,427 | 108,674 | 173,933 | 1,252,954 | 1,426,887 | ||||||||||||||||||
|
|
|
|
|
| |||||||||||||||||||
| 5,714,629 | 29,567,801 | 35,282,430 | ||||||||||||||||||||||
|
|
|
|
|
| |||||||||||||||||||
Switzerland (7.6%) | ||||||||||||||||||||||||
ABB Ltd. (Registered)* | 39,961 | 138,908 | 178,869 | 1,051,829 | 3,656,252 | 4,708,081 | ||||||||||||||||||
Actelion Ltd. (Registered)* | 908 | 6,494 | 7,402 | 76,697 | 548,538 | 625,235 | ||||||||||||||||||
Adecco S.A. (Registered)* | 1,149 | 8,492 | 9,641 | 90,936 | 672,087 | 763,023 | ||||||||||||||||||
Aryzta AG* | 830 | 5,591 | 6,421 | 63,642 | 428,703 | 492,345 | ||||||||||||||||||
Baloise Holding AG (Registered) | 438 | 3,026 | 3,464 | 55,778 | 385,352 | 441,130 | ||||||||||||||||||
Barry Callebaut AG (Registered)* | 16 | 117 | 133 | 20,053 | 146,635 | 166,688 | ||||||||||||||||||
Cie Financiere Richemont S.A. (Registered), Class A | 8,735 | 62,682 | 71,417 | 869,534 | 6,239,742 | 7,109,276 | ||||||||||||||||||
Coca-Cola HBC AG (CDI)* | — | 4,506 | 4,506 | — | 131,475 | 131,475 | ||||||||||||||||||
Coca-Cola HBC AG (ADR) | 1,592 | 8,416 | 10,008 | 46,439 | 245,495 | 291,934 | ||||||||||||||||||
Credit Suisse Group AG (Registered)* | 34,009 | 95,558 | 129,567 | 1,039,656 | 2,921,212 | 3,960,868 | ||||||||||||||||||
Credit Suisse Group AG (ADR)* | 29,720 | — | 29,720 | 922,509 | — | 922,509 | ||||||||||||||||||
EMS-Chemie Holding AG (Registered) | 71 | 503 | 574 | 25,231 | 178,747 | 203,978 | ||||||||||||||||||
Geberit AG (Registered)* | 339 | 2,380 | 2,719 | 102,796 | 721,697 | 824,493 | ||||||||||||||||||
Givaudan S.A. (Registered)* | 73 | 533 | 606 | 104,257 | 761,215 | 865,472 | ||||||||||||||||||
Glencore Xstrata plc* | 186,270 | 659,748 | 846,018 | 964,535 | 3,416,278 | 4,380,813 | ||||||||||||||||||
Holcim Ltd. (Registered)* | 5,980 | 14,677 | 20,657 | 447,469 | 1,098,245 | 1,545,714 | ||||||||||||||||||
Julius Baer Group Ltd.* | 1,900 | 72,892 | 74,792 | 91,246 | 3,500,581 | 3,591,827 | ||||||||||||||||||
Kuehne + Nagel International AG (Registered) | 452 | 16,674 | 17,126 | 59,334 | 2,188,807 | 2,248,141 | ||||||||||||||||||
Lindt & Spruengli AG | 8 | 54 | 62 | 36,061 | 243,410 | 279,471 | ||||||||||||||||||
Lindt & Spruengli AG (Registered) | 1 | 7 | 8 | 53,921 | 377,445 | 431,366 | ||||||||||||||||||
Lonza Group AG (Registered)* | 503 | 3,300 | 3,803 | 47,703 | 312,965 | 360,668 | ||||||||||||||||||
Nestle S.A. (Registered) | 44,305 | 397,470 | 441,775 | 3,243,222 | 29,095,668 | 32,338,890 | ||||||||||||||||||
Nestle S.A. (Registered) (ADR) | — | 120,470 | 120,470 | — | 8,865,387 | 8,865,387 | ||||||||||||||||||
Novartis AG (Registered) | 33,348 | 170,353 | 203,701 | 2,661,709 | 13,596,921 | 16,258,630 | ||||||||||||||||||
Novartis AG (ADR) | 17,294 | 112,876 | 130,170 | 1,390,092 | 9,072,973 | 10,463,065 | ||||||||||||||||||
Pargesa Holding S.A | 246 | 1,798 | 2,044 | 19,828 | 144,920 | 164,748 | ||||||||||||||||||
Partners Group Holding AG | 170 | 1,111 | 1,281 | 45,337 | 296,292 | 341,629 | ||||||||||||||||||
Roche Holding AG | 24,583 | 61,596 | 86,179 | 6,867,422 | 17,207,245 | 24,074,667 | ||||||||||||||||||
Schindler Holding AG | 407 | 14,703 | 15,110 | 59,906 | 2,164,121 | 2,224,027 | ||||||||||||||||||
Schindler Holding AG (Registered) | 215 | 1,120 | 1,335 | 31,718 | 165,228 | 196,946 | ||||||||||||||||||
SGS S.A. (Registered) | 124 | 351 | 475 | 285,240 | 807,412 | 1,092,652 | ||||||||||||||||||
Sika AG | 20 | 138 | 158 | 71,095 | 490,553 | 561,648 | ||||||||||||||||||
Sonova Holding AG (Registered)* | 398 | 32,908 | 33,306 | 53,540 | 4,426,837 | 4,480,377 | ||||||||||||||||||
STMicroelectronics N.V. | 5,056 | 40,856 | 45,912 | 40,620 | 328,241 | 368,861 | ||||||||||||||||||
Sulzer AG (Registered) | 182 | 1,527 | 1,709 | 29,359 | 246,326 | 275,685 | ||||||||||||||||||
Swatch Group AG | 3,175 | 1,977 | 5,152 | 2,098,159 | 1,306,476 | 3,404,635 | ||||||||||||||||||
Swatch Group AG (Registered) | 399 | 2,782 | 3,181 | 44,907 | 313,113 | 358,020 | ||||||||||||||||||
Swiss Life Holding AG (Registered)* | 262 | 2,073 | 2,335 | 54,394 | 430,379 | 484,773 | ||||||||||||||||||
Swiss Prime Site AG (Registered)* | 417 | 3,444 | 3,861 | 32,278 | 266,586 | 298,864 | ||||||||||||||||||
Swiss Reinsurance AG* | 3,083 | 22,369 | 25,452 | 283,572 | 2,057,482 | 2,341,054 | ||||||||||||||||||
Swisscom AG (Registered) | 204 | 1,494 | 1,698 | 107,689 | 788,661 | 896,350 | ||||||||||||||||||
Syngenta AG (Registered) | 816 | 5,865 | 6,681 | 324,918 | 2,335,349 | 2,660,267 | ||||||||||||||||||
Syngenta AG (ADR) | — | 18,584 | 18,584 | — | 1,485,605 | 1,485,605 | ||||||||||||||||||
Transocean Ltd. (BATS Europe Exchange) | 3,153 | 22,527 | 25,680 | 153,541 | 1,096,993 | 1,250,534 | ||||||||||||||||||
Transocean Ltd. (New York Exchange) | 21,527 | — | 21,527 | 1,063,864 | — | 1,063,864 | ||||||||||||||||||
UBS AG (Registered)* | 69,735 | 388,093 | 457,828 | 1,322,702 | 7,361,172 | 8,683,874 | ||||||||||||||||||
See Notes to Pro-forma Combined Financial Statements.
73
| Multimanager International Equity | EQ/ International Core PLUS | Pro-forma Combined | Multimanager International Equity | EQ/ International Core PLUS | Pro-forma Combined | |||||||||||||||||||
| Number of Shares | Number of Shares | Number of Shares | Value ($) (Note 1) | Value ($) (Note 1) | Value ($) (Note 1) | |||||||||||||||||||
Weatherford International Ltd.* | — | 817,491 | 817,491 | — | 12,662,936 | 12,662,936 | ||||||||||||||||||
Wolseley plc | 2,321 | 16,996 | 19,317 | 131,639 | 963,950 | 1,095,589 | ||||||||||||||||||
Zurich Insurance Group AG* | 3,288 | 9,368 | 12,656 | 952,803 | 2,714,678 | 3,667,481 | ||||||||||||||||||
|
|
|
|
|
| |||||||||||||||||||
| 27,539,180 | 148,866,385 | 176,405,565 | ||||||||||||||||||||||
|
|
|
|
|
| |||||||||||||||||||
Taiwan (0.4%) | ||||||||||||||||||||||||
Advanced Semiconductor Engineering, Inc. (ADR) | 273,945 | — | 273,945 | 1,314,936 | — | 1,314,936 | ||||||||||||||||||
Taiwan Semiconductor Manufacturing Co., Ltd. (ADR) | 125,954 | 298,851 | 424,805 | 2,196,638 | 5,211,961 | 7,408,599 | ||||||||||||||||||
|
|
|
|
|
| |||||||||||||||||||
| 3,511,574 | 5,211,961 | 8,723,535 | ||||||||||||||||||||||
|
|
|
|
|
| |||||||||||||||||||
Turkey (0.1%) | ||||||||||||||||||||||||
Akbank TAS | 262,087 | — | 262,087 | 817,116 | — | 817,116 | ||||||||||||||||||
Turkiye Garanti Bankasi A/S | 220,407 | — | 220,407 | 713,836 | — | 713,836 | ||||||||||||||||||
|
|
|
|
|
| |||||||||||||||||||
| 1,530,952 | — | 1,530,952 | ||||||||||||||||||||||
|
|
|
|
|
| |||||||||||||||||||
United Kingdom (14.2%) | ||||||||||||||||||||||||
3i Group plc | 8,968 | 62,034 | 71,002 | 57,189 | 395,595 | 452,784 | ||||||||||||||||||
Aberdeen Asset Management plc | 7,881 | 236,093 | 243,974 | 65,253 | 1,954,791 | 2,020,044 | ||||||||||||||||||
Admiral Group plc | 1,837 | 11,871 | 13,708 | 39,850 | 257,517 | 297,367 | ||||||||||||||||||
Aggreko plc | 13,864 | 17,205 | 31,069 | 392,354 | 486,905 | 879,259 | ||||||||||||||||||
AMEC plc | 2,337 | 19,305 | 21,642 | 42,105 | 347,813 | 389,918 | ||||||||||||||||||
Anglo American plc | 12,201 | 88,562 | 100,763 | 266,696 | 1,935,836 | 2,202,532 | ||||||||||||||||||
Antofagasta plc | 3,118 | 25,278 | 28,396 | 42,545 | 344,919 | 387,464 | ||||||||||||||||||
ARM Holdings plc | 51,087 | 88,807 | 139,894 | 929,727 | 1,616,189 | 2,545,916 | ||||||||||||||||||
ARM Holdings plc (ADR) | 53,206 | — | 53,206 | 2,912,496 | — | 2,912,496 | ||||||||||||||||||
Associated British Foods plc | 3,115 | 22,836 | 25,951 | 126,120 | 924,583 | 1,050,703 | ||||||||||||||||||
AstraZeneca plc | 10,964 | 79,592 | 90,556 | 648,980 | 4,711,204 | 5,360,184 | ||||||||||||||||||
Aviva plc | 59,161 | 188,818 | 247,979 | 440,561 | 1,406,091 | 1,846,652 | ||||||||||||||||||
Babcock International Group plc | 2,984 | 23,093 | 26,077 | 66,955 | 518,164 | 585,119 | ||||||||||||||||||
BAE Systems plc | 28,343 | 205,890 | 234,233 | 204,165 | 1,483,104 | 1,687,269 | ||||||||||||||||||
Barclays plc | 311,011 | 974,136 | 1,285,147 | 1,400,593 | 4,386,881 | 5,787,474 | ||||||||||||||||||
Bellway plc | — | 45,695 | 45,695 | — | 1,187,998 | 1,187,998 | ||||||||||||||||||
BG Group plc | 83,681 | 425,832 | 509,513 | 1,797,966 | 9,149,406 | 10,947,372 | ||||||||||||||||||
BHP Billiton plc | 18,494 | 134,628 | 153,122 | 572,384 | 4,166,697 | 4,739,081 | ||||||||||||||||||
BP plc | 165,080 | 1,193,688 | 1,358,768 | 1,334,154 | 9,647,224 | 10,981,378 | ||||||||||||||||||
British American Tobacco plc | 27,403 | 261,134 | 288,537 | 1,469,340 | 14,001,917 | 15,471,257 | ||||||||||||||||||
British Land Co. plc (REIT) | 7,967 | 59,737 | 67,704 | 82,984 | 622,216 | 705,200 | ||||||||||||||||||
British Sky Broadcasting Group plc | 9,068 | 66,594 | 75,662 | 126,736 | 930,732 | 1,057,468 | ||||||||||||||||||
BT Group plc | 68,995 | 501,852 | 570,847 | 433,473 | 3,152,973 | 3,586,446 | ||||||||||||||||||
Bunzl plc | 2,778 | 21,285 | 24,063 | 66,703 | 511,080 | 577,783 | ||||||||||||||||||
Burberry Group plc | 24,324 | 65,498 | 89,822 | 610,635 | 1,644,275 | 2,254,910 | ||||||||||||||||||
Capita plc | 5,752 | 266,441 | 272,193 | 98,870 | 4,579,791 | 4,678,661 | ||||||||||||||||||
Carnival plc | 1,483 | 11,714 | 13,197 | 61,419 | 485,139 | 546,558 | ||||||||||||||||||
Centrica plc | 94,742 | 326,151 | 420,893 | 545,500 | 1,877,892 | 2,423,392 | ||||||||||||||||||
CNH Industrial N.V.* | 8,350 | 57,744 | 66,094 | 95,171 | 658,147 | 753,318 | ||||||||||||||||||
Cobham plc | 9,952 | 68,418 | 78,370 | 45,238 | 311,000 | 356,238 | ||||||||||||||||||
Compass Group plc | 15,930 | 591,913 | 607,843 | 255,351 | 9,488,126 | 9,743,477 | ||||||||||||||||||
Croda International plc | 1,269 | 58,218 | 59,487 | 51,631 | 2,368,698 | 2,420,329 | ||||||||||||||||||
Diageo plc | 72,486 | 663,272 | 735,758 | 2,400,664 | 21,966,906 | 24,367,570 | ||||||||||||||||||
Diageo plc (ADR) | — | 42,038 | 42,038 | — | 5,566,672 | 5,566,672 | ||||||||||||||||||
Direct Line Insurance Group plc | 7,869 | 52,510 | 60,379 | 32,525 | 217,037 | 249,562 | ||||||||||||||||||
Domino’s Pizza Group plc | 146,995 | — | 146,995 | 1,248,726 | — | 1,248,726 | ||||||||||||||||||
easyJet plc | 1,515 | 10,095 | 11,610 | 38,535 | 256,770 | 295,305 | ||||||||||||||||||
Ensco plc, Class A | — | 16,550 | 16,550 | — | 946,329 | 946,329 | ||||||||||||||||||
G4S plc | 13,780 | 90,423 | 104,203 | 59,900 | 393,057 | 452,957 | ||||||||||||||||||
GKN plc | 13,544 | 104,570 | 118,114 | 83,724 | 646,416 | 730,140 | ||||||||||||||||||
GlaxoSmithKline plc | 42,835 | 310,907 | 353,742 | 1,143,079 | 8,296,751 | 9,439,830 | ||||||||||||||||||
Hammerson plc (REIT) | 5,664 | 45,692 | 51,356 | 47,084 | 379,832 | 426,916 | ||||||||||||||||||
Hargreaves Lansdown plc | 46,805 | 13,410 | 60,215 | 1,049,441 | 300,673 | 1,350,114 | ||||||||||||||||||
HSBC Holdings plc (Hong Kong Exchange) | 127,033 | — | 127,033 | 1,378,568 | — | 1,378,568 | ||||||||||||||||||
HSBC Holdings plc | 234,317 | 1,429,576 | 1,663,893 | 2,570,226 | 15,681,038 | 18,251,264 | ||||||||||||||||||
ICAP plc | 5,369 | 34,056 | 39,425 | 40,151 | 254,680 | 294,831 | ||||||||||||||||||
IMI plc | 2,649 | 20,611 | 23,260 | 66,896 | 520,494 | 587,390 | ||||||||||||||||||
Imperial Tobacco Group plc | 21,636 | 61,621 | 83,257 | 837,662 | 2,385,725 | 3,223,387 | ||||||||||||||||||
Inmarsat plc | 4,173 | 28,581 | 32,754 | 52,242 | 357,805 | 410,047 | ||||||||||||||||||
InterContinental Hotels Group plc | 2,283 | 17,230 | 19,513 | 76,102 | 574,350 | 650,452 | ||||||||||||||||||
International Consolidated Airlines Group S.A.* | 7,315 | 61,871 | 69,186 | 48,696 | 411,876 | 460,572 | ||||||||||||||||||
Intertek Group plc | 1,383 | 47,694 | 49,077 | 72,095 | 2,486,255 | 2,558,350 | ||||||||||||||||||
Intu Properties plc (REIT) | 6,621 | 42,550 | 49,171 | 33,978 | 218,358 | 252,336 | ||||||||||||||||||
Invensys plc | 6,044 | 41,513 | 47,557 | 50,894 | 349,560 | 400,454 | ||||||||||||||||||
Investec plc | 5,540 | 37,008 | 42,548 | 40,145 | 268,176 | 308,321 | ||||||||||||||||||
ITV plc | 32,664 | 238,205 | 270,869 | 104,934 | 765,244 | 870,178 | ||||||||||||||||||
J Sainsbury plc | 10,417 | 78,683 | 89,100 | 62,963 | 475,577 | 538,540 | ||||||||||||||||||
Johnson Matthey plc | 1,781 | 13,135 | 14,916 | 96,735 | 713,430 | 810,165 | ||||||||||||||||||
Kingfisher plc | 20,759 | 151,951 | 172,710 | 132,244 | 967,995 | 1,100,239 | ||||||||||||||||||
Land Securities Group plc (REIT) | 6,850 | 50,020 | 56,870 | 109,292 | 798,073 | 907,365 | ||||||||||||||||||
Legal & General Group plc | 51,758 | 378,977 | 430,735 | 190,873 | 1,397,592 | 1,588,465 | ||||||||||||||||||
Liberty Global plc* | 29,799 | — | 29,799 | 2,512,652 | — | 2,512,652 | ||||||||||||||||||
See Notes to Pro-forma Combined Financial Statements.
74
Multimanager International Equity | EQ/International Core PLUS | Pro-forma Combined | Multimanager International Equity | EQ/ International Core PLUS | Pro-forma Combined | |||||||||||||||||||
Number of Shares | Number of Shares | Number of Shares | Value ($) (Note 1) | Value ($) (Note 1) | Value ($) (Note 1) | |||||||||||||||||||
Lloyds Banking Group plc* | 432,966 | 3,114,949 | 3,547,915 | 565,546 | 4,068,788 | 4,634,334 | ||||||||||||||||||
London Stock Exchange Group plc | 1,368 | 11,094 | 12,462 | 39,258 | 318,371 | 357,629 | ||||||||||||||||||
Marks & Spencer Group plc | 69,217 | 103,203 | 172,420 | 495,846 | 739,309 | 1,235,155 | ||||||||||||||||||
Meggitt plc | 42,723 | 50,320 | 93,043 | 373,191 | 439,552 | 812,743 | ||||||||||||||||||
Melrose Industries plc | 10,456 | 82,314 | 92,770 | 52,931 | 416,693 | 469,624 | ||||||||||||||||||
National Grid plc | 32,110 | 233,803 | 265,913 | 419,000 | 3,050,869 | 3,469,869 | ||||||||||||||||||
Next plc | 1,398 | 10,338 | 11,736 | 126,168 | 932,997 | 1,059,165 | ||||||||||||||||||
Noble Corp. plc | — | 476,782 | 476,782 | — | 17,865,021 | 17,865,021 | ||||||||||||||||||
Old Mutual plc | 42,826 | 313,638 | 356,464 | 134,105 | 982,126 | 1,116,231 | ||||||||||||||||||
Pearson plc | 7,153 | 52,382 | 59,535 | 158,842 | 1,163,210 | 1,322,052 | ||||||||||||||||||
Persimmon plc* | 2,911 | 19,303 | 22,214 | 59,726 | 396,044 | 455,770 | ||||||||||||||||||
Petrofac Ltd | 2,087 | 16,629 | 18,716 | 42,301 | 337,050 | 379,351 | ||||||||||||||||||
Prudential plc | 61,724 | 163,046 | 224,770 | 1,369,639 | 3,617,947 | 4,987,586 | ||||||||||||||||||
Randgold Resources Ltd | 715 | 5,604 | 6,319 | 44,874 | 351,710 | 396,584 | ||||||||||||||||||
Reckitt Benckiser Group plc | 5,663 | 101,725 | 107,388 | 449,470 | 8,073,881 | 8,523,351 | ||||||||||||||||||
Reed Elsevier plc | 10,391 | 75,497 | 85,888 | 154,691 | 1,123,923 | 1,278,614 | ||||||||||||||||||
Resolution Ltd | 11,528 | 90,901 | 102,429 | 67,578 | 532,867 | 600,445 | ||||||||||||||||||
Rexam plc | 6,428 | 50,653 | 57,081 | 56,469 | 444,977 | 501,446 | ||||||||||||||||||
Rightmove plc | 15,503 | — | 15,503 | 703,418 | — | 703,418 | ||||||||||||||||||
Rio Tinto plc | 20,471 | 332,688 | 353,159 | 1,155,785 | 18,783,437 | 19,939,222 | ||||||||||||||||||
Rio Tinto plc (ADR) | 23,183 | 120,653 | 143,836 | 1,308,217 | 6,808,449 | 8,116,666 | ||||||||||||||||||
Rolls-Royce Holdings plc* | 116,086 | 322,195 | 438,281 | 2,450,966 | 6,802,620 | 9,253,586 | ||||||||||||||||||
Rolls-Royce Holdings plc (Preference)*†(b) | 9,650,146 | 29,785,756 | 39,435,902 | 15,980 | 49,324 | 65,304 | ||||||||||||||||||
Royal Bank of Scotland Group plc* | 18,736 | 136,250 | 154,986 | 104,898 | 762,832 | 867,730 | ||||||||||||||||||
RSA Insurance Group plc | 29,812 | 230,334 | 260,146 | 45,122 | 348,619 | 393,741 | ||||||||||||||||||
SABMiller plc | 8,418 | 61,099 | 69,517 | 432,273 | 3,137,495 | 3,569,768 | ||||||||||||||||||
Sage Group plc | 9,401 | 70,794 | 80,195 | 62,846 | 473,263 | 536,109 | ||||||||||||||||||
Schroders plc | 985 | 6,424 | 7,409 | 42,376 | 276,371 | 318,747 | ||||||||||||||||||
Segro plc (REIT) | 7,343 | 46,877 | 54,220 | 40,613 | 259,271 | 299,884 | ||||||||||||||||||
Serco Group plc | 4,631 | 31,953 | 36,584 | 38,282 | 264,140 | 302,422 | ||||||||||||||||||
Severn Trent plc | 1,972 | 15,278 | 17,250 | 55,677 | 431,358 | 487,035 | ||||||||||||||||||
Smith & Nephew plc | 7,913 | 57,910 | 65,823 | 112,821 | 825,665 | 938,486 | ||||||||||||||||||
Smiths Group plc | 3,392 | 25,202 | 28,594 | 83,131 | 617,652 | 700,783 | ||||||||||||||||||
SSE plc | 8,440 | 60,821 | 69,261 | 191,474 | 1,379,817 | 1,571,291 | ||||||||||||||||||
Standard Chartered plc | 62,468 | 303,171 | 365,639 | 1,406,837 | 6,827,690 | 8,234,527 | ||||||||||||||||||
Standard Life plc | 20,628 | 151,148 | 171,776 | 122,836 | 900,056 | 1,022,892 | ||||||||||||||||||
Subsea 7 S.A. | 57,729 | 16,775 | 74,504 | 1,105,030 | 321,102 | 1,426,132 | ||||||||||||||||||
Tate & Lyle plc | 3,699 | 29,884 | 33,583 | 49,554 | 400,345 | 449,899 | ||||||||||||||||||
Telecity Group plc | 193,572 | — | 193,572 | 2,325,558 | — | 2,325,558 | ||||||||||||||||||
Tesco plc | 133,251 | 513,173 | 646,424 | 737,767 | 2,841,269 | 3,579,036 | ||||||||||||||||||
Travis Perkins plc | 1,975 | 15,608 | 17,583 | 61,224 | 483,838 | 545,062 | ||||||||||||||||||
TUI Travel plc | 4,171 | 27,743 | 31,914 | 28,533 | 189,782 | 218,315 | ||||||||||||||||||
Tullow Oil plc | 28,906 | 58,183 | 87,089 | 409,262 | 823,777 | 1,233,039 | ||||||||||||||||||
Unilever plc | 24,545 | 81,839 | 106,384 | 1,008,816 | 3,363,638 | 4,372,454 | ||||||||||||||||||
United Utilities Group plc | 5,754 | 43,709 | 49,463 | 63,983 | 486,031 | 550,014 | ||||||||||||||||||
Vodafone Group plc | 715,490 | 3,074,495 | 3,789,985 | 2,808,013 | 12,066,168 | 14,874,181 | ||||||||||||||||||
Weir Group plc | 1,812 | 112,150 | 113,962 | 63,972 | 3,959,439 | 4,023,411 | ||||||||||||||||||
Whitbread plc | 1,538 | 54,319 | 55,857 | 95,532 | 3,374,008 | 3,469,540 | ||||||||||||||||||
William Hill plc | 8,291 | 54,981 | 63,272 | 55,179 | 365,913 | 421,092 | ||||||||||||||||||
WM Morrison Supermarkets plc | 19,301 | 139,375 | 158,676 | 83,419 | 602,383 | 685,802 | ||||||||||||||||||
WPP plc | 44,897 | 84,604 | 129,501 | 1,025,991 | 1,933,380 | 2,959,371 | ||||||||||||||||||
|
|
|
|
|
| |||||||||||||||||||
| 52,769,190 | 278,164,041 | 330,933,231 | ||||||||||||||||||||||
|
|
|
|
|
| |||||||||||||||||||
United States (1.6%) | ||||||||||||||||||||||||
Bunge Ltd. | — | 29,718 | 29,718 | — | 2,440,145 | 2,440,145 | ||||||||||||||||||
Carnival Corp | 28,314 | — | 28,314 | 1,137,373 | — | 1,137,373 | ||||||||||||||||||
Catamaran Corp.* | 27,347 | — | 27,347 | 1,298,435 | — | 1,298,435 | ||||||||||||||||||
Gilead Sciences, Inc.* | 15,832 | — | 15,832 | 1,189,775 | — | 1,189,775 | ||||||||||||||||||
MasterCard, Inc., Class A | 2,183 | — | 2,183 | 1,823,809 | — | 1,823,809 | ||||||||||||||||||
Mettler-Toledo International, Inc.* | — | 13,138 | 13,138 | — | 3,187,148 | 3,187,148 | ||||||||||||||||||
Perrigo Co. plc | 1 | — | # | 1 | 78 | 50 | 128 | |||||||||||||||||
Schlumberger Ltd. | 27,716 | 252,844 | 280,560 | 2,497,489 | 22,783,773 | 25,281,262 | ||||||||||||||||||
|
|
|
|
|
| |||||||||||||||||||
| 7,946,959 | 28,411,116 | 36,358,075 | ||||||||||||||||||||||
|
|
|
|
|
| |||||||||||||||||||
Total Common Stock (73.5%) | 283,073,121 | 1,425,314,354 | 1,708,387,475 | |||||||||||||||||||||
|
|
|
|
|
| |||||||||||||||||||
INVESTMENT COMPANIES | ||||||||||||||||||||||||
Exchange Traded Funds (5.9%) | ||||||||||||||||||||||||
iShares® China Large-Cap ETF | — | 110,910 | 110,910 | — | 4,253,399 | 4,253,399 | ||||||||||||||||||
iShares® Europe ETF | — | 335,566 | 335,566 | — | 15,922,607 | 15,922,607 | ||||||||||||||||||
iShares® Latin America 40 ETF | — | 33,047 | 33,047 | — | 1,224,061 | 1,224,061 | ||||||||||||||||||
iShares® MSCI Australia ETF | — | 95,215 | 95,215 | — | 2,320,390 | 2,320,390 | ||||||||||||||||||
iShares® MSCI Austria Capped ETF | — | 131,337 | 131,337 | — | 2,601,786 | 2,601,786 | ||||||||||||||||||
iShares® MSCI Belgium Capped ETF | — | 68,797 | 68,797 | — | 1,127,576 | 1,127,576 | ||||||||||||||||||
iShares® MSCI BRIC ETF | — | 68,616 | 68,616 | — | 2,586,137 | 2,586,137 | ||||||||||||||||||
iShares® MSCI Canada ETF | — | 47,158 | 47,158 | — | 1,375,127 | 1,375,127 | ||||||||||||||||||
See Notes to Pro-forma Combined Financial Statements.
75
| Multimanager International Equity | EQ/ International | Pro-forma Combined | Multimanager International Equity | EQ/International Core PLUS | Pro-forma Combined | |||||||||||||||||||
Number of Shares | Number of Shares | Number of Shares | Value ($) (Note 1) | Value ($) (Note 1) | Value ($) (Note 1) | |||||||||||||||||||
iShares® MSCI EAFE ETF | — | 515,466 | 515,466 | — | 34,567,150 | 34,567,150 | ||||||||||||||||||
iShares® MSCI EAFE Small-Cap ETF | — | 55,100 | 55,100 | — | 2,808,998 | 2,808,998 | ||||||||||||||||||
iShares® MSCI Emerging Markets ETF | — | 64,132 | 64,132 | — | 2,678,794 | 2,678,794 | ||||||||||||||||||
iShares® MSCI France ETF | — | 165,867 | 165,867 | — | 4,718,916 | 4,718,916 | ||||||||||||||||||
iShares® MSCI Germany ETF | — | 286,710 | 286,710 | — | 9,105,910 | 9,105,910 | ||||||||||||||||||
iShares® MSCI Hong Kong ETF | — | 21,077 | 21,077 | — | 434,186 | 434,186 | ||||||||||||||||||
iShares® MSCI Indonesia ETF | — | 21,400 | 21,400 | — | 488,776 | 488,776 | ||||||||||||||||||
iShares® MSCI Ireland Capped ETF | — | 11,600 | 11,600 | — | 415,860 | 415,860 | ||||||||||||||||||
iShares® MSCI Israel Capped ETF | — | 19,400 | 19,400 | — | 935,468 | 935,468 | ||||||||||||||||||
iShares® MSCI Italy Capped ETF | — | 354,948 | 354,948 | — | 5,533,639 | 5,533,639 | ||||||||||||||||||
iShares® MSCI Japan ETF | — | 819,380 | 819,380 | — | 9,939,079 | 9,939,079 | ||||||||||||||||||
iShares® MSCI Malaysia ETF | — | 20,262 | 20,262 | — | 320,545 | 320,545 | ||||||||||||||||||
iShares® MSCI Mexico Capped ETF | — | 9,348 | 9,348 | — | 635,664 | 635,664 | ||||||||||||||||||
iShares® MSCI Netherlands ETF | — | 88,693 | 88,693 | — | 2,299,809 | 2,299,809 | ||||||||||||||||||
iShares® MSCI New Zealand Capped ETF | — | 39,400 | 39,400 | — | 1,471,984 | 1,471,984 | ||||||||||||||||||
iShares® MSCI Pacific ex-Japan ETF | — | 119,192 | 119,192 | — | 5,569,842 | 5,569,842 | ||||||||||||||||||
iShares® MSCI Poland Capped ETF | — | 7,700 | 7,700 | — | 228,536 | 228,536 | ||||||||||||||||||
iShares® MSCI Singapore ETF | — | 58,226 | 58,226 | — | 766,836 | 766,836 | ||||||||||||||||||
iShares® MSCI South Korea Capped ETF | — | 6,000 | 6,000 | — | 388,020 | 388,020 | ||||||||||||||||||
iShares® MSCI Spain Capped ETF | — | 65,421 | 65,421 | — | 2,523,288 | 2,523,288 | ||||||||||||||||||
iShares® MSCI Sweden ETF | — | 49,603 | 49,603 | — | 1,777,276 | 1,777,276 | ||||||||||||||||||
iShares® MSCI Switzerland Capped ETF | — | 24,200 | 24,200 | — | 798,358 | 798,358 | ||||||||||||||||||
iShares® MSCI Thailand Capped ETF | — | 5,568 | 5,568 | — | 382,243 | 382,243 | ||||||||||||||||||
iShares® MSCI Turkey ETF | — | 11,984 | 11,984 | — | 571,157 | 571,157 | ||||||||||||||||||
iShares® MSCI United Kingdom ETF | 28,155 | 66,400 | 94,555 | 587,876 | 1,386,432 | 1,974,308 | ||||||||||||||||||
SPDR® DJ EURO Stoxx 50 ETF | — | 40,364 | 40,364 | — | 1,703,361 | 1,703,361 | ||||||||||||||||||
SPDR® S&P Emerging Asia Pacific ETF | — | 36,279 | 36,279 | — | 2,798,925 | 2,798,925 | ||||||||||||||||||
SPDR® S&P Emerging Europe ETF | — | 11,967 | 11,967 | — | 481,660 | 481,660 | ||||||||||||||||||
Vanguard FTSE Developed Markets ETF | — | 174,400 | 174,400 | — | 7,268,992 | 7,268,992 | ||||||||||||||||||
Vanguard FTSE Emerging Markets ETF | — | 15,200 | 15,200 | — | 625,328 | 625,328 | ||||||||||||||||||
Vanguard FTSE Europe ETF | — | 33,800 | 33,800 | — | 1,987,440 | 1,987,440 | ||||||||||||||||||
Vanguard FTSE Pacific ETF | — | 9,600 | 9,600 | — | 588,480 | 588,480 | ||||||||||||||||||
|
|
|
|
|
| |||||||||||||||||||
Total Investment Companies (5.9%) (Cost $103,315,491) | 587,876 | 137,612,035 | 138,199,911 | |||||||||||||||||||||
|
|
|
|
|
| |||||||||||||||||||
RIGHTS | ||||||||||||||||||||||||
Spain (0.0%) | ||||||||||||||||||||||||
Repsol S.A. expiring 1/9/14* | 7,487 | 53,356 | 60,843 | 5,109 | 36,407 | 41,516 | ||||||||||||||||||
|
|
|
|
|
| |||||||||||||||||||
Total Rights (0.0%) | 5,109 | 36,407 | 41,516 | |||||||||||||||||||||
|
|
|
|
|
| |||||||||||||||||||
Total Investments (79.4%) | 283,666,106 | 1,562,962,796 | 1,846,628,902 | |||||||||||||||||||||
Other Assets Less Liabilities (20.6%) | 69,598,913 | 408,483,617 | 478,082,530 | |||||||||||||||||||||
|
|
|
|
|
| |||||||||||||||||||
Net Assets (100%) | $ | 353,265,019 | $ | 1,971,446,413 | $ | 2,324,711,432 | ||||||||||||||||||
|
|
|
|
|
| |||||||||||||||||||
| * | Non-income producing. |
| # | Number of shares is less than 0.50. |
| † | Securities (totaling $65,304 or 0.0% of net assets) at fair value by management. |
| ‡ | Affiliated company as defined under the Investment Company Act of 1940. |
| § | Securities exempt from registration under Rule 144A of the Securities Act of 1933. These securities may only be resold to qualified institutional buyers. At December 31, 2013, the market value of these securities amounted to $522,175 or 0.0% of net assets. Securities denoted with “§” but without “b” have been determined to be liquid under the guidelines established by the Board of Trustees. To the extent any securities might provide a right to demand registration, such rights have not been relied upon when determining liquidity. |
| (b) | Illiquid securities. |
Glossary:
ADR - American Depositary Receipt
CDI - CHESS Depositary Interest
CVA - Dutch Certification
GDR - Global Depositary Receipt
FDR - Finnish Depositary Receipt
REIT - Real Estate Investment Trust
RNC - Risparmio Non-Convertible Shares
SDR - Swedish Certification
See Notes to Pro-forma Combined Financial Statements.
76
Investments in companies which were affiliates for the year ended December 31, 2013, were as follows:
Multimanager International Equity
| Securities: | Value December 31, 2012 | Purchases at Cost | Sales at Cost | Value December 31, 2013 | Dividend Income | Realized Gain (Loss) | ||||||||||||||||||
AXA S.A. | $ | 732,309 | $ | — | $ | 498,681 | $ | 436,589 | $ | 27,173 | $ | (22,804 | ) | |||||||||||
|
|
|
|
|
|
|
|
|
|
|
| |||||||||||||
EQ/International Core PLUS
| Securities: | Value December 31, 2012 | Purchases at Cost | Sales at Cost | Value December 31, 2013 | Dividend Income | Realized Gain (Loss) | ||||||||||||||||||
AXA S.A. | $ | 1,446,113 | $ | 784,794 | $ | 123,267 | $ | 3,165,832 | $ | 58,883 | $ | (16,811 | ) | |||||||||||
|
|
|
|
|
|
|
|
|
|
|
| |||||||||||||
Combined Pro-forma
| Securities: | Value December 31, 2012 | Purchases at Cost | Sales at Cost | Value December 31, 2013 | Dividend Income | Realized Gain (Loss) | ||||||||||||||||||
AXA S.A. | $ | 2,178,422 | $ | 784,794 | $ | 621,948 | $ | 3,602,421 | $ | 86,056 | $ | (39,615 | ) | |||||||||||
|
|
|
|
|
|
|
|
|
|
|
| |||||||||||||
See Notes to Pro-forma Combined Financial Statements.
77
At December 31, 2013 the Portfolio had the following futures contracts open
Multimanager International Equity
Purchases | Number of Contracts | Expiration Date | Original Value | Value at 12/31/2013 | Unrealized Appreciation/ (Depreciation) | |||||||||||||||
DJ EURO Stoxx 50 Index | 605 | March - 14 | $ | 24,642,278 | $ | 25,867,838 | $ | 1,225,560 | ||||||||||||
FTSE 100 Index | 147 | March - 14 | 15,692,016 | 16,303,366 | 611,350 | |||||||||||||||
SPI 200 Index | 54 | March - 14 | 6,123,373 | 6,410,397 | 287,024 | |||||||||||||||
TOPIX Index | 127 | March - 14 | 15,155,104 | 15,707,672 | 552,568 | |||||||||||||||
|
| |||||||||||||||||||
| $ | 2,676,502 | |||||||||||||||||||
|
| |||||||||||||||||||
EQ/International Core PLUS
Purchases | Number of Contracts | Expiration Date | Original Value | Value at 12/31/2013 | Unrealized Appreciation/ (Depreciation) | |||||||||||||||
DJ EURO Stoxx 50 Index | 3,922 | March - 14 | $ | 159,581,564 | $ | 167,691,999 | $ | 8,110,435 | ||||||||||||
FTSE 100 Index | 923 | March - 14 | 98,632,476 | 102,367,394 | 3,734,918 | |||||||||||||||
SPI 200 Index | 317 | March - 14 | 35,883,812 | 37,631,405 | 1,747,593 | |||||||||||||||
TOPIX Index | 810 | March - 14 | 96,658,548 | 100,182,793 | 3,524,245 | |||||||||||||||
|
| |||||||||||||||||||
| $ | 17,117,191 | |||||||||||||||||||
|
| |||||||||||||||||||
Combined Pro-Forma
Purchases | Number of Contracts | Expiration Date | Original Value | Value at 12/31/2013 | Unrealized Appreciation/ (Depreciation) | |||||||||||||||
DJ EURO Stoxx 50 Index | 4,527 | March - 14 | $ | 184,223,842 | $ | 193,559,837 | $ | 9,335,995 | ||||||||||||
FTSE 100 Index | 1,070 | March - 14 | 114,324,492 | 118,670,760 | 4,346,268 | |||||||||||||||
SPI 200 Index | 371 | March - 14 | 42,007,185 | 44,041,802 | 2,034,617 | |||||||||||||||
TOPIX Index | 937 | March - 14 | 111,813,652 | 115,890,465 | 4,076,813 | |||||||||||||||
|
| |||||||||||||||||||
| $ | 19,793,693 | |||||||||||||||||||
|
| |||||||||||||||||||
See Notes to Pro-forma Financial Statements.
78
At December 31, 2013 the Portfolio had the following outstanding foreign currency contracts to buy/sell foreign currencies as follows: (Note 1)
Multimanager International Equity
Foreign Currency Buy Contract | Counterparty | Local Contract Buy Amount (000’s) | U.S. $ Current Value | U.S. $ Settlement Value | Unrealized Appreciation/ (Depreciation) | |||||||||||||||||
European Union Euro vs. U.S. Dollar, | Credit Suisse | 9,000 | $ | 12,381,030 | $ | 12,408,525 | $ | (27,495 | ) | |||||||||||||
|
| |||||||||||||||||||||
Foreign Currency Sell Contract | Counterparty | Local Contract Sell Amount (000’s) | U.S. $ Settlement Value | U.S. $ Current Value | Unrealized Appreciation/ (Depreciation) | |||||||||||||||
Danish Krone vs. U.S. Dollar, | State Street Bank & Trust | 1,241 | $ | 227,996 | $ | 228,910 | $ | (914 | ) | |||||||||||
|
| |||||||||||||||||||
| $ | (28,409 | ) | ||||||||||||||||||
|
| |||||||||||||||||||
EQ/International Core PLUS
Foreign Currency Buy Contracts | Counterparty | Local Contract Buy Amount (000’s) | U.S. $ Current Value | U.S. $ Settlement Value | Unrealized Appreciation/ (Depreciation) | |||||||||||||
Australian Dollar vs. U.S. Dollar, | BNP Paribas | 2,300 | $ | 2,044,324 | $ | 2,073,224 | $ | (28,900 | ) | |||||||||
British Pound vs. U.S. Dollar, | JPMorgan Chase Bank | 7,000 | 11,585,980 | 11,458,783 | 127,197 | |||||||||||||
European Union Euro vs. U.S. Dollar, | Barclays Bank plc | 10,300 | 14,169,401 | 14,199,333 | (29,932 | ) | ||||||||||||
Japanese Yen vs. U.S. Dollar, | Goldman Sachs & Co. | 418,300 | 3,970,624 | 4,078,168 | (107,544 | ) | ||||||||||||
|
| |||||||||||||||||
| $ | (39,179 | ) | ||||||||||||||||
|
| |||||||||||||||||
Foreign Currency Sell Contracts | Counterparty | Local Contract Sell Amount (000’s) | U.S. $ Settlement Value | U.S. $ Current Value | Unrealized Appreciation/ (Depreciation) | |||||||||||||
Japanese Yen vs. U.S. Dollar, | Goldman Sachs & Co. | 3,369 | $ | 32,149 | $ | 31,992 | $ | 157 | ||||||||||
Japanese Yen vs. U.S. Dollar, | Barclays Bank plc | 4,359 | 41,510 | 41,388 | 122 | |||||||||||||
Japanese Yen vs. U.S. Dollar, | Deutsche Bank AG | 3,429 | 32,605 | 32,557 | 48 | |||||||||||||
|
| |||||||||||||||||
| 327 | ||||||||||||||||||
|
| |||||||||||||||||
| $ | (38,852 | ) | ||||||||||||||||
|
| |||||||||||||||||
Combined Pro-forma
Foreign Currency Buy Contracts | Counterparty | Local Contract Buy Amount (000’s) | U.S. $ Current Value | U.S. $ Settlement Value | Unrealized Appreciation/ (Depreciation) | |||||||||||||
Australian Dollar vs. U.S. Dollar, | BNP Paribas | 2,300 | $ | 2,044,324 | $ | 2,073,224 | $ | (28,900 | ) | |||||||||
British Pound vs. U.S. Dollar, | JPMorgan Chase Bank | 7,000 | 11,585,980 | 11,458,783 | 127,197 | |||||||||||||
European Union Euro vs. U.S. Dollar, | Barclays Bank plc | 10,300 | 14,169,401 | 14,199,333 | (29,932 | ) | ||||||||||||
European Union Euro vs. U.S. Dollar, | Credit Suisse | 9,000 | 12,381,030 | 12,408,525 | (27,495 | ) | ||||||||||||
Japanese Yen vs. U.S. Dollar, | Goldman Sachs & Co. | 418,300 | 3,970,624 | 4,078,168 | (107,544 | ) | ||||||||||||
|
| |||||||||||||||||
| $ | (66,674 | ) | ||||||||||||||||
|
| |||||||||||||||||
Foreign Currency Sell Contracts | Counterparty | Local Contract Sell Amount (000’s) | U.S. $ Settlement Value | U.S. $ Current Value | Unrealized Appreciation/ (Depreciation) | |||||||||||||
Danish Krone vs. U.S. Dollar, | State Street Bank & Trust | 1,241 | $ | 227,996 | $ | 228,910 | $ | (914 | ) | |||||||||
Japanese Yen vs. U.S. Dollar, | Goldman Sachs & Co. | 3,369 | 32,149 | 31,992 | 157 | |||||||||||||
Japanese Yen vs. U.S. Dollar, | Barclays Bank plc | 4,359 | 41,510 | 41,388 | 122 | |||||||||||||
Japanese Yen vs. U.S. Dollar, | Deutsche Bank AG | 3,429 | 32,605 | 32,557 | 48 | |||||||||||||
|
| |||||||||||||||||
| (587 | ) | |||||||||||||||||
|
| |||||||||||||||||
| $ | (67,261 | ) | ||||||||||||||||
|
| |||||||||||||||||
See Notes to Pro-forma Combined Financial Statements.
79
The following is a summary of the inputs used to value the Portfolio’s net assets as of December 31, 2013 :
The inputs or methodology used for valuing securities are not necessarily an indication of the risk associated with investing in those securities. For example, money market securities are valued using amortized cost, in accordance with rules under the Investment Company Act of 1940. Generally, amortized cost approximates the current fair value of a security, but since the value is not obtained from a quoted price in an active market, such securities are reflected as Level 2.
Various inputs are used in determining the value of the Portfolio’s investments. These inputs are summarized in the three broad levels listed below:
| • | Level 1 - Quoted prices in active markets for identical securities |
| • | Level 2 - Significant other observable inputs (including quoted prices for similar securities, interest rates, prepayment speeds, credit risk, etc.) |
| • | Level 3 - Significant unobservable inputs (including the Portfolio’s own assumptions in determining the fair value of investments) |
Description | Quoted Prices in Active Markets for Identical Securities (Level 1) | Significant Other Observable Inputs (Level 2) | Significant Unobservable Inputs (Level 3) | Total | ||||||||||||||||||||||||||||||||||||||||||||
| Multimanager International Equity (a) | EQ/ International Core PLUS | COMBINED PRO FORMA | Multimanager International Equity | EQ/ International Core PLUS | COMBINED PRO FORMA | Multimanager International Equity | EQ/ International Core PLUS | COMBINED PRO FORMA | Multimanager International Equity | EQ/ International Core PLUS | COMBINED PRO FORMA | |||||||||||||||||||||||||||||||||||||
Assets | ||||||||||||||||||||||||||||||||||||||||||||||||
Investments in Securities | $ | 51,068,587 | $ | 417,936,975 | $ | 469,005,562 | $ | 232,581,539 | $ | 1,144,976,497 | $ | 1,377,558,036 | $ | 15,980 | $ | 49,324 | $ | 65,304 | $ | 283,666,106 | $ | 1,562,962,796 | $ | 1,846,628,902 | ||||||||||||||||||||||||
Other Investments* | 2,676,502 | 17,117,191 | 19,793,693 | — | 127,524 | 127,524 | — | — | — | 2,676,502 | 17,244,715 | 19,921,217 | ||||||||||||||||||||||||||||||||||||
|
|
|
|
|
|
|
|
|
|
|
|
|
|
|
|
|
|
|
|
|
|
|
| |||||||||||||||||||||||||
Total | $ | 53,745,089 | $ | 435,054,166 | $ | 488,799,255 | $ | 232,581,539 | $ | 1,145,104,021 | $ | 1,377,685,560 | $ | 15,980 | $ | 49,324 | $ | 65,304 | $ | 286,342,608 | $ | 1,580,207,511 | $ | 1,866,550,119 | ||||||||||||||||||||||||
|
|
|
|
|
|
|
|
|
|
|
|
|
|
|
|
|
|
|
|
|
|
|
| |||||||||||||||||||||||||
Liabilities | ||||||||||||||||||||||||||||||||||||||||||||||||
Investments in Securities | $ | — | $ | — | $ | — | $ | — | $ | — | $ | — | $ | — | $ | — | $ | — | $ | — | $ | — | $ | — | ||||||||||||||||||||||||
Other Investments* | — | — | — | (28,409 | ) | (166,376 | ) | (194,785 | ) | — | — | — | (28,409 | ) | (166,376 | ) | (194,785 | ) | ||||||||||||||||||||||||||||||
|
|
|
|
|
|
|
|
|
|
|
|
|
|
|
|
|
|
|
|
|
|
|
| |||||||||||||||||||||||||
Total | $ | — | $ | — | $ | — | $ | (28,409 | ) | $ | (166,376 | ) | $ | (194,785 | ) | $ | — | $ | — | $ | — | $ | (28,409 | ) | $ | (166,376 | ) | $ | (194,785 | ) | ||||||||||||||||||
|
|
|
|
|
|
|
|
|
|
|
|
|
|
|
|
|
|
|
|
|
|
|
| |||||||||||||||||||||||||
Total Assets and Liabilities | $ | 53,745,089 | $ | 435,054,166 | $ | 488,799,255 | $ | 232,553,130 | $ | 1,144,937,645 | $ | 1,377,490,775 | $ | 15,980 | $ | 49,324 | $ | 65,304 | $ | 286,314,199 | $ | 1,580,041,135 | $ | 1,866,355,334 | ||||||||||||||||||||||||
|
|
|
|
|
|
|
|
|
|
|
|
|
|
|
|
|
|
|
|
|
|
|
| |||||||||||||||||||||||||
| * | Other investments are derivative instruments, such as futures, forwards and written options, which are valued at the unrealized appreciation/depreciation on the instrument. |
Multimanage International Equity/Pro Forma Combined
| (a) | A security with a market value of $1,384,620 transferred from Level 2 to Level 1 during the year ended December 31, 2013 due to active trading. |
There were no additional transfers between Levels 1, 2 and 3 during the year ended December 31, 2013.
See Notes to Pro-forma Combined Financial Statements.
80
Fair Values of Derivative Instruments as of December 31, 2013:
Multimanager International Equity
Statement of Assets and Liabilities
Derivatives Not Accounted for as Hedging Instruments^ | Asset Derivatives | Fair Value | ||||
Interest rate contracts | Receivables, Net Assets- | $ | — | * | ||
| Unrealized appreciation | ||||||
Foreign exchange contracts | Receivables | — | ||||
Credit contracts | Receivables | — | ||||
Equity contracts | Receivables, Net Assets- | |||||
| Unrealized appreciation | 2,676,502 | * | ||||
Commodity contracts | Receivables | — | ||||
Other contracts | Receivables | — | ||||
|
| |||||
Total | $ | 2,676,502 | ||||
|
| |||||
| Liability Derivatives | ||||||
Interest rate contracts | Payables, Net Assets- | $ | — | * | ||
| Unrealized depreciation | ||||||
Foreign exchange contracts | Payables | (28,409 | ) | |||
Credit contracts | Payables | — | ||||
Equity contracts | Payables, Net Assets- | |||||
| Unrealized depreciation | — | * | ||||
Commodity contracts | Payables | — | ||||
Other contracts | Payables | — | ||||
|
| |||||
Total | $ | (28,409 | ) | |||
|
| |||||
| * | Includes cumulative appreciation/depreciation of futures contracts as reported in the Portfolio of Investments. Only current day’s variation margin is reported within the Statement of Assets & Liabilities. |
The effect of Derivative Instruments on the Statement of Operations for the year ended December 31, 2013:
Amount of Realized Gain or (Loss) on Derivatives Recognized in Income
Derivatives Not Accounted for as Hedging Instruments^ | Options | Futures | Forward Currency Contracts | Swaps | Total | |||||||||||||||
Interest rate contracts | $ | — | $ | — | $ | — | $ | — | $ | — | ||||||||||
Foreign exchange contracts | — | — | 741,450 | — | 741,450 | |||||||||||||||
Credit contracts | — | — | — | — | — | |||||||||||||||
Equity contracts | — | 23,687,113 | — | — | 23,687,113 | |||||||||||||||
Commodity contracts | — | — | — | — | — | |||||||||||||||
Other contracts | — | — | — | — | — | |||||||||||||||
|
|
|
|
|
|
|
|
|
| |||||||||||
Total | $ | — | $ | 23,687,113 | $ | 741,450 | $ | — | $ | 24,428,563 | ||||||||||
|
|
|
|
|
|
|
|
|
| |||||||||||
Amount of Unrealized Appreciation or (Depreciation) on Derivatives Recognized in Income
Derivatives Not Accounted for as Hedging Instruments^ | Options | Futures | Forward Currency Contracts | Swaps | Total | |||||||||||||||
Interest rate contracts | $ | — | $ | — | $ | — | $ | — | $ | — | ||||||||||
Foreign exchange contracts | — | — | (167,742 | ) | — | (167,742 | ) | |||||||||||||
Credit contracts | — | — | — | — | — | |||||||||||||||
Equity contracts | — | (442,081 | ) | — | — | (442,081 | ) | |||||||||||||
Commodity contracts | — | — | — | — | — | |||||||||||||||
Other contracts | — | — | — | — | — | |||||||||||||||
|
|
|
|
|
|
|
|
|
| |||||||||||
Total | $ | — | $ | (442,081 | ) | $ | (167,742 | ) | $ | — | $ | (609,823 | ) | |||||||
|
|
|
|
|
|
|
|
|
| |||||||||||
| ^ | This Portfolio held forward foreign currency and futures contracts as a substitute for investing in conventional securities, hedging and in an attempt to enhance returns. |
The Portfolio held forward foreign currency contracts with an average settlement value of approximately $11,933,000 and futures contracts with an average notional balance of approximately $101,545,000 for the year ended December 31, 2013.
See Notes to Pro-Forma Combined Financial Statements.
81
EQ/International Core PLUS
Statement of Assets and Liabilities
Derivatives Not Accounted for as | Asset Derivatives | Fair Value | ||||
Interest rate contracts | Receivables, Net Assets- | |||||
| Unrealized appreciation | $ | — | * | |||
Foreign exchange contracts | Receivables | 127,524 | ||||
Credit contracts | Receivables | — | ||||
Equity contracts | Receivables, Net Assets- | |||||
| Unrealized appreciation | 17,117,191 | * | ||||
Commodity contracts | Receivables | — | ||||
Other contracts | Receivables | — | ||||
|
| |||||
Total | $ 17,244,715 | |||||
|
| |||||
| Liability Derivatives | ||||||
Interest rate contracts | Payables, Net Assets- | |||||
| Unrealized depreciation | $ | — | * | |||
Foreign exchange contracts | Payables | (166,376 | ) | |||
Credit contracts | Payables | — | ||||
Equity contracts | Payables, Net Assets- | |||||
| Unrealized depreciation | — | * | ||||
Commodity contracts | Payables | — | ||||
Other contracts | Payables | — | ||||
|
| |||||
Total | $ (166,376) | |||||
|
| |||||
| * | Includes cumulative appreciation/depreciation of futures contracts as reported in the Portfolio of Investments. Only current day’s variation margin is reported within the Statement of Assets & Liabilities. |
The effect of Derivative Instruments on the Statement of Operations for the year ended December 31, 2013:
Amount of Realized Gain or (Loss) on Derivatives Recognized in Income
Derivatives Not Accounted for as Hedging Instruments^ | Options | Futures | Forward Currency Contracts | Swaps | Total | |||||||||||||||
Interest rate contracts | $ | — | $ | — | $ | — | $ | — | $ | — | ||||||||||
Foreign exchange contracts | — | — | 1,114,531 | — | 1,114,531 | |||||||||||||||
Credit contracts | — | — | — | — | — | |||||||||||||||
Equity contracts | — | 68,192,885 | — | — | 68,192,885 | |||||||||||||||
Commodity contracts | — | — | — | — | — | |||||||||||||||
Other contracts | — | — | — | — | — | |||||||||||||||
|
|
|
|
|
|
|
|
|
| |||||||||||
Total | $ | — | $ | 68,192,885 | $ | 1,114,531 | $ | — | $ | 69,307,416 | ||||||||||
|
|
|
|
|
|
|
|
|
| |||||||||||
Amount of Unrealized Appreciation or (Depreciation) on Derivatives Recognized in Income |
| |||||||||||||||||||
Derivatives Not Accounted for as Hedging Instruments^ | Options | Futures | Forward Currency Contracts | Swaps | Total | |||||||||||||||
Interest rate contracts | $ | — | $ | — | $ | — | $ | — | $ | — | ||||||||||
Foreign exchange contracts | — | — | (126,899 | ) | — | (126,899 | ) | |||||||||||||
Credit contracts | — | — | — | — | — | |||||||||||||||
Equity contracts | — | 12,555,120 | — | — | 12,555,120 | |||||||||||||||
Commodity contracts | — | — | — | — | — | |||||||||||||||
Other contracts | — | — | — | — | — | |||||||||||||||
|
|
|
|
|
|
|
|
|
| |||||||||||
Total | $ | — | $12,555,120 | $(126,899) | $ | — | $12,428,221 | |||||||||||||
|
|
|
|
|
|
|
|
|
| |||||||||||
| ^ | This Portfolio held forward foreign currency and futures contracts as a substitute for investing in conventional securities, hedging and in an attempt to enhance returns. |
The Portfolio held forward foreign currency contracts with an average settlement value of approximately $24,896,000 and futures contracts with an average notional balance of approximately $307,664,000 for the year ended December 31, 2013.
See Notes to Pro-forma Combined Financial Statements.
82
Combined Pro-Forma
Fair Values of Derivative Instruments as of December 31, 2013:
Statement of Assets and Liabilities
Derivatives Not Accounted for as Hedging Instruments^ | Asset Derivatives | Fair Value | ||||
Interest rate contracts | Receivables, Net Assets- | $ | — | * | ||
| Unrealized appreciation | ||||||
Foreign exchange contracts | Receivables | 127,524 | ||||
Credit contracts | Receivables | — | ||||
Equity contracts | Receivables, Net Assets- Unrealized appreciation | 19,793,693 | * | |||
Commodity contracts | Receivables | — | ||||
Other contracts | Receivables | — | ||||
|
| |||||
Total | $ | 19,921,217 | ||||
|
| |||||
Liability Derivatives | ||||||
Interest rate contracts | Payables, Net Assets- | $ | — | * | ||
| Unrealized depreciation | ||||||
Foreign exchange contracts | Payables | (194,785 | ) | |||
Credit contracts | Payables | — | ||||
Equity contracts | Payables, Net Assets- Unrealized depreciation | — | * | |||
Commodity contracts | Payables | — | ||||
Other contracts | Payables | — | ||||
|
| |||||
Total | $ | (194,785 | ) | |||
|
| |||||
| * | Includes cumulative appreciation/depreciation of futures contracts as reported in the Portfolio of Investments. Only current day’s variation margin is reported within the Statement of Assets & Liabilities. |
The effect of Derivative Instruments on the Statement of Operations for the year ended December 31, 2013:
Amount of Realized Gain or (Loss) on Derivatives Recognized in Income
Derivatives Not Accounted for as Hedging Instruments^ | Options | Futures | Forward Currency Contracts | Swaps | Total | |||||||||||||||
Interest rate contracts | $ | — | $ | — | $ | — | $ | — | $ | — | ||||||||||
Foreign exchange contracts | — | — | 1,855,981 | — | 1,855,981 | |||||||||||||||
Credit contracts | — | — | — | — | — | |||||||||||||||
Equity contracts | — | 91,879,998 | — | — | 91,879,998 | |||||||||||||||
Commodity contracts | — | — | — | — | — | |||||||||||||||
Other contracts | — | — | — | — | — | |||||||||||||||
|
|
|
|
|
|
|
|
|
| |||||||||||
Total | $ | — | $ | 91,879,998 | $ | 1,855,981 | $ | — | $ | 93,735,979 | ||||||||||
|
|
|
|
|
|
|
|
|
| |||||||||||
Amount of Unrealized Appreciation or (Depreciation) on Derivatives Recognized in Income
Derivatives Not Accounted for as Hedging Instruments^ | Options | Futures | Forward Currency Contracts | Swaps | Total | |||||||||||||||
Interest rate contracts | $ | — | $ | — | $ | — | $ | — | $ | — | ||||||||||
Foreign exchange contracts | — | — | (294,641 | ) | — | (294,641 | ) | |||||||||||||
Credit contracts | — | — | — | — | — | |||||||||||||||
Equity contracts | — | 12,113,039 | — | — | 12,113,039 | |||||||||||||||
Commodity contracts | — | — | — | — | — | |||||||||||||||
Other contracts | — | — | — | — | — | |||||||||||||||
|
|
|
|
|
|
|
|
|
| |||||||||||
Total | $ | — | $ | 12,113,039 | $ | (294,641 | ) | $ | — | $ | 11,818,398 | |||||||||
|
|
|
|
|
|
|
|
|
| |||||||||||
| ^ | This Portfolio held forward foreign currency and futures contracts as a substitute for investing in conventional securities, hedging and in an attempt to enhance returns. |
The Portfolio held forward foreign currency contracts with an average settlement value of approximately $36,829,000 and futures contracts with an average notional balance of approximately $409,209,000 for the year ended December 31, 2013.
See Notes to Pro-forma Combined Financial Statements.
83
Multimanager International Equity
The following table presents the Portfolio’s gross derivative assets and liabilities by counterparty net of amounts available for offset under netting arrangements and any related collateral received or pledged by the Portfolio as of December 31, 2013:
Counterparty | Gross Amount of Derivative Assets Presented in the Statement of Assets and Liabilities (a) | Derivatives Available for Offset | Collateral Received | Net Amount Due from Counterparty | ||||||||||||
Exchange Traded Futures & Options Contracts (b) | $ | 2,676,502 | (c) | $ | — | $ | — | $ | 2,676,502 | |||||||
|
|
|
|
|
|
|
| |||||||||
Counterparty | Gross Amount of Derivative Liabilities Presented in the Statement of Assets and Liabilities (a) | Derivatives Available for Offset | Collateral Pledged | Net Amount Due to Counterparty | ||||||||||||
Credit Suisse | $ | 27,495 | $ | — | $ | — | $ | 27,495 | ||||||||
State Street Bank & Trust | 914 | — | — | 914 | ||||||||||||
|
|
|
|
|
|
|
| |||||||||
| $ | 28,409 | $ | — | $ | — | $ | 28,409 | |||||||||
|
|
|
|
|
|
|
| |||||||||
EQ/International Core PLUS
The following table presents the Portfolio’s gross derivative assets and liabilities by counterparty net of amounts available for offset under netting arrangements and any related collateral received or pledged by the Portfolio as of December 31, 2013:
Counterparty | Gross Amount of Derivative Assets Presented in the Statement of Assets and Liabilities (a) | Derivatives Available for Offset | Collateral Received | Net Amount Due from Counterparty | ||||||||||||
JPMorgan Chase Bank | $ | 127,197 | $ | — | $ | — | $ | 127,197 | ||||||||
Goldman Sachs & Co. | 157 | (157 | ) | — | — | |||||||||||
Barclays Bank plc | 122 | (122 | ) | — | — | |||||||||||
Deutsche Bank AG | 48 | — | — | 48 | ||||||||||||
Exchange Traded Futures & Options Contracts (b) | 17,117,191 | (c) | — | — | 17,117,191 | |||||||||||
|
|
|
|
|
|
|
| |||||||||
| $ | 17,244,715 | $ | (279 | ) | $ | — | $ | 17,244,436 | ||||||||
|
|
|
|
|
|
|
| |||||||||
Counterparty | Gross Amount of Derivative Liabilities Presented in the Statement of Assets and Liabilities (a) | Derivatives Available for Offset | Collateral Pledged | Net Amount Due to Counterparty | ||||||||||||
BNP Paribas | $ | 28,900 | $ | — | $ | — | $ | 28,900 | ||||||||
Barclays Bank plc | 29,932 | (122 | ) | — | 29,810 | |||||||||||
Goldman Sachs & Co. | 107,544 | (157 | ) | — | 107,387 | |||||||||||
|
|
|
|
|
|
|
| |||||||||
| $ | 166,376 | $ | (279 | ) | $ | — | $ | 166,097 | ||||||||
|
|
|
|
|
|
|
| |||||||||
Combined Pro-Forma
The following table presents the Portfolio’s gross derivative assets and liabilities by counterparty net of amounts available for offset under netting arrangements and any related collateral received or pledged by the Portfolio as of December 31, 2013:
Counterparty | Gross Amount of Derivative Assets Presented in the Statement of Assets and Liabilities (a) | Derivatives Available for Offset | Collateral Received | Net Amount Due from Counterparty | ||||||||||||
JPMorgan Chase Bank | 127,197 | — | — | 127,197 | ||||||||||||
Goldman Sachs & Co. | 157 | (157 | ) | — | — | |||||||||||
Barclays Bank plc | 122 | (122 | ) | — | — | |||||||||||
Deutsche Bank AG | 48 | — | — | 48 | ||||||||||||
Exchange Traded Futures & Options Contracts (b) | 19,793,693 | (c) | — | — | 19,793,693 | |||||||||||
|
|
|
|
|
|
|
| |||||||||
| $ | 19,921,217 | $ | (279 | ) | $ | — | $ | 19,920,938 | ||||||||
|
|
|
|
|
|
|
| |||||||||
Counterparty | Gross Amount of Derivative Liabilities Presented in the Statement of Assets and Liabilities (a) | Derivatives Available for Offset | Collateral Pledged | Net Amount Due to Counterparty (cannot be less than zero) | ||||||||||||
BNP Paribas | $ | 28,900 | $ | — | $ | — | $ | 28,900 | ||||||||
Barclays Bank plc | 29,932 | (122 | ) | — | 29,810 | |||||||||||
Credit Suisse | 27,495 | — | — | 27,495 | ||||||||||||
Goldman Sachs & Co. | 107,544 | (157 | ) | — | 107,387 | |||||||||||
State Street Bank & Trust | 914 | — | — | 914 | ||||||||||||
|
|
|
|
|
|
|
| |||||||||
| $ | 194,785 | $ | (279 | ) | $ | — | $ | 194,506 | ||||||||
|
|
|
|
|
|
|
| |||||||||
| (a) | For financial reporting purposes the Portfolio does not offset derivative assets and derivative liabilities subject to master netting arrangements in the Statement of Assets and Liabilities. |
| (b) | These derivatives are traded on an exchange, therefore they are not subject to master netting arrangements. |
| (c) | This amount represents the cumulative appreciation (depreciation) of futures contracts as reported in the Portfolio of Investments. The Statement of Assets and Liabilities only reflect the current day variation margin receivable/payable to brokers for futures contracts. |
See Notes to Pro-forma Combined Financial Statements.
84
Investment security transactions for the year ended December 31, 2013 were as follows:
| Multimanager International Equity | EQ/International Core PLUS | COMBINED PRO FORMA | ||||||||||
Cost of Purchases: | ||||||||||||
Long-term investments other than U.S. government debt securities | $ | 162,352,856 | $ | 189,671,887 | $ | 352,024,743 | ||||||
Net Proceeds of Sales and Redemptions: | ||||||||||||
Long-term investments other than U.S. government debt securities | $ | 267,935,852 | $ | 455,404,219 | $ | 723,340,071 | ||||||
See Notes to Pro-forma Combined Financial Statements.
85
As of December 31, 2013, the gross unrealized appreciation (depreciation) of investments based on the aggregate cost of investments for federal income tax purposes was as follows:
| Multimanager International Equity | EQ/International Core PLUS | Combined Pro Forma | ||||||||||
Aggregate gross unrealized appreciation | $ | 85,423,856 | $ | 397,660,799 | $ | 483,084,655 | ||||||
Aggregate gross unrealized depreciation | (10,158,798 | ) | (27,413,421 | ) | (37,572,219 | ) | ||||||
|
|
|
|
|
| |||||||
Net unrealized appreciation | $ | 75,265,058 | $ | 370,247,378 | $ | 445,512,436 | ||||||
|
|
|
|
|
| |||||||
Federal income tax cost of investments | $ | 208,401,048 | $ | 1,192,715,418 | $ | 1,401,116,466 | ||||||
|
|
|
|
|
| |||||||
Capital Loss Carryforward
Multimanager International Equity
The Portfolio has a net capital loss carryforward of $1,051,476,094 of which $79,721,486 expires in the year 2016 and $971,754,608 expires in the year 2017. The Portfolio utilized net capital loss carryforward of $47,357,294 during 2013.
The Portfolio utilized net capital loss carryforward under the provisions of the Regulated Investment Company Modernization Act of 2010 of $763,049 for Short Term and $9,006,540 for Long Term during 2013.
EQ/International Core PLUS
The Portfolio has a net capital loss carryforward of $269,709,849 of which $228,456,280 expires in the year 2017 and $41,253,569 expires in the year 2018. The Portfolio utilized net capital loss carryforward of $80,531,828 during 2013.
The Portfolio utilized net capital loss carryforward under the provisions of the Regulated Investment Company Modernization Act of 2010 of $38,985,742 for Short Term and $10,476,217 for Long Term during 2013.
Combined Pro-Forma
The Portfolio has a net capital loss carryforward of $1,321,185,943 of which $79,721,486 expires in the year 2016, $1,200,210,888 expires in the year 2017 and $41,253,569 expires in the year 2018. The Portfolio utilized net capital loss carryforward of $127,889,122 during 2013.
The Portfolio utilized net capital loss carryforward under the provisions of the Regulated Investment Company Modernization Act of 2010 of $39,748,791 for Short Term and $19,482,757 for Long Term during 2013.
Certain capital loss carryforwards may be subject to limitations on use pursuant to applicable U.S. Federal Income Tax Law. Therefore, it is possible not all of these capital losses will be available for use.
See Notes to Pro-forma Combined Financial Statements.
86
Statement Of Assets and Liabilities
December 31, 2013
| Multimanager International Equity | EQ/International Core PLUS | Pro Forma Adjustment | Pro Forma Combined | |||||||||||||
Investments at cost: Affiliated Issuers | $ | 315,975 | $ | 2,272,962 | $ | 2,588,937 | ||||||||||
Investments at cost: Unaffiliated Issuers | $ | 205,412,435 | $ | 1,150,397,396 | $ | 1,355,809,831 | ||||||||||
Foreign cash at cost | $ | 56,104,318 | $ | 383,010,560 | $ | 439,114,878 | ||||||||||
ASSETS | ||||||||||||||||
Investments at value: Affiliated Issuers | $ | 436,589 | $ | 3,165,832 | $ | 3,602,421 | ||||||||||
Investments at value: Unaffiliated Issuers | 283,229,517 | 1,559,796,964 | 1,843,026,481 | |||||||||||||
Cash | 12,066,649 | 7,169,826 | 19,236,475 | |||||||||||||
Foreign cash | 51,299,555 | 375,822,857 | 427,122,412 | |||||||||||||
Cash held as collateral at broker | 4,189,000 | 23,864,000 | 28,053,000 | |||||||||||||
Receivable for securities sold | 1,344,255 | 2,129,122 | 3,473,377 | |||||||||||||
Dividends, interest, and other receivables | 1,254,435 | 2,187,886 | 3,442,321 | |||||||||||||
Due from broker for futures variation margin | 189,595 | 1,096,599 | 1,286,194 | |||||||||||||
Receivable from Separate Accounts for Trust shares sold | 82,206 | 69,772 | 151,978 | |||||||||||||
Unrealized appreciation on forward foreign currency contracts | — | 127,524 | 127,524 | |||||||||||||
Other assets | 1,901 | 76,821 | 78,722 | |||||||||||||
|
|
|
|
|
|
|
| |||||||||
Total assets | 354,093,702 | 1,975,507,203 | — | 2,329,600,905 | ||||||||||||
|
|
|
|
|
|
|
| |||||||||
| — | ||||||||||||||||
LIABILITIES | ||||||||||||||||
Payable to Separate Accounts for Trust shares redeemed | 224,953 | 1,888,305 | 2,113,258 | |||||||||||||
Investment management fees payable | 195,916 | 986,515 | 1,182,431 | |||||||||||||
Payable for securities purchased | 112,675 | 378,257 | 490,932 | |||||||||||||
Distribution fees payable - Class B/IB | 21,977 | 326,765 | 348,742 | |||||||||||||
Administrative fees payable | 76,344 | 233,679 | 310,023 | |||||||||||||
Unrealized depreciation on forward foreign currency contracts | 28,409 | 166,376 | 194,785 | |||||||||||||
Trustees’ fees payable | 34,359 | 1,658 | 36,017 | |||||||||||||
Distribution fees payable - Class A/IA | 2,845 | 2,312 | 5,157 | |||||||||||||
Accrued expenses | 131,205 | 76,923 | 208,128 | |||||||||||||
|
|
|
|
|
|
|
| |||||||||
Total liabilities | 828,683 | 4,060,790 | — | 4,889,473 | ||||||||||||
|
|
|
|
|
|
|
| |||||||||
NET ASSETS | $ | 353,265,019 | $ | 1,971,446,413 | $ | — | $ | 2,324,711,432 | ||||||||
|
|
|
|
|
|
|
| |||||||||
Net assets were comprised of: | ||||||||||||||||
Paid in capital | 1,358,685,009 | 1,881,888,800 | 3,240,632,849 | |||||||||||||
Accumulated undistributed net investment income (loss) | (519,478 | ) | (4,041,940 | ) | (5,372,106 | ) | ||||||||||
Accumulated undistributed net realized gain (loss) on investments, futures and foreign currency transactions | (1,080,723,166 | ) | (326,670,200 | ) | (1,406,641,718 | ) | ||||||||||
Net unrealized appreciaiton (depreciation) on investments, futures and foreign currency translations | 75,822,654 | 420,269,753 | 496,092,407 | |||||||||||||
|
|
|
|
|
|
|
| |||||||||
Net Assets | $ | 353,265,019 | $ | 1,971,446,413 | $ | — | $ | 2,324,711,432 | ||||||||
|
|
|
|
|
|
|
| |||||||||
Class A/IA Shares: | ||||||||||||||||
Net Assets | 13,704,389 | 11,118,362 | 24,822,751 | |||||||||||||
Shares outstanding | 1,138,735 | 1,078,274 | 190,335 | a- | 2,407,344 | |||||||||||
|
|
|
|
|
|
|
| |||||||||
Net asset value, offering and redemption price per share | $ | 12.03 | $ | 10.31 | $ | 10.31 | ||||||||||
|
|
|
|
|
|
|
| |||||||||
Class B/IB Shares: | ||||||||||||||||
Net Assets | 106,515,068 | 1,566,557,155 | 1,673,072,223 | |||||||||||||
Shares outstanding | 8,867,746 | 151,745,858 | 1,449,924 | a- | 162,063,528 | |||||||||||
|
|
|
|
|
|
|
| |||||||||
Net asset value, offering and redemption price per share | $ | 12.01 | $ | 10.32 | $ | 10.32 | ||||||||||
|
|
|
|
|
|
|
| |||||||||
Class K Shares: | ||||||||||||||||
Net Assets | 233,045,562 | 393,770,896 | 626,816,458 | |||||||||||||
Shares outstanding | 19,365,240 | 38,184,268 | 3,233,368 | a- | 60,782,876 | |||||||||||
|
|
|
|
|
|
|
| |||||||||
Net asset value, offering and redemption price per share | $ | 12.03 | $ | 10.31 | $ | 10.31 | ||||||||||
|
|
|
|
|
|
|
| |||||||||
| a- | Reflects adjustment for additional shares issued of the acquiring Portfolio. |
See Notes to Pro-forma Combined Financial Statements.
87
STATEMENT OF OPERATIONS
For The Year Ended December 31, 2013
| Multimanager International Equity | EQ/ International Core PLUS | Pro Forma Adjustment | Pro Forma Combined | |||||||||||||
Foreign withholding tax | $ | 920,062 | $ | 1,788,074 | $ | 2,708,136 | ||||||||||
Dividend income received from affiliates | $ | 27,173 | $ | 58,883 | $ | 86,056 | ||||||||||
INVESTMENT INCOME | ||||||||||||||||
Dividends | $ | 11,808,844 | $ | 30,417,507 | $ | 42,226,351 | ||||||||||
Interest | 64,878 | 139,189 | 204,067 | |||||||||||||
|
|
|
|
|
|
|
| |||||||||
Total income | 11,873,722 | 30,556,696 | — | 42,430,418 | ||||||||||||
|
|
|
|
|
|
|
| |||||||||
EXPENSES | ||||||||||||||||
Investment management fees | 4,585,952 | 9,538,391 | (1,407,124 | ) c- | 12,717,219 | |||||||||||
Distribution fees - Class B/IB | 684,232 | 2,993,685 | 3,677,917 | |||||||||||||
Administrative fees | 841,959 | 2,376,183 | (314,071 | ) c- | 2,904,071 | |||||||||||
Custodian fees | 265,100 | 200,000 | (315,346 | ) a- | 149,754 | |||||||||||
Printing and mailing expenses | 61,427 | 171,727 | (102,116 | ) a- | 131,038 | |||||||||||
Professional fees | 79,676 | 89,464 | (86,650 | ) a- | 82,490 | |||||||||||
Distribution fees - Class A/IA | 32,169 | 27,541 | 59,710 | |||||||||||||
Trustees’ fees | 13,458 | 38,500 | (18,698 | ) | 33,260 | |||||||||||
Miscellaneous | 197,022 | 255,596 | (338,024 | ) a- | 114,594 | |||||||||||
|
|
|
|
|
|
|
| |||||||||
Gross expenses | 6,760,995 | 15,691,087 | (2,582,029 | ) | 19,870,053 | |||||||||||
|
|
|
|
|
|
|
| |||||||||
Less: Waiver from investment manager | (374,445 | ) | — | 374,445 | d- | — | ||||||||||
Fees paid indirectly | (32,600 | ) | (8,713 | ) | 41,313 | b- | — | |||||||||
|
|
|
|
|
|
|
| |||||||||
Net expenses | 6,353,950 | 15,682,374 | (2,166,271 | ) | 19,870,053 | |||||||||||
|
|
|
|
|
|
|
| |||||||||
NET INVESTMENT INCOME (LOSS) | 5,519,772 | 14,874,322 | 2,166,271 | 22,560,365 | ||||||||||||
|
|
|
|
|
|
|
| |||||||||
Realized gain (loss) from affiliates | (22,804 | ) | (16,811 | ) | (39,615 | ) | ||||||||||
REALIZED AND UNREALIZED GAIN (LOSS) | ||||||||||||||||
Realized gain (loss) on: | ||||||||||||||||
Investments | 75,393,471 | 52,905,718 | 128,299,189 | |||||||||||||
Futures | 23,687,113 | 68,192,885 | 91,879,998 | |||||||||||||
Foreign currency transactions | (901,126 | ) | 543,384 | (357,742 | ) | |||||||||||
|
|
|
|
|
|
|
| |||||||||
Net realized gain (loss) | 98,179,458 | 121,641,987 | — | 219,821,445 | ||||||||||||
|
|
|
|
|
|
|
| |||||||||
Change in unrealized appreciation (depreciation) from affiliates | 202,961 | 1,058,191 | 1,261,152 | |||||||||||||
Change in unrealized appreciation (depreciation) on: | ||||||||||||||||
Investments | (30,914,340 | ) | 167,933,192 | 137,018,852 | ||||||||||||
Futures | (442,081 | ) | 12,555,120 | 12,113,039 | ||||||||||||
Foreign currency translations | (5,674,428 | ) | (5,155,937 | ) | (10,830,365 | ) | ||||||||||
|
|
|
|
|
|
|
| |||||||||
Net change in unrealized appreciation (depreciation) | (37,030,849 | ) | 175,332,375 | — | 138,301,526 | |||||||||||
|
|
|
|
|
|
|
| |||||||||
NET REALIZED AND UNREALIZED GAIN (LOSS) | 61,148,609 | 296,974,362 | — | 358,122,971 | ||||||||||||
|
|
|
|
|
|
|
| |||||||||
NET INCREASE (DECREASE) IN NET ASSETS RESULTING FROM OPERATIONS | $ | 66,668,381 | $ | 311,848,684 | $ | 2,166,271 | $ | 380,683,336 | ||||||||
|
|
|
|
|
|
|
| |||||||||
| a- | Reflects adjustment due to elimination of duplicative expenes. |
| b- | Reflects adjustment due to termination of the brokerage recapture program. |
| c- | Reflects adjustment in expenses due to the effects of new contract rate for acquiring Fund. |
| d- | Reflects elimination of waiver due to expense adjustment. |
See Notes to Pro-forma Combined Financial Statements.
88
NOTES TO PRO FORMA COMBINED FINANCIAL STATEMENTS
As of December 31, 2013
NOTE 1 – BASIS OF COMBINATION AND SIGNIFICANT ACCOUNTING POLICIES:
EQ Advisors Trust (the “Trust’) was organized as a Delaware statutory trust on October 31, 1996 and is registered under the Investment Company Act of 1940, as amended, as an open-end management investment company with numerous portfolios. The Board of Trustees of the “Trust” and the Board of Trustees of the AXA Premier VIP Trust (“VIP Trust”), approved a proposed Agreement and Plan of Reorganization and Termination (the “Reorganization Plan”) on December 10-11, 2013 and December 4, 2013 respectively, that provides for the transfer of all assets of the Multimanager International Equity Portfolio, a series of VIP Trust (“International Equity Portfolio”) to the EQ/International Core PLUS Portfolio, a series of the Trust (“International Core PLUS Portfolio”), and the assumption by the International Core PLUS Portfolio of all of the liabilities of the International Equity Portfolio in exchange for shares of the International Core PLUS Portfolio having an aggregate value equal to the net assets of the International Equity Portfolio, the distribution of the International Core PLUS Portfolio shares to the International Equity Portfolio shareholders of record determined immediately after the close of business on the closing date, and the subsequent liquidation of the International Equity Portfolio.
The International Equity Portfolio’s annual contractual management fee rate equals 0.850% of average daily net assets for the first $750 million, 0.800% of average daily net assets for the next $1 billion, 0.775% for the next $3 billion, 0.750% for the next $5 billion, and 0.725% of average daily net assets thereafter. The International Core PLUS Portfolio’s annual contractual management fee rate equals 0.600% of average daily net assets for the first $2 billion, 0.550% of average daily net assets for the next $1 billion, 0.525% of average daily net assets for the next $3 billion, 0.500% of average daily net assets for the next $5 billion, and 0.475% of average daily net assets thereafter. The Reorganization Plan is subject to the approval of the International Equity Portfolio’s shareholders. A special meeting of shareholders of the International Equity Portfolio will be held on or about May 21, 2014.
The Reorganization will be accounted for as a tax-free reorganization of investment companies. The unaudited pro forma combined financial statements are presented for the information of the reader and may not necessarily be representative of what the actual combined financial statements would have been had the Reorganization occurred at December 31, 2013. The unaudited pro forma combined portfolio of investments and statement of assets and liabilities reflect the financial position of the International Equity Portfolio and the International Core PLUS Portfolio at December 31, 2013. The unaudited pro forma combined statement of operations reflects the results of operations of the International Core PLUS Portfolio as if it had acquired the International Equity Portfolio at the beginning of the year ended December 31, 2013. These statements have been derived from the Portfolios’ respective books and records utilized in calculating daily net asset value at the dates indicated above for each Portfolio under accounting principles generally accepted in the United States of America. The historical cost of investment securities will be carried forward to the surviving entity and results of operations of the International Core PLUS Portfolio for pre-combination periods will not be restated.
The unaudited pro forma combined portfolio of investments and statements of assets and liabilities and operations should be read in conjunction with the historical financial statements of the Portfolios included in the Trust’s Statement of Additional Information, each of the Portfolios has substantially the same significant accounting policies as detailed in the historical financial statements. The preparation of financial statements in accordance with accounting principles generally accepted in the United States of America requires management to make estimates and assumptions that affect the reported amounts and disclosures. Actual results could differ from those estimates.
Following the Reorganization, the International Core PLUS Portfolio is the “accounting survivor.”
89
NOTE 2 – SHARES:
The unaudited pro forma net asset value per share assumes additional common shares of beneficial interest issued in connection with the proposed acquisition of the International Equity Portfolio by the International Core PLUS Portfolio as of December 31, 2013. The number of additional shares issued was calculated based on the net assets of the International Equity Portfolio and net asset value per share of the International Core PLUS Portfolio at December 31, 2013.
NOTE 3 – Taxes:
Each Portfolio, as well as the Acquiring Portfolio after the Reorganization, intends to comply with the requirements of the Internal Revenue Code of 1986, as amended applicable to regulated investment companies (“RICS”) and to distribute substantially all of its net investment income and net realized capital gains to shareholders of each Portfolio. Therefore, no Federal income tax provision is required.
NOTE 4 – UNAUDITED PRO FORMA COMBINED ADJUSTMENTS:
The accompanying unaudited pro forma combined financial statements reflect changes in the International Core PLUS Portfolio’s shares as if the merger had taken place on December 31, 2013. The International Equity Portfolio will bear the expenses, based on the fraction that its shareholder accounts will bear to the shareholder accounts of the Acquired Portfolios at the merger date, of the Reorganization (i.e., the costs associated with preparing, printing and distributing the prospectus and proxy materials, legal and accounting fees in connection with the Reorganization, and expenses of holding the shareholders meeting), such expenses, which are not reflected in the unaudited pro forma combined statement of operations, are estimated at approximately $102,000.
90
PART C
OTHER INFORMATION
| Item 15. | Indemnification |
Registrant’s Amended and Restated Agreement and Declaration of Trust (“Declaration of Trust”) and By-Laws.
Article VII, Section 2 of the Declaration of Trust of EQ Advisors Trust (“Trust”) states, in relevant part, that a “Trustee, when acting in such capacity, shall not be personally liable to any Person, other than the Trust or a Shareholder to the extent provided in this Article VII, for any act, omission or obligation of the Trust, of such Trustee or of any other Trustee. The Trustees shall not be responsible or liable in any event for any neglect or wrongdoing of any officer, agent, employee, Manager, or Principal Underwriter of the Trust. The Trust shall indemnify each Person who is serving or has served at the Trust’s request as a director, officer, trustee, employee, or agent of another organization in which the Trust has any interest as a shareholder, creditor, or otherwise to the extent and in the manner provided in the By-Laws.” Article VII, Section 4 of the Trust’s Declaration of Trust further states, in relevant part, that the “Trustees shall be entitled and empowered to the fullest extent permitted by law to purchase with Trust assets insurance for liability and for all expenses reasonably incurred or paid or expected to be paid by a Trustee, officer, employee, or agent of the Trust in connection with any claim, action, suit, or proceeding in which he or she may become involved by virtue of his or her capacity or former capacity as a Trustee of the Trust.”
Article VI, Section 2 of the Trust’s By-Laws states, in relevant part, that “[s]ubject to the exceptions and limitations contained in Section 3 of this Article VI, every [Trustee, officer, employee or other agent of the Trust] shall be indemnified by the Trust to the fullest extent permitted by law against all liabilities and against all expenses reasonably incurred or paid by him or her in connection with any proceeding in which he or she becomes involved as a party or otherwise by virtue of his or her being or having been an agent.” Article VI, Section 3 of the Trust’s By-Laws further states, in relevant part, that “[n]o indemnification shall be provided hereunder to [a Trustee, officer, employee or other agent of the Trust]: (a) who shall have been adjudicated, by the court or other body before which the proceeding was brought, to be liable to the Trust or its Shareholders by reason of willful misfeasance, bad faith, gross negligence or reckless disregard of the duties involved in the conduct of his or her office (collectively, “disabling conduct”); or (b) with respect to any proceeding disposed of (whether by settlement, pursuant to a consent decree or otherwise) without an adjudication by the court or other body before which the proceeding was brought that such [Trustee, officer, employee or other agent of the Trust] was liable to the Trust or its Shareholders by reason of disabling conduct, unless there has been a determination that such [Trustee, officer, employee or other agent of the Trust] did not engage in disabling conduct: (i) by the court or other body before which the proceeding was brought; (ii) by at least a majority of those Trustees who are neither Interested Persons of the Trust nor are parties to the proceeding based upon a review of readily available facts (as opposed to a full trial-type inquiry); or (iii) by written opinion of independent legal counsel based upon a review of readily available facts (as opposed to a full trial-type inquiry); provided, however, that indemnification shall be provided hereunder to [a Trustee, officer, employee or other agent of the Trust] with respect to any proceeding in the event of (1) a final decision on the merits by the court or other body before which the proceeding was brought that the [Trustee, officer, employee or other agent of the Trust] was not liable by reason of disabling conduct, or (2) the dismissal of the proceeding by the court or other body before which it was brought for insufficiency of evidence of any disabling conduct with which such [Trustee, officer, employee or other agent of the Trust] has been charged.” Article VI, Section 4 of the Trust’s By-Laws also states that the “rights of indemnification herein provided (i) may be insured against by policies maintained by the Trust on behalf of any [Trustee, officer, employee or other agent of the Trust], (ii) shall be severable, (iii) shall not be exclusive of or affect any other rights to which any [Trustee, officer, employee or other agent of the Trust] may now or hereafter be entitled and (iv) shall inure to the benefit of [such party’s] heirs, executors and administrators.”
Registrant’s Investment Management Agreements state:
Limitations on Liability. Manager will exercise its best judgment in rendering its services to the Trust, and the Trust agrees, as an inducement to Manager’s undertaking to do so, that the Manager will not be liable for any error of judgment or mistake of law or for any loss suffered by the Trust in connection with the matters to which this Agreement relates, but will be liable only for willful misconduct, bad faith, gross negligence, reckless disregard of its duties or its failure to exercise due care in rendering its services to the Trust as specified in this Agreement. Any
person, even though an officer, director, employee or agent of Manager, who may be or become an officer, Trustee, employee or agent of the Trust, shall be deemed, when rendering services to the Trust or when acting on any business of the Trust, to be rendering such services to or to be acting solely for the Trust and not as an officer, director, employee or agent, or one under the control or direction of Manager, even though paid by it.
Sections 5(a) and 5(b) of the Registrant’s Investment Advisory Agreements generally state:
| 5. | LIABILITY AND INDEMNIFICATION |
(a) Except as may otherwise be provided by the Investment Company Act or any other federal securities law, neither the Adviser nor any of its officers, members or employees (its “Affiliates”) shall be liable for any losses, claims, damages, liabilities or litigation (including legal and other expenses) incurred or suffered by the Manager or the Trust as a result of any error of judgment or mistake of law by the Adviser or its Affiliates with respect to the services provided to the Portfolio, except that nothing in this Agreement shall operate or purport to operate in any way to exculpate, waive or limit the liability of the Adviser or its Affiliates for, and the Adviser shall indemnify and hold harmless the Trust, the Manager, all affiliated persons thereof (within the meaning of Section 2(a)(3) of the Investment Company Act) and all controlling persons (as described in Section 15 of the Securities Act of 1933, as amended (“1933 Act”)) (collectively, “Manager Indemnitees”) against any and all losses, claims, damages, liabilities or litigation (including reasonable legal and other expenses) to which any of the Manager Indemnitees may become subject under the 1933 Act, the Investment Company Act, the Advisers Act, or under any other statute, at common law or otherwise arising out of or based on (i) any willful misconduct, bad faith, reckless disregard or gross negligence of the Adviser in the performance of any of its duties or obligations hereunder or (ii) any untrue statement of a material fact contained in the Prospectus and SAI, proxy materials, reports, advertisements, sales literature, or other materials pertaining to the Portfolio or the omission to state therein a material fact known to the Adviser which was required to be stated therein or necessary to make the statements therein not misleading, if such statement or omission was made in reliance upon information furnished to the Manager or the Trust by the Adviser Indemnitees (as defined below) for use therein.
(b) Except as may otherwise be provided by the Investment Company Act or any other federal securities law, the Manager and the Trust shall not be liable for any losses, claims, damages, liabilities or litigation (including reasonable legal and other expenses) incurred or suffered by the Adviser as a result of any error of judgment or mistake of law by the Manager with respect to the Portfolio, except that nothing in this Agreement shall operate or purport to operate in any way to exculpate, waive or limit the liability of the Manager for, and the Manager shall indemnify and hold harmless the Adviser, all affiliated persons thereof (within the meaning of Section 2(a)(3) of the Investment Company Act) and all controlling persons (as described in Section 15 of the 1933 Act) (collectively, “Adviser Indemnitees”) against any and all losses, claims, damages, liabilities or litigation (including reasonable legal and other expenses) to which any of the Adviser Indemnities may become subject under the 1933 Act, the Investment Company Act, the Advisers Act, or under any other statute, at common law or otherwise arising out of or based on (i) any willful misconduct, bad faith, reckless disregard or gross negligence of the Manager in the performance of any of its duties or obligations hereunder or (ii) any untrue statement of a material fact contained in the Prospectus and SAI, proxy materials, reports, advertisements, sales literature, or other materials pertaining to the Portfolio or the omission to state therein a material fact known to the Manager which was required to be stated therein or necessary to make the statements therein not misleading, unless such statement or omission was made in reliance upon information furnished to the Manager or the Trust by the Adviser Indemnitees for use therein.
Section 14 of the Registrant’s Distribution Agreements states:
The Trust shall indemnify and hold harmless [the Distributor] from any and all losses, claims, damages or liabilities (or actions in respect thereof) to which [the Distributor] may be subject, insofar as such losses, claims, damages or liabilities (or actions in respect thereof) arise out of or result from negligent, improper, fraudulent or unauthorized acts or omissions by the Trust or its officers, trustees, agents or representatives, other than acts or omissions caused directly or indirectly by [the Distributor].
[The Distributor] will indemnify and hold harmless the Trust, its officers, trustees, agents and representatives against any losses, claims, damages or liabilities, to which the Trust, its officers, trustees, agents and representatives may
become subject, insofar as such losses, claims, damages or liabilities (or actions in respect thereof) arise out of or are based upon: (i) any untrue statement or alleged untrue statement of any material fact contained in the Trust Prospectus and/or SAI or any supplements thereto; (ii) the omission or alleged omission to state any material fact required to be stated in the Trust Prospectus and/or SAI or any supplements thereto or necessary to make the statements therein not misleading; or (iii) other misconduct or negligence of [the Distributor] in its capacity as a principal underwriter of the Trust’s Class [IA, IB and/or K] shares and will reimburse the Trust, its officers, Trustees, agents and representatives for any legal or other expenses reasonably incurred by any of them in connection with investigating or defending against such loss, claim, damage, liability or action; provided, however, that [the Distributor] shall not be liable in any such instance to the extent that any such loss, claim, damage or liability arises out of or is based upon an untrue statement or alleged untrue statement or omission or alleged omission made in the Trust Prospectus and/or SAI or any supplement in good faith reliance upon and in conformity with written information furnished by the Preparing Parties specifically for use in the preparation of the Trust Prospectus and/or SAI.
Section 6 of the Registrant’s Mutual Funds Service Agreement states:
(a) FMG LLC shall not be liable for any error of judgment or mistake of law or for any loss or expense suffered by the Trust, in connection with the matters to which this Agreement relates, except for a loss or expense caused by or resulting from or attributable to willful misfeasance, bad faith or negligence on FMG LLC’s part (or on the part of any third party to whom FMG LLC has delegated any of its duties and obligations pursuant to Section 4(c) hereunder) in the performance of its (or such third party’s) duties or from reckless disregard by FMG LLC (or by such third party) of its obligations and duties under this Agreement (in the case of FMG LLC) or under an agreement with FMG LLC (in the case of such third party) or, subject to Section 10 below, FMG LLC’s (or such third party) refusal or failure to comply with the terms of this Agreement (in the case of FMG LLC) or an agreement with FMG LLC (in the case of such third party) or its breach of any representation or warranty under this Agreement (in the case of FMG LLC) or under an agreement with FMG LLC (in the case of such third party). In no event shall FMG LLC (or such third party) be liable for any indirect, incidental special or consequential losses or damages of any kind whatsoever (including but not limited to lost profits), even if FMG LLC (or such third party) has been advised of the likelihood of such loss or damage and regardless of the form of action.
(b) Except to the extent that FMG LLC may be held liable pursuant to Section 6(a) above, FMG LLC shall not be responsible for, and the Trust shall indemnify and hold FMG LLC harmless from and against any and all losses, damages, costs, reasonable attorneys’ fees and expenses, payments, expenses and liabilities including, but not limited to, those arising out of or attributable to:
(i) any and all actions of FMG LLC or its officers or agents required to be taken pursuant to this Agreement;
(ii) the reliance on or use by FMG LLC or its officers or agents of information, records, or documents which are received by FMG LLC or its officers or agents and furnished to it or them by or on behalf of the Trust, and which have been prepared or maintained by the Trust or any third party on behalf of the Trust;
(iii) the Trust’s refusal or failure to comply with the terms of this Agreement or the Trust’s lack of good faith, or its actions, or lack thereof, involving negligence or willful misfeasance;
(iv) the breach of any representation or warranty of the Trust hereunder;
(v) the reliance on or the carrying out by FMG LLC or its officers or agents of any proper instructions reasonably believed to be duly authorized, or requests of the Trust;
(vi) any delays, inaccuracies, errors in or omissions from information or data provided to FMG LLC by data services, including data services providing information in connection with any third party computer system licensed to FMG LLC, and by any corporate action services, pricing services or securities brokers and dealers;
(vii) the offer or sale of shares by the Trust in violation of any requirement under the Federal securities laws or regulations or the securities laws or regulations of any state, or in violation of any stop order or other determination or ruling by any Federal agency or any state agency with respect to the offer or sale of such shares in such state (1) resulting from activities, actions, or omissions by the Trust or its other service providers and agents, or (2) existing or arising out of activities, actions or omissions by or on behalf of the Trust prior to the effective date of this Agreement;
(viii) any failure of the Trust’s registration statement to comply with the 1933 Act and the 1940 Act (including the rules and regulations thereunder) and any other applicable laws, or any untrue statement of a material fact or omission of a material fact necessary to make any statement therein not misleading in a Trust’s prospectus;
(ix) except as provided for in Schedule B.III., the actions taken by the Trust, its Manager, its investment advisers, and its distributor in compliance with applicable securities, tax, commodities and other laws, rules and regulations, or the failure to so comply, and
(x) all actions, inactions, omissions, or errors caused by third parties to whom FMG LLC or the Trust has assigned any rights and/or delegated any duties under this Agreement at the specific request of or as required by the Trust, its Portfolio, investment advisers, or Trust distributors.
The Trust shall not be liable for any indirect, incidental, special or consequential losses or damages of any kind whatsoever (including, but not limited to, lost profits) even if the Trust has been advised of the likelihood of such loss or damage and regardless of the form of action, except when the Trust is required to indemnify FMG LLC pursuant to this Agreement.
Section 12(a)(iv) of the Registrant’s Global Custody Agreement states:
(A) Customer shall indemnify and hold Bank and its directors, officers, agents and employees (collectively the “Indemnitees”) harmless from and against any and all claims, liabilities, losses, damages, fines, penalties, and expenses, including out-of-pocket and incidental expenses and legal fees (“Losses”) that may be incurred by, or asserted against, the Indemnitees or any of them for following any instructions or other directions upon which Bank is authorized to rely pursuant to the terms of this Agreement. (B) In addition to and not in limitation of the preceding subparagraph, Customer shall also indemnify and hold the Indemnitees and each of them harmless from and against any and all Losses that may be incurred by, or asserted against, the Indemnitees or any of them in connection with or arising out of Bank’s performance under this Agreement, provided the Indemnitees have not acted with negligence or engaged in willful misconduct. (C) In performing its obligations hereunder, Bank may rely on the genuineness of any document which it reasonably believes in good faith to have been validly executed.
Article VIII of the Registrant’s Participation Agreement states:
8.1(a). AXA Equitable Life Insurance Company (for the purposes of this Article, “Equitable”) agrees to indemnify and hold harmless the Trust, each member of the Board, the Distributors, and the directors and officers and each person, if any, who controls any such person within the meaning of Section 15 of the 1933 Act (collectively, the “Indemnified Parties” for purposes of this Section 8.1) against any and all losses, claims, damages, liabilities (including amounts paid in settlement with the written consent of Equitable), investigation of claims or litigation (including legal and other expenses), to which the Indemnified Parties may become subject under any statute, regulation, at common law or otherwise, insofar as such losses, claims, damages, liabilities or expenses (or actions in respect thereof) or settlements are related to the sale or acquisition of the Trust’s shares or the Equitable Contracts or interests in the Accounts and:
(i) arise out of or are based upon any untrue statements or alleged untrue statements of any material fact contained in the registration statement, prospectus, or Statement of Additional Information for the Equitable Contracts or contained in the Equitable Contracts or sales literature for the Equitable Contracts (or any amendment or supplement to any of the foregoing), or arise out of or are based upon the omission or the alleged omission to state therein a material fact required to be stated therein or necessary to make the
statements therein not misleading, provided that this agreement to indemnify shall not apply as to any Indemnified Party if such statement or omission or such alleged statement or omission was made in reliance upon and in conformity with information furnished to Equitable by or on behalf of the Trust for use in the registration statement, prospectus, or Statement of Additional Information for the Equitable Contracts or in the Equitable Contracts or sales literature (or any amendment or supplement) or otherwise for use in connection with the sale of the Equitable Contracts or Trust shares; or
(ii) arise out of or as a result of statements or representations (other than statements or representations contained in the Registration Statement, prospectus or Statement of Additional Information, or sales literature of the Trust not supplied by Equitable or persons under its control) or wrongful conduct of Equitable or persons under its control, with respect to the sale or distribution of the Equitable Contracts or Trust shares; or
(iii) arise out of any untrue statement or alleged untrue statement of a material fact contained in a Registration Statement, prospectus, or Statement of Additional Information, or sales literature of the Trust or any amendment thereof or supplement thereto or the omission or alleged omission to state therein a material fact required to be stated therein or necessary to make the statements therein not misleading if such a statement or omission was made in reliance upon information furnished to the Trust by or on behalf of Equitable; or
(iv) arise as a result of any failure by Equitable to provide the services and furnish the materials required to be provided or furnished by it under the terms of this Agreement; or
(v) arise out of or result from any material breach of any representation and/or warranty made by Equitable in this Agreement or arise out of or result from any other material breach of this Agreement by Equitable;
as limited by and in accordance with the provisions of Sections 8.1(b) and 8.1(c) hereof…
8.2(a). Each of the Distributors agrees to indemnify and hold harmless Equitable, and the Trust and each of their directors and officers and each person, if any, who controls Equitable within the meaning of Section 15 of the 1933 Act (collectively, the “Indemnified Parties” for purposes of this Section 8.2) against any and all losses, claims, damages, liabilities (including amounts paid in settlement with the written consent of the Distributors), investigation of claims or litigation (including legal and other expenses) to which the Indemnified Parties may become subject under any statute, regulation, at common law or otherwise, insofar as such losses, claims, damages, liabilities or expenses (or actions in respect thereof) or settlements are related to the sale or acquisition of the Trust’s shares or the Equitable Contracts or interests in the Accounts and:
(i) arise out of or are based upon any untrue statement or alleged untrue statement of any material fact contained in the Registration Statement, prospectus or Statement of Additional Information, or sales literature of the Trust (or any amendment or supplement to any of the foregoing), or arise out of or are based upon the omission or the alleged omission to state therein a material fact required to be stated therein or necessary to make the statements therein not misleading, provided that this agreement to indemnify shall not apply as to any Indemnified Party if such statement or omission or such alleged statement or omission was made in reliance upon and in conformity with information furnished to the Distributors or Trust by or on behalf of Equitable for use in the Registration Statement, prospectus, or Statement of Additional Information for the Trust, or in sales literature (or any amendment or supplement) or otherwise for use in connection with the sale of the Equitable Contracts or Trust shares; or
(ii) arise out of or as a result of statements or representations (other than statements or representations contained in the registration statement, prospectus or Statement of Additional Information, or sales literature for the Equitable Contracts not supplied by the Distributors or persons under their control) or wrongful conduct of the Distributors or persons under their control, with respect to the sale or distribution of the Equitable Contracts or Trust shares; or
(iii) arise out of any untrue statement or alleged untrue statement of a material fact contained in a registration statement, prospectus, or Statement of Additional Information or sales literature covering the Equitable Contracts, or any amendment thereof or supplement thereto, or the omission or alleged omission to state
therein a material fact required to be stated therein or necessary to make the statement or statements therein not misleading, if such statement or omission was made in reliance upon information furnished to Equitable by or on behalf of the Distributors or the Trust; or
(iv) arise as a result of any failure by the Distributors or the Trust to provide the services and furnish the materials required to be provided or furnished by the Distributors or the Trust under the terms of this Agreement (including a failure, whether unintentional or in good faith or otherwise, to comply with the diversification or other qualification requirements specified in Article VI of this Agreement); or
(v) arise out of or result from any material breach of any representation and/or warranty made by the Distributors in this Agreement or arise out of or result from any other material breach of this Agreement by the Distributors;
as limited by and in accordance with the provisions of Sections 8.2(b) and 8.2(c) hereof…
8.3(a) The Trust agrees to indemnify and hold harmless Equitable and each of its directors and officers and each person, if any, who controls Equitable within the meaning of Section 15 of the 1933 Act (collectively, the “Indemnified Parties” for purposes of this Section 8.3) against any and all losses, claims, damages, liabilities (including amounts paid in settlement with the written consent of the Trust), investigation of claims or litigation (including legal and other expenses) to which the Indemnified Parties may become subject under any statute, regulation, at common law or otherwise, insofar as such losses, claims, damages, liabilities or expenses (or actions in respect thereof) or settlements result from the gross negligence, bad faith or willful misconduct of the Board or any member thereof, are related to the operations of the Trust and:
(i) arise as a result of any failure by the Trust to provide the services and furnish the materials required to be provided or furnished by it under the terms of this Agreement (including a failure to comply with the diversification and other qualification requirements specified in … this Agreement); or
(ii) arise out of or result from any material breach of any representation and/or warranty made by the Trust in this Agreement or arise out of or result from any other material breach of this Agreement by the Trust;
as limited by and in accordance with the provisions of Sections 8.3(b) and 8.3(c) hereof…
Article VII of the Registrant’s Second Amended and Restated Retirement Plan Participation Agreement states:
7.1. Indemnification By the Plan. Except as provided to the contrary in Section 7.4 or 7.5 hereof, AXA Equitable and the Plan shall jointly and severally indemnify and hold harmless the Trust, each member of the Board, the Distributor, the trustees, directors and officers thereof and each person, if any, who controls any such person within the meaning of Section 15 of the 1933 Act (collectively, the “Indemnified Parties” for purposes of this Section 7.1) against any and all losses, claims, damages, liabilities (including amounts paid in settlement with the written consent of AXA Equitable and the Plan), investigation of claims or litigation (including legal and other expenses), to which the Indemnified Parties may become subject under any statute, regulation, at common law or otherwise, insofar as such losses, claims, damages, liabilities or expenses (or actions in respect thereof) or settlements are related to, arise out of or are based upon:
(i) the failure (intentional or otherwise) of the Plan at any time to be or to continue to be a Qualified Plan…;
(ii) the sale or acquisition of the Class K shares of the Designated Portfolios and (1) arise out of or are based upon any untrue statements or alleged untrue statements of any material fact made by AXA Equitable or the Plan or any person under its control or the omission or the alleged omission to state a material fact required to be stated or necessary to make such statements not misleading, unless such statement or omission or alleged statement or omission was made in reliance upon and in conformity with information furnished by the Trust or the Distributor to AXA Equitable or the Plan for use in connection with the sale or distribution of Class K shares of the Designated Portfolios; or (2) arise out of or as a result of warranties or representations (other than warranties or representations contained in a Registration Statement, any SEC Disclosure Materials or sales
literature of the Trust not supplied by the Plan or persons under its control) or wrongful conduct of AXA Equitable or the Plan or any of such, with respect to the sale or distribution of Class K shares of the Designated Portfolios; or (3) arise out of any untrue statement or alleged untrue statement of a material fact contained in a Registration Statement, any SEC Disclosure Materials or sales literature of the Trust or the omission or alleged omission to state therein a material fact required to be stated therein or necessary to make the statements therein not misleading, but only if such a statement or omission was made in reliance upon information furnished to the Trust or the Distributor by AXA Equitable or the Plan or persons under their control; or
(iii) arise as a result of any failure by the Plan to provide the services or furnish the materials required to be provided or furnished by it under the terms of this Agreement; or
(iv) arise out of or result from any material breach of any representation and/or warranty made by AXA Equitable or the Plan in this Agreement or arise out of or result from any other material breach of this Agreement by AXA Equitable or the Plan.
7.2. Indemnification by the Distributor. Except as provided to the contrary in Section 7.4 or 7.5 hereof, the Distributor shall indemnify and hold harmless the Plan, its trustees, the Trust, the Board and their officers and each person, if any, who controls the Plan within the meaning of Section 15 of the 1933 Act (collectively, the “Indemnified Parties” for purposes of this Section 7.2) against any and all losses, claims, damages, liabilities (including amounts paid in settlement with the written consent of the Distributor), investigation of claims or litigation (including legal and other expenses) to which the Indemnified Parties may become subject under any statute, regulation, at common law or otherwise, insofar as such losses, claims, damages, liabilities or expenses (or actions in respect thereof) or settlements are related to, arise out of or are based upon
(i) the sale or acquisition of Class K shares of the Designated Portfolios by the Plan and (1) arise out of or are based upon any untrue statement or alleged untrue statement of any material fact contained in a Registration Statement, any SEC Disclosure Materials or sales literature of the Trust or arise out of or are based upon the omission or the alleged omission to state therein a material fact required to be stated therein or necessary to make the statements therein not misleading, but only if such statement or omission or such alleged statement or omission was made in reliance upon and in conformity with information furnished by the Distributor to the Trust for use in a Registration Statement, any SEC Disclosure Materials or sales literature of the Trust or otherwise for use in connection with the sale or acquisition of Class K shares of the Delegated Portfolios by the Plan; or (2) arise out of any untrue statement or alleged untrue statement of a material fact contained in a Registration Statement, any SEC Disclosure Materials or sales literature of the Trust or the omission or alleged omission to state therein a material fact required to be stated therein or necessary to make the statement or statements therein not misleading, but only if such statement or omission was made in reliance upon information furnished to the Plan or the Trust by the Distributor; or
(ii) any failure by the Distributor to provide the services and furnish the materials required to be provided or furnished by the Distributor under the terms of this Agreement; or
(iii) arise out of or result from any material breach of any representation and/or warranty made by the Distributor in this Agreement or arise out of or result from any other material breach of this Agreement by the Distributor.
7.3. Indemnification By the Trust. Except as provided to the contrary in Section 7.4 or 7.5 hereof, the Trust shall indemnify and hold harmless the Plan and each of its trustees and officers, the Distributor, the directors and officers thereof and each person, if any, who controls any such person within the meaning of Section 15 of the 1933 Act (collectively, the “Indemnified Parties” for purposes of this Section 7.3) against any and all losses, claims, damages, liabilities (including amounts paid in settlement with the written consent of the Trust), investigation of claims or litigation (including legal and other expenses) to which the Indemnified Parties may become subject under any statute, regulation, at common law or otherwise, insofar as such losses, claims, damages, liabilities or expenses (or actions in respect thereof) or settlements result from the gross negligence, bad faith or willful misconduct of the Board or any member thereof, are related to, arise out of or are based upon:
(i) any failure by the Trust to provide the services and furnish the materials required to be provided or furnished by it under the terms of this Agreement (including a failure to comply with the diversification and other qualification requirements specified in … this Agreement); or
(ii) arise out of or result from any material breach of any representation and/or warranty made by the Trust in this Agreement or arise out of or result from any other material breach of this Agreement by the Trust….
| Item 16. | Exhibits |
(1)(a) | Agreement and Declaration of Trust.1 | |
(1)(b)(i) | Amended and Restated Agreement and Declaration of Trust.2 | |
(1)(b)(ii) | Amendment No. 1 to the Amended and Restated Agreement and Declaration of Trust.4 | |
(1)(b)(iii) | Amendment No. 2 to the Amended and Restated Agreement and Declaration of Trust.6 | |
(1)(c) | Certificate of Trust.1 | |
(1)(d) | Certificate of Amendment to the Certificate of Trust.2 | |
(2) | By-Laws.1 | |
(3) | None. | |
(4)(a) | Agreement and Plan of Reorganization and Termination between EQ Advisors Trust (the “Trust”) on behalf of the Multimanager Aggressive Equity Portfolio, Multimanager Technology Portfolio, Multimanager Core Bond Portfolio, Multimanager Mid Cap Growth Portfolio, and Multimanager Mid Cap Value Portfolio, each a series of the Trust and AXA Premier VIP Trust, on behalf of the Multimanager Aggressive Equity Portfolio, Multimanager Technology Portfolio, Multimanager Core Bond Portfolio, Multimanager Mid Cap Growth Portfolio, and Multimanager Mid Cap Value Portfolio, each a series of AXA Premier VIP Trust; filed as Appendix A to the Combined Proxy Statement and Prospectus set forth as Part A to this Registration Statement on Form N-14. | |
(4)(b) | Agreement and Plan of Reorganization and Termination between the Trust on behalf of the EQ/Large Cap Core PLUS Portfolio, EQ/Large Cap Value PLUS Portfolio, and EQ/International Core PLUS Portfolio and AXA Premier VIP Trust on behalf of the Multimanager Large Cap Core Portfolio, Multimanager Large Cap Value Portfolio, and Multimanager International Equity Portfolio; filed as Appendix B to the Combined Proxy Statement and Prospectus set forth as Part A to this Registration Statement on Form N-14. | |
(5) | Provisions of instruments defining the rights of holders of the securities being registered are contained in the Registrant’s Amended and Restated Agreement and Declaration of Trust and By-Laws (Exhibits (1)(b)(i) and (2)). | |
(6) | Investment Advisory Contracts | |
(6)(a) | Investment Management Agreement dated as of May 1, 2011 between the Trust and AXA Equitable Funds Management Group, LLC (“FMG LLC” or “AXA FMG”). 25 | |
(6)(a)(i) | Amendment No. 1 effective as of August 1, 2011 to the Investment Management Agreement dated as of May 1, 2011 between the Trust and FMG LLC. 25 | |
(6)(a)(ii) | Amendment No. 2 effective as of September 1, 2011 to the Investment Management Agreement dated as of May 1, 2011 between the Trust and FMG LLC. 25 | |
| (6)(a)(iii) | Amendment No. 3 effective as of October 1, 2011 to the Investment Management Agreement dated as of May 1, 2011 between the Trust and FMG LLC.27 | |
| (6)(a)(iv) | Amendment No. 4 effective as of February 8, 2013 to the Investment Management Agreement dated as of May 1, 2011 between the Trust and FMG LLC.31 | |
| (6)(a)(v) | Amendment No. 5 effective as of September 1, 2012 to the Investment Management Agreement dated as of May 1, 2011 between the Trust and FMG LLC. 31 | |
| (6)(a)(vi) | Amendment No. 6 effective as of May 1, 2013 to the Investment Management Agreement dated as of May 1, 2011 between the Trust and FMG LLC. 34 | |
| (6)(a)(vii) | Amendment No. 7 effective as of September 1, 2013 to the Investment Management Agreement dated as of May 1, 2011 between the Trust and FMG LLC. 34 | |
| (6)(a)(viii) | Amendment No. 8 effective as of October 21, 2013 to the Investment Management Agreement dated as of May 1, 2011 between the Trust and FMG LLC. 34 | |
| (6)(a)(ix) | Form of Amendment No. 9 effective as of , 2014 to the Investment Management Agreement dated as of May 1, 2011 between the Trust and FMG LLC. 35 | |
| (6)(a)(x) | Form of Amendment No. 10 effective as of , 2014 to the Investment Management Agreement dated as of May 1, 2011 between the Trust and FMG LLC.35 | |
| (6)(b) | Investment Advisory Agreement between FMG LLC and Massachusetts Financial Services Company (doing business as MFS Investment Management) (“MFSIM”) dated as of May 1, 2011.25 | |
| (6)(b)(i) | Amendment No. 1 effective June 6, 2013, to the Investment Advisory Agreement between FMG LLC and MFSIM dated as of May 1, 2011.35 | |
| (6)(b)(ii) | Form of Amendment No. 2 effective as of , 2014, to the Investment Advisory Agreement between FMG LLC and MFSIM dated as of May 1, 2011. 35 | |
| (6)(c) | Investment Advisory Agreement between FMG LLC and AllianceBernstein L.P. (“AllianceBernstein”) effective as of May 1, 2011. 25 | |
| (6)(c)(i) | Amendment No. 1 effective as of September 1, 2011 to the Investment Advisory Agreement between FMG LLC and AllianceBernstein effective as of May 1, 2011. 27 | |
| (6)(c)(ii) | Amendment No. 2 effective as of August 1, 2012 to the Investment Advisory Agreement between FMG LLC and AllianceBernstein effective as of May 1, 2011.31 | |
| (6)(c)(iii) | Amendment No. 3 effective as of September 1, 2012, to the Investment Advisory Agreement between FMG LLC and AllianceBernstein effective as of May 1, 2011.31 | |
| (6)(c)(iv) | Form of Amendment No. 4 effective as of , 2014, to the Investment Advisory Agreement between FMG LLC and AllianceBernstein effective as of May 1, 2011. 35 | |
| (6)(d) | Investment Advisory Agreement between FMG LLC and Capital Guardian Trust Company (“Capital Guardian”) dated as of May 1, 2011. 25 | |
(6)(d)(i) | Amendment No. 1 effective as of June 24, 2013, to the Investment Advisory Agreement between FMG LLC and Capital Guardian dated as of May 1, 2011. 35 | |
(6)(e) | Investment Advisory Agreement between FMG LLC and BlackRock Investment Management LLC (“BlackRock Investment”) effective as of May 1, 2011 with respect to the Tactical Manager Portfolios.25 | |
(6)(e)(i) | Amended and Restated Investment Advisory Agreement between FMG LLC and BlackRock Investment effective as of August 1, 2011 with respect to the Tactical Manager Portfolios.28 | |
(6)(f) | Investment Advisory Agreement between FMG LLC and Institutional Capital, LLC (“ICAP”) dated as of May 1, 2011. 25 | |
(6)(g) | Investment Advisory Agreement between FMG LLC, Wentworth Hauser and Violich, Inc. (“Wentworth Hauser”) and Hirayama Investments, LLC (“Hirayama Investments”) dated as of May 1, 2011.25 | |
(6)(h) | Amended and Restated Investment Advisory Agreement by and among FMG LLC, WHV Investment Management (“WHV”) (formerly known as Wentworth Hauser) and Hirayama Investments effective as of July 10, 2012.31 | |
(6)(i) | Form of Investment Advisory Agreement between FMG LLC and ClearBridge Advisors LLC (“ClearBridge”) effective as of , 2014. 35 | |
(6)(j) | Form of Investment Advisory Agreement between FMG LLC and Scotia Institutional Asset Management US, Ltd. (“Scotia Institutional”) effective as of , 2014. 35 | |
(6)(k) | Investment Advisory Agreement between FMG LLC and Marsico Capital Management, LLC (“Marsico”) dated as of May 1, 2011. 25 | |
(6)(k)(i) | Form of Amendment No. 1 effective as of , 2014 to the Investment Advisory Agreement between FMG LLC and Marsico dated as of May 1, 2011. 35 | |
(6)(l) | Investment Advisory Agreement between FMG LLC and T. Rowe Price Associates, Inc. (“T. Rowe Price”) dated as of May 1, 2011. 25 | |
(6)(l)(i) | Amendment No. 1 effective as of June 6, 2013, to the Investment Advisory Agreement between FMG LLC and T. Rowe Price dated as of May 1, 2011. 35 | |
(6)(l)(ii) | Form of Amendment No. 2 effective as of , 2014, to the Investment Advisory Agreement between FMG LLC and T. Rowe Price dated as of May 1, 2011. 35 | |
(6)(m) | Form of Investment Advisory Agreement between FMG LLC and Westfield Capital Management Company (“Westfield”) effective as of , 2014. 35 | |
(6)(n) | Form of Investment Advisory Agreement between FMG LLC and Allianz Global Investors U.S. LLC (“Allianz”) effective as of , 2014. 35 | |
(6)(o) | Investment Advisory Agreement between FMG LLC and Wellington Management Company, LLP (“Wellington”) dated as of May 1, 2011. 25 | |
| (6)(o)(i) | Form of Amendment No. 1 effective as of , 2014 to the Investment Advisory Agreement between FMG LLC and Wellington dated as of May 1, 2011. 35 | |
| (6)(p) | Investment Advisory Agreement between FMG LLC and SSgA Funds Management, Inc. (“SSgA FM”) dated as of May 1, 2011. 25 | |
| (6)(p)(i) | Amendment No. 1 effective as of July 10, 2012 to the Investment Advisory Agreement between FMG LLC and SSgA FM dated as of May 1, 2011. 31 | |
| (6)(p)(ii) | Form of Amendment No. 2 effective as of , 2014 to the Investment Advisory Agreement between FMG LLC and SSgA FM dated as of May 1, 2011. 35 | |
| (6)(q) | Form of Investment Advisory Agreement between FMG LLC and BlackRock Financial Management, Inc. (“BlackRock Financial”) effective as of , 2014. 35 | |
| (6)(r) | Investment Advisory Agreement between FMG LLC and Pacific Investment Management Company, LLC (“PIMCO”) dated as of May 1, 2011. 25 | |
| (6)(r)(i) | Amendment No. 1 effective as of May 1, 2012 to the Investment Advisory Agreement between FMG LLC and PIMCO dated as of May 1, 2011. 31 | |
| (6)(r)(ii) | Amendment No. 2 effective as of February 8, 2013 to the Investment Advisory Agreement between FMG LLC and PIMCO dated as of May 1, 2011. 31 | |
| (6)(r)(iii) | Amendment No. 3 effective as of July 19, 2013 to the Investment Advisory Agreement between FMG LLC and PIMCO dated as of May 1, 2011. 35 | |
| (6)(r)(iv) | Form of Amendment No. 4 effective as of , 2014 to the Investment Advisory Agreement between FMG LLC and PIMCO dated as of May 1, 2011. 35 | |
| (6)(s) | Investment Advisory Agreement between FMG LLC and BlackRock Investment effective as of May 1, 2011. 25 | |
| (6)(s)(i) | Amendment No. 1 effective as of July 26, 2013, to the Investment Advisory Agreement between FMG LLC and BlackRock Investment effective as of May 1, 2011. 35 | |
| (6)(s)(ii) | Form of Amendment No. 2 effective as of , 2014, to the Investment Advisory Agreement between FMG LLC and BlackRock Investment effective as of May 1, 2011. 35 | |
| (6)(s)(iii) | Form of Amendment No. 3 effective as of , 2014, to the Investment Advisory Agreement between FMG LLC and BlackRock Investment effective as of May 1, 2011. 35 | |
| (6)(t) | Investment Advisory Agreement between FMG LLC and Franklin Advisers, Inc. (“Franklin Advisers”) dated as of May 1, 2011. 25 | |
| (6)(t)(i) | Form of Amendment No. 1 effective as of , 2014, to the Investment Advisory Agreement between FMG LLC and Franklin Advisers dated as of May 1, 2011. 35 | |
| (6)(u) | Investment Advisory Agreement between FMG LLC and Diamond Hill Capital Management, Inc. (“Diamond Hill”) effective as of June 6, 2013. 35 | |
| (6)(u)(i) | Form of Amendment No. 1 effective as of , 2014, to the Investment Management Agreement between FMG LLC and Diamond Hill effective as of June 6, 2013. 35 | |
| (6)(v) | Form of Investment Advisory Agreement between FMG LLC and Knightsbridge Asset Management, LLC (“Knightsbridge”) effective as of , 2014. 35 | |
| (6)(w) | Investment Advisory Agreement between FMG LLC and Lord Abbett & Co. LLC (“Lord Abbett”) dated as of May 1, 2011. 25 | |
| (6)(w)(i) | Form of Amendment No. 1 effective as of , 2014, to the Investment Advisory Agreement between FMG LLC and Lord Abbett dated as of May 1, 2011. 35 | |
| (6)(w)(ii) | Form of Amendment No. 2 effective as of , 2014, to the Investment Advisory Agreement between FMG LLC and Lord Abbett dated as of May 1, 2011. 35 | |
| (6)(x) | Investment Advisory Agreement between AXA FMG and EARNEST Partners, LLC (“EARNEST”) dated as of August 1, 2012. 31 | |
| (6)(x)(i) | Form of Amendment No. 1 effective as of , 2014, to the Investment Advisory Agreement between FMG LLC and EARNEST Partners, LLC. dated as of August 1, 2012. 35 | |
| (6)(y) | Form of Investment Advisory Agreement between FMG LLC and Thornburg Investment Management, Inc. (“Thornburg”) effective as of , 2014. 35 | |
| (7) | Underwriting or Distribution Contracts | |
| (7)(a) | Amended and Restated Distribution Agreement between the Trust and AXA Distributors, LLC (“AXA Distributors”) dated as of July 15, 2002 with respect to Class IB shares.6 | |
| (7)(a)(i) | Amendment No. 1, dated May 2, 2003, to the Amended and Restated Distribution Agreement between the Trust and AXA Distributors, dated as of July 15, 2002 with respect to Class IB shares.7 | |
| (7)(a)(ii) | Amendment No. 2, dated July 8, 2004, to the Amended and Restated Distribution Agreement between the Trust and AXA Distributors, dated as of July 15, 2002 with respect to Class IB shares.8 | |
| (7)(a)(iii) | Amendment No. 3, dated October 1, 2004 to the Amended and Restated Distribution Agreement between the Trust and AXA Distributors, dated as of July 15, 2002 with respect to Class IB shares.8 | |
| (7)(a)(iv) | Amendment No. 4, dated May 1, 2005 to the Amended and Restated Distribution Agreement between the Trust and AXA Distributors dated as of July 15, 2002 with respect to Class IB shares.9 | |
| (7)(a)(v) | Amendment No. 5, dated September 30, 2005 to the Amended and Restated Distribution Agreement between the Trust and AXA Distributors dated as of July 15, 2002 with respect to Class IB shares.10 | |
| (7)(a)(vi) | Amendment No. 6 dated August 1, 2006 to the Amended and Restated Distribution Agreement between the Trust and AXA Distributors dated as of July 15, 2002 with respect to Class IB shares.12 | |
| (7)(a)(vii) | Amendment No. 7 dated May 1, 2007 to the Amended and Restated Distribution Agreement between the Trust and AXA Distributors dated as of July 15, 2002 with respect to Class IB shares.14 | |
| (7)(a)(viii) | Amendment No. 8 dated July 11, 2007 to the Amended and Restated Distribution Agreement between the Trust and AXA Distributors dated as of July 15, 2002 with respect to Class IB shares.15 | |
| (7)(a)(ix) | Amendment No. 9 dated January 1, 2008 to the Amended and Restated Distribution Agreement between the Trust and AXA Distributors dated as of July 15, 2002 with respect to Class IB shares.16 | |
| (7)(a)(x) | Amendment No. 10 dated May 1, 2008 to the Amended and Restated Distribution Agreement between the Trust and AXA Distributors dated as of July 15, 2002 with respect to Class IB shares.17 | |
| (7)(a)(xi) | Amendment No. 11 dated January 1, 2009 to the Amended and Restated Distribution Agreement between the Trust and AXA Distributors dated as of July 15, 2002 with respect to Class IB shares.18 | |
| (7)(a)(xii) | Amendment No. 12 dated May 1, 2009 to the Amended and Restated Distribution Agreement between the Trust and AXA Distributors dated as of July 15, 2002 with respect to Class IB shares.19 | |
| (7)(a)(xiii) | Amendment No. 13 dated September 29, 2009 to the Amended and Restated Distribution Agreement between the Trust and AXA Distributors dated as of July 15, 2002 with respect to Class IB shares.20 | |
| (7)(a)(xiv) | Amendment No. 14 dated as of August 16, 2010 to the Amended and Restated Distribution Agreement between the Trust and AXA Distributors dated as of July 15, 2002 with respect to Class IB shares.23 | |
| (7)(a)(xv) | Amendment No. 15 dated as of December 15, 2010 to the Amended and Restated Distribution Agreement between the Trust and AXA Distributors dated as of July 15, 2002 with respect to Class IB shares.23 | |
| (7)(a)(xvi) | Amendment No. 16 dated as of June 7, 2011 to the Amended and Restated Distribution Agreement between the Trust and AXA Distributors dated as of July 15, 2002 with respect to Class IB shares.26 | |
| (7)(a)(xvii) | Amendment No. 17 dated as of April 12, 2012 to the Amended and Restated Distribution Agreement between the Trust and AXA Distributors dated as of July 15, 2002 with respect to Class IB shares.29 | |
| (7)(a)(xviii) | Amendment No. 18 dated as of August 29, 2012 to the Amended and Restated Distribution Agreement between the Trust and AXA Distributors dated as of July 15, 2002 with respect to Class IB shares.31 | |
| (7)(a)(xix) | Amendment No. 19 dated as of May 1, 2013 to the Amended and Restated Distribution Agreement between the Trust and AXA Distributors dated as of July 15, 2002 with respect to Class IB shares.34 | |
| (7)(a)(xx) | Amendment No. 20 dated as of October 21, 2013 to the Amended and Restated Distribution Agreement between the Trust and AXA Distributors dated as of July 15, 2002 with respect to Class IB shares.34 | |
| (7)(a)(xxi) | Form of Amendment No. 21 dated as of , 2014 to the Amended and Restated Distribution Agreement between the Trust and AXA Distributors dated as of July 15, 2002 with respect to Class IB shares.35 | |
| (7)(a)(xxii) | Form of Amendment No. 22 dated as of , 2014 to the Amended and Restated Distribution Agreement between the Trust and AXA Distributors dated as of July 15, 2002 with respect to Class IB shares.35 | |
| (7)(b) | Distribution Agreement between the Trust and AXA Distributors dated as of August 1, 2011 with respect to Class K shares.25 | |
| (7)(b)(i) | Amendment No. 1 dated as of April 12, 2012 to the Distribution Agreement between the Trust and AXA Distributors dated as of August 1, 2011 with respect to Class K shares.29 | |
| (7)(b)(ii) | Amendment No. 2 dated as of August 29, 2012 to the Distribution Agreement between the Trust and AXA Distributors dated as of August 1, 2011 with respect to Class K shares.31 | |
| (7)(b)(iii) | Amendment No. 3 dated as of May 1, 2013 to the Distribution Agreement between the Trust and AXA Distributors dated August 1, 2011 with respect to Class K shares.34 | |
| (7)(b)(iv) | Amendment No. 4 dated as of October 21, 2013 to the Distribution Agreement between the Trust and AXA Distributors dated August 1, 2011 with respect to Class K shares.34 | |
| (7)(b)(v) | Form of Amendment No. 5 dated as of , 2014 to the Distribution Agreement between the Trust and AXA Distributors dated August 1, 2011 with respect to Class K shares. 35 | |
| (7)(b)(vi) | Form of Amendment No. 6 dated as of , 2014 to the Distribution Agreement between the Trust and AXA Distributors dated August 1, 2011 with respect to Class K shares. 35 | |
| (7)(c) | Amended and Restated Distribution Agreement between the Trust and AXA Distributors effective January 1, 2012 with respect to the Class IA shares.30 | |
| (7)(c)(i) | Amendment No. 1 effective as of March 1, 2012 to the Distribution Agreement between the Trust and AXA Distributors effective January 1, 2012 with respect to the Class IA shares.30 | |
| (7)(c)(ii) | Amendment No. 2 dated as of April 30, 2012, to the Distribution Agreement between the Trust and AXA Distributors dated as of January 1, 2012 with respect to the Class IA shares.31 | |
| (7)(c)(iii) | Amendment No. 3 dated as of July 10, 2012, to the Distribution Agreement between the Trust and AXA Distributors dated as of January 1, 2012 with respect to the Class IA shares.31 | |
| (7)(c)(iv) | Form of Amendment No. 4 dated as of , 2014, to the Distribution Agreement between the Trust and AXA Distributors dated as of January 1, 2012 with respect to the Class IA shares. 35 | |
| (8) | Form of Deferred Compensation Plan.3 | |
| (9) | Custodian Agreements | |
| (9)(a) | Amended and Restated Global Custody Agreement between the Trust and JPMorgan Chase Bank dated February 1, 2002.5 | |
| (9)(a)(i) | Amendment No. 1, dated May 2, 2003, to the Amended and Restated Global Custody Agreement between the Trust and JP Morgan Chase Bank dated February 1, 2002.7 | |
| (9)(a)(ii) | Amendment No. 2, dated July 8, 2004, to the Amended and Restated Global Custody Agreement between the Trust and JP Morgan Chase Bank dated February 1, 2002.8 | |
| (9)(a)(iii) | Amendment No. 3, dated September 13, 2004, to the Amended and Restated Global Custody Agreement between the Trust and JP Morgan Chase Bank dated February 1, 2002.8 | |
| (9)(a)(iv) | Amendment No. 4 dated May 1, 2005 to the Amended and Restated Global Custody Agreement between the Trust and JP Morgan Chase Bank dated February 1, 2002.9 | |
| (9)(a)(v) | Amendment No. 5 dated September 30, 2005 to the Amended and Restated Global Custody Agreement between the Trust and JP Morgan Chase Bank dated February 1, 2002.10 | |
| (9)(a)(vi) | Amendment No. 6 dated August 1, 2006 to the Amended and Restated Global Custody Agreement between the Trust and JP Morgan Chase Bank dated February 1, 2002.13 | |
| (9)(a)(vii) | Amendment No. 7 dated May 1, 2007 to the Amended and Restated Global Custody Agreement between the Trust and JP Morgan Chase Bank dated February 1, 2002.14 | |
| (9)(a)(viii) | Amendment No. 8 dated April 1, 2007 to the Amended and Restated Global Custody Agreement between the Trust and JP Morgan Chase Bank dated February 1, 2002.15 | |
| (9)(a)(ix) | Amendment No. 9 dated January 1, 2008 to the Amended and Restated Global Custody Agreement between the Trust and JPMorgan Chase Bank dated February 1, 2002. 16 | |
| (9)(a)(x) | Amendment No. 10 dated May 1, 2008 to the Amended and Restated Global Custody Agreement between the Trust and JPMorgan Chase Bank dated February 1, 2002.17 | |
| (9)(a)(xi) | Amendment No. 11 dated July 1, 2008 to the Amended and Restated Global Custody Agreement between the Trust and JPMorgan Chase Bank dated February 1, 2002.17 | |
| (9)(a)(xii) | Amendment No. 12 dated January 1, 2009 to the Amended and Restated Global Custody Agreement between the Trust and JPMorgan Chase Bank dated February 1, 2002.18 | |
| (9)(a)(xiii) | Amendment No. 13 dated May 1, 2009 to the Amended and Restated Global Custody Agreement between the Trust and JPMorgan Chase Bank dated February 1, 2002.19 | |
| (9)(a)(xiv) | Amendment No. 14 dated as of September 29, 2009, to the Amended and Restated Global Custody Agreement between the Trust and JPMorgan Chase Bank dated February 1, 2002.20 | |
| (9)(a)(xv) | Amendment No. 15 dated as of October 1, 2009, to the Amended and Restated Global Custody Agreement between the Trust and JPMorgan Chase Bank dated February 1, 2002.20 | |
| (9)(a)(xvi) | Amendment No. 16 dated as of August 16, 2010 to the Amended and Restated Global Custody Agreement between the Trust and JPMorgan Chase Bank dated February 1, 2002.23 | |
| (9)(a)(xvii) | Amendment No. 17 dated as of December 15, 2010 to the Amended and Restated Global Custody Agreement between the Trust and JPMorgan Chase Bank dated February 1, 2002. 23 | |
| (9)(a)(xviii) | Amendment No. 18 dated as of December 7, 2010 to the Amended and Restated Global Custody Agreement between the Trust and JPMorgan Chase Bank dated February 1, 2002.24 | |
| (9)(a)(xix) | Amendment No. 19 dated as of May 1, 2011 to the Amended and Restated Global Custody Agreement between the Trust and JPMorgan Chase Bank dated February 1, 2002.25 | |
| (9)(a)(xx) | Amendment No. 20 dated as of July 20, 2011 to the Amended and Restated Global Custody Agreement between the Trust and JPMorgan Chase Bank dated February 1, 2002.25 | |
| (9)(a)(xxi) | Amendment No. 21 dated as of April 30, 2012 to the Amended and Restated Global Custody Agreement between the Trust and JPMorgan Chase Bank dated February 1, 2002.29 | |
| (9)(a)(xxii) | Amendment No. 22 dated as of June 1, 2013 to the Amended and Restated Global Custody Agreement between the Trust and JPMorgan Chase Bank dated February 1, 2002.34 | |
| (9)(a)(xxiii) | Amendment No. 23 dated as of October 21, 2013 to the Amended and Restated Global Custody Agreement between the Trust and JPMorgan Chase Bank dated February 1, 2002.34 | |
| (9)(a)(xxiv) | Form of Amendment No. 24 dated as of , 2014 to the Amended and Restated Global Custody Agreement between the Trust and JPMorgan Chase Bank dated February 1, 2002. 35 | |
| (10) | Distribution Plan and Multiple Class Plan | |
| (10)(a) | Amended and Restated Distribution Plan pursuant to Rule 12b-1 under the 1940 Act for the Trust’s Class IB shares adopted as of July 14, 2010. 22 | |
| (10)(b) | Shareholder Services and Distribution Plan pursuant to Rule 12b-1 under the 1940 Act for the Trust’s Class IA shares adopted as of July 12, 2011. 28 | |
| (10)(c) | Revised Amended and Restated Plan Pursuant to Rule 18f-3 under the 1940 Act. 25 | |
| (11)(a) | Legal Opinion of K&L Gates LLP regarding the legality of the securities being registered with respect to the Multimanager Aggressive Equity Portfolio, Multimanager Technology Portfolio, Multimanager Core Bond Portfolio, Multimanager Mid Cap Growth Portfolio, and Multimanager Mid Cap Value Portfolio. (filed herewith) | |
| (11)(b) | Legal Opinion of K&L Gates LLP regarding the legality of the securities being registered with respect to the EQ/Large Cap Core PLUS Portfolio, EQ/Large Cap Value PLUS Portfolio, and EQ/International Core PLUS Portfolio. (filed herewith) | |
| (12) | Opinion of K&L Gates LLP as to tax matters. (to be filed by amendment) | |
| (13) | Other Material Contracts | |
| (13)(a) | Mutual Fund Service Agreement dated May 1, 2011 between the Trust and FMG LLC.25 | |
| (13)(a)(i) | Amendment No. 1 dated June 7, 2011 to the Mutual Fund Service Agreement between the Trust and FMG LLC dated May 1, 2011.26 | |
| (13)(a)(ii) | Amendment No. 2 dated September 1, 2011 to the Mutual Fund Service Agreement dated May 1, 2011 between the Trust and FMG LLC.25 | |
| (13)(a)(iii) | Amendment No. 3 dated as of October 1, 2011 to the Mutual Fund Service Agreement dated May 1, 2011 between the Trust and FMG LLC.27 | |
| (13)(a)(iv) | Amendment No. 4 dated as of April 12, 2012 to the Mutual Fund Service Agreement dated May 1, 2011 between the Trust and FMG LLC.29 | |
| (13)(a)(v) | Amendment No. 5 dated as of September 1, 2012, to the Mutual Fund Service Agreement dated May 1, 2011 between the Trust and FMG LLC.31 | |
| (13)(a)(vi) | Amendment No. 6 dated as of May 1, 2013 to the Mutual Fund Service Agreement dated May 1, 2011 between the Trust and FMG LLC.34 | |
| (13)(a)(vii) | Amendment No. 7 dated as of September 1, 2013 to the Mutual Fund Service Agreement dated May 1, 2011 between the Trust and FMG LLC.34 | |
| (13)(a)(viii) | Amendment No. 8 dated as of October 21, 2013 to the Mutual Fund Service Agreement dated May 1, 2011 between the Trust and FMG LLC.34 | |
| (13)(a)(ix) | Form of Amendment No. 9 dated as of , 2014 to the Mutual Fund Service Agreement dated May 1, 2011 between the Trust and FMG LLC.35 | |
| (13)(a)(x) | Form of Amendment No. 10 dated as of , 2014 to the Mutual Fund Service Agreement dated May 1, 2011 between the Trust and FMG LLC.35 | |
| (13)(b) | Sub-Administration Agreement between FMG LLC and JPMorgan Chase Bank dated May 1, 2011. 25 | |
| (13)(c) | Expense Limitation Agreement dated as of May 1, 2011 between the Trust and FMG LLC.25 | |
| (13)(c)(i) | Amendment No. 1 dated as of June 7, 2011 to the Expense Limitation Agreement between the Trust and FMG LLC dated May 1, 2011.26 | |
| (13)(c)(ii) | Amendment No. 2 dated as of August 19, 2011 to the Expense Limitation Agreement between the Trust and FMG LLC dated May 1, 2011.25 | |
| (13)(c)(iii) | Amendment No. 3 effective as of January 1, 2012 to the Expense Limitation Agreement between the Trust and FMG LLC dated May 1, 2011.27 | |
| (13)(c)(iv) | Amendment No. 4 effective as of April 12, 2012 to the Expense Limitation Agreement between the Trust and FMG LLC dated May 1, 2011.29 | |
| (13)(c)(v) | Amendment No. 5 effective as of May 1, 2013 to the Expense Limitation Agreement between the Trust and FMG LLC dated May 1, 2011.32 | |
| (13)(c)(vi) | Amendment No. 6 effective as of October 21, 2013 to the Expense Limitation Agreement between the Trust and FMG LLC dated May 1, 2011.34 | |
| (13)(c)(vii) | Form of Amendment No. 7 effective as of , 2014 to the Expense Limitation Agreement between the Trust and FMG LLC dated May 1, 2011.35 | |
| (13)(c)(viii) | Form of Amendment No. 8 effective as of , 2014 to the Expense Limitation Agreement between the Trust and FMG LLC dated May 1, 2011.35 | |
| (13)(d) | Amended and Restated Participation Agreement among the Trust, AXA Equitable Life Insurance Company (“AXA Equitable”), AXA Distributors and AXA Advisors dated as of July 15, 2002.6 | |
| (13)(d)(i) | Amendment No. 1, dated May 2, 2003, to the Amended and Restated Participation Agreement among the Trust, AXA Equitable, AXA Distributors and AXA Advisors dated July 15, 2002.7 | |
| (13)(d)(ii) | Amendment No. 2, dated July 9, 2004, to the Amended and Restated Participation Agreement among the Trust, AXA Equitable, AXA Distributors and AXA Advisors dated July 15, 2002.8 | |
| (13)(d)(iii) | Amendment No. 3, dated October 1, 2004, to the Amended and Restated Participation Agreement among the Trust, AXA Equitable, AXA Distributors and AXA Advisors dated July 15, 2002.8 | |
| (13)(d)(iv) | Amendment No. 4 dated May 1, 2005 to the Amended and Restated Participation Agreement among the Trust, AXA Equitable, AXA Distributors and AXA Advisors dated July 15, 2002.9 | |
| (13)(d)(v) | Amendment No. 5 dated September 30, 2005 to the Amended and Restated Participation Agreement among the Trust, AXA Equitable, AXA Distributors and AXA Advisors dated July 15, 2002.11 | |
| (13)(d)(vi) | Amendment No. 6 dated August 1, 2006 to the Amended and Restated Participation Agreement among the Trust, AXA Equitable, AXA Distributors and AXA Advisors dated July 15, 2002.13 | |
| (13)(d)(vii) | Amendment No. 7 dated May 1, 2007 to the Amended and Restated Participation Agreement among the Trust, AXA Equitable, AXA Distributors and AXA Advisors dated July 15, 2002.14 | |
| (13)(d)(viii) | Amendment No. 8 dated January 1, 2008 to the Amended and Restated Participation Agreement among the Trust, AXA Equitable, AXA Distributors and AXA Advisors dated July 15, 2002.16 | |
| (13)(d)(ix) | Amendment No. 9 dated May 1, 2008 to the Amended and Restated Participation Agreement among the Trust, AXA Equitable, AXA Distributors and AXA Advisors dated July 15, 2002.17 | |
| (13)(d)(x) | Amendment No. 10 dated January 1, 2009 to the Amended and Restated Participation Agreement among the Trust, AXA Equitable, AXA Distributors and AXA Advisors dated July 15, 2002.18 | |
| (13)(d)(xi) | Amendment No. 11 dated May 1, 2009 to the Amended and Restated Participation Agreement among the Trust, AXA Equitable, AXA Distributors and AXA Advisors dated July 15, 2002.19 | |
| (13)(d)(xii) | Amendment No. 12 dated September 29, 2009 to the Amended and Restated Participation Agreement among the Trust, AXA Equitable, AXA Distributors and AXA Advisors dated July 15, 2002.20 | |
| (13)(d)(xiii) | Amendment No. 13 dated August 16, 2010 to the Amended and Restated Participation Agreement among the Trust, AXA Equitable, AXA Distributors and AXA Advisors dated July 15, 2002.23 | |
| (13)(d)(xiv) | Amendment No. 14 dated as of December 15, 2010 to the Amended and Restated Participation Agreement among the Trust, AXA Equitable, AXA Distributors and AXA Advisors dated July 15, 2002.23 | |
| (13)(d)(xv) | Amendment No. 15 dated June 7, 2011 to the Amended and Restated Participation Agreement among the Trust, AXA Equitable, AXA Distributors and AXA Advisors dated July 15, 2002.26 | |
| (13)(d)(xvi) | Amendment No. 16 dated as of April 30, 2012 to the Amended and Restated Participation Agreement among the Trust, AXA Equitable and AXA Distributors dated July 15, 2002.31 | |
| (13)(e) | Second Amended and Restated Participation Agreement among the Trust, AXA Equitable, FMG LLC and AXA Distributors dated May 23, 2012.33 | |
| (13)(e)(i) | Amendment No. 1 dated as of June 4, 2013 to the Second Amended and Restated Participation Agreement among the Trust, AXA Equitable, FMG LLC and AXA Distributors dated May 23, 2012.34 | |
| (13)(e)(ii) | Amendment No. 2 dated as of October 21, 2013 to the Second Amended and Restated Participation Agreement among the Trust, AXA Equitable, FMG LLC and AXA Distributors dated May 23, 2012.34 | |
| (13)(e)(iii) | Form of Amendment No. 3 dated as of , 2014 to the Second Amended and Restated Participation Agreement among the Trust, AXA Equitable, FMG LLC and AXA Distributors dated May 23, 2012. 35 | |
| (13)(f) | Amended and Restated Retirement Plan Participation Agreement among the Trust, AXA Advisors, the Investment Plan for Employees, Managers and Agents, and AXA Equitable dated July 10, 2002.6 | |
| (13)(g) | Second Amended and Restated Retirement Plan Participation Agreement among the Trust, AXA Distributors, the AXA Equitable 401(k) Plan and AXA Equitable dated April 26, 2012.31 | |
| (13)(h) | Participation Agreement among the Trust, MONY Life Insurance Company (“MONY Life”), and AXA Distributors dated as of May 23, 2012.35 | |
| (13)(h)(i) | Amendment No. 1 dated June 4, 2013 to the Amended and Restated Participation Agreement among the Trust, MONY Life, and AXA Distributors dated as of May 23, 2012.35 | |
| (13)(i) | Participation Agreement among the Trust, MONY Life Insurance Company (“MONY”) and AXA Distributors effective as of October 1, 2013.35 | |
| (13)(i)(i) | Form of Amendment No. 1 dated as of , 2014 to the Participation Agreement among the Trust, MONY and AXA Distributors effective as of October 1, 2013.35 | |
| (13)(j) | Amended and Restated Participation Agreement among the Trust, MONY Life Insurance Company of America (“MLOA”) and AXA Distributors dated as of May 23, 2012.35 | |
| (13)(j)(i) | Amendment No. 1 dated as of June 4, 2013 to the Amended and Restated Participation Agreement among the Trust, MLOA and AXA Distributors dated as of May 23, 2012.35 | |
| (13)(j)(ii) | Amendment No. 2 dated as of October 21, 2013 to the Amended and Restated Participation Agreement among the Trust, MLOA and AXA Distributors dated as of May 23, 2012.35 | |
| (13)(j)(iii) | Form of Amendment No. 3 dated as of , 2014 to the Amended and Restated Participation Agreement among the Trust, MLOA and AXA Distributors dated as of May 23, 2012.35 | |
| (14) | Consent of Independent Registered Public Accounting Firm. (filed herewith) | |
| (15) | None. | |
| (16) | Powers of Attorney. (filed herewith) | |
| (17) | Additional Exhibits | |
| (17) | Voting Instruction and Proxy Cards. (filed herewith) | |
| 1. | Incorporated by reference to and/or previously filed with Registrant’s Registration Statement on Form N-1A filed on December 3, 1996 (File No. 333-17217). |
| 2. | Incorporated by reference to and/or previously filed with Pre-Effective Amendment No. 1 to Registrant’s Registration Statement on Form N-1A filed on January 23, 1997 (File No. 333-17217). |
| 3. | Incorporated by reference to and/or previously filed with Pre-Effective Amendment No. 2 to Registrant’s Registration Statement on Form N-1A filed on April 7, 1997 (File No. 333-17217). |
| 4. | Incorporated by reference to and/or previously filed with Post-Effective Amendment No. 18 to Registrant’s Registration Statement on Form N-1A filed on January 23, 2001 (File No. 333-17217). |
| 5. | Incorporated by reference to and/or previously filed with Post-Effective Amendment No. 24 to Registrant’s Registration Statement on Form N-1A filed on April 3, 2002 (File No. 333-17217). |
| 6. | Incorporated by reference to and/or previously filed with Post-Effective Amendment No. 25 to Registrant’s Registration Statement on Form N-1A filed on February 7, 2003 (File No. 333-17217). |
| 7. | Incorporated by reference to and/or previously filed with Post-Effective Amendment No. 28 to Registrant’s Registration Statement on Form N-1A filed on February 10, 2004 (File No. 333-17217). |
| 8. | Incorporated by reference to and/or previously filed with Post-Effective Amendment No. 35 to Registrant’s Registration Statement on Form N-1A filed on October 15, 2004 (File No. 333-17217). |
| 9. | Incorporated by reference to and/or previously filed with Post-Effective Amendment No. 37 to Registrant’s Registration Statement on Form N-1A filed on April 7, 2005 (File No. 333-17217). |
| 10. | Incorporated by reference to and/or previously filed with Post-Effective Amendment No. 42 to Registrant’s Registration Statement on Form N-1A filed on August 24, 2005 (File No. 333-17217). |
| 11. | Incorporated by reference to and/or previously filed with Post-Effective Amendment No. 44 to Registrant’s Registration Statement on Form N-1A filed on April 5, 2006 (File No. 333-17217). |
| 12. | Incorporated by reference to and/or previously filed with Post-Effective Amendment No. 46 to Registrant’s Registration Statement on Form N-1A filed on August 23, 2006 (File No. 333-17217). |
| 13. | Incorporated by reference to Post-Effective Amendment No. 51 to Registrant’s Registration Statement on Form N-1A filed on February 2, 2007 (File No. 333-17217). |
| 14. | Incorporated by reference to and/or previously filed with Post-Effective Amendment No. 53 to Registrant’s Registration Statement on Form N-1A filed on April 27, 2007 (File No. 333-17217). |
| 15. | Incorporated by reference to Post-Effective Amendment No. 54 to Registrant’s Registration Statement on Form N-1A filed on October 4, 2007 (File No. 333-17217). |
| 16. | Incorporated by reference to and/or previously filed with Post-Effective Amendment No. 56 to Registrant’s Registration Statement on Form N-1A filed on December 27, 2007 (File No. 333-17217). |
| 17. | Incorporated by reference to Post-Effective Amendment No. 61 to the Registrant’s Registration Statement on Form N-1A filed on February 13, 2009 (File No. 333-17217). |
| 18. | Incorporated by reference to Post-Effective Amendment No. 64 to the Registrant’s Registration Statement on Form N-1A filed on March 16, 2009 (File No. 333-17217). |
| 19. | Incorporated by reference to and/or previously filed with Post-Effective Amendment No. 67 to the Registrant’s Registration Statement on Form N-1A filed on April 15, 2009 (File No. 333-17217). |
| 20. | Incorporated by reference to and/or previously filed with Post-Effective Amendment No. 70 to the Registrant’s Registration Statement on Form N-1A filed on January 21, 2010 (File No. 333-17217). |
| 21. | Incorporated by reference to and/or previously filed with Post-Effective Amendment No. 73 to the Registrant’s Registration Statement on Form N-1A filed on April 28, 2010 (File No. 333-17217). |
| 22. | Incorporated by reference to and/or previously filed with Post-Effective Amendment No. 75 to the Registrant’s Registration Statement on Form N-1A filed on October��5, 2010 (File No. 333-17217). |
| 23. | Incorporated by reference to and/or previously filed with Post-Effective Amendment No. 77 to the Registrant’s Registration Statement on Form N-1A filed on February 3, 2011 (File No. 333-17217). |
| 24. | Incorporated by reference to and/or previously filed with Post-Effective Amendment No. 79 to the Registrant’s Registration Statement on Form N-1A filed on April 28, 2011 (File No. 333-17217). |
| 25. | Incorporated by reference to and/or previously filed with Post-Effective Amendment No. 83 to the Registrant’s Registration Statement on Form N-1A filed on August 16, 2011 (File No. 333-17217). |
| 26. | Incorporated by reference to and/or previously filed with Post-Effective Amendment No. 84 to the Registrant’s Registration Statement on Form N-1A filed on August 17, 2011 (File No. 333-17217). |
| 27. | Incorporated by reference to and/or previously filed with Post-Effective Amendment No. 87 to the Registrant’s Registration Statement on Form N-1A filed on January 13, 2012 (File No. 333-17217). |
| 28. | Incorporated by reference to and/or previously filed with Post-Effective Amendment No. 89 to the Registrant’s Registration Statement on Form N-1A filed on February 6, 2012 (File No. 333-17217). |
| 29 | Incorporated by reference to and/or previously filed with Post-Effective Amendment No. 91 to the Registrant’s Registration Statement on Form N-1A filed on April 25, 2012 (File No. 333-17217). |
| 30. | Incorporated by reference to and/or previously filed with Post-Effective Amendment No. 92 to the Registrant’s Registration Statement on Form N-1A filed on April 25, 2012. (File No. 333-17217). |
| 31. | Incorporated by reference to and/or previously filed with Post-Effective Amendment No. 96 to the Registrant’s Registration Statement on Form N-1A filed on February 7, 2013. (File No. 333-17217). |
| 32. | Incorporated by reference and/or previously filed with Post-Effective Amendment No. 98 to the Registrant’s Registration Statement filed on April 30, 2013. (File No. 333-17217). |
| 33. | Incorporated by reference and/or previously filed with Post-Effective Amendment No. 100 to the Registrant’s Registration Statement filed on July 22, 2013. (File No. 333-17217). |
| 34. | Incorporated by reference and/or previously filed with Post-Effective Amendment No. 101 to the Registrant’s Registration Statement filed on October 1, 2013. (File No. 333-17217). |
| 35. | Incorporated by reference and/or previously filed with Post-Effective Amendment No. 103 to the Registrant’s Registration Statement filed on January 10, 2014. (File No. 333-17217). |
Item 17. Undertakings
(1) The undersigned Registrant agrees that prior to any public reoffering of the securities registered through the use of a prospectus which is a part of this Registration Statement by any person or party who is deemed to be an underwriter within the meaning of
Rule 145(c) under the Securities Act of 1933, as amended (the “1933 Act”), the reoffering prospectus will contain the information called for by the applicable registration form for reofferings by persons who may be deemed underwriters, in addition to the information called for by the other items of the applicable form.
(2) The undersigned Registrant agrees that every prospectus that is filed under paragraph (1) above will be filed as a part of an amendment to the Registration Statement and will not be used until the amendment is effective, and that, in determining any liability under the 1933 Act, each post-effective amendment shall be deemed to be a new registration statement for the securities offered therein, and the offering of the securities at that time shall be deemed to be the initial bona fide offering of them.
(3) The Registrant agrees to file an executed copy of the opinion of counsel supporting the tax consequences of the proposed reorganization as an amendment to this Registration Statement within a reasonable time after receipt of such opinion.
SIGNATURES
As required by the Securities Act of 1933, as amended (the “1933 Act”), this Registration Statement has been signed on behalf of the Registrant, in the City of New York and the State of New York on the 27th day of February 2014.
| EQ ADVISORS TRUST | ||
| By: |
| |
| Name: | Steven M. Joenk | |
| Title: | Trustee, Chairman, President and Chief Executive Officer | |
As required by the 1933 Act, this Registration Statement has been signed by the following persons in the capacities and on the dates indicated.
Signature | Title | Date | ||
Steven M. Joenk | Trustee, Chairman, President and Chief Executive Officer | February 27, 2014 | ||
/s/ Jettie M. Edwards Jettie M. Edwards | Trustee | February 27, 2014 | ||
/s/ William M. Kearns, Jr. William M. Kearns, Jr. | Trustee | February 27, 2014 | ||
/s/ Christopher P.A. Komisarjevsky Christopher P.A. Komisarjevsky | Trustee | February 27, 2014 | ||
/s/ Gary S. Schpero Gary S. Schpero | Trustee | February 27, 2014 | ||
/s/ Harvey Rosenthal Harvey Rosenthal | Trustee | February 27, 2014 | ||
/s/ Kenneth Walker Kenneth Walker | Trustee | February 27, 2014 | ||
/s/ Caroline L. Williams Caroline L. Williams | Trustee | February 27, 2014 | ||
/s/ Donald E. Foley Donald E. Foley | Trustee | February 27, 2014 | ||
/s/ H. Thomas McMeekin H. Thomas McMeekin | Trustee | February 27, 2014 | ||
/s/ Brian Walsh Brian Walsh | Treasurer and Chief Financial Officer | February 27, 2014 | ||
| * By: |
| |
| Steven M. Joenk | ||
| (Attorney-in-fact) |
EXHIBIT INDEX
Exhibit Number | Description of Exhibit | |
(11)(a) | Legal Opinion of K&L Gates LLP regarding the legality of the securities being registered with respect to the Multimanager Aggressive Equity Portfolio, Multimanager Technology Portfolio, Multimanager Core Bond Portfolio, Multimanager Mid Cap Growth Portfolio, and Multimanager Mid Cap Value Portfolio. | |
(11)(b) | Legal Opinion of K&L Gates LLP regarding the legality of the securities being registered with respect to the EQ/Large Cap Core PLUS Portfolio, EQ/Large Cap Value PLUS Portfolio, and EQ/International Core PLUS Portfolio. | |
(14) | Consent of Independent Registered Public Accounting Firm. | |
(16) | Powers of Attorney. | |
(17) | Voting Instruction and Proxy Cards. | |