Exhibit 99(a)(5)(xiv)
Work in progress kpn Project Celtic Performance considerations Internal Presentation (Part 1 of 2) For additional background info Business case and value creation potential evaluation in progress The Hague, 9 April 2009 Strictly private & confidential JX247 1 Q1 2008 Confidential KPN00191502
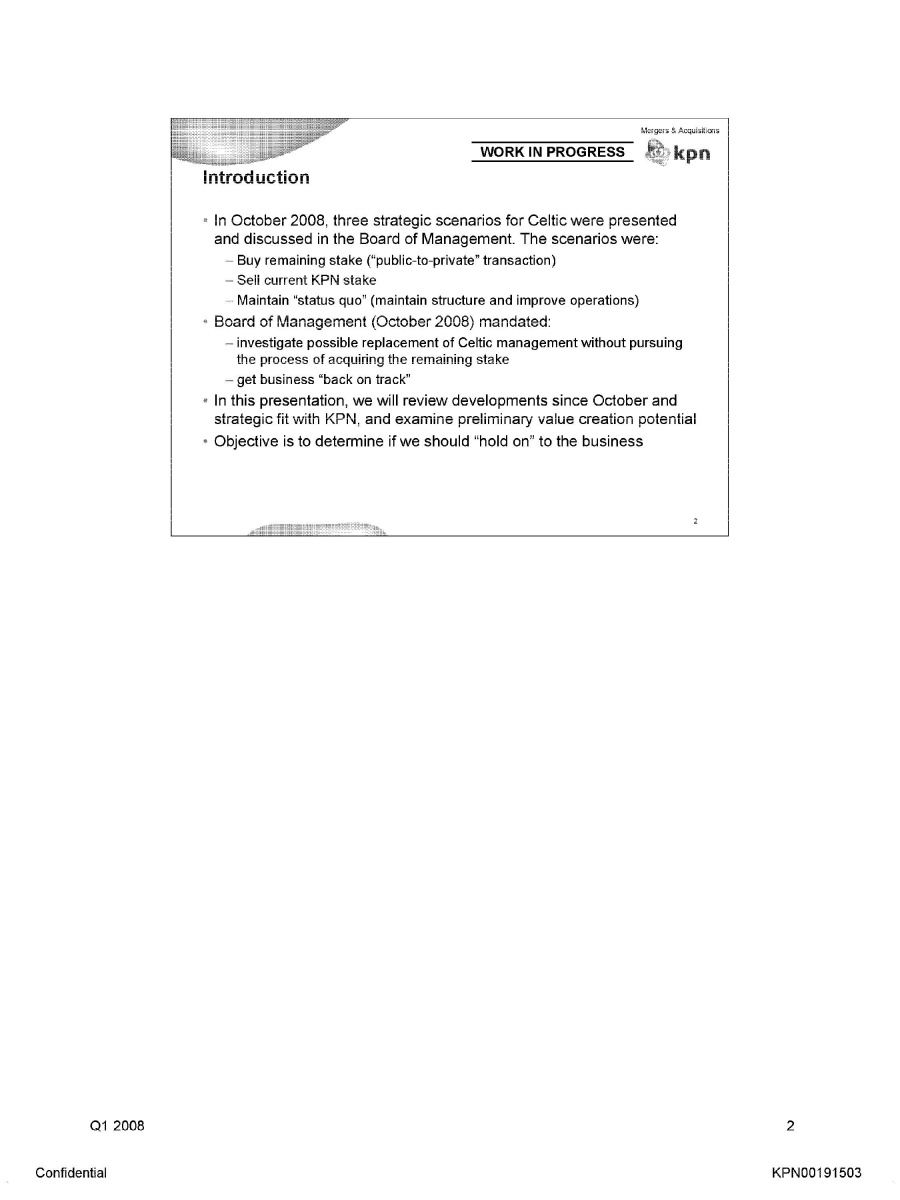
Mergers & Acquisitions kpn Work in progress Introduction In October 2008, three strategic scenarios for Celtic were presented and discussed in the Board of Management. The scenarios were: Buy remaining stake (“public-to-private” transaction) Sell current KPN stake Maintain “status quo” (maintain structure and improve operations) Board of Management (October 2008) mandated: investigate possible replacement of Celtic management without pursuing the process of acquiring the remaining stake get business “back on track” In this presentation, we will review developments since October and strategic fit with KPN, and examine preliminary value creation potential Objective is to determine if we should “hold on” to the business 2 Q1 2008 Confidential KPN00191503
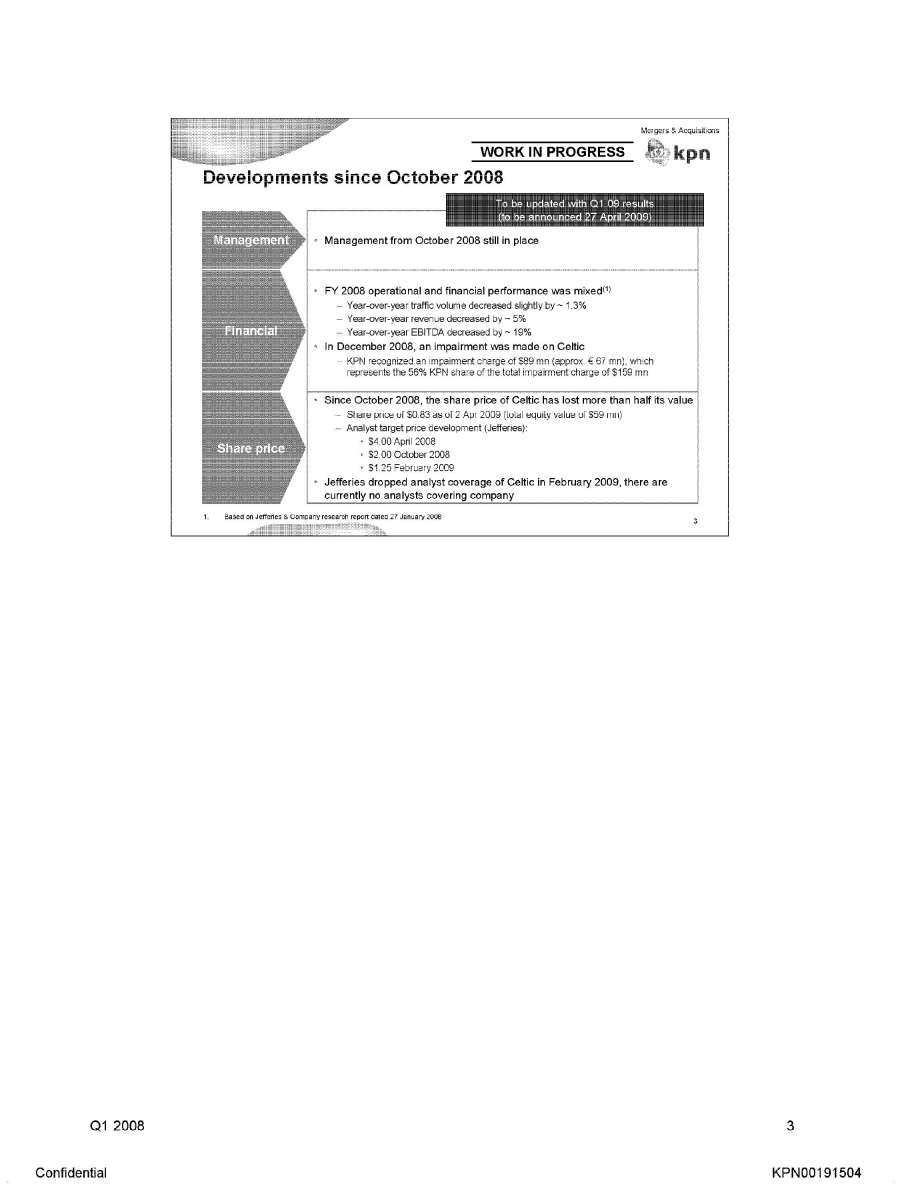
Mergers & Acquisitions kpn Work in Progress Developments since October 2008 To be updated with Q1 09 results (to be announced 27 April 2009) Management Management from October 2008 still in place Financial FY 2008 operational and financial performance was mixed(1) Year-over-year traffic volume decreased slightly by 1.3% Year-over-year revenue decreased by 5% Year-over-year EBITDA decreased by 19% In December 2008, an impairment was made on Celtic KPN recognized an impairment charge of $89 mn (approx. € 67 mn) which represents the 56% KPN share of the total impairment charge of $159 mn Share price Since October 2008, the share price of Celtic has lost more than half its value Share price of $0 83 as of 2 Apr 2009 (total equity value of $59 mn) Analyst target price development (Jefferies): $4.00 April 2008 $2.00 October 2008 $1.25 February 2009 Jefferies dropped analyst coverage of Celtic in February 2009, there are currently no analysts covering company 1. Based on Jefferies & Company research report dated 27 January 2008 3 Q1 2008 Confidential KPN00191504
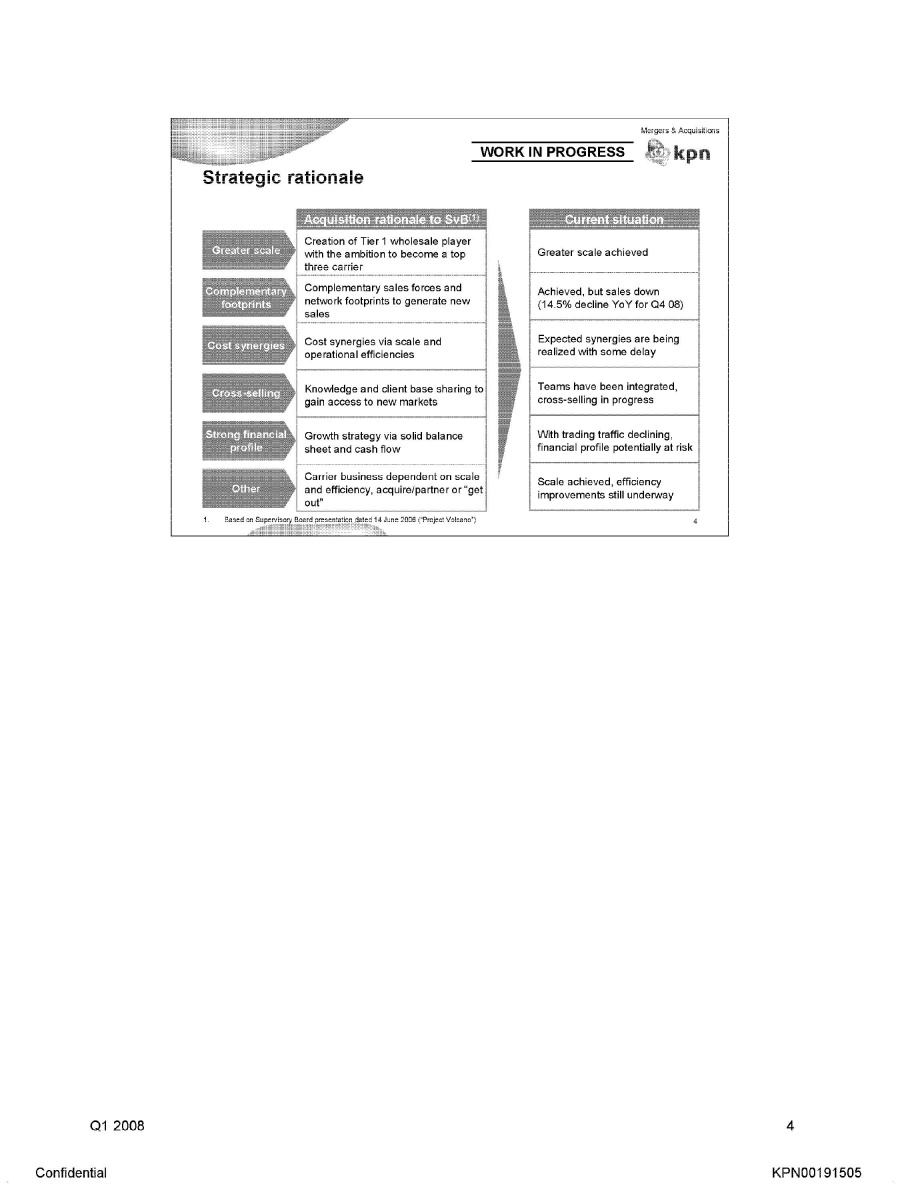
Mergers & Acquisitions kpn Work in progress Strategic rationale Acquisition rationale to SvB(1) Current situation Greater scale Creation of Tier 1 wholesale player with the ambition to become a top three carrier Greater scale achieved Complementary footprints Complementary sales forces and network footprints to generate new sales Achieved, but sales down (14.5% decline YoY for Q4 08) Cost synergies Cost synergies via scale and operational efficiencies Expected synergies are being realized with some delay Cross-selling Knowledge and client base sharing to gain access to new markets Teams have been integrated, cross-selling in progress Strong financial profile Growth strategy via solid balance sheet and cash flow With trading traffic declining, financial profile potentially at risk Other Carrier business dependent on scale and efficiency, acquire/partner or “get out” Scale achieved, efficiency improvements still underway 1 Based on Supervisory Board presentation dated 14 June 2006 (“Project Volcano”) 4 Q1 2008 Confidential KPN00191505
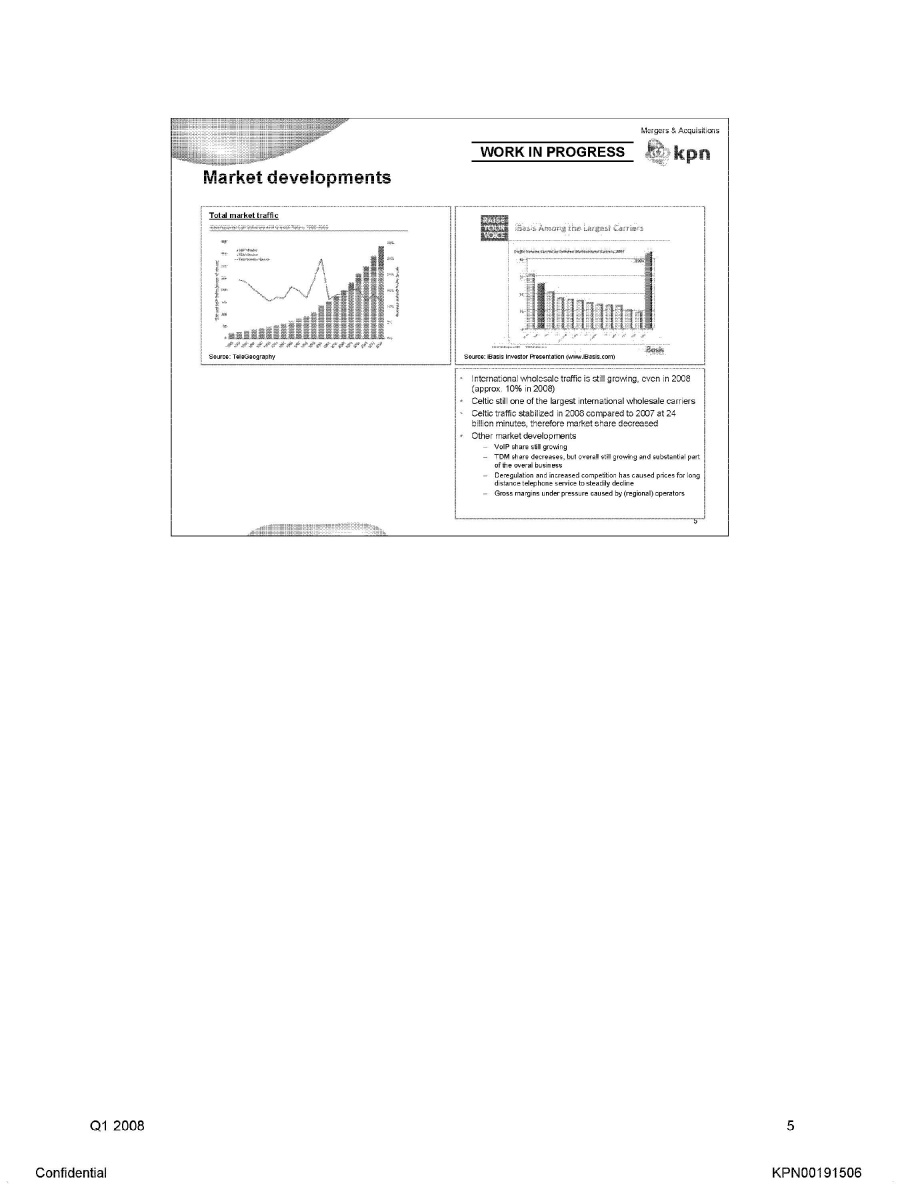
Mergers & Acquisitions kpn Work in progress Market developments Total market traffic International call volumes Source: TeleGeography Raise Your Voice iBasis Among the largest carriers Traffic volume by selected multinational carriers Source: iBasis Investor Presentation (www.iBasis.com) International wholesale traffic is still growing, even in 2008 (approx. 10% in 2008) Celtic still one of the largest international wholesale carriers Celtic traffic stabilized in 2008 compared to 2007 at 24 billion minutes, therefore market share decreased Other market developments VoIP share still growing TDM share decreases, but overall still growing and substantial part of the overal business Deregulation and increased competition has caused prices for long distance telephone service to steadily decline Gross margins under pressure caused by (regional) operators Q1 2008 5 Confidential KPN00191506
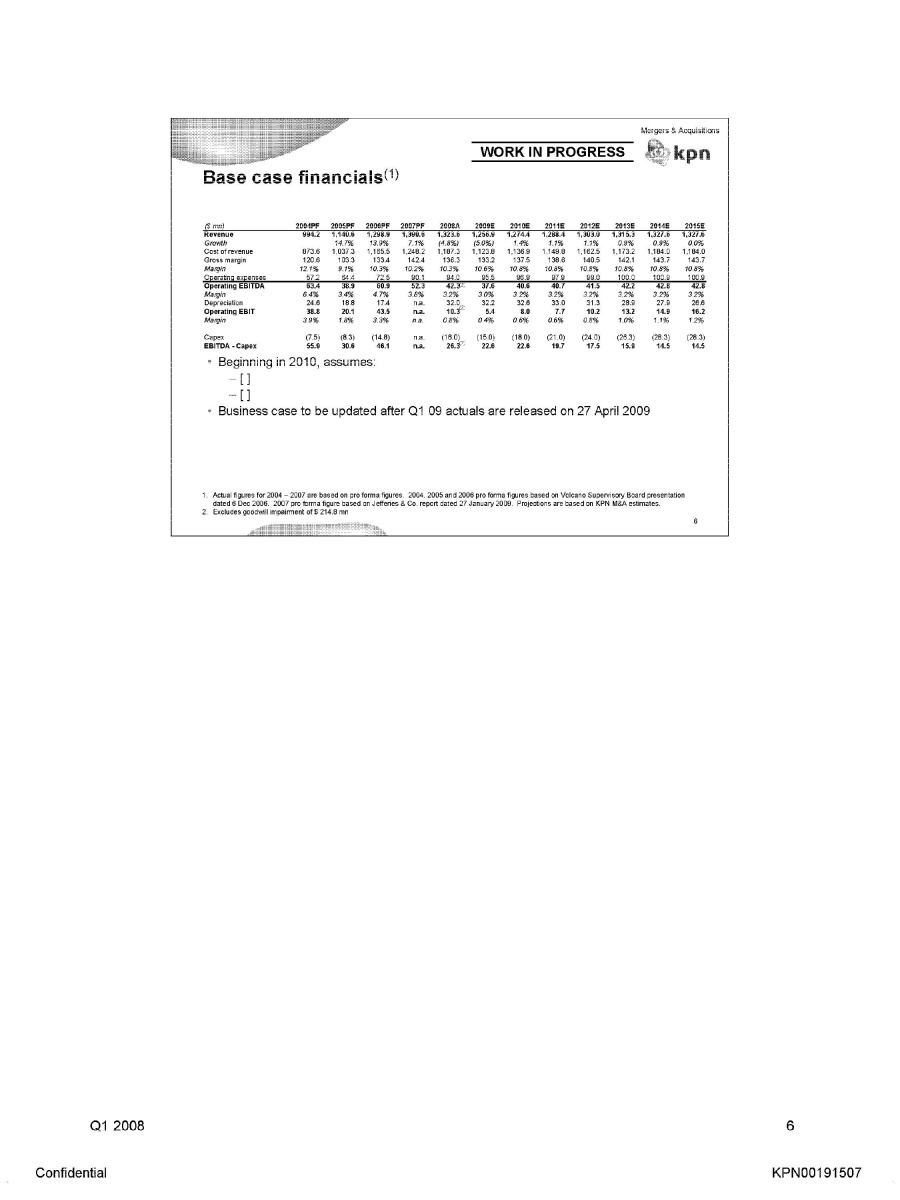
Mergers & Acquisitions kpn Work in progress Base case financials (1) ($ mn) 2004PF 2005PF 2006PF 2007PF 2008A 2009E 2010E 2011E 2012E 2013E 2014E 2015E Revenue 994.2 1,140.6 1,298.9 1,390.6 1,323.6 1,256.9 1,274.4 1,288.4 1,303.0 1,315.3 1,327.6 1,327.6 Growth 14.7% 13.9% 7.1% (4.8%) (5.0%) 1.4% 1.1% 1.1% 0.9% 0.9% 0.0% Cost of revenue 873.6 1,037.3 1,165.5 1,248.2 1,187.3 1,123.9 1,136.9 1,149.8 1,162.5 1,173.2 1,184.0 1,184.0 Gross margin 120.6 103.3 133.4 142.4 136.3 133.2 137.5 138.6 140.5 142.1 143.7 143.7 Margin 12.1% 9.1% 10.3% 10.2% 10.3% 10.6% 10.8% 10.8% 10.8% 10.8% 10.8% 10.8% Operating expenses 57.2 64.4 72.5 90.1 94.0 95.5 96.9 97.9 99.0 100.0 100.9 100.9 Operating EBITDA 63.4 38.9 60.9 52.3 42.3 (2) 37.6 40.6 40.7 41.5 42.2 42.8 42.8 Margin 6.4% 3.4% 4.7% 3.8% 3.2% 3.0% 3.2% 3.2% 3.2% 3.2% 3.2% 3.2% Depreciation 24.6 18.8 17.4 n.a. 32.0 32.2 32.6 33.0 31.3 28.9 27.9 26.6 Operating EBIT 38.8 20.1 43.5 n.a. 10.3 (2) 5.4 8.0 7.7 10.2 13.2 14.9 16.2 Margin 3.9% 1.8% 3.3% n a 0.8% 0.4% 0.6% 0.6% 0.8% 1.0% 1.1% 1.2% Capex (7.5) (8.3) (14.8) n.a. (16.0) (15.0) (18.0) (21.0) (24.0) (24.0) (26.3) (28.3) (28.3) EBITDA - Capex 55.9 30.6 46.1 n.a. 26.3 (2) 22.6 22.6 19.7 17.5 15.9 14.5 14.5 Beginning in 2010, assumes: [ ] [ ] Business case to be updated after Q1 09 actuals are released on 27 April 2009 1. Actual figures for 2004 – 2007 are based on pro forma figures. 2004, 2005 and 2006 based on Volcano Supervisory Board presentation dated 6 Dec 2006, 2007 pro forma figures based on Jefferies & Co. report dated 27 Jan 2009. Projections are based on KPN M&A estimates 2. Excludes goodwill impairment of $ 214.8 mn 6 Q1 2008 Confidential KPN00191507
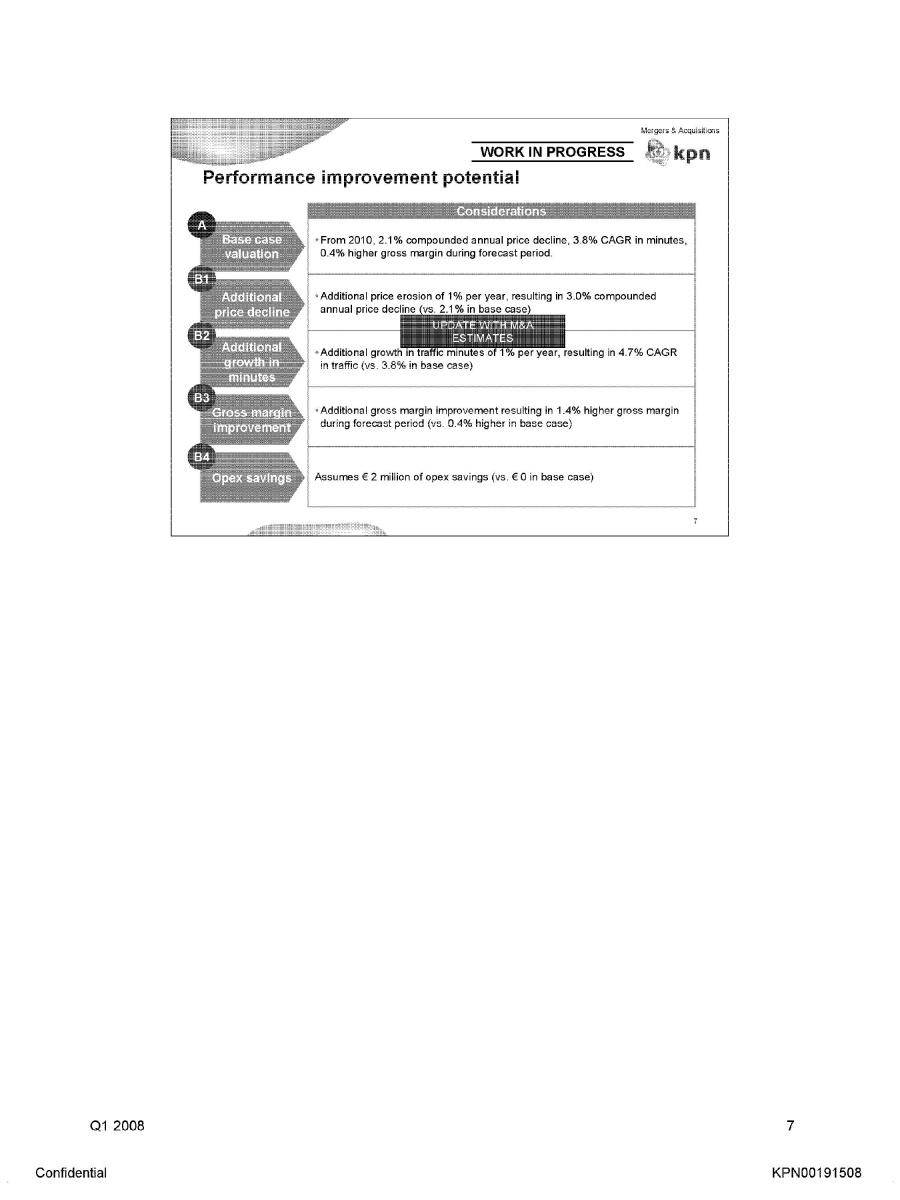
Mergers & Acquisitions kpn Work in progress Performance improvement potential Considerations A Base case valuation From 2010, 2.1% compounded annual price decline, 3.8% CAGR in minutes, 0.4% higher gross margin during forecast period. B1 Additional price decline Additional price erosion of 1% per year, resulting in 3.0% compounded annual price decline (vs. 2 1 °A in base case) UPDATE WITH M&A ESTIMATES B2 Additional growth in minutes Additional growth in traffic minutes of 1% per year, resulting in 4.7% CAGR in traffic (vs. 3.8% in base case) B3 Gross margin improvement Additional gross margin improvement resulting in 1.4% higher gross margin during forecast period (vs. 0.4% higher in base case) B4 Opex savings Assumes € 2 million of opex savings (vs. € 0 in base case) 7 Q1 2008 Confidential KPN00191508
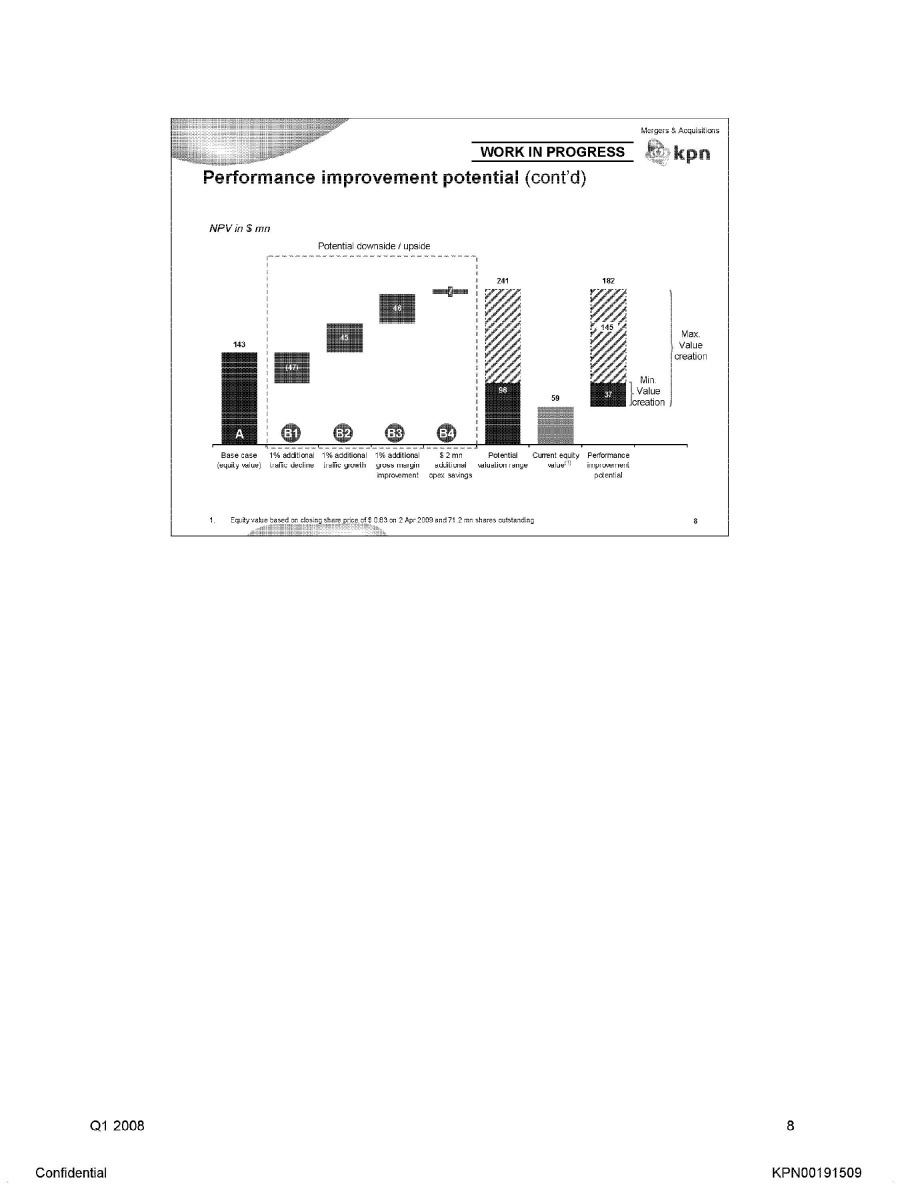
Mergers & Acquisitions kpn Work in progress Performance improvement potential (cont'd) NPV in $ mn Potential downside / upside 143 (47) 45 46 7 241 96 59 182 145 37 Max. Value creation Min. Value creation A B1 B2 B3 B4 Base case (equity value) 1% additional traffic decline 1% additional traffic growth 1% additional gross margin improvement $ 2 mn additional opex savings Potential valuation range Current equity value Performance improvement potential 1. Equity value hosed on closing share price of $ 0.83 on 2 Apr 2009 and 71.2 mn shares outstanding 8 Q1 2008 Confidential KPN00191509
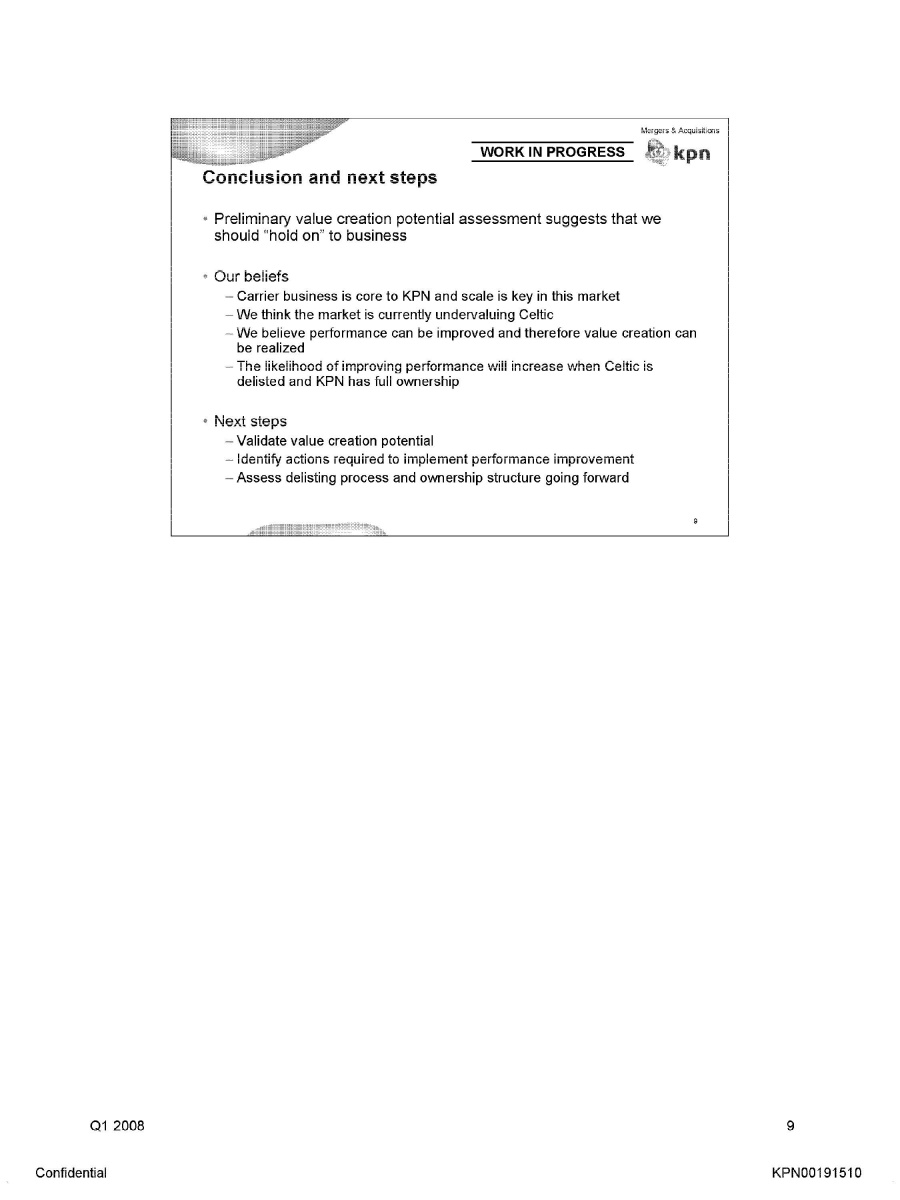
Mergers & Acquisitions kpn Work in progress Conclusion and next steps Preliminary value creation potential assessment suggests that we should “hold on” to business Our beliefs Carrier business is core to KPN and scale is key in this market We think the market is currently undervaluing Celtic We believe performance can be improved and therefore value creation can be realized The likelihood of improving performance will increase when Celtic is delisted and KPN has full ownership Next steps Validate value creation potential Identify actions required to implement performance improvement Assess delisting process and ownership structure going forward 9 Q1 2008 Confidential KPN00191510
Mergers & Acquisitions
WORK IN PROGRESS
[kpn logo]
Appendix
| Q1 2008 | 10 |
| Confidential | KPN00191511 |
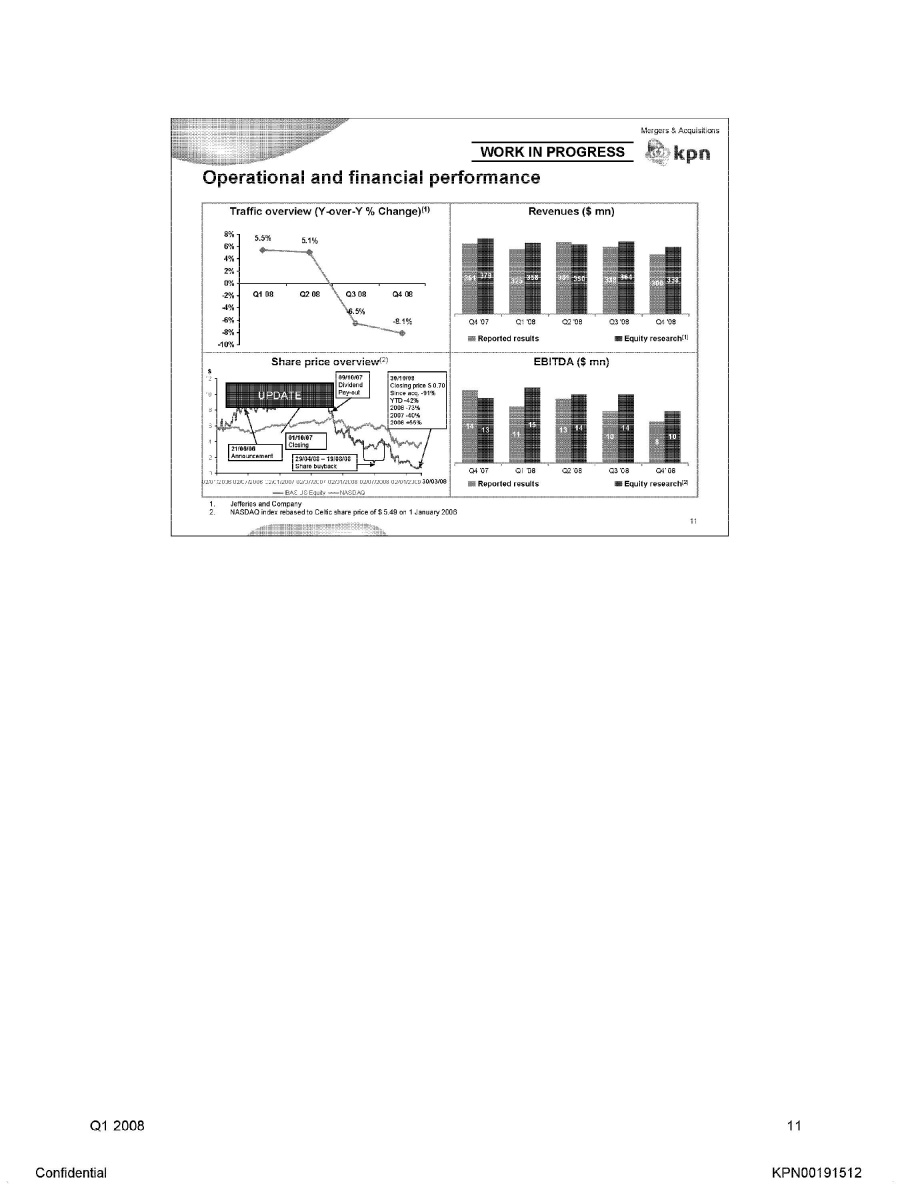
Mergers & Acquisitions kpn Work in progress Operational and financial performance Traffic overview (Y-over& % Change) (1) 8% 6% 4% 2% 0% -2% -4% -6% -8% -10% 5.5% 5.1% -6.5% -8.1% Q1 08 Q2 08 Q3 08 Q4 08 Revenues 351 379 325 358 381 350 338 364 300 338 Q4 ’07 Q1 ’08 Q2 ’08 Q3 ’08 Q4 ‘08 Reported results Equity research (2) Share price overview(2) UPDATE 21/06/06 Announcement 01/10/07 Closing 09/10/07 Dividend Pay-out 29/04/08-19/08/08 Share buyback 30/10/08 Closing price $0 70 Since acq. -91% YTD -42% 2008 -73% 2007 -40% 2006 +55% 02/01/2006 02/07/2006 02/01/2007 02/07/2007 02/01/2008 02/07/2008 02/01/2009 30/03/08 IBAS US Equity NASDAQ EBITDA 14 13 11 15 13 14 10 14 8 10 Q4 ’07 Q1 ’08 Q2 ’08 Q3 ’08 Q4 ‘08 Reported results Equity research (2) 1. Jefferies and Company 2 NASDAQ index rebased to Celtic share price of $ 5.49 on 1 January 2006 11 Q1 2008 Confidential KPN00191512
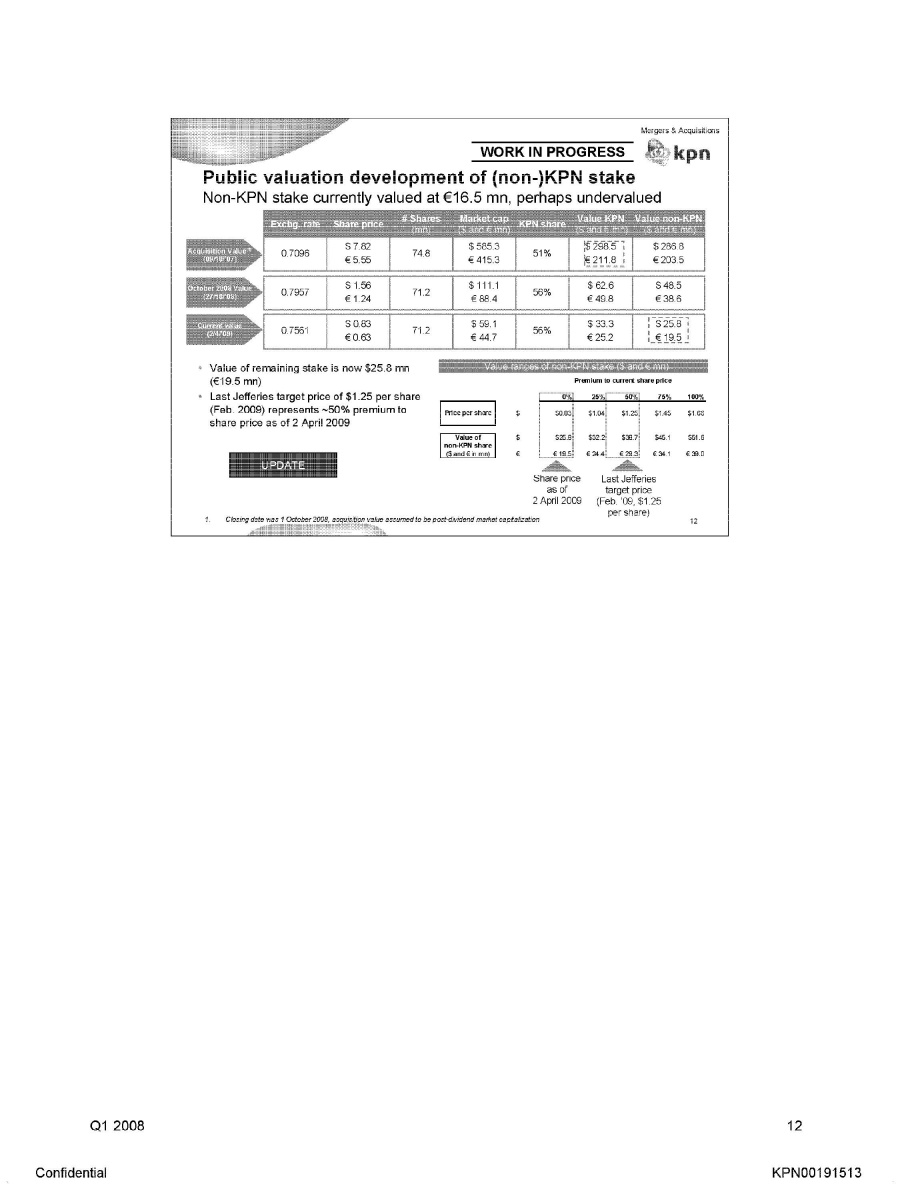
Mergers & Acquisitions kpn Work in progress Public valuation development of (non-)KPN stake Non-KPN stake currently valued at €16.5 mn, perhaps undervalued Exch. Rate Share price # shares (mn) Market cap ($ and € mn) KPN share Value KPN ($ and € mn) Value non-KPN ($ and € mn) Acquisition Value (1) (09/10/07) 0.7096 $ 7.82 € 5.55 74.8 $ 585.3 € 415.3 51%$ 298.5 € 211.8 $ 286.8 € 203.5 October 2008 Value (27/10/08) 0.7957 $ 1.56 € 1.24 71.2 $ 111.1 € 88.4 56% $ 62.6 € 49.8 $ 48.5 € 38.6 Current value (2/4/09) 0.7561 $ 0.83 € 0.63 71.2 $ 59.1 € 44.7 56% $ 33.3 € 25 2 $ 25.8 €19.5 Value of remaining stake is now $25.8 mn (€19.5 mn) Last Jefferies target price of $1.25 per share (Feb. 2009) represents -50% premium to share price as of 2 April 2009 Value ranges of non-KPN stake ($ and € mn) Premium to current share price 0% 25% 50% 75% 100% Price per share $ $ 0.83 $1.04 $1.25 $1.45 $1.66 Value of non-KPN share ($ and € mn) $ 25.8 $32.2 $38.7 $45.1 $51.6 € € 19.5 € 24.4 € 29.3 € 34.1 € 39.0 UPDATE Share price as of 2 April 2009 Last Jefferies target price (Feb 09, $1.25 per share) 1. Closing date was 1 October 2008, acquisition value assumed to be post-dividend market capitalization 12 Q1 2008 Confidential KPN00191513
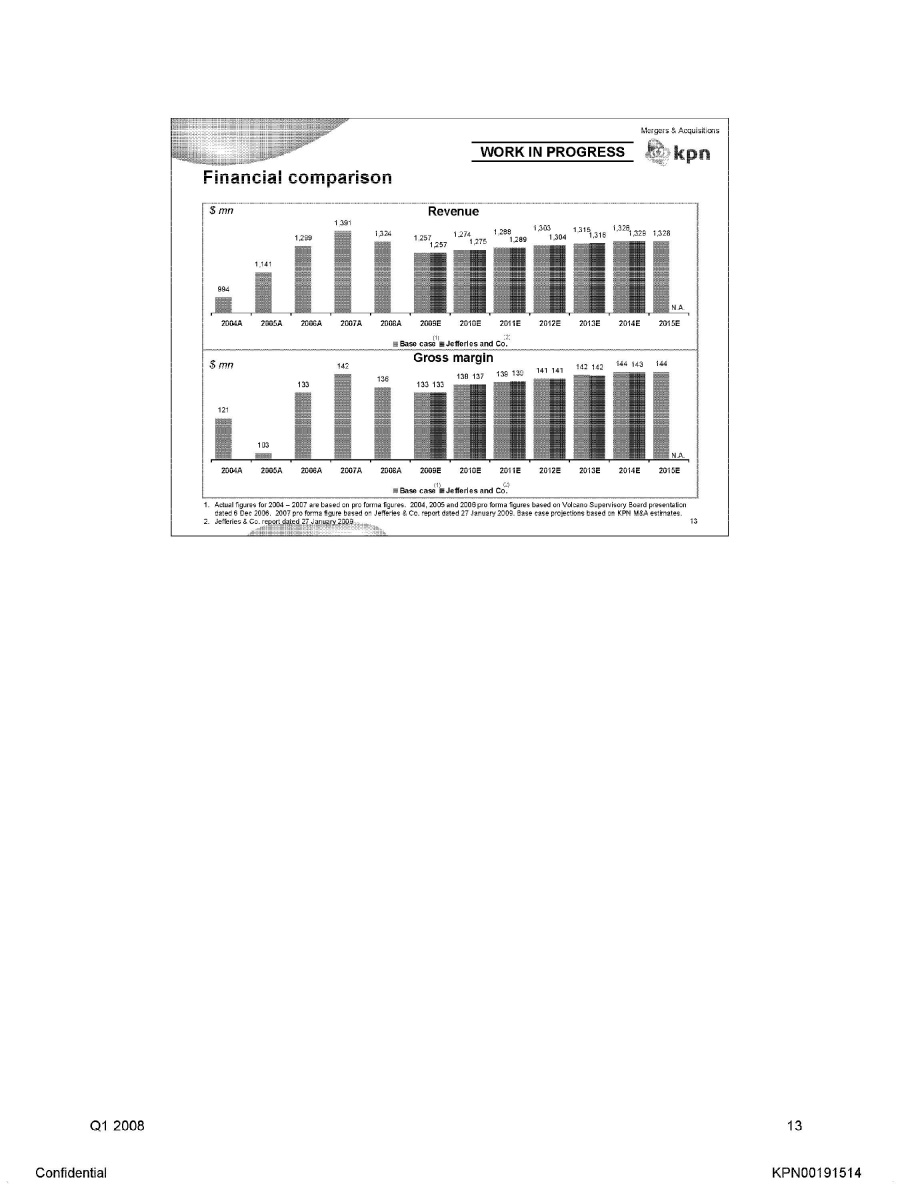
Mergers & Acquisitions kpn Work in progress Financial comparison $ mn Revenue 994 1,141 1,299 1,391 1,324 1,257 1,257 1,274 1,275 1,288 1,289 1,303 1,304 1,315 1,315 1,328 1,329 1,328 n.a. 2004A 2005A 2006A 2007A 2008A 2009E 2010E 2011E 2012E 2013E 2014E 2015E Base case (1) Jefferies and Co. (2) $ mn Gross margin 121 103 133 142 136 133 133 138 137 139 139 141 141 142 142 144 143 144 n.a. 2004A 2005A 2006A 2007A 2008A 2009E 2010E 2011E 2012E 2013E 2014E 2015E Base case (1) Jefferies and Co. (2) 1. Actual figures for 2004 - 2007 are based on pro forma figures. 2004, 2005 and 2006 pro forma figures based on Volcano Supervisory Board presentation dated 6 Dec 2006. 2007 pro forma figure based on Jefferies & Co. report dated 27 January 2009. Base case projections based on KPN M&A estimates. 2. Jefferies & Co report dated 27 January 2009 13 Q1 2008 Confidential KPN00191514
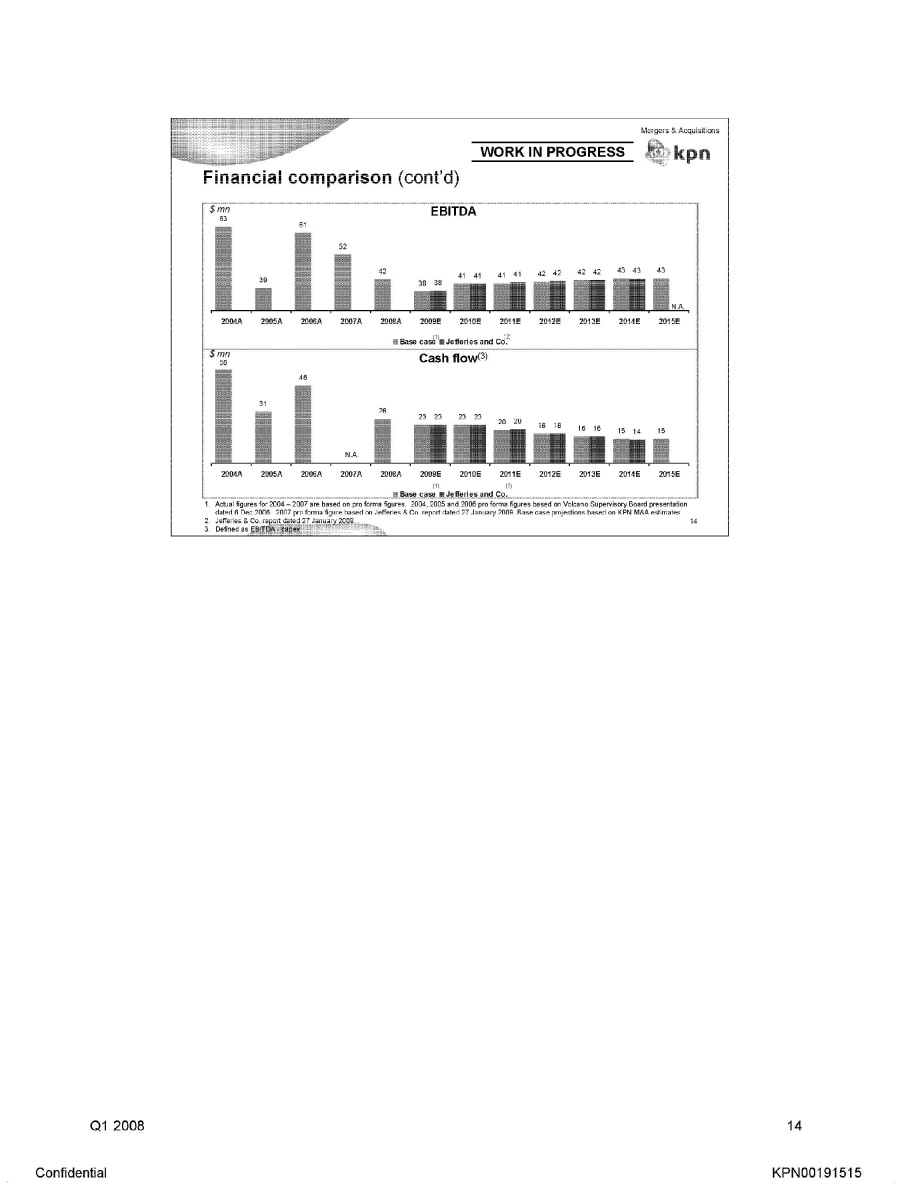
Mergers & Acquisitions kpn Financial comparison (cont’d) $ mn EBITDA 63 39 61 52 42 38 38 41 41 41 41 42 42 42 42 43 43 43 n.a. 2004A 2005A 2006A 2007A 2008A 2009E 2010E 2011E 2012E 2013E 2014E 2015E Base case (1) Jefferies and Co. (2) $ mn Cash flow (3) 56 31 46 n.a. 26 23 23 23 23 20 20 18 18 16 16 15 14 15 n.a. 2004A 2005A 2006A 2007A 2008A 2009E 2010E 2011E 2012E 2013E 2014E 2015E Base case (1) Jefferies and Co. (2) 1. Actual figures for 2004 - 2007 are based on pro forma figures. 2004, 2005 and 2006 pro forma figures based on Volcano Supervisory Board presentation dated 6 Dec 2006. 2007 pro forma figure based on Jefferies & Co report dated 27 January 2009. Base case projections based on KPN M&A estimates. 2. Jefferies & Co report dated 27 January 2009 3. Defined as EBITDA - capex 14 Q1 2008 Confidential KPN00191515
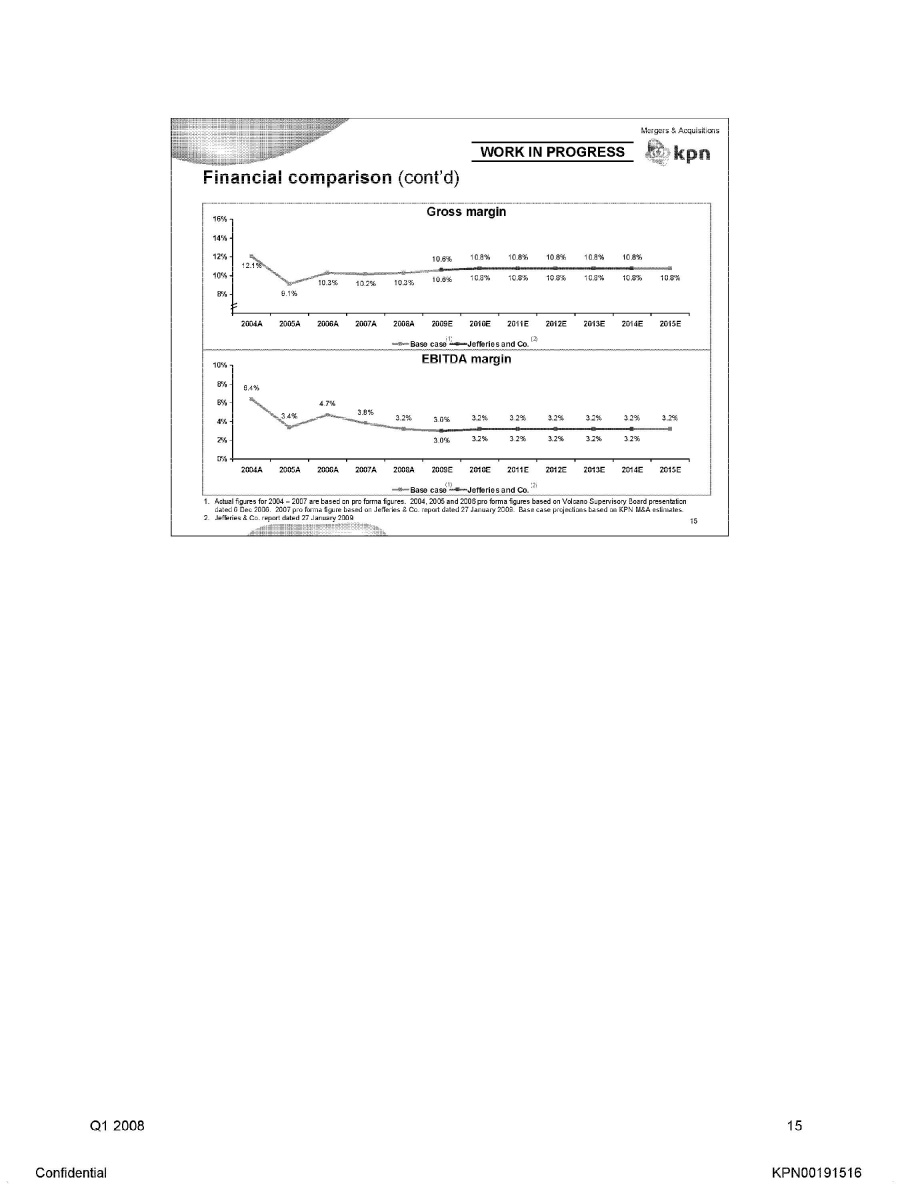
Mergers & Acquisitions kpn Work in progress Financial comparison (cont’d) Gross margin 16% 14% 12% 10% 8% 12.1% 9.1% 10.3% 10.2% 10.3% 10.6% 10.8% 10.8% 10.8% 10.8% 10.8% 10.8% 10.6% 10.8% 10.8% 10.8% 10.8% 10.8% 2004A 2005A 2006A 2007A 2008A 2009E 2010E 2011E 2012E 2013E 2014E 2015E Base case (1) Jefferies and Co. (2) EBITDA margin 10% 8% 6% 4% 2% 0% 6.4% 3.4% 4.7% 3.8% 3.2% 3.0% 3.2% 3.2% 3.2% 3.2% 3.2% 3.2% 3.0% 3.2% 3.2% 32% 3.2% 3.2% 2004A 2005A 2006A 2007A 2008A 2009E 2010E 2011E 2012E 2013E 2014E 2015E Base case (1) Jefferies and Co. (2) 1 Actual figures for 2004 - 2007 are based on pro forma figures. 2004, 2005 and 2006 pro forma figures based on Volcano Supervisory Board presentation dated 6 Dec 2006. 2007 pro forma figure based on Jeffries & Co. report dated 27 January 2009. Base case projections based on KPN M&A estimates. 2 Jeffreies & Co., report dated 27 January 2009 15 Q1 2008 Confidential KPN00191516
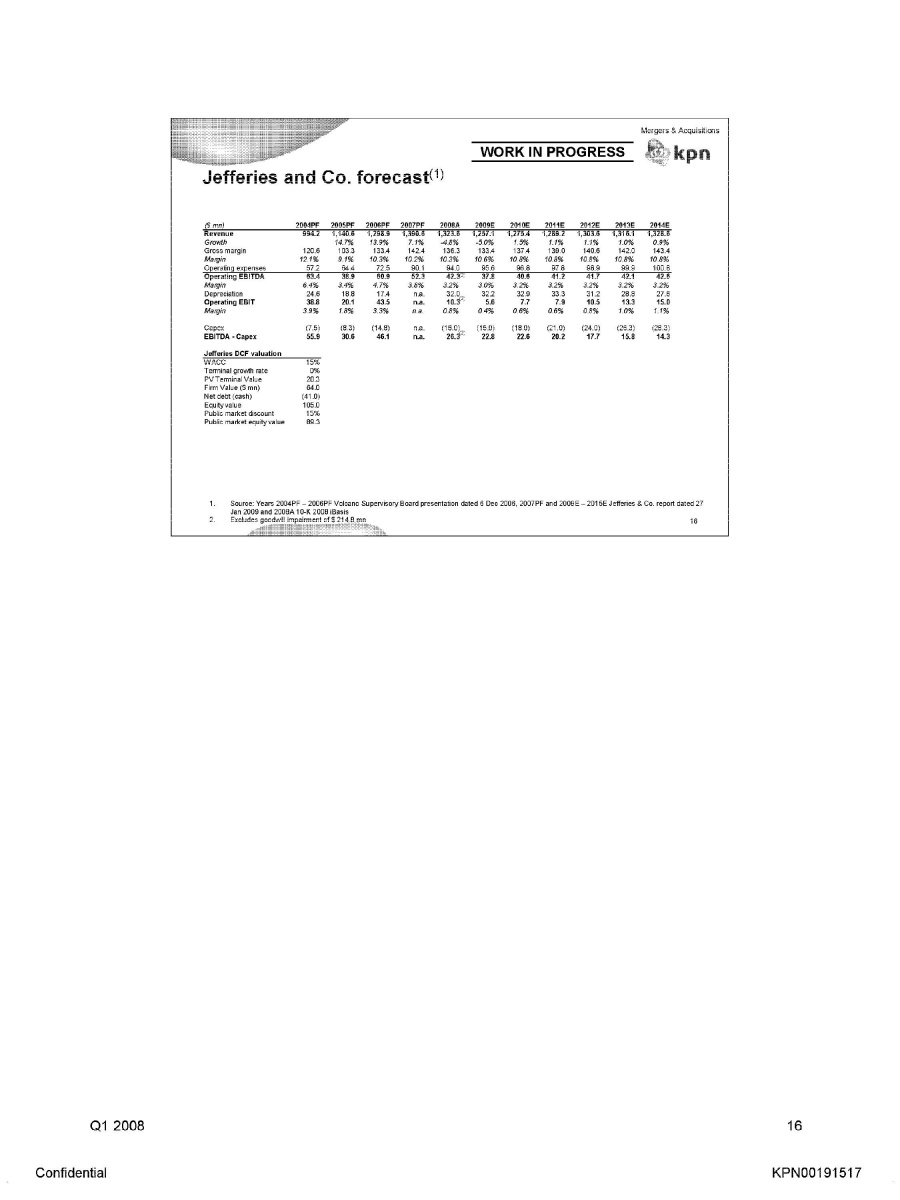
Mergers & Acquisitions kpn Work in progress Jefferies and Co. forecast (1) ($mn) 2004PF 2005PF 2006PF 2007PF 2008A 2009E 2010E 2011E 2012E 2013E 2014E Revenue 994.2 1,140.6 1,298.9 1,390.6 1,323.6 1,257.1 1,275.4 1,289.2 1,303.6 1,316.1 1,328.6 Growth 14.7% 13.9% 7.1% -4.8% (5.0%) 1.5% 1.1% 1.1% 1.0% 0.9% Gross margin 120.6 103.3 133.4 142.4 136.3 133.4 137.4 139.0 140.6 142.0 143.4 Margin 12.1% 9.1% 10.3% 10.2% 10.3% 10.6% 10.8% 10.8% 10.8% 10.8% 10.8% Operating expenses 57.2 64.4 72.5 90.1 94.0 95.6 96.8 97.8 98.9 99.9 100.8 Operating EBITDA 63.4 38.9 60.9 52.3 42.3 (2) 37.8 40.6 41.2 41.7 42.1 42.6 Margin 6.4% 3.4% 4.7% 3.8% 3.2% 3.0% 3.2% 3.2% 3.2% 3.2% 3.2% Depreciation 24.6 18.8 17.4 n.a. 32.0 32.2 32.9 33.3 31.2 28.8 27.6 Operating EBIT 38.8 20.1 43.5 n.a. 10.3 (2) 5.6 7.7 7.9 10.5 13.3 15.0 Margin 3.9% 1.8% 3.3% n a 0.8% 0.4% 0.6% 0.6% 0.8% 1.0% 1.1% Capex (7.5) (8.3) (14.8) n.a. (16.0). (15.0) (18.0) (21.0) (24.0) (26.3) (28.3) EBITDA - Capex 55.9 30.6 46.1 n.a. 26.3 (2) 22.8 22.6 20.2 17.7 15.8 14.3 Jefferies DCF valuation WACC 15% Terminal growth rate 0% PV Terminal Value 28.3 Firm Value ($mn) 64.0 Net debt (cash) (41.0) Equity value 105.0 Public market discout 15% Public market equity value 89.3 1. Source: Years 2004PF - 2006PF Volcano Supervisory Board presentation dated 6 Dec 2006, 2007PF and 2009E - 2015E Jefferies & Co. report dated 27 Jan 2009 and 2008A 10-K 2008 iBasis 2. Excludes goodwill impairment of $ 214.8 mn Q1 2008 16 Confidential KPN00191517
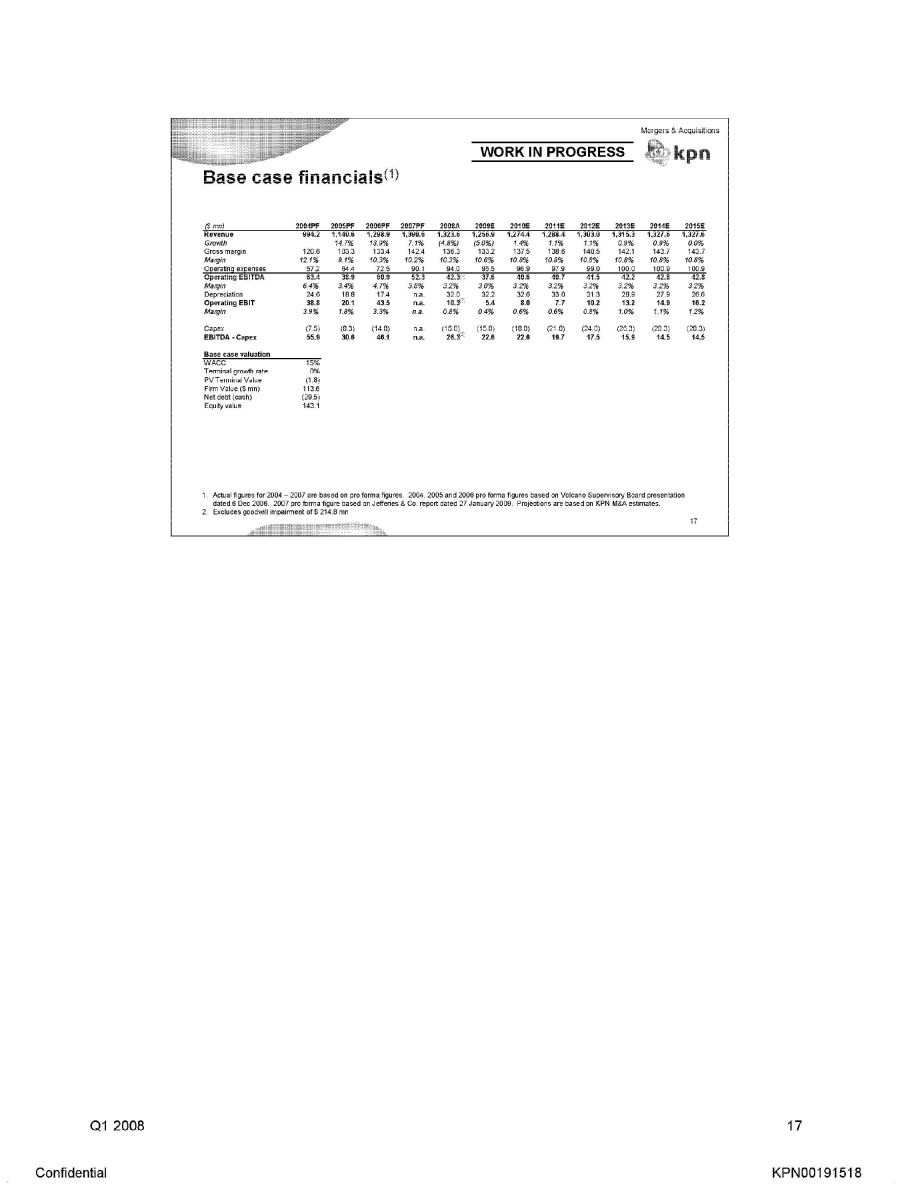
Mergers & Acquisitions kpn Work in progress Base case financials (1) ($ mn) 2004PF 2005PF 2006PF 2007PF 2008A 2009E 2010E 2011E 2012E 2013E 2014E 2015E Revenue 994.2 1,140.6 1,298.9 1,390.6 1,323.6 1,323.6 1,256.9 1,274.4 1,288.4 1,303.0 1,315.3 1,327.6 1,327.6 Growth 14.7% 13.9% 7.1% (4.8%) (5.0%) 1.4% 1.1% 1.1% 0.9% 0.9% 0.0% Gross margin 120.6 103.3 133.4 142.4 136.3 133.2 137.5 138.6 140.5 142.1 143.7 143.7 Margin 12.1% 9.1% 10.3% 10.2% 10.3% 10.6% 10.8% 10.8% 10.8% 10.8% 10.8% 10.8% Operating expenses 57.2 64.4 72.5 90.1 94.0 95.5 96.9 97.9 9 99.0 100.0 100.9 100.9 Operating EBITDA 63.4 38.9 60.9 52.3 42.3 37.6 40.6 40.7 41.5 42.2 42.8 42.8 Margin 6.4% 3.4% 4.7% 3.8% 3.2% 3.0% 3.2% 3.2% 3.2% 3.2% 3.2% 3.2% Depreciation 24.6 18.8 17.4 n.a. 32.0 32.2 32.6 33.0 31.3 28.9 27.9 26.6 Operating EBIT 38.8 20.1 43.5 10.3 5.4 8.0 7.7 10.2 13.2 14.9 16.2 Margin 3.9% 1.8% 3.3% n a 0.8% 0.4% 0.6% 0.6% 0.8% 1.0% 1.1% 1.2% Capex (7.5) (8.3) (14.8) n.a. (16.0) (15.0) (18.0) (21.0) (24.0) (26.3) (28.3) (28.3) EBITDA - Capex 55.9 30.6 46.1 n.a. 26.3 (2) 22.6 22.6 19.7 17.5 15.9 14.5 14.5 Base case valuation WACC 15% Terminal growth rate 0% NPV Terminal Value (1.8) Firm Value ($ mn) 113.6 Net debt (cash) (29.5 Equity value 143.1 1. Actual figures for 2004-2007 are based on pro forma figures. 2004, 2005 and 2006 pro forma figures based on Volcano Supervisory Board presentation dated 6 Dec 2006. 2007 pro forma figure based on Jefferies & Co. report dated 27 January 2009. Projections are based on KPN M&A estimates. 2. Excludes goodwill impairment of $ 214.8 mn 17 Q1 2008 Confidential KPN00191518