Exhibit 99 (a)(5)(xxi)
GEOTEXT Translations, Inc.
| STATE OF NEW YORK | ) | |
| | ) | |
| | ) | ss |
| COUNTY OF NEW YORK | ) | |
CERTIFICATION
This is to certify that the attached translation is, to the best of my knowledge and belief, a true and accurate translation from Dutch into English of the attached e-mail from P.J. van der Schot, dated June 11, 2009.
| | | /s/ | |
| | | | |
| | | Helen Serdyuk, Proofreader | |
| | | Geotext Translations, Inc. | |
Sworn to and subscribed before me
this 4th day of October, 2009
/s/ KATHRYN D. WOLF
KATHRYN D. WOLF
NOTARY PUBLIC-STATE OF NEW YORK
No. 01WO6210178
Qualified In Kings County
___ Expires August 10, 2013
New York 259 West 30th Street, 17th Floor, New York, NY 10001, U.S.A. tel 212.631.7432 fax 212.631.7778 San Francisco 220 Montgomery Street, 3rd Floor, San Francisco, CA 94104, U.S.A. tel 415.576.9500 fax 415.520.0525 London 107-111 Fleet Street, London EC4A 2AB, United Kingdom tel +44.(0)20.7936.9002 fax +44.(0)20.7990.9909 Hong Kong 20th Floor, Central Tower, 28 Queen's Road, Central, Hong Kong tel +852.2159.9143 fax +852.3010.0082
translations@geotext.com | www.geotext.com
From: Schot, van der, P.J. (Paul) (W&O CS iBasis Office)
Sent: Thursday, June 11, 2009 1:44:01 PM
To: Johannes van Dijk; Nijs de, H.W, (Henk) (W&O Finance BG Carrier Services): Dijk, van, J.A. (Johannes) (W&O Finance BC Carrier Services); Scheerder, J.W. (Jan Willem) (W&O CS SALES WS NAT Director)
Subject: Year-end evaluation and year-plan scenarios for during the review tomorrow
Attachments: Scenario's JEV 2009 _ JP 2010 12 juni 2009 v.0.2.ppt [Scenarios YEE 2009 _ YP 2010 June 12, 2009 v.0.2.ppt]
Gentlemen,
Based on the scenarios worked out by Henk I have made the following presentation that we will show in the review.
Received an adjusted version of the numbers from Johannes tonight. My proposal is to first discuss these adjusted numbers tomorrow morning (from 9 to 9:30) and for me to then adjust the presentation.
Please let me know what you think about the content and the set-up of the presentation.
Have a nice evening,
Paul
From: Johannes van Dijk [mailto:johannesvandijk@planet.nl]
Sent: Thursday, June 11, 2009 20:25
To: Nijs, de, H.W (Henk) (W&O Finance BC Carrier Services); Schot, van der, P.J. (Paul) (W&O CS iBasis Office); Dijk, van, J.A. (Johannes) (W&O Financing BC Carrier Services) Subject: YEE SCENARIOSIBASIS_may_2009_v.0.l.xls
I played around with the scenarios a bit.
Johannes
| Highly Confidential | KPN00042178 |
[logo] kpn Scenarios iBasis for 2009IYP 20 June 12, 2009 v.0.2 o Highly Confidential [logo] KPN00042179
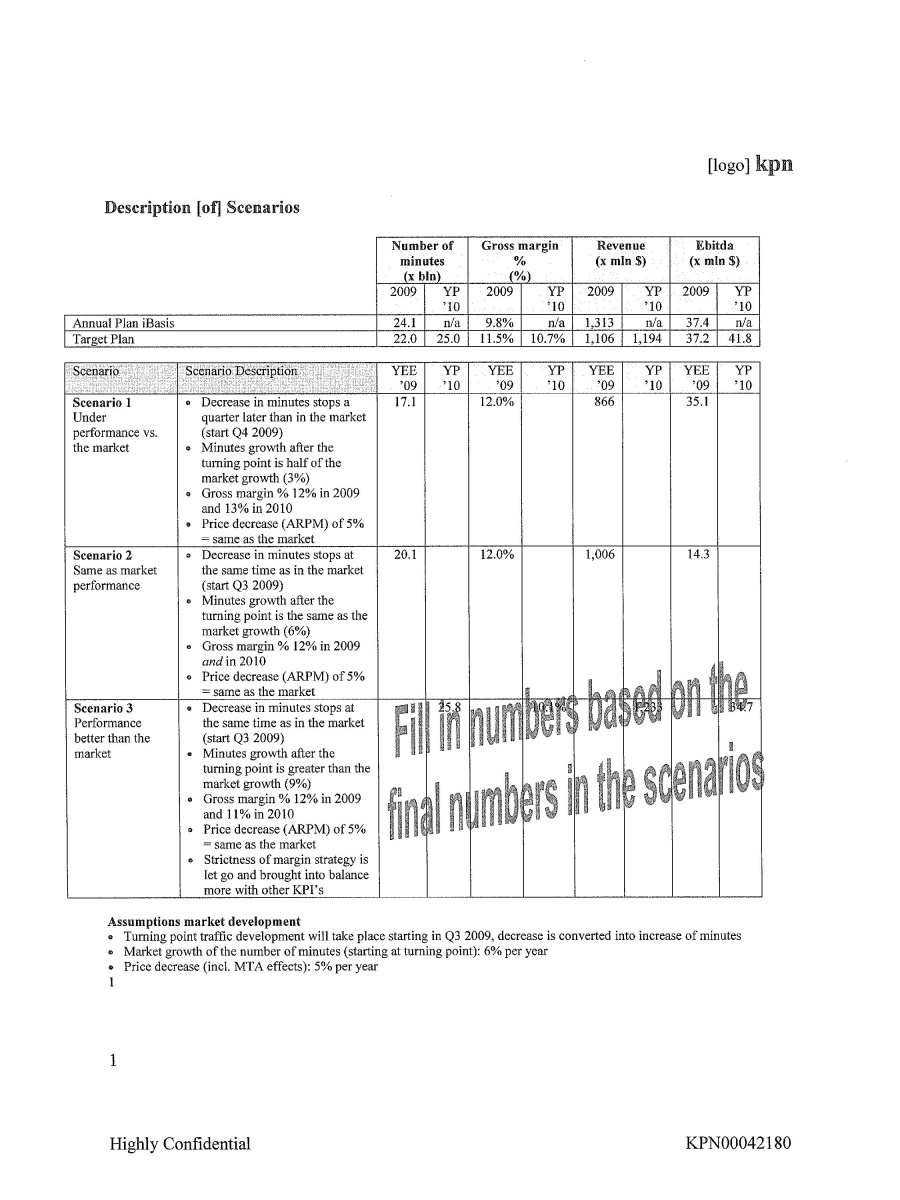
[logo] kpn Description [of] Scenarios Number of minutes (x bin) Gross margin % (%) Revenue (x min $) Ebitda (x min $) 2009 YP ‘10 2009 YP ‘10 2009 YP ‘10 2009 YP ‘10 Annual Plan iBasis 24.1 n/a 9.8% n/a 1313 n/a 37.4 n/a Target Plan 22.0 25.0 11.5% 10.7% 1106 1194 37.2 41.8 Scenario Scenario Description YEE ‘09 YP ‘10 YEE ‘09 YP ‘10 YEE ‘09 YP ‘10 YEE ‘09 YP ‘10 Scenario 1 Under performance vs. the market Scenario 2 Same as market performance Scenario 3 Performance better than the market • Decrease in minutes stops a quarter later than in the market (start Q4 2009) • Minutes growth after the turning point is half of the market growth (3%) • Gross margin % 12% in 2009 and 13% in 2010 • Price decrease (ARPM) of 5% = same as the market CD Decrease in minutes stops at the same time as in the market (start Q3 2009) • Minutes growth after the turning point is the same as the market growth (6%) CD Gross margin % 12% in 2009 and in 2010 CD Price decrease (ARPM) of 5% = same as the market CD Decrease in minutes stops at the same time as in the market (start Q3 2009) • Minutes growth after the turning point is greater than the market growth (9%) CD Gross margin % 12% in 2009 and 11% in 2010 CD Price decrease (ARPM) of 5% = same as the market CD Strictness of margin strategy is let go and brought into balance more with other KPI’s 17.1 12.0% 866 35.1 20.1 12.0% 1,006 14.3 25.8 10.1% 1,233 34.7 Fill in numbers based on the final numbers in the scenarios Assumptions market development • Turning point traffic development will take place starting in Q3 2009, decrease is converted into increase of minutes CD Market growth of the number of minutes (starting at turning point): 6% per year CD Price decrease (incl. MTA effects): 5% per year 1 Highly Confidential KPN00042180
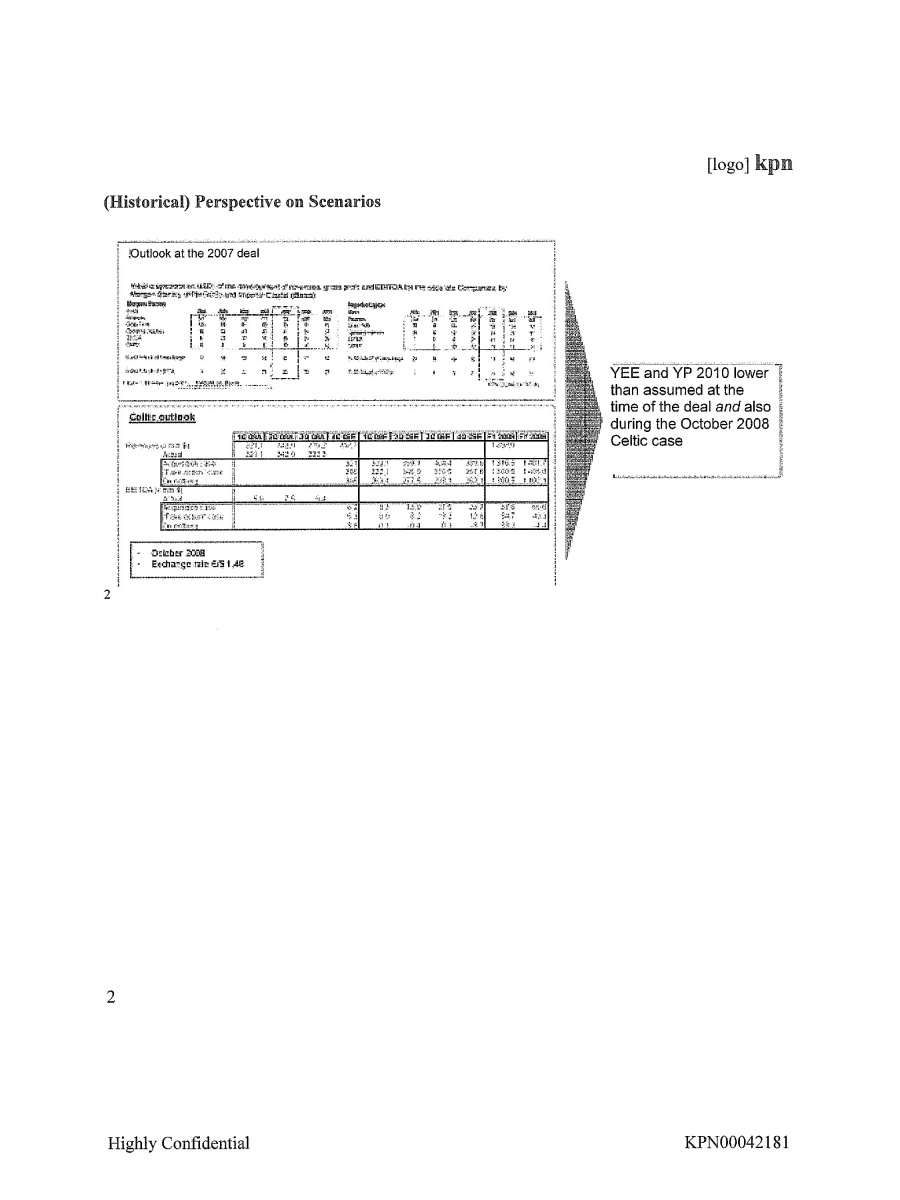
[logo] kpn (Historical) Perspective on Scenarios Outlook at the 2007 deal Celtic outlook October 2008 Exchange rate €/$ 1.48 YEE and YP 2010 lower than assumed at the time of the deal and also during the October 2008 Celtic case 2 2 Highly confidential KPN00042181
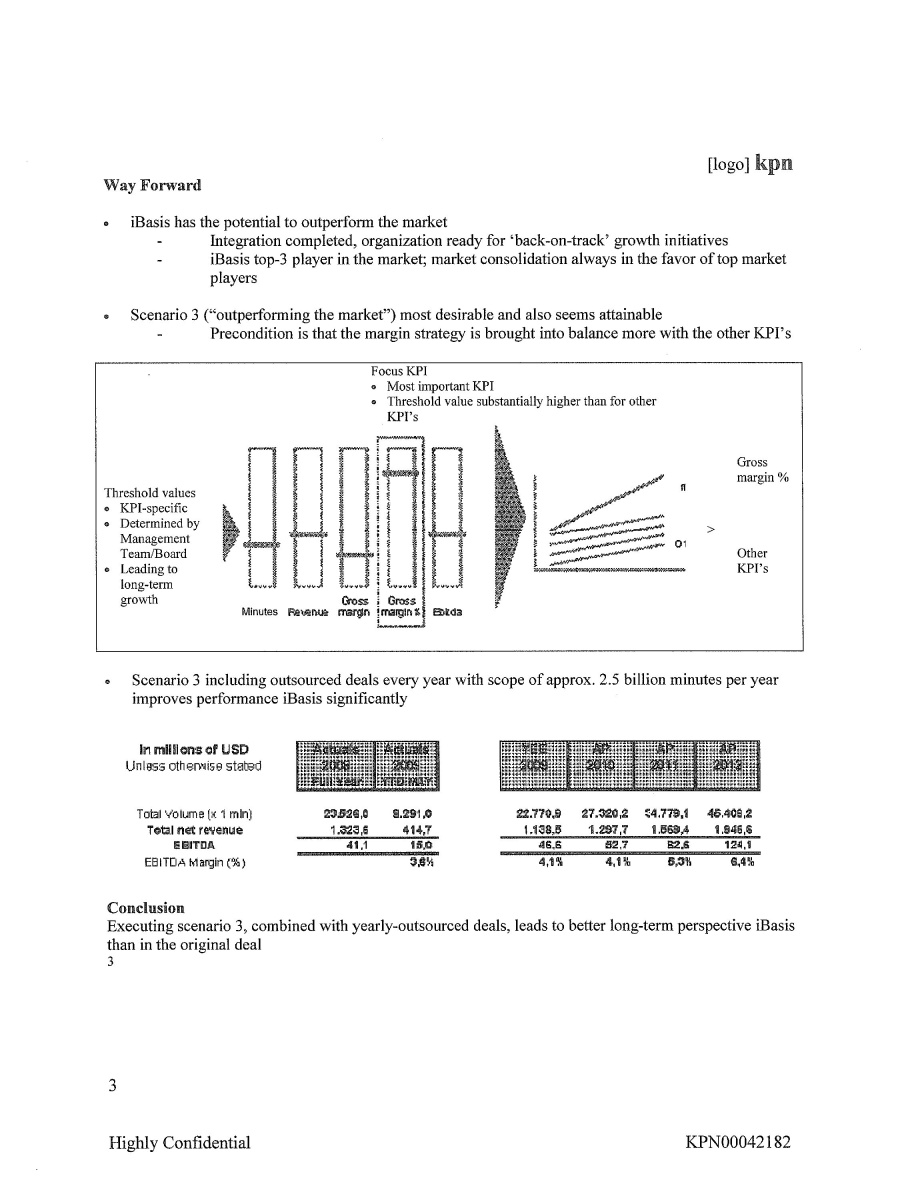
[logo] kpn Way Forward • iBasis has the potential to outperform the market Integration completed, organization ready for 'back-on-track' growth initiatives iBasis top-3 player in the market; market consolidation always in the favor of top market players • Scenario 3 ("outperforming the market") most desirable and also seems attainable Precondition is that the margin strategy is brought into balance more with the other KPI's Focus KPI • Most important KPI • Threshold value substantially higher than for other KPI's Threshold values • KPI-specific • Determined by Management Team/Board • Leading to long-term growth Minutes Revenue Gross Margin Gross margin % Ebitda Gross margin % Other KPI’s • Scenario 3 including outsourced deals every year with scope of approx. 2.5 billion minutes per year improves performance iBasis significantly In millions of USD Unless otherwise stated Total volume (x 1 min) Total net revenue EBITDA EBITDA margin (%) 23,526.0 8,291.0 22,770.9 27,320.2 54,779.1 46,408.2 1,323.6 414.7 1,138.5 1,297.7 1,569.4 1,846.6 41.1 15.0 46.6 52.7 82.6 124.1 3.8% 4.1% 4.1% 5.3% 6.4% Conclusion Executing scenario 3, combined with yearly-outsourced deals, leads to better long-term perspective iBasis than in the original deal 3 3 Highly Confidential KPN00042182
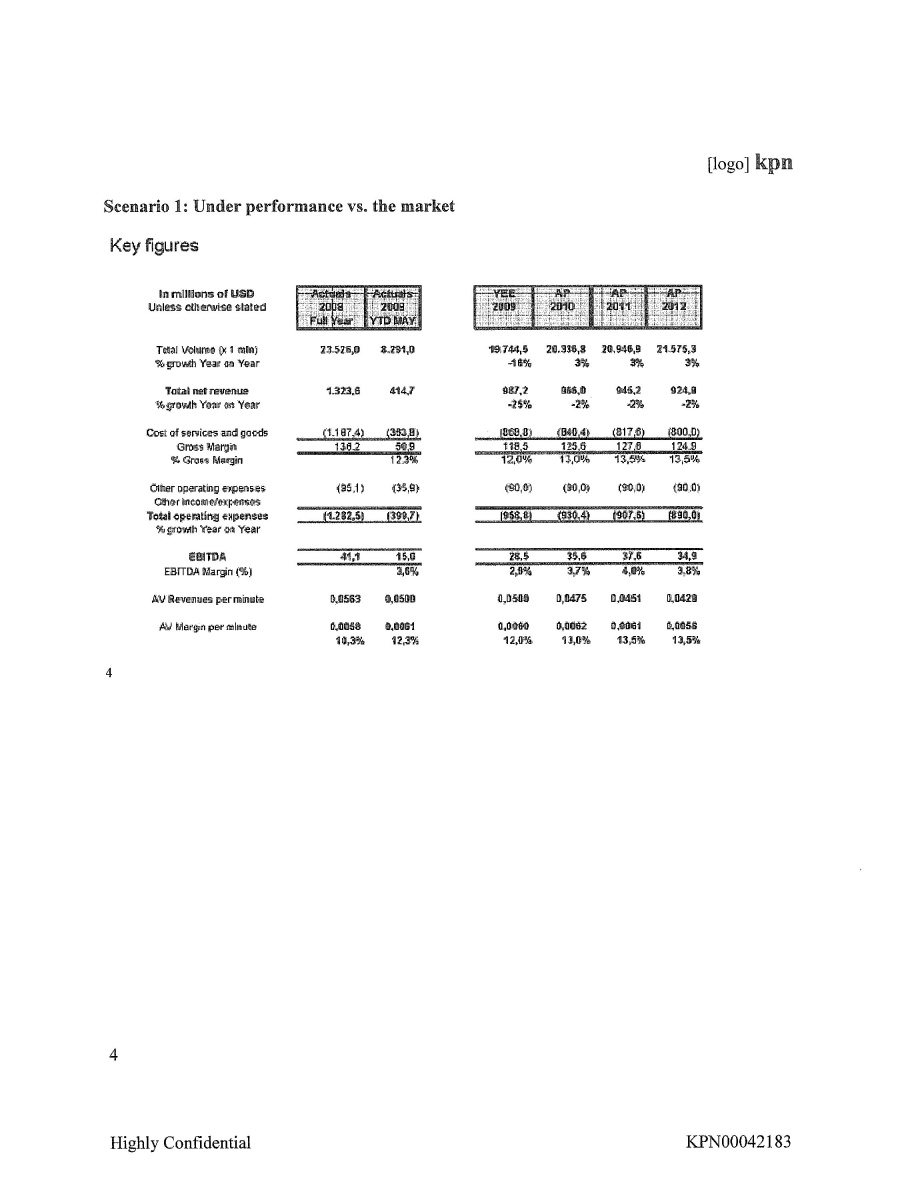
[logo] kpn Scenario 1: Under performance vs. the market Key figures in millions of USD unless otherwise stated Actuals 2008 Full year Actuals 2008 YTD MAY YEE 2008 AP 2010 AP 2011 AP 2012 Total volume (x 1 min) % growth year on year 23,526.0 8,291.0 19,744.5 20,336.8 20,946.9 21,575.3 Total net revenue % growth year on year 1,323.6 414.7 987.2 956.0 945.2 924.9 -25% -2% - -2% -2% Cost of services and goods Gross margin % Gross margin (1,187.4) (363.8) (868.8) (840.4) (817.6) (800.0) 136.2 50.9 118.5 125.6 127.6 124.9 12.3% 12.0% 13.0% 13.5% 13.5% Other operating expenses Other income/expenses Total operating expenses % growth year on year (95.1) (35.9) (90.0) (90.0) (90.0) (90.0) (1282.5) (399.7) (958.8) (930.4) (907.6) (890.0)
EBITDA EBITDA Margin (%) 41.1 15.0 28.5 35.6 37.6 34.9 3.6% 2.9% 3.7% 4.0% 3.8% AV Revenues per minute 0.0563 0.0500 0.0500 0.0475 0.0451 0.0429 AV Margin per minute 0.0058 0.0061 0.0060 0.0062 0.0061 0.0058 10.3% 12.3% 12.0% 13.0% 13.5% 13.5% Highly Confidential KPN00042183

[logo] kpn Scenario 1: Under performance with regard to the market Graphics Minutes 1. Underperformance Gross margin 1. Underperformance Revenue 1. Underperformance EBITDA
EBITDA 1. Underperformance 5 Highly Confidential KPN00042184
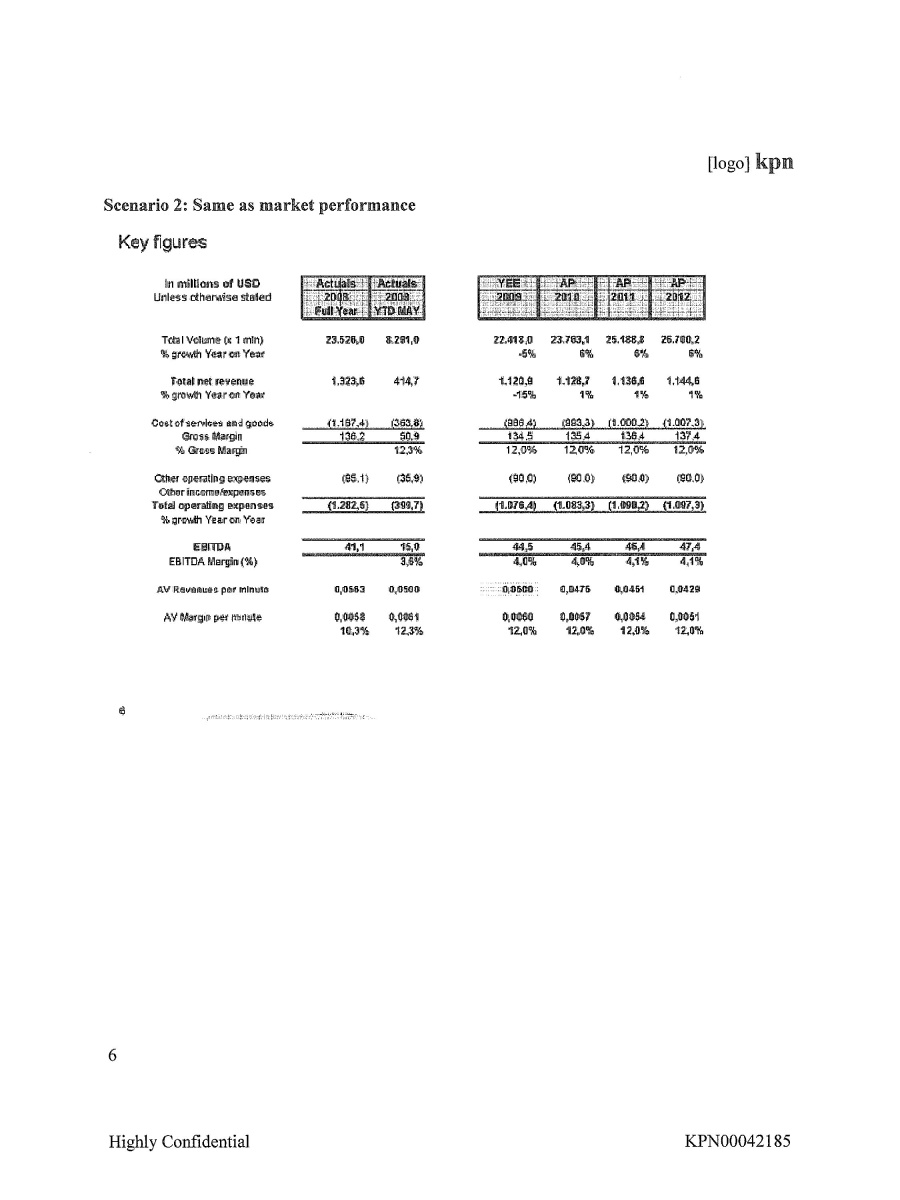
[logo] kpn Scenario 2: Same as market performance Key figures in millions of USD unless otherwise stated
ACtuals 2008 Full Year Actuals 2009 YTD May YEE 2009 AP 2010 AP 2011 AP 2012 Total Volume (x 1 min) % growth year on year 23,526.0 8291.0 22418.0 23763.1 25188.8 26700.2 -6% -6% -6% - -6% Total net revenue % growth year on year 1,323.6 414.7 1,120.9 1,128.7 1,136.6 1,144.6 -15% 1% 1% 1% Cost of services and goods Gross Margin % Gross Margin (1,187.4) (363.8) (986.4) (993.3) (1,000.2) (1,007.3) 136.2 50.9 134.5 135.4 136.4 137.4 12.3% 12.0% 12.0% 12.0% 12.0% Other operating expenses Other income/expenses Total operating expenses % growth year on year (95.1) (35.9) (90.0) (90.0) (90.0) (90.0) (1,285.5) (399.7) (1,076.4) (1,083.3) (1,090.2) (1,097.3) EBITDA EBITDA Margin (%) 41.1 15.0 44.5 45.4 46.4 47.4 3.6% 4.0% 4.0% 4.1% 4.1% AV Revenues per minute 0.0563 0.0500 0.0500 0.0475 0.0451 0.0429 AV Margin per minute 0.0058 0.0061 0.0060 0.0057 0.0054 0.0051 10.3% 12.3% 12.0% 12.0% 12.0% 12.0% 6 Highly confidential KPN00042185
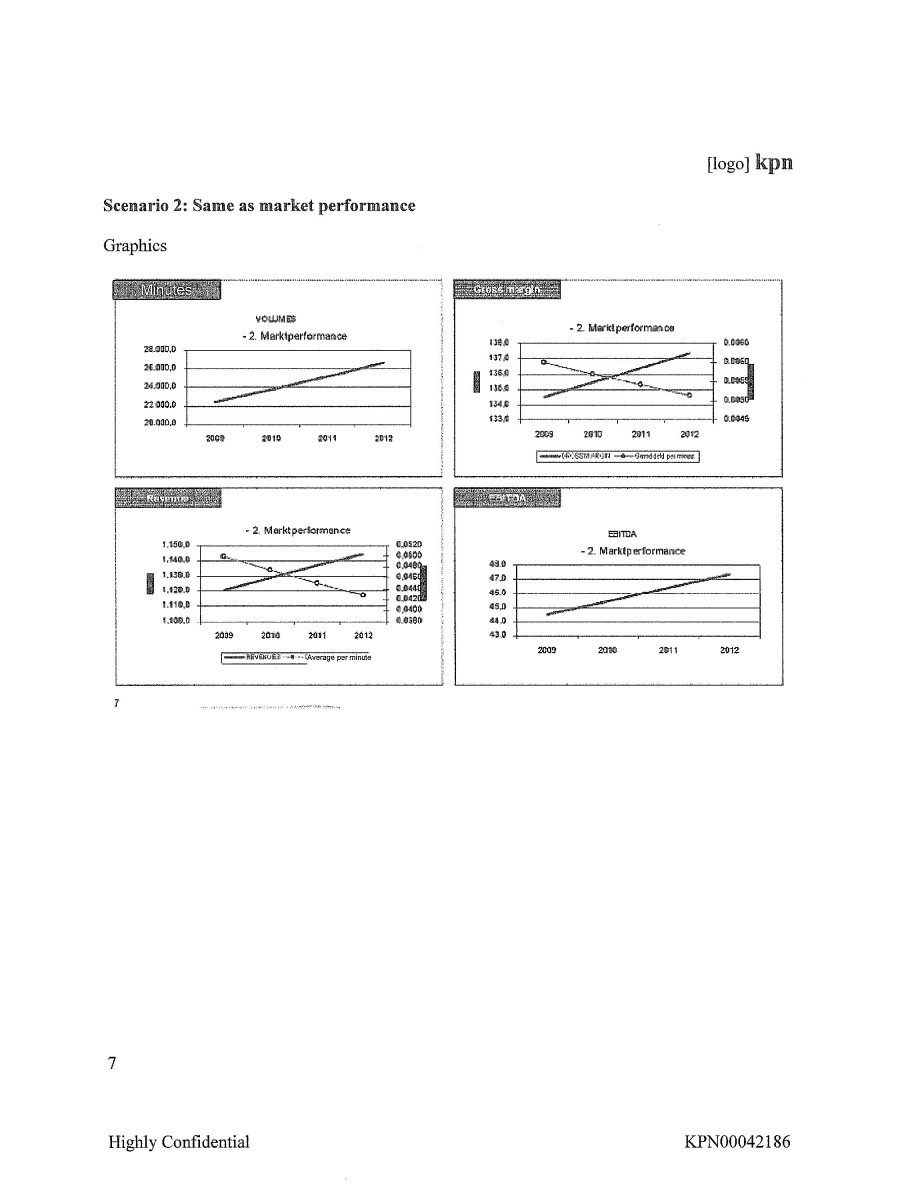
Scenario 2: Same as market performance Graphics Minutes VOLUMES 2. Marktperformance Gross margin 2. Marktperformance Revenue 2. Marktperformance EBITDA 2. Marktperformance 7 Highly Confidential KPN00042186
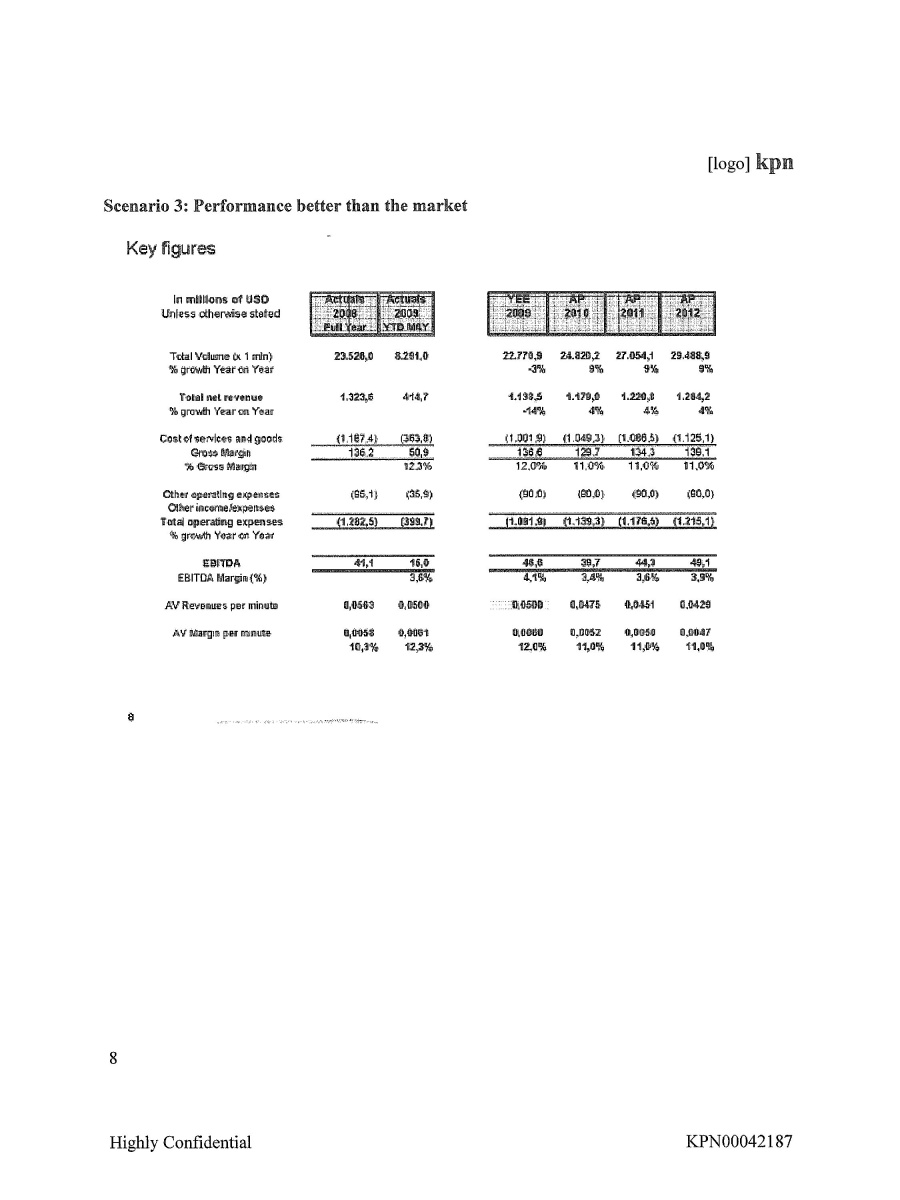
[logo] kpn Scenario 3: Performance better than the market Key figures in millions of USD unless otherwise stated Actuals 2008 Full Year Actuals 2009 YTD May YEE 2009 AP 2010 AP 2011 AP 2012 Total Volume (x 1 min) % growth year on year 23,526.0 8291.0 22770.9 24820.2 27054.1 29488.9 -3% 9% 9% 9% Total net revenue % growth year on year 1,323.6 414.7 1,138.5 1,179.0 1,220.8 1,264.2 -14% 4% 4% 4% Cost of services and goods Gross Margin % Gross Margin (1,187.4) (363.8) (1,001.9) (1.049.3) (1,086.5) (1,125.1) 136.2 50.9 136.6 129.7 134.3 139.1 12.3% 12.0% 11.0% 11.0% 11.0% Other operating expenses Other income/expenses Total operating expenses % growth year on year (95.1) (35.9) (90.0) (90.0) (90.0) (90.0) (1,285.5) (399.7) (1,091.9) (1,139.3) (1,176.5) (1,215.1) EBITDA EBITDA Margin (%) 41.1 15.0 46.6 39.7 44.3 49.1 3.6% 4.1% 3.4% 3.6% 3.9% AV Revenues per minute 0.0563 0.0500 0.0500 0.0475 0.0451 0.0429 AV Margin per minute 0.0058 0.0051 0.0060 0.0052 0.0050 0.0047 10.3% 12.3% 12.0% 11.0% 11.0% 11.0% 8 Highly Confidential KPN00042187
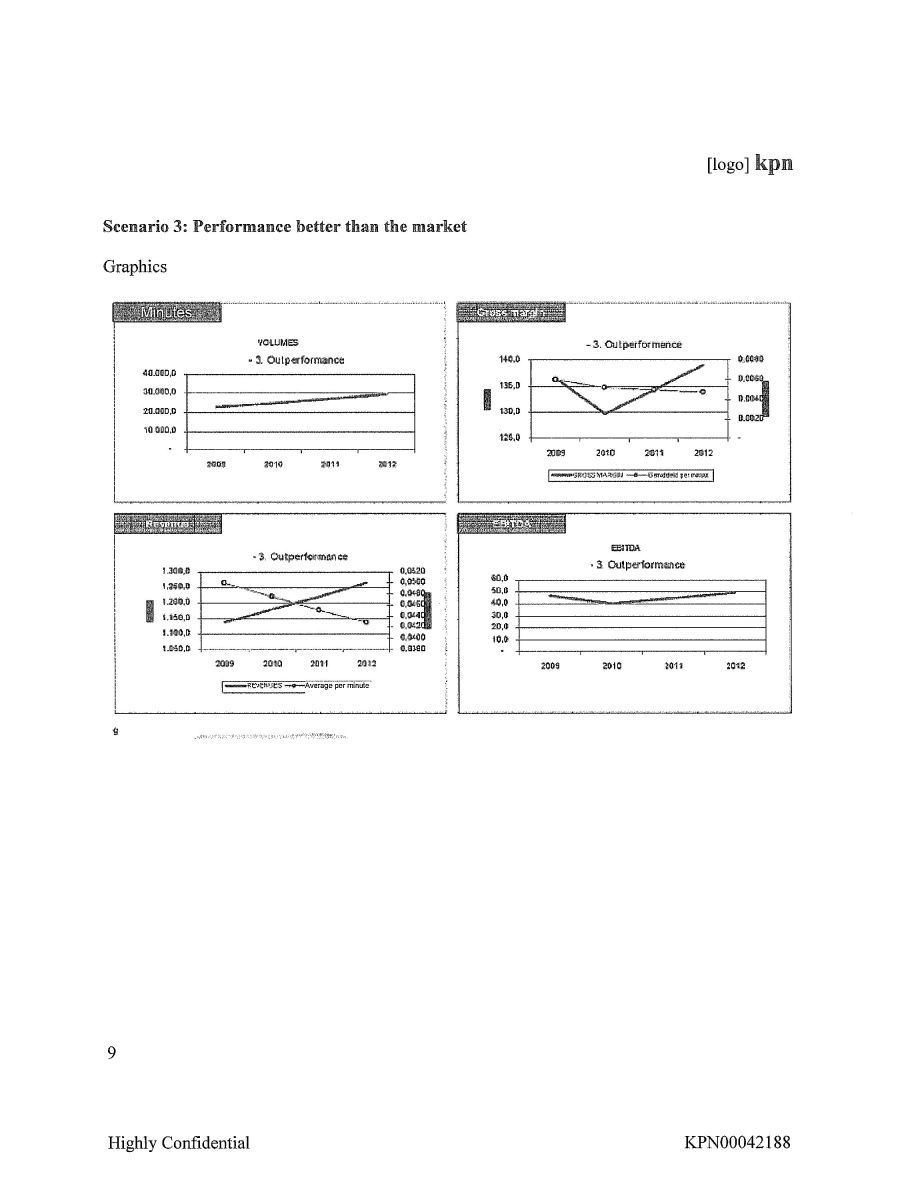
[logo] kpn Scenario 3: Performance better than the market Graphics Minutes VOLUMES 3. Outperformance 3. Outperformance Revenue EBITDA 9 Highly Confidential KPN00042188

Scenario 4 = Scenario 3 + 2.5 billion minutes in outsource deals per year Key figures in millions of USD unless otherwise stated Actuals 2008 Full Year Actuals 2009 YTD May YEE 2009 AP 2010 AP 2011 AP 2012 Total Volume (x 1 min) % growth year on year 23,526.0 8291.0 22770.9 27320.2 34779.1 45409.2 -3% 20% 27% 31% Total net revenue % growth year on year 1,323.6 414.7 1,138.5 1,287.7 1,569.4 1,946.6 -14% 14% 21 24% Cost of services and goods Gross Margin % Gross Margin (1,187.4) (363.8) (1,001.9) (1,155.0) (1,396.8) (1,732.5) 136.2 50.9 136.6 142.7 172.6 214.1 12.3% 12.0% 11.0% 11.0% 11.0% Other operating expenses Other income/expenses Total operating expenses % growth year on year (95.1) (35.9) (90.0) (90.0) (90.0) (90.0) (1,285.5) (399.7) (1,091.9) (1,245.0) (1,486.8) (1,822.5) EBITDA EBITDA Margin (%) 41.1 15.0 46.6 52.7 82.6 124.1 3.6% 4.1% 4.1% 5.3% 6.4% AV Revenues per minute 0.0563 0.0500 0.0500 0.0475 0.0451 0.0429 AV Margin per minute 0.0058 0.0051 0.0060 0.0052 0.0050 0.0047 10.3% 12.3% 12.0% 11.0% 11.0% 11.0% 10 Highly Confidential KPN00042189
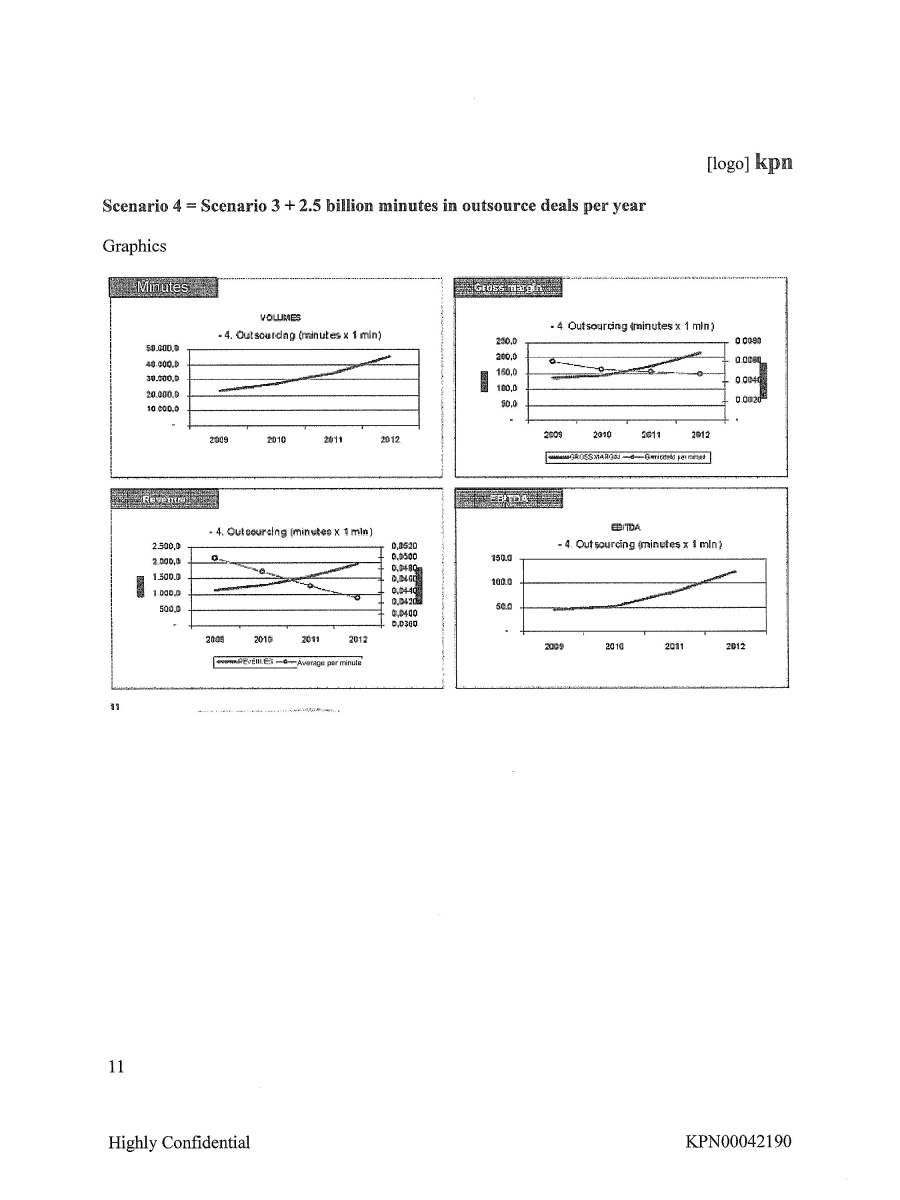
[logo] kpn Scenario 4 =Scenario 3 + 2.5 billion minutes in outsource deals per year Graphics Minutes VOLUMES 4. Outsourcing (minutes x 1 min) 4. Outsourcing (minutes x 1 min) 4. Outsourcing (minutes x 1 min) 4. Outsourcing (minutes x 1 min) Revenue Gross Margin EBITDA 11 Highly Confidential KPN00042190

From: Schot, van der, P.J. (Paul) (W&O CS iBasis Office)
Sent: Thursday, June 11, 2009 1:44:01 PM
To: Johannes van Dijk; Nijs, de, H.W. (Henk) (W&O Financiën BC Carrier Services); Dijk, van, J.A. (Johannes) (W&O Financiën BC Carrier Services); Scheerder, J.W. (Jan Willem) (W&O CS SALES WS NAT Director)
Subject: JEV en Jaarplan scenario's voor morgen tijdens de review
Attachments: Scenario's JEV 2009 _ JP 2010 12 juni 2009 v0.2.ppt
Heren,
Ik heb op basis van de uitwerking van de scenario's van Henk de volgende presentatie gemaakt die we in de review gaan laten zien.
Vanavond een aangepaste versie van de cijfers van Johannes gekregen. Mijn voorstel is om eerst morgenochtend (van 9 tot half 10) deze aangepaste cijfers te bespreken en dat ik daama de presentatie aanpas.
Graag jullie reactie op de rest van de inhoud en de opbouw van de presentatie.
Pr avond
Paul
_______________
Van: Johannes van Dijk [mailto:johannesvandijk@planet.nl]
Verzonden: donderdag 11 juni 2009 20:25
Aan: Nijs, de, H.W. (Henk) (W&O Financiën BC Carrier Services); Schot, van der, P.J. (Paul) (W&O CS iBasis Office); Dijk, van, J.A. (Johannes) (W&O Financiën BC Carrier Services) Onderwerp: YEE SCENARIOSIBASIS_may_2009_v01.xls
Ik heb nog even gespeeld met de scenario's
Johannes
| Highly Confidential | KPN00042178 |
kpn Scenario’s iBasis t.b.v. JEV 2009/JP 2010 12 juni 2009 v0.2 0 Highly Confidential KPN00042179

Beschrijving scenario's Jaarplan iBasis Target plan Scenario 1 Underperformance t.o,v. de mark! Scenario 2 Gelijk aan mark!performance Scenario 3 Betere performance dan de markt , Daling van de minuten slopl een !<wartaallaler dan in de mark! (start 042009) · Minulen oroei na het keerpunl i. de helf! van de mark!groel (3%) • Gross margln% 12% In 2009 en 13% In 2010 • PrlJsdaling (ARPM)van 5% =gellJk aan de mark! , Daling van de minuten slopt op helzelfde moment als in de mark! (start 03 2000) • Mlnuten groel na het keerpunt is gellJk aan de marktgroel (6%) • Gross margln% 12% in 2009 en in 2010 • Prijsdallng (ARPM)van 5% = gelljll aan de mark! , Daling van de minuten stopt op helzelfde moment als in de mark! (start 03 2009) • Minuten groel na het keerpunt is groter dan de marldgroei (9%) • Gross margln% 12% In 2009 en 11% In 2010 , Prljsdallng (ARPM)van 5% =gelljk aan de mark! • Slrietheld van marge-stralegie wordt losgelalen en wordt meer in balans gebraeht met andere KPl's 17,1 20,1 12,0% 12,0% 866 1.006 35,1 14,3 1 Highly Confidential Aannames marklonlwlkkeling Kantelpunt verkeersontwikkeling vind! plaats vanaf 032009, daling wordt omgeze! in minuten stijging Marklgroei van het aantal minuten (vanaf kanlelpunt): 6% per jaar Prljsdaling (incl. MTA effecten): 5% per jaar KPN00042180
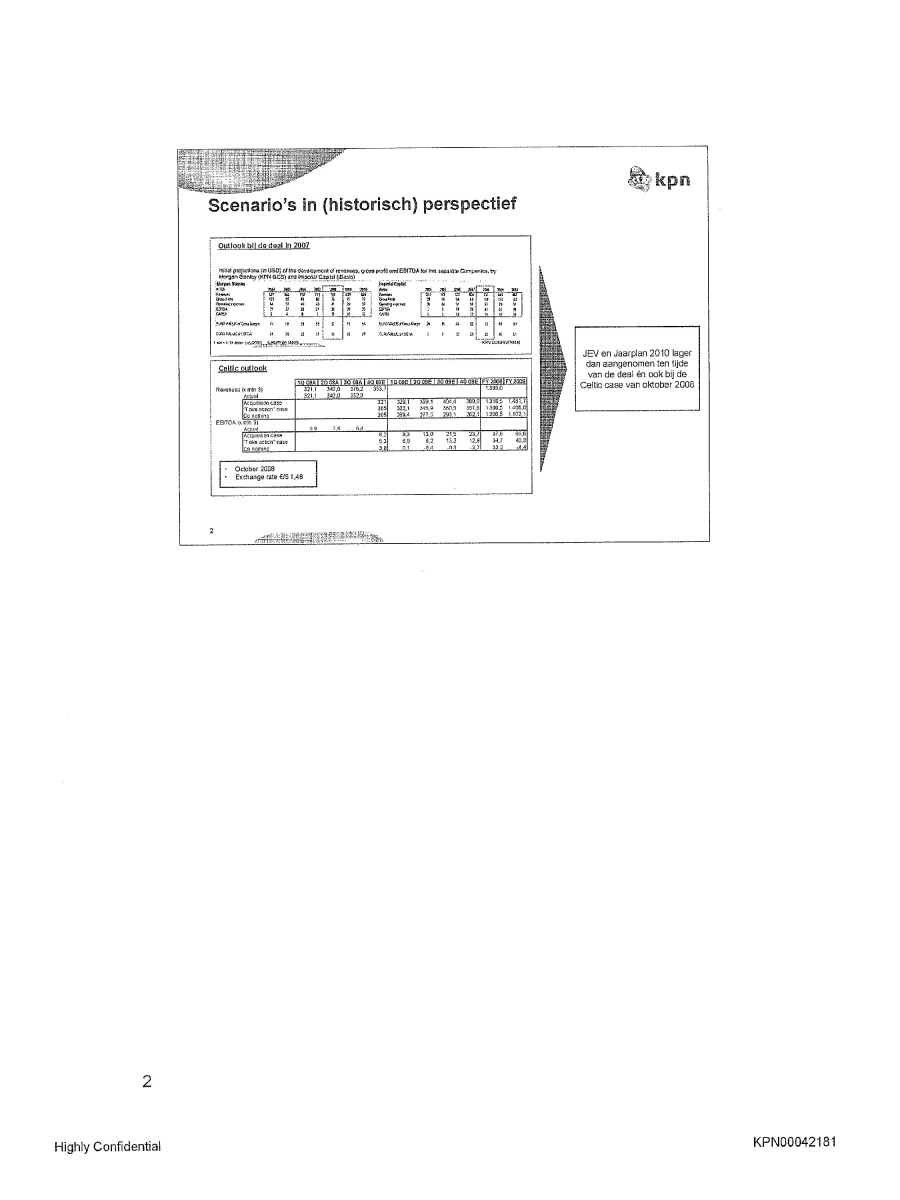
Slide Scenario's in (historisch) perspectief Outlook bil de deal in 2007 Celtic outlook Revenues EBITDA October 2008 Exchange rate €/$ 1,48 JEV en Jaarplan 2010 lager dan aangeenomen ten tijde van de deal é ook bij de Celtic case van oktoer 2008 Highly Confidential KPN00042181
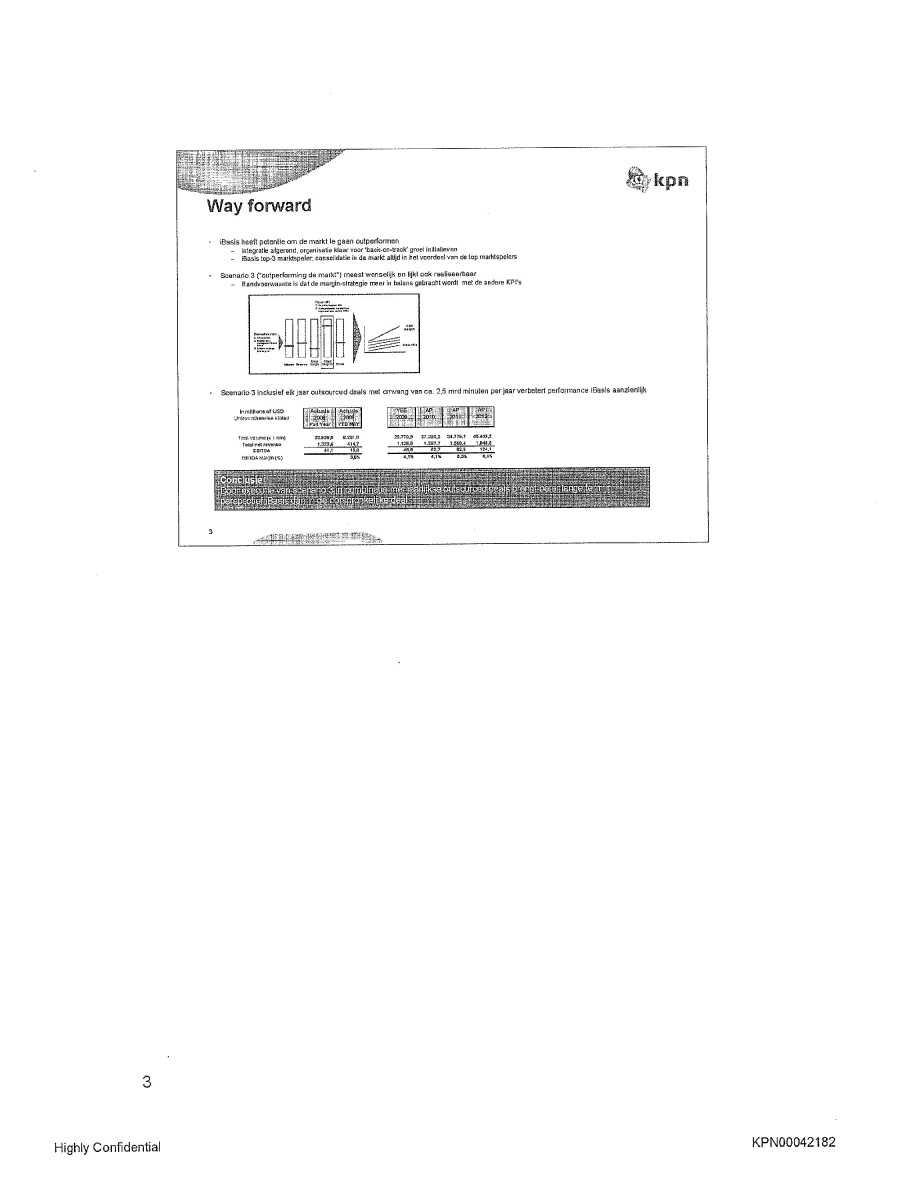
Way forward iBasis heelt potentie om de markt Ie gaan outperformen - Integratie afgerand, organisatie klaar voor 'back-on-track' groei initiatieven - iBasis top-3 marktspeler: consolidatie in de markt altijd in het voordeel van de top marktspelers Scenario 3 ("outperforming de markt") meest wenselijk en lijkt ook realiseerbaar - Randvoorwaarde is dat de margin-slrategie meer in balans gebracht wordt met de andere KPI's Scenario 3 inclusief elk jaar outsourced deals met omvang van ca. 2,5 mrd minuten per jaar verbetert performance iBasis aanzienlijk In mllllons of USD Unless otherwise stated Total Volume (K 1 min) Total net revenue EBITDA EB1TDA Margin (%) Conclusie Doore executie van Scenario 3 in combinatie met jaarikse outsourced deals brengt beter lange termin perspectief iBasis dan in de corspronkelije deal Highly Confidential KPN00042182

Scenario 1: underperformance t.o.v. de markt Key figures In millions of USD Unless otherwise stated Total Volume (x 1 min) 23,526,0 8,291,0 19,744,5 20.336,8 20.946,9 21,575,3 % growth Year on Year -16% 3% 3% 3% Total net revenue 1,323,6 414.7 9B7,2 966,0 945,2 924,9 %growth Year on Year -25% -2% -2% -2% Cost of services and goods (1.187,4) (363,8) 186B,B) (840,4) (817,6) (800,0) Gross Margin 136,2 50,9 118,5 125.6 127,6 124,9 % Grass Margin 12,3% 12,0% 13,0% 13,5% 13,5% other operating expenses (95,1 ) (35,9) (90,0) (90,0) (90,0) (90,0) Oiher income/expenses Total operating expenses (1.282,5) (399,7) 1958,8) (930,4) (907,6) (890,0) % growth Year on Year EBITDA 41,1 15,0 28,5 35,6 37,6 34,9 EBITDA Margin (%) 3,6% 2,9% 3,7% 4,0% 3,8% AV Revenues per minute 0,0563 0,0500 0,0500 0,0475 0,0451 0,0429 AV Margin per minute 0,0058 0,0061 0,0060 0,0062 0,0061 0,0058 10,3% 12,3% 12,0% 13,0% 13,5% 13,5% 4 Highly Confidential KPN00042183
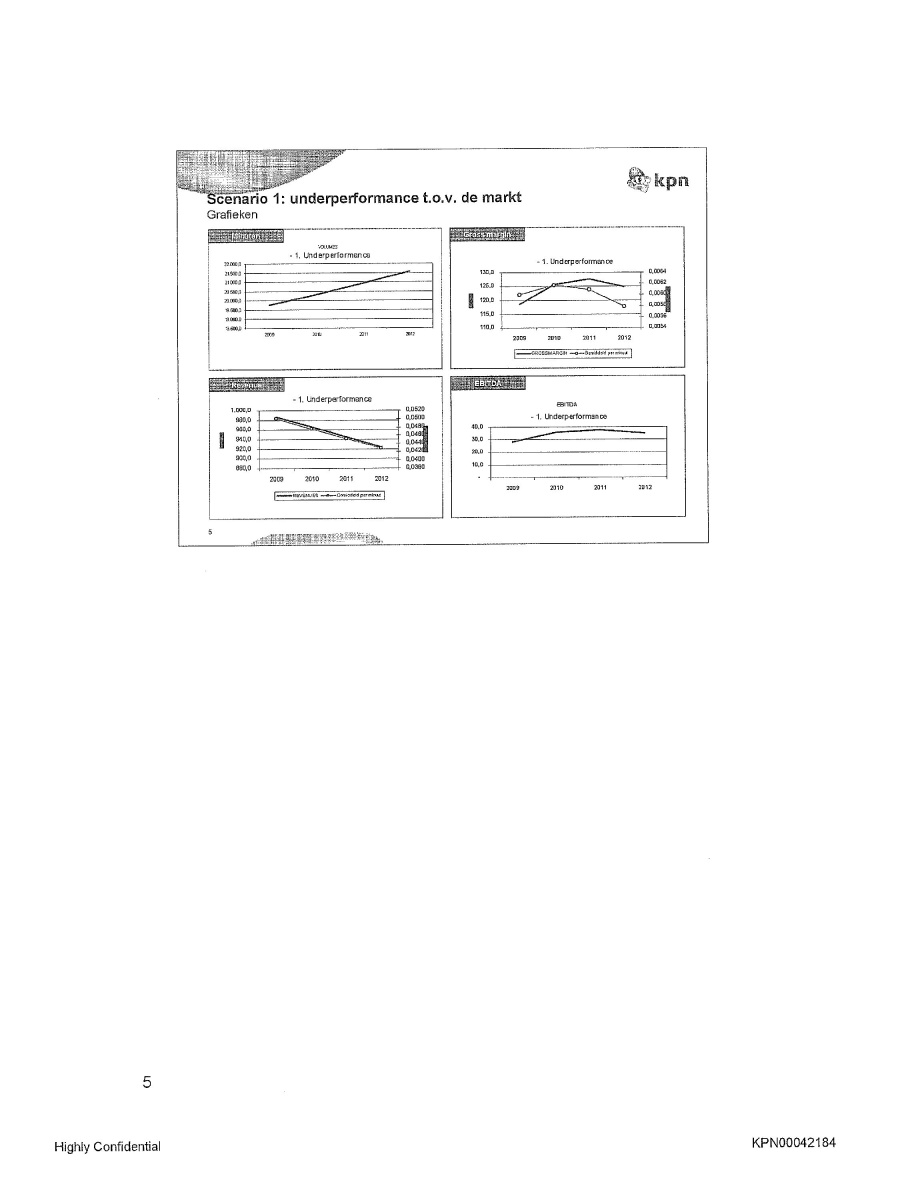
Scenario 1: underperformance t.o.v. de markt Grafieken Minutes - 1. Underperformance Gross margin - 1. Underperformance Revenue - 1. Underperformance EBITDA - 1. Underperformance 5 Highly Confidential KPN00042184
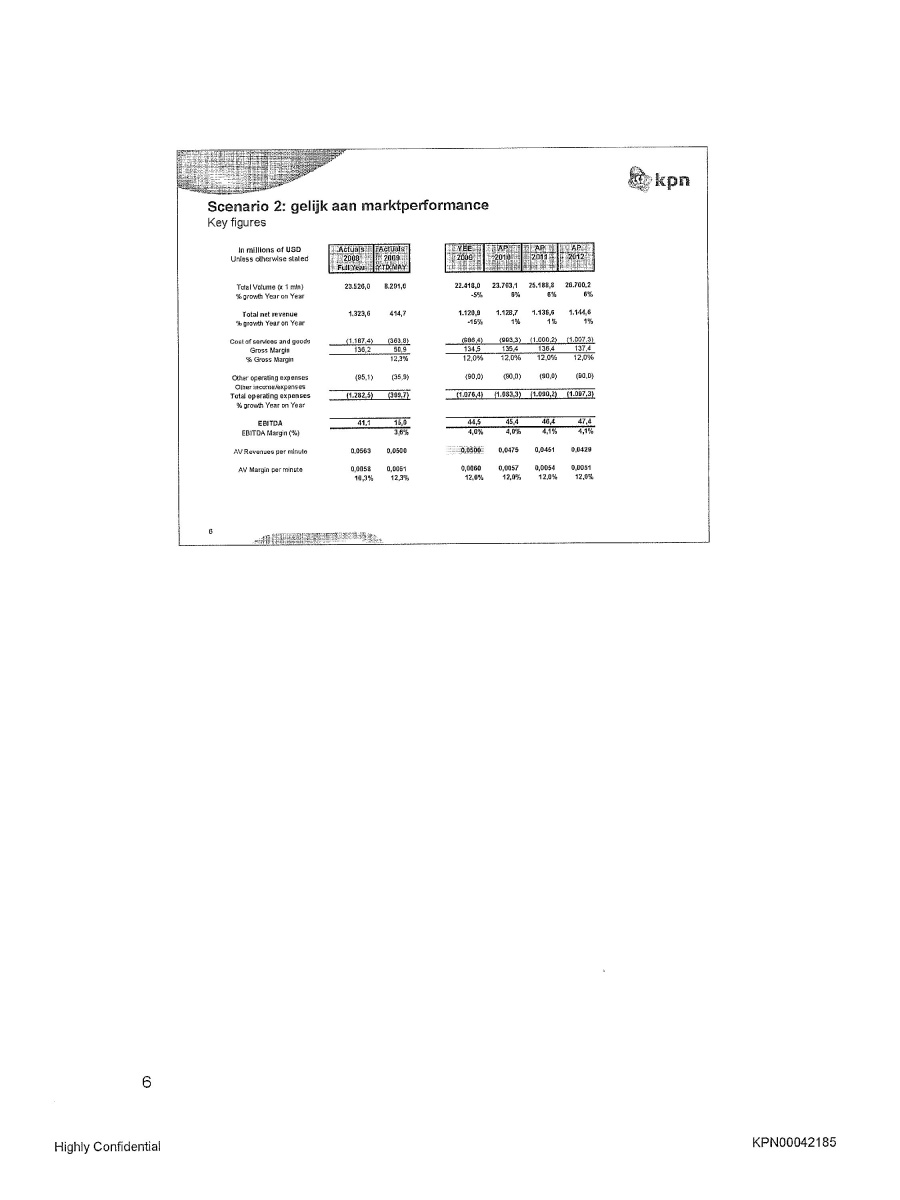
Scenario 2: gelijk aan marktperformance Key figures In millions of USD Unless olherwise stated Total Volume (x 1 min) 23.526,0 8.291,0 22.418,0 23.763,1 25.188,8 26.700,2 % growth Year on Year -5% 8% 8% 8% Total net revenue 1.323,6 414,7 1.120,9 1.128,7 1.136,6 1.144,6 % growth Year on Year -15% 1% 1% 1% Cost of services and goods (1.187,4) (363,8) (986,4) (993,3) (1.000,2) (1.007,3) Gross Margin 136,2 50,9 134,5 135,4 136,4 137,4 % Gross Margin 12,3% 12,0% 12,0% 12,0% 12,0% Other operating expenses (95,1) (35,9) (90,0) (90,0) (90,0) (90,0) Other income/expenses Total operating expenses (1.282,5) (399,7) (1.076,4) (1.083,3) (1.090,2) (1.097,3) % growth Year on Year EBITDA 41,1 15,0 44,5 45,4 46,4 47,4 EBITDA Margin (%) 3,6% 4,0% 4,0% 4,1% 4,1% AV Revenues per minute 0,0563 0,0500 0,500 0,0475 0,0451 0,0429 AV Margin per minute 0,0058 0,0061 0,0060 0,0057 0,0054 0,0051 10,3% 12,3% 12,0% 12,0% 12,0% 12,0% 6 Highly Confidential KPN00042185
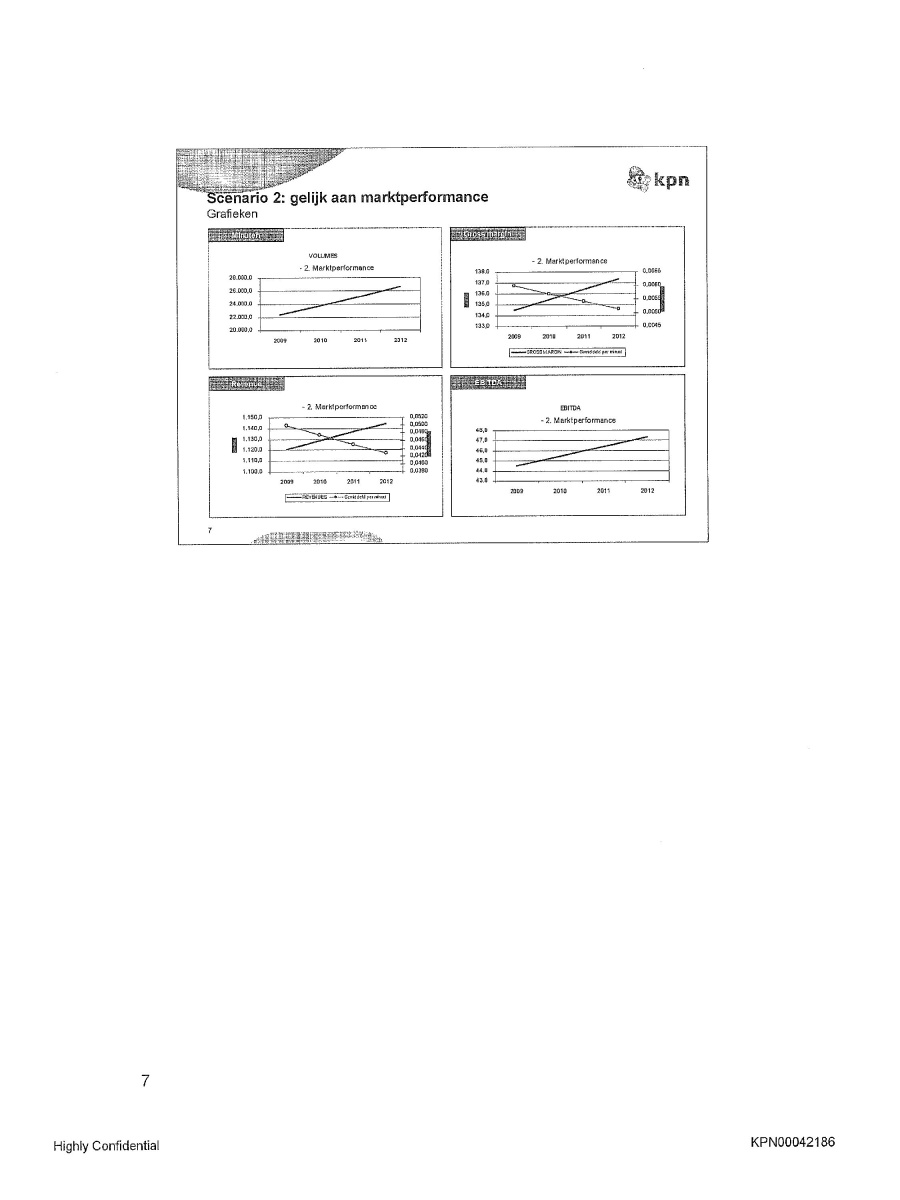
Scenario 2: gelijk aan marktperformance Grafieken Minuten VOLUMES - 2. Marktperformance Gross Margin - 2. Marktperformance Revenue - 2. Marktperformance EBITDA - 2. Marktperformance 7 KPN00042186
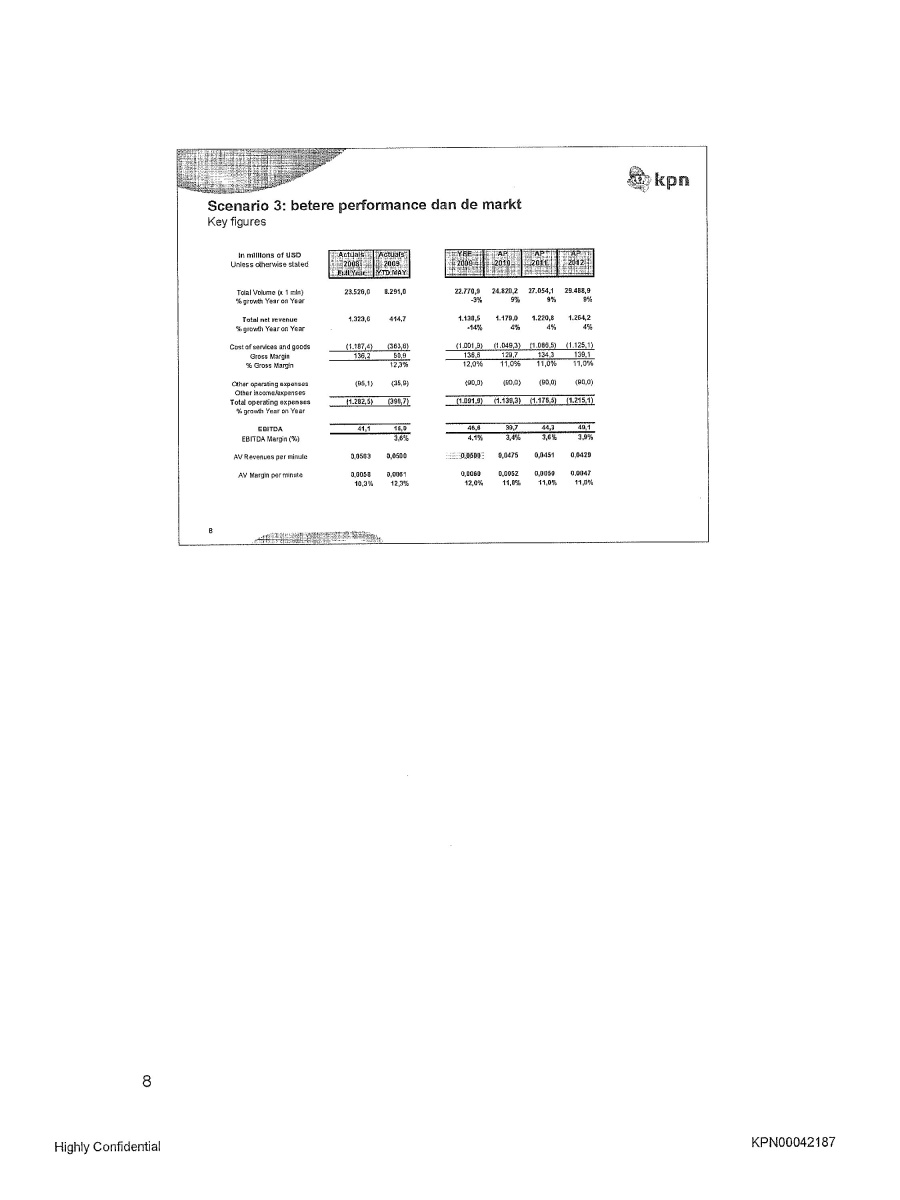
Scenario 3: betere performance dan de markt Key figures In millions of USD Unless otherwise stated Tolal Volume (x 1 min) 23.526,0 8.291,0 22.770,9 24.820,2 27.054,1 29.488,9 % growth Year on Year ·3% 9% 9% 9% Total net revenue 1.323,6 414,7 1.138,5 1.179,0 1.220,8 1.264,2 % growth Year on Year ·14% 4% 4% 4% Cost of services and goods (1.187,4) (363,8) (1.001,9) (1.049,3) (1.086,5) (1.125,1) Gross Margin 136,2 50,9 136,6 129,7 134.3 139,1 % Gross Margin 12,3% 12,0% 11,0% 11,0% 11,0% Clther operating expenses (95,1) (35,9) (90,0) (90,0) (90,0) (90,0) Other Income/expenses Total operating expenses (1.282,5) (399,7) (1.091,9) (1.139,3) (1.176,5) (1.215,1) % growth Year on Year EBITDA 41,1 15,0 46,6 39,7 44,3 49,1 EBITDA Margin (%) 3,6% 4,1% 3,4% 3,6% 3,9% AV Revenues per minute 0,0563 0,0500 0;0500 0,0475 0,0451 0,0429 AV Margin per minute 0,0058 0,0061 0,0060 0,0052 0,0050 0,0047 10,3% 12,3% 12,0% 11,0% 11,0% 11,0% 8 Highly Confidential KPN00042187

Scenario 3: betere performance dan de markt Grafieken Minuten VOLUMES - 3. Outperformance Gross Margin - 3. Outperformance Revenue - 3. Outperformance EBITDA - 3. Outperformance 9 KPN00042188
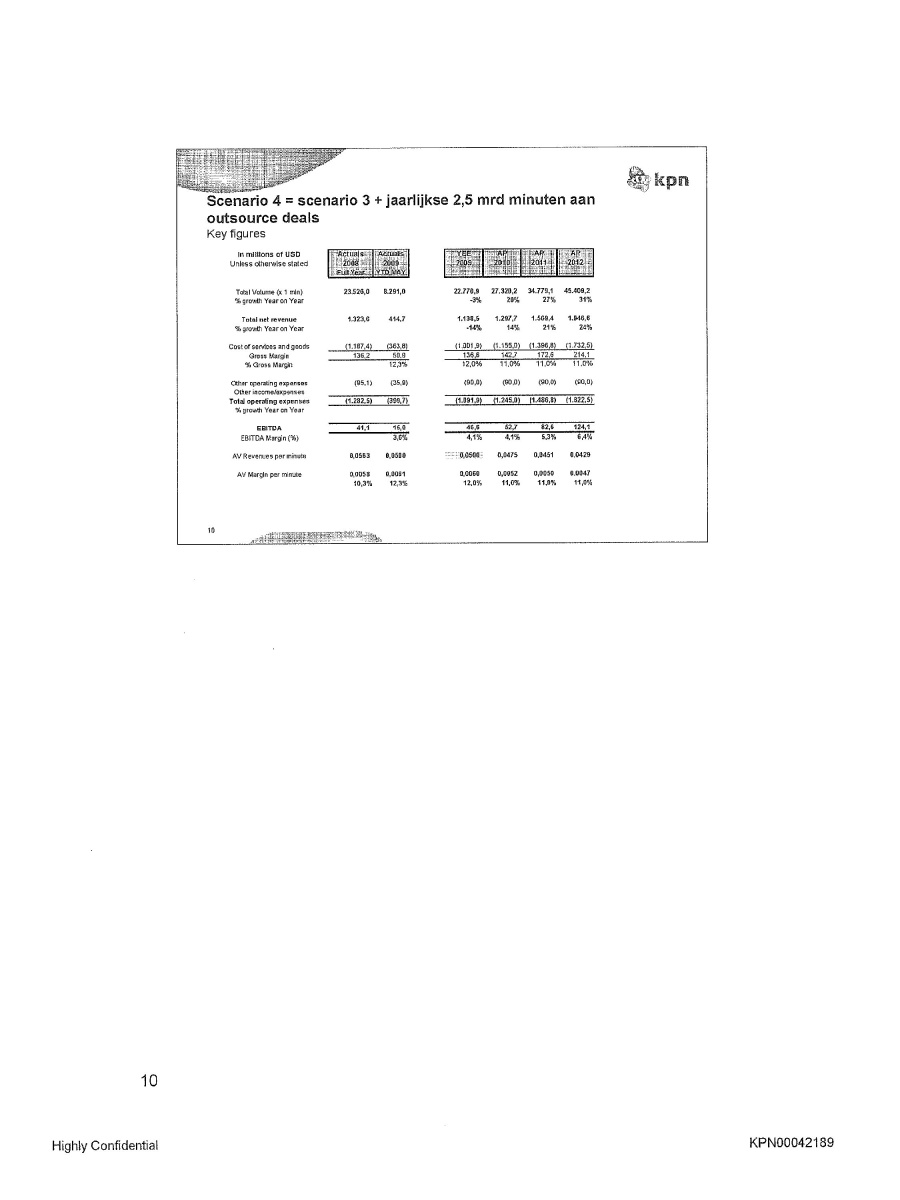
Scenario 4 = scenario 3 + jaarlijkse 2,5 mrd minuten aan outsource deals Key figures In millions of USD Unless otherwise stated Total Volume (x 1 min) 23.526,0 8.291,0 22.770,9 27.320,2 34.779,1 45.409,2 % growth Year on Year ·3% 20% 27% 31% Total net revenue 1.323,6 414,7 1.138,5 1.297,7 1.569,4 1.946,6 % growth Year on Year ·14% 14% 21% 24% Cost of services and goods (1.187,4) (363,8) (1.001,9) (1.155,0) (1.396,8) (1.732,5) Gross Margin 136,2 50,9 136,6 142,7 172,6 214,1 % Gross Margin 12,3% 12,0% 11,0% 11,0% 11,0% Other operating expenses (95,1) (35,9) (90,0) (90,0) (90,0) (90,0) Other income/expenses Total operating expenses (1.282,5) (399,7) (1.091,9) (1.245,0) (1.486,8) (1.B22,5) % growth Year on Year EBITDA 41,1 15,0 46,6 52,7 82,6 124,1 EBITDA Margin (%) 3,6% 4,1% 4,1% 5,3% 6,4% AV Revenues perminute 0,0563 0,0500 0;0500 0,0475 0,0451 0,0429 AV Margin per minute 0,0058 0,0061 0,0060 0,0052 0,0050 0,0047 10,3% 12,3% 12,0% 11,0% 11,0% 11,0% 10 10 Highly Confidential KPN00042189
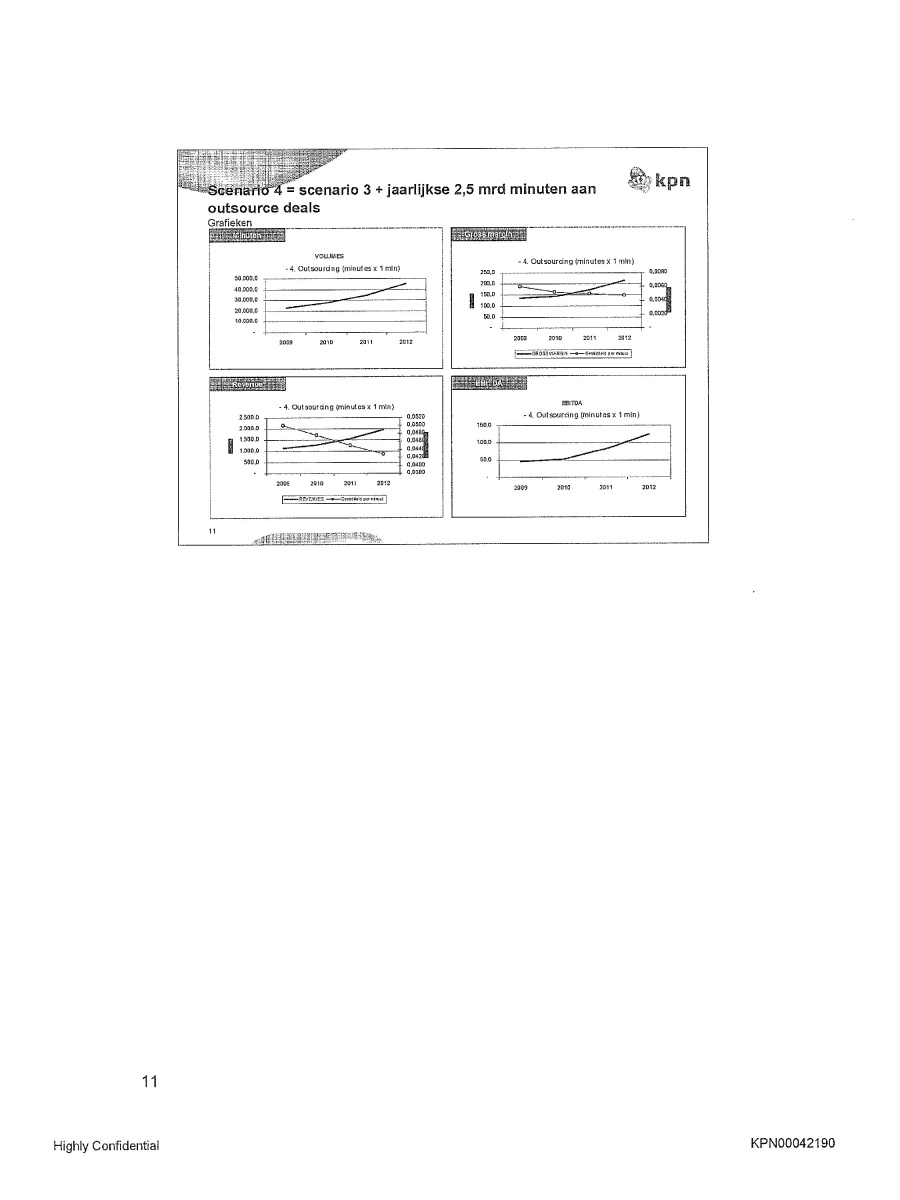
Scenario 4 = Scenario 3 + jaarlijkse 2,5 mrd minuten aan outsource deals Grafieken Minuten VOLUMES - 4. Outsourcing (minutes x 1 min) Gross Margin - 4. Outsourcing (minutes x 1 min) Revenue - 4. Outsourcing (minutes x 1 min) EBITDA - 4. Outsourcing (minutes x 1 min) 11 Highly Confidential KPN00042190
