In respect of the 2003 grant, if the performance condition is not met after the three-year measurement period, the performance will be measured again over the four financial years following the date of grant of the options. If the performance condition is not met at the end of four years, the option will lapse.
The options granted to the Executive Directors in 2004 were subject to the same performance condition as set in 2003, but to the extent that the performance conditions have not been met at the end of the three-year performance period, the option will lapse with no retesting being permitted.
At the average exchange rate for the year, the above gain made by Dr Garnier amounted to £3,618,060. An EOI benefit of $335,730 (£183,459) was paid to Dr Garnier on exercise of these options, this benefit has been included in the table on page 50. On 14th February 2005, Dr Garnier exercised 79,054 options with an exercise price of $22.07 giving rise to a gain of $2,029,561. Dr Garnier also received $174,472 in respect of the Exchange Offer Incentive benefit arising on the exercise of these options.
Mr Coombe did not exercise any share options during 2004 or 2003. Dr Yamada did not exercise any options during 2004.
The highest and lowest closing prices during the year ended 31st December 2004 for GlaxoSmithKline shares were £12.99 and £10.42, respectively. The highest and lowest prices for GlaxoSmithKline ADSs during the year ended 31st December 2004 were $47.50 and $39.04, respectively. The market price for a GlaxoSmithKline share on 31st December 2004 was £12.22 (31st December 2003 – £12.80) and for a GlaxoSmithKline ADS was $47.39 (31st December 2003 – $46.62). The prices on 25th February 2005 were £12.62 per GlaxoSmithKline share and $48.64 per GlaxoSmithKline ADS.
The value of awards deferred by Dr Garnier at vesting was $1,496,608.
Back to Contents
| 56 | GlaxoSmithKline Remuneration Report |
At the average exchange rate for the year, the above gains by Dr Garnier and Dr Yamada amounted to £12,045 and £236,612, respectively. Mr Coombe was excluded from the grant of awards made on 2nd December 2004 as he retires from the company within 12 months of the date of the grant.
The Performance Share Plan (PSP) is a medium-term incentive scheme introduced during 2001. The PSP replaces the Long-Term Incentive Plan and the Mid-Term Incentive Plan operated respectively by Glaxo Wellcome and SmithKline Beecham.
Under the terms of the PSP the number of shares actually vesting is determined following the end of the relevant three-year measurement period and is dependent on GlaxoSmithKline’s performance during that period as described on page 46. The share awards are granted annually in November or December and the measurement period commences on the following 1st January, ending after three years on 31st December. The three-year measurement period for the awards with a performance period commencing 1st January 2002, ended on 31st December 2004. Based on the performance of GlaxoSmithKline during that period, 50 per cent of the award vested in February 2005. Beginning with the award with a performance period beginning on 1st January 2004, dividends are reinvested on the PSPs awarded to members of the CET. Under the terms of the PSP, US participants may defer receipt of all or part of their vested awards.
Dr Garnier elected to defer receipt of 34,492 of his awards that vested in 2004 until retirement.
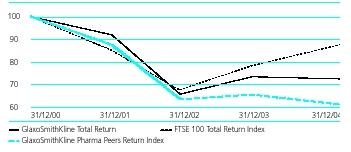
Prior to the performance period beginning 1st January 2004, awards were in two parts: half can be earned by reference to GlaxoSmithKline’s TSR performance compared to the FTSE 100, of which the company is a constituent, and the other half of the award is deliverable if the company’s business performance EPS growth, excluding currency and exceptional items, is on average at least three percentage points per annum more than the increase in the UK Retail Prices Index over the three-year performance period. For these awards, if GlaxoSmithKline is ranked in the top 20 of the FTSE 100 based on TSR performance, then all of the shares in this part of the award will vest. For the 50th position in the FTSE 100, 40 per cent of the shares will vest. If GlaxoSmithKline is ranked below 50th position, none of the shares, subject to this part of the award, will vest. Between the 20th and 50th positions, vesting will occur on a sliding scale.
The following vesting table applies to the awards with a performance period from 1st January 2004 to 31st December 2006.
| TSR rank with 14 companies & GlaxoSmithKline* | | Percentage of award vesting** | |
|
| 1 | | 100% | |
| 2 | | 100% | |
| 3 | | 90% | |
| 4 | | 80% | |
| 5 | | 70% | |
| 6 | | 60% | |
| 7 | | 50% | |
| Median | | 35% | |
| Below median | | 0% | |
|
| | |
| * | The performance comparator group for these awards comprised 14 other companies and GlaxoSmithKline. Both Aventis and Sanofi-Synthelabo were in the comparator group prior to their merger to form Sanofi-Aventis. For the purposes of calculating TSR over the performance period for the awards granted in December 2003, the starting price of the shares of the two individual companies will be compared to the price of the merged company at the end of the performance period, adjusted by the merger ratio. Dividends will be treated as having been reinvested during the performance period. |
| | |
| ** | TSR is measured on a pro rata basis. Where GlaxoSmithKline’s performance falls between two of the comparators, the level of vesting will be determined by the actual relative level of TSR rather than simple ranking. |
| Mid-Term Incentive Plan – ADSs | Vested and
deferred participations
at 31.12.03 | | Dividends
reinvested
in 2004 | | Vested and
deferred
participations
at 31.12.04 | |
| |
| Dr JP Garnier | 157,424 | | 5,714 | | 163,138 | |
| |
The Mid-Term Incentive Plan (MTIP) was a share award scheme operated by SmithKline Beecham. The plan closed to new entrants upon completion of the merger and no further participations have been granted.
Where a final award of ADSs is made, receipt of the award may be deferred by a Director. Dr Garnier deferred receipt of the full amounts vested in 1999, 2000, 2001, 2002 and 2003. The deferred awards, together with any additional ADSs subsequently received through dividend reinvestment, are not included in the Directors’ interests table on page 53 since they are retained in the MTIP until paid out.
| Stock Appreciation Rights (SARs) – ADSs | At 31.12.03 | | At 31.12.04 | | | Average
grant price | |
|
|
|
|
|
|
| |
| Dr L Shapiro | 1,487 | | 1,487 | | | $50.34 | |
|
|
|
|
|
|
| |
All SARs held by Dr Shapiro have a grant price above the market price of a GlaxoSmithKline ADS at year end.
Dr Shapiro is a member of GlaxoSmithKline’s Scientific Advisory Board (SAB). Dr Shapiro was a member of SmithKline Beecham’s SAB from 1993 until the completion of the merger with Glaxo Wellcome. Along with other members of the SAB, she received annual grants of SmithKline Beecham SARs which, in general, vested three years from the date of grant and will expire 10 years from the date of grant. Grants of SARs to SAB members ceased in 1999.
SARs entitle the holder to a cash sum at a future date based on share price growth between the date of grant and the date of exercise. Full provision is made in the financial statements for accrued gains on SARs from the date of grant. In connection with the merger, all previously granted SARs became immediately exercisable.
Back to Contents
| Remuneration Report GlaxoSmithKline | 57 |
Pensions
The accrued annual pension benefits and transfer values for Executive Directors on retirement are set out below.
The regulations require disclosure of: the accrued benefit at the end of the year; the change in accrued benefit over the year; the transfer value at both the beginning and end of the year, and the change in the transfer value over the year. The Listing Rules require additional disclosure of the change in accrued benefit net of inflation and the transfer value of this change.
| | | Accrued
benefit
at 31.12.03
000 pa | | Accrued
benefit
at 31.12.04
000 pa | | Change in
accrued
benefit
over year
000 pa | | Transfer
value
at 31.12.03
000 | | Transfer
value
at 31.12.04
000 | | Change
over year
in transfer
value*
000 | | Change in
accrued
benefit over
year net
of inflation
000 pa | | Transfer value
of change
in accrued
benefit*
000 | |
| |
| Dr JP Garnier | | $1,012 | | $1,040 | | $28 | | $10,089 | | $11,638 | | $1,549 | | $(8 | ) | $1,549 | |
| Mr J Coombe | | £317 | | £345 | | £28 | | £6,436 | | £7,666 | | £1,230 | | £19 | | £432 | |
| Dr T Yamada | | $155 | | $165 | | $10 | | $1,044 | | $1,264 | | $220 | | $5 | | $220 | |
| |
| * | The change in transfer value is shown net of contributions made by the individual. |
Pensions for the Executive Directors have been disclosed in the currency in which the pension is payable.
Dr Garnier and Dr Yamada are members of the all employee US cash balance pension plan, under which GlaxoSmithKline makes annual contributions calculated as a percentage of the employee’s base salary and bonus. The fund increases at an interest rate set annually in advance based on the 30-year treasury bond rate to provide a cash sum at retirement. This cash sum is used to purchase a pension at retirement based on the annuity rates applicable at that time. Neither has entitlement to a spouse’s pension or to pension increases, other than by reducing their own initial pension.
The normal retirement age under this plan is 65 years of age. Dr Garnier’s pension arrangements have been brought into line with the terms of his service agreement and the assumed retirement age reduced to 60. Similarly Dr Yamada’s assumed retirement age has been reduced to 62.
The transfer value, or cash sum, of Dr Garnier’s plan has increased by $1,548,679 over the year as a result of phased transfers from a previous scheme, the further accumulation of interest and contributions paid by the company.
The transfer value, or cash sum, of Dr Yamada’s plan has increased by $220,097 over the year as a result of the further accumulation of interest and contributions paid by the company.
Dr Garnier and Dr Yamada are also members of the US Retirement Savings Plan, a money purchase scheme open to all US employees. Contributions are invested in a range of funds and the value of the accumulated funds are paid at retirement. During 2004 contributions of £36,160 ($66,173) were paid into this scheme by the company in respect of Dr Garnier, of which £2,240 ($4,100) was invested in GlaxoSmithKline shares in a stock ownership account. In respect of Dr Yamada, contributions of £44,840 ($82,057) were paid into the scheme of which £2,240 ($4,100) was invested in GlaxoSmithKline shares in a stock ownership account. The shares held in this account are included within the Director’s interests tables on page 53.
Mr Coombe’s transfer value has been calculated on the basis of actuarial advice in accordance with Actuarial Guidance Note GN11. The transfer value represents the present value of future payments to be made under the pension plan. Whilst Mr Coombe’s annual accrued benefit has increased by £28,206 (£19,324 excluding the effects of inflation), the transfer value has increased by £1,230,000 over the year.
This increase has arisen primarily as a result of the following factors:
| • | Mr Coombe’s pensionable salary increased by £14,850 in 2004. This has accounted for £7,601 of the increase in his accrued benefit and £169,000 increase in the transfer value of his accrued benefit as at 31st December 2004 |
| | |
| • | Annual increases to transfer values become larger the closer an individual is to retirement. Under the terms of Mr Coombe’s service agreement, he will retire at the age of 60 on 31st March 2005. As Mr Coombe approaches retirement, the transfer value of his pension will further increase to reflect the level of funds required to meet the annual accrued benefit payments |
Mr Coombe has waived his 2004 annual bonus of £650,370 and 2001 special deferred bonus of £383,924. The company will make a contribution to the pension plan in 2005 of £1,034,294 to enhance his pension benefits.
In 2003, a discretionary increase was applied to the UK Pension Plan uplifting the increase from the UK Retail Price Index level of 2.8% to 3% for all plan members. As a result, Sir Richard Sykes received a discretionary increase of £1,265 in his accrued benefit in 2004.
Back to Contents
| 58 | GlaxoSmithKline Remuneration Report |
Directors and Senior Management
For US reporting purposes, it is necessary to provide information on compensation and interests of Directors and Senior Management as a group (‘the group’). For the purposes of this disclosure, the group is defined as the Directors, members of the CET and the Company Secretary. In respect of the financial year 2004, the total compensation paid to members of the group for the periods during which they served in that capacity was £13,113,720, the aggregate increase in accrued pension benefits was £49,681 and the aggregate payment to defined contribution schemes was £306,589. During 2004 members of the group were granted options over 478,650 shares and 1,206,750 ADSs and awarded 216,709 shares, 540,849 ADSs in the Performance Share Plan and 3,160 shares in the Restricted Share Plan. At 25th February 2005, the then-current members of the group (comprising 23 persons) owned 552,787 shares and 476,357 ADSs, constituting less than one per cent of the issued share capital of the company. The group also held, at that date: options to purchase 5,249,150 shares and 7,813,443 ADSs; 715,252 shares and 1,239,292 ADSs awarded under the Performance Share Plan, including those shares and ADSs that are vested and deferred; 4,188 shares and 235,845 ADSs under the legacy SmithKline Beecham Mid-Term Incentive Plan, including those shares and ADSs that are vested and deferred; 1,487 ADSs awarded under the legacy SmithKline Beecham Stock Appreciation Rights and 3,160 shares awarded under the Restricted Share Plan. These holdings were issued under the various executive share option plans described in Note 36 to the Financial statements, ‘Employee share schemes’.
Directors’ interests in contracts
Except as described in Note 32 to the Financial statements, ‘Related party transactions’, during or at the end of the financial year no Director or connected person had any material interest in any contract of significance in relation to the Group’s business with a Group company.
The Directors’ Remuneration Report has been approved by the Board of Directors and signed on its behalf by
Sir Christopher Gent
Chairman
2nd March 2005
Back to Contents
| | Operating and financial review and prospects |
| | |
| | |
| | |
| | The Operating and financial review and prospects discusses the operating and financial performance, the financial outlook and the financial resources of the Group. The results for each year are compared primarily with the results for the preceding year under the following headings: |
| | |
| 60 | Financial trends and ratios |
| | |
| 61 | 2004 Year – results for the year to 31st December 2004 compared to the year to 31st December 2003 |
| | |
| 71 | Financial position and resources – at 31st December 2004 |
| | |
| 76 | Outlook and risk factors |
| |
| | Additionally, in accordance with US requirements: |
| | |
| 79 | 2003 Year – results for the year to 31st December 2003 compared to the year to 31st December 2002 |
| | |
| | Exchange rates
The Group, as a multinational business, operates in many countries and earns revenues and incurs costs in many currencies. Its results as reported in sterling, are affected by movements in exchange rates between sterling and overseas currencies. Average exchange rates prevailing during the period are used to translate the results and cash flows of overseas subsidiary and associated undertakings and joint ventures into sterling. Period end rates are used to translate the net assets of those undertakings. The currencies which most influence these translations are the US dollar, the Euro and the Japanese Yen. In order to illustrate underlying performance, it is the Group’s practice to discuss its results in terms of constant exchange rate (CER) growth. This represents growth calculated as if the exchange rates used to determine the results of overseas companies in sterling had remained unchanged from those used in the previous year. CER% represents growth at constant exchange rates. £% represents growth at actual exchange rates. Business performance
During the years 2000 to 2003, business performance was the primary performance measure used by management and was presented after excluding merger items, integration and restructuring costs and disposals of businesses. Management believes that exclusion of these items provides a better comparison of the way in which the business was managed and gives an indication of the performance of the Group in terms of those elements of revenue and expenditure which local management was able to influence. For 2004, with the completion of these programmes, the Group is reporting results on a statutory basis only. Growth rates are presented comparing 2004 results both with 2003 business performance results and 2003 statutory results. Management considers that the comparison of 2004 statutory results with 2003 business performance results gives the most appropriate indication of the Group’s performance for the period under review and therefore commentaries are presented on this basis unless otherwise stated. This information is provided in addition to the statutory results prepared under UK GAAP which appear on pages 90 and 91 to assist shareholders to gain a clear understanding of the underlying performance of the business and increase comparability for the periods presented. |
Back to Contents
| 60 | GlaxoSmithKline Operating and financial review and prospects |
Financial trends and ratios
| Statutory results | 2004
£m | | | | Growth | | 2003
(restated)
£m | | | | Growth | | 2002
(restated)
£m | |
|
|
|
|
|
|
| CER% | | £% | CER% | | £% |
|
|
|
|
|
|
|
|
|
|
|
|
|
|
| |
| Turnover - | Pharmaceuticals | 17,146 | | 1 | | (6 | ) | 18,181 | | 5 | | 1 | | 17,995 | |
| - | Consumer Healthcare | 3,213 | | 3 | | (1 | ) | 3,260 | | 4 | | 1 | | 3,217 | |
|
|
|
|
|
|
|
|
|
|
|
|
|
| |
| Total | 20,359 | | 1 | | (5 | ) | 21,441 | | 5 | | 1 | | 21,212 | |
|
|
|
|
|
|
|
|
|
|
|
|
|
| |
| Cost of sales | (4,309 | ) | (1 | ) | (5 | ) | (4,544 | ) | – | | (1 | ) | (4,609 | ) |
| Selling, general and administration | (7,061 | ) | (2 | ) | (7 | ) | (7,597 | ) | (2 | ) | (5 | ) | (8,023 | ) |
| Research and development | (2,839 | ) | 7 | | 2 | | (2,791 | ) | (1 | ) | (4 | ) | (2,900 | ) |
|
|
|
|
|
|
|
|
|
|
|
|
|
| |
| Trading profit | 6,150 | | 5 | | (6 | ) | 6,509 | | 21 | | 15 | | 5,680 | |
|
|
|
|
|
|
|
|
|
|
|
|
|
| |
| | | | | | | | | | | | | | | |
| Profit before taxation | 6,119 | | 8 | | (3 | ) | 6,313 | | 20 | | 14 | | 5,524 | |
| Earnings | 4,302 | | 7 | | (4 | ) | 4,478 | | 19 | | 14 | | 3,930 | |
| Basic earnings per share (pence) | 75.0 | p | 8 | | (3 | ) | 77.1 | p | 22 | | 16 | | 66.5 | p |
|
|
|
|
|
|
|
|
|
|
|
|
|
| |
| | | | | | | | | | | | | | | |
| Merger, restructuring and disposal of subsidiaries | | | | | | | | | | | | | |
|
|
|
|
|
|
|
|
|
|
|
|
|
| |
| Cost of sales | – | | | | | | (356 | ) | | | | | (366 | ) |
| Selling, general and administration | – | | | | | | (18 | ) | | | | | (498 | ) |
| Research and development | – | | | | | | (21 | ) | | | | | (168 | ) |
|
|
|
|
|
|
|
|
|
|
|
|
|
| |
| Trading profit | – | | | | | | (395 | ) | | | | | (1,032 | ) |
|
|
|
|
|
|
|
|
|
|
|
|
|
| |
| | | | | | | | | | | | | | | |
| Profit before taxation | – | | | | | | (390 | ) | | | | | (1,011 | ) |
| Earnings | – | | | | | | (281 | ) | | | | | (712 | ) |
|
|
|
|
|
|
|
|
|
|
|
|
|
| |
| | | | | | | | | | | | | | | |
| Business performance results | | | | | | | | | | | | | | |
|
|
|
|
|
|
|
|
|
|
|
|
|
| |
| Turnover | 20,359 | | 1 | | (5 | ) | 21,441 | | 5 | | 1 | | 21,212 | |
| Cost of sales | (4,309 | ) | 7 | | 3 | | (4,188 | ) | – | | (1 | ) | (4,243 | ) |
| Selling, general and administration | (7,061 | ) | (2 | ) | (7 | ) | (7,579 | ) | 4 | | – | | (7,525 | ) |
| Research and development | (2,839 | ) | 8 | | 2 | | (2,770 | ) | 4 | | 1 | | (2,732 | ) |
|
|
|
|
|
|
|
|
|
|
|
|
|
| |
| Trading profit | 6,150 | | (1 | ) | (11 | ) | 6,904 | | 8 | | 3 | | 6,712 | |
|
|
|
|
|
|
|
|
|
|
|
|
|
| |
| | | | | | | | | | | | | | | |
| Profit before taxation | 6,119 | | 2 | | (9 | ) | 6,703 | | 8 | | 3 | | 6,535 | |
| Adjusted earnings | 4,302 | | 1 | | (10 | ) | 4,759 | | 7 | | 5 | | 4,642 | |
| Adjusted earnings per share (pence) | 75.0 | p | 2 | | (9 | ) | 82.0 | p | 10 | | 4 | | 78.5 | p |
|
|
|
|
|
|
|
|
|
|
|
|
|
| |
| | | | | | | | | | | | | | | |
| Research and development – Statutory | | | | | | | | | | | | | | |
|
|
|
|
|
|
|
|
|
|
|
|
|
| |
| Pharmaceuticals | 2,730 | | | | | | 2,704 | | | | | | 2,791 | |
| Consumer Healthcare | 109 | | | | | | 87 | | | | | | 109 | |
|
|
|
|
|
|
|
|
|
|
|
|
|
| |
| Total | 2,839 | | | | | | 2,791 | | | | | | 2,900 | |
|
|
|
|
|
|
|
|
|
|
|
|
|
| |
| | | | | | | | | | | | | | | |
| Interest | | | | | | | | | | | | | | |
|
|
|
|
|
|
|
|
|
|
|
|
|
| |
| Net interest payable | 203 | | | | | | 161 | | | | | | 141 | |
| Interest cover | 31 times | | | | | | 40 times | | | | | | 40 times | |
|
|
|
|
|
|
|
|
|
|
|
|
|
| |
| | | | | | | | | | | | | | | |
| Interest cover is calculated as statutory profit before interest divided by net interest payable. | | | | | | | |
| | | | | | | | | | | | | | | |
| Tax rate | | | | | | | | | | | | | | |
|
|
|
|
|
|
|
|
|
|
|
|
|
| |
| Business performance | 27.8% | | | | | | 27.4% | | | | | | 27.0% | |
| Statutory results | 27.8% | | | | | | 27.4% | | | | | | 26.5% | |
|
|
|
|
|
|
|
|
|
|
|
|
|
| |
| | | | | | | | | | | | | | | |
| Borrowings | | | | | | | | | | | | | | |
|
|
|
|
|
|
|
|
|
|
|
|
|
| |
| Net debt | 1,984 | | | | | | 1,648 | | | | | | 2,335 | |
| Gearing | 32% | | | | | | 28% | | | | | | 50% | |
|
|
|
|
|
|
|
|
|
|
|
|
|
| |
The gearing ratio is calculated as net debt as a percentage of shareholders’ funds, net debt and minority interests.
Back to Contents
| | Operating and financial review and prospects GlaxoSmithKline | 61 |
2004 Year
World economy
Record oil prices the continued threat of terrorism and tightened monetary policies by the major economies were features of the global economy during 2004. Despite this, there was continued strong growth in China and the USA, with signs of economic recovery in the main economies of Europe, albeit slower.
Growth in the USA was 4.4 per cent, although there were wide predictions that 2005 would see expansion kept to less than four per cent. The Federal Reserve Board raised interest rates five times during 2004 to stave off inflationary pressures. There was continued concern over the country’s budget deficit and the effect on the global economy of whatever corrective actions were to be adopted. Nevertheless, the USA remained the main driver for global growth, with strong support from Asia, despite the adverse impact of higher oil prices.
Japan’s economy declined 0.5 per cent, however a recovery in the economy is anticipated in mid-2005. Although in China, official measures to moderate the pace of the country’s economic expansion were taken, growth of over nine per cent was achieved. Emerging economies elsewhere in Asia were hit by oil price rises, although reasonable growth continued in countries such as Taiwan, Thailand and Singapore.
In the EU, GDP grew 2.3 per cent where growth in the larger economies varied from 2.8 per cent in the UK to 1.5 per cent in Germany. Interest rates were unchanged by the European Central Bank and while oil prices were expected to have an adverse impact on the main European economies in 2005, continued modest growth was predicted.
In the UK, increases in Government and consumer spending fuelled initial expansion that was dampened later by concerns about interest rates and house prices. Nevertheless the final growth rate met Government forecasts. The Bank of England raised interest rates four times during the year, but held them at 4.75 per cent as signs emerged of the slowing in the economy and as concerns about inflation receded.
Following the substantive recovery of the global equity markets in 2003, share price indices in 2004 showed subdued advances despite positive economic and corporate news through the year.
Exchange
The currencies that most influence the Group’s results are the US dollar, the Euro and the Japanese Yen.
The pound hit its highest level against the dollar for more than four years, climbing to $1.92 at the year-end, and the Euro gained one per cent against sterling and eight per cent against the dollar in 2004. This was the second consecutive year that the dollar has fallen in value against the Euro, due to the impact of continued unrest in Iraq, tension elsewhere in the world and concerns for the US economy.
World market – pharmaceuticals
Global pharmaceutical sales increased by nine per cent in 2004 to £284 billion.
World market by geographic region | Value
£ bn | | % of
total | | Growth | |
| |
| CER% | | £% | |
|
|
|
|
|
|
|
| |
| USA | 124.7 | | 44 | | 10 | | (2 | ) |
| Europe | 82.3 | | 29 | | 8 | | 8 | |
| Germany | 15.5 | | 5 | | 6 | | 6 | |
| France | 15.0 | | 5 | | 8 | | 8 | |
| UK | 10.5 | | 4 | | 10 | | 10 | |
| Italy | 9.7 | | 3 | | 6 | | 6 | |
| Japan | 30.9 | | 11 | | 3 | | 1 | |
| Asia Pacific | 19.3 | | 7 | | 13 | | 6 | |
| Latin America | 12.1 | | 4 | | 16 | | 2 | |
| Middle East, Africa | 8.6 | | 3 | | 13 | | 5 | |
| Canada | 6.0 | | 2 | | 10 | | 8 | |
|
|
|
|
|
|
|
| |
| Total | 283.9 | | 100 | | 9 | | 2 | |
|
|
|
|
|
|
|
| |
Growth in the US market has slowed but remains in double digits and now represents 44 per cent of the global prescription pharmaceutical market compared to 30 per cent a decade ago.
At 30th September 2004, GlaxoSmithKline held second position in the world pharmaceutical market with a market share of 6.5 per cent, behind Pfizer with a market share of 10.1 per cent. GlaxoSmithKline had eight products in the world’s top 60 pharmaceutical products; these are Augmentin, Avandia, Imigran/Imitrex, Lamictal, Seretide/Advair, Seroxat/Paxil, Wellbutrin and Zofran.
World market –
top five therapeutic classes | Value
£ bn | | % of
total | | CER% | | Growth | |
|
| £% |
|
|
|
|
|
|
|
| |
| Cardiovascular | 48.3 | | 17 | | 9 | | 3 | |
| Central nervous system | 47.1 | | 17 | | 11 | | 4 | |
| Alimentary tract and metabolic Anti-infectives | 35.1 | | 12 | | 6 | | (1 | ) |
| (bacterial, viral and fungal) excluding vaccines | 30.6 | | 11 | | 6 | | (1 | ) |
| Respiratory | 19.5 | | 7 | | 5 | | (1 | ) |
|
|
|
|
|
|
|
| |
| (Note: data based on 12 months to 30th September 2004.) | |
Pharmaceutical turnover
All growth rates included in the review of turnover are at constant exchange rates (CER) unless otherwise stated. The sterling growth rates may be found in the tables of pharmaceutical turnover by therapeutic area on page 63 and by geographic region on page 64.
Total pharmaceutical turnover in 2004 was £17,146 million compared with £18,181 million in 2003, an increase of one per cent CER. In sterling terms turnover declined six per cent principally due to the weakness of the US dollar.
Within the Group’s portfolio, turnover of new products first launched in a major market within the last five years accounted for 30 per cent of total turnover and grew by 21 per cent to £5,130 million. Turnover of the more established, franchise products amounted to £8,767 million representing 51 per cent of total turnover and declined five per cent compared to last year. Turnover of older products, now less actively promoted, was £3,249 million, a decline of seven per cent, representing 19 per cent of total turnover.
Back to Contents
| 62 | GlaxoSmithKline Operating and financial review and prospects | |
2004 Year continued
Global pharmaceutical turnover in the fourth quarter of 2004 increased three per cent, reflecting a US turnover increase of four per cent to £2,114 million; whereas in Europe turnover grew two per cent to £1,397 million, and in International turnover grew five per cent to £976 million. Turnover in the USA was impacted by generic competition for Wellbutrin and Paxil. Excluding sales of these products, turnover grew 10 per cent in the USA.
Pharmaceutical turnover by therapeutic area
GlaxoSmithKline’s ability to continue to deliver pharmaceutical turnover growth, despite generic competition to several of its products, is primarily due to an exceptionally broad product portfolio of fast-growing, high-value products.
These include the respiratory product Seretide/Advair, up 19 per cent (£2.5 billion), the diabetes treatment Avandia/Avandamet, up 32 per cent (£1.1 billion), Lamictal for epilepsy/bipolar disorder, up 32 per cent (£0.7 billion), Valtrex for herpes (£0.6 billion), up 24 per cent, Coreg for heart disease, up 34 per cent (£0.4 billion) and vaccines, up 11 per cent (£1.2 billion).
In all, 12 GlaxoSmithKline products each had sales of over £500 million in 2004.
Respiratory
GlaxoSmithKline continues to be the global leader in respiratory pharmaceuticals with sales of its three key products, Seretide/Advair, Flixotide/Flovent and Serevent, amounting to £3.4 billion, up nine per cent. Sales of Seretide/Advair, the Group’s largest product grew 19 per cent to £2.5 billion although this contributed to declines in Serevent and Flixotide, its constituent products.
In the USA, Advair sales grew 20 per cent to £1.3 billion. Growth of Seretide in Europe was also strong (up 18 per cent to £902 million), although reported growth in the fourth quarter was adversely impacted by a one-off rebate adjustment in Germany and wholesaler de-stocking in Italy. International sales grew 15 per cent, reflecting good growth in all geographic areas.
The older respiratory products Ventolin and Becotide continued to decline as patients converted to newer products.
Central nervous system (CNS)
CNS sales declined 16 per cent to £3.5 billion. Sales declined in all regions.
Total sales of the Paxil franchise were down 39 per cent to £1.1 billion as a result of generic competition to Paxil IR, sales of which declined 53 per cent to £667 million. Mitigating this decline was the strong performance of the product in Japan, up 25 per cent to £171 million and the performance of Paxil CR which generated sales of £396 million, up 14 per cent.
Total sales of Wellbutrin products fell 12 per cent to £751 million. Wellbutrin IR and SR sales fell 64 per cent to £284 million as a result of generic competition. This impact was partially offset, however, by the exceptionally strong performance of Wellbutrin XL, the new once-daily product, which achieved sales of £467 million in its first full year on the market.
The strong growth of GlaxoSmithKline’s epilepsy and bi-polar disorder treatment Lamictal continues, with sales up 32 per cent to £678 million. Ongoing US growth, up 49 per cent to £414 million, is being driven by the indication for the maintenance treatment of bi-polar disorder received last year.
Anti-virals
Global HIV product sales rose four per cent to £1.5 billion and sales in the USA increased four per cent to £747 million. GlaxoSmithKline continues to grow its HIV franchise, despite the launch of several new products by competitors.
HIV performance was enhanced by the launch of Epzicom, a new combination product (Epivir/Ziagen) in the USA in August 2004 and in the EU (under the name Kivexa) in January 2005.
Sales of the herpes treatment Valtrex exceeded £500 million for the first time in 2004 (up 24 per cent to £571 million). Performance is being driven by the USA (up 30 per cent to £369 million) where the product is the clear market leader in treatments for genital herpes.
Anti-bacterials
Anti-bacterial sales declined nine per cent worldwide and 24 per cent in the USA reflecting generic competition in all regions.
Metabolic
The diabetes treatments Avandia/Avandamet continue to perform very strongly, with overall sales of £1.1 billion (up 32 per cent).
Sales in the USA grew 26 per cent to £852 million. Encouragingly, Avandia/Avandamet are also growing very strongly in Europe and International markets with sales up 49 per cent and 62 per cent, respectively. Strong performance in these markets is driven by the growing acceptance amongst opinion leaders and physicians of the benefits of these new products in improving control for diabetic patients.
Vaccines
The vaccines business had a strong year, with sales up 11 per cent to £1.2 billion. Several key products are driving growth – Pediarix/Infanrix up 12 per cent to £357 million, Priorix up 14 per cent to £95 million and Fluarix up 38 per cent to £79 million.
Oncology and emesis
Sales of Zofran grew eight per cent to £763 million, driven by the US performance, up 10 per cent to £565 million.
Cardiovascular and urogenital
In 2004, Coreg (for heart disease) sales grew 34 per cent to £432 million.
Other therapeutic areas
Sales of Zantac fell 12 per cent to £273 million with declines in all regions.
Back to Contents
| | Operating and financial review and prospects GlaxoSmithKline | 63 |
Pharmaceutical turnover by therapeutic area 2004
| | | | | | | | | | | | Total | | | | | | USA | | | | | | Europe | | | | International | |
|
|
|
|
|
|
|
|
|
|
|
|
|
|
|
|
|
|
|
|
|
|
|
|
|
|
|
| |
| Therapeutic area/ | % of | | | | 2004 | | 2003 | | Growth | | 2004 | | Growth | | 2004 | | Growth | | 2004 | | Growth | |
| | | | | | | | | |
| | | |
| | | |
| | | |
| |
| major products | total | | | £m | | £m | | CER% | | £% | | £m | | CER% | | £% | | £m | | CER% | | £% | | £m | | CER% | | £% | |
|
|
|
|
|
|
|
|
|
|
|
|
|
|
|
|
|
|
|
|
|
|
|
|
|
|
|
|
|
| |
| Respiratory | 26 | |  | | 4,415 | | 4,417 | | 7 | | – | | 2,183 | | 9 | | (3 | ) | 1,538 | | 5 | | 4 | | 694 | | 4 | | – | |
| Serevent, Seretide/Advair | | | | | | | | | | | | | | | | | | | | | | | | | | | | | |
| Flixotide/Flovent | | | | 3,428 | | 3,352 | | 9 | | 2 | | 1,710 | | 9 | | (2 | ) | 1,253 | | 8 | | 7 | | 465 | | 11 | | 8 | |
| Seretide/Advair | | | | 2,461 | | 2,214 | | 19 | | 11 | | 1,330 | | 20 | | 8 | | 902 | | 18 | | 17 | | 229 | | 15 | | 11 | |
| Flixotide/Flovent | | | | 618 | | 705 | | (7 | ) | (12 | ) | 251 | | (12 | ) | (21 | ) | 189 | | (7 | ) | (9 | ) | 178 | | 2 | | – | |
| Serevent | | | | 349 | | 433 | | (15 | ) | (19 | ) | 129 | | (26 | ) | (34 | ) | 162 | | (13 | ) | (14 | ) | 58 | | 24 | | 21 | |
| Flixonase/Flonase | | | | 578 | | 594 | | 7 | | (3 | ) | 450 | | 9 | | (2 | ) | 59 | | 7 | | 5 | | 69 | | (5 | ) | (10 | ) |
|
|
|
|
|
|
|
|
|
|
|
|
|
|
|
|
|
|
|
|
|
|
|
|
|
|
|
|
|
| |
| CNS | 20 | |  | | 3,463 | | 4,455 | | (16 | ) | (22 | ) | 2,271 | | (19 | ) | (27 | ) | 748 | | (11 | ) | (12 | ) | 444 | | (7 | ) | (10 | ) |
| Depression | | | | 1,814 | | 2,830 | | (30 | ) | (36 | ) | 1,254 | | (34 | ) | (40 | ) | 252 | | (31 | ) | (32 | ) | 308 | | (10 | ) | (13 | ) |
| Seroxat/Paxil | | | | 1,063 | | 1,877 | | (39 | ) | (43 | ) | 519 | | (51 | ) | (56 | ) | 251 | | (31 | ) | (32 | ) | 293 | | (8 | ) | (11 | ) |
| Paxil IR | | | | 667 | | 1,490 | | (53 | ) | (55 | ) | 131 | | (82 | ) | (84 | ) | 251 | | (31 | ) | (32 | ) | 285 | | (10 | ) | (13 | ) |
| Paxil CR | | | | 396 | | 387 | | 14 | | 2 | | 388 | | 13 | | 1 | | – | | – | | – | | 8 | | >100 | | >100 | |
| Wellbutrin | | | | 751 | | 953 | | (12 | ) | (21 | ) | 735 | | (12 | ) | (21 | ) | 1 | | >100 | | >100 | | 15 | | (37 | ) | (40 | ) |
| Wellbutrin IR, SR | | | | 284 | | 883 | | (64 | ) | (68 | ) | 270 | | (65 | ) | (69 | ) | 1 | | >100 | | >100 | | 13 | | (44 | ) | (48 | ) |
| Wellbutrin XL | | | | 467 | | 70 | | >100 | | >100 | | 465 | | >100 | | >100 | | – | | – | | – | | 2 | | >100 | | – | |
| Migraine | | | | 760 | | 849 | | (3 | ) | (10 | ) | 527 | | (3 | ) | (13 | ) | 176 | | – | | (2 | ) | 57 | | (4 | ) | (7 | ) |
| Imigran/Imitrex | | | | 682 | | 760 | | (2 | ) | (10 | ) | 492 | | (2 | ) | (12 | ) | 142 | | (2 | ) | (3 | ) | 48 | | (6 | ) | (9 | ) |
| Lamictal | | | | 678 | | 556 | | 32 | | 22 | | 414 | | 49 | | 33 | | 219 | | 10 | | 8 | | 45 | | 12 | | 5 | |
| Requip | | | | 116 | | 99 | | 25 | | 17 | | 53 | | 26 | | 13 | | 56 | | 22 | | 19 | | 7 | | 35 | | 40 | |
|
|
|
|
|
|
|
|
|
|
|
|
|
|
|
|
|
|
|
|
|
|
|
|
|
|
|
|
|
| |
| Anti-virals | 14 | |  | | 2,360 | | 2,349 | | 8 | | – | | 1,165 | | 12 | | 1 | | 725 | | 1 | | – | | 470 | | 7 | | 1 | |
| HIV | | | | 1,463 | | 1,508 | | 4 | | (3 | ) | 747 | | 4 | | (6 | ) | 559 | | 2 | | 1 | | 157 | | 8 | | 1 | |
| Combivir | | | | 571 | | 589 | | 4 | | (3 | ) | 280 | | 4 | | (7 | ) | 226 | | 5 | | 4 | | 65 | | (1 | ) | (7 | ) |
| Trizivir | | | | 322 | | 376 | | (8 | ) | (14 | ) | 177 | | (10 | ) | (19 | ) | 130 | | (8 | ) | (9 | ) | 15 | | 13 | | 7 | |
| Epivir | | | | 294 | | 293 | | 7 | | – | | 139 | | 4 | | (6 | ) | 115 | | 10 | | 7 | | 40 | | 14 | | 5 | |
| Ziagen | | | | 155 | | 167 | | – | | (7 | ) | 73 | | (5 | ) | (15 | ) | 60 | | (1 | ) | (2 | ) | 22 | | 25 | | 10 | |
| Retrovir | | | | 43 | | 45 | | 2 | | (4 | ) | 17 | | – | | (11 | ) | 16 | | 4 | | – | | 10 | | 3 | | – | |
| Agenerase, Lexiva | | | | 63 | | 38 | | 80 | | 66 | | 46 | | >100 | | 84 | | 12 | | 21 | | 20 | | 5 | | 29 | | 67 | |
| Herpes | | | | 718 | | 669 | | 15 | | 7 | | 380 | | 31 | | 17 | | 138 | | (5 | ) | (7 | ) | 200 | | 6 | | 2 | |
| Valtrex | | | | 571 | | 499 | | 24 | | 14 | | 369 | | 30 | | 17 | | 90 | | 6 | | 5 | | 112 | | 19 | | 15 | |
| Zovirax | | | | 147 | | 170 | | (10 | ) | (14 | ) | 11 | | 38 | | 22 | | 48 | | (21 | ) | (23 | ) | 88 | | (8 | ) | (11 | ) |
| Zeffix | | | | 130 | | 129 | | 7 | | 1 | | 11 | | 18 | | 10 | | 22 | | 27 | | 29 | | 97 | | 3 | | (5 | ) |
|
|
|
|
|
|
|
|
|
|
|
|
|
|
|
|
|
|
|
|
|
|
|
|
|
|
|
|
|
| |
| Anti-bacterials | 9 | |  | | 1,561 | | 1,815 | | (9 | ) | (14 | ) | 356 | | (24 | ) | (32 | ) | 701 | | (6 | ) | (7 | ) | 504 | | 1 | | (6 | ) |
| Augmentin | | | | 708 | | 825 | | (9 | ) | (14 | ) | 223 | | (21 | ) | (29 | ) | 298 | | (9 | ) | (10 | ) | 187 | | 9 | | 3 | |
| Augmentin IR | | | | 533 | | 584 | | (5 | ) | (9 | ) | 59 | | (15 | ) | (20 | ) | 293 | | (10 | ) | (11 | ) | 181 | | 8 | | 1 | |
| Augmentin ES | | | | 74 | | 135 | | (39 | ) | (45 | ) | 69 | | (42 | ) | (48 | ) | – | | – | | – | | 5 | | >100 | | >100 | |
| Augmentin XR | | | | 101 | | 106 | | 6 | | (5 | ) | 95 | | 1 | | (10 | ) | 5 | | >100 | | >100 | | 1 | | >100 | | – | |
| Zinnat/Ceftin | | | | 218 | | 246 | | (7 | ) | (11 | ) | 9 | | (52 | ) | (59 | ) | 133 | | – | | (1 | ) | 76 | | (8 | ) | (16 | ) |
|
|
|
|
|
|
|
|
|
|
|
|
|
|
|
|
|
|
|
|
|
|
|
|
|
|
|
|
|
| |
| Metabolic | 8 | |  | | 1,253 | | 1,079 | | 27 | | 16 | | 852 | | 26 | | 13 | | 135 | | 19 | | 16 | | 266 | | 35 | | 28 | |
| Avandia/Avandamet | | | | 1,116 | | 931 | | 32 | | 20 | | 852 | | 26 | | 13 | | 103 | | 49 | | 47 | | 161 | | 62 | | 52 | |
|
|
|
|
|
|
|
|
|
|
|
|
|
|
|
|
|
|
|
|
|
|
|
|
|
|
|
|
|
| |
| Vaccines | 7 | |  | | 1,196 | | 1,123 | | 11 | | 7 | | 268 | | 6 | | (5 | ) | 523 | | 7 | | 6 | | 405 | | 21 | | 17 | |
| Hepatitis | | | | 406 | | 417 | | 3 | | (3 | ) | 134 | | (5 | ) | (15 | ) | 201 | | 7 | | 5 | | 71 | | 9 | | 4 | |
| Infanrix, Pediarix | | | | 357 | | 336 | | 12 | | 6 | | 129 | | 16 | | 4 | | 162 | | 11 | | 10 | | 66 | | 8 | | 2 | |
|
|
|
|
|
|
|
|
|
|
|
|
|
|
|
|
|
|
|
|
|
|
|
|
|
|
|
|
|
| |
| Oncology and emesis | 5 | |  | | 934 | | 1,001 | | 2 | | (7 | ) | 679 | | 2 | | (9 | ) | 170 | | 6 | | 4 | | 85 | | (5 | ) | (11 | ) |
| Zofran | | | | 763 | | 774 | | 8 | | (1 | ) | 565 | | 10 | | (2 | ) | 130 | | 5 | | 3 | | 68 | | (2 | ) | (7 | ) |
| Hycamtin | | | | 99 | | 110 | | (3 | ) | (10 | ) | 64 | | (7 | ) | (17 | ) | 29 | | 13 | | 16 | | 6 | | (19 | ) | (25 | ) |
|
|
|
|
|
|
|
|
|
|
|
|
|
|
|
|
|
|
|
|
|
|
|
|
|
|
|
|
|
| |
| Cardiovascular and | 5 | |  | | | | | | | | | | | | | | | | | | | | | | | | | | | |
| urogenital | | | | 933 | | 771 | | 31 | | 21 | | 563 | | 27 | | 14 | | 262 | | 51 | | 49 | | 108 | | 15 | | 8 | |
| Coreg | | | | 432 | | 361 | | 34 | | 20 | | 425 | | 37 | | 23 | | – | | – | | – | | 7 | | (43 | ) | (53 | ) |
| Levitra | | | | 49 | | 37 | | 41 | | 32 | | 20 | | – | | (9 | ) | 21 | | 87 | | 91 | | 8 | | >100 | | 100 | |
| Avodart | | | | 64 | | 19 | | >100 | | >100 | | 34 | | >100 | | >100 | | 27 | | >100 | | >100 | | 3 | | >100 | | – | |
|
|
|
|
|
|
|
|
|
|
|
|
|
|
|
|
|
|
|
|
|
|
|
|
|
|
|
|
|
| |
| Other | 6 | |  | | 1,031 | | 1,171 | | (7 | ) | (12 | ) | 88 | | (1 | ) | (11 | ) | 326 | | (5 | ) | (8 | ) | 617 | | (8 | ) | (14 | ) |
| Zantac | | | | 273 | | 328 | | (12 | ) | (17 | ) | 70 | | 1 | | (9 | ) | 72 | | (22 | ) | (23 | ) | 131 | | (13 | ) | (17 | ) |
|
|
|
|
|
|
|
|
|
|
|
|
|
|
|
|
|
|
|
|
|
|
|
|
|
|
|
|
|
| |
| | 100 | |  | | 17,146 | | 18,181 | | 1 | | (6 | ) | 8,425 | | – | | (10 | ) | 5,128 | | 2 | | – | | 3,593 | | 3 | | (2 | ) |
|
|
|
|
|
|
|
|
|
|
|
|
|
|
|
|
|
|
|
|
|
|
|
|
|
|
|
|
|
| |
CER% represents turnover growth at constant exchange rates. £% represents growth at actual exchange rates. An analysis of turnover by quarter is given in the Financial record (pages 154 to 159).
Back to Contents
| 64 | GlaxoSmithKline Operating and financial review and prospects |
2004 Year continued
Regional analysis
The turnover reported in the table below represents sales invoiced by GlaxoSmithKline’s local entity to its customers in the local market plus co-promotion income within each market.
Pharmaceutical turnover by geographic region in 2004 on an invoiced basis
| | | | | | | | | | Growth* | |
| Region/ | % of | |  | | 2004 | | 2003 | |
| |
| major markets | total | | | £m | | £m | | CER% | | £% | |
|
|
|
|
|
|
|
|
|
|
|
| |
| USA | 49 | |  | | 8,425 | | 9,410 | | – | | (10 | ) |
|
|
|
|
|
|
|
|
|
|
|
| |
| Europe | 30 | |  | | 5,128 | | 5,114 | | 2 | | – | |
| France | | | | 982 | | 1,005 | | (1 | ) | (2 | ) |
| UK | | | | 735 | | 731 | | 1 | | 1 | |
| Italy | | | | 611 | | 660 | | (6 | ) | (7 | ) |
| Germany | | | | 521 | | 538 | | (2 | ) | (3 | ) |
| Spain | | | | 560 | | 528 | | 7 | | 6 | |
| Poland | | | | 148 | | 167 | | (8 | ) | (11 | ) |
| Other Europe | | | | 1,571 | | 1,485 | | 8 | | 6 | |
|
|
|
|
|
|
|
|
|
|
|
| |
| International | 21 | |  | | 3,593 | | 3,657 | | 3 | | (2 | ) |
| Asia Pacific | | | | 1,162 | | 1,140 | | 8 | | 2 | |
| Japan | | | | 770 | | 753 | | 5 | | 2 | |
| Middle East, Africa | | | | 669 | | 693 | | (1 | ) | (3 | ) |
| Latin America | | | | 581 | | 597 | | 8 | | (3 | ) |
| Canada | | | | 411 | | 474 | | (11 | ) | (13 | ) |
|
|
|
|
|
|
|
|
|
|
|
| |
| | 100 | | | | 17,146 | | 18,181 | | 1 | | (6 | ) |
|
|
|
|
|
|
|
|
|
|
|
| |
| * | CER% represents turnover growth at constant exchange rates. £% represents growth at actual exchange rates. |
Individual governments determine the pricing of medicines in most countries within Europe, which can result in wide price variations for the same product. Parallel trade occurs when third parties exploit this price differential by purchasing products in the market where low prices are enforced and selling them to governments and other purchasers in those markets where higher prices have been agreed. This parallel trade is permitted under the single market rules in the European Union. GlaxoSmithKline does not derive any benefit from the profit on resale at the higher price.
As a result, management believes that within the European region, turnover by market, on an invoiced basis as presented above, does not properly represent the consumption of the products within each market. GlaxoSmithKline employees based in each market are instrumental in the promotion of the Group’s products within their market, thereby creating a product sale and final consumption in that market. The following table gives the adjustments made in order to restate the turnover for markets within Europe on a turnover created basis. These adjustments are GlaxoSmithKline’s estimates based on the most recent data from independent external sources, valued in sterling at relevant exchange rates. Management believes that this turnover created basis of reporting turnover by market provides a better reflection of the performance of the businesses in each market within Europe.
The total turnover for the Europe region is unaffected by this restatement.
Parallel trade occurs occasionally elsewhere in the world but it is not sufficiently material to affect significantly the turnover data by market presented on an invoiced basis.
Pharmaceutical turnover for Europe region in 2004 on a turnover created basis
Turnover by market within Europe has been adjusted for the effects of parallel trade to show turnover on the basis of the country where the product is finally consumed, not where the product was sold by GlaxoSmithKline.
Region/
major markets | | | | | 2004 | | | | | | 2003 | |
|
|
Invoiced
£m | | Adjustment
£m | | Created
£m | Invoiced
£m | | Adjustment
£m | | Created
£m |
| |
| Europe | 5,128 | | – | | 5,128 | | 5,114 | | – | | 5,114 | |
| France | 982 | | (32 | ) | 950 | | 1,005 | | (39 | ) | 966 | |
| UK | 735 | | 95 | | 830 | | 731 | | 60 | | 791 | |
| Italy | 611 | | (23 | ) | 588 | | 660 | | (8 | ) | 652 | |
| Germany | 521 | | 55 | | 576 | | 538 | | 59 | | 597 | |
| Spain | 560 | | (15 | ) | 545 | | 528 | | (21 | ) | 507 | |
| Poland | 148 | | – | | 148 | | 167 | | – | | 167 | |
| Other Europe | 1,571 | | (80 | ) | 1,491 | | 1,485 | | (51 | ) | 1,434 | |
| |
Pharmaceutical turnover by geographic region in 2004 on a turnover created basis
| | | | | | | | | | Growth* | |
| Region/ | % of | | | | 2004 | | 2003 | |
|
|
| |
| major markets | total | | | £m | | £m | | CER% | | £% | |
|
|
|
|
|
|
|
|
|
|
|
| |
| USA | 49 | | | | 8,425 | | 9,410 | | – | | (10 | ) |
|
|
|
|
|
|
|
|
|
|
|
| |
| Europe | 30 | | | | 5,128 | | 5,114 | | 2 | | – | |
| France | | | | 950 | | 966 | | – | | (2 | ) |
| UK | | | | 830 | | 791 | | 5 | | 5 | |
| Italy | | | | 588 | | 652 | | (9 | ) | (10 | ) |
| Germany | | | | 576 | | 597 | | (2 | ) | (4 | ) |
| Spain | | | | 545 | | 507 | | 9 | | 7 | |
| Poland | | | | 148 | | 167 | | (8 | ) | (11 | ) |
| Other Europe | | | | 1,491 | | 1,434 | | 7 | | 4 | |
|
|
|
|
|
|
|
|
|
|
|
| |
| International | 21 | | | | 3,593 | | 3,657 | | 3 | | (2 | ) |
| Asia Pacific | | | | 1,162 | | 1,140 | | 8 | | 2 | |
| Japan | | | | 770 | | 753 | | 5 | | 2 | |
| Middle East, Africa | | | | 669 | | 693 | | (1 | ) | (3 | ) |
| Latin America | | | | 581 | | 597 | | 8 | | (3 | ) |
| Canada | | | | 411 | | 474 | | (11 | ) | (13 | ) |
|
|
|
|
|
|
|
|
|
|
|
| |
| | 100 | | | | 17,146 | | 18,181 | | 1 | | (6 | ) |
|
|
|
|
|
|
|
|
|
|
|
| |
| * | CER% represents turnover growth at constant exchange rates. £% represents growth at actual exchange rates. An analysis of turnover by quarter is given in the Financial record (pages 154 to 159). |
Back to Contents
| Operating and financial review and prospects GlaxoSmithKline | 65 |
USA
The USA reported flat turnover in the year despite the significant impact of generic competition to Paxil and Wellbutrin. Excluding sales of these products, turnover grew 10 per cent. The US business represented 49 per cent of total pharmaceutical turnover in 2004.
Advair maintained its strong growth with sales of £1,330 million, up 20 per cent. However, this adversely affected sales of its constituent products, Flovent and Serevent, which both showed declines. Flonase, indicated for the treatment of perennial rhinitis, grew by nine per cent.
Sales of Wellbutrin products fell 12 per cent to £735 million. Wellbutrin IR and SR sales fell 65 per cent to £270 million as a result of generic competition. The impact was partially offset, however, by the exceptionally strong performance of Wellbutrin XL, the new once-daily product, which achieved sales of £465 million in its first full year on the market.
Total sales of the Paxil franchise were down 51 per cent to £519 million as a result of generic competition to Paxil IR (sales of which declined 82 per cent to £131 million). Mitigating this decline was the performance of Paxil CR which generated sales of £388 million, up 13 per cent.
Sales in the anti-virals therapeutic area grew 12 per cent with HIV products up four per cent. Valtrex, for herpes, grew 30 per cent driven by patients switching to suppression therapy.
Sales of Avandia/Avandamet increased by 26 per cent. Antibacterial sales declined 24 per cent as a result of generic competition that began in the third quarter of 2002. Coreg sales increased 37 per cent as it continued to benefit from its wide range of indications.
Vaccines grew six per cent reflecting the good performance of Pediarix.
Europe
The discussion of individual market performance in the Europe region is on a turnover created basis rather than a turnover invoiced basis.
Europe region contributed 30 per cent of pharmaceutical turnover. Although overall turnover growth in the region was only two per cent, good growth was recorded in Spain and Southern and Eastern Europe. Government healthcare reforms, including pricing and reimbursement restrictions, adversely affected turnover in France, Italy and Germany.
Seretide, GlaxoSmithKline’s largest selling product in Europe, grew 18 per cent and reported notable growth in Spain and the UK. Seretide and its constituent products Serevent and Flixotide grew eight per cent.
The decline in sales of the herpes franchise was mainly as a result of generic competition for Zovirax partially offset by patients switching to the newer product, Valtrex.
Seroxat sales were down 31 per cent reflecting generic competition in the UK and France.
Anti-bacterial sales declined six per cent due to generic competition throughout the region
Vaccines grew by seven per cent driven by the hepatitis franchise and Infanrix.
International
The International region reported year on year turnover growth of three per cent. Strong growth in Asia Pacific up eight per cent and Latin America up eight per cent, was offset by flat sales in Australia and declines of five per cent in Sub-Sahahra Africa, eight per cent in the Middle East/North Africa and 11 per cent in Canada. In Canada, the sales decline was due to generic erosion of Paxil IR, excluding this element, Canada grew 4.5 per cent.
Japan recorded turnover growth of five per cent, despite routine government price reductions being implemented in 2004. Paxil up 25 per cent, Serevent up 74 per cent and Valtrex up 16 per cent performed particularly well offsetting small declines in Zantac and Zovirax.
Across all markets in International, the key products driving growth were Seretide, which grew 15 per cent to record sales of £229 million, Avandia/Avandamet, which grew 62 per cent to £161 million and the vaccines franchise, which recorded growth of 21 per cent and achieved sales of £405 million.
| Consumer Healthcare sales | | | | | | | | |
| | | | | | | | Growth | |
| | 2004 | | 2003 | |
|
|
| |
| | £m | | £m | | CER% | | £% | |
|
|
|
|
|
|
|
| |
| OTC medicines | 1,489 | | 1,556 | | 2 | | (4 | ) |
| Analgesics | 349 | | 342 | | 7 | | 2 | |
| Dermatological | 193 | | 237 | | (14 | ) | (19 | ) |
| Gastro-intestinal | 256 | | 283 | | (1 | ) | (10 | ) |
| Respiratory tract | 152 | | 151 | | 4 | | 1 | |
| Smoking control | 341 | | 325 | | 14 | | 5 | |
| Natural wellness support | 156 | | 166 | | (1 | ) | (6 | ) |
| | | | | | | | | |
| Oral care | 1,088 | | 1,082 | | 4 | | 1 | |
| Nutritional healthcare | 636 | | 622 | | 5 | | 2 | |
|
|
|
|
|
|
|
| |
| | 3,213 | | 3,260 | | 3 | | (1 | ) |
| |
The growth in Consumer Healthcare sales of three per cent to £3.2 billion comprised an OTC medicines sales increase of two per cent, a Nutritional healthcare sales increase of five per cent and Oral care sales increase of four per cent.
OTC medicines
OTC medicine sales were £1.5 billion, up two per cent. Sales growth from smoking control products in the USA, up 12 per cent, and Europe, up 24 per cent, helped to offset the decline in dermatological products, which were down 14 per cent due to generic competition to Cutivate in the USA. Expansion of the Panadol brand in International markets helped analgesics grow seven per cent.
In July, GlaxoSmithKline obtained the OTC marketing rights in the USA for orlistat, an FDA-approved prescription product for obesity management marketed by Roche as Xenical.
Oral care
Oral care sales were £1.1 billion, up four per cent. Strong growth in International of nine per cent was led by the Sensodyne, Polident and Poligrip brands.
Nutritional healthcare
Sales of Nutritional healthcare products grew five per cent to £0.6 billion. Lucozade grew seven per cent to £268 million.
Back to Contents
| 66 | GlaxoSmithKline Operating and financial review and prospects |
2004 Year continued
Trading profit – statutory results
For 2004 the Group is reporting results on a statutory basis only. The analysis below of trading profit and subsequent discussion compares the 2004 results with 2003 statutory results.
| | | | | | | | 2003 | | | | | |
| | | | 2004 | | | | (restated) | | Growth | |
| |
|
|
| |
|
|
| |
| |
| | £m | | % | | £m | | % | | CER% | | £% | |
|
|
|
|
|
|
|
|
|
|
|
| |
| Turnover | 20,359 | | 100.0 | | 21,441 | | 100.0 | | 1 | | (5 | ) |
|
|
|
|
|
|
|
|
|
|
|
| |
| Cost of sales | (4,309 | ) | (21.2 | ) | (4,544 | ) | (21.2 | ) | (1 | ) | (5 | ) |
| Selling, general | | | | | | | | | | | | |
| and administration | (7,061 | ) | (34.7 | ) | (7,597 | ) | (35.4 | ) | (2 | ) | (7 | ) |
| Research and | | | | | | | | | | | | |
| development | (2,839 | ) | (13.9 | ) | (2,791 | ) | (13.0 | ) | 7 | | 2 | |
|
|
|
|
|
|
|
|
|
|
|
| |
| Trading profit | 6,150 | | 30.2 | | 6,509 | | 30.4 | | 5 | | (6 | ) |
| |
In 2004, the Group adopted UITF Abstract 38 and the revised Abstract 17 relating to shares held by the ESOP Trusts and share options and awards. Comparative information for 2003 has been restated accordingly. Trading profit and profit before tax in 2003 have been reduced by £16 million and net assets at 31st December 2003 by £2,661 million.
Cost of sales
Cost of sales as a percentage of turnover remained in line with the prior year as reduced merger and manufacturing restructuring costs were offset by a significant weakening of the US dollar relative to last year, the loss of higher margin Paxil IR and Wellbutrin SR sales to generics, and an adverse product mix. Merger and manufacturing restructuring costs were nil in 2004 but £356 million in 2003.
Selling, general and administration
Selling, general and administration (SG&A) costs declined two per cent (seven per cent in sterling terms) reflecting savings in general and administration that were partly offset by increased advertising, promotion and selling costs. These latter costs increased three per cent, and accounted for a one percentage point increase in total SG&A. General and administration costs declined eight per cent and accounted for a three percentage point reduction in total SG&A. This was due to lower charges related to programmes to deliver future cost savings (equal to a two percentage point reduction in total SG&A) and other general expense reductions (equal to a three percentage point decline in total SG&A). These reductions were partly offset by higher provisions for legal matters, equivalent to a two percentage point increase in total SG&A. Net of currency movements, there was an overall reduction of 0.7 percentage points relative to 2003 for expenses expressed as a percentage of turnover.
The higher provisions for legal matters include a charge of £141 million in Quarter 4 2004 related to the introduction of an IBNR (incurred but not reported) actuarial technique to determine a reasonable estimate of the Group’s exposure for unasserted claims in relation to a number of product liability matters.
Research and development
R&D expenditure increased seven per cent reflecting increased clinical trial activity. Pharmaceuticals R&D expenditure represented 15.9 per cent of pharmaceutical turnover in the year.
Trading profit
Overall the trading margin declined 0.2 percentage points as trading profit of £6,150 million declined six per cent in sterling terms. At constant exchange rates trading profit increased five per cent and the margin decreased 0.2 percentage points reflecting the completion of the merger and manufacturing restructuring programme in 2003, lower charges relating to programmes to deliver future cost savings offset by higher legal provisions and increased R&D expenditure.
Profit before taxation – statutory results
The analysis and discussion below of profit before taxation relates to statutory performance.
| | 2004 | | 2003 | |
| Other operating income/(expense) | £m | | £m | |
|
|
|
| |
| Royalties and other income | 96 | | 75 | |
| Other operating expense | (296 | ) | (436 | ) |
|
|
|
| |
| | (200 | ) | (361 | ) |
| Income from equity investments and | | | | |
| other disposals | 140 | | 228 | |
|
|
|
| |
| | (60 | ) | (133 | ) |
| |
Other operating expense includes litigation costs and provisions relating to legal claims on withdrawn products, product withdrawals, anti-trust matters and claims with respect to sales, marketing and reimbursement. Income from equity investments and other disposals includes equity investment carrying value adjustments arising from stock market changes, product disposals and equity investment sales.
Other operating expense was £60 million in the year compared with £133 million in 2003. The charge in 2004 reflects provisions related to litigation matters and other legal matters, partly offest by minor product divestments, sales of equity investments and other income. The net charge from legal provisions and gain on sales of equity investments was lower in 2004 compared with last year.
Share of profits/(losses) of joint ventures and associated undertakings
The share of profits of associates arises principally from the Group’s holding in Quest Diagnostics Inc.
Disposal of interest in associates
During 2004, the Group disposed of 3.8 million shares from its investment in Quest Diagnostics Inc. for cash proceeds of £188 million, reducing the Group’s shareholding at 31st December 2004 to 18.6 per cent. After recognising a charge of £17 million for goodwill previously written off to reserves a profit of £139 million was recognised.
| | 2004 | | 2003 | |
| Net interest payable | £m | | £m | |
|
|
|
| |
| Interest payable | (298 | ) | (214 | ) |
| Investment income | 102 | | 61 | |
|
|
|
| |
| | (196 | ) | (153 | ) |
| Share of interest payable of associate | (7 | ) | (8 | ) |
|
|
|
| |
| | (203 | ) | (161 | ) |
| |
Net interest payable increased compared with 2003 largely as a result of higher average effective Group interest rate and higher borrowings.
Back to Contents
| Operating and financial review and prospects GlaxoSmithKline | 67 |
Profit on ordinary activities before taxation – statutory results
Taking account of net other operating income/(expenses), the contribution from associates, business disposals and net interest payable, statutory profit before tax was £6,119 million compared with £6,313 million in 2003, an increase of eight per cent (three per cent decline in sterling).
Trading profit – business performance
During the years 2000 to 2003, business performance was the primary performance measure used by management and was presented after excluding merger items, integration and restructuring costs and disposal of businesses, as management believes that exclusion of these items provides a better comparison of business performance for the periods presented. For 2004, with the completion of these programmes, the Group is reporting results on a statutory basis only. The analysis below of trading profit and subsequent discussion compares the 2004 results with 2003 business performance results. Accordingly this information is provided as a supplement to that contained in the consolidated statement of profit and loss on pages 90 and 91 prepared in accordance with UK GAAP.
| | | | | | | | 2003 | | | | | |
| | | | 2004 | | | | restated | | Growth | |
| |
| |
| |
| |
| | £m | | % | | £m | | % | | CER% | | £% | |
|
|
|
|
|
|
|
|
|
|
|
|
|
| | | | | | | | | | | | | |
| Turnover | 20,359 | | 100.0 | | 21,441 | | 100.0 | | 1 | | (5 | ) |
|
|
|
|
|
|
|
|
|
|
|
| |
| Cost of sales | (4,309 | ) | (21.2 | ) | (4,188 | ) | (19.5 | ) | 7 | | 3 | |
| Selling, general | | | | | | | | | | | | |
| and administration | (7,061 | ) | (34.7 | ) | (7,579 | ) | (35.4 | ) | (2 | ) | (7 | ) |
| Research and | | | | | | | | | | | | |
| development | (2,839 | ) | (13.9 | ) | (2,770 | ) | (12.9 | ) | 8 | | 2 | |
|
|
|
|
|
|
|
|
|
|
|
| |
| Trading profit | 6,150 | | 30.2 | | 6,904 | | 32.2 | | (1 | ) | (11 | ) |
|
|
|
|
|
|
|
|
|
|
|
| |
Cost of sales
Cost of sales increased as a percentage of turnover as a result of a significant weakening of the US dollar relative to 2003, the loss of higher margin Paxil IR and Wellbutrin SR sales to generics and an adverse product mix.
Selling, general and administration
SG&A costs declined two per cent (seven per cent in sterling terms) reflecting savings in general and administration that were partly offset by increased advertising, promotion and selling costs. These latter costs increased three per cent, and accounted for a one percentage point increase in total SG&A. General and administration costs declined eight per cent and accounted for a three percentage point reduction in total SG&A. This was due to lower charges related to programmes to deliver future cost savings (equal to a two percentage point reduction in total SG&A) and other general expense reductions (equal to a three percentage point decline in total SG&A). These reductions were partly offset by higher provisions for legal matters, equivalent to a two percentage point increase in total SG&A. Net of currency movements, there was an overall reduction of 0.7 percentage points relative to 2003 for expenses expressed as a percentage of turnover.
The higher provisions for legal matters include a charge of £141 million in Quarter 4 2004 related to the introduction of an IBNR (incurred but not reported) actuarial technique to determine a reasonable estimate of the Group’s exposure for unasserted claims in relation to a number of product liability matters.
Research and development
Research and development (R&D) increased eight per cent reflecting increased clinical trial activity. Pharmaceuticals R&D expenditure represented 15.9 per cent of pharmaceutical turnover in the year.
Trading profit
Trading profit was £6,150 million, a one per cent decrease (11 per cent decline in sterling terms) compared with 2003 business performance. The trading margin declined two percentage points compared with 2003. Net of currency movements the margin declined 0.7 percentage points, reflecting higher R&D expenditure, a higher cost of sales due to a less favourable product mix and higher provisions for legal matters, partially offset by cost savings initiatives in general and administration and lower charges related to programmes to deliver future cost savings.
Profit before taxation – business performance
The analysis and discussion below of profit before taxation relates to statutory performance in 2004 and business performance in 2003.
| | 2004 | | 2003 | |
| Other operating income/(expense) | £m | | £m | |
|
|
|
| |
| Royalties and other income | 96 | | 75 | |
| Other operating expense | (296 | ) | (436 | ) |
|
|
|
| |
| | (200 | ) | (361 | ) |
| Income from equity investments and | | | | |
| other disposals | 140 | | 228 | |
|
|
|
| |
| | (60 | ) | (133 | ) |
|
|
|
| |
Other operating expense includes litigation costs and provisions relating to legal claims on withdrawn products, product withdrawals, anti-trust matters and claims with respect to sales, marketing and reimbursement. Income from equity investments and other disposals includes equity investment carrying value adjustments arising from stock market changes, product disposals and equity investment sales.
Other operating expense was £60 million in the year compared with £133 million in 2003. The charge in 2004 reflects provisions related to legal matters, partly offset by minor product divestments, sales of equity investments and other income.
Share of profits/(losses) of joint ventures and associated undertakings
The share of profits of associates arises principally from the Group’s holding in Quest Diagnostics Inc.
Disposal of interest in associates
During 2004, the Group disposed of 3.8 million shares from its investment in Quest Diagnostics Inc. for cash proceeds of £188 million, reducing the Group’s shareholding at 31st December 2004 to 18.6 per cent. After recognising a charge of £17 million for goodwill previously written off to reserves a profit of £139 million was recognised.
Back to Contents
| 68 | GlaxoSmithKline Operating and financial review and prospects | |
2004 Year continued
| | 2004 | | 2003 | |
| Net interest payable | £m | | £m | |
|
|
|
| |
| Interest payable | (298 | ) | (214 | ) |
| Investment income | 102 | | 61 | |
|
|
|
| |
| | (196 | ) | (153 | ) |
| Share of interest payable of associate | (7 | ) | (8 | ) |
|
|
|
| |
| | (203 | ) | (161 | ) |
|
|
|
| |
Net interest payable increased compared with 2003 largely as a result of a higher average effective Group interest rate and higher borrowings.
Profit on ordinary activities before taxation – business performance
Taking account of net other operating income/(expense), the contribution from associates and net interest payable, statutory profit before tax was £6,119 million, compared with business performance profit before tax of £6,703 million in 2003, an increase of two per cent (decline in sterling terms of nine per cent).
Merger and manufacturing restructuring
The merger and manufacturing programmes were substantially completed in 2003; consequently the Group is only reporting statutory results in 2004. The costs of these programmes in 2003 were £390 million (£281 million after tax).
| Taxation | | | | |
| | | | 2003 | |
| | 2004 | | (restated) | |
| | £m | | £m | |
|
|
|
| |
| | | | | |
| Business performance | (1,701 | ) | (1,838 | ) |
| Merger, restructuring and disposal of subsidiaries | – | | 109 | |
|
|
|
| |
| Total | (1,701 | ) | (1,729 | ) |
|
|
|
| |
The integrated nature of the Group’s worldwide operations, involving significant investment in research and strategic manufacture at a limited number of locations, with consequential cross-border supply routes into numerous end-markets, gives rise to complexity and delay in negotiations with revenue authorities as to the profits on which individual Group companies are liable to tax. Disagreements with, and between, revenue authorities as to intra-Group transactions, in particular the price at which goods should be transferred between Group companies in different tax jurisdictions, can produce conflicting claims from revenue authorities as to the profits to be taxed in individual territories. Resolution of such issues is a continuing fact of life for GlaxoSmithKline. The Group has open issues with the revenue authorities in the USA, UK, Japan and Canada. By far the largest relates to Glaxo heritage products, in respect of which the US Internal Revenue Service (IRS) and UK Inland Revenue have made competing and contradictory claims.
GlaxoSmithKline has attempted to settle the US dispute, first through direct discussion with the IRS and subsequently through discussions between the US and UK authorities under the terms of the double tax convention between the two countries and discussions were terminated in July 2003. On 6th January 2004, the IRS issued a Notice of Deficiency for the years 1989-1996 claiming additional taxes of $2.7 billion. On 2nd April 2004 the Group filed a petition in the US Tax Court disputing the IRS claim and seeking a refund of $1 billion in taxes. On 25th January 2005 the IRS issued a further Notice of Deficiency for the years 1997-2000 claiming additional taxes of $1.9 billion.
If the IRS claims for the years 1989-2000 were upheld, the Group would additionally be liable for interest on late payment, estimated to amount to $3.0 billion, net of federal tax relief, at 31st December 2004, giving a total of $7.6 billion for the years 1989-2000. The Group expects to file a petition against the tax claims for 1997-2000 in April 2005, including a further claim for refund of taxes, and will ask the Tax Court to consolidate the IRS claims for all the years 1989-2000 into a single trial. A provisional trial date for the 1989-1996 claims has been set for October 2006.
As similar tax issues remain open for 2001 to date, GlaxoSmithKline expects to receive further substantial claims by the IRS for these years. GlaxoSmithKline continues to believe that the profits reported by its US subsidiaries for the period 1989 to date, on which it has paid taxes in the USA, are more than sufficient to reflect the activities of its US operations.
The Group is in continuing discussions with the Inland Revenue in respect of UK transfer pricing disputes.
GlaxoSmithKline uses the best advice in determining its transfer pricing methodology and in seeking to manage transfer pricing issues to a satisfactory conclusion and, on the basis of external professional advice, continues to believe that it has made adequate provision for the liabilities likely to arise from open assessments.
However, there continues to be a wide difference of views between the Group, the IRS, the Inland Revenue and other relevant taxation authorities where open issues exist. The ultimate liability for such matters may vary from amounts provided and is dependent upon the outcome of litigation proceedings and negotiations with the relevant tax authorities.
Except as shown in this Annual Report, no provision has been made for taxation which would arise on the distribution of profits retained by overseas subsidiary and associated undertakings, on the grounds that no remittance of profit retained at 31st December 2004 is required in such a way that incremental tax will arise.
| Earnings | | | | | | |
| | | | | | Growth | |
| | | | 2003 | |
| |
| | 2004 | | (restated) | | CER% | | £% | |
|
|
|
|
|
|
|
| |
| Statutory earnings (£m) | 4,302 | | 4,478 | | 7 | | (4 | ) |
| Basic earnings per share | 75.0 | p | 77.1 | p | 8 | | (3 | ) |
| Basic earnings per ADS | $2.74 | | $2.53 | | 8 | | 8 | |
|
|
|
|
|
|
|
| |
| Adjusted earnings (£m) | 4,302 | | 4,759 | | 1 | | (10 | ) |
| Adjusted earnings per share | 75.0 | p | 82.0 | p | 2 | | (9 | ) |
| Adjusted earnings per ADS | $2.74 | | $2.69 | | 2 | | 2 | |
|
|
|
|
|
|
|
| |
| Weighted average number of shares (millions) | 5,736 | | 5,806 | | | | | |
|
|
|
|
|
|
|
| |
Adjusted earnings and adjusted earnings per share are presented above in order to illustrate business performance.
During the years 2000 to 2003, business performance was the primary performance measure used by management and was presented after excluding merger items, integration and restructuring costs and disposals of businesses. Management believes that exclusion of these items provides a better comparison of business performance for the periods presented. For 2004, with the completion of these programmes, the Group is reporting results on a statutory basis only.
Back to Contents
| Operating and financial review and prospects GlaxoSmithKline | 69 |
Adjusted earnings increased one per cent. Adjusted earnings per share increased two per cent reflecting the reduction in the weighted average number of shares resulting from the Group’s share buy-back programme. The interest cost of this programme also impacts the Group’s earnings.
At actual rates of exchange, adjusted earnings per share declined nine per cent. The adverse currency impact on EPS of 11 percentage points reflects the significant weakening of the US dollar relative to 2003 and compares with a six per cent adverse currency impact on turnover. This difference principally arises from a different mix of currencies in profits compared with turnover.
Statutory EPS in 2004 was 75.0 pence compared with 77.1 pence in 2003. The sterling based decline in statutory EPS of three per cent reflected the significant weakening of the dollar. Excluding the effects of currency, statutory EPS grew eight per cent reflecting the completion of the Group’s merger and restructuring programmes in 2003 as well as underlying business growth.
Dividend
The Board has declared a fourth interim dividend of 12 pence per share making a total for the year of 42 pence per share. This compares with a total dividend of 41 pence per share for 2003. The equivalent dividend receivable by ADR holders is 44.438 cents per ADS based on an exchange rate of £1/$1.8516. The dividend will have an ex-dividend date of 16th February 2005 and will be paid on 7th April 2005 to shareholders and ADR holders of record on 18th February 2005.
Critical accounting policies
The consolidated Financial statements are prepared in accordance with UK generally accepted accounting principles, following the accounting policies approved by the Board and described in Note 2 to the Financial statements, ‘Accounting policies’. Management is required to make estimates and assumptions that affect the amounts of assets, liabilities, revenue and expenses reported in the Financial statements. Actual amounts and results could differ from those estimates. The following are considered to be the critical accounting policies adopted.
Turnover
Revenue is recognised when title and risk of loss is passed to the customer and reliable estimates can be made of relevant deductions. Gross turnover is reduced by rebates, discounts, allowances and product returns given or expected to be given, which vary by product arrangements and buying groups. These arrangements with purchasing organisations are dependent upon the submission of claims some time after the initial recognition of the sale. Provisions are made at the time of sale for the estimated rebates, discounts or allowances payable or returns to be made, based on available market information and historical experience. Because the amounts are estimated they may not fully reflect the final outcome, and the amounts are subject to change dependent upon, amongst other things, the types of buying group and product sales mix. The level of provision is reviewed and adjusted quarterly in the light of historical experience of actual rebates, discounts or allowances given and returns made and any changes in arrangements. Future events could cause the assumptions on which the provisions are based to change, which could affect the future results of the Group.
The Group’s largest business is US pharmaceuticals, and the US market has the most complex arrangements for rebates, discounts and allowances. The following briefly describes the nature of the arrangements in existence in the Group’s US pharmaceuticals business.
| • | The US Medicaid programme is a state-administered programme providing assistance to certain poor and vulnerable patients. In 1990, the Medicaid Drug Rebate Program was established to reduce state and federal expenditure on prescription drugs. GlaxoSmithKline participates by providing rebates to states. Provisions for Medicaid rebates are calculated based on the specific terms of individual state agreements using a combination of historical experience, product and population growth, anticipated price increases and the impact of contracting strategies |
| | |
| • | GlaxoSmithKline has arrangements with certain key parties, whereby the party is able to buy products from wholesalers at lower prices. A chargeback represents the difference between the invoice price to the wholesaler and the indirect customer’s contractual discounted price. Provisions for estimating chargebacks are calculated based on the terms of each agreement, historical experience and product growth rates |
| | |
| • | Customer rebates are offered to key managed care and group purchasing organisations and other direct and indirect customers. These arrangements require the customer to achieve certain performance targets relating to value of product purchased, formulary status or pre-determined market shares relative to competitors. The provision for these rebates is estimated based on the specific terms in each agreement, historical experience and product growth rates |
| | |
| • | Cash discounts are offered to customers to encourage prompt payment. These are accrued for at the time of invoicing and adjusted subsequently to reflect actual experience |
| | |
| • | Where there is historical experience of customer returns, GlaxoSmithKline records a provision for estimated sales returns by applying historical experience of customer returns to the amounts invoiced, together with market related information such as stock levels at wholesalers, anticipated price increases and competitor activity. |
A reconciliation of gross turnover to net turnover for the US pharmaceuticals business in 2004 is as follows:
| | £m | | % | |
|
|
|
| |
| Gross turnover | 10,835 | | 100 | |
| | | | | |
| US Government and State programmes | 734 | | 7 | |
| Chargebacks | 732 | | 7 | |
| Managed care and group purchasing organisation rebates | 575 | | 5 | |
| Cash discounts | 208 | | 2 | |
| Customer returns | 86 | | 1 | |
| Other | 75 | | – | |
|
|
|
| |
| Total deductions | 2,410 | | 22 | |
|
|
|
| |
| Net turnover | 8,425 | | 78 | |
|
|
|
| |
Back to Contents
70 GlaxoSmithKline Operating and financial review and prospects
2004 Year continued
The total provisions for rebates, discounts, allowances and returns in the US pharmaceuticals business at 31st December 2004 and 31st December 2003 were as follows:
| | At 31st | | At 31st | |
| December | December |
| 2004 | 2003 |
| £m | £m |
|
|
|
| |
| US Government and State programmes | 362 | | 262 | |
| Chargebacks | 50 | | 49 | |
| Managed care and group purchasing | | | | |
| organisation rebates | 297 | | 311 | |
| Cash discounts | 19 | | 18 | |
| Customer returns | 97 | | 112 | |
| Other | 31 | | 38 | |
|
|
|
| |
| Total | 856 | | 790 | |
|
|
|
| |
A monthly process is operated to monitor stock levels at wholesalers for any abnormal movements. This process uses gross sales volumes, prescription volumes based on third party data sources and information received from key wholesalers. The aim of this is to maintain stocks at a consistent level from year to year based on the pattern of consumption.
On this basis, US pharmaceutical stock levels at wholesalers and in other distribution channels at 31st December 2004 were estimated to amount to less than one month of turnover. This calculation uses third party information, the accuracy of which cannot be totally verified, but which is believed to be sufficiently reliable for this purpose.
Legal and other disputes
GlaxoSmithKline provides for anticipated settlement costs where a reasonable estimate may be made of the likely outcome of the dispute and legal and other expenses arising from claims against the Group. The company’s Directors, having taken legal advice, have established provisions after taking into account insurance and other agreements and having regard to the relevant facts and circumstances of each matter and in accordance with accounting requirements. Provisions for product liability claims on certain products have been made on an ‘incurred but not reported’ basis where sufficient history of claims made and settlements is available. No provisions have been made for other unasserted claims or for claims for which no reasonable estimate of the likely outcome can yet be made. The ultimate liability for pending and unasserted claims may vary from the amounts provided, if any, and is dependent upon the outcome of litigation proceedings, investigations and possible settlement negotiations.
Impairment of fixed assets
The carrying values of fixed assets subject to depreciation and amortisation are reviewed for impairment when there is an indication that the values of the assets might be impaired. Impairment is determined by reference to the higher of net realisable value and value in use, measured by reference to risk-adjusted future cashflows discounted using appropriate risk-free interest rates. These future cashflows are based on business forecasts and are therefore inherently judgemental. Future events could cause the assumptions used in these impairment reviews to change with a consequent adverse effect on the future results of the Group.
Intangible assets
Where intangible assets are acquired by GlaxoSmithKline from third parties the costs of acquisition are capitalised. Licences to compounds in development are amortised over their estimated useful lives, but not exceeding 15 years. Estimated useful lives are reviewed annually and impairment reviews are undertaken if events occur which call into question the carrying values of the assets. Brands acquired with businesses are capitalised independently where they are separable and have a long-term value to the Group. Brands are amortised over their estimated useful lives, not exceeding 20 years, except where the end of the useful economic life cannot be foreseen. Where brands are not amortised, they are subject to annual impairment reviews. Impairment reviews are based on risk-adjusted future cash flows discounted using appropriate risk-free interest rates. These future cash flows are based on business forecasts and are therefore inherently judgemental. Future events could cause the values of these intangible assets to be impaired and this would have an adverse effect on the future results of the Group.
Pensions and post-retirement benefits
The costs of providing pensions and other post-retirement benefits are charged to the profit and loss account in accordance with SSAP 24 over the period during which benefit is derived from the employee’s services. The costs are assessed in accordance with advice received from independent actuaries on the basis of assumptions selected by management. These assumptions include future earnings and pension increases, discount rates and expected long term rates of return on assets and are disclosed in Note 35 to the Financial statements, ‘Employee costs’. The expected long term rates of return on assets are determined based on long term government bond rates adjusted for risk and current market expectations. This Note also gives the additional disclosures required by FRS 17 ‘Retirement Benefits’. The selection of different assumptions could affect the future results of the Group.
Product rights and goodwill
In addition to the critical accounting policies outlined above, the accounting policy for product rights and goodwill is deemed to be important in respect of the balance sheet prepared in accordance with US accounting principles. Under US GAAP the merger of Glaxo Wellcome and SmithKline Beecham in 2000 was accounted for as an acquisition which gave rise to product rights of £24 billion and goodwill of £16 billion being recognised. Goodwill and those product rights determined to have indefinite lives are not amortised but rather reviewed annually for impairment. These impairment reviews assess business projections prepared as part of the Group’s annual budgeting and planning process to determine whether or not an impairment in the value of the goodwill has occurred. The business projections include assumptions about future events. Changes in future events could cause the assumptions in the business projections to change with a consequent adverse effect on the future results of the Group as reported under US GAAP.
Back to Contents
Operating and financial review and prospects GlaxoSmithKline 71
Financial position and resources
| Financial position | | | | |
| | | | 2003 | |
| | 2004 | | (restated) | |
| | £m | | £m | |
|
|
|
| |
| | | | | |
| Goodwill | 139 | | 143 | |
| Intangible fixed assets | 2,003 | | 1,697 | |
| Tangible fixed assets | 6,471 | | 6,441 | |
| Investments | 332 | | 294 | |
|
|
|
| |
| Fixed assets | 8,945 | | 8,575 | |
|
|
|
| |
| | | | | |
| Equity investments | 153 | | 164 | |
| Stocks | 2,192 | | 2,109 | |
| Debtors | 7,309 | | 6,897 | |
| Liquid investments | 2,818 | | 2,493 | |
| Cash at bank | 1,161 | | 962 | |
|
|
|
| |
| Current assets | 13,633 | | 12,625 | |
|
|
|
| |
| Loans and overdrafts | (1,582 | ) | (1,452 | ) |
| Other creditors | (7,140 | ) | (7,019 | ) |
|
|
|
| |
| Creditors: amounts due within one year | (8,722 | ) | (8,471 | ) |
|
|
|
| |
| Net current assets | 4,911 | | 4,154 | |
|
|
|
| |
| | | | | |
| Total assets less current liabilities | 13,856 | | 12,729 | |
|
|
|
| |
| Loans | (4,381 | ) | (3,651 | ) |
| Other creditors | (244 | ) | (232 | ) |
|
|
|
| |
| Creditors: amounts due after one year | (4,625 | ) | (3,883 | ) |
|
|
|
| |
| Provisions for liabilities and charges | (3,029 | ) | (3,042 | ) |
|
|
|
| |
| Net assets | 6,202 | | 5,804 | |
|
|
|
| |
| | | | | |
| Called up share capital | 1,484 | | 1,487 | |
| Share premium account | 304 | | 264 | |
| Other reserves | (644 | ) | (804 | ) |
| Profit and loss account | 4,781 | | 4,112 | |
|
|
|
| |
| Equity shareholders’ funds | 5,925 | | 5,059 | |
|
|
|
| |
| | | | | |
| Non-equity minority interests | – | | 503 | |
| Equity minority interests | 277 | | 242 | |
|
|
|
| |
| Capital employed | 6,202 | | 5,804 | |
|
|
|
| |
Tangible fixed assets
The total cost of the Group’s tangible fixed assets at 31st December 2004 was £12.9 billion, with a net book value of £6.5 billion. Of this, land and buildings represented £2.8 billion, plant and equipment £2.8 billion, computer software £0.2 billion and assets in construction £0.7 billion. In 2004, GlaxoSmithKline invested £993 million in new and renewal property, plant and equipment. This is mainly related to a large number of projects for the improvement and expansion of facilities at various worldwide sites. Property is mainly held freehold. New investment is financed from Group liquid resources. At 31st December 2004, the Group had capital contractual commitments for future expenditure of some £235 million and 2005 operating lease commitments of £83 million.
GlaxoSmithKline’s business is science-based, technology-intensive and highly regulated by governmental authorities. It allocates significant financial resources to the renewal and maintenance of its property, plant and equipment to minimise risks of interruption of production and to achieve compliance with regulatory standards. A number of its processes use chemicals and hazardous materials.
The Group observes stringent procedures and uses specialist skills to manage environmental risks from these activities. Environmental issues, sometimes dating from operations now modified or discontinued, are reported under ‘Responsibility for environment, health and safety’ (page 31) and in Note 30 to the Financial statements, ‘Legal proceedings’. GlaxoSmithKline believes that its facilities are adequate for its current needs.
Investments
GlaxoSmithKline held investments with a carrying value at 31st December 2004 of £485 million (2003 – £458 million). The market value at 31st December 2004 was £1,292 million (2003 – £1,279 million). The investments, which include associates and joint ventures, are mainly in equity shares where the holding derives directly from the Group’s business. These investments include stakes in companies where the Group has research collaborations, which provide access to biotechnology developments of potential interest or interests in companies that arise from business divestments.
Debtors
Debtors increased in 2004 reflecting the timing of year-end receipts, a higher deferred tax asset, insurance receivables and additional cash contributions into the UK pension plan.
Provisions
The Group carried provisions of £3,029 million at 31st December 2004 in respect of estimated future liabilities, of which £1,074 million related to legal and other disputes and £785 million related to pensions and other post-retirement benefits for employees.
Provision has been made for tax, legal and other disputes, indemnified disposal liabilities and the costs of manufacturing restructuring and merger integration to the extent that at the balance sheet date an actual or constructive obligation existed and could be reasonably estimated.
| Net debt | | | | |
| Group net debt at 31st December comprised: | | | | |
| | | | | |
| | 2004 | | 2003 | |
| | £m | | £m | |
|
|
|
| |
| Cash and liquid investments | 3,979 | | 3,455 | |
| Borrowings – repayable within one year | (1,582 | ) | (1,452 | ) |
| Borrowings – repayable after one year | (4,381 | ) | (3,651 | ) |
|
|
|
| |
| Net debt | (1,984 | ) | (1,648 | ) |
|
|
|
| |
Net debt increased by £336 million in 2004 to £1,984 million primarily due to the negative impact of foreign exchange on operating cash flows, the redemption of preference shares issued by a subsidiary, the settlement of some legal matters and the acquisition of the Fraxiparine and Arixtra business from Sanofi-Synthelabo.
Pensions
The Group continues to account for pension arrangements in accordance with SSAP 24. Under the transitional provisions of FRS 17 the disclosed pension assets and liabilities of the Group at 31st December 2004 show a net deficit after allowing for deferred taxation of £1,020 million (2003 – £1,300 million). Special cash contributions of £256 million were made in 2004 to reduce the funding deficits in the UK and US plans. This position will be reviewed annually and further contributions made as appropriate.
Back to Contents
72 GlaxoSmithKline Operating and financial review and prospects
Financial position and resources continued
Shareholders’ funds
A summary of the movements in equity shareholders’ funds is set out below.
| | | | 2003 | |
| | 2004 | | (restated) | |
| | £m | | £m | |
|
|
|
| |
| At beginning of year, as previously reported | 7,720 | | 6,581 | |
| Prior period adjustment – implementation | | | | |
| of UITF 17 (revised) and UITF 38 | (2,661 | ) | (2,741 | ) |
|
|
|
| |
| Equity shareholders’ funds at beginning | | | | |
| of year as restated | 5,059 | | 3,840 | |
| Profit for the year | 4,302 | | 4,478 | |
| Dividends | (2,402 | ) | (2,374 | ) |
| Shares issued on exercise of share options | 42 | | 41 | |
| Own shares purchased | (1,000 | ) | (980 | ) |
| Investment in ESOP shares | 26 | | 33 | |
| Exchange movements | (48 | ) | 106 | |
| Goodwill written back | 20 | | – | |
| Unrealised (loss)/profit on disposal | | | | |
| of intellectual property | (1 | ) | 7 | |
| Tax on exchange movements and | | | | |
| unrealised gains | (73 | ) | (92 | ) |
|
|
|
| |
| At end of year | 5,925 | | 5,059 | |
|
|
|
| |
Equity shareholders’ funds increased from £5,059 million at 31st December 2003 to £5,925 million at 31st December 2004. The increase arises from retained earnings partly offset by shares purchased and cancelled or held as Treasury shares, and exchange movements on overseas net assets.
Share purchases
In 2004, the ESOP Trusts did not make any market purchases of shares in GlaxoSmithKline plc (2003 – nil). Shares are held by the Trusts to satisfy future exercises of options and awards under the Group share option and award schemes. A proportion of the shares held by the Trusts are in respect of awards where the rules of the scheme require the company to satisfy exercises through market purchases rather than the issue of new shares. The shares held by the Trusts are matched to options and awards granted and diminish the dilutive effect of new share issues on shareholders' capital and earnings.
On 23rd October 2002, GlaxoSmithKline announced a second share repurchase programme of £4 billion. At the 2004 Annual General Meeting shareholders renewed approval for GlaxoSmithKline to make market purchases of its own shares. The exact amount and timing of future purchases will depend on market conditions and other factors. In 2004, GlaxoSmithKline purchased a total of 88 million shares, at a cost of £1 billion, under this programme. Of the total shares purchased in 2004, 18 million shares costing £201 million were cancelled, and the remaining 70 million shares costing £799 million are held as Treasury shares.
At 31st December 2004 the ESOP Trusts held 174.5 million GlaxoSmithKline shares, at a carrying value of £2,574 million and market value of £2,133 million, against the future exercise of share options and share awards.
Commitments and contingent liabilities
Financial commitments are summarised in Note 26 to the Financial statements, ‘Commitments’. Other contingent liabilities and obligations in respect of short and long-term debt are set out in Note 24 to the Financial statements, ‘Contingent liabilities’ and Note 25 to the Financial statements, ‘Net debt’.
Amounts provided for pensions and post-retirement benefits, restructuring and integration plans and legal, environmental and other disputes are set out in Note 23 to the Financial statements, ‘Provisions for liabilities and charges’.
Contractual obligations and commitments
The following table sets out the Group’s contractual obligations and commitments as they fall due for payment.
| | Total | | Under 1 yr | | 1-3 yrs | | 3-5 yrs | | 5 yrs+ | |
| | £m | | £m | | £m | | £m | | £m | |
|
|
|
|
|
|
|
|
|
| |
| Loans | 5,870 | | 1,547 | | 525 | | 1,554 | | 2,244 | |
| Finance lease obligations | 93 | | 35 | | 43 | | 8 | | 7 | |
| Operating lease | | | | | | | | | | |
| commitments | 407 | | 83 | | 127 | | 78 | | 119 | |
| Intangible fixed assets | 1,256 | | 145 | | 317 | | 264 | | 530 | |
| Tangible fixed assets | 235 | | 208 | | 27 | | – | | – | |
| Other commitments | 85 | | 25 | | 55 | | 5 | | – | |
|
|
|
|
|
|
|
|
|
| |
| Total | 7,946 | | 2,043 | | 1,094 | | 1,909 | | 2,900 | |
|
|
|
|
|
|
|
|
|
| |
The Group has entered into a number of research collaborations to develop new compounds with other pharmaceutical companies. The terms of these arrangements can include up-front fees, equity investments, loans and commitments to fund specified levels of research. In addition the Group will often agree to make further payments if future ‘milestones’ are achieved. As some of these agreements relate to compounds in the early stages of development, milestone payments will continue for a number of years if the compounds move successfully through the development process. Generally the closer the product is to marketing approval the greater the possibility of success. The payments shown above represent the maximum that would be paid if all milestones are achieved. A number of commitments were made in 2004 under licensing and other agreements, principally with Theravance Inc., Tanabe Seiyaka Co. Ltd, Exelixis Inc. and Human Genome Sciences Inc.. Pension commitments are provided in Note 35 to the Financial statements, ‘Employee costs’.
Contingent liabilities
The following table sets out contingent liabilities, comprising discounted bills, performance guarantees and other items arising in the normal course of business and when they are expected to expire.
| | Total | | Under 1 yr | | 1-3 yrs | | 3-5 yrs | | 5 yrs+ | |
| | £m | | £m | | £m | | £m | | £m | |
|
|
|
|
|
|
|
|
|
| |
| Guarantees | 48 | | 37 | | 4 | | 5 | | 2 | |
| Other contingent liabilities | 159 | | 16 | | 7 | | 2 | | 134 | |
|
|
|
|
|
|
|
|
|
| |
| Total | 207 | | 53 | | 11 | | 7 | | 136 | |
|
|
|
|
|
|
|
|
|
| |
Back to Contents
| Operating and financial review and prospects GlaxoSmithKline | 73 |
In the normal course of business the Group has provided various indemnification guarantees in respect of business disposals in which legal and other disputes have subsequently arisen. A provision is made where a reasonable estimate can be made of the likely outcome of the dispute and this is included in Note 23 to the Financial statements, ‘Provisions for liabilities and charges’.
It is the Group’s policy to provide for the settlement costs of asserted claims and environmental disputes when a reasonable estimate may be made. Prior to this point no liability is recorded. Legal and environmental costs are discussed in ‘Risk factors’ on pages 76 to 78.
GlaxoSmithKline uses the best advice in determining its transfer pricing methodology and, on the basis of external professional advice, continues to believe that it has made adequate provision for the liabilities likely to arise from open taxation assessments. The ultimate liability for such matters may vary significantly from amounts provided and is dependent upon the outcome of litigation proceedings and negotiations with the relevant tax authorities. This is discussed further in Note 12 to the Financial statements, ‘Taxation’.
Cash flow
A summary of the consolidated cash flow statement is set out below:
| | | | 2003 | |
| | 2004 | | (restated) | |
| | £m | | £m | |
|
|
|
| |
| Net cash inflow from operating activities | 6,527 | | 7,005 | |
| Dividends from joint ventures and | | | | |
| associated undertakings | 11 | | 1 | |
| Returns on investment and servicing of finance | (252 | ) | (231 | ) |
| Taxation paid | (1,583 | ) | (1,917 | ) |
| Capital expenditure and financial investment | (1,035 | ) | (954 | ) |
| Acquisitions and disposals | (69 | ) | (12 | ) |
| Equity dividends paid | (2,475 | ) | (2,333 | ) |
|
|
|
| |
| Net cash inflow before management | | | | |
| of liquid resources and financing | 1,124 | | 1,559 | |
| Management of liquid resources | (413 | ) | (1,336 | ) |
| Shares purchased | (1,000 | ) | (980 | ) |
| Other financing | 546 | | 730 | |
|
|
|
| |
| Increase/(decrease) in cash in the year | 257 | | (27 | ) |
|
|
|
| |
| | | | | |
| Reconciliation of net cash flow to movement in net debt | |
| | 2004 | | 2003 | |
| | £m | | £m | |
|
|
|
| |
| Net debt at beginning of year | (1,648 | ) | (2,335 | ) |
| Increase/(decrease) in cash in the year | 257 | | (27 | ) |
| Cash outflow from management | | | | |
| of liquid resources | 413 | | 1,336 | |
| Net increase in long-term loans | (1,350 | ) | (1,023 | ) |
| Net repayment of short-term loans | 407 | | 442 | |
| Exchange and other movements | (63 | ) | (41 | ) |
|
|
|
| |
| Net debt at end of year | (1,984 | ) | (1,648 | ) |
|
|
|
| |
The net cash inflow from operating activities was £6,527 million, a decrease of £478 million over 2003, arising from the negative impact of foreign exchange and the settlement of some legal matters.
Investment appraisal
GlaxoSmithKline has a formal process for assessing potential investment proposals in order to ensure decisions are aligned with the Group’s overall strategy. This process includes an analysis of the impact on profit and assessment of the return based on discounted cash flows. The discount rate used to perform financial analysis is decided internally, to allow determination of the extent to which investments cover the Group’s cost of capital. For specific investments the discount rate may be adjusted to take into account country or other risk weightings.
Capital expenditure and financial investment
Cash payments for tangible and intangible fixed assets amounted to £1,043 million (2003 – £1,062 million). Disposals realised £53 million (2003 – £46 million). Cash payments to acquire equity investments of £103 million (2003 – £63 million) were made in the year and sales of equity investments realised £58 million (2003 – £125 million).
Future cash flow
The Group expects that future operating cash flow will be sufficient to fund its operating and debt service costs, to satisfy normal levels of capital expenditure, to meet obligations under existing licensing agreements and to meet other routine outflows including tax and dividends, subject to the risk factors discussed on pages 76 and 78. The Group may from time to time have additional demands for finance, such as for acquisitions. The Group has access to other sources of liquidity from banks and other financial institutions, in addition to the cash flow from operations, for such needs.
Payment policies
Group companies are responsible for monitoring and managing their working capital. The terms of sales collections and supplier payments reflect local commercial practice.
In the UK, the company and each of its UK subsidiaries have policies to ensure that suppliers are paid on time. In particular, the UK companies seek:
| • | to settle terms of payment with suppliers when agreeing the terms of the transaction |
| • | to ensure that suppliers are made aware of the agreed terms of payment |
| • | to abide by the terms of payment. |
The policy includes arrangements for accelerated payment of small suppliers.
Payment performance
At 31st December 2004, the average number of days’ purchases represented by trade and fixed asset creditors of the parent company was nil (2003 – nil) and in respect of the company and its UK subsidiaries in aggregate was 21 days (2003 – 21 days).
Back to Contents
| 74 | GlaxoSmithKline Operating and financial review and prospects | |
Financial position and resources continued
Treasury policies
GlaxoSmithKline plc reports in sterling and pays dividends out of sterling profits. The role of Corporate Treasury in GlaxoSmithKline is to manage and monitor the Group’s external and internal funding requirements and financial risks in support of Group corporate objectives. Treasury activities are governed by policies and procedures approved by the Board and monitored by a treasury management group.
GlaxoSmithKline maintains treasury control systems and procedures to monitor foreign exchange, interest rate, liquidity, credit and other financial risks.
Liquidity
The Group operates globally, primarily through subsidiary companies established in the markets in which the Group trades. Due to the nature of the Group’s business, with patent protection on many of the products in the Group’s portfolio, the Group’s products compete largely on product efficacy rather than on price. Selling margins are sufficient to cover normal operating costs and the Group’s operating subsidiaries are substantially cash generative. Operating cash flow is used to fund investment in the research and development of new products as well as routine outflows of capital expenditure, tax, dividends and repayment of maturing debt. The Group may, from time to time, have additional demands for finance, such as for share purchases and acquisitions.
GlaxoSmithKline operates with a high level of interest cover and at low levels of net debt relative to its market capitalisation. In addition to the strong positive cash flow from normal trading activities, additional liquidity is readily available via its commercial paper programme and short-term investments. The Group also has an uncommitted Euro Medium Term Note programme of £5 billion, of which £2,526 million was in issue at 31st December 2004. In March 2004, the Group established a US Shelf Registration of $5 billion; at 31st December 2004 $2,477 (£1,290) million was in issue.
Treasury operations
The objective of treasury activity is to manage the post-tax net cost/income of financial operations to the benefit of Group earnings. Corporate Treasury does not operate as a profit centre.
GlaxoSmithKline uses a variety of financial instruments, including derivatives, to finance its operations and to manage market risks from those operations. Financial instruments comprise cash and liquid resources, borrowings and spot foreign exchange contracts.
A number of derivative financial instruments are used to manage the market risks from Treasury operations. Derivative instruments, principally comprising forward foreign currency contracts, interest rate and currency swaps, are used to swap borrowings and liquid assets into the currencies required for Group purposes and to manage exposure to funding risks from changes in foreign exchange rates and interest rates.
GlaxoSmithKline balances the use of borrowings and liquid assets having regard to: the cash flow from operating activities and the currencies in which it is earned; the tax cost of intra-Group distributions; the currencies in which business assets are denominated; and the post-tax cost of borrowings compared to the post-tax return on liquid assets.
Liquid assets surplus to the immediate operating requirements of Group companies are generally invested and managed centrally by Corporate Treasury. Requirements of Group companies for operating finance are met whenever possible from central resources.
External borrowings, mainly managed centrally by Corporate Treasury, comprise a portfolio of long and medium-term instruments and short-term finance.
GlaxoSmithKline does not hold or issue derivative financial instruments for trading purposes and the Group’s Treasury policies specifically prohibit such activity. All transactions in financial instruments are undertaken to manage the risks arising from underlying business activities, not for speculation.
Funding, maturity and counterparty risk
The Group invests centrally managed liquid assets in government bonds, short-term corporate debt instruments with a minimum short-term credit rating of A-1/P-1, money market funds with a credit rating of AAA/Aaa and fully collateralised preference share investments. (Credit ratings shown are from Standard and Poor’s and Moody’s Investors’ Services respectively).
The Group manages its net borrowing requirements through a portfolio of long and medium-term borrowings, including bonds, together with short-term finance under the US $10 billion commercial paper programme. In April 2004 a $500 million 3 year 2.375 per cent coupon bond, a $500 million 10 year 4.375 per cent coupon bond and a $1,500 million 30 year 5.375 per cent coupon bond were issued under the US Shelf Registration established in March 2004.
The Group’s medium-term borrowings mature at dates between 2005 and 2014, the private financing matures in 2032, the long-dated sterling bond matures in 2033 and the long-dated dollar bond matures in 2034. The private financing may be redeemed by GlaxoSmithKline at any time and, in particular, in the event of any accelerating event that would increase the cost of funding for the Group. GlaxoSmithKline’s long-term debt rating is AA from Standard and Poor’s and Aa2 from Moody’s Investors’ Services. The agencies’ short-term ratings for paper issued under the Group’s commercial paper programme are A-1+ and P-1 respectively.
Foreign exchange risk management
In GlaxoSmithKline foreign currency transaction exposure arising on normal trade flows, in respect of both external and intra-Group trade, is not hedged. GlaxoSmithKline’s policy is to minimise the exposure of overseas operating subsidiaries to transaction risk by matching local currency income with local currency costs. For this purpose, intra-Group trading transactions are matched centrally and intra-Group payment terms are managed to reduce risk. Exceptional foreign currency cash flows are hedged selectively under the management of Corporate Treasury.
A significant proportion of Group borrowings, including the commercial paper programme, is in US dollars, to benefit from the liquidity of US dollar denominated capital markets. Certain of these and other borrowings are swapped into other currencies as required for Group purposes. The Group seeks to denominate borrowings in the currencies of its principal assets.
Back to Contents
| Operating and financial review and prospects GlaxoSmithKline | 75 |
Borrowings denominated in, or swapped into, foreign currencies that match investments in overseas Group assets are treated as a hedge against the relevant net assets.
Based on the composition of net debt at 31st December 2004 a 10 per cent appreciation in sterling against major currencies would result in a reduction in the Group’s net debt of approximately £120 million. A 10 per cent weakening in sterling against major currencies would result in an increase in the Group’s net debt of approximately £150 million.
Interest rate risk management
GlaxoSmithKline’s policy on interest rate risk management requires that the amount of net borrowings at fixed rates increases with the ratio of forecast net interest payable to trading profit.
The Group uses a limited number of interest rate swaps to redenominate external borrowings into the interest rate coupon required for Group purposes. The duration of these swaps matches the duration of the principal instruments. Interest rate derivative instruments are accounted for as hedges of the relevant assets or liabilities, where possible.
The Group manages centrally the short-term cash surpluses or borrowing requirements of subsidiary companies and uses forward contracts to hedge future repayments back into originating currency.
Sensitivity analysis considers the sensitivity of the Group’s net debt to hypothetical changes in market rates and assumes that all other variables remain constant. Based on the composition of net debt at 31st December 2004 a one percentage point (100 basis points) increase or decrease in average interest rates would result in a negligible change in the Group’s annual interest expense.
Equity risk management
Equity investments classified as current assets are available for sale and the Group manages disposals to meet overall business requirements as they arise. The Group regularly monitors the value of its equity investments and only enters into hedges selectively with the approval of the Board.
Financial assets and liabilities
An analysis of net debt is given in Note 25 to the Financial statements, ‘Net debt’. An analysis of financial assets and liabilities at carrying value and fair value and a reconciliation to net debt are given in Note 34 to the Financial statements, ‘Financial instruments and related disclosures’, together with a discussion of derivative financial instruments and quantitative disclosures about market risk in accordance with the requirements of Financial Reporting Standard 13.
The Group continues to benefit from strong positive cash flow. Group net debt would have decreased significantly in the year to 31st December 2004, but for the Group’s purchase of its own shares in the market of £1 billion.
The financial assets and liabilities at 31st December 2004 are representative of the treasury policies and strategies of GlaxoSmithKline, applied consistently during the year. There were no significant changes in such policies throughout the year.
Back to Contents
| 76 | GlaxoSmithKline Operating and financial review and prospects |
Outlook and risk factors
Outlook
Sales growth of existing products and launch of new products are key drivers of GlaxoSmithKline’s business performance. It is anticipated that a number of new products will be launched in 2005. Typically, sales of existing products decline dramatically when generic competition is introduced either on patent expiry or earlier if there is a successful challenge to the Group’s patent. GlaxoSmithKline is engaged in legal proceedings regarding the validity and infringement of the Group’s patents relating to many of its products. These are discussed in ‘Risk factors’ below and in Note 30 to the Financial statements, ‘Legal proceedings’.
On 4th March 2005, the US Food and Drug Administration (FDA) halted distribution of supplies of Paxil CR and Avandamet due to manufacturing issues at the Group’s Cidra, Puerto Rico facility.
The company is working with the FDA to resolve the manufacturing issues with these products as quickly as possible, although the timing of this and the financial impact on the company's earnings are currently uncertain.
Subject to this uncertainty GSK’s published earnings guidance for 2005 remains EPS percentage growth in the low double-digit range (at constant exchange rates) on an International Financial Reporting Standards basis.
The Group has net debt of about £2 billion, which is low relative to its market capitalisation, and this positions it to take advantage of any opportunities that might arise to build the business.
There are risks and uncertainties inherent in the business which may affect future performance including expected earnings growth. These are discussed in ‘Risk factors’ below.
Risk factors
There are risks and uncertainties relevant to the Group’s business. The factors listed below are among those that the Group thinks could cause the Group’s actual results to differ materially from expected and historical results.
Risk that R&D will not deliver commercially successful new products
Continued development of commercially viable new products is critical to the Group’s ability to replace sales of older products that decline upon expiration of exclusive rights, and to increase overall sales. Developing new products is a costly, lengthy and uncertain process. A new product candidate can fail at any stage of the process, and one or more late-stage product candidates could fail to receive regulatory approval.
New product candidates may appear promising in development but, after significant investments, fail to reach the market or have only limited commercial success as a result of efficacy or safety concerns, inability to obtain necessary regulatory approvals, difficulty or excessive costs to manufacture, infringement of patents or other intellectual property rights of others or inability to differentiate the product adequately from those with which it competes. The successful development of the Group’s research and development pipeline is of particular importance in light of the recent and anticipated expiration of patent or data exclusivity for a number of the Group’s largest selling products.
Risk of loss or expiration of patents or marketing exclusivity
Patent infringement litigation
Efforts by generic manufacturers may involve challenges to the validity of a patent or assertions that the alternative compounds do not infringe the Group’s patents. If the Group is not successful during the patent protection or data exclusivity periods in maintaining exclusive rights to market one or more of its major products, particularly in the USA where the Group has its highest turnover and margins, the Group’s turnover and margins would be adversely affected.
See Note 30 to the Financial statements, ‘Legal proceedings’, for a discussion of patent-related proceedings in which the Group is involved.
Generic drug manufacturers are seeking to market generic versions of many of the Group’s most important products, including Seretide/Advair, Avandia, Zofran, Wellbutrin XL, Imitrex, Lamictal and Valtrex, prior to the expiration of the Group’s patents, and have exhibited a readiness to do so for other products in the future. Generic products competitive with Augmentin, Paxil and Wellbutrin SR were launched in the USA in 2002, 2003 and 2004, respectively, and had a significant impact on the Group’s overall turnover and earnings.
Weakness of intellectual property protection in certain countries
In some of the countries in which the Group operates, patent protection may be significantly weaker than in the USA or the European Union. In addition, in an effort to control public health crises, some developing countries, such as South Africa and Brazil, have considered plans for substantial reductions in the scope of patent protection for pharmaceutical products. In particular, these countries could facilitate competition within their markets from generic manufacturers who would otherwise be unable to introduce competing products for a number of years. Any loss of patent protection, including abrogation of patent rights or compulsory licensing, is likely to affect adversely the Group’s operating results in those national markets but is not expected to be material to the Group overall. Absence of adequate patent protection could limit the opportunity to look to such markets for future sales growth.
Risk of substantial adverse outcome of litigation and government investigations
See Note 30 to the Financial statements, ’Legal proceedings’, for a discussion of proceedings and governmental investigations in which the Group is currently involved. Unfavourable resolution of these and similar future proceedings or investigations may have a material adverse effect on the Group’s financial results. The Group has made material provisions in 2003 and 2004 related to legal proceedings and investigations which reduced its earnings. The Group may also make additional significant provisions related to legal proceedings and investigations in the future, which would reduce its earnings. In many cases the practice of the plaintiff bar is to claim damages – compensatory, punitive and statutory – in amounts that bear no relationship to the underlying harm. Accordingly it is potentially misleading to quantify the potential exposure to claims, proceedings and investigations of the type described in Note 30.
Recent insurance loss experience, including pharmaceutical product liability exposures, has increased the cost of, and narrowed the coverage afforded by, insurance for pharmaceutical companies generally, including the Group.
In order to contain insurance costs in 2004 and 2005 the Group has continued to adjust its coverage profile, accepting a greater degree of un-insured exposure. In addition, where future claims are made under insurance policies, insurers may reserve the right to deny coverage on various grounds. If denial of coverage is ultimately upheld on these claims, this could result in material additional charges to the Group’s earnings.
Back to Contents
| Operating and financial review and prospects GlaxoSmithKline | 77 |
Product liability litigation
Pre-clinical and clinical trials are conducted during the development of potential products to determine the safety and efficacy of products for use by humans following approval by regulatory bodies. Notwithstanding these efforts, when drugs and vaccines are introduced into the marketplace, unanticipated side effects may became evident. The Group is currently a defendant in a number of product liability lawsuits, including class actions, that involve substantial claims for damages related to the Group’s pharmaceutical products.
Litigation, particularly in the USA, is inherently unpredictable and excessive verdicts that are not justified by the evidence can occur. Class actions that sweep together all persons who were prescribed the Group’s products can inflate the potential liability by the force of numbers. Claims for pain and suffering and punitive damages are frequently asserted in product liability actions and, if allowed, can represent potentially open-ended exposure.
Anti-trust litigation
In the USA it has become increasingly common that following an adverse outcome in prosecution of patent infringement actions, the defendants and direct and indirect purchasers and other payers initiate anti-trust actions as well. Claims by direct and indirect purchasers and other payers are typically filed as class actions and the relief sought may include treble damages and restitution claims. Damages in adverse anti-trust verdicts are subject to automatic trebling in the USA
Governmental investigations
The Group operates globally in complex legal and regulatory environments that often vary among jurisdictions. The failure to comply with applicable laws, rules and regulations in these jurisdictions may result in civil and criminal legal proceedings. In the USA, for example, the Group is responding to federal and state governmental investigations into pricing, marketing and reimbursement of its prescription drug products. These investigations could result in related restitution or civil false claims act litigation on behalf of the federal or state governments, as well as related proceedings initiated against the Group by or on behalf of consumers and private payers. Such proceedings may result in trebling of damages awarded or fines in respect of each violation of law. Criminal proceedings may also be initiated against Group companies or individuals.
Risks of competition, price controls and limitations on sales
Third party competition
The Group operates in highly competitive businesses. In the pharmaceuticals business, it faces competition both from proprietary products of large international manufacturers and producers of generic pharmaceuticals. Significant product innovations, technical advances or the intensification of price competition by competitors could adversely affect the Group’s operating results. Continued consolidation in the pharmaceutical industry could adversely affect the Group’s competitive position, while continued consolidation among the Group’s customers may increase pricing pressures.
The Group had 12 products with over £500 million in annual global sales in 2004. Among these products are Paxil IR and Augmentin IR, with respect to each of which the Group now faces generic competition, and Zofran, Imitrex, Valtrex, Lamictal and Avandia, with respect to which the Group is currently defending its intellectual property rights in the USA, and Flonase, for which the FDA has not yet approved any generic version following expiry of the US patent in mid-2004.
If these or any of the Group’s other major products were to become subject to a problem such as loss of patent protection, unexpected side effects, regulatory proceedings, publicity affecting doctor or patient confidence or pressure from competitive products, or if a new, more effective treatment should be introduced, the adverse impact on the Group’s revenues and operating results could be significant. In particular, the Group faces intense competition from manufacturers of generic pharmaceutical products in all of its major markets.
Generic products often enter the market upon expiration of patents or data exclusivity periods for the Group’s products. Introduction of generic products typically leads to a dramatic loss of sales and reduces the Group’s revenues and margins for its proprietary products. The expiration dates for patents for the Group’s major products are set out on pages 30 to 31 and legal proceedings involving patent challenges are set out in Note 30 to the Financial statements, ‘Legal proceedings’.
Governmental and payer controls
Pharmaceutical products are subject to price controls or pressures and other restrictions in many markets, including Japan, Germany, France and Italy. Some governments intervene directly in setting prices. In addition, in some markets major purchasers of pharmaceutical products (whether governmental agencies or private health care providers) have the economic power to exert substantial pressure on prices or the terms of access to formularies.
The Group cannot predict whether existing controls will increase or new controls will be introduced that will reduce the Group’s margins or affect adversely its ability to introduce new products profitably.
For example, in the USA, where the Group has its highest margins and most sales for any country, pricing pressures could significantly increase upon implementation of the pharmaceutical benefit under Medicare, or in the event that other state programmes to control the cost of pharmaceutical are adopted. Once the Medicare programme initiates outpatient pharmaceutical coverage for its beneficiaries in 2006, the US government, or the private insurers through which coverage will be offered, through their enormous purchasing power under the programme could demand discounts that may implicitly create price controls on prescription drugs. Additionally, a number of states have proposed or implemented various schemes to control prices for their own senior citizens’ drug programmes, including importation from other countries and bulk purchasing of drugs. The growth in the number of patients covered through large managed care institutions in the USA, which is likely to increase with implementation of the Medicare amendments, also increases pricing pressures on the Group’s products.
These trends may adversely affect the Group’s revenues and margins from sales in the USA. Until the terms of implementation of the Medicare pharmaceutical benefit have been finalised, it is not possible to quantify the impact of that benefit on the Group’s financial results.
Back to Contents
| 78 | GlaxoSmithKline Operating and financial review and prospects |
Outlook and risk factors continued
Regulatory controls
The Group must comply with a broad range of regulatory controls on the testing, approval, manufacturing and marketing of many of its pharmaceutical and consumer healthcare products, particularly in the USA and countries of the European Union, that affect not only the cost of product development but also the time required to reach the market and the uncertainty of successfully doing so.
Stricter regulatory controls also heighten the risk of withdrawal by regulators of approvals previously granted, which would reduce revenues and can result in product recalls and product liability lawsuits. In addition, in some cases the Group may voluntarily cease marketing a product (for example the withdrawal of Lotronex shortly after its initial launch in the USA) or face declining sales based on concerns about efficacy or safety, whether or not scientifically justified, even in the absence of regulatory action. The development of the post-approval adverse event profile for a product or the product class may have a major impact on the marketing and sale of the product.
Risk of interruption of product supply
The manufacture of pharmaceutical products and their constituent materials requires compliance with good manufacturing practice regulations. The Group's manufacturing sites are subject to review and approval by the FDA and other regulatory agencies. Compliance failure by suppliers of key materials or the Group’s own manufacturing facilities could lead to product recalls and seizures, interruption of production and delays in the approvals of new products pending resolution of manufacturing issues. Non-compliance can also result in fines and disgorgement of profits. In addition, while the Group undertakes business continuity planning, single sourcing for certain components, bulk active materials and finished products creates a risk of failure of supply in the event of regulatory non-compliance or physical disruption at the manufacturing sites. The FDA has recently seized Paxil CR and Avandamet tablets manufactured at the Group's Cidra, Puerto Rico facility on grounds that those products failed to meet FDA manufacturing standards. That facility has been the subject of FDA observations of possible deficiencies in manufacturing practices to which the Group responded by, among other things, voluntarily recalling certain shipments of Paxil CR and Avandamet from wholesalers. See note 30 to the Financial statements, 'Legal proceedings'. The Group continues to cooperate with the FDA in responding to the observations and in respect of the recent seizures, but there can be no assurance as to any remedy the FDA may ultimately seek or as to the timing of resumption of distribution of Paxil CR and/or Avandamet. In 2004 Paxil CR and Avandamet accounted for £396 million and £222 million in sales, respectively. Any interruption of supply or fines or disgorgement remedy could materially and adversely affect the Group's financial results.
Risk from concentration of sales to wholesalers
In the USA, in line with other pharmaceutical companies, the Group sells its products through a small number of wholesalers in addition to hospitals, pharmacies, physicians and other groups. Sales to the three largest of which amounted to approximately 80 per cent of the Group’s US pharmaceutical sales. The Group is exposed to a concentration of credit risk in respect of these wholesalers such that, if one or more of them is affected by financial difficulty, it could materially and adversely affect the Group’s financial results.
Environmental liabilities
The environmental laws of various jurisdictions impose actual and potential obligations on the Group to remediate contaminated sites. The Group has also been identified as a potentially responsible party under the US Comprehensive Environmental Response Compensation and Liability Act at a number of sites for remediation costs relating to the Group’s use or ownership of such sites. Failure to manage properly the environmental risks could result in additional remedial costs that could materially and adversely affect the Group’s operations. See Note 30 to the Financial statements, ‘Legal proceedings’, for a discussion of environmental-related proceedings in which the Group is involved.
Reliance on information technology
The Group is increasingly dependent on information technology systems, including Internet-based systems, for internal communication as well as communication with customers and suppliers. Any significant disruption of these systems, whether due to computer viruses or other outside incursions, could materially and adversely affect the Group’s operations.
Taxation
The effective tax rate on the Group’s earnings benefits from the fact that a portion of its earnings is taxed at more favourable rates in some jurisdictions outside the UK. Changes in tax laws or in their application with respect to matters, such as transfer pricing and the risk of double taxation, that relate to the portion of the Group’s earnings taxed at more favourable rates, could increase the Group’s effective tax rate and adversely affect its financial results. The Group has open issues with the revenue authorities in the USA, UK, Japan and Canada. By far the largest relates to Glaxo heritage products, in respect of which the US Internal Revenue Service and UK Inland Revenue have made competing and contradictory claims. These matters are discussed in Note 12 to the Financial statements, ‘Taxation’.
Global political and economic conditions
The Group conducts a substantial portion of its operations outside the UK. The Group’s management of foreign exchange rates is discussed in Operating and financial review and prospects, ‘Foreign exchange risk management’. Fluctuations in exchange rates between sterling and other currencies, especially the US dollar, the Euro and the Japanese yen, materially affect the Group’s financial results.
The Group has no control over changes in inflation and interest rates, foreign currency exchange rates and controls or other economic factors affecting its businesses or the possibility of political unrest, legal and regulatory changes or nationalisation in jurisdictions in which the Group operates. These factors could materially affect the Group’s future results of operations.
Accounting standards
New or revised accounting standards and rules promulgated from time to time by the UK, US or international accounting standard setting boards could have a material adverse impact on the Group’s reported financial results. With the adoption of International Financial Reporting Standards (IFRS), changes in the market valuation of certain financial instruments (such as the equity collar linked to the Group’s investment in Quest Diagnostics, the put and call options linked to the Group’s strategic alliance with Theravance and impairments of equity investments) will be reflected in the Group’s reported results before those gains or losses are actually realised and could have a significant impact on the profit and loss statement in any given period. The Group believes that it complies with the appropriate regulatory requirements concerning its financial statements and disclosures. However, other companies have experienced investigations into potential non-compliance with accounting and disclosure requirements that have resulted in significant penalties.
Human resources
The Group has approximately 100,000 employees around the world and is subject to laws and regulations concerning its employees – ranging from discrimination and harassment to personal privacy to labour relations – that vary significantly from jurisdiction to jurisdiction. Failure to comply with applicable requirements could have a significant adverse affect on the Group.
Back to Contents
| Operating and financial review and prospects GlaxoSmithKline | 79 |
2003 Year
In accordance with US SEC disclosure requirements, the following discussion compares results for the year to 31st December 2003 with the results for the year to 31st December 2002.
All growth rates included in the review of turnover are at constant exchange rates (CER) unless otherwise stated. The sterling growth rates may be found in the table of pharmaceutical sales by therapeutic area on page 81.
Exchange
The currencies that most influence the Group’s results are the US Dollar, the Euro and the Japanese Yen.
The pound hit its highest level against the dollar for more than three years, climbing to $1.79 and the Euro gained 20 per cent against the dollar in 2003, the first year that the Dollar has fallen in value against the Euro, as investors weighed up the impact of continued unrest in Iraq, tensions elsewhere in the world and concerns for the US economy.
World market – pharmaceuticals
Global pharmaceutical sales increased by almost nine per cent CER (five per cent sterling) in 2003 to £279 billion.
World market by
geographic region | Value
£bn | | % of
total | | | | Growth | |
|
| CER | | £% |
|
|
|
|
|
|
|
| |
| USA | 127 | | 46 | | 11 | | 2 | |
| Europe | 76 | | 27 | | 8 | | 15 | |
| Germany | 15 | | 5 | | 7 | | 15 | |
| France | 14 | | 5 | | 6 | | 14 | |
| UK | 9 | | 3 | | 11 | | 11 | |
| Italy | 9 | | 3 | | 5 | | 13 | |
| Japan | 31 | | 11 | | 2 | | (1 | ) |
| Asia Pacific | 19 | | 7 | | 9 | | 4 | |
| Latin America | 12 | | 4 | | (3 | ) | (11 | ) |
| Middle East, Africa | 8 | | 3 | | 17 | | 13 | |
| Canada | 6 | | 2 | | 12 | | 11 | |
|
|
|
|
|
|
|
| |
| Total | 279 | | 100 | | 9 | | 5 | |
|
|
|
|
|
|
|
| |
The US market, although less buoyant than 2002 maintained double digit growth and now represents 46 per cent of the global prescription pharmaceutical market compared to 31 per cent a decade ago.
At 30th September 2003, GlaxoSmithKline held second position in the world pharmaceutical market with a market share of 6.9 per cent, behind Pfizer with a market share of 10.3 per cent. GlaxoSmithKline had seven products in the world’s top 50 pharmaceutical products; these are Augmentin, Avandia, Imigran/Imitrex, Seretide/Advair, Seroxat/Paxil, Wellbutrin and Zofran.
World market –
top five therapeutic classes | Value
£bn | | % of
total | | | | Growth | |
| |
|
| | CER | | £% |
|
|
|
|
|
|
|
| |
| Cardiovascular | 47 | | 17 | | 7 | | 4 | |
| Central nervous system | 46 | | 16 | | 13 | | 8 | |
| Alimentary tract and metabolic | 36 | | 13 | | 8 | | 4 | |
| Anti-infectives (bacterial, | | | | | | | | |
| viral and fungal) excluding vaccines | 31 | | 11 | | 7 | | 2 | |
| Respiratory | 20 | | 7 | | 2 | | (2 | ) |
|
|
|
|
|
|
|
| |
| (Note: data based on 12 months to 30th September 2003.) |
Pharmaceutical turnover
All growth rates included in the review of turnover are at constant exchange rates (CER) unless otherwise stated. The sterling growth rates may be found in the tables of pharmaceutical turnover by therapeutic area on page 81.
Total pharmaceutical turnover in 2003 was £18,181 million compared with £17,995 million in 2002, an increase of five per cent. Approximately one per cent of this overall growth came from price increases. Growth in sterling terms of one per cent was significantly impacted by the weakness of the US dollar and other currencies.
Within the Group’s portfolio, turnover of new products launched in a major market within the last five years accounted for 25 per cent of total turnover and grew by 29 per cent to £4,633 million. Turnover of the more established, franchise products amounted to £9,888 million representing 54 per cent of total turnover and grew one per cent compared to last year. Turnover of older products, now less actively promoted, was £3,660 million, a decline of eight per cent, representing 21 per cent of total turnover.
Global pharmaceutical turnover in the fourth quarter of 2003 declined two per cent, reflecting a US turnover decline of six per cent to £2,188 million; whereas in Europe turnover grew two per cent to £1,363 million, and in International turnover grew four per cent to £964 million. Turnover in the US declined due to generic competition to Paxil which began in September 2003.
Pharmaceutical turnover by therapeutic area
GlaxoSmithKline’s ability to continue to deliver pharmaceutical turnover growth, despite generic competition to several of its products, is primarily due to an exceptionally broad product portfolio of fast-growing, high-value products.
These include the Respiratory product Seretide/Advair (£2.2 billion) up 39 per cent, the diabetes treatment Avandia/Avandamet (£0.9 billion) up 24 per cent, Wellbutrin for depression (£0.9 billion) up 18 per cent, the emesis treatment Zofran (£0.8 billion) up 16 per cent, Lamictal for epilepsy (£0.6 billion) up 31 per cent, Trizivir, for HIV (£0.4 billion) up 22 per cent, Valtrex for herpes (£0.5 billion) up 23 per cent, Coreg for heart disease (£0.4 billion) up 28 per cent and the pediatric vaccine Infanrix/Pediarix (£0.3 billion) up 32 per cent.
Central nervous system (CNS)
CNS sales grew four per cent to £4,455 million. Sales in the USA and Europe grew three per cent. International sales grew 15 per cent.
Sales of Seroxat/Paxil, GlaxoSmithKline’s leading product for depression and anxiety disorders, declined four per cent to £1,877 million. US sales declined nine per cent to £1,179 million following the launch of a generic paroxetine in September 2003. GlaxoSmithKline's innovative new product Paxil CR, increased its share of total Paxil prescriptions (branded and generic) since the generic launch from 33 per cent to 37 per cent. Paxil CR sales in 2003 were £387 million. In Europe Seroxat sales declined eight per cent to £369 million reflecting competition and pricing pressures. International sales grew 25 per cent to £329 million led by continued strong growth in Japan.
Back to Contents
| 80 | GlaxoSmithKline Operating and financial review and prospects |
2003 Year continued
Sales of Wellbutrin, for depression, grew 18 per cent to £953 million, reflecting increased physician awareness of the product’s outstanding efficacy and favourable side-effect profile. A new once-daily formulation, Wellbutrin XL, was launched in September 2003. This formulation accounted for 40 per cent of branded Wellbutrin prescriptions in early February 2004 and seven per cent of sales in 2003.
Limited generic competition to Wellbutrin began in the USA in January 2004 for the 100mg dose.
GlaxoSmithKline’s medicine for epilepsy, Lamictal, continued to grow across all regions achieving sales of £556 million, up 31 per cent. In June 2003, the FDA approved Lamictal for long-term maintenance treatment of bi-polar disorder.
Respiratory
GlaxoSmithKline continues to be the global leader in respiratory pharmaceuticals with sales of its three key products, Seretide/Advair, Flixotide/Flovent and Serevent, amounting to £3.4 billion, up 17 per cent. Sales of Seretide/Advair, the Group’s largest product, grew 39 per cent to £2.2 billion although this contributed to declines in Serevent and Flixotide, its constituent products. Seretide/Advair is now one of the top ten pharmaceutical brands in the world. In the USA, sales grew 54 per cent to £1,235 million.
Seretide also continued to perform strongly in Europe (up 18 per cent) and International markets (up 37 per cent). The growth prospects for Advair were further strengthened with an FDA approval for use in the treatment of COPD in the fourth quarter 2003.
The older respiratory products Ventolin and Becotide continued to decline as patients converted to newer products.
Anti-virals
HIV medicines grew across all regions and totalled £1.5 billion in sales, up six per cent. Sales of Trizivir, GlaxoSmithKline’s triple combination therapy, grew 22 per cent to £376 million. Lexiva, for HIV, was launched in December 2003, with initial sales of £7 million.
Global sales of Valtrex, which received FDA approval in August 2003 to reduce the risk of transmission of genital herpes, rose 23 per cent to £499 million.
Anti-bacterials
Anti-bacterial sales declined 16 per cent worldwide and 41 per cent in the USA. Augmentin’s US sales were down 51 per cent in the year as a result of generic competition that began in the third quarter 2002.
In the USA, GlaxoSmithKline’s two new antibiotics, Augmentin ES for children, and Augmentin XR for adults, recorded combined sales of £237 million in 2003 in spite of generic competition.
Metabolic
Worldwide sales for the metabolic category were £1.1 billion, up 20 per cent. The Avandia franchise (Avandia and Avandamet) grew 24 per cent for the year with US sales up 20 per cent to £755 million.
Avandamet, a combination of Avandia and metformin HCI, expanded the Avandia metabolic franchise with its US launch in the fourth quarter 2002. In Europe, Avandia has benefited from increasing physician acceptance with sales of £70 million, up 57 per cent. The franchise should benefit further from the EU approval of Avandamet in December 2003. Avandia also did very well in International markets with sales of £106 million, up 40 per cent.
Vaccines
Sales of vaccines grew two per cent to £1.1 billion, supported by the Infanrix/Pediarix franchise, up 32 per cent to £336 million. The hepatitis franchise declined 13 per cent to £417 million reflecting competitive pressure in the USA and Europe.
In the USA, GlaxoSmithKline’s new Pediarix vaccine was launched in January 2003. Pediarix adds protection against hepatitis B and poliomyelitis to the Infanrix combination and results in up to six fewer injections for infants.
Cardiovascular and urogenital
In 2003, Coreg sales grew 28 per cent to £361 million, benefiting from recent data that showed a highly significant statistical difference in survival between Coreg and metoprolol in patients with heart failure.
Levitra (vardenafil), a new agent for the treatment of erectile dysfunction, was launched in the USA in August 2003 and in Europe in the first half of the year. Levitra was researched and developed by Bayer AG and is co-promoted with GlaxoSmithKline.
Oncology and emesis
Sales of Zofran grew 16 per cent to £774 million, driven by a strong US performance, up 20 per cent to £575 million.
Other therapeutic areas
Sales of Zantac fell 13 per cent to £328 million with declines in all regions.
Back to Contents
| Operating and financial review and prospects GlaxoSmithKline | 81 |
Pharmaceutical turnover by therapeutic area 2003
| | | | | | | | | | | | Total | | | | | | USA | | | | | | Europe | | | | International | |
|
|
|
|
|
|
|
|
|
|
|
|
|
|
|
|
|
|
|
|
|
|
|
|
|
|
|
| |
| | | | | | | | | | Growth | | | | Growth | | | | Growth | | | | Growth | |
| Therapeutic area/ | % of | |  | | 2003 | | 2002 | |
| | 2003 | |
| | 2003 | |
| | 2003 | |
| |
| major products | total | | | £m | | £m | | CER% | | £% | | £m | | CER% | | £% | | £m | | CER% | | £m | | £m | | CER% | | £% | |
|
|
|
|
|
|
|
|
|
|
|
|
|
|
|
|
|
|
|
|
|
|
|
|
|
|
|
|
|
| |
| CNS | 25 | |  | | 4,455 | | 4,511 | | 4 | | (1 | ) | 3,112 | | 3 | | (6 | ) | 847 | | 3 | | 10 | | 496 | | 15 | | 14 | |
| Depression | | | | 2,830 | | 2,937 | | 2 | | (4 | ) | 2,107 | | 1 | | (7 | ) | 369 | | (8 | ) | (2 | ) | 354 | | 25 | | 23 | |
| Seroxat/Paxil | | | | 1,877 | | 2,055 | | (4 | ) | (9 | ) | 1,179 | | (9 | ) | (17 | ) | 369 | | (8 | ) | (2 | ) | 329 | | 25 | | 23 | |
| Wellbutrin | | | | 953 | | 882 | | 18 | | 8 | | 928 | | 18 | | 8 | | – | | – | | – | | 25 | | 30 | | 25 | |
| Migraine | | | | 849 | | 888 | | 1 | | (4 | ) | 609 | | (1 | ) | (9 | ) | 179 | | 3 | | 11 | | 61 | | 7 | | 7 | |
| Imigran/Imitrex | | | | 760 | | 798 | | – | | (5 | ) | 560 | | (1 | ) | (9 | ) | 147 | | 3 | | 11 | | 53 | | 7 | | 8 | |
| Naramig/Amerge | | | | 89 | | 90 | | 1 | | (1 | ) | 49 | | (3 | ) | (9 | ) | 32 | | 7 | | 14 | | 8 | | 7 | | – | |
| Lamictal | | | | 556 | | 438 | | 31 | | 27 | | 311 | | 38 | | 26 | | 202 | | 26 | | 34 | | 43 | | 9 | | 8 | |
| Requip | | | | 99 | | 89 | | 13 | | 11 | | 47 | | 9 | | – | | 47 | | 15 | | 24 | | 5 | | 43 | | 25 | |
| Zyban | | | | 75 | | 99 | | (25 | ) | (24 | ) | 28 | | (35 | ) | (40 | ) | 32 | | 12 | | 19 | | 15 | | (45 | ) | (40 | ) |
|
|
|
|
|
|
|
|
|
|
|
|
|
|
|
|
|
|
|
|
|
|
|
|
|
|
|
|
|
| |
| Respiratory | 24 | |  | | 4,417 | | 3,987 | | 14 | | 11 | | 2,242 | | 21 | | 11 | | 1,481 | | 4 | | 10 | | 694 | | 13 | | 11 | |
| Serevent, Seretide/Advair | | | | | | | | | | | | | | | | | | | | | | | | | | | | | |
| Flixotide/Flovent | | | | 3,352 | | 2,937 | | 17 | | 14 | | 1,750 | | 23 | | 12 | | 1,170 | | 7 | | 15 | | 432 | | 18 | | 19 | |
| Seretide/Advair | | | | 2,214 | | 1,631 | | 39 | | 36 | | 1,235 | | 54 | | 41 | | 773 | | 18 | | 27 | | 206 | | 37 | | 40 | |
| Flixotide/Flovent | | | | 705 | | 783 | | (8 | ) | (10 | ) | 319 | | (10 | ) | (18 | ) | 208 | | (10 | ) | (5 | ) | 178 | | 1 | | 1 | |
| Serevent | | | | 433 | | 523 | | (15 | ) | (17 | ) | 196 | | (27 | ) | (33 | ) | 189 | | (5 | ) | (1 | ) | 48 | | 26 | | 26 | |
| Flixonase/Flonase | | | | 594 | | 534 | | 19 | | 11 | | 461 | | 22 | | 12 | | 56 | | 1 | | 8 | | 77 | | 14 | | 12 | |
| Ventolin | | | | 265 | | 265 | | (1 | ) | – | | 4 | | (50 | ) | (50 | ) | 134 | | (5 | ) | 1 | | 127 | | 7 | | 2 | |
| Becotide | | | | 111 | | 130 | | (16 | ) | (15 | ) | – | | – | | – | | 93 | | (15 | ) | (11 | ) | 18 | | (23 | ) | (28 | ) |
|
|
|
|
|
|
|
|
|
|
|
|
|
|
|
|
|
|
|
|
|
|
|
|
|
|
|
|
|
| |
| Anti-virals | 13 | |  | | 2,349 | | 2,299 | | 5 | | 2 | | 1,159 | | 4 | | (4 | ) | 726 | | 5 | | 14 | | 464 | | 7 | | 3 | |
| HIV | | | | 1,508 | | 1,465 | | 6 | | 3 | | 798 | | 2 | | (7 | ) | 555 | | 11 | | 20 | | 155 | | 12 | | 6 | |
| Trizvir | | | | 376 | | 315 | | 22 | | 19 | | 219 | | 20 | | 10 | | 143 | | 28 | | 39 | | 14 | | 27 | | 17 | |
| Combivir | | | | 589 | | 588 | | 3 | | – | | 301 | | (3 | ) | (11 | ) | 218 | | 8 | | 17 | | 70 | | 16 | | 9 | |
| Epivir | | | | 293 | | 295 | | 2 | | (1 | ) | 148 | | (1 | ) | (10 | ) | 107 | | 5 | | 14 | | 38 | | 6 | | 3 | |
| Retrovir | | | | 45 | | 50 | | (10 | ) | (10 | ) | 19 | | (12 | ) | (17 | ) | 16 | | (14 | ) | (6 | ) | 10 | | 1 | | – | |
| Ziagen | | | | 167 | | 173 | | (1 | ) | (3 | ) | 86 | | (6 | ) | (15 | ) | 61 | | 7 | | 15 | | 20 | | 7 | | 5 | |
| Agenerase | | | | 31 | | 44 | | (25 | ) | (30 | ) | 19 | | (33 | ) | (39 | ) | 9 | | (5 | ) | – | | 3 | | 1 | | (25 | ) |
| Herpes | | | | 669 | | 653 | | 6 | | 2 | | 325 | | 15 | | 5 | | 148 | | (3 | ) | 6 | | 196 | | (2 | ) | (4 | ) |
| Valtrex | | | | 499 | | 425 | | 23 | | 17 | | 316 | | 26 | | 15 | | 86 | | 9 | | 18 | | 97 | | 25 | | 26 | |
| Zovirax | | | | 170 | | 228 | | (26 | ) | (25 | ) | 9 | | (72 | ) | (74 | ) | 62 | | (16 | ) | (7 | ) | 99 | | (19 | ) | (22 | ) |
| Zeffix | | | | 129 | | 123 | | 11 | | 5 | | 10 | | (4 | ) | (17 | ) | 17 | | 2 | | 6 | | 102 | | 14 | | 7 | |
|
|
|
|
|
|
|
|
|
|
|
|
|
|
|
|
|
|
|
|
|
|
|
|
|
|
|
|
|
| |
| Anti-bacterials | 10 | |  | | 1,815 | | 2,210 | | (16 | ) | (18 | ) | 524 | | (41 | ) | (46 | ) | 755 | | 1 | | 8 | | 536 | | 6 | | (1 | ) |
| Augmentin | | | | 825 | | 1,191 | | (29 | ) | (31 | ) | 312 | | (51 | ) | (56 | ) | 332 | | (2 | ) | 5 | | 181 | | 11 | | 5 | |
| Zinnat/Ceftin | | | | 246 | | 243 | | – | | 1 | | 22 | | (29 | ) | (35 | ) | 134 | | 6 | | 15 | | 90 | | 4 | | (2 | ) |
| Fortum | | | | 184 | | 201 | | (9 | ) | (8 | ) | 27 | | (22 | ) | (27 | ) | 95 | | (9 | ) | (1 | ) | 62 | | (3 | ) | (9 | ) |
| Amoxil | | | | 117 | | 136 | | (11 | ) | (14 | ) | 19 | | (36 | ) | (41 | ) | 36 | | (26 | ) | (20 | ) | 62 | | 15 | | 5 | |
|
|
|
|
|
|
|
|
|
|
|
|
|
|
|
|
|
|
|
|
|
|
|
|
|
|
|
|
|
| |
| Metabolic | 6 | |  | | 1,079 | | 960 | | 20 | | 12 | | 755 | | 20 | | 10 | | 116 | | 32 | | 38 | | 208 | | 16 | | 11 | |
| Avandia/Avandamet | | | | 931 | | 809 | | 24 | | 15 | | 755 | | 20 | | 10 | | 70 | | 57 | | 67 | | 106 | | 40 | | 34 | |
|
|
|
|
|
|
|
|
|
|
|
|
|
|
|
|
|
|
|
|
|
|
|
|
|
|
|
|
|
| |
| Vaccines | 6 | |  | | 1,123 | | 1,080 | | 2 | | 4 | | 281 | | 6 | | (3 | ) | 495 | | (1 | ) | 6 | | 347 | | 4 | | 8 | |
| Hepatitis | | | | 417 | | 483 | | (13 | ) | (14 | ) | 157 | | (18 | ) | (26 | ) | 192 | | (12 | ) | (6 | ) | 68 | | 1 | | – | |
| Infanrix | | | | 336 | | 254 | | 32 | | 32 | | 124 | | 71 | | 57 | | 147 | | 17 | | 26 | | 65 | | 10 | | 12 | |
|
|
|
|
|
|
|
|
|
|
|
|
|
|
|
|
|
|
|
|
|
|
|
|
|
|
|
|
|
| |
| Oncology and emesis | 6 | |  | | 1,001 | | 977 | | 9 | | 2 | | 743 | | 10 | | – | | 163 | | 1 | | 7 | | 95 | | 13 | | 12 | |
| Zofran | | | | 774 | | 708 | | 16 | | 9 | | 575 | | 20 | | 10 | | 126 | | 1 | | 8 | | 73 | | 13 | | 11 | |
| Hycamtin | | | | 110 | | 94 | | 23 | | 17 | | 77 | | 33 | | 22 | | 25 | | – | | 4 | | 8 | | 14 | | 14 | |
|
|
|
|
|
|
|
|
|
|
|
|
|
|
|
|
|
|
|
|
|
|
|
|
|
|
|
|
|
| |
| Cardiovasular and | 4 | |  | | | | | | | | | | | | | | | | | | | | | | | | | | | |
| urogenital | | | | 771 | | 661 | | 22 | | 17 | | 495 | | 24 | | 14 | | 176 | | 10 | | 20 | | 100 | | 34 | | 28 | |
| Coreg | | | | 361 | | 306 | | 28 | | 18 | | 346 | | 28 | | 17 | | – | | – | | – | | 15 | | 33 | | 36 | |
| Levitra | | | | 37 | | – | | – | | – | | 22 | | – | | – | | 11 | | – | | – | | 4 | | – | | – | |
| Avodart | | | | 19 | | 6 | | >100 | | >100 | | 14 | | >100 | | >100 | | 5 | | – | | – | | – | | – | | – | |
|
|
|
|
|
|
|
|
|
|
|
|
|
|
|
|
|
|
|
|
|
|
|
|
|
|
|
|
|
| |
| Other | 6 | |  | | 1,171 | | 1,310 | | (8 | ) | (11 | ) | 99 | | (15 | ) | (22 | ) | 355 | | (16 | ) | (13 | ) | 717 | | (3 | ) | (8 | ) |
| Zantac | | | | 328 | | 382 | | (13 | ) | (14 | ) | 77 | | (1 | ) | (10 | ) | 94 | | (25 | ) | (19 | ) | 157 | | (10 | ) | (13 | ) |
|
|
|
|
|
|
|
|
|
|
|
|
|
|
|
|
|
|
|
|
|
|
|
|
|
|
|
|
|
| |
| | 100 | | | | 18,181 | | 17,995 | | 5 | | 1 | | 9,410 | | 5 | | (4 | ) | 5,114 | | 2 | | 9 | | 3,657 | | 8 | | 5 | |
|
|
|
|
|
|
|
|
|
|
|
|
|
|
|
|
|
|
|
|
|
|
|
|
|
|
|
|
|
| |
CER% represents turnover growth at constant exchange rates. £% represents growth at actual exchange rates.
Back to Contents
| 82 | GlaxoSmithKline Operating and financial review and prospects |
2003 Year continued
USA
The USA reported five per cent turnover growth in the year and this business represents 52 per cent of total pharmaceutical turnover.
Advair maintained its strong growth with sales of £1,235 million driving the overall respiratory growth of 21 per cent. However, this adversely affected sales of its constituent products, Flovent and Serevent, which both showed declines. Flonase indicated for the treatment of perennial rhinitis grew strongly by 22 per cent.
Sales growth of three per cent in the central nervous system products included sales of Wellbutrin up 18 per cent, reflecting the performance of the new once a day formulation Wellbutrin XL. Paxil sales declined nine per cent due to the launch of generic paroxetine in September 2003. GlaxoSmithKline's innovative new product Paxil CR, increased its share of total Paxil prescriptions (branded and generic) since the generic launch from 33 per cent to 37 per cent. Paxil CR sales in 2003 were £387 million.
Sales in the anti-virals therapeutic area grew four per cent with HIV led by a strong performance of Trizivir up 20 per cent, which partially drew sales from its constituent products. Valtrex, for herpes, grew 26 per cent driven by the FDA approval for the reduced risk of transmission of genital herpes.
Sales of Avandia increased by 20 per cent, benefiting from the launch of Avandamet in November 2002. Anti-bacterial sales declined 41 per cent as a result of generic competition that began in the third quarter 2002. Coreg sales increased 28 per cent reflecting the benefit from recent data that showed a highly significant statistical difference in survival between Coreg and metopropol in patients with heart failure.
Europe
The discussion of individual market performance in the Europe region is on a ‘turnover created basis’ rather than a ‘turnover invoiced basis’; see pages 64 to 65 for further details.
Europe region contributed 28 per cent of pharmaceutical turnover. Although overall turnover growth in the region was only two per cent, good growth was recorded in Italy and Central and Eastern Europe, but government healthcare reforms, including pricing and reimbursement restrictions, adversely affected turnover in France, Spain and Germany. Seretide, GlaxoSmithKline’s largest selling product in Europe, reported notable growth in France, Italy and the UK, although this was partly offset by expected declines in Serevent and Flixotide. Trizivir showed strong growth in all of the major markets in the region. The decline in sales of the herpes franchise was mainly as a result of generic competition for Zovirax partially offset by patients switching to the newer Valtrex product.
International
An eight per cent turnover growth in the International region reflected a mixture of good growth in the Middle East and Africa, Canada, Japan and Asia Pacific. Latin America also grew strongly as Mexico rebounded following poor economic conditions and a re-alignment of wholesaler stock levels in 2002.
Overall International growth was driven by Seretide, Seroxat/Paxil and Avandia, partly offset by declines in Zantac and Zovirax.
The Asia Pacific area grew due to the performance of Seretide and Avandia. Strong growth in a number of markets was partly offset by a decline of one per cent in the largest market, Australia, reflecting reduced sales of Zyban, Zantac and the older antibiotics.
The growth in Japan reflected strong growth of Paxil, Serevent and Valtrex partly offset by the declines of Zovirax, Zantac, and government price reductions.
The Middle East and Africa area followed the trends of most other markets with growth in Seretide, Avandia, and vaccines. In Canada growth was driven by Seretide and Avandia.
Consumer Healthcare sales
| | | | | | Growth | |
| | 2003 | | 2002 | |
| |
| | £m | | £m | | CER% | | £% | |
| |
| OTC medicines | 1,556 | | 1,586 | | 2 | | (2 | ) |
| Analgesics | 342 | | 339 | | 4 | | 1 | |
| Dermatological | 237 | | 188 | | 31 | | 26 | |
| Gastro-intestinal | 283 | | 312 | | (2 | ) | (9 | ) |
| Respiratory tract | 151 | | 142 | | 6 | | 6 | |
| Smoking control | 325 | | 378 | | (8 | ) | (14 | ) |
| Natural wellness support | 166 | | 162 | | 3 | | 2 | |
| | | | | | | | | |
| Oral care | 1,082 | | 1,052 | | 3 | | 3 | |
| | | | | | | | | |
| Nutritional healthcare | 622 | | 579 | | 9 | | 7 | |
| |
| | 3,260 | | 3,217 | | 4 | | 1 | |
| |
The growth in Consumer Healthcare sales of four per cent to £3,260 million comprised an OTC medicines sales increase of two per cent, a Nutritional Healthcare sales increase of nine per cent and Oral care sales increase of three per cent.
OTC medicines
Over-the-counter medicine sales were £1.6 billion, up two per cent. Sales of smoking control and gastro-intestinal products were down significantly in the USA primarily due to flat market conditions and to private label competition. Growth from smoking control products recently launched in Europe and sales of dermatological products acquired earlier this year helped to offset these declines.
Oral care
Oral care sales were £1.1 billion, up three per cent.
GlaxoSmithKline's Sensodyne brand continues to grow in all regions.
Nutritional healthcare
Nutritional healthcare products grew nine per cent to £0.6 billion. Lucozade Sport and Lucozade Hydroactive continued to drive growth in this category.
Back to Contents
| Operating and financial review and prospects GlaxoSmithKline | 83 |
Trading profit – statutory results
Statutory results include merger items, integration and restructuring costs, and the disposal of subsidiaries.
| | 2003
(restated) | | 2002
(restated)
| | Growth | |
| |
| |
| |
| |
| | £m | | % | | £m | | % | | CER% | | £% | |
| |
| Turnover | 21,441 | | 100.0 | | 21,212 | | 100.0 | | 5 | | 1 | |
| |
| Cost of sales | (4,544 | ) | (21.2 | ) | (4,609 | ) | (21.7 | ) | – | | (1 | ) |
| Selling, general | | | | | | | | | | | | |
| and administration | (7,597 | ) | (35.4 | ) | (8,023 | ) | (37.8 | ) | (2 | ) | (5 | ) |
| Research and | | | | | | | | | | | | |
| development | (2,791 | ) | (13.0 | ) | (2,900 | ) | (13.7 | ) | (1 | ) | (4 | ) |
| |
| Trading profit | 6,509 | | 30.4 | | 5,680 | | 26.8 | | 21 | | 15 | |
| |
Cost of sales
Cost of sales reduced as a percentage of turnover as a result of benefits arising from merger and manufacturing restructuring savings and a favourable product mix. A small pricing benefit was more than offset by an adverse exchange impact. Merger and manufacturing costs incurred of £356 million were £10 million lower than in 2002.
Selling, general and administration
Selling, general and administration (SG&A) costs declined two per cent reflecting reduced merger integration costs and operational excellence cost savings initiatives. These were partly offset by increased selling costs to support new product launches, charges relating to cost saving programmes and increased pension costs. Without the merger integration costs SG&A grew four per cent driven by selling cost increases, which accounted for a three percentage point increase. The charges relating to operational excellence and pension cost increases each individually added one percentage point, while cost savings reduced growth by one percentage point. Together these produced a reduction of 2.4 percentage points relative to 2002 for the expenses expressed as a percentage of turnover.
Research and development
R&D declined one per cent reflecting reduced merger integration costs, partly offset by increased clinical trial and in-licensing activity and the reinvestment of merger synergies. Pharmaceuticals R&D expenditure represented 14.9 per cent of pharmaceutical turnover in the year.
Trading profit
Statutory trading profit was £6,509 million with a growth of 21 per cent, stronger than turnover growth of five per cent, demonstrating an improved trading margin of 3.6 percentage points. This was principally due to lower merger integration costs, cost savings derived from merger integration, manufacturing and other initiatives partly offset by charges relating to operational excellence cost saving programmes and higher pension costs.
Profit before taxation - statutory results
The analysis and discussion below of profit before taxation relates to statutory performance.
| Other operating income/(expense) | 2003
£m | | 2002
£m | |
| |
| Royalties and other income | 75 | | 75 | |
| Other operating expense | (436 | ) | (209 | ) |
| |
| | (361 | ) | (134 | ) |
| Income from equity investments and | | | | |
| other disposals | 228 | | 23 | |
| |
| | (133 | ) | (111 | ) |
| |
Other operating income/(expense) includes litigation costs and provisions relating to legal claims on withdrawn products, product withdrawals and anti-trust matters, equity investment carrying value adjustments arising from stock market price changes, royalty income, product disposals and equity investment sales.
Other operating expenses were £133 million in the year compared with £111 million in 2002. The year on year movement reflects higher provisions in 2003 for product liability, anti-trust and other claims, partially offset by higher 2003 proceeds from product disposals and equity investment sales.
Business disposals
The profit on disposal of businesses in 2003 of £5 million reflects the final settlements regarding the disposal of Healthcare Services businesses in 1999.
Share of profits/(losses) of joint ventures and associated undertakings
The share of profits of associates arises principally from the Group’s holding in Quest Diagnostics Inc.
| Net interest payable | 2003
£m | | 2002
£m | |
| |
| Interest payable | (214 | ) | (206 | ) |
| Investment income | 61 | | 73 | |
| |
| | (153 | ) | (133 | ) |
| Share of interest payable of associate | (8 | ) | (8 | ) |
| |
| | (161 | ) | (141 | ) |
| |
Net interest payable increased compared with 2002 largely as a result of the unwinding of the discounts on provisions and long-term receivables.
Profit on ordinary activities before taxation - statutory results
Taking account of net other operating income/(expenses), the contribution from associates, business disposals and net interest payable, statutory profit before tax was £6,313 million compared with £5,524 million in 2002, an increase of 20 per cent.
Back to Contents
| 84 | GlaxoSmithKline Operating and financial review and prospects |
2003 Year continued
Trading profit – business performance
To illustrate GlaxoSmithKline performance in 2003, the analysis below of trading profit and the subsequent discussion excludes merger items, integration and restructuring costs and the disposal of businesses. Management believes that exclusion of these items provides a better reflection of the way in which the business is managed. Accordingly this information is provided as a supplement to that contained in the consolidated statement of profit and loss on pages 90 and 91 prepared in accordance with UK GAAP.
| | 2003
(restated) | | 2002
(restated) | | Growth | |
| |
| |
| |
| |
| | £m | | % | | £m | | % | | CER% | | £% | |
| |
| Turnover | 21,441 | | 100.0 | | 21,212 | | 100.0 | | 5 | | 1 | |
| |
| Cost of sales | (4,188 | ) | (19.5 | ) | (4,243 | ) | (20.0 | ) | – | | (1 | ) |
| Selling, general | | | | | | | | | | | | |
| and administration | (7,579 | ) | (35.4 | ) | (7,525 | ) | (35.5 | ) | 4 | | 1 | |
| Research and | | | | | | | | | | | | |
| development | (2,770 | ) | (12.9 | ) | (2,732 | ) | (12.9 | ) | 4 | | 1 | |
| |
| Trading profit | 6,904 | | 32.2 | | 6,712 | | 31.6 | | 8 | | 3 | |
| |
Cost of sales
Cost of sales reduced as a percentage of turnover as a result of benefits arising from merger, manufacturing restructuring savings, and a favourable product mix. A small pricing benefit was more than offset by an adverse exchange impact.
Selling, general and administration
Selling, general and administration (SG&A) costs grew four per cent reflecting increased selling costs to support new product launches, charges relating to operational excellence cost saving programmes and increased pension costs, partly offset by cost saving initiatives. These cost saving initiatives were relatively small restructuring activities in 2002 and 2003. It is estimated that without the operational excellence charges SG&A would have grown three per cent, driven principally by selling cost increases. Pension cost increases added one percentage point, but these were offset by cost saving initiatives. Together these produced a reduction of 0.2 percentage points expressed as a percentage of turnover.
Research and development
Research and development (R&D) increased four per cent reflecting increased clinical trial and in-licensing activity and the reinvestment of merger synergies. Pharmaceuticals R&D expenditure represented 14.8 per cent of pharmaceutical turnover in the year.
Trading profit
Business performance trading profit was £6,904 million with a growth of eight per cent, stronger than turnover growth of five per cent, demonstrating an improved trading margin of 0.8 points to 32.2 per cent compared with 2002. This was principally due to cost savings derived from merger integration, manufacturing and other initiatives, partly offset by charges relating to operational excellence cost saving programmes and higher pension costs.
The focus of operational excellence is on value creation and the elimination of waste and bureaucracy. This programme has become an integral part of the way the business is managed and so any charges are booked to business performance.
Profit before taxation - business performance
The analysis and discussion below of profit before taxation relates to business performance.
| | 2003 | | 2002 | |
| Other operating income/(expense) | £m | | £m | |
| |
| Royalties and other income | 75 | | 75 | |
| Other operating expense | (436 | ) | (209 | ) |
| |
| | (361 | ) | (134 | ) |
| Income from equity investments and | | | | |
| other disposals | 228 | | 23 | |
| |
| | (133 | ) | (111 | ) |
| |
Other operating income/(expense) includes litigation costs and provisions relating to legal claims on withdrawn products, product withdrawals and anti-trust matters, equity investment carrying value adjustments arising from stock market price changes, royalty income, product disposals and equity investment sales.
Other operating expenses were £133 million in the year compared with £111 million in 2002. The year-on-year movement reflects higher provisions in 2003 for product liability, anti-trust and other claims, partially offset by higher 2003 proceeds from product disposals and equity investment sales.
Share of profits/(losses) of joint ventures and associated undertakings
The share of profits of associates arises principally from the Group’s holding in Quest Diagnostics Inc.
| | 2003 | | 2002 | |
| Net interest payable | £m | | £m | |
| |
| Interest payable | (214 | ) | (206 | ) |
| Investment income | 61 | | 73 | |
| |
| | (153 | ) | (133 | ) |
| Share of interest payable of associate | (8 | ) | (8 | ) |
| |
| | (161 | ) | (141 | ) |
| |
Net interest payable increased compared with 2002 largely as a result of the unwinding of the discounts on provisions and long-term receivables.
Profit on ordinary activities before taxation - business performance
Taking account of net other operating income/(expense), the contribution from associates, business disposals and net interest payable, business performance profit before tax was £6,703 million, compared with £6,535 million in 2002, an increase of eight per cent.
Back to Contents
| Operating and financial review and prospects GlaxoSmithKline | 85 |
Merger items, restructuring costs and disposal of businesses
Merger and manufacturing restructuring
GlaxoSmithKline has made good progress with its merger and manufacturing restructuring plans. The merger programmes were substantially complete at the end of 2003. Combined these programmes have now produced annual savings which exceeded the published target of £1.8 billion.
Costs of £369 million were incurred in the year in respect of merger and manufacturing restructuring. After tax relief of £91 million, the net charge was £278 million. The costs in 2003 include severance, asset write-downs, professional fees and site closure.
Block Drug Company, Inc.
GlaxoSmithKline acquired Block Drug in January 2001. The costs incurred in integrating this business were £26 million in 2003 including redundancies, asset write-downs and site closures.
Disposal of businesses
The profit on disposal of businesses in 2003 of £5 million reflects the final settlements regarding the disposal of the Healthcare Services businesses in 1999.
| Taxation | 2003
(restated)
£m | | 2002
(restated)
£m | |
|
|
|
| |
| | | | | |
| Business performance | (1,838 | ) | (1,763 | ) |
| Merger, restructuring and disposal | | | | |
| of subsidiaries | 109 | | 299 | |
|
|
|
| |
| Total | (1,729 | ) | (1,464 | ) |
|
|
| |
The integrated nature of the Group’s worldwide operations, involving significant investment in research and strategic manufacture at a limited number of locations, with consequential cross-border supply routes into numerous end-markets, gives rise to complexity and delay in negotiations with revenue authorities as to the profits on which individual Group companies are liable to tax. Disagreements with, and between, revenue authorities as to intra-Group transactions, in particular the price at which goods should be transferred between Group companies in different tax jurisdictions, can produce conflicting claims from revenue authorities as to the profits that fall to be taxed in individual territories. Resolution of such issues is a continuing fact of life for GlaxoSmithKline. The Group has open issues with the revenue authorities in the USA, UK, Japan and Canada, but by far the largest relates to Glaxo heritage products in the USA.
In the USA, for a number of years, GlaxoSmithKline has had significant open issues relating to transfer pricing. GlaxoSmithKline has attempted to settle the dispute, first through direct discussion with the US Internal Revenue Service (IRS) and subsequently through discussions between the USA and UK authorities under the terms of the double tax convention between the two countries. GlaxoSmithKline understands that the views of the two tax authorities were so different that they were unable to reach agreement, and discussions were terminated in July 2003.
The Group has now received a claim for additional taxes that the IRS asserts legacy company Glaxo Wellcome owes for the years 1989 to 1996. This statutory notice of deficiency for $2.7 billion (£1.5 billion) in tax principally relates to the allocation of profits for Glaxo heritage products between the USA and other countries. To the extent that the IRS were successful in its claim, interest would be payable. GlaxoSmithKline estimates the interest on the full claim to date would be approximately $2.5 billion (£1.4 billion), net of federal tax relief. As similar tax issues remain open for 1997 to date, GlaxoSmithKline expects to receive further claims by the IRS for these years.
Since GlaxoSmithKline has exhausted all administrative remedies open to it, the Group plans to contest this claim for additional taxes by filing a petition in the US Tax Court, where a trial is not expected until sometime in 2005 or 2006.
GlaxoSmithKline continues to believe that the profits reported by the US subsidiaries for the period 1989 to date, on which it has paid taxes in the USA, are more than sufficient to reflect the activities of its US operations.
GlaxoSmithKline uses the best advice in determining its transfer pricing methodology and in seeking to manage transfer pricing issues to a satisfactory conclusion and, on the basis of external professional advice, continues to believe that it has made adequate provision for the liabilities likely to arise from open assessments. However, there continues to be a wide difference of views between the Group and the IRS. The ultimate liability for such matters may vary significantly from amounts provided and is dependent upon the outcome of litigation proceedings and negotiations with the relevant tax authorities.
The credit for taxation on merger and restructuring items amounting to £109 million reflects the actual tax rate applicable to the transactions in the territories in which they arise.
For the latest position on taxation, see ‘Taxation’ in the 2004 Year Operating and financial review and prospects on page 68.
Back to Contents
| 86 GlaxoSmithKline Operating and financial review and prospects |
2003 Year continued
| Earnings | | 2003 | | | 2002 | | | | Growth | |
| | | |
|
| (restated) | (restated) | CER% | £% |
|
|
|
|
|
|
|
|
|
|
| | | | | | | | | | | |
| Statutory earnings (£m) | | 4,478 | | | 3,930 | | 19 | | 14 | |
| Basic earnings per share | | 77.1 | p | | 66.5 | p | 22 | | 16 | |
| Basic earnings per ADS | | $2.53 | | | $2.00 | | 23 | | 27 | |
|
|
|
|
|
|
|
|
|
| |
| | | | | | | | | | | |
| Adjusted earnings (£m) | 4,759 | | | 4,642 | | 7 | | 5 | |
| Adjusted earnings per share | | 82.0 | p | | 78.5 | p | 10 | | 4 | |
| Adjusted earnings per ADS | | $2.69 | | | $2.36 | | 10 | | 14 | |
|
|
|
|
|
|
|
|
|
| |
| Weighted average number | | | | | | | | | | |
| of shares (millions) | | 5,806 | | | 5,912 | | | | | |
|
|
|
|
|
|
|
|
|
| |
Adjusted earnings and adjusted earnings per share are presented above in order to illustrate business performance which is the primary measure used by management. Adjusted earnings increased by seven per cent. Adjusted earnings per share increased by 10 per cent reflecting the reduction in the weighted average number of shares resulting from the Group’s share buy-back programme. The interest cost of this programme also impacts the Group’s earnings.
Adjusted earnings per share increased four per cent in sterling terms, compared with 10 per cent in CER terms. The adverse currency impact on EPS of six per cent in the year reflected the significant weakening of the US dollar relative to 2002 and compares with a four per cent adverse currency impact on turnover. This difference principally arises from a different mix of currencies in profits compared with turnover.
Taken together with other expenses, taxation and business disposals this resulted in a basic EPS of 77.1 pence compared with 66.5 pence in 2002 and a diluted EPS of 76.9 pence compared with 66.3 pence in 2002. Merger and manufacturing restructuring costs were lower in 2003 than in 2002 and as a result, the sterling based growth in basic EPS of 16 per cent was significantly higher than the CER based growth in adjusted EPS despite the overall negative impact of currencies in 2003.
Dividend
The Board has declared a fourth interim dividend of 14 pence per share making a total for the year of 41 pence per share. This compares with a total dividend of 40 pence per share for 2002.
In 2004, GlaxoSmithKline expects a similar increase in the total dividend as has been declared in 2003. The allocation of the quarterly dividends will be rebalanced in 2004. GlaxoSmithKline intends to increase the first three interim dividends from nine pence to 10 pence, with the remainder of the total dividend for the year being allocated to the fourth quarter dividend.
Back to Contents
GlaxoSmithKline 87
Financial statements
This section comprises the Directors’ statements of responsibility, the Independent Auditors’ report on the Financial statements, the Financial statements consisting of the principal Financial statements and supporting notes.
| 88 | Directors’ statements of responsibility |
| 89 | Report on Independent Registered Public Accounting Firm |
| | |
| | Financial statements |
90 | Consolidated statement of profit and loss |
90 | Consolidated statement of total recognised gains and losses |
92 | Consolidated statement of cash flow |
94 | Consolidated balance sheet |
94 | Reconciliation of movements in consolidated equity shareholders’ |
| funds |
95 | Company balance sheet |
| | |
| | Notes to the financial statements |
96 | 1. Presentation of the Financial statements |
97 | 2. Accounting policies |
99 | 3. New accounting policies and future requirements |
99 | 4. Exchange rates |
100 | 5. Merger of Glaxo Wellcome and SmithKline Beecham |
100 | 6. Segment information |
102 | 7. Merger items, restructuring costs and divested businesses |
103 | 8. Other operating income/(expense) |
104 | 9. Operating profit |
104 | 10. Joint ventures and associated undertakings |
105 | 11. Net interest payable |
105 | 12. Taxation |
107 | 13. Earnings per share |
107 | 14. Dividends |
108 | 15. Goodwill |
108 | 16. Other intangible assets |
109 | 17. Tangible fixed assets |
109 | 18. Fixed asset investments |
110 | 19. Equity investments |
110 | 20. Stocks |
110 | 21. Debtors |
110 | 22. Other creditors |
111 | 23. Provisions for liabilities and charges |
111 | 24. Contingent liabilities |
112 | 25. Net debt |
113 | 26. Commitments |
114 | 27. Share capital and share premium account |
114 | 28. Non-equity minority interests |
115 | 29. Reserves |
116 | 30. Legal proceedings |
122 | 31. Post balance sheet event |
122 | 32. Related party transactions |
123 | 33. Acquisitions and disposals |
125 | 34. Financial instruments and related disclosures |
129 | 35. Employee costs |
136 | 36. Employee share schemes |
139 | 37. Reconciliation to US accounting principles |
150 | 38. Principal Group companies |
Back to Contents
Directors’ statements of responsibility
Directors’ statement of responsibility in relation to the Financial statements
The Directors are:
| • | responsible for ensuring the maintenance of proper accounting records, which disclose with reasonable accuracy the financial position of the Group at any time and from which financial statements can be prepared to comply with the Companies Act 1985 |
| | |
| • | required by law to prepare financial statements for each financial period which give a true and fair view of the state of affairs of the company and the Group as at the end of the financial period and of the profit or loss for that period |
| | |
| • | responsible also for ensuring the operation of systems of internal control and for taking reasonable steps to safeguard the assets of the Group and for preventing and detecting fraud and other irregularities. |
The Financial statements for the year ended 31st December 2004, comprising principal statements and supporting notes, are set out in ‘Financial statements’ on pages 90 to 152 of this report.
The Directors confirm that suitable accounting policies have been consistently applied in the preparation of the Financial statements, supported by reasonable and prudent judgements and estimates as necessary; applicable accounting standards have been followed, and the Financial statements have been prepared on the going concern basis.
The responsibilities of the auditors in relation to the Financial statements are set out in the Independent Auditors’ report (page 89 opposite).
The Financial statements for the year ended 31st December 2004 are included in the Annual Report 2004, which is published in hard-copy printed form and made available on the website. The Directors are responsible for the maintenance and integrity of the Annual Report on the website in accordance with UK legislation governing the preparation and dissemination of financial statements. Access to the website is available from outside the UK, where comparable legislation may be different.
Directors’ remuneration
The Remuneration Report (pages 43 to 58 of this report) sets out the remuneration policies operated by GlaxoSmithKline and disclosures on Directors’ remuneration and other disclosable information relating to Directors and officers and their interests. It has been prepared in accordance with the Companies Act 1985 and complies with Section B of the Combined Code on Corporate Governance.
Going concern basis
After making enquiries, the Directors have a reasonable expectation that the Group and company have adequate resources to continue in operational existence for the foreseeable future. For this reason, they continue to adopt the going concern basis in preparing the Financial statements.
Internal control
The Board, through the Audit Committee, has reviewed the assessment of risks and the internal control framework that operates in GlaxoSmithKline and has considered the effectiveness of the system of internal control in operation in the Group for the year covered by this report and up to the date of its approval by the Board of Directors.
The Combined Code
The Board considers that GlaxoSmithKline plc applies the principles of the Combined Code on Corporate Governance of the Financial Reporting Council, as described under ‘Corporate governance’ (pages 33 to 42), and has complied with its provisions except as described on page 41.
As required by the Listing Rules of the Financial Services Authority, the auditors have considered the Directors’ statement of compliance in relation to those points of the Combined Code which are specified for their review.
Annual Report
The Annual Report for the year ended 31st December 2004, comprising the Report of the Directors, the Remuneration Report, the Financial statements and additional information for investors, has been approved by the Board of Directors and signed on its behalf by
Sir Christopher Gent
Chairman
2nd March 2005
Back to Contents
Report of Independent Registered Public Accounting Firm
To Board of Directors and Shareholders of GlaxoSmithKline plc:
In our opinion, the accompanying consolidated balance sheets and the related consolidated statements of profit and loss, of total recognised gains and losses and of cash flows present fairly, in all material respects, the financial position of GlaxoSmithKline plc and its subsidiaries at 31st December 2004 and 31st December 2003, and the results of their operations and their cash flows for each of the three years in the period ended 31st December 2004 in conformity with accounting principles generally accepted in the United Kingdom. These financial statements are the responsibility of the Group’s management. Our responsibility is to express an opinion on these financial statements based on our audits. We conducted our audits of these statements in accordance with the standards of the Public Company Accounting Oversight Board (United States). Those standards require that we plan and perform the audit to obtain reasonable assurance about whether the financial statements are free of material misstatement. An audit includes examining, on a test basis, evidence supporting the amounts and disclosures in the financial statements, assessing the accounting principles used and significant estimates made by management, and evaluating the overall financial statement presentation. We believe that our audits provide a reasonable basis for our opinion.
As discussed in Note 3 to the consolidated financial statements, the Group changed its method of accounting for employee share schemes and ESOP Trusts in conformity with Urgent Issues Task Force Abstract 17 (revised 2003), ‘Employee Share Schemes’ and Urgent Issues Task Force Abstract 38, ‘Accounting for ESOP Trusts’, which were adopted as at 1st January 2002.
Accounting principles generally accepted in the United Kingdom vary in certain significant respects from accounting principles generally accepted in the United States of America. Information relating to the nature and effect of such differences is presented in Note 37 to the consolidated financial statements.
PricewaterhouseCoopers LLP
London, England
2 March 2005, except for the Cidra, Puerto Rico manufacturing site matter discussed in Note 30, for which the date is 8 March 2005.
Back to Contents
| Consolidated statement of profit and loss | | | | |
| for the year ended 31st December 2004 | | | | |
| | | | | |
| | | | 2004 | |
| | | |
| |
| | | | Statutory | |
| | Notes | | £m | |
|
|
|
|
|
| | | | | |
| Turnover | 6 | | 20,359 | |
| Cost of sales | | | (4,309 | ) |
|
|
|
|
|
| Gross profit | | | 16,050 | |
| Selling, general and administrative expenditure | | | (7,061 | ) |
| Research and development expenditure | | | (2,839 | ) |
|
|
|
|
|
| | | | | |
| Trading profit | | | 6,150 | |
| Other operating income/(expense) | 8 | | (60 | ) |
|
|
|
|
|
| Operating profit | 9 | | 6,090 | |
| Share of profits/(losses) of joint ventures and associated undertakings | 10 | | 95 | |
| Profit on disposal of interest in associates | 33 | | 138 | |
| Product divestments | 7 | | – | |
| (Loss)/profit on disposal of businesses | | | (1 | ) |
|
|
|
|
|
| Profit before interest | | | 6,322 | |
| Net interest payable | 11 | | (203 | ) |
|
|
|
|
|
| | | | | |
| Profit on ordinary activities before taxation | | | 6,119 | |
| Taxation | 7,12 | | (1,701 | ) |
|
|
|
|
|
| Profit on ordinary activities after taxation | | | 4,418 | |
| Equity minority interests | | | (114 | ) |
| Preference share dividends | | | (2 | ) |
|
|
|
|
|
| Earnings (Profit attributable to shareholders) | 13 | | 4,302 | |
|
|
|
|
|
| | | | | |
| | | | | |
| Basic earnings per share | 13 | | 75.0 | p |
| Adjusted earnings per share | 13 | | 75.0 | p |
| Diluted earnings per share | 13 | | 74.8 | p |
|
|
|
|
|
| | | | | |
| Profit attributable to shareholders | | | 4,302 | |
| Dividends | 14 | | (2,402 | ) |
|
|
|
|
|
| Retained profit | | | 1,900 | |
|
|
|
|
|
Consolidated statement of total recognised gains and losses
for the year ended 31st December 2004
| | 2004 | |
| | £m | |
|
|
|
| | | |
| Profit attributable to shareholders | 4,302 | |
| Exchange movements on overseas net assets | (54 | ) |
| Unrealised (loss)/profit on disposal of intellectual property | (1 | ) |
| Tax on exchange movements and unrealised gains | (73 | ) |
|
|
|
| Total recognised gains and losses relating to the year | 4,174 | |
| Prior year adjustment – implementation of UITF 17 (revised) and UITF 38 | 368 | |
|
|
|
| Total recognised gains and losses | 4,542 | |
|
|
|
Back to Contents
| | Consolidated statement of profit and loss GlaxoSmithKline | 91 |
| | | |
| | | |
| | | |
| | | |
| | | | | | 2003 | | | | | | | | | | 2002 | |
| |
| | | | | |
| |
| | | | Merger, | | | | | | | | | | Merger, | | | |
| | Business | | restructuring | | | | | | | | Business | | restructuring | | | |
| | performance | | and disposal | | Statutory | | | | | | performance | | and disposal | | Statutory | |
| | (restated) | | of subsidiaries | | (restated) | | | | | | (restated) | | of subsidiaries | | (restated) | |
| | £m | | £m | | £m | | | | | | £m | | £m | | £m | |
|
| | 21,441 | | – | | 21,441 | | | | | | 21,212 | | – | | 21,212 | |
| | (4,188 | ) | (356 | ) | (4,544 | ) | | | | | (4,243 | ) | (366 | ) | (4,609 | ) |
|
| | 17,253 | | (356 | ) | 16,897 | | | | | | 16,969 | | (366 | ) | 16,603 | |
| | (7,579 | ) | (18 | ) | (7,597 | ) | | | | | (7,525 | ) | (498 | ) | (8,023 | ) |
| | (2,770 | ) | (21 | ) | (2,791 | ) | | | | | (2,732 | ) | (168 | ) | (2,900 | ) |
|
| | 6,904 | | (395 | ) | 6,509 | | | | | | 6,712 | | (1,032 | ) | 5,680 | |
| | (133 | ) | – | | (133 | ) | | | | | (111 | ) | – | | (111 | ) |
|
| | 6,771 | | (395 | ) | 6,376 | | | | | | 6,601 | | (1,032 | ) | 5,569 | |
| | 93 | | – | | 93 | | | | | | 75 | | – | | 75 | |
| | – | | – | | – | | | | | | – | | – | | – | |
| | – | | – | | – | | | | | | – | | 11 | | 11 | |
| | – | | 5 | | 5 | | | | | | – | | 10 | | 10 | |
|
| | 6,864 | | (390 | ) | 6,474 | | | | | | 6,676 | | (1,011 | ) | 5,665 | |
| | (161 | ) | – | | (161 | ) | | | | | (141 | ) | – | | (141 | ) |
|
| | 6,703 | | (390 | ) | 6,313 | | | | | | 6,535 | | (1,011 | ) | 5,524 | |
| | (1,838 | ) | 109 | | (1,729 | ) | | | | | (1,763 | ) | 299 | | (1,464 | ) |
|
| | 4,865 | | (281 | ) | 4,584 | | | | | | 4,772 | | (712 | ) | 4,060 | |
| | (94 | ) | – | | (94 | ) | | | | | (110 | ) | – | | (110 | ) |
| | (12 | ) | – | | (12 | ) | | | | | (20 | ) | – | | (20 | ) |
|
| | 4,759 | | (281 | ) | 4,478 | | | | | | 4,642 | | (712 | ) | 3,930 | |
|
| | | | | | | | | | | | | | | | | |
| | | | | | | | | | | | | | | | | |
| | – | | | | 77.1 | p | | | | | – | | | | 66.5 | p |
| | 82.0 | p | | | – | | | | | | 78.6 | p | | | – | |
| | – | | | | 76.9 | p | | | | | – | | | | 66.3 | p |
|
| | | | | | | | | | | | | | | | | |
| | | | | | 4,478 | | | | | | | | | | 3,930 | |
| | | | | | (2,374 | ) | | | | | | | | | (2,346 | ) |
|
| | | | | | 2,104 | | | | | | | | | | 1,584 | |
|
| | | | | | | | | | | | | | | | | |
| | | | | | | | | | | | | | | | | |
| | | | | | | | | | | | | | | | | |
| | | | | | | | | | | | | | | | | |
| | | | | | | | | | | | | | | | | |
| | | | | | | | | | | | | | | | | |
| | | | | | | | | | | | | | | | | |
| | | | | | | | | | | | | | | | | |
| | | | | | 2003 | | | | | | | | | | 2002 | |
| | | | | | (restated) | | | | | | | | | | (restated) | |
| | | | | | £m | | | | | | | | | | £m | |
|
| | | | | | 4,478 | | | | | | | | | | 3,930 | |
| | | | | | 113 | | | | | | | | | | (82 | ) |
| | | | | | 7 | | | | | | | | | | 7 | |
| | | | | | (92 | ) | | | | | | | | | (65 | ) |
|
| | | | | | 4,506 | | | | | | | | | | 3,790 | |
|
Back to Contents
| Consolidated statement of cash flow | | | | | | | |
| for the year ended 31st December 2004 | | | | | | | |
| | | | | | | | |
| | | | | | | | |
| | | | | | | | |
| Reconciliation of operating profit to operating cash flows | | | | 2003 | | 2002 | |
| | | 2004 | | (restated) | | (restated) | |
| | Notes | £m | | £m | | £m | |
|
|
|
|
|
|
| |
| Operating profit | | 6,090 | | 6,376 | | 5,569 | |
| Depreciation | | 785 | | 773 | | 764 | |
| Impairment and assets written off | | 88 | | 250 | | 288 | |
| Amortisation of goodwill and intangible fixed assets | | 106 | | 87 | | 72 | |
| Loss on sale of tangible fixed assets | | 2 | | – | | 26 | |
| Profit on sale of equity investments | | (33 | ) | (89 | ) | (46 | ) |
| Increase in stocks | | (33 | ) | (76 | ) | (2 | ) |
| Increase in trade and other debtors | | (447 | ) | (552 | ) | (72 | ) |
| Increase/(decrease) in trade and other creditors | | 163 | | (69 | ) | 459 | |
| (Decrease)/increase in provisions | | (176 | ) | 260 | | 256 | |
| Other | | (18 | ) | 45 | | (59 | ) |
|
|
|
|
|
|
| |
| Net cash inflow from operating activities | | 6,527 | | 7,005 | | 7,255 | |
|
|
|
|
|
|
| |
| Cash flow statement | | | | | | | |
|
|
|
|
|
|
| |
| Net cash inflow from operating activities | | 6,527 | | 7,005 | | 7,255 | |
| Dividends from joint ventures and associated undertakings | | 11 | | 1 | | 2 | |
| Returns on investment and servicing of finance | | (252 | ) | (231 | ) | (237 | ) |
| Taxation paid | | (1,583 | ) | (1,917 | ) | (1,633 | ) |
| Capital expenditure and financial investment | | (1,035 | ) | (954 | ) | (1,178 | ) |
| Acquisitions and disposals | 33 | (69 | ) | (12 | ) | (20 | ) |
| Equity dividends paid | | (2,475 | ) | (2,333 | ) | (2,327 | ) |
|
|
|
|
|
|
| |
| Net cash inflow before management of liquid resources and financing | | 1,124 | | 1,559 | | 1,862 | |
| Management of liquid resources | | (413 | ) | (1,336 | ) | 52 | |
| Financing | | (454 | ) | (250 | ) | (1,509 | ) |
|
|
|
|
|
|
| |
| Increase/(decrease) in cash in the year | | 257 | | (27 | ) | 405 | |
|
|
|
|
|
|
| |
| Reconciliation of net cash flow to movement in net debt | | | | | | | |
|
|
|
|
|
|
| |
| Net debt at beginning of year | | (1,648 | ) | (2,335 | ) | (2,101 | ) |
| Increase/(decrease) in cash in the year | | 257 | | (27 | ) | 405 | |
| Cash outflow/(inflow) from management of liquid resources | | 413 | | 1,336 | | (52 | ) |
| Net increase in long-term loans | | (1,350 | ) | (1,023 | ) | (1,005 | ) |
| Net repayment of short-term loans | | 407 | | 442 | | 542 | |
| Net repayment of obligations under finance leases | | 22 | | – | | 1 | |
| Net non-cash funds of subsidiary undertakings acquired | | – | | – | | (4 | ) |
| Exchange adjustments | | 24 | | (37 | ) | (121 | ) |
| Other non-cash movements | | (109 | ) | (4 | ) | – | |
|
|
|
|
|
|
| |
| Movement in net debt | | (336 | ) | 687 | | (234 | |
|
|
|
|
|
|
| |
| Net debt at end of year | 25 | (1,984 | ) | (1,648 | ) | (2,335 | ) |
|
|
|
|
|
|
| |
Back to Contents
| | Consolidated statement of cash flow GlaxoSmithKline | 93 |
| | | |
| | | |
| | | |
| | | |
| Analysis of cash flows | | | | | | | 2003 | | 2002 | |
| | | | | | 2004 | | (restated) | | (restated) | |
| | | | Notes | | £m | | £m | | £m | |
|
|
|
|
|
|
|
|
|
| |
| Returns on investment and servicing of finance | | | | | | | | | | |
| Interest received | | | | | 95 | | 65 | | 83 | |
| Interest paid | | | | | (272 | ) | (197 | ) | (215 | ) |
| Dividends paid to minority shareholders | | | | | (73 | ) | (84 | ) | (85 | ) |
| Dividends paid on preference shares | | | | | (2 | ) | (15 | ) | (20 | ) |
|
|
|
|
|
|
|
|
|
| |
| | | | | | (252 | ) | (231 | ) | (237 | ) |
|
|
|
|
|
|
|
|
|
| |
| Capital expenditure and financial investment | | | | | | | | | | |
| Purchase of tangible fixed assets | | | | | (865 | ) | (869 | ) | (1,044 | ) |
| Sale of tangible fixed assets | | | | | 53 | | 46 | | 59 | |
| Purchase of intangible assets | | | | | (178 | ) | (193 | ) | (182 | ) |
| Product divestments | | | | | – | | – | | (1 | ) |
| Purchase of equity investments | | | | | (103 | ) | (63 | ) | (75 | ) |
| Sale of equity investments | | | | | 58 | | 125 | | 65 | |
|
|
|
|
|
|
|
|
|
| |
| | | | | | (1,035 | ) | (954 | ) | (1,178 | ) |
|
|
|
|
|
|
|
|
|
| |
| Acquisitions and disposals | | | 33 | | | | | | | |
| Purchase of businesses | | | | | (297 | ) | (12 | ) | (21 | ) |
| Disposal of businesses | | | | | 42 | | 3 | | 6 | |
| Investment in joint ventures and associated undertakings | | | | | (2 | ) | (3 | ) | (5 | ) |
| Disposal of interests in associates | | | | | 188 | | – | | – | |
|
|
|
|
|
|
|
|
|
| |
| | | | | | (69 | ) | (12 | ) | (20 | ) |
|
|
|
|
|
|
|
|
|
| |
| Financing | | | | | | | | | | |
| Issue of share capital | | | 27 | | 42 | | 41 | | 56 | |
| Redemption of preference shares issued by a subsidiary | | | | | (489 | ) | – | | – | |
| Share capital purchased for cancellation | | | | | (201 | ) | (980 | ) | (2,220 | ) |
| Share capital purchased and held as Treasury shares | | | | | (799 | ) | – | | – | |
| Proceeds from own shares for employee share options | | | | | 23 | | 26 | | 58 | |
| Other financing cash flows | | | | | 49 | | 82 | | 135 | |
| Increase in long-term loans | | | | | 1,365 | | 1,046 | | 1,094 | |
| Repayment of long-term loans | | | | | (15 | ) | (23 | ) | (89 | ) |
| Net repayment of short-term loans | | | | | (407 | ) | (442 | ) | (542 | ) |
| Net repayment of obligations under finance leases | | | | | (22 | ) | – | | (1 | ) |
|
|
|
|
|
|
|
|
|
| |
| | | | | | (454 | ) | (250 | ) | (1,509 | ) |
|
|
|
|
|
|
|
|
|
| |
| | | | | | | | | | | |
| | | | | | | | | | | |
| Analysis of changes in net debt | At 1.1.04 | | Exchange | | Other | | Cash flow | | At 31.12.04 | |
| | £m | | £m | | £m | | £m | | £m | |
|
|
|
|
|
|
|
|
|
| |
| | | | | | | | | | | |
| Cash at bank | 962 | | (21 | ) | – | | 220 | | 1,161 | |
| Overdrafts | (155 | ) | 6 | | – | | 37 | | (112 | ) |
|
|
|
|
|
|
|
|
|
| |
| | 807 | | (15 | ) | – | | 257 | | 1,049 | |
|
|
|
|
|
|
|
|
|
| |
| Debt due within one year: | | | | | | | | | | |
| Commercial paper | (836 | ) | – | | (1 | ) | 7 | | (830 | ) |
| Eurobonds and Medium-Term Notes | (383 | ) | 9 | | (552 | ) | 374 | | (552 | ) |
| Other | (78 | ) | (3 | ) | (42 | ) | 35 | | (88 | ) |
|
|
|
|
|
|
|
|
|
| |
| | (1,297 | ) | 6 | | (595 | ) | 416 | | (1,470 | ) |
|
|
|
|
|
|
|
|
|
| |
| Debt due after one year: | | | | | | | | | | |
| Eurobonds, Medium-Term Notes and private financing | (3,617 | ) | 116 | | 548 | | (1,349 | ) | (4,302 | ) |
| Other | (34 | ) | 5 | | (62 | ) | 12 | | (79 | ) |
|
|
|
|
|
|
|
|
|
| |
| | (3,651 | ) | 121 | | 486 | | (1,337 | ) | (4,381 | ) |
|
|
|
|
|
|
|
|
|
| |
| Management of liquid resources: | | | | | | | | | | |
| Liquid investments | 2,493 | | (88 | ) | – | | 413 | | 2,818 | |
|
|
|
|
|
|
|
|
|
| |
| Net debt | (1,648 | ) | 24 | | (109 | ) | (251 | ) | (1,984 | ) |
|
|
|
|
|
|
|
|
|
| |
For further information on significant changes in net debt see Note 25 ‘Net debt’.
Back to Contents
| Consolidated balance sheet | | | | | | |
| at 31st December 2004 | | | | | | |
| | | | | | | |
| | | | | | | |
| | | | | | 2003 | |
| 2004 | (restated) |
| Notes | £m | £m |
|
|
|
|
|
| |
| Goodwill | 15 | | 139 | | 143 | |
| Other intangible assets | 16 | | 2,003 | | 1,697 | |
|
|
|
|
|
| |
| | | | 2,142 | | 1,840 | |
| Tangible assets | 17 | | 6,471 | | 6,441 | |
| Investments | 18 | | 332 | | 294 | |
|
|
|
|
|
| |
| Fixed assets | | | 8,945 | | 8,575 | |
|
|
|
|
|
| |
| | | | | | | |
| Equity investments | 19 | | 153 | | 164 | |
| Stocks | 20 | | 2,192 | | 2,109 | |
| Debtors | 21 | | 7,309 | | 6,897 | |
| Liquid investments | 25 | | 2,818 | | 2,493 | |
| Cash at bank | 25 | | 1,161 | | 962 | |
|
|
|
|
|
| |
| Current assets | | | 13,633 | | 12,625 | |
|
|
|
|
|
| |
| Loans and overdrafts | 25 | | (1,582 | ) | (1,452 | ) |
| Other creditors | 22 | | (7,140 | ) | (7,019 | ) |
|
|
|
|
|
| |
| Creditors: amounts due within one year | | | (8,722 | ) | (8,471 | ) |
|
|
|
|
|
| |
| Net current assets | | | 4,911 | | 4,154 | |
|
|
|
|
|
| |
| Total assets less current liabilities | | | 13,856 | | 12,729 | |
|
|
|
|
|
| |
| Loans | 25 | | (4,381 | ) | (3,651 | ) |
| Other creditors | 22 | | (244 | ) | (232 | ) |
|
|
|
|
|
| |
| Creditors: amounts due after one year | | | (4,625 | ) | (3,883 | ) |
|
|
|
|
|
| |
| Provisions for liabilities and charges | 23 | | (3,029 | ) | (3,042 | ) |
|
|
|
|
|
| |
| Net assets | | | 6,202 | | 5,804 | |
|
|
|
|
|
| |
| Capital and reserves | | | | | | |
| Called up share capital | 27 | | 1,484 | | 1,487 | |
| Share premium account | 27 | | 304 | | 264 | |
| Other reserves | 29 | | (644 | ) | (804 | ) |
| Profit and loss account | 29 | | 4,781 | | 4,112 | |
|
|
|
|
|
| |
| Equity shareholders’ funds | | | 5,925 | | 5,059 | |
|
|
|
|
|
| |
| | | | | | | |
| Non-equity minority interests | 28 | | – | | 503 | |
| Equity minority interests | | | 277 | | 242 | |
|
|
|
|
|
| |
| Capital employed | | | 6,202 | | 5,804 | |
|
|
|
|
|
| |
Approved by the Board on 2nd March 2005
Sir Christopher Gent, Chairman
Reconciliation of movements in consolidated equity shareholders’ funds
for the year ended 31st December 2004
| | | | | | 2003 | |
| 2004 | (restated) |
| Notes | £m | £m |
|
|
|
|
|
| |
| Equity shareholders’ funds as previously reported | | | 7,720 | | 6,581 | |
| Prior period adjustment – implementation of UITF 17 (revised) and UITF 38 | | | (2,661 | ) | (2,741 | ) |
|
|
|
|
|
| |
| Equity shareholders’ funds at beginning of year as restated | | | 5,059 | | 3,840 | |
| Total recognised gains and losses for the period | | | 4,174 | | 4,506 | |
| Dividends | 14 | | (2,402 | ) | (2,374 | ) |
| Ordinary shares issued | | | 42 | | 41 | |
| Ordinary shares purchased and cancelled | | | (201 | ) | (980 | ) |
| Ordinary shares purchased and held as Treasury shares | | | (799 | ) | – | |
| Proceeds from own shares for employee share options | | | 23 | | 26 | |
| Employee share schemes | | | 3 | | 7 | |
| Goodwill written back | | | 20 | | – | |
| Exchange movements on goodwill written off to reserves | | | 6 | | (7 | ) |
|
|
|
|
|
| |
| Equity shareholders’ funds at end of year | | | 5,925 | | 5,059 | |
|
|
|
|
|
| |
Back to Contents
| Company balance sheet | | | | | | |
| at 31st December 2004 | | | | | | |
| | | | | | | |
| | | | | | | |
| | | | 2004 | | 2003 | |
| Notes | £m | £m |
|
|
|
|
|
| |
| Shares in subsidiary companies – at cost | 38 | | 17,930 | | 17,612 | |
|
|
|
|
|
| |
| Fixed assets | | | 17,930 | | 17,612 | |
|
|
|
|
|
| |
| Amounts owed by Group undertakings | | | 108 | | 2,969 | |
| Taxation | | | 110 | | 52 | |
| Cash at bank | | | 22 | | 8 | |
|
|
|
|
|
| |
| Current assets | | | 240 | | 3,029 | |
|
|
|
|
|
| |
| Dividends payable | 14 | | (1,258 | ) | (1,331 | ) |
| Amounts owed to Group undertakings | | | (6,821 | ) | (8,578 | ) |
|
|
|
|
|
| |
| Creditors: amounts due within one year | | | (8,079 | ) | (9,909 | ) |
|
|
|
|
|
| |
| Net current liabilities | | | (7,839 | ) | (6,880 | ) |
|
|
|
|
|
| |
| Net assets | | | 10,091 | | 10,732 | |
|
|
|
|
|
| |
| Capital and reserves | | | | | | |
| Called up share capital | 27 | | 1,484 | | 1,487 | |
| Share premium account | 27 | | 304 | | 264 | |
| Other reserves | 29 | | 81 | | 76 | |
| Profit and loss account | 29 | | 8,222 | | 8,905 | |
|
|
|
|
|
| |
| Equity shareholders’ funds | | | 10,091 | | 10,732 | |
|
|
|
|
|
| |
Approved by the Board on 2nd March 2005
Sir Christopher Gent
Chairman
Back to Contents
Notes to the financial statements
1 Presentation of the Financial statements
Description of business
GlaxoSmithKline is a major global healthcare group which is engaged in the creation and discovery, development, manufacture and marketing of pharmaceutical products, including vaccines, over-the-counter (OTC) medicines and health-related consumer products. GlaxoSmithKline’s principal pharmaceutical products include medicines in the following therapeutic areas: central nervous system, respiratory, anti-virals, anti-bacterials, vaccines, oncology and emesis, metabolic, cardiovascular and urogenital.
Financial period
These Financial statements cover the financial year from 1st January to 31st December 2004, with comparative figures for the financial years from 1st January to 31st December 2003 and from 1st January to 31st December 2002.
Composition of the Group
A list of the subsidiary and associated undertakings which, in the opinion of the Directors, principally affected the amount of profit or the net assets of the Group is given in Principal Group companies, Note 38.
Composition of financial statements
The consolidated Financial statements are drawn up in accordance with UK generally accepted accounting principles (UK GAAP) and with UK accounting presentation.
The Financial statements comprise:
| • | Consolidated statement of profit and loss |
| • | Consolidated statement of total recognised gains and losses |
| • | Consolidated statement of cash flow |
| • | Consolidated balance sheet |
| • | Reconciliation of movements in consolidated equity shareholders’ funds |
| • | Company balance sheet |
| • | Notes to the financial statements. |
As permitted by Section 230 of the Companies Act 1985, the profit and loss account of the company is not presented.
The consolidated statement of total recognised gains and losses includes:
| • | the realised profit attributable to shareholders as reflected in the consolidated statement of profit and loss |
| • | the unrealised gain or loss in the value of the Group’s overseas net assets, less related foreign currency borrowings, attributable to currency movements over the period |
| • | tax on the above items. |
The reconciliation of movements in equity shareholders’ funds comprises the items contributing to the increase or decrease over the period in shareholders’ funds. Such items include:
| • | the total recognised gains and losses for the period |
| • | dividends paid and proposed |
| • | the proceeds of shares issued during the period |
| • | the cost of shares purchased as Treasury shares or for cancellation under the share buy-back programme |
| • | changes to goodwill, arising on acquisitions prior to 1st January 1998, which has been set directly against reserves. |
Additional information in accordance with the requirements of US generally accepted accounting principles (US GAAP) is included in the Notes to the Financial statements. In Note 37 a statement of differences, and reconciliations of net income and shareholders’ equity, between UK and US GAAP are provided.
Presentation of statement of profit and loss
During the years 2000 to 2003, a columnar presentation was adopted in the statement of profit and loss in order to illustrate underlying business performance, as this was the primary measure used by management. For this purpose certain items were identified separately and excluded from business performance. These comprised: merger and integration items, including product divestments; costs relating to previously announced manufacturing and other restructuring, and the effect of disposals of subsidiaries. Management believes that exclusion of these items provided a better reflection for those years of the way in which the business was managed and gives an indication of the performance of the Group in terms of those elements of revenue and expenditure which local management is able to influence.
For 2004, with the completion of these programmes, the Group is reporting results on a statutory basis only. Growth rates are presented comparing 2004 results both with 2003 business performance results and 2003 statutory results. Management considers that the comparison of 2004 statutory results with 2003 business performance results gives the most appropriate indication of the Group’s performance for that period.
Trading profit reflects turnover less: cost of sales, comprising costs of manufacture and external royalties; selling, general and administrative expenditure, comprising the costs of selling, distribution and medical support of currently marketed products and the costs of administration; and the costs of research and development to create future products for sale.
Accounting convention
The Financial statements have been prepared using the historical cost convention.
Accounting standards
The Financial statements comply with applicable UK accounting standards.
Accounting principles and policies
The preparation of the Financial statements in conformity with generally accepted accounting principles requires management to make estimates and assumptions that affect the reported amounts of assets and liabilities and disclosure of contingent assets and liabilities at the date of the Financial statements and the reported amounts of revenues and expenses during the reporting period. Actual results could differ from those estimates.
The Financial statements have been prepared in accordance with the company’s accounting policies approved by the Board and described in Note 2.
Back to Contents
| Notes to the financial statements GlaxoSmithKline | 97 |
2 Accounting policies
Consolidation
The consolidated Financial statements include:
| • | the assets and liabilities, and the results and cash flow, of the company and its subsidiary undertakings, including Employee Share Ownership Plan (ESOP) Trusts |
| • | the Group’s share of the net assets and results of joint ventures and associated undertakings. |
The Financial statements of undertakings consolidated are made up to 31st December.
Undertakings in which the Group has a material interest are accounted for as subsidiaries where the Group exercises dominant influence, as joint ventures where the Group exercises joint control and as associates where the Group can exercise significant influence.
Interests acquired in undertakings are consolidated from the effective date of acquisition and interests sold are consolidated up to the date of disposal.
Transactions and balances between subsidiary undertakings are eliminated; no profit is taken on sales between subsidiary undertakings or sales to joint ventures and associated undertakings until the products are sold to customers outside the Group.
Goodwill arising on the acquisition of interests in subsidiary undertakings, joint ventures and associated undertakings, representing the excess of the purchase consideration over the Group’s share of the separable net assets acquired, is capitalised as a separate item in the case of subsidiary undertakings and as part of the cost of investment in the case of joint ventures and associated undertakings. Goodwill is denominated in the currency in which the acquisition is made and financed. In the case of acquisitions prior to 1998, goodwill was written off against reserves; on a subsequent disposal of assets from such acquisitions, any related goodwill is removed from consolidated reserves and charged to the consolidated profit and loss account.
The Group’s interests in its joint ventures are accounted for using the gross equity method. The Group’s interests in its associated undertakings are accounted for using the equity method.
Deferred taxation relief on unrealised intra-Group profit is accounted for only to the extent that it is considered recoverable.
Assets and liabilities of overseas subsidiary and associated undertakings and joint ventures including related goodwill, are translated into sterling at rates of exchange ruling at the balance sheet date. The results and cash flows of overseas subsidiary and associated undertakings and joint ventures are translated into sterling using average rates of exchange. Exchange adjustments arising when the opening net assets and the profits for the year retained by overseas subsidiary and associated undertakings and joint ventures are translated into sterling, less exchange differences arising on related foreign currency borrowings, are taken directly to reserves and reported in the statement of total recognised gains and losses.
In translating into sterling assets, liabilities, results and cash flows of overseas subsidiary and associated undertakings and joint ventures reported in currencies of hyper-inflationary economies, adjustments are made to reflect current price levels. Any loss on net monetary assets is charged to the consolidated profit and loss account.
Foreign currency transactions
Foreign currency transactions by Group companies are booked in local currency at the exchange rate ruling on the date of transaction, or at the forward rate if hedged by a forward exchange contract. Foreign currency assets and liabilities are translated into local currency at rates of exchange ruling at the balance sheet date, or at the forward rate. Exchange differences are included in trading profit.
Revenue
Revenue is recognised in the profit and loss account when goods are supplied or made available to external customers against orders received and when title and risk of loss passes to the customer. Turnover represents net invoice value after the deduction of discounts given at the point of sale, and accruals for estimated future rebates and returns. The methodology and assumptions used to estimate rebates and returns are monitored and adjusted regularly in the light of contractual and historical information and past experience. Turnover also includes co-promotion income where the Group records its share of the revenue but with no related cost of sales. Value added tax and other sales taxes are excluded from revenue.
Expenditure
Expenditure is recognised in respect of goods and services received when supplied in accordance with contractual terms. Provision is made when an obligation exists for a future liability in respect of a past event and where the amount of the obligation can be reliably estimated. Advertising and promotion expenditure is charged to the profit and loss account as incurred. Shipment costs on inter-company transfers are charged to cost of sales; distribution costs on sales to customers are included in selling, general and administrative expenditure. Restructuring costs are recognised in respect of the direct expenditures of a business reorganisation where the plans are sufficiently detailed and well advanced, and where appropriate communication to those affected has been undertaken at the balance sheet date.
Research and development
Research and development expenditure is charged to the profit and loss account in the period in which it is incurred. Tangible fixed assets used for research and development are depreciated in accordance with the Group’s policy.
Environmental expenditure
Environmental expenditure related to existing conditions resulting from past or current operations and from which no current or future benefit is discernible is charged to the profit and loss account. The Group determines its liability on a site-by-site basis and records a liability at the time when it is probable and can be reasonably estimated. This liability includes the Group’s own portion of the costs and also a portion of other potentially responsible parties’ costs when it is probable that they will not be able to satisfy their respective shares of the clean-up obligation. When recoveries of reimbursements are virtually certain they are recorded as assets.
Pensions and post-retirement benefits
The cost of providing pensions and other employee post-retirement benefits is charged to the consolidated profit and loss account on a systematic and rational basis, based on actuarial assumptions, over the period during which benefit is derived from employees’ services. Any difference between this charge and the contributions paid is included as an asset or liability in the consolidated balance sheet.
Back to Contents
| 98 | GlaxoSmithKline Notes to the financial statements | |
2 Accounting policies continued
Legal and other disputes
Provision is made for anticipated settlement costs where a reasonable estimate can be made of the likely outcome of legal or other disputes against the Group. In addition provision is made for legal and other expenses arising from claims received or other disputes. In respect of product liability claims related to products where there is sufficient history of claims made and settlements, an “incurred but not reported” (IBNR) actuarial technique is used to determine a reasonable estimate of the Group’s exposure to unasserted claims for those products and a provision is made on that basis. No provision is made for other unasserted claims or where an obligation exists under a dispute but it is not possible to make a reasonable estimate. Costs associated with claims made by the Group against third parties are charged to the profit and loss account as they are incurred.
Employee share plans
Incentives in the form of shares are provided to employees under share option and share award schemes. In respect of certain award schemes and share option grants, the company provides finance to ESOP Trusts to purchase company shares on the open market to meet the company’s obligation to provide shares when employees exercise their option or award. Any excess of the fair value of the shares at the date of the award over the exercise price of the options or awards is charged to the profit and loss account over the periods of service in respect of which the options and awards are granted. In respect of other share option grants, share options when exercised are accounted for as share issues at exercise price. Additional employer costs in respect of options and awards are charged to the profit and loss account over the periods of service.
Assets and liabilities of the ESOP Trusts are included in the Group balance sheet. Costs of running the Trusts are charged to the profit and loss account. Company shares held by the Trusts are deducted from other reserves and held at a value which recognises any shortfall in the proceeds receivable from employees on exercise. If there is deemed to be a further permanent impairment in value this is reflected by a transfer to profit and loss account reserve.
Goodwill
Goodwill is stated at cost less a provision for amortisation. Amortisation is calculated to write off the cost in equal annual instalments over its expected useful life. The useful life is not normally expected to exceed 20 years.
Intangible fixed assets
Intangible assets are stated at cost less a provision for amortisation.
Acquired licences, patents, know-how and marketing rights are amortised over their estimated useful lives in equal instalments, but no longer than 15 years. Items capitalised are restricted to those related to specific compounds or products which are being developed for commercial applications. The estimated useful lives for determining the amortisation charge are reviewed annually, and take into account the estimated time it takes to bring the compounds or products to market as marketable products. Any development costs which are incurred by the Group and are associated with an acquired licence, patent, know-how or marketing rights are written off to the profit and loss account when incurred.
Brands are valued independently as part of the fair value of businesses acquired from third parties where the brand has a value which is substantial and long-term and where the brands can be sold separately from the rest of the businesses acquired. Brands are amortised over the estimated useful lives but no longer than 20 years, except where the end of the useful economic life of the brand cannot be foreseen.
Prior to 1998, acquired minor brands and similar intangibles were eliminated in the Group balance sheet against reserves in the year of acquisition.
Tangible fixed assets
Tangible fixed assets are stated at cost less provisions for depreciation or impairment. The costs of acquiring and developing computer software for internal use and internet sites for external use are capitalised as a tangible fixed asset where the software or site supports a significant business system and the expenditure leads to the creation of a durable asset.
Depreciation is calculated to write off the cost of tangible fixed assets, excluding freehold land, in equal annual instalments over their expected useful lives. The normal expected useful lives of the major categories of tangible fixed assets are reviewed annually and are:
|
| Freehold buildings | 20 to 50 years |
| Leasehold land and | The shorter of lease term and 50 |
| buildings | years |
| Plant and machinery | 10 to 20 years |
| Fixtures and equipment | 3 to 10 years |
| ERP systems software | 7 years |
| Other computer software | 3 to 5 years |
|
Enterprise Resource Planning (ERP) systems software generally involves significant customisation prior to implementation and is expected to have a useful economic life of seven years, rather than the maximum five years of other computer software. On disposal of a tangible fixed asset, the cost and related accumulated depreciation are removed from the financial statements and the net amount, less any proceeds, is taken to the consolidated profit and loss account.
Leases
Leasing agreements which transfer to the Group substantially all the benefits and risks of ownership of an asset are treated as finance leases, as if the asset had been purchased outright. The assets are included in tangible fixed assets and the capital element of the leasing commitments is shown as obligations under finance leases. Assets held under finance leases are depreciated over the shorter of the lease terms and the useful lives of the assets. The interest element of the lease rental is charged against profit. All other leases are operating leases and the annual rentals are charged against profit on a straight-line basis over the lease term.
Impairment of fixed assets
The carrying values of fixed assets are reviewed for impairment when there is an indication that the assets might be impaired. Any provision for impairment is charged against profit in the year concerned. First year impairment reviews are conducted for acquired goodwill and intangible assets. Certain intangibles are considered to have an indefinite life and are therefore not amortised. Such intangibles are subject to annual impairment tests. Impairment is determined by reference to the higher of net realisable value and value in use, which is measured by reference to discounted future cash flows.
Back to Contents
| Notes to the financial statements GlaxoSmithKline | 99 |
2 Accounting policies continued
Investments in joint ventures and associates
Investments in joint ventures and associated undertakings are carried in the consolidated balance sheet at the Group’s share of their net assets at date of acquisition and of their post-acquisition retained profits or losses together with any goodwill arising on the acquisition, net of amortisation.
Stocks
Stocks are included in the financial statements at the lower of cost (including manufacturing overheads, where appropriate) and net realisable value. Cost is generally determined on a first in, first out basis.
Taxation
The Group accounts for taxation which is deferred or accelerated by reason of timing differences which have originated but not reversed by the balance sheet date. Deferred tax assets are only recognised to the extent that they are considered recoverable against future taxable profits. Deferred tax on the retained earnings of overseas subsidiaries is only provided when there is a binding commitment to distribute past earnings in future periods.
Deferred tax is measured at the average tax rates that are expected to apply in the periods in which the timing differences are expected to reverse. Deferred tax liabilities and assets are not discounted.
Current asset investments
Current asset investments are stated at the lower of cost and net realisable value.
In the case of securities acquired at a significant premium or discount to maturity value, and intended to be held to redemption, cost is adjusted to amortise the premium or discount over the life to maturity of the security. Floating rate bonds are stated at cost. Interest income is taken to the profit and loss account on a receivable basis.
Equity investments are included as current assets when regarded as available for sale.
Derivative financial instruments
The Group does not hold or issue derivative financial instruments for trading purposes.
Derivative financial instruments are used to manage exposure to market risks from treasury operations. The principal derivative instruments are currency swaps, forward exchange contracts and interest rate swaps. The derivative contracts are treated from inception as an economic hedge of the underlying financial instrument, with matching accounting treatment and cash flows. The derivative contracts have high correlation with the specific financial instrument being hedged both at inception and throughout the hedge period. Derivative instruments no longer designated as hedges are restated at market value and any future changes in value are taken directly to the profit and loss account.
Currency swaps and forward exchange contracts used to fix the value of the related asset or liability in the contract currency and at the contract rate are accrued to the profit and loss account over the life of the contract.
Gains and losses on foreign exchange contracts designated as hedges of forecast foreign exchange transactions are deferred and included in the measurement of the related foreign currency transactions in the period they occur. Gains and losses on balance sheet hedges are accrued and are taken directly to reserves, except that forward premiums/discounts are recognised as interest over the life of the contracts.
Interest differentials under interest swap agreements are recognised in the profit and loss account by adjustment of interest expense over the life of the agreement.
Debt instruments
Debt instruments are stated at the amount of net proceeds adjusted to amortise the issue cost of debt evenly over the term of the debt.
3 New accounting policies and future requirements
In December 2003, the Urgent Issues Task Force issued Abstract 38 and amended Abstract 17, relating to the accounting for and presentation of ESOP Trusts and share options and awards granted to employees. These requirements became mandatory for 2004 reporting and require the shares held by the ESOP Trusts to be shown as a deduction in arriving at shareholders’ funds. The charge to the profit and loss account for employee share options is restricted to the intrinsic loss, the difference between the market price and exercise price, at the date of grant. Comparative data for prior periods has been restated for comparability. Trading profit and profit before tax in 2003 have been reduced by £16 million and net assets at 31st December 2003 by £2,661 million. It is not practicable to quantify the effect on 2004 because of the different measurement basis adopted.
In June 2002, the Council of the European Union adopted a Regulation requiring listed companies in its Member States to prepare their consolidated financial statements in accordance with International Financial Reporting Standards (IFRS) from 2005. GlaxoSmithKline has completed its conversion project, subject to any changes in standards and pronouncements, and unaudited information for 2004 and 2003 restated onto an IFRS basis, is given on pages 163 to 173.
4 Exchange rates
The Group uses the average of exchange rates prevailing during the period to translate the results and cash flows of overseas subsidiaries, joint ventures and associated undertakings into sterling and period end rates to translate the net assets of those undertakings. The currencies which most influence these translations, and the relevant exchange rates, were:
| | 2004 | | 2003 | | 2002 | |
|
|
|
|
|
| |
| Average rates: | | | | | | |
| £/US$ | 1.83 | | 1.64 | | 1.50 | |
| £/Euro | 1.47 | | 1.45 | | 1.59 | |
| £/Yen | 197.00 | | 191.00 | | 188.00 | |
| Period end rates: | | | | | | |
| £/US$ | 1.92 | | 1.79 | | 1.61 | |
| £/Euro | 1.41 | | 1.42 | | 1.54 | |
| £/Yen | 197.00 | | 192.00 | | 192.00 | |
|
|
|
|
|
| |
Back to Contents
| 100 | GlaxoSmithKline Notes to the financial statements |
5 Merger of Glaxo Wellcome and SmithKline Beecham
The combination of Glaxo Wellcome plc and SmithKline Beecham plc was treated as a merger at 27th December 2000 under UK GAAP. Under the merger relief provisions of the Companies Act 1985, the shares issued by GlaxoSmithKline plc to acquire Glaxo Wellcome and SmithKline Beecham were accounted for at par and no share premium arose; the shares acquired by GlaxoSmithKline in Glaxo Wellcome and SmithKline Beecham were similarly accounted for at the nominal value of the shares issued. In the consolidated Financial statements of GlaxoSmithKline, the results and net assets of Glaxo Wellcome and SmithKline Beecham were combined at their book amounts, subject to alignment adjustments.
6 Segment information
An analysis of turnover, profit before taxation, total assets and net assets by business and geographical sector, tangible fixed assets by geographical sector and turnover by location of customer are set out below. The business sectors consist of Pharmaceuticals (prescription pharmaceuticals and vaccines) and Consumer Healthcare (oral care, OTC medicines and nutritional healthcare). Assets by business sector in 2003 have been adjusted to ensure consistency with 2004. The geographical sectors reflect the Group’s most significant regional markets and are consistent with the Group’s regional market management reporting structure. Business sector data includes an allocation of corporate costs to each sector. There are no sales between business sectors.
The Group’s activities are organised on a global basis. The geographical sector figures are therefore influenced by the location of the Group’s operating resources, in particular manufacturing and research, and by variations over time in intra-Group trading and funding arrangements.
Where the Group co-promotes a product and the third party records the sale, the Group records its share of revenue as co-promotion income within turnover. The nature of co-promotion activities is such that the Group records no costs of sales. Pharmaceutical turnover includes co-promotion income of £65 million (2003 – £35 million, 2002 – £nil).
| | | | 2003 | | 2002 | |
| | 2004 | | (restated) | | (restated) | |
| Turnover by business sector | £m | | £m | | £m | |
|
|
|
|
|
| |
| Pharmaceuticals | 17,146 | | 18,181 | | 17,995 | |
| Consumer Healthcare | 3,213 | | 3,260 | | 3,217 | |
|
|
|
|
|
| |
| External turnover | 20,359 | | 21,441 | | 21,212 | |
|
|
|
|
|
| |
| | | | | | | |
| Statutory profit before tax by business sector | | | | | | |
|
|
|
|
|
| |
| Pharmaceuticals | 5,428 | | 5,785 | | 5,085 | |
| Consumer Healthcare | 662 | | 591 | | 484 | |
|
|
|
|
|
| |
| Operating profit | 6,090 | | 6,376 | | 5,569 | |
|
|
|
|
|
| |
| Share of profits of joint ventures and associated undertakings | 95 | | 93 | | 75 | |
| Profit on disposal of interest in associate | 138 | | – | | – | |
| (Loss)/profit on disposal of businesses | (1 | ) | 5 | | 10 | |
| Product divestments | – | | – | | 11 | |
| Net interest payable | (203 | ) | (161 | ) | (141 | ) |
|
|
|
|
|
| |
| Profit before taxation | 6,119 | | 6,313 | | 5,524 | |
|
|
|
|
|
| |
| | | | | | | |
| Profit before taxation | 6,119 | | 6,313 | | 5,524 | |
| Taxation | (1,701 | ) | (1,729 | ) | (1,464 | ) |
| Minority interests | (114 | ) | (94 | ) | (110 | ) |
| Preference share dividends | (2 | ) | (12 | ) | (20 | ) |
|
|
|
|
|
| |
| Statutory earnings | 4,302 | | 4,478 | | 3,930 | |
|
|
|
|
|
| |
| | | | | | | |
| Total assets by business sector | | | | | | |
|
|
|
| | | |
| Pharmaceuticals | 18,875 | | 17,384 | | | |
| Consumer Healthcare | 3,703 | | 3,816 | | | |
|
|
|
| | | |
| Total assets | 22,578 | | 21,200 | | | |
|
|
|
| | | |
| | | | | | | |
| Net assets by business sector | | | | | | |
|
|
|
| | | |
| Pharmaceuticals | 3,698 | | 3,316 | | | |
| Consumer Healthcare | 2,504 | | 2,488 | | | |
|
|
|
| | | |
| Net assets | 6,202 | | 5,804 | | | |
|
|
|
| | | |
Back to Contents
| Notes to the financial statements GlaxoSmithKline | 101 |
6 Segment information continued
| | | | 2003 | | 2002 | |
| | 2004 | | (restated) | | (restated) | |
| Turnover by location of subsidiary undertaking | £m | | £m | | £m | |
|
|
|
|
|
| |
| USA | 9,524 | | 10,569 | | 11,096 | |
| Europe | 11,431 | | 11,798 | | 10,423 | |
| International | 7,847 | | 7,945 | | 6,824 | |
|
|
|
|
|
| |
| Turnover including inter-segment turnover | 28,802 | | 30,312 | | 28,343 | |
|
|
|
|
|
| |
| USA | (289 | ) | (219 | ) | (168 | ) |
| Europe | (4,278 | ) | (4,690 | ) | (3,873 | ) |
| International | (3,876 | ) | (3,962 | ) | (3,090 | ) |
|
|
|
|
|
| |
| Inter-segment turnover | (8,443 | ) | (8,871 | ) | (7,131 | ) |
|
|
|
|
|
| |
| USA | 9,235 | | 10,350 | | 10,928 | |
| Europe | 7,153 | | 7,108 | | 6,550 | |
| International | 3,971 | | 3,983 | | 3,734 | |
|
|
|
|
|
| |
| External turnover | 20,359 | | 21,441 | | 21,212 | |
|
|
|
|
|
| |
| | | | | | | |
| Statutory profit before tax by location of subsidiary undertaking | | | | | | |
|
|
|
|
|
| |
| USA | 1,266 | | 1,983 | | 2,117 | |
| Europe | 2,739 | | 3,045 | | 2,508 | |
| International | 2,085 | | 1,348 | | 944 | |
|
|
|
|
|
| |
| Operating profit | 6,090 | | 6,376 | | 5,569 | |
|
|
|
|
|
| |
| Share of profits of joint ventures and associated undertakings | 95 | | 93 | | 75 | |
| Profit on disposal of interest in associate | 138 | | – | | – | |
| Profit on disposal of businesses | (1 | ) | 5 | | 10 | |
| Product divestments | – | | – | | 11 | |
| Net interest payable | (203 | ) | (161 | ) | (141 | ) |
|
|
|
|
|
| |
| Profit before taxation | 6,119 | | 6,313 | | 5,524 | |
|
|
|
|
|
| |
| | | | | | | |
| Profit before taxation | 6,119 | | 6,313 | | 5,524 | |
| Taxation | (1,701 | ) | (1,729 | ) | (1,464 | ) |
| Minority interests | (114 | ) | (94 | ) | (110 | ) |
| Preference share dividends | (2 | ) | (12 | ) | (20 | ) |
|
|
|
|
|
| |
| Statutory earnings | 4,302 | | 4,478 | | 3,930 | |
|
|
|
|
|
| |
| | | | | | | |
| Total assets by location of subsidiary undertaking | | | | | | |
|
|
|
| | | |
| USA | 4,351 | | 4,385 | | | |
| Europe | 11,374 | | 10,362 | | | |
| International | 2,874 | | 2,998 | | | |
|
|
|
| | | |
| Total operating assets | 18,599 | | 17,745 | | | |
| Cash at bank and liquid investments | 3,979 | | 3,455 | | | |
|
|
|
| | | |
| Total assets | 22,578 | | 21,200 | | | |
|
|
|
| | | |
| | | | | | | |
| Net assets by location of subsidiary undertaking | | | | | | |
|
|
|
| | | |
| USA | 233 | | 484 | | | |
| Europe | 5,973 | | 4,922 | | | |
| International | 1,980 | | 2,046 | | | |
|
|
|
| | | |
| Net operating assets | 8,186 | | 7,452 | | | |
| Net debt | (1,984 | ) | (1,648 | ) | | |
|
|
|
| | | |
| Net assets | 6,202 | | 5,804 | | | |
|
|
|
| | | |
Back to Contents
| 102 | GlaxoSmithKline Notes to the financial statements |
6 Segment information continued
| | | | | | | | | | 2004 | | 2003 | |
| |
|
|
|
|
|
|
|
|
| |
| |
| | | | Plant, | | | | | | | | | |
| | Land and | | equipment | | Computer | | Assets in | | | | | |
| | buildings | | and vehicles | | software | | construction | | Total | | Total | |
| Tangible fixed assets by location of subsidiary undertaking | £m | | £m | | £m | | £m | | £m | | £m | |
|
|
|
|
|
|
|
|
|
|
|
| |
| USA | 662 | | 399 | | 40 | | 157 | | 1,258 | | 1,295 | |
| Europe | 1,591 | | 2,023 | | 159 | | 500 | | 4,273 | | 4,184 | |
| International | 503 | | 357 | | 11 | | 69 | | 940 | | 962 | |
|
|
|
|
|
|
|
|
|
|
|
| |
| Total | 2,756 | | 2,779 | | 210 | | 726 | | 6,471 | | 6,441 | |
|
|
|
|
|
|
|
|
|
|
|
| |
| | | | | | | | | | | | | |
| | | | | | | | 2004 | | 2003 | | 2002 | |
| Turnover by location of customer | | | | | | | £m | | £m | | £m | |
|
|
|
|
|
|
|
|
|
|
|
| |
| USA | | | | | | | 9,243 | | 10,333 | | 10,807 | |
| Europe | | | | | | | 6,658 | | 6,611 | | 6,064 | |
| International | | | | | | | 4,458 | | 4,497 | | 4,341 | |
|
|
|
|
|
|
|
|
|
|
|
| |
| External turnover | | | | | | | 20,359 | | 21,441 | | 21,212 | |
|
|
|
|
|
|
|
|
|
|
|
| |
UK segment
Information is given separately in respect of the UK, which, although included in the Group’s Europe market region, is considered the Group’s home segment for the purposes of segmental reporting.
| | | | 2003 | | 2002 | |
| | 2004 | | (restated) | | (restated) | |
| | £m | | £m | | £m | |
|
|
|
|
|
| |
| | | | | | | |
| Turnover by location of customer | 1,461 | | 1,404 | | 1,366 | |
|
|
|
|
|
| |
| Turnover including inter-segment turnover | 4,467 | | 4,678 | | 4,945 | |
| Inter-segment turnover | (2,709 | ) | (2,883 | ) | (3,230 | ) |
|
|
|
|
|
| |
| Turnover by location of subsidiary | 1,758 | | 1,795 | | 1,715 | |
|
|
|
|
|
| |
| | | | | | | |
| Operating profit | 1,403 | | 1,519 | | 1,294 | |
|
|
|
|
|
| |
| | | | | | | |
| Total assets | 7,578 | | 7,145 | | | |
|
|
|
| | | |
| Net operating assets | 2,635 | | 2,023 | | | |
|
|
|
| | | |
7 Merger items, restructuring costs and divested businesses
Manufacturing and other restructuring costs were incurred by GlaxoSmithKline during 2003 and 2002 in the implementation of previously announced plans for the restructuring of manufacturing and other activities.
Merger integration costs relate to the integration of Glaxo Wellcome and SmithKline Beecham into a unified GlaxoSmithKline business. These costs include consultancy fees in respect of integration planning, severance costs, asset write-offs, costs related to the early vesting or lapse of performance conditions on share options and share incentive awards and costs of the programme to encourage staff to convert Glaxo Wellcome and SmithKline Beecham share options into GlaxoSmithKline share options. Integration costs were incurred in 2003 and 2002 relating to the integration of the Block Drug businesses. These costs include professional fees, severance costs and asset write-offs.
Product divestment income arising in 2002 related to the finalisation of the disposals of Famvir, Kytril and other products required in 2000 in order to obtain regulatory approval for the merger.
The disposal of businesses in 2003 and 2002 related to the finalisation of the disposals of Clinical Laboratories and Healthcare Services in 1999.
Back to Contents
| Notes to the financial statements GlaxoSmithKline | 103 |
| 7 | Merger items, restructuring costs and divested businesses continued |
| | |
| | | | | | | | Disposal of | | | |
| | Merger | | Restructuring | | Block Drug | | subsidiaries | | Total | |
| 2003 | £m | | £m | | £m | | £m | | £m | |
|
|
|
|
|
|
|
|
|
| |
| Manufacturing and other restructuring | – | | (83 | ) | – | | – | | (83 | ) |
| Merger integration costs | (286 | ) | – | | – | | – | | (286 | ) |
| Block Drug integration costs | – | | – | | (26 | ) | – | | (26 | ) |
|
|
|
|
|
|
|
|
|
| |
| Effect on operating profit | (286 | ) | (83 | ) | (26 | ) | – | | (395 | ) |
| Profit on disposal of businesses | – | | – | | – | | 5 | | 5 | |
|
|
|
|
|
|
|
|
|
| |
| Effect on profit before tax | (286 | ) | (83 | ) | (26 | ) | 5 | | (390 | ) |
|
|
|
|
|
|
|
|
|
| |
| Effect on taxation – operating items | | | | | | | | | 98 | |
| Effect on taxation – non-operating items | | | | | | | | | 11 | |
|
|
|
|
|
|
|
|
|
| |
| Effect on taxation | | | | | | | | | 109 | |
|
|
|
|
|
|
|
|
|
| |
| Effect on earnings | | | | | | | | | (281 | ) |
|
|
|
|
|
|
|
|
|
| |
| | | | | | | | | | | |
|
| | | | | | | | Disposal of | | | |
| | Merger | | Restructuring | | Block Drug | | subsidiaries | | Total | |
| 2002 | £m | | £m | | £m | | £m | | £m | |
|
|
|
|
|
|
|
|
|
| |
| Manufacturing and other restructuring | – | | (121 | ) | – | | – | | (121 | ) |
| Merger integration costs | (851 | ) | – | | – | | – | | (851 | ) |
| Block Drug integration costs | – | | – | | (60 | ) | – | | (60 | ) |
|
|
|
|
|
|
|
|
|
| |
| Effect on operating profit | (851 | ) | (121 | ) | (60 | ) | – | | (1,032 | ) |
| Product divestments | 11 | | – | | – | | – | | 11 | |
| Profit on disposal of businesses | – | | – | | – | | 10 | | 10 | |
|
|
|
|
|
|
|
|
|
| |
| Effect on profit before tax | (840 | ) | (121 | ) | (60 | ) | 10 | | (1,011 | ) |
|
|
|
|
|
|
|
|
|
| |
| | | | | | | | | | | |
| Effect on taxation – operating items | | | | | | | | | 266 | |
| Effect on taxation – non-operating items | | | | | | | | | 33 | |
|
|
|
|
|
|
|
|
|
| |
| Effect on taxation | | | | | | | | | 299 | |
|
|
|
|
|
|
|
|
|
| |
| Effect on earnings | | | | | | | | | (712 | ) |
|
|
|
|
|
|
|
|
|
| |
| | | | | | | | | | | |
|
| 8 | Other operating income/(expense) |
| | 2004 | | 2003 | | 2002 | |
| | £m | | £m | | £m | |
|
|
|
|
|
| |
| Royalties and other income | 96 | | 75 | | 75 | |
| Other operating expense | (296 | ) | (436 | ) | (209 | ) |
|
|
|
|
|
| |
| | (200 | ) | (361 | ) | (134 | ) |
| Income from equity investments and other disposals | 140 | | 228 | | 23 | |
|
|
|
|
|
| |
| | (60 | ) | (133 | ) | (111 | ) |
|
|
|
|
|
| |
Royalties and other income is principally a core of recurring income in the form of royalties from the out-licensing of intellectual property. Other operating expense includes litigation costs and provisions relating to legal claims on withdrawn products, product withdrawals, anti-trust matters and claims with respect to sales, marketing and reimbursement. Income from equity investments and other disposals includes equity investment carrying value adjustments arising from stock market changes, product disposals and equity investment sales.
Back to Contents
| 104 | GlaxoSmithKline Notes to the financial statements |
| | | | 2003 | | 2002 | |
| | 2004 | | (restated) | | (restated) | |
| | £m | | £m | | £m | |
|
|
|
|
|
|
|
| The following items have been charged in operating profit: | | | | | | |
| Employee costs (Note 35) | 4,704 | | 5,074 | | 4,922 | |
| Advertising | 599 | | 615 | | 688 | |
| Distribution costs | 271 | | 284 | | 281 | |
| Depreciation of tangible fixed assets: | | | | | | |
| Owned assets | 780 | | 771 | | 760 | |
| Leased assets | 5 | | 2 | | 4 | |
| Amortisation of goodwill | 12 | | 13 | | 12 | |
| Amortisation of intangible fixed assets | 94 | | 74 | | 60 | |
| Exchange losses on foreign currency deposits/loans | – | | (1 | ) | – | |
| Operating lease rentals: | | | | | | |
| Plant | 56 | | 90 | | 50 | |
| Land and buildings | 63 | | 62 | | 61 | |
| Audit fees | 7.2 | | 6.9 | | 6.1 | |
| Fees to auditors for other work: | | | | | | |
| Auditors’ UK firm | 2.6 | | 1.7 | | 5.2 | |
| Auditors’ overseas firms | 4.7 | | 5.9 | | 9.6 | |
|
|
|
|
|
|
|
| Analysis of fees to auditors for other work: | | | | | | |
| Further assurance (audit-related) services | 3.4 | | 2.6 | | 1.8 | |
| Tax services | 3.0 | | 4.6 | | 4.9 | |
| Merger of Glaxo Wellcome and SmithKline Beecham | – | | – | | 6.0 | |
| Other services | 0.9 | | 0.4 | | 2.1 | |
|
|
|
|
|
|
|
| | | | | | | |
| Included within audit fees above is a fee of £10,000 (2003 – £10,000, 2002 – £10,000) relating to the company audit of GlaxoSmithKline plc. Included in further assurance services in 2004 and 2003 are amounts related to the Group’s preparation for the adoption of International Financial Reporting Standards and preparation for section 404 of the Sarbanes-Oxley Act 2002. Tax services relates to fees paid for corporate tax compliance, tax planning and advice. Other services include human resources advisory, compliance and treasury related services. Included within fees to auditors for other work in 2002 is £6.0 million paid to the auditor’s management consulting practice, which was sold by them in 2002. | |
| | | | | | | |
| In 2004 and 2003, the Group applied discounting to certain long-term assets and liabilities, using risk-free rates of return. | | | |
| | | | | | | |
| | | | | | | |
| 10 | Joint ventures and associated undertakings | | | | | | |
| | 2004 | | 2003 | | 2002 | |
| | £m | | £m | | £m | |
|
|
|
|
|
| |
| Associated undertakings: | | | | | | |
| Share of profits of Quest Diagnostics Inc. | 100 | | 102 | | 94 | |
| Share of losses of other associated undertakings | (1 | ) | (3 | ) | – | |
| Amortisation of goodwill | (5 | ) | (6 | ) | (6 | ) |
|
|
|
|
|
| |
| | 94 | | 93 | | 88 | |
| Share of profits/(losses) of joint ventures | 1 | | – | | (13 | ) |
|
|
|
|
|
| |
| | 95 | | 93 | | 75 | |
|
|
|
|
|
|
|
| | | | | | | |
| Share of turnover of joint ventures | 31 | | 31 | | 29 | |
| Sales to joint ventures and associated undertakings | 50 | | 51 | | 49 | |
|
|
|
|
|
|
|
Back to Contents
| Notes to the financial statements GlaxoSmithKline | 105 |
| | 2004 | | 2003 | | 2002 | |
| | £m | | £m | | £m | |
|
|
|
|
|
|
|
| Interest payable | | | | | | |
| On bank loans and overdrafts | (6 | ) | (6 | ) | (6 | ) |
| On other loans | (273 | ) | (186 | ) | (198 | ) |
| In respect of finance leases | (2 | ) | (2 | ) | (2 | ) |
| Realised losses | (1 | ) | – | | – | |
| Unwinding of discount on provisions | (16 | ) | (20 | ) | – | |
|
|
|
|
|
| |
| | (298 | ) | (214 | ) | (206 | ) |
| Share of interest payable of associate | (7 | ) | (8 | ) | (8 | ) |
|
|
|
|
|
| |
| | (305 | ) | (222 | ) | (214 | ) |
|
|
|
|
|
| |
| Investment income | | | | | | |
| Interest income | 99 | | 58 | | 71 | |
| Realised gains | – | | – | | 2 | |
| Unwinding of discount on assets | 3 | | 3 | | – | |
|
|
|
|
|
| |
| | 102 | | 61 | | 73 | |
|
|
|
|
|
| |
| | (203 | ) | (161 | ) | (141 | ) |
|
|
|
|
|
|
|
| | | | | | | |
| 12 | Taxation | | | | | | |
| | | | 2003 | | 2002 | |
| | 2004 | | (restated) | | (restated) | |
| Taxation charge based on profits for the period | £m | | £m | | £m | |
|
|
|
|
|
| |
| UK corporation tax at the UK statutory rate | 429 | | 673 | | 479 | |
| Less double taxation relief | (156 | ) | (290 | ) | (117 | ) |
|
|
|
|
|
| |
| | 273 | | 383 | | 362 | |
| Overseas taxation | 1,394 | | 1,578 | | 1,036 | |
| Deferred taxation | (6 | ) | (272 | ) | 32 | |
|
|
|
|
|
| |
| | 1,661 | | 1,689 | | 1,430 | |
| Share of taxation charge of associates | 40 | | 40 | | 34 | |
|
|
|
|
|
| |
| | 1,701 | | 1,729 | | 1,464 | |
|
|
|
|
|
|
|
| | | | | | | |
| | | | 2003 | | 2002 | |
| | 2004 | | (restated) | | (restated) | |
| Reconciliation of the current taxation rate on Group profits | % | | % | | % | |
|
|
|
|
|
| |
| UK statutory rate of taxation | 30.0 | | 30.0 | | 30.0 | |
| Overseas taxes | 1.2 | | 0.1 | | 0.1 | |
|
|
|
|
|
| |
| Average Group tax rate | 31.2 | | 30.1 | | 30.1 | |
| Effect of special tax status in manufacturing locations | (3.6 | ) | (3.9 | ) | (3.9 | ) |
| Share option deductions | (0.2 | ) | (0.1 | ) | (0.2 | ) |
| Merger and restructuring costs | – | | (0.1 | ) | 0.7 | |
| R&D credits | (1.5 | ) | (1.1 | ) | (1.2 | ) |
| Other permanent differences | 2.1 | | 1.1 | | (0.8 | ) |
| Capital allowances in excess of depreciation | 0.3 | | (0.3 | ) | (0.5 | ) |
| Intra-Group profit | 0.3 | | (0.1 | ) | 1.3 | |
| Reversing timing differences on tax losses | (1.6 | ) | – | | – | |
| Other timing differences | (0.7 | ) | 4.0 | | 2.2 | |
| Prior year items | 1.0 | | 1.5 | | (2.4 | ) |
|
|
|
|
|
| |
| Current tax rate on ordinary activities | 27.3 | | 31.1 | | 25.3 | |
| Capital allowances in excess of depreciation | (0.3 | ) | 0.3 | | 0.5 | |
| Intra-Group profit | (0.3 | ) | 0.1 | | (1.3 | ) |
| Reversing timing differences on tax losses | 1.6 | | – | | – | |
| Other timing differences | 0.7 | | (4.0 | ) | (2.2 | ) |
| Share of taxation charge of associates | 0.6 | | 0.6 | | 0.6 | |
| Prior year items | (1.8 | ) | (0.6 | ) | 3.6 | |
| UITF 17 restatement | – | | (0.1 | ) | – | |
|
|
|
|
|
| |
| Tax rate on ordinary activities | 27.8 | | 27.4 | | 26.5 | |
|
|
|
|
|
|
|
The Group operates in countries where the tax rate differs from the UK tax rate. The average Group tax rate has been determined by aggregating the local standard tax rates and weighting these in proportion to accounting profits. Profits arising from manufacturing operations in Singapore, Puerto Rico and Ireland are taxed at reduced rates. The effect of this reduction in the taxation charge increased earnings per share by 3.8p in 2004, 4.2p in 2003 and 3.7p in 2002.
Back to Contents
| 106 | GlaxoSmithKline Notes to the financial statements |
12 Taxation continued
The integrated nature of the Group’s worldwide operations, involving significant investment in research and strategic manufacture at a limited number of locations, with consequential cross-border supply routes into numerous end-markets, gives rise to complexity and delay in negotiations with revenue authorities as to the profits on which individual Group companies are liable to tax. Disagreements with, and between, revenue authorities as to intra-Group transactions, in particular the price at which goods should be transferred between Group companies in different tax jurisdictions, can produce conflicting claims from revenue authorities as to the profits to be taxed in individual territories. Resolution of such issues is a continuing fact of life for GlaxoSmithKline. The Group has open issues with the revenue authorities in the USA, UK, Japan and Canada. By far the largest relates to Glaxo heritage products, in respect of which the US Internal Revenue Service (IRS) and UK Inland Revenue have made competing and contradictory claims.
GlaxoSmithKline has attempted to settle the US dispute, first through direct discussion with the IRS and subsequently through discussions between the US and UK authorities under the terms of the double tax convention between the two countries and discussions were terminated in July 2003. On 6th January 2004, the IRS issued a Notice of Deficiency for the years 1989-1996 claiming additional taxes of $2.7 billion. On 2nd April 2004 the Group filed a petition in the US Tax Court disputing the IRS claim and seeking a refund of $1 billion in taxes. On 25th January 2005 the IRS issued a further Notice of Deficiency for the years 1997-2000 claiming additional taxes of $1.9 billion. If the IRS claims for the years 1989-2000 were upheld, the Group would additionally be liable for interest on late payment, estimated to amount to $3.0 billion net of federal tax relief at 31st December 2004, giving a total of $7.6 billion for the years 1989-2000. The Group expects to file a petition against the tax claims for 1997-2000 in April 2005, including a further claim for refund of taxes, and will ask the Tax Court to consolidate the IRS claims for all the years 1989-2000 into a single trial. A provisional trial date for the 1989-1996 claims has been set for October 2006. As similar tax issues remain open for 2001 to date, GlaxoSmithKline expects to receive further substantial claims by the IRS for these years. GlaxoSmithKline continues to believe that the profits reported by its US subsidiaries for the period 1989 to date, on which it has paid taxes in the USA, are more than sufficient to reflect the activities of its US operations.
GlaxoSmithKline is in continuing discussions with the Inland Revenue in respect of UK transfer pricing disputes.
GlaxoSmithKline uses the best advice in determining its transfer pricing methodology and in seeking to manage transfer pricing issues to a satisfactory conclusion and, on the basis of external professional advice, continues to believe that it has made adequate provision for the liabilities likely to arise from open assessments. However, there continues to be a wide difference of views between the Group, the IRS, the Inland Revenue and other relevant taxation authorities where open issues exist. The ultimate liability for such matters may vary from amounts provided and is dependent upon the outcome of litigation proceedings and negotiations with the relevant tax authorities.
Except as shown in this Annual Report, no provision has been made for taxation which would arise on the distribution of profits retained by overseas subsidiary and associated undertakings, on the grounds that no remittance of profit retained at 31st December 2004 is required in such a way that incremental tax will arise.
At 31st December 2004, the Group had income tax losses of approximately £385 million (2003 – £225 million) and capital losses estimated to be in excess of £10 billion (2003 – in excess of £10 billion) on which the related deferred tax assets are not recognised because there is insufficient evidence that these losses will be used.
| Tax balances | Current | | Deferred | | Deferred | |
| tax creditor | tax debtor | tax provision |
| £m | £m | £m |
|
|
|
|
|
| |
| At 1st January 2004 | (1,458 | ) | 1,441 | | (618 | ) |
| Exchange adjustments | 67 | | (52 | ) | – | |
| Charge to profit and loss account | (1,667 | ) | 148 | | (142 | ) |
| Cash paid | 1,583 | | – | | – | |
| Other movements | (123 | ) | – | | 50 | |
|
|
|
|
|
| |
| At 31st December 2004 | (1,598 | ) | 1,537 | | (710 | ) |
|
|
|
|
|
| |
| Deferred taxation asset/(liability) | | | 2003 | |
| 2004 | (restated) |
| £m | £m |
|
|
|
|
|
| Accelerated capital allowances | (664 | ) | (689 | ) |
| Stock valuation adjustment | (51 | ) | (52 | ) |
| Intra-Group profit | 594 | | 485 | |
| Product and business disposals | (31 | ) | (59 | ) |
| Pensions and other post-retirement benefits | 38 | | 113 | |
| Tax losses | 20 | | 94 | |
| Legal and other disputes | 157 | | 167 | |
| Merger integration and manufacturing restructuring | 89 | | 157 | |
| Other net timing differences | 675 | | 607 | |
|
|
|
| |
| | 827 | | 823 | |
|
|
|
| |
Deferred taxation provided on stock valuation adjustments, intra-Group profit and other timing differences shown above are current. All deferred taxation movements arise from the origination and reversal of timing differences. Other net timing differences include accrued expenses and other provisions.
Back to Contents
| Notes to the financial statements GlaxoSmithKline | 107 |
| | | | 2003 | | 2002 | |
| 2004 | (restated) | (restated) |
| p | p | p |
|
|
|
|
|
| |
| | | | | | | |
| Basic earnings per share | 75.0 | | 77.1 | | 66.5 | |
| Adjustment for merger items, restructuring costs and disposal of subsidiaries: | | | | | | |
| Merger integration and transaction costs | – | | 3.8 | | 10.8 | |
| Restructuring costs | – | | 1.0 | | 1.5 | |
| Block Drug integration costs | – | | 0.3 | | 0.7 | |
| Disposal of businesses | – | | (0.2 | ) | (0.9 | ) |
|
|
|
|
|
| |
| Adjusted earnings per share | 75.0 | | 82.0 | | 78.6 | |
|
|
|
|
|
| |
| | | | | | | |
| Diluted earnings per share | 74.8 | | 76.9 | | 66.3 | |
|
|
|
|
|
| |
Basic and adjusted earnings per share have been calculated by dividing the profit attributable to shareholders by the weighted average number of shares in issue during the period. The numbers used in calculating basic and diluted earnings per share are reconciled below.
Adjusted earnings per share is calculated using business performance earnings. During the years 2000 to 2003, business performance was the primary performance measure used by management and was presented after excluding merger items, integration and restructuring costs and disposals of businesses, as management believed that exclusion of these items provided a better comparison of business performance for the periods presented. For 2004, with the completion of these programmes, the Group is reporting results on a statutory basis only. This information, which is provided in addition to the statutory results prepared under UK GAAP, is given to assist shareholders to gain a clearer understanding of the underlying performance of the business and to increase comparability for the periods presented.
| Net profit for the period attributable to shareholders | £m | | £m | | £m | |
|
|
|
|
|
| |
| Earnings – basic and diluted | 4,302 | | 4,478 | | 3,930 | |
| Adjustments for merger items, restructuring costs and disposal of subsidiaries | – | | 281 | | 712 | |
|
|
|
|
|
| |
| Adjusted earnings | 4,302 | | 4,759 | | 4,642 | |
|
|
|
|
|
| |
| | | | | | | |
| | | | | | | |
| Weighted average number of shares in issue | millions | | millions | | millions | |
|
|
|
|
|
| |
| Basic and adjusted | 5,736 | | 5,806 | | 5,912 | |
| Dilution for share options | 12 | | 18 | | 22 | |
|
|
|
|
|
| |
| Diluted | 5,748 | | 5,824 | | 5,934 | |
|
|
|
|
|
| |
Shares held by the ESOP Trusts are excluded. The trustees have waived their rights to dividends on the shares held by the ESOP Trusts.
| 14 Dividends | 2004 | | 2003 | | 2002 | |
| £m | £m | £m |
|
|
|
|
|
| |
| First interim | 575 | | 524 | | 535 | |
| Second interim | 573 | | 522 | | 530 | |
| Third interim | 571 | | 520 | | 527 | |
| Fourth interim | 683 | | 808 | | 754 | |
|
|
|
|
|
| |
| | 2,402 | | 2,374 | | 2,346 | |
|
|
|
|
|
| |
| | | | | | | |
| Dividends per share | 2004 | | 2003 | | 2002 | |
| p | p | p |
|
|
|
|
|
| |
| First interim | 10 | | 9 | | 9 | |
| Second interim | 10 | | 9 | | 9 | |
| Third interim | 10 | | 9 | | 9 | |
| Fourth interim | 12 | | 14 | | 13 | |
|
|
|
|
|
| |
| | 42 | | 41 | | 40 | |
|
|
|
|
|
| |
Back to Contents
| 108 | GlaxoSmithKline Notes to the financial statements |
| 15 Goodwill | Total | |
| £m |
|
| |
| Cost at 1st January 2004 | 195 | |
| Exchange adjustments | 13 | |
| Asset written off | (2 | ) |
|
| |
| Cost at 31st December 2004 | 206 | |
|
| |
| Amortisation at 1st January 2004 | (52 | ) |
| Exchange adjustments | (4 | ) |
| Provision for the year | (12 | ) |
| Asset written off | 1 | |
|
| |
| Amortisation at 31st December 2004 | (67 | ) |
|
| |
| Net book value at 1st January 2004 | 143 | |
|
| |
| Net book value at 31st December 2004 | 139 | |
|
| |
| | | |
| 16 Other intangible assets | Licences, | | | | | |
| patents, etc. | Brands | Total |
| £m | £m | £m |
|
|
|
|
|
| |
| Cost at 1st January 2004 | 838 | | 1,169 | | 2,007 | |
| Exchange adjustments | (24 | ) | (25 | ) | (49 | ) |
| Additions | 462 | | – | | 462 | |
| Disposals | (1 | ) | (1 | ) | (2 | ) |
| Assets written off | (19 | ) | – | | (19 | ) |
|
|
|
|
|
| |
| Cost at 31st December 2004 | 1,256 | | 1,143 | | 2,399 | |
|
|
|
|
|
| |
| Amortisation at 1st January 2004 | (229 | ) | – | | (229 | ) |
| Exchange adjustments | 7 | | – | | 7 | |
| Provision for the year | (94 | ) | – | | (94 | ) |
| Disposals | 1 | | – | | 1 | |
| Assets written off | 1 | | – | | 1 | |
|
|
|
|
|
| |
| Amortisation at 31st December 2004 | (314 | ) | – | | (314 | ) |
|
|
|
|
|
| |
| | | | | | | |
| Impairment at 1st January 2004 | (58 | ) | (23 | ) | (81 | ) |
| Exchange adjustments | 1 | | 1 | | 2 | |
| Impairment loss | (4 | ) | – | | (4 | ) |
| Disposals | – | | 1 | | 1 | |
|
|
|
|
|
| |
| Impairment at 31st December 2004 | (61 | ) | (21 | ) | (82 | ) |
|
|
|
|
|
| |
| Total amortisation and impairment at 31st December 2004 | (375 | ) | (21 | ) | (396 | ) |
|
|
|
|
|
| |
| Net book value at 1st January 2004 | 551 | | 1,146 | | 1,697 | |
|
|
|
|
|
| |
| Net book value at 31st December 2004 | 881 | | 1,122 | | 2,003 | |
|
|
|
|
|
| |
The additions to licences and patents in the year relate to the purchases of Fraxiparine and Arixtra product rights from Sanofi-Synthelabo, the OTC marketing rights for orlistat from Roche and various other compound rights (see Note 26).
Brands largely comprise a portfolio of products acquired with the acquisition of Sterling Winthrop Inc. in 1994, such as Panadol, Solpadeine and Hedex, and the products acquired with the acquisition of The Block Drug Company in 2001, such as Sensodyne, Polident and Poligrip. Each of these is considered to have an indefinite life given the strength and durability of the brand and the level of marketing support. Accordingly, they are not amortised. The valuation of each Sterling brand is reviewed annually using a 10 year cash flow forecast as this was the basis for the original independent assessment when they were acquired in 1994 and a post-tax discount rate of eight per cent. The valuation of each Block Drug brand is also reviewed annually using a five year cash flow forecast and a post-tax discount rate of eight per cent.
Back to Contents
| Notes to the financial statements GlaxoSmithKline | 109 |
| 17 Tangible fixed assets | | | Plant, | | | | | | | |
| Land and | equipment | Computer | Assets in | |
| buildings | and vehicles | software | construction | Total |
| | £m | £m | £m | £m | £m |
|
|
|
|
|
|
|
|
|
| |
| Cost at 1st January 2004 | 3,999 | | 7,206 | | 431 | | 768 | | 12,404 | |
| Exchange adjustments | (78 | ) | (91 | ) | (6 | ) | (3 | ) | (178 | ) |
| Additions | 91 | | 363 | | 8 | | 531 | | 993 | |
| Disposals | (61 | ) | (270 | ) | (13 | ) | (6 | ) | (350 | ) |
| Reclassifications | 113 | | 291 | | 133 | | (537 | ) | – | |
|
|
|
|
|
|
|
|
|
| |
| Cost at 31st December 2004 | 4,064 | | 7,499 | | 553 | | 753 | | 12,869 | |
|
|
|
|
|
|
|
|
|
| |
| Depreciation at 1st January 2004 | (1,112 | ) | (4,276 | ) | (239 | ) | – | | (5,627 | ) |
| Exchange adjustments | 25 | | 63 | | 4 | | – | | 92 | |
| Provision for the year | (122 | ) | (569 | ) | (94 | ) | – | | (785 | ) |
| Disposals | 29 | | 215 | | 12 | | – | | 256 | |
| Reclassifications | 8 | | (6 | ) | (2 | ) | – | | – | |
|
|
|
|
|
|
|
|
|
| |
| Depreciation at 31st December 2004 | (1,172 | ) | (4,573 | ) | (319 | ) | – | | (6,064 | ) |
|
|
|
|
|
|
|
|
|
| |
| Impairment at 1st January 2004 | (129 | ) | (157 | ) | (22 | ) | (28 | ) | (336 | ) |
| Exchange adjustments | 4 | | 2 | | – | | – | | 6 | |
| Impairment loss | (17 | ) | (9 | ) | (2 | ) | – | | (28 | ) |
| Disposals | 6 | | 17 | | – | | 1 | | 24 | |
|
|
|
|
|
|
|
|
|
| |
| Impairment at 31st December 2004 | (136 | ) | (147 | ) | (24 | ) | (27 | ) | (334 | ) |
|
|
|
|
|
|
|
|
|
| |
| Total depreciation and impairment at 31st December 2004 | (1,308 | ) | (4,720 | ) | (343 | ) | (27 | ) | (6,398 | ) |
|
|
|
|
|
|
|
|
|
| |
| Net book value at 1st January 2004 | 2,758 | | 2,773 | | 170 | | 740 | | 6,441 | |
|
|
|
|
|
|
|
|
|
| |
| Net book value at 31st December 2004 | 2,756 | | 2,779 | | 210 | | 726 | | 6,471 | |
|
|
|
|
|
|
|
|
|
| |
The net book value at 31st December 2004 of the Group’s land and buildings comprises freehold properties £2,557 million (at 1st January 2004 – £2,532 million), properties with leases of 50 years or more £143 million (at 1st January 2004 – £182 million) and properties with leases of less than 50 years £56 million (at 1st January 2004 – £44 million). Included in plant, equipment and vehicles at 31st December 2004 are leased assets with a cost of £93 million (at 1st January 2004 – £3 million), accumulated depreciation of £25 million (at 1st January 2004 – £2 million) and a net book value of £68 million (at 1st January 2004 – £1 million).
The impairment loss principally arises from decisions to rationalise facilities and is calculated based on either net realisable value or value in use, typically using a discount rate of eight per cent.
| 18 Fixed asset investments | Joint | | Associated | | Equity | | | |
| ventures | undertakings | investments | Total |
| | £m | £m | £m | £m |
|
|
|
|
|
|
|
| |
| At 1st January 2004 | 13 | | 183 | | 98 | | 294 | |
| Exchange adjustments | – | | (14 | ) | (5 | ) | (19 | ) |
| Additions | – | | 2 | | 84 | | 86 | |
| Impairment | – | | – | | (20 | ) | (20 | ) |
| Transfers | – | | (1 | ) | (4 | ) | (5 | ) |
| Disposals | – | | (31 | ) | (8 | ) | (39 | ) |
| Retained profit for the year | (1 | ) | 41 | | – | | 40 | |
| Goodwill amortisation | – | | (5 | ) | – | | (5 | ) |
|
|
|
|
|
|
|
| |
| At 31st December 2004 | 12 | | 175 | | 145 | | 332 | |
|
|
|
|
|
|
|
| |
Investments in joint ventures comprise £14 million share of gross assets (2003 – £15 million) and £2 million share of gross liabilities (2003 – £2 million).
The principal associated undertaking is Quest Diagnostics Inc., a US clinical laboratory business listed on the New York Stock Exchange. The investment has a book value at 31st December 2004 of £153 million (2003 – £158 million) and a market value of £908 million (2003 – £904 million). At 31st December 2004, the Group owned 18.6 per cent of Quest (2003 – 21 per cent). The book value includes goodwill which is being amortised over 20 years; the amortisation charge for 2004 was £5 million (2003 – £6 million). The goodwill at 31st December 2004 amounts to £61 million (2003 – £85 million). Goodwill of £80 million which relates to the continuing Group interest in Clinical Laboratories assets attributed to Quest, remains eliminated against Group reserves. Equity investments comprise listed investments of £91 million (2003 – £7 million) and unlisted investments of £54 million (2003 – £91 million). The market value of listed investments at 31st December 2004 was £98 million (2003 – £9 million).
Back to Contents
| 110 | GlaxoSmithKline Notes to the financial statements |
| 19 Equity investments | Total | |
| | £m |
|
| |
| At 1st January 2004 | 164 | |
| Exchange adjustments | (6 | ) |
| Additions | 19 | |
| Impairments | (5 | ) |
| Transfers | 5 | |
| Disposals | (24 | ) |
|
| |
| At 31st December 2004 | 153 | |
|
| |
Equity investments include listed investments of £127 million (2003 – £111 million). The market value of listed investments was £172 million (2003 – £184 million).
| 20 Stocks | 2004 | | 2003 | |
| £m | £m |
|
|
|
| |
| Raw materials and consumables | 629 | | 636 | |
| Work in progress | 644 | | 474 | |
| Finished goods | 919 | | 999 | |
|
|
|
| |
| | 2,192 | | 2,109 | |
|
|
|
| |
| 21 Debtors | 2004 | | 2003 | |
| | £m | £m |
|
|
|
| |
| Amounts due within one year | | | | |
| Trade debtors | 3,786 | | 3,715 | |
| Other debtors | 374 | | 532 | |
| Prepaid pension contributions | 733 | | 440 | |
| Other prepayments and accrued income | 282 | | 247 | |
|
|
|
| |
| Amounts due after one year | | | | |
| Other debtors | 596 | | 512 | |
| Prepayments and accrued income | 1 | | 10 | |
| Deferred taxation (Note 12) | 1,537 | | 1,441 | |
|
|
|
| |
| | 7,309 | | 6,897 | |
|
|
|
| |
Debtors include trading balances of £7 million (2003 – £1 million) due from joint ventures and associated undertakings. Other debtors due after one year include insurance recovery receivables which have been discounted using a risk-free rate of return.
| 22 Other creditors | | | 2003 | |
| 2004 | (restated) |
| | £m | £m |
|
|
|
| |
| Amounts due within one year | | | | |
| Trade creditors | 707 | | 686 | |
| Taxation (Note 12) | 1,598 | | 1,458 | |
| Social security | 114 | | 108 | |
| Other creditors | 351 | | 313 | |
| Accruals and deferred income | 3,110 | | 3,121 | |
| Dividends payable | 1,260 | | 1,333 | |
|
|
|
| |
| | 7,140 | | 7,019 | |
|
|
|
| |
| Amounts due after one year | | | | |
| Other creditors | 178 | | 130 | |
| Accruals and deferred income | 66 | | 102 | |
|
|
|
| |
| | 244 | | 232 | |
|
|
|
| |
Accruals include obligations for wages and salaries of £639 million (2003 – £689 million).
Back to Contents
| Notes to the financial statements GlaxoSmithKline | 111 |
| 23 Provisions for | | | | | | | | | | | | | | |
| liabilities and charges | Pensions and other | | | Legal | | | |
| | post-retirement | Manufacturing | Merger | and other | Deferred | Other | |
| benefits | restructuring | integration | disputes | taxation | provisions | Total |
| £m | £m | £m | £m | £m | £m | £m |
|
|
|
|
|
|
|
|
|
|
|
|
|
| |
| At 1st January 2004 | 807 | | 99 | | 305 | | 1,007 | | 618 | | 206 | | 3,042 | |
| Exchange adjustments | (40 | ) | (2 | ) | (5 | ) | (59 | ) | – | | (4 | ) | (110 | ) |
| Charge for the year | 145 | | (25 | ) | – | | 660 | | 142 | | 24 | | 946 | |
| Unwinding of discount | – | | – | | 4 | | 11 | | – | | 1 | | 16 | |
| Applied | (208 | ) | (25 | ) | (80 | ) | (545 | ) | – | | (122 | ) | (980 | ) |
| Reclassifications and other movements | 81 | | (1 | ) | – | | – | | (50 | ) | 85 | | 115 | |
|
|
|
|
|
|
|
|
|
|
|
|
|
| |
| At 31st December 2004 | 785 | | 46 | | 224 | | 1,074 | | 710 | | 190 | | 3,029 | |
|
|
|
|
|
|
|
|
|
|
|
|
|
| |
During 2004, the Group made special cash contributions totalling £256 million (2003 – £368 million) into the UK and US pension schemes. The contribution relating to the US pension scheme is included within the amounts applied to the provision above; the contributions relating to the UK pension scheme have increased the pension prepayment amount shown under debtors in Note 21.
The Group has recognised costs in previous years in respect of plans for manufacturing the other restructuring initiated in 1998, 1999 and in 2001 following the merger of Glaxo Wellcome and SmithKline Beecham and the acquisition of Block Drug. These plans are largely completed. Costs recognised as a provision, principally in respect of identified severances at sites where it has been announced that manufacturing activities will cease, are expected to be incurred mainly in 2005 and 2006. Costs of asset write-downs have been recognised as impairments of fixed assets.
The Group has recognised costs in previous years in respect of plans for the integration of the Glaxo Wellcome and SmithKline Beecham businesses. Implementation of the integration following the merger is substantially complete. Costs recognised as a provision in respect of identified severances are expected to be incurred in 2005 and in respect of the programme to encourage staff to convert Glaxo Wellcome or SmithKline Beecham share options into GlaxoSmithKline share options when employees exercise these options up to 2010. This latter provision was discounted by £21 million in 2004 (2003 – £28 million) using risk-free rates of return.
GlaxoSmithKline is involved in a number of legal and other disputes, including notification of possible claims. Provisions for legal and other disputes include amounts relating to US anti-trust, product liability, contract terminations, self-insurance, environmental clean-up and property rental. The company’s Directors, having taken legal advice, have established provisions after taking into account insurance and other agreements and having regard to the relevant facts and circumstances of each matter and in accordance with accounting requirements. These provisions were discounted by £11 million in 2004 (2003 – £25 million) using risk-free rates of return. GlaxoSmithKline has undertaken a review of its product liability claims and assessed that a number of products now have a history of claims made and settlements which makes it possible to use an IBNR (incurred but not reported) actuarial technique to determine a reasonable estimate of the Group’s exposure for unasserted claims in relation to those products. Apart from the IBNR provision, no provisions have been made for unasserted claims. The ultimate liability for such matters may vary from the amounts provided and is dependent upon the outcome of litigation proceedings, investigations and possible settlement negotiations.
It is in the nature of the Group’s business that a number of these matters, including those provided using the IBNR actuarial technique, may be the subject of negotiation and litigation over several years. The largest individual amounts provided are expected to be settled within three years.
For a discussion of legal issues, refer to Note 30, ‘Legal proceedings’.
24 Contingent liabilities
At 31st December 2004 contingent liabilities, comprising guarantees, discounted bills and other items arising in the normal course of business, amounted to £207 million (2003 – £236 million). For a discussion of tax issues, refer to Note 12, ‘Taxation’ and of legal issues, refer to Note 30, ‘Legal proceedings’.
Back to Contents
| 112 | GlaxoSmithKline Notes to the financial statements |
| | |
25 Net debt
| | 2004 | | 2003 | |
| | £m | | £m | |
|
|
|
| |
| Liquid investments | 2,818 | | 2,493 | |
| Cash at bank | 1,161 | | 962 | |
|
|
|
| |
| | 3,979 | | 3,455 | |
|
|
|
| |
| Loans and overdrafts due within one year: | | | | |
| 7.375 per cent US$ US Medium Term Note 2005 | (52 | ) | – | |
| 8.75 per cent sterling Euro Bond 2005 | (500 | ) | – | |
| Floating rate US$ European Medium Term Notes | – | | (277 | ) |
| 2.0 per cent CHF Bond 2004 | – | | (106 | ) |
| Commercial paper | (830 | ) | (836 | ) |
| Bank loans and overdrafts | (163 | ) | (230 | ) |
| Other loans | (2 | ) | (2 | ) |
| Obligations under finance leases | (35 | ) | (1 | ) |
|
|
|
| |
| | (1,582 | ) | (1,452 | ) |
|
|
|
| |
| Loans due after one year: | | | | |
| 7.375 per cent US$ Medium Term Note 2005 | – | | (56 | ) |
| 8.75 per cent sterling Euro Bond 2005 | – | | (499 | ) |
| 6.125 per cent US$ Notes 2006 | (260 | ) | (279 | ) |
| 2.375 per cent US$ US Medium Term Note 2007 | (260 | ) | – | |
| 3.375 per cent euro European Medium Term Note 2008 | (705 | ) | (699 | ) |
| 4.875 per cent sterling European Medium Term Note 2008 | (498 | ) | (498 | ) |
| 3.25 per cent euro European Medium Term Note 2009 | (348 | ) | (357 | ) |
| 4.375 per cent US$ US Medium Term Note 2014 | (772 | ) | – | |
| 5.25 per cent sterling European Medium Term Note 2033 | (975 | ) | (974 | ) |
| 5.375 per cent US$ US Medium Term Note 2034 | (258 | ) | – | |
| Loan Stock | (12 | ) | (13 | ) |
| Bank loans | (4 | ) | (4 | ) |
| Other loans and private financing | (231 | ) | (260 | ) |
| Obligations under finance leases | (58 | ) | (12 | ) |
|
|
|
| |
| | (4,381 | ) | (3,651 | ) |
|
|
|
| |
| Net debt | (1,984 | ) | (1,648 | ) |
|
|
|
| |
At the balance sheet date the Group’s liquid investments had an aggregate market value of £2,820 million (2003 – £2,509 million). Liquid investments include redeemable preference shares, which are fully collateralised with highly rated bonds, of £1 billion (2003 – £1 billion).
Loans and overdrafts due within one year
Commercial paper comprises a US$10 billion programme, of which $1,593 million (£830 million) was in issue at 31st December 2004 (2003 – $1,497 million (£836 million)), backed up by committed facilities of 364 days duration of $900 million (£469 million) (2003 – $1,404 million (£784 million)) renewable annually, and liquid investments as shown in the table above.
The weighted average interest rate on commercial paper borrowings at 31st December 2004 was 2.35 per cent (2003 – 1.1 per cent).
The weighted average interest rate on bank loans and overdrafts due within one year at 31st December 2004 was 3.0 per cent.
Loans due after one year
In 2004, three bonds were issued under the US Medium Term Note programme; a US$500 million, 2.375 per cent coupon bond, a US$1.5 billion, 4.375 per cent coupon bond, a US$500 million, 5.375 per cent coupon bond.
Loans due after one year are repayable over various periods as follows:
| | 2004 | | 2003 | |
| | £m | | £m | |
|
|
|
| |
| Between one and two years | 289 | | 562 | |
| Between two and three years | 279 | | 281 | |
| Between three and four years | 1,210 | | 2 | |
| Between four and five years | 352 | | 1,199 | |
| After five years | 2,251 | | 1,607 | |
|
|
|
| |
| | 4,381 | | 3,651 | |
|
|
|
| |
The loans repayable after five years carry interest at effective rates between 4.4 per cent and 5.4 per cent. The repayment dates range from 2010 to 2034.
Back to Contents
| Notes to the financial statements GlaxoSmithKline | 113 |
| | |
25 Net debt continued
Secured loans
Loans amounting to £11 million (2003 – £13 million) are secured by charges on fixed and current assets.
| | 2004 | | 2003 | |
| Finance lease obligations | £m | | £m | |
|
|
|
| |
| Rental payments due within one year | 36 | | 1 | |
| Rental payments due between one and two years | 28 | | 2 | |
| Rental payments due between two and three years | 17 | | 1 | |
| Rental payments due between three and four years | 5 | | 1 | |
| Rental payments due between four and five years | 3 | | 2 | |
| Rental payments due after five years | 7 | | 6 | |
|
|
|
| |
| Total future rental payments | 96 | | 13 | |
| Future finance charges | (3 | ) | – | |
|
|
|
| |
| Total finance lease obligations | 93 | | 13 | |
|
|
|
| |
Financial instruments
Further information is given in Note 34.
26 Commitments
| | 2004 | | 2003 | |
| Capital commitments | £m | | £m | |
|
|
|
| |
| Contracted for but not provided in the financial statements: | | | | |
| Intangible fixed assets | 1,256 | | 1,412 | |
| Tangible fixed assets | 235 | | 171 | |
|
|
|
| |
| | 1,491 | | 1,583 | |
|
|
|
| |
A number of commitments were made in 2004 under licensing and other agreements, principally with Theravance Inc., Exelixis Inc., Tanabe Seiyaku Co. Ltd., and Human Genome Sciences, Inc.
The Group also has other commitments of £85 million (2003 – £144 million) relating to revenue payments to be made under licences and other alliances, principally to Exelixis Inc.
| | 2004 | | 2003 | |
| Commitments under operating leases to pay rentals for the next year | £m | | £m | |
|
|
|
| |
| Operating leases on land and buildings which expire: | | | | |
| In one year or less | 4 | | 6 | |
| Between one and five years | 16 | | 19 | |
| After five years | 30 | | 35 | |
|
|
|
| |
| | 50 | | 60 | |
|
|
|
| |
| Operating leases on plant, equipment and vehicles which expire: | | | | |
| In one year or less | 10 | | 8 | |
| Between one and five years | 23 | | 50 | |
| After five years | – | | 2 | |
|
|
|
| |
| | 33 | | 60 | |
|
|
|
| |
| Commitments under operating leases to pay rentals in future years | | | | |
|
|
|
| |
| 2005 | 83 | | 94 | |
| 2006 | 73 | | 78 | |
| 2007 | 54 | | 54 | |
| 2008 | 42 | | 43 | |
| 2009 | 36 | | 36 | |
| 2010 and thereafter | 119 | | 122 | |
|
|
|
| |
| | 407 | | 427 | |
|
|
|
| |
Back to Contents
| 114 | GlaxoSmithKline Notes to the financial statements |
| | |
| | Ordinary Shares of 25p each | | Share
premium
account
£m | |
| |
| |
| 27 Share capital and share premium account | Number | | £m | |
|
|
|
|
|
| |
| Share capital authorised | | | | | | |
| At 31st December 2002 | 10,000,000,000 | | 2,500 | | | |
| At 31st December 2003 | 10,000,000,000 | | 2,500 | | | |
| At 31st December 2004 | 10,000,000,000 | | 2,500 | | | |
|
|
|
|
|
| |
| Share capital issued and fully paid | | | | | | |
| At 1st January 2002 | 6,172,965,989 | | 1,543 | | 170 | |
| Share capital issued under share option schemes | 7,049,394 | | 2 | | 54 | |
| Share capital purchased and cancelled | (155,749,038 | ) | (39 | ) | – | |
|
|
|
|
|
| |
| At 31st December 2002 | 6,024,266,345 | | 1,506 | | 224 | |
| Share capital issued under share option schemes | 6,041,283 | | 1 | | 40 | |
| Share capital purchased and cancelled | (80,844,000 | ) | (20 | ) | – | |
|
|
|
|
|
| |
| At 31st December 2003 | 5,949,463,628 | | 1,487 | | 264 | |
| Share capital issued under share option schemes | 6,300,203 | | 2 | | 40 | |
| Share capital purchased and cancelled | (18,075,000 | ) | (5 | ) | – | |
|
|
|
|
|
| |
| At 31st December 2004 | 5,937,688,831 | | 1,484 | | 304 | |
|
|
|
|
|
| |
| | | | | | | |
| | 31st December
2004 | | 31st December
2003 | | 31st December
2002 | |
|
|
|
|
|
| |
| | | | | | | |
| Number (‘000) of shares issuable under outstanding options (Note 36) | 276,954 | | 259,990 | | 217,953 | |
|
|
|
|
|
| |
| Number (‘000) of unissued shares not under option | 3,785,358 | | 3,790,546 | | 3,757,781 | |
|
|
|
|
|
| |
At 31st December 2004, of the issued share capital, 174,527,097 shares were held in the ESOP Trust, 69,948,000 shares were held in Treasury and 5,693,213,734 shares were in free issue.
In October 2002, GlaxoSmithKline commenced a new £4 billion share buy-back programme. This followed the completion of the £4 billion buy-back programme announced in 2001. A total of £2.2 billion has been spent on the new share buy-back programme, of which £1 billion was spent in 2004. The exact amount and timing of future purchases, and whether some repurchased shares will be held as Treasury shares or be cancelled, will be determined by the company and is dependent on market conditions and other factors. No shares were purchased in the period 1st January 2005 to 10th February 2005. In the period 11th February 2005 to 25th February 2005 a further 5.55 million shares have been purchased at a cost of £70 million. All purchases were through the publicly announced buy-back programme.
The table below sets out the monthly purchases under the current share buy-back programme:
| | | | Average share price excluding | |
| | Number of shares | | commisson and stamp duty | |
| Month | (000) | | £ | |
|
|
|
| |
| January 2004 | Nil | | – | |
| February 2004 | 4,950 | | 11.09 | |
| March 2004 | 20,545 | | 10.81 | |
| April 2004 | 1,010 | | 11.85 | |
| May 2004 | 7,832 | | 11.73 | |
| June 2004 | 10,156 | | 11.43 | |
| July 2004 | 1,800 | | 11.06 | |
| August 2004 | 11,850 | | 10.88 | |
| September 2004 | 8,485 | | 11.72 | |
| October 2004 | Nil | | – | |
| November 2004 | 10,305 | | 11.60 | |
| December 2004 | 11,090 | | 11.64 | |
|
|
|
| |
| Total | 88,023 | | 11.29 | |
|
|
|
| |
For details of substantial shareholdings refer to ‘Substantial shareholdings’ on page 177.
28 Non-equity minority interests
At 1st January 2004 SmithKline Beecham Holdings Corporation (SBH Corp), a subsidiary incorporated in Delaware, USA, had in issue $500 million of Flexible Auction Market Preferred Stock (Flex AMPS), comprising 5,000 shares of $100,000 each, issued in six series. SBH Corp also had in issue $400 million of Auction Rate Preference Stock (ARPS), comprising 4,000 shares of $100,000 each issued in five series. The ARPS and the Flex AMPS together constituted the preference shares, which represented the non-equity minority interests. These were redeemed in March and April 2004.
Back to Contents
| Notes to the financial statements GlaxoSmithKline | 115 |
29 Reserves
| | Other | | Profit and | | | |
| | reserves | | loss account | | Total | |
| | (restated) | | (restated) | | (restated) | |
| | £m | | £m | | £m | |
|
|
|
|
|
| |
| At 31st December 2001 as previously reported | 1,866 | | 3,811 | | 5,677 | |
| Prior year adjustment – implementation of UITF 17 (revised) and UITF 38 | (2,970 | ) | 63 | | (2,907 | ) |
|
|
|
|
|
| |
| At 31st December 2001 as restated | (1,104 | ) | 3,874 | | 2,770 | |
| Exchange movements | – | | (82 | ) | (82 | ) |
| UK tax on exchange movements | – | | (65 | ) | (65 | ) |
| Ordinary shares purchased and cancelled | 39 | | (2,220 | ) | (2,181 | ) |
| Investment in ESOP shares | 144 | | (67 | ) | 77 | |
| Profit attributable to shareholders | – | | 3,930 | | 3,930 | |
| Dividends | – | | (2,346 | ) | (2,346 | ) |
| Unrealised profit on disposal of intellectual property | – | | 7 | | 7 | |
|
|
|
|
|
| |
| At 31st December 2002 | (921 | ) | 3,031 | | 2,110 | |
| Exchange movements | – | | 113 | | 113 | |
| Tax on exchange movements and unrealised profits | – | | (92 | ) | (92 | ) |
| Ordinary shares purchased and cancelled | 20 | | (980 | ) | (960 | ) |
| Investment in ESOP shares | 97 | | (64 | ) | 33 | |
| Profit attributable to shareholders | – | | 4,478 | | 4,478 | |
| Dividends | – | | (2,374 | ) | (2,374 | ) |
| Unrealised profit on disposal of intellectual property | – | | 7 | | 7 | |
| Revaluation of goodwill due to exchange | _ | | (7 | ) | (7 | ) |
|
|
|
|
|
| |
| At 31st December 2003 | (804 | ) | 4,112 | | 3,308 | |
| Goodwill written back | – | | 20 | | 20 | |
| Exchange movements | – | | (54 | ) | (54 | ) |
| Tax on exchange movements and unrealised profits | – | | (73 | ) | (73 | ) |
| Ordinary shares purchased and cancelled | 5 | | (201 | ) | (196 | ) |
| Ordinary shares purchased and held as Treasury shares | – | | (799 | ) | (799 | ) |
| Investment in ESOP shares | 155 | | (129 | ) | 26 | |
| Profit attributable to shareholders | – | | 4,302 | | 4,302 | |
| Dividends | – | | (2,402 | ) | (2,402 | ) |
| Unrealised loss on disposal of intellectual property | – | | (1 | ) | (1 | ) |
| Revaluation of goodwill due to exchange | – | | 6 | | 6 | |
|
|
|
|
|
| |
| At 31st December 2004 | (644 | ) | 4,781 | | 4,137 | |
|
|
|
|
|
| |
Goodwill arising on acquisitions before 1st January 1998 which has been written off against profit and loss account reserves amounts to £6,180 million, including goodwill of £4,840 million previously held as a goodwill reserve which was offset against profit and loss account reserves in 2000. The goodwill written back in 2004 relates to the disposal of part of the Group’s holding in Quest Diagnostics Inc. and the disposal of the Group’s holding in GlaxoSmithKline Pharmaceuticals (Chongqing) Limited. Goodwill denominated in local currencies which is subject to revaluation amounted to £294 million at 31st December 2004. Goodwill on acquisitions after 1st January 1998 has been capitalised, in accordance with the accounting policy set out in Note 2.
Exchange movements taken to reserves in 2004 include losses of £86 million (2003 – losses £27 million, 2002 – losses £1,179 million) on foreign currency loans less deposits, gains of £38 million (2003 – gains £133 million, 2002 – gains £1,097 million) on the retranslation of net assets and £6 million (2003 – £7 million, 2002 – £nil) on goodwill eliminated against reserves. The tax on exchange movements and unrealised profits in 2004 of £73 million (2003 – £92 million, 2002 – £65 million) relates to the taxable element of the foreign currency loans less deposits and unrealised profits taken to reserves.
Exchange adjustments debited to reserves cumulatively amount to £1,291 million (2003 – £1,243 million, 2002 – £1,356 million).
Other reserves include the merger reserve created on the merger of Glaxo Wellcome and SmithKline Beecham amounting to £1,561 million at 31st December 2004 (2003 – £1,561 million; 2002 – £1,561 million). Other reserves also include the capital redemption reserve created as a result of the share buy-back programme amounting to £81 million at 31st December 2004 (2003 – £76 million, 2002 – £56 million). Following the implementation of UITF 38, investments in own shares held by the ESOP Trusts amounting to £2,574 million at 31st December 2004 (2003 – £2,729 million, 2002 – £2,826 million) are now shown as a deduction from other reserves.
Total reserves amounted to £4,137 million at 31st December 2004 (2003 – £3,308 million, 2002 – £2,110 million), of which £8,303 million (2003 – £8,981 million; 2002 – £10,879 million) relates to the company and £97 million (2003 – £86 million, 2002 – £76 million) relates to joint ventures and associated undertakings.
The profit of GlaxoSmithKline plc for the year was £2,719 million (2003 – £1,436 million, 2002 – £10,598 million), which after dividends of £2,402 million (2003 – £2,374 million, 2002 – £2,352 million), gave a retained profit of £317 million (2003 – loss £938 million, 2002 – profit £8,246 million). After the cost of shares purchased and cancelled of £201 million (2003 – £980 million, 2002 – £2,220 million), shares purchased and held as Treasury shares of £799 million (2003 – £nil, 2002 – £nil) and an unrealised profit on capital reduction by subsidiary of £nil (2003 – £nil, 2002 – £4,096 million), the profit and loss account reserve at 31st December 2004 stood at £8,222 million (2003 – £8,905 million, 2002 – £10,823 million), of which £4,096 million is unrealised (2003 – £4,096 million, 2002 – £4,096 million).
Back to Contents
| 116 | GlaxoSmithKline Notes to the financial statements |
30 Legal proceedings
The Group is involved in various legal and administrative proceedings, principally product liability, intellectual property, tax, anti-trust and governmental investigations and related private litigation. The Group makes provision for these proceedings on a regular basis as summarised in Notes 2 and 23. The Group may make additional significant provisions for such legal proceedings, as required in the event of further developments in these matters, consistent with generally accepted accounting principles. Litigation, particularly in the USA, is inherently unpredictable and excessive awards that may not be justified by the evidence may occur. The Group could in the future incur judgments or enter into settlements of claims that could result in payments that exceed its current provisions by an amount that would have a material adverse effect on the Group’s financial condition and results of operations.
Intellectual property claims include challenges to the validity of the Group’s patents on various products or processes and assertions of non-infringement of those patents. A loss in any of these cases could result in loss of patent protection for the product at issue. The consequence of any such loss could be a significant decrease in sales of that product and could materially affect future results of operations for the Group.
Legal expenses incurred, relating to the defence of the Group’s intellectual property, and litigation costs and provisions related to product liability claims on existing products, are charged to selling, general and administration costs. Litigation costs and provisions relating to legal claims on withdrawn products, anti-trust and pricing matters are charged to other operating income/expense. Provisions are made, after taking appropriate legal advice, when a reasonable estimate can be made of the likely outcome of the dispute. In 2004 the Group established an actuarially determined provision for product liability claims incurred but not yet reported as described in Note 23. At 31st December 2004 the Group’s aggregate provision for legal and other disputes (not including tax matters described under ‘Taxation’ in Note 12) was just over £1 billion. The ultimate liability for legal claims may vary from the amounts provided and is dependent upon the outcome of litigation proceedings, investigations and possible settlement negotiations.
The most significant of those matters are described below.
Intellectual property
USA
Paxil
In the USA a number of distributors of generic drugs filed applications with the FDA to market generic versions of Paxil/Seroxat (paroxetine hydrochloride) prior to the expiration in 2006 of the Group’s patent on paroxetine hydrochloride hemihydrate. Apotex launched its generic version of Paxil in September 2003. Other distributors sought to bring to market anhydrate or other versions of paroxetine hydrochloride and in one case paroxetine mesylate. In response the Group filed actions against all those distributors for infringement of various of the Group’s patents on the basis that the generic anhydrate and other versions infringe because they contain and/or convert to the hemihydrate form and/or infringe other Group patents.
In July 1998, GlaxoSmithKline filed an action against Apotex in the US District Court for the Northern District of Illinois for infringement of the Group’s patent for paroxetine hydrochloride hemihydrate. Apotex had filed an Abbreviated New Drug Application (ANDA) with the US Food and Drug Administration (FDA) seeking approval to introduce a generic form of Paxil. Following a trial in February 2003 the judge ruled GlaxoSmithKline’s patent valid but not infringed by Apotex’s product. On the Group’s appeal of the ruling of non-infringement, the US Court of Appeals for the Federal Circuit (CAFC), which hears all appeals from US District Courts on patent matters, ruled that the Group’s patent was infringed but invalid based upon ‘public use’ in clinical trials prior to the filing date in the USA. The Group filed a petition to the CAFC for rehearing of its appeal by the full court but as of the date of this report no decision on that petition has yet been announced.
In June 1999, GlaxoSmithKline filed an action against Geneva Pharmaceuticals, a subsidiary of Novartis Pharmaceuticals, in the US District Court for the Eastern District of Pennsylvania for infringement of the Group’s patents for paroxetine hydrochloride following notice of Geneva’s ANDA filing. That case has been consolidated with similar infringement actions against other generic companies that subsequently filed ANDAs. Additional infringement actions have been brought based on patents issued subsequent to the original filing against Apotex in the Northern District of Illinois. The Group also filed an action against Apotex relating to those new patents in the Eastern District of Pennsylvania. In December 2002 the judge granted in part and denied in part summary judgement motions filed by Apotex with the result that issues of validity and infringement of three of the four new patents remain for trial. The Group has petitioned the District Court to permit an interim appeal to the CAFC of summary rulings that one of the four new patents and certain claims of the other three are invalid. In June 2003 the Group requested the FDA to remove three patents related to Paxil from the register of pharmaceutical patents maintained by the FDA (the Orange Book). The delisting did not affect the validity of these patents or the related patent litigation. Following FDA approval of its ANDA, Apotex subsequently launched a generic version of Paxil in September 2003.
The Group continues to pursue patent infringement claims in litigation in the Eastern District of Pennsylvania against Apotex, Geneva, Alphapharm, Andrx, Teva Pharmaceuticals and Zenith, and bulk suppliers BASF and Sumika Fine Chemicals. Apotex, Alphapharm, BASF and Sumika have filed counterclaims in these actions alleging that the Group has violated anti-trust or unfair competition laws. In February 2003 the CAFC heard Apotex’s appeal from a decision by the US District Court for the District of Columbia denying Apotex’s request that the FDA be required to delist certain of the Group’s patents for Paxil from the Orange Book. In October 2003 the CAFC affirmed the district court decision and dismissed the case. Certain but not all of the claims and counterclaims with respect to Geneva, Alphapharm, BASF and Sumika have now been settled.
In March 2000, GlaxoSmithKline filed an action against Pentech Pharmaceuticals in the US District Court for the Northern District of Illinois for infringement of the Group’s patents for paroxetine hydrochloride. Pentech filed an ANDA for a capsule version of Paxil, asserting that its compound and presentation do not infringe the Group’s patents or that the patents are invalid.
Back to Contents
| Notes to the financial statements GlaxoSmithKline | 117 |
30 Legal proceedings continued
In April 2003, the Group reached a settlement with Pentech and Par Pharmaceuticals to which Pentech had granted rights under Pentech’s ANDA for paroxetine hydrochloride capsules.
The settlement allowed Par to distribute in Puerto Rico substitutable generic paroxetine hydrochloride immediate release tablets supplied and licensed from the Group for a royalty payable to the Group. Par became entitled to distribute the same product in the US market once Apotex’s generic version of Paxil became available there in September 2003. In the settlement Par and Pentech acknowledge that the GlaxoSmithKline patent covering the hemihydrate form of paroxetine hydrochloride is valid and enforceable and would be infringed by Pentech’s proposed capsule product. The Bureau of Competition of the US Federal Trade Commission reviewed the settlement. The review was voluntary and was conducted at the request of the Group, Par and Pentech. Pentech’s former supplier Asahi Glass Co. filed claims alleging that the settlement violated the anti-trust laws. Those claims have been dismissed by the court. Similar claims brought by Apotex and Sumika are pending in the US District Court for the Eastern District of Pennsylvania.
Zofran
In August 2001 the Group commenced an action in the US District Court for the District of New Jersey against Reddy-Cheminor and Dr Reddy’s Laboratories. Dr Reddy had certified invalidity of three patents for ondansetron, the active ingredient in Zofran tablets, including the compound patent that expires in July 2005 and two method of use patents, the later of which expires in December 2006, in both instances taking into account the extension for paediatric exclusivity. In July 2003 the Group filed an action against Dr Reddy’s Laboratories in the same district court for infringement of the Group’s patents related to the orally disintegrating tablet presentation of Zofran. In October 2003 the Group filed an action against West-ward Pharmaceuticals, Inc. in the same district court for infringement of the Group’s patents related to an injectable presentation of Zofran. Both the Dr Reddy disintegrating tablet case and the West-ward case were consolidated with the earlier Dr Reddy case. Prior to trial both Reddy-Cheminor and West-ward withdrew their challenges to the compound patent. The trial over infringement of the Group’s method of use and process patents was completed in June 2004 but as of the date of this report closing arguments have not been held and no decision has been announced.
In March 2002, the Group filed a similar action against Teva Pharmaceuticals USA Inc. in the US District Court for the District of Delaware alleging infringement of the two method of use patents for ondansetron. Teva had certified invalidity or non-infringement of the two method of use patents. Teva did not challenge the compound patent. The trial judge ruled in the Group’s favour, upholding the validity of the method of use patents. Teva appealed that decision to the CAFC and oral argument is expected in the third quarter of 2005. In September 2003, November 2003 and January 2004 the Group filed actions against Teva in the same court for infringement of the Group’s patents related to the injectable and orally disintegrating tablet presentations of Zofran. These cases were consolidated into the case now on appeal.
An earlier ondansetron case, involving orally disintegrating Zofran tablets, was commenced by the Group in January 2003 against Kali Laboratories in the US District Court for the District of New Jersey. Both Kali and the Group have subsequently filed motions for summary judgement.
In June 2003, the Group commenced an action in the US District Court for the District of New Jersey against the Faulding Pharmaceutical Company alleging infringement of the two method of use patents for ondansetron. Faulding did not challenge the compound patent. That case, as of the date of this report, has been stayed pending decisions in the Teva, Reddy and Kali cases.
In August 2004, the Group commenced an action in the US District Court for the District of New Jersey against Pliva alleging infringement of the Group’s patent for a reduced crystal size of ondansetron, which expires in March 2012 taking into account the extension for paediatric exclusivity. Pliva did not challenge the compound patent or the emesis use patents. The case is in its preliminary stages.
In January 2005, the Group commenced two additional actions, both in the US District Court for the District of New Jersey, for the same reduced crystal size patent against Kali and Apotex. In contrast to its previous ANDA for orally disintegrating tablets, Kali did not challenge the emesis use patents in its recent ANDA for oral tablets nor did it challenge the compound patent. Apotex did not challenge either compound or emesis use patents in connection with their ANDA.
Lamictal
In August 2002, the Group commenced an action in the US District Court for the District of New Jersey against Teva Pharmaceuticals USA, Inc., alleging infringement of the Group’s compound patent for lamotrigine, the active ingredient in Lamictal oral tablets. That patent affords protection through January 2009 after giving effect to an expected grant of paediatric exclusivity by FDA. The defendant had filed an ANDA with the FDA with a certification of invalidity of the Group’s patent. The Hatch-Waxman stay on the FDA approval of that ANDA has expired. The trial in the Teva case concluded in January 2005. Following the trial the parties reached a settlement agreement subject to government review, pursuant to which the Group has granted Teva an exclusive royalty-bearing licence to distribute in the USA a generic version of lamotrigine chewable tablets on a date not later than June 2005 and the exclusive right to manufacture and sell Teva’s own generic version of lamotrigine tablets in the USA with an expected launch date in 2008.
Imitrex
In December 2003, the Group commenced an action in the US District Court for the Southern District of New York against Dr Reddy’s Laboratories, alleging infringement of one of two primary compound patents for sumatriptan, the active ingredient in Imitrex. The patent at issue affords protection through February 2009 after giving effect to a grant of paediatric exclusivity by the FDA. The defendant has filed an ANDA with the FDA with a certification of invalidity of that compound patent but did not certify invalidity or non-infringement of the second compound patent that expires in June 2007 after giving effect to paediatric exclusivity. The case is in its early stages. Six other generic companies have filed ANDAs for Imitrex but of those only Cobalt Pharmaceuticals has certified invalidity of the same compound patent at issue in the Dr. Reddy’s case. The Group has commenced an infringement action against Cobalt which has recently been transferred to the US District Court for the Southern District of New York. In February 2005, the Group commenced an action in the US District Court for the District of Delaware against Spectrum Pharmaceuticals, alleging infringement of the same compound patent at issue in the Dr. Reddy’s case. Spectrum filed its certification of invalidity or non-infringement of that patent as part of an ANDA filing for approval for sumatriptan injection. The case is in its early stages.
Back to Contents
| 118 | GlaxoSmithKline Notes to the financial statements |
30 Legal proceedings continued
Valtrex
In May 2003, the Group commenced an action in the US District Court for the District of New Jersey against Ranbaxy Laboratories, alleging infringement of the Group’s compound patent for valaciclovir, the active ingredient in Valtrex. That patent expires in 2009. The defendant has filed an ANDA with the FDA with a certification of invalidity of the Group’s compound patent and non-infringement of two other patents expiring in 2016 that are listed in the Orange Book. FDA approval of that ANDA is stayed until the earlier of October 2005 or resolution of the patent infringement litigation. Discovery is underway in the case.
Avandia and Avandamet
In August 2003, the Group filed an action in the US District Court for the District of New Jersey against Teva Pharmaceuticals USA Inc. for infringement of the Group’s patent relating to the maleate salt form of rosiglitazone, the active ingredient in Avandia, which expires in 2015. In September 2003 the Group filed a comparable action in the same court against Dr Reddy’s Laboratories, alleging infringement of the same patent for the maleate salt form. Both Dr Reddy’s Laboratories and Teva filed ANDAs with the FDA with certifications of invalidity of the Group’s maleate salt patent. FDA approval of those ANDAs is stayed until the earlier of November 2006 or resolution of the respective patent infringement actions.
Teva subsequently filed an additional certification challenging the validity of the Group’s basic compound patent for rosiglitazone, and in January 2004 the Group commenced an action against Teva in the same court for infringement of that patent. The basic compound patent currently expires in 2008, although expiry is expected to be extended to 2012 after the US Patent and Trademark Office has granted patent term restoration.
In January 2005, the Group filed an action in the US District Court for the District of New Jersey against Teva for infringement of the same two patents. Teva had filed an ANDA with the FDA for a generic version of Avandamet with certifications of invalidity and non-infringement of those patents. FDA approval of that ANDA is stayed until the earlier of June 2007 or resolution of the patent infringement action but since Avandamet is protected by the same patents as Avandia, should the Avandia patents at issue be found invalid during the litigation with Teva or Dr. Reddy’s, that ruling would be dipositive for Avandamet as well.
Wellbutrin XL
In December 2004, Biovail commenced actions in the US District Court for the Central District of California against Anchen Pharmaceuticals and in the US District Court for the Southern District of Florida against Abrika Pharmaceuticals, in each case alleging infringement of Biovail formulation patents for Wellbutrin XL. Those patents expire in 2018. Each of Anchen and Abrika had filed an ANDA with the FDA with a certification of invalidity or non-infringement of the Biovail patents. FDA approval of each of those ANDAs is stayed until the earlier of May 2007 or resolution of the applicable patent infringement action. The Group is a party to the action as a licensee under those patents and owner of the New Drug Application for Wellbutrin XL. Both cases are in their early stages.
Advair
In September 2004, the Group applied to the US Patent and Trademark Office (USPTO) for re-issue of its combination patent for Advair, an inhaled combination of salmeterol and fluticasone propionate, which expires in September 2010. This followed an internal review which concluded that the language in the patent may not accurately describe all of the circumstances of the invention and may not claim the invention as precisely as it could. The objective of seeking re-issuance is to strengthen the protection afforded by the patent. It is expected that the administrative process with the USPTO will take one to two years. While the application for re-issue is pending, the patent remains in force and is listed in the Orange Book.
The Group holds other patents relating to Advair which are not affected by the re-issue application, including the compound patent related to the active ingredient salmeterol which affords protection through August 2008 (after giving effect to an expected grant of paediatric exclusivity by the FDA), various patents relating to the Diskus device which expire over a period from 2011 to 2016 and patents relating to the HFA formulation and related technology which expire over a period from 2015 to 2021.
Levitra
In October 2002, Pfizer Inc. filed an action against Bayer AG and GlaxoSmithKline in the US District Court for the District of Delaware, alleging that the manufacture and sale of Levitra (vardenafil) would infringe a patent newly issued to Pfizer and asking that Bayer and GlaxoSmithKline be permanently enjoined. In September 2003 the US Patent and Trademark Office initiated a re-examination of the Pfizer patent based on questions of patentability in light of prior art. The Pfizer action, including an additional suit filed in the same court following the launch of Levitra in the USA, was predicated on the validity of that patent and was stayed pending the outcome of the re-examination. In December 2004 the parties entered into an agreement to settle patent infringement and validity proceedings on a worldwide basis, including the US action.
Cervarix
In February 2005, Merck & Co. and the Group announced a cross licence and settlement agreement for certain patent rights related to human papillomavirus (HPV) vaccine. The Group will receive an upfront payment and royalties from Merck based upon sales of an HPV vaccine upon development and launch. The agreement resolves competing intellectual property claims related to the Merck and GlaxoSmithKline HPV vaccines, respectively.
UK and Europe
Seroxat
Following settlement in August 2004 of most of the Group’s patent litigation with Synthon BV, Synthon is free to market its paroxetine mesylate product in many markets globally where it has obtained marketing authorisations. Paroxetine mesylate is a different salt form of paroxetine than that used in the marketed form of Seroxat/Paxil. In certain markets patent litigation with Synthon is ongoing and Synthon is asserting counterclaims for unfair competition against the Group.
Back to Contents
| Notes to the financial statements GlaxoSmithKline | 119 |
30 Legal proceedings continuedAnother generic version of Seroxat/Paxil’s active ingredient is paroxetine hydrochloride anhydrate. Generic products containing the anhydrate are now on the market in most European countries. Whilst some of these products are the subject of continuing litigation, most actions have now been settled and it is expected that more will be settled in the future. In the UK, litigation of several years standing between the Group and Apotex culminated in an Appeal Court decision that the Group’s anhydrate process patent was valid but not infringed. That decision is not subject to further appeal. As a result of the litigation, Apotex was enjoined from launching its product for about one year but it is now on the market. A damages enquiry relating to the injunction will take place in due course.
Product liability
Paxil
The Group has received lawsuits and claims filed on behalf of patients alleging that they have suffered symptoms on discontinuing treatment with Paxil (paroxetine). Separately, the Group has received lawsuits and claims that patients who had commenced Paxil treatment committed or attempted to commit suicide and/or acts of violence. There are also private consumer lawsuits alleging that the Group concealed and misrepresented data from paediatric clinical trials of Paxil.
The Group has received lawsuits filed in state and federal courts in the USA and Canada on behalf of thousands of plaintiffs, including 14 purported class actions, alleging that paroxetine (the active ingredient in Paxil) is addictive and causes dependency and withdrawal reactions. Plaintiffs seek remedies including compensatory, punitive and statutory damages and the cost of a fund for medical monitoring. In 2003 a federal judge in the US District Court for the Central District of California denied class action certifications for a nationwide class and a California statewide class as to cases filed in federal court in that district. Subsequently, on petition from plaintiffs’ counsel all federal court cases have been transferred to that District Court for consolidation in Multidistrict Litigation (MDL). The first five cases are scheduled to start trial in the MDL court in May 2005. There has been no determination as to whether any of the other lawsuits pending in the MDL or in state courts will be permitted to proceed as class actions.
The Group has received a number of claims and lawsuits alleging that treatment with Paxil has caused homicidal or suicidal behaviour exhibited by users of the product. None of these are or purport to be class actions. In October 2004 the FDA announced that it would require a black box warning about suicidality and other strengthened warnings for selective serotonin reuptake inhibitor (SSRI) products, including Paxil, as a class.
Avandia
The Group has received lawsuits and claims filed in state and federal courts in the USA on behalf of numerous patients alleging that rosiglitazone (the active ingredient in Avandia) has caused congestive heart failure or liver damage. None of the cases purports to be a class action. Most of the cases are in their early stages although certain state court trials are scheduled to take place in 2005.
Phenylpropanolamine
Following a report from the Yale Haemorrhagic Stroke Project that found a suggestion of an association between first use of phenylpropanolamine (‘PPA’) decongestant and haemorrhagic stroke, the Group and most other manufacturers have voluntarily withdrawn consumer healthcare products in which PPA was an active ingredient. Since the PPA product withdrawal the Group has been named as a defendant in numerous personal injury and class action lawsuits filed in state and federal courts alleging personal injury or increased risk of injury from use of products containing PPA and unfair and deceptive business practices. Plaintiffs seek remedies including compensatory and punitive damages and refunds. The federal cases have been consolidated in a multidistrict litigation proceeding in the US District Court for the District of Washington. The judge responsible for those proceedings has denied class certification and struck all class allegations in the federal personal injury and consumer refund class actions. A limited number of cases in which the Group or other manufacturers are defendants are now reaching trial in state courts. Class certification has been denied in California state court and a Pennsylvania state court putative class action has been dismissed, leaving no putative class actions pending against the Group in this litigation.
Baycol
In August 2001, Bayer AG withdrew Baycol (cerivastatin sodium) worldwide in light of reports of adverse events, including deaths, involving rhabdomyolosis. GlaxoSmithKline had participated in the marketing of Baycol in the USA pursuant to a co-promotion agreement with Bayer which was the licence holder and manufacturer of the product.
Following the withdrawal, Bayer and GlaxoSmithKline have been named as defendants in thousands of lawsuits filed in state and federal courts in the USA on behalf of both individuals and putative classes of former Baycol users. A number of the suits allege that the plaintiffs have suffered personal injuries, including rhabdomyolosis, from the use of Baycol. Others claim that persons who took Baycol, although not injured, may be at risk of future injury or may have suffered economic damages from purchasing and using Baycol. Plaintiffs seek remedies including compensatory, punitive and statutory damages and creation of funds for medical monitoring. GlaxoSmithKline and Bayer Corporation, the principal US subsidiary of Bayer AG, have signed an allocation agreement under which Bayer Corporation has agreed to pay 95 per cent of all settlements and compensatory damages judgements with each party retaining responsibility for its own attorneys’ fees and any punitive damages. The federal cases have been consolidated in a multidistrict litigation proceeding in the US District Court for the District of Minnesota. Numerous cases are scheduled for trial in state and federal courts during 2005. To date, a statewide medical monitoring class action against Bayer and GlaxoSmithKline has been certified in Pennsylvania, and another class action, in which GlaxoSmithKline was not named as a defendant, has been certified in Oklahoma. A substantial number of claims for death or serious injury have been settled.
Back to Contents
| 120 | GlaxoSmithKline Notes to the financial statements |
30 Legal proceedings continued
Fen-Phen
In 1997, the FDA became aware of reports of cardiac valvular problems in individuals for whom fenfluramine or dexfenfluramine alone or in combination with phentermine was prescribed as part of a regimen of weight reduction and requested the voluntary withdrawal of fenfluramine and dexfenfluramine from the market. The reports of cardiac valvular problems and the subsequent withdrawal of those products from the market spawned numerous product liability lawsuits filed against the manufacturers and distributors of fenfluramine, dexfenfluramine and phentermine. As one of a number of manufacturers of phentermine, the Group is a defendant in thousands of lawsuits in various state and federal district courts in the USA. Most of the lawsuits seek relief including some combination of compensatory and punitive damages, medical monitoring and refunds for purchases of drugs. In 1997 the Judicial Panel on Multidistrict Litigation issued an order consolidating and transferring all federal actions to the District Court for the Eastern District of Pennsylvania. That court approved a global settlement proposed by defendant Wyeth, which sold fenfluramine and dexfenfluramine. The settlement, subsequently confirmed by the Third Circuit Court of Appeals, does not include any of the phentermine defendants, including the Group. Individual plaintiffs may elect to opt out of the class settlement and pursue their claims individually and tens of thousands of plaintiffs have elected to do so. Wyeth continues to settle individual state court cases before trial and the Group continues to be dismissed from lawsuits as they are settled by Wyeth.
Thimerosal
GlaxoSmithKline, along with a number of other pharmaceutical companies, has been named as a defendant in numerous individual personal injury lawsuits in state and federal district courts in the USA alleging that thimerosal, a preservative used in the manufacture of vaccines, causes neurodevelopmental disorders and other injuries, including autism. Three of the cases are purported class actions; there has been no determination as to whether any of those cases will be permitted to proceed as a class action. A number of purported class actions in other jurisdictions have been withdrawn or dismissed. Plaintiffs seek remedies including compensatory, punitive and statutory damages and the cost of a fund for medical monitoring and research. Although many of the lawsuits are in their early stages, a number of cases are scheduled for trial in 2005.
Lotronex
Following the voluntary withdrawal of Lotronex in the USA in November 2000 a number of lawsuits have been filed against the Group in state and federal district courts, including individual personal injury actions and purported class actions asserting product liability and consumer fraud claims. Plaintiffs seek remedies including compensatory, punitive and statutory damages. The class previously certified in West Virginia has been decertified and the action has been dismissed. A large number of claims brought following the withdrawal have now been settled.
Government investigations
Marketing and promotion
In February 2004, GlaxoSmithKline received a subpoena from the US Attorney’s office in Colorado regarding the Group’s sales and promotional practices relating to nine of its largest selling products for the period from January 1997 to the present.
In particular the government has inquired about alleged promotion of these drugs for off-label uses as well as Group sponsored continuing medical education programmes, other speaker events, special issue boards, advisory boards, speaker training programmes, clinical studies, and related grants, fees, travel and entertainment. Although the original subpoena issued from the US Attorney’s office in Colorado, the scope of the inquiry is nationwide. The Group is co-operating with the investigation which is in its early stages. The Group had earlier responded to an October 2002 letter from the FDA’s Division of Drug Marketing, Advertising and Communication requesting information on the Group’s alleged promotion of Wellbutrin SR for off-label use.
Average wholesale price
GlaxoSmithKline has responded to subpoenas from the Office of the Inspector General of the US Department of Health and Human Services, the US Department of Justice and the states of Texas and California in connection with allegations that pharmaceutical companies, including GlaxoSmithKline, have violated federal fraud and abuse laws such as the Federal False Claims Act (and, with respect to Texas and California, comparable state laws) as a result of the way ‘average wholesale price’ (AWP) was determined and reported for certain drugs and the way the Medicare and Medicaid programmes reimburse for those drugs.
Subsequently, several states through their respective attorneys general and several counties in New York state filed civil lawsuits in state and federal court against GlaxoSmithKline and several other drug companies. The actions claim, on behalf of the states as payers and on behalf of in-state patients as consumers, damages and restitution due to AWP based price reporting for an undefined set of pharmaceutical products covered by the states’ Medicaid programmes. In addition, private payer class action lawsuits have been filed against GlaxoSmithKline in several federal district and state courts. All the federal cases have been consolidated in a multidistrict litigation proceeding in the US District Court for the District of Massachusetts. The Group is one of five companies designated for ‘fast track’ discovery in that proceeding. A hearing on the private-payer plaintiffs’ motion for class certification took place in February 2005 but the judge has not yet ruled on that motion. All of the civil suits filed in state court by state attorneys general and a private payer class action case remanded to state court are in their early stages.
Nominal pricing
The Group has been advised by the US Department of Justice that they are investigating certain of the Group’s nominal pricing arrangements to determine whether those arrangements qualify under the nominal price exception to best price reporting requirements under the Medicaid Drug Rebate Programme or violate civil statutes or laws. The Group is cooperating in that investigation which is being conducted by the same government attorneys involved in the AWP investigation and has provided documents and information regarding nominal pricing arrangements for a number of the Group’s products.
Paxil/Seroxat
Following announcement of the New York State Attorney General’s office over the state’s lawsuit, subsequently settled in August 2004, alleging failure to disclose data on the use of Paxil in children and adolescents, similar cases, some of which purport to be class actions, have been filed in state and federal courts by private plaintiffs. All those cases are in their early stages.
Back to Contents
| Notes to the financial statements GlaxoSmithKline | 121 |
30 Legal proceedings continued
In the UK an investigation remains pending by the UK Medicines and Healthcare products Regulatory Agency (MHRA) to determine whether the Group has complied with its pharmacovigilance obligations in reporting of data from clinical trials for Seroxat/Paxil in children and adolescents.
Cidra, Puerto Rico manufacturing site
In October 2003 the FDA inspected the Group’s manufacturing facility in Cidra, Puerto Rico. The Cidra site is engaged in tableting and packaging for a range of GlaxoSmithKline products – primarily for the US market – including Paxil, Paxil CR, Coreg, Avandia and Avandamet. Following that inspection the FDA has issued two Forms 483 (‘observations’ of possible deficiencies in manufacturing practices) to the Group. The FDA carried out a further inspection in November 2004 and subsequently issued two further Forms 483. The FDA observations relate to certain aspects of production controls, process validation and laboratory investigations. In response to the FDA's observations, the Group, among other things, voluntarily recalled certain shipments of Paxil CR and Avandamet from wholesalers. In March 2005 the FDA initiated seizures of Paxil CR and Avandamet tablets manufactured at Cidra on grounds that those products failed to meet FDA manufacturing standards. The Group continues to cooperate with the FDA in responding to the observations contained in the Forms 483 and in respect of the recent seizures, but there can be no assurance as to any remedy the FDA may ultimately seek or as to the timing of resumption of distribution of Paxil CR and/or Avandamet.
Anti-trust
Paxil
In November 2000, the US Federal Trade Commission (FTC) staff advised the Group that they were conducting a non-public investigation to determine whether the Group was violating Section 5 of the Federal Trade Commission Act by ‘monopolizing or attempting to monopolize’ the market for paroxetine hydrochloride by preventing generic competition to Paxil and requested the Group to submit certain information in connection with that investigation. In October 2003 the FTC closed its investigation on the basis of its finding that no further action is warranted.
Following public reference to the FTC investigation regarding Paxil, purported class actions were filed in the US District Court for the Eastern District of Pennsylvania on behalf of indirect purchasers, including consumers and third party payers, and direct purchasers. The plaintiffs claimed that the Group monopolized a ‘market’ for Paxil by bringing allegedly sham patent litigation and allegedly abusing the regulatory procedures for the listing of patents in the FDA Orange Book. The court has granted final approval to settlement with the direct purchaser class and preliminary approval to settlement with the purported class of indirect purchasers. The hearing date for final approval for the indirect purchaser class settlement is 9th March 2005. The Group has also reached a final settlement with a group of chain drugstores. In state courts a purported consumer fraud class action in California remains at an early stage and, separately, both a state court class action in California and a federal class action in Florida, each of which is a purported indirect purchaser class action, have been stayed pending disposition of the federal court settlement. A separate action by the City of New York for alleged overcharges is also in its early stages.
Apotex, Alphapharm, BASF and Sumika have filed anti-trust and unfair competition counterclaims against the Group based on allegations similar to those made in the purported class actions identified in the proceeding paragraph. While discovery in the Apotex matter is in the early stages, the three other actions have been stayed.
Relafen
In August 2001, the US District Court for the District of Massachusetts ruled the Group’s patent for nabumetone (Relafen) invalid for anticipatory art and unenforceable on the grounds of inequitable conduct. In August 2002 the CAFC issued a decision affirming the District Court’s judgement of invalidity but declining to rule on the judgement of inequitable conduct.
Following the District Court decision, anti-trust claims alleging competitive injury and overcharges were filed by Teva and Eon Pharmaceuticals, generic manufacturers of nabumetone, by purported classes of direct and indirect purchasers and payers and by individual retail chains.
The plaintiffs’ claims are based on allegations of fraudulent procurement of a patent, wrongful listing of the patent in the FDA Orange Book and prosecution of sham patent infringement litigation. Those cases, which were originally filed in the US District Courts for the District of Massachusetts and the Eastern District of Pennsylvania, were all transferred to the District of Massachusetts. The Group has settled the cases filed by Teva, Eon, a group of major retail pharmacy chains and the class of direct purchasers. The court has given preliminary approval to the settlement that the Group has reached with a class of indirect purchasers. A hearing on final approval of that settlement is scheduled for 4th May 2005. Additionally, a settlement agreement has been signed with the states regarding their ‘global claim’ for alleged overcharges in connection with state purchases of the drug.
Augmentin
In 2002, the US District Court for the Eastern District of Virginia found various patents covering Augmentin invalid. That holding was subsequently affirmed by the CAFC. Following the adverse trial court decision, purported anti-trust class actions were filed on behalf of classes of direct and indirect purchasers that were ultimately consolidated in the US District Court for the Eastern District of Virginia. Plaintiffs alleged that the Group knowingly obtained invalid patents and engaged in other anticompetitive conduct to prevent entry of generic products in violation of the monopolization section of the US anti-trust laws. The court has approved the Group’s settlement of those class action claims. In February 2005 the Group reached an agreement in principle with Lek Pharmaceuticals, a wholly-owned subsidiary of Novartis, to resolve the anti-trust lawsuit filed by Lek in that same District Court which sought lost profits, treble damages, injunctive relief and attorneys’ fees.
Canadian importation
The Group has been named in seven purported class action lawsuits along with eight other pharmaceutical companies. Following the Group’s actions in 2003 to reduce illegal importation of prescription drugs from Canada, the lawsuits allege that the companies entered an unlawful conspiracy to prevent Canadian pharmacies from selling their products to US customers.
The Group has also been named as a defendant, along with thirteen other drug companies, in a state court action in California, in which the plaintiffs, independent pharmacies, allege that the defendants unlawfully conspired to keep prices artificially high in the USA to the detriment of the plaintiffs. In relation to the same matter, the Minnesota State Attorney General has filed a complaint alleging that the Group has violated state anti-trust and commercial laws. All of these actions are in their early stages.
Back to Contents
| 122 | GlaxoSmithKline Notes to the financial statements |
30 Legal proceedings continued
Wellbutrin SR
In December 2004, and January and February 2005, lawsuits, several of which purported to be class actions, were filed in the US District Court for the Eastern District of Pennsylvania against the Group on behalf of direct and indirect purchasers of Wellbutrin SR. The complaints allege violations of US anti-trust laws through sham litigation and fraud on the patent office by the Group in obtaining and enforcing patents covering Wellbutrin SR. The complaints follow the introduction of generic competition to Wellbutrin SR in April 2004 after district and appellate court rulings that a generic manufacturer did not infringe the Group’s patents. The cases are in their early stages.
Environmental matters
GlaxoSmithKline has been notified of its potential responsibility relating to past operations and its past waste disposal practices at certain sites, primarily in the USA. Some of these matters are the subject of litigation, including proceedings initiated by the US federal or state governments for waste disposal site remediation costs and tort actions brought by private parties.
GlaxoSmithKline has been advised that it may be a responsible party at approximately 27 sites, of which 14 appear on the National Priority List created by the Comprehensive Environmental Response Compensation and Liability Act (Superfund).
These proceedings seek to require the operators of hazardous waste facilities, transporters of waste to the sites and generators of hazardous waste disposed of at the sites to clean up the sites or to reimburse the government for cleanup costs. In most instances, GlaxoSmithKline is involved as an alleged generator of hazardous waste although there are a few sites where GlaxoSmithKline is involved as a current or former operator of the facility. Although Superfund provides that the defendants are jointly and severally liable for cleanup costs, these proceedings are frequently resolved on the basis of the nature and quantity of waste disposed of at the site by the generator. GlaxoSmithKline’s proportionate liability for cleanup costs has been substantially determined for about 20 of the sites referred to above.
GlaxoSmithKline’s potential liability varies greatly from site to site. While the cost of investigation, study and remediation at such sites could, over time, be substantial, GlaxoSmithKline routinely accrues amounts related to its share of liability for such matters.
Tax matters
Pending tax matters are described in Note 12.
31 Post balance sheet event
On 10th January 2005, GlaxoSmithKline announced it had agreed to transfer most of its European and International co-promotion rights for Levitra to Bayer for a cash consideration of £148 million and a reduction in the Group’s commitment to fund future research and development on the product. GlaxoSmithKline retains co-promotion or co-marketing rights to Levitra in the USA and more than 20 other markets.
32 Related party transactions
GlaxoSmithKline held an 18.6 per cent interest in Quest Diagnostics Inc. at 31st December 2004 (2003 – 21 per cent). The Group and Quest Diagnostics are parties to a long-term contractual relationship under which Quest Diagnostics is the primary provider of clinical laboratory testing to support the Group’s clinical trials testing requirements worldwide. During 2004, Quest Diagnostics provided services of £35 million (2003 – £31 million) to the Group.
In 2004, both the Group and Shionogi & Co. Ltd. entered into transactions with their 50/50 US joint venture company in support of the research and development activities conducted by that joint venture company. During 2004, GlaxoSmithKline provided services to the joint venture of £1 million (2003 – £1 million). At 31st December 2004 the balance due to GlaxoSmithKline from the joint venture was £2 million (2003 – £3 million).
Dr Shapiro, a Non-Executive Director of GlaxoSmithKline plc, received fees of $85,000 (2003 – $85,000) of which $30,000 (2003 – $30,000) was in the form of ADSs, from a subsidiary of the company, for the membership on the Group’s Scientific Advisory Board. These are included within ‘Annual remuneration’ in the Remuneration Report on pages 43 to 58.
Dr Barzach, a former Non-Executive Director of GlaxoSmithKline plc, received fees of €83,005 (2003 – €72,268) from a subsidiary of the company for healthcare consultancy provided. These are included within ‘Annual remuneration’ in the Remuneration Report.
Back to Contents
| Notes to the financial statementsGlaxoSmithKline | 123 |
33 Acquisitions and disposals
Details of the acquisition and disposal of subsidiary and associated undertakings, joint ventures and other businesses are given below:
| 2004 | Book | | Fair value | | Net assets | | Goodwill | | Cost of | |
| | values | | adjustments | | acquired | | capitalised | | acquisition | |
| Acquisitions | £m | | £m | | £m | | £m | | £m | |
|
|
|
|
|
|
|
|
|
| |
| Fraxiparine, Fraxodi and Arixtra | 135 | | 162 | | 297 | | – | | 297 | |
|
|
|
|
|
|
|
|
|
| |
Fraxiparine, Fraxodi and Arixtra
In September 2004, for a cash consideration of £297 million the Group acquired Fraxiparine, Fraxodi and Arixtra and related assets including a manufacturing facility.
Euclid SR Partners, LP
During the year an additional £2 million was invested in Euclid SR Partners, LP, an associate company in which the Group has a 38.7 per cent interest.
Disposals
Quest Diagnostics Inc.
During 2004, the Group disposed of 3.8 million shares from its investment in Quest Diagnostics Inc. for cash proceeds of £188 million, reducing the Group’s shareholding at 31st December 2004 to 18.6 per cent. After recognising a charge for goodwill previously written off to reserves of £17 million a profit of £139 million was recognised.
GlaxoSmithKline Vehicle Finance Ltd
During 2004, the Group disposed of its employee vehicle financing subsidiary resulting in a loss of £3 million.
GlaxoSmithKline Pharmaceuticals (Chongqing) Ltd
During 2004, the Group disposed of GlaxoSmithKline Pharmaceuticals (Chongqing) Ltd, a Group subsidiary located in China, for £7 million. A profit on disposal of £1 million was realised, after recognising a charge for goodwill previously written off to reserves of £3 million.
Beeyar Investments (Pty) Ltd
In July 2004, the Group disposed of Beeyar Investments (Pty) Ltd, a subsidiary located in South Africa, for cash proceeds of £1 million, realising a profit of £1 million.
OptiLead S.r.l.
During the year, part of the Group’s holding in an associated undertaking, OptiLead S.r.l. was sold, resulting in a loss of £1 million.
| | Fraxiparine | | | | | | GSK | | GSK | | | | | |
| | Fraxodi | | | | Quest | | Vehicle | | Pharmaceuticals | | Beeyar | | | |
| | and Arixtra | | Euclid SR | | Diagnostics | | Finance | | (Chongqing) | | Investments | | Total | |
| Cash flows | £m | | £m | | £m | | £m | | £m | | £m | | £m | |
|
|
|
|
|
|
|
|
|
|
|
|
|
| |
| Cash consideration paid | 297 | | 2 | | – | | – | | – | | – | | 299 | |
|
|
|
|
|
|
|
|
|
|
|
|
|
| |
| Net cash proceeds from disposals | – | | – | | 188 | | 34 | | 7 | | 1 | | 230 | |
|
|
|
|
|
|
|
|
|
|
|
|
|
| |
| |
|
| 2003 | Book | | Fair value | | Net assets | | Goodwill | | Cost of | |
| | values | | adjustments | | acquired | | capitalised | | acquisition | |
| Acquisitions | £m | | £m | | £m | | £m | | £m | |
|
|
|
|
|
|
|
|
|
| |
| Europharm | 1 | | – | | 1 | | 2 | | 3 | |
|
|
|
|
|
|
|
|
|
| |
Europharm
During 2003, the Group completed the buyout of the minority interests in Europharm Holdings SA, a Group subsidiary located in Romania, for £3 million, giving rise to goodwill of a further £2 million, which has been capitalised.
Iterfi - Sterilyo
During 2003, a further payment of £9 million was made pursuant to the 2002 acquisition agreement based on the financial performance of the acquired company. This amount has been included as deferred compensation in 2002.
Back to Contents
| 124 | GlaxoSmithKline Notes to the financial statements |
33 Acquisitions and disposals continued
Disposals
SB Clinical Laboratories
An additional cash refund of £3 million was received during 2003 in respect of indemnified liabilities arising from the SB Clinical Laboratories disposal which occurred in 1999. This refund follows the successful outcome of a case in the US Court of Appeal.
| | Iterfi- | | | | SB Clinical | | | | | |
| Sterilyo | Europharm | Laboratories | Other | Total |
| Cash flows | £m | £m | £m | £m | £m |
|
|
|
|
|
|
|
|
|
| |
| Cash consideration paid | 9 | | 3 | | – | | 3 | | 15 | |
|
|
|
|
|
|
|
|
|
| |
| Net cash proceeds from disposals | – | | – | | 3 | | – | | 3 | |
|
|
|
|
|
|
|
|
|
| |
| | | | | | | | | | | |
| 2002 | Book | Fair value | Net assets | Goodwill | Cost of |
| | values | adjustments | acquired | capitalised | acquisition |
| Acquisitions | £m | £m | £m | £m | £m |
|
|
|
|
|
|
|
|
|
| |
| Iterfi – Sterilyo | (7 | ) | 4 | | (3 | ) | 21 | | 18 | |
| Human Kft | 10 | | – | | 10 | | 1 | | 11 | |
| Other | – | | – | | – | | 1 | | 1 | |
|
|
|
|
|
|
|
|
|
| |
| | 3 | | 4 | | 7 | | 23 | | 30 | |
|
|
|
|
|
|
|
|
|
| |
Iterfi – Sterilyo
During 2002, the Group acquired Iterfi-Sterilyo Group for an initial cash consideration of £9 million. A further payment was paid during 2003, of £9 million, which was based on the financial performance of the acquired company during 2002. The net assets of Iterfi-Sterilyo have been incorporated in the financial statements at their provisional fair values. No adjustments were made to these values in 2003.
Human Kft
During 2002, the Group acquired the vaccine related assets of Human Kft, a manufacturing business located in Hungary, for a cash consideration of £11 million.
Disposals
SB Clinical Laboratories
A cash refund of £6 million was received during 2002 in respect of indemnified liabilities arising from the SB Clinical Laboratories disposal which occurred in 1999. The refund follows the successful outcome of a case in the US Court of Appeal.
| | SB Clinical | | Iterfi - | | Human | | | | | |
| Laboratories | Sterilyo | Kft | Other | Total |
| Cash flows | £m | £m | £m | £m | £m |
|
|
|
|
|
|
|
|
|
| |
| Cash consideration paid | – | | 9 | | 11 | | 6 | | 26 | |
|
|
|
|
|
|
|
|
|
| |
| Net cash proceeds from disposals | 6 | | – | | – | | – | | 6 | |
|
|
|
|
|
|
|
|
|
| |
Back to Contents
Notes to the financial statements GlaxoSmithKline | 125 |
34 Financial instruments and related disclosures
Policies
Discussion of the Group’s objectives and policies for the management of financial instruments and associated risks is included under ‘Treasury Policies’ in the Operating and financial review and prospects on pages 74 to 75.
Investments
The Group holds a number of equity investments, frequently in entities where the Group has entered into research collaborations. The Group seeks to realise the value in these investments, which in part the research collaboration helps to create, and therefore certain of these investments are regarded as available for sale and are accounted for as current asset investments. For the purposes of US GAAP all the current asset investments are classified as available for sale.
In 2002, GlaxoSmithKline hedged part of the equity value of its holdings in its largest equity investment, Quest Diagnostics Inc. through a series of variable sale forward contracts. These contracts (the ‘equity collar’) are structured in five series, each over one million Quest shares, and mature between 2006 and 2008.
The Group has liquid investments, representing funds surplus to immediate operating requirements, which are accounted for as current asset investments. For the purposes of US GAAP the investments are classified as available for sale. The proceeds from sale of investments classified as available for sale under US GAAP were £15,048 million in the year ended 31st December 2004. The proceeds include the roll-over of liquid funds on short-term deposit. Under US GAAP the gross gains and losses reflected in the consolidated profit and loss account in respect of investments classified as available for sale were £34 million and £2 million, respectively.
Foreign exchange risk management
The Group has entered into forward foreign exchange contracts in order to swap liquid assets and borrowings into the currencies required for Group purposes. At 31st December 2004 the Group had outstanding contracts to sell or purchase foreign currency having a total notional principal amount of £11,137 million (2003 – £8,544 million). The majority of contracts are for periods of 12 months or less.
At the end of 2004, the Group had a number of currency swaps in place in respect of medium-term debt instruments. Borrowings denominated in, or swapped into, foreign currencies which match investments in overseas Group assets are treated as a hedge against the relevant net assets and exchange gains or losses are recorded in reserves.
Interest rate risk management
To manage the fixed/floating interest rate profile of debt, the Group had several interest rate swaps outstanding with commercial banks at 31st December 2004.
Concentrations of credit risk and credit exposures of financial instruments
The Group does not believe it is exposed to major concentrations of credit risk on its financial instruments. The Group is exposed to credit-related losses in the event of non-performance by counterparties to financial instruments, but does not expect any counterparties to fail to meet their obligations.
The Group applies Board-approved limits to the amount of credit exposure to any one counterparty and employs strict minimum credit worthiness criteria as to the choice of counterparty.
Fair value of financial assets and liabilities
The table on page 126 presents the carrying amounts under UK GAAP and the fair values of the Group’s financial assets and liabilities at 31st December 2004 and 31st December 2003. Debtors and creditors due within one year have been excluded.
The fair values of the financial assets and liabilities are included at the amount at which the instrument could be exchanged in a current transaction between willing parties, other than in a forced or liquidation sale. The following methods and assumptions were used to estimate the fair values:
| • | Equity investments – market value based on quoted market prices in the case of listed investments; market value by reference to quoted prices for similar companies or recent financing information in the case of material unlisted investments |
| • | Cash at bank – approximates to the carrying amount |
| • | Liquid investments – based on quoted market prices for similar companies or recent financing information in the case of marketable securities; approximates to the carrying amount in the case of time deposits because of their short maturity |
| • | Short-term loans and overdrafts – approximates to the carrying amount because of the short maturity of these instruments |
| • | Medium-term loans – market value based on quoted market prices in the case of the Eurobonds and other fixed rate borrowings; approximates to the carrying amount in the case of floating rate bank loans and other loans |
| • | Forward exchange contracts – based on market prices and exchange rates at the balance sheet date |
| • | Currency swaps – based on market valuations at the balance sheet date |
| • | Equity collar – fair value is determined based on an option pricing model |
| • | Interest rate instruments – fair value is determined using the net present value of discounted cash flows |
| • | Debtors and creditors – approximates to the carrying amount |
| • | Provisions – approximates to the carrying amount |
| • | Auction rate preference stock – approximates to the carrying amount in the case of floating rate instruments |
| • | Flexible auction market preferred stock – based on market valuations at the balance sheet date. |
Fair value of investments in own shares
The Group had at 31st December 2004 investments in own shares of £2,574 million (2003 – £2,729 million) with a fair value of £2,123 million (2003 – £2,276 million) based on quoted market price. The shares represent purchases by the ESOP Trusts to satisfy future exercises of options and awards under employee incentive schemes. They are excluded from financial instrument disclosure.
Back to Contents
126 | GlaxoSmithKline Notes to the financial statements |
34 Financial instruments and related disclosures continued
Classification and fair values of financial assets and liabilities
The following table sets out the classification of financial assets and liabilities and provides a reconciliation to Group net debt in Note 25. Short-term debtors and creditors have been excluded from financial assets and liabilities. Provisions have been included where there is a contractual obligation to settle in cash.
| | 2004 | | 2003 | |
| |
| |
| |
| | Carrying amount £m | | Fair value £m | | Carrying amount £m | | Fair value £m | |
|
|
|
|
|
|
|
| |
| Net debt | | | | | | | | |
| Liquid investments | 2,818 | | 2,820 | | 2,493 | | 2,509 | |
| Cash at bank | 1,161 | | 1,161 | | 962 | | 962 | |
|
|
|
|
|
|
|
| |
| Current asset financial instruments | 3,979 | | 3,981 | | 3,455 | | 3,471 | |
|
|
|
|
|
|
|
| |
| | | | | | | | | |
| Sterling notes and bonds | (1,475 | ) | (1,533 | ) | (1,474 | ) | (1,552 | ) |
|
|
|
|
|
|
|
| |
| | (1,475 | ) | (1,533 | ) | (1,474 | ) | (1,552 | ) |
|
|
|
|
|
|
|
| |
| US dollar notes, bonds and private financing | (1,828 | ) | (1,817 | ) | (866 | ) | (893 | ) |
| Notes and bonds swapped into US dollars | (498 | ) | (497 | ) | (498 | ) | (499 | ) |
| Currency swaps | – | | 92 | | – | | 59 | |
| Interest rate swaps | – | | (28 | ) | – | | (2 | ) |
|
|
|
|
|
|
|
| |
| | (2,326 | ) | (2,250 | ) | (1,364 | ) | (1,335 | ) |
|
|
|
|
|
|
|
| |
| Notes and bonds swapped into Yen | (348 | ) | (338 | ) | (463 | ) | (457 | ) |
| Currency swaps | – | | 10 | | – | | 3 | |
|
|
|
|
|
|
|
| |
| | (348 | ) | (328 | ) | (463 | ) | (454 | ) |
|
|
|
|
|
|
|
| |
| | | | | | | | | |
| Euro notes and bonds | (705 | ) | (717 | ) | (699 | ) | (700 | ) |
| Interest rate swap | – | | 12 | | – | | (4 | ) |
|
|
|
|
|
|
|
| |
| | (705 | ) | (705 | ) | (699 | ) | (704 | ) |
|
|
|
|
|
|
|
| |
| | | | | | | | | |
| Other medium-term borrowings | (79 | ) | (79 | ) | (34 | ) | (34 | ) |
| Other short-term loans and overdrafts | (1,030 | ) | (1,030 | ) | (1,069 | ) | (1,069 | ) |
|
|
|
|
|
|
|
| |
| Total borrowings | (5,963 | ) | (5,925 | ) | (5,103 | ) | (5,148 | ) |
|
|
|
|
|
|
|
| |
| | | | | | | | | |
|
|
|
|
|
|
|
| |
| Total net debt | (1,984 | ) | (1,944 | ) | (1,648 | ) | (1,677 | ) |
|
|
|
|
|
|
|
| |
| | | | | | | | | |
| Fixed asset equity investments | 145 | | 151 | | 98 | | 100 | |
| Current asset equity investments | 153 | | 199 | | 164 | | 237 | |
| Other debtors due after 1 year | 597 | | 499 | | 522 | | 522 | |
| Other creditors due after 1 year | (244 | ) | (244 | ) | (232 | ) | (232 | ) |
| Provisions | (256 | ) | (256 | ) | (245 | ) | (245 | ) |
| Other foreign exchange derivatives | (67 | ) | (79 | ) | 52 | | 71 | |
| Non-hedging derivatives | – | | (59 | ) | – | | 36 | |
| | | | | | | | | |
| Auction rate preference stock | – | | – | | (224 | ) | (224 | ) |
| Flexible auction market preferred stock | – | | – | | (279 | ) | (279 | ) |
|
|
|
|
|
|
|
| |
| Total non-equity minority interests | – | | – | | (503 | ) | (503 | ) |
|
|
|
|
|
|
|
| |
| Total financial assets and liabilities | (1,656 | ) | (1,733 | ) | (1,792 | ) | (1,691 | ) |
|
|
|
|
|
|
|
| |
| Total financial assets | 4,874 | | 4,830 | | 4,291 | | 4,437 | |
| Total financial liabilities | (6,530 | ) | (6,563 | ) | (6,083 | ) | (6,128 | ) |
|
|
|
|
|
|
|
| |
Where appropriate, currency and interest rate swaps have been presented alongside the underlying principal instrument. The carrying amounts of these instruments have been adjusted for the effect of the currency and interest rate swaps acting as hedges.
The difference between the carrying amount and the fair value of equity (fixed and current assets) and liquid investments represents gross unrealised gains of £52 million and £2 million, respectively.
Back to Contents
Notes to the financial statements GlaxoSmithKline | 127 |
34 Financial instruments and related disclosures continued
Currency and interest rate risk profile of financial liabilities
Financial liabilities, after taking account of currency and interest rate swaps, are analysed below.
Total financial liabilities comprise total borrowings of £5,963 million (2003 – £5,103 million), other creditors due after one year of £244 million (2003 – £232 million), provisions of £256 million (2003 – £245 million) and non-equity minority interest preference shares of nil (2003 – £503 million) but exclude creditors due within one year and foreign exchange derivatives of £67 million (2003 – £nil). The benchmark rate for determining interest payments for all floating rate financial liabilities in the tables below is LIBOR.
| | Fixed rate | | Floating rate | | Non-interest bearing | |
| |
| |
| |
| |
At 31st December 2004
Currency | £m | | %Weighted average interest rate | | Weighted average years for which rate is fixed | | £m | | £m | | Weighted average years to maturity | | Total £m | |
|
|
|
|
|
| |
| |
|
|
|
|
| |
| US dollars | 571 | | 5.9 | | 13.8 | | 1,764 | | 411 | | 8.9 | | 2,746 | |
| Sterling | 1,489 | | 6.4 | | 19.3 | | 842 | | 123 | | 2.1 | | 2,454 | |
| Euro | – | | – | | – | | 747 | | 44 | | 5.3 | | 791 | |
| Japanese Yen | 348 | | 0.4 | | 4.6 | | – | | – | | – | | 348 | |
| Other currencies | – | | – | | – | | 89 | | 35 | | 6.1 | | 124 | |
|
|
|
|
|
| |
| |
|
|
|
|
| |
| | 2,408 | | 5.4 | | 15.9 | | 3,442 | | 613 | | 4.6 | | 6,463 | |
|
|
|
|
|
| |
| |
|
|
|
|
| |
| | | | | | | | | | | | | | | |
| | Fixed rate | | Floating rate | | Non-interest bearing | |
| |
| |
| |
| |
At 31st December 2003
Currency | £m | | Weighted
average
interest
rate
% | | Weighted average years for which rate is fixed | | £m | | £m | | Weighted average years to maturity | | Total £m | |
|
|
|
|
|
| |
| |
|
|
|
|
| |
| US dollars | 279 | | 6.1 | | 2.1 | | 1,676 | | 311 | | 10.5 | | 2,266 | |
| Sterling | 1,478 | | 6.4 | | 20.4 | | 852 | | 100 | | 4.1 | | 2,430 | |
| Euro | 3 | | – | | – | | 750 | | 34 | | 5.6 | | 787 | |
| Japanese Yen | 463 | | 0.5 | | 4.3 | | 52 | | – | | – | | 515 | |
| Other currencies | 14 | | – | | – | | 39 | | 32 | | 4.8 | | 85 | |
|
|
|
|
|
| |
| |
|
|
|
|
| |
| | 2,237 | | 5.1 | | 14.7 | | 3,369 | | 477 | | 8.4 | | 6,083 | |
|
|
|
|
|
| |
| |
|
|
|
|
| |
Currency and interest rate risk profile of financial assets
Total financial assets comprise fixed asset equity investments of £145 million (2003 – £98 million), current asset equity investments of £153 million (2003 – £164 million), liquid investments of £2,818 million (2003 – £2,493 million), cash at bank of £1,161 million (2003 – £962 million) and debtors due after one year of £597 million (2003 – £522 million), but exclude foreign exchange derivatives of £nil (2003 – £52 million). The benchmark rate for determining interest receipts for all floating rate assets in the tables below is LIBOR.
| | Fixed rate | | Floating rate | | Non-interest bearing | |
| |
| |
| |
| |
At 31st December 2004
Currency | Fixed rate £m | | Weighted average interest rate % | | Weighted average years for which rate is fixed | | £m | | £m | | Total £m | |
|
|
|
|
|
| |
| |
|
|
| |
| US dollars | 164 | | 6.2 | | 11.9 | | 1,429 | | 757 | | 2,350 | |
| Sterling | – | | – | | – | | 1,088 | | 89 | | 1,177 | |
| Euro | – | | – | | – | | 629 | | 57 | | 686 | |
| Japanese Yen | – | | – | | – | | 1 | | 28 | | 29 | |
| Other currencies | 155 | | 3.0 | | 0.2 | | 353 | | 124 | | 632 | |
|
|
|
|
|
| |
| |
|
|
| |
| | 319 | | 4.7 | | 6.2 | | 3,500 | | 1,055 | | 4,874 | |
|
|
|
|
|
| |
| |
|
|
| |
| | | | | | | | | | | | | |
| | Fixed rate | | Floating rate | | Non-interest bearing | |
| |
| |
| |
| |
At 31st December 2003 Currency | Fixed rate £m | | Weighted average interest rate % | | Weighted average years for which rate is fixed | | £m | | £m | | Total £m | |
|
|
|
|
|
| |
| |
|
|
| |
| US dollars | 300 | | 6.6 | | 5 | | 1,248 | | 479 | | 2,027 | |
| Sterling | 20 | | 7.8 | | 2.6 | | 1,209 | | 60 | | 1,289 | |
| Euro | 1 | | 3.0 | | 0.6 | | 328 | | 77 | | 406 | |
| Japanese Yen | – | | – | | – | | 1 | | 33 | | 34 | |
| Other currencies | 103 | | 2.7 | | 0.1 | | 293 | | 87 | | 483 | |
|
|
|
|
|
| |
| |
|
|
| |
| | 424 | | 5.0 | | 3.6 | | 3,079 | | 736 | | 4,239 | |
|
|
|
|
|
| |
| |
|
|
| |
Back to Contents
128 | GlaxoSmithKline Notes to the financial statements |
34 Financial instruments and related disclosures continued
Currency exposure of net monetary assets/(liabilities)
The Group’s currency exposures that give rise to net currency gains and losses that are recognised in the profit and loss account arise principally in companies with sterling functional currency. Monetary assets and liabilities denominated in overseas functional currency and borrowings designated as a hedge against overseas net assets are excluded from the table below.
| | Functional currency of Group operation | |
|
| |
Net monetary assets/(liabilities)
held in non-functional currency | Sterling £m | | US$ £m | | Euro £m | | Yen £m | | Other £m | | Total £m | |
|
|
|
|
|
|
|
|
|
|
|
| |
| Sterling | – | | 5 | | (53 | ) | – | | (130 | ) | (178 | ) |
| US dollars | 234 | | – | | 18 | | (1 | ) | (23 | ) | 228 | |
| Euro | (97 | ) | (15 | ) | – | | – | | (46 | ) | (158 | ) |
| Japanese Yen | 29 | | – | | 1 | | – | | 1 | | 31 | |
| Other | 39 | | (8 | ) | (4 | ) | – | | – | | 27 | |
|
|
|
|
|
|
|
|
|
|
|
| |
| | 205 | | (18 | ) | (38 | ) | (1 | ) | (198 | ) | (50 | ) |
|
|
|
|
|
|
|
|
|
|
|
| |
| | | | | | | | | | | | | |
| | | | | | | | | | | | | |
| | Functional currency of Group operation | |
| At 31st December 2003 |
| |
Net monetary assets/(liabilities)
held in non-functional currency | Sterling
£m | | US$ £m | | Euro £m | | Yen £m | | Other £m | | Total £m | |
|
|
|
|
|
|
|
|
|
|
|
| |
| Sterling | – | | 157 | | (30 | ) | – | | 242 | | 369 | |
| US dollars | 41 | | – | | 12 | | – | | 45 | | 98 | |
| Euro | (55 | ) | 111 | | – | | – | | 6 | | 62 | |
| Japanese Yen | 7 | | (1 | ) | – | | – | | – | | 6 | |
| Other | (145 | ) | (55 | ) | (12 | ) | – | | – | | (212 | ) |
|
|
|
|
|
|
|
|
|
|
|
| |
| | (152 | ) | 212 | | (30 | ) | – | | 293 | | 323 | |
|
|
|
|
|
|
|
|
|
|
|
| |
| | | | | | | | | | | | | |
Maturity of financial liabilities | | | Debt £m | | Finance leases £m | | Other £m | | Total 2004 £m | | Total 2003 £m | |
|
|
|
|
|
|
|
|
|
|
|
| |
| Within one year or on demand | | | 1,547 | | 35 | | 53 | | 1,635 | | 2,032 | |
| Between one and two years | | | 262 | | 27 | | 88 | | 377 | | 630 | |
| Between two and five years | | | 1,817 | | 24 | | 132 | | 1,973 | | 1,597 | |
| After five years | | | 2,244 | | 7 | | 227 | | 2,478 | | 1,824 | |
|
|
|
|
|
|
|
|
|
|
|
| |
| | | | 5,870 | | 93 | | 500 | | 6,463 | | 6,083 | |
|
|
|
|
|
|
|
|
|
|
|
| |
| | | | | | | | | | | | | |
| | | | | | | | | | | | | |
| | | | | | | | 2004 | |
| | | | | | | |
| |
| Hedges | | | | | | | Gains £m | | Losses £m | | Net £m | |
|
|
|
|
|
|
|
|
|
|
|
| |
| Unrecognised gains and losses at the beginning of the year | | | | | | | 171 | | (60 | ) | 111 | |
| Unrecognised gains and losses arising in previous years and recognised in the year | | | | (27 | ) | – | | (27 | ) |
| Unrecognised gains and losses arising in the year | | | | | | | 8 | | (77 | ) | (69 | ) |
|
|
|
|
|
|
|
|
|
|
|
| |
| Total unrecognised gains and losses at the end of the year | | | | | | | 152 | | (137 | ) | 15 | |
|
|
|
|
|
|
|
|
|
|
|
| |
| | | | | | | | | | | | | |
| Expected to be recognised within one year | | | | | | | – | | (9 | ) | (9 | ) |
| Expected to be recognised after one year | | | | | | | 152 | | (128 | ) | 24 | |
|
|
|
|
|
|
|
|
|
|
|
| |
| Total unrecognised gains and losses at the end of the year | | | | | | | 152 | | (137 | ) | 15 | |
|
|
|
|
|
|
|
|
|
|
|
| |
The unrecognised gains and losses above represent the difference between the carrying amount and the fair value of the currency swaps, interest rate swaps, equity collar and other foreign exchange derivatives.
Committed facilities
The Group has committed facilities to back up the commercial paper programme of $900 million (£469 million) (2003 – $1,404 million (£784 million)) of 364 days duration, renewable annually. At 31st December 2004, undrawn committed facilities totalled $900 million (£469 million) (2003 – $1,404 million (£784 million)).
Back to Contents
Notes to the financial statements GlaxoSmithKline | 129 |
| 35 Employee costs | 2004 £m | | 2003 (restated) £m | | 2002 (restated) £m | |
|
|
|
|
|
| |
| | | | | | | |
| Wages and salaries | 3,864 | | 3,999 | | 3,876 | |
| Social security costs | 430 | | 444 | | 385 | |
| Pension and other post-retirement costs | 295 | | 386 | | 257 | |
| Cost of share-based incentive plans | 24 | | (20 | ) | 117 | |
| Severance costs arising from integration and restructuring activities | 80 | | 222 | | 228 | |
| Pension and other post-retirement costs arising from integration and restructuring activities | 6 | | 43 | | 59 | |
|
|
|
|
|
| |
| | 4,699 | | 5,074 | | 4,922 | |
|
|
|
|
|
| |
The Group provides benefits to employees, commensurate with local practice in individual countries, including, in some markets, healthcare insurance, subsidised car schemes and personal life assurance.
Information on Directors’ remuneration is given in the Remuneration Report on pages 43 to 58.
| The average number of persons employed by the Group (including Directors) during the year | 2004 Number | | 2003 Number | | 2002 Number | |
|
|
|
|
|
| |
| Manufacturing | 31,427 | | 34,265 | | 36,548 | |
| Selling, general and administration | 53,513 | | 54,128 | | 54,810 | |
| Research and development | 14,897 | | 14,773 | | 14,808 | |
|
|
|
|
|
| |
| | 99,837 | | 103,166 | | 106,166 | |
|
|
|
|
|
| |
| | | | | | | |
| The average number of Group employees excludes temporary and contract staff. | | | | | | |
| | | | | | | |
| The numbers of Group employees at the end of each financial year are given in the Financial record (page 162). | | | | | | |
| | | | | | | |
| Pension and other post-retirement costs | 2004 £m | | 2003 £m | | 2002 £m | |
|
|
|
|
|
| |
| UK pension schemes | 96 | | 113 | | 18 | |
| US pension schemes | 28 | | 75 | | 86 | |
| Other overseas pensions schemes | 69 | | 74 | | 52 | |
| Unfunded post-retirement healthcare schemes | 84 | | 100 | | 61 | |
| Post-employment costs | 18 | | 24 | | 40 | |
|
|
|
|
|
| |
| | 295 | | 386 | | 257 | |
|
|
|
|
|
| |
| Analysed as: | | | | | | |
| Funded defined benefit/hybrid schemes | 148 | | 213 | | 92 | |
| Unfunded defined benefit schemes | 22 | | 24 | | 34 | |
| Defined contribution schemes | 23 | | 25 | | 30 | |
| Unfunded post-retirement healthcare schemes | 84 | | 100 | | 61 | |
| Post-employment costs | 18 | | 24 | | 40 | |
|
|
|
|
|
| |
| | 295 | | 386 | | 257 | |
|
|
|
|
|
| |
| Pension and other post-retirement costs arising from integration and restructuring | 6 | | 43 | | 59 | |
|
|
|
|
|
| |
Pensions
Group undertakings operate pension arrangements which cover the Group’s material obligations to provide pensions to retired employees. These arrangements have been developed in accordance with local practices in the countries concerned. Pension benefits can be provided by state schemes; by defined contribution schemes, whereby retirement benefits are determined by the value of funds arising from contributions paid in respect of each employee, or by defined benefit schemes, whereby retirement benefits are based on employee pensionable remuneration and length of service. Some defined benefit schemes now also include defined contribution sections and are described as ‘hybrid’ schemes in the table.
In the majority of cases the contributions to defined benefit schemes are determined in accordance with the advice of independent, professionally qualified actuaries. Formal, independent, actuarial valuations of the Group’s main plans are undertaken regularly, normally at least every three years. The assets of funded schemes are generally held in separately administered trusts or are insured. Assets are invested in different classes in order to maintain a balance between risk and return. Investments are diversified to limit the financial effect of the failure of any individual investment.
Back to Contents
| 130 | GlaxoSmithKline Notes to the financial statements |
35 Employee costs continued
Pension costs of defined benefit schemes for accounting purposes have been assessed in accordance with independent actuarial advice, generally using the projected unit method and by spreading surpluses or deficits over the average expected remaining service lives of the respective memberships. In certain countries pension benefits are provided on an unfunded basis, some administered by trustee companies. Where assets are not held with the specific purpose of matching the liabilities of unfunded schemes, a provision is included within provisions for pensions and other post-retirement benefits. Liabilities are generally assessed annually in accordance with the advice of independent actuaries.
The market value of the assets of the Group’s funded defined benefit pension funds at the dates of the latest actuarial valuations, some of which date back to 2001, was £5.1 billion and the actuarial value of assets was sufficient to cover approximately 97 per cent of the benefits that had accrued to members after allowing for future salary and pension increases. The UK defined benefit pension schemes account for approximately 60 per cent of the Group’s plans in asset valuation and projected benefit terms and the US defined benefit pension schemes account for approximately 30 per cent of the Group’s plans in asset valuation and projected benefit terms.
During 2004, the Group made special funding contributions to the UK and US pension schemes totalling £256 million. The Group has agreed with the trustees of certain of the pension schemes to make additional contributions dependent on the funding status of those schemes. In 2005, following the move to IFRS, pension costs for the Group are expected to be approximately £35 million higher than they were in 2004.
UK
In the UK the defined benefit pension schemes operated for the benefit of former Glaxo Wellcome employees and former SmithKline Beecham employees remain separate. These schemes were closed to new entrants in 2001 and subsequent UK employees are entitled to join a defined contribution scheme. The relevant assumptions used in calculating the pension costs of all of the UK defined benefit schemes for accounting purposes are as follows:
| | 2004 | | 2003 | |
| | % pa | | % pa | |
|
|
|
| |
| Rate of increase of future earnings | 3.75 | | 3.75 | |
| Discount rate | 7.75 | | 7.75 | |
| Expected long-term rate of return on investments | 7.75 | | 7.75 | |
| Expected pension increases | 2.25 | | 2.25 | |
|
|
|
| |
The regular cost for the Glaxo Wellcome pension arrangements in 2004 was £57million, which reduced to an accounting cost of £47million, after allowance was made for spreading the surplus disclosed as a level percentage of salary over the expected future working lifetime of the existing members (some 9 years). The most recent triennial actuarial valuations for funding purposes were carried out as at 31st December 2002. At that date the assets of the schemes represented 92 per cent of the actuarial value of all benefits accrued to members after allowing for future salary and pension increases. The market value of the assets held by the schemes at 31st December 2002 was £2,103 million.
The regular cost for the SmithKline Beecham schemes in 2004 was £15 million, which increased to an accounting cost of £49 million after allowance was made for the spreading of the deficit over the expected future working lifetime of current employees in the scheme (some 10 years). The latest valuation was carried out at 31st December 2002 and at that date the scheme assets represented 56 per cent of the actuarial value of the accrued service liabilities based on the 2003 assumptions. The market value of assets held by the scheme at 31st December 2002 was £856 million.
USA
In the USA the former Glaxo Wellcome and SmithKline Beecham defined benefit and hybrid schemes were merged during 2001. The relevant assumptions used in calculating the pension costs for accounting purposes are as follows:
| | 2004 | | 2003 | |
| | % pa | | % pa | |
|
|
|
| |
| Rate of increase of future earnings | 5.50 | | 5.50 | |
| Discount rate | 7.75 | | 8.50 | |
| Expected long-term rate of return on investments | 7.75 | | 8.50 | |
| Cash balance credit/conversion rate | 5.25 | | 5.75 | |
|
|
|
| |
The regular cost for the main US schemes in 2004 was £51 million, which decreased to an accounting cost of £28 million after allowance was made for the spreading of the surplus over the expected future working lifetime of current employees in the schemes. The latest valuation was carried out at 1st January 2004 and at that date the actuarial value of scheme assets represented 110 per cent of the actuarial value of the accrued service liabilities. The market value of assets held by the scheme at 1st January 2004 was £1,593 million.
Post-retirement healthcare
The Group operates a number of post-retirement healthcare schemes, the principal one of which is in the USA. The cost of the US scheme has been assessed using the same assumptions as for the US pension scheme, together with the assumption for future medical inflation of 10 per cent reducing by one per cent per year to five per cent. The total provision for post-retirement benefits at 31st December 2004 amounted to £594 million (2003 – £569 million).
Back to Contents
| Notes to the financial statements GlaxoSmithKline | 131 |
35 Employee costs continued
FRS 17 disclosures
The Group continues to account for pension arrangements in accordance with SSAP 24 ‘Accounting for Pension Costs’. Under the transitional provisions of FRS 17 ‘Retirement Benefits’ certain disclosures are required on the basis of the valuation methodology adopted by FRS 17. For defined benefit schemes the fair values of pension scheme assets at 31st December 2004 are compared with the future pension liabilities calculated under the projected unit method applying the following assumptions:
| | | | | | UK | | | | | | USA | | Rest of World | |
| |
| |
| |
| |
| | 2004 | | 2003 | | 2002 | | 2004 | | 2003 | | 2002 | | 2004 | | 2003 | | 2002 | |
| | % pa | | % pa | | % pa | | % pa | | % pa | | % pa | | % pa | | % pa | | % pa | |
|
|
|
|
|
|
|
|
|
|
|
|
|
|
|
|
|
| |
| Rate of increase of future earnings | 4.00 | | 4.00 | | 3.75 | | 5.00 | | 5.50 | | 5.50 | | 3.25 | | 3.00 | | 3.00 | |
| Discount rate | 5.25 | | 5.25 | | 5.75 | | 5.75 | | 6.25 | | 6.75 | | 4.25 | | 4.75 | | 4.75 | |
| Expected pension increases | 2.50 | | 2.50 | | 2.25 | | n/a | | n/a | | n/a | | 2.00 | | 2.00 | | 1.50 | |
| Cash balance credit/conversion rate | n/a | | n/a | | n/a | | 4.75 | | 5.25 | | 5.75 | | 1.75 | | 1.50 | | n/a | |
| Inflation rate | 2.50 | | 2.50 | | 2.25 | | 2.50 | | 2.50 | | 2.25 | | 1.75 | | 1.50 | | 1.50 | |
|
|
|
|
|
|
|
|
|
|
|
|
|
|
|
|
|
| |
The expected long-term rates of return on the assets determined based on actuarial advice and the fair values of the assets and liabilities of the UK and US defined benefit schemes, together with aggregated data for other defined benefit schemes in the Group are as follows:
| | | | UK | | | | USA | | Rest of World | | Group | |
| |
| |
| |
| |
| |
| | | | | | | | | | Average | | | | | |
| At 31st December 2004 | Expected rate | | Fair | | Expected rate | | Fair | | expected rate | | Fair | | Fair | |
| | of return | | value | | of return | | value | | of return | | value | | value | |
| | % | | £m | | % | | £m | | % | | £m | | £m | |
|
|
|
|
|
|
|
|
|
|
|
|
|
| |
| Equities | 8.25 | | 2,716 | | 8.50 | | 1,229 | | 7.50 | | 205 | | 4,150 | |
| Property | – | | – | | 6.50 | | 58 | | 6.25 | | 7 | | 65 | |
| Bonds | 4.50 | | 1,404 | | 5.75 | | 307 | | 3.75 | | 270 | | 1,981 | |
| Other assets | 4.00 | | 44 | | 2.50 | | 50 | | 2.25 | | 62 | | 156 | |
|
|
|
|
|
|
|
|
|
|
|
|
|
| |
| Fair value of assets | | | 4,164 | | | | 1,644 | | | | 544 | | 6,352 | |
| Present value of scheme liabilities | | | (5,326 | ) | | | (1,750 | ) | | | (760 | ) | (7,836 | ) |
|
|
|
|
|
|
|
|
|
|
|
|
|
| |
| | | | (1,162 | ) | | | (106 | ) | | | (216 | ) | (1,484 | ) |
|
|
|
|
|
|
|
|
|
|
|
|
|
| |
| Value of schemes in surplus | | | | | | | 18 | | | | 7 | | 25 | |
| Deferred tax liability | | | | | | | (7 | ) | | | (2 | ) | (9 | ) |
|
|
|
|
|
|
|
|
|
|
|
|
|
| |
| | | | | | | | 11 | | | | 5 | | 16 | |
|
|
|
|
|
|
|
|
|
|
|
|
|
| |
| Value of schemes in deficit | | | (1,162 | ) | | | (124 | ) | | | (223 | ) | (1,509 | ) |
| Deferred tax asset | | | 349 | | | | 46 | | | | 78 | | 473 | |
|
|
|
|
|
|
|
|
|
|
|
|
|
| |
| | | | (813 | ) | | | (78 | ) | | | (145 | ) | (1,036 | ) |
|
|
|
|
|
|
|
|
|
|
|
|
|
| |
| Group total | | | | | | | | | | | | | (1,020 | ) |
|
|
|
|
|
|
|
|
|
|
|
|
|
| |
| | |
| | | | UK | | | | USA | | | | Rest of World | | Group | |
| |
| |
| |
| |
| |
| | | | | | | | | | Average | | | | | |
| At 31st December 2003 | Expected rate | | Fair | | Expected rate | | Fair | | expected rate | | Fair | | Fair | |
| | of return | | value | | of return | | value | | of return | | value | | value | |
| | % | | £m | | % | | £m | | % | | £m | | £m | |
|
|
|
|
|
|
|
|
|
|
|
|
|
| |
| Equities | 8.25 | | 2,927 | | 8.50 | | 1,201 | | 7.75 | | 174 | | 4,302 | |
| Property | – | | – | | 6.50 | | 52 | | 6.50 | | 6 | | 58 | |
| Bonds | 4.50 | | 574 | | 5.75 | | 314 | | 4.00 | | 226 | | 1,114 | |
| Other assets | 4.00 | | 185 | | 1.00 | | 26 | | 2.00 | | 18 | | 229 | |
|
|
|
|
|
|
|
|
|
|
|
|
|
| |
| Fair value of assets | | | 3,686 | | | | 1,593 | | | | 424 | | 5,703 | |
| Present value of scheme liabilities | | | (5,181 | ) | | | (1,743 | ) | | | (674 | ) | (7,598 | ) |
|
|
|
|
|
|
|
|
|
|
|
|
|
| |
| | | | (1,495 | ) | | | (150 | ) | | | (250 | ) | (1,895 | ) |
|
|
|
|
|
|
|
|
|
|
|
|
|
| |
| Value of schemes in surplus | | | | | | | | | | | 7 | | 7 | |
| Deferred tax liability | | | | | | | | | | | (2 | ) | (2 | ) |
|
|
|
|
|
|
|
|
|
|
|
|
|
| |
| | | | | | | | | | | | 5 | | 5 | |
|
|
|
|
|
|
|
|
|
|
|
|
|
| |
| Value of schemes in deficit | | | (1,495 | ) | | | (150 | ) | | | (257 | ) | (1,902 | ) |
| Deferred tax asset | | | 449 | | | | 53 | | | | 95 | | 597 | |
|
|
|
|
|
|
|
|
|
|
|
|
|
| |
| | | | (1,046 | ) | | | (97 | ) | | | (162 | ) | (1,305 | ) |
|
|
|
|
|
|
|
|
|
|
|
|
|
| |
| Group total | | | | | | | | | | | | | (1,300 | ) |
|
|
|
|
|
|
|
|
|
|
|
|
|
| |
Back to Contents
| 132 | GlaxoSmithKline Notes to the financial statements |
35 Employee costs continued
| | | | UK | | | | USA | | Rest of World | | Group | |
| |
| |
| |
| |
| |
| | | | | | | | | | Average | | | | | |
| At 31st December 2002 | Expected rate | | Fair | | Expected rate | | Fair | | expected rate | | Fair | | Fair | |
| | of return | | value | | of return | | value | | of return | | value | | value | |
| | % | | £m | | % | | £m | | % | | £m | | £m | |
|
|
|
|
|
|
|
|
|
|
|
|
|
| |
| Equities | 8.25 | | 2,523 | | 9.25 | | 804 | | 6.75 | | 172 | | 3,499 | |
| Property | – | | – | | 7.00 | | 53 | | 7.00 | | 5 | | 58 | |
| Bonds | 4.50 | | 299 | | 6.25 | | 265 | | 4.50 | | 145 | | 709 | |
| Other assets | 4.00 | | 137 | | 1.50 | | 240 | | 1.75 | | 9 | | 386 | |
|
|
|
|
|
|
|
|
|
|
|
|
|
| |
| Fair value of assets | | | 2,959 | | | | 1,362 | | | | 331 | | 4,652 | |
| Present value of scheme liabilities | | | (4,153 | ) | | | (1,782 | ) | | | (578 | ) | (6,513 | ) |
|
|
|
|
|
|
|
|
|
|
|
|
|
| |
| | | | (1,194 | ) | | | (420 | ) | | | (247 | ) | (1,861 | ) |
|
|
|
|
|
|
|
|
|
|
|
|
|
| |
| Value of schemes in surplus | | | | | | | | | | | 11 | | 11 | |
| Deferred tax liability | | | | | | | | | | | (3 | ) | (3 | ) |
|
|
|
|
|
|
|
|
|
|
|
|
|
| |
| | | | | | | | | | | | 8 | | 8 | |
|
|
|
|
|
|
|
|
|
|
|
|
|
| |
| Value of schemes in deficit | | | (1,194 | ) | | | (420 | ) | | | (258 | ) | (1,872 | ) |
| Deferred tax asset | | | 358 | | | | 147 | | | | 97 | | 602 | |
|
|
|
|
|
|
|
|
|
|
|
|
|
| |
| | | | (836 | ) | | | (273 | ) | | | (161 | ) | (1,270 | ) |
|
|
|
|
|
|
|
|
|
|
|
|
|
| |
| Group total | | | | | | | | | | | | | (1,262 | ) |
|
|
|
|
|
|
|
|
|
|
|
|
|
| |
The UK defined benefit schemes also have defined contribution sections with account balances totalling £404 million at 31st December 2004 (2003 – £327 million, 2002 – £281 million). The defined benefit sections of the UK schemes have been closed to new members and, under the projected unit method of valuing the pension scheme liabilities, the current service cost will increase as a percentage of payroll as the members of the schemes approach retirement. The deficits under FRS 17 reflect the different basis for valuing liabilities compared with SSAP 24.
The liability under FRS 17 for the US post-retirement healthcare scheme has been assessed using the same assumptions as for the US pension scheme, together with the assumption for future medical inflation of 9 per cent, reducing by one per cent per year to five per cent. On this basis the liability for the US scheme has been assessed at £895 million (2003 – £908 million; 2002 – £766 million), which reduced to £564 million (2003 – £590 million; 2002 – £475 million) after taking account of deferred tax.
If the defined benefit pension and post-retirement benefit schemes had been accounted for under FRS 17, the following amounts would have been recorded in the profit and loss account and statement of total recognised gains and losses for the three years ended 31st December 2004.
| | | | | | | | | | Post-retirement | |
| | | | | | | | Pensions | | benefits | |
| |
| |
| |
| 2004 | UK | | USA | | Rest of World | | Group | | Group | |
| | £m | | £m | | £m | | £m | | £m | |
|
|
|
|
|
|
|
| |
| |
| Amounts charged to operating profit | | | | | | | | | | |
| Current service cost | (117 | ) | (58 | ) | (42 | ) | (217 | ) | (37 | ) |
| Past service cost | (3 | ) | – | | (2 | ) | (5 | ) | – | |
| Curtailments/settlements | (5 | ) | – | | – | | (5 | ) | – | |
|
|
|
|
|
|
|
| |
| |
| | (125 | ) | (58 | ) | (44 | ) | (227 | ) | (37 | ) |
|
|
|
|
|
|
|
| |
| |
| Amounts credited/(charged) to net interest | | | | | | | | | | |
| Expected return on pension scheme assets | 274 | | 118 | | 20 | | 412 | | | |
| Interest on scheme liabilities | (269 | ) | (104 | ) | (27 | ) | (400 | ) | (55 | ) |
|
|
|
|
|
|
|
| |
| |
| | 5 | | 14 | | (7 | ) | 12 | | (55 | ) |
|
|
|
|
|
|
|
| |
| |
| Amounts recorded in statement of total | | | | | | | | | | |
| recognised gains and losses | | | | | | | | | | |
| Actual return less expected return on pension scheme assets | 106 | | 82 | | 1 | | 189 | | | |
| Experience gains/(losses) arising on scheme liabilities | 11 | | (6 | ) | 43 | | 48 | | 47 | |
| Changes in assumptions relating to present | | | | | | | | | | |
| value of scheme liabilities | – | | (62 | ) | (31 | ) | (93 | ) | (82 | ) |
|
|
|
|
|
|
|
| |
| |
| | 117 | | 14 | | 13 | | 144 | | (35 | ) |
|
|
|
|
|
|
|
| |
| |
Back to Contents
| Notes to the financial statements GlaxoSmithKline | 133 |
35 Employee costs continued
| | | | | | | | | | Post-retirement | |
| | | | | | | | Pensions | | benefits | |
| |
| |
| |
| 2003 | UK | | USA | | Rest of World | | Group | | Group | |
| | £m | | £m | | £m | | £m | | £m | |
|
|
|
|
|
|
|
| |
| |
| Amounts charged to operating profit | | | | | | | | | | |
| Current service cost | (108 | ) | (67 | ) | (44 | ) | (219 | ) | (29 | ) |
| Past service cost | – | | 7 | | 16 | | 23 | | 3 | |
| Curtailments/settlements | (78 | ) | (15 | ) | – | | (93 | ) | – | |
|
|
|
|
|
|
|
| |
| |
| | (186 | ) | (75 | ) | (28 | ) | (289 | ) | (26 | ) |
|
|
|
|
|
|
|
| |
| |
| Amounts credited/(charged) to net interest | | | | | | | | | | |
| Expected return on pension scheme assets | 231 | | 111 | | 17 | | 359 | | | |
| Interest on scheme liabilities | (246 | ) | (119 | ) | (25 | ) | (390 | ) | (64 | ) |
|
|
|
|
|
|
|
|
|
| |
| | (15 | ) | (8 | ) | (8 | ) | (31 | ) | (64 | ) |
|
|
|
|
|
|
|
| |
| |
| Amounts recorded in statement of total | | | | | | | | | | |
| recognised gains and losses | | | | | | | | | | |
| Actual return less expected return on pension scheme assets | 368 | | 230 | | 10 | | 608 | | | |
| Experience (losses)/gains arising on scheme liabilities | (193 | ) | 5 | | (28 | ) | (216 | ) | (123 | ) |
| Changes in assumptions relating to present | | | | | | | | | | |
| value of scheme liabilities | (616 | ) | (61 | ) | (32 | ) | (709 | ) | (67 | ) |
|
|
|
|
|
|
|
|
|
| |
| | (441 | ) | 174 | | (50 | ) | (317 | ) | (190 | ) |
|
|
|
|
|
|
|
| |
| |
| | | | | | | | | | | |
| | | | | | | | | | | |
| | | | | | | | | | Post-retirement | |
| | | | | | | | Pensions | | benefits | |
| |
| |
| |
| 2002 | UK | | USA | | Rest of World | | Group | | Group | |
| | £m | | £m | | £m | | £m | | £m | |
|
|
|
|
|
|
|
| |
| |
| Amounts charged to operating profit | | | | | | | | | | |
| Current service cost | (118 | ) | (74 | ) | (32 | ) | (224 | ) | (24 | ) |
| Past service cost | (28 | ) | (34 | ) | – | | (62 | ) | – | |
| Curtailments/settlements | – | | – | | (1 | ) | (1 | ) | – | |
|
|
|
|
|
|
|
|
|
| |
| | (146 | ) | (108 | ) | (33 | ) | (287 | ) | (24 | ) |
|
|
|
|
|
|
|
| |
| |
| Amounts credited/(charged) to net interest | | | | | | | | | | |
| Expected return on pension scheme assets | 293 | | 129 | | 14 | | 436 | | | |
| Interest on scheme liabilities | (235 | ) | (129 | ) | (22 | ) | (386 | ) | (53 | ) |
|
|
|
|
|
|
|
| |
| |
| | 58 | | – | | (8 | ) | 50 | | (53 | ) |
|
|
|
|
|
|
|
| |
| |
| Amounts recorded in statement of total | | | | | | | | | | |
| recognised gains and losses | | | | | | | | | | |
| Actual return less expected return on pension scheme assets | (1,024 | ) | (293 | ) | (56 | ) | (1,373 | ) | | |
| Experience gains/(losses) arising on scheme liabilities | 34 | | (3 | ) | 2 | | 33 | | 95 | |
| Changes in assumptions relating to present | | | | | | | | | | |
| value of scheme liabilities | (15 | ) | (57 | ) | 10 | | (62 | ) | (124 | ) |
|
|
|
|
|
|
|
| |
| |
| | (1,005 | ) | (353 | ) | (44 | ) | (1,402 | ) | (29 | ) |
|
|
|
|
|
|
|
| |
| |
Back to Contents
| 134 | GlaxoSmithKline Notes to the financial statements |
35 Employee costs continued
| | | | | | | | | | Post-retirement | |
| | | | | | | | Pensions | | benefits | |
| |
|
|
|
|
|
|
| |
| |
| Movements in deficits | UK | | USA | | Rest of World | | Group | | Group | |
| | £m | | £m | | £m | | £m | | £m | |
|
|
|
|
|
|
|
|
|
| |
| Deficits in schemes at 1st January 2002 | (255 | ) | (245 | ) | (214 | ) | (714 | ) | (854 | ) |
| Exchange adjustments | – | | 37 | | (9 | ) | 28 | | 85 | |
| Charged to operating profit | (146 | ) | (108 | ) | (33 | ) | (287 | ) | (24 | ) |
| Employer contributions | 154 | | 249 | | 61 | | 464 | | 41 | |
| Other finance income/(expense) | 58 | | – | | (8 | ) | 50 | | (53 | ) |
| Actuarial losses recognised in statement of total | | | | | | | | | | |
| recognised gains and losses | (1,005 | ) | (353 | ) | (44 | ) | (1,402 | ) | (29 | ) |
|
|
|
|
|
|
|
|
|
| |
| Deficits in schemes at 31st December 2002 | (1,194 | ) | (420 | ) | (247 | ) | (1,861 | ) | (834 | ) |
|
|
|
|
|
|
|
|
|
| |
| Exchange adjustments | – | | 20 | | (15 | ) | 5 | | 96 | |
| Charged to operating profit | (186 | ) | (75 | ) | (28 | ) | (289 | ) | (26 | ) |
| Employer contributions | 341 | | 159 | | 98 | | 598 | | 41 | |
| Other finance income/(expense) | (15 | ) | (8 | ) | (8 | ) | (31 | ) | (64 | ) |
| Actuarial (losses)/gains recognised in statement of total | | | | | | | | | | |
| recognised gains and losses | (441 | ) | 174 | | (50 | ) | (317 | ) | (190 | ) |
|
|
|
|
|
|
|
|
|
| |
| Deficits in schemes at 31st December 2003 | (1,495 | ) | (150 | ) | (250 | ) | (1,895 | ) | (977 | ) |
|
|
|
|
|
|
|
|
|
| |
| Exchange adjustments | – | | 9 | | 4 | | 13 | | 59 | |
| Charged to operating profit | (125 | ) | (58 | ) | (44 | ) | (227 | ) | (37 | ) |
| Employer contributions | 336 | | 65 | | 68 | | 469 | | 40 | |
| Other finance income/(expense) | 5 | | 14 | | (7 | ) | 12 | | (55 | ) |
| Actuarial (losses)/gains recognised in statement of total | | | | | | | | | | |
| recognised gains and losses | 117 | | 14 | | 13 | | 144 | | (35 | ) |
|
|
|
|
|
|
|
|
|
| |
| Deficits in schemes at 31st December 2004 | (1,162 | ) | (106 | ) | (216 | ) | (1,484 | ) | (1,005 | ) |
|
|
|
|
|
|
|
|
|
| |
| |
| | | | | | | | | | | |
| | | | | | | | | | Post-retirement | |
| | | | | | | | Pensions | | benefits | |
| |
| |
| |
| History of experience gains and losses | UK | | USA | | Rest of World | | Group | | Group | |
| | £m | | £m | | £m | | £m | | £m | |
|
|
|
|
|
|
|
|
|
| |
| 2004 | | | | | | | | | | |
| Difference between the expected and actual | | | | | | | | | | |
| return on scheme assets (£m) | 106 | | 82 | | 1 | | 189 | | | |
| Percentage of scheme assets at 31st December 2004 | 3% | | 5% | | – | | 3% | | | |
|
|
|
|
|
|
|
| | | |
| | | | | | | | | | | |
| Experience gains/(losses) of scheme liabilities (£m) | 11 | | (6 | ) | 43 | | 48 | | 47 | |
| Percentage of present value of scheme liabilities | | | | | | | | | | |
| at 31st December 2004 | – | | – | | 6% | | 1% | | 5% | |
|
|
|
|
|
|
|
| |
| |
| | | | | | | | | | | |
| Total amount recognised in statement of total | | | | | | | | | | |
| recognised gains and losses (£m) | 117 | | 14 | | 13 | | 144 | | (35 | ) |
| Percentage of present value of scheme | | | | | | | | | | |
| liabilities at 31st December 2004 | 2% | | 1% | | 2% | | 2% | | 3% | |
|
|
|
|
|
|
|
| |
| |
Back to Contents
| Notes to the financial statements GlaxoSmithKline | 135 |
35 Employee costs continued
| | | | | | | | | | Post-retirement | |
| | | | | | | | Pensions | | benefits | |
| History of experience gains and losses |
|
|
|
|
|
|
| |
| |
| UK | | USA | | Rest of World | | Group | | Group | |
| | £m | | £m | | £m | | £m | | £m | |
|
|
|
|
|
|
|
| |
| |
| | | | | | | | | | | |
| 2003 | | | | | | | | | | |
| Difference between the expected and actual | | | | | | | | | | |
| return on scheme assets (£m) | 368 | | 230 | | 10 | | 608 | | | |
| Percentage of scheme assets at 31st December 2003 | 10% | | 14% | | 2% | | 11% | | | |
|
|
|
|
|
|
|
| | | |
| Experience (losses)/gains of scheme liabilities (£m) | (193 | ) | 5 | | (28 | ) | (216 | ) | (123 | ) |
| Percentage of present value of scheme liabilities | | | | | | | | | | |
| at 31st December 2003 | 4% | | – | | 4% | | 3% | | 13% | |
|
|
|
|
|
|
|
| |
| |
| Total amount recognised in statement of total | | | | | | | | | | |
| recognised gains and losses (£m) | (441 | ) | 174 | | (50 | ) | (317 | ) | (190 | ) |
| Percentage of present value of scheme | | | | | | | | | | |
| liabilities at 31st December 2003 | 9% | | 10% | | 7% | | 4% | | 19% | |
|
|
|
|
|
|
|
| |
| |
| 2002 | | | | | | | | | | |
| Difference between the expected and actual | | | | | | | | | | |
| return on scheme assets (£m) | (1,024 | ) | (293 | ) | (56 | ) | (1,373 | ) | | |
| Percentage of scheme assets at 31st December 2002 | 35% | | 22% | | 17% | | 30% | | | |
|
|
|
|
|
|
|
| | | |
| Experience gains/(losses) of scheme liabilities (£m) | 34 | | (3 | ) | 2 | | 33 | | 95 | |
| Percentage of present value of scheme liabilities | | | | | | | | | | |
| at 31st December 2002 | 1% | | – | | – | | 1% | | 11% | |
|
|
|
|
|
|
|
| |
| |
| Total amount recognised in statement of total | | | | | | | | | | |
| recognised gains and losses (£m) | (1,005 | ) | (353 | ) | (44 | ) | (1,402 | ) | (29 | ) |
| Percentage of present value of scheme | | | | | | | | | | |
| liabilities at 31st December 2002 | 24% | | 20% | | 8% | | 22% | | 3% | |
|
|
|
|
|
|
|
| |
| |
If the FRS 17 valuation basis had been applied in the financial statements instead of the SSAP 24 valuation basis, the effect on the profit and loss account reserve after taking account of deferred tax would have been as follows:
| | | | | | | | 2003 | |
| | | | 2004 | | | | (restated) | |
| |
|
|
| |
|
|
| |
| | £m | | £m | | £m | | £m | |
|
|
|
|
|
|
|
| |
| Profit and loss account reserve per balance sheet | | | 4,781 | | | | 4,112 | |
| Pension liability under FRS 17 | (1,020 | ) | | | (1,300 | ) | | |
| Net pension asset under SSAP 24 per balance sheet | 387 | | | | 152 | | | |
|
|
|
|
|
|
|
| |
| | | | (1,407 | ) | | | (1,452 | ) |
| Post-retirement healthcare schemes under FRS 17 | (640 | ) | | | (638 | ) | | |
| Net post-retirement healthcare schemes provision per balance sheet | (379 | ) | | | (372 | ) | | |
|
|
|
|
|
|
|
| |
| | | | (261 | ) | | | (266 | ) |
|
|
|
|
|
|
|
| |
| Profit and loss account reserve including FRS 17 pension and post-retirement healthcare liability | | | 3,113 | | | | 2,394 | |
|
|
|
|
|
|
|
| |
Back to Contents
| 136 | GlaxoSmithKline Notes to the financial statements |
36 Employee share schemes
The Group operates share option schemes, whereby options are granted to employees to acquire shares or ADSs in GlaxoSmithKline plc at the grant price, and share award schemes, whereby awards are granted to employees to acquire shares or ADSs in GlaxoSmithKline plc at no cost, subject to the achievement of performance targets. In 2004, the Group introduced a new share award scheme, the Restricted Share Plan, whereby awards are granted to employees to acquire shares or ADSs in GlaxoSmithKline plc at no cost after a three year period. The granting of restricted share awards has replaced the granting of options to certain employees as the cost of the scheme more readily equates to the potential gain to be made by the employee.
The Group operates share option schemes and savings-related share option schemes. Grants under share option schemes are normally exercisable between three and ten years from the date of grant. Grants under savings-related share option schemes are normally exercisable after three years’ saving.
Options under the share option schemes are normally granted at the market price ruling at the date of grant. In accordance with UK practice, the majority of options under the savings-related share option schemes are granted at a price 20 per cent below the market price ruling at the date of grant. In accordance with the exemption granted in UITF 17 (revised) no charge to the profit and loss account is made in relation to these savings-related share option schemes.
| Options outstanding | | Share option | | Share option | | Savings-related | |
| | schemes – shares | | schemes – ADSs | | share option schemes | |
| |
| |
| |
| |
| | | | | Weighted | | | | Weighted | | | | Weighted | |
| | | Number | | exercise | | Number | | exercise | | Number | | exercise | |
| | | (000) | | price | | (000) | | price | | (000) | | price | |
|
|
|
|
|
|
|
|
|
|
|
|
| |
| At 31st December 2001 | | 179,936 | | £15.67 | | 73,825 | | $50.31 | | 8,200 | | £14.13 | |
| Options granted | | 33,454 | | £11.91 | | 22,991 | | $37.57 | | 9,793 | | £9.16 | |
| Options exercised | | (8,857 | ) | £10.55 | | (1,504 | ) | $21.75 | | (398 | ) | £14.04 | |
| Options cancelled | | (7,061 | ) | £17.53 | | (4,435 | ) | $54.69 | | (4,607 | ) | £14.41 | |
|
|
|
|
|
|
|
|
|
|
|
|
| |
| At 31st December 2002 | | 197,472 | | £15.20 | | 90,877 | | $47.34 | | 12,988 | | £10.29 | |
| Options granted | | 32,750 | | £12.84 | | 23,630 | | $43.34 | | 1,416 | | £10.20 | |
| Options exercised | | (4,728 | ) | £4.75 | | (1,828 | ) | $22.22 | | (112 | ) | £10.23 | |
| Options cancelled | | (19,789 | ) | £7.45 | | (6,150 | ) | $32.73 | | (3,709 | ) | £12.23 | |
|
|
|
|
|
|
|
|
|
|
|
|
| |
| At 31st December 2003 | | 205,705 | | £14.89 | | 106,529 | | $46.58 | | 10,583 | | £9.59 | |
| Options granted | | 9,837 | | £11.23 | | 9,222 | | $42.99 | | 1,580 | | £9.52 | |
| Options exercised | | (5,764 | ) | £6.54 | | (1,845 | ) | $25.65 | | (232 | ) | £9.18 | |
| Options cancelled | | (11,997 | ) | £15.33 | | (3,427 | ) | $48.28 | | (1,790 | ) | £10.46 | |
|
|
|
|
|
|
|
|
|
|
|
|
| |
| At 31st December 2004 | | 197,781 | | £14.92 | | 110,479 | | $46.57 | | 10,141 | | £9.44 | |
|
|
|
|
|
|
|
|
|
|
|
|
| |
| Range of exercise prices | | £3.98 | | – £19.77 | | $12.83 | | – $61.35 | | £9.16 | | – £14.12 | |
|
|
|
|
|
|
|
|
|
|
|
|
| |
In order to encourage employees to convert options, excluding savings-related share options, held over Glaxo Wellcome or SmithKline Beecham shares or ADSs, into those over GlaxoSmithKline shares or ADSs, a programme was established to give an additional cash benefit of 10 per cent of the exercise price of the original option provided that the employee did not voluntarily leave the Group for two years from the date of the merger and did not exercise the option before the earlier of six months from the expiry date of the original option and two years from the date of the merger. The cash benefit will also be paid if the options expire unexercised if the market price is below the exercise price on the date of expiry.
Options outstanding
at 31st December 2004 | | Share option | | Share option | | Savings-related | |
| | schemes – shares | | schemes – ADSs | | share option schemes | |
| |
| |
| |
| |
| | | | | Weighted | | Latest | | | | Weighted | | Latest | | | | Weighted | | Latest | |
| | | Number | | exercise | | exercise | | Number | | exercise | | exercise | | Number | | exercise | | exercise | |
| Year of grant | | (000) | | price | | date | | (000) | | price | | date | | (000) | | price | | date | |
|
|
|
|
|
|
|
|
|
|
|
|
|
|
|
|
|
|
| |
| 1995 | | 3,266 | | £7.17 | | 15.11.05 | | 522 | | $21.82 | | 15.11.05 | | – | | – | | – | |
| 1996 | | 3,980 | | £8.41 | | 01.12.06 | | 956 | | $27.60 | | 21.11.06 | | – | | – | | – | |
| 1997 | | 7,979 | | £11.64 | | 13.11.07 | | 3,978 | | $40.30 | | 13.11.07 | | – | | – | | – | |
| 1998 | | 16,270 | | £16.93 | | 23.11.08 | | 6,041 | | $54.25 | | 23.11.08 | | – | | – | | – | |
| 1999 | | 17,344 | | £18.17 | | 01.12.09 | | 7,619 | | $60.13 | | 24.11.09 | | – | | – | | – | |
| 2000 | | 18,759 | | £14.87 | | 11.09.10 | | 366 | | $58.88 | | 16.03.10 | | – | | – | | – | |
| 2001 | | 59,320 | | £18.09 | | 28.11.11 | | 37,939 | | $51.82 | | 28.11.11 | | 270 | | £14.12 | | 31.05.05 | |
| 2002 | | 31,280 | | £11.90 | | 03.12.12 | | 21,231 | | $37.53 | | 03.12.12 | | 7,419 | | £9.16 | | 31.05.06 | |
| 2003 | | 29,960 | | £12.65 | | 15.12.13 | | 22,682 | | $43.38 | | 15.12.13 | | 878 | | £10.20 | | 31.05.07 | |
| 2004 | | 9,623 | | £11.21 | | 02.12.14 | | 9,145 | | $42.98 | | 02.12.14 | | 1,574 | | £9.52 | | 31.05.08 | |
|
|
|
|
|
|
|
|
|
|
|
|
|
|
|
|
|
|
| |
| Total | | 197,781 | | £14.92 | | | | 110,479 | | $46.57 | | | | 10,141 | | £9.44 | | | |
|
|
|
|
|
|
|
|
|
|
|
|
|
|
|
|
|
|
| |
All of the above options are exercisable, except all options over shares and ADSs granted in 2002, 2003 and 2004 and the savings-related share options granted in 2002, 2003 and 2004.
There has been no change in the effective exercise price of any outstanding options during the year. No further options were granted between 31st December 2004 and 25th February 2005.
Back to Contents
| Notes to the financial statements GlaxoSmithKline | 137 |
36 Employee share schemes continued
| Options exercisable | | Share option | | Share option | | Savings-related | |
| | schemes – shares | | schemes – ADSs | | share option schemes | |
| |
|
|
| |
|
|
|
|
| |
| | | | | Weighted | | | | Weighted | | | | Weighted | |
| | | Number | | exercise | | Number | | exercise | | Number | | exercise | |
| | | (000) | | price | | (000) | | price | | (000) | | price | |
|
|
|
|
|
|
|
|
|
|
|
|
| |
| At 31st December 2002 | | 72,611 | | £14.33 | | 27,129 | | $48.89 | | 2,227 | | £13.27 | |
| | | | | | | | | | | | | | |
| At 31st December 2003 | | 79,693 | | £14.56 | | 22,364 | | $49.82 | | 192 | | £16.48 | |
| | | | | | | | | | | | | | |
| At 31st December 2004 | | 126,917 | | £16.49 | | 57,421 | | $51.75 | | 270 | | £14.12 | |
|
|
|
|
|
|
|
|
|
|
|
|
| |
GlaxoSmithKline share award schemes
Performance Share Plan
The Group operates a Performance Share Plan whereby awards are granted to Directors and senior executives at no cost. The percentage of each award that vests is based upon the performance of the Group over a three year measurement period. The performance conditions consist of two parts, each of which applies to 50 per cent of the award. For awards granted in 2002 and 2003, the first part of the condition compares GlaxoSmithKline’s Total Shareholder Return (TSR) over the period with the TSR of companies in the UK FTSE 100 Index over the same period. For awards granted in 2004 the first part of the condition compares GlaxoSmithKline’s TSR over the period with TSR of 13 pharmaceutical companies in the comparator group over the same period. The second part of the performance condition compares GlaxoSmithKline’s earnings per share growth to the increase in the UK Retail Prices Index over the three year performance period. Awards granted to Directors and members of the CET from 15th December 2003 are subject to a single performance condition which compares GlaxoSmithKline’s TSR over the period with the TSR of companies in the comparator group over the same period.
| | | | | Other awards | |
| | |
|
|
| |
| Number of shares and ADSs issuable | | Shares | | ADSs | |
| | Number (000) | | Number (000) | |
|
|
|
|
| |
| At 31st December 2001 | | 3,181 | | 1,760 | |
| Awards granted | | 863 | | 477 | |
| Awards exercised | | (728 | ) | (197 | ) |
| Awards cancelled | | (152 | ) | (97 | ) |
|
|
|
|
| |
| At 31st December 2002 | | 3,164 | | 1,943 | |
| Awards granted | | 1,070 | | 832 | |
| Awards exercised | | (625 | ) | (189 | ) |
| Awards cancelled | | (109 | ) | (107 | ) |
|
|
|
|
| |
| At 31st December 2003 | | 3,500 | | 2,479 | |
| Awards granted | | 1,778 | | 1,339 | |
| Awards exercised | | (409 | ) | (187 | ) |
| Awards cancelled | | (520 | ) | (276 | ) |
|
|
|
|
| |
| At 31st December 2004 | | 4,349 | | 3,355 | |
|
|
|
|
| |
Restricted Share Plan
The Group operates a Restricted Share Plan whereby awards are granted to employees at no cost. The award vests after three years with no performance criteria attached.
| Number of shares and ADSs issuable | | Shares | | ADSs | |
| | Number (000) | | Number (000) | |
|
|
|
|
| |
| At 31st December 2003 | | – | | – | |
| Awards granted | | 4,419 | | 3,562 | |
|
|
|
|
| |
| At 31st December 2004 | | 4,419 | | 3,562 | |
|
|
|
|
| |
Back to Contents
| 138 | GlaxoSmithKline Notes to the financial statements |
36 Employee share schemes continued
Employee Share Ownership Plan Trusts
The Group sponsors Employee Share Ownership Plan (ESOP) Trusts to acquire and hold shares in GlaxoSmithKline plc to satisfy awards made under employee incentive plans and options granted under employee share option schemes. The trustees of the ESOP Trusts purchase shares on the open market with finance provided by the Group by way of loans or contributions. The expected cost of the obligations to deliver shares under the schemes are normally spread over the periods of service in respect of which the awards and options are granted. An accelerated charge was made in 2000 in respect of the outstanding cost of providing shares for awards and options which became exercisable solely as a result of the merger.
| Shares held for share award schemes | | | | 2003 | |
| | 2004 | | (restated) | |
|
|
|
|
| |
| Number of shares (000) | | 22,992 | | 7,748 | |
| | | | | | |
| | | £m | | £m | |
|
|
|
|
| |
| Nominal value | | 6 | | 2 | |
| Carrying value | | 213 | | 84 | |
| Market value | | 281 | | 99 | |
|
|
|
|
| |
| Shares held for share option schemes | | | | | |
| | 2004 | | 2003 | |
|
|
|
|
| |
| Number of shares (000) | | 151,535 | | 170,066 | |
| | | | | | |
| | | £m | | £m | |
|
|
|
|
| |
| Nominal value | | 38 | | 43 | |
| Carrying value | | 2,361 | | 2,645 | |
| Market value | | 1,852 | | 2,177 | |
|
|
|
|
| |
Results in 2003 have been restated following the implementation of UITF17 (revised). UITF17 (revised) requires that the minimum expense should be the difference between the fair value of the shares at the date of award and the amount that an employee may be required to pay for the shares (i.e. the intrinsic value of the award).
The Trusts also acquire and hold shares to meet notional dividends re-invested on deferred awards under the SmithKline Beecham Mid-Term Incentive Plan. The trustees have waived their rights to dividends on the shares held by the Employee Share Ownership Trusts.
Option pricing
For the purposes of valuing options to arrive at the stock-based compensation adjustment in the Reconciliation to US accounting principles in Note 37, the Black-Scholes option pricing model has been used. The assumptions used in the model for 2004 and 2003 are as follows:
| | | 2004 | | 2003 | |
|
|
|
|
| |
| Risk-free interest rate | | 3.3% – 4.6% | | 4.2% – 4.9% | |
| Dividend yield | | 3.1% | | 2.9% | |
| Volatility | | 26% – 29% | | 34% | |
| Expected lives of options granted under: | | | | | |
| Share option schemes | | 5 years | | 5 years | |
| Savings-related share option schemes | | 3 years | | 3 years | |
|
|
|
|
| |
Back to Contents
| Notes to the financial statements GlaxoSmithKline | 139 |
37 Reconciliation to US accounting principles
The analyses and reconciliations presented in this Note represent the financial information prepared on the basis of US Generally Accepted Accounting Principles (US GAAP) rather than UK GAAP.
Summary of material differences between UK and US GAAP
Acquisition of SmithKline Beecham
The combination of Glaxo Wellcome plc and SmithKline Beecham plc was accounted for as a merger (pooling of interests) in accordance with UK GAAP. Under US GAAP, this business combination did not qualify for pooling of interests accounting and Glaxo Wellcome was determined to be the accounting acquirer in a purchase business combination.
Accordingly the net assets of SmithKline Beecham were fair valued as at the date of acquisition. As a result of the fair value exercise, increases in the values of SmithKline Beecham’s inventory, tangible fixed assets, investments and pension obligations were recognised and fair market values attributed to its intangible assets, mainly product rights (inclusive of patents and trade marks) and in-process research and development, together with appropriate deferred taxation effects. The difference between the cost of acquisition and the fair value of the assets and liabilities of SmithKline Beecham has been recorded as goodwill.
Capitalised interest
Under UK GAAP, the Group does not capitalise interest. US GAAP requires interest incurred as part of the cost of constructing fixed assets to be capitalised and amortised over the life of the asset.
Computer software
Under UK GAAP, the Group capitalises costs incurred in acquiring and developing computer software for internal use where the software supports a significant business system and the expenditure leads to the creation of a durable asset. For US GAAP, the Group applies SOP 98-1, ‘Accounting for the Costs of Computer Software Developed or Obtained for Internal Use’, which restricts the categories of costs which can be capitalised.
Goodwill and intangible fixed assets
Under UK GAAP, goodwill arising on acquisitions before 1998 accounted for under the purchase method has been eliminated against shareholders’ funds. Additionally, UK GAAP requires that on subsequent disposal or closure of a business, any goodwill previously taken directly to shareholders’ funds is then charged against income. Under UK GAAP, goodwill arising on acquisitions from 1998 is capitalised and amortised over a period not exceeding 20 years. Intangible assets are amortised over their estimated useful economic life except in the case of certain acquired brands where the end of the useful economic life of the brand cannot be foreseen.
Under US GAAP, goodwill arising on acquisitions prior to 30th June 2001 was capitalised and amortised over a period not exceeding 40 years. All intangible assets, including brands, were amortised over a finite life. In July 2001, the Financial Accounting Standards Board (FASB) issued Statement of Financial Accounting Standard (SFAS) 142, ‘Goodwill and Other Intangible Assets’. SFAS 142 requires that goodwill no longer be amortised over its estimated useful life. The Group must instead identify and value its reporting units for the purpose of assessing, at least annually, potential impairment of goodwill allocated to each reporting unit.
Additionally, the Group reassesses the useful lives of existing recognised intangible assets. Intangible assets deemed to have indefinite lives are no longer amortised, instead they are tested annually for potential impairment. Separable intangible assets with finite lives continue to be amortised over their useful lives.
The Group adopted SFAS 142 as of 1st January 2002. The implementation of SFAS 142 resulted in no impairment of the Group’s goodwill and an initial impairment of £173 million (£127 million net of tax) on indefinite-lived assets. This is shown as a cumulative effect of an accounting change.
Under UK GAAP, costs to be incurred in integrating and restructuring the Wellcome, SmithKline Beecham and Block Drug businesses following the acquisitions in 1995, 2000 and 2001 respectively were charged to the profit and loss account post acquisition. Under US GAAP, certain of such costs were considered in the allocation of purchase consideration thereby affecting the goodwill arising on acquisition.
Under UK GAAP, certain intangible assets related to specific compounds or products which are purchased from a third party and are developed for commercial applications are capitalised. Under US GAAP, payments made for these compounds or products which are still in development and have not yet received regulatory approval are charged directly to the profit and loss account until such time that they receive regulatory approval.
Restructuring costs
Under UK GAAP, restructuring costs incurred following acquisitions were charged to the profit and loss account post acquisition. For US GAAP purposes, certain of these costs were recognised as liabilities upon acquisition in the opening balance sheet.
Other restructuring costs are recorded as a provision under UK GAAP when a restructuring plan has been announced. Under US GAAP, a provision may only be recognised when further criteria are met or the liability is incurred. Accordingly, adjustments have been made to eliminate the UK GAAP provisions for restructuring costs that do not meet US GAAP requirements.
Marketable securities
Marketable securities consist primarily of equity securities and certain other liquid investments. Under UK GAAP, these securities are stated at the lower of cost and net realisable value. Under US GAAP these securities are considered available for sale under SFAS 115 ‘Accounting for certain investments in debt and equity securities’ and are carried at fair value, with the unrealised gains and losses, net of tax, recorded as a separate component of shareholders’ equity.
Equity securities are reviewed at least annually for other than temporary impairment. The factors considered are:
| • | the investee’s current financial performance and future prospects |
| • | the general market condition of the geographic or industry area in which the investee operates |
| • | the duration and extent to which the market value (if available) has been below cost. |
Gross unrealised gains and losses on marketable securities were £60 million and £3 million respectively at 31st December 2004 (£68 million and £5 million respectively at 31st December 2003).
Back to Contents
| 140 | GlaxoSmithKline Notes to the financial statements |
37 Reconciliation to US accounting principles continued
Pensions and other post-retirement benefits
The key differences between UK (SSAP 24) and US GAAP in relation to defined benefit pension plans are:
| • | under UK GAAP, the effect of variations in cost can be accumulated at successive valuations and amortised on an aggregate basis. Under US GAAP the amortisation of the transition asset and the costs of past service benefit improvements are separately tracked: experience gains/losses are dealt with on an aggregate basis but amortised only if outside a 10 per cent corridor |
| | |
| • | UK GAAP allows measurements of plan assets and liabilities to be based on the result of the latest actuarial valuation. US GAAP requires measurement of plan assets and liabilities to be made at the date of the Financial statements or up to three months prior to that date |
| | |
| • | the pension adjustment also includes the impact of changes in minimum pension liabilities included within accumulated other comprehensive income. |
During 2002, the Group decided to align the measurement date for all of its pension and post-retirement benefit plans to 31st December as certain of the Group’s plans had a measurement date for assets and liabilities of 30th September.
The impact, reflected as a cumulative effect of an accounting change, was a £37 million credit, net of tax, to income.
Stock-based compensation
Under UK GAAP, share options are accounted for as equity when exercised, valued at the issuance price. Under US GAAP, the Group applies SFAS 123, ‘Accounting for stock-based compensation’, and related accounting interpretations in accounting for its option plans which require options to be fair valued at their grant date and included in profit and loss over the vesting period of the options.
The Group is entitled to receive a tax deduction for the amount treated as compensation under US tax rules for employee stock options which have been exercised by US employees during the year. Under UK GAAP, this is treated as a reduction of tax expense whereas, under US GAAP, a portion of this amount is credited to equity.
Employee Share Ownership Plan Trusts
Prior to 2004, under UK GAAP shares of the Group’s stock held by the ESOP Trusts were recorded at cost, less a provision representing the difference between the cost and the option exercise price, and accounted for as fixed asset investments. Projected losses on the exercise of the options covered by the shares were recorded through the profit and loss account over the life of the options. In 2004, UITF Abstract 38, ‘Accounting for ESOP Trusts’, and related amendments to UITF Abstract 17, ‘Employee share schemes’, were implemented in the Group’s UK GAAP financial statements. UITF 38 changes the presentation of an entity’s own shares held in an ESOP Trust from requiring them to be recognised as assets to requiring them to be deducted in arriving at shareholders’ funds, as under US GAAP. UITF 17 (revised) requires that the minimum expense should be the difference between the fair value of the shares at the date of award and the amount that an employee may be required to pay for the shares (i.e. the intrinsic value of the award).
These changes have been accounted for as prior year adjustments under UK GAAP and the reconciliations of Profit attributable to shareholders and Equity shareholders’ funds from UK GAAP to US GAAP have been restated accordingly to reconcile from the restated UK GAAP figures.
A reconciling difference between UK GAAP and US GAAP remains in respect of the charge recognised against profit. Under US GAAP, shares purchased by the ESOP Trusts are accounted for within shareholders’ equity with gains and losses on issuance of shares to employees being recorded as adjustments to shareholders’ equity.
Guarantor obligations
The Group adopted the FASB’s Financial Interpretation No. 45 (FIN 45), ‘Guarantor’s Accounting and Disclosure Requirements for Guarantees, Including Indirect Guarantees of Indebtedness of Others’ with effect from 1st January 2003.
This requires that the Group recognise and measure, at fair value, on a prospective basis, certain guarantees issued or modified after 31st December 2002. Under UK GAAP, such guarantor obligations are recognised when further additional criteria are met or the liability is incurred.
Derivative instruments
SFAS 133, ‘Accounting for Derivative Instruments and Hedging Activities’, as amended by SFAS 137 and SFAS 138 and as interpreted by the Derivatives Implementation Group, was adopted by the Group with effect from 1st January 2001. SFAS 133 establishes accounting and reporting standards for derivative instruments, including certain derivative instruments embedded in other contracts (collectively, referred to as derivatives) and for hedging activities. Under UK GAAP, some derivative instruments used for hedging are not recognised on the balance sheet and the matching principle is used to match the gain or loss under these hedging contracts to the foreign currency transaction or profits to which they relate. SFAS 133 requires that an entity recognise all derivatives as either assets or liabilities in the consolidated balance sheet and measure those instruments at fair value. Changes in fair value over the period are recorded in current earnings unless hedge accounting is obtained. The Group does not designate any of its derivatives as qualifying hedge instruments under SFAS 133. SFAS 133 prescribes requirements for designation and documentation of hedging relationships and ongoing assessments of effectiveness in order to qualify for hedge accounting.
The Group also evaluates contracts for ‘embedded’ derivatives, and considers whether any embedded derivatives have to be bifurcated, or separated, from the host contracts in accordance with SFAS 133 requirements. If embedded derivatives exist and are not clearly and closely related to the host contract, they are accounted for separately from the host contract as derivatives.
Gains and losses related to the fair value adjustments of all derivative instruments are classified in the consolidated statement of income and cash flows in accordance with the nature of the derivative.
The fair value and book value of derivative instruments in respect of financial assets and liabilities as at 31st December 2004 is disclosed in the ‘Classification and fair value of financial assets and liabilities’ table in Note 34.
Back to Contents
| Notes to the financial statements GlaxoSmithKline | 141 |
37 Reconciliation to US accounting principles continued
Valuation of derivative instruments
The fair value of derivative instruments is sensitive to movements in the underlying market rates and variables. The Group monitors the fair value of derivative instruments on at least a quarterly basis, with a formal review every six months. Derivatives including interest rate swaps and cross-currency swaps are valued using standard valuation models, counterparty valuations, or third party valuations. Standard valuation models used by the Group consider relevant discount rates, the market yield curve on the valuation date, forward currency exchange rates and counterparty risk. All significant rates and variables are obtained from market sources. All valuations are based on the remaining term to maturity of the instrument. Foreign exchange contracts are valued using forward rates observed from quoted prices in the relevant markets when possible. The Group assumes parties to long-term contracts are economically viable but reserves the right to exercise early termination rights if economically beneficial when such rights exist in the contract.
Dividends
Under UK GAAP, dividends proposed are provided for in the year in respect of which they are recommended by the Board of Directors for approval by the shareholders. Under US GAAP, such dividends are not provided for until declared by the Board of Directors.
Consolidated summary statement of cash flows
The US GAAP cash flow statement reports changes in cash and cash equivalents, which includes short-term highly liquid investments with original maturities of three months or less. Only three categories of cash flows are reported: operating activities (including tax and interest); investing activities (including capital expenditure, acquisitions and disposals together with cash flows from available for sale current asset investments); and financing activities (including dividends paid). A summary statement of cash flows is presented on page 143.
Cash and cash equivalents
Under UK GAAP, the cash balance includes only cash at bank and other cash balances. Under US GAAP, cash and cash equivalents include cash at bank and certain liquid investments with original maturities of three months or less.
Comprehensive income statement
The requirement of SFAS 130, ‘Reporting comprehensive income’, to provide a comprehensive income statement is met under UK GAAP by the Statement of total recognised gains and losses (pages 90 and 91).
Reclassifications
Certain prior year balances have been reclassified for comparative purposes. Certain amounts previously presented in aggregate in the reconciliation of profit under US GAAP to UK GAAP have been presented separately in the current year presentation to provide more information related to these adjustments.
Sales incentives
In accordance with UK GAAP, certain amounts paid by the Group to its customers are recorded as promotional expense included in operating income. Under US GAAP, these items are recorded as a reduction in revenue. While these items do not result in a net impact to the income statement under US GAAP, the amount that would be classified as a reduction in revenue in 2004 would be £373 million (2003 – £324 million).
Variable interest entities
In January 2003, the FASB issued Interpretation No. 46 (FIN 46), ‘Consolidation of Variable Interest Entities’, and in December 2003 issued FIN 46R, a revision of this Interpretation. Under the revised Interpretation, certain entities, known as Variable Interest Entities (VIEs), must be consolidated by the ‘primary beneficiary’ of the entity. The primary beneficiary is generally defined as having the majority of the risks and rewards arising from the VIE. Additionally, for VIEs in which a significant, but not majority, variable interest is held, certain disclosures are required.
The Group has completed a review of potential VIEs and, as a consequence, has consolidated Theravance Inc. from May 2004 (see Note (c) on page 145). No other VIEs of which the Group is the primary beneficiary were identified.
Recent Financial Accounting Standards Board (FASB) pronouncements
In May 2004, the FASB issued FASB Staff Position (FSP) FAS 106-2, ‘Accounting and Disclosure Requirements Related to the Medicare Prescription Drug, Improvement and Modernization Act of 2003’, superseding FSP 106-1. FSP 106-2 addresses the accounting implications of the Act for an entity that sponsors a post-retirement health care plan providing prescription drug benefits. The Act introduces in the USA a prescription drug benefit under Medicare, as well as a federal subsidy to sponsors of certain post-retirement health care plans. For companies that elected for deferral under FSP 106-1, FSP 106-2 is effective for reporting periods commencing after 15th June 2004. The estimated amount of the federal subsidy is treated as a prior service gain and credited to the profit and loss account over the average service lives of the employees. Under US GAAP, this change resulted in a decrease of £71 million in the accumulated benefit obligation and a reduction of £2 million in net periodic post-retirement benefit cost for the year ended 31st December 2004.
Back to Contents
| 142 | GlaxoSmithKline Notes to the financial statements |
37 Reconciliation to US accounting principles continued
The following is a summary of the material adjustments to profit and shareholders’ funds which would be required if US GAAP had been applied instead of UK GAAP.
| Profit | | | | | | 2003 | | 2002 | |
| | | | 2004 | | (restated) | | (restated) | |
| | Notes | | £m | | £m | | £m | |
|
|
|
|
|
|
|
|
| |
| Profit attributable to shareholders under UK GAAP | | | | 4,302 | | 4,478 | | 3,930 | |
| Goodwill amortisation reversal including goodwill in associated undertakings | | (a) | | 17 | | 19 | | 18 | |
| Amortisation and impairment of intangible assets | | (b) | | (1,426 | ) | (2,292 | ) | (4,089 | ) |
| Acquisition and disposal of product rights | | (b) | | (210 | ) | (105 | ) | (181 | ) |
| Capitalised interest | | | | (17 | ) | 23 | | 20 | |
| Tangible fixed assets | | | | (2 | ) | 5 | | 25 | |
| Disposal of interest in associate | | | | (81 | ) | – | | – | |
| Disposal of goodwill in subsidiaries | | | | 3 | | – | | – | |
| Product divestments | | | | (1 | ) | 7 | | 7 | |
| Equity investments | | | | (30 | ) | (31 | ) | (8 | ) |
| Recognition of cost of sales on fair value step-up of inventory | | | | (13 | ) | – | | – | |
| Pensions and post-retirement benefits | | (f) | | (162 | ) | (122 | ) | (138 | ) |
| Stock-based compensation | | | | (296 | ) | (372 | ) | (320 | ) |
| Derivative instruments and hedging | | | | 33 | | (41 | ) | 37 | |
| Fair value of put option granted to minority shareholders | | (c) | | 17 | | – | | – | |
| Guarantor obligations | | | | 19 | | (21 | ) | – | |
| Restructuring | | | | (12 | ) | 98 | | 37 | |
| Tax benefits on exercise of US stock options | | (d) | | (10 | ) | (13 | ) | (13 | ) |
| Deferred taxation | | (d) | | 661 | | 787 | | 1,178 | |
| Variable interest entities | | (c) | | (60 | ) | – | | – | |
|
|
|
|
|
|
|
|
| |
| Net income under US GAAP before cumulative effect of changes | | | | | | | | | |
| in accounting principles | | | | 2,732 | | 2,420 | | 503 | |
| Cumulative effect of changes in accounting principles | | | | – | | – | | (90 | ) |
|
|
|
|
|
|
|
|
| |
| Net income after cumulative effect of changes in accounting principles | | | | 2,732 | | 2,420 | | 413 | |
|
|
|
|
|
|
|
|
| |
| | | | | | | | | | |
| Certain items for the year ended 31st December 2002 have been reclassified for comparative purposes. | |
| | | | | | | | | | |
| Earnings per share under US GAAP | | | | 2004 | | 2003 | | 2002 | |
| | | | pence | | pence | | pence | |
|
|
|
|
|
|
|
|
| |
| Basic net income per share before cumulative effect of changes | | | | | | | | | |
| in accounting principles under US GAAP | | | | 47.6 | | 41.7 | | 8.5 | |
| Cumulative effect of changes in accounting principles per share | | | | | | | | | |
| under US GAAP | | | | – | | – | | (1.5 | ) |
| Basic net income per share after cumulative effect of changes | | | | | | | | | |
| in accounting principles under US GAAP | | | | 47.6 | | 41.7 | | 7.0 | |
|
|
|
|
|
|
|
|
| |
| Diluted net income per share before cumulative effect of changes | | | | | | | | | |
| in accounting principles under US GAAP | | | | 47.5 | | 41.6 | | 8.5 | |
| Cumulative effect of changes in accounting principles per share | | | | | | | | | |
| under US GAAP | | | | – | | – | | (1.5 | ) |
| Diluted net income per share after cumulative effect of changes | | | | | | | | | |
| in accounting principles under US GAAP | | | | 47.5 | | 41.6 | | 7.0 | |
|
|
|
|
|
|
|
|
| |
| | | | | | | | | | |
| Earnings per ADS under US GAAP | | | | 2004 | | 2003 | | 2002 | |
| | | | $ | | $ | | $ | |
|
|
|
|
|
|
|
|
| |
| Basic net income per ADS before cumulative effect of changes | | | | | | | | | |
| in accounting principles under US GAAP | | | | 1.74 | | 1.37 | | 0.26 | |
| Cumulative effect of changes in accounting principles per ADS | | | | | | | | | |
| under US GAAP | | | | – | | – | | (0.05 | ) |
| Basic net income per ADS after cumulative effect of changes | | | | | | | | | |
| in accounting principles under US GAAP | | | | 1.74 | | 1.37 | | 0.21 | |
|
|
|
|
|
|
|
|
| |
| Diluted net income per ADS before cumulative effect of changes | | | | | | | | | |
| in accounting principles under US GAAP | | | | 1.74 | | 1.36 | | 0.26 | |
| Cumulative effect of changes in accounting principles per ADS | | | | | | | | | |
| under US GAAP | | | | – | | – | | (0.05 | ) |
| Diluted net income per ADS after cumulative effect of changes | | | | | | | | | |
| in accounting principles under US GAAP | | | | 1.74 | | 1.36 | | 0.21 | |
|
|
|
|
|
|
|
|
| |
Back to Contents
| Notes to the financial statements GlaxoSmithKline | 143 |
37 Reconciliation to US accounting principles continued
| Equity shareholders’ funds | | | | | | 2003 | | | |
| | | | 2004 | | (restated) | | | |
| | Notes | | £m | | £m | | | |
|
|
|
|
|
|
| | | |
| Equity shareholders’ funds under UK GAAP | | | | 5,925 | | 5,059 | | | |
| US GAAP adjustments: | | | | | | | | | |
| Goodwill | | (a) | | 17,982 | | 17,986 | | | |
| Product rights | | (b) | | 13,994 | | 15,652 | | | |
| Pension intangible asset | | (b) | | 102 | | 128 | | | |
| Tangible fixed assets | | | | 43 | | 45 | | | |
| Capitalised interest | | | | 180 | | 198 | | | |
| Marketable securities | | | | 49 | | 84 | | | |
| Other investments | | | | 554 | | 832 | | | |
| Fair value step-up of inventory | | | | 1 | | – | | | |
| Pensions and other post-retirement benefits | | (f) | | (1,287 | ) | (1,702 | ) | | |
| Restructuring costs | | | | 80 | | 92 | | | |
| Derivative instruments and hedging | | | | (15 | ) | 26 | | | |
| Fair value of put option granted to minority shareholders | | (c) | | 17 | | – | | | |
| Guarantor obligations | | | | (2 | ) | (21 | ) | | |
| Dividends | | | | 683 | | 808 | | | |
| Deferred taxation | | (e) | | (4,204 | ) | (5,071 | ) | | |
| Variable interest entities | | (c) | | (60 | ) | – | | | |
|
|
|
|
|
|
| | | |
| Shareholders’ equity under US GAAP | | | | 34,042 | | 34,116 | | | |
|
|
|
|
|
|
| | | |
| | | | | | | | | | |
| Consolidated statement of cash flows under US GAAP | | | | 2004 | | 2003 | | 2002 | |
| | | | £m | | £m | | £m | |
|
|
|
|
|
|
|
|
| |
| Net cash provided by operating activities | | | | 4,618 | | 4,895 | | 5,345 | |
| Net cash used in investing activities | | | | (988 | ) | (904 | ) | (1,051 | ) |
| Net cash used in financing activities | | | | (3,038 | ) | (3,051 | ) | (4,002 | ) |
|
|
|
|
|
|
|
|
| |
| Net increase in cash and cash equivalents | | | | 592 | | 940 | | 292 | |
| Exchange rate movements | | | | (93 | ) | (36 | ) | (42 | ) |
| Cash and cash equivalents at beginning of year | | | | 1,986 | | 1,082 | | 832 | |
|
|
|
|
|
|
|
|
| |
| Cash and cash equivalents at end of year | | | | 2,485 | | 1,986 | | 1,082 | |
|
|
|
|
|
|
|
|
| |
| | | | | | | | | | |
| Notes to the Profit and Equity shareholders’ funds reconciliations | | | | | | | | | |
| | | | | | | | | | |
| (a) Goodwill | | | | | | | | | |
| | | | | | | | | | |
| The following tables set out the UK to US GAAP adjustments required to the UK GAAP statement of profit and loss and balance sheet in respect of goodwill including goodwill in respect of associated undertakings: |
| | | | | | | | | | |
| Income statement | | | | 2004 | | 2003 | | 2002 | |
| | | | £m | | £m | | £m | |
|
|
|
|
|
|
|
|
| |
| Amortisation under UK GAAP | | | | (17 | ) | (19 | ) | (18 | ) |
| Amortisation under US GAAP | | | | – | | – | | – | |
|
|
|
|
|
|
|
|
| |
| UK to USGAAP adjustment for amortisation (including goodwill in respect of associated undertakings) | | | | 17 | | 19 | | 18 | |
|
|
|
|
|
|
|
|
| |
| | | | | | | | | | |
| Balance sheet | | | | 2004 | | 2003 | | | |
| | | | £m | | £m | | | |
|
|
|
|
|
|
| | | |
| Goodwill under UK GAAP | | | | 139 | | 143 | | | |
| Goodwill under US GAAP | | | | 18,121 | | 18,129 | | | |
|
|
|
|
|
|
| | | |
| UK to US GAAP adjustments | | | | 17,982 | | 17,986 | | | |
|
|
|
|
|
|
| | | |
Of the £18,121 million (2003 - £18,129 million) US GAAP goodwill balance at 31st December 2004, £15,875 million (2003 - £15,875 million) is in respect of the goodwill arising on the acquisition of SmithKline Beecham by Glaxo Wellcome in 2000.
Back to Contents
| 144 | GlaxoSmithKline Notes to the financial statements |
37 Reconciliation to US accounting principles continued
The following tables present the changes in goodwill allocated to the Group’s reportable segments:
| | | | | Consumer | | | |
| | | Pharmaceuticals | | Healthcare | | Total | |
| | | £m | | £m | | £m | |
|
|
|
|
|
|
| |
| At 31st December 2002 | | 15,679 | | 2,481 | | 18,160 | |
| Additions | | 2 | | – | | 2 | |
| Exchange adjustments | | (13 | ) | (20 | ) | (33 | ) |
|
|
|
|
|
|
| |
| At 31st December 2003 | | 15,668 | | 2,461 | | 18,129 | |
| Asset written off | | (1 | ) | – | | (1 | ) |
| Exchange adjustments | | 5 | | (12 | ) | (7 | ) |
|
|
|
|
|
|
| |
| At 31st December 2004 | | 15,672 | | 2,449 | | 18,121 | |
|
|
|
|
|
|
| |
| | | | | | | | |
| (b) Intangible assets | | | | | | | |
| | | | | | | | |
| The following tables set out the UK to US GAAP adjustments required to the UKGAAP statement of profit and loss and balance sheet in respect of intangible assets: | |
| | | | | | | | |
| Income statement | | 2004 | | 2003 | | 2002 | |
| | £m | | £m | | £m | |
|
|
|
|
|
|
| |
| Amortisation charge under UK GAAP | | 94 | | 74 | | 60 | |
| Amortisation charge under US GAAP | | 1,516 | | 1,641 | | 1,787 | |
|
|
|
|
|
|
| |
| UK to US GAAP adjustment for amortisation | | 1,422 | | 1,567 | | 1,727 | |
|
|
|
|
|
|
| |
| | | | | | | | |
| Impairment charge under UK GAAP | | 22 | | 41 | | 46 | |
| Impairment charge under US GAAP | | 26 | | 766 | | 2,581 | |
|
|
|
|
|
|
| |
| UK to US GAAP adjustment for impairments | | 4 | | 725 | | 2,535 | |
| Cumulative effect of change in accounting principle | | – | | – | | (173 | ) |
|
|
|
|
|
|
| |
| UK to US GAAP adjustment for impairments for the period | | 4 | | 725 | | 2,362 | |
|
|
|
|
|
|
| |
| |
Following the initial implementation of SFAS 142 in 2002, the carrying value of the brands determined to have indefinite lives were reviewed and an impairment of £173 million (£127 million net of tax) was recognised. This was recorded as a cumulative effect of a change in accounting principle. In addition to the above adjustments for amortisation and impairments, further UK to US GAAP adjustments arose during the year of £173 million (2003 - £105 million; 2002 - £181 million) in respect of the acquisition of licences, patents etc. which are capitalised under UK GAAP but charged directly to research and development expense under US GAAP, and £37 million (2003 and 2002 – £nil) in respect of disposals of product rights which have a higher carrying value under US GAAP than under UK GAAP. |
| | | | | | | | |
| Balance sheet | | 2004 | | 2003 | | | |
| | £m | | £m | | | |
|
|
|
|
| | | |
| Intangible assets under UK GAAP | | 2,003 | | 1,697 | | | |
| Intangible assets under US GAAP | | 16,099 | | 17,477 | | | |
|
|
|
|
| | | |
| UK to US GAAP adjustments | | 14,096 | | 15,780 | | | |
| Less pensions intangible asset | | (102 | ) | (128 | ) | | |
|
|
|
|
| | | |
| Net UK to US GAAP product rights adjustments | | 13,994 | | 15,652 | | | |
|
|
|
|
| | | |
| Intangible assets under US GAAP are analysed as follows: | | | | | | | |
| | | 2004 | | 2003 | | | |
| | | £m | | £m | | | |
|
|
|
|
| | | |
| | | | | | | | |
| Acquired products | | 10,589 | | 12,054 | | | |
| Licences, patents etc. | | 371 | | 126 | | | |
| Brands | | 5,037 | | 5,169 | | | |
| Pensions | | 102 | | 128 | | | |
|
|
|
|
| | | |
| Intangible assets under US GAAP | | 16,099 | | 17,477 | | | |
|
|
|
|
| | | |
| | | | | | | | |
| The following tables present details of the Group’s intangible assets, differentiating between those subject to amortisation and those which are not subject to amortisation: |
| | | | | | | | |
| | | 2004 | | 2003 | | | |
| | | £m | | £m | | | |
|
|
|
|
| | | |
| | | | | | | | |
| Intangible assets subject to amortisation | | 11,922 | | 13,234 | | | |
| Intangible assets not subject to amortisation | | 4,177 | | 4,243 | | | |
|
|
|
|
| | | |
| Intangible assets under US GAAP | | 16,099 | | 17,477 | | | |
|
|
|
|
| | | |
Back to Contents
| Notes to the financial statements GlaxoSmithKline | 145 |
37 Reconciliation to US accounting principles continued
The following intangible assets are subject to amortisation:
| | | 2004 | | 2003 | |
| | | Product | | Product | |
| | | rights | | rights | |
| | | £m | | £m | |
|
|
|
|
| |
| Cost | 21,555 | | 21,329 | |
| Accumulated amortisation | (6,872 | ) | (5,360 | ) |
| Impairment | (2,761 | ) | (2,735 | ) |
|
|
|
| |
| Net | | 11,922 | | 13,234 | |
|
|
|
|
| |
The carrying values of certain product rights were reviewed and an impairment of £26 million has been recorded. In 2003, impairments of £658 million were recorded, of which £633 million related to Paxil which was impaired following the launch in the USA of a generic Paxil product. Fair values are determined using a discounted cash flow model.
As discussed in Note 30 ‘Legal proceedings’, a number of distributors of generic drugs have filed applications to market generic versions of a number of the Group’s products prior to the expiration of the Group’s patents. If generic versions of products are launched in future periods at earlier dates than the Group currently expects, impairments of the carrying value of the products may arise.
The estimated future amortisation expense for the next five years for intangible assets subject to amortisation as of 31st December 2004 is as follows:
| Year | | £m | |
|
|
| |
| 2005 | | 1,528 | |
| 2006 | | 1,487 | |
| 2007 | | 1,473 | |
| 2008 | | 1,472 | |
| 2009 | | 756 | |
|
|
| |
| Total | | 6,716 | |
|
|
| |
Intangible assets which are not subject to amortisation include a pension asset of £102 million at 31st December 2004 (£128 million at 31st December 2003) and certain product rights. The intangible assets relating to product rights are analysed as follows:
| | 2004 | | 2003 | |
| | £m | | £m | |
|
|
|
| |
| Cost | 4,652 | | 4,693 | |
| Impairment | (577 | ) | (578 | ) |
|
|
|
| |
| Net | 4,075 | | 4,115 | |
|
|
|
| |
An impairment charge of £nil was recognised during 2004 (2003 – £108 million).
(c) Theravance
In May 2004, the Group formed a strategic alliance with Theravance Inc. to develop and commercialise novel medicines across a variety of important therapeutic areas. Under the terms of the alliance, Theravance received $129 million, a significant part of which related to the Group’s purchase of Theravance shares. The Group has a call option in 2007 to further increase its ownership to over 50 per cent at a significant premium to the price paid in the 2004 transaction. Theravance’s shareholders have a put option at a lower exercise price to cause GlaxoSmithKline to acquire up to half of their outstanding stock in 2007. Given the maximum number of shares subject to the put option, the Group’s obligation is capped at $525 million. The Group has an exclusive option to license potential new medicines from all of Theravance’s programmes until August 2007. Upon exercising its option over a Theravance programme, the Group will be responsible for the relevant development, manufacturing and commercialisation activities. Depending on the success of such programmes, Theravance will receive clinical, regulatory and commercial milestone payments and royalties on the subsequent sales of medicines. Based on the assessment performed, the Group is the primary beneficiary of Theravance, as defined by FIN 46R, and as a result Theravance has been consolidated into the Group’s US GAAP financial statements from May 2004. The net assets acquired were measured at fair value. The principal adjustment to the carrying value of the net assets in Theravance’s balance sheet prior to the acquisition was recognition of in-process research and development (IPR&D) at a valuation of £273 million. The IPR&D was written-off immediately after the acquisition in accordance with US GAAP purchase accounting. The effect of consolidating Theravance has been to decrease shareholders’ equity and net income by £60 million.
Additionally, the Group has accounted for the Theravance put option discussed above in accordance with SFAS 150, ‘Accounting for Certain Financial Instruments with Characteristics of both Liabilities and Equity’, which requires the Group to record the fair value of the put option as a liability. The fair value of the Theravance put option at 31st December 2004 is £69 million; as at the initial consolidation of Theravance, the value of the put option was £86 million. In accordance with SFAS 133, ‘Accounting for Derivative Instruments and Hedging Activities’ the call option is not recognised in the financial statements as it is not readily convertible into cash.
Back to Contents
| 146 | GlaxoSmithKline Notes to the financial statements |
37 Reconciliation to US accounting principles continued
(d) Taxation
| | | | 2003 | | 2002 | |
| | 2004 | | (restated) | | (restated) | |
| Total tax expense | £m | | £m | | £m | |
|
|
|
|
|
| |
| UK GAAP: | | | | | | |
| Current tax expense | 1,707 | | 2,001 | | 1,432 | |
| Deferred tax (credit)/expense | (6 | ) | (272 | ) | 32 | |
|
|
|
|
|
| |
| Total tax expense | 1,701 | | 1,729 | | 1,464 | |
|
|
|
|
|
| |
| US GAAP: | | | | | | |
| Current tax expense | 1,717 | | 2,014 | | 1,445 | |
| Deferred tax credit | (667 | ) | (1,059 | ) | (1,146 | ) |
|
|
|
|
|
| |
| Total tax expense | 1,050 | | 955 | | 299 | |
| Cumulative effect of changes in accounting principles | – | | – | | (34 | ) |
|
|
|
|
|
| |
| Total tax expense | 1,050 | | 955 | | 265 | |
|
|
|
|
|
| |
| UK to US GAAP adjustments: | | | | | | |
| Current tax expense | 10 | | 13 | | 13 | |
| Deferred tax credit | (661 | ) | (787 | ) | (1,178 | ) |
|
|
|
|
|
| |
| Total tax expense | (651 | ) | (774 | ) | (1,165 | ) |
| Cumulative effect of changes in accounting principles | – | | – | | (34 | ) |
|
|
|
|
|
| |
| Total tax expense | (651 | ) | (774 | ) | (1,199 | ) |
|
|
|
|
|
| |
| | | | | | | |
| (e) Deferred taxation under US GAAP | | | | | | |
| | | | | | | |
| Classification of GlaxoSmithKline’s deferred taxation liabilities and assets under US GAAP is as follows: | | | | | | |
| | | | 2003 | | | |
| | 2004 | | (restated) | | | |
| | £m | | £m | | | |
|
|
|
|
|
| |
| Liabilities | | | | | | |
| Stock valuation adjustment | (51 | ) | (52 | ) | | |
|
|
|
|
|
| |
| Current deferred taxation liabilities | (51 | ) | (52 | ) | | |
|
|
|
|
|
| |
| Accelerated capital allowances | (664 | ) | (689 | ) | | |
| Product rights | (4,454 | ) | (4,917 | ) | | |
| Other timing differences | 66 | | (229 | ) | | |
|
|
|
|
|
| |
| Total deferred taxation liabilities | (5,103 | ) | (5,887 | ) | | |
|
|
|
|
|
| |
| Assets | | | | | | |
| Intra-Group profit | 594 | | 485 | | | |
| Other timing differences | 675 | | 607 | | | |
|
|
|
|
|
| |
| Current deferred taxation assets | 1,269 | | 1,092 | | | |
|
|
|
|
|
| |
| Asset disposal | (31 | ) | (59 | ) | | |
| Pensions and other post-retirement benefits | 57 | | 86 | | | |
| Tax losses | 20 | | 94 | | | |
| Manufacturing restructuring | 66 | | 132 | | | |
| Legal and other disputes | 157 | | 167 | | | |
| Other timing differences | 188 | | 127 | | | |
|
|
|
|
|
| |
| Total deferred taxation assets | 1,726 | | 1,639 | | | |
|
|
|
|
|
| |
| Net deferred taxation under US GAAP | (3,377 | ) | (4,248 | ) | | |
| Net deferred taxation under UK GAAP | 827 | | 823 | | | |
|
|
|
|
|
| |
| UK to US GAAP adjustment | (4,204 | ) | (5,071 | ) | | |
|
|
|
|
|
| |
Back to Contents
| Notes to the financial statements GlaxoSmithKline | 147 |
37 Reconciliation to US accounting principles continued
(f) Pensions and post-retirement costs under US GAAP
| | 2004 | | 2003 | | 2002 | |
| | £m | | £m | | £m | |
|
|
|
|
|
| |
| UK pension schemes | 225 | | 278 | | 103 | |
| US pension schemes | 54 | | 79 | | 67 | |
| Other overseas pension schemes | 77 | | 83 | | 51 | |
| Unfunded post-retirement healthcare schemes | 96 | | 118 | | 78 | |
| Post-employment costs | 18 | | 24 | | 40 | |
|
|
|
|
|
| |
| | 470 | | 582 | | 339 | |
|
|
|
|
|
| |
| Analysed as: | | | | | | |
| Funded defined benefit/hybrid schemes | 298 | | 389 | | 149 | |
| Unfunded defined benefit schemes | 37 | | 26 | | 48 | |
| Defined contribution schemes | 21 | | 25 | | 24 | |
| Unfunded post-retirement healthcare schemes | 96 | | 118 | | 78 | |
| Post-employment costs | 18 | | 24 | | 40 | |
|
|
|
|
|
| |
| | 470 | | 582 | | 339 | |
|
|
|
|
|
| |
The disclosures below include the additional information required by SFAS 132R. The pension costs of the UK, US and major overseas defined benefit pension plans have been restated in the following tables in accordance with US GAAP. Pension costs in 2004 of £5 million (2003 – £9 million; 2002 – £12 million), in respect of minor retirement plans, which have not been recalculated in accordance with the requirements of SFAS 87, have been excluded.
| | 2004 | | 2003 | | 2002 | |
| Net periodic pension cost for the major retirement plans | £m | | £m | | £m | |
|
|
|
|
|
| |
| Service cost | 213 | | 211 | | 219 | |
| Interest cost | 400 | | 392 | | 388 | |
| Expected return on plan assets | (431 | ) | (408 | ) | (470 | ) |
| Amortisation of prior service cost | 14 | | 17 | | 20 | |
| Amortisation of transition obligation | 2 | | 3 | | (6 | ) |
| Amortisation of net actuarial loss | 115 | | 79 | | 3 | |
|
|
|
|
|
| |
| Net periodic pension cost under US GAAP | 313 | | 294 | | 154 | |
|
|
|
|
|
| |
| Termination benefits and curtailment costs | 13 | | 112 | | 56 | |
| Adjustment for change in accounting principle | – | | – | | (62 | ) |
|
|
|
|
|
| |
| | | | | | | |
| During 2002, the Group decided to align the measurement date for all of its pension plans. As certain of the Group’s pension plans had a measurement date for pension assets and liabilities of 30th September, the Group elected to change the measurement date for these plans from 30th September to 31st December. |
| | | | | | | |
| | 2004 | | 2003 | | 2002 | |
| Major assumptions used in computing pension costs | %pa | | %pa | | %pa | |
|
|
|
|
|
| |
| Rates of future pay increases | 4.25 | | 4.25 | | 4.25 | |
| Discount rate | 5.25 | | 5.50 | | 6.00 | |
| Expected long-term rates of return on plan assets | 7.00 | | 7.50 | | 7.75 | |
|
|
|
|
|
| |
| | | | | | | |
| In aggregate, average international plan assumptions did not vary significantly from US assumptions. | | | | | | |
| | | | | | | |
| Estimated future benefit payments | | | | | £m | |
|
|
|
|
|
| |
| 2005 | | | | | 297 | |
| 2006 | | | | | 306 | |
| 2007 | | | | | 317 | |
| 2008 | | | | | 330 | |
| 2009 | | | | | 346 | |
| 2010–2014 | | | | | 2,011 | |
|
|
|
|
|
| |
Back to Contents
| 148 | GlaxoSmithKline Notes to the financial statements |
37 Reconciliation to US accounting principles continued
| | | 2004 | | 2003 | |
| Change in benefit obligation | | £m | | £m | |
|
|
|
|
| |
| Benefit obligation at beginning of year | | 7,866 | | 6,760 | |
| Amendments | | 2 | | (20 | ) |
| Service cost | | 213 | | 211 | |
| Interest cost | | 400 | | 392 | |
| Plan participants’ contributions | | 15 | | 16 | |
| Actuarial loss | | 137 | | 899 | |
| Benefits paid | | (345 | ) | (328 | ) |
| Termination benefits and curtailment costs | | 5 | | 92 | |
| Exchange | | (122 | ) | (156 | ) |
|
|
|
|
| |
| Benefit obligation at end of year | | 8,171 | | 7,866 | |
|
|
|
|
| |
| Benefit obligation at end of year for pension plans with accumulated benefit obligations in excess of plan assets | | 5,554 | | 6,960 | |
|
|
|
|
| |
| | | | | | |
| The accumulated benefit obligation at 31st December 2004 was £7,691 million (31st December 2003 – £7,391 million). | | | | |
| | | | | | |
| | | 2004 | | 2003 | |
| Change in plan assets | | £m | | £m | |
|
|
|
|
| |
| Fair value of plan assets at beginning of year | | 5,968 | | 4,855 | |
| Actual return on plan assets | | 651 | | 979 | |
| Employer contributions | | 465 | | 596 | |
| Plan participants’ contributions | | 15 | | 16 | |
| Benefits paid | | (345 | ) | (328 | ) |
| Exchange | | (64 | ) | (150 | ) |
|
|
|
|
| |
| Fair value of plan assets at end of year | | 6,690 | | 5,968 | |
|
|
|
|
| |
| Fair value of plan assets at end of year for pension plans with accumulated benefit obligations in excess of plan assets | | 4,519 | | 5,525 | |
|
|
|
|
| |
| | | | | | |
| Plan assets consist primarily of investments in UK and overseas equities, fixed interest securities, securities linked to the UK Retail Prices Index and property. At 31st December 2004 UK equities included 0.3 million GlaxoSmithKline shares (2003 – 0.5 million shares) with a market value of £4 million (2003 – £7 million). | |
| | | | | | |
| Normal employer contributions are expected to be approximately £360 million in 2005. | | | | | |
| | | | | | |
| | | 2004 | | 2003 | |
| Funded status | | £m | | £m | |
|
|
|
|
| |
| Funded status | | (1,481 | ) | (1,898 | ) |
| Unrecognised net actuarial loss | | 1,900 | | 2,123 | |
| Unrecognised prior service cost | | 75 | | 96 | |
| Unrecognised transition obligation | | 24 | | 26 | |
|
|
|
|
| |
| Net amount recognised | | 518 | | 347 | |
|
|
|
|
| |
| | | | | | |
| | | 2004 | | 2003 | |
| Amounts recognised in the statement of financial position | | £m | | £m | |
|
|
|
|
| |
| Prepaid benefit cost | | 365 | | 18 | |
| Accrued pension liability | | (1,065 | ) | (1,471 | ) |
| Intangible asset | | 102 | | 128 | |
| Accumulated other comprehensive income | | 1,116 | | 1,672 | |
|
|
|
|
| |
| Net amount recognised | | 518 | | 347 | |
|
|
|
|
| |
Back to Contents
| Notes to the financial statements GlaxoSmithKline | 149 |
37 Reconciliation to US accounting principles continued
Post-retirement healthcare under US GAAP
The post-retirement healthcare costs of the UK, US and major overseas post-retirement healthcare schemes have been restated in the following tables in accordance with US GAAP. Costs in 2004 of £nil (2003 – £13 million, 2002 – £nil), which have not been recalculated, have been excluded.
| | 2004 | | 2003 | | 2002 | |
| Net healthcare cost | £m | | £m | | £m | |
|
|
|
|
|
| |
| Service cost | 32 | | 29 | | 23 | |
| Interest cost | 55 | | 64 | | 53 | |
| Amortisation of prior service cost | (1 | ) | (2 | ) | (1 | ) |
| Amortisation of net actuarial loss | 11 | | 14 | | 3 | |
|
|
|
|
|
| |
| Net healthcare cost | 97 | | 105 | | 78 | |
|
|
|
|
|
| |
| | | | | | | |
| The major assumptions used in calculating the net healthcare cost were: | %pa | | %pa | | %pa | |
|
|
|
|
|
| |
| Rate of future healthcare inflation | 9.0 to 5.0 | | 10.0 to 5.0 | | 11.0 to 5.0 | |
| Discount rate | 5.75 | | 6.25 | | 6.75 | |
|
|
|
|
|
| |
| | | | | | | |
| The rate of future healthcare inflation reflects the fact that the benefits of certain groups of participants are capped. | | | |
| | | | | | | |
| | 2004 | | 2003 | | | |
| Change in benefit obligation | £m | | £m | | | |
|
|
|
| | | |
| Benefit obligation at beginning of year | 975 | | 830 | | | |
| Amendments | – | | (3 | ) | | |
| Service cost | 32 | | 29 | | | |
| Interest cost | 55 | | 64 | | | |
| Plan participants’ contributions | 8 | | 8 | | | |
| Actuarial loss | 6 | | 192 | | | |
| Benefits paid | (47 | ) | (49 | ) | | |
| Exchange | (64 | ) | (96 | ) | | |
|
|
|
| | | |
| Benefit obligation at end of year | 965 | | 975 | | | |
|
|
|
| | | |
| | | | | | | |
| | | | | | | |
| Change in plan assets | | | | | | |
|
|
|
| | | |
| Fair value of plan assets at beginning of year | – | | – | | | |
| Employer and plan participants’ contributions | 47 | | 49 | | | |
| Benefits paid | (47 | ) | (49 | ) | | |
|
|
|
| | | |
| Fair value of plan assets at end of year | – | | – | | | |
|
|
|
| | | |
| | | | | | | |
| Funded status | | | | | | |
|
|
|
| | | |
| Funded status | (965 | ) | (975 | ) | | |
| Unrecognised net actuarial loss | 340 | | 371 | | | |
| Unrecognised prior service cost | (14 | ) | (17 | ) | | |
|
|
|
| | | |
| Accrued post-retirement healthcare cost | (639 | ) | (621 | ) | | |
|
|
|
| | | |
| | | | | | | |
| | 1% decrease | | 1% increase | | | |
| Impact of a one per cent variation in the rate of future healthcare inflation | £m | | £m | | | |
|
|
|
| | | |
| Effect on total service and interest cost | (7 | ) | 8 | | | |
| Effect on provision for post-retirement benefits | (75 | ) | 82 | | | |
|
|
|
| | | |
Back to Contents
| 150 | GlaxoSmithKline Notes to the financial statements |
38 Principal Group companies
The following represent the principal subsidiary and associated undertakings of the GlaxoSmithKline Group at 31st December 2004. Details are given of the principal country of operation, the location of the headquarters, the business segment and the business activities. The equity share capital of these undertakings is wholly owned by the Group except where its percentage interest is shown otherwise. All companies are incorporated in their principal country of operation except where stated.
Europe | Location | Subsidiary undertaking | Segment | Activity | % |
|
| England | Brentford | +GlaxoSmithKline Holdings (One) Limited | Ph,CH | h | |
| | Brentford | +GlaxoSmithKline Services Unlimited | Ph,CH | s | |
| | Brentford | +GlaxoSmithKline Finance plc | Ph,CH | f | |
| | | | | | |
| | Brentford | GlaxosmithKline Capital plc | Ph | f | |
| | Brentford | SmithKline Beecham p.l.c. | Ph,CH | d e h m p r | |
| | Brentford | Wellcome Limited | Ph,CH | h | |
| | Greenford | Glaxo Group Limited | Ph | h | |
| | Greenford | Glaxo Operations UK Limited | Ph | p | |
| | Brentford | Glaxo Wellcome International B.V. (Footnote (i)) | Ph,CH | h | |
| | Brentford | Glaxo Wellcome Investments B.V. (Footnote (i)) | Ph,CH | h | |
| | Stockley Park | Glaxo Wellcome UK Limited | Ph | h m p | |
| | Brentford | GlaxoSmithKline Export Limited | Ph | e | |
| | Brentford | GlaxoSmithKline Research & Development Limited | Ph | d r | |
| | Brentford | GlaxoSmithKline UK Limited | Ph | m p | |
| | Brentford | SmithKline Beecham (Investments) Limited | Ph,CH | f | |
| | Brentford | SmithKline Beecham (SWG) Limited | CH | e m | |
| | Brentford | SmithKline Beecham Research Limited | Ph | m | |
| | Brentford | Stafford-Miller Limited | CH | m p | |
| | Greenford | The Wellcome Foundation Limited | Ph | p | |
| | Brentford | Setfirst (No. 2) Limited | Ph,CH | f h | |
| | | (formerly GlaxoSmithKline Luxembourg S.A.) (Footnote (ii)) | | | |
|
|
|
|
|
|
| Austria | Vienna | GlaxoSmithKline Pharma G.m.b.H | Ph | m | |
|
|
|
|
|
|
| Belgium | Genval | GlaxoSmithKline S.A. | Ph | m | |
| | Rixensart | GlaxoSmithKline Biologicals S.A. | Ph | d e m p r | |
| | Rixensart | GlaxoSmithKline Biologicals Manufacturing S.A. | Ph | h | |
|
|
|
|
|
|
| Guernsey | St. Peter Port | SmithKline Beecham Limited | Ph,CH | i | |
|
|
|
|
|
|
| Denmark | Ballerup | GlaxoSmithKline Consumer Healthcare A/S | CH | m | |
| | Brøndby | GlaxoSmithKline Pharma A/S | Ph | m | |
|
|
|
|
|
|
| Finland | Espoo | GlaxoSmithKline Oy | Ph | m | |
|
|
|
|
|
|
| France | Marly le Roi | Groupe GlaxoSmithKline S.A.S | Ph | h | |
| | Marly le Roi | Laboratoire GlaxoSmithKline S.A.S | Ph | m | |
| | Marly le Roi | Glaxo Wellcome Production S.A.S | Ph | m p | |
| | Marly le Roi | GlaxoSmithKline Sante Grand Public S.A.S. | CH | m | |
|
|
|
|
|
|
| Germany | Buehl | GlaxoSmithKline Consumer Healthcare GmbH & Co KG | CH | d h m p r s | |
| | Buehl | GlaxoSmithKline Healthcare GmbH | CH | h | |
|
|
|
|
|
|
| Greece | Athens | GlaxoSmithKline A.E.B.E | Ph,CH | h m | |
|
|
|
|
|
|
| Hungary | Budapest | GlaxoSmithKline Kft | Ph,CH | e m | |
|
|
|
|
|
|
| Italy | Verona | GlaxoSmithKline S.p.A. | Ph | d h m r | |
| | Milan | GlaxoSmithKline Consumer Healthcare S.p A. | CH | h m | |
|
|
|
|
|
|
| Luxembourg | Mamer | GlaxoSmithKline International (Luxembourg) S.A. | Ph,CH | f h | |
|
Back to Contents
Notes to the financial statements GlaxoSmithKline | 151 |
38 Principal Group companies continued
| Europe | Location | Subsidiary undertaking | Segment | Activity | % |
|
|
|
|
|
|
| Netherlands | Zeist | GlaxoSmithKline B.V. | Ph | m | |
| | Zeist | GlaxoSmithKline Consumer Healthcare B.V. | CH | m | |
|
|
|
|
|
|
| Norway | Oslo | GlaxoSmithKline AS | Ph | m | |
|
|
|
|
|
|
| Poland | Poznan | GlaxoSmithKline Pharmaceuticals S.A. | Ph | m p | 97 |
| | Warsaw | GlaxoSmithKline Consumer Healthcare Sp.zo.o. | CH | m e | |
|
|
|
|
|
|
| Portugal | Lisbon | GlaxoSmithKline-Produtos Farmaceuticos Lda | Ph | m | |
|
|
|
|
|
|
| Republic of | Dublin | GlaxoSmithKline Consumer Healthcare (Ireland) Limited (Footnote (iii)) | CH | m | |
| Ireland | Carrigaline | SmithKline Beecham (Cork) Limited (Footnote (iii)) | Ph | p | |
| | Carrigaline | SmithKline Beecham (Manufacturing) Limited (Footnote (iii)) | Ph | p | |
|
|
|
|
|
|
| Spain | Tres Cantos | GlaxoSmithKline, S.A. | Ph | m | |
| | Aranda de Duero | GlaxoSmithKline, S.A. | Ph | p | |
| | Alcala de Henares | SmithKline Beecham S.A. | Ph | p | |
|
|
|
|
|
|
| Sweden | Mölndal | GlaxoSmithKline AB | Ph | m | |
|
|
|
|
|
|
| Switzerland | Muenchenbuchsee | GlaxoSmithKline Investments (Switzerland) GmbH | Ph,CH | h | |
| | Muenchenbuchsee | GlaxoSmithKline AG | Ph | m | |
| | Zug | Adechsa GmbH | Ph | e | |
|
|
|
|
|
|
| | | | | | |
| USA | | | | | |
|
|
|
|
|
|
| USA | Philadelphia | SmithKline Beecham Corporation | Ph,CH | d e h m p r s | |
| | Pittsburgh | GlaxoSmithKline Consumer Healthcare, L.P. | CH | m p | 88 |
| | Pittsburgh | Block Drug Company, Inc | CH | h m p | |
| | Wilmington | GlaxoSmithKline Financial Inc | Ph | f | |
| | Wilmington | GlaxoSmithKline Holdings (Americas) Inc | Ph,CH | h | |
|
|
|
|
|
|
| | | | | | |
| Americas | | | | | |
|
|
|
|
|
|
| Bermuda | Hamilton | GlaxoSmithKline Insurance Ltd | Ph,CH | i | |
|
|
|
|
|
|
| Canada | Mississauga | GlaxoSmithKline Inc | Ph,CH | m p r | |
|
|
|
|
|
|
| | | | | | |
| Asia Pacific | | | | | |
|
|
|
|
|
|
| Australia | Boronia | Glaxo Wellcome Australia Pty Ltd | Ph,CH | d e m p r | |
|
|
|
|
|
|
| China | Hong Kong | GlaxoSmithKline Limited | Ph,CH | m | |
| | Tianjin | Sino-American Tianjin Smith Kline & French Laboratories Ltd | Ph | d m p r | 55 |
|
|
|
|
|
|
| India | Mumbai | GlaxoSmithKline Pharmaceuticals Limited | Ph | m p | 59 |
| | Nabha | GlaxoSmithKline Consumer Healthcare Limited (Footnote (iv)) | CH | m p | 40 |
|
|
|
|
|
|
| Malaysia | Petaling Jaya | | | | |
| | Selangor | GlaxoSmithKline Pharmaceutical Sdn Bhd | Ph | m | |
| | Darul Ehsan | | | | |
|
|
|
|
|
|
| New Zealand | Auckland | GlaxoSmithKline NZ Limited | Ph,CH | m | |
|
|
|
|
|
|
| Pakistan | Karachi | GlaxoSmithKline Pakistan Limited | Ph,CH | m p e | 79 |
|
|
|
|
|
|
| Philippines | Makati | GlaxoSmithKline Philippines Inc. | Ph,CH | m | |
|
|
|
|
|
|
| Singapore | Singapore | Glaxo Wellcome Manufacturing Pte Ltd | Ph | p | |
| | Singapore | GlaxoSmithKline Pte Ltd | Ph | m | |
|
|
|
|
|
|
| South Korea | Seoul | GlaxoSmithKline Korea | Ph | m p | |
|
|
|
|
|
|
| Taiwan | Taipei | Glaxo Wellcome Taiwan Limited | Ph | m p | |
|
|
|
|
|
|
Back to Contents
| 152 | GlaxoSmithKline Notes to the financial statements |
38 Principal Group companies continued
| | | | | | |
| | | | | | |
Japan | Location | Subsidiary undertaking | Segment | Activity | % |
|
|
|
|
|
|
| Japan | Tokyo | GlaxoSmithKline K.K. | Ph,CH | d m p r | 85 |
|
|
|
|
|
|
| | | | | |
Latin America | | | | |
|
|
|
|
|
|
| Argentina | Buenos Aires | GlaxoSmithKline Argentina S.A. | Ph,CH | m p | |
|
|
|
|
|
|
| Brazil | Rio de Janeiro | GlaxoSmithKline Brasil Ltda | Ph,CH | m p | |
|
|
|
|
|
|
| Colombia | Bogota | GlaxoSmithKline Colombia S.A. | Ph,CH | m | |
|
|
|
|
|
|
| Mexico | Mexico City | GlaxoSmithKline Mexico, S.A. de C.V. | Ph,CH | e m p s | |
|
|
|
|
|
|
| Puerto Rico | Guaynabo | GlaxoSmithKline Puerto Rico Inc. | Ph | m | |
| | San Juan | SB Pharmco Puerto Rico Inc. | Ph | p | |
|
|
|
|
|
|
| Venezuela | Caracas | GlaxoSmithKline Venezuela C.A. | Ph,CH | m | |
|
|
|
|
|
|
| | | | | |
| Middle East& | | | | |
| Africa | | | | | |
|
|
|
|
|
|
| Egypt | Cairo | GlaxoSmithKline S.A.E | Ph | m p | 90 |
|
|
|
|
|
|
| South Africa | Bryanston | GlaxoSmithKline South Africa (Pty) Ltd | Ph,CH | m p | |
|
|
|
|
|
|
| Turkey | Istanbul | GlaxoSmithKline Ilaclari Sanayi ve Ticaret A.S. | Ph | m p | |
|
|
|
|
|
|
| | | | | | |
USA | Location | Associated undertaking | Business | | % |
|
|
|
|
|
|
| USA | Teterboro | Quest Diagnostics Incorporated (Footnote (v)). | Clinical testing | | 19 |
|
|
|
|
|
|
| | | | | | |
| | | | | | |
| Footnotes | | | | | |
| (i) | Incorporated in the Netherlands |
| | |
| (ii) | Originally incorporated in Luxembourg, now registered in Guernsey. |
| | |
| (iii) | Exempt from the provisions of Section 7 of the Companies (Amendment) Act 1986 (Ireland) |
| | |
| (iv) | Consolidated as a subsidiary undertaking in accordance with Section 258 (4)(a) of the Companies Act on the grounds of dominant influence |
| | |
| (v) | Equity accounted on the grounds of significant influence |
| | |
| + | Directly held wholly owned subsidiary of GlaxoSmithKline plc |
| |
| Business segment: | Ph Pharmaceuticals, CH Consumer Healthcare |
| Business activity: | d development, e exporting, f finance, h holding company, i insurance, m marketing, p production, r research, s service |
Full details of all Group subsidiary and associated undertakings will be attached to the company’s Annual Return to be filed with the Registrar of Companies.
Back to Contents
| | Investor information |
| | |
| | This section includes the financial record presenting historical information prepared under UK GAAP. In addition, historical information restated in accordance with International Financial Reporting Standards is presented. This section also discusses shareholder return – the return to shareholders in the form of dividends and share price movements – and provides other information for shareholders. |
| | |
| | Financial record |
| | Information prepared under UK GAAP |
154 | Quarterly trend |
160 | Five year record |
| | |
| | Financial information under International Financial |
| | Reporting Standards (IFRS) |
163 | Background |
164 | IFRS accounting policies |
167 | IFRS adjustments |
169 | IFRS pharmaceutical turnover - total Group |
170 | IFRS Consolidated income statement |
172 | IFRS Consolidated balance sheet |
172 | IFRS Consolidated statement of recognised income and expense |
173 | IFRS Consolidated cash flow statement |
| | |
174 | Shareholder return |
175 | Shareholder information |
176 | Share capital |
178 | Taxation information for shareholders |
Back to Contents
Financial record
Quarterly trend
An unaudited analysis is provided by quarter of the Group results in sterling for the financial year 2004. The analysis comprises statutory results, business performance results and pharmaceutical sales by therapeutic area.
| Profit and loss account – statutory | 12 months 2004 | | Q4 2004 | |
| |
| |
| |
| | £m | | CER % | | £% | | £m | | CER % | | £% | |
|
|
|
|
|
|
|
|
|
|
|
| |
| | | | | | | | | | | | | |
| Turnover – Pharmaceuticals | 17,146 | | 1 | | (6 | ) | 4,487 | | 3 | | (1 | ) |
| – Consumer Healthcare | 3,213 | | 3 | | (1 | ) | 846 | | 1 | | (2 | ) |
|
|
|
|
|
|
|
|
|
|
|
| |
| Total turnover | 20,359 | | 1 | | (5 | ) | 5,333 | | 3 | | (1 | ) |
| Cost of sales | (4,309 | ) | (1 | ) | (5 | ) | (1,158 | ) | (4 | ) | (7 | ) |
| Selling, general and administrative expenditure | (7,061 | ) | (2 | ) | (7 | ) | (2,047 | ) | 4 | | 2 | |
| Research and development expenditure | (2,839 | ) | 7 | | 2 | | (846 | ) | 7 | | 3 | |
|
|
|
|
|
|
|
|
|
|
|
| |
| Operating costs | (14,209 | ) | | | | | (4,051 | ) | | | | |
|
|
|
|
|
|
|
|
|
|
|
| |
| Trading profit – Pharmaceuticals | 5,530 | | | | | | 1,110 | | | | | |
| – Consumer Healthcare | 620 | | | | | | 172 | | | | | |
|
|
|
|
|
|
|
|
|
|
|
| |
| Total trading profit | 6,150 | | 5 | | (6 | ) | 1,282 | | 5 | | (2 | ) |
| Other operating income/(expense) | (60 | ) | | | | | 40 | | | | | |
|
|
|
|
|
|
|
|
|
|
|
| |
| Operating profit | 6,090 | | 6 | | (4 | ) | 1,322 | | 24 | | 16 | |
|
|
|
|
|
|
|
|
|
|
|
| |
| Share of profits/(losses) of joint ventures and associated undertakings | 95 | | | | | | 23 | | | | | |
| Business disposals | (1 | ) | | | | | (1 | ) | | | | |
| Profit on disposal of interests in associates | 138 | | | | | | 97 | | | | | |
|
|
|
|
|
|
|
|
|
|
|
| |
| Profit before interest | 6,322 | | | | | | 1,441 | | | | | |
| Net interest payable | (203 | ) | | | | | (51 | ) | | | | |
|
|
|
|
|
|
|
|
|
|
|
| |
| Profit on ordinary activities before taxation | 6,119 | | 8 | | (3 | ) | 1,390 | | 34 | | 24 | |
| Taxation | (1,701 | ) | | | | | (401 | ) | | | | |
|
|
|
|
|
|
|
|
|
|
|
| |
| Profit on ordinary activities after taxation | 4,418 | | 7 | | (4 | ) | 989 | | 30 | | 21 | |
| Equity minority interests | (114 | ) | | | | | (28 | ) | | | | |
| Preference share dividends | (2 | ) | | | | | – | | | | | |
|
|
|
|
|
|
|
|
|
|
|
| |
| Earnings (Profit attributable to shareholders) | 4,302 | | 7 | | (4 | ) | 961 | | 30 | | 21 | |
|
|
|
|
|
|
|
|
|
|
|
| |
| Basic earnings per share | 75.0 | p | 8 | | (3 | ) | 16.8 | p | 31 | | 22 | |
|
|
|
|
|
|
|
|
|
|
|
| |
| | | | | | | | | | | | | |
| Profit and loss account – business performance | | | | | | | | | | | | |
|
|
|
|
|
|
|
|
|
|
|
| |
| Turnover – Pharmaceuticals | 17,146 | | 1 | | (6 | ) | 4,487 | | 3 | | (1 | ) |
| – Consumer Healthcare | 3,213 | | 3 | | (1 | ) | 846 | | 1 | | (2 | ) |
|
|
|
|
|
|
|
|
|
|
|
| |
| Total turnover | 20,359 | | 1 | | (5 | ) | 5,333 | | 3 | | (1 | ) |
| Cost of sales | (4,309 | ) | 7 | | 3 | | (1,158 | ) | 7 | | 4 | |
| Selling, general and administrative expenditure | (7,061 | ) | (2 | ) | (7 | ) | (2,047 | ) | 6 | | 4 | |
| Research and development expenditure | (2,839 | ) | 8 | | 2 | | (846 | ) | 8 | | 4 | |
|
|
|
|
|
|
|
|
|
|
|
| |
| Operating costs | (14,209 | ) | | | | | (4,051 | ) | | | | |
|
|
|
|
|
|
|
|
|
|
|
| |
| Trading profit – Pharmaceuticals | 5,530 | | | | | | 1,110 | | | | | |
| – Consumer Healthcare | 620 | | | | | | 172 | | | | | |
|
|
|
|
|
|
|
|
|
|
|
| |
| Total trading profit | 6,150 | | (1 | ) | (11 | ) | 1,282 | | (7 | ) | (13 | ) |
| Other operating income/(expense) | (60 | ) | | | | | 40 | | | | | |
|
|
|
|
|
|
|
|
|
|
|
| |
| Operating profit | 6,090 | | – | | (10 | ) | 1,322 | | 8 | | 1 | |
|
|
|
|
|
|
|
|
|
|
|
| |
| Share of profits/(losses) of joint ventures and associated undertakings | 95 | | | | | | 23 | | | | | |
| Business disposals | (1 | ) | | | | | (1 | ) | | | | |
| Profit on disposal of interest in associates | 138 | | | | | | 97 | | | | | |
|
|
|
|
|
|
|
|
|
|
|
| |
| Profit before interest | 6,322 | | | | | | 1,441 | | | | | |
| Net interest payable | (203 | ) | | | | | (51 | ) | | | | |
|
|
|
|
|
|
|
|
|
|
|
| |
| Profit on ordinary activities before taxation | 6,119 | | 2 | | (9 | ) | 1,390 | | 17 | | 8 | |
| Taxation | (1,701 | ) | | | | | (401 | ) | | | | |
|
|
|
|
|
|
|
|
|
|
|
| |
| Profit on ordinary activities after taxation | 4,418 | | 1 | | (9 | ) | 989 | | 14 | | 6 | |
| Equity minority interests | (114 | ) | | | | | (28 | ) | | | | |
| Preference share dividends | (2 | ) | | | | | – | | | | | |
|
|
|
|
|
|
|
|
|
|
|
| |
| Adjusted earnings (Profit attributable to shareholders) | 4,302 | | 1 | | (10 | ) | 961 | | 14 | | 6 | |
|
|
|
|
|
|
|
|
|
|
|
| |
| Adjusted earnings per share | 75.0 | p | | | | | 16.8 | p | | | | |
|
|
|
|
|
|
|
|
|
|
|
| |
Back to Contents
| Financial record GlaxoSmithKline | 155 |
| | 9 months 2004 | | | | Q3 2004 | | | | 6 months 2004 | | | | Q2 2004 | | | | Q1 2004 | |
| |
|
|
|
|
| |
|
|
|
|
| |
|
|
|
|
| |
|
|
|
|
| |
|
|
|
|
| |
| | £m | | CER % | | £% | | £m | | CER % | | £% | | £m | | CER % | | £% | | £m | | CER % | | £% | | £m | | CER % | | £% | |
|
|
|
|
|
|
|
|
|
|
|
|
|
|
|
|
|
|
|
|
|
|
|
|
|
|
|
|
|
|
|
| | 12,659 | | – | | (7 | ) | 4,213 | | (1 | ) | (9 | ) | 8,446 | | 1 | | (6 | ) | 4,266 | | 1 | | (7 | ) | 4,180 | | 1 | | (6 | ) |
| | 2,367 | | 4 | | (1 | ) | 806 | | 3 | | (3 | ) | 1,561 | | 5 | | – | | 798 | | 4 | | (1 | ) | 763 | | 6 | | 1 | |
|
|
|
|
|
|
|
|
|
|
|
|
|
|
|
|
|
|
|
|
|
|
|
|
|
|
|
|
|
|
|
| | 15,026 | | 1 | | (6 | ) | 5,019 | | – | | (8 | ) | 10,007 | | 2 | | (6 | ) | 5,064 | | 2 | | (6 | ) | 4,943 | | 2 | | (5 | ) |
| | (3,151 | ) | – | | (5 | ) | (1,096 | ) | 2 | | (3 | ) | (2,055 | ) | (2 | ) | (6 | ) | (1,031 | ) | 1 | | (3 | ) | (1,024 | ) | (4 | ) | (8 | ) |
| | (5,014 | ) | (4 | ) | (10 | ) | (1,647 | ) | (10 | ) | (15 | ) | (3,367 | ) | (1 | ) | (8 | ) | (1,641 | ) | (3 | ) | (12 | ) | (1,726 | ) | 2 | | (3 | ) |
| | (1,993 | ) | 7 | | 1 | | (682 | ) | 6 | | – | | (1,311 | ) | 7 | | 2 | | (680 | ) | 9 | | 4 | | (631 | ) | 5 | | – | |
|
|
|
|
|
|
|
|
|
|
|
|
|
|
|
|
|
|
|
|
|
|
|
|
|
|
|
|
|
|
|
| | (10,158 | ) | | | | | (3,425 | ) | | | | | (6,733 | ) | | | | | (3,352 | ) | | | | | (3,381 | ) | | | | |
|
|
|
|
|
|
|
|
|
|
|
|
|
|
|
|
|
|
|
|
|
|
|
|
|
|
|
|
|
|
|
| | 4,420 | | | | | | 1,412 | | | | | | 3,008 | | | | | | 1,557 | | | | | | 1,451 | | | | | |
| | 448 | | | | | | 182 | | | | | | 266 | | | | | | 155 | | | | | | 111 | | | | | |
|
|
|
|
|
|
|
|
|
|
|
|
|
|
|
|
|
|
|
|
|
|
|
|
|
|
|
|
|
|
|
| | 4,868 | | 5 | | (6 | ) | 1,594 | | 7 | | (7 | ) | 3,274 | | 4 | | (6 | ) | 1,712 | | 4 | | (5 | ) | 1,562 | | 4 | | (8 | ) |
| | (100 | ) | | | | | (33 | ) | | | | | (67 | ) | | | | | (102 | ) | | | | | 35 | | | | | |
|
|
|
|
|
|
|
|
|
|
|
|
|
|
|
|
|
|
|
|
|
|
|
|
|
|
|
|
|
|
|
| | 4,768 | | 2 | | (9 | ) | 1,561 | | 7 | | (7 | ) | 3,207 | | – | | (10 | ) | 1,610 | | (7 | ) | (14 | ) | 1,597 | | 7 | | (4 | ) |
|
|
|
|
|
|
|
|
|
|
|
|
|
|
|
|
|
|
|
|
|
|
|
|
|
|
|
|
|
|
|
| | 72 | | | | | | 22 | | | | | | 50 | | | | | | 28 | | | | | | 22 | | | | | |
| | – | | | | | | – | | | | | | – | | | | | | – | | | | | | – | | | | | |
| | 41 | | | | | | – | | | | | | 41 | | | | | | 41 | | | | | | – | | | | | |
|
|
|
|
|
|
|
|
|
|
|
|
|
|
|
|
|
|
|
|
|
|
|
|
|
|
|
|
|
|
|
| | 4,881 | | | | | | 1,583 | | | | | | 3,298 | | | | | | 1,679 | | | | | | 1,619 | | | | | |
| | (152 | ) | | | | | (61 | ) | | | | | (91 | ) | | | | | (48 | ) | | | | | (43 | ) | | | | |
|
|
|
|
|
|
|
|
|
|
|
|
|
|
|
|
|
|
|
|
|
|
|
|
|
|
|
|
|
|
|
| | 4,729 | | 2 | | (9 | ) | 1,522 | | 6 | | (8 | ) | 3,207 | | – | | (9 | ) | 1,631 | | (6 | ) | (13 | ) | 1,576 | | 7 | | (5 | ) |
| | (1,300 | ) | | | | | (418 | ) | | | | | (882 | ) | | | | | (449 | ) | | | | | (433 | ) | | | | |
|
|
|
|
|
|
|
|
|
|
|
|
|
|
|
|
|
|
|
|
|
|
|
|
|
|
|
|
|
|
|
| | 3,429 | | 2 | | (9 | ) | 1,104 | | 6 | | (8 | ) | 2,325 | | – | | (9 | ) | 1,182 | | (5 | ) | (13 | ) | 1,143 | | 7 | | (6 | ) |
| | (86 | ) | | | | | (39 | ) | | | | | (47 | ) | | | | | (25 | ) | | | | | (22 | ) | | | | |
| | (2 | ) | | | | | – | | | | | | (2 | ) | | | | | – | | | | | | (2 | ) | | | | |
|
|
|
|
|
|
|
|
|
|
|
|
|
|
|
|
|
|
|
|
|
|
|
|
|
|
|
|
|
|
|
| | 3,341 | | 2 | | (9 | ) | 1,065 | | 6 | | (9 | ) | 2,276 | | – | | (9 | ) | 1,157 | | (5 | ) | (13 | ) | 1,119 | | 7 | | (6 | ) |
|
|
|
|
|
|
|
|
|
|
|
|
|
|
|
|
|
|
|
|
|
|
|
|
|
|
|
|
|
|
|
| | 58.2 | p | 3 | | (8 | ) | 18.7 | p | 7 | | (7 | ) | 39.5 | p | 1 | | (8 | ) | 20.1 | p | (4 | ) | (12 | ) | 19.4 | p | | | | |
|
|
|
|
|
|
|
|
|
|
|
|
|
|
|
|
|
|
|
|
|
|
|
|
|
|
|
|
|
|
|
| | | | | | | | | | | | | | | | | | | | | | | | | | | | | | | |
| | | | | | | | | | | | | | | | | | | | | | | | | | | | | | | |
| | 12,659 | | – | | (7 | ) | 4,213 | | (1 | ) | (9 | ) | 8,446 | | 1 | | (6 | ) | 4,266 | | 1 | | (7 | ) | 4,180 | | 1 | | (6 | ) |
| | 2,367 | | 4 | | (1 | ) | 806 | | 3 | | (3 | ) | 1,561 | | 5 | | – | | 798 | | 4 | | (1 | ) | 763 | | 6 | | 1 | |
|
|
|
|
|
|
|
|
|
|
|
|
|
|
|
|
|
|
|
|
|
|
|
|
|
|
|
|
|
|
|
| | 15,026 | | 1 | | (6 | ) | 5,019 | | – | | (8 | ) | 10,007 | | 2 | | (6 | ) | 5,064 | | 2 | | (6 | ) | 4,943 | | 2 | | (5 | ) |
| | (3,151 | ) | 7 | | 3 | | (1,096 | ) | 8 | | 3 | | (2,055 | ) | 6 | | 2 | | (1,031 | ) | 9 | | 4 | | (1,024 | ) | 4 | | – | |
| | (5,014 | ) | (4 | ) | (10 | ) | (1,647 | ) | (12 | ) | (16 | ) | (3,367 | ) | – | | (7 | ) | (1,641 | ) | (3 | ) | (12 | ) | (1,726 | ) | 2 | | (3 | ) |
| | (1,993 | ) | 8 | | 2 | | (682 | ) | 6 | | – | | (1,311 | ) | 8 | | 3 | | (680 | ) | 11 | | 6 | | (631 | ) | 6 | | – | |
|
|
|
|
|
|
|
|
|
|
|
|
|
|
|
|
|
|
|
|
|
|
|
|
|
|
|
|
|
|
|
| | (10,158 | ) | | | | | (3,425 | ) | | | | | (6,733 | ) | | | | | (3,352 | ) | | | | | (3,381 | ) | | | | |
|
|
|
|
|
|
|
|
|
|
|
|
|
|
|
|
|
|
|
|
|
|
|
|
|
|
|
|
|
|
|
| | 4,420 | | | | | | 1,412 | | | | | | 3,008 | | | | | | 1,557 | | | | | | 1,451 | | | | | |
| | 448 | | | | | | 182 | | | | | | 266 | | | | | | 155 | | | | | | 111 | | | | | |
|
|
|
|
|
|
|
|
|
|
|
|
|
|
|
|
|
|
|
|
|
|
|
|
|
|
|
|
|
|
|
| | 4,868 | | 1 | | (10 | ) | 1,594 | | 5 | | (9 | ) | 3,274 | | (1 | ) | (11 | ) | 1,712 | | (1 | ) | (9 | ) | 1,562 | | (2 | ) | (13 | ) |
| | (100 | ) | | | | | (33 | ) | | | | | (67 | ) | | | | | (102 | ) | | | | | 35 | | | | | |
|
|
|
|
|
|
|
|
|
|
|
|
|
|
|
|
|
|
|
|
|
|
|
|
|
|
|
|
|
|
|
| | 4,768 | | (2 | ) | (13 | ) | 1,561 | | 5 | | (9 | ) | 3,207 | | (6 | ) | (14 | ) | 1,610 | | (12 | ) | (18 | ) | 1,597 | | 1 | | (10 | ) |
|
|
|
|
|
|
|
|
|
|
|
|
|
|
|
|
|
|
|
|
|
|
|
|
|
|
|
|
|
|
|
| | 72 | | | | | | 22 | | | | | | 50 | | | | | | 28 | | | | | | 22 | | | | | |
| | – | | | | | | – | | | | | | – | | | | | | – | | | | | | – | | | | | |
| | 41 | | | | | | – | | | | | | 41 | | | | | | 41 | | | | | | – | | | | | |
|
|
|
|
|
|
|
|
|
|
|
|
|
|
|
|
|
|
|
|
|
|
|
|
|
|
|
|
|
|
|
| | 4,881 | | | | | | 1,583 | | | | | | 3,298 | | | | | | 1,679 | | | | | | 1,619 | | | | | |
| | (152 | ) | | | | | (61 | ) | | | | | (91 | ) | | | | | (48 | ) | | | | | (43 | ) | | | | |
|
|
|
|
|
|
|
|
|
|
|
|
|
|
|
|
|
|
|
|
|
|
|
|
|
|
|
|
|
|
|
| | 4,729 | | (2 | ) | (13 | ) | 1,522 | | 4 | | (10 | ) | 3,207 | | (5 | ) | (14 | ) | 1,631 | | (10 | ) | (17 | ) | 1,576 | | 1 | | (11 | ) |
| | (1,300 | ) | | | | | (418 | ) | | | | | (882 | ) | | | | | (449 | ) | | | | | (433 | ) | | | | |
|
|
|
|
|
|
|
|
|
|
|
|
|
|
|
|
|
|
|
|
|
|
|
|
|
|
|
|
|
|
|
| | 3,429 | | (2 | ) | (13 | ) | 1,104 | | 4 | | (10 | ) | 2,325 | | (5 | ) | (14 | ) | 1,182 | | (9 | ) | (17 | ) | 1,143 | | – | | (11 | ) |
| | (86 | ) | | | | | (39 | ) | | | | | (47 | ) | | | | | (25 | ) | | | | | (22 | ) | | | | |
| | (2 | ) | | | | | – | | | | | | 2 | | | | | | – | | | | | | (2 | ) | | | | |
|
|
|
|
|
|
|
|
|
|
|
|
|
|
|
|
|
|
|
|
|
|
|
|
|
|
|
|
|
|
|
| | 3,341 | | (2 | ) | (13 | ) | 1,065 | | 4 | | (11 | ) | 2,276 | | (5 | ) | (14 | ) | 1,157 | | (10 | ) | (17 | ) | 1,119 | | – | | (11 | ) |
|
|
|
|
|
|
|
|
|
|
|
|
|
|
|
|
|
|
|
|
|
|
|
|
|
|
|
|
|
|
|
| | | | | | | | | | | | | | | | | | | | | | | | | | | | | | | |
| | 58.2 | p | | | | | 18.7 | p | | | | | 39.5 | p | | | | | 20.1 | p | | | | | 19.4 | p | | | | |
|
|
|
|
|
|
|
|
|
|
|
|
|
|
|
|
|
|
|
|
|
|
|
|
|
|
|
|
|
|
|
Back to Contents
| 156 | GlaxoSmithKline Financial record |
| Pharmaceutical turnover – total Group | | | | | | | | | | | | | | | | | | | | | | | | | |
| | | | Q4 2004 | | | | Q3 2004 | | | | Q2 2004 | | | | Q1 2004 | |
| |
| |
| |
| |
| |
| | £m | | CER % | | | £% | | £m | | CER % | | | £% | | £m | | CER % | | | £% | | £m | | CER % | | | £% | |
|
|
|
|
|
|
|
|
|
|
|
|
|
|
|
|
|
|
|
|
|
|
|
|
|
|
|
|
|
| Respiratory | 1,173 | | 4 | | | – | | 1,070 | | 10 | | | 1 | | 1,086 | | 6 | | | (1 | ) | 1,086 | | 7 | | | (1 | ) |
| Seretide/Advair, | | | | | | | | | | | | | | | | | | | | | | | | | | | | |
| Flixotide/Flovent, Serevent | 920 | | 5 | | | 2 | | 832 | | 10 | | | 2 | | 852 | | 12 | | | 5 | | 824 | | 8 | | | 1 | |
| Seretide/Advair | 668 | | 13 | | | 8 | | 609 | | 20 | | | 10 | | 603 | | 22 | | | 14 | | 581 | | 22 | | | 13 | |
| Flixotide/Flovent | 167 | | (8 | ) | | (10 | ) | 141 | | (8 | ) | | (15 | ) | 156 | | (3 | ) | | (10 | ) | 154 | | (9 | ) | | (14 | ) |
| Serevent | 85 | | (17 | ) | | (17 | ) | 82 | | (13 | ) | | (19 | ) | 93 | | (9 | ) | | (15 | ) | 89 | | (21 | ) | | (26 | ) |
| Flixonase/Flonase | 143 | | 5 | | | (1 | ) | 145 | | 28 | | | 14 | | 133 | | (11 | ) | | (19 | ) | 157 | | 11 | | | (1 | ) |
|
|
|
|
|
|
|
|
|
|
|
|
|
|
|
|
|
|
|
|
|
|
|
|
|
|
|
|
|
| Central Nervous System | 837 | | (9 | ) | | (13 | ) | 835 | | (26 | ) | | (33 | ) | 877 | | (17 | ) | | (24 | ) | 914 | | (8 | ) | | (17 | ) |
| Seroxat/Paxil | 242 | | (23 | ) | | (26 | ) | 246 | | (51 | ) | | (55 | ) | 284 | | (41 | ) | | (45 | ) | 291 | | (36 | ) | | (41 | ) |
| Paxil IR | 144 | | (34 | ) | | (35 | ) | 144 | | (65 | ) | | (67 | ) | 189 | | (54 | ) | | (56 | ) | 190 | | (51 | ) | | (53 | ) |
| Paxil CR | 98 | | 1 | | | (6 | ) | 102 | | 4 | | | (7 | ) | 95 | | 21 | | | 8 | | 101 | | 37 | | | 20 | |
| Wellbutrin | 164 | | (24 | ) | | (28 | ) | 173 | | (30 | ) | | (38 | ) | 193 | | (7 | ) | | (16 | ) | 221 | | 17 | | | 2 | |
| Wellbutrin IR, SR | 30 | | (85 | ) | | (84 | ) | 45 | | (79 | ) | | (82 | ) | 76 | | (64 | ) | | (67 | ) | 133 | | (30 | ) | | (38 | ) |
| Wellbutrin XL | 134 | | >100 | | | >100 | | 128 | | >100 | | | >100 | | 117 | | >100 | | | – | | 88 | | >100 | | | >100 | |
| Imigran/Imitrex | 177 | | – | | | (6 | ) | 175 | | (3 | ) | | (12 | ) | 158 | | (9 | ) | | (17 | ) | 172 | | 4 | | | (6 | ) |
| Lamictal | 182 | | 31 | | | 25 | | 172 | | 29 | | | 19 | | 171 | | 38 | | | 27 | | 153 | | 29 | | | 18 | |
| Requip | 32 | | 23 | | | 19 | | 29 | | 22 | | | 12 | | 29 | | 29 | | | 21 | | 26 | | 24 | | | 18 | |
|
|
|
|
|
|
|
|
|
|
|
|
|
|
|
|
|
|
|
|
|
|
|
|
|
|
|
|
|
| Anti-virals | 606 | | 8 | | | 4 | | 597 | | 11 | | | 2 | | 595 | | 6 | | | (2 | ) | 562 | | 6 | | | (2 | ) |
| HIV | 375 | | 6 | | | 2 | | 372 | | 8 | | | (1 | ) | 368 | | 2 | | | (6 | ) | 348 | | – | | | (7 | ) |
| Combivir | 147 | | 4 | | | – | | 144 | | 7 | | | (1 | ) | 141 | | – | | | (7 | ) | 139 | | 4 | | | (3 | ) |
| Trizivir | 75 | | (12 | ) | | (15 | ) | 79 | | (6 | ) | | (14 | ) | 87 | | (7 | ) | | (15 | ) | 81 | | (8 | ) | | (14 | ) |
| Epivir | 73 | | 8 | | | 4 | | 73 | | 6 | | | (3 | ) | 77 | | 11 | | | 4 | | 71 | | 4 | | | (4 | ) |
| Ziagen | 38 | | 1 | | | (3 | ) | 42 | | 7 | | | (2 | ) | 37 | | (2 | ) | | (12 | ) | 38 | | (7 | ) | | (12 | ) |
| Retrovir | 11 | | 8 | | | – | | 11 | | 5 | | | – | | 11 | | – | | | (8 | ) | 10 | | (4 | ) | | (9 | ) |
| Agenerase, Lexiva | 21 | | 66 | | | 62 | | 18 | | >100 | | | >100 | | 15 | | >100 | | | 88 | | 9 | | 9 | | | – | |
| Herpes | 183 | | 14 | | | 8 | | 179 | | 15 | | | 5 | | 182 | | 10 | | | 2 | | 174 | | 23 | | | 15 | |
| Valtrex | 146 | | 20 | | | 13 | | 147 | | 27 | | | 15 | | 145 | | 19 | | | 10 | | 133 | | 31 | | | 21 | |
| Zovirax | 37 | | (6 | ) | | (10 | ) | 32 | | (21 | ) | | (24 | ) | 37 | | (15 | ) | | (20 | ) | 41 | | 3 | | | – | |
| Zeffix | 34 | | – | | | – | | 33 | | 13 | | | 3 | | 33 | | 14 | | | 3 | | 30 | | 4 | | | (3 | ) |
|
|
|
|
|
|
|
|
|
|
|
|
|
|
|
|
|
|
|
|
|
|
|
|
|
|
|
|
|
| Anti-bacterials | 396 | | (20 | ) | | (22 | ) | 353 | | (10 | ) | | (16 | ) | 386 | | (1 | ) | | (8 | ) | 426 | | (4 | ) | | (9 | ) |
| Augmentin | 170 | | (30 | ) | | (32 | ) | 156 | | (7 | ) | | (12 | ) | 178 | | 6 | | | (1 | ) | 204 | | – | | | (6 | ) |
| Augmentin IR | 135 | | (17 | ) | | (19 | ) | 125 | | (9 | ) | | (13 | ) | 134 | | 11 | | | 6 | | 139 | | (3 | ) | | (6 | ) |
| Augmentin ES | 5 | | (93 | ) | | (90 | ) | 14 | | 32 | | | 17 | | 22 | | (18 | ) | | (30 | ) | 33 | | (15 | ) | | (25 | ) |
| Augmentin XR | 30 | | (12 | ) | | (17 | ) | 17 | | (12 | ) | | (19 | ) | 22 | | (10 | ) | | – | | 32 | | 41 | | | 23 | |
| Zinnat/Ceftin | 58 | | (15 | ) | | (17 | ) | 45 | | (16 | ) | | (21 | ) | 52 | | 1 | | | (5 | ) | 63 | | 2 | | | (2 | ) |
|
|
|
|
|
|
|
|
|
|
|
|
|
|
|
|
|
|
|
|
|
|
|
|
|
|
|
|
|
| Metabolic | 324 | | 18 | | | 11 | | 320 | | 25 | | | 13 | | 339 | | 52 | | | 38 | | 270 | | 16 | | | 4 | |
| Avandia/Avandamet | 287 | | 21 | | | 14 | | 284 | | 31 | | | 18 | | 307 | | 59 | | | 45 | | 238 | | 18 | | | 5 | |
|
|
|
|
|
|
|
|
|
|
|
|
|
|
|
|
|
|
|
|
|
|
|
|
|
|
|
|
|
| Vaccines | 350 | | 23 | | | 21 | | 328 | | 22 | | | 15 | | 278 | | 4 | | | (2 | ) | 240 | | (6 | ) | | (9 | ) |
| Hepatitis | 109 | | 10 | | | 7 | | 102 | | 7 | | | – | | 105 | | 6 | | | (1 | ) | 90 | | (11 | ) | | (16 | ) |
| Infanrix/Pediarix | 100 | | 35 | | | 32 | | 95 | | 22 | | | 14 | | 86 | | (9 | ) | | (16 | ) | 76 | | 6 | | | 1 | |
|
|
|
|
|
|
|
|
|
|
|
|
|
|
|
|
|
|
|
|
|
|
|
|
|
|
|
|
|
| Oncology and emesis | 229 | | 5 | | | (1 | ) | 246 | | 9 | | | (1 | ) | 237 | | (5 | ) | | (13 | ) | 222 | | (1 | ) | | (10 | ) |
| Zofran | 190 | | 7 | | | 2 | | 201 | | 12 | | | 1 | | 192 | | 2 | | | (7 | ) | 180 | | 10 | | | (1 | ) |
| Hycamtin | 24 | | (7 | ) | | (8 | ) | 26 | | – | | | (10 | ) | 25 | | (5 | ) | | (14 | ) | 24 | | 1 | | | (8 | ) |
|
|
|
|
|
|
|
|
|
|
|
|
|
|
|
|
|
|
|
|
|
|
|
|
|
|
|
|
|
| Cardiovascular and urogenital | 280 | | 50 | | | 44 | | 233 | | 14 | | | 3 | | 220 | | 35 | | | 24 | | 200 | | 27 | | | 16 | |
| Coreg | 115 | | 29 | | | 20 | | 110 | | 29 | | | 13 | | 113 | | 50 | | | 35 | | 94 | | 27 | | | 12 | |
| Levitra | 12 | | 78 | | | 71 | | 11 | | (53 | ) | | (56 | ) | 9 | | >100 | | | >100 | | 17 | | >100 | | | >100 | |
| Avodart | 23 | | >100 | | | >100 | | 17 | | >100 | | | >100 | | 14 | | >100 | | | >100 | | 10 | | >100 | | | >100 | |
|
|
|
|
|
|
|
|
|
|
|
|
|
|
|
|
|
|
|
|
|
|
|
|
|
|
|
|
|
| Other | 292 | | 8 | | | 4 | | 231 | | (13 | ) | | (20 | ) | 248 | | (14 | ) | | (19 | ) | 260 | | (6 | ) | | (12 | ) |
| Zantac | 69 | | (6 | ) | | (9 | ) | 66 | | (12 | ) | | (18 | ) | 70 | | (15 | ) | | (21 | ) | 68 | | (14 | ) | | (18 | ) |
|
|
|
|
|
|
|
|
|
|
|
|
|
|
|
|
|
|
|
|
|
|
|
|
|
|
|
|
|
| Total | 4,487 | | 3 | | | (1 | ) | 4,213 | | (1 | ) | | (9 | ) | 4,266 | | 1 | | | (7 | ) | 4,180 | | 1 | | | (6 | ) |
|
|
|
|
|
|
|
|
|
|
|
|
|
|
|
|
|
|
|
|
|
|
|
|
|
|
|
|
|
Pharmaceutical turnover includes co-promotion income.
Back to Contents
| Financial record GlaxoSmithKline | 157 |
Pharmaceutical turnover – US
| | | | Q4 2004 | | | | Q3 2004 | | | | Q2 2004 | | | | Q1 2004 | |
| |
| |
| |
| |
| |
| | £m | | CER % | | | £% | | £m | | CER % | | | £% | | £m | | CER % | | | £% | | £m | | CER % | | | £% | |
|
|
|
|
|
|
|
|
|
|
|
|
|
|
|
|
|
|
|
|
|
|
|
|
|
|
|
|
|
| Respiratory | 568 | | 7 | | | – | | 556 | | 15 | | | 2 | | 511 | | 3 | | | (8 | ) | 548 | | 10 | | | (4 | ) |
| Seretide/Advair | | | | | | | | | | | | | | | | | | | | | | | | | | | | |
Flixotide/Flovent, Serevent | 458 | | 8 | | | – | | 431 | | 12 | | | (1 | ) | 405 | | 9 | | | (2 | ) | 416 | | 7 | | | (6 | ) |
| Seretide/Advair | 367 | | 16 | | | 8 | | 342 | | 22 | | | 8 | | 304 | | 18 | | | 6 | | 317 | | 24 | | | 9 | |
| Flixotide/Flovent | 64 | | (11 | ) | | (17 | ) | 59 | | (13 | ) | | (23 | ) | 65 | | (6 | ) | | (16 | ) | 63 | | (18 | ) | | (28 | ) |
| Serevent | 27 | | (25 | ) | | (29 | ) | 30 | | (22 | ) | | (32 | ) | 36 | | (20 | ) | | (28 | ) | 36 | | (36 | ) | | (44 | ) |
| Flixonase/Flonase | 105 | | 2 | | | (4 | ) | 119 | | 32 | | | 16 | | 100 | | (15 | ) | | (24 | ) | 126 | | 22 | | | 7 | |
|
|
|
|
|
|
|
|
|
|
|
|
|
|
|
|
|
|
|
|
|
|
|
|
|
|
|
|
|
| Central Nervous System | 536 | | (6 | ) | | (12 | ) | 544 | | (32 | ) | | (40 | ) | 579 | | (20 | ) | | (28 | ) | 612 | | (11 | ) | | (22 | ) |
| Seroxat/Paxil | 108 | | (20 | ) | | (25 | ) | 117 | | (64 | ) | | (68 | ) | 146 | | (52 | ) | | (57 | ) | 148 | | (48 | ) | | (55 | ) |
| Paxil IR | 13 | | (69 | ) | | (68 | ) | 17 | | (92 | ) | | (93 | ) | 53 | | (77 | ) | | (79 | ) | 48 | | (77 | ) | | (80 | ) |
| Paxil CR | 95 | | (1 | ) | | (8 | ) | 100 | | 2 | | | (9 | ) | 93 | | 20 | | | 7 | | 100 | | 36 | | | 19 | |
| Wellbutrin | 159 | | (24 | ) | | (28 | ) | 168 | | (30 | ) | | (38 | ) | 191 | | (5 | ) | | (15 | ) | 217 | | 18 | | | 3 | |
| Wellbutrin IR, SR | 25 | | (87 | ) | | (86 | ) | 41 | | (81 | ) | | (83 | ) | 75 | | (63 | ) | | (67 | ) | 129 | | (29 | ) | | (39 | ) |
| Wellbutrin XL | 134 | | >100 | | | >100 | | 127 | | >100 | | | >100 | | 116 | | >100 | | | – | | 88 | | >100 | | | >100 | |
| Imigran/Imitrex | 130 | | 5 | | | (2 | ) | 127 | | (5 | ) | | (15 | ) | 109 | | (11 | ) | | (21 | ) | 126 | | 3 | | | (9 | ) |
| Lamictal | 113 | | 58 | | | 47 | | 106 | | 42 | | | 26 | | 104 | | 55 | | | 41 | | 91 | | 39 | | | 20 | |
| Requip | 15 | | 40 | | | 36 | | 13 | | 21 | | | – | | 13 | | 25 | | | 8 | | 12 | | 20 | | | 9 | |
|
|
|
|
|
|
|
|
|
|
|
|
|
|
|
|
|
|
|
|
|
|
|
|
|
|
|
|
|
| Anti-virals | 291 | | 12 | | | 4 | | 307 | | 19 | | | 6 | | 296 | | 12 | | | (1 | ) | 271 | | 6 | | | (7 | ) |
| HIV | 186 | | 7 | | | – | | 198 | | 13 | | | 1 | | 191 | | 6 | | | (5 | ) | 172 | | (8 | ) | | (19 | ) |
| Combivir | 70 | | 3 | | | (4 | ) | 73 | | 12 | | | (1 | ) | 69 | | 3 | | | (8 | ) | 68 | | (2 | ) | | (14 | ) |
| Trizivir | 38 | | (12 | ) | | (19 | ) | 47 | | (4 | ) | | (13 | ) | 49 | | (6 | ) | | (18 | ) | 43 | | (16 | ) | | (26 | ) |
| Epivir | 32 | | – | | | (3 | ) | 35 | | 6 | | | (8 | ) | 39 | | 17 | | | 8 | | 33 | | (6 | ) | | (20 | ) |
| Ziagen | 17 | | (6 | ) | | (11 | ) | 20 | | 3 | | | (9 | ) | 18 | | (4 | ) | | (14 | ) | 18 | | (13 | ) | | (25 | ) |
| Retrovir | 4 | | (3 | ) | | – | | 5 | | 12 | | | – | | 4 | | 1 | | | (20 | ) | 4 | | (10 | ) | | (20 | ) |
| Agenerase, Lexiva | 15 | | 76 | | | 50 | | 13 | | >100 | | | >100 | | 12 | | >100 | | | >100 | | 6 | | 17 | | | – | |
| | | | | | | | | | | | | | | | | | | | | | | | | | | | | |
| Herpes | 95 | | 24 | | | 14 | | 99 | | 32 | | | 16 | | 97 | | 25 | | | 13 | | 89 | | 43 | | | 25 | |
| Valtrex | 92 | | 23 | | | 14 | | 96 | | 34 | | | 19 | | 95 | | 28 | | | 14 | | 86 | | 38 | | | 21 | |
| Zovirax | 3 | | 93 | | | 50 | | 3 | | (19 | ) | | (25 | ) | 2 | | (45 | ) | | (33 | ) | 3 | | >100 | | | >100 | |
| Zeffix | 3 | | 6 | | | – | | 3 | | 30 | | | 50 | | 2 | | 4 | | | (33 | ) | 3 | | 34 | | | 50 | |
|
|
|
|
|
|
|
|
|
|
|
|
|
|
|
|
|
|
|
|
|
|
|
|
|
|
|
|
|
| Anti-bacterials | 85 | | (45 | ) | | (49 | ) | 71 | | (25 | ) | | (34 | ) | 89 | | (13 | ) | | (21 | ) | 111 | | (8 | ) | | (20 | ) |
| Augmentin | 50 | | (55 | ) | | (57 | ) | 42 | | (14 | ) | | (22 | ) | 53 | | (2 | ) | | (12 | ) | 78 | | 8 | | | (6 | ) |
| Augmentin IR | 19 | | (41 | ) | | (42 | ) | 14 | | (31 | ) | | (36 | ) | 11 | | 67 | | | 57 | | 15 | | 36 | | | 15 | |
| Augmentin ES | 3 | | (95 | ) | | (94 | ) | 13 | | 26 | | | 8 | | 21 | | (22 | ) | | (30 | ) | 32 | | (17 | ) | | (28 | ) |
| Augmentin XR | 28 | | (15 | ) | | (20 | ) | 15 | | (18 | ) | | (29 | ) | 21 | | 2 | | | (8 | ) | 31 | | 39 | | | 21 | |
| Zinnat/Ceftin | 2 | | (43 | ) | | (67 | ) | 1 | | (77 | ) | | (75 | ) | 2 | | (44 | ) | | (50 | ) | 4 | | (50 | ) | | (50 | ) |
|
|
|
|
|
|
|
|
|
|
|
|
|
|
|
|
|
|
|
|
|
|
|
|
|
|
|
|
|
| Metabolic | 218 | | 17 | | | 9 | | 216 | | 24 | | | 10 | | 233 | | 56 | | | 40 | | 185 | | 11 | | | (3 | ) |
| Avandia/Avandamet | 218 | | 17 | | | 9 | | 216 | | 24 | | | 10 | | 233 | | 56 | | | 40 | | 185 | | 11 | | | (3 | ) |
|
|
|
|
|
|
|
|
|
|
|
|
|
|
|
|
|
|
|
|
|
|
|
|
|
|
|
|
|
| Vaccines | 79 | | 30 | | | 22 | | 67 | | 9 | | | (4 | ) | 67 | | 2 | | | (8 | ) | 55 | | (14 | ) | | (25 | ) |
| Hepatitis | 34 | | (6 | ) | | (13 | ) | 34 | | 1 | | | (13 | ) | 35 | | 16 | | | 3 | | 31 | | (23 | ) | | (31 | ) |
| Infanrix, Pediarix | 40 | | 63 | | | 54 | | 33 | | 20 | | | 6 | | 32 | | (9 | ) | | (18 | ) | 24 | | 1 | | | (14 | ) |
|
|
|
|
|
|
|
|
|
|
|
|
|
|
|
|
|
|
|
|
|
|
|
|
|
|
|
|
|
| Oncology and emesis | 165 | | 6 | | | (1 | ) | 182 | | 13 | | | – | | 172 | | (7 | ) | | (17 | ) | 160 | | (2 | ) | | (14 | ) |
| Zofran | 140 | | 10 | | | 3 | | 152 | | 16 | | | 3 | | 141 | | 1 | | | (9 | ) | 132 | | 12 | | | (3 | ) |
| Hycamtin | 15 | | (14 | ) | | (21 | ) | 17 | | (6 | ) | | (19 | ) | 16 | | (10 | ) | | (24 | ) | 16 | | 4 | | | (6 | ) |
|
|
|
|
|
|
|
|
|
|
|
|
|
|
|
|
|
|
|
|
|
|
|
|
|
|
|
|
|
| Cardiovascular and urogenital | 151 | | 36 | | | 27 | | 142 | | 2 | | | (9 | ) | 141 | | 44 | | | 28 | | 129 | | 34 | | | 17 | |
| Coreg | 114 | | 33 | | | 24 | | 108 | | 33 | | | 17 | | 112 | | 55 | | | 38 | | 91 | | 29 | | | 12 | |
| Levitra | 5 | | >100 | | | >100 | | 3 | | (82 | ) | | (85 | ) | 1 | | – | | | – | | 11 | | – | | | – | |
| Avodart | 11 | | >100 | | | >100 | | 10 | | 77 | | | 67 | | 7 | | >100 | | | – | | 6 | | >100 | | | >100 | |
|
|
|
|
|
|
|
|
|
|
|
|
|
|
|
|
|
|
|
|
|
|
|
|
|
|
|
|
|
| Other | 21 | | 33 | | | 31 | | 21 | | (2 | ) | | (19 | ) | 24 | | (5 | ) | | (11 | ) | 22 | | (15 | ) | | (27 | ) |
| Zantac | 16 | | 23 | | | 14 | | 17 | | 10 | | | (6 | ) | 20 | | – | | | (9 | ) | 17 | | (17 | ) | | (26 | ) |
|
|
|
|
|
|
|
|
|
|
|
|
|
|
|
|
|
|
|
|
|
|
|
|
|
|
|
|
|
| Total | 2,114 | | 4 | | | (3 | ) | 2,106 | | (4 | ) | | (15 | ) | 2,112 | | – | | | (10 | ) | 2,093 | | 1 | | | (12 | ) |
|
|
|
|
|
|
|
|
|
|
|
|
|
|
|
|
|
|
|
|
|
|
|
|
|
|
|
|
|
Pharmaceutical turnover includes co-promotion income.
Back to Contents
| 158 | GlaxoSmithKline Financial record |
Pharmaceutical turnover – Europe
| | | | Q4 2004 | | | | Q3 2004 | | | | Q2 2004 | | | | Q1 2004 | |
| |
| |
| |
| |
| |
| | £m | | CER % | | | £% | | £m | | CER % | | | £% | | £m | | CER % | | | £% | | £m | | CER % | | | £% | |
|
|
|
|
|
|
|
|
|
|
|
|
|
|
|
|
|
|
|
|
|
|
|
|
|
|
|
|
|
| Respiratory | 403 | | (2 | ) | | (1 | ) | 358 | | 7 | | | 4 | | 403 | | 11 | | | 7 | | 374 | | 5 | | | 6 | |
| Seretide/Advair | | | | | | | | | | | | | | | | | | | | | | | | | | | | |
| Flixotide/Flovent, Serevent | 328 | | (1 | ) | | 8 | | 295 | | 11 | | | 8 | | 329 | | 16 | | | 13 | | 301 | | 9 | | | 9 | |
| Seretide/Advair | 238 | | 7 | | | 8 | | 213 | | 21 | | | 17 | | 240 | | 29 | | | 25 | | 211 | | 18 | | | 19 | |
| Flixotide/Flovent | 50 | | (13 | ) | | (12 | ) | 43 | | (5 | ) | | (9 | ) | 48 | | (6 | ) | | (8 | ) | 48 | | (6 | ) | | (8 | ) |
| Serevent | 40 | | (22 | ) | | (22 | ) | 39 | | (11 | ) | | (11 | ) | 41 | | (12 | ) | | (15 | ) | 42 | | (8 | ) | | (9 | ) |
| Flixonase/Flonase | 14 | | 5 | | | 8 | | 12 | | 7 | | | – | | 19 | | 5 | | | 6 | | 14 | | 10 | | | 8 | |
|
|
|
|
|
|
|
|
|
|
|
|
|
|
|
|
|
|
|
|
|
|
|
|
|
|
|
|
|
| Central Nervous System | 183 | | (19 | ) | | (18 | ) | 181 | | (10 | ) | | (12 | ) | 191 | | (7 | ) | | (10 | ) | 193 | | (6 | ) | | (5 | ) |
| Seroxat/Paxil | 55 | | (38 | ) | | (37 | ) | 58 | | (32 | ) | | (35 | ) | 67 | | (29 | ) | | (30 | ) | 71 | | (27 | ) | | (27 | ) |
| Paxil IR | 55 | | (38 | ) | | (37 | ) | 58 | | (32 | ) | | (35 | ) | 67 | | (29 | ) | | (30 | ) | 71 | | (27 | ) | | (27 | ) |
| Paxil CR | – | | – | | | – | | – | | – | | | – | | – | | – | | | – | | – | | – | | | – | |
| Wellbutrin | 1 | | >100 | | | >100 | | – | | – | | | – | | – | | – | | | – | | – | | – | | | – | |
| Wellbutrin IR, SR | 1 | | >100 | | | >100 | | – | | – | | | – | | – | | – | | | – | | – | | – | | | – | |
| Wellbutrin XL | – | | – | | | – | | – | | – | | | – | | – | | – | | | – | | – | | – | | | – | |
| Imigran/Imitrex | 35 | | (15 | ) | | (15 | ) | 36 | | 2 | | | – | | 36 | | 2 | | | (3 | ) | 35 | | 6 | | | 6 | |
| Lamictal | 58 | | (2 | ) | | – | | 54 | | 10 | | | 8 | | 56 | | 17 | | | 12 | | 51 | | 15 | | | 16 | |
| Requip | 15 | | 8 | | | 7 | | 14 | | 22 | | | 17 | | 14 | | 32 | | | 27 | | 13 | | 28 | | | 30 | |
|
|
|
|
|
|
|
|
|
|
|
|
|
|
|
|
|
|
|
|
|
|
|
|
|
|
|
|
|
| Anti-virals | 189 | | 3 | | | 3 | | 170 | | (1 | ) | | (4 | ) | 183 | | (3 | ) | | (6 | ) | 183 | | 6 | | | 7 | |
| HIV | 146 | | 2 | | | 3 | | 132 | | – | | | (4 | ) | 141 | | (1 | ) | | (5 | ) | 140 | | 9 | | | 9 | |
| Combivir | 60 | | 6 | | | 5 | | 54 | | 3 | | | 2 | | 56 | | 1 | | | (5 | ) | 56 | | 13 | | | 14 | |
| Trizivir | 32 | | (15 | ) | | (14 | ) | 30 | | (10 | ) | | (14 | ) | 34 | | (10 | ) | | (11 | ) | 34 | | 3 | | | 3 | |
| Epivir | 30 | | 10 | | | 11 | | 27 | | 5 | | | – | | 29 | | 8 | | | 4 | | 29 | | 16 | | | 16 | |
| Ziagen | 16 | | 4 | | | 7 | | 14 | | (3 | ) | | (7 | ) | 15 | | (4 | ) | | (6 | ) | 15 | | (3 | ) | | – | |
| Retrovir | 4 | | 14 | | | – | | 4 | | (3 | ) | | – | | 4 | | 4 | | | – | | 4 | | 2 | | | – | |
| Agenerasee, Lexiva | 4 | | 65 | | | 100 | | 3 | | 28 | | | – | | 3 | | (9 | ) | | – | | 2 | | 2 | | | – | |
| Herpes | 35 | | 2 | | | 3 | | 31 | | (8 | ) | | (14 | ) | 35 | | (12 | ) | | (15 | ) | 37 | | (2 | ) | | – | |
| Valtrex | 23 | | 12 | | | 15 | | 22 | | 6 | | | – | | 23 | | (4 | ) | | (8 | ) | 22 | | 12 | | | 16 | |
| Zovirax | 12 | | (13 | ) | | (14 | ) | 9 | | (31 | ) | | (36 | ) | 12 | | (23 | ) | | (25 | ) | 15 | | (17 | ) | | (17 | ) |
| Zeffix | 6 | | 13 | | | 20 | | 6 | | 37 | | | 50 | | 5 | | 38 | | | 25 | | 5 | | 24 | | | 25 | |
|
|
|
|
|
|
|
|
|
|
|
|
|
|
|
|
|
|
|
|
|
|
|
|
|
|
|
|
|
| Anti-bacterials | 184 | | (11 | ) | | (11 | ) | 154 | | (8 | ) | | (10 | ) | 169 | | 3 | | | (2 | ) | 194 | | (5 | ) | | (5 | ) |
| Augmentin | 78 | | (12 | ) | | (11 | ) | 63 | | (14 | ) | | (17 | ) | 75 | | 5 | | | 1 | | 82 | | (12 | ) | | (13 | ) |
| Augmentin IR | 76 | | (13 | ) | | (13 | ) | 62 | | (16 | ) | | (18 | ) | 74 | | 2 | | | – | | 81 | | (13 | ) | | (14 | ) |
| Augmentin ES | – | | – | | | – | | – | | – | | | – | | – | | – | | | – | | – | | – | | | – | |
| Augmentin XR | 2 | | >100 | | | 100 | | 1 | | >100 | | | – | | 1 | | >100 | | | >100 | | 1 | | >100 | | | >100 | |
| Zinnat/Ceftin | 36 | | (17 | ) | | (14 | ) | 25 | | 1 | | | (4 | ) | 31 | | 14 | | | 7 | | 41 | | 9 | | | 11 | |
|
|
|
|
|
|
|
|
|
|
|
|
|
|
|
|
|
|
|
|
|
|
|
|
|
|
|
|
|
| Metabolic | 37 | | 13 | | | 12 | | 36 | | 15 | | | 9 | | 31 | | 26 | | | 24 | | 31 | | 25 | | | 24 | |
| Avandia/Avandamet | 29 | | 32 | | | 32 | | 27 | | 49 | | | 42 | | 25 | | 47 | | | 47 | | 22 | | 83 | | | 83 | |
|
|
|
|
|
|
|
|
|
|
|
|
|
|
|
|
|
|
|
|
|
|
|
|
|
|
|
|
|
| Vaccines | 156 | | 20 | | | 21 | | 150 | | 17 | | | 14 | | 116 | | (5 | ) | | (9 | ) | 101 | | (6 | ) | | (6 | ) |
| Hepatitis | 56 | | 19 | | | 17 | | 52 | | 17 | | | 16 | | 51 | | (3 | ) | | (7 | ) | 42 | | (5 | ) | | (5 | ) |
| Infanrix/Pediarix | 48 | | 23 | | | 30 | | 41 | | 14 | | | 8 | | 38 | | (4 | ) | | (10 | ) | 35 | | 13 | | | 17 | |
|
|
|
|
|
|
|
|
|
|
|
|
|
|
|
|
|
|
|
|
|
|
|
|
|
|
|
|
|
| ONCOLOGY AND EMESIS | 42 | | 2 | | | 2 | | 42 | | 6 | | | 5 | | 44 | | 7 | | | 2 | | 42 | | 8 | | | 8 | |
| Zofran | 32 | | – | | | – | | 32 | | 4 | | | – | | 34 | | 7 | | | 6 | | 32 | | 8 | | | 7 | |
| Hycamtin | 8 | | 15 | | | 33 | | 7 | | 14 | | | 17 | | 7 | | 11 | | | – | | 7 | | 14 | | | 17 | |
|
|
|
|
|
|
|
|
|
|
|
|
|
|
|
|
|
|
|
|
|
|
|
|
|
|
|
|
|
| Cardiovascular and urogenital | 96 | | 100 | | | 100 | | 64 | | 53 | | | 45 | | 53 | | 29 | | | 26 | | 49 | | 16 | | | 17 | |
| Coreg | – | | – | | | – | | – | | – | | | – | | – | | – | | | – | | – | | – | | | – | |
| Levitra | 6 | | 47 | | | 50 | | 5 | | 99 | | | 67 | | 5 | | >100 | | | >100 | | 5 | | 93 | | | >100 | |
| Avodart | 10 | | >100 | | | >100 | | 7 | | >100 | | | >100 | | 6 | | >100 | | | >100 | | 4 | | >100 | | | >100 | |
|
|
|
|
|
|
|
|
|
|
|
|
|
|
|
|
|
|
|
|
|
|
|
|
|
|
|
|
|
| Other | 107 | | 20 | | | 19 | | 67 | | (13 | ) | | (16 | ) | 73 | | (16 | ) | | (20 | ) | 79 | | (14 | ) | | (16 | ) |
| Zantac | 17 | | (22 | ) | | (26 | ) | 17 | | (26 | ) | | (23 | ) | 18 | | (18 | ) | | (25 | ) | 20 | | (22 | ) | | (20 | ) |
|
|
|
|
|
|
|
|
|
|
|
|
|
|
|
|
|
|
|
|
|
|
|
|
|
|
|
|
|
| Total | 1,397 | | 2 | | | 2 | | 1,222 | | 3 | | | – | | 1,263 | | 2 | | | (2 | ) | 1,246 | | – | | | – | |
|
|
|
|
|
|
|
|
|
|
|
|
|
|
|
|
|
|
|
|
|
|
|
|
|
|
|
|
|
Pharmaceutical turnover includes co-promotion income.
Back to Contents
| Financial record GlaxoSmithKline | 159 |
Pharmaceutical turnover – International
| | | | Q4 2004 | | | | Q3 2004 | | | | Q2 2004 | | | | Q1 2004 | |
| |
| |
| |
| |
| |
| | £m | | CER % | | | £% | | £m | | CER % | | £% | | £m | | CER % | | | £% | | £m | | CER % | | | £% | |
|
|
|
|
|
|
|
|
|
|
|
|
|
|
|
|
|
|
|
|
|
|
|
|
|
|
|
|
| Respiratory | 202 | | 8 | | | 5 | | 156 | | – | | (7 | ) | 172 | | 9 | | | 4 | | 164 | | (1 | ) | | (2 | ) |
| Seretide/Advair | | | | | | | | | | | | | | | | | | | | | | | | | | | |
Flixotide/Flovent, Serevent | 134 | | 13 | | | 11 | | 106 | | 3 | | (3 | ) | 118 | | 14 | | | 9 | | 107 | | 13 | | | 14 | |
| Seretide/Advair | 63 | | 21 | | | 15 | | 54 | | 5 | | – | | 59 | | 17 | | | 11 | | 53 | | 18 | | | 20 | |
| Flixotide/Flovent | 53 | | 3 | | | 2 | | 39 | | (3 | ) | (7 | ) | 43 | | 4 | | | (2 | ) | 43 | | 5 | | | 8 | |
| Serevent | 18 | | 22 | | | 29 | | 13 | | 14 | | – | | 16 | | 45 | | | 45 | | 11 | | 16 | | | 10 | |
| Flixonase/Flonase | 24 | | 23 | | | 9 | | 14 | | 14 | | 17 | | 14 | | 3 | | | (7 | ) | 17 | | (38 | ) | | (39 | ) |
|
|
|
|
|
|
|
|
|
|
|
|
|
|
|
|
|
|
|
|
|
|
|
|
|
|
|
|
| Central Nervous System | 118 | | (10 | ) | | (12 | ) | 110 | | (7 | ) | (13 | ) | 107 | | (15 | ) | | (18 | ) | 109 | | 6 | | | 5 | |
| Seroxat/Paxil | 79 | | (13 | ) | | (16 | ) | 71 | | (11 | ) | (14 | ) | 71 | | (13 | ) | | (17 | ) | 72 | | 11 | | | 9 | |
| Paxil IR | 76 | | (16 | ) | | (18 | ) | 69 | | (13 | ) | (17 | ) | 69 | | (15 | ) | | (19 | ) | 71 | | 10 | | | 8 | |
| Paxil CR | 3 | | >100 | | | >100 | | 2 | | >100 | | – | | 2 | | >100 | | | 100 | | 1 | | >100 | | | >100 | |
| Wellbutrin | 4 | | (29 | ) | | (33 | ) | 5 | | (8 | ) | (29 | ) | 2 | | (78 | ) | | (67 | ) | 4 | | (28 | ) | | (33 | ) |
| Wellbutrin IR, SR | 4 | | (34 | ) | | (33 | ) | 4 | | (18 | ) | (43 | ) | 1 | | (86 | ) | | (83 | ) | 4 | | (36 | ) | | (33 | ) |
| Wellbutrin XL | – | | – | | | – | | 1 | | >(100 | ) | – | | 1 | | – | | | – | | – | | – | | | – | |
| Imigran/Imitrex | 12 | | (2 | ) | | (14 | ) | 12 | | (2 | ) | (8 | ) | 13 | | (16 | ) | | (13 | ) | 11 | | – | | | – | |
| Lamictal | 11 | | 14 | | | – | | 12 | | 12 | | 9 | | 11 | | 10 | | | – | | 11 | | 11 | | | 10 | |
| Requip | 2 | | 23 | | | – | | 2 | | 43 | | 100 | | 2 | | 39 | | | 100 | | 1 | | 35 | | | – | |
|
|
|
|
|
|
|
|
|
|
|
|
|
|
|
|
|
|
|
|
|
|
|
|
|
|
|
|
| Anti-virals | 126 | | 7 | | | 5 | | 120 | | 10 | | 1 | | 116 | | 5 | | | (1 | ) | 108 | | 5 | | | – | |
| HIV | 43 | | 13 | | | 8 | | 42 | | 11 | | 2 | | 36 | | (4 | ) | | (10 | ) | 36 | | 12 | | | 6 | |
| Combivir | 17 | | 3 | | | – | | 17 | | – | | (11 | ) | 16 | | (13 | ) | | (11 | ) | 15 | | 8 | | | (6 | ) |
| Trizivir | 5 | | 12 | | | 25 | | 2 | | (2 | ) | (33 | ) | 4 | | 5 | | | – | | 4 | | 52 | | | 33 | |
| Epivir | 11 | | 31 | | | 10 | | 11 | | 11 | | 10 | | 9 | | 1 | | | (10 | ) | 9 | | 15 | | | 13 | |
| Ziagen | 5 | | 18 | | | – | | 8 | | 54 | | 33 | | 4 | | 13 | | | (20 | ) | 5 | | 14 | | | 25 | |
| Retrovir | 3 | | 16 | | | – | | 2 | | 4 | | – | | 3 | | (8 | ) | | – | | 2 | | (1 | ) | | – | |
| Agenerase,Lexiva | 2 | | (10 | ) | | 100 | | 2 | | >100 | | 100 | | – | | – | | | – | | 1 | | (19 | ) | | – | |
| Herpes | 53 | | 5 | | | – | | 49 | | 2 | | – | | 50 | | 4 | | | (2 | ) | 48 | | 13 | | | 12 | |
| Valtrex | 31 | | 18 | | | 11 | | 29 | | 19 | | 16 | | 27 | | 15 | | | 13 | | 25 | | 27 | | | 25 | |
| Zovirax | 22 | | (9 | ) | | (12 | ) | 20 | | (15 | ) | (17 | ) | 23 | | (7 | ) | | (15 | ) | 23 | | 1 | | | – | |
| Zeffix | 25 | | (4 | ) | | (4 | ) | 24 | | 7 | | (8 | ) | 26 | | 10 | | | 4 | | 22 | | (1 | ) | | (12 | ) |
|
|
|
|
|
|
|
|
|
|
|
|
|
|
|
|
|
|
|
|
|
|
|
|
|
|
|
|
| Anti-bacterials | 127 | | (3 | ) | | (7 | ) | 128 | | (1 | ) | (9 | ) | 128 | | 3 | | | (4 | ) | 121 | | 4 | | | (2 | ) |
| Augmentin | 42 | | (6 | ) | | (13 | ) | 51 | | 14 | | 9 | | 50 | | 19 | | | 11 | | 44 | | 10 | | | 7 | |
| Augmentin IR | 40 | | (5 | ) | | (15 | ) | 49 | | 12 | | 7 | | 49 | | 17 | | | 9 | | 43 | | 7 | | | 5 | |
| Augmentin ES | 2 | | (12 | ) | | 100 | | 1 | | >100 | | – | | 1 | | >100 | | | >100 | | 1 | | >100 | | | >100 | |
| Augmentin XR | – | | – | | | – | | 1 | | >100 | | – | | – | | – | | | – | | – | | – | | | – | |
| Zinnat/Ceftin | 20 | | (3 | ) | | (9 | ) | 19 | | (24 | ) | (30 | ) | 19 | | (8 | ) | | (14 | ) | 18 | | 10 | | | (5 | ) |
|
|
|
|
|
|
|
|
|
|
|
|
|
|
|
|
|
|
|
|
|
|
|
|
|
|
|
|
| Metabolic | 69 | | 23 | | | 19 | | 68 | | 35 | | 28 | | 75 | | 53 | | | 42 | | 54 | | 29 | | | 23 | |
| Avandia, Avandamet | 40 | | 40 | | | 33 | | 41 | | 73 | | 64 | | 49 | | 90 | | | 75 | | 31 | | 43 | | | 35 | |
|
|
|
|
|
|
|
|
|
|
|
|
|
|
|
|
|
|
|
|
|
|
|
|
|
|
|
|
| Vaccines | 115 | | 24 | | | 20 | | 111 | | 40 | | 35 | | 95 | | 19 | | | 12 | | 84 | | 1 | | | – | |
| Hepatitis | 19 | | 21 | | | 27 | | 16 | | (5 | ) | (11 | ) | 19 | | 16 | | | 12 | | 17 | | 3 | | | (6 | ) |
| Infanrix/Pediarix | 12 | | 14 | | | (8 | ) | 21 | | 47 | | 50 | | 16 | | (16 | ) | | (24 | ) | 17 | | – | | | – | |
|
|
|
|
|
|
|
|
|
|
|
|
|
|
|
|
|
|
|
|
|
|
|
|
|
|
|
|
| Oncology and emesis | 22 | | 2 | | | (4 | ) | 22 | | (11 | ) | (19 | ) | 21 | | (2 | ) | | (9 | ) | 20 | | (9 | ) | | (9 | ) |
| Zofran | 18 | | 1 | | | (5 | ) | 17 | | (9 | ) | (11 | ) | 17 | | 2 | | | (11 | ) | 16 | | (1 | ) | | – | |
| Hycamtin | 1 | | (9 | ) | | – | | 2 | | 15 | | – | | 2 | | (15 | ) | | 100 | | 1 | | (51 | ) | | (67 | ) |
|
|
|
|
|
|
|
|
|
|
|
|
|
|
|
|
|
|
|
|
|
|
|
|
|
|
|
|
| Cardiovascular and urogenital | 33 | | 22 | | | 18 | | 27 | | 15 | | 4 | | 26 | | 9 | | | – | | 22 | | 15 | | | 10 | |
| Coreg | 1 | | (52 | ) | | (75 | ) | 2 | | (53 | ) | (60 | ) | 1 | | (47 | ) | | (67 | ) | 3 | | (18 | ) | | – | |
| Levitra | 1 | | 40 | | | – | | 3 | | 47 | | 50 | | 3 | | >100 | | | >100 | | 1 | | – | | | – | |
| Avodart | 2 | | >100 | | | – | | – | | – | | – | | 1 | | >100 | | | – | | – | | – | | | – | |
|
|
|
|
|
|
|
|
|
|
|
|
|
|
|
|
|
|
|
|
|
|
|
|
|
|
|
|
| Other | 164 | | – | | | (6 | ) | 143 | | (15 | ) | (21 | ) | 151 | | (15 | ) | | (20 | ) | 159 | | (1 | ) | | (8 | ) |
| Zantac | 36 | | (8 | ) | | (8 | ) | 32 | | (14 | ) | (20 | ) | 32 | | (21 | ) | | (26 | ) | 31 | | (7 | ) | | (11 | ) |
|
|
|
|
|
|
|
|
|
|
|
|
|
|
|
|
|
|
|
|
|
|
|
|
|
|
|
|
| Total | 976 | | 5 | | | 1 | | 885 | | 3 | | (4 | ) | 891 | | 3 | | | (4 | ) | 841 | | 3 | | | (1 | ) |
|
|
|
|
|
|
|
|
|
|
|
|
|
|
|
|
|
|
|
|
|
|
|
|
|
|
|
|
Pharmaceutical turnover includes co-promotion income.
Back to Contents
| 160 | GlaxoSmithKline Financial record |
Five year record
A record of financial performance is provided analysed in accordance with current reporting practice.
| Turnover by business segment | | 2004 | | 2003 | | 2002 | | 2001 | | 2000 | |
| | £m | | £m | | £m | | £m | | £m | |
|
|
|
|
|
|
|
|
|
|
| |
| Pharmaceuticals | | 17,146 | | 18,181 | | 17,995 | | 17,205 | | 15,429 | |
| Consumer Healthcare | | 3,213 | | 3,260 | | 3,217 | | 3,284 | | 2,650 | |
|
|
|
|
|
|
|
|
|
|
| |
| | | 20,359 | | 21,441 | | 21,212 | | 20,489 | | 18,079 | |
|
|
|
|
|
|
|
|
|
|
| |
| | | | | | | | | | | | |
| Pharmaceutical turnover by therapeutic area | | | | | | | | | | | |
|
|
|
|
|
|
|
|
|
|
| |
| Central nervous system | | 3,463 | | 4,455 | | 4,511 | | 4,007 | | 3,279 | |
| Respiratory | | 4,415 | | 4,417 | | 3,987 | | 3,537 | | 2,789 | |
| Anti-bacterials | | 1,561 | | 1,815 | | 2,210 | | 2,604 | | 2,472 | |
| Anti-virals | | 2,360 | | 2,349 | | 2,299 | | 2,128 | | 1,899 | |
| Metabolic | | 1,253 | | 1,079 | | 960 | | 875 | | 589 | |
| Vaccines | | 1,196 | | 1,123 | | 1,080 | | 948 | | 842 | |
| Oncology and emesis | | 934 | | 1,001 | | 977 | | 838 | | 710 | |
| Cardiovascular and urogenital | | 933 | | 771 | | 661 | | 591 | | 463 | |
| Others | | 1,031 | | 1,171 | | 1,310 | | 1,677 | | 1,939 | |
|
|
|
|
|
|
|
|
|
|
| |
| Continuing business | | 17,146 | | 18,181 | | 17,995 | | 17,205 | | 14,982 | |
|
|
|
|
|
|
|
|
|
|
| |
| Divested products | | – | | – | | – | | – | | 447 | |
|
|
|
|
|
|
|
|
|
|
| |
| | | 17,146 | | 18,181 | | 17,995 | | 17,205 | | 15,429 | |
|
|
|
|
|
|
|
|
|
|
| |
| | | | | | | | | | | | |
| Pharmaceutical turnover by geographic area | | | | | | | | | | | |
|
|
|
|
|
|
|
|
|
|
| |
| USA | | 8,425 | | 9,410 | | 9,797 | | 9,037 | | 7,705 | |
| Europe | | 5,128 | | 5,114 | | 4,701 | | 4,561 | | 4,268 | |
| International: | | | | | | | | | | | |
| Asia Pacific | | 1,162 | | 1,140 | | 1,100 | | 1,047 | | 975 | |
| Japan | | 770 | | 753 | | 712 | | 741 | | 832 | |
| Latin America | | 581 | | 597 | | 606 | | 790 | | 682 | |
| Middle East, Africa | | 669 | | 693 | | 652 | | 611 | | 585 | |
| Canada | | 411 | | 474 | | 427 | | 418 | | 382 | |
|
|
|
|
|
|
|
|
|
|
| |
| International | | 3,593 | | 3,657 | | 3,497 | | 3,607 | | 3,456 | |
|
|
|
|
|
|
|
|
|
|
| |
| | | 17,146 | | 18,181 | | 17,995 | | 17,205 | | 15,429 | |
|
|
|
|
|
|
|
|
|
|
| |
| Pharmaceutical turnover in 2004 and 2003 includes co-promotion income. | | | | | | | | | | | |
| | | | | | | | | | | | |
| Consumer Healthcare sales | | | | | | | | | | | |
|
|
|
|
|
|
|
|
|
|
| |
| OTC medicines | | 1,489 | | 1,556 | | 1,586 | | 1,603 | | 1,454 | |
| Oral care | | 1,088 | | 1,082 | | 1,052 | | 1,106 | | 642 | |
| Nutritional healthcare | | 636 | | 622 | | 579 | | 575 | | 535 | |
|
|
|
|
|
|
|
|
|
|
| |
| Continuing business | | 3,213 | | 3,260 | | 3,217 | | 3,284 | | 2,631 | |
|
|
|
|
|
|
|
|
|
|
| |
| Divested products | | – | | – | | – | | – | | 19 | |
|
|
|
|
|
|
|
|
|
|
| |
| | | 3,213 | | 3,260 | | 3,217 | | 3,284 | | 2,650 | |
|
|
|
|
|
|
|
|
|
|
| |
Back to Contents
| Financial record GlaxoSmithKline | 161 |
| Statutory results | | | | 2003 | | 2002 | | 2001 | | 2000 | |
| | 2004 | | (restated) | | (restated) | | (restated) | | (restated) | |
| | £m | | £m | | £m | | £m | | £m | |
|
|
|
|
|
|
|
|
|
|
| |
| Turnover | | 20,359 | | 21,441 | | 21,212 | | 20,489 | | 18,079 | |
| Operating profit | | 6,090 | | 6,376 | | 5,569 | | 4,701 | | 4,836 | |
| Profit before taxation | | 6,119 | | 6,313 | | 5,524 | | 4,484 | | 6,136 | |
| Earnings (profit attributable to shareholders) | | 4,302 | | 4,478 | | 3,930 | | 3,027 | | 4,204 | |
| Dividends | | (2,402 | ) | (2,374 | ) | (2,346 | ) | (2,356 | ) | (2,097 | ) |
| Retained profit | | 1,900 | | 2,104 | | 1,584 | | 671 | | 2,107 | |
| Basic earnings per share (p) | | 75.0 | | 77.1 | | 66.5 | | 49.9 | | 69.3 | |
| Diluted earnings per share | | 74.8 | | 76.9 | | 66.3 | | 49.5 | | 68.5 | |
| Weighted average number of shares in issues: | | | | | | | | | | | |
| Basic | | 5,736 | | 5,806 | | 5,912 | | 6,064 | | 6,065 | |
| Diluted | | 5,748 | | 5,824 | | 5,934 | | 6,116 | | 6,134 | |
|
|
|
|
|
|
|
|
|
|
| |
| | | | | | | | | | | | |
| Return on capital employed (per cent) | | 101.9 | | 120.8 | | 110.6 | | 75.6 | | 94.0 | |
|
|
|
|
|
|
|
|
|
|
| |
| Return on capital employed is calculated as statutory profit before taxation as a percentage of average capital employed over the year. | |
| | | | | | | | | | | | |
| Merger, restructuring and disposal of subsidiaries | | | | | | | | | | | |
|
|
|
|
|
|
|
|
|
|
| |
| Manufacturing and other restructuring | | – | | (83 | ) | (121 | ) | (162 | ) | (171 | ) |
| Merger costs and product divestments | | – | | (286 | ) | (840 | ) | (1,069 | ) | 895 | |
| Other items | | – | | (21 | ) | (50 | ) | (421 | ) | (22 | ) |
|
|
|
|
|
|
|
|
|
|
| |
| (Loss)/profit before taxation | | – | | (390 | ) | (1,011 | ) | (1,652 | ) | 702 | |
| (Loss)/profit attributable to shareholders | | – | | (281 | ) | (712 | ) | (1,330 | ) | 452 | |
|
|
|
|
|
|
|
|
|
|
| |
| | | | | | | | | | | | |
| Business performance results | | | | | | | | | | | |
|
|
|
|
|
|
|
|
|
|
| |
| Turnover | | 20,359 | | 21,441 | | 21,212 | | 20,489 | | 18,079 | |
| | | | | | | | | | | | |
| R&D expenditure | | 2,839 | | 2,770 | | 2,732 | | 2,555 | | 2,510 | |
| per cent of sales | | 14% | | 13% | | 13% | | 12% | | 14% | |
| | | | | | | | | | | | |
| Trading profit | | 6,150 | | 6,904 | | 6,712 | | 6,041 | | 5,061 | |
| per cent of sales | | 30% | | 32% | | 32% | | 30% | | 28% | |
| | | | | | | | | | | | |
| Net interest payable | | (203 | ) | (161 | ) | (141 | ) | (88 | ) | (182 | ) |
| Profit before taxation | | 6,119 | | 6,703 | | 6,535 | | 6,157 | | 5,362 | |
| Adjusted earnings (profit attributable to shareholders) | | 4,302 | | 4,759 | | 4,642 | | 4,371 | | 3,686 | |
|
|
|
|
|
|
|
|
|
|
| |
During the years 2000 to 2003, business performance was the primary performance measure used by management and was presented after excluding merger items, integration and restructuring costs and disposals of business. Management believes that exclusion of these items provides a better comparison of the way in which the business was managed and gives an indication of the performance of the Group in terms of those elements of revenue and expenditure which local management was able to influence. This information, which is provided in addition to the statutory results prepared under UK GAAP, is given to assist shareholders to gain a clearer understanding of the underlying performance of the business and to increase comparability for the periods presented. Statutory results include these items. For 2004, with the completion of these programmes, the Group is reporting results on a statutory basis only.
| Amounts in accordance with US GAAP | | 2004 | | 2003 | | 2002 | | 2001 | | 2000 | |
| | £m | | £m | | £m | | £m | | £m | |
|
|
|
|
|
|
|
|
|
|
| |
| Turnover | | 19,986 | | 21,117 | | 21,212 | | 20,489 | | 9,559 | |
| Net income/(loss) | | 2,732 | | 2,420 | | 413 | | (143 | ) | (5,228 | ) |
| Basic net income/(loss) per share (pence) | | 47.6 | | 41.7 | p | 7.0 | p | (2.4 | )p | (145.6 | )p |
| Diluted net income/(loss) per share (pence) | | 47.5 | | 41.6 | p | 7.0 | p | (2.4 | )p | (145.6 | )p |
|
|
|
|
|
|
|
|
|
|
| |
| | | | | | | | | | | | |
| The information below presents US GAAP net income/(loss) and net income/(loss) per share as if the results for the years ended 31st December 2000 and 2001 were adjusted to reverse the amortisation expense for goodwill and indefinite-lived intangible assets, that is, as if SFAS 142 had also applied in those years. |
|
|
|
|
|
|
|
|
|
|
| |
| Adjusted net income/(loss) | | | | | | | | 1,456 | | (4,658 | ) |
| Adjusted basic net income/(loss) per share (pence) | | | | | | | | 24.0 | p | (129.7 | )p |
| Adjusted diluted net income/(loss) per share (pence) | | | | | | | | 23.8 | p | (129.7 | )p |
|
|
|
|
|
|
|
|
|
|
| |
Back to Contents
| 162 | GlaxoSmithKline Financial record |
| Balance sheet | | | | | | | | | | | |
| | | | | 2003 | | 2002 | | 2001 | | 2000 | |
| Net assets | | 2004 | | (restated) | | (restated) | | (restated) | | (restated) | |
| | £m | | £m | | £m | | £m | | £m | |
|
|
|
|
|
|
|
|
|
|
| |
| Fixed assets | | 8,945 | | 8,575 | | 8,752 | | 8,984 | | 8,005 | |
| Other assets and liabilities | | (759 | ) | (1,123 | ) | (1,770 | ) | (1,538 | ) | (881 | ) |
|
|
|
|
|
|
|
|
|
|
| |
| Net operating assets | | 8,186 | | 7,452 | | 6,982 | | 7,446 | | 7,124 | |
| Net debt | | (1,984 | ) | (1,648 | ) | (2,335 | ) | (2,101 | ) | (611 | ) |
|
|
|
|
|
|
|
|
|
|
| |
| Net assets | | 6,202 | | 5,804 | | 4,647 | | 5,345 | | 6,513 | |
|
|
|
|
|
|
|
|
|
|
| |
| | | | | | | | | | | | |
| Capital employed | | | | | | | | | | | |
|
|
|
|
|
|
|
|
|
|
| |
| Share capital and share premium | | 1,788 | | 1,751 | | 1,730 | | 1,713 | | 1,586 | |
| Other reserves | | 4,137 | | 3,308 | | 2,110 | | 2,770 | | 3,683 | |
|
|
|
|
|
|
|
|
|
|
| |
| Equity shareholders’ funds | | 5,925 | | 5,059 | | 3,840 | | 4,483 | | 5,269 | |
| Minority interests | | 277 | | 745 | | 807 | | 862 | | 1,244 | |
|
|
|
|
|
|
|
|
|
|
| |
| | | 6,202 | | 5,804 | | 4,647 | | 5,345 | | 6,513 | |
|
|
|
|
|
|
|
|
|
|
| |
| | | | | | | | | | | | |
| Capital expenditure (tangible fixed assets) | | 993 | | 870 | | 1,027 | | 1,113 | | 1,018 | |
|
|
|
|
|
|
|
|
|
|
| |
| | | | | | | | | | | | |
| | | | | | | | | | | | |
| Amounts in accordance with US GAAP | | 2004 | | 2003 | | 2002 | | 2001 | | 2000 | |
| | £m | | £m | | £m | | £m | | £m | |
|
|
|
|
|
|
|
|
|
|
| |
| Total assets | | 55,841 | | 56,400 | | 57,671 | | 61,341 | | 65,786 | |
| Net assets | | 34,429 | | 34,861 | | 35,729 | | 40,969 | | 46,239 | |
| Shareholders’ equity | | 34,042 | | 34,116 | | 34,922 | | 40,107 | | 44,995 | |
|
|
|
|
|
|
|
|
|
|
| |
| | | | | | | | | | | | |
| Number of employees | | | | | | | | | | | |
| | 2004 | | 2003 | | 2002 | | 2001 | | 2000 | |
|
|
|
|
|
|
|
|
|
|
| |
| USA | | 23,782 | | 24,036 | | 23,527 | | 23,613 | | 22,745 | |
| Europe | | 44,679 | | 44,559 | | 46,028 | | 46,508 | | 45,929 | |
| International: | | | | | | | | | | | |
| Asia Pacific | | 16,109 | | 18,373 | | 17,289 | | 18,364 | | 19,058 | |
| Japan | | 2,965 | | 2,842 | | 2,952 | | 2,985 | | 3,165 | |
| Latin America | | 5,603 | | 5,916 | | 6,876 | | 7,800 | | 7,704 | |
| Middle East, Africa | | 5,134 | | 3,400 | | 5,973 | | 6,344 | | 7,133 | |
| Canada | | 1,747 | | 1,793 | | 1,854 | | 1,856 | | 1,783 | |
|
|
|
|
|
|
|
|
|
|
| |
| International | | 31,558 | | 32,324 | | 34,944 | | 37,349 | | 38,843 | |
|
|
|
|
|
|
|
|
|
|
| |
| | | 100,019 | | 100,919 | | 104,499 | | 107,470 | | 107,517 | |
|
|
|
|
|
|
|
|
|
|
| |
| | | | | | | | | | | | |
| Manufacturing | | 31,143 | | 32,459 | | 35,503 | | 36,849 | | 35,681 | |
| Selling | | 44,646 | | 43,978 | | 43,994 | | 44,499 | | 43,325 | |
| Administration | | 9,193 | | 9,550 | | 10,378 | | 11,081 | | 11,980 | |
| Research and development | | 15,037 | | 14,932 | | 14,624 | | 15,041 | | 16,531 | |
|
|
|
|
|
|
|
|
|
|
| |
| | | 100,019 | | 100,919 | | 104,499 | | 107,470 | | 107,517 | |
|
|
|
|
|
|
|
|
|
|
| |
The number of employees is the number of permanent employed staff at the end of the financial period. It excludes those employees who are employed and managed by GlaxoSmithKline on a contract basis.
Exchange rates
As a guide to holders of ADRs, the following tables set out, for the periods indicated, information on the exchange rate of US dollars for sterling as reported by the Federal Reserve Bank of New York (‘noon buying rate’).
| Average | | | | 1.84 | | 1.63 | | 1.51 | | 1.44 | | 1.51 | |
|
|
|
|
|
|
|
|
|
|
|
|
| |
| The average rate for the year is calculated as the average of the noon buying rates on the last day of each month during the year. |
| | | | | | | | | | | | | | |
| | | Feb | | Jan | | Dec | | Nov | | Oct | | Sept | |
| | | 2005 | | 2005 | | 2004 | | 2004 | | 2004 | | 2004 | |
|
|
|
|
|
|
|
|
|
|
|
|
| |
| | | | | | | | | | | | | | |
| High | | 1.91 | | 1.91 | | 1.95 | | 1.91 | | 1.84 | | 1.81 | |
| Low | | 1.86 | | 1.86 | | 1.91 | | 1.83 | | 1.78 | | 1.77 | |
|
|
|
|
|
|
|
|
|
|
|
|
| |
| | | | | | | | | | | | | | |
| The noon buying rate on 25th February 2005 was £1= US$1.91. |
Back to Contents
Financial information under International Financial Reporting Standards (IFRS)
Background
The IFRS project
In June 2002, the Council of the European Union adopted a Regulation requiring listed companies in its Member States to prepare their consolidated financial statements in accordance with International Financial Reporting Standards (IFRS) from 2005. The first GlaxoSmithKline Annual Report prepared under IFRS will be that for the year ending 31st December 2005. The first financial results announcement prepared in accordance with IFRS will be that for the first quarter of 2005.
The Group’s project to convert its financial reporting from UK GAAP to IFRS has now been completed, subject to any changes in standards and pronouncements. A training programme has been rolled out to all finance staff worldwide and the adjusted historical data, which will provide the comparative information under IFRS in 2005, has been prepared.
The unaudited consolidated results of GlaxoSmithKline plc converted from the current UK GAAP basis onto an IFRS basis for 2003 and 2004 are presented on pages 170 to 173. As 2003 will be the earliest year for which full IFRS financial statements will be presented in the Annual Report 2005, the transition date to IFRS for GlaxoSmithKline is 1st January 2003. Normally accounting changes of this nature would require full retrospective application, but under the IFRS transitional rules, certain adjustments only have to be applied with effect from the transition date of 1st January 2003.
Basis of preparation of data
The IFRS financial information has been prepared on the basis of all IFRS and Standing Interpretations Committee (SIC) and International Financial Reporting Interpretations Committee (IFRIC) interpretations issued by the IASB effective for 2005 reporting.
GlaxoSmithKline has chosen to adopt the IASB’s amendments to IAS 19, Employee Benefits, early. This permits actuarial gains and losses, differences between the expected and actual returns and the effect of changes in actuarial assumptions to be recognised in the Statement of recognised income and expense.
The financial information presented under IFRS is unaudited.
IFRS 1 exemptions
IFRS 1, First-Time Adoption of International Financial Reporting Standards, permits those companies adopting IFRS for the first time to take some exemptions from the full requirements of IFRS in the transition period. GlaxoSmithKline intends to take the following key exemptions:
| • | Business combinations: Business combinations prior to the transition date (1st January 2003) have not been restated onto an IFRS basis |
| | |
| • | Employee benefits: All cumulative actuarial gains and losses have been recognised in equity at the transition date |
| | |
| • | Share-based payments: IFRS 2, Share-based Payment, applies to equity instruments, such as share options granted since 7th November 2002, but GlaxoSmithKline has elected to adopt full retrospective application of the standard |
| • | Financial instruments: Financial instruments in the comparative periods to be presented in the Annual Report 2005 (i.e. 2004 and 2003) are recorded on the existing UK GAAP basis, rather than in accordance with IAS 32 ‘Financial Instruments: Disclosure and Presentation’ and IAS 39 ‘Financial Instruments: Recognition and Measurement’ (see below). |
The IFRS financial information has been prepared on the basis of taking these exemptions.
Financial instruments
GlaxoSmithKline intends to adopt IAS 39 in full. However, one of the exemptions available under IFRS 1 relaxes the requirement for comparative information presented in the Annual Report 2005 to comply with IAS 32 and IAS 39. GlaxoSmithKline intends to take advantage of this exemption, and so, in 2003 and 2004, financial instruments will be accounted for and presented on a UK GAAP basis.
On 1st January 2005 there was an adjustment to the opening balance sheet to reflect the movements from the UK GAAP carrying values to the IAS 32 and IAS 39 values, which for many financial instruments will be fair value.
The financial instruments concerned are:
| • | Held at fair value under IFRS with movements recorded in equity:instruments |
| | – | Equity investments |
| | – | Liquid investments |
| | – | Derivatives classified as cash flow hedging |
| | | |
| • | Held at fair value under IFRS with movements recorded in the income statement: |
| | – | Equity collar linked to the Group’s investment in Quest Diagnostics Inc. |
| | – | Put and call options linked to the Group’s strategic alliance with Theravance Inc. |
| | – | Other derivatives not classified as hedging instruments, including embedded derivatives |
| | – | Derivatives classified as fair value hedges together with the hedged element of the relevant asset or liability |
| | | |
| • | | Presentation differences only: |
| | – | Non-equity minority interests (repaid during 2004). |
If the IAS 39 valuation rules had been applied in 2004 there would have been a charge to profit before tax, the largest elements of which arise from the Quest collar (£42 million; 2003 – £42 million) and the Theravance put and call options (£53 million; 2003 – nil). Valuations are inherently unpredictable and changes in the fair values of financial instruments could have a material impact on the future results and financial position of GlaxoSmithKline.
Back to Contents
| 164 | GlaxoSmithKline Financial information under IFRS |
IFRS accounting policies
The following IFRS accounting policies are expected to be applied by GlaxoSmithKline plc in its consolidated financial statements for 2005.
Consolidation
The consolidated Financial statements include:
| • | the assets and liabilities, and the results and cash flows, of the company and its subsidiaries, including ESOP Trusts; |
| | |
| • | the Group’s share of the net assets and results of joint ventures and associates. |
The Financial statements of undertakings consolidated are made up to 31st December.
Entities over which the Group has the ability to exercise control are accounted for as subsidiaries; where the Group has the ability to exercise joint control, they are accounted for as joint ventures, and where the Group has the ability to exercise significant influence, they are accounted for as associates.
Interests acquired in entities are consolidated from the effective date of acquisition and interests sold are consolidated up to the date of disposal.
Transactions and balances between subsidiaries are eliminated; no profit is taken on sales between subsidiaries or on sales to joint ventures and associates until the products are sold to customers outside the Group. Deferred tax relief on unrealised intra-Group profit is accounted for only to the extent that it is considered recoverable.
Goodwill arising on the acquisition of interests in subsidiaries, joint ventures and associates, representing the excess of the purchase consideration over the Group’s share of the fair values of the identifiable assets, liabilities and contingent liabilities acquired, is capitalised as a separate item in the case of subsidiaries and as part of the cost of investment in the case of joint ventures and associates. Goodwill is denominated in the currency of the operation acquired. In the case of acquisitions prior to 1998, goodwill was written off directly to equity; on a subsequent disposal of assets from such acquisitions, any related goodwill remains in equity and is not charged to the consolidated income statement.
The results and assets and liabilities of associates and joint ventures are incorporated into the consolidated financial statements using the equity method of accounting.
Assets and liabilities of overseas subsidiaries, associates and joint ventures including related goodwill, are translated into sterling at rates of exchange ruling at the balance sheet date. The results and cash flows of overseas subsidiaries, associates and joint ventures are translated into sterling using average rates of exchange. Exchange adjustments arising when the opening net assets and the profits for the year retained by overseas subsidiaries, associates and joint ventures are translated into sterling, less exchange differences arising on related foreign currency borrowings which hedge the Group’s net investment in these operations, are taken to a separate component of equity.
When translating into sterling the assets, liabilities, results and cash flows of overseas subsidiaries, associates and joint ventures which are reported in currencies of hyper-inflationary economies, adjustments are made to reflect current price levels. Any loss on net monetary assets is charged to the consolidated income statement.
Foreign currency transactions
Foreign currency transactions by Group companies are booked in local currency at the exchange rate ruling on the date of transaction. Foreign currency assets and liabilities are retranslated into local currency at rates of exchange ruling at the balance sheet date. Exchange differences are included in the income statement.
Revenue
Revenue is recognised in the income statement when goods or services are supplied or made available to external customers against orders received and when title and risk of loss passes to the customer. Turnover represents net invoice value after the deduction of discounts and allowances given and accruals for estimated future rebates and returns. The methodology and assumptions used to estimate rebates and returns are monitored and adjusted regularly in the light of contractual and historical information and past experience. Turnover also includes co-promotion income where the Group records its share of the revenue but no related cost of sales. Value added tax and other sales taxes are excluded from revenue.
Expenditure
Expenditure is recognised in respect of goods and services received when supplied in accordance with contractual terms. Provision is made when an obligation exists for a future liability in respect of a past event and where the amount of the obligation can be reliably estimated. Advertising and promotion expenditure is charged to the income statement as incurred. Shipment costs on intercompany transfers are charged to cost of sales; distribution costs on sales to customers are included in selling, general and administrative expenditure. Restructuring costs are recognised in respect of the direct expenditures of a business reorganisation where the plans are sufficiently detailed and well advanced, and where appropriate communication to those affected has been undertaken at the balance sheet date.
Research and development
Research and development expenditure is charged to the income statement in the period in which it is incurred. Development expenditure is capitalised when the criteria for recognising an asset are met, usually at the point of regulatory filing in a major market. Property, plant and equipment used for research and development is depreciated in accordance with the Group’s policy.
Environmental expenditure
Environmental expenditure related to existing conditions resulting from past or current operations and from which no current or future benefit is discernible is charged to the income statement. The Group recognises its liability on a site-by-site basis when it can be reliably estimated. This liability includes the Group’s portion of the total costs and also a portion of other potentially responsible parties’ costs when it is probable that they will not be able to satisfy their respective shares of the clean-up obligation. Recoveries of reimbursements are recorded as assets when virtually certain.
Back to Contents
Financial information under IFRS GlaxoSmithKline | 165 |
IFRS accounting policies continued
Pensions and other post-employment benefits
The costs of providing pensions under defined benefit schemes are calculated using the projected unit credit method and spread over the period during which benefit is expected to be derived from the employees’ services, in accordance with the advice of qualified actuaries. Pension obligations are measured as the present value of estimated future cash flows discounted at rates reflecting the yields of high quality corporate bonds. Pension scheme assets are measured at fair value at the balance sheet date. Actuarial gains and losses, differences between the expected and actual returns, and the effect of changes in actuarial assumptions are recognised in the Statement of recognised income and expense in the year they arise.
The Group’s contributions to defined contribution plans are charged to the income statement as incurred.
The costs of other post-employment liabilities are calculated in a similar way to defined benefit pension schemes and spread over the period during which benefit is expected to be derived from the employees’ services, in accordance with the advice of qualified actuaries.
Legal and other disputes
Provision is made for anticipated settlement costs where a reasonable estimate can be made of the likely outcome of legal or other disputes against the Group. In addition provision is made for legal or other expenses arising from claims received or other disputes. In respect of product liability claims related to products where there is sufficient history of claims made and settlements, an “incurred but not reported” (IBNR) actuarial technique is used to determine a reasonable estimate of the Group’s exposure to unasserted claims for those products and a provision is made on that basis. No provision is made for other unasserted claims or where an obligation exists under a dispute but it is not possible to make a reasonable estimate. Costs associated with claims made by the Group against third parties are charged to the income statement as they are incurred.
Employee share plans
Incentives in the form of shares are provided to employees under share option and share award schemes. These options and awards are fair valued at their grant dates and the cost is charged to the income statement over the relevant vesting periods.
The Group provides finance to ESOP Trusts to purchase company shares on the open market to meet the obligation to provide shares when employees exercise their options or awards. Costs of running the ESOP Trusts are charged to the income statement. Shares held by the ESOP Trusts are deducted from other reserves and held at the value of the proceeds receivable from employees on exercise. If there is deemed to be a permanent impairment in value this is reflected by a transfer to retained earnings.
Property, plant and equipment
Property, plant and equipment (PP&E) is stated at the cost of purchase or construction less provisions for depreciation and impairment. Financing costs are not capitalised.
Depreciation is calculated to write off the cost of PP&E, excluding freehold land, using the straight-line basis over its expected useful life. The normal expected useful lives of the major categories of PP&E are reviewed annually and are:
|
|
| Freehold buildings | 20 to 50 years |
| Leasehold land and | Lease term or 20 to 50 years |
| buildings | |
| Plant and machinery | 10 to 20 years |
| Fixtures and equipment | 3 to 10 years |
|
|
On disposal of PP&E, the cost and related accumulated depreciation and impairments are removed from the financial statements and the net amount, less any proceeds, is taken to the income statement.
Leases
Leasing agreements which transfer to the Group substantially all the benefits and risks of ownership of an asset are treated as finance leases, as if the asset had been purchased outright. The assets are included in PP&E or computer software and the capital elements of the leasing commitments are shown as obligations under finance leases. Assets held under finance leases are depreciated on a basis consistent with similar owned assets or the lease term if shorter. The interest element of the lease rental is included in the income statement. All other leases are operating leases and the annual rentals are included in the income statement on a straight-line basis over the lease term.
Goodwill
Goodwill is stated at cost less impairments. Goodwill is deemed to have an indefinite useful life and is tested for impairment annually.
Where the fair value of the interest acquired in an entity’s assets, liabilities and contingent liabilities exceeds the consideration paid, this excess is recognised immediately as a gain in the income statement.
Back to Contents
166 | GlaxoSmithKline Financial information under IFRS |
IFRS accounting policies continued
Intangible fixed assets
Intangible assets are stated at cost less provisions for amortisation and impairments.
Licences, patents, know-how and marketing rights separately acquired or acquired as part of a business combination are amortised over their estimated useful lives from the time they are available for use. The estimated useful lives for determining the amortisation charge are reviewed annually, and take into account the estimated time it takes to bring the compounds or products to market. Any development costs incurred by the Group and associated with acquired licences, patents, know-how or marketing rights are written off to the income statement when incurred, unless the criteria for recognition of an internally generated intangible asset are met.
Brands are valued independently as part of the fair value of businesses acquired from third parties where the brand has a value which is substantial and long-term and where the brands can be sold separately from the rest of the businesses acquired. Brands are amortised over their estimated useful lives, except where it is considered that the useful economic life is indefinite.
Prior to 1998, acquired minor brands and similar intangibles were eliminated in the Group balance sheet against reserves in the year of acquisition.
The costs of acquiring and developing computer software for internal use and internet sites for external use are capitalised as intangible fixed assets where the software or site supports a significant business system and the expenditure leads to the creation of a durable asset. ERP systems software is amortised over seven years and other computer software over three to five years.
Impairment of non-current assets
The carrying values of all non-current assets are reviewed for impairment when there is an indication that the assets might be impaired. Additionally, goodwill, intangible assets with indefinite useful lives and intangible assets which are not yet available for use are tested for impairment annually. Any provision for impairment is charged to the income statement in the year concerned.
Investments in joint ventures and associates
Investments in joint ventures and associates are carried in the consolidated balance sheet at the Group’s share of their net assets at date of acquisition and of their post-acquisition retained profits or losses together with any goodwill arising on the acquisition.
Available-for-sale investments
Available-for-sale investments are initially recorded at cost and then remeasured at subsequent reporting dates to fair value. Unrealised gains and losses on available-for-sale investments are recognised directly in equity. On disposal or impairment of the investments, the gains and losses in equity are recycled into the income statement. Equity investments are recorded in non-current assets unless they are expected to be sold within one year.
Inventories
Inventories are included in the financial statements at the lower of cost (including raw materials, direct labour, other direct costs and related production overheads) and net realisable value. Cost is generally determined on a first in, first out basis.
Taxation
Deferred tax is provided in full, using the liability method, on temporary differences arising between the tax bases of assets and liabilities and their carrying amounts in the financial statements. Deferred tax assets are recognised to the extent that it is probable that future taxable profits will be available against which the temporary differences can be utilised.
Deferred tax is provided on temporary differences arising on investments in subsidiaries, associates and joint ventures, except where the timing of the reversal of the temporary difference can be controlled and it is probable that the temporary difference will not reverse in the foreseeable future.
Deferred tax is provided using rates of tax that have been enacted or substantively enacted by the balance sheet date. Deferred tax liabilities and assets are not discounted.
Derivative financial instruments and hedging activities
Derivative financial instruments are used to manage exposure to market risks from treasury operations. The principal derivative instruments used by GlaxoSmithKline are foreign currency swaps, interest rate swaps and forward foreign exchange contracts. The Group does not hold or issue derivative financial instruments for trading or speculative purposes.
Derivative financial instruments are initially recognised in the balance sheet at cost and then remeasured at subsequent reporting dates to fair value. Hedging derivatives are classified on inception as fair value hedges, cash flow hedges or net investment hedges.
Changes in the fair value of derivatives designated as fair value hedges are recorded in the income statement, with the changes in the fair value of the hedged asset or liability.
Changes in the fair value of derivatives designated as cash flow hedges are recognised in equity. Amounts deferred in equity are transferred to the income statement in line with the hedged forecast transaction.
Hedges of net investments in foreign entities are accounted for in a similar way to cash flow hedges.
Changes in the fair value of any derivative instruments that do not qualify for hedge accounting are recognised immediately in the income statement.
Debt instruments
Unhedged debt instruments are stated at the amount of net proceeds, adjusted to amortise the issue costs of the debt over its term.
Back to Contents
Financial information under IFRS GlaxoSmithKline | 167 |
IFRS adjustments
A summary of the principal differences between UK GAAP and IFRS as they apply to GlaxoSmithKline is set out below and the financial effect is shown on pages 170 to 173.
Customer allowances
This adjustment is a reclassification between turnover and expenses with no profit or cash flow effect. IFRS has no detailed rules in relation to when certain marketing and promotional expenditure should be deducted from turnover rather than recorded as an expense. However, these rules do exist under US GAAP in EITF 01-09, Accounting for Consideration Given by a Vendor to a Customer, which requires most marketing, advertising, and promotion payments made to customers to be deducted from turnover. This has the most significant impact in the Consumer Healthcare business where payments to large retailers for in-store advertising, preferential shelf-space, product listings etc. are commonplace.
GlaxoSmithKline believes that this reflects best practice in revenue recognition and hence, in the absence of detailed guidance under IFRS, has decided to adopt a revenue recognition policy under IFRS in line with EITF 01-09. Therefore going forward there would be no difference between turnover reported under IFRS and turnover reported under US GAAP. This adjustment has no impact on profit before tax or EPS.
Share-based payments
The present UK GAAP approach to share-based payments is to record any intrinsic loss on grant suffered by the company. This means that for share options granted at the market price, there is no charge to the income statement. Where shares or options are granted at no cost to the employee (e.g. under long-term incentive plans) the income statement is charged with an amount equal to the market price on the date of the award, spread over the performance period (usually three years).
IFRS 2, Share-based Payment, and its UK GAAP equivalent FRS 20, Share-based Payment, both of which came into force in 2005, require the fair value of the equity instruments issued to be charged to the income statement. For share awards granted to senior executives, although the calculation is different, the resultant charge is not materially different from that under UK GAAP. The major difference arises in respect of share options; of the £368 million adjustment in 2003, some £350 million arises from the grant of share options at market price to approximately 12,000 employees. GlaxoSmithKline has chosen to recognise all unvested options and awards retrospectively.
GlaxoSmithKline receives a tax credit, as appropriate, which relates to share options and awards when exercised, based on the gains the holders make and dependant on the tax rules in the country in which the deduction is claimed. The deferred tax asset represents an estimate of future tax relief for this gain and is based on the potential gains available to the option or award holders at the balance sheet date. The movement in deferred tax asset from one balance sheet to the next may result in either a tax credit or a tax charge recorded in the income statement.
This adjustment reduces profit before tax in 2004 by £309 million (2003–£368 million), earnings by £314 million (2003–£344 million) and EPS by 5.5 pence (2003–5.9 pence).
The adjustment for share-based payments is expected to reduce to a more normal level of £200-£250 million by 2005. The considerably higher charge in 2004 and 2003 arises from two main factors. Relatively few share options were granted during 2000 when the GW/SB merger was being finalised, but then in 2001 there was a full“catch-up”grant early in the year followed by the normal annual grant in November 2001. In addition, the grants in 2001 were made at an average share price in excess of £18. These share options will become exercisable in 2004 and therefore fall out of the charge in 2005, when the charge will reflect more current share prices and more normal grant levels.
Coreg capitalisation and amortisation
The North American rights toCoregwere acquired at the time of the GW/SB merger as partial consideration for the required disposal of Kytril to Roche. Under UK GAAP this was accounted for as an exchange of assets with no value being attributed toCoregon the balance sheet. IFRS, however, requires the acquired rights toCoregto be added to intangible assets at their fair value on the date of acquisition of $400 million, and then amortised over their remaining useful life of eight years. This adjustment reduces 2004 profit before tax by £27 million (2003–£31 million) and EPS by 0.3 pence (2003–0.3 pence).
Other intangible assets amortisation
Under UK GAAP, GlaxoSmithKline amortises intangible assets over their estimated expected useful lives from acquisition, which can be up to a maximum of 15 years. IFRS only permits amortisation to commence when the asset becomes available for use, with annual impairment testing required before this point. GlaxoSmithKline has determined that the point at which amortisation of product-related assets commences under IFRS will normally be regulatory approval. The majority of GlaxoSmithKline’s intangible assets relates to the acquisition of rights to compounds in development and so has not reached the point at which amortisation commences. This has led to a reduction in the amortisation charge in the periods presented, which is likely to reverse in the future as these compounds reach regulatory approval and amortisation is then charged over a shorter period. Profit before tax in 2004 increases by £43 million (2003–£43 million) and EPS by 0.5 pence (2003–0.5 pence).
Goodwill amortisation
UK GAAP requires goodwill to be amortised over its estimated expected useful life, which GlaxoSmithKline has determined to be normally no longer than 20 years. Under IFRS, however, goodwill is considered to have an indefinite life and so is not amortised, but is subject to annual impairment testing. This adjustment therefore reverses the goodwill amortisation charged under UK GAAP, including that recorded in the profit on share of associates line relating to the acquisition of the Group’s interest in Quest Diagnostics Inc. Under the business combinations exemption of IFRS 1, goodwill previously written off direct to reserves under UK GAAP is not recycled to the income statement on the disposal or part-disposal of the subsidiary or associate, as it would be under UK GAAP. The adjustment increases 2004 profit before tax by £38 million (2003–£26 million) and EPS by 0.7 pence (2003–0.4 pence).
Back to Contents
168 | GlaxoSmithKline Financial information under IFRS |
IFRS adjustments continued
Pensions and other post-employment benefits
GlaxoSmithKline accounts under UK GAAP for pensions and other post-employment benefits (OPEBs) in accordance with SSAP 24, which spreads the costs of providing the benefits over the estimated average service lives of the employees. The additional FRS 17 disclosures give the pension fund surpluses and deficits and the liabilities for OPEBs based on the valuation methodologies required by that Standard.
IAS 19, Employee Benefits, takes a similar valuation approach to FRS 17, and in accordance with the transitional provisions of IFRS 1 the surpluses and deficits have been recognised on the balance sheet at the transition date of 1st January 2003. In addition, following an amendment to IAS 19 issued by the IASB in December 2004, it is permitted to recognise any movements in the surpluses or deficits immediately in balance sheets, but outside the income statement, in a similar way to FRS 17. This means that, in most cases, the balance sheet reflects the full surplus or deficit positions of the funds.
The Group’s policy is to charge out to the operating businesses the service cost element of the pension charge, which then gets reported within cost of sales, selling, general and administrative expenditure or research and development as appropriate, but not to charge out the element related to the funding deficit, which is all reported in Selling, general and administrative expenditure. Under IAS 19, the service cost element of the total charge is considerably higher than under SSAP 24 and the funding deficit element lower. This leads to an additional reclassification adjustment between the income statement expense headings.
In the USA, the recently enacted Medicare Prescription Drug, Improvement and Modernization Act is expected to lead to payments being received by GlaxoSmithKline from the US Government in respect of its employee healthcare plans. At present there is no clear consensus on how these receipts should be accounted for under IAS 19. GlaxoSmithKline has recognised these receipts as actuarial adjustments and so the impact of them is recognised in the balance sheet. This treatment would change if guidance is issued which requires a different accounting treatment.
The overall impact of the adjustments to pensions and OPEBs in 2004 is a decrease in profit before tax of £36 million (2003–increase of £11 million) and a decrease in EPS of 0.4 pence (2003–nil).
Share of profits of associates
Under UK GAAP the share of profits of associates is reported within profit before tax for the Group. However, IFRS requires this share of profits to be the net profit attributable to the Group, i.e. after interest, tax and minority interests of the associate. This leads to a reclassification adjustment removing the share of the associates’interest, tax and minority interests from those lines in the income statement and netting them all together in the share of profits of associates line. This adjustment reduces 2004 profit before tax by £42 million (2003–£42 million) but does not affect EPS.
Deferred tax on intercompany profit
Under UK GAAP, deferred tax on the provision for intercompany profit held in inventory is calculated at the supplying company’s effective tax rate. IFRS, however, takes a balance sheet approach to the recognition of deferred tax which results in the tax rate of the company holding the inventory at the balance sheet date being applied to the provision. If the proportions of the Group’s inventory held in specific locations change significantly from one balance sheet date to the next there could be a significant change in the value of the deferred tax asset, which is reflected through the tax charge for the year.
Other adjustments
There are a number of other minor adjustments and reclassifications, including:
| • | Computer software, which is recorded as an intangible asset unless it forms an integral part of the operating system of a tangible fixed asset |
| • | Deferred tax on brands acquired with a company, where if there is a difference between the fair value of the brands on acquisition and the tax value, a taxable temporary difference arises |
| • | Cash equivalents reclassification, where liquid investments with maturities of less than three months at acquisition are included within cash and cash equivalents, and |
| • | Provisions reclassification, where the elements of provisions expected to be paid within one year of the balance sheet date, with the exception of pensions and OPEBs, are presented within current liabilities. |
Cash flow statement
The move from UK GAAP to IFRS does not change any of the cash flows of the Group. The IFRS cash flow format is similar to UK GAAP but presents various cash flows in different categories and in a different order from the UK GAAP cash flow statement. All of the IFRS accounting adjustments net out within cash generated from operations except for the intangible assets reclassification and the inclusion of liquid investments with a maturity of less than three months on acquisition, together with related exchange adjustments, within cash and cash equivalents under IFRS.
Back to Contents
Financial information under IFRS GlaxoSmithKline | 169 |
| IFRS pharmaceutical turnover – total Group | | | | | | | | | | | | |
| | | | | | | | | | | | | |
| | 12 months 2004 £m | | 12 months 2003 £m | | Q4 2004 £m | | Q3 2004 £m | | Q2 2004 £m | | Q1 2004 £m | |
|
| |
| |
| |
| |
| |
| |
| Respiratory | 4,394 | | 4,390 | | 1,167 | | 1,065 | | 1,080 | | 1,082 | |
| Seretide/Advair, | | | | | | | | | | | | |
| Flixotide/Flovent, Serevent | 3,408 | | 3,328 | | 914 | | 827 | | 847 | | 820 | |
| Seretide/Advair | 2,441 | | 2,192 | | 662 | | 604 | | 598 | | 577 | |
| Flixotide/Flovent | 618 | | 704 | | 167 | | 141 | | 156 | | 154 | |
| Serevent | 349 | | 432 | | 85 | | 82 | | 93 | | 89 | |
| Flixonase/Flonase | 578 | | 594 | | 143 | | 145 | | 133 | | 157 | |
|
|
|
|
|
|
|
|
|
|
|
| |
| Central Nervous System | 3,462 | | 4,446 | | 836 | | 835 | | 877 | | 914 | |
| Seroxat/Paxil | 1,063 | | 1,877 | | 242 | | 246 | | 284 | | 291 | |
| Paxil IR | 667 | | 1,490 | | 144 | | 144 | | 189 | | 190 | |
| Paxil CR | 396 | | 387 | | 98 | | 102 | | 95 | | 101 | |
| Wellbutrin | 751 | | 953 | | 164 | | 173 | | 193 | | 221 | |
| Wellbutrin IR, SR | 284 | | 883 | | 30 | | 45 | | 76 | | 133 | |
| Wellbutrin XL | 467 | | 70 | | 134 | | 128 | | 117 | | 88 | |
| Imigran/Imitrex | 682 | | 759 | | 177 | | 175 | | 158 | | 172 | |
| Lamictal | 677 | | 549 | | 181 | | 172 | | 171 | | 153 | |
| Requip | 116 | | 98 | | 32 | | 29 | | 29 | | 26 | |
|
|
|
|
|
|
|
|
|
|
|
| |
| Anti-virals | 2,359 | | 2,345 | | 605 | | 597 | | 595 | | 562 | |
| HIV | 1,462 | | 1,505 | | 374 | | 372 | | 368 | | 348 | |
| Combivir | 570 | | 588 | | 146 | | 144 | | 141 | | 139 | |
| Trizivir | 322 | | 375 | | 75 | | 79 | | 87 | | 81 | |
| Epivir | 294 | | 293 | | 73 | | 73 | | 77 | | 71 | |
| Ziagen | 155 | | 167 | | 38 | | 42 | | 37 | | 38 | |
| Retrovir | 43 | | 45 | | 11 | | 11 | | 11 | | 10 | |
| Agenerase, Lexiva | 63 | | 31 | | 21 | | 18 | | 15 | | 9 | |
| Herpes | 718 | | 668 | | 183 | | 179 | | 182 | | 174 | |
| Valtrex | 571 | | 498 | | 146 | | 147 | | 145 | | 133 | |
| Zovirax | 147 | | 170 | | 37 | | 32 | | 37 | | 41 | |
| Zeffix | 130 | | 129 | | 34 | | 33 | | 33 | | 30 | |
|
|
|
|
|
|
|
|
|
|
|
| |
| Anti-bacterials | 1,547 | | 1,800 | | 393 | | 350 | | 382 | | 422 | |
| Augmentin | 708 | | 825 | | 170 | | 156 | | 178 | | 204 | |
| Augmentin IR | 533 | | 584 | | 135 | | 125 | | 134 | | 139 | |
| Augmentin ES | 74 | | 135 | | 5 | | 14 | | 22 | | 33 | |
| Augmentin XR | 101 | | 106 | | 30 | | 17 | | 22 | | 32 | |
| Zinnat/Ceftin | 205 | | 232 | | 56 | | 42 | | 48 | | 59 | |
|
|
|
|
|
|
|
|
|
|
|
| |
| Metabolic | 1,251 | | 1,077 | | 324 | | 320 | | 338 | | 269 | |
| Avandia/Avandamet | 1,114 | | 929 | | 287 | | 284 | | 306 | | 237 | |
|
|
|
|
|
|
|
|
|
|
|
| |
| Vaccines | 1,194 | | 1,121 | | 349 | | 328 | | 278 | | 239 | |
| Hepatitis | 405 | | 417 | | 109 | | 101 | | 105 | | 90 | |
| Infanrix/Pediarix | 356 | | 336 | | 99 | | 95 | | 86 | | 76 | |
|
|
|
|
|
|
|
|
|
|
|
| |
| Oncology and emesis | 934 | | 1,000 | | 229 | | 246 | | 237 | | 222 | |
| Zofran | 763 | | 774 | | 190 | | 201 | | 192 | | 180 | |
| Hycamtin | 99 | | 110 | | 24 | | 26 | | 25 | | 24 | |
|
|
|
|
|
|
|
|
|
|
|
| |
| Cardiovascular and urogenital | 932 | | 770 | | 280 | | 232 | | 220 | | 200 | |
| Coreg | 432 | | 361 | | 115 | | 110 | | 113 | | 94 | |
| Levitra | 49 | | 37 | | 12 | | 11 | | 9 | | 17 | |
| Avodart | 64 | | 19 | | 23 | | 17 | | 14 | | 10 | |
|
|
|
|
|
|
|
|
|
|
|
| |
| Other | 1,027 | | 1,165 | | 292 | | 229 | | 248 | | 258 | |
| Zantac | 273 | | 328 | | 69 | | 66 | | 70 | | 68 | |
|
|
|
|
|
|
|
|
|
|
|
| |
| Total | 17,100 | | 18,114 | | 4,475 | | 4,202 | | 4,255 | | 4,168 | |
|
|
|
|
|
|
|
|
|
|
|
| |
| | | | | | | | | | | | | |
| Pharmaceutical turnover includes co-promotion income. | | | | | | | | | | | | |
Back to Contents
| 170 | GlaxoSmithKline Financial information under IFRS |
| IFRS Consolidated income statement – statutory | | | | | | | | 12 months 2004 | | | | 12 months 2003 | |
| |
|
|
|
|
|
|
| |
|
|
|
|
| |
| | | UK GAAP | | Adjustments | | IFRS | | Growth | | UK GAAP | | Adjustments | | IFRS | |
| | | £m | | £m | | £m | | £% | | CER% | | £m | | £m | | £m | |
|
|
|
|
|
|
|
|
|
|
|
|
|
|
|
|
| |
| Turnover | | 20,359 | | (373 | ) | 19,986 | | (5 | ) | 1 | | 21,441 | | (371 | ) | 21,070 | |
| Cost of sales | | (4,309 | ) | (51 | ) | (4,360 | ) | (5 | ) | – | | (4,544 | ) | (33 | ) | (4,577 | ) |
| Selling, general and administrative expenditure | | (7,061 | ) | 156 | | (6,905 | ) | (7 | ) | (4 | ) | (7,597 | ) | 145 | | (7,452 | ) |
| Research and development expenditure | | (2,839 | ) | (65 | ) | (2,904 | ) | 1 | | 8 | | (2,791 | ) | (74 | ) | (2,865 | ) |
|
|
|
|
|
|
|
|
|
|
|
|
|
|
|
|
| |
| Operating costs | | (14,209 | ) | 40 | | (14,169 | ) | | | | | (14,932 | ) | 38 | | (14,894 | ) |
|
|
|
|
|
|
|
|
|
|
|
|
|
|
|
|
| |
| Trading profit | | 6,150 | | (333 | ) | 5,817 | | (6 | ) | 5 | | 6,509 | | (333 | ) | 6,176 | |
| Other operating income/(expense) | | (60 | ) | (1 | ) | (61 | ) | | | | | (133 | ) | 7 | | (126 | ) |
|
|
|
|
|
|
|
|
|
|
|
|
|
|
|
|
| |
| Operating profit | | 6,090 | | (334 | ) | 5,756 | | (5 | ) | 6 | | 6,376 | | (326 | ) | 6,050 | |
|
|
|
|
|
|
|
|
|
|
|
|
|
|
|
|
| |
| Share of profits/(losses) of joint ventures | | | | | | | | | | | | | | | | | |
| and associates | | 95 | | (35 | ) | 60 | | | | | | 93 | | (36 | ) | 57 | |
| Disposal of interests in associates | | 138 | | 11 | | 149 | | | | | | – | | – | | – | |
| Disposal of businesses | | (1 | ) | 1 | | – | | | | | | 5 | | – | | 5 | |
|
|
|
|
|
|
|
|
|
|
|
|
|
|
|
|
| |
| Profit before interest | | 6,322 | | (357 | ) | 5,965 | | | | | | 6,474 | | (362 | ) | 6,112 | |
| Finance costs, net | | (203 | ) | 17 | | (186 | ) | | | | | (161 | ) | 8 | | (153 | ) |
|
|
|
|
|
|
|
|
|
|
|
|
|
|
|
|
| |
| Profit on ordinary activities before taxation | | 6,119 | | (340 | ) | 5,779 | | (3 | ) | 9 | | 6,313 | | (354 | ) | 5,959 | |
| Taxation | | (1,701 | ) | (56 | ) | (1,757 | ) | | | | | (1,729 | ) | 78 | | (1,651 | ) |
|
|
|
|
|
|
|
|
|
|
|
|
|
|
|
|
| |
| Profit on ordinary activities after taxation | | 4,418 | | (396 | ) | 4,022 | | (7 | ) | 4 | | 4,584 | | (276 | ) | 4,308 | |
| Equity minority interests | | (114 | ) | 2 | | (112 | ) | | | | | (94 | ) | (1 | ) | (95 | ) |
| Preference share dividends | | (2 | ) | – | | (2 | ) | | | | | (12 | ) | – | | (12 | ) |
|
|
|
|
|
|
|
|
|
|
|
|
|
|
|
|
| |
| Earnings (Profit attributable to shareholders) | | 4,302 | | (394 | ) | 3,908 | | (7 | ) | 4 | | 4,478 | | (277 | ) | 4,201 | |
|
|
|
|
|
|
|
|
|
|
|
|
|
|
|
|
| |
| Basic earnings per share | | 75.0 | p | (6.9 | )p | 68.1p | | (6 | ) | 6 | | 77.1 | p | (4.8 | )p | 72.3 | p |
|
|
|
|
|
|
|
|
|
|
|
|
|
|
|
|
| |
| | | | | | | | | | | | | | | | | | |
| | | | | | | | | | | | | | | | | | |
| IFRS Consolidated income statement – business performance | | | | | | | | | |
| | | | | | | | | 12 months 2004 | | | | 12 months 2003 | |
| | |
|
|
|
|
|
|
| |
|
|
|
|
| |
| | | UK GAAP | | Adjustments | | IFRS | | Growth | | UK GAAP | | Adjustments | | IFRS | |
| | | £m | | £m | | £m | | £% | | CER% | | £m | | £m | | £m | |
|
|
|
|
|
|
|
|
|
|
|
|
|
|
|
|
| |
| Turnover | | 20,359 | | (373 | ) | 19,986 | | (5 | ) | 1 | | 21,441 | | (371 | ) | 21,070 | |
| Cost of sales | | (4,309 | ) | (51 | ) | (4,360 | ) | 3 | | 9 | | (4,188 | ) | (33 | ) | (4,221 | ) |
| Selling, general and administrative expenditure | | (7,061 | ) | 156 | | (6,905 | ) | (7 | ) | (3 | ) | (7,579 | ) | 145 | | (7,434 | ) |
| Research and development expenditure | | (2,839 | ) | (65 | ) | (2,904 | ) | 2 | | 9 | | (2,770 | ) | (74 | ) | (2,844 | ) |
|
|
|
|
|
|
|
|
|
|
|
|
|
|
|
|
| |
| Operating costs | | (14,209 | ) | 40 | | (14,169 | ) | | | | | (14,537 | ) | 38 | | (14,499 | ) |
|
|
|
|
|
|
|
|
|
|
|
|
|
|
|
|
| |
| Trading profit | | 6,150 | | (333 | ) | 5,817 | | (11 | ) | (1 | ) | 6,904 | | (333 | ) | 6,571 | |
| Other operating income/(expense) | | (60 | ) | (1 | ) | (61 | ) | | | | | (133 | ) | 7 | | (126 | ) |
|
|
|
|
|
|
|
|
|
|
|
|
|
|
|
|
| |
| Operating profit | | 6,090 | | (334 | ) | 5,756 | | (11 | ) | – | | 6,771 | | (326 | ) | 6,445 | |
|
|
|
|
|
|
|
|
|
|
|
|
|
|
|
|
| |
| Share of profits/(losses) of joint ventures | | | | | | | | | | | | | | | | | |
| and associates | | 95 | | (35 | ) | 60 | | | | | | 93 | | (36 | ) | 57 | |
| Disposal of interests in associates | | 138 | | 11 | | 149 | | | | | | – | | – | | – | |
| Disposal of businesses | | (1 | ) | 1 | | – | | | | | | – | | – | | – | |
|
|
|
|
|
|
|
|
|
|
|
|
|
|
|
|
| |
| Profit before interest | | 6,322 | | (357 | ) | 5,965 | | | | | | 6,864 | | (362 | ) | 6,502 | |
| Finance costs, net | | (203 | ) | 17 | | (186 | ) | | | | | (161 | ) | 8 | | (153 | ) |
|
|
|
|
|
|
|
|
|
|
|
|
|
|
|
|
| |
| Profit on ordinary activities before taxation | | 6,119 | | (340 | ) | 5,779 | | (9 | ) | 2 | | 6,703 | | (354 | ) | 6,349 | |
| Taxation | | (1,701 | ) | (56 | ) | (1,757 | ) | | | | | (1,838 | ) | 78 | | (1,760 | ) |
|
|
|
|
|
|
|
|
|
|
|
|
|
|
|
|
| |
| Profit on ordinary activities after taxation | | 4,418 | | (396 | ) | 4,022 | | (12 | ) | (2 | ) | 4,865 | | (276 | ) | 4,589 | |
| Equity minority interests | | (114 | ) | 2 | | (112 | ) | | | | | (94 | ) | (1 | ) | (95 | ) |
| Preference share dividends | | (2 | ) | – | | (2 | ) | | | | | (12 | ) | – | | (12 | ) |
|
|
|
|
|
|
|
|
|
|
|
|
|
|
|
|
| |
| Adjusted earnings (Profit attributable to | | | | | | | | | | | | | | | | | |
| shareholders) | | 4,302 | | (394 | ) | 3,908 | | (13 | ) | (2 | ) | 4,759 | | (277 | ) | 4,482 | |
|
|
|
|
|
|
|
|
|
|
|
|
|
|
|
|
| |
| | | | | | | | | | | | | | | | | | |
| Adjusted earnings per share | | 75.0 | p | (6.9 | )p | 68.1 | p | (12 | ) | (1 | ) | 82.0 | p | (4.8 | )p | 77.2 | p |
|
|
|
|
|
|
|
|
|
|
|
|
|
|
|
|
| |
Back to Contents
| Financial information under IFRS GlaxoSmithKline | 171 |
| IFRS Consolidated income statement – statutory | | | | | | | | | | | | | | | |
| | | | | | | Q4 2004 | | | | 9 months 2004 | | | | | | Q3 2004 | |
| | |
|
|
|
|
| |
|
|
|
|
| |
|
|
|
|
| |
| | | UK GAAP | | Adjustments | | IFRS | | UK GAAP | | Adjustments | | IFRS | | UK GAAP | | Adjustments | | IFRS | |
| | | £m | | £m | | £m | | £m | | £m | | £m | | £m | | £m | | £m | |
|
|
|
|
|
|
|
|
|
|
|
|
|
|
|
|
|
|
| |
| Turnover | | 5,333 | | (97 | ) | 5,236 | | 15,026 | | (276 | ) | 14,750 | | 5,019 | | (95 | ) | 4,924 | |
| Cost of sales | | (1,158 | ) | (18 | ) | (1,176 | ) | (3,151 | ) | (33 | ) | (3,184 | ) | (1,096 | ) | (9 | ) | (1,105 | ) |
| Selling, general and administrative expenditure | | (2,047 | ) | 42 | | (2,005 | ) | (5,014 | ) | 114 | | (4,900 | ) | (1,647 | ) | 54 | | (1,593 | ) |
| Research and development expenditure | | (846 | ) | (7 | ) | (853 | ) | (1,993 | ) | (58 | ) | (2,051 | ) | (682 | ) | (14 | ) | (696 | ) |
|
|
|
|
|
|
|
|
|
|
|
|
|
|
|
|
|
|
| |
| Operating costs | | (4,051 | ) | 17 | | (4,034 | ) | (10,158 | ) | 23 | | (10,135 | ) | (3,425 | ) | 31 | | (3,394 | ) |
|
|
|
|
|
|
|
|
|
|
|
|
|
|
|
|
|
|
| |
| Trading profit | | 1,282 | | (80 | ) | 1,202 | | 4,868 | | (253 | ) | 4,615 | | 1,594 | | (64 | ) | 1,530 | |
| Other operating income/(expense) | | 40 | | (1 | ) | 39 | | (100 | ) | – | | (100 | ) | (33 | ) | – | | (33 | ) |
|
|
|
|
|
|
|
|
|
|
|
|
|
|
|
|
|
|
| |
| Operating profit | | 1,322 | | (81 | ) | 1,241 | | 4,768 | | (253 | ) | 4,515 | | 1,561 | | (64 | ) | 1,497 | |
|
|
|
|
|
|
|
|
|
|
|
|
|
|
|
|
|
|
| |
| Share of profits/(losses) of joint ventures and | | | | | | | | | | | | | | | | | | | |
| associates | | 23 | | (7 | ) | 16 | | 72 | | (28 | ) | 44 | | 22 | | (8 | ) | 14 | |
| Disposal of interests in associates | | 97 | | 7 | | 104 | | 41 | | 4 | | 45 | | – | | – | | – | |
| Disposal of business | | (1 | ) | 1 | | – | | – | | – | | – | | – | | – | | – | |
|
|
|
|
|
|
|
|
|
|
|
|
|
|
|
|
|
|
| |
| Profit before interest | | 1,441 | | (80 | ) | 1,361 | | 4,881 | | (277 | ) | 4,604 | | 1,583 | | (72 | ) | 1,511 | |
| Finance costs, net | | (51 | ) | 12 | | (39 | ) | (152 | ) | 5 | | (147 | ) | (61 | ) | 1 | | (60 | ) |
|
|
|
|
|
|
|
|
|
|
|
|
|
|
|
|
|
|
| |
| Profit on ordinary activities before taxation | | 1,390 | | (68 | ) | 1,322 | | 4,729 | | (272 | ) | 4,457 | | 1,522 | | (71 | ) | 1,451 | |
| Taxation | | (401 | ) | (120 | ) | (521 | ) | (1,300 | ) | 64 | | (1,236 | ) | (418 | ) | 14 | | (404 | ) |
|
|
|
|
|
|
|
|
|
|
|
|
|
|
|
|
|
|
| |
| Profit on ordinary activities after taxation | | 989 | | (188 | ) | 801 | | 3,429 | | (208 | ) | 3,221 | | 1,104 | | (57 | ) | 1,047 | |
| Equity minority interests | | (28 | ) | 1 | | (27 | ) | (86 | ) | 1 | | (85 | ) | (39 | ) | – | | (39 | ) |
| Preference share dividends | | – | | – | | – | | (2 | ) | – | | (2 | ) | – | | – | | – | |
|
|
|
|
|
|
|
|
|
|
|
|
|
|
|
|
|
|
| |
| Earnings (Profit attributable to shareholders) | | 961 | | (187 | ) | 774 | | 3,341 | | (207 | ) | 3,134 | | 1,065 | | (57 | ) | 1,008 | |
|
|
|
|
|
|
|
|
|
|
|
|
|
|
|
|
|
|
| |
| | | | | | | | | | | | | | | | | | | | |
| Basic earnings per share | | 16.8 | p | (3.3 | )p | 13.5 | p | 58.2 | p | (3.6 | )p | 54.6 | p | 18.7 | p | (1.0 | )p | 17.7 | p |
|
|
|
|
|
|
|
|
|
|
|
|
|
|
|
|
|
|
| |
| | | | | | | | | | | | | | | | | | | | |
| | | | | | | | | | | | | | | | | | | | |
| IFRS Consolidated income statement – statutory | | | | | | | | | | | | | | | |
| | | 6 months 2004 | | | | Q2 2004 | | | | | | Q1 2004 | |
| | |
|
|
|
|
| |
|
|
|
|
| |
|
|
|
|
| |
| | | UK GAAP | | Adjustments | | IFRS | | UK GAAP | | Adjustments | | IFRS | | UK GAAP | | Adjustments | | IFRS | |
| | | £m | | £m | | £m | | £m | | £m | | £m | | £m | | £m | | £m | |
|
|
|
|
|
|
|
|
|
|
|
|
|
|
|
|
|
|
| |
| Turnover | | 10,007 | | (181 | ) | 9,826 | | 5,064 | | (93 | ) | 4,971 | | 4,943 | | (88 | ) | 4,855 | |
| Cost of sales | | (2,055 | ) | (24 | ) | (2,079 | ) | (1,031 | ) | (13 | ) | (1,044 | ) | (1,024 | ) | (11 | ) | (1,035 | ) |
| Selling, general and administrative expenditure | | (3,367 | ) | 60 | | (3,307 | ) | (1,641 | ) | 37 | | (1,604 | ) | (1,726 | ) | 23 | | (1,703 | ) |
| Research and development expenditure | | (1,311 | ) | (44 | ) | (1,355 | ) | (680 | ) | (16 | ) | (696 | ) | (631 | ) | (28 | ) | (659 | ) |
|
|
|
|
|
|
|
|
|
|
|
|
|
|
|
|
|
|
| |
| Operating costs | | (6,733 | ) | (8 | ) | (6,741 | ) | (3,352 | ) | 8 | | (3,344 | ) | (3,381 | ) | (16 | ) | (3,397 | ) |
|
|
|
|
|
|
|
|
|
|
|
|
|
|
|
|
|
|
| |
| Trading profit | | 3,274 | | (189 | ) | 3,085 | | 1,712 | | (85 | ) | 1,627 | | 1,562 | | (104 | ) | 1,458 | |
| Other operating income/(expense) | | (67 | ) | – | | (67 | ) | (102 | ) | – | | (102 | ) | 35 | | – | | 35 | |
|
|
|
|
|
|
|
|
|
|
|
|
|
|
|
|
|
|
| |
| Operating profit | | 3,207 | | (189 | ) | 3,018 | | 1,610 | | (85 | ) | 1,525 | | 1,597 | | (104 | ) | 1,493 | |
|
|
|
|
|
|
|
|
|
|
|
|
|
|
|
|
|
|
| |
| Share of profits/(losses) of joint ventures and | | | | | | | | | | | | | | | | | | | |
| associates | | 50 | | (20 | ) | 30 | | 28 | | (12 | ) | 16 | | 22 | | (8 | ) | 14 | |
| Disposal of interests in associates | | 41 | | 4 | | 45 | | 41 | | 4 | | 45 | | – | | – | | – | |
|
|
|
|
|
|
|
|
|
|
|
|
|
|
|
|
|
|
| |
| Profit before interest | | 3,298 | | (205 | ) | 3,093 | | 1,679 | | (93 | ) | 1,586 | | 1,619 | | (112 | ) | 1,507 | |
| Finance costs, net | | (91 | ) | 4 | | (87 | ) | (48 | ) | 2 | | (46 | ) | (43 | ) | 2 | | (41 | ) |
|
|
|
|
|
|
|
|
|
|
|
|
|
|
|
|
|
|
| |
| Profit on ordinary activities before taxation | | 3,207 | | (201 | ) | 3,006 | | 1,631 | | (91 | ) | 1,540 | | 1,576 | | (110 | ) | 1,466 | |
| Taxation | | (882 | ) | 50 | | (832 | ) | (449 | ) | 23 | | (426 | ) | (433 | ) | 27 | | (406 | ) |
|
|
|
|
|
|
|
|
|
|
|
|
|
|
|
|
|
|
| |
| Profit on ordinary activities after taxation | | 2,325 | | (151 | ) | 2,174 | | 1,182 | | (68 | ) | 1,114 | | 1,143 | | (83 | ) | 1,060 | |
| Equity minority interests | | (47 | ) | 1 | | (46 | ) | (25 | ) | – | | (25 | ) | (22 | ) | 1 | | (21 | ) |
| Preference share dividends | | (2 | ) | – | | (2 | ) | – | | – | | – | | (2 | ) | – | | (2 | ) |
|
|
|
|
|
|
|
|
|
|
|
|
|
|
|
|
|
|
| |
| Earnings (Profit attributable to shareholders) | | 2,276 | | (150 | ) | 2,126 | | 1,157 | | (68 | ) | 1,089 | | 1,119 | | (82 | ) | 1,037 | |
|
|
|
|
|
|
|
|
|
|
|
|
|
|
|
|
|
|
| |
| | | | | | | | | | | | | | | | | | | | |
| Basic earnings per share | | 39.5 | p | (2.6 | )p | 36.9 | p | 20.1 | p | (1.2 | )p | 18.9 | p | 19.4 | p | (1.4 | )p | 18.0 | p |
|
|
|
|
|
|
|
|
|
|
|
|
|
|
|
|
|
|
| |
Back to Contents
| 172 | GlaxoSmithKline Financial information under IFRS |
| IFRS Consolidated balance sheet | | | | 31st December 2004 | | | | 31st December 2003 | |
| | |
|
|
| |
|
|
| |
| | | UK GAAP | | Adjustments | | IFRS | | UK GAAP | | Adjustments | | IFRS | |
| | | £m | | £m | | £m | | £m | | £m | | £m | |
|
|
|
|
|
|
|
|
|
|
|
|
| |
| | | | | | | | | | | | | | |
| Property, plant and equipment | | 6,471 | | (274 | ) | 6,197 | | 6,441 | | (285 | ) | 6,156 | |
| Goodwill | | 139 | | 26 | | 165 | | 143 | | 12 | | 155 | |
| Other intangible assets | | 2,003 | | 510 | | 2,513 | | 1,697 | | 533 | | 2,230 | |
| Investments in associates and joint ventures | | 187 | | 22 | | 209 | | 196 | | 14 | | 210 | |
| Other investments | | 298 | | – | | 298 | | 262 | | – | | 262 | |
| Deferred tax assets | | 1,537 | | 495 | | 2,032 | | 1,441 | | 498 | | 1,939 | |
| Other non-current assets | | 234 | | 14 | | 248 | | 522 | | 9 | | 531 | |
|
|
|
|
|
|
|
|
|
|
|
|
| |
| Non-current assets | | 10,869 | | 793 | | 11,662 | | 10,702 | | 781 | | 11,483 | |
|
|
|
|
|
|
|
|
|
|
|
|
| |
| Current assets | | | | | | | | | | | | | |
| Inventories | | 2,192 | | 1 | | 2,193 | | 2,109 | | – | | 2,109 | |
| Trade and other receivables | | 5,538 | | (724 | ) | 4,814 | | 4,934 | | (439 | ) | 4,495 | |
| Liquid investments | | 2,818 | | (1,306 | ) | 1,512 | | 2,493 | | (1,024 | ) | 1,469 | |
| Cash and cash equivalents | | 1,161 | | 1,306 | | 2,467 | | 962 | | 1,024 | | 1,986 | |
| Assets held for sale | | – | | 2 | | 2 | | – | | – | | – | |
|
|
|
|
|
|
|
|
|
|
|
|
| |
| Current assets | | 11,709 | | (721 | ) | 10,998 | | 10,498 | | (439 | ) | 10,059 | |
|
|
|
|
|
|
|
|
|
|
|
|
| |
| Total assets | | 22,578 | | 72 | | 22,650 | | 21,200 | | 342 | | 21,542 | |
|
|
|
|
|
|
|
|
|
|
|
|
| |
| Short-term borrowings | | (1,582 | ) | – | | (1,582 | ) | (1,452 | ) | – | | (1,452 | ) |
| Trade and other payables | | (5,542 | ) | 704 | | (4,838 | ) | (5,561 | ) | 844 | | (4,717 | ) |
| Current tax payable | | (1,598 | ) | – | | (1,598 | ) | (1,458 | ) | – | | (1,458 | ) |
| Short-term provisions | | – | | (962 | ) | (962 | ) | – | | (968 | ) | (968 | ) |
|
|
|
|
|
|
|
|
|
|
|
|
| |
| Current liabilities | | (8,722 | ) | (258 | ) | (8,980 | ) | (8,471 | ) | (124 | ) | (8,595 | ) |
|
|
|
|
|
|
|
|
|
|
|
|
| |
| Long-term borrowings | | (4,381 | ) | – | | (4,381 | ) | (3,651 | ) | – | | (3,651 | ) |
| Deferred tax provision | | (710 | ) | 333 | | (377 | ) | (618 | ) | 449 | | (169 | ) |
| Pensions and other post-employment benefits | | (785 | ) | (1,734 | ) | (2,519 | ) | (807 | ) | (2,137 | ) | (2,944 | ) |
| Other provisions | | (1,534 | ) | 965 | | (569 | ) | (1,617 | ) | 962 | | (655 | ) |
| Other non-current liabilities | | (244 | ) | – | | (244 | ) | (232 | ) | – | | (232 | ) |
|
|
|
|
|
|
|
|
|
|
|
|
| |
| Non-current liabilities | | (7,654 | ) | (436 | ) | (8,090 | ) | (6,925 | ) | (726 | ) | (7,651 | ) |
|
|
|
|
|
|
|
|
|
|
|
|
| |
| Total liabilities | | (16,376 | ) | (694 | ) | (17,070 | ) | (15,396 | ) | (850 | ) | (16,246 | ) |
|
|
|
|
|
|
|
|
|
|
|
|
| |
| Net assets | | 6,202 | | (622 | ) | 5,580 | | 5,804 | | (508 | ) | 5,296 | |
|
|
|
|
|
|
|
|
|
|
|
|
| |
| Equity | | | | | | | | | | | | | |
| Share capital | | 1,484 | | – | | 1,484 | | 1,487 | | – | | 1,487 | |
| Share premium account | | 304 | | – | | 304 | | 264 | | – | | 264 | |
| Shares held by ESOP Trusts | | (2,574 | ) | 38 | | (2,536 | ) | (2,729 | ) | 11 | | (2,718 | ) |
| Other reserves | | 1,930 | | – | | 1,930 | | 1,925 | | – | | 1,925 | |
| Retained earnings | | 4,781 | | (655 | ) | 4,126 | | 4,112 | | (514 | ) | 3,598 | |
|
|
|
|
|
|
|
|
|
|
|
|
| |
| Equity shareholders’ funds | | 5,925 | | (617 | ) | 5,308 | | 5,059 | | (503 | ) | 4,556 | |
|
|
|
|
|
|
|
|
|
|
|
|
| |
| Non-equity minority interests | | – | | – | | – | | 503 | | – | | 503 | |
| Equity minority interests | | 277 | | (5 | ) | 272 | | 242 | | (5 | ) | 237 | |
|
|
|
|
|
|
|
|
|
|
|
|
| |
| Capital employed | | 6,202 | | (622 | ) | 5,580 | | 5,804 | | (508 | ) | 5,296 | |
|
|
|
|
|
|
|
|
|
|
|
|
| |
| | | | | | | | | | | | | | |
| | | | | | | | | | | | | | |
| IFRS Consolidated statement of recognised income and expense | | 31st December 2004 | | | | 31st December 2003 | |
| | |
|
|
| |
|
|
| |
| | | UK GAAP | | Adjustments | | IFRS | | UK GAAP | | Adjustments | | IFRS | |
| | | £m | | £m | | £m | | £m | | £m | | £m | |
|
|
|
|
|
|
|
|
|
|
|
|
| |
| | | | | | | | | | | | | | |
| Exchange movements | | (54 | ) | 24 | | (30 | ) | 113 | | 14 | | 127 | |
| Tax on exchange movements and unrealised gains | | (73 | ) | – | | (73 | ) | (92 | ) | 2 | | (90 | ) |
| Loss from own shares for employee share schemes | | (55 | ) | – | | (55 | ) | (39 | ) | – | | (39 | ) |
| Goodwill written back | | 20 | | (20 | ) | – | | – | | – | | – | |
| Revaluation of goodwill due to exchange | | 6 | | – | | 6 | | (7 | ) | – | | (7 | ) |
| Unrealised loss on disposal of intellectual property | | (1 | ) | 1 | | – | | 7 | | (7 | ) | – | |
| Actuarial gains/(losses) on defined benefit plans | | – | | 91 | | 91 | | – | | (311 | ) | (311 | ) |
|
|
|
|
|
|
|
|
|
|
|
|
| |
| | | | | | | | | | | | | | |
| Net gains/(losses) recognised directly in equity | | (157 | ) | 96 | | (61 | ) | (18 | ) | (302 | ) | (320 | ) |
| | | | | | | | | | | | | | |
| Profit attributable to shareholders | | 4,302 | | (394 | ) | 3,908 | | 4,478 | | (277 | ) | 4,201 | |
|
|
|
|
|
|
|
|
|
|
|
|
| |
| | | | | | | | | | | | | | |
| Total recognised income and expense for the year | | 4,145 | | (298 | ) | 3,847 | | 4,460 | | (579 | ) | 3,881 | |
|
|
|
|
|
|
|
|
|
|
|
|
| |
Back to Contents
| Financial information under IFRS GlaxoSmithKline | 173 |
| IFRS Consolidated cash flow statement | | | | | | | | | | | | | |
| | | | | | | | | | | | | | |
| | | 12 months 2004 | | 12 months 2003 | | Q4 2004 | | Q3 2004 | | Q2 2004 | | Q1 2004 | |
| | | £m | | £m | | £m | | £m | | £m | | £m | |
|
|
| |
| |
| |
| |
| |
| |
| | | | | | | | | | | | | | |
| Cash flows from operating activities | | | | | | | | | | | | | |
| Cash generated from operations | | 6,527 | | 7,005 | | 1,406 | | 2,006 | | 1,783 | | 1,332 | |
| Taxation paid | | (1,583 | ) | (1,917 | ) | (467 | ) | (391 | ) | (454 | ) | (271 | ) |
|
|
|
|
|
|
|
|
|
|
|
|
| |
| Net cash inflow from operating activities | | 4,944 | | 5,088 | | 939 | | 1,615 | | 1,329 | | 1,061 | |
|
|
|
|
|
|
|
|
|
|
|
|
| |
| | | | | | | | | | | | | | |
| Cash flow from investing activities | | | | | | | | | | | | | |
| Purchase of tangible fixed assets | | (788 | ) | (746 | ) | (283 | ) | (195 | ) | (189 | ) | (121 | ) |
| Proceeds from sale of tangible fixed assets | | 53 | | 46 | | 15 | | 24 | | 12 | | 2 | |
| Purchase of intangible assets | | (255 | ) | (316 | ) | (86 | ) | (96 | ) | (48 | ) | (25 | ) |
| Purchase of equity investments | | (103 | ) | (63 | ) | (26 | ) | (6 | ) | (67 | ) | (4 | ) |
| Proceeds from sale of equity investments | | 58 | | 125 | | 3 | | 18 | | 34 | | 3 | |
| Purchase of businesses, net of cash acquired | | (297 | ) | (12 | ) | 9 | | (306 | ) | – | | – | |
| Disposal of businesses and interest in associates | | 230 | | 3 | | 174 | | – | | 56 | | – | |
| Investment in joint ventures and associates | | (2 | ) | (3 | ) | – | | – | | (2 | ) | – | |
| Interest received | | 317 | | 195 | | 89 | | 79 | | 89 | | 60 | |
| Dividends from joint ventures and associates | | 11 | | 1 | | 3 | | 4 | | 2 | | 2 | |
|
|
|
|
|
|
|
|
|
|
|
|
| |
| Net cash outflow from investing activities | | (776 | ) | (770 | ) | (102 | ) | (478 | ) | (113 | ) | (83 | ) |
|
|
|
|
|
|
|
|
|
|
|
|
| |
| | | | | | | | | | | | | | |
| Cash flow from financing activities | | | | | | | | | | | | | |
| (Increase)/decrease in liquid investments | | (53 | ) | (373 | ) | (19 | ) | (37 | ) | 10 | | (7 | ) |
| Proceeds from own shares for employee share options | | 23 | | 26 | | 7 | | 4 | | 8 | | 4 | |
| Issue of share capital | | 42 | | 41 | | 17 | | 9 | | 6 | | 10 | |
| Share capital purchased for cancellation | | (201 | ) | (980 | ) | – | | – | | (23 | ) | (178 | ) |
| Purchase of Treasury shares | | (799 | ) | – | | (267 | ) | (247 | ) | (195 | ) | (90 | ) |
| Redemption of preference shares issued by subsidiary | | (489 | ) | – | | – | | – | | (49 | ) | (440 | ) |
| Increase in long-term loans | | 1,365 | | 1,046 | | – | | – | | 1,365 | | – | |
| Repayment of long-term loans | | (15 | ) | (23 | ) | (4 | ) | (7 | ) | – | | (4 | ) |
| Net repayment of short-term loans | | (407 | ) | (442 | ) | 19 | | 59 | | (475 | ) | (10 | ) |
| Net repayment of obligations under finance leases | | (22 | ) | – | | (22 | ) | – | | – | | – | |
| Interest paid | | (494 | ) | (327 | ) | (135 | ) | (133 | ) | (130 | ) | (96 | ) |
| Dividends paid to GSK shareholders | | (2,475 | ) | (2,333 | ) | (56 | ) | (1,092 | ) | (807 | ) | (520 | ) |
| Dividends paid to minority interests | | (73 | ) | (84 | ) | (9 | ) | (4 | ) | (9 | ) | (51 | ) |
| Dividends paid on preference shares | | (2 | ) | (15 | ) | – | | – | | – | | (2 | ) |
| Other financing cash flows | | 49 | | 82 | | 19 | | 55 | | (58 | ) | 33 | |
|
|
|
|
|
|
|
|
|
|
|
|
| |
| Net cash outflow from financing activities | | (3,551 | ) | (3,382 | ) | (450 | ) | (1,393 | ) | (357 | ) | (1,351 | ) |
|
|
|
|
|
|
|
|
|
|
|
|
| |
| | | | | | | | | | | | | | |
| Exchange adjustments | | (93 | ) | (110 | ) | (77 | ) | 3 | | 28 | | (47 | ) |
|
|
|
|
|
|
|
|
|
|
|
|
| |
| | | | | | | | | | | | | | |
| Increase/(decrease) in cash and cash equivalents | | 524 | | 826 | | 310 | | (253 | ) | 887 | | (420 | ) |
| Cash and cash equivalents at beginning of period | | 1,831 | | 1,005 | | 2,045 | | 2,298 | | 1,411 | | 1,831 | |
|
|
|
|
|
|
|
|
|
|
|
|
| |
| | | | | | | | | | | | | | |
| Cash and cash equivalents at end of period | | 2,355 | | 1,831 | | 2,355 | | 2,045 | | 2,298 | | 1,411 | |
|
|
|
|
|
|
|
|
|
|
|
|
| |
| | | | | | | | | | | | | | |
| Cash and cash equivalents at end of period comprise: | | | | | | | | | | | | | |
| | | | | | | | | | | | | | |
| Cash and cash equivalents | | 2,467 | | 1,986 | | 2,467 | | 2,244 | | 2,529 | | 1,526 | |
| Overdrafts | | (112 | ) | (155 | ) | (112 | ) | (199 | ) | (231 | ) | (115 | ) |
|
|
|
|
|
|
|
|
|
|
|
|
| |
| | | 2,355 | | 1,831 | | 2,355 | | 2,045 | | 2,298 | | 1,411 | |
|
|
|
|
|
|
|
|
|
|
|
|
| |
Back to Contents
Shareholder return
| Share price | | | | | | | |
| | | | | | | | |
| | | 2004 | | 2003 | | 2002 | |
| | | (£) | | (£) | | (£) | |
|
|
|
|
|
|
| |
| | | | | | | | |
| At 1st January | | 12.80 | | 11.92 | | 17.23 | |
| High during the year | | 12.99 | | 13.90 | | 17.80 | |
| Low during the year | | 10.42 | | 10.00 | | 10.57 | |
| At 31st December | | 12.22 | | 12.80 | | 11.92 | |
| (Decrease)/Increase | | (5 | )% | 7 | % | (31 | )% |
|
|
|
|
|
|
| |
The table above sets out the middle market closing prices derived from the London Stock Exchange Daily Official List. The company’s share price decreased by five per cent in 2004 from a price of £12.80 at 1st January 2004 to £12.22 at 31st December 2004. This compares with an increase in the FTSE 100 index of eight per cent during the year.
Market capitalisation
The market capitalisation of GlaxoSmithKline at 31st December 2004 was £72 billion. At that date GlaxoSmithKline was the fourth largest company by market capitalisation on the FTSE index.
SmithKline Beecham plc Floating Rate Unsecured Loan Stock 1990/2010
The loan stock is not listed on any exchange but holders may require SmithKline Beecham plc to redeem their loan stock at par, i.e. £1 for every £1 of loan stock held, on the first business day of March, June, September and December. Holders wishing to redeem all or part of their loan stock should complete the notice on the back of their loan stock certificate and return it to the registrar, to arrive at least 30 days before the relevant redemption date.
Taxation
General information concerning the UK and US tax effects of share ownership is set out in 'Taxation information for shareholders' on page 178.
Dividends
GlaxoSmithKline pays dividends quarterly. The Board declared dividends for 2004 as follows:
| | | 2004 | | 2003 | |
| Dividends per share | | pence | | pence | |
|
|
|
|
| |
| | | | | | |
| First interim – paid 1st July 2004 | | 10 | | 9 | |
| Second interim – paid 30th September 2004 | | 10 | | 9 | |
| Third interim – paid 6th January 2005 | | 10 | | 9 | |
| Fourth interim – payable 7th April 2005 | | 12 | | 14 | |
|
|
|
|
| |
| Total | | 42 | | 41 | |
|
|
|
|
| |
Dividends per share
As a guide to shareholders, the table below sets out the dividends per share paid in the last five years.
| Year | | GSK (p) | | GW (p) | | SB (p) | |
|
|
|
|
|
|
| |
| | | | | | | | |
| 2004 | | 42.0 | | | | | |
| 2003 | | 41.0 | | | | | |
| 2002 | | 40.0 | | | | | |
| 2001 | | 39.0 | | | | | |
| 2000 | | | | 38.0 | | 29.66 | |
|
|
|
|
|
|
| |
Dividends paid to Glaxo Wellcome and SmithKline Beecham shareholders are expressed as dividends per GlaxoSmithKline share.
Dividends per ADS
As a guide to holders of ADRs, the table below sets out the dividends per ADS paid in US dollars in the last five years. They are translated into US dollars at applicable exchange rates.
| Year | | GSK ($) | | GW ($) | | SB ($) | |
|
|
|
|
|
|
| |
| | | | | | | | |
| 2004 | | 1.53 | | | | | |
| 2003 | | 1.39 | | | | | |
| 2002 | | 1.24 | | | | | |
| 2001 | | 1.11 | | | | | |
| 2000 | | | | 1.10 | | 0.87 | |
|
|
|
|
|
|
| |
Dividends paid to Glaxo Wellcome and SmithKline Beecham ADR holders are expressed as dividends per GlaxoSmithKline ADS. One GlaxoSmithKline ADS represents two GlaxoSmithKline shares.
| Dividend calendar | |
| | |
| Fourth quarter 2004 | |
|
| Ex-dividend date | 16th February 2005 |
| Record date | 18th February 2005 |
| Payable | 7th April 2005 |
|
| | |
| First quarter 2005 | |
|
| Ex-dividend date | 11th May 2005 |
| Record date | 13th May 2005 |
| Payable | 7th July 2005 |
|
| | |
| Second quarter 2005 | |
|
| Ex-dividend date | 3rd August 2005 |
| Record date | 5th August 2005 |
| Payable | 6th October 2005 |
|
| | |
| Third quarter 2005 | |
|
| Ex-dividend date | 2nd November 2005 |
| Record date | 4th November 2005 |
| Payable | 5th January 2006 |
|
Back to Contents
Shareholder information
Ordinary shares
The company's shares are listed on the London Stock Exchange.
Registrar
The company's share register is administered by Lloyds TSB Registrars, who also provide the following services:
| • | GlaxoSmithKline Investment Plan
The plan enables shareholders to reinvest quarterly dividends and/or make monthly investments in the company's ordinary shares using a special dealing arrangement. |
| | |
| • | GlaxoSmithKline Individual Savings Account
The GlaxoSmithKline Individual Savings Account (ISA) is a tax-efficient way to invest in the company's ordinary shares. |
| | |
| • | GlaxoSmithKline Corporate Sponsored Nominee
The corporate sponsored nominee provides a facility for shareholders to hold shares without the need for share certificates. Shareholders' details will not be held on the main share register, and so will remain confidential. |
| | |
| • | Shareview service
The shareview portfolio service provides shareholders with information on their investment in the company. Shareholders may register for this service at www.shareview.co.uk. |
| | |
| • | Shareview Dealing service
Shareview Dealing Service is a telephone and internal share dealing facility available to ordinary shareholders by logging on to www.shareview.co.uk/dealing or by calling 0870 850 0852. |
American Depositary Shares
The company's shares are listed on the New York Stock Exchange in the form of American Depositary Shares (ADSs) and these are evidenced by American Depositary Receipts (ADRs), each one of which represents two ordinary shares.
ADR programme administrator
The ADR programme is administered by The Bank of New York, and provides the Global BuyDIRECT service which is a direct ADS purchase/sale and dividend reinvestment plan for ADR holders.
Share dealing facility
Hoare Govett Limited operates a postal share dealing service in the company’s ordinary shares. It enables investors to buy or sell shares at competitive commission charges. Transactions are executed and settled by Pershing Securities Limited. Further details of this service together with purchase and sale forms may be obtained by telephoning +44 (0)20 7661 6555.
Smith Barney, part of Citigroup, also offers a share dealing service in the company’s ordinary shares and ADSs. Further details of this service can be obtained by contacting them, see contact details inside back cover.
The provision of the details above are not intended to be an invitation or inducement to engage in an investment activity. Advice on share dealing, should be obtained from a stockbroker or independent financial adviser.
Share price information
Share price information is available on the company's website at www.gsk.com. Information in the UK is also available on Ceefax, Teletext, and from FT Cityline by calling 0906 003 5694 or 0906 843 5694 (calls charged at 60p a minute plus VAT at all times).
Annual General Meeting 2005
|
| The Queen Elizabeth II Conference Centre, 25th May 2005 |
| Broad Sanctuary, Westminster, |
| London SW1P 3EE |
|
The Annual General Meeting is the company's principal forum for communication with private shareholders. In addition to the formal resolutions to be put to the meeting, there will be a presentation by the Chief Executive Officer on the performance of the business and its future development. There will be opportunity for questions to the Board, and the Chairmen of the Board's committees will take questions on matters relating to those committees.
Investors holding shares in the company through a nominee service should arrange with that nominee service to be appointed as a corporate representative or proxy in respect of their shareholding in order to attend and vote at the meeting.
ADR holders wishing to attend the meeting must obtain a proxy from The Bank of New York which will enable them to attend the meeting and vote on the business to be transacted. ADR holders may instruct The Bank of New York as to the way in which the shares represented by their ADRs should be voted by completing and returning the voting card provided by the bank in accordance with the instructions given.
| Financial reporting | |
| | |
| Financial reporting calendar 2005 | |
|
|
| Announcement of 1st Quarter Results | 28th April 2005 |
|
|
| Announcement of 2nd Quarter Results | 28th July 2005 |
|
|
| Announcement of 3rd Quarter Results | 27th October 2005 |
|
|
| Preliminary Announcement of Annual Results | 9th February 2006 |
|
|
| Publication of Annual Report/Review | March 2006 |
|
|
Results Announcements
The Results Announcements are issued to the London Stock Exchange, and are available on their news service. At the same time, or shortly afterwards, they are issued to the media, made available on the website and sent to the US Securities and Exchange Commission and the New York Stock Exchange.
Financial reports
The company publishes an Annual Report and, for the investor not needing the full detail of the Report, an Annual Review. These are available from the date of publication on the website.
The Annual Review is sent to all shareholders on the date of publication. Shareholders may also elect to receive the Report by writing to the company’s registrars. Alternatively shareholders may elect to receive notification by email of the publication of financial reports by registering on www.shareview.co.uk.
Copies of previous financial reports are available on the website. Printed copies can be obtained from the registrar in the UK and from the Customer Response Center in the USA.
Back to Contents
Share capital
Nature of trading market
The Ordinary Shares of the company were listed on the London Stock Exchange on 27th December 2000. The shares were also listed on the New York Stock Exchange (in the form of American Depositary Shares‘ADSs’) from the same date.
The following table sets out, for the periods indicated, the high and low middle market closing quotations in pence for the shares on the London Stock Exchange, as derived from its Daily Official List, and the high and low last reported sales prices in US dollars for the ADSs on the New York Stock Exchange, as derived from the New York Stock Exchange Composite Tape.
Information relating to the share and ADS prices for Glaxo Wellcome and SmithKline Beecham prior to the date of the merger is also given.
| GlaxoSmithKline | Pence per share | |
| |
| |
| Fiscal periods from 27th December 2000 | High | | Low | |
|
|
|
| |
| Quarter ended 31st March 2005* | 1295 | | 1175 | |
| February 2005 | 1295 | | 1178 | |
| January 2005 | 1250 | | 1175 | |
| December 2004 | 1222 | | 1114 | |
| November 2004 | 1209 | | 1101 | |
| October 2004 | 1215 | | 1121 | |
| September 2004 | 1209 | | 1137 | |
| Quarter ended 31st December 2004 | 1222 | | 1101 | |
| Quarter ended 30th September 2004 | 1209 | | 1042 | |
| Quarter ended 30th June 2004 | 1201 | | 1067 | |
| Quarter ended 31st March 2004 | 1299 | | 1060 | |
| Quarter ended 31st December 2003 | 1390 | | 1250 | |
| Quarter ended 30th September 2003 | 1306 | | 1158 | |
| Quarter ended 30th June 2003 | 1335 | | 1131 | |
| Quarter ended 31st March 2003 | 1242 | | 1000 | |
| Year ended 31st December 2002 | 1780 | | 1057 | |
| Year ended 31st December 2001 | 2032 | | 1626 | |
| 27th to 31st December 2000 | 1920 | | 1890 | |
|
|
|
| |
| | | | | |
| | US dollars per ADS | |
| |
| |
| Fiscal periods from 27th December 2000 | High | | Low | |
|
|
|
| |
| Quarter ended 31st March 2005* | 49.45 | | 44.17 | |
| February 2005 | 49.45 | | 44.36 | |
| January 2005 | 47.35 | | 44.48 | |
| December 2004 | 47.50 | | 43.25 | |
| November 2004 | 45.04 | | 42.54 | |
| October 2004 | 44.01 | | 41.15 | |
| September 2004 | 43.84 | | 40.68 | |
| Quarter ended 31st December 2004 | 47.50 | | 41.15 | |
| Quarter ended 30th September 2004 | 43.84 | | 39.04 | |
| Quarter ended 30th June 2004 | 43.50 | | 39.44 | |
| Quarter ended 31st March 2004 | 46.93 | | 39.38 | |
| Quarter ended 31st December 2003 | 47.64 | | 42.09 | |
| Quarter ended 30th September 2003 | 43.22 | | 36.91 | |
| Quarter ended 30th June 2003 | 43.87 | | 35.40 | |
| Quarter ended 31st March 2003 | 40.13 | | 31.85 | |
| Year ended 31st December 2002 | 50.87 | | 32.86 | |
| Year ended 31st December 2001 | 58.00 | | 47.15 | |
| 27th to 31st December 2000 | 5613/16 | | 553/8 | |
|
|
|
| |
| * to 25th February 2005 | | | | |
Glaxo Wellcome
Fiscal period
from 1st January to 26th December 2000
| | Pence per share | |
| |
| |
| | High | | Low | |
|
|
|
| |
| 2000 | 2110 | | 1440 | |
|
|
|
| |
Fiscal period
from 1st January to 26th December 2000
| | US dollars per ADS | |
| |
| |
| | High | | Low | |
|
|
|
| |
| 2000 | 63 3 /4 | | 46 | |
|
|
|
| |
SmithKline Beecham
Fiscal period
from 1st January to 26th December 2000
| | Pence per share | |
| |
| |
| | High | | Low | |
|
|
|
| |
| 2000 | 955 | | 671 | |
|
|
|
| |
Fiscal period
from 1st January to 26th December 2000
| | US dollars per ADS | |
| |
| |
| | High | | Low | |
|
|
|
| |
| 2000 | 71 15 /16 | | 52 1 /2 | |
|
|
|
| |
Back to Contents
Share capital GlaxoSmithKline | 177 |
| Analysis of shareholdings | | | | | | | | |
| Analysis of shareholdings at 31st December 2004: | Number of accounts | | % of total accounts | | % of total shares | | Number of shares | |
|
|
|
|
|
|
|
| |
| Holding of shares | | | | | | | | |
| Up to 1,000 | 153,285 | | 70 | | 1 | | 55,899,970 | |
| 1,001 to 5,000 | 49,861 | | 23 | | 2 | | 107,541,323 | |
| 5,001 to 100,000 | 13,634 | | 6 | | 3 | | 206,901,953 | |
| 100,001 to 1,000,000 | 1,226 | | 1 | | 7 | | 402,558,721 | |
| Over 1,000,000 | 513 | | – | | 87 | | 5,164,786,864 | |
|
|
|
|
|
|
|
| |
| Totals | 218,519 | | 100 | | 100 | | 5,937,688,831 | |
|
|
|
|
|
|
|
| |
| Held by | | | | | | | | |
| Nominee companies | 40,211 | | 18 | | 79 | | 4,662,105,341 | |
| Investment and trust companies | 71 | | – | | 1 | | 31,564,510 | |
| Insurance companies | 26 | | – | | – | | 25,620,938 | |
| Individuals and other corporate bodies | 178,209 | | 82 | | 6 | | 369,095,973 | |
| BNY (Nominees) Limited | 1 | | – | | 13 | | 779,354,069 | |
| Held as Treasury Shares by GlaxoSmithKline | 1 | | – | | 1 | | 69,948,000 | |
|
|
|
|
|
|
|
| |
| Totals | 218,519 | | 100 | | 100 | | 5,937,688,831 | |
|
|
|
|
|
|
|
| |
The Bank of New York’s holding held through BNY (Nominees) Limited represents the company’s ADR programme, whereby each ADS represents two Ordinary Shares of 25p nominal value.
At 25th February 2005, the number of holders of record of shares in the USA was 1,187 with holdings of 1,776,334 shares, and the number of registered holders of the ADRs was 44,537 with holdings of 401,140,809 ADRs. Certain of these shares and ADRs were held by brokers or other nominees, as a result the number of holders of record or registered holders in the USA is not representative of the number of beneficial holders or of the residence of beneficial holders.
Control of company
As far as is known to the company, it is not directly or indirectly owned or controlled by one or more corporations or by any government. The company does not know of any arrangements, the operation of which might result in a change in control of the company.
Substantial shareholdings
At 25th February 2005, the company had received notification of the following interests of three per cent or more in the shares in issue, excluding Treasury shares:
| • | BNY (Nominees) Limited holds 802,281,619 shares representing 13.68 per cent. These shares are held on behalf of holders of ADRs, which evidence ADSs. |
| | |
| • | Legal & General Investment Management Limited holds 215,495,981 shares representing 3.67 per cent. |
| | |
| • | Barclays plc holds 229,512,017 shares representing 3.91 per cent. |
As far as is known to the company, no other person was the owner of three per cent or more of the shares in issue, excluding Treasury shares of the company.
Directors and Officers
The interests of the Directors and Officers of the company, as defined in the Companies Act 1985, in share options of the company are given in the Remuneration Report (pages 43 to 58).
Exchange controls and other limitations affecting security holders
There are currently no UK laws, decrees or regulations restricting the import or export of capital or affecting the remittance of dividends or other payments to holders of the company’s shares who are non-residents of the UK. There are no limitations relating only to non-residents of the UK under English law or the company’s Memorandum and Articles of Association on the right to be a holder of, and to vote in respect of, the company’s shares.
Documents on display
The Memorandum and Articles of Association of the company and other documents referred to in this Annual Report are available for inspection at the Registered Office of the company.
Publications
This year GlaxoSmithKline is again producing a Corporate Responsibility Report covering performance in areas including community investment, business ethics and integrity, access to medicines, R&D and environmental health and safety. The report will be published on the website at the end of March.
Back to Contents
Taxation information for shareholders
Information for shareholders
A summary of the main tax consequences for holders of shares and ADRs who are citizens or residents of the UK or the USA is set out below. It is not a complete analysis of all the possible tax consequences of purchase or ownership of these securities. It is intended only as a general guide. Holders are advised to consult their advisers with respect to the tax consequences of the purchase and ownership of their shares or ADRs, and the consequences under state and local tax laws in the USA and the implications of the new UK/US Income Tax convention.
This statement is based upon UK and US tax laws and practices at the date of this report.
The new UK/US Income Tax Convention came into force on 31st March 2003. The provisions of the new treaty apply for UK tax purposes from 1st April 2003 (UK Corporation Tax), 6th April 2003 (UK Income Tax and Capital Gains Tax) and 1st May 2003 (Withholding Taxes). For US tax purposes, the provisions of the new treaty apply from 1st May 2003 (Withholding Taxes) and 1st January 2004 (all other US taxes). However, holders of shares or ADRs have the ability to elect to continue to use the provisions of the previous treaty for 12 months following the new treaty’s entry into force. An election must be made in advance of the first event to which the new treaty would apply.
US holders of ADRs generally will be treated as the owners of the underlying shares for the purposes of the current USA/UK double taxation conventions relating to income and gains (Income Tax Convention), estate and gift taxes (Estate and Gift Tax Convention) and for the purposes of the US Internal Revenue Code of 1986, as amended (the Code).
The following analysis deals with dividends paid after 6th April 1999 when Advance Corporation Tax (ACT) was abolished.
UK shareholders
Taxation of dividends
From 6th April 1999, the rate of tax credits was reduced to one ninth. As a result of compensating reductions in the rate of tax on dividend income, there is no increase in the tax borne by UK resident individual shareholders. Tax credits are, however, no longer repayable to shareholders with a tax liability of less than the associated tax credit.
Taxation of capital gains
UK shareholders may be liable for UK tax on gains on the disposal of shares or ADRs. They may also be entitled to indexation relief and taper relief on such sales. Indexation relief is calculated on the market value of shares at 31st March 1982 and on the cost of any subsequent purchases from the date of such purchase. Indexation relief for individual shareholders ceased on 5th April 1998. Taper relief is available to individual shareholders who hold or are deemed to hold shares for at least three years before they are sold.
Inheritance tax
Individual shareholders may be liable to inheritance tax on the transfer of shares or ADRs. Tax may be charged on the amount by which the value of the shareholder's estate is reduced as a result of any transfer by way of gift or other disposal at less than full market value. Such a gift or other disposal is subject to both UK inheritance tax and US estate or gift tax. The Estate and Gift Tax Convention would generally provide for tax paid in the USA to be credited against tax payable in the UK.
Stamp duty
UK stamp duty or stamp duty reserve tax (SDRT) will, subject to certain exemptions, be payable on the purchase of shares at a rate of 0.5 per cent of the purchase price. There is a minimum charge of £5 where a stamp duty liability arises.
US shareholders
The following is a summary of certain UK taxation and USA federal income tax considerations that may be relevant to a US holder of shares or ADRs. This summary only applies to a shareholder that holds shares or ADRs as capital assets, is a citizen or resident of the USA or a domestic corporation or that is otherwise subject to United States federal income taxation on a net income basis in respect of the shares or ADRs, and is not resident in the UK for UK tax purposes and does not hold shares for the purposes of a trade, profession or vocation that is carried on in the UK through a branch or agency.
Taxation of dividends
The gross amount of dividends received (including amounts in respect of associated tax credit and UK withholding tax) is treated as foreign source dividend income for US tax purposes. It is not eligible for the dividend received deduction allowed to US corporations. Dividends on ADRs are payable in US dollars; dividends on shares are payable in Sterling. Dividends paid in pounds Sterling will be included in income in the US dollar amount calculated by reference to the exchange rate on the day the dividends are received by the holder. Subject to certain exceptions, an individual eligible US holder will be subject to US taxation at a maximum rate of 15 per cent in respect of qualified dividends received before 2009. Shareholders are advised to consult their own Tax Advisers to confirm their eligibility.
Taxation of capital gains
Generally, US holders will not be subject to UK capital gains tax, but will be subject to US tax on capital gains realised on the sale or other disposal of shares or ADRs.
Estate and gift taxes
Under the Estate and Gift Tax Convention, a US shareholder is not generally subject to UK inheritance tax.
Stamp duty
UK stamp duty or SDRT will, subject to certain exemptions, be payable on any issue or transfer of shares to the ADR custodian or depository at a rate of 1.5 per cent of their price (if issued), the amount of any consideration provided (if transferred on sale), or their value (if transferred for no consideration).
No SDRT would be payable on the transfer of an ADR. No UK stamp duty should be payable on the transfer of an ADR provided that the instrument of transfer is executed and remains at all times outside the UK. Any stamp duty on the transfer of an ADR would be payable at a rate of 0.5 per cent of the consideration for the transfer. Any sale of the underlying shares would result in liability to UK stamp duty or, as the case may be, SDRT at a rate of 0.5 per cent. There is a minimum charge of £5 where a stamp duty liability arises.
Back to Contents
Cross reference to Form 20-F
This table has been provided as a cross reference from the information included in this Annual Report to the requirements of Form 20-F.| | |
| Item | Page |
|
|
1 | Identity of directors, senior management and advisors | n/a |
|
|
2 | Offer statistics and expected timetable | n/a |
|
|
|
3 | Key information | |
| A | Selected financial data | 160-162,174 |
| D | Risk factors | 76-78 |
|
|
|
4 | Information on the company | |
| A | History and development of the company | Inside front cover |
| B | Business overview | |
| | Products | 25-26,28 |
| | Competition | 27-28 |
| | Regulation | 29-30 |
| | Marketing and distribution | 18,23 |
| | Manufacture and supply | 24 |
| | Research and development | 07-17 |
| | Intellectual property | 30-31 |
| | Environment, health and safety | 31-32 |
| | Access to medicines | 19 |
| | Investment in communities | 21-22 |
| C | Organisational structure | 150-152 |
| D | Property, plants and equipment | 71 |
| | Environmental responsibility | 71 |
| | Note 6 – Segment information | 100-102 |
| | Note 17 – Tangible fixed assets | 109 |
|
|
|
5 | Operating and financial review and prospects | |
| A | Operating results | |
| | | 61-78 |
| | | 79-86 |
| B | Liquidity and capital resources | 71-75 |
| C | Research and development, patents and licenses, etc. | 07-17,60 |
| D | Trend information | 60 |
| E | Balance sheet arrangements | n/a |
| F | Tabular disclosure of contractual obligations | 72 |
|
|
|
6 | Directors, senior management and employees | |
| A | Directors and senior management | 34-35 |
| B | Compensation | |
| | Remuneration Report | 43-58 |
| C | Board practices | |
| | Corporate governance | 36-42 |
| D | Employees | |
| | GlaxoSmithKline people | 20 |
| | Note 35 – Employee costs | 129-135 |
| | Financial record | 162 |
| E | Share ownership | |
| | GlaxoSmithKline people | 20 |
| | Note 36 – Employee share schemes | 136-138 |
| | Share options | 54-55 |
| | Incentive plans | 55-56 |
| | Directors’ interests | 53,58 |
|
|
|
7 | Major shareholders and related party transactions | |
| A | Major shareholders | 177 |
| B | Related party transactions
Note 32 – Related party transactions | 122 |
| | |
| Item | Page |
|
|
| 8 | Financial information | |
| A | Consolidated statements and other financial information | |
| | | See Item 18 |
| | | 116-122 |
| B | Significant changes | |
| | Note 31 – Post Balance Sheet Event | 122 |
|
|
|
| 9 | The offer and listing | |
| A | Share price history | 176 |
| C | Markets | 176 |
|
|
|
| 10 | Additional information | |
| B | Memorandum and Articles of Association | Footnote (i) |
| C | Material contracts | n/a |
| D | Exchange controls | 177 |
| E | Taxation | 178 |
| H | Documents on display | 177 |
|
|
|
| 11 | Quantitative and qualitative disclosures about market risk |
| | Treasury policies | 74-75 |
| | Note 34 - Financial instruments and related disclosures | 125-128 |
|
|
|
| 12 | Description of securities other than equity securities | n/a |
|
|
|
| 13 | Defaults, dividend arrearages and delinquencies | n/a |
|
|
|
| 14 | Material modifications to the rights of security holders and use of proceeds | n/a |
|
|
|
| 15 | Controls and procedures | 39-42 |
|
|
|
| 16 | [Reserved] | |
| A | Audit Committee financial expert | 40 |
| B | Code of ethics | 41 |
| C | Principal accountant fees and services | 104 |
| D | Exemptions from the listing standard for audit committees | n/a |
| E | Purchases of equity securities by the issuer and affiliated purchasers | 114 |
|
|
|
| 17 | Financial statements | |
|
|
|
| 18 | Financial statements | |
| | Independent auditors’ report | Footnote (ii) |
| | Consolidated statement of profit and loss | 90-91 |
| | Consolidated statement of total recognised gains and losses | 90-91 |
| | Consolidated statement of cash flow | 92-93 |
| | Consolidated balance sheet | 94 |
| | Reconciliation of movements in consolidated equity | |
| | shareholders’ funds | 94 |
| | Company balance sheet | 95 |
| | Notes to the financial statements | 96-152 |
|
|
|
| 19 | Exhibits | Footnote (ii) |
|
|
|
| | | |
| | Footnote | |
| i) | Information responsive to this item is incorporated by reference to ‘Memorandum and Articles of Association of GlaxoSmithKline’ at pages 35–36 of the Group’s Annual Report on Form 20-F for the year ended 31st December 2000. | |
| | | |
| ii) | See the company’s Form 20-F filing with the Securities and Exchange Commission. | |
Back to Contents
Glossary of terms
| Terms used in the Annual Report | US equivalent or brief description |
|
| Accelerated capital allowances | Tax allowance in excess of depreciation arising from the purchase of fixed assets that |
| | delay the charging and payment of tax. The US equivalent of tax depreciation. |
|
| Advance Corporation Tax (ACT) | An advance payment of UK tax that was made when dividends are paid. No direct US |
| | equivalent. |
|
| American Depositary Receipt (ADR) | Receipt evidencing title to an ADS. Each GlaxoSmithKline ADR represents two ordinary |
| | shares. |
|
| American Depositary Shares (ADSs) | Ordinary Shares registered on the New York Stock Exchange. |
|
| Called-up share capital | Ordinary Shares, issued and fully paid. |
|
| CER growth | Growth at constant exchange rates. |
|
| Combined Code | Guidelines required by the Listing Rules of the Financial Services Authority to address the |
| | principal aspects of Corporate Governance. |
|
| The company | GlaxoSmithKline plc. |
|
| Creditors | Accounts payable. |
|
| Currency swap | An exchange of two currencies, coupled with a subsequent re-exchange of those |
| | currencies, at agreed exchange rates and dates. |
|
| Debtors | Accounts receivable. |
|
| Defined benefit plan | Pension plan with specific employee benefits, often called ‘final salary scheme’ . |
|
| Defined contribution plan | Pension plan with specific contributions and a level of pension dependent upon the |
| | growth of the pension fund. |
|
| Derivative financial instrument | A financial instrument that derives its value from the price or rate of some underlying item. |
|
| Diluted earnings per share | Diluted income per share. |
|
| Earnings per share | Basic income per share. |
|
| Employee Share Ownership Plan Trusts | Trusts established by the Group to satisfy share based employee incentive plans. |
|
| Equity shareholders’ funds | The aggregation of shares and reserves owned by shareholders. The US equivalent is |
| | shareholders’ equity. |
|
| Finance lease | Capital lease. |
|
| Freehold | Ownership with absolute rights in perpetuity. |
|
| Gearing ratio | Net debt as a percentage of shareholders’ funds net debt and minority interests. |
|
| The Group | GlaxoSmithKline plc and its subsidiary undertakings. |
|
| Hedging | The reduction of risk, normally in relation to foreign currency or interest rate |
| | movements, by making off-setting commitments. |
|
| Intangible fixed assets | Assets without physical substance, such as brands, licences, patents, know-how and |
| | marketing rights purchased from outside parties. |
|
| Interest cover | The number of times profit before interest exceeds net interest payable. |
|
| Interest payable | Interest expense. |
|
| Interest receivable | Interest income. |
|
| Non-equity minority interest | Preference shares issued by a subsidiary to outside parties. |
|
| Preference shares | Shares issued at varying dividend rates that are treated as outside interests. |
|
| Profit | Income. |
|
| Profit and loss account reserve | Retained earnings. |
|
| Profit attributable to shareholders | Net income. |
|
| Share capital | Ordinary Shares, capital stock or common stock issued and fully paid. |
|
| Share option | Stock option. |
|
| Share premium account | Additional paid-up capital or paid-in surplus (not distributable). |
|
| Shares in issue | Shares outstanding. |
|
| Statement of total recognised gains and losses | Statement of comprehensive income. |
|
| Stocks | Inventories. |
|
| Subsidiary undertaking | An affiliate in which GlaxoSmithKline holds a majority shareholding and/or exercises control. |
|
| Tangible fixed assets | Property, plant and equipment. |
|
| Turnover | Revenue. |
|
|
| | |
Back to Contents
Contact details
INTERNET
Information for investors and about the company is available on GlaxoSmithKline’s corporate website at www.gsk.com
HEAD OFFICE AND REGISTERED OFFICE
GlaxoSmithKline plc
980 Great West Road
Brentford
Middlesex TW8 9GS
Tel: +44 (0)20 8047 5000
UNITED KINGDOM
Investor relations
980 Great West Road
Brentford
Middlesex TW8 9GS
Tel: +44 (0)20 8047 5557 / 5558
Fax: +44 (0)20 8047 7807
Registrar
Lloyds TSB Registrars
The Causeway
Worthing
West Sussex BN99 6DA
www.shareview.co.uk
General enquiries, Annual Report orderline and
Corporate Nominee service
Tel: 0870 600 3991 inside the UK
Tel: +44 (0)121 415 7067 outside the UK
Shareholder Investment Plans
Dividend re-investment enquiries
Tel: 0870 241 3018 inside the UK
Tel: +44 (0)121 415 7067 outside the UK - Ordinary holders
Tel: +44 (0)121 415 7146 outside the UK - Employees
Monthly Savings Plan enquiries
Tel: 0870 606 0268 inside the UK
Tel: +44 (0)131 527 3746 outside the UK
ISA enquiries
Tel: 0870 242 4244 inside the UK
Tel: +44 (0)1903 854 062 outside the UK
Glaxo Wellcome and SmithKline Beecham corporate PEPs
The Share Centre Limited
Oxford House
Oxford Road
Aylesbury
Bucks HP21 8SZ
Tel: +44 (0)1296 414 144
Corporate Share dealing facility
Smith Barney
Attn: GSK Services
Citigroup Centre, Level 20
Canada Square, Canary Wharf
London E14 5LB
Tel: +44 (0)20 7508 1795
Fax: +44 (0)20 7890 7281
TheBalaesGroup@Citigroup.com
UNITED STATES OF AMERICA
Investor relations
One Franklin Plaza
PO Box 7929
Philadelphia PA 19101
Tel: 1 888 825 5249 toll free
Tel: +1 215 751 7003 outside the USA
Fax: +1 215 751 3233
ADR programme administrator
The Bank of New York
Shareholder Relations
PO Box 11258
Church Street Station
New York NY 10286-1258
www.adrbny.com
Tel: 1 877 353 1154 toll free
Tel: +1 610 382 7836 outside the USA
Customer response center
Tel: 1 888 825 5249 toll free
Corporate Share dealing facility
Smith Barney
Attn: GSK Services
53 State Street
39th Floor
Boston, MA 02109
Tel: 1 800 347 6179 toll free
Tel: +1 617 589 3341 outside the USA
Fax: +1 617 589 3474
TheTaylorGroup@SmithBarney.com
Printed by The Midas Press in the UK. The paper used in the production of this document is made from pulp harvested from sustainable forests, also using sawmill residues and forest thinnings. It is elemental chlorine-free.
Back to Contents

Back to Contents
Signature
The registrant hereby certifies that it meets all of the requirements for filing on Form 20-F and that it has duly caused and authorized the undersigned to sign this annual report on its behalf.
| | GlaxoSmithKline plc |
| | | |
| | | |
| March 8, 2005 | By: | /s/ John Coombe
John Coombe
Chief Financial Officer |
| | | |
Back to Contents
Item 19 Exhibits
Exhibit Index