The following vesting schedules apply to awards made in 2003, 2004 and 2006.
In his capacity as SVP, Worldwide Business Development, Dr Slaoui was eligible to participate in the GSK Share Value Plan. Both Dr Slaoui and his wife, as an employee of GSK, received awards under the Share Value Plan. Following the announcement of his appointment to the Board, in February 2006, he ceased to be eligible to receive awards under this plan. The awards are subject to a 3-year vesting period and the vesting is contingent on their continued employment with GSK.
The Mid-Term Incentive Plan (MTIP) was a share award scheme operated by SmithKline Beecham. The plan closed to new entrants upon completion of the merger and no further participations have been granted.
Where a final award of ADSs is made, receipt of the award may be deferred by a Director. Dr Garnier deferred receipt of the full amounts vested in 1999, 2000, 2001, 2002 and 2003. The deferred awards, together with any additional ADSs subsequently received through dividend reinvestment, are not included in the Directors’ interests table on page 76 since they are retained in the MTIP until paid out.
Back to Contents
| |
| Remuneration Report |
| continued |
|
| |
| | | | Average |
| Stock Appreciation Rights (SARs) – ADSs | At 31.12.05 | At 17.05.06 | grant price |
|
| Dr L Shapiro | 872 | 872 | $57.25 |
|
Dr Shapiro did not exercise any SARS in 2006. Her gain on exercise in 2005 was $6,380.
All SARs held by Dr Shapiro had a grant price above the market price of a GlaxoSmithKline ADS at 17th May 2006, the date she retired from the Board of GlaxoSmithKline.
Dr Shapiro is a member of GlaxoSmithKline’s Scientific Advisory Board (SAB). Dr Shapiro was a member of SmithKline Beecham’s SAB from 1993 until the completion of the merger with Glaxo Wellcome. Along with other members of the SAB, she received annual grants of SmithKline Beecham SARs which, in general, vested three years from the date of grant and will expire 10 years from the date of grant. Grants of SARs to SAB members ceased in 1999.
SARs entitle the holder to a cash sum at a future date based on share price growth between the date of grant and the date of exercise. Full provision is made in the financial statements for accrued gains on SARs from the date of grant. In connection with the merger, all previously granted SARs became immediately exercisable.
Pensions
The accrued annual pension benefits and transfer values for Executive Directors on retirement are set out below.
The regulations require disclosure of the accrued benefit at the end of the year, the change in accrued benefit over the year, the transfer value at both the beginning and end of the year, and the change in the transfer value over the year. The Listing Rules require additional disclosure of the change in the accrued benefit net of inflation and the transfer value of this change. Pensions for the Executive Directors have been disclosed in the currency in which the pension is payable.
| | | | | | | | | | | | Personal | | | | | | | | | | | | Change in | | | | |
| | | | | | | | | Change in | | | contributions | | | | | | | | | | | | accrued | | | Transfer value | |
| | | Accrued | | | Accrued | | | accrued | | | made to the | | | Transfer | | | Transfer | | | Change | | | benefit over | | | of change | |
| | | benefit at | | | benefit at | | | benefit | | | scheme during | | | value at | | | value | | | in transfer | | | year net | | | in accrued | |
| | | 31.12.05 | | | 31.12.06 | | | over year | | | the year | | | 31.12.05 | | | at 31.12.06 | | | value* | | | of inflation | | | benefit* | |
| | | 000 | | | 000 | | | 000 | | | 000 | | | 000 | | | 000 | | | 000 | | | 000 | | | 000 | |
|
| Current Executive Directors | | | | | | | | | | | | | | | | | | | | | | | | | | | |
| Dr JP Garnier | $ | 1,093 | | $ | 1,202 | | $ | 109 | | | – | | $ | 13,240 | | $ | 14,680 | | $ | 1,440 | | $ | 87 | | $ | 1,440 | |
|
| Dr M Slaoui | | – | | $ | 26 | | $ | 26 | | | – | | | – | | $ | 131 | | $ | 131 | | $ | 26 | | $ | 131 | |
| | € | 52 | | € | 53 | | € | 1 | | | – | | € | 493 | | € | 538 | | € | 45 | | | – | | € | 45 | |
|
| Mr J Heslop | £ | 75 | | £ | 111 | | £ | 36 | | £ | 11 | | £ | 1,260 | | £ | 1,930 | | £ | 659 | | £ | 34 | | £ | 415 | |
|
| Former Executive Directors | | | | | | | | | | | | | | | | | | | | | | | | | | | |
| Dr T Yamada | $ | 168 | | $ | 169 | | $ | 1 | | | – | | $ | 1,985 | | $ | 2,110 | | $ | 125 | | | – | | $ | 125 | |
|
| * | These are shown net of contributions made by the individual. |
Dr Garnier is a member of the All Employee US Cash Balance Pension Plan, under which GlaxoSmithKline makes annual contributions calculated as a percentage of the employee’s base salary and bonus. GlaxoSmithKline makes annual contributions of 15% of Dr Garnier’s annual salary and bonus, as detailed in his contract. The fund increases at an interest rate set annually in advance based on the 30 year US treasury bond rate to provide a cash sum at retirement. This cash sum is used to purchase a pension at retirement based on the annuity rates applicable at that time. The plan has no entitlement to a spouse’s pension or to pension increases, other than by reducing the executive’s own initial pension.
The transfer value, or cash sum, of Dr Garnier’s plan has increased by $1,440,430 over the year as a result of further accumulation of interest and contributions paid by the company.
With effect from 1st June 2006, Dr Slaoui became a member of the US Executive Cash Balance Pension Plan, under which GlaxoSmithKline makes annual contributions calculated as a percentage of the executive’s base salary. GlaxoSmithKline makes annual contributions of 38% of Dr Slaoui’s annual salary. The fund increases at an interest rate set annually in advance based on the 30 year US treasury bond rate to provide a cash sum at retirement. This cash sum is used to purchase a pension at retirement based on the annuity rates applicable at that time. The plan has no entitlement to a spouse’s pension or to pension increases, other than by reducing the executive's own initial pension.
Dr Slaoui was an active participant of the Belgium Fortes Plan until 31st May 2006. This plan is a defined benefit plan with a lump sum payable at Normal Retirement age for the plan which is 60 years of age. The transfer value, or cash sum, of Dr Slaoui’s plan has increased by ¤45,042 over the year as a result of the further accumulation of interest and contributions paid by the company.
Mr Heslop participates in the Glaxo Wellcome Defined Benefit Plan with an accrual rate of 1/30th of final pensionable salary per annum. In 2000 all benefits accrued under the Glaxo Wellcome UK pension arrangements were augmented by the Trustees of the plans by 5% to reflect a distribution of surplus. This augmentation will apply to that element of Mr Heslop’s pension earnings before 31st March 2000.
Back to Contents
| |
| Remuneration Report |
| continued |
|
Mr Heslop’s transfer value has been calculated on the basis of actuarial advice in accordance with Actuarial Guidance Note GN11. The transfer value represents the present value of future payments to be made under the pension plan. Mr Heslop’s annual accrued benefit has increased by £36,401 (£34,389 excluding the effects of inflation), and the transfer value less personal contributions has increased by £658,794 over the year. The increase in Mr Heslop’s pensionable salary of £80,000 is the primary reason for the increase in transfer value.
Dr Yamada retired on 31st May 2006, as a member of the All Employee US Cash Balance Pension Plan, under which GlaxoSmithKline makes annual contributions calculated as a percentage of the employee’s base salary and bonus. GlaxoSmithKline made annual contributions of 18% of Dr Yamada’s annual salary and bonus (as detailed in his contract). The fund increases at an interest rate set annually in advance based on the 30 year US treasury bond rate to provide a cash sum at retirement. This cash sum is used to purchase a pension at retirement based on the annuity rates applicable at that time. The plan has no entitlement to a spouse’s pension or to pension increases, other than by reducing the executive’s own initial pension. Dr Yamada commenced his pension benefit in the form of an annuity on 1st June 2006.
Dr Garnier, Dr Slaoui and Dr Yamada are also members of the US Retirement Savings Plan, a savings scheme open to all US employees and the Executive Supplemental Savings Plan, a savings scheme open to executives to restore US government limits imposed on the Retirement Savings Plan. Contributions to both plans are invested in a range of funds and the value of the accumulated funds is paid at retirement. During 2006, contributions of $183,840 (£99,373) were paid into these two schemes by the company in respect of Dr Garnier. In respect of Dr Slaoui, contributions of $20,354 (£11,002) were paid into the scheme. In respect of Dr Yamada, contributions of $62,494 (£33,781) were paid into the scheme.
Directors and Senior Management
For US reporting purposes, it is necessary to provide information on compensation and interests of Directors and Senior Management as a group (‘the group’). For the purpose, the group is defined as the Directors, members of the CET and the Company Secretary. For the financial year 2006, the total compensation paid to members of the group for the periods during which they served in that capacity was £14,906,027, the aggregate increase in accrued pension benefits, net of inflation, was £290,013 and the aggregate payment to defined contribution schemes was £446,115. During 2006, the group were granted 887,150 share options and 1,060,000 ADS options under the Share Option Scheme, 383,070 shares and 462,000 ADSs under the Performance Share Plan and were awarded 3,160 shares under the Share Value Plan. Members of the group were also awarded 21,339 shares and 38,458 ADSs through the reinvestment of dividends in the Performance Share Plan.
At 23rd February 2007, the group (comprising 25 persons) owned 573,400 shares and 346,738 ADSs, constituting less than 1% of the issued share capital of the company. The group also held, at that date: options to purchase 6,302,356 shares and 7,720,807 ADSs; 1,104,369 shares and 1,611,659 ADSs awarded under the Performance Share Plan, including those shares and ADSs that are vested and deferred; 222,403 vested and deferred ADSs under the legacy SmithKline Beecham Mid-Term Incentive Plan and 21,020 shares and 3,850 ADSs awarded under the Share Value Plan. These holdings were issued under the various executive share option plans described in Note 40 to the financial statements, ‘Employee share schemes’.
Directors’ interests in contracts
Except as described in Note 33 to the financial statements, ‘Related party transactions’, during or at the end of the financial year no Director or connected person had any material interest in any contract of significance in relation to the Group’s business with a Group company.
The Directors’ Remuneration Report has been approved by the Board of Directors and signed on its behalf by
Sir Christopher Gent
Chairman
28th February 2007
<Back to Contents
<Back to Contents
| |
| Directors’ statements of responsibility |
| |
|
| |
Directors’ statement of responsibility in relation to the consolidated financial statements
The Directors are responsible for:
| • | ensuring the maintenance of proper accounting records, whichdisclose with reasonable accuracy the financial position of the Groupat any time and from which financial statements can be preparedto comply with the Companies Act 1985 and Article 4 of the IASRegulation |
| | |
| • | preparing financial statements for each financial period which givea true and fair view, in accordance with IFRS as adopted for use inthe European Union, of the state of affairs of the Group as at theend of the financial period and of the profit or loss for that period |
| | |
| • | ensuring the operation of systems of internal control and for takingreasonable steps to safeguard the assets of the Group and forpreventing and detecting fraud and other irregularities. |
The financial statements for the year ended 31st December 2006, comprising principal statements and supporting notes, are set out in ‘Financial statements’ on pages 86 to 164 of this report.
The Directors confirm that suitable accounting policies have been consistently applied in the preparation of the financial statements, supported by reasonable and prudent judgements and estimates as necessary.
The responsibilities of the auditors in relation to the financial statements are set out in the Independent Auditors’ report (page 85 opposite).
The financial statements for the year ended 31st December 2006 are included in the Annual Report 2006, which is published in hard-copy printed form and made available on the website. The Directors are responsible for the maintenance and integrity of the Annual Report on the website in accordance with UK legislation governing the preparation and dissemination of financial statements. Access to the website is available from outside the UK, where comparable legislation may be different.
Disclosure of information to auditors
The Directors, in office at the date of this Report, have each confirmed that:
| • | so far as they are aware, there is no relevant audit information ofwhich the company’s auditors are unaware; and |
| | |
| • | each Director has taken all the steps that he/she ought to have takenas a Director to make himself/herself aware of any relevant auditinformation and to establish that the company’s auditors are awareof that information. |
This confirmation is given and should be interpreted in accordance with the provisions of Section 234 ZA of the Companies Act 1985.
Directors’ remuneration
The Remuneration Report on pages 65 to 82 sets out the remuneration policies operated by GlaxoSmithKline and disclosures on Directors’ remuneration and other disclosable information relating to Directors and officers and their interests. It has been prepared in accordance with the Companies Act 1985 and complies with Section B of the Combined Code on Corporate Governance.
Going concern basis
After making enquiries, the Directors have a reasonable expectation that the Group has adequate resources to continue in operational existence for the foreseeable future. For this reason, they continue to adopt the going concern basis in preparing the financial statements.
Internal control
The Board, through the Audit Committee, has reviewed the assessment of risks and the internal control framework that operates in GlaxoSmithKline and has considered the effectiveness of the system of internal control in operation in the Group for the year covered by this report and up to the date of its approval by the Board of Directors.
The Combined Code
The Board considers that GlaxoSmithKline plc applies the principles of the Combined Code on Corporate Governance of the Financial Reporting Council, as described under ‘Corporate governance’ on pages 53 to 63, and has complied with its provisions except as described on page 62.
As required by the Listing Rules of the Financial Services Authority, the auditors have considered the Directors’ statement of compliance in relation to those points of the Combined Code which are specified for their review.
Annual Report
The Annual Report for the year ended 31st December 2006, comprising the Report of the Directors, the Remuneration Report, the Financial statements and additional information for investors, has been approved by the Board of Directors and signed on its behalf by
Sir Christopher Gent
Chairman
28th February 2007
<Back to Contents
| |
| Report of Independent Registered Public Accounting Firm |
| To the Board of Directors and Shareholders of GlaxoSmithKline plc |
|
| |
We have completed an integrated audit of GlaxoSmithKline’s 2006 consolidated financial statements and of its internal control over financial reporting as of 31st December 2006 and an audit of its 2005 and 2004 consolidated financial statements in accordance with the standards of the Public Company Accounting Oversight Board (United States). Our opinions, based on our audits, are presented below.
Consolidated financial statements
In our opinion, the accompanying consolidated balance sheets and the related consolidated income statements, consolidated statements of cash flows and, consolidated statements of recognised income and expense present fairly, in all material respects, the financial position of GlaxoSmithKline and its subsidiaries at 31st December 2006 and 2005 and the results of their operations and cash flows for each of the three years in the period ended 31st December 2006, in conformity with International Financial Reporting Standards (IFRSs) as adopted by the European Union. These financial statements are the responsibility of GlaxoSmithKline’s management. Our responsibility is to express an opinion on these financial statements based on our audits. We conducted our audits of these financial statements in accordance with the standards of the Public Company Accounting Oversight Board (United States). Those standards require that we plan and perform the audit to obtain reasonable assurance about whether the financial statements are free of material misstatement. An audit of financial statements includes examining, on a test basis, evidence supporting the amounts and disclosures in the financial statements, assessing the accounting principles used and significant estimates made by management, and evaluating the overall financial statements presentation. We believe that our audits present a reasonable basis for our opinion.
IFRSs as adopted by the European Union vary in certain significant respects from accounting principles generally accepted in the United States of America. Information relating to the nature and effect of such differences is presented in Note 41 to the consolidated financial statements.
Internal control over financial reporting
Also, in our opinion, management’s assessment, included in ‘Management’s annual report on internal control over financial reporting’ on page 64, that the Group maintained effective internal control over financial reporting as of 31st December 2006 based on criteria established in Internal Control – Integrated Framework issued by the Committee of Sponsoring Organizations of the Treadway Commission (COSO) is fairly stated, in all material respects, based on those criteria. Furthermore, in our opinion, the Group maintained, in all material respects, effective internal control over financial reporting as of 31st December 2006, based on criteria established in Internal Control – Integrated Framework issued by the COSO. The Group’s management is responsible for maintaining effective internal control over financial reporting and for its assessment of the effectiveness of internal control over financial reporting. Our responsibility is to express opinions on management’s assessment and on the effectiveness of the Group’s internal control over financial reporting based on our audit.
We conducted our audit of internal control over financial reporting in accordance with the standards of the Public Company Accounting Oversight Board (United States). Those standards require that we plan and perform the audit to obtain reasonable assurance about whether effective internal control over financial reporting was maintained in all material respects. An audit of internal control over financial reporting includes obtaining an understanding of internal control over financial reporting, evaluating management’s assessment, testing and evaluating the design and operating effectiveness of internal control, and performing such other procedures as we consider necessary in the circumstances. We believe that our audit provides a reasonable basis for our opinions.
A company’s internal control over financial reporting is a process designed to provide reasonable assurance regarding the reliability of financial reporting and the preparation of financial statements for external purposes in accordance with generally accepted accounting standards and principles. A company’s internal control over financial reporting includes those policies and procedures that (i) pertain to the maintenance of records that, in reasonable detail, accurately and fairly reflect the transactions and dispositions of the assets of the company; (ii) provide reasonable assurance that transactions are recorded as necessary to permit preparation of financial statements in accordance with generally accepted accounting standards and principles, and that receipts and expenditures of the company are being made only in accordance with authorisations of management and directors of the company; and (iii) provide reasonable assurance regarding prevention or timely detection of unauthorized acquisition, use, or disposition of the company’s assets that could have a material effect on the financial statements.
Because of its inherent limitations, internal control over financial reporting may not prevent or detect misstatements. Also, projections of any evaluation of effectiveness to future periods are subject to the risk that controls may become inadequate because of changes in conditions, or that the degree of compliance with the policies or procedures may deteriorate.
PricewaterhouseCoopers LLP
London
United Kingdom
28 February 2007
<Back to Contents
| |
| Consolidated income statement |
| for the year ended 31st December 2006 |
|
| |
| | | | 2006 | | 2005 | | 2004 | |
| | Notes | | £m | | £m | | £m | |
|
|
|
|
|
|
|
| |
| Turnover | 5 | | 23,225 | | 21,660 | | 19,986 | |
| Cost of sales | | | (5,010 | ) | (4,764 | ) | (4,360 | ) |
|
|
|
|
|
|
|
| |
| Gross profit | | | 18,215 | | 16,896 | | 15,626 | |
| Selling, general and administration | | | (7,257 | ) | (7,250 | ) | (7,201 | ) |
| Research and development | | | (3,457 | ) | (3,136 | ) | (2,904 | ) |
| Other operating income | 6 | | 307 | | 364 | | 235 | |
|
|
|
|
|
|
|
| |
| Operating profit | 7,8 | | 7,808 | | 6,874 | | 5,756 | |
| | | | | | | | | |
| Finance income | 9 | | 287 | | 257 | | 176 | |
| Finance costs | 10 | | (352 | ) | (451 | ) | (362 | ) |
| Share of after tax profits of associates and joint ventures | 11 | | 56 | | 52 | | 60 | |
| Profit on disposal of interest in associates | 36 | | – | | – | | 149 | |
|
|
|
|
|
|
|
| |
| Profit before taxation | | | 7,799 | | 6,732 | | 5,779 | |
| | | | | | | | | |
| Taxation | 12 | | (2,301 | ) | (1,916 | ) | (1,757 | ) |
|
|
|
|
|
|
|
| |
| Profit after taxation for the year | | | 5,498 | | 4,816 | | 4,022 | |
|
|
|
|
|
|
|
| |
| Profit attributable to minority interests | | | 109 | | 127 | | 114 | |
| Profit attributable to shareholders | | | 5,389 | | 4,689 | | 3,908 | |
|
|
|
|
|
|
|
| |
| | | | 5,498 | | 4,816 | | 4,022 | |
|
|
|
|
|
|
|
| |
| Basic earnings per share (pence) | 13 | | 95.5 | p | 82.6 | p | 68.1 | p |
| Diluted earnings per share (pence) | 13 | | 94.5 | p | 82.0 | p | 68.0 | p |
|
|
|
|
|
|
|
| |
<Back to Contents
| |
| Consolidated balance sheet |
| at 31st December 2006 |
|
| |
| | | | 2006 | | 2005 | |
| | Notes | | £m | | £m | |
|
|
|
|
|
| |
| Non-current assets | | | | | | |
| Property, plant and equipment | 15 | | 6,930 | | 6,652 | |
| Goodwill | 16 | | 758 | | 696 | |
| Other intangible assets | 17 | | 3,293 | | 3,383 | |
| Investments in associates and joint ventures | 18 | | 295 | | 276 | |
| Other investments | 19 | | 441 | | 362 | |
| Deferred tax assets | 12 | | 2,123 | | 2,214 | |
| Other non-current assets | 20 | | 721 | | 438 | |
|
|
|
|
|
| |
| Total non-current assets | | | 14,561 | | 14,021 | |
|
|
|
|
|
| |
| | | | | | | |
| Current assets | | | | | | |
| Inventories | 21 | | 2,437 | | 2,177 | |
| Current tax recoverable | 12 | | 186 | | 416 | |
| Trade and other receivables | 22 | | 5,317 | | 5,348 | |
| Liquid investments | 30 | | 1,035 | | 1,025 | |
| Cash and cash equivalents | 23 | | 2,005 | | 4,209 | |
| Assets held for sale | 24 | | 12 | | 2 | |
|
|
|
|
|
| |
| Total current assets | | | 10,992 | | 13,177 | |
|
|
|
|
|
| |
| Total assets | | | 25,553 | | 27,198 | |
|
|
|
|
|
| |
| | | | | | | |
| Current liabilities | | | | | | |
| Short-term borrowings | 30 | | (718 | ) | (1,200 | ) |
| Trade and other payables | 25 | | (4,871 | ) | (5,147 | ) |
| Current tax payable | 12 | | (621 | ) | (2,269 | ) |
| Short-term provisions | 27 | | (1,055 | ) | (895 | ) |
|
|
|
|
|
| |
| Total current liabilities | | | (7,265 | ) | (9,511 | ) |
|
|
|
|
|
| |
| | | | | | | |
| Non-current liabilities | | | | | | |
| Long-term borrowings | 30 | | (4,772 | ) | (5,271 | ) |
| Deferred tax provision | 12 | | (595 | ) | (569 | ) |
| Pensions and other post-employment benefits | 26 | | (2,339 | ) | (3,069 | ) |
| Other provisions | 27 | | (528 | ) | (741 | ) |
| Other non-current liabilities | 28 | | (406 | ) | (467 | ) |
|
|
|
|
|
| |
| Total non-current liabilities | | | (8,640 | ) | (10,117 | ) |
|
|
|
|
|
| |
| Total liabilities | | | (15,905 | ) | (19,628 | ) |
|
|
|
|
|
| |
| Net assets | | | 9,648 | | 7,570 | |
|
|
|
|
|
| |
| | | | | | | |
| Equity | | | | | | |
| Share capital | 31 | | 1,498 | | 1,491 | |
| Share premium account | 31 | | 858 | | 549 | |
| Retained earnings | 32 | | 6,965 | | 5,579 | |
| Other reserves | 32 | | 65 | | (308 | ) |
|
|
|
|
|
| |
| Shareholders’ equity | | | 9,386 | | 7,311 | |
|
|
|
|
|
| |
| Minority interests | | | 262 | | 259 | |
|
|
|
|
|
| |
| Total equity | | | 9,648 | | 7,570 | |
|
|
|
|
|
| |
Approved by the Board on 28th February 2007
Sir Christopher Gent
Chairman
<Back to Contents
| |
| Consolidated cash flow statement |
| for the year ended 31st December 2006 |
|
| |
| | | | | 2006 | | 2005 | | 2004 | |
| | | Notes | | £m | | £m | | £m | |
|
|
|
|
|
|
|
|
| |
| Cash flow from operating activities | | | | | | | | | |
| Cash generated from operations | | 34 | | 8,203 | | 7,665 | | 6,527 | |
| Taxation paid | | | | (3,846 | ) | (1,707 | ) | (1,583 | ) |
|
|
|
|
|
|
|
|
| |
| Net cash inflow from operating activities | | | | 4,357 | | 5,958 | | 4,944 | |
|
|
|
|
|
|
|
|
| |
| |
| Cash flow from investing activities | | | | | | | | | |
| Purchase of property, plant and equipment | | | | (1,366 | ) | (903 | ) | (788 | ) |
| Proceeds from sale of property, plant and equipment | | | | 43 | | 54 | | 53 | |
| Proceeds from sale of intangible assets | | | | 175 | | 221 | | – | |
| Purchase of intangible assets | | | | (224 | ) | (278 | ) | (255 | ) |
| Purchase of equity investments | | | | (57 | ) | (23 | ) | (103 | ) |
| Proceeds from sale of equity investments | | | | 32 | | 35 | | 58 | |
| Share transactions with minority shareholders | | 36 | | (157 | ) | (36 | ) | – | |
| Purchase of businesses, net of cash acquired | | 36 | | (273 | ) | (1,026 | ) | (297 | ) |
| Disposal of businesses and interest in associates | | 36 | | 5 | | (2 | ) | 230 | |
| Investments in associates and joint ventures | | 36 | | (13 | ) | (2 | ) | (2 | ) |
| Interest received | | | | 299 | | 290 | | 173 | |
| Dividends from associates and joint ventures | | | | 15 | | 10 | | 11 | |
|
|
|
|
|
|
|
|
| |
| Net cash outflow from investing activities | | | | (1,521 | ) | (1,660 | ) | (920 | ) |
|
|
|
|
|
|
|
|
| |
| |
| Cash flow from financing activities | | | | | | | | | |
| (Increase)/decrease in liquid investments | | | | (55 | ) | 550 | | (53 | ) |
| Proceeds from own shares for employee share options | | | | 151 | | 68 | | 23 | |
| Issue of share capital | | 31 | | 316 | | 252 | | 42 | |
| Share capital purchased for cancellation | | | | – | | – | | (201 | ) |
| Purchase of Treasury shares | | | | (1,348 | ) | (999 | ) | (799 | ) |
| Redemption of preference shares issued by subsidiary | | | | – | | – | | (489 | ) |
| Increase in long-term loans | | | | – | | 982 | | 1,365 | |
| Repayment of long-term loans | | | | – | | (70 | ) | (15 | ) |
| Net repayment of short-term loans | | | | (739 | ) | (857 | ) | (407 | ) |
| Net repayment of obligations under finance leases | | | | (34 | ) | (36 | ) | (22 | ) |
| Interest paid | | | | (414 | ) | (381 | ) | (350 | ) |
| Dividends paid to shareholders | | | | (2,598 | ) | (2,390 | ) | (2,475 | ) |
| Dividends paid to minority interests | | | | (87 | ) | (86 | ) | (73 | ) |
| Dividends paid on preference shares | | | | – | | – | | (2 | ) |
| Other financing cash flows | | | | 16 | | 53 | | 49 | |
|
|
|
|
|
|
|
|
| |
| Net cash outflow from financing activities | | | | (4,792 | ) | (2,914 | ) | (3,407 | ) |
|
|
|
|
|
|
|
|
| |
| |
| (Decrease)/increase in cash and bank overdrafts | | 35 | | (1,956 | ) | 1,384 | | 617 | |
| |
| Exchange adjustments | | | | (254 | ) | 233 | | (93 | ) |
| Cash and bank overdrafts at beginning of year | | | | 3,972 | | 2,355 | | 1,831 | |
|
|
|
|
|
|
|
|
| |
| Cash and bank overdrafts at end of year | | | | 1,762 | | 3,972 | | 2,355 | |
|
|
|
|
|
|
|
|
| |
| |
| Cash and bank overdrafts at end of year comprise: | | | | | | | | | |
| Cash and cash equivalents | | | | 2,005 | | 4,209 | | 2,467 | |
| Overdrafts | | | | (243 | ) | (237 | ) | (112 | ) |
|
|
|
|
|
|
|
|
| |
| | | | | 1,762 | | 3,972 | | 2,355 | |
|
|
|
|
|
|
|
|
| |
<Back to Contents
| |
| Consolidated statement of recognised income and expense |
| for the year ended 31st December 2006 |
|
| |
| | 2006 | | 2005 | | 2004 | |
| | £m | | £m | | £m | |
|
|
|
|
|
| |
| Exchange movements on overseas net assets | (390 | ) | 203 | | (47 | ) |
| Tax on exchange movements | (78 | ) | 99 | | (73 | ) |
| Fair value movements on available-for-sale investments | 84 | | (1 | ) | – | |
| Deferred tax on fair value movements on available-for-sale investments | (15 | ) | (10 | ) | – | |
| Exchange movements on goodwill in reserves | 31 | | 9 | | 6 | |
| Actuarial gains/(losses) on defined benefit plans | 429 | | (794 | ) | 108 | |
| Deferred tax on actuarial movements in defined benefit plans | (161 | ) | 257 | | (17 | ) |
| Fair value movements on cash flow hedges | (5 | ) | (4 | ) | – | |
| Deferred tax on fair value movements on cash flow hedges | 2 | | 1 | | – | |
|
|
|
|
|
| |
| Net losses recognised directly in equity | (103 | ) | (240 | ) | (23 | ) |
| Profit for the year | 5,498 | | 4,816 | | 4,022 | |
|
|
|
|
|
| |
| Total recognised income and expense for the year | 5,395 | | 4,576 | | 3,999 | |
|
|
|
|
|
| |
| |
| Total recognised income and expense for the year attributable to: | | | | | | |
| Shareholders | 5,307 | | 4,423 | | 3,906 | |
| Minority interests | 88 | | 153 | | 93 | |
|
|
|
|
|
| |
| | 5,395 | | 4,576 | | 3,999 | |
|
|
|
|
|
| |
Back to Contents
| |
| Notes to the financial statements |
|
| |
1 Presentation of the financial statements
Description of business
GlaxoSmithKline is a major global healthcare group which is engaged in the creation and discovery, development, manufacture and marketing of pharmaceutical products, including vaccines, over-the-counter (OTC) medicines and health-related consumer products. GlaxoSmithKline’s principal pharmaceutical products include medicines in the following therapeutic areas: central nervous system, respiratory, anti-virals, anti-bacterials, vaccines, oncology and emesis, metabolic, cardiovascular and urogenital.
Compliance with applicable law and IFRS
The financial statements have been prepared in accordance with the Companies Act 1985, Article 4 of the IAS Regulation and International Accounting Standards (IAS) and International Financial Reporting Standards (IFRS) and related interpretations, as adopted by the European Union.
For GSK, there are no differences between IFRS as adopted for use in the European Union and full IFRS as published by the International Accounting Standards Board.
Financial period
These financial statements cover the financial year from 1st January to 31st December 2006, with comparative figures for the financial years from 1st January to 31st December 2005 and, where appropriate, from 1st January to 31st December 2004.
Composition of the Group
A list of the subsidiary and associated undertakings which, in the opinion of the Directors, principally affected the amount of profit or the net assets of the Group is given in ‘Principal Group companies’, Note 42.
Composition of financial statements
The consolidated financial statements are drawn up in accordance with IFRS and with IFRS accounting presentation. The financial statements comprise:
| • | Consolidated income statement |
| • | Consolidated balance sheet |
| • | Consolidated cash flow statement |
| • | Consolidated statement of recognised income and expense |
| • | Notes to the financial statements. |
Additional information in accordance with the requirements of US generally accepted accounting principles (US GAAP) is included in the notes to the financial statements. In Note 41 a statement of differences, and reconciliations of net income and shareholders’ equity, between IFRS and US GAAP are provided.
Accounting convention
The financial statements have been prepared using the historical cost convention, modified for certain items carried at fair value, as stated in the accounting policies.
Accounting principles and policies
The preparation of the financial statements in conformity with generally accepted accounting principles requires management to make estimates and assumptions that affect the reported amounts of assets and liabilities and disclosure of contingent assets and liabilities at the date of the financial statements and the reported amounts of revenues and expenses during the reporting period. Actual results could differ from those estimates.
The financial statements have been prepared in accordance with the Group’s accounting policies approved by the Board and described in Note 2.
2 Accounting policies
Information on the application of these accounting policies, including areas of estimation and judgement is given under ‘Critical Accounting Policies’ in ‘Financial Review 2006’ on page 37.
Consolidation
The consolidated financial statements include:
| • | the assets and liabilities, and the results and cash flows, of thecompany and its subsidiaries, including ESOP Trusts |
| | |
| • | the Group’s share of the results and net assets of associates andjoint ventures. |
The financial statements of entities consolidated are made up to 31st December.
Entities over which the Group has the power to govern the financial and operating policies are accounted for as subsidiaries. Where the Group has the ability to exercise joint control, the entities are accounted for as joint ventures, and where the Group has the ability to exercise significant influence, they are accounted for as associates.
Interests acquired in entities are consolidated from the date the Group acquires control and interests sold are de-consolidated from the date control ceases.
Transactions and balances between subsidiaries are eliminated; no profit before tax is taken on sales between subsidiaries or on sales to joint ventures and associates until the products are sold to customers outside the Group. Deferred tax relief on unrealised intra-Group profit is accounted for only to the extent that it is considered recoverable.
Goodwill arising on the acquisition of interests in subsidiaries, joint ventures and associates, representing the excess of the acquisition cost over the Group’s share of the fair values of the identifiable assets, liabilities and contingent liabilities acquired, is capitalised as a separate item in the case of subsidiaries and as part of the cost of investment in the case of joint ventures and associates. Goodwill is denominated in the currency of the operation acquired. Where the cost of acquisition is below the fair value of the net assets acquired, the difference is recognised directly in the income statement.
The results and assets and liabilities of associates and joint ventures are incorporated into the consolidated financial statements using the equity method of accounting.
<Back to Contents
| |
| Notes to the financial statements |
| continued |
|
| |
2 Accounting policiescontinued
Foreign currency translation
Foreign currency transactions are booked in the functional currency of the Group company at the exchange rate ruling on the date of transaction. Foreign currency monetary assets and liabilities are retranslated into local currency at rates of exchange ruling at the balance sheet date. Exchange differences are included in the income statement.
Assets and liabilities, including related goodwill, of overseas subsidiaries, associates and joint ventures, are translated into Sterling at rates of exchange ruling at the balance sheet date. The results and cash flows of overseas subsidiaries, associates and joint ventures are translated into Sterling using average rates of exchange. Exchange adjustments arising when the opening net assets and the profits for the year retained by overseas subsidiaries, associates and joint ventures are translated into Sterling, less exchange differences arising on related foreign currency borrowings which hedge the Group’s net investment in these operations, are taken to a separate component of equity.
When translating into Sterling the assets, liabilities, results and cash flows of overseas subsidiaries, associates and joint ventures which are reported in currencies of hyper-inflationary economies, adjustments are made to reflect current price levels. Any loss on net monetary assets is charged to the consolidated income statement.
Revenue
Revenue is recognised in the income statement when goods or services are supplied or made available to external customers against orders received and when title and risk of loss passes to the customer. Turnover represents net invoice value after the deduction of discounts and allowances given and accruals for estimated future rebates and returns. The methodology and assumptions used to estimate rebates and returns are monitored and adjusted regularly in the light of contractual and legal obligations, historical trends, past experience and projected market conditions. Market conditions are evaluated using wholesaler and other third-party analyses, market research data and internally generated information. Turnover also includes co-promotion income where the Group records its share of the revenue but no related cost of sales. Value added tax and other sales taxes are excluded from revenue.
Expenditure
Expenditure is recognised in respect of goods and services received when supplied in accordance with contractual terms. Provision is made when an obligation exists for a future liability in respect of a past event and where the amount of the obligation can be reliably estimated. Manufacturing start-up costs between validation and the achievement of normal production are expensed as incurred. Advertising and promotion expenditure is charged to the income statement as incurred. Shipment costs on intercompany transfers are charged to cost of sales; distribution costs on sales to customers are included in selling, general and administrative expenditure. Restructuring costs are recognised in respect of the direct expenditure of a business reorganisation where the plans are sufficiently detailed and well advanced, and where appropriate communication to those affected has been undertaken.
Research and development
Research and development expenditure is charged to the income statement in the period in which it is incurred. Development expenditure is capitalised when the criteria for recognising an asset are met, usually when a regulatory filing has been made in a major market and approval is considered highly probable. Property, plant and equipment used for research and development is depreciated in accordance with the Group’s policy.
Environmental expenditure
Environmental expenditure related to existing conditions resulting from past or current operations and from which no current or future benefit is discernible is charged to the income statement. The Group recognises its liability on a site-by-site basis when it can be reliably estimated. This liability includes the Group’s portion of the total costs and also a portion of other potentially responsible parties’ costs when it is probable that they will not be able to satisfy their respective shares of the clean-up obligation. Recoveries of reimbursements are recorded as assets when virtually certain.
Legal and other disputes
Provision is made for anticipated settlement costs where a reasonable estimate can be made of the likely outcome of legal or other disputes against the Group. In addition, provision is made for legal or other expenses arising from claims received or other disputes. In respect of product liability claims related to products where there is sufficient history of claims made and settlements, an “incurred but not reported” (IBNR) actuarial technique is used to determine a reasonable estimate of the Group’s exposure to unasserted claims for those products and a provision is made on that basis.
No provision is made for other unasserted claims or where an obligation exists under a dispute but it is not possible to make a reasonable estimate. Costs associated with claims made by the Group against third parties are charged to the income statement as they are incurred.
Pensions and other post-employment benefits
The costs of providing pensions under defined benefit schemes are calculated using the projected unit credit method and spread over the period during which benefit is expected to be derived from the employees’ services, in accordance with the advice of qualified actuaries. Pension obligations are measured as the present value of estimated future cash flows discounted at rates reflecting the yields of high quality corporate bonds.
Pension scheme assets are measured at fair value at the balance sheet date. Actuarial gains and losses, differences between the expected and actual returns, and the effect of changes in actuarial assumptions are recognised in the statement of recognised income and expense in the year in which they arise. The Group’s contributions to defined contribution plans are charged to the income statement as incurred.
The costs of other post-employment liabilities are calculated in a similar way to defined benefit pension schemes and spread over the period during which benefit is expected to be derived from the employees’ services, in accordance with the advice of qualified actuaries.
<Back to Contents
| |
| Notes to the financial statements |
| continued |
|
| |
2 Accounting policies continued
Employee share plans
Incentives in the form of shares are provided to employees under share option and share award schemes. These options and awards are fair valued at their grant dates and the cost is charged to the income statement over the relevant vesting periods. This has been applied on a fully retrospective basis. The Group provides finance to ESOP Trusts to purchase company shares on the open market to meet the obligation to provide shares when employees exercise their options or awards. Costs of running the ESOP Trusts are charged to the income statement. Shares held by the ESOP Trusts are deducted from other reserves. A transfer is made between other reserves and retained earnings over the vesting periods of the related share options or awards to reflect the ultimate proceeds receivable from employees on exercise. If there is deemed to be a permanent impairment in value this is also reflected by a transfer to retained earnings.
Property, plant and equipment
Property, plant and equipment (PP&E) is stated at the cost of purchase or construction less provisions for depreciation and impairment. Financing costs are not capitalised.
Depreciation is calculated to write off the cost less residual value of PP&E, excluding freehold land, using the straight-line basis over the expected useful life. Residual values and lives are reviewed and, where appropriate, adjusted annually. The normal expected useful lives of the major categories of PP&E are:
|
|
| Freehold buildings | 20 to 50 years |
| Leasehold land and buildings | Lease term or 20 to 50 years |
| Plant and machinery | 10 to 20 years |
| Fixtures and equipment | 3 to 10 years |
|
|
On disposal of PP&E, the cost and related accumulated depreciation and impairments are removed from the financial statements and the net amount, less any proceeds, is taken to the income statement.
Leases
Leasing agreements which transfer to the Group substantially all the benefits and risks of ownership of an asset are treated as finance leases, as if the asset had been purchased outright. The assets are included in PP&E or computer software and the capital elements of the leasing commitments are shown as obligations under finance leases. Assets held under finance leases are depreciated on a basis consistent with similar owned assets or the lease term if shorter. The interest element of the lease rental is included in the income statement. All other leases are operating leases and the annual rentals are included in the income statement on a straight-line basis over the lease term.
Goodwill
Goodwill is stated at cost less impairments. Goodwill is deemed to have an indefinite useful life and is tested for impairment annually.
Where the fair value of the interest acquired in an entity’s assets, liabilities and contingent liabilities exceeds the consideration paid, this excess is recognised immediately as a gain in the income statement.
Other intangible assets
Intangible assets are stated at cost less provisions for amortisation and impairments.
Licences, patents, know-how and marketing rights separately acquired or acquired as part of a business combination are amortised over their estimated useful lives, using the straight-line basis, from the time they are available for use. The estimated useful lives for determining the amortisation charge are reviewed annually, and take into account the estimated time it takes to bring the compounds or products to market. Any development costs incurred by the Group and associated with acquired licences, patents, know-how or marketing rights are written off to the income statement when incurred, unless the criteria for recognition of an internally generated intangible asset are met, usually when a regulatory filing has been made in a major market and approval is considered highly probable.
Brands are valued independently as part of the fair value of businesses acquired from third parties where the brand has a value which is substantial and long-term and where the brands can be sold separately from the rest of the businesses acquired. Brands are amortised over their estimated useful lives, except where it is considered that the useful economic life is indefinite.
The costs of acquiring and developing computer software for internal use and internet sites for external use are capitalised as intangible fixed assets where the software or site supports a significant business system and the expenditure leads to the creation of a durable asset. ERP systems software is amortised over seven years and other computer software over three to five years.
Impairment of non-current assets
The carrying values of all non-current assets are reviewed for impairment when there is an indication that the assets might be impaired. Additionally, goodwill, intangible assets with indefinite useful lives and intangible assets which are not yet available for use are tested for impairment annually. Any provision for impairment is charged to the income statement in the year concerned.
Investments in associates and joint ventures
Investments in associates and joint ventures are carried in the consolidated balance sheet at the Group’s share of their net assets at date of acquisition and of their post-acquisition retained profits or losses together with any goodwill arising on the acquisition.
<Back to Contents
| |
| Notes to the financial statements |
| continued |
|
| |
2 Accounting policiescontinued
Available-for-sale investments
Liquid investments and other investments are treated as available-for-sale investments and are initially recorded at cost and then remeasured at subsequent reporting dates to fair value. Unrealised gains and losses on available-for-sale investments are recognised directly in equity. On disposal or impairment of the investments, the gains and losses in equity are recycled into the income statement. Equity investments are recorded in non-current assets unless they are expected to be sold within one year.
Purchases and sales of equity investments are accounted for on the trade date and purchases and sales of other available-for-sale investments are accounted for on settlement date.
In 2004 equity investments are recorded at cost.
Inventories
Inventories are included in the financial statements at the lower of cost (including raw materials, direct labour, other direct costs and related production overheads) and net realisable value. Cost is generally determined on a first in, first out basis. Pre-launch inventory is held as an asset when there is a high probability of regulatory approval for the product. Before that point a provision is made against the carrying value to its recoverable amount, which is then reversed at the point when a high probability of regulatory approval is determined.
Trade receivables
Trade receivables are carried at original invoice amount less any provisions for doubtful debts. Provisions are made where there is evidence of a risk of non-payment, taking into account ageing, previous experience and general economic conditions. Receivables are discounted where the effect is material.
Cash and cash equivalents
Cash and cash equivalents comprise cash in hand, current balances with banks and similar institutions and highly liquid investments with maturities of three months or less when acquired. They are readily convertible into known amounts of cash and have an insignificant risk of changes in value.
Taxation
Current tax is provided at the amounts expected to be paid applying tax rates that have been enacted or substantively enacted by the balance sheet date.
Deferred tax is provided in full, using the liability method, on temporary differences arising between the tax bases of assets and liabilities and their carrying amounts in the financial statements. Deferred tax assets are recognised to the extent that it is probable that future taxable profits will be available against which the temporary differences can be utilised.
Deferred tax is provided on temporary differences arising on investments in subsidiaries, associates and joint ventures, except where the timing of the reversal of the temporary difference can be controlled and it is probable that the temporary difference will not reverse in the foreseeable future.
Deferred tax is provided using rates of tax that have been enacted or substantively enacted by the balance sheet date. Deferred tax liabilities and assets are not discounted.
Discounting
Where the time effect of money is material, balances are discounted to current values using appropriate rates of interest. The unwinding of the discounts is recorded in finance income/costs.
Derivative financial instruments and hedging (2006 and 2005)
Derivative financial instruments are used to manage exposure to market risks from treasury operations. The principal derivative instruments used by GlaxoSmithKline are foreign currency swaps, interest rate swaps and forward foreign exchange contracts. The Group does not hold or issue derivative financial instruments for trading or speculative purposes.
Derivative financial instruments are initially recognised in the balance sheet at cost and then remeasured at subsequent reporting dates to fair value. Derivatives designated as hedging instruments are classified on inception as fair value hedges, cash flow hedges or net investment hedges. Changes in the fair value of derivatives designated as fair value hedges are recorded in the income statement, with the changes in the fair value of the hedged asset or liability.
Changes in the fair value of derivatives designated as cash flow hedges are recognised in equity, to the extent that the hedges are effective. Ineffective portions are recognised in profit or loss immediately. Amounts deferred in equity are recycled to the income statement when the hedged item affects profit or loss.
Hedges of net investments in foreign entities are accounted for in a similar way to cash flow hedges.
Changes in the fair value of any derivative instruments that do not qualify for hedge accounting are recognised immediately in the income statement.
Derivative financial instruments and hedging (2004 )
IAS 32 and 39 were adopted by the Group on 1st January 2005. In accordance with an exemption permitted under IFRS I, the 2004 information relating to financial instruments remains as reported under UK GAAP and applying the following policies.
Derivative contracts are treated from inception as an economic hedge of the underlying financial instrument with matching accounting treatment and cash flows. Derivative instruments no longer designated as hedges are restated at market value and any future changes in value are taken directly to the profit and loss account.
Currency swaps and forward exchange contracts used to fix the value of the related asset or liability in the contract currency and at the contract rate are accrued to the profit and loss account over the life of the contract.
Gains and losses on foreign exchange contracts designated as hedges of forecast foreign exchange transactions are deferred and included in the measurement of the related foreign currency transactions in the period they occur. Gains and losses on balance sheet hedges are accrued and are taken directly to reserves except that forward premiums/discounts are recognised as interest over the life of the contracts.
Interest differentials under interest swap agreements are recognised in the profit and loss account by adjustment of interest expense over the life of the agreement.
Back to Contents
| |
| Notes to the financial statements |
| continued |
|
| |
3 New accounting requirements
The following IFRS and IFRIC interpretations have been issued by the IASB and are likely to affect future Annual Reports, although none is expected to have a material impact on the results or financial position of the Group.
IFRS 7 ‘Financial instruments: disclosures’ was issued in August 2005 and is required to be implemented by GSK from 1st January 2007. This new standard incorporates the disclosure requirements of IAS 32, which it supersedes, and adds further quantitative and qualitative disclosures in relation to financial instruments.
Amendment to IAS 1 ‘Capital disclosures’ was issued in August 2005 and is required to be implemented by GSK from 1st January 2007. The amendment requires new disclosures about how an entity manages its capital resources.
IFRS 8 ‘Operating segments’ was issued in November 2006 and is required to be implemented by GSK from 1st January 2009. This standard replaces IAS 14 and aligns the segmental reporting requirements with those of the equivalent US standard. The new standard adopts a ‘management approach’ under which segmental information is to be disclosed on the same basis as that used for internal reporting purposes.
IFRIC 9 ‘Reassessment of embedded derivatives’ was issued in March 2006 and is required to be implemented by GSK from 1st January 2007. This interpretation clarifies that an embedded derivative should be assessed on its inception and only reassessed if there is a change in the terms of the relevant contract.
IFRIC 10 ‘Interim financial reporting and impairment’ was issued in July 2006 and is required to be implemented by GSK from 1st January 2007. Under this interpretation any impairment losses on goodwill and equity investments recognised in a quarterly interim statement may not be reversed in subsequent interim or annual financial statements.
IFRIC 11 ‘IFRS 2 - Group and treasury share transactions’ was issued in November 2006 and is required to be implemented by GSK from 1st January 2008. This interpretation provides guidance on whether share-based transactions involving group entities should be accounted for as equity settled or cash settled transactions.
4 Exchange rates
The Group uses the average of exchange rates prevailing during the period to translate the results and cash flows of overseas subsidiaries, joint ventures and associated undertakings into Sterling and period end rates to translate the net assets of those undertakings. The currencies which most influence these translations, and the relevant exchange rates, were:
| | | 2006 | | 2005 | | 2004 | |
|
|
|
|
|
|
| |
| Average rates: | | | | | | | |
| £/US$ | | 1.85 | | 1.82 | | 1.83 | |
| £/Euro | | 1.47 | | 1.46 | | 1.47 | |
| £/Yen | | 215 | | 200 | | 197 | |
| Period end rates: | | | | | | | |
| £/US$ | | 1.96 | | 1.72 | | 1.92 | |
| £/Euro | | 1.48 | | 1.46 | | 1.41 | |
| £/Yen | | 233 | | 203 | | 197 | |
|
|
|
|
|
|
| |
5 Segment information
The Group’s primary segment reporting is by business sector with geographical reporting being the secondary format. The business sectors consist of Pharmaceuticals (prescription pharmaceuticals and vaccines) and Consumer Healthcare (oral care, OTC medicines and nutritional healthcare). The geographical sectors of the USA, Europe and International (other Rest of World markets) reflect the Group’s most significant regional markets and are consistent with the Group’s regional market management reporting structure. Business sector data includes an allocation of corporate costs to each sector on an appropriate basis. There are no sales between business sectors.The Group’s activities are organised on a global basis. The geographical sector figures are therefore influenced by the location of the Group’s operating resources, in particular manufacturing and research, and by variations over time in intra-Group trading and funding arrangements. Turnover is shown by business sector, by location of customer and by location of subsidiary. Other geographic information is given by location of subsidiary. The UK segment information gives turnover by location of customer and location of subsidiary. The UK operating profit, total assets and net assets are also shown. Where the Group co-promotes a product and the third party records the sale, the Group records its share of revenue as co-promotion income within turnover. The nature of co-promotion activities is such that the Group records no costs of sales. Pharmaceutical turnover includes co-promotion revenue of £182 million (2005 –£112 million, 2004 – £65 million).
<Back to Contents
| |
| Notes to the financial statements |
| continued |
|
5 Segment informationcontinued
| Turnover by business sector | 2006 | | 2005 | | 2004 | |
| £m | £m | £m |
|
|
|
|
|
| |
| Pharmaceuticals | 20,078 | | 18,661 | | 17,100 | |
| Consumer Healthcare | 3,147 | | 2,999 | | 2,886 | |
|
|
|
|
|
| |
| Turnover | 23,225 | | 21,660 | | 19,986 | |
|
|
|
|
|
| |
| Profit by business sector | | | | | | |
|
|
|
|
|
| |
| Pharmaceuticals | 7,125 | | 6,159 | | 5,126 | |
| Consumer Healthcare | 683 | | 715 | | 630 | |
|
|
|
|
|
| |
| Operating profit | 7,808 | | 6,874 | | 5,756 | |
|
|
|
|
|
| |
| Finance income | 287 | | 257 | | 176 | |
| Finance costs | (352 | ) | (451 | ) | (362 | ) |
| Share of after tax profits of associates and joint ventures: | | | | | | |
| Pharmaceuticals | 56 | | 52 | | 60 | |
| Consumer Healthcare | – | | – | | – | |
| Profit on disposal of interest in associates | – | | – | | 149 | |
|
|
|
|
|
| |
| Profit before taxation | 7,799 | | 6,732 | | 5,779 | |
|
|
|
|
|
| |
| Taxation | (2,301 | ) | (1,916 | ) | (1,757 | ) |
|
|
|
|
|
| |
| Profit after taxation for the year | 5,498 | | 4,816 | | 4,022 | |
|
|
|
|
|
| |
| Investments in associates and joint ventures by business sector | | | | | | |
|
|
|
| | | |
| Pharmaceuticals | 295 | | 276 | | | |
| Consumer Healthcare | – | | – | | | |
|
|
|
| | | |
| Investment in associates and joint ventures | 295 | | 276 | | | |
|
|
|
| | | |
| Property, plant and equipment and other intangible assets by business sector | | | | | | |
|
|
|
| | | |
| Additions | | | | | | |
| Pharmaceuticals | 1,795 | | 2,031 | | | |
| Consumer Healthcare | 139 | | 164 | | | |
|
|
|
| | | |
| Total additions | 1,934 | | 2,195 | | | |
|
|
|
| | | |
| Depreciation/amortisation | | | | | | |
| Pharmaceuticals | (849 | ) | (807 | ) | | |
| Consumer Healthcare | (109 | ) | (97 | ) | | |
|
|
|
| | | |
| Total depreciation/amortisation | (958 | ) | (904 | ) | | |
|
|
|
| | | |
| Impairment | | | | | | |
| Pharmaceuticals | (241 | ) | (92 | ) | | |
| Consumer Healthcare | (3 | ) | – | | | |
|
|
|
| | | |
| Total impairment | (244 | ) | (92 | ) | | |
|
|
|
| | | |
| Impairment reversal | | | | | | |
| Pharmaceuticals | 61 | | 3 | | | |
| Consumer Healthcare | – | | – | | | |
|
|
|
| | | |
| Total impairment reversal | 61 | | 3 | | | |
|
|
|
| | | |
<Back to Contents
| |
| Notes to the financial statements |
| continued |
|
5 Segment informationcontinued
| Total assets by business sector | 2006 | | 2005 | | | |
| £m | £m | |
|
|
|
| | | |
| Pharmaceuticals | 16,936 | | 16,431 | | | |
| Consumer Healthcare | 2,768 | | 2,446 | | | |
|
|
|
| | | |
| Total operating assets | 19,704 | | 18,877 | | | |
|
|
|
| | | |
| Investments in associates and joint ventures | 295 | | 276 | | | |
| Liquid investments | 1,035 | | 1,025 | | | |
| Derivative financial instruments | 193 | | 179 | | | |
| Cash and cash equivalents | 2,005 | | 4,209 | | | |
| Current and deferred taxation | 2,309 | | 2,630 | | | |
| Tangible assets held for sale | 12 | | 2 | | | |
|
|
|
| | | |
| Total assets | 25,553 | | 27,198 | | | |
|
|
|
| | | |
| |
| Total liabilities by business sector | | | | | | |
|
|
|
| | | |
| Pharmaceuticals | (8,148 | ) | (9,099 | ) | | |
| Consumer healthcare | (951 | ) | (1,070 | ) | | |
|
|
|
| | | |
| Total operating liabilities | (9,099 | ) | (10,169 | ) | | |
|
|
|
| | | |
| Short-term borrowings | (718 | ) | (1,200 | ) | | |
| Long-term borrowings | (4,772 | ) | (5,271 | ) | | |
| Derivative financial instruments | (100 | ) | (150 | ) | | |
| Current and deferred taxation | (1,216 | ) | (2,838 | ) | | |
|
|
|
| | | |
| Total liabilities | (15,905 | ) | (19,628 | ) | | |
|
|
|
| | | |
| |
| Net assets by business sector | | | | | | |
|
|
|
| | | |
| Pharmaceuticals | 8,788 | | 7,332 | | | |
| Consumer Healthcare | 1,817 | | 1,376 | | | |
|
|
|
| | | |
| Net operating assets | 10,605 | | 8,708 | | | |
| Net debt | (2,450 | ) | (1,237 | ) | | |
| Investments in associates and joint ventures | 295 | | 276 | | | |
| Derivative financial instruments | 93 | | 29 | | | |
| Current and deferred taxation | 1,093 | | (208 | ) | | |
| Tangible assets held for sale | 12 | | 2 | | | |
|
|
|
| | | |
| Net assets | 9,648 | | 7,570 | | | |
|
|
|
| | | |
| | | | | | | |
| Turnover by location of customer | 2006 | | 2005 | | 2004 | |
| £m | £m | £m |
|
|
|
|
|
| |
| USA | 11,102 | | 9,867 | | 9,191 | |
| Europe | 7,010 | | 6,892 | | 6,395 | |
| International | 5,113 | | 4,901 | | 4,400 | |
|
|
|
|
|
| |
| Turnover | 23,225 | | 21,660 | | 19,986 | |
|
|
|
|
|
| |
| |
| Turnover by location of subsidiary undertaking | | | | | | |
|
|
|
|
|
| |
| USA | 11,362 | | 10,185 | | 9,511 | |
| Europe | 14,007 | | 12,303 | | 11,192 | |
| International | 9,349 | | 8,547 | | 7,787 | |
|
|
|
|
|
| |
| Turnover including inter-segment turnover | 34,718 | | 31,035 | | 28,490 | |
|
|
|
|
|
| |
| USA | 339 | | 308 | | 327 | |
| Europe | 6,337 | | 4,836 | | 4,304 | |
| International | 4,817 | | 4,231 | | 3,873 | |
|
|
|
|
|
| |
| Inter-segment turnover | 11,493 | | 9,375 | | 8,504 | |
|
|
|
|
|
| |
| USA | 11,023 | | 9,877 | | 9,184 | |
| Europe | 7,670 | | 7,467 | | 6,888 | |
| International | 4,532 | | 4,316 | | 3,914 | |
|
|
|
|
|
| |
| External turnover | 23,225 | | 21,660 | | 19,986 | |
|
|
|
|
|
| |
<Back to Contents
| |
| Notes to the financial statements |
| continued |
|
5 Segment informationcontinued
| Property, plant and equipment and other intangible asset additions by location | 2006 | | 2005 | | | |
| £m | £m | |
|
|
|
| | | |
| USA | 637 | | 509 | | | |
| Europe | 1,020 | | 742 | | | |
| International | 277 | | 944 | | | |
|
|
|
| | | |
| Total additions | 1,934 | | 2,195 | | | |
|
|
|
| | | |
| |
| Total assets by location | | | | | | |
|
|
|
| | | |
| USA | 4,830 | | 4,459 | | | |
| Europe | 15,166 | | 16,423 | | | |
| International | 5,389 | | 5,020 | | | |
| Inter-segment trading balances | (5,681 | ) | (7,025 | ) | | |
|
|
|
| | | |
| Total operating assets | 19,704 | | 18,877 | | | |
|
|
|
| | | |
| Investments in associates and joint ventures | 295 | | 276 | | | |
| Liquid investments | 1,035 | | 1,025 | | | |
| Derivative financial instruments | 193 | | 179 | | | |
| Cash and cash equivalents | 2,005 | | 4,209 | | | |
| Current and deferred taxation | 2,309 | | 2,630 | | | |
| Tangible assets held for sale | 12 | | 2 | | | |
|
|
|
| | | |
| Total assets | 25,553 | | 27,198 | | | |
|
|
|
| | | |
| |
| Net assets by location | | | | | | |
|
|
|
| | | |
| USA | 919 | | 446 | | | |
| Europe | 11,151 | | 11,628 | | | |
| International | 4,216 | | 3,659 | | | |
| Inter-segment trading balances | (5,681 | ) | (7,025 | ) | | |
|
|
|
| | | |
| Net operating assets | 10,605 | | 8,708 | | | |
| Net debt | (2,450 | ) | (1,237 | ) | | |
| Investments in associates and joint ventures | 295 | | 276 | | | |
| Derivative financial instruments | 93 | | 29 | | | |
| Current and deferred taxation | 1,093 | | (208 | ) | | |
| Tangible assets held for sale | 12 | | 2 | | | |
|
|
|
| | | |
| Net assets | 9,648 | | 7,570 | | | |
|
|
|
| | | |
UK Segment
For the purposes of US GAAP information is given separately in respect of the UK, which, although included in the Group’s Europe market region, is considered the Group’s home segment for the purposes of segmental reporting.
| | 2006 | | 2005 | | 2004 | |
| £m | £m | £m |
|
|
|
|
|
| |
| Turnover by location of customer | 1,501 | | 1,431 | | 1,382 | |
|
|
|
|
|
| |
| Turnover including inter-segment turnover | 4,890 | | 4,414 | | 4,386 | |
| Inter-segment turnover | 3,086 | | 2,657 | | 2,709 | |
|
|
|
|
|
| |
| Turnover by location of subsidiary | 1,804 | | 1,757 | | 1,677 | |
|
|
|
|
|
| |
| Operating profit | 1,468 | | 1,576 | | 1,327 | |
|
|
|
|
|
| |
| Total assets | 6,208 | | 7,057 | | 6,521 | |
|
|
|
|
|
| |
| Net operating assets | 2,829 | | 2,290 | | 2,253 | |
|
|
|
|
|
| |
Back to Contents
| |
| Notes to the financial statements |
| continued |
|
6 Other operating income
| 2006 | | 2005 | | 2004 | |
| £m | | £m | | £m | |
|
|
|
|
|
| |
| Royalties | 112 | | 83 | | 96 | |
| Asset disposal profits | 169 | | 290 | | 146 | |
| Other income including fair value adjustments | 26 | | (9 | ) | (7 | ) |
|
|
|
|
|
| |
| 307 | | 364 | | 235 | |
|
|
|
|
|
| |
Royalties are principally a core of recurring income from the out-licensing of intellectual property. Asset disposal profits include product divestments and disposals of equity investments, intellectual property and tangible property. Other income includes equity investment carrying value adjustments arising from stock market changes and fair value adjustments arising on the Quest Collar and Theravance put and call options.
7 Operating profit
| 2006 | | 2005 | | 2004 | |
| £m | | £m | | £m | |
|
|
|
|
|
| |
| The following items have been charged in operating profit: | | | | | | |
| Employee costs (Note 8) | 5,495 | | 5,254 | | 5,054 | |
| Advertising | 759 | | 697 | | 599 | |
| Distribution costs | 276 | | 270 | | 266 | |
| Depreciation of property, plant and equipment | 732 | | 710 | | 691 | |
| Amortisation of intangible assets | 226 | | 194 | | 168 | |
| Net foreign exchange losses/(gains) | 36 | | (3 | ) | 72 | |
| Inventories: | | | | | | |
| Cost of inventories included in cost of sales | 4,480 | | 4,335 | | 4,032 | |
| Write-down of inventories | 146 | | 119 | | 142 | |
| Reversal of prior year write-down of inventories | (93 | ) | (61 | ) | (49 | ) |
| Operating lease rentals: | | | | | | |
| Minimum lease payments | 114 | | 104 | | 110 | |
| Contingent rents | 11 | | 12 | | 9 | |
| Sub-lease payments | 2 | | 1 | | – | |
| Fees payable to company’s auditor for the audit of parent company and | | | | | | |
| consolidated financial statements | 1.7 | | 1.4 | | 1.1 | |
| Fees payable to the company’s auditor and its associates for other services | 15.9 | | 13.1 | | 13.4 | |
|
|
|
|
|
| |
The reversals of prior year write-downs of inventories principally arise from the reassessment of usage or demand expectations prior to inventory expiration.
| 2006 | | 2005 | | 2004 | |
| Fees payable to the company’s auditor and its associates for other services | £m | | £m | | £m | |
|
|
|
|
|
| |
| Audit of accounts of the Group’s UK and overseas subsidiaries and related pension | | | | | | |
| schemes of the company, pursuant to legislation | 7.7 | | 6.7 | | 5.7 | |
| Other assurance services, pursuant to such legislation | 4.4 | | 2.6 | | 2.2 | |
| Other tax services | 1.9 | | 2.3 | | 3.0 | |
| All other services, including regulatory, compliance and treasury related services | 1.9 | | 1.5 | | 2.5 | |
|
|
|
|
|
| |
| 15.9 | | 13.1 | | 13.4 | |
|
|
|
|
|
| |
At 31st December 2006, the amount due to PricewaterhouseCoopers LLP and its associates for fees yet to be invoiced was £3.7 million, comprising statutory audit £3.4 million and taxation services £0.3 million.
Fees in respect of the GlaxoSmithKline plc pension scheme included above:
| 2006 | | 2005 | | 2004 | |
| £m | | £m | | £m | |
|
|
|
|
|
| |
| Audit | 0.3 | | 0.2 | | 0.2 | |
| Other services | 0.1 | | – | | – | |
|
|
|
|
|
| |
| 0.4 | | 0.2 | | 0.2 | |
|
|
|
|
|
| |
Back to Contents
| |
| Notes to the financial statements |
| continued |
|
8 Employee costs
| 2006 | | 2005 | | 2004 | |
| £m | | £m | | £m | |
|
|
|
|
|
| |
| Wages and salaries | 4,363 | | 4,152 | | 3,864 | |
| Social security costs | 461 | | 432 | | 430 | |
| Pension and other post-employment costs (see Note 26) | 377 | | 350 | | 347 | |
| Cost of share-based incentive plans | 226 | | 236 | | 333 | |
| Severance and other costs from integration and restructuring activities | 68 | | 84 | | 80 | |
|
|
|
|
|
| |
| | 5,495 | | 5,254 | | 5,054 | |
|
|
|
|
|
| |
The Group provides benefits to employees, commensurate with local practice in individual countries, including, in some markets, healthcare insurance, subsidised car schemes and personal life assurance.
| 2006 | | 2005 | | 2004 | |
| The average number of persons employed by the Group (including Directors) during the year | Number | | Number | | Number | |
|
|
|
|
|
| |
| Manufacturing | 32,403 | | 30,906 | | 31,427 | |
| Selling, general and administration | 53,665 | | 53,634 | | 53,513 | |
| Research and development | 15,734 | | 14,963 | | 14,897 | |
|
|
|
|
|
| |
| 101,802 | | 99,503 | | 99,837 | |
|
|
|
|
|
| |
The average number of Group employees excludes temporary and contract staff. The numbers of Group employees at the end of each financial year are given in the Financial record on page 175. The average number of persons employed by GlaxoSmithKline plc in 2006 was nil (2005 – nil).
The compensation of the Directors and Senior Management (members of the CET and the Company Secretary) in aggregate, was as follows:
| 2006 | | 2005 | | 2004 | |
| £m | | £m | | £m | |
|
|
|
|
|
| |
| Wages and salaries | 15 | | 17 | | 13 | |
| Social security costs | 1 | | 1 | | 1 | |
| Pension and other post-employment costs | 3 | | 3 | | 2 | |
| Cost of share-based incentive plans | 14 | | 15 | | 16 | |
|
|
|
|
|
| |
| 33 | | 36 | | 32 | |
|
|
|
|
|
| |
9 Finance income
| 2006 | | 2005 | | 2004 | |
| £m | | £m | | £m | |
|
|
|
|
|
| |
| Interest income | 262 | | 268 | | 173 | |
| Unwinding of discount on assets | 1 | | – | | 3 | |
| Interest on extended credit on receivables | 21 | | 8 | | – | |
| Net investment hedges | (2 | ) | (17 | ) | – | |
| Fair value adjustments on non-hedging derivatives | 4 | | (2 | ) | – | |
| Realised gains on financial instruments | 1 | | – | | – | |
|
|
|
|
|
| |
| 287 | | 257 | | 176 | |
|
|
|
|
|
| |
10 Finance costs
| 2006 | | 2005 | | 2004 | |
| £m | | £m | | £m | |
|
|
|
|
|
| |
| Interest on bank loans and overdrafts | (5 | ) | (11 | ) | (6 | ) |
| Interest on other loans | (301 | ) | (412 | ) | (337 | ) |
| Interest in respect of finance leases | (8 | ) | (4 | ) | (2 | ) |
| Realised losses on financial instruments | – | | – | | (1 | ) |
| Unwinding of discount on provisions | (36 | ) | (25 | ) | (16 | ) |
| Fair value hedges | – | | 2 | | – | |
| Fair value adjustments on non-hedging derivatives | (2 | ) | (1 | ) | – | |
|
|
|
|
|
| |
| (352 | ) | (451 | ) | (362 | ) |
|
|
|
|
|
| |
Back to Contents
| |
| Notes to the financial statements |
| continued |
|
11 Associates and joint ventures
| 2006 | | 2005 | | 2004 | |
| £m | | £m | | £m | |
|
|
|
|
|
| |
| Associates: | | | | | | |
| Share of after tax profits of Quest Diagnostics Inc. | 59 | | 52 | | 59 | |
| Share of after tax losses of other associates | (2 | ) | (1 | ) | (1 | ) |
|
|
|
|
|
| |
| 57 | | 51 | | 58 | |
| Share of after tax (losses)/profits of joint ventures | (1 | ) | 1 | | 2 | |
|
|
|
|
|
| |
| 56 | | 52 | | 60 | |
|
|
|
|
|
| |
| Share of turnover of joint ventures | 21 | | 32 | | 31 | |
| Sales to joint ventures and associates | 18 | | 48 | | 50 | |
|
|
|
|
|
| |
Summarised income statement information in respect of the Group’s associates is set out below:
| 2006 | | 2005 | | 2004 | |
| £m | | £m | | £m | |
|
|
|
|
|
| |
| Total turnover | 3,392 | | 3,029 | | 2,806 | |
| Total profit/(loss) | 315 | | 296 | | 275 | |
|
|
|
|
|
| |
12 Taxation
| 2006 | | 2005 | | 2004 | |
| Taxation charge based on profits for the year | £m | | £m | | £m | |
|
|
|
|
|
| |
| UK corporation tax at the UK statutory rate | 2,512 | | 407 | | 304 | |
| Less double taxation relief | (2,112 | ) | (235 | ) | (156 | ) |
|
|
|
|
|
| |
| 400 | | 172 | | 148 | |
| Overseas taxation | 2,310 | | 1,847 | | 1,519 | |
|
|
|
|
|
| |
| Current taxation | 2,710 | | 2,019 | | 1,667 | |
| Deferred taxation | (409 | ) | (103 | ) | 90 | |
|
|
|
|
|
| |
| 2,301 | | 1,916 | | 1,757 | |
|
|
|
|
|
| |
| | | | | | | |
| 2006 | | 2005 | | 2004 | |
| Reconciliation of the taxation rate on Group profits | % | | % | | % | |
|
|
|
|
|
| |
| UK statutory rate of taxation | 30.0 | | 30.0 | | 30.0 | |
| Overseas taxes | 4.2 | | 3.0 | | 2.5 | |
| Benefit of special tax status | (5.2 | ) | (2.3 | ) | (3.6 | ) |
| R&D credits | (1.3 | ) | (1.4 | ) | (1.5 | ) |
| Intercompany stock profit | (1.9 | ) | 1.0 | | 0.3 | |
| Impact of share based payments | 0.5 | | (0.3 | ) | 1.5 | |
| Tax on profit of associates | (0.4 | ) | (0.4 | ) | (0.4 | ) |
| Other differences | 0.3 | | (0.4 | ) | 0.5 | |
| Prior year items | 3.3 | | (0.7 | ) | 1.1 | |
|
|
|
|
|
| |
| Tax rate | 29.5 | | 28.5 | | 30.4 | |
|
|
|
|
|
| |
Additional UK Corporation tax and Double Taxation relief in 2006 arise from dividends received from overseas subsidiaries. Current tax expense has been reduced by a benefit of £5 million arising from previously unrecognised tax losses. Deferred tax expense has been reduced by a benefit of £2 million arising from changes in tax rates.
The Group operates in countries where the tax rate differs from the UK tax rate. The impact of these overseas taxes on the company’s overall rate of tax is shown above. Profits arising from certain operations in Singapore, Puerto Rico, Ireland and Belgium are accorded special status and are taxed at reduced rates compared with the normal rates of tax in these territories. The effect of this reduction in the taxation charge increased earnings per share by 7.2p in 2006, 2.7p in 2005 and 3.6p in 2004.
The Group is required under IFRS to create a deferred tax asset in respect of unrealised intercompany profit arising on stock held by the Group at the year end by applying the tax rate of the country in which the stock is held (rather than the tax rate of the country where the profit was originally made and the tax paid, which is the practice under UK and US GAAP). The Group tax rate was decreased by 1.9% in 2006 (2005 –1.0% increase, 2004 – 0.3% increase) as a result of increases in work-in-progress and finished goods.
The integrated nature of the Group’s worldwide operations, involving significant investment in research and strategic manufacture at a limited number of locations, with consequential cross-border supply routes into numerous end-markets, gives rise to complexity and delay in negotiations with revenue authorities as to the profits on which individual Group companies are liable to tax. Resolution of such issues is a continuing fact of life for GSK.
| |
|
| GSK Annual Report 2006 |
| 100 |
<Back to Contents
| |
| Notes to the financial statements |
| continued |
|
12 Taxationcontinued
As reported last year, GSK’s largest unresolved tax issues were with the US Internal Revenue Service (IRS) and UK HM Revenue and Customs (HMRC) in respect of transfer prices related to the Glaxo heritage products.
On 11th September 2006, GSK and the IRS agreed to a resolution of their dispute. Under the agreement, GSK has made gross payments to the IRS of approximately $3.3 billion. The final net cash cost to the Group is approximately $3.1 billion, which covers federal, state and local taxes, interest and the benefit of tax relief on the payments made. The settlement resolved all the transfer pricing issues in dispute for the period 1989 – 2000, which were due to go to trial in February 2007, and also covers the subsequent years 2001 – 2005. GSK had previously made provision for the dispute and this settlement did not have any significant impact on the Group’s reported earnings or tax rate for the year.
GSK continues to be in dispute with HMRC primarily in respect of transfer pricing and Controlled Foreign Companies legislation matters for the years 1994 to date and the parties are now preparing for litigation. HMRC has not formally quantified its claims in respect of these matters but there continues to be a wide difference between the Group and HMRC positions on these matters. GSK also has open issues in Japan and Canada, which were the subject of court proceedings in 2006. In Japan the tax authorities are claiming approximately Yen 39 billion (£169 million) in respect of transactions in 1998. GSK has paid the tax claimed, as required by law, and applied for a refund. A court decision is expected in late March 2007. A court decision in the Group’s dispute with the Canadian Revenue Authority over the pricing ofZantacin the years 1989 to 1993 is expected in the first half of 2007.
GSK uses the best advice in determining its transfer pricing methodology and in seeking to manage transfer pricing and other taxation issues to a satisfactory conclusion and, on the basis of external professional advice, continues to believe that it has made adequate provision for the liabilities likely to arise from open assessments. The ultimate liability for such matters may vary from the amounts provided and is dependent upon the outcome of litigation proceedings and negotiations with the relevant tax authorities.
Except as shown in this Annual Report, no provision has been made for taxation which would arise on the distribution of profits retained by overseas subsidiary and associated undertakings, on the grounds that no remittance of profit retained at 31st December 2006 is required in such a way that incremental tax will arise. The aggregate amount of these unremitted profits at the balance sheet date was approximately £26 billion.
| Payable | | Recoverable | | Net | |
| Movement on current tax account | £m | | £m | | £m | |
|
|
|
|
|
| |
| At 1st January 2006 | (2,269 | ) | 416 | | (1,853 | ) |
| Exchange adjustments | 170 | | (8 | ) | 162 | |
| Charge for the year | (1,981 | ) | (729 | ) | (2,710 | ) |
| Cash paid | 3,438 | | 408 | | 3,846 | |
| Other movements | 21 | | 99 | | 120 | |
|
|
|
|
|
| |
| At 31st December 2006 | (621 | ) | 186 | | (435 | ) |
|
|
|
|
|
| |
Movement in deferred tax assets and liabilities
| | | | | | | | | | Pensions & | | | | | | | | | | Share | | Other | | | |
| | Accelerated | | | | | Product & | | other post | | | | Legal | | Manu- | | Stock | | option | | net | | | |
| Deferred taxation | capital | | | Intra-group | | business | | retirement | | Tax | | & other | | facturing | | valuation | | and award | | temporary | | | |
| asset/(liability) | allowances | Intangibles | | profit | | disposals | | benefits | | Losses | | disputes | | restructuring | | adjustments | | schemes | | differences | | Total | |
|
|
|
|
|
|
|
|
|
|
|
|
|
|
|
|
|
|
|
|
|
|
|
| |
| Deferred tax asset at | | | | | | | | | | | | | | | | | | | | | | | | |
| 1st January 2006 | (492 | ) | (18 | ) | 709 | | (9 | ) | 1,035 | | 63 | | 160 | | 73 | | (72 | ) | 151 | | 614 | | 2,214 | |
| Deferred tax liability at | | | | | | | | | | | | | | | | | | | | | | | | |
| 1st January 2006 | (123 | ) | (522 | ) | – | | 13 | | 25 | | 24 | | 1 | | – | | (50 | ) | – | | 63 | | (569 | ) |
|
|
|
|
|
|
|
|
|
|
|
|
|
|
|
|
|
|
|
|
|
|
|
| |
| | | | | | | | | | | | | | | | | | | | | | | | |
| At 1st January 2006 | (615 | ) | (540 | ) | 709 | | 4 | | 1,060 | | 87 | | 161 | | 73 | | (122 | ) | 151 | | 677 | | 1,645 | |
| Exchange adjustments | 11 | | 27 | | – | | – | | (55 | ) | (10 | ) | (17 | ) | (1 | ) | 8 | | – | | (82 | ) | (119 | ) |
| Credit/(charge) to income | (5 | ) | 113 | | 225 | | (9 | ) | 33 | | 15 | | 9 | | 7 | | 16 | | 5 | | – | | 409 | |
| Credit/(charge) to equity | – | | – | | – | | – | | (161 | ) | – | | – | | – | | – | | 1 | | (13 | ) | (173 | ) |
| Transfer to/from current tax | 2 | | – | | – | | 4 | | (139 | ) | – | | – | | (5 | ) | 3 | | – | | (20 | ) | (155 | ) |
| Acquisitions | – | | (84 | ) | – | | – | | – | | 1 | | – | | – | | – | | – | | 4 | | (79 | ) |
| Other movements | – | | – | | – | | – | | – | | 5 | | – | | – | | 5 | | – | | (10 | ) | – | |
|
|
|
|
|
|
|
|
|
|
|
|
|
|
|
|
|
|
|
|
|
|
|
| |
| At 31st December 2006 | (607 | ) | (484 | ) | 934 | | (1 | ) | 738 | | 98 | | 153 | | 74 | | (90 | ) | 157 | | 556 | | 1,528 | |
|
|
|
|
|
|
|
|
|
|
|
|
|
|
|
|
|
|
|
|
|
|
|
| |
| | | | | | | | | | | | | | | | | | | | | | | | | |
| Deferred tax asset at | | | | | | | | | | | | | | | | | | | | | | | | |
| 31st December 2006 | (34 | ) | (49 | ) | 934 | | – | | 416 | | 64 | | 147 | | 30 | | (35 | ) | 124 | | 526 | | 2,123 | |
| Deferred tax liability at | | | | | | | | | | | | | | | | | | | | | | | | |
| 31st December 2006 | (573 | ) | (435 | ) | – | | (1 | ) | 322 | | 34 | | 6 | | 44 | | (55 | ) | 33 | | 30 | | (595 | ) |
|
|
|
|
|
|
|
|
|
|
|
|
|
|
|
|
|
|
|
|
|
|
|
| |
| (607 | ) | (484 | ) | 934 | | (1 | ) | 738 | | 98 | | 153 | | 74 | | (90 | ) | 157 | | 556 | | 1,528 | |
|
|
|
|
|
|
|
|
|
|
|
|
|
|
|
|
|
|
|
|
|
|
|
| |
| |
|
| GSK Annual Report 2006 |
| 101 |
Back to Contents
| |
| Notes to the financial statements |
| continued |
|
12 Taxationcontinued
At 31st December 2006, the Group had recognised a deferred tax asset of £98 million (2005 – £87 million) in respect of income tax losses of approximately £348 million (2005 – £291 million). Of these losses, £100 million (2005 – £64 million) are due to expire between 2007–2013, £178 million (2005 – £184 million) are due to expire between 2019–2027 and £70 million (2005 – £43 million) are available indefinitely. At 31st December 2006, the Group had not recognised any deferred tax asset in respect of income tax losses of approximately £3,742 million (2005 – £217 million), of which £131 million (2005 – £28 million) are due to expire between 2007–2018, £21 million (2005 – £79 million) are due to expire between 2019–2027 and £3,590 million (2005 – £110 million) are available indefinitely. Unrecognised losses have increased in 2006 due to quantification of previously uncertain amounts arising principally in 2003 and 2004. The Group had capital losses at 31st December 2006 estimated to be in excess of £10 billion in respect of which no deferred tax asset has been recognised. Deferred tax assets are recognised where it is probable that future taxable profit will be available to utilise losses. All deferred taxation movements arise from the origination and reversal of temporary differences. Other net temporary differences include accrued expenses and other provisions.
13 Earnings per share
| 2006 | | 2005 | | 2004 | |
| p | | p | | p | |
|
|
|
|
|
| |
| Basic earnings per share | 95.5 | | 82.6 | | 68.1 | |
| Diluted earnings per share | 94.5 | | 82.0 | | 68.0 | |
|
|
|
|
|
| |
Basic earnings per share have been calculated by dividing the profit attributable to shareholders by the weighted average number of shares in issue during the period after deducting shares held by the ESOP Trusts and treasury shares.
Diluted earnings per share have been calculated after adjusting the weighted average number of shares used in the basic calculation to assume the conversion of all potentially dilutive shares. A potentially dilutive share forms part of the employee share schemes where its exercise price is below the average market price of GSK shares during the period and any performance conditions attaching to the scheme have been met at the balance sheet date.
The number of shares used in calculating basic and diluted earnings per share are reconciled below.
| Weighted average number of shares in issue | millions | | millions | | millions | |
|
|
|
|
|
| |
| Basic | 5,643 | | 5,674 | | 5,736 | |
| Dilution for share options | 57 | | 46 | | 12 | |
|
|
|
|
|
| |
| Diluted | 5,700 | | 5,720 | | 5,748 | |
|
|
|
|
|
| |
Shares held by the ESOP Trusts are excluded. The trustees have waived their rights to dividends on the shares held by the ESOP Trusts.
14 Dividends
| 2006 | | First interim | | Second interim | | Third interim | | Fourth interim | | Total | |
|
|
|
|
|
|
|
|
|
|
| |
| Total dividend (£m) | | 619 | | 620 | | 671 | | 785 | | 2,695 | |
| Dividend per share (pence) | | 11 | | 11 | | 12 | | 14 | | 48 | |
| | | | | | | | | | | | |
| Paid/payable | | 6th July 2006 | | 5th October 2006 | | 4th January 2007 | | 12th April 2007 | | | |
|
|
|
|
|
|
|
|
|
|
| |
| 2005 | | | | | | | | | | | |
|
|
|
|
|
|
|
|
|
|
| |
| Total dividend (£m) | | 568 | | 567 | | 568 | | 791 | | 2,494 | |
| Dividend per share (pence) | | 10 | | 10 | | 10 | | 14 | | 44 | |
| | | | | | | | | | | | |
| Paid | | 7th July 2005 | | 6th October 2005 | | 5th January 2006 | | 6th April 2006 | | | |
|
|
|
|
|
|
|
|
|
|
| |
| 2004 | | | | | | | | | | | |
|
|
|
|
|
|
|
|
|
|
| |
| Total dividend (£m) | | 575 | | 573 | | 571 | | 684 | | 2,403 | |
| Dividend per share (pence) | | 10 | | 10 | | 10 | | 12 | | 42 | |
| | | | | | | | | | | | |
| Paid | | 1st July 2004 | | 30th September 2004 | | 6th January 2005 | | 7th April 2005 | | | |
|
|
|
|
|
|
|
|
|
|
| |
Under IFRS interim dividends are only recognised in the financial statements when paid and not when declared. GSK normally pays a dividend two quarters after the quarter to which it relates and one quarter after it is declared. The 2006 financial statements recognise those dividends paid in 2006, namely the third and fourth interim dividends for 2005 and the first and second interim dividends for 2006. The amounts recognised in each year are as follows:
| 2006 | | 2005 | | 2004 | |
| £m | | £m | | £m | |
|
|
|
|
|
| |
| Dividends to shareholders | 2,598 | | 2,390 | | 2,476 | |
|
|
|
|
|
| |
| |
|
| GSK Annual Report 2006 |
| 102 |
Back to Contents
| |
| Notes to the financial statements |
| continued |
|
| | | | | | | | | |
| 15 Property, plant and equipment | | | Plant, | | | | | |
| Land and | | equipment | | Assets in | | | |
| buildings | | and vehicles | | construction | | Total | |
| £m | | £m | | £m | | £m | |
|
|
|
|
|
|
|
| |
| Cost at 1st January 2005 | 4,062 | | 7,512 | | 682 | | 12,256 | |
| Exchange adjustments | 136 | | 183 | | 19 | | 338 | |
| Additions | 54 | | 307 | | 640 | | 1,001 | |
| Additions through business combinations | 32 | | 45 | | 33 | | 110 | |
| Disposals and write-offs | (82 | ) | (404 | ) | (4 | ) | (490 | ) |
| Reclassifications | 83 | | 255 | | (348 | ) | (10 | ) |
| Transfer to assets held for sale | (4 | ) | (11 | ) | – | | (15 | ) |
|
|
|
|
|
|
|
| |
| Cost at 31st December 2005 | 4,281 | | 7,887 | | 1,022 | | 13,190 | |
| Exchange adjustments | (232 | ) | (295 | ) | (65 | ) | (592 | ) |
| Additions | 100 | | 403 | | 982 | | 1,485 | |
| Additions through business combinations | – | | 5 | | – | | 5 | |
| Disposals and write-offs | (44 | ) | (578 | ) | (5 | ) | (627 | ) |
| Reclassifications | 153 | | 358 | | (511 | ) | – | |
| Transfer to assets held for sale | (14 | ) | (4 | ) | – | | (18 | ) |
|
|
|
|
|
|
|
| |
| Cost at 31st December 2006 | 4,244 | | 7,776 | | 1,423 | | 13,443 | |
|
|
|
|
|
|
|
| |
| Depreciation at 1st January 2005 | (1,171 | ) | (4,578 | ) | – | | (5,749 | ) |
| Exchange adjustments | (38 | ) | (119 | ) | – | | (157 | ) |
| Provision for the year | (125 | ) | (585 | ) | – | | (710 | ) |
| Disposals and write-offs | 43 | | 356 | | – | | 399 | |
| Reclassifications | – | | 1 | | – | | 1 | |
| Transfer to assets held for sale | 1 | | 10 | | – | | 11 | |
|
|
|
|
|
|
|
| |
| Depreciation at 31st December 2005 | (1,290 | ) | (4,915 | ) | – | | (6,205 | ) |
| Exchange adjustments | 73 | | 196 | | – | | 269 | |
| Provision for the year | (137 | ) | (595 | ) | – | | (732 | ) |
| Disposals and write-offs | 23 | | 506 | | – | | 529 | |
| Transfer to assets held for sale | 6 | | 3 | | – | | 9 | |
|
|
|
|
|
|
|
| |
| Depreciation at 31st December 2006 | (1,325 | ) | (4,805 | ) | – | | (6,130 | ) |
|
|
|
|
|
|
|
| |
| Impairment at 1st January 2005 | (136 | ) | (147 | ) | (27 | ) | (310 | ) |
| Exchange adjustments | (9 | ) | (2 | ) | – | | (11 | ) |
| Disposals and write-offs | 10 | | 2 | | 2 | | 14 | |
| Impairment losses | (13 | ) | (18 | ) | – | | (31 | ) |
| Reversal of impairments | – | | 3 | | – | | 3 | |
| Transfer to assets held for sale | 2 | | – | | – | | 2 | |
|
|
|
|
|
|
|
| |
| Impairment at 31st December 2005 | (146 | ) | (162 | ) | (25 | ) | (333 | ) |
| Exchange adjustments | 13 | | 4 | | 3 | | 20 | |
| Disposals and write-offs | 12 | | 10 | | 2 | | 24 | |
| Impairment losses | (46 | ) | (107 | ) | (2 | ) | (155 | ) |
| Reversal of impairments | 26 | | 24 | | 11 | | 61 | |
|
|
|
|
|
|
|
| |
| Impairment at 31st December 2006 | (141 | ) | (231 | ) | (11 | ) | (383 | ) |
|
|
|
|
|
|
|
| |
| Total depreciation and impairment at 31st December 2005 | (1,436 | ) | (5,077 | ) | (25 | ) | (6,538 | ) |
| Total depreciation and impairment at 31st December 2006 | (1,466 | ) | (5,036 | ) | (11 | ) | (6,513 | ) |
|
|
|
|
|
|
|
| |
| Net book value at 1st January 2005 | 2,755 | | 2,787 | | 655 | | 6,197 | |
|
|
|
|
|
|
|
| |
| Net book value at 31st December 2005 | 2,845 | | 2,810 | | 997 | | 6,652 | |
|
|
|
|
|
|
|
| |
| Net book value at 31st December 2006 | 2,778 | | 2,740 | | 1,412 | | 6,930 | |
|
|
|
|
|
|
|
| |
The net book value at 31st December 2006 of the Group’s land and buildings comprises freehold properties £2,632 million (2005 – £2,635 million), properties with leases of 50 years or more £116 million (2005 – £155 million) and properties with leases of less than 50 years £30 million (2005 – £55 million).
| |
|
| GSK Annual Report 2006 |
| 103 |
Back to Contents
| |
| Notes to the financial statements |
| continued |
|
15 Property, plant and equipmentcontinued
Included in land and buildings at 31st December 2006 are leased assets with a cost of £241 million (2005 – £165 million), accumulated amortisation of £95 million (2005 – £49 million) and a net book value of £146 million (2005 – £116 million). Included in plant, equipment and vehicles at 31st December 2006 are leased assets with a cost of £263 million (2005 – £153 million), accumulated amortisation of £97 million (2005 – £57 million) and a net book value of £166 million (at 1st January 2006 – £96 million). Some lease agreements include renewal or purchase options or escalation clauses.
The impairment losses principally arise from decisions to rationalise facilities and are calculated based on either fair value less costs to sell or value in use. The value in use calculations determine the net present value of the projected risk-adjusted, post-tax cash flows of the relevant asset or cash generating unit, applying a discount rate of the Group post-tax weighted average cost of capital of 8%, adjusted where appropriate for country specific risks. These losses have been charged through cost of sales £125 million, R&D £22 million, and SG&A £8 million.
Reversals of impairment arise from subsequent reviews of the impaired assets where the conditions which gave rise to the original impairments are deemed no longer to apply. The principal component of the 2006 reversals relates to the Montrose manufacturing facility, and all of the reversals have been credited to cost of sales.
| 16 Goodwill | 2006 | | 2005 | |
| £m | | £m | |
|
|
|
| |
| Cost at 1st January | 696 | | 304 | |
| Exchange adjustments | (54 | ) | 10 | |
| Additions through business combinations | 126 | | 383 | |
| Disposals | – | | (1 | ) |
| Impairments | (10 | ) | – | |
|
|
|
| |
| Cost at 31st December | 758 | | 696 | |
|
|
|
| |
| Net book value at 1st January | 696 | | 304 | |
|
|
|
| |
| Net book value at 31st December | 758 | | 696 | |
|
|
|
| |
The additions for the year comprise £112 million on the acquisition of CNS, Inc., £8 million on the acquisition of Pliva Research Institute, and a further £6 million on the acquisition of the minority interest held in GlaxoSmithKline K.K. See Note 36 for further details.
The impairments in the year of £10 million relate to the Europharm business located in Romania, and were determined using the fair value less costs to sell model.
The carrying value of goodwill is made up of balances arising on acquisition of the following companies:
| | 2006 | | 2005 | |
| | £m | | £m | |
|
|
|
| |
| ID Biomedical Corporation | 316 | | 358 | |
| CNS, Inc. | 112 | | – | |
| Nippon Glaxo | 134 | | 143 | |
| Polfa Poznan S.A. | 96 | | 98 | |
| Corixa Corporation | 25 | | 28 | |
| Others | 75 | | 69 | |
|
|
|
| |
| | 758 | | 696 | |
|
|
|
| |
Goodwill is allocated to cash generating units which are tested for impairment at least annually. The recoverable amounts of the cash generating units are assessed using a value in use or a fair value less costs to sell model, depending on the nature of the unit. Value in use is calculated as the net present value of the projected risk-adjusted, five-year post-tax cash flows plus a terminal value of the cash generating unit to which the goodwill is allocated. Initially a post-tax discount rate based on the Group’s weighted average cost of capital of 8%, adjusted where appropriate for country specific risks, is applied to calculate the net present value of the post-tax cash flows. Where this indicates that the recoverable value of the unit is close to or below its carrying value, the impairment test is reperformed using a pre-tax discount rate and pre-tax cash flows in order to determine if an impairment exists and to establish its magnitude. Fair value is calculated using a discounted cash flow approach, which in this case is based on the Group’s acquisition valuation model.
The cash generating units for which the carrying amount of goodwill allocated to the unit is significant in comparison with the total goodwill balance are Vaccines, Consumer Healthcare, Japan and Poland. Total goodwill of £362 million (2005 – £407 million), principally relating to the acquisitions of ID Biomedical and Corixa, is allocated to the Vaccines unit. The recoverable value of this unit is determined using the fair value less costs to sell model. Goodwill arising on the acquisition of the minority interest in Nippon Glaxo of £134 million (2005 – £143 million) and on the acquisition of Polfa Poznan of £96 million (2005 – £98 million) is allocated to the Japan and Poland cash generating units respectively. The recoverable value of both these units is determined using the value in use model. Goodwill arising on the acquisition of CNS, Inc. in December 2006 is allocated to the Consumer Healthcare cash generating unit.
| |
|
| GSK Annual Report 2006 |
| 104 |
Back to Contents
| |
| Notes to the financial statements |
| continued |
|
| | | | | | | | | |
| 17 Other intangible assets | Computer | | Licences, | | | | | |
| software | | patents, etc. | | Brands | | Total | |
| £m | | £m | | £m | | £m | |
|
|
|
|
|
|
|
| |
| Cost at 1st January 2005 | 609 | | 1,449 | | 1,143 | | 3,201 | |
| Exchange adjustments | 13 | | 72 | | 41 | | 126 | |
| Additions | 62 | | 207 | | – | | 269 | |
| Additions through business combinations | – | | 816 | | – | | 816 | |
| Disposals and asset write-offs | (9 | ) | (72 | ) | – | | (81 | ) |
| Reclassifications from property, plant and equipment | 10 | | – | | – | | 10 | |
|
|
|
|
|
|
|
| |
| Cost at 31st December 2005 | 685 | | 2,472 | | 1,184 | | 4,341 | |
| Exchange adjustments | (23 | ) | (213 | ) | (62 | ) | (298 | ) |
| Additions | 90 | | 138 | | – | | 228 | |
| Additions through business combinations | – | | 29 | | 187 | | 216 | |
| Disposals and asset write-offs | (37 | ) | (80 | ) | – | | (117 | ) |
|
|
|
|
|
|
|
| |
| Cost at 31st December 2006 | 715 | | 2,346 | | 1,309 | | 4,370 | |
|
|
|
|
|
|
|
| |
| Amortisation at 1st January 2005 | (314 | ) | (265 | ) | – | | (579 | ) |
| Exchange adjustments | (6 | ) | (21 | ) | – | | (27 | ) |
| Provision for the year | (85 | ) | (109 | ) | – | | (194 | ) |
| Disposals and asset write-offs | 7 | | 10 | | – | | 17 | |
| Reclassifications from property, plant and equipment | (1 | ) | – | | – | | (1 | ) |
|
|
|
|
|
|
|
| |
| Amortisation at 31st December 2005 | (399 | ) | (385 | ) | – | | (784 | ) |
| Exchange adjustments | 13 | | 38 | | – | | 51 | |
| Provision for the year | (87 | ) | (139 | ) | – | | (226 | ) |
| Disposals and asset write-offs | 29 | | 7 | | – | | 36 | |
|
|
|
|
|
|
|
| |
| Amortisation at 31st December 2006 | (444 | ) | (479 | ) | – | | (923 | ) |
|
|
|
|
|
|
|
| |
| Impairment at 1st January 2005 | (23 | ) | (65 | ) | (21 | ) | (109 | ) |
| Exchange adjustments | – | | (2 | ) | (2 | ) | (4 | ) |
| Impairment losses | (1 | ) | (60 | ) | (1 | ) | (62 | ) |
| Disposals and asset write-offs | 1 | | – | | – | | 1 | |
|
|
|
|
|
|
|
| |
| Impairment at 31st December 2005 | (23 | ) | (127 | ) | (24 | ) | (174 | ) |
| Exchange adjustments | – | | 29 | | 3 | | 32 | |
| Impairment losses | (9 | ) | (80 | ) | – | | (89 | ) |
| Disposals and asset write-offs | 8 | | 69 | | – | | 77 | |
|
|
|
|
|
|
|
| |
| Impairment at 31st December 2006 | (24 | ) | (109 | ) | (21 | ) | (154 | ) |
|
|
|
|
|
|
|
| |
| Total amortisation and impairment at 31st December 2005 | (422 | ) | (512 | ) | (24 | ) | (958 | ) |
| Total amortisation and impairment at 31st December 2006 | (468 | ) | (588 | ) | (21 | ) | (1,077 | ) |
|
|
|
|
|
|
|
| |
| Net book value at 1st January 2005 | 272 | | 1,119 | | 1,122 | | 2,513 | |
|
|
|
|
|
|
|
| |
| Net book value at 31st December 2005 | 263 | | 1,960 | | 1,160 | | 3,383 | |
|
|
|
|
|
|
|
| |
| Net book value at 31st December 2006 | 247 | | 1,758 | | 1,288 | | 3,293 | |
|
|
|
|
|
|
|
| |
| |
|
| GSK Annual Report 2006 |
| 105 |
Back to Contents
| |
| Notes to the financial statements |
| continued |
|
17 Other intangible assetscontinued
Amortisation and impairment have been charged through Research and development, and Selling, general and administration. At 31st December 2006, the net book value of computer software included £28 million that had been internally generated.
The additions through business combinations in the year of £216 million include £207 million from CNS, Inc., (see Note 36).
Brands comprise a portfolio of products acquired with the acquisitions of Sterling Winthrop Inc. in 1994, The Block Drug Company in 2001 and CNS, Inc., in 2006. The book values of the major brands are as follows:
| | 2006 | | 2005 | |
| | £m | | £m | |
|
|
|
| |
| Panadol | 317 | | 340 | |
| Sensodyne | 220 | | 230 | |
| Breathe Right | 169 | | – | |
| Polident | 93 | | 97 | |
| Corega | 83 | | 87 | |
| Poligrip | 57 | | 60 | |
| Solpadeine | 56 | | 56 | |
| Others | 293 | | 290 | |
|
|
|
| |
| | 1,288 | | 1,160 | |
|
|
|
| |
Each of these brands is considered to have an indefinite life, given the strength and durability of the brand and the level of marketing support. The brands are in relatively similar stable and profitable market sectors, with similar risk profiles, and their size, diversification and market shares mean that the risk of market-related factors causing a shortening of the brands’ lives is considered to be relatively low. The Group is not aware of any material legal, regulatory, contractual, competitive, economic or other factor which could limit their useful lives. Accordingly, they are not amortised. Each brand is tested annually for impairment applying a fair value less costs to sell methodology and using five year post-tax cash flow forecasts with a terminal value calculation and applying a discount rate of the Group post-tax weighted average cost of capital of 8%, adjusted where appropriate for country-specific risks.
The main assumptions include future sales prices and volumes, product contribution, the future expenditure required to maintain the product’s marketability and registration in the relevant jurisdiction and the product’s life. These assumptions are reviewed as part of management’s budgeting and strategic planning cycle for changes in market conditions and sales erosion through competition.
| 18 Investments in associates and joint ventures | Joint | | Associated | | 2006 | | 2005 | |
| ventures | | undertakings | | Total | | Total | |
| £m | | £m | | £m | | £m | |
|
|
|
|
|
|
|
| |
| At 1st January | 14 | | 262 | | 276 | | 209 | |
| Implementation of accounting for financial instruments under IAS 39 | – | | – | | – | | (7 | ) |
|
|
|
|
|
|
|
| |
| At 1st January, as adjusted | 14 | | 262 | | 276 | | 202 | |
| Exchange adjustments | (2 | ) | (35 | ) | (37 | ) | 26 | |
| Additions | 8 | | 5 | | 13 | | 2 | |
| Fair value adjustment | – | | 1 | | 1 | | – | |
| Retained profit for the year | (4 | ) | 46 | | 42 | | 46 | |
|
|
|
|
|
|
|
| |
| At 31st December | 16 | | 279 | | 295 | | 276 | |
|
|
|
|
|
|
|
| |
The principal associated undertaking is Quest Diagnostics Inc., a US clinical laboratory business listed on the New York Stock Exchange. The investment had a book value at 31st December 2006 of £262 million (2005 – £244 million) and a market value of £987 million (2005 – £1,093 million).
At 31st December 2006, the Group owned 18.7% of Quest (2005 – 18.4%) . Although the Group holds less than 20% of the ownership interest and voting control in Quest, the Group has the ability to exercise significant influence through both its significant shareholding and its nominated director’s active participation on the Quest Board of Directors and Board sub-committees.
| |
|
| GSK Annual Report 2006 |
| 106 |
Back to Contents
| |
| Notes to the financial statements |
| continued |
|
18 Investments in associates and joint venturescontinued
| Summarised balance sheet information in respect of the Group’s associates is set out below: | 2006 | | 2005 | |
| £m | | £m | |
|
|
|
| |
| Total assets | 2,930 | | 3,134 | |
| Total liabilities | (1,350 | ) | (1,481 | ) |
|
|
|
| |
| Net assets | 1,580 | | 1,653 | |
|
|
|
| |
| Group’s share of associates‘ net assets | 279 | | 262 | |
|
|
|
| |
Investments in joint ventures comprise £22 million share of gross assets (2005 – £17 million) and £6 million share of gross liabilities (2005 – £3 million). These principally arise from 50% interests in two joint ventures, Shionogi-GlaxoSmithKline Holdings, L.P., which is developing specified chemical compounds, and GlaxoSmithKline Shire BioChem, which primarily co-marketsCombivir,TrizivirandEpivirin certain territories, together with a 29% interest in another joint venture, Pharmaceutical Insurance Limited, which is a mutual insurance company covering pharmaceutical property risk.
In 2002, GSK hedged part of the equity value of its holding in Quest Diagnostics Inc. through a series of variable sale forward contracts. The contracts (‘the equity collar’) were renewed in 2006 and are structured in five series, each over two million Quest shares, and mature between 2010 and 2012. The fair value of the contracts at 31st December 2006 was a liability of $24 million (2005 – $24 million).
| 19 Other investments | 2006 | | 2005 | |
| £m | | £m | |
|
|
|
| |
| At 1st January | 362 | | 298 | |
| Implementation of accounting for financial instruments under IAS 39 | – | | 61 | |
|
|
|
| |
| At 1st January as adjusted | 362 | | 359 | |
| Exchange adjustments | (45 | ) | 33 | |
| Additions | 57 | | 23 | |
| Fair value movements | 116 | | 14 | |
| Impairments | (16 | ) | (35 | ) |
| Transfers | – | | (12 | ) |
| Disposals | (33 | ) | (20 | ) |
|
|
|
| |
| At 31st December | 441 | | 362 | |
|
|
|
| |
Other investments comprise non-current equity investments which are available-for-sale investments recorded at fair value at each balance sheet date. For investments traded in an active market, the fair value is determined by reference to the relevant stock exchange quoted bid price. For other investments, the fair value is estimated by reference to the current market value of similar instruments or by reference to the discounted cash flows of the underlying net assets.
The Group holds a number of equity investments, frequently in entities where the Group has entered into research collaborations. Equity investments are recorded as non-current assets unless they are expected to be sold within one year, in which case they are recorded as current assets. Non-current equity investments include listed investments of £348 million (2005 – £268 million) that offer the Group the opportunity for return through dividend income and fair value gains.
On disposal of investments, fair value movements are reclassified from reserves to the income statement based on average cost.
The impairment losses recorded in the tables above have been recognised in the income statement for the year within other operating income, together with amounts recycled from the fair value reserve (Note 32) on recognition of the impairments. These impairments initially result from prolonged or significant declines in the fair value of the equity investments below acquisition cost, subsequent to which any further declines in fair value are immediately taken to the income statement.
| 20 Other non-current assets | | | | |
| | 2006 | | 2005 | |
| £m | | £m | |
|
|
|
| |
| Amounts recoverable under insurance contracts | 262 | | 265 | |
| Derivative financial instruments | 113 | | 15 | |
| Pension schemes in surplus | 179 | | 12 | |
| Other receivables | 167 | | 146 | |
|
|
|
| |
| | 721 | | 438 | |
|
|
|
| |
| |
|
| GSK Annual Report 2006 |
| 107 |
Back to Contents
| |
| Notes to the financial statements |
| continued |
|
21 Inventories
| | 2006 | | 2005 | |
| | £m | | £m | |
|
|
|
| |
| Raw materials and consumables | 764 | | 721 | |
| Work in progress | 626 | | 552 | |
| Finished goods | 1,047 | | 904 | |
|
|
|
| |
| 2,437 | | 2,177 | |
|
|
|
| |
22 Trade and other receivables
| | 2006 | | 2005 | |
| | £m | | £m | |
|
|
|
| |
| Trade receivables | 4,356 | | 4,411 | |
| Prepaid pension contributions | 1 | | 1 | |
| Other prepayments and accrued income | 223 | | 285 | |
| Interest receivable | 28 | | 42 | |
| Employee loans and advances | 51 | | 59 | |
| Derivative financial instruments | 80 | | 180 | |
| Other receivables | 578 | | 370 | |
|
|
|
| |
| 5,317 | | 5,348 | |
|
|
|
| |
Trade receivables include £13 million (2005 – £2 million) due from associates and joint ventures.
Movements in the bad and doubtful debt provision are as follows:
| | 2006 | | 2005 | |
| | £m | | £m | |
|
|
|
| |
| At 1st January | 140 | | 128 | |
| Exchange adjustments | (9 | ) | 8 | |
| Charge for the year | 12 | | 40 | |
| Utilised | (39 | ) | (36 | ) |
|
|
|
| |
| At 31st December | 104 | | 140 | |
|
|
|
| |
23 Cash and cash equivalents
| | 2006 | | 2005 | |
| | £m | | £m | |
|
|
|
| |
| Cash at bank and in hand | 620 | | 686 | |
| Short-term deposits | 1,324 | | 1,677 | |
| Commercial paper | 61 | | 1,846 | |
|
|
|
| |
| 2,005 | | 4,209 | |
|
|
|
| |
24 Assets held for sale
| | 2006 | | 2005 | |
| | £m | | £m | |
|
|
|
| |
| Land and buildings | 8 | | 1 | |
| Plant, equipment and vehicles | 1 | | 1 | |
| Equity investments | 3 | | – | |
|
|
|
| |
| 12 | | 2 | |
|
|
|
| |
25 Trade and other payables
| | 2006 | | 2005 | |
| | £m | | £m | |
|
|
|
| |
| Trade payables | 865 | | 819 | |
| Wages and salaries | 718 | | 804 | |
| Social security | 104 | | 102 | |
| Other payables | 265 | | 240 | |
| Deferred income | 40 | | 34 | |
| Customer return and rebate accruals | 1,119 | | 1,187 | |
| Other accruals | 1,713 | | 1,784 | |
| Derivative financial instruments | 40 | | 171 | |
| Dividends payable | 7 | | 6 | |
|
|
|
| |
| 4,871 | | 5,147 | |
|
|
|
| |
| |
|
| GSK Annual Report 2006 |
| 108 |
Back to Contents
| |
| Notes to the financial statements |
| continued |
|
25 Trade and other payablescontinued
Customer return and rebate accruals are provided for by the Group at the point of sale in respect of the estimated rebates, discounts or allowances payable to customers, principally in the USA. Provisions are made at the time of sale but the actual amounts paid are based on claims made some time after the initial recognition of the sale. As the amounts are estimated they may not fully reflect the final outcome and the amounts are subject to change dependent upon, amongst other things, the types of buying group and product sales mix. The level of provision is reviewed and adjusted quarterly in the light of historical experience of actual rebates, discounts or allowances given and returns made and any changes in arrangements. Future events could cause the assumptions on which the provisions are based to change, which could affect the future results of the Group.
26 Pensions and other post-employment benefits
| Pension and other post-employment costs | 2006 | | 2005 | | 2004 | |
| £m | £m | £m |
|
|
|
|
|
| |
| UK pension schemes | 159 | | 124 | | 119 | |
| US pension schemes | 35 | | 41 | | 44 | |
| Other overseas pensions schemes | 91 | | 83 | | 74 | |
| Unfunded post-retirement healthcare schemes | 91 | | 100 | | 92 | |
| Other post-employment costs | 1 | | 2 | | 18 | |
|
|
|
|
|
| |
| 377 | | 350 | | 347 | |
|
|
|
|
|
| |
| Analysed as: | | | | | | |
| Funded defined benefit/hybrid pension schemes | 237 | | 198 | | 192 | |
| Unfunded defined benefit pension schemes | 19 | | 25 | | 22 | |
| Unfunded post-retirement healthcare schemes | 91 | | 100 | | 92 | |
|
|
|
|
|
| |
| Defined benefit schemes | 347 | | 323 | | 306 | |
| Defined contribution pension schemes | 29 | | 25 | | 23 | |
| Other post-employment costs | 1 | | 2 | | 18 | |
|
|
|
|
|
| |
| 377 | | 350 | | 347 | |
|
|
|
|
|
| |
The costs of the defined benefit pension and post-retirement healthcare schemes are charged in the income statement as follows:
| Cost of sales | 74 | | 71 | | 68 | |
| Selling, general and administration | 175 | | 177 | | 166 | |
| Research and development | 98 | | 75 | | 72 | |
|
|
|
|
|
| |
| 347 | | 323 | | 306 | |
|
|
|
|
|
| |
GSK entities operate pension arrangements which cover the Group’s material obligations to provide pensions to retired employees. These arrangements have been developed in accordance with local practices in the countries concerned. Pension benefits can be provided by state schemes; by defined contribution schemes, whereby retirement benefits are determined by the value of funds arising from contributions paid in respect of each employee, or by defined benefit schemes, whereby retirement benefits are based on employee pensionable remuneration and length of service. Some ‘hybrid’ defined benefit schemes also include defined contribution sections.
Contributions to defined benefit schemes are determined in accordance with the advice of independent, professionally qualified actuaries. Pension costs of defined benefit schemes for accounting purposes have been assessed in accordance with independent actuarial advice, using the projected unit method. In certain countries pension benefits are provided on an unfunded basis, some administered by trustee companies. Liabilities are generally assessed annually in accordance with the advice of independent actuaries. Formal, independent, actuarial valuations of the Group’s main plans are undertaken regularly, normally at least every three years.
The assets of funded schemes are generally held in separately administered trusts or are insured. Assets are invested in different classes in order to maintain a balance between risk and return. Investments are diversified to limit the financial effect of the failure of any individual investment. The long term, overall target asset allocation is 60% equities, 30% bonds and 10% property.
Actuarial movements in the year are recognised in full through the statement of recognised income and expense.
The UK discount rate is based on the iBoxx over 15 year AA index and the US discount rate is based on corporate bond yields which reflect the term of the expected benefit payments. The expected rate of return on bonds reflects the portfolio mix of index-linked, government and corporate bonds. An equity risk premium of between 3% and 4% is added to longer term government bond yields to give the expected rate of return on equities. Projected inflation rate and pension increases are long term predictions based on the yield gap between long term index-linked and fixed interest Gilts. In the UK, mortality rates are calculated using the PA92 standard mortality tables projected to 2006. Plan obligations are then increased by between 3% and 10%, depending on each individual scheme’s mortality experience, to make allowance for future improvements in life expectancy. In the USA, mortality rates are calculated using the RP2000 fully generational table, projected using scale AA, with the white collar adjustment.
| |
|
| GSK Annual Report 2006 |
| 109 |
<Back to Contents
| |
| Notes to the financial statements |
| continued |
|
26 Pensions and other post-employment benefitscontinued
The average life expectancy assumed now for an individual at the age of 60 and projected to apply in 2026 for an individual then at the age of 60 is as follows:
| | | | UK | | | | USA | |
| |
| |
| Male | | Female | | Male | | Female | |
| Years | Years | Years | Years |
|
|
|
|
|
|
|
| |
| Current | 25.3 | | 26.8 | | 24.3 | | 26.1 | |
| Projected for 2026 | 26.9 | | 28.6 | | 25.8 | | 27.0 | |
|
|
|
|
|
|
|
| |
These mortality assumptions were set following a review in December 2005. GSK expects to review these again in December 2007.
During 2006, the Group made special funding contributions to the UK and US pension schemes totalling £346 million (2005 – £366 million). In 2006, GSK formalised an agreement with the trustees of the UK defined benefit pension schemes to make additional contributions of up to £325 million per year in addition to the normal contributions, over a four-year period ending 31st December 2009 in order to eliminate the then pension deficits on an IAS 19 basis.
In the UK the defined benefit pension schemes operated for the benefit of former Glaxo Wellcome employees and former SmithKline Beecham employees remain separate. These schemes were closed to new entrants in 2001 and subsequent UK employees are entitled to join a defined contribution scheme. In the USA the former Glaxo Wellcome and SmithKline Beecham defined benefit schemes were merged during 2001. In addition, the Group operates a number of post-retirement healthcare schemes, the principal one of which is in the USA.
The Group has applied the following financial assumptions in assessing the defined benefit liabilities:
| | | | | | UK | | | | | | USA | | | | | Rest of World | |
| |
| |
|
| 2006 | | 2005 | | 2004 | | 2006 | | 2005 | | 2004 | | 2006 | | 2005 | | 2004 |
| % pa | % pa | % pa | % pa | % pa | % pa | % pa | % pa | % pa |
|
|
|
|
|
|
|
|
|
|
|
|
|
|
|
|
|
| |
| Rate of increase of future earnings | 4.25 | | 4.00 | | 4.00 | | 5.00 | | 5.00 | | 5.00 | | 3.25 | | 3.25 | | 3.25 | |
| Discount rate | 5.00 | | 4.75 | | 5.25 | | 5.75 | | 5.50 | | 5.75 | | 4.25 | | 3.75 | | 4.25 | |
| Expected pension increases | 3.00 | | 2.75 | | 2.50 | | n/a | | n/a | | n/a | | 2.00 | | 2.00 | | 2.00 | |
| Cash balance credit/conversion rate | n/a | | n/a | | n/a | | 4.75 | | 4.50 | | 4.75 | | 1.75 | | 1.75 | | 1.75 | |
| Inflation rate | 3.00 | | 2.75 | | 2.50 | | 2.50 | | 2.50 | | 2.50 | | 1.75 | | 1.75 | | 1.75 | |
|
|
|
|
|
|
|
|
|
|
|
|
|
|
|
|
|
| |
The amounts recorded in the income statement and statement of recognised income and expense for the three years ended 31st December 2006 in relation to the defined benefit pension and post-retirement healthcare schemes were as follows:
| | | | | | | | | | Post-retirement | |
| | | | Pensions | benefits |
| |
|
|
|
|
|
|
| |
| |
| 2006 | UK | | USA | | Rest of World | | Group | | Group | |
| | £m | | £m | | £m | | £m | | £m | |
|
|
|
|
|
|
|
| |
| |
| Amounts charged to operating profit | | | | | | | | | | |
| Current service cost | 135 | | 66 | | 56 | | 257 | | 48 | |
| Past service cost | 33 | | – | | (2 | ) | 31 | | – | |
| Expected return on pension scheme assets | (333 | ) | (142 | ) | (30 | ) | (505 | ) | – | |
| Interest on scheme liabilities | 307 | | 113 | | 42 | | 462 | | 57 | |
| Settlements and curtailments | 17 | | (2 | ) | (4 | ) | 11 | | (14 | ) |
|
|
|
|
|
|
|
| |
| |
| 159 | | 35 | | 62 | | 256 | | 91 | |
|
|
|
|
|
|
|
| |
| |
| Actuarial gains recorded in the statement of recognised income and expense | 111 | | 169 | | 10 | | 290 | | 139 | |
|
|
|
|
|
|
|
| |
| |
| | | | | | | | | | | |
| | | | | | | | | | Post-retirement | |
| | | Pensions | benefits |
|
|
|
|
|
|
|
| |
|
| 2005 | UK | | USA | | Rest of World | | Group | | Group |
| £m | £m | £m | £m | £m |
|
|
|
|
|
|
|
| |
| |
| Amounts charged to operating profit | | | | | | | | | | |
| Current service cost | 117 | | 63 | | 52 | | 232 | | 46 | |
| Past service cost | – | | – | | – | | – | | 1 | |
| Expected return on pension scheme assets | (285 | ) | (126 | ) | (28 | ) | (439 | ) | – | |
| Interest on scheme liabilities | 276 | | 104 | | 34 | | 414 | | 53 | |
| Settlements and curtailments | 16 | | – | | – | | 16 | | – | |
|
|
|
|
|
|
|
| |
| |
| | 124 | | 41 | | 58 | | 223 | | 100 | |
|
|
|
|
|
|
|
| |
| |
| Actuarial losses recorded in the statement of recognised income and expense | (490 | ) | (109 | ) | (93 | ) | (692 | ) | (102 | ) |
|
|
|
|
|
|
|
| |
| |
| |
|
| GSK Annual Report 2006 |
| 110 |
<Back to Contents
| |
| Notes to the financial statements |
| continued |
|
26 Pensions and other post-employment benefitscontinued
| | | | | | | | | | Post-retirement | |
| | | | | | | | Pensions | | benefits | |
| |
|
|
|
|
|
|
| |
| |
| 2004 | UK | | USA | | Rest of World | | Group | | Group | |
| | £m | | £m | | £m | | £m | | £m | |
|
|
|
|
|
|
|
| |
| |
| Amounts charged to operating profit | | | | | | | | | | |
| Current service cost | 117 | | 58 | | 42 | | 217 | | 37 | |
| Past service cost | – | | – | | 2 | | 2 | | – | |
| Expected return on pension scheme assets | (272 | ) | (118 | ) | (20 | ) | (410 | ) | – | |
| Interest on scheme liabilities | 269 | | 104 | | 27 | | 400 | | 55 | |
| Settlements and curtailments | 5 | | – | | – | | 5 | | – | |
|
|
|
|
|
|
|
| |
| |
| 119 | | 44 | | 51 | | 214 | | 92 | |
|
|
|
|
|
|
|
| |
| |
| Actuarial gains/(losses) recorded in the statement of recognised income and expense | 162 | | 26 | | (26 | ) | 162 | | (54 | ) |
|
|
|
|
|
|
|
| |
| |
The total actuarial losses recorded in the statement of recognised income and expense since 1st January 2003 amount to £689 million.
The fair values of the assets and liabilities of the UK and US defined benefit pension schemes, together with aggregated data for other defined benefit pension schemes in the Group are as follows:
| | | | UK | | | | USA | | Rest of World | | Group | |
| |
| |
| |
| |
| |
| | | | | | | | | | Average | | | | | |
| At 31st December 2006 | Expected rate | | Fair | | Expected rate | | Fair | | expected rate | | Fair | | Fair | |
| | of return | | value | | of return | | value | | of return | | value | | value | |
| | % | | £m | | % | | £m | | % | | £m | | £m | |
|
|
|
|
|
|
|
|
|
|
|
|
|
| |
| Equities | 8.00 | | 4,218 | | 8.50 | | 1,412 | | 7.25 | | 205 | | 5,835 | |
| Property | 7.00 | | 210 | | 7.50 | | 169 | | 6.75 | | 11 | | 390 | |
| Bonds | 4.50 | | 2,026 | | 5.50 | | 324 | | 3.50 | | 351 | | 2,701 | |
| Other assets | 5.00 | | 100 | | 5.00 | | 48 | | 3.75 | | 174 | | 322 | |
|
|
|
|
|
|
|
|
|
|
|
|
|
| |
| Fair value of assets | | | 6,554 | | | | 1,953 | | | | 741 | | 9,248 | |
| Present value of scheme obligations | | | (7,444 | ) | | | (1,949 | ) | | | (952 | ) | (10,345 | ) |
|
|
|
|
|
|
|
|
|
|
|
|
|
| |
| | | (890 | ) | | | 4 | | | | (211 | ) | (1,097 | ) |
|
|
|
|
|
|
|
|
|
|
|
|
|
| |
| Included in other non-current assets | | | – | | | | 160 | | | | 19 | | 179 | |
|
|
|
|
|
|
|
|
|
|
|
|
|
| |
| Included in pensions and other post-employment benefits | | | (890 | ) | | | (156 | ) | | | (230 | ) | (1,276 | ) |
|
|
|
|
|
|
|
|
|
|
|
|
|
| |
| | | (890 | ) | | | 4 | | | | (211 | ) | (1,097 | ) |
|
|
|
|
|
|
|
|
|
|
|
|
|
| |
| Actual return on plan assets | | | 560 | | | | 310 | | | | 56 | | 926 | |
|
|
|
|
|
|
|
|
|
|
|
|
|
| |
| | | | | | | | | | | | | |
| | | | UK | | | | USA | | Rest of World | | Group | |
| |
| |
| |
| |
| |
| | | | | | | | | | Average | | | | | |
| At 31st December 2005 | Expected rate | | Fair | | Expected rate | | Fair | | expected rate | | Fair | | Fair | |
| | of return | | value | | of return | | value | | of return | | value | | value | |
| | % | | £m | | % | | £m | | % | | £m | | £m | |
|
|
|
|
|
|
|
|
|
|
|
|
|
| |
| Equities | 7.75 | | 3,895 | | 8.50 | | 1,440 | | 7.00 | | 192 | | 5,527 | |
| Property | – | | – | | 7.50 | | 106 | | 6.25 | | 11 | | 117 | |
| Bonds | 4.25 | | 1,764 | | 5.50 | | 352 | | 3.50 | | 302 | | 2,418 | |
| Other assets | 4.00 | | 85 | | 4.00 | | 78 | | 3.25 | | 152 | | 315 | |
|
|
|
|
|
|
|
|
|
|
|
|
|
| |
| Fair value of assets | | | 5,744 | | | | 1,976 | | | | 657 | | 8,377 | |
| Present value of scheme obligations | | | (7,054 | ) | | | (2,150 | ) | | | (922 | ) | (10,126 | ) |
|
|
|
|
|
|
|
|
|
|
|
|
|
| |
| | | (1,310 | ) | | | (174 | ) | | | (265 | ) | (1,749 | ) |
|
|
|
|
|
|
|
|
|
|
|
|
|
| |
| Included in other non-current assets | | | – | | | | – | | | | 12 | | 12 | |
|
|
|
|
|
|
|
|
|
|
|
|
|
| |
| Included in pensions and other post-employment benefits | | | (1,310 | ) | | | (174 | ) | | | (277 | ) | (1,761 | ) |
|
|
|
|
|
|
|
|
|
|
|
|
|
| |
| | | | (1,310 | ) | | | (174 | ) | | | (265 | ) | (1,749 | ) |
|
|
|
|
|
|
|
|
|
|
|
|
|
| |
| Actual return on plan assets | | | 932 | | | | 129 | | | | 63 | | 1,124 | |
|
|
|
|
|
|
|
|
|
|
|
|
|
| |
| |
|
| GSK Annual Report 2006 |
| 111 |
<Back to Contents
| |
| Notes to the financial statements |
| continued |
|
26 Pensions and other post-employment benefitscontinued
| | | | UK | | | | USA | | Rest of World | | Group | |
|
| |
| |
| |
| |
| | | | | | | | | | Average | | | | | |
| At 31st December 2004 | Expected rate | | Fair | | Expected rate | | Fair | | expected rate | | Fair | | Fair | |
| | of return | | value | | of return | | value | | of return | | value | | value | |
| | % | | £m | | % | | £m | | % | | £m | | £m | |
|
|
|
|
|
|
|
|
|
|
|
|
|
| |
| Equities | 8.25 | | 3,053 | | 8.50 | | 1,223 | | 7.50 | | 208 | | 4,484 | |
| Property | – | | – | | 6.50 | | 58 | | 6.25 | | 7 | | 65 | |
| Bonds | 4.50 | | 1,428 | | 5.75 | | 307 | | 3.75 | | 270 | | 2,005 | |
| Other assets | 4.00 | | 80 | | 2.50 | | 50 | | 2.25 | | 62 | | 192 | |
|
|
|
|
|
|
|
|
|
|
|
|
|
| |
| Fair value of assets | | | 4,561 | | | | 1,638 | | | | 547 | | 6,746 | |
| Present value of scheme obligations | | | (5,735 | ) | | | (1,750 | ) | | | (761 | ) | (8,246 | ) |
|
|
|
|
|
|
|
|
|
|
|
|
|
| |
| | | (1,174 | ) | | | (112 | ) | | | (214 | ) | (1,500 | ) |
|
|
|
|
|
|
|
|
|
|
|
|
|
| |
| Included in other non-current assets | | | – | | | | – | | | | 14 | | 14 | |
|
|
|
|
|
|
|
|
|
|
|
|
|
| |
| Included in pensions and other post-employment benefits | | | (1,174 | ) | | | (112 | ) | | | (228 | ) | (1,514 | ) |
|
|
|
|
|
|
|
|
|
|
|
|
|
| |
| | | (1,174 | ) | | | (112 | ) | | | (214 | ) | (1,500 | ) |
|
|
|
|
|
|
|
|
|
|
|
|
|
| |
| Actual return on plan assets | | | 468 | | | | 204 | | | | 43 | | 715 | |
|
|
|
|
|
|
|
|
|
|
|
|
|
| |
| | | | | | | | | | | |
| | | | | | | | | Post-retirement | |
| | | | | | | Pensions | | benefits | |
|
|
|
|
|
|
|
| |
| |
| Movements in defined benefit obligations | UK | | USA | | Rest of World | | Group | | Group | |
| £m | | £m | | £m | | £m | | £m | |
|
|
|
|
|
|
|
| |
| |
| Obligations at 1st January 2004 | (5,508 | ) | (1,751 | ) | (707 | ) | (7,966 | ) | (951 | ) |
| Exchange adjustments | – | | 126 | | 31 | | 157 | | 52 | |
| Service cost | (117 | ) | (58 | ) | (44 | ) | (219 | ) | (37 | ) |
| Interest cost | (269 | ) | (104 | ) | (27 | ) | (400 | ) | (55 | ) |
| Settlements and curtailments | (5 | ) | – | | – | | (5 | ) | – | |
| Actuarial losses | (34 | ) | (60 | ) | (49 | ) | (143 | ) | (54 | ) |
| Scheme participants’ contributions | (12 | ) | – | | (3 | ) | (15 | ) | (8 | ) |
| Benefits paid | 210 | | 97 | | 38 | | 345 | | 48 | |
|
|
|
|
|
|
|
| |
| |
| Obligations at 31st December 2004 | (5,735 | ) | (1,750 | ) | (761 | ) | (8,246 | ) | (1,005 | ) |
|
|
|
|
|
|
|
| |
| |
| Exchange adjustments | – | | (217 | ) | 14 | | (203 | ) | (138 | ) |
| Service cost | (117 | ) | (63 | ) | (52 | ) | (232 | ) | (47 | ) |
| Interest cost | (276 | ) | (104 | ) | (34 | ) | (414 | ) | (53 | ) |
| Settlements and curtailments | (16 | ) | – | | – | | (16 | ) | – | |
| Actuarial losses | (1,137 | ) | (112 | ) | (128 | ) | (1,377 | ) | (102 | ) |
| Scheme participants’ contributions | (12 | ) | – | | (3 | ) | (15 | ) | (9 | ) |
| Benefits paid | 239 | | 96 | | 42 | | 377 | | 46 | |
|
|
|
|
|
|
|
| |
| |
| Obligations at 31st December 2005 | (7,054 | ) | (2,150 | ) | (922 | ) | (10,126 | ) | (1,308 | ) |
|
|
|
|
|
|
|
| |
| |
| Exchange adjustments | – | | 267 | | 30 | | 297 | | 151 | |
| Service cost | (168 | ) | (66 | ) | (54 | ) | (288 | ) | (48 | ) |
| Interest cost | (307 | ) | (113 | ) | (42 | ) | (462 | ) | (57 | ) |
| Settlements and curtailments | (17 | ) | 2 | | 12 | | (3 | ) | 14 | |
| Actuarial (losses)/gains | (116 | ) | 1 | | (16 | ) | (131 | ) | 139 | |
| Scheme participants’ contributions | (11 | ) | – | | (3 | ) | (14 | ) | (8 | ) |
| Benefits paid | 229 | | 110 | | 43 | | 382 | | 54 | |
|
|
|
|
|
|
|
| |
| |
| Obligations at 31st December 2006 | (7,444 | ) | (1,949 | ) | (952 | ) | (10,345 | ) | (1,063 | ) |
|
|
|
|
|
|
|
| |
| |
The liability for the US post-retirement healthcare scheme has been assessed using the same assumptions as for the US pension scheme, together with the assumption for future medical inflation of 9.25%, reducing by 0.75% per year to 5% in 2013 and thereafter. On this basis the liability for the US scheme has been assessed at £927 million (2005 – £1,133 million, 2004 – £895 million).
| |
|
| GSK Annual Report 2006 |
| 112 |
<Back to Contents
| |
| Notes to the financial statements |
| continued |
|
26 Pensions and other post-employment benefitscontinued
The defined benefit pension obligation is analysed as follows:
| | 2006 | | 2005 | | 2004 | |
| £m | £m | £m |
|
|
|
|
|
| |
| Funded | (10,099 | ) | (9,858 | ) | (8,029 | ) |
| Unfunded | (246 | ) | (268 | ) | (217 | ) |
|
|
|
|
|
| |
| | (10,345 | ) | (10,126 | ) | (8,246 | ) |
|
|
|
|
|
| |
Post-retirement benefits are unfunded.
| Movements in fair value of assets | | | | | | | | | Post-retirement | |
| | | | Pensions | benefits |
|
|
|
|
|
|
|
|
| UK | | USA | | Rest of World | | Group | Group |
| £m | | £m | | £m | | £m | £m |
|
|
|
|
|
|
|
| |
| |
| Assets at 1st January 2004 | 3,955 | | 1,583 | | 444 | | 5,982 | | – | |
| Exchange adjustments | – | | (117 | ) | 27 | | (90 | ) | – | |
| Expected return on assets | 272 | | 118 | | 20 | | 410 | | – | |
| Actuarial gains | 196 | | 86 | | 23 | | 305 | | – | |
| Employer contributions | 336 | | 65 | | 68 | | 469 | | 40 | |
| Scheme participants’ contributions | 12 | | – | | 3 | | 15 | | 8 | |
| Benefits paid | (210 | ) | (97 | ) | (38 | ) | (345 | ) | (48 | ) |
|
|
|
|
|
|
|
| |
| |
| Assets at 31st December 2004 | 4,561 | | 1,638 | | 547 | | 6,746 | | – | |
|
|
|
|
|
|
|
| |
| |
| Exchange adjustments | – | | 200 | | (4 | ) | 196 | | – | |
| Expected return on assets | 285 | | 126 | | 28 | | 439 | | – | |
| Actuarial gains | 647 | | 3 | | 35 | | 685 | | – | |
| Employer contributions | 478 | | 105 | | 90 | | 673 | | 37 | |
| Scheme participants’ contributions | 12 | | – | | 3 | | 15 | | 9 | |
| Benefits paid | (239 | ) | (96 | ) | (42 | ) | (377 | ) | (46 | ) |
|
|
|
|
|
|
|
| |
| |
| Assets at 31st December 2005 | 5,744 | | 1,976 | | 657 | | 8,377 | | – | |
|
|
|
|
|
|
|
| |
| |
| Exchange adjustments | – | | (255 | ) | (30 | ) | (285 | ) | – | |
| Expected return on assets | 333 | | 142 | | 30 | | 505 | | – | |
| Settlements and curtailments | – | | – | | (8 | ) | (8 | ) | – | |
| Actuarial gains | 227 | | 168 | | 26 | | 421 | | – | |
| Employer contributions | 468 | | 32 | | 106 | | 606 | | 46 | |
| Scheme participants’ contributions | 11 | | – | | 3 | | 14 | | 8 | |
| Benefits paid | (229 | ) | (110 | ) | (43 | ) | (382 | ) | (54 | ) |
|
|
|
|
|
|
|
| |
| |
| Assets at 31st December 2006 | 6,554 | | 1,953 | | 741 | | 9,248 | | – | |
|
|
|
|
|
|
|
| |
| |
The UK defined benefit schemes include defined contribution sections with account balances totalling £609 million at 31st December 2006 (2005 – £515 million, 2004 – £404 million). Information on scheme assets under US GAAP is given in Note 41.
Employer contributions for 2007 are estimated to be approximately £500 million in respect of defined benefit pension schemes and £50 million in respect of post-retirement benefits.
The transition date for conversion to IFRS for GSK was 1st January 2003 and therefore the following historical data has been presented from that date. This will be built up to a rolling five year record next year.
| History of experience gains and losses | | | | | | | | | Post-retirement | |
| | | | Pensions | benefits |
|
|
|
|
|
|
|
|
| UK | | USA | | Rest of World | | Group | Group |
| £m | | £m | | £m | | £m | £m |
|
|
|
|
|
|
|
| |
| |
| | | | | | | | | | | |
| 2006 | | | | | | | | | | |
| Experience gains of scheme assets (£m) | 227 | | 168 | | 26 | | 421 | | | |
| Percentage of scheme assets at 31st December 2006 | 3 | % | 9 | % | 4 | % | 5 | % | | |
|
|
|
|
|
|
|
| | | |
| | | | | | | | | | | |
| Experience (losses)/gains of scheme liabilities (£m) | (37 | ) | (16 | ) | (42 | ) | (95 | ) | 17 | |
| Percentage of scheme obligations at 31st December 2006 | – | | 1 | % | 4 | % | 1 | % | 2 | % |
|
|
|
|
|
|
|
| |
| |
| | | | | | | | | | | |
| Fair value of assets | 6,554 | | 1,953 | | 741 | | 9,248 | | – | |
| Present value of scheme obligations | (7,444 | ) | (1,949 | ) | (952 | ) | (10,345 | ) | (1,063 | ) |
|
|
|
|
|
|
|
| |
| |
| (Deficits)/surpluses in the schemes | (890 | ) | 4 | | (211 | ) | (1,097 | ) | (1,063 | ) |
|
|
|
|
|
|
|
| |
| |
| |
|
| GSK Annual Report 2006 |
| 113 |
<Back to Contents
| |
| Notes to the financial statements |
| continued |
|
26 Pensions and other post-employment benefitscontinued
| History of experience gains and losses | | | | | | | | | Post-retirement | |
| | | | Pensions | benefits |
|
|
|
|
|
|
|
|
| UK | | USA | | Rest of World | | Group | Group |
| £m | | £m | | £m | | £m | £m |
|
|
|
|
|
|
|
| |
| |
| | | | | | | | | | | |
| 2005 | | | | | | | | | | |
| Experience gains of scheme assets (£m) | 647 | | 3 | | 35 | | 685 | | | |
| Percentage of scheme assets at 31st December 2005 | 11 | % | – | | 5 | % | 8 | % | | |
|
|
|
|
|
|
|
| | | |
| | | | | | | | | | | |
| Experience losses of scheme liabilities (£m) | (94 | ) | (10 | ) | (35 | ) | (139 | ) | (4 | ) |
| Percentage of scheme obligations at 31st December 2005 | 1 | % | – | | 4 | % | 1 | % | – | |
|
|
|
|
|
|
|
| |
| |
| | | | | | | | | | | |
| Fair value of assets | 5,744 | | 1,976 | | 657 | | 8,377 | | – | |
| Present value of scheme obligations | (7,054 | ) | (2,150 | ) | (922 | ) | (10,126 | ) | (1,308 | ) |
|
|
|
|
|
|
|
| |
| |
| Deficits in the schemes | (1,310 | ) | (174 | ) | (265 | ) | (1,749 | ) | (1,308 | ) |
|
|
|
|
|
|
|
| |
| |
| | | | | | | | | | | |
| 2004 | | | | | | | | | | |
| Experience gains of scheme assets (£m) | 196 | | 86 | | 23 | | 305 | | | |
| Percentage of scheme assets at 31st December 2004 | 4 | % | 5 | % | 4 | % | 5 | % | | |
|
|
|
|
|
|
|
| |
| |
| | | | | | | | | | | |
| Experience (losses)/gains of scheme liabilities (£m) | (25 | ) | (5 | ) | (18 | ) | (48 | ) | 47 | |
| Percentage of scheme obligations at 31st December 2004 | – | | – | | 2 | % | 1 | % | 5 | % |
|
|
|
|
|
|
|
| |
| |
| | | | | | | | | | | |
| Fair value of assets | 4,561 | | 1,638 | | 547 | | 6,746 | | – | |
| Present value of scheme obligations | (5,735 | ) | (1,750 | ) | (761 | ) | (8,246 | ) | (1,005 | ) |
|
|
|
|
|
|
|
| |
| |
| Deficits in the schemes | (1,174 | ) | (112 | ) | (214 | ) | (1,500 | ) | (1,005 | ) |
|
|
|
|
|
|
|
| |
| |
| | | | | | | | | | | |
| 2003 | | | | | | | | | | |
| Experience gains of scheme assets (£m) | 336 | | 231 | | 33 | | 600 | | | |
| Percentage of scheme assets at 31st December 2003 | 8 | % | 15 | % | 7 | % | 10 | % | | |
|
|
|
|
|
|
|
| |
| |
| | | | | | | | | | | |
| Experience (losses)/gains of scheme liabilities (£m) | (183 | ) | 5 | | (19 | ) | (197 | ) | (123 | ) |
| Percentage of scheme obligations at 31st December 2003 | 3 | % | – | | 3 | % | 2 | % | 13 | % |
|
|
|
|
|
|
|
| |
| |
| | | | | | | | | | | |
| Fair value of assets | 3,955 | | 1,583 | | 444 | | 5,982 | | – | |
| Present value of scheme obligations | (5,508 | ) | (1,751 | ) | (707 | ) | (7,966 | ) | (951 | ) |
|
|
|
|
|
|
|
| |
| |
| Deficits in the schemes | (1,553 | ) | (168 | ) | (263 | ) | (1,984 | ) | (951 | ) |
|
|
|
|
|
|
|
| |
| |
Sensitivity analysis
Effect of changes in assumptions used on the annual defined benefit pension and post-retirement costs or the benefit obligations:
| | £m | |
|
| |
| A 0.25% decrease in discount rate would have the following approximate effect: | | |
| | | |
| Increase in annual pension cost | 4 | |
| Increase in annual post-retirement benefits cost | 1 | |
| Increase in pension obligation | 369 | |
| Increase in post-retirement benefits obligation | 37 | |
|
| |
| A one year increase in life expectancy would have the following approximate effect: | | |
| | | |
| Increase in annual pension cost | 17 | |
| Increase in annual post-retirement benefits cost | 3 | |
| Increase in pension obligation | 259 | |
| Increase in post-retirement benefits obligation | 39 | |
|
| |
| |
|
| GSK Annual Report 2006 |
| 114 |
Back to Contents
| |
| Notes to the financial statements |
| continued |
|
26 Pensions and other post-employment benefitscontinued
Sensitivity analysis
| | £m | |
|
| |
| A 0.25% decrease in expected rates of returns on assets would have the following approximate effect: | | |
| | | |
| Increase in annual pension cost | 22 | |
|
| |
| A 1% increase in the rate of future healthcare inflation would have the following approximate effect: | | |
| | | |
| Increase in annual post-retirement benefits cost | 8 | |
| Increase in post-retirement benefits obligation | 89 | |
|
| |
| A 0.25% increase in inflation would have the following approximate effect: | | |
| | | |
| Increase in annual pension cost | 23 | |
| Increase in pension obligation | 298 | |
|
| |
27 Other provisions
| | Exchange | | | | | | Legal | | | | | |
| | Offer | | Merger | | Operational | | and other | | Other | | | |
| | Incentive | | integration | | excellence | | disputes | | provisions | | Total | |
| | £m | | £m | | £m | | £m | | £m | | £m | |
|
|
|
|
|
|
|
|
|
|
|
| |
| At 1st January 2006 | 133 | | 59 | | 52 | | 1,165 | | 227 | | 1,636 | |
| Exchange adjustments | (5 | ) | (1 | ) | (5 | ) | (94 | ) | (15 | ) | (120 | ) |
| (Credit)/charge for the year | (2 | ) | (24 | ) | 134 | | 293 | | 45 | | 446 | |
| Unwinding of discount | 2 | | – | | – | | 24 | | 10 | | 36 | |
| Applied | (11 | ) | (15 | ) | (50 | ) | (274 | ) | (41 | ) | (391 | ) |
| Reversed unused | – | | – | | – | | (8 | ) | (14 | ) | (22 | ) |
| Reclassifications and other movements | – | | (2 | ) | – | | (1 | ) | 1 | | (2 | ) |
|
|
|
|
|
|
|
|
|
|
|
| |
| At 31st December 2006 | 117 | | 17 | | 131 | | 1,105 | | 213 | | 1,583 | |
|
|
|
|
|
|
|
|
|
|
|
| |
| | | | | | | | | | | | | |
| To be settled within one year | 64 | | 15 | | 117 | | 743 | | 116 | | 1,055 | |
| To be settled after one year | 53 | | 2 | | 14 | | 362 | | 97 | | 528 | |
|
|
|
|
|
|
|
|
|
|
|
| |
| At 31st December 2006 | 117 | | 17 | | 131 | | 1,105 | | 213 | | 1,583 | |
|
|
|
|
|
|
|
|
|
|
|
| |
The Group has recognised costs in previous years in respect of plans for the integration of the Glaxo Wellcome and SmithKline Beecham businesses. Implementation of the integration following the merger is substantially complete. The exchange offer incentive programme operated at the time of the merger to encourage staff to convert Glaxo Wellcome or SmithKline Beecham share options into GlaxoSmithKline share options. The incentive is paid either when employees exercise the relevant options, or when the options lapse, up to 2010. The discount on this provision increased by £2 million in 2006 (2005 – £4 million), and was calculated using risk-free rates of return. Costs recognised in the remaining merger integration provision in respect of identified severances are expected to be incurred in 2007.
Operational excellence is the term used by the Group to refer to the continuous worldwide programme of cost saving measures that are carried out within all areas of the business. The majority of these projects are of a short-term nature.
GSK is involved in a number of legal and other disputes, including notification of possible claims, as set out in Note 43 ‘Legal proceedings’. Provisions for legal and other disputes include amounts relating to US anti-trust, product liability, contract terminations, self-insurance, environmental clean-up and property rental. The company’s Directors, having taken legal and other specialist advice, have established provisions after taking into account insurance and other agreements and having regard to the relevant facts and circumstances of each matter and in accordance with accounting requirements. These provisions were discounted by £2 million in 2006 (2005 – £71 million) using risk-adjusted projected cash flows and risk-free rates of return. The effect of the change in the discount rate in 2006 is to increase the discount at 31st December by £7 million. A number of products have a history of claims made and settlements which makes it possible to use an IBNR (incurred but not reported) actuarial technique to determine a reasonable estimate of the Group’s exposure for unasserted claims in relation to those products. Apart from the IBNR provision, no provisions have been made for unasserted claims. The ultimate liability for such matters may vary from the amounts provided and is dependent upon the outcome of litigation proceedings, investigations and possible settlement negotiations.
It is in the nature of the Group’s business that a number of these matters, including those provided using the IBNR actuarial technique, may be the subject of negotiation and litigation over several years. The largest individual amounts provided are expected to be settled within three years.
At 31st December 2006, it is expected that £120 million (2005 – £115 million) of the provision made for legal and other disputes will be reimbursed by third party insurers. This amount is included within current and non-current assets.
For a discussion of legal issues, refer to Note 43 ‘Legal proceedings’.
| |
|
| GSK Annual Report 2006 |
| 115 |
Back to Contents
| |
| Notes to the financial statements |
| continued |
|
28 Other non-current liabilities
| | 2006 | | 2005 | |
| | £m | | £m | |
|
|
|
| |
| Accruals and deferred income | 97 | | 58 | |
| Derivative financial instruments | 60 | | 26 | |
| Other payables | 249 | | 383 | |
|
|
|
| |
| | 406 | | 467 | |
|
|
|
| |
29 Contingent liabilities
At 31st December 2006 contingent liabilities, comprising guarantees, letters of credit, discounted bills and other items arising in the normal course of business, amounted to £258 million (2005 – £342 million). At 31st December 2006, £114 million (2005 – £96 million) financial assets were pledged as collateral for contingent liabilities. For discussions of tax and legal issues, refer to Note 12, ‘Taxation’ and Note 43, ‘Legal proceedings’.
30 Net debt
| | 2006 | | 2005 | |
| | £m | | £m | |
|
|
|
| |
| Current assets: | | | | |
| Liquid investments | 1,035 | | 1,025 | |
| Cash and cash equivalents | 2,005 | | 4,209 | |
|
|
|
| |
| | 3,040 | | 5,234 | |
|
|
|
| |
| Short-term borrowings: | | | | |
| 6.125% US$ Notes 2006 | – | | (291 | ) |
| 2.375% US$ Medium Term Note 2007 | (255 | ) | – | |
| Commercial paper | – | | (576 | ) |
| Bank loans and overdrafts | (410 | ) | (249 | ) |
| Other loans | (11 | ) | (46 | ) |
| Obligations under finance leases | (42 | ) | (38 | ) |
|
|
|
| |
| | (718 | ) | (1,200 | ) |
|
|
|
| |
| Long-term borrowings: | | | | |
| 2.375%US$ US Medium Term Note 2007 | – | | (283 | ) |
| 3.375%€European Medium Term Note 2008 | (671 | ) | (689 | ) |
| 4.875% £ European Medium Term Note 2008 | (494 | ) | (502 | ) |
| 3.25%€European Medium Term Note 2009 | (338 | ) | (342 | ) |
| 3.00%€European Medium Term Note 2012 | (503 | ) | (510 | ) |
| 4.375% US$ US Medium Term Note 2014 | (719 | ) | (825 | ) |
| 4.00%€European Medium Term Note 2025 | (497 | ) | (503 | ) |
| 5.25% £ European Medium Term Note 2033 | (977 | ) | (976 | ) |
| 5.375% US$ US Medium Term Note 2034 | (253 | ) | (288 | ) |
| Loan stock | (10 | ) | (11 | ) |
| Bank loans | (1 | ) | (3 | ) |
| Other loans and private financing | (212 | ) | (256 | ) |
| Obligations under finance leases | (97 | ) | (83 | ) |
|
|
|
| |
| | (4,772 | ) | (5,271 | ) |
|
|
|
| |
| Net debt | (2,450 | ) | (1,237 | ) |
|
|
|
| |
Current assets
Liquid investments are classified as available-for-sale investments. At 31st December 2006, they included redeemable shares, which were fully collateralised with highly rated bonds, of€1 billion (£676 million), and government bonds. The effective interest rate on liquid investments at 31st December 2006 was approximately 3.7 % (2005 – approximately 2.8%) .
The effective interest rate on cash and cash equivalents at 31st December 2006 was approximately 4.8% (2005 – approximately 4.0%) .
| |
|
| GSK Annual Report 2006 |
| 116 |
<Back to Contents
| |
| Notes to the financial statements |
| continued |
|
30 Net debtcontinued
Short-term borrowings
Commercial paper comprises a US$10 billion programme, of which none was in issue at 31st December 2006 (2005 – $991 million (£576 million)), backed up by committed facilities of 364 days duration of $900 million (£459 million) (2005 – $900 million (£523 million)) renewable annually, and liquid investments, cash and cash equivalents as shown in the table above.
The weighted average interest rate on current bank loans and overdrafts at 31st December 2006 was 2.4% (2005 – 4.0%) .
Long-term borrowings
Loans due after one year are repayable over various periods as follows:
| | 2006 | | 2005 | |
| | £m | | £m | |
|
|
|
| |
| Between one and two years | 1,202 | | 317 | |
| Between two and three years | 366 | | 1,224 | |
| Between three and four years | 26 | | 354 | |
| Between four and five years | 7 | | 9 | |
| After five years | 3,171 | | 3,367 | |
|
|
|
| |
| | 4,772 | | 5,271 | |
|
|
|
| |
The loans repayable after five years carry interest at effective rates between 3.0% and 5.4% . The repayment dates range from 2012 to 2034.
The average effective interest rate of all Notes at 31st December 2006 was approximately 4.3% (2005 – approximately 4.5%) .
Secured loans
Loans amounting to £8 million (2005 – £20 million) are secured by charges on non-current and current assets.
| Finance lease obligations | 2006 | | 2005 | |
| £m | £m |
|
|
|
| |
| Rental payments due within one year | 49 | | 41 | |
| Rental payments due between one and two years | 41 | | 33 | |
| Rental payments due between two and three years | 30 | | 23 | |
| Rental payments due between three and four years | 18 | | 13 | |
| Rental payments due between four and five years | 8 | | 9 | |
| Rental payments due after five years | 14 | | 15 | |
|
|
|
| |
| Total future rental payments | 160 | | 134 | |
| Future finance charges | (21 | ) | (13 | ) |
|
|
|
| |
| Total finance lease obligations | 139 | | 121 | |
|
|
|
| |
| |
|
| GSK Annual Report 2006 |
| 117 |
Back to Contents
| |
| Notes to the financial statements |
| continued |
|
31 Share capital and share premium account
| | | | | | | |
| | Ordinary shares of 25p each | | Share | |
| |
|
|
| | premium | |
| | Number | | £m | | £m | |
|
|
|
|
|
| |
| Share capital authorised | | | | | | |
| At 31st December 2004 | 10,000,000,000 | | 2,500 | | | |
| At 31st December 2005 | 10,000,000,000 | | 2,500 | | | |
| At 31st December 2006 | 10,000,000,000 | | 2,500 | | | |
|
|
|
|
|
| |
| Share capital issued and fully paid | | | | | | |
| | | | | | | |
| At 1st January 2004 | 5,949,463,628 | | 1,487 | | 264 | |
| Issued under share option schemes | 6,300,203 | | 2 | | 40 | |
| Purchased and cancelled | (18,075,000 | ) | (5 | ) | – | |
|
|
|
|
|
| |
| At 31st December 2004 | 5,937,688,831 | | 1,484 | | 304 | |
| Issued under share option schemes | 25,162,425 | | 7 | | 245 | |
|
|
|
|
|
| |
| At 31st December 2005 | 5,962,851,256 | | 1,491 | | 549 | |
| Issued under share option schemes | 28,750,592 | | 7 | | 309 | |
|
|
|
|
|
| |
| At 31st December 2006 | 5,991,601,848 | | 1,498 | | 858 | |
|
|
|
|
|
| |
| | | | | | | |
| | 31st December | | 31st December | | 31st December | |
| | 2006 | | 2005 | | 2004 | |
|
|
|
|
|
| |
| Number (‘000) of shares issuable under outstanding options (Note 40) | 225,163 | | 221,293 | | 276,954 | |
|
|
|
|
|
| |
| Number (‘000) of unissued shares not under option | 3,783,235 | | 3,815,856 | | 3,785,358 | |
|
|
|
|
|
| |
At 31st December 2006, of the issued share capital, 153,451,642 shares were held in the ESOP Trust, 235,482,678 shares were held as Treasury shares and 5,602,667,528 shares were in free issue. All issued shares are fully paid. The nominal, carrying and market values of the shares held in the ESOP Trust are disclosed in Note 40.
In October 2006, the Group announced a new share buy-back programme totalling £6 billion, which is expected to be completed over a three year period. The exact amount and timing of future purchases, and the extent to which repurchased shares will be held as Treasury shares rather than being cancelled, will be determined by the company and is dependent on market conditions and other factors. In 2006, the Group also commenced close period share buy-backs by operating under specific, irrevocable agreements put in place with its brokers prior to the start of each close period.
A total of £7.8 billion has been spent by the company between 1st January 2001 and 31st December 2006 on buying its own shares for cancellation or to be held as Treasury shares, of which £1.3 billion was spent in 2006 (£0.5 billion under the new £6 billion programme).
20.4 million shares have been purchased in the period 1st January 2007 to 23rd February 2007 at a cost of £290 million. All purchases were made through the publicly announced buy-back programme.
The table below sets out the monthly purchases under the share buy-back programme:
| | | | Average share price excluding | |
| | Number of shares | | commission and stamp duty | |
| Month | 000 | | £ | |
|
|
|
| |
| January 2006 | Nil | | – | |
| February 2006 | 4,375 | | 14.67 | |
| March 2006 | 10,040 | | 15.34 | |
| April 2006 | 640 | | 15.63 | |
| May 2006 | 10,200 | | 15.09 | |
| June 2006 | 8,567 | | 14.81 | |
| July 2006 | 5,935 | | 15.07 | |
| August 2006 | 9,080 | | 14.41 | |
| September 2006 | 6,525 | | 14.42 | |
| October 2006 | 10,628 | | 14.30 | |
| November 2006 | 18,550 | | 13.73 | |
| December 2006 | 8,163 | | 13.39 | |
|
|
|
| |
| Total | 92,703 | | 14.45 | |
|
|
|
| |
All shares purchased in 2006 are held as Treasury shares. For details of substantial shareholdings refer to ‘Substantial shareholdings’ on page 177.
| |
|
| GSK Annual Report 2006 |
| 118 |
Back to Contents
| |
| Notes to the financial statements |
| continued |
|
32 Movements in equity
| | | | | | | | Shareholders’ equity | | | | | |
| |
|
|
|
|
|
|
| | | | | |
| | Share | | Share | | Retained | | Other | | | | Minority | | Total | |
| | capital | | premium | | earnings | | reserves | | Total | | interests | | equity | |
| | £m | | £m | | £m | | £m | | £m | | £m | | £m | |
|
|
|
|
|
|
|
|
|
|
|
|
|
| |
| At 1st January 2004 | 1,487 | | 264 | | 3,959 | | (793 | ) | 4,917 | | 681 | | 5,598 | |
| Recognised income and expense for the year | – | | – | | 3,906 | | – | | 3,906 | | 93 | | 3,999 | |
| Changes in minority shareholdings | – | | – | | – | | – | | – | | (489 | ) | (489 | ) |
| Distributions to minority shareholders | – | | – | | – | | – | | – | | (72 | ) | (72 | ) |
| Dividends to shareholders | – | | – | | (2,476 | ) | – | | (2,476 | ) | – | | (2,476 | ) |
| Ordinary shares issued | 2 | | 40 | | – | | – | | 42 | | – | | 42 | |
| Ordinary shares purchased and cancelled | (5 | ) | – | | (201 | ) | 5 | | (201 | ) | – | | (201 | ) |
| Ordinary shares purchased and held as Treasury shares | – | | – | | (799 | ) | – | | (799 | ) | – | | (799 | ) |
| Ordinary shares transferred by ESOP Trusts | – | | – | | – | | 23 | | 23 | | – | | 23 | |
| Write-down of shares held by ESOP Trusts | – | | – | | (180 | ) | 180 | | – | | – | | – | |
| Share-based incentive plans | – | | – | | 333 | | (21 | ) | 312 | | – | | 312 | |
|
|
|
|
|
|
|
|
|
|
|
|
|
| |
| At 31st December 2004 | 1,484 | | 304 | | 4,542 | | (606 | ) | 5,724 | | 213 | | 5,937 | |
| Implementation of accounting for financial instruments under IAS 39 | – | | – | | (94 | ) | 78 | | (16 | ) | 4 | | (12 | ) |
|
|
|
|
|
|
|
|
|
|
|
|
|
| |
| At 1st January 2005, as adjusted | 1,484 | | 304 | | 4,448 | | (528 | ) | 5,708 | | 217 | | 5,925 | |
| Recognised income and expense for the year | – | | – | | 4,426 | | (3 | ) | 4,423 | | 153 | | 4,576 | |
| Changes in minority shareholdings | – | | – | | (15 | ) | – | | (15 | ) | (25 | ) | (40 | ) |
| Distributions to minority shareholders | – | | – | | – | | – | | – | | (86 | ) | (86 | ) |
| Dividends to shareholders | – | | – | | (2,390 | ) | – | | (2,390 | ) | – | | (2,390 | ) |
| Ordinary shares issued | 7 | | 245 | | – | | – | | 252 | | – | | 252 | |
| Ordinary shares purchased and held as Treasury shares | – | | – | | (1,000 | ) | – | | (1,000 | ) | – | | (1,000 | ) |
| Ordinary shares transferred by ESOP Trusts | – | | – | | – | | 68 | | 68 | | – | | 68 | |
| Write-down of shares held by ESOP Trusts | – | | – | | (155 | ) | 155 | | – | | – | | – | |
| Share-based incentive plans | – | | – | | 240 | | – | | 240 | | – | | 240 | |
| Tax on share-based incentive plans | – | | – | | 25 | | – | | 25 | | – | | 25 | |
|
|
|
|
|
|
|
|
|
|
|
|
|
| |
| At 31st December 2005 | 1,491 | | 549 | | 5,579 | | (308 | ) | 7,311 | | 259 | | 7,570 | |
| Recognised income and expense for the year | – | | – | | 5,248 | | 59 | | 5,307 | | 88 | | 5,395 | |
| Changes in minority shareholdings | – | | – | | – | | – | | – | | 2 | | 2 | |
| Distributions to minority shareholders | – | | – | | – | | – | | – | | (87 | ) | (87 | ) |
| Dividends to shareholders | – | | – | | (2,598 | ) | – | | (2,598 | ) | – | | (2,598 | ) |
| Ordinary shares issued | 7 | | 309 | | – | | – | | 316 | | – | | 316 | |
| Ordinary shares purchased and held as Treasury shares | – | | – | | (1,348 | ) | – | | (1,348 | ) | – | | (1,348 | ) |
| Ordinary shares transferred by ESOP Trusts | – | | – | | – | | 151 | | 151 | | – | | 151 | |
| Write-down of shares held by ESOP Trusts | – | | – | | (163 | ) | 163 | | – | | – | | – | |
| Share-based incentive plans | – | | – | | 226 | | – | | 226 | | – | | 226 | |
| Tax on share-based incentive plans | – | | – | | 21 | | – | | 21 | | – | | 21 | |
|
|
|
|
|
|
|
|
|
|
|
|
|
| |
| At 31st December 2006 | 1,498 | | 858 | | 6,965 | | 65 | | 9,386 | | 262 | | 9,648 | |
|
|
|
|
|
|
|
|
|
|
|
|
|
| |
Retained earnings and other reserves amounted to £7,030 million at 31st December 2006 (2005 – £5,271 million, 2004 – £3,936 million) of which £7,180 million (2005 – £8,067 million, 2004 – £10,243 million) relates to the company and £185 million (2005 – £180 million, 2004– £108 million) relates to joint ventures and associated undertakings. The cumulative translation exchange in equity since 1st January 2003 is shown in the following table:
| | 2006 | | 2005 | | 2004 | |
| | £m | | £m | | £m | |
|
|
|
|
|
| |
| Translation exchange at 1st January | 217 | | 5 | | 46 | |
| Exchange movements on overseas net assets | (390 | ) | 203 | | (47 | ) |
| Exchange movements on goodwill in reserves | 31 | | 9 | | 6 | |
|
|
|
|
|
| |
| Translation exchange at 31st December | (142 | ) | 217 | | 5 | |
|
|
|
|
|
| |
| |
|
| GSK Annual Report 2006 |
| 119 |
Back to Contents
| |
| Notes to the financial statements |
| continued |
|
32 Movements in equitycontinued
Other reserves is analysed as follows:
| | | | | | Cash flow | | | | | |
| | ESOP Trust | | Fair value | | hedge | | Other | | | |
| | shares | | reserve | | reserve | | reserves | | Total | |
| | £m | | £m | | £m | | £m | | £m | |
|
|
|
|
|
|
|
|
|
| |
| At 1st January 2004 | (2,718 | ) | – | | – | | 1,925 | | (793 | ) |
| Ordinary shares purchased and cancelled | – | | – | | – | | 5 | | 5 | |
| Ordinary shares transferred by ESOP Trusts | 23 | | – | | – | | – | | 23 | |
| Write-down of shares held by ESOP Trusts | 180 | | – | | – | | – | | 180 | |
| Share-based incentive plans | (21 | ) | – | | – | | – | | (21 | ) |
|
|
|
|
|
|
|
|
|
| |
| At 31st December 2004 | (2,536 | ) | – | | – | | 1,930 | | (606 | ) |
| Implementation of accounting for financial instruments under IAS 39 | – | | 76 | | 2 | | – | | 78 | |
|
|
|
|
|
|
|
|
|
| |
| At 1st January 2005, as adjusted | (2,536 | ) | 76 | | 2 | | 1,930 | | (528 | ) |
| Recognised income and expense for the year | – | | – | | (3 | ) | – | | (3 | ) |
| Ordinary shares transferred by ESOP Trusts | 68 | | – | | – | | – | | 68 | |
| Write-down of shares held by ESOP Trusts | 155 | | – | | – | | – | | 155 | |
|
|
|
|
|
|
|
|
|
| |
| At 31st December 2005 | (2,313 | ) | 76 | | (1 | ) | 1,930 | | (308 | ) |
| Recognised income and expense for the year | – | | 61 | | (2 | ) | – | | 59 | |
| Ordinary shares transferred by ESOP Trusts | 151 | | – | | – | | – | | 151 | |
| Write-down of shares held by ESOP Trusts | 163 | | – | | – | | – | | 163 | |
|
|
|
|
|
|
|
|
|
| |
| At 31st December 2006 | (1,999 | ) | 137 | | (3 | ) | 1,930 | | 65 | |
|
|
|
|
|
|
|
|
|
| |
Other reserves include the merger reserve created on the merger of Glaxo Wellcome and SmithKline Beecham amounting to £1,561 million at 31st December 2006 (2005 – £1,561 million; 2004 – £1,561 million). Other reserves also include the capital redemption reserve created as a result of the share buy-back programme amounting to £81 million at 31st December 2006 (2005 – £81 million, 2004 – £81 million).
33 Related party transactions
GlaxoSmithKline held an 18.7% interest in Quest Diagnostics Inc. at 31st December 2006 (2005 – 18.4%) . The Group and Quest Diagnostics are parties to a long-term contractual relationship under which Quest Diagnostics is the primary provider of clinical laboratory testing to support the Group’s clinical trials testing requirements worldwide. During 2006, Quest Diagnostics provided services of £48 million (2005 – £39 million) to the Group. At 31st December 2006 the balance payable by GlaxoSmithKline to Quest Diagnostics was £4 million (2005 – £5 million).
In 2006, both the Group and Shionogi & Co. Ltd. entered into transactions with their 50/50 US joint venture company in support of the research and development activities conducted by that joint venture company. During 2006, GlaxoSmithKline provided services to the joint venture of £2 million (2005 – £1 million). At 31st December 2006 the balance due to GlaxoSmithKline from the joint venture was £3 million (2005 – £1 million).
Dr Shapiro, a former Non-Executive Director of GlaxoSmithKline plc, received fees of $85,000 (2005 – $85,000) of which $30,000 (2005 –$30,000) was in the form of ADSs, from a subsidiary of the company, for her membership of the Group’s Scientific Advisory Board. These fees are included within ‘Annual remuneration’ in the Remuneration Report on pages 65 to 82.
The aggregate compensation of the Directors, CET and Company Secretary is given in Note 8, ‘Employee Costs’.
| |
|
| GSK Annual Report 2006 |
| 120 |
Back to Contents
| |
| Notes to the financial statements |
| continued |
|
34 Reconciliation of profit after tax to operating cash flows
Reconciliation of profit after tax to operating cash flows
| | | | 2006 | | 2005 | | 2004 | |
| | Notes | | £m | | £m | | £m | |
|
|
|
|
|
|
|
| |
| Profit after tax | 5 | | 5,498 | | 4,816 | | 4,022 | |
| Tax on profits | | | 2,301 | | 1,916 | | 1,757 | |
| Share of after tax profits of associates and joint ventures | | | (56 | ) | (52 | ) | (60 | ) |
| Profit on disposal of interest in associates | | | – | | – | | (149 | ) |
| Finance income/costs | | | 65 | | 194 | | 186 | |
| Depreciation | | | 732 | | 710 | | 691 | |
| Impairment and assets written off | | | 208 | | 193 | | 94 | |
| Amortisation of intangible assets | | | 226 | | 194 | | 168 | |
| (Profit)/loss on sale of property, plant and equipment | | | – | | (19 | ) | 2 | |
| (Profit)/loss on sale of intangible assets | | | (158 | ) | (203 | ) | 1 | |
| Profit on sale of equity investments | | | (18 | ) | (15 | ) | (33 | ) |
| Fair value loss on inventory sold | | | – | | – | | 13 | |
| Changes in working capital: | | | | | | | | |
| (Increase)/decrease in inventories | | | (298 | ) | 47 | | (33 | ) |
| Increase in trade and other receivables | | | (529 | ) | (397 | ) | (235 | ) |
| Increase in trade and other payables | | | 354 | | 491 | | 163 | |
| Decrease in pension and other provisions | | | (270 | ) | (453 | ) | (351 | ) |
| Share-based incentive plans | | | 226 | | 236 | | 333 | |
| Other | | | (78 | ) | 7 | | (42 | ) |
|
|
|
|
|
|
|
| |
| Cash generated from operations | | | 8,203 | | 7,665 | | 6,527 | |
|
|
|
|
|
|
|
| |
35 Reconciliation of net cash flow to movement in net debt
Reconciliation of net cash flow to movement in net debt
|
|
|
|
|
| |
| Net debt at beginning of year | (1,237 | ) | (1,984 | ) | (1,648 | ) |
| Implementation of accounting for financial instruments under IAS 39 | – | | 13 | | – | |
| (Decrease)/increase in cash and bank overdrafts | (1,956 | ) | 1,384 | | 617 | |
| Cash outflow/(inflow) from liquid investments | 55 | | (550 | ) | 53 | |
| Net increase in long-term loans | – | | (912 | ) | (1,350 | ) |
| Net repayment of short-term loans | 739 | | 857 | | 407 | |
| Net repayment of obligations under finance leases | 34 | | 36 | | 22 | |
| Net non-cash funds of subsidiary undertakings acquired | – | | (68 | ) | – | |
| Exchange adjustments | (9 | ) | 39 | | 24 | |
| Other non-cash movements | (76 | ) | (52 | ) | (109 | ) |
|
|
|
|
|
| |
| Movement in net debt | (1,213 | ) | 747 | | (336 | ) |
|
|
|
|
|
| |
| Net debt at end of year | (2,450 | ) | (1,237 | ) | (1,984 | ) |
|
|
|
|
|
| |
| |
|
| GSK Annual Report 2006 |
| 121 |
Back to Contents
| |
| Notes to the financial statements |
| continued |
|
35 Reconciliation of net cash flow to movement in net debtcontinued
Analysis of changes in net debt
| | At 31.12.05 | | Exchange | | Other | | Acquisitions | | Cash flow | | At 31.12.06 | |
| | £m | | £m | | £m | | £m | | £m | | £m | |
|
|
|
|
|
|
|
|
|
|
|
| |
| Liquid investments | 1,025 | | (45 | ) | – | | – | | 55 | | 1,035 | |
|
|
|
|
|
|
|
|
|
|
|
| |
| Cash and cash equivalents | 4,209 | | (281 | ) | – | | 25 | | (1,948 | ) | 2,005 | |
| Overdrafts | (237 | ) | 27 | | – | | – | | (33 | ) | (243 | ) |
|
|
|
|
|
|
|
|
|
|
|
| |
| | 3,972 | | (254 | ) | – | | 25 | | (1,981 | ) | 1,762 | |
|
|
|
|
|
|
|
|
|
|
|
| |
| Debt due within one year: | | | | | | | | | | | | |
| Commercial paper | (576 | ) | – | | – | | – | | 576 | | – | |
| Eurobonds and Medium-Term Notes | (291 | ) | 10 | | (255 | ) | – | | 281 | | (255 | ) |
| Other | (96 | ) | (1 | ) | (11 | ) | – | | (112 | ) | (220 | ) |
|
|
|
|
|
|
|
|
|
|
|
| |
| | (963 | ) | 9 | | (266 | ) | – | | 745 | | (475 | ) |
|
|
|
|
|
|
|
|
|
|
|
| |
| Debt due after one year: | | | | | | | | | | | | |
| Eurobonds, Medium-Term Notes and private financing | (5,160 | ) | 271 | | 230 | | – | | – | | (4,659 | ) |
| Other | (111 | ) | 10 | | (40 | ) | – | | 28 | | (113 | ) |
|
|
|
|
|
|
|
|
|
|
|
| |
| | (5,271 | ) | 281 | | 190 | | – | | 28 | | (4,772 | ) |
|
|
|
|
|
|
|
|
|
|
|
| |
| Net debt | (1,237 | ) | (9 | ) | (76 | ) | 25 | | (1,153 | ) | (2,450 | ) |
|
|
|
|
|
|
|
|
|
|
|
| |
For further information on significant changes in net debt see Note 30 ‘Net debt’.
36 Acquisitions and disposals
Details of the acquisition and disposal of subsidiary and associated undertakings, joint ventures and other businesses are given below:
2006
Acquisitions
CNS, Inc.
On 19th December 2006, the Group acquired 100% of the issued share capital of CNS, Inc., a consumer healthcare company based in the USA for a cash consideration of £280 million. The company marketsBreathe Rightnasal dilator strips andFiberChoicedietary fibre supplements. These are the key intangible assets acquired and have been valued using a discounted cash flow calculation. This transaction has been accounted for by the purchase method of accounting. The goodwill arising on the acquisition reflects the potential for expansion of the brands into other overseas markets and the expected synergies for the Group. CNS Inc. had a turnover of £71 million (2005 – £60 million) and a profit of £11 million (2005 – profit £9 million) for the year of which £2 million of turnover and £nil of profit related to the period since acquisition and are included in the Group accounts.
| | Book | | Fair value | | Fair | |
| | value | | adjustment | | value | |
| | £m | | £m | | £m | |
|
|
|
|
|
| |
| Net assets acquired | | | | | | |
| Intangible assets | 4 | | 203 | | 207 | |
| Property, plant and equipment | 1 | | – | | 1 | |
| Other assets including cash and cash equivalents | 44 | | – | | 44 | |
| Deferred tax provision | – | | (77 | ) | (77 | ) |
| Other liabilities | (7 | ) | – | | (7 | ) |
|
|
|
|
|
| |
| | 42 | | 126 | | 168 | |
| Goodwill | – | | 112 | | 112 | |
|
|
|
|
|
| |
| Total consideration | 42 | | 238 | | 280 | |
|
|
|
|
|
| |
| |
|
| GSK Annual Report 2006 |
| 122 |
<Back to Contents
| |
| Notes to the financial statements |
| continued |
|
36 Acquisitions and disposalscontinued
Euclid SR Partners, LP
During 2006, an additional £5 million was invested in Euclid SR Partners, LP, an associate in which the Group has a 38.7% share.
Shionogi-GlaxoSmithKline Holdings Ltd
During 2006, an additional £8 million was invested in Shionogi GlaxoSmithKline Holdings Ltd, a joint venture in which the Group has a 50% share.
Pliva Research Institute Ltd.
In May 2006, the Group purchased the entire share capital of the Pliva Research Institute Ltd. for a cash consideration of £26 million, of this amount £8 million is deferred, with payment being made when Phase I clinical trials are initiated.
GlaxoSmithKline K.K.
In August 2006, a Japanese subsidiary of the Group made a cash payment of £150 million to complete the purchase of the remaining 15% of the share capital held by the minority shareholder. This payment was preceded in the year by a dividend to the minority shareholders of £7 million representing additional consideration.
| | | | | | Shionogi | | Pliva | | | | | | | |
| | | | Euclid SR | | GlaxoSmithKline | | Research | | GlaxoSmith- | | | | | |
| | CNS Inc. | | Partners, LP | | Holdings Ltd. | | Institute | | Kline K.K. | | Other | | Total | |
| Cash flows | £m | | £m | | £m | | £m | | £m | | £m | | £m | |
|
|
|
|
|
|
|
|
|
|
|
|
|
| |
| Cash consideration | 280 | | 5 | | 8 | | 18 | | 157 | | – | | 468 | |
| Cash and cash equivalents acquired | (24 | ) | – | | – | | (1 | ) | – | | – | | (25 | ) |
|
|
|
|
|
|
|
|
|
|
|
|
|
| |
| Net cash payment on acquisitions | 256 | | 5 | | 8 | | 17 | | 157 | | – | | 443 | |
|
|
|
|
|
|
|
|
|
|
|
|
|
| |
| Net cash proceeds from disposals | – | | – | | – | | – | | – | | (5 | ) | (5 | ) |
|
|
|
|
|
|
|
|
|
|
|
|
|
| |
2005
Acquisitions
ID Biomedical Corporation
On 8th December 2005, the Group acquired 100% of the issued share capital of ID Biomedical Corporation, a biotechnology company based in Canada specialising in the development and manufacture of vaccines, particularly influenza vaccines, for a cash consideration of £874 million. This transaction has been accounted for by the purchase method of accounting. The goodwill arising on the acquisition results from benefits which cannot be separately quantified and recorded, including immediate access to additional ‘flu vaccines manufacturing capacity, particularly in the event of a pandemic, a skilled workforce and good relations with the US and Canadian governments regarding the supply of ‘flu vaccines. ID Biomedical Corporation had a turnover of £30 million (2004 – £23 million) and a loss of £83 million (2004 – loss £17 million) for the year, of which £1 million of turnover and £11 million of loss related to the period since acquisition and are included in the Group accounts.
| | Book | | Fair value | | Fair | |
| | value | | adjustment | | value | |
| | £m | | £m | | £m | |
|
|
|
|
|
| |
| Net assets acquired | | | | | | |
| Intangible assets | 15 | | 686 | | 701 | |
| Property, plant and equipment | 88 | | – | | 88 | |
| Other assets | 74 | | 23 | | 97 | |
| Deferred tax provision | – | | (225 | ) | (225 | ) |
| Other liabilities | (136 | ) | (8 | ) | (144 | ) |
|
|
|
|
|
| |
| | 41 | | 476 | | 517 | |
| Goodwill | – | | 357 | | 357 | |
|
|
|
|
|
| |
| Total consideration | 41 | | 833 | | 874 | |
|
|
|
|
|
| |
The total consideration included directly attributable costs of £3 million.
| |
|
| GSK Annual Report 2006 |
| 123 |
<Back to Contents
| |
| Notes to the financial statements |
| continued |
|
36 Acquisitions and disposalscontinued
Corixa Corporation
On 12th July 2005, the Group acquired 92% of the issued share capital of Corixa Corporation, a biotechnology company specialising in developing vaccine adjuvants and immunology based products, for a cash consideration of £150 million. This investment increased the Group’s holding in Corixa to 100%. The Group had a number of business relationships with Corixa prior to the acquisition date, principally in relation to an adjuvant developed by Corixa and used in some of the Group’s vaccines. This transaction has been accounted for by the purchase method of accounting. The existing 8% investment in Corixa, with a book value of £12 million, was previously classified as an available-for-sale investment and now forms part of the investment in the subsidiary. The existing 8% of the issued share capital had been acquired, in previous years, for a cash consideration of £24 million. Corixa Corporation had a turnover of £3 million and a loss of £49 million for the year, of which £1 million of turnover and £24 million of loss related to the period since acquisition and are included in the Group accounts.
| | Book | | Fair value | | Fair | |
| | value | | adjustment | | value | |
| | £m | | £m | | £m | |
|
|
|
|
|
| |
| Net assets acquired | | | | | | |
| Intangible assets | – | | 115 | | 115 | |
| Other assets | 91 | | 29 | | 120 | |
| Other liabilities | (95 | ) | (4 | ) | (99 | ) |
|
|
|
|
|
| |
| | (4 | ) | 140 | | 136 | |
| Goodwill | – | | 26 | | 26 | |
| Existing investment | (12 | ) | – | | (12 | ) |
|
|
|
|
|
| |
| Total consideration | (16 | ) | 166 | | 150 | |
|
|
|
|
|
| |
The total consideration included directly attributable costs of £1 million.
Euclid SR Partners, LP
During 2005 an additional £2 million was invested in Euclid SR Partners, LP, an associate in which the Group has a 38.7% interest.
GlaxoSmithKline Consumer Healthcare Limited
In April 2005, an Indian subsidiary of the Group purchased 3.16% of the share capital held by minority shareholders, for a cash consideration of £16 million.
GlaxoSmithKline Pharmaceuticals Limited
In May and June 2005, an Indian subsidiary of the Group purchased 1.52% of the share capital held by minority shareholders, for a cash consideration of £26 million.
GlaxoSmithKline Biologicals (Shanghai) Limited
During 2005, a Chinese subsidiary of the Group purchased all of the share capital held by minority shareholders for a cash consideration of £4 million.
Disposals
Ideapharm SA
In December 2005, the Group disposed of Ideapharm SA, a subsidiary located in Romania, for cash proceeds of £3 million, which were received in January 2006. The net assets disposed of in the year included cash of £2 million.
Aseptic Technologies S.A.
In April 2005, the Group disposed of 16.22% of Aseptic Technologies S.A. to Societe Regionale d’Investissement de Wallonie S.A. for cash proceeds of £10 million.
| | GSK | | | | GSK | | GSK | | | | | | | | | | | |
| | Biologicals | | Aseptic | | Pharma- | | Consumer | | | | Euclid | | | | ID | | | |
| | (Shanghai) | | Tech. | | ceuticals | | Healthcare | | Ideapharm | | SR | | Corixa | | Biomedical | | | |
| Cash flows | £m | | £m | | £m | | £m | | £m | | £m | | £m | | £m | | Total | |
|
|
|
|
|
|
|
|
|
|
|
|
|
|
|
|
|
| |
| Cash consideration | 4 | | – | | 26 | | 16 | | – | | 2 | | 150 | | 874 | | 1,072 | |
| Cash and cash equivalents acquired | – | | – | | – | | – | | – | | – | | (7 | ) | 9 | | 2 | |
|
|
|
|
|
|
|
|
|
|
|
|
|
|
|
|
|
| |
| Net cash payment on acquisitions | 4 | | – | | 26 | | 16 | | – | | 2 | | 143 | | 883 | | 1,074 | |
|
|
|
|
|
|
|
|
|
|
|
|
|
|
|
|
|
| |
| Cash and cash equivalents disposed | – | | – | | – | | – | | 2 | | – | | – | | – | | 2 | |
|
|
|
|
|
|
|
|
|
|
|
|
|
|
|
|
|
| |
| Net cash proceeds from disposals | – | | 10 | | – | | – | | – | | – | | – | | – | | 10 | |
|
|
|
|
|
|
|
|
|
|
|
|
|
|
|
|
|
| |
| |
|
| GSK Annual Report 2006 |
| 124 |
<Back to Contents
| |
| Notes to the financial statements |
| continued |
|
36 Acquisitions and disposalscontinued
2004
Acquisitions
Fraxiparine, Fraxodi and Arixtra
In September 2004, the Group acquiredFraxiparine, FraxodiandArixtra andrelated assets including a manufacturing facility for a cash consideration of £297 million.
| | Book | | Fair value | | Net assets | |
| | value | | adjustment | | acquired | |
| | £m | | £m | | £m | |
|
|
|
|
|
| |
| Intangible assets | – | | 262 | | 262 | |
| Tangible fixed assets | 56 | | (24 | ) | 32 | |
| Inventory | 79 | | – | | 79 | |
| Provisions for onerous contracts | – | | (76 | ) | (76 | ) |
|
|
|
|
|
| |
| | 135 | | 162 | | 297 | |
|
|
|
|
|
| |
Euclid SR Partners, LP
During 2004 an additional £2 million was invested in Euclid SR Partners, LP, an associate company in which the Group has a 38.7% interest.
Disposals
Quest Diagnostics Inc.
During 2004, the Group disposed of 3.8 million shares from its investment in Quest Diagnostics Inc. for cash proceeds of £188 million, reducing the Group’s shareholding at 31st December 2004 to 18.6% . A profit of £150 million was recognised.
GlaxoSmithKline Vehicle Finance Ltd
During 2004, the Group disposed of its employee vehicle financing subsidiary resulting in a loss of £3 million.
GlaxoSmithKline Pharmaceuticals (Chongqing) Ltd
During 2004, the Group disposed of GlaxoSmithKline Pharmaceuticals (Chongqing) Ltd, a Group subsidiary located in China, for £7 million. A profit on disposal of £2 million was realised.
Beeyar Investments (Pty) Ltd
In July 2004, the Group disposed of Beeyar Investments (Pty) Ltd, a subsidiary located in South Africa, for cash proceeds of £1 million, realising a profit of £1 million.
OptiLead S.r.l.
During the year, part of the Group’s holding in an associated undertaking, OptiLead S.r.l. was sold, resulting in a loss of £1 million.
| | Fraxiparine | | | | | | GSK | | GSK | | | | | |
| | Fraxodi | | | | Quest | | Vehicle | | Pharmaceuticals | | Beeyar | | | |
| | andArixtra | | Euclid SR | | Diagnostics | | Finance | | (Chongqing) | | Investments | | Total | |
| Cash flows | £m | | £m | | £m | | £m | | £m | | £m | | £m | |
|
|
|
|
|
|
|
|
|
|
|
|
|
| |
| Cash consideration paid | 297 | | 2 | | – | | – | | – | | – | | 299 | |
|
|
|
|
|
|
|
|
|
|
|
|
|
| |
| Net cash proceeds from disposals | – | | – | | 188 | | 34 | | 7 | | 1 | | 230 | |
|
|
|
|
|
|
|
|
|
|
|
|
|
| |
| |
|
| GSK Annual Report 2006 |
| 125 |
Back to Contents
| |
| Notes to the financial statements |
| continued |
|
37 Commitments
| Contractual obligations and commitments | 2006 | | 2005 | |
| £m | £m |
|
|
|
| |
| Contracted for but not provided in the financial statements: | | | | |
| Intangible assets | 3,219 | | 1,833 | |
| Plant, property and equipment | 521 | | 376 | |
| Investments | 196 | | 13 | |
| Purchase commitments | 299 | | 376 | |
| Business combinations | 258 | | – | |
| Pensions | 975 | | 2,200 | |
| Theravance put option agreement | 258 | | 258 | |
| Other commitments | 65 | | 64 | |
| Interest on loans | 2,875 | | 3,067 | |
|
|
|
| |
| | 8,666 | | 8,187 | |
|
|
|
| |
The commitments related to intangible assets include milestone payments, which are dependent on successful clinical development and which represent the maximum that would be paid if all milestones are achieved. A number of commitments were made in 2006 under licensing and other agreements, including ChemoCentryx Inc., EPIX Pharmaceuticals Inc. and Genmab A/S. At 31st December 2006, the Genmab agreement was subject to review by the US Government under the Hart-Scott-Rodino Act. Approval was received on 6th February 2007.
On 8th December 2006, GSK entered into an agreement to acquire Domantis Limited for £230 million in cash. At 31st December 2006, the acquisition agreement was subject to clearance under the Hart-Scott-Rodino Act. Approval was received on 5th January 2007. On 21st December 2006, GSK entered into an agreement to acquire all the outstanding shares of Praecis Pharmaceuticals Inc. for approximately $54.8 million (£28 million) by means of a cash tender offer in early 2007.
In 2006, GSK formalised an agreement with the trustees of the UK pension schemes to make additional contributions of up to £325 million per year, in addition to the normal contributions, over a four-year period ending 31st December 2009 in order to eliminate the then pension deficits on an IAS 19 basis, by that point. The table above shows this commitment, but excludes the normal ongoing annual funding requirement of approximately £200 million. GSK has also committed to eliminate any future deficits that may arise over a rolling five-year period. No other commitments have been made past 31st December 2009.
The Group has entered into a put option agreement whereby Theravance’s shareholders can sell up to half of their Theravance shares to GSK at a pre-determined price ($19.375) . Given the maximum number of shares subject to the put option, the Group’s obligation is capped at $525 million. The expiry date is August 2007.
The Group also has other commitments which principally relate to revenue payments to be made under licences and other alliances.
Commitments in respect of future interest payable on loans are disclosed after taking into account the effect of interest rate swaps.
| Commitments under operating leases | 2006 | | 2005 | |
| £m | £m |
|
|
|
| |
| Rental payments due within one year | 94 | | 111 | |
| Rental payments due between one and two years | 74 | | 78 | |
| Rental payments due between two and three years | 55 | | 60 | |
| Rental payments due between three and four years | 41 | | 45 | |
| Rental payments due between four and five years | 33 | | 40 | |
| Rental payments due after five years | 77 | | 103 | |
|
|
|
| |
| Total commitments under operating lease | 374 | | 437 | |
|
|
|
| |
38 Post balance sheet events
On 5th January 2007, GSK completed the acquisition of Domantis Limited for £230 million in cash.
On 7th February 2007, the FDA approved orlistat for OTC use in the USA under the brand namealli.
On 15th February 2007, GSK entered into a second hedging contract over an additional 10 million shares in Quest Diagnostics Inc. through another series of variable sale forward contracts maturing between 2013 and 2015.
On 16th February 2007, GSK completed the cash tender offer for Praecis Pharmaceuticals Inc.
On 20th February 2007, GSK and the Roche Group settled their arbitration proceedings relating to the licensing and co-marketing of carvedilol and GSK acquired from Roche the OTC marketing rights to orlistat outside the USA.
| |
|
| GSK Annual Report 2006 |
| 126 |
Back to Contents
| |
| Notes to the financial statements |
| continued |
|
| |
39 Financial instruments and related disclosures
Financial risk management
GlaxoSmithKline plc reports in Sterling and pays dividends out of Sterling profits. The role of Corporate Treasury in GSK is to manage and monitor the Group’s external and internal funding requirements and financial risks in support of Group corporate objectives. Treasury activities are governed by policies and procedures approved by the Board and monitored by a treasury management group.
GSK maintains treasury control systems and procedures to monitor foreign exchange, interest rate, liquidity, credit and other financial risks.
GSK uses a variety of financial instruments, including derivatives, to finance its operation and to manage market risks from these operations. Financial instruments include cash and liquid resources, borrowings and spot foreign exchange contracts.
A number of derivative financial instruments are used to manage the market risks from Treasury operations. Derivative instruments, principally comprising forward foreign currency contracts and interest rate and currency swaps, are used to swap borrowings and liquid assets into the currencies required for Group purposes and to manage exposure to funding risks from changes in foreign exchange rates and interest rates.
GSK balances the use of borrowings and liquid assets having regard to the cash flow from operating activities and the currencies in which it is earned; the tax cost of intra-Group distributions; the currencies in which business assets are denominated; and the post-tax cost of borrowings compared to the post-tax return on liquid assets.
Liquid assets surplus to the immediate operating requirements of Group companies are generally invested and managed centrally by Corporate Treasury. Requirements of Group companies for operating finance are met whenever possible from central resources.
External borrowings, mainly managed centrally by Corporate Treasury, comprise a portfolio of long and medium-term instruments and short-term finance.
GSK does not hold or issue derivative financial instruments for trading purposes and the Group’s Treasury policies specifically prohibit such activity. All transactions in financial instruments are undertaken to manage the risks arising from underlying business activities, not for speculation.
Foreign exchange risk management
In GSK foreign currency transaction exposure arising on normal trade flows, in respect of both external and intra-Group trade, is not hedged. GSK’s policy is to minimise the exposure of overseas operating subsidiaries to transaction risk by matching local currency income with local currency costs. For this purpose, intra-Group trading transactions are matched centrally and intra-Group payment terms are managed to reduce risk. Exceptional foreign currency cash flows are hedged selectively under the management of Corporate Treasury.
The Group seeks to denominate borrowings in the currencies of its principal assets and cash flows. These are primarily denominated in US Dollars, Euros and Sterling. Certain of these and other borrowings are swapped into other currencies as required for Group purposes.
Borrowings denominated in, or swapped into, foreign currencies that match investments in overseas Group assets are treated as a hedge against the relevant net assets.
At 31st December 2006, the Group had outstanding contracts to sell or purchase foreign currency having a total gross notional principal amount of £14,687 million (2005 – £15,974 million). The majority of contracts are for periods of 12 months or less.
Based on the composition of net debt at 31st December 2006, a 10% appreciation in Sterling against major currencies would result in a reduction in the Group’s net debt of approximately £210 million. A 10% weakening in Sterling against major currencies would result in an increase in the Group’s net debt of approximately £256 million.
Interest rate risk management
GSK’s policy on interest rate risk management requires that the amount of net borrowings at fixed rates increases with the ratio of forecast net interest payable to trading profit.
The Group uses a limited number of interest rate swaps to redenominate external borrowings into the interest rate coupon required for Group purposes. The duration of these swaps matches the duration of the principal instruments. Interest rate derivative instruments are accounted for as fair value or cash flow hedges of the relevant assets or liabilities.
The Group manages centrally the short-term cash surpluses or borrowing requirements of subsidiary companies and uses forward contracts to hedge future repayments back into originating currency.
Sensitivity analysis considers the sensitivity of the Group’s net debt to hypothetical changes in market rates and assumes that all other variables remain constant. Based on the composition of net debt and financing arrangements at 31st December 2006, and taking into consideration all fixed rate borrowings in place, a one percentage point (100 basis points) decrease in average interest rates would result in an increase in the Group’s annual net interest charge of approximately £5 million.
Market risk of financial assets
The Group invests centrally managed liquid assets in government bonds, short-term corporate debt instruments with a minimum short-term credit rating of A-1/P-1, money market funds with a credit rating of AAA/Aaa and other structured investments (credit ratings shown are from Standard and Poor’s and Moody’s Investors’ Services, respectively). These investments are classified as available-for-sale.
Equity investments are classified as available-for-sale investments and the Group manages disposals to meet overall business requirements as they arise. The Group regularly monitors the value of its equity investments and only enters into hedges selectively with the approval of the Board.
Credit risk
In the USA, in line with other pharmaceutical companies, the Group sells its products through a small number of wholesalers in addition to hospitals, pharmacies, physicians and other groups. Sales to the three largest wholesalers amounted to approximately 80% of the Group’s US pharmaceutical sales. At 31st December 2006, the Group had trade receivables due from these three wholesalers totalling £1,044 million (31st December 2005 – £1,051 million).
| |
|
| GSK Annual Report 2006 |
| 127 |
<Back to Contents
| |
| Notes to the financial statements |
| continued |
|
| |
39 Financial instruments and related disclosurescontinued
The Group is exposed to a concentration of credit risk in respect of these wholesalers such that, if one or more of them is affected by financial difficulty, it could materially and adversely affect the Group’s financial results.
The Group does not believe it is exposed to major concentrations of credit risk on other classes of financial instruments. The Group is exposed to credit-related losses in the event of non-performance by counterparties to financial instruments, but does not expect any counterparties to fail to meet their obligations. Where the Group has significant investments with a single counterparty, collateral is obtained in order to reduce risk.
The Group applies Board-approved limits to the amount of credit exposure to any one counterparty and employs strict minimum credit worthiness criteria as to the choice of counterparty.
Liquidity
The Group operates globally, primarily through subsidiary companies established in the markets in which the Group trades. Due to the nature of the Group’s business with patent protection on many products in the Group’s portfolio, the Group’s products compete largely on product efficacy rather than on price. Selling margins are sufficient to exceed normal operating costs and the Group’s operating subsidiaries are substantially cash generative.
Operating cash flow is used to fund investment in the research and development of new products as well as routine outflows of capital expenditure, tax, dividends and repayment of maturing debt. The Group may, from time to time, have additional demands for finance, such as for share purchases and business acquisitions.
GSK operates with a high level of interest cover and at low levels of net debt relative to its market capitalisation. In addition to the strong positive cash flow from normal trading activities, additional liquidity is readily available via its commercial paper programme and short-term investments. The Group also has a European Medium Term Note programme of £10 billion, of which £3.5 billion was in issue at 31st December 2006. In March 2004, the Group established a US Shelf Registration of $5 billion; at 31st December 2006 $2.4 billion (£1.2 billion) was in issue.
Fair value of financial assets and liabilities
The table on page 129 presents the carrying amounts under IFRS and the fair values of the Group’s financial assets and liabilities at 31st December 2006 and 31st December 2005.
The fair values of the financial assets and liabilities are included at the amount at which the instrument could be exchanged in a current transaction between willing parties, other than in a forced or liquidation sale. The following methods and assumptions were used to estimate the fair values:
| • | Equity investments – investments traded in an active market, determined by reference to the relevant stock exchange quoted bid price; other investments determined by reference to the current market value of similar instruments or by reference to the discounted cash flows of the underlying net assets |
| • | Cash and cash equivalents – approximates to the carrying amount |
| | |
| • | Liquid investments – based on quoted market prices in the case of marketable securities; based on principal amounts in the case of non-marketable securities because of their short repricing periods |
| | |
| • | Short-term loans and overdrafts – approximates to the carrying amount because of the short maturity of these instruments |
| | |
| • | Long-term loans – based on quoted market prices in the case of the Eurobonds and other fixed rate borrowings; approximates to the carrying amount in the case of floating rate bank loans and other loans |
| | |
| • | Forward exchange contracts – based on market prices and exchange rates at the balance sheet date |
| | |
| • | Currency swaps – based on market valuations at the balance sheet date |
| | |
| • | Quest equity collar and Theravance put and call options – based on an option pricing model which uses significant assumptions in respect of price volatility, dividend yield and interest rates |
| | |
| • | Interest rate instruments – based on the net present value of discounted cash flows |
| | |
| • | Receivables and payables – approximates to the carrying amount |
| | |
| • | Lease obligations – approximates to the carrying amount. |
In the year ended 31st December 2006, the total amount of the change in fair values estimated using valuation techniques referred to above resulted in a credit to the income statement of £5 million (2005 – £1 million).
Fair value of investments in GSK shares
At 31st December 2006 the ESOP Trusts held GSK ordinary shares with a carrying value of £1,999 million (2005 – £2,313 million) with a fair value of £2,062 million (2005 – £2,460 million) based on quoted market price. The shares represent purchases by the ESOP Trusts to satisfy future exercises of options and awards under employee incentive schemes. The carrying value, which is the lower of cost or expected proceeds, of these shares has been recognised as a deduction from other reserves. At 31st December 2006, GSK held Treasury shares at a cost of £3,147 million (2005 – £1,799 million) which has been deducted from retained earnings.
Committed facilities
The Group has committed facilities to back up the commercial paper programme of $900 million (£459 million) (2005 – $900 million (£523 million)) of 364 days duration, renewable annually. At 31st December 2006, undrawn committed facilities totalled $900 million (£459 million) (2005 – $900 million (£523 million)).
| |
|
| GSK Annual Report 2006 |
| 128 |
<Back to Contents
| |
| Notes to the financial statements |
| continued |
|
39 Financial instruments and related disclosurescontinued
Classification and fair values of financial assets and liabilities
The following table sets out the classification of financial assets and liabilities. Receivables and payables have been included to the extent they are classified as financial assets and liabilities in accordance with IAS 32. Where appropriate, currency and interest rate swaps have been presented alongside the underlying principal instrument. The carrying amounts of these instruments have been adjusted for the effect of the currency and interest rate swaps acting as hedges.
| | | | 2006 | | | | 2005 | |
| |
|
|
| |
|
|
| |
| At 31st December | Carrying | | Fair | | Carrying | | Fair | |
| value | value | value | value |
| £m | £m | £m | £m |
|
|
|
|
|
|
|
| |
| Liquid investments | 1,035 | | 1,035 | | 1,025 | | 1,025 | |
| Cash and cash equivalents | 2,005 | | 2,005 | | 4,209 | | 4,209 | |
|
|
|
|
|
|
|
| |
| Current asset financial instruments | 3,040 | | 3,040 | | 5,234 | | 5,234 | |
|
|
|
|
|
|
|
| |
| £ notes and bonds | (977 | ) | (1,043 | ) | (976 | ) | (1,097 | ) |
|
|
|
|
|
|
|
| |
| US$ notes, bonds and private financing | (1,435 | ) | (1,446 | ) | (1,929 | ) | (1,932 | ) |
| Notes and bonds swapped into US$ | (494 | ) | (493 | ) | (502 | ) | (501 | ) |
| Currency swaps | 101 | | 101 | | 54 | | 54 | |
| Interest rate swaps | (46 | ) | (46 | ) | (47 | ) | (47 | ) |
|
|
|
|
|
|
|
| |
| | (1,874 | ) | (1,884 | ) | (2,424 | ) | (2,426 | ) |
|
|
|
|
|
|
|
| |
| Notes swapped into Yen | (338 | ) | (335 | ) | (342 | ) | (348 | ) |
| Currency swaps | 44 | | 44 | | 10 | | 10 | |
|
|
|
|
|
|
|
| |
| | (294 | ) | (291 | ) | (332 | ) | (338 | ) |
|
|
|
|
|
|
|
| |
| €notes | (1,671 | ) | (1,620 | ) | (1,702 | ) | (1,705 | ) |
| Interest rate swap | 6 | | 6 | | 5 | | 5 | |
|
|
|
|
|
|
|
| |
| | (1,665 | ) | (1,614 | ) | (1,697 | ) | (1,700 | ) |
|
|
|
|
|
|
|
| |
| Other short-term borrowings | (463 | ) | (463 | ) | (909 | ) | (909 | ) |
| Other long-term borrowings | (112 | ) | (112 | ) | (111 | ) | (111 | ) |
|
|
|
|
|
|
|
| |
| Total borrowings and related swaps | (5,385 | ) | (5,407 | ) | (6,449 | ) | (6,581 | ) |
|
|
|
|
|
|
|
| |
| Equity investments | 441 | | 441 | | 362 | | 362 | |
| Receivables | 4,773 | | 4,773 | | 4,934 | | 4,934 | |
| Payables | (4,581 | ) | (4,581 | ) | (4,754 | ) | (4,754 | ) |
| Other derivatives – assets | 37 | | 37 | | 126 | | 126 | |
| Other derivatives – liabilities | (49 | ) | (49 | ) | (150 | ) | (150 | ) |
| Other financial assets | 263 | | 263 | | 271 | | 271 | |
| Other financial liabilities | (232 | ) | (232 | ) | (391 | ) | (391 | ) |
|
|
|
|
|
|
|
| |
| Total financial assets and liabilities | (1,693 | ) | (1,715 | ) | (817 | ) | (949 | ) |
|
|
|
|
|
|
|
| |
| Total financial assets | 8,710 | | 8,710 | | 10,996 | | 10,996 | |
|
|
|
|
|
|
|
| |
| Total financial liabilities | (10,403 | ) | (10,425 | ) | (11,813 | ) | (11,945 | ) |
|
|
|
|
|
|
|
| |
| Reconciliation to net debt | | | | | | | | |
|
|
|
|
|
|
|
| |
| Liquid investments | 1,035 | | 1,035 | | 1,025 | | 1,025 | |
| Cash and cash equivalents | 2,005 | | 2,005 | | 4,209 | | 4,209 | |
| Total borrowings | (5,385 | ) | (5,407 | ) | (6,449 | ) | (6,581 | ) |
|
|
|
|
|
|
|
| |
| | (2,345 | ) | (2,367 | ) | (1,215 | ) | (1,347 | ) |
| Less net effect of interest rate and currency swaps | (105 | ) | (105 | ) | (22 | ) | (22 | ) |
|
|
|
|
|
|
|
| |
| Net debt | (2,450 | ) | (2,472 | ) | (1,237 | ) | (1,369 | ) |
|
|
|
|
|
|
|
| |
| |
|
| GSK Annual Report 2006 |
| 129 |
<Back to Contents
| |
| Notes to the financial statements |
| continued |
|
39 Financial instruments and related disclosurescontinued
Interest rate profiles of financial assets and liabilities
The following tables set out the exposure of financial assets and liabilities to either fixed interest rates, floating interest rates or no interest rates. The maturity profile of financial assets and liabilities exposed to interest rate risk in the tables below indicates the contractual repricing and maturity dates of these instruments.
| | | | | | Cash and | | | | Other | | | |
| | | | Liquid | | cash | | | | financial | | | |
| At 31st December 2006 | Investments | | investments | | equivalents | | Receivables | | assets | | Total | |
| Financial assets | £m | | £m | | £m | | £m | | £m | | £m | |
|
|
|
|
|
|
|
|
|
|
|
| |
| Less than one year | – | | 1,035 | | 1,952 | | 211 | | 1 | | 3,199 | |
| Between one and two years | – | | – | | – | | 3 | | – | | 3 | |
| Between two and three years | – | | – | | – | | 1 | | – | | 1 | |
| Between three and four years | – | | – | | – | | – | | – | | – | |
| Between four and five years | – | | – | | – | | – | | – | | – | |
| Greater than five years | – | | – | | – | | – | | 104 | | 104 | |
|
|
|
|
|
|
|
|
|
|
|
| |
| Total interest earning | – | | 1,035 | | 1,952 | | 215 | | 105 | | 3,307 | |
|
|
|
|
|
|
|
|
|
|
|
| |
| Analysed as: | | | | | | | | | | | | |
| Fixed rate interest | – | | 285 | | 12 | | 207 | | 104 | | 608 | |
| Floating rate interest | – | | 750 | | 1,940 | | 8 | | 1 | | 2,699 | |
|
|
|
|
|
|
|
|
|
|
|
| |
| Total interest earning | – | | 1,035 | | 1,952 | | 215 | | 105 | | 3,307 | |
| Non-interest earning | 441 | | – | | 53 | | 4,558 | | 351 | | 5,403 | |
|
|
|
|
|
|
|
|
|
|
|
| |
| Total | 441 | | 1,035 | | 2,005 | | 4,773 | | 456 | | 8,710 | |
|
|
|
|
|
|
|
|
|
|
|
| |
| | | | | | | | | | | | | |
| | | | | | | | | | | | | |
| | | | | | Cash and | | | | Other | | | |
| | | | Liquid | | cash | | | | financial | | | |
| At 31st December 2005 | Investments | | investments | | equivalents | | Receivables | | assets | | Total | |
| Financial assets | £m | | £m | | £m | | £m | | £m | | £m | |
|
|
|
|
|
|
|
|
|
|
|
| |
| Less than one year | – | | 1,025 | | 4,188 | | 204 | | 94 | | 5,511 | |
| Between one and two years | – | | – | | – | | 8 | | – | | 8 | |
| Between two and three years | – | | – | | – | | 13 | | – | | 13 | |
| Between three and four years | – | | – | | – | | 12 | | – | | 12 | |
| Between four and five years | – | | – | | – | | – | | – | | – | |
| Greater than five years | – | | – | | – | | – | | 117 | | 117 | |
|
|
|
|
|
|
|
|
|
|
|
| |
| Total interest earning | – | | 1,025 | | 4,188 | | 237 | | 211 | | 5,661 | |
|
|
|
|
|
|
|
|
|
|
|
| |
| Analysed as: | | | | | | | | | | | | |
| Fixed rate interest | – | | 292 | | – | | 207 | | 117 | | 616 | |
| Floating rate interest | – | | 733 | | 4,188 | | 30 | | 94 | | 5,045 | |
|
|
|
|
|
|
|
|
|
|
|
| |
| Total interest earning | – | | 1,025 | | 4,188 | | 237 | | 211 | | 5,661 | |
| Non-interest earning | 362 | | – | | 21 | | 4,697 | | 255 | | 5,335 | |
|
|
|
|
|
|
|
|
|
|
|
| |
| Total | 362 | | 1,025 | | 4,209 | | 4,934 | | 466 | | 10,996 | |
|
|
|
|
|
|
|
|
|
|
|
| |
| |
|
| GSK Annual Report 2006 |
| 130 |
<Back to Contents
| |
| Notes to the financial statements |
| continued |
|
39 Financial instruments and related disclosurescontinued
| | | | Effect of | | Obligations | | | | Other | | | |
| | | | interest rate | | under finance | | | | financial | | | |
| At 31st December 2006 | Debt | | swaps | | leases | | Payables | | liabilities | | Total | |
| Financial liabilities | £m | | £m | | £m | | £m | | £m | | £m | |
|
|
|
|
|
|
|
|
|
|
|
| |
| Less than one year | (895 | ) | (1,883 | ) | (106 | ) | (14 | ) | – | | (2,898 | ) |
| Between one and two years | (1,166 | ) | 1,164 | | (10 | ) | – | | – | | (12 | ) |
| Between two and three years | (339 | ) | – | | (7 | ) | – | | – | | (346 | ) |
| Between three and four years | (1 | ) | – | | (8 | ) | – | | – | | (9 | ) |
| Between four and five years | – | | – | | (6 | ) | – | | – | | (6 | ) |
| Greater than five years | (2,948 | ) | 719 | | (2 | ) | – | | – | | (2,231 | ) |
|
|
|
|
|
|
|
|
|
|
|
| |
| Total interest bearing | (5,349 | ) | – | | (139 | ) | (14 | ) | – | | (5,502 | ) |
|
|
|
|
|
|
|
|
|
|
|
| |
| Analysed as: | | | | | | | | | | | | |
| Fixed rate interest | (4,721 | ) | 2,138 | | (46 | ) | (6 | ) | – | | (2,635 | ) |
| Floating rate interest | (628 | ) | (2,138 | ) | (93 | ) | (8 | ) | – | | (2,867 | ) |
|
|
|
|
|
|
|
|
|
|
|
| |
| Total interest bearing | (5,349 | ) | – | | (139 | ) | (14 | ) | – | | (5,502 | ) |
| Non-interest bearing | (2 | ) | – | | – | | (4,567 | ) | (332 | ) | (4,901 | ) |
|
|
|
|
|
|
|
|
|
|
|
| |
| Total | (5,351 | ) | – | | (139 | ) | (4,581 | ) | (332 | ) | (10,403 | ) |
|
|
|
|
|
|
|
|
|
|
|
| |
| | | | | | | | | | | | | |
| | | | | | | | | | | | | |
| | | | Effect of | | Obligations | | | | Other | | | |
| | | | interest rate | | under finance | | | | financial | | | |
| At 31st December 2005 | Debt | | swaps | | leases | | Payables | | liabilities | | Total | |
| Financial liabilities | £m | | £m | | £m | | £m | �� | £m | | £m | |
|
|
|
|
|
|
|
|
|
|
|
| |
| Less than one year | (1,176 | ) | (2,348 | ) | (103 | ) | (148 | ) | (61 | ) | (3,836 | ) |
| Between one and two years | (287 | ) | 291 | | (3 | ) | – | | (23 | ) | (22 | ) |
| Between two and three years | (1,190 | ) | 1,185 | | (3 | ) | – | | – | | (8 | ) |
| Between three and four years | (343 | ) | – | | (2 | ) | – | | – | | (345 | ) |
| Between four and five years | – | | – | | (2 | ) | – | | – | | (2 | ) |
| Greater than five years | (3,354 | ) | 872 | | (8 | ) | – | | – | | (2,490 | ) |
|
|
|
|
|
|
|
|
|
|
|
| |
| Total interest bearing | (6,350 | ) | – | | (121 | ) | (148 | ) | (84 | ) | (6,703 | ) |
|
|
|
|
|
|
|
|
|
|
|
| |
| Analysed as: | | | | | | | | | | | | |
| Fixed rate interest | (5,527 | ) | 2,348 | | (21 | ) | – | | (24 | ) | (3,224 | ) |
| Floating rate interest | (823 | ) | (2,348 | ) | (100 | ) | (148 | ) | (60 | ) | (3,479 | ) |
|
|
|
|
|
|
|
|
|
|
|
| |
| Total interest bearing | (6,350 | ) | – | | (121 | ) | (148 | ) | (84 | ) | (6,703 | ) |
| Non-interest bearing | – | | – | | – | | (4,606 | ) | (504 | ) | (5,110 | ) |
|
|
|
|
|
|
|
|
|
|
|
| |
| Total | (6,350 | ) | – | | (121 | ) | (4,754 | ) | (588 | ) | (11,813 | ) |
|
|
|
|
|
|
|
|
|
|
|
| |
Maturity analysis of interest earning financial assets
The maturity analysis of interest earning financial assets is equivalent to the maturity analysis presented in the interest rate profile table above.
Maturity analysis of interest bearing financial liabilities
| | | | Finance | | | | | |
| At 31st December 2006 | Debt | | leases | | Payables | | Total | |
| Financial liabilities | £m | | £m | | £m | | £m | |
|
|
|
|
|
|
|
| |
| Within one year or on demand | (676 | ) | (42 | ) | (14 | ) | (732 | ) |
| Between one and two years | (1,166 | ) | (36 | ) | – | | (1,202 | ) |
| Between two and three years | (339 | ) | (27 | ) | – | | (366 | ) |
| Between three and four years | (11 | ) | (15 | ) | – | | (26 | ) |
| Between four and five years | – | | (7 | ) | – | | (7 | ) |
| After five years | (3,157 | ) | (12 | ) | – | | (3,169 | ) |
|
|
|
|
|
|
|
| |
| | (5,349 | ) | (139 | ) | (14 | ) | (5,502 | ) |
|
|
|
|
|
|
|
| |
| |
|
| GSK Annual Report 2006 |
| 131 |
<Back to Contents
| |
| Notes to the financial statements |
| continued |
|
39 Financial instruments and related disclosurescontinued
| | | | | | | | Other | | | |
| | | | Finance | | | | financial | | | |
| At 31st December 2005 | Debt | | leases | | Payables | | liabilities | | Total | |
| Financial liabilities | £m | | £m | | £m | | £m | | £m | |
|
|
|
|
|
|
|
|
|
| |
| Within one year or on demand | (1,162 | ) | (38 | ) | (148 | ) | (61 | ) | (1,409 | ) |
| Between one and two years | (287 | ) | (30 | ) | – | | (23 | ) | (340 | ) |
| Between two and three years | (1,203 | ) | (21 | ) | – | | – | | (1,224 | ) |
| Between three and four years | (343 | ) | (11 | ) | – | | – | | (354 | ) |
| Between four and five years | (1 | ) | (8 | ) | – | | – | | (9 | ) |
| After five years | (3,354 | ) | (13 | ) | – | | – | | (3,367 | ) |
|
|
|
|
|
|
|
|
|
| |
| | (6,350 | ) | (121 | ) | (148 | ) | (84 | ) | (6,703 | ) |
|
|
|
|
|
|
|
|
|
| |
Currency profiles of financial assets and liabilities
The Group’s currency exposures that give rise to net currency gains and losses that are recognised in the income statement arise principally in companies with Sterling functional currency. The tables below set out these exposures on financial assets and liabilities held in currencies other than the functional currencies of Group companies after the effect of currency swaps.
| At 31st December 2006 | Sterling | | US$ | | Euro | | Yen | | Other | | Total | |
| Financial assets | £m | | £m | | £m | | £m | | £m | | £m | |
|
|
|
|
|
|
|
|
|
|
|
| |
| Investments | – | | 140 | | 3 | | – | | 27 | | 170 | |
| Cash and cash equivalents | 2 | | 81 | | 6 | | 2 | | 18 | | 109 | |
| Receivables | 2 | | 221 | | 118 | | – | | 34 | | 375 | |
| Other financial assets | – | | 2 | | 1 | | – | | 4 | | 7 | |
|
|
|
|
|
|
|
|
|
|
|
| |
| | 4 | | 444 | | 128 | | 2 | | 83 | | 661 | |
|
|
|
|
|
|
|
|
|
|
|
| |
| | | | | | | | | | | | | |
| | | | | | | | | | | | | |
| At 31st December 2005 | Sterling | | US$ | | Euro | | Yen | | Other | | Total | |
| Financial assets | £m | | £m | | £m | | £m | | £m | | £m | |
|
|
|
|
|
|
|
|
|
|
|
| |
| Investments | 8 | | 108 | | 3 | | – | | 11 | | 130 | |
| Cash and cash equivalents | 1 | | 46 | | 10 | | 2 | | 19 | | 78 | |
| Receivables | 7 | | 123 | | 89 | | – | | 91 | | 310 | |
| Other financial assets | – | | – | | – | | – | | – | | – | |
|
|
|
|
|
|
|
|
|
|
|
| |
| | 16 | | 277 | | 102 | | 2 | | 121 | | 518 | |
|
|
|
|
|
|
|
|
|
|
|
| |
| | | | | | | | | | | | | |
| | | | | | | | | | | | | |
| At 31st December 2006 | Sterling | | US$ | | Euro | | Yen | | Other | | Total | |
| Financial liabilities | £m | | £m | | £m | | £m | | £m | | £m | |
|
|
|
|
|
|
|
|
|
|
|
| |
| Debt | – | | – | | – | | – | | – | | – | |
| Obligations under finance leases | – | | – | | (9 | ) | – | | (8 | ) | (17 | ) |
| Payables | (14 | ) | (117 | ) | (67 | ) | (2 | ) | (93 | ) | (293 | ) |
|
|
|
|
|
|
|
|
|
|
|
| |
| | (14 | ) | (117 | ) | (76 | ) | (2 | ) | (101 | ) | (310 | ) |
|
|
|
|
|
|
|
|
|
|
|
| |
| | | | | | | | | | | | | |
| | | | | | | | | | | | | |
| At 31st December 2005 | Sterling | | US$ | | Euro | | Yen | | Other | | Total | |
| Financial liabilities | £m | | £m | | £m | | £m | | £m | | £m | |
|
|
|
|
|
|
|
|
|
|
|
| |
| Debt | – | | – | | (497 | ) | – | | – | | (497 | ) |
| Obligations under finance leases | – | | (2 | ) | – | | – | | – | | (2 | ) |
| Payables | (7 | ) | (18 | ) | (13 | ) | (1 | ) | (30 | ) | (69 | ) |
|
|
|
|
|
|
|
|
|
|
|
| |
| | (7 | ) | (20 | ) | (510 | ) | (1 | ) | (30 | ) | (568 | ) |
|
|
|
|
|
|
|
|
|
|
|
| |
| |
|
| GSK Annual Report 2006 |
| 132 |
<Back to Contents
| |
| Notes to the financial statements |
| continued |
|
| |
39 Financial instruments and related disclosurescontinued
Derivative financial instruments
The table below sets out the net principal amount and fair value of derivative contracts held by GSK:
| | | | | | | Fair value | |
| | | Contract or underlying |
|
|
| |
| | | principal amount | Assets | | Liabilities | |
| | | 2006 | 2006 | | 2006 | |
| | | £m | £m | | £m | |
|
|
|
|
|
|
| |
| Currency and interest related instruments: | | | | | | | |
| Foreign exchange contracts | | 461 | | 20 | | (25 | ) |
| Cross currency swaps | | 838 | | 150 | | (5 | ) |
| Interest rate swaps | | 1,696 | | 6 | | (46 | ) |
| |
| Equity related instruments: | | | | | | | |
| Options and warrants | | 407 | | 13 | | (12 | ) |
| Equity collar | | 270 | | – | | (12 | ) |
| | | | | | | | |
| Embedded derivatives | | 43 | | 4 | | – | |
|
|
|
|
|
|
| |
| Total derivative financial instruments | | | | 193 | | (100 | ) |
|
|
|
|
|
|
| |
| | | | | | | | |
| | | | | | | Fair value | |
| | | Contract or underlying | |
|
|
| |
| | | principal amount | | Assets | | Liabilities | |
| | | 2005 | | 2005 | | 2005 | |
| | | £m | | £m | | £m | |
|
|
|
|
|
|
| |
| Currency and interest related instruments: | | | | | | | |
| Foreign exchange contracts | | (4,665 | ) | 102 | | (85 | ) |
| Cross currency swaps | | 842 | | 64 | | – | |
| Interest rate swaps | | 1,848 | | 5 | | (47 | ) |
| | | | | | | | |
| Equity related instruments: | | | | | | | |
| Options and warrants | | 290 | | 21 | | (49 | ) |
| Equity collar | | 299 | | – | | (14 | ) |
| | | | | | | | |
| Embedded derivatives | | 34 | | 3 | | (2 | ) |
|
|
|
|
|
|
| |
| Total derivative financial instruments | | | | 195 | | (197 | ) |
|
|
|
|
|
|
| |
Derivative financial instruments
Included in ‘Equity related instruments’ above are variable sale forward contracts in Quest Diagnostics Inc. and options in Theravance Inc., as detailed below.
In 2002, GSK hedged part of the equity value of its holdings in Quest, its largest equity investment, through a series of variable sale forward contracts. The contracts (‘the equity collar’) were renewed in 2006 and are structured in five series, each over two million Quest shares, and mature between 2010 and 2012. The fair value of the contracts at 31st December 2006 was a liability of $24 million (£12 million) (2005 – $24 million (£14 million)). A second hedging contract over an additional 10 million shares was entered into on 15th February 2007 – see Note 38 ‘Post balance sheet events’.
The Group has entered into a put option agreement whereby Theravance’s shareholders can sell up to half of their Theravance shares to GSK at a pre-determined price ($19.375) . Given the maximum number of shares subject to the put option, the Group’s obligation is capped at $525 million. At 31st December 2006, this option is recorded as a liability of $19 million (£10 million) (2005 – $81 million (£47 million)). As at 31st December 2006, the maximum potential exposure to GSK from fair value movements of these options is therefore approximately $506 million (£258 million) (2005 – $444 million (£258 million)). The expiry date is August 2007.
The Group has entered into a call option agreement whereby it can purchase half of the outstanding Theravance shares in issue at a predetermined price ($54.25) . At 31st December 2006, this option is recorded as an asset of $15 million (£8 million) (2005 – $28 million (£16 million)). As at 31st December 2006, the maximum potential exposure to GSK from fair value movements of this option is therefore $15 million. The expiry date is July 2007.
| |
|
| GSK Annual Report 2006 |
| 133 |
Back to Contents
| |
| Notes to the financial statements |
| continued |
|
| |
39 Financial instruments and related disclosurescontinued
The following table sets out the principal amount and fair values of derivative contracts which qualify for hedge accounting treatment:
| | | | 2006 | | | | 2005 | |
| |
|
|
| |
|
|
| |
| | Contract or underlying | | Fair value of | | Contract or underlying | | Fair value of | |
| | principal amount | | derivative contract | | principal amount | | derivative contract | |
| | £m | | £m | | £m | | £m | |
|
|
|
|
|
|
|
| |
| Cash flow hedges: | | | | | | | | |
| Cross currency swaps | 338 | | 44 | | 342 | | 10 | |
|
|
|
|
|
|
|
| |
| Fair value hedges: | | | | | | | | |
| Foreign exchange contracts | – | | – | | 2,151 | | 74 | |
| Interest rate swaps | 1,696 | | (40 | ) | 1,848 | | (42 | ) |
| Cross currency swaps | 500 | | (5 | ) | 500 | | 3 | |
|
|
|
|
|
|
|
| |
| Net investment hedges: | | | | | | | | |
| Foreign exchange contracts | (5,049 | ) | 11 | | (6,816 | ) | (57 | ) |
| Cross currency swaps | 500 | | 106 | | 500 | | 51 | |
|
|
|
|
|
|
|
| |
Cash flow hedges
The Group has entered into a cross currency swap and designated it a cash flow hedge converting fixed Euro coupons, payable annually, to fixed Yen payments. The bond matures in 2009. The risk being hedged is the variability of cash flows arising from currency fluctuations.
Fair value hedges
The Group has designated interest rate swaps and the interest element of cross currency swaps as fair value hedges. The risk being hedged is the variability of the fair value of the bonds arising from interest rate fluctuations.
Net investment hedges
Foreign exchange contracts and the currency element of cross currency swaps have been designated as net investment hedges in respect of the foreign currency translation risk arising on consolidation of the Group’s net investment in its US dollar, Euro and Yen foreign operations.
40 Employee share schemes
The Group operates share option schemes, whereby options are granted to employees to acquire shares or ADSs in GlaxoSmithKline plc at the grant price, savings-related share option schemes and share award schemes, whereby awards are granted to employees to acquire shares or ADSs in GlaxoSmithKline plc at no cost, subject to the achievement by the Group of specified performance targets. In 2004, the Group introduced a new share award scheme, the Share Value Plan, whereby awards are granted to employees to acquire shares or ADSs in GlaxoSmithKline plc at no cost after a three year vesting period. The granting of restricted share awards has replaced the granting of options to certain employees as the cost of the scheme more readily equates to the potential gain to be made by the employee.
Grants under share option schemes are normally exercisable between three and ten years from the date of grant. Grants of restricted shares and share awards are normally exercisable at the end of the three year vesting/performance period. Grants under savings-related share option schemes are normally exercisable after three years’ saving. Options under the share option schemes are granted at the market price ruling at the date of grant. In accordance with UK practice, the majority of options under the savings-related share option schemes are granted at a price 20% below the market price ruling at the date of grant.
Share options awarded to the Directors and, with effect from the 2004 grant, the CET are subject to performance criteria as laid out in the Remuneration Report.
The stock-based compensation charge has been recorded in the income statement as follows:
| | 2006 | | 2005 | | 2004 | |
| | £m | | £m | | £m | |
|
|
|
|
|
| |
| Cost of sales | 18 | | 17 | | 35 | |
| Selling, general and administration | 143 | | 150 | | 207 | |
| Research and development | 65 | | 69 | | 91 | |
|
|
|
|
|
| |
| | 226 | | 236 | | 333 | |
|
|
|
|
|
| |
| |
|
| GSK Annual Report 2006 |
| 134 |
<Back to Contents
| |
| Notes to the financial statements |
| continued |
|
| |
40 Employee share schemescontinued
Option pricing
For the purposes of valuing options to arrive at the stock-based compensation charge, the Black-Scholes option pricing model has been used. The assumptions used in the model for 2004, 2005 and 2006 are as follows:
| | | 2006 | | | 2005 | | | 2004 | |
|
|
| | |
| | |
| |
| Risk-free interest rate | | 4.2% – 5.0% | | | 4.0% – 4.8% | | | 3.3% – 4.6% | |
| Dividend yield | | 3.3% | | | 3.0% | | | 3.2% | |
| Volatility | | 18% – 29% | | | 21% – 28% | | | 26% – 29% | |
| Expected lives of options granted under: | | | | | | | | | |
| Share option schemes | | 5 years | | | 5 years | | | 5 years | |
| Savings-related share option schemes | | 3 years | | | 3 years | | | 3 years | |
| Weighted average share price for grants in the year: | | | | | | | | | |
| Ordinary shares | £ | 14.64 | | £ | 13.15 | | £ | 11.25 | |
| ADSs | $ | 51.40 | | $ | 47.42 | | $ | 43.23 | |
|
|
|
|
|
|
|
|
| |
Volatility was determined based on the three year share price history. The fair value of performance share plan grants take into account market conditions. Expected lives of options were determined based on weighted average historic exercises of options.
| Options outstanding | | | | | | | | Share option | | | | | | | | | Share option | | | | | | | | | Savings-related | |
| | | | | | schemes – shares | | | | | | schemes – ADSs | | | share option schemes | |
| |
|
|
|
|
|
|
|
| |
|
|
|
|
|
|
|
| |
|
|
|
|
|
|
|
| |
| | | | | | Weighted | | | Weighted | | | | | | Weighted | | | Weighted | | | | | | Weighted | | | Weighted | |
| | | Number | | | exercise | | | fair | | | Number | | | exercise | | | fair | | | Number | | | exercise | | | fair | |
| | | 000 | | | price | | | value | | | 000 | | | price | | | value | | | 000 | | | price | | | value | |
|
|
|
|
|
|
|
|
|
|
|
|
|
|
|
|
|
|
|
|
|
|
|
|
|
|
| |
| At 1st January 2004 | | 205,705 | | £ | 14.89 | | | | | | 106,529 | | $ | 46.58 | | | | | | 10,583 | | £ | 9.59 | | | | |
| Options granted | | 9,837 | | £ | 11.23 | | £ | 2.49 | | | 9,222 | | $ | 42.99 | | $ | 8.54 | | | 1,580 | | £ | 9.52 | | £ | 3.30 | |
| Options exercised | | (5,764 | ) | £ | 6.54 | | | | | | (1,845 | ) | $ | 25.65 | | | | | | (232 | ) | £ | 9.18 | | | | |
| Options lapsed | | (11,997 | ) | £ | 15.33 | | | | | | (3,427 | ) | $ | 48.28 | | | | | | (1,790 | ) | £ | 10.46 | | | | |
|
|
|
|
|
|
|
|
|
|
|
|
|
|
|
|
|
|
|
|
|
|
|
|
|
|
| |
| At 31st December 2004 | | 197,781 | | £ | 14.92 | | | | | | 110,479 | | $ | 46.57 | | | | | | 10,141 | | £ | 9.44 | | | | |
| Options granted | | 516 | | £ | 12.57 | | £ | 2.76 | | | 956 | | $ | 45.66 | | $ | 9.90 | | | 5,167 | | £ | 11.45 | | £ | 3.68 | |
| Options exercised | | (10,483 | ) | £ | 9.91 | | | | | | (7,537 | ) | $ | 38.83 | | | | | | (5,732 | ) | £ | 9.16 | | | | |
| Options lapsed | | (20,888 | ) | £ | 17.16 | | | | | | (8,306 | ) | $ | 50.26 | | | | | | (810 | ) | £ | 11.02 | | | | |
|
|
|
|
|
|
|
|
|
|
|
|
|
|
|
|
|
|
|
|
|
|
|
|
|
|
| |
| At 31st December 2005 | | 166,926 | | £ | 14.97 | | | | | | 95,592 | | $ | 46.86 | | | | | | 8,766 | | £ | 10.66 | | | | |
| Options granted | | 9,776 | | £ | 14.78 | | £ | 3.53 | | | 7,940 | | $ | 51.36 | | $ | 11.59 | | | 2,069 | | £ | 11.40 | | £ | 3.41 | |
| Options exercised | | (13,244 | ) | £ | 11.66 | | | | | | (13,310 | ) | $ | 41.78 | | | | | | (2,009 | ) | £ | 9.48 | | | | |
| Options lapsed | | (6,755 | ) | £ | 15.35 | | | | | | (1,791 | ) | $ | 46.88 | | | | | | (653 | ) | £ | 10.97 | | | | |
|
|
|
|
|
|
|
|
|
|
|
|
|
|
|
|
|
|
|
|
|
|
|
|
|
|
| |
| At 31st December 2006 | | 156,703 | | £ | 15.22 | | | | | | 88,431 | | $ | 48.02 | | | | | | 8,173 | | £ | 11.11 | | | | |
|
|
|
|
|
|
|
|
|
|
|
|
|
|
|
|
|
|
|
|
|
|
|
|
|
|
| |
| Range of exercise prices | £ | 10.06 | – | £ | 19.77 | | | | | $ | 32.09 | – | $ | 61.35 | | | | | £ | 10.20 | – | £ | 11.45 | | | | |
|
|
|
|
|
|
|
|
|
|
|
|
|
|
|
|
|
|
|
|
|
|
|
|
|
|
| |
| Weighted average remaining contractual life | | | | | 4.9 years | | | | | | | | | 5.6 years | | | | | | | | | 2.4 years | | | | |
|
|
|
|
|
|
|
|
|
|
|
|
|
|
|
|
|
|
|
|
|
|
|
|
|
|
| |
The total intrinsic value (the amount by which the share price exceeded the exercise price of the option) of options exercised during 2006 was £129 million (2005 – £122 million).
The aggregate intrinsic value of options outstanding at 31st December 2006 was £342 million.
| |
|
| GSK Annual Report 2006 |
| 135 |
<Back to Contents
| |
| Notes to the financial statements |
| continued |
|
| |
40 Employee share schemescontinued
In order to encourage employees to convert options, excluding savings-related share options, held over Glaxo Wellcome or SmithKline Beecham shares or ADSs, into those over GlaxoSmithKline shares or ADSs, a programme was established to give an additional cash benefit of 10% of the exercise price of the original option provided that the employee did not voluntarily leave the Group for two years from the date of the merger and did not exercise the option before the earlier of six months from the expiry date of the original option and two years from the date of the merger. The cash benefit will also be paid if the options expire unexercised if the market price is below the exercise price on the date of expiry.
| Options outstanding | | | | Share option | | | | | Share option | | | | | Savings-related | |
| at 31st December 2006 | | | schemes – shares | | | | schemes – ADSs | | share option schemes | |
| |
|
|
|
| |
|
|
|
| |
|
|
|
| |
| | | | Weighted | Latest | | | | Weighted | Latest | | | | | Latest | |
| | Number | | exercise | exercise | | Number | | exercise | exercise | | Number | | Exercise | exercise | |
| Year of grant | 000 | | price | date | | 000 | | price | date | | 000 | | price | date | |
|
|
|
|
|
|
|
|
|
|
|
|
|
|
| |
| 1997 | 4,379 | £ | 11.85 | 13.11.07 | | 2,130 | $ | 40.20 | 13.11.07 | | – | | – | – | |
| 1998 | 14,286 | £ | 16.91 | 23.11.08 | | 5,132 | $ | 54.29 | 23.11.08 | | – | | – | – | |
| 1999 | 15,225 | £ | 18.20 | 01.12.09 | | 6,966 | $ | 60.15 | 24.11.09 | | – | | – | – | |
| 2000 | 14,649 | £ | 14.90 | 11.09.10 | | 326 | $ | 58.88 | 09.08.10 | | – | | – | – | |
| 2001 | 42,824 | £ | 18.12 | 29.11.11 | | 27,450 | $ | 51.84 | 28.11.11 | | – | | – | – | |
| 2002 | 19,302 | £ | 11.95 | 03.12.12 | | 9,838 | $ | 37.60 | 03.12.12 | | – | | – | – | |
| 2003 | 27,318 | £ | 12.67 | 14.12.13 | | 19,396 | $ | 43.55 | 14.12.13 | | 179 | £ | 10.20 | 31.05.07 | |
| 2004 | 8,922 | £ | 11.23 | 02.12.14 | | 8,919 | $ | 43.05 | 02.12.14 | | 1,268 | £ | 9.52 | 31.05.08 | |
| 2005 | 206 | £ | 13.08 | 01.11.15 | | 464 | $ | 47.33 | 31.10.15 | | 4,663 | £ | 11.45 | 31.05.09 | |
| 2006 | 9,592 | £ | 14.69 | 28.11.16 | | 7,810 | $ | 51.34 | 28.07.16 | | 2,063 | £ | 11.40 | 31.05.10 | |
|
|
|
|
|
|
|
|
|
|
|
|
|
|
| |
| Total | 156,703 | £ | 15.22 | | | 88,431 | $ | 48.02 | | | 8,173 | £ | 11.11 | | |
|
|
|
|
|
|
|
|
|
|
|
|
|
|
| |
All of the above options are exercisable, except all options over shares and ADSs granted in 2004, 2005 and 2006 and the savings-related share options granted in 2004, 2005 and 2006. The total number of non-vested options at 31st December 2006 was 26,713,865 share options and 17,192,398 ADS options (2005 – 45,645,311 share options and 31,326,848 ADS options). These options had a weighted average grant date fair value of £3.53 for share options, $11.59 for ADS options and £3.41 for savings-related share options (2005 – £2.95, $2.72 and £3.68 respectively).
There has been no change in the effective exercise price of any outstanding options during the year.
| Options exercisable | | | | | Share option | | | | | | Share option | | | | | | Savings-related | |
| | | schemes – shares | | | | schemes – ADSs | | share option schemes | |
| |
|
|
|
|
| |
|
|
|
|
| |
|
|
|
|
| |
| | | | Weighted | | Weighted | | | | Weighted | | Weighted | | | | Weighted | | Weighted | |
| | Number | | exercise | | fair | | Number | | exercise | | fair | | Number | | exercise | | fair | |
| | 000 | | price | | value | | 000 | | price | | value | | 000 | | price | | value | |
|
|
|
|
|
|
|
|
|
|
|
|
|
|
|
|
|
| |
| At 31st December 2004 | 126,917 | £ | 16.49 | | | | 57,421 | $ | 51.75 | | | | 270 | £ | 14.12 | | | |
| At 31st December 2005 | 128,316 | £ | 15.77 | | | | 64,265 | $ | 48.56 | | | | 1,429 | £ | 9.16 | | | |
| At 31st December 2006 | 137,983 | £ | 15.51 | | | | 71,238 | $ | 48.32 | | | | 179 | £ | 10.20 | | | |
|
|
|
|
|
|
|
|
|
|
|
|
|
|
|
|
|
| |
| Weighted average remaining | | | 4.4 years | | | | | | 4.9 years | | | | | | 0.3 years | | | |
| contractual life | | | | | | | | | | | | | | | | | | |
|
|
|
|
|
|
|
|
|
|
|
|
|
|
|
|
|
| |
| Options vested during the year | 24,991 | | | £ | 3.27 | | 18,103 | | | $ | 12.35 | | 789 | | | £ | 4.15 | |
|
|
|
|
|
|
|
|
|
|
|
|
|
|
|
|
|
| |
The aggregate intrinsic value of options exercisable at 31st December 2006 was £251 million. The total fair value of options vesting during the year was £206 million (2005 – £250 million; 2004 – £630 million).
| |
|
| GSK Annual Report 2006 |
| 136 |
<Back to Contents
| |
| Notes to the financial statements |
| continued |
|
| |
40 Employee share schemescontinued
GlaxoSmithKline share award schemes
Performance Share Plan
The Group operates a Performance Share Plan whereby awards are granted to Directors and senior executives at no cost. The percentage of each award that vests is based upon the performance of the Group over a three year measurement period. The performance conditions consist of two parts, each of which applies to 50% of the award. For awards granted in 2003, the first part of the condition compares GlaxoSmithKline’s Total Shareholder Return (TSR) over the period with the TSR of companies in the UK FTSE 100 Index over the same period. For awards granted in 2004, and subsequent years, the first part of the condition compares GlaxoSmithKline’s TSR over the period with the TSR of 13 pharmaceutical companies in the comparator group over the same period. The second part of the performance condition compares GlaxoSmithKline’s earnings per share growth to the increase in the UK Retail Prices Index over the three year performance period. Awards granted to Directors and members of the CET from 15th December 2003 are subject to a single performance condition which compares GlaxoSmithKline’s TSR over the period with the TSR of companies in the comparator group over the same period.
| Number of shares and ADSs issuable | Shares | | | Weighted | | ADSs | | | Weighted | |
| Number (000) | | | fair value | | Number (000) | | | fair value | |
|
|
|
|
|
|
|
|
|
| |
| At 1st January 2004 | 3,500 | | | | | 2,479 | | | | |
| Awards granted | 1,778 | | £ | 7.25 | | 1,339 | | $ | 23.89 | |
| Awards exercised | (409 | ) | | | | (187 | ) | | | |
| Awards cancelled | (520 | ) | | | | (276 | ) | | | |
|
|
|
|
|
|
|
|
|
| |
| At 31st December 2004 | 4,349 | | | | | 3,355 | | | | |
| Awards granted | 130 | | £ | 9.02 | | 88 | | $ | 32.34 | |
| Awards exercised | (375 | ) | | | | (199 | ) | | | |
| Awards cancelled | (477 | ) | | | | (237 | ) | | | |
|
|
|
|
|
|
|
|
|
| |
| At 31st December 2005 | 3,627 | | | | | 3,007 | | | | |
| Awards granted | 2,068 | | £ | 10.06 | | 1,452 | | $ | 35.13 | |
| Awards exercised | (438 | ) | | | | (187 | ) | | | |
| Awards cancelled | (501 | ) | | | | (238 | ) | | | |
|
|
|
|
|
|
|
|
|
| |
| At 31st December 2006 | 4,756 | | | | | 4,034 | | | | |
|
|
|
|
|
|
|
|
|
| |
Share Value Plan
The Group operates a Share Value Plan whereby awards are granted, in the form of shares, to certain employees at no cost. The awards vest after three years. There are no performance criteria attached.
| Number of shares and ADSs issuable | Shares | | | Weighted | | ADSs | | | Weighted | |
| Number (000) | | | fair value | | Number (000) | | | fair value | |
|
|
|
|
|
|
|
|
|
| |
| At 1st January 2004 | – | | | | | – | | | | |
| Awards granted | 4,419 | | £ | 10.07 | | 3,562 | | $ | 38.14 | |
|
|
|
|
|
|
|
|
|
| |
| At 31st December 2004 | 4,419 | | | | | 3,562 | | | | |
| Awards granted | 403 | | £ | 12.00 | | 511 | | $ | 44.39 | |
| Awards exercised | (138 | ) | | | | (143 | ) | | | |
| Awards cancelled | (170 | ) | | | | (81 | ) | | | |
|
|
|
|
|
|
|
|
|
| |
| At 31st December 2005 | 4,514 | | | | | 3,849 | | | | |
| Awards granted | 4,759 | | £ | 13.45 | | 4,126 | | $ | 52.53 | |
| Awards exercised | (131 | ) | | | | (66 | ) | | | |
| Awards cancelled | (348 | ) | | | | (280 | ) | | | |
|
|
|
|
|
|
|
|
|
| |
| At 31st December 2006 | 8,794 | | | | | 7,629 | | | | |
|
|
|
|
|
|
|
|
|
| |
| |
|
| GSK Annual Report 2006 |
| 137 |
<Back to Contents
| |
| Notes to the financial statements |
| continued |
|
| |
40 Employee share schemescontinued
Employee Share Ownership Plan Trusts
The Group sponsors Employee Share Ownership Plan (ESOP) Trusts to acquire and hold shares in GlaxoSmithKline plc to satisfy awards made under employee incentive plans and options granted under employee share option schemes. The trustees of the ESOP Trusts purchase shares on the open market with finance provided by the Group by way of loans or contributions. Costs of running the ESOP Trusts are charged to the income statement. Shares held by the ESOP Trusts are deducted from other reserves and held at the value of proceeds receivable from employees on exercise. If there is deemed to be a permanent diminution in value this is reflected by a transfer to retained earnings. The Trusts also acquire and hold shares to meet notional dividends re-invested on deferred awards under the SmithKline Beecham Mid-Term Incentive Plan. The trustees have waived their rights to dividends on the shares held by the ESOP Trusts.
| Shares held for share award schemes | 2006 | | 2005 | |
|
|
|
| |
| Number of shares (‘000) | 37,508 | | 22,169 | |
| | | | | |
| | £m | | £m | |
|
|
|
| |
| Nominal value | 9 | | 6 | |
| Carrying value | 196 | | 116 | |
| Market value | 504 | | 326 | |
|
|
|
| |
| Shares held for share option schemes | 2006 | | 2005 | |
|
|
|
| |
| Number of shares (‘000) | 115,943 | | 145,267 | |
| | | | | |
| | £m | | £m | |
|
|
|
| |
| Nominal value | 29 | | 36 | |
| Carrying value | 1,803 | | 2,197 | |
| Market value | 1,558 | | 2,134 | |
|
|
|
| |
| |
|
| GSK Annual Report 2006 |
| 138 |
Back to Contents
| |
| Notes to the financial statements |
| continued |
|
| |
41 Reconciliation to US accounting principles
The analyses and reconciliations presented in this Note represent the financial information prepared on the basis of US Generally Accepted Accounting Principles (US GAAP) rather than IFRS.
Summary of material differences between IFRS and US GAAP
Acquisition of SmithKline Beecham
The Group has exercised the exemption available under IFRS 1 ‘First-time Adoption of IFRS’ not to restate business combinations prior to the date of transition of the Group’s reporting GAAP from UK Generally Accepted Accounting Principles (UK GAAP) to IFRS. Therefore the combination in 2000 of Glaxo Wellcome plc and SmithKline Beecham plc continues to be accounted for as a merger (pooling of interests) in accordance with UK GAAP at that time. Under US GAAP, this business combination did not qualify for pooling of interests accounting and Glaxo Wellcome was deemed to be the accounting acquirer in a purchase business combination.
Accordingly the net assets of SmithKline Beecham were recognised at fair value as at the date of acquisition. As a result of the fair value exercise, increases in the values of SmithKline Beecham’s inventory, property, plant and equipment, intangible assets, investments and pension obligations were recognised and fair market values attributed to its internally-generated intangible assets, mainly product rights (inclusive of patents and trademarks) and in-process research and development, together with appropriate deferred taxation effects. The difference between the cost of acquisition and the fair value of the assets and liabilities of SmithKline Beecham is recorded as goodwill.
Capitalised interest
Under IFRS, the Group does not capitalise interest. US GAAP requires interest incurred as part of the cost of constructing a fixed asset to be capitalised and amortised over the life of the asset.
Goodwill
The Group has exercised the exemption available under IFRS 1 not to restate business combinations prior to the date of transition of the Group’s reporting GAAP from UK GAAP to IFRS. Under UK GAAP, goodwill arising on acquisitions before 1998 accounted for under the purchase method was eliminated against equity, and under IFRS, on future disposal or closure of a business, any goodwill previously taken directly to equity under a former GAAP will not be charged against income. Under UK GAAP, goodwill arising on acquisitions from 1998 was capitalised and amortised over a period not exceeding 20 years. On the date of the Group’s transition to IFRS, 1st January 2003, amortisation ceased in accordance with IFRS 3 ‘Business combinations’. The Group must instead identify and value its reporting units for the purpose of assessing, at least annually, potential impairment of goodwill allocated to each reporting unit. As permitted by the business combinations exemption available under IFRS 1, amortisation arising prior to 2003 was not reversed.
Under US GAAP, goodwill arising on acquisitions prior to 30th June 2001 was capitalised and amortised over a period not exceeding 40 years. In July 2001, the Financial Accounting Standards Board (FASB) issued Statement of Financial Accounting Standard (SFAS) 142, ‘Goodwill and Other Intangible Assets’. Like IFRS 3, SFAS 142 requires that goodwill must not be amortised and that annual impairment tests of goodwill must be undertaken. The implementation of SFAS 142 in 2002, a year earlier than the Group’s transition to IFRS, results in goodwill balances acquired between 1998 and 2003 reflecting one year less of amortisation under US GAAP than under IFRS.
Under IFRS, costs to be incurred in integrating and restructuring the Wellcome, SmithKline Beecham and Block Drug businesses following the acquisitions in 1995, 2000 and 2001 respectively were charged to the income statement post acquisition. Similarly, integration and restructuring costs arising in respect of the acquisitions of CNS in 2006 and Corixa and ID Biomedical in 2005 have been charged to the income statement under IFRS. Under US GAAP, certain of these costs are considered in the allocation of purchase consideration thereby affecting the goodwill arising on acquisition.
In-process research & development (IPR&D)
Under IFRS, IPR&D projects acquired in a business combination are capitalised and remain on the balance sheet, subject to any impairment write-downs. Amortisation is charged over the assets’ estimated useful lives from the point when the assets became available for use. Under US GAAP, such assets are recognised in the opening balance sheet but are then written off immediately to the income statement, as the technological feasibility of the IPR&D has not yet been established and it has no alternative future use. Under IFRS, deferred tax is provided for IPR&D assets acquired in a business combination. US GAAP does not provide for deferred tax on these assets, resulting in a reconciling adjustment to deferred tax and goodwill.
IPR&D acquired in transactions other than business combinations is discussed under Intangible assets below.
Intangible assets
Under IFRS, certain intangible assets related to specific compounds or products which are purchased from a third party and are developed for commercial applications are capitalised but not subject to amortisation until regulatory approval is obtained. Under US GAAP, payments made in respect of these compounds or products which are still in development and have not yet received regulatory approval are charged directly to the income statement.
Under IFRS, intangible assets are amortised over their estimated useful economic life except in the case of certain acquired brands where the end of the useful economic life of the brand cannot be foreseen. Under US GAAP, until the implementation of SFAS 142 ‘Goodwill and Other Intangible Assets’ in 2002, all intangible assets, including brands, were amortised over a finite life. On implementation of SFAS 142 in 2002, intangible assets deemed to have indefinite lives were no longer amortised. As a result of the difference in accounting treatment prior to the implementation of SFAS 142, the carrying values of indefinite lived brands are affected by amortisation charged before 2002 under US GAAP.
| |
|
| GSK Annual Report 2006 |
| 139 |
<Back to Contents
| |
| Notes to the financial statements |
| continued |
|
| |
41 Reconciliation to US accounting principlescontinued
Restructuring costs
Under IFRS, restructuring costs incurred following acquisitions are charged to the profit and loss account post acquisition. For US GAAP purposes, certain of these costs are recognised as liabilities upon acquisition in the opening balance sheet.
Other restructuring costs are recorded as a provision under IFRS when a restructuring plan has been announced. Under US GAAP, a provision may only be recognised when further criteria are met or the liability is incurred. Therefore adjustments have been made to eliminate provisions for restructuring costs that do not meet US GAAP requirements.
Marketable securities
Marketable securities consist primarily of equity securities and certain other liquid investments, principally government bonds and short-term corporate debt instruments. Under SFAS 115 ‘Accounting for Certain Investments in Debt and Equity Securities’, these securities are considered available for sale and are carried at fair value, with the unrealised gains and losses, net of tax, recorded as a separate component of shareholders’ equity. Under IFRS, these are accounted for as available-for-sale financial assets in accordance with IAS 39 ‘Financial Instruments : Recognition and Measurement’.
The accounting treatment for marketable securities under US GAAP and IFRS is similar. However, differences do arise, principally as a result of the category of marketable securities as defined by SFAS 115 being smaller than the category of available-for-sale financial assets as defined by IAS 39. Investments which are not marketable securities under the SFAS 115 definition are accounted for at cost less impairments under US GAAP rather than at fair value.
The Group did not adopt IAS 39 until 1st January 2005, and, in accordance with the exemption available under IFRS 1, has presented financial instruments in the comparative periods in accordance with UK GAAP. Therefore in 2004 these securities are stated at the lower of cost and net realisable value.
Marketable securities are reviewed at least every quarter for other than temporary impairment. For equity securities, the factors considered include:
| • | the investee’s current financial performance and future prospects |
| • | the general market condition of the geographic or industry area in which the investee operates |
| • | the duration and extent to which the market value has been below cost. |
Gross unrealised gains and losses on marketable securities were £142 million and less than £1 million, respectively, at 31st December 2006 (2005 – £36 million and £4 million, respectively). The fair value of marketable securities with unrealised losses at 31st December 2006 is £3 million (2005 – £62 million). All of these marketable securities have been in a continuous loss position for less than 12 months. Deferred tax provided against unrealised gains and losses at 31st December 2006 was £21 million (2005 – £4 million). Gains of £8 million were reclassified out of accumulated other comprehensive income into the income statement on disposals of equity investments during the year (2005 – £7 million gain).
The proceeds from sale of marketable securities under US GAAP were £19,013 million in the year ended 31st December 2006 (2005 –£19,416 million). The proceeds include the roll-over of liquid funds on short-term deposit. The gross gains and losses reflected in the consolidated income statement in respect of marketable securities were £11 million and £nil, respectively (2005 – £7 million and £nil).
Pensions and other post-retirement benefits
The key difference between IFRS and US GAAP is the method of recognition of actuarial gains and losses. GSK has opted under IFRS to recognise actuarial gains and losses in the statement of recognised income and expense in the year in which they arise. Under US GAAP actuarial gains and losses are recognised using the 10% corridor approach and deferred actuarial gains and losses are amortised.
Stock-based compensation
Under IFRS 2 ‘Share-based Payment’, share options are fair valued at their grant dates and the cost is charged to the income statement over the relevant vesting periods. Under US GAAP, the Group applies SFAS 123R ‘Share-Based Payment’ and related accounting interpretations in accounting for its option plans, which also require options to be fair valued at their grant date and charged to the income statement over the vesting period of the options. Minor differences arise as a result of the differing definitions of grant date for certain share-based payments and in the accounting treatment of share options with certain conditions linked to inflation, which are classified as liabilities under SFAS 123R.
Derivative instruments
SFAS 133, ‘Accounting for Derivative Instruments and Hedging Activities’, as amended by SFAS 137 and SFAS 138 and as interpreted by the Derivatives Implementation Group, was adopted by the Group with effect from 1st January 2001. SFAS 133 establishes accounting and reporting standards for derivative instruments, including certain derivative instruments embedded in other contracts (collectively, referred to as derivatives) and for hedging activities. SFAS 133 requires that an entity recognise all derivatives as either assets or liabilities in the consolidated balance sheet and measure those instruments at fair value. Changes in fair value over the period are recorded in current earnings unless hedge accounting is obtained. SFAS 133 prescribes requirements for designation and documentation of hedging relationships and ongoing assessments of effectiveness in order to qualify for hedge accounting.
The Group also evaluates contracts for ‘embedded’ derivatives. In accordance with SFAS 133 requirements, if embedded derivatives are not clearly and closely related to the host contract, they are accounted for separately from the host contract as derivatives.
The key differences between IFRS under which the Group’s financial statements are prepared and US GAAP, and in the Group’s application of their respective requirements, are:
| • | certain derivatives which are designated by the Group as hedging instruments under IAS 39 are not designated as hedging instruments under SFAS 133. Accordingly, hedge accounting is not applied under US GAAP in respect of these arrangements |
| |
|
| GSK Annual Report 2006 |
| 140 |
<Back to Contents
| |
| Notes to the financial statements |
| continued |
|
| |
41 Reconciliation to US accounting principlescontinued
| • | the definition of derivatives within the scope of SFAS 133 excludes instruments for which there is no liquid market. This leads to certain items not being recognised on the balance sheet, although they are accounted for as derivatives under IFRS, most notably the call option over Theravance shares |
| | |
| • | IAS 39 has an exemption from the requirement to recognise embedded foreign currency derivatives where the currency is commonly used in the economic environment of the host contract. SFAS 133 does not grant a similar exemption and so the Group identifies and separately accounts for more embedded derivatives under US GAAP than it does under IFRS. |
In 2005 the Group exercised the exemption available under IFRS 1 to present financial instruments in the comparative periods in accordance with UK GAAP. Under UK GAAP, some derivative instruments used for hedges were not recognised on the balance sheet and the matching principle was used to match the gain or loss under these hedging contracts to the foreign currency transaction or profits to which they related. Gains and losses related to the fair value adjustments on these derivative instruments are therefore reconciling items in the 2004 comparative period presented in the reconciliation of profit. In 2006 and 2005, the Group did not designate any of its derivatives as qualifying hedge instruments under SFAS 133.
Hedging arrangements under US GAAP
As at 31st December 2006, the Group applied $500 million of borrowings (2005 – $1 billion) to hedge the foreign currency exposures of the Group’s net investment in certain foreign operations. These borrowings are designated as hedges of net investments. The effective portion of foreign exchange gains or losses on these hedges is recorded as part of the foreign currency translation component of other comprehensive income. In 2006, £32 million of after tax gains (2005 – £42 million of after tax losses) were recorded in other comprehensive income.
Valuation of derivative instruments
The fair value of derivative instruments is sensitive to movements in the underlying market rates and variables. The Group monitors the fair value of derivative instruments on at least a quarterly basis. Derivatives, including interest rate swaps and cross-currency swaps, are valued using standard valuation models, counterparty valuations, or third party valuations. Standard valuation models used by the Group consider relevant discount rates, the market yield curve on the valuation date, forward currency exchange rates and counterparty risk. All significant rates and variables are obtained from market sources. All valuations are based on the remaining term to maturity of the instrument.
Foreign exchange contracts are valued using forward rates observed from quoted prices in the relevant markets when possible. The Group assumes parties to long-term contracts are economically viable but reserves the right to exercise early termination rights if economically beneficial when such rights exist in the contract.
Dividends
Under IFRS, GSK plc’s quarterly dividends are recognised only on payment. Under US GAAP, the dividends are recognised in the financial statements when they are declared.
Other
The following adjustments are also included in the reconciliations:
| • | computer software – under IFRS, the Group capitalises costs incurred in acquiring and developing computer software for internal use where the software supports a significant business system and the expenditure leads to the creation of a durable asset. For US GAAP, the Group applies SOP 98-1, ‘Accounting for the Costs of Computer Software Developed or Obtained for Internal Use’, which restricts the categories of costs which can be capitalised. |
| | |
| • | variable interest entities – under the FASB’s Interpretation No. 46 Revised (FIN 46R), ‘Consolidation of Variable Interest Entities’, certain entities, known as Variable Interest Entities (VIEs), must be consolidated by the ‘primary beneficiary’ of the entity. The primary beneficiary is generally defined as having the majority of the risks and rewards arising from the VIE. Additionally, for VIEs in which a significant, but not majority, variable interest is held, certain disclosures are required. The Group regularly reviews potential VIEs and, as a consequence, consolidated Theravance Inc. between May 2004 and February 2006 (see Note (c) on page 147). No other VIEs of which the Group is the primary beneficiary have been identified. |
| | |
| • | fixed asset and inventory impairments – reversals of impairments previously recorded against the carrying value of assets are permitted under IFRS in certain circumstances. US GAAP does not permit reversals of these impairments. |
| | |
| • | various other small adjustments. |
Consolidated summary statement of cash flows
The US GAAP cash flow statement reports three categories of cash flows: operating activities (including tax and interest); investing activities (including capital expenditure, acquisitions and disposals together with cash flows from available-for-sale current asset investments); and financing activities (including dividends paid). A summary statement of cash flows is presented on page 144.
Comprehensive income statement
The requirement of SFAS 130, ‘Reporting comprehensive income’, to provide a comprehensive income statement is met under IFRS by the Statement of recognised income and expense (page 89).
Recent pronouncements
Share-based payment
On 1st January 2006, the Group adopted SFAS 123R, ‘Share-Based Payment’ using the modified prospective application method. Prior to this, GSK applied the fair value provisions of SFAS 123, ‘Accounting for Stock-Based Compensation’ in accounting for employee share-based compensation awards. The adoption of SFAS 123R had the following impact on the Group’s consolidated financial statements:
| • | Under SFAS 123, the Group had elected to account for the forfeiture of non-vested stock options as incurred. As a result of adopting SFAS 123R, the Group is now required to estimate total forfeitures at the grant date, and revise its estimate throughout the vesting period. The impact of estimating the level of option forfeitures in advance of actual occurrence reduces the cumulative compensation cost recognised in respect of options outstanding at the date of adoption of SFAS 123R of 1st January 2006 by £19 million (£12 million net of tax). This has been recognised as a cumulative effect of a change in accounting principle. |
| |
|
| GSK Annual Report 2006 |
| 141 |
<Back to Contents
| |
| Notes to the financial statements |
| continued |
|
| |
41 Reconciliation to US accounting principlescontinued
| • | Under SFAS 123R share options whose vesting is indexed to a factor that is not a market, performance or service condition are classified as liabilities on the balance sheet and remeasured to fair value at each reporting date. Accordingly, share options granted by GSK with a condition linked to inflation are accounted for as liabilities under US GAAP. Under IFRS, these options are accounted for as equity-settled share-based payments, so their fair value is measured at grant date only and this is recognised over the vesting period in shareholders’ funds. The impact of accounting for options outstanding at 1st January 2006 on the revised US GAAP basis increases the cumulative compensation cost recognised by £3 million (£2 million net of tax). This has been recognised as a cumulative effect of a change in accounting principle. |
| | |
| • | Under SFAS 123, the Group allocated share option compensation expense based on the nominal vesting period, rather than the expected time to achieve retirement eligibility. SFAS 123R specifies that a share-based award is considered vested for expense attribution purposes when the employee’s retention of the award is no longer contingent upon providing subsequent service. Accordingly, the Group has prospectively revised its expense attribution method so that the related compensation cost is recognised over the period from the grant date to the date retirement eligibility is achieved, if less than the stated vesting period. The impact of this change was not significant. |
For the year ended 31st December 2006, compensation expense for all types of share-based payment arrangements and the related income tax benefit recognised was £252 million and £26 million, respectively. Had the Group continued to account for compensation expense under the fair value provisions of SFAS 123, the compensation expense would not have been materially different from the SFAS 123R expense for the year.
At 31st December 2006, GSK had approximately £288 million of total unrecognised compensation cost related to non-vested share-based compensation arrangements granted under the plans, of which £135 million relates to share option schemes. The total cost is expected to be recognised over a weighted-average period of 1.9 years, and 1.8 years for share option schemes.
The tax benefit realised from share options exercised during 2006 was £54 million.
Pensions and other post retirement benefits
In September 2006, the FASB issued SFAS 158, ‘Employers’ Accounting for Defined Benefit Pension and Other Post-retirement Plans’. SFAS 158 requires GSK to (i) recognise the overfunded or underfunded status of a defined benefit plan (other than a multi-employer plan) as an asset or liability with changes in that funded status recognised through comprehensive income; (ii) measure the funded status of a plan as of the year-end date; and (iii) provide additional disclosures.
The Group adopted SFAS 158 in 2006 and has initially recognised the funded status of the defined benefit post-retirement plan and provided the required disclosures at 31st December 2006. Retrospective application was not permitted, therefore in 2005 and 2004 actuarial gains and losses were recognised using the 10% corridor approach and deferred actuarial gains and losses were amortised.
The impact of the adoption of SFAS 158 on the Group’s consolidated financial statements is disclosed in note (f) within this Note.
Accounting for uncertain tax positions
In July 2006, the FASB issued FIN 48, ‘Accounting for Uncertain Tax Positions’. FIN 48 clarifies the accounting for uncertainty in income taxes recognised in an enterprise’s financial statements under US GAAP, in accordance with SFAS 109, ‘Accounting for Income Taxes’. The interpretation prescribes a recognition threshold and measurement attribute for the financial statement recognition and measurement of a tax position taken or expected to be taken in a tax return. FIN 48 also provides guidance on derecognition, classification, interest and penalties, disclosure and transition. The Group is currently evaluating the potential impacts of FIN 48 on its US GAAP financial statements. For the Group, the interpretation will be effective from 1st January 2007.
Other Pronouncements
| • | SFAS 157 – In September 2006, the FASB issued SFAS 157, ‘Fair Value Measurements’. This Statement defines fair value, establishes a framework for measuring fair value in US GAAP, and expands disclosures about fair value measurements. The Statement refers to other accounting pronouncements that require or permit fair value measurements, the FASB having previously concluded in those accounting pronouncements that fair value is the relevant measurement attribute. This Statement does not require any new fair value measurements. For the Group, the Statement will be effective on 1st January 2008. |
| | |
| • | SFAS 159 – In February 2007, the FASB issued SFAS 159, ‘The Fair Value Option for Financial Assets and Financial Liabilities’. This Statement permits entities to choose to elect, at specified election dates, to measure eligible financial instruments at fair value. Unrealised gains and losses on items for which the fair value option has been elected would be reported in net income at each subsequent reporting date, and upfront costs and fees related to those items would be recognised in net income as incurred and not deferred. The Group is unlikely to elect to exercise the Fair Value Option. |
| | |
| • | SAB 108 – In September 2006, the SEC staff issued Staff Accounting Bulletin No. 108. SAB 108 establishes a dual approach for qualifying financial statement errors, requiring evaluation of errors under both the iron curtain and the roll-over methods. The guidance applies to the Group’s US GAAP financial information for 2006 and accordingly has been adopted by the Group. SAB 108 has had no impact on the US GAAP financial information presented in this Note. |
| |
|
| GSK Annual Report 2006 |
| 142 |
<Back to Contents
| |
| Notes to the financial statements |
| continued |
|
41 Reconciliation to US accounting principlescontinued
The following is a summary of the material adjustments to profit and shareholders’ funds which would be required if US GAAP had been applied instead of IFRS.
| Profit | | | 2006 | | 2005 | | 2004 | |
| Notes | | £m | | £m | | £m | |
|
|
|
|
|
|
|
| |
| Profit after taxation for the year under IFRS | | | 5,498 | | 4,816 | | 4,022 | |
| Profit attributable to minority interests | | | (109 | ) | (127 | ) | (114 | ) |
|
|
|
|
|
|
|
| |
| Profit attributable to shareholders under IFRS | | | 5,389 | | 4,689 | | 3,908 | |
| US GAAP adjustments: | | | | | | | | |
| Goodwill impairment | | | 10 | | – | | – | |
| Amortisation and impairment of intangible assets | b | | (1,276 | ) | (1,584 | ) | (1,441 | ) |
| Acquisition and disposal of product rights | b | | (111 | ) | (72 | ) | (210 | ) |
| Write-off of in-process R&D acquired in business combinations | b | | (14 | ) | (26 | ) | – | |
| Depreciation and impairment of other assets | | | (93 | ) | (40 | ) | (2 | ) |
| Capitalised interest | | | 4 | | (1 | ) | (17 | ) |
| Disposal of interests in associates and subsidiaries | | | – | | – | | (97 | ) |
| Investments | | | (10 | ) | (2 | ) | (30 | ) |
| Pensions and post-retirement benefits | f | | (171 | ) | (127 | ) | (126 | ) |
| Stock-based compensation | | | (26 | ) | 6 | | 13 | |
| Derivative instruments and hedging | | | 477 | | (30 | ) | 33 | |
| Fair value of put option granted to minority shareholders | c | | – | | – | | 17 | |
| Restructuring costs | | | (16 | ) | 1 | | (12 | ) |
| Tax benefits on exercise of stock options | d | | 16 | | (47 | ) | (10 | ) |
| Deferred taxation | d | | 276 | | 585 | | 757 | |
| Other | | | – | | (16 | ) | (51 | ) |
|
|
|
|
|
|
|
| |
| Net income under US GAAP before cumulative effect of change in accounting principle | | | 4,455 | | 3,336 | | 2,732 | |
| Cumulative effect of change in accounting principle | | | 10 | | – | | – | |
|
|
|
|
|
|
|
| |
| Net income under US GAAP | | | 4,465 | | 3,336 | | 2,732 | |
|
|
|
|
|
|
|
| |
| | | | | | | | | |
| Earnings per share under US GAAP | 2006 | | 2005 | | 2004 | |
| p | | p | | p | |
|
|
|
|
|
| |
| Basic net income per share before cumulative effect of change in accounting principle | 78.9 | | 58.8 | | 47.6 | |
| Cumulative effect of change in accounting principle per share | 0.2 | | – | | – | |
|
|
|
|
|
| |
| Basic net income per share after cumulative effect of change in accounting principle | 79.1 | | 58.8 | | 47.6 | |
|
|
|
|
|
| |
| Diluted net income per share before cumulative effect of change in accounting principle | 78.2 | | 58.3 | | 47.5 | |
| Cumulative effect of change in accounting principle per share | 0.2 | | – | | – | |
|
|
|
|
|
| |
| Diluted net income per share after cumulative effect of change in accounting principle | 78.4 | | 58.3 | | 47.5 | |
|
|
|
|
|
| |
| | | | | | | |
| Earnings per ADS under US GAAP | 2006 | | 2005 | | 2004 | |
| $ | | $ | | $ | |
|
|
|
|
|
| |
| Basic net income per ADS before cumulative effect of change in accounting principle | 2.92 | | 2.14 | | 1.74 | |
| Cumulative effect of change in accounting principle per ADS | 0.01 | | – | | – | |
|
|
|
|
|
| |
| Basic net income per ADS after cumulative effect of change in accounting principle | 2.93 | | 2.14 | | 1.74 | |
|
|
|
|
|
| |
| Diluted net income per ADS before cumulative effect of change in accounting principle | 2.89 | | 2.12 | | 1.74 | |
| Cumulative effect of change in accounting principle per ADS | 0.01 | | – | | – | |
|
|
|
|
|
| |
| Diluted net income per ADS after cumulative effect of change in accounting principle | 2.90 | | 2.12 | | 1.74 | |
|
|
|
|
|
| |
| |
|
| GSK Annual Report 2006 |
| 143 |
<Back to Contents
| |
| Notes to the financial statements |
| continued |
|
| |
41 Reconciliation to US accounting principlescontinued
| Equity shareholders’ funds | | | 2006 | | 2005 | | | |
| Notes | £m | £m | |
|
|
|
|
|
| | | |
| Total equity under IFRS | | | 9,648 | | 7,570 | | | |
| Minority interests | | | (262 | ) | (259 | ) | | |
|
|
|
|
|
| | | |
| Shareholders’ equity under IFRS | | | 9,386 | | 7,311 | | | |
| US GAAP adjustments: | | | | | | | | |
| Goodwill | a | | 17,949 | | 17,976 | | | |
| Product rights | b | | 10,634 | | 12,065 | | | |
| Pension intangible asset | f | | – | | 86 | | | |
| Fixed assets | | | (35 | ) | 33 | | | |
| Inventory impairment reversals | | | (54 | ) | (30 | ) | | |
| Capitalised interest | | | 183 | | 179 | | | |
| Investments | | | 500 | | 576 | | | |
| Pensions and other post-retirement benefits | f | | 35 | | 1,163 | | | |
| Restructuring costs | | | 39 | | 65 | | | |
| Derivative instruments | | | (44 | ) | (33 | ) | | |
| Dividends | | | (676 | ) | (568 | ) | | |
| Deferred taxation | e | | (3,262 | ) | (4,531 | ) | | |
| Other | | | (2 | ) | (10 | ) | | |
|
|
|
|
|
| | | |
| Shareholders’ equity under US GAAP | | | 34,653 | | 34,282 | | | |
|
|
|
|
|
| | | |
| | | | | | | |
| Consolidated statement of cash flows under US GAAP | 2006 | 2005 | 2004 |
| £m | £m | £m |
|
|
|
|
|
| |
| Net cash provided by operating activities | 4,163 | | 5,751 | | 4,618 | |
| Net cash used in investing activities | (1,752 | ) | (1,843 | ) | (988 | ) |
| Net cash used in financing activities | (4,345 | ) | (2,409 | ) | (3,038 | ) |
|
|
|
|
|
| |
| Net increase in cash and cash equivalents | (1,934 | ) | 1,499 | | 592 | |
| Exchange rate movements | (282 | ) | 237 | | (93 | ) |
| Cash and cash equivalents at beginning of year | 4,221 | | 2,485 | | 1,986 | |
|
|
|
|
|
| |
| Cash and cash equivalents at end of year | 2,005 | | 4,221 | | 2,485 | |
|
|
|
|
|
| |
| |
|
| GSK Annual Report 2006 |
| 144 |
<Back to Contents
| |
| Notes to the financial statements |
| continued |
|
| |
41 Reconciliation to US accounting principlescontinued
Notes to the Profit and Equity shareholders’ funds reconciliations
(a) Goodwill
The following tables set out the IFRS to US GAAP adjustments required to the IFRS balance sheet in respect of goodwill.
| Balance sheet | 2006 | | 2005 | | | |
| £m | £m | |
|
|
|
| | | |
| Goodwill under IFRS | 758 | | 696 | | | |
| Goodwill under US GAAP | 18,707 | | 18,672 | | | |
|
|
|
| | | |
| IFRS to US GAAP adjustments | 17,949 | | 17,976 | | | |
|
|
|
| | | |
Of the £18,707 million US GAAP goodwill balance at 31st December 2006 (2005 – £18,672 million), £15,875 million (2005 – £15,875 million) is in respect of the goodwill arising on the acquisition of SmithKline Beecham by Glaxo Wellcome in 2000.
The following table presents the changes in goodwill allocated to the Group’s reportable segments:
| | | | Consumer | | | |
| Pharmaceuticals | Healthcare | Total |
| £m | £m | £m |
|
|
|
|
|
| |
| At 1st January 2005 | 15,672 | | 2,449 | | 18,121 | |
| Additions | 528 | | – | | 528 | |
| Disposals | (1 | ) | – | | (1 | ) |
| Exchange adjustments | 5 | | 19 | | 24 | |
|
|
|
|
|
| |
| At 31st December 2005 | 16,204 | | 2,468 | | 18,672 | |
| Additions | 16 | | 116 | | 132 | |
| Exchange adjustments | (76 | ) | (21 | ) | (97 | ) |
|
|
|
|
|
| |
| At 31st December 2006 | 16,144 | | 2,563 | | 18,707 | |
|
|
|
|
|
| |
(b) Intangible assets
The following tables set out the IFRS to US GAAP adjustments required to the IFRS income statement and balance sheet in respect of intangible assets:
| Income statement | 2006 | | 2005 | | 2004 | |
| £m | £m | £m |
|
|
|
|
|
| |
| Amortisation charge under IFRS | 139 | | 109 | | 75 | |
| Amortisation charge under US GAAP | 1,454 | | 1,674 | | 1,516 | |
|
|
|
|
|
| |
| IFRS to US GAAP adjustment for amortisation | 1,315 | | 1,565 | | 1,441 | |
|
|
|
|
|
| |
| Impairment charge under IFRS | 80 | | 99 | | 26 | |
| Impairment charge under US GAAP | 41 | | 118 | | 26 | |
|
|
|
|
|
| |
| IFRS to US GAAP adjustment for impairment | (39 | ) | 19 | | – | |
|
|
|
|
|
| |
In addition to the above adjustments for amortisation and impairments, further IFRS to US GAAP adjustments arose during the year of £125 million (2005 – £98 million; 2004 – £173 million) in respect of the acquisition and disposal of in-process R&D, licences, patents etc. which are capitalised under IFRS but charged directly to research and development expense under US GAAP, and £nil (2005 – £nil; 2004 – £37 million) in respect of disposals of product rights which have a higher carrying value under US GAAP than under IFRS.
| |
|
| GSK Annual Report 2006 |
| 145 |
<Back to Contents
| |
| Notes to the financial statements |
| continued |
|
| |
41 Reconciliation to US accounting principlescontinued
| Balance sheet | 2006 | | 2005 | |
| £m | £m |
|
|
|
| |
| Product rights intangible assets under IFRS | 3,046 | | 3,120 | |
| Product rights intangible assets under US GAAP | 13,680 | | 15,185 | |
|
|
|
| |
| Net IFRS to US GAAP adjustment for product rights intangible assets | 10,634 | | 12,065 | |
|
|
|
| |
Product rights intangible assets under US GAAP are analysed as follows:
| 2006 | Acquired products, | | Brands subject | | Indefinite | | | |
| licences, patents, etc. | to amortisation | lived brands | Total |
| £m | £m | £m | £m |
|
|
|
|
|
|
|
| |
| Cost | 21,249 | | 1,096 | | 4,811 | | 27,156 | |
| Accumulated amortisationand impairment | (12,606 | ) | (210 | ) | (660 | ) | (13,476 | ) |
|
|
|
|
|
|
|
| |
| Carrying value | 8,643 | | 886 | | 4,151 | | 13,680 | |
|
|
|
|
|
|
|
| |
| | | | | | | | | |
| 2005 | £m | | £m | | £m | | £m | |
|
|
|
|
|
|
|
| |
| Cost | 21,369 | | 1,096 | | 4,722 | | 27,187 | |
| Accumulated amortisationand impairment | (11,187 | ) | (185 | ) | (630 | ) | (12,002 | ) |
|
|
|
|
|
|
|
| |
| Carrying value | 10,182 | | 911 | | 4,092 | | 15,185 | |
|
|
|
|
|
|
|
| |
The acquired products, licences and patents are pharmaceutical products, principally arising from the acquisition of SmithKline Beecham plc, and consumer healthcare products with book values net of accumulated amortisation and impairment as follows:
| | 2006 | | 2005 | |
| £m | £m |
|
|
|
| |
| Avandia | 3,492 | | 3,841 | |
| Seroxat/Paxil | 940 | | 1,410 | |
| Augmentin | 966 | | 1,142 | |
| Fluviral | 571 | | 683 | |
| Havrix | 338 | | 363 | |
| Infanrix | 275 | | 294 | |
| Fraxiparine | 222 | | 239 | |
| Twinrix | 219 | | 235 | |
| Engerix-B | 209 | | 224 | |
| Hycamtin | 177 | | 212 | |
| Coreg | 122 | | 240 | |
| Others | 1,112 | | 1,299 | |
|
|
|
| |
| Acquired products, licences, patents etc. intangible assets under US GAAP | 8,643 | | 10,182 | |
|
|
|
| |
The indefinite lived brands relate to a large number of Consumer Healthcare products, principally arising from the acquisitions of SmithKline Beecham plc (including products previously acquired by SmithKline Beecham from Sterling Winthrop Inc.) and the Block Drug Company, with book values as follows:
| | 2006 | | 2005 | |
| £m | £m |
|
|
|
| |
| Panadol | 683 | | 730 | |
| Aquafresh | 347 | | 347 | |
| Lucozade | 324 | | 324 | |
| Horlicks | 319 | | 319 | |
| Ribena | 309 | | 309 | |
| Nicorette | 292 | | 292 | |
| Odol | 228 | | 228 | |
| Tums | 226 | | 226 | |
| Nicoderm | 224 | | 224 | |
| Sensodyne | 216 | | 225 | |
| Others | 983 | | 868 | |
|
|
|
| |
| Indefinite lived brands intangible assets under US GAAP | 4,151 | | 4,092 | |
|
|
|
| |
| |
|
| GSK Annual Report 2006 |
| 146 |
<Back to Contents
| |
| Notes to the financial statements |
| continued |
|
| |
41 Reconciliation to US accounting principlescontinued
Each of these brands is considered to have an indefinite life, given the strength and durability of the brand and the level of marketing support. The brands are in relatively stable and profitable market sectors, and their size, diversification and market shares mean that the risk of market-related factors causing a shortening of the brands’ lives is considered to be relatively low. The Group is not aware of any material legal, regulatory, contractual, competitive, economic or other factor which could limit their useful lives. Accordingly, they are not amortised. Each brand is tested annually for impairment applying a fair value less costs to sell methodology and using five year post-tax cash flow forecasts with a terminal value calculation and applying a discount rate of the Group post-tax weighted average cost of capital of 8%, adjusted where appropriate for country-specific risks.
The carrying values of certain intangibles subject to amortisation were reviewed and an impairment of £6 million (2005 – £68 million) has been recorded. Of this, £6 million (2005 – £46 million) relates to pharmaceutical products and £nil (2005 – £22 million) to Consumer Healthcare products. An impairment charge in respect of Consumer Healthcare intangible assets not subject to amortisation of £35 million was recognised during 2006 (2005 – £50 million).
As discussed in Note 43 ‘Legal proceedings’, a number of distributors of generic drugs have filed applications to market generic versions of a number of the Group’s products prior to the expiration of the Group’s patents. If generic versions of products are launched in future periods at earlier dates than the Group currently expects, impairments of the carrying value of the products may arise.
The estimated future amortisation expense for the next five years for intangible assets subject to amortisation as of 31st December 2006 is as follows:
| Year | | £m | |
|
|
| |
| 2007 | | 1,424 | |
| 2008 | | 1,241 | |
| 2009 | | 865 | |
| 2010 | | 846 | |
| 2011 | | 815 | |
|
|
| |
| Total | | 5,191 | |
|
|
| |
In-process R&D of £14 million (2005 – £26 million; 2004 – £nil) arising on the acquisitions of CNS and Pliva in 2006 and ID Biomedical and Corixa in 2005 has been written off. This has been valued on the same basis as the other intangible assets acquired and relates to various development projects in the pre-approval stage where the technological feasibility of the projects had not been established at the point of acquisition.
(c) Theravance
In May 2004, the Group formed a strategic alliance with Theravance Inc. to develop and commercialise novel medicines across a variety of important therapeutic areas. Under the terms of the alliance, Theravance received $129 million, a significant part of which related to the Group’s purchase of Theravance shares. The Group has a call option in 2007 to further increase its ownership to over 50% at a significant premium to the price paid in the 2004 transaction. Theravance’s other shareholders have a put option at a lower exercise price to cause GlaxoSmithKline to acquire up to half of the outstanding stock in 2007. Given the maximum number of shares subject to the put option, the Group’s obligation is capped at $525 million. The Group has an exclusive option to license potential new medicines from all of Theravance’s programmes until August 2007. Upon exercising its option over a Theravance programme, the Group will be responsible for the relevant development, manufacturing and commercialisation activities. Depending on the success of such programmes, Theravance will receive clinical, regulatory and commercial milestone payments and royalties on the subsequent sales of medicines. Based on the assessment performed in May 2004, the Group was the primary beneficiary of Theravance, as defined by FIN 46R, and as a result Theravance was consolidated into the Group’s US GAAP financial statements from that date. The net assets acquired were measured at fair value. The principal adjustment to the carrying value of the net assets in Theravance’s balance sheet prior to the acquisition was recognition of in-process research and development (IPR&D) at a valuation of £273 million. The IPR&D was written off immediately after the acquisition in accordance with US GAAP purchase accounting.
In February 2006, Theravance completed a secondary offering of common stock, which is a reconsideration event as defined by FIN 46R. The assessment at this date indicated that the Group is no longer the primary beneficiary of Theravance’s variable interests. Accordingly, Theravance has been de-consolidated from the Group’s results under US GAAP since February 2006.
Additionally, the Group previously accounted for the Theravance put option discussed above in accordance with SFAS 150, ‘Accounting for Certain Financial Instruments with Characteristics of both Liabilities and Equity’, which requires the Group to record the fair value of the put option as a liability. Since Theravance ceased to be a subsidiary of the Group under FIN 46R in February 2006, the put option has been accounted for in accordance with SFAS 133, ‘Accounting for Derivative Instruments and Hedging Activities’. This also requires the fair value of the put option to be recorded as a liability. The fair value of the Theravance put option at 31st December 2006 is £10 million (2005 – £47 million). In accordance with SFAS 133, the call option is not recognised in the financial statements as it is not readily convertible into cash.
| |
|
| GSK Annual Report 2006 |
| 147 |
<Back to Contents
| |
| Notes to the financial statements |
| continued |
|
| |
41 Reconciliation to US accounting principlescontinued
| (d) Taxation | | | | | | |
| 2006 | 2005 | 2004 |
| Total tax expense | £m | | £m | | £m | |
|
|
|
|
|
| |
| IFRS: | | | | | | |
| Current tax expense | 2,710 | | 2,019 | | 1,667 | |
| Deferred tax (credit)/expense | (409 | ) | (103 | ) | 90 | |
|
|
|
|
|
| |
| Total tax expense | 2,301 | | 1,916 | | 1,757 | |
|
|
|
|
|
| |
| US GAAP: | | | | | | |
| Current tax expense | 2,735 | | 2,103 | | 1,717 | |
| Deferred tax credit | (685 | ) | (688 | ) | (667 | ) |
|
|
|
|
|
| |
| Total tax expense | 2,050 | | 1,415 | | 1,050 | |
|
|
|
|
|
| |
| IFRS to US GAAP adjustments: | | | | | | |
| Current tax expense | 25 | | 84 | | 50 | |
| Deferred tax credit | (276 | ) | (585 | ) | (757 | ) |
|
|
|
|
|
| |
| Total tax expense | (251 | ) | (501 | ) | (707 | ) |
|
|
|
|
|
| |
The IFRS to US GAAP adjustment in respect of current tax expense includes £41 million (2005 – £37 million; 2004 – £40 million) for the Group’s share of the tax expense of associates. This is recognised in the Taxation charge in the income statement under US GAAP but recorded in Share of after tax profits of associates in the income statement presented in accordance with IFRS.
| (e) Deferred taxation under US GAAP | 2006 | | 2005 | | | |
| £m | £m | |
|
|
|
| | | |
| Liabilities | | | | | | |
| Stock valuation adjustment | (44 | ) | (42 | ) | | |
| Other timing differences | 20 | | 63 | | | |
|
|
|
| | | |
| Current deferred taxation liabilities | (24 | ) | 21 | | | |
|
|
|
| | | |
| Accelerated capital allowances | (564 | ) | (187 | ) | | |
| Product rights | (3,563 | ) | (4,035 | ) | | |
| Product and business disposals | (1 | ) | 13 | | | |
| Pensions and other post-retirement benefits | 317 | | 25 | | | |
| Tax losses | 80 | | – | | | |
| Legal and other disputes | 6 | | – | | | |
| Manufacturing restructuring | 37 | | – | | | |
| Share option and award schemes | 62 | | – | | | |
| Other timing differences | 8 | | 25 | | | |
| Valuation allowances | (46 | ) | – | | | |
|
|
|
| | | |
| Total deferred taxation liabilities | (3,688 | ) | (4,138 | ) | | |
|
|
|
| | | |
| Assets | | | | | | |
| Intra-Group profit | 696 | | 619 | | | |
| Stock valuation adjustment | (28 | ) | (72 | ) | | |
| Other timing differences | 360 | | 614 | | | |
|
|
|
| | | |
| Current deferred taxation assets | 1,028 | | 1,161 | | | |
|
|
|
| | | |
| Accelerated capital allowances | (33 | ) | (492 | ) | | |
| Product rights | (49 | ) | (9 | ) | | |
| Pensions and other post-retirement benefits | 410 | | 43 | | | |
| Tax losses | 1,205 | | 125 | | | |
| Restructuring | 26 | | 53 | | | |
| Legal and other disputes | 147 | | 160 | | | |
| Share option and award schemes | 233 | | 276 | | | |
| Other timing differences | 128 | | (3 | ) | | |
| Valuation allowances | (1,141 | ) | (62 | ) | | |
|
|
|
| | | |
| Total deferred taxation assets | 1,954 | | 1,252 | | | |
|
|
|
| | | |
| |
|
| GSK Annual Report 2006 |
| 148 |
<Back to Contents
| |
| Notes to the financial statements |
| continued |
|
| |
41 Reconciliation to US accounting principlescontinued
| (e) Deferred taxation under US GAAPcontinued | 2006
| | 2005
| | | |
| £m | | £m | | | |
| | | |
| Net deferred taxation under US GAAP | (1,734 | ) | (2,886 | ) | | |
| Net deferred taxation under IFRS | 1,528 | | 1,645 | | | |
| | | |
| IFRS to US GAAP adjustment | (3,262 | ) | (4,531 | ) | | |
| | | |
(f) Pensions and post-retirement costs under US GAAP
| | 2006
| | 2005
| | 2004
| |
| | £m | | £m | | £m | |
| |
| UK pension schemes | 258 | | 218 | | 225 | |
| US pension schemes | 61 | | 55 | | 54 | |
| Other overseas pension schemes | 102 | | 87 | | 77 | |
| Unfunded post-retirement healthcare schemes | 127 | | 114 | | 96 | |
| Post-employment costs | 1 | | 2 | | 18 | |
| |
| | 549 | | 476 | | 470 | |
| |
| Analysed as: | | | | | | |
| Funded defined benefit/hybrid schemes | 363 | | 306 | | 298 | |
| Unfunded defined benefit schemes | 30 | | 29 | | 37 | |
| Defined contribution schemes | 28 | | 25 | | 21 | |
| Unfunded post-retirement healthcare schemes | 127 | | 114 | | 96 | |
| Post-employment costs | 1 | | 2 | | 18 | |
| |
| | 549 | | 476 | | 470 | |
| |
The disclosures below include the additional information required by SFAS 132R and SFAS 158. The pension costs of the UK, US and major overseas defined benefit pension plans have been restated in the following tables in accordance with US GAAP. Minor retirement plans with pension costs in 2006 of £5 million (2005 – £8 million; 2004 – £5 million), have not been recalculated in accordance with the requirements of SFAS 87, and have been excluded.
| Net periodic pension cost for the major retirement plans | 2006
| | 2005
| | 2004
| |
| £m | | £m | | £m | |
| |
| Service cost | 247 | | 223 | | 213 | |
| Interest cost | 448 | | 408 | | 400 | |
| Expected return on plan assets | (491 | ) | (444 | ) | (431 | ) |
| Amortisation of prior service cost | 16 | | 13 | | 14 | |
| Amortisation of transition obligation | 2 | | 2 | | 2 | |
| Amortisation of net actuarial loss | 146 | | 107 | | 115 | |
| |
| Net periodic pension cost under US GAAP | 368 | | 309 | | 313 | |
| |
| Termination benefits and curtailment costs | 19 | | 19 | | 13 | |
| |
The assumptions used under IAS 19 within Note 26, are similar to those disclosed in the following table, which are presented on a weighted average basis.
| Major assumptions used in computing pension costs | 2006
| | 2005
| | 2004
| |
| % pa | | % pa | | % pa | |
| |
| Rates of future pay increases | 4.25 | | 4.00 | | 4.25 | |
| Discount rate | 5.00 | | 4.75 | | 5.25 | |
| Expected long-term rates of return on plan assets | 6.75 | | 6.75 | | 7.00 | |
| |
In aggregate, average international plan assumptions did not vary significantly from US assumptions.
| Estimated future benefit payments | £m | |
| |
| 2007 | 355 | |
| 2008 | 368 | |
| 2009 | 385 | |
| 2010 | 400 | |
| 2011 | 416 | |
| 2012–2016 | 2,386 | |
| |
| |
|
| GSK Annual Report 2006 |
| 149 |
Back to Contents
| |
| Notes to the financial statements |
| continued |
|
| |
41 Reconciliation to US accounting principlescontinued
| Change in benefit obligation | 2006
| | 2005
| | | |
| £m | | £m | | | |
| | | |
| Benefit obligation at 1st January | (9,997 | ) | (8,171 | ) | | |
| Amendments | (36 | ) | (1 | ) | | |
| Service cost | (247 | ) | (223 | ) | | |
| Interest cost | (448 | ) | (408 | ) | | |
| Plan participants’ contributions | (14 | ) | (15 | ) | | |
| Actuarial loss | (43 | ) | (1,334 | ) | | |
| Benefits paid | 368 | | 372 | | | |
| Termination benefits and curtailment costs | (17 | ) | (15 | ) | | |
| Exchange adjustments | 263 | | (202 | ) | | |
| | | |
| Benefit obligation at 31st December | (10,171 | ) | (9,997 | ) | | |
| | | |
| Benefit obligation at 31st December for pension plans with accumulated benefit | | | | | | |
| obligations in excess of plan assets | (6,643 | ) | (8,748 | ) | | |
| | | |
The accumulated benefit obligation at 31st December 2006 was £9,385 million (31st December 2005 – £9,294 million).
| Change in plan assets | 2006
| | 2005
| | | |
| £m | | £m | | | |
| | | |
| Fair value of plan assets at 1st January | 8,298 | | 6,690 | | | |
| Actual return on plan assets | 867 | | 1,113 | | | |
| Employer contributions | 592 | | 661 | | | |
| Plan participants’ contributions | 14 | | 15 | | | |
| Benefits paid | (368 | ) | (372 | ) | | |
| Exchange adjustments | (262 | ) | 191 | | | |
| | | |
| Fair value of plan assets at 31st December | 9,141 | | 8,298 | | | |
| | | |
| Fair value of plan assets at end of year for pension plans with accumulated benefit | | | | | | |
| obligations in excess of plan assets | 6,214 | | 7,735 | | | |
| | | |
Plan assets consist primarily of investments in UK and overseas equities, fixed interest securities, index-linked securities and property. At 31st December 2006 UK equities included 0.1 million GSK shares (2005 – 1.9 million shares) with a market value of £1 million (2005 – £28 million). An analysis of the proportions of total plan assets for each major category is disclosed in Note 26. That analysis includes assets valued at £125 million in minor retirement plans, which have been excluded from these US GAAP tables.
| Funded status before adoption of SFAS 158 | 2006
| | 2005
| | | |
| £m | | £m | | | |
| | | |
| Funded status | (1,030 | ) | (1,699 | ) | | |
| Unrecognised net actuarial loss | 1,966 | | 2,499 | | | |
| Unrecognised prior service cost | 81 | | 60 | | | |
| Unrecognised transition obligation | 16 | | 21 | | | |
| | | |
| Net amount recognised before adoption of SFAS 158 | 1,033 | | 881 | | | |
| | | |
| | | | | | | |
| Amounts recognised in the statement of financial position before adoption of SFAS 158 | 2006
| | 2005
| | | |
| £m | | £m | | | |
| | | |
| Prepaid benefit cost | 423 | | 8 | | | |
| Accrued pension liability | (460 | ) | (1,027 | ) | | |
| Intangible asset | 100 | | 86 | | | |
| Accumulated other comprehensive income | 970 | | 1,814 | | | |
| | | |
| Net amount recognised before adoption of SFAS 158 | 1,033 | | 881 | | | |
| | | |
| |
|
| GSK Annual Report 2006 |
| 150 |
<Back to Contents
| |
| Notes to the financial statements |
| continued |
|
| |
41 Reconciliation to US accounting principlescontinued
| Amount recognised in the statement of financial position | Before
| | Incremental
| | After
| |
| adoption | | effect | | adoption | |
| of SFAS 158 | | of SFAS 158 | | of SFAS 158 | |
| £m | | £m | | £m | |
| |
| Prepaid/accrued | (37 | ) | (993 | ) | (1,030 | ) |
| Intangible asset | 100 | | (100 | ) | – | |
| Deferred tax asset | 319 | | – | | 319 | |
| Accumulated other comprehensive income, net of deferred tax | 651 | | 1,093 | | 1,744 | |
| |
| At 31st December 2006 | 1,033 | | – | | 1,033 | |
| |
| | | |
| Amounts estimated to be recognised in net periodic pension cost in 2007 | Total
| |
| £m | |
| |
| Net actuarial loss | 108 | |
| Prior service cost | 17 | |
| Transition obligation | 2 | |
| |
| | 127 | |
| |
Post-retirement healthcare under US GAAP
The post-retirement healthcare costs of the UK, US and major overseas post-retirement healthcare schemes have been restated in the following tables in accordance with US GAAP. Minor healthcare plans with costs in 2006 of £8 million (2005 – £5 million; 2004 – £nil) have not been recalculated and have been excluded.
| Net healthcare cost | 2006
| | 2005
| | 2004
| |
| £m | | £m | | £m | |
| |
| Service cost | 35 | | 37 | | 32 | |
| Interest cost | 62 | | 57 | | 55 | |
| Amortisation of prior service cost | (1 | ) | (2 | ) | (1 | ) |
| Amortisation of net actuarial loss | 22 | | 15 | | 11 | |
| |
| Net healthcare cost | 118 | | 107 | | 97 | |
| |
| | | | | | | |
| The major assumptions used in calculating the net healthcare cost were: | %pa | | %pa | | %pa | |
| |
| Rate of future healthcare inflation | 9.25 to 5.0 | | 10.0 to 5.0 | | 9.0 to 5.0 | |
| Discount rate | 5.75 | | 5.50 | | 5.75 | |
| |
| Change in benefit obligation | | | | | | |
2006
| | 2005
| | | |
| £m | | £m | | | |
| | | |
| Benefit obligation at 1st January | 1,211 | | 965 | | | |
| Amendments | (16 | ) | – | | | |
| Service cost | 35 | | 37 | | | |
| Interest cost | 62 | | 57 | | | |
| Plan participants’ contributions | 8 | | 8 | | | |
| Actuarial (gain)/loss | (117 | ) | 82 | | | |
| Benefits paid | (53 | ) | (43 | ) | | |
| Exchange | (102 | ) | 105 | | | |
| | | |
| Benefit obligation at 31st December | 1,028 | | 1,211 | | | |
| | | |
| | | | | | | |
| Change in plan assets | | | | | | |
| | | |
| Fair value of plan assets at 1st January | – | | – | | | |
| Employer and plan participants’ contributions | 53 | | 43 | | | |
| Benefits paid | (53 | ) | (43 | ) | | |
| | | |
| Fair value of plan assets at 31st December | – | | – | | | |
| | | |
| |
|
| GSK Annual Report 2006 |
| 151 |
<Back to Contents
| |
| Notes to the financial statements |
| continued |
|
| |
41 Reconciliation to US accounting principlescontinued
| Funded status before adoption of SFAS 158 | 2006
| | 2005
| | | |
| £m | | £m | | | |
| | | |
| Funded status | (1,028 | ) | (1,211 | ) | | |
| Unrecognised net actuarial loss | 265 | | 450 | | | |
| Unrecognised prior service cost | (27 | ) | (14 | ) | | |
| | | |
| Accrued post-retirement healthcare cost before adoption of SFAS 158 | (790 | ) | (775 | ) | | |
| | | |
| | | | | | | |
| Amount recognised in the statement of financial position before adoption of SFAS 158 | | | | | | |
| | | |
| Accrued benefit cost | (790 | ) | (775 | ) | | |
| | | |
| Accrued post-retirement healthcare cost before adoption of SFAS 158 | (790 | ) | (775 | ) | | |
| | | |
| | | | | | | |
| Amount recognised in the statement of financial position | Before
| | Incremental
| | After
| |
| adoption | | effect | | adoption | |
| of SFAS 158 | | of SFAS 158 | | of SFAS 158 | |
| £m | | £m | | £m | |
| |
| Prepaid/accrued | (790 | ) | (238 | ) | (1,028 | ) |
| Deferred tax asset | 408 | | – | | 408 | |
| Accumulated other comprehensive income, net of deferred tax | (408 | ) | 238 | | (170 | ) |
| |
| At 31st December 2006 | (790 | ) | – | | (790 | ) |
| |
| | | |
| Amounts estimated to be recognised in net periodic pension cost in 2007 | Total
| |
| £m | |
| |
| Net actuarial loss | 13 | |
| Prior service cost | (2 | ) |
| |
| | 11 | |
| |
| | | | | |
| Impact of a 1% variation in the assumed rate of future healthcare inflation | 1% decrease
| | 1% increase
| |
| £m | | £m | |
| |
| Effect on total service and interest cost for post-retirement healthcare | (7 | ) | 8 | |
| Effect on obligation for post-retirement healthcare | (75 | ) | 89 | |
| |
| | | | | | | |
| Estimated future benefit payments | | | Medicare
| |
| |
Gross
| | subsidy | | Net | |
| £m | | £m | | £m | |
| |
| 2007 | 46 | | (3 | ) | 43 | |
| 2008 | 50 | | (4 | ) | 46 | |
| 2009 | 55 | | (4 | ) | 51 | |
| 2010 | 59 | | (5 | ) | 54 | |
| 2011 | 62 | | (5 | ) | 57 | |
| 2012-2016 | 354 | | (33 | ) | 321 | |
| |
| |
|
| GSK Annual Report 2006 |
| 152 |
Back to Contents
| |
| Notes to the financial statements |
| continued |
|
| |
42 Principal Group companies
The following represent the principal subsidiary and associated undertakings of the GlaxoSmithKline Group at 31st December 2006. Details are given of the principal country of operation, the location of the headquarters, the business segment and the business activities. The equity share capital of these undertakings is wholly owned by the Group except where its percentage interest is shown otherwise. All companies are incorporated in their principal country of operation except where stated.
| Europe | | Location | | Subsidiary undertaking | | Segment | | Activity | | % | |
|
|
| |
| England | | Brentford | | +GlaxoSmithKline Holdings Limited | | Ph,CH | | h | | | |
| | | Brentford | | +GlaxoSmithKline Holdings (One) Limited | | Ph,CH | | h | | | |
| | | Brentford | | +GlaxoSmithKline Services Unlimited | | Ph,CH | | s | | | |
| | | Brentford | | GlaxoSmithKline Finance plc | | Ph,CH | | f | | | |
| | | Brentford | | GlaxoSmithKline Capital plc | | Ph | | f | | | |
| | | Brentford | | SmithKline Beecham p.l.c. | | Ph,CH | | d e h m p r | | | |
| | | Brentford | | Wellcome Limited | | Ph,CH | | h | | | |
| | | Greenford | | Glaxo Group Limited | | Ph | | h | | | |
| | | Greenford | | Glaxo Operations UK Limited | | Ph | | p | | | |
| | | Brentford | | Glaxo Wellcome International B.V. (i) | | Ph,CH | | h | | | |
| | | Brentford | | Glaxo Wellcome Investments B.V. (i) | | Ph,CH | | h | | | |
| | | Stockley Park | | Glaxo Wellcome UK Limited | | Ph | | h m p | | | |
| | | Brentford | | GlaxoSmithKline Export Limited | | Ph | | e | | | |
| | | Brentford | | GlaxoSmithKline Research & Development Limited | | Ph | | d r | | | |
| | | Brentford | | GlaxoSmithKline UK Limited | | Ph | | m p | | | |
| | | Brentford | | SmithKline Beecham (Investments) Limited | | Ph,CH | | f | | | |
| | | Brentford | | SmithKline Beecham (SWG) Limited | | CH | | e m | | | |
| | | Brentford | | Setfirst Limited | | Ph,CH | | h | | | |
| | | Greenford | | The Wellcome Foundation Limited | | Ph | | p | | | |
|
|
| |
| Austria | | Vienna | | GlaxoSmithKline Pharma G.m.b.H | | Ph | | m | | | |
|
|
| |
| Belgium | | Genval | | GlaxoSmithKline S.A. | | Ph | | m | | | |
| | | Rixensart | | GlaxoSmithKline Biologicals S.A. | | Ph | | d e m p r | | | |
| | | Rixensart | | GlaxoSmithKline Biologicals Manufacturing S.A. | | Ph | | h | | | |
|
|
| |
| Czech Republic | | Prague | | GlaxoSmithKline s.r.o. | | Ph,CH | | m | | | |
|
|
| |
| Denmark | | Ballerup | | GlaxoSmithKline Consumer Healthcare A/S | | CH | | m | | | |
| | | Brøndby | | GlaxoSmithKline Pharma A/S | | Ph | | m | | | |
|
|
| |
| Finland | | Espoo | | GlaxoSmithKline Oy | | Ph | | m | | | |
|
|
| |
| France | | Marly le Roi | | Groupe GlaxoSmithKline S.A.S. | | Ph | | h | | | |
| | | Marly le Roi | | Laboratoire GlaxoSmithKline S.A.S. | | Ph | | m | | | |
| | | Marly le Roi | | Glaxo Wellcome Production S.A.S. | | Ph | | m p | | | |
| | | Marly le Roi | | GlaxoSmithKline Sante Grand Public S.A.S. | | CH | | m | | | |
|
|
| |
| Germany | | Buehl | | GlaxoSmithKline Consumer Healthcare GmbH & Co. KG | | CH | | d h m p r s | | | |
| | | Munich | | GlaxoSmithKline Pharma GmbH | | Ph | | h | | | |
|
|
| |
| Greece | | Athens | | GlaxoSmithKline A.E.B.E | | Ph,CH | | h m | | | |
|
|
| |
| Guernsey | | St. Peter Port | | SmithKline Beecham Limited | | Ph,CH | | i | | | |
| | | St. Peter Port | | Setfirst (No.2) Limited | | Ph,CH | | h | | | |
|
|
| |
| Hungary | | Budapest | | GlaxoSmithKline Medicine and Healthcare Products Limited | | Ph,CH | | e m | | | |
|
|
| |
| Italy | | Verona | | GlaxoSmithKline S.p.A. | | Ph | | d h m r | | | |
| | | Milan | | GlaxoSmithKline Consumer Healthcare S.p.A. | | CH | | h m | | | |
|
|
| |
| Luxembourg | | Mamer | | GlaxoSmithKline International (Luxembourg) S.A. | | Ph,CH | | f h | | | |
|
|
| |
| |
|
| GSK Annual Report 2006 |
| 153 |
<Back to Contents
| |
| Notes to the financial statements |
| continued |
|
| |
42 Principal Group companiescontinued
| Europe | | Location | | Subsidiary undertaking | | Segment | | Activity | | % | |
|
| Netherlands | | Zeist | | GlaxoSmithKline B.V. | | Ph | | m | | | |
| | | Zeist | | GlaxoSmithKline Consumer Healthcare B.V. | | CH | | m | | | |
|
| Norway | | Oslo | | GlaxoSmithKline AS | | Ph | | m | | | |
|
| Poland | | Poznan | | GlaxoSmithKline Pharmaceuticals S.A. | | Ph | | m p | | 97 | |
| | | Poznan | | GSK Services Sp.z.o.o | | Ph | | m | | | |
| | | Warsaw | | GlaxoSmithKline Consumer Healthcare Sp.z.o.o. | | CH | | m e | | | |
|
| Portugal | | Alges | | GlaxoSmithKline-Produtos Farmaceuticos, Limitada | | Ph | | m | | | |
|
| Republic of | | Carrigaline | | SmithKline Beecham (Cork) Limited (ii) | | Ph | | p | | | |
| Ireland | | Carrigaline | | GlaxoSmithKline Trading Services Limited (ii) | | Ph | | e | | | |
| | | Dublin | | GlaxoSmithKline Consumer Healthcare (Ireland) Limited (ii) | | CH | | m | | | |
|
| Russian | | Moscow | | GlaxoSmithKline Trading | | Ph | | m | | | |
| Federation | | | | | | | | | | | |
|
| Spain | | Madrid | | GlaxoSmithKline S.A. | | Ph | | m p | | | |
| | | Madrid | | GlaxoSmithKline Consumer Healthcare S.A. | | CH | | m | | | |
|
| Sweden | | Solna | | GlaxoSmithKline AB | | Ph | | m | | | |
|
| Switzerland | | Muenchenbuchsee | | GlaxoSmithKline AG | | Ph | | m | | | |
|
| USA | | | | | | | | | | | |
|
| USA | | Hamilton | | Corixa Corporation | | Ph | | m p | | | |
| | | Minneapolis | | CNS, Inc. | | CH | | m p | | | |
| | | Philadelphia | | SmithKline Beecham Corporation | | Ph,CH | | d e h m p r s | | | |
| | | Pittsburgh | | GlaxoSmithKline Consumer Healthcare, L.P. | | CH | | m p | | 88 | |
| | | Pittsburgh | | Block Drug Company, Inc. | | CH | | h m p | | | |
| | | Wilmington | | GlaxoSmithKline Holdings (Americas) Inc. | | Ph,CH | | h | | | |
|
| Americas | | | | | | | | | | | |
|
| Bermuda | | Hamilton | | GlaxoSmithKline Insurance Ltd | | Ph,CH | | i | | | |
|
| Canada | | Mississauga | | GlaxoSmithKline Inc. | | Ph | | m p r | | | |
| | | Oakville | | GlaxoSmithKline Consumer Healthcare Inc. | | CH | | m | | | |
| | | Laval | | ID Biomedical Corporation | | Ph | | d m p r | | | |
|
| Asia Pacific | | | | | | | | | | | |
|
| Australia | | Boronia | | Glaxo Wellcome Australia Pty Ltd | | Ph,CH | | d e m p r | | | |
|
| China | | Hong Kong | | GlaxoSmithKline Limited | | Ph,CH | | m | | | |
| | | Tianjin | | Sino-American Tianjin Smith Kline & French Laboratories Ltd | | Ph | | d m p r | | 55 | |
|
| India | | Mumbai | | GlaxoSmithKline Pharmaceuticals Limited | | Ph | | m p | | 51 | |
| | | Nabha | | GlaxoSmithKline Consumer Healthcare Limited (iii) | | CH | | m p | | 43 | |
|
| Malaysia | | Petaling Jaya | | GlaxoSmithKline Pharmaceutical Sdn Bhd | | Ph | | m | | | |
|
| New Zealand | | Auckland | | GlaxoSmithKline NZ Limited | | Ph,CH | | m | | | |
|
| Pakistan | | Karachi | | GlaxoSmithKline Pakistan Limited | | Ph,CH | | m p e | | 79 | |
|
| Philippines | | Makati | | GlaxoSmithKline Philippines Inc | | Ph,CH | | m | | | |
|
| Singapore | | Singapore | | Glaxo Wellcome Manufacturing Pte Ltd | | Ph | | p | | | |
| | | Singapore | | GlaxoSmithKline Pte Ltd | | Ph | | m | | | |
|
| South Korea | | Seoul | | GlaxoSmithKline Korea | | Ph | | m p | | | |
|
| Taiwan | | Taipei | | Glaxo Wellcome Taiwan Limited | | Ph | | m p | | | |
|
| |
|
| GSK Annual Report 2006 |
| 154 |
<Back to Contents
| |
| Notes to the financial statements |
| continued |
|
| |
42 Principal Group companiescontinued
| Japan | | Location | | Subsidiary undertaking | | Segment | | Activity | | % | |
|
| Japan | | Tokyo | | GlaxoSmithKline K.K. | | Ph,CH | | d m p r | | | |
|
| Latin America | | | | | | | | | | | |
|
| Argentina | | Buenos Aires | | GlaxoSmithKline Argentina S.A. | | Ph,CH | | m p | | | |
|
| Brazil | | Rio de Janeiro | | GlaxoSmithKline Brasil Ltda | | Ph,CH | | m p | | | |
|
| Colombia | | Bogota | | GlaxoSmithKline Colombia S.A. | | Ph,CH | | m | | | |
|
| Mexico | | Delegacion Tlalpan | | GlaxoSmithKline Mexico S.A. de C.V. | | Ph,CH | | e m p s | | | |
|
| Puerto Rico | | Guaynabo | | GlaxoSmithKline Puerto Rico Inc. | | Ph | | m | | | |
| | | San Juan | | SB Pharmco Puerto Rico Inc. | | Ph | | p | | | |
|
| Venezuela | | Caracas | | GlaxoSmithKline Venezuela C.A. | | Ph,CH | | m | | | |
|
| Middle East & | | | | | | | | | | | |
| Africa | | | | | | | | | | | |
|
| Egypt | | Cairo | | GlaxoSmithKline S.A.E | | Ph | | m p | | 91 | |
|
| South Africa | | Bryanston | | GlaxoSmithKline South Africa (Pty) Ltd | | Ph,CH | | m p | | | |
|
| Turkey | | Istanbul | | GlaxoSmithKline Ilaclari Sanayi ve Ticaret A.S. | | Ph | | m p | | | |
|
| USA | | Location | | Associated undertaking | | Business | | | | % | |
|
| USA | | Teterboro | | Quest Diagnostics Incorporated (iv) | | Clinical testing | | | | 19 | |
|
| i) | Incorporated in the Netherlands. |
| |
| ii) | Exempt from the provisions of Section 7 of the Companies (Amendment) Act 1986 (Ireland). |
| |
| iii) | Consolidated as a subsidiary undertaking in accordance with Section 258 (4)(a) of the Companies Act on the grounds of dominant influence. |
| |
| iv) | Equity accounted on the grounds of significant influence. |
| |
| + | Directly held wholly owned subsidiary of GlaxoSmithKline plc. |
| | |
| | |
| | |
| | |
| Key | |
| | |
| Business segment: | Ph Pharmaceuticals, CH Consumer Healthcare |
| | |
| Business activity: | d development, e exporting, f finance, h holding company, i insurance, m marketing, p production, r research, s service |
| | |
| Full details of all Group subsidiary and associated undertakings will be attached to the company’s Annual Return to be filed with the Registrar of Companies. |
| |
|
| GSK Annual Report 2006 |
| 155 |
Back to Contents
| |
| Notes to the financial statements |
| continued |
|
| |
43 Legal proceedings
The Group is involved in significant legal and administrative proceedings, principally product liability, intellectual property, tax, antitrust and governmental investigations and related private litigation. The Group makes provision for these proceedings on a regular basis as summarised in Notes 2 and 27. The Group may make additional significant provisions for such legal proceedings as required in the event of further developments in these matters, consistent with generally accepted accounting principles. Litigation, particularly in the USA, is inherently unpredictable and excessive awards that may not be justified by the evidence may occur. The Group could in the future incur judgements or enter into settlements of claims that could result in payments that exceed its current provisions by an amount that would have a material adverse effect on the Group’s financial condition, results of operations and/or cash flows.
Intellectual property claims include challenges to the validity of the Group’s patents on various products or processes and assertions of non-infringement of those patents. A loss in any of these cases could result in loss of patent protection for the product at issue. The consequences of any such loss could be a significant decrease in sales of that product and could materially affect future results of operations for the Group.
Legal expenses incurred and provisions related to legal claims are charged to selling, general and administration costs. Provisions are made, after taking appropriate legal and other specialist advice, when a reasonable estimate can be made of the likely outcome of the dispute. Beginning in 2004, the Group has established an actuarially determined provision for product liability claims incurred but not yet reported as described in Note 27. At 31st December 2006, the Group’s aggregate provision for legal and other disputes (not including tax matters described under ‘Taxation’ in Note 12) was over £1 billion. The ultimate liability for legal claims may vary from the amounts provided and is dependent upon the outcome of litigation proceedings, investigations and possible settlement negotiations.
The most significant of those matters are described below.
Intellectual property
Advair
In September 2004, the Group applied to the US Patent and Trademark Office (USPTO) for re-issue of its combination patent forAdvair, an inhaled combination of salmeterol and fluticasone propionate, which expires in September 2010. This followed an internal review which concluded that the language in the patent may not accurately describe all of the circumstances of the invention and may not claim the invention as precisely as it could. The objective of seeking re-issuance is to strengthen the protection afforded by the patent. In January 2007, the Group received a Notice of Allowance finding the pharmaceutical composition claims patentable. The reissued patent will have the same September 2010 expiration date as the original composition patent and will be listed in the register of pharmaceutical patents maintained by the US Food and Drug Administration (FDA) (the Orange Book).
The Group holds other US patents relating toAdvair, including various patents relating to theDiskusdevice which expire over a period from 2011 to 2016, and various patents relating to the HFA formulation and MDI device which expire over a period from 2014 to 2017.
Avandia and Avandamet
In August 2003, the Group filed an action in the US District Court for the District of New Jersey against Teva Pharmaceuticals USA Inc. for infringement of the Group’s patent relating to the maleate salt form of rosiglitazone, the active ingredient inAvandia, which expires in 2015. In September 2003, the Group filed a comparable action in same court against Dr. Reddy’s Laboratories, alleging infringement of the same patent. Those actions were filed in response to Abbreviated New Drug Application (ANDA) filings with the FDA by Dr. Reddy’s Laboratories and Teva with certifications that the Group’s maleate salt patent is invalid. Teva subsequently filed an additional certification challenging the validity of the Group’s basic compound patent for rosiglitazone, and in January 2004 the Group commenced an action against Teva in the same court for infringement of that patent. The basic compound patent currently expires in 2012 after giving effect to patent term restoration and paediatric exclusivity. The actions have been consolidated and a trial date set for 6th August 2007 for the Group’s actions against Teva on the basic compound and maleate salt patents and Dr. Reddy’s on the maleate salt patent.
Both Teva and Dr. Reddy’s have tentative FDA approval for all dosage strengths. The Hatch-Waxman stays against final FDA approval in respect of the ANDAs filed by both companies expired in November 2006.
In January 2005, the Group filed an action in the US District Court for the District of New Jersey against Teva for infringement of the same two patents – the basic compound and maleate salt patents for rosiglitazone. Teva had filed an ANDA with the FDA for a generic version ofAvandametwith a certification that those patents are invalid or not infringed. FDA approval of that ANDA is stayed until the earlier of June 2007 or resolution of the patent infringement action. SinceAvandametis protected by the same patents asAvandia, any earlier holding of invalidity in theAvandiacases would be dispositive forAvandametas well.
Imitrex
In December 2003, the Group commenced an action in the US District Court for the Southern District of New York against Dr. Reddy’s Laboratories, alleging infringement of one of the two primary compound patents for sumatriptan, the active ingredient inImitrex. The patent at issue affords protection through February 2009 after giving effect to a grant of paediatric exclusivity by the FDA. The defendant had filed an ANDA with the FDA for sumatriptan oral tablets with a certification of invalidity of that compound patent but did not certify invalidity or non-infringement of the other compound patent that expires in June 2007 after giving effect to paediatric exclusivity.
In March 2004, the Group commenced an infringement action against Cobalt Pharmaceuticals which was transferred to the US District Court for the Southern District of New York. The defendant had filed an ANDA for sumatriptan oral tablets with a certification of invalidity or non-infringement of the same compound patent at issue in the Dr. Reddy’s case.
In February 2005, the Group commenced an infringement action in the US District Court for the District of Delaware against Spectrum Pharmaceuticals. The defendant had filed an ANDA for injectable sumatriptan with a certification of invalidity or non-infringement of the same compound patent at issue in the Dr. Reddy’s and Cobalt cases.
| |
|
| GSK Annual Report 2006 |
| 156 |
<Back to Contents
| |
| Notes to the financial statements |
| continued |
|
| |
43 Legal proceedingscontinued
In October 2006, the Group reached a settlement agreement with Dr. Reddy’s which provides that Dr. Reddy’s may exclusively distribute authorised generic versions of sumatriptan tablets in the USA with an expected launch date late in the fourth quarter of 2008. In November 2006, the Group reached a settlement with Cobalt which provides that Cobalt may distribute a generic version of sumatriptan tablets in the USA with an expected launch date early in the first quarter of 2009. In December 2006, the Group reached a settlement with Spectrum which provides that Spectrum may exclusively distribute authorised versions of certain sumatriptan injection products in the USA with an expected launch during the Group’s sumatriptan paediatric exclusivity period which begins in August 2008, with such launch occurring not later than early November 2008.
Lamictal
In August 2002, the Group commenced an action in the US District Court for the District of New Jersey against Teva Pharmaceuticals USA Inc., alleging infringement of the Group’s compound patent for lamotrigine, the active ingredient inLamictaloral tablets. That patent affords protection through January 2009 after giving effect to a grant of paediatric exclusivity by the FDA. Teva had filed an ANDA with the FDA with a certification of invalidity of the Group’s patent. The parties reached a settlement agreement pursuant to which the Group has granted Teva an exclusive royalty-bearing license to distribute in the USA a generic version of lamotrigine chewable tablets. In addition, Teva was granted the exclusive right to manufacture and sell Teva’s own generic version of lamotrigine tablets in the USA with an expected launch date in 2008.
Paxil/Seroxat
In the USA a number of distributors of generic drugs filed applications with the FDA to market generic versions ofPaxil/Seroxat(paroxetine hydrochloride) prior to the expiration in 2007 of the Group’s patent on paroxetine hyrdrochloride hemihydrate. Other distributors sought to bring to market anhydrate or other versions of paroxetine hydrochloride and in one case paroxetine mesylate. In response the Group filed actions against all those distributors for infringement of various of the Group’s patents on the basis that the generic anhydrate and other versions infringe because they contain and/or convert to the hemihydrate form and/or infringe other Group patents.
In July 1998, the Group filed an action against Apotex in the US District Court for the Northern District of Illinois for infringement of the Group’s patent for paroxetine hydrochloride hemihydrate. Apotex had filed an ANDA with the FDA seeking approval to introduce a generic form ofPaxil. Following a trial in February 2003, the judge ruled the Group’s patent valid but not infringed by Apotex’s product. On the Group’s appeal to the US Court of Appeals for the Federal Circuit (CAFC), which hears all appeals from US District Courts on patent matters, the CAFC ruled that the Group’s patent was infringed but invalid based upon ‘public use’ in clinical trials prior to the filing date in the USA. The Group filed a petition to the CAFC for rehearing on its appeal by the full court and in April 2005 the full CAFC vacated that judgement and remanded the matter to the same panel. Concurrently with entry of that decision, the panel issued a new opinion ruling the same patent invalid under an alternative theory.
Between 1999 and 2001 the Group filed further actions against Apotex in the US District Court for the Eastern District of Pennsylvania for infringement of additional of the Group’s patents. In December 2002, the judge granted in part and denied in part summary judgement motions filed by Apotex with the result that issues of validity and infringement of three of the four new patents remained for trial. In July 2004, the judge certified the patent that had been held invalid for appeal to the US Circuit Court for the CAFC. In February 2006, the CAFC affirmed the judge’s ruling of invalidity of that patent.
The Group also commenced actions in the US District Court for the Eastern District of Pennsylvania against Geneva, Alphapharm, Andrx Pharmaceuticals, Zenith and Teva Pharmaceuticals in connection with their ANDA filings forPaxiland BASF and Sumika Fine Chemicals in connection with their supply of paroxetine hydrochloride for use in ANDAs. All the Group’s patent infringement claims against these defendants have been resolved.
Apotex launched its generic product in the USA in September 2003. Additional generic products were launched by other defendants after March 2004.
The Group’s US patent litigation with Synthon BV was settled in December 2003 enabling US marketing of Synthon’s paroxetine mesylate product. This was followed with settlement in August 2004 of most of the Group’s non-US patent litigation with Synthon as a consequence of which Synthon is free to market its paroxetine mesylate product in many markets globally where it has obtained marketing authorisations. Paroxetine mesylate is a different salt form of paroxetine than that used in the marketed form ofSeroxat/Paxil. In certain markets litigation with Synthon is ongoing and Synthon is asserting counterclaims for unfair competition against the Group.
Generic products containing the anhydrate form of paroxetine hydrochloride are now on the market in most European countries. Whilst some of these products are the subject of continuing litigation, most actions have now been settled and it is expected that more will be settled in the future. In the UK, litigation of several years standing between the Group and Apotex culminated in an Appeal Court decision that the Group’s anhydrate process patent was valid but not infringed. Following the litigation in Canada with Apotex over several other patents related to paroxetine, Apotex launched its generic product in Canada in October 2003. Apotex alleged that as a result of that litigation it had been enjoined from launching that product after receipt of regulatory approval. An action by Apotex to recover damages related to the delay occasioned by those injunctions is ongoing.
Paxil CR
In November 2005, Mylan Pharmaceuticals filed an ANDA forPaxil CR(paroxetine hydrochloride controlled release formulation) with a certification of invalidity and non-infringement of several patents listed in the FDA Orange Book. There was no certification of invalidity or non-infringement of the patent covering paroxetine hydrochloride hemihydrate, which Mylan admitted is the active ingredient in its product. That patent expires in June 2007, after giving effect to a grant of paediatric exclusivity by the FDA. As the Group did not file a patent infringement action against Mylan within the 45-day period provided under Hatch-Waxman, there is no 30-month stay of FDA approval of the Mylan ANDA.
| |
|
| GSK Annual Report 2006 |
| 157 |
<Back to Contents
| |
| Notes to the financial statements |
| continued |
|
| |
43 Legal proceedingscontinued
Requip
In April 2005, the Group commenced an action in the US District Court for the District of Delaware against Teva Pharmaceutical USA Inc. alleging infringement of the Group’s compound patent for ropinirole hydrochloride (the active ingredient inRequip) and a method of use patent for treatment of Parkinson’s disease, both of which are listed in the FDA Orange Book. The compound patent expires in December 2007 and the method of use patent in May 2008. The defendant filed an ANDA with the FDA with a certification of invalidity and non-infringement of those patents. FDA approval of that ANDA is stayed until the earlier of August 2007 or resolution of the patent infringement action. In December 2006, the judge ruled at the conclusion of the trial that the Group’s method of use of ropinirole to treat Parkinson’s Disease is novel and nonobvious rejecting Teva’s claims on those grounds. Teva’s further claim that the patent is unenforceable for inequitable conduct remains before the judge as the evidence was not reviewed at the trial. This issue is to be decided on the basis of deposition testimony and documents and consideration of further potential filings by the parties. Teva’s original challenge to the Group’s basic compound patent was withdrawn before trial, and Teva has accepted that the FDA will not approve its product prior to expiration of that patent.
Valtrex
In May 2003, the Group commenced an action in the US District Court for the District of New Jersey against Ranbaxy Laboratories, alleging infringement of the Group’s compound patent for valacyclovir, the active ingredient inValtrex. That patent expires in 2009. The defendant has filed an ANDA with the FDA with a certification the Group’s compound patent was invalid or not infringed. In August 2004, Ranbaxy filed a motion for partial summary judgement that the patent was invalid for being in ‘public use’ more than one year before the filing of the patent application and the Group filed a motion that the patent was not invalid on those grounds. In March 2005, the court ruled in the Group’s favour that the patent was not invalid on those grounds.
On 1st February 2007 Ranbaxy received FDA approval for its generic valacyclovir product and notified the Group that it sought to market the product in the USA. Under the terms of an earlier agreement between the companies, previously approved by the court, Ranbaxy had agreed that if the Group applied for a preliminary injunction within 45 days of that notification Ranbaxy would not launch its product until the court either ruled on the preliminary injunction or decided the pending court case. At a conference with the court on 28th February 2007 a trial date for the case was set for 7th August 2007 and the parties agreed that it would not be necessary that the Group file a request for a preliminary injunction.
Wellbutrin XL
In December 2004, Biovail commenced actions in the US District Court for the Central District of California against Anchen Pharmaceuticals and in the US District Court for the Southern District of Florida against Abrika Pharmaceuticals, in each case alleging infringement of Biovail formulation patents forWellbutrin XL. In April 2005, Biovail filed an action in the US District Court for the Eastern District of Pennsylvania against Impax Laboratories for infringement of the same patents. Those patents expire in 2018. Each of Anchen, Abrika and Impax had filed an ANDA with the FDA with a certification of invalidity or non-infringement of the Biovail patents. The Group is the licensee under those patents. In August 2006, the judge granted Anchen’s motion and ruled that Anchen’s ANDA product did not infringe Biovail’s patent. Biovail has appealed that decision to the CAFC. A hearing on Abrika’s motion for summary judgement was heard in April 2006 but as of the date of this report no decision has been announced. Impax filed a motion for summary judgement of nonfringement in August 2006, but as of the date of this report no decision has been announced. The Group is not a party to any of those actions. In September 2005, Biovail commenced actions in the US District Court for the Southern District of New York against Watson Laboratories alleging infringement of the Biovail formulation patents. Watson’s third party counterclaim against the Group based on listing activities associated with the FDA Orange Book was dismissed in October 2006.
The FDA has given final approval to Anchen’s ANDA for its generic version ofWellbutrin XLand to Impax for a generic 300 mg tablet product. The 300 mg generic product was launched in the USA at the end of December 2006. No generic version of the 150 mg tablet has been launched as of the date of this report.
In December 2005, Andrx Pharmaceuticals filed an action against the Group in the US District Court for the Southern District of Florida, alleging that the manufacture, importation and sale of the 150 mgWellbutrin XLproduct infringes a patent issued to Andrx in June 2005 and asking for treble damages, attorneys’ fees and that the Group and others acting in concert with it be enjoined. In February 2007, the parties reached a settlement, providing that the Group pay Andrx a $35 million license fee and that Andrx grant the Group a royalty-bearing license to its US patents coveringWellbutrin XL.
Zofran
In August 2001, the Group commenced an action in the US District Court for the District of New Jersey against Reddy-Cheminor and Dr. Reddy’s Laboratories. Dr. Reddy had certified invalidity of three patents for ondansetron, the active ingredient inZofrantablets, including the compound patent that expired in July 2005 and two method of use patents, the later of which expired in December 2006, in both instances taking into account the extension for paediatric exclusivity. In July 2003, the Group filed an action against Dr. Reddy’s Laboratories in the same district court for infringement of the Group’s patents related to the orally disintegrating tablet presentation ofZofran. In October 2003, the Group filed an action against West-ward Pharmaceuticals, Inc. in the same district court for infringement of the Group’s patents related to an injectable presentation ofZofran. Both the Dr. Reddy’s disintegrating tablet case and the West-ward case were consolidated with the earlier Dr. Reddy’s case.
| |
|
| GSK Annual Report 2006 |
| 158 |
<Back to Contents
| |
| Notes to the financial statements |
| continued |
|
| |
43 Legal proceedingscontinued
Prior to the trial both Reddy-Cheminor and West-ward withdrew their challenge to the compound patent. The trial over infringement and validity of the Group’s method of use and process patents was completed in June 2004 and closing arguments were heard in May 2005. The parties subsequently reached a settlement agreement, the terms of which remain confidential.
In March 2002, the Group filed a similar action against Teva Pharmaceuticals USA Inc. in the US District Court for the District of Delaware alleging infringement of the two method of use patents for ondansetron. Teva had certified invalidity or non-infringement of the two method of use patents. Teva did not challenge the compound patent. The trial judge ruled in the Group’s favour, upholding the validity of the method of use patents. Following an appeal by Teva to the CAFC, the parties reached a settlement agreement, the terms of which remain confidential.
In January 2003, the Group commenced an action against Kali Laboratories (now Par Pharmaceutical Company) in the US District Court for the District of New Jersey involving orally disintegratingZofrantablets. The trial judge denied Kali’s summary judgement motion and granted the Group’s summary judgement motions in June 2005 and July 2005, affirming the validity of the Group’s method of use patents and holding that Kali’s proposed generic product would infringe those patents. Following an appeal by Kali to the CAFC, the parties reached a settlement agreement, the terms of which remain confidential.
Following the settlement agreements referred to above, generic ondansetron tablet products were launched by a number of distributors in the USA in December 2006.
Product liability
Pre-clinical and clinical trials are conducted during the development of potential products to determine the safety and efficacy of products for use by humans following approval by regulatory bodies. Notwithstanding these efforts, when drugs and vaccines are introduced into the marketplace, unanticipated side effects may become evident. The Group is currently a defendant in a number of product liability lawsuits related to the Group’s pharmaceutical products. The most significant of those matters are described below.
Paxil
The Group has received lawsuits and claims filed on behalf of patients alleging that they have suffered symptoms on discontinuing treatment withPaxil(paroxetine). Separately, the Group has received lawsuits and claims that patients who had commencedPaxiltreatment committed or attempted to commit suicide and/or acts of violence. The Group has also received lawsuits and claims alleging that use ofPaxilduring pregnancy resulted in the birth of a child with birth defects or health issues.
The Group received lawsuits filed in state and federal courts in the USA and Canada on behalf of thousands of plaintiffs, including purported class actions, alleging that paroxetine (the active ingredient inPaxil) is addictive and causes dependency and withdrawal reactions. Plaintiffs sought remedies including compensatory, punitive and statutory damages and the cost of a fund for medical monitoring. In 2003, a federal judge in the US District Court for the Central District of California denied class action certifications for a nationwide class and a California statewide class as to cases filed in federal court in that district. Subsequently, on petition from plaintiffs’ counsel all federal court cases were transferred to that District Court for consolidation in Multidistrict Litigation (MDL). In January 2006, a conditional settlement agreement that included more than 90 per cent of the pending claims based on symptoms on discontinuingPaxiltreatment became effective. The Group did not, as part of the settlement, admit any liability with respect to the allegations in any of the suits. Virtually all the personal injury lawsuits concerning discontinuation symptoms have now been resolved by settlement or dismissal. One purported class action consumer fraud lawsuit focused on discontinuation symptoms continues in California state court. There is also purported class action litigation in Canada concerning symptoms on discontinuation ofPaxil.
The Group has received numerous claims and lawsuits alleging that treatment withPaxilhas caused homicidal or suicidal behaviour exhibited by users of the product. Class certification was denied in January 2007 in the one purported personal injury class action lawsuit which is pending in the US District Court for the Eastern District of Pennsylvania. In January 2005, the FDA approved a black box warning that antidepressants increased the risk of suicidal thoughts or behaviour in paediatric patients and other strengthened warnings for selective serotonin reuptake inhibitor (SSRI) products, includingPaxil, as a class. In May 2006, thePaxilUS label was updated to warn that young adults, especially those with Major Depressive Disorder, may be at increased risk for suicidal behaviour during treatment with paroxetine. In December 2006, the FDA held an Advisory Committee meeting following a review of data regarding suicidal thoughts and behaviours in clinical studies of various antidepressants in adults. The FDA is expected to update the label for antidepressants as a class to advise of a possible increased risk for suicidal behaviour in young adults.
The Group has received numerous lawsuits and claims alleging that use ofPaxilduring the first trimester of pregnancy resulted in the birth of a child with a heart defect or other birth defect. The Group is also involved in litigation alleging that the use ofPaxilduring pregnancy resulted in the birth of a baby with primary pulmonary hypertension of the newborn. In September 2005, the US label forPaxilwas updated to reflect new information that suggested an increased risk of congenital malformations (particularly cardiovascular malformations) in infants born to mothers who tookPaxilduring the first trimester of pregnancy. In December 2005, thePaxilUS label was further updated to include new data and to strengthen the pregnancy warning from Category C to Category D, which indicates there is evidence of risk to the foetus, but the potential benefits from the use of the drug in pregnant women may outweigh the risk. In May 2006, thePaxilUS label was again updated to include a class warning concerning persistent pulmonary hypertension of the newborn in mothers who tookPaxilafter the 20th week of pregnancy.
| |
|
| GSK Annual Report 2006 |
| 159 |
<Back to Contents
| |
| Notes to the financial statements |
| continued |
|
| |
43 Legal proceedingscontinued
Phenylpropanolamine
Following a report from the Yale Haemorrhagic Stroke Project that found a suggestion of an association between first use of phenylpropanolamine (PPA) decongestant and haemorrhagic stroke, the Group and most other manufacturers have voluntarily withdrawn consumer healthcare products in which PPA was an active ingredient. Since the PPA product withdrawal the Group has been named as a defendant in numerous personal injury and class action lawsuits filed in state and federal courts alleging personal injury or increased risk of injury from use of products containing PPA and unfair and deceptive business practices. Plaintiffs seek remedies including compensatory and punitive damages and refunds.
The federal cases have been consolidated in a multidistrict litigation proceeding in the US District Court for the District of Washington. The judge responsible for those proceedings has denied class certification and struck all class allegations in the federal personal injury and consumer refund class actions. Class certification has been denied in California state court and a Pennsylvania state court putative class action has been dismissed, leaving no putative class actions pending against the Group in this litigation. A substantial number of cases in which the Group or other manufacturers are defendants have reached trial in state and federal courts. Manufacturers have for the most part received favourable outcomes at trial.
Baycol
In August 2001, Bayer AG withdrewBaycol(cerivastatin sodium) worldwide in light of reports of adverse events, including deaths, involving rhabdomyolosis. The Group had participated in the marketing ofBaycolin the USA pursuant to a co-promotion agreement with Bayer which was the licence holder and manufacturer of the product.
Following the withdrawal, Bayer and the Group have been named as defendants in thousands of lawsuits filed in state and federal courts in the USA on behalf of both individuals and putative classes of formerBaycolusers. A number of the suits allege that the plaintiffs have suffered personal injuries, including rhabdomyolosis, from the use ofBaycol. Others claim that persons who tookBaycol, although not injured, may be at risk of future injury or may have suffered economic damages from purchasing and usingBaycol. Plaintiffs seek remedies including compensatory, punitive and statutory damages and creation of funds for medical monitoring.
The Group and Bayer Corporation, the principal US subsidiary of Bayer AG, have signed an allocation agreement under which Bayer Corporation has agreed to pay 95 per cent of all settlements and compensatory damages judgements with each party retaining responsibility for its own attorneys’ fees and any punitive damages. The federal cases have been consolidated in a MDL proceeding in the US District Court for the District of Minnesota. To date two statewide class actions have been certified – a medical monitoring case in Pennsylvania and a Consumer Fraud and Deceptive Business Practices Act case in Illinois. The medical monitoring action was dismissed by the court on summary judgement. Another class action, in which GSK was not named as a defendant, has been certified in Oklahoma. A substantial number of claims for death or serious injury have been settled and many others alleging muscle aches and pains have been voluntarily or involuntarily dismissed.
Fen-Phen
In 1997, the FDA became aware of reports of cardiac valvular problems in individuals for whom fenfluramine or dexfenfluramine alone or in combination with phentermine was prescribed as part of a regimen of weight reduction and requested the voluntary withdrawal of fenfluramine and dexfenfluramine from the market. The reports of cardiac valvular problems and the subsequent withdrawal of those products form the market spawned numerous product liability lawsuits filed against the manufacturers and distributors of fenfluramine, dexfenfluramine and phentermine. As one of a number of manufacturers of phentermine, the Group remains a defendant in less than one hundred of several thousand lawsuits that were filed in various state and federal district courts in the USA against the Group and other defendants.
Most of the lawsuits seek relief including some combination of compensatory and punitive damages, medical monitoring and refunds for purchases of drugs. In 1997, the Judicial Panel on Multidistrict Litigation issued an order consolidating and transferring all federal actions to the US District Court for the Eastern District of Pennsylvania. That court approved a global settlement proposed by defendant Wyeth, which sold fenfluramine and dexfenfluramine. The settlement, subsequently approved by the Third Circuit Court of Appeals, does not include any of the phentermine defendants, including the Group. Individual plaintiffs may elect to opt out of the class settlement and pursue their claims individually and tens of thousands of plaintiffs have elected to do so. Wyeth continues to settle individual state court cases before trial and the Group continues to be dismissed from lawsuits as they are settled by Wyeth.
Thimerosal
The Group, along with a number of other pharmaceutical companies, has been named as a defendant in numerous individual personal injury lawsuits in state and federal district courts in the USA alleging that thimerosal, a preservative used in the manufacture of vaccines, causes neurodevelopmental disorders and other injuries, including autism. Two of the cases are purported class actions although there has been no determination whether any of those cases will be permitted to proceed as a class action. A number of purported class actions in other jurisdictions have been withdrawn or dismissed. Plaintiffs seek remedies including compensatory, punitive and statutory damages and the cost of a fund for medical monitoring and research. As of the date of this report there are no cases scheduled for trial in 2007 in which the Group is a defendant.
| |
|
| GSK Annual Report 2006 |
| 160 |
<Back to Contents
| |
| Notes to the financial statements |
| continued |
|
| |
43 Legal proceedings continued
Sales and marketing and regulation
Marketing and promotion
In February 2004, the Group received a subpoena from the US Attorney’s office in Colorado regarding the Group’s sales and promotional practices relating to nine of its largest selling products for the period from January 1997 to the present. In particular the government has inquired about alleged promotion of these drugs for off-label uses as well as Group sponsored continuing medical education programmes, other speaker events, special issue boards, advisory boards, speaker training programmes, clinical studies, and related grants, fees, travel and entertainment. Although the original subpoena issued from the US Attorney’s office in Colorado, the scope of the inquiry is nationwide. The Group is co-operating with the investigation and providing the requested information. The Group had earlier responded to an October 2002 letter from the FDA’s Division of Drug Marketing, Advertising and Communication requesting information on the Group’s alleged promotion ofWellbutrin SRfor off-label use.
In June 2005, the Group and other pharmaceutical manufacturers received a letter from the US Senate Finance Committee in which the Committee expressed concern that educational grants were being improperly used to promote drug products and requesting that each company provide detailed information and documents about its use of educational grants. In January 2006, the Group and the same manufacturers received a second letter from the Committee asking for additional information on the Group’s internal grant approval process, grants to medical/physician/professional organisations, academic institutions or state agencies to support journal articles and other publications and grants to patient education or advocacy groups. The Group is co-operating in the Committee’s investigation and providing the requested information.
In February 2003, the Verona Public Prosecutor commenced a criminal investigation into GSK’s sales and marketing practices in Italy. Specific areas of investigation include medical education programmes, clinical studies and congresses as well as the interaction between GSK representatives and physicians. The US Securities and Exchange Commission (SEC) staff has initiated an investigation into the allegations. The Group is co-operating with both of these investigations.
In February 2006, the Group received a subpoena from the SEC in respect of the Group’s participation in the United Nations Oil for Food Programme. The Group is co-operating with the SEC and providing documents responsive to the subpoena. The US Department of Justice is also investigating this matter.
Average wholesale price
GSK has responded to subpoenas from the Office of the Inspector General of the US Department of Health and Human Services (HHS), the US Department of Justice and the states of Texas and California in connection with allegations that pharmaceutical companies, including GSK, have violated federal fraud and abuse laws such as the Federal False Claims Act (and, with respect to Texas and California, comparable state laws) as a result of the way ‘average wholesale price’ (AWP) was determined and reported for certain drugs and the way the Medicare and Medicaid programmes reimburse for those drugs. In September 2005, the Group reached a civil settlement with the US Department of Justice, the US Attorney for the District of Massachusetts and the Office of the Inspector General for HHS (the “DOJ Settlement”). The Group agreed to pay the government a civil settlement of $149 million, which included settlement amounts for each of the states for the claims being settled. As part of the settlement the corporate integrity agreement to which the Group is a party was amended to address issues raised in the course of the government investigation.
Subsequent to the initial subpoenas, a number of states through their respective attorneys general and most of the counties in New York state filed civil lawsuits in state and federal courts against GSK and many other drug companies. The actions claim, on behalf of the states as payers (and in some cases on behalf of in-state patients as consumers), damages and restitution due to AWP-based price reporting for pharmaceutical products covered by the states’ Medicaid programmes (and in some cases by other governmental programmes). In addition, private payer class action lawsuits were filed against GSK in multiple federal district and state courts. All the federal cases were consolidated in a MDL proceeding in the US District Court for the District of Massachusetts.
In August 2005, the judge in that MDL proceeding granted in part and denied in part the private-payer plaintiffs’ motion for class certification, thereby narrowing the scope of the class claims. In August 2006 the Group reached civil settlements to resolve the class action litigation and certain of the state attorney general claims. The Group agreed to a nationwide settlement (subject to court approval) of $70 million to resolve these claims. The Group separately resolved potential AWP claims by state Medicaid programmes in more than two-thirds of the states through the procedures established by the DOJ Settlement, and also fully resolved AWP lawsuits filed or threatened by a number of state attorneys general. Litigation concerning AWP issues is continuing with a group of other state attorneys general as well as with New York counties.
Nominal pricing
The Group responded to two letter requests from the US Senate Committee on Finance, dated April 2004 and February 2005, for documents and information relating to the nominal price exception to the best price reporting requirements under the Medicaid Drug Rebate Programme. There has been no further activity in connection with this inquiry by the Committee as to the Group since September 2005. In May 2004, the Group was advised by the US Department of Justice that they are investigating certain of the Group’s nominal pricing arrangements to determine whether those arrangements qualify under the exception to the best price reporting requirements or violate civil statutes or laws. The Group is co-operating in that investigation and has provided documents and information to the Department of Justice regarding nominal pricing arrangements for a number of the Group’s products.
| |
|
| GSK Annual Report 2006 |
| 161 |
<Back to Contents
| |
| Notes to the financial statements |
| continued |
|
| |
43 Legal proceedingscontinued
Paxil/Seroxat
Following announcement of the New York State Attorney General’s office about the state’s lawsuit, subsequently settled in August 2004, alleging failure to disclose data on the use ofPaxilin children and adolescents, similar cases, some of which purport to be class actions, have been filed in state and federal and Canadian courts by private plaintiffs seeking to recover amounts paid forPaxilpurchased for use by patients under age 18. The Group reached a class settlement agreement in an Illinois state court action that would include all persons in the USA who boughtPaxilfor someone under age 18. The Group denies any liability. The agreement relates only to the cost of purchasingPaxilfor use by paediatric patients and does not include any personal injury claims. The settlement received preliminary approval by a judge in Madison County, Illinois in October 2006. The final fairness hearing on the settlement is scheduled for 25th April 2007.
In the UK an investigation remains pending by the UK Medicines and Healthcare products Regulatory Agency (MHRA) to determine whether the Group has complied with its pharmacovigilence obligations in reporting data from clinical trials forSeroxat/Paxilin children and adolescents.
Cidra, Puerto Rico manufacturing site
Following FDA inspections in October 2003 and November 2004 which resulted in observations of possible deficiencies in manufacturing practices at the Group’s manufacturing facility in Cidra, Puerto Rico, in March 2005 the FDA halted distribution of supplies ofPaxil CRandAvandametdue to manufacturing issues. The FDA observations related to certain aspects of production controls, process validation and laboratory investigations.
The Cidra site is engaged in tableting and packaging for a range of GlaxoSmithKline products – primarily for the US market – including Paxil,Paxil CR,Coreg,Avandia, andAvandamet. In April 2005 the Group reached agreement with the FDA on a Consent Decree. The Consent Decree provides for an independent expert to review manufacturing processes at the site for compliance with FDA Good Manufacturing Practice (GMP) requirements. As provided in the Consent Decree, the Group provided a report to the FDA on the deficiencies identified in this review, setting out a corrective plan and timetable for completion. The Group remains fully committed to working cooperatively with the FDA to address any issues in a timely fashion. The Group has resumed manufacture of products at the site. In June 2006, the FDA confirmed that the status for the site had been upgraded to ‘voluntary action indicated,’ which means that the FDA deems the site acceptable for the export of products and for routine manufacturing operations.
No financial penalties have been imposed under the Consent Decree. The Consent Decree allows for potential future penalties up to a maximum of $10 million a year if the Group fails to meet the terms of the Consent Decree.
In April 2005, the Group received a subpoena from the US Attorney’s Office in Boston requesting production of records regarding manufacturing at the Cidra site covering the same type of information as that collected by the US government in Puerto Rico in 2003. The Group is co-operating with the US Attorney’s Office and producing the records responsive to the subpoena. The Group is also named in two purported consumer fraud class action lawsuits – one filed in California state court and the other in the US District Court for the District of Puerto Rico – alleging thatPaxil CRand/orPaxilOral Suspension were not manufactured according to GMP. Plaintiffs seek economic, statutory and punitive damages, along with a request for injunctive relief. There has not yet been any determination whether either case will be permitted to proceed as a class action.
Anti-trust
Paxil/Seroxat
In the paroxetine patent infringement actions brought by the Group as described under ‘Intellectual property’ above, Apotex, Alphapharm, BASF and Sumika have filed anti-trust and unfair competition counterclaims against the Group in the US District Court for the Eastern District of Pennsylvania based on allegations that the Group monopolised a ‘market’ forPaxilby bringing allegedly sham patent litigation and allegedly abusing the regulatory procedures for the listing of patents in the FDA Orange Book. Whilst the Apotex matter remains in the discovery stage, the Alphapharm and BASF matters have been resolved and a settlement agreement in principle has been reached with Sumika.
In November 2000, the US Federal Trade Commission (FTC) staff advised the Group that they were conducting a non-public investigation to determine whether the Group was violating Section 5 of the Federal Trade Commission Act by ‘monopolising or attempting to monopolise’ the market for paroxetine hydrochloride by preventing generic competition toPaxiland requested the Group to submit certain information in connection with that investigation. In October 2003, the FTC closed its investigation on the basis of its finding that no further action was warranted.
Following public reference to the FTC investigation regardingPaxil, a number of governmental and private civil actions and claims were initiated in the USA. All have been resolved with the exception of a private indirect purchaser opt-out lawsuit brought in Minnesota state court. That matter is in the discovery phase. Additionally, class actions have been filed in provincial courts in Canada on behalf of direct and indirect purchasers. Those cases are in their early stages.
| |
|
| GSK Annual Report 2006 |
| 162 |
<Back to Contents
| |
| Notes to the financial statements |
| continued |
|
| |
43 Legal proceedingscontinued
In October 2005, the Competition Directorate of the European Commission initiated an inspection concerning allegations that the Group has abused a dominant position in the marketplace concerning enforcement of its intellectual property rights, litigation surrounding regulatory approvals and marketing ofSeroxatin Europe. In October 2006, the Commission made a formal request for further information. The Group continues to co-operate fully with the Commission.
Canadian importation
The Group has been named in seven purported class action lawsuits along with eight other pharmaceutical companies. Following the Group’s actions in 2003 to reduce illegal importation of prescription drugs from Canada, the lawsuits alleged that the companies entered into an unlawful conspiracy to prevent Canadian pharmacies from selling their products to US customers. Those lawsuits were consolidated into one action before the US District Court for the District of Minnesota. The Group’s motion to dismiss the consolidated action was granted by the court and affirmed by the US Circuit Court of Appeals for the Eighth Circuit in November 2006.
In relation to the same matter, the Minnesota state attorney general has filed a civil investigative demand and, subsequently, a complaint alleging that the Group has violated state anti-trust and commercial laws. That case is still in the discovery phase.
The Group has also been named as a defendant, along with thirteen other drug companies, in a state court action in California, in which the plaintiffs, independent pharmacies, allege that the defendants unlawfully conspired to keep prices artificially high in the USA to the detriment of the plaintiffs. In December 2006, the trial judge granted the Group’s motion for summary judgement. Plaintiffs have filed an appeal with the California Court of Appeals.
Wellbutrin SR
In December 2004, and January and February 2005, lawsuits, several of which purported to be class actions, were filed in the US District Court for the Eastern District of Pennsylvania against the Group on behalf of direct and indirect purchasers ofWellbutrin SR. The complaints allege violations of US anti-trust laws through sham litigation and fraud on the patent office by the Group in obtaining and enforcing patents coveringWellbutrin SR. The complaints follow the introduction of generic competition toWellbutrin SRin April 2004 after district and appellate court rulings that a generic manufacturer did not infringe the Group’s patents. The parties are involved in discovery.
Secondary wholesaler
In July 2006, RxUSA Wholesale, Inc., a ‘secondary wholesaler’, filed suit against the Group and many other pharmaceutical manufacturers and wholesalers in the US District Court for the Eastern District of New York. The complaint alleges that the defendants engaged in a conspiracy to refuse to supply pharmaceutical products to RxUSA in violation of federal and state anti-trust laws. The Group’s motion to dismiss the complaint is pending.
Commercial and corporate
Relenza
In May 2004, Biota Holdings Limited filed a complaint in the Victorian Supreme Court in Australia alleging that the Group had failed to fulfil its development, promotion and production obligations for zanamivir (Relenza) under the terms of the licence agreement between the Group and Biota. Biota is seeking substantial cash damages. The Group believes that it has adhered to its obligations under the licence agreement. The parties are involved in extensive discovery.
Securities class action
In September 2005, attorneys representing a purported class of purchasers of GlaxoSmithKline shares and American Depositary Shares (ADSs) filed a second amended securities class action complaint against the Group in the US District Court for the Southern District of New York alleging that the Group violated US securities laws through failure to disclose unfavourable clinical data from studies onPaxil, misrepresentation of the remaining patent protection forPaxilandAugmentinand violation of the Federal False Claims Act on the basis of the Group’s recent AWP settlement with the government. In October 2006, the judge entered an order dismissing the complaint. Plaintiffs have filed an appeal with the US Court of Appeals for the Second Circuit.
Overtime claims
In December 2006, two purported class actions were filed in the US District Courts for the Central and Southern Districts of California against the Group on behalf of all the Group’s US pharmaceutical sales representatives. The actions allege that those representatives are not ‘exempt’ employees under the US Fair Labor Standards Act and consequently entitled to overtime pay. The suits seek double damages for all overtime allegedly worked by the Group’s sales representatives over a three-year period together with attorneys’ fees. Similar actions have been filed against other pharmaceutical companies. The cases are in their early stages.
Environmental matters
GSK has been notified of its potential responsibility relating to past operations and its past waste disposal practices at certain sites, primarily in the USA. Some of these matters are the subject of litigation, including proceedings initiated by the US federal or state governments for waste disposal site remediation costs and tort actions brought by private parties.
GSK has been advised that it may be a responsible party at approximately 29 sites, of which 14 appear on the National Priority List created by the Comprehensive Environmental Response Compensation and Liability Act (Superfund).
| |
|
| GSK Annual Report 2006 |
| 163 |
<Back to Contents
| |
| Notes to the financial statements |
| continued |
|
| |
43 Legal proceedingscontinued
These proceedings seek to require the operators of hazardous waste facilities, transporters of waste to the sites and generators of hazardous waste disposed of at the sites to clean up the sites or to reimburse the government for cleanup costs. In most instances, GSK is involved as an alleged generator of hazardous waste although there are a few sites where GSK is involved as a current or former operator of the facility. Although Superfund provides that the defendants are jointly and severally liable for cleanup costs, these proceedings are frequently resolved on the basis of the nature and quantity of waste disposed of at the site by the generator. GSK’s proportionate liability for cleanup costs has been substantially determined for about 20 of the sites referred to above.
GSK’s potential liability varies greatly from site to site. While the cost of investigation, study and remediation at such sites could, over time, be substantial, GSK routinely accrues amounts related to its share of the liability for such matters.
Tax matters
Pending tax matters are described in Note 12.
| |
|
| GSK Annual Report 2006 |
| 164 |
<Back to Contents
This section includes the financial record presenting historical information analysed in accordance with current reporting practice. The transition date to IFRS for GSK was 1st January 2003. Therefore, the 2006, 2005, 2004 and 2003 information included in the Five year record is in accordance with IFRS. The 2002 information is in accordance with UK GAAP.
To provide a link between IFRS and UK GAAP, 2003 information is presented also under UK GAAP. The accounting policies used in the preparation of the UK GAAP information are disclosed in the 2004 Annual Report. Information prepared under IFRS is not directly comparable with information prepared under UK GAAP.
The Five year record also presents information in accordance with US GAAP.
This section also discusses shareholder return, in the form of dividends and share price movements, and provides other information for shareholders.
| Financial record | |
| Quarterly trend | 166 |
| Five year record | 172 |
| | |
| Shareholder information | 177 |
| | |
| Taxation information for shareholders | 180 |
|
| |
|
| GSK Annual Report 2006 |
| 165 |
<Back to Contents
| |
| Financial record |
| Quarterly trend |
|
| |
An unaudited analysis is provided by quarter of the Group results and pharmaceutical sales by therapeutic area in Sterling for the financial year 2006.
| Income statement | | | 12 months 2006 | | | | | | Q4 2006 | |
| |
|
|
|
|
| |
|
|
|
|
| |
| | £m | | CER % | | £% | | £m | | CER % | | £% | |
|
|
|
|
|
|
|
|
|
|
|
| |
| Turnover – Pharmaceuticals | 20,078 | | 9 | | 8 | | 5,136 | | 8 | | 1 | |
| – Consumer Healthcare | 3,147 | | 6 | | 5 | | 823 | | 9 | | 3 | |
|
|
|
|
|
|
|
|
|
|
|
| |
| Total turnover | 23,225 | | 9 | | 7 | | 5,959 | | 9 | | 1 | |
| Cost of sales | (5,010 | ) | 6 | | 5 | | (1,445 | ) | 15 | | 11 | |
| Selling, general and administrative | (7,257 | ) | – | | – | | (1,934 | ) | – | | (5 | ) |
| Research and development | (3,457 | ) | 11 | | 10 | | (980 | ) | 6 | | 1 | |
| Other operating income | 307 | | | | | | 100 | | | | | |
|
|
|
|
|
|
|
|
|
|
|
| |
| Operating profit | 7,808 | | 17 | | 14 | | 1,700 | | 19 | | 4 | |
|
|
|
|
|
|
|
|
|
|
|
| |
| Finance income | 287 | | | | | | 83 | | | | | |
| Finance costs | (352 | ) | | | | | (86 | ) | | | | |
| Share of after tax profits of associates and joint ventures | 56 | | | | | | 13 | | | | | |
|
|
|
|
|
|
|
|
|
|
|
| |
| Profit before taxation | 7,799 | | 19 | | 16 | | 1,710 | | 22 | | 6 | |
| Taxation | (2,301 | ) | | | | | (505 | ) | | | | |
| Tax rate % | 29.5 | % | | | | | 29.5 | % | | | | |
|
|
|
|
|
|
|
|
|
|
|
| |
| Profit after taxation for the period | 5,498 | | 17 | | 14 | | 1,205 | | 20 | | 5 | |
|
|
|
|
|
|
|
|
|
|
|
| |
| Profit attributable to minority interests | 109 | | | | | | 24 | | | | | |
| Profit attributable to shareholders | 5,389 | | | | | | 1,181 | | | | | |
|
|
|
|
|
|
|
|
|
|
|
| |
| Basic earnings per share (pence) | 95.5 | p | 19 | | 16 | | 21.0 | p | 22 | | 6 | |
|
|
|
|
|
|
|
|
|
|
|
| |
| Diluted earnings per share (pence) | 94.5 | p | | | | | 20.8 | p | | | | |
|
|
|
|
|
|
|
|
|
|
|
| |
| |
|
| GSK Annual Report 2006 |
| 166 |
<Back to Contents
| |
| Financial record |
| continued |
|
| |
| | Q3 2006 | | | | | | Q2 2006 | | | | | | Q1 2006 | |
|
|
|
|
| |
|
|
|
|
| |
|
|
|
|
| |
| £m | | CER % | | £% | | £m | | CER % | | £% | | £m | | CER % | | £% | |
|
|
|
|
|
|
|
|
|
|
|
|
|
|
|
|
| |
| 4,876 | | 7 | | 4 | | 5,021 | | 10 | | 11 | | 5,045 | | 10 | | 16 | |
| 766 | | 4 | | 1 | | 790 | | 5 | | 7 | | 768 | | 6 | | 10 | |
|
|
|
|
|
|
|
|
|
|
|
|
|
|
|
|
| |
| 5,642 | | 7 | | 3 | | 5,811 | | 9 | | 11 | | 5,813 | | 10 | | 15 | |
| (1,222 | ) | 5 | | 3 | | (1,209 | ) | 3 | | 5 | | (1,134 | ) | (2 | ) | 1 | |
| (1,617 | ) | (10 | ) | (14 | ) | (1,883 | ) | 8 | | 12 | | (1,823 | ) | 5 | | 11 | |
| (871 | ) | 11 | | 8 | | (853 | ) | 20 | | 22 | | (753 | ) | 10 | | 14 | |
| 91 | | | | | | 45 | | | | | | 71 | | | | | |
|
|
|
|
|
|
|
|
|
|
|
|
|
|
|
|
| |
| 2,023 | | 19 | | 13 | | 1,911 | | 13 | | 12 | | 2,174 | | 15 | | 24 | |
|
|
|
|
|
|
|
|
|
|
|
|
|
|
|
|
| |
| 64 | | | | | | 67 | | | | | | 73 | | | | | |
| (81 | ) | | | | | (93 | ) | | | | | (92 | ) | | | | |
| 16 | | | | | | 12 | | | | | | 15 | | | | | |
|
|
|
|
|
|
|
|
|
|
|
|
|
|
|
|
| |
| 2,022 | | 21 | | 15 | | 1,897 | | 15 | | 14 | | 2,170 | | 17 | | 27 | |
| (596 | ) | | | | | (560 | ) | | | | | (640 | ) | | | | |
| 29.5 | % | | | | | 29.5 | % | | | | | 29.5 | % | | | | |
|
|
|
|
|
|
|
|
|
|
|
|
|
|
|
|
| |
| 1,426 | | 19 | | 14 | | 1,337 | | 14 | | 12 | | 1,530 | | 16 | | 25 | |
|
|
|
|
|
|
|
|
|
|
|
|
|
|
|
|
| |
| 35 | | | | | | 22 | | | | | | 28 | | | | | |
| 1,391 | | | | | | 1,315 | | | | | | 1,502 | | | | | |
|
|
|
|
|
|
|
|
|
|
|
|
|
|
|
|
| |
| 24.7 | p | 21 | | 16 | | 23.3 | p | 15 | | 14 | | 26.5 | p | 17 | | 26 | |
|
|
|
|
|
|
|
|
|
|
|
|
|
|
|
|
| |
| 24.4 | p | | | | | 23.0 | p | | | | | 26.3 | p | | | | |
|
|
|
|
|
|
|
|
|
|
|
|
|
|
|
|
| |
| |
|
| GSK Annual Report 2006 |
| 167 |
<Back to Contents
| |
| Financial record |
| continued |
|
| |
Pharmaceutical turnover – total Group
| | Q4 2006 | | Q3 2006 | | Q2 2006 | | Q1 2006 | |
| |
|
|
|
|
| |
|
|
|
|
| |
|
|
|
|
| |
|
|
|
|
| |
| | £m | | CER % | | £% | | £m | | CER % | | £% | | £m | | CER % | | £% | | £m | | CER % | | £% | |
|
|
|
|
|
|
|
|
|
|
|
|
|
|
|
|
|
|
|
|
|
|
|
| |
| Respiratory | 1,269 | | (3 | ) | (10 | ) | 1,185 | | (1 | ) | (4 | ) | 1,232 | | – | | 1 | | 1,309 | | 4 | | 9 | |
| Seretide/Advair | 862 | | 9 | | 1 | | 813 | | 14 | | 10 | | 822 | | 12 | | 13 | | 816 | | 12 | | 18 | |
| Flixotide/Flovent | 172 | | 7 | | (1 | ) | 145 | | (1 | ) | (4 | ) | 164 | | 2 | | 3 | | 178 | | 10 | | 16 | |
| Serevent | 74 | | (9 | ) | (15 | ) | 69 | | (10 | ) | (13 | ) | 74 | | (13 | ) | (13 | ) | 74 | | (9 | ) | (6 | ) |
| Flixonase/Flonase | 48 | | (69 | ) | (72 | ) | 64 | | (59 | ) | (61 | ) | 68 | | (53 | ) | (54 | ) | 131 | | (27 | ) | (23 | ) |
|
|
|
|
|
|
|
|
|
|
|
|
|
|
|
|
|
|
|
|
|
|
|
| |
| Central Nervous System | 915 | | 13 | | 3 | | 913 | | 18 | | 13 | | 918 | | 18 | | 19 | | 896 | | 11 | | 18 | |
| Seroxat/Paxil | 163 | | 11 | | 3 | | 137 | | 4 | | (3 | ) | 159 | | 5 | | 4 | | 161 | | (4 | ) | (1 | ) |
| Paxil IR | 113 | | – | | (7 | ) | 103 | | (8 | ) | (13 | ) | 122 | | (1 | ) | (3 | ) | 110 | | (11 | ) | (10 | ) |
| Paxil CR | 50 | | 50 | | 39 | | 34 | | 61 | | 48 | | 37 | | 33 | | 37 | | 51 | | 15 | | 24 | |
| Wellbutrin | 212 | | 9 | | (2 | ) | 234 | | 27 | | 22 | | 237 | | 40 | | 42 | | 217 | | 22 | | 33 | |
| Wellbutrin IR, SR | 25 | | 13 | | 4 | | 26 | | 17 | | 13 | | 27 | | >100 | | >100 | | 24 | | (31 | ) | (25 | ) |
| Wellbutrin XL | 187 | | 9 | | (3 | ) | 208 | | 28 | | 23 | | 210 | | 34 | | 36 | | 193 | | 35 | | 47 | |
| Imigran/Imitrex | 174 | | 2 | | (7 | ) | 180 | | 4 | | – | | 175 | | 7 | | 8 | | 182 | | 2 | | 9 | |
| Lamictal | 257 | | 23 | | 13 | | 257 | | 27 | | 22 | | 245 | | 12 | | 13 | | 237 | | 14 | | 22 | |
| Requip | 76 | | 62 | | 52 | | 70 | | 71 | | 67 | | 64 | | 85 | | 88 | | 58 | | 83 | | 93 | |
|
|
|
|
|
|
|
|
|
|
|
|
|
|
|
|
|
|
|
|
|
|
|
| |
| Anti-virals | 706 | | 9 | | 1 | | 703 | | 9 | | 6 | | 719 | | 12 | | 13 | | 699 | | 10 | | 16 | |
| HIV | 360 | | (5 | ) | (11 | ) | 363 | | (6 | ) | (9 | ) | 393 | | 1 | | 2 | | 399 | | 4 | | 10 | |
| Combivir | 119 | | (14 | ) | (20 | ) | 125 | | (12 | ) | (15 | ) | 141 | | (6 | ) | (5 | ) | 143 | | (3 | ) | 2 | |
| Trizivir | 61 | | (14 | ) | (21 | ) | 63 | | (16 | ) | (18 | ) | 72 | | (5 | ) | (4 | ) | 72 | | (7 | ) | (3 | ) |
| Epivir | 43 | | (24 | ) | (31 | ) | 46 | | (25 | ) | (29 | ) | 53 | | (25 | ) | (22 | ) | 60 | | (12 | ) | (9 | ) |
| Ziagen | 28 | | (12 | ) | (18 | ) | 28 | | (12 | ) | (15 | ) | 29 | | (19 | ) | (19 | ) | 32 | | (9 | ) | (3 | ) |
| Agenerase, Lexiva | 34 | | 12 | | 3 | | 32 | | 3 | | 3 | | 32 | | 23 | | 23 | | 33 | | 41 | | 50 | |
| Epzicom/Kivexa | 69 | | 66 | | 57 | | 63 | | 88 | | 85 | | 58 | | >100 | | >100 | | 51 | | >100 | | >100 | |
| Herpes | 242 | | 18 | | 8 | | 242 | | 21 | | 15 | | 245 | | 25 | | 26 | | 236 | | 13 | | 20 | |
| Valtrex | 212 | | 23 | | 12 | | 215 | | 26 | | 20 | | 214 | | 30 | | 32 | | 204 | | 16 | | 24 | |
| Zovirax | 30 | | (9 | ) | (12 | ) | 27 | | (6 | ) | (13 | ) | 31 | | (3 | ) | (6 | ) | 32 | | (6 | ) | (3 | ) |
| Zeffix | 42 | | 5 | | – | | 42 | | 16 | | 14 | | 40 | | 5 | | 8 | | 38 | | 24 | | 31 | |
| Relenza | 37 | | >100 | | >100 | | 30 | | – | | – | | 17 | | >100 | | >100 | | 7 | | >100 | | >100 | |
|
|
|
|
|
|
|
|
|
|
|
|
|
|
|
|
|
|
|
|
|
|
|
| |
| Metabolic | 474 | | 34 | | 22 | | 438 | | 16 | | 11 | | 529 | | 32 | | 35 | | 434 | | 26 | | 36 | |
| Avandia | 324 | | 25 | | 12 | | 323 | | 13 | | 8 | | 408 | | 23 | | 26 | | 344 | | 30 | | 42 | |
| Avandamet | 68 | | 54 | | 48 | | 44 | | (21 | ) | (23 | ) | 64 | | >100 | | >100 | | 28 | | (39 | ) | (36 | ) |
| Avandaryl | 14 | | – | | – | | 11 | | – | | – | | 5 | | – | | – | | 12 | | – | | – | |
| Bonviva/Boniva | 34 | | >100 | | >100 | | 27 | | >100 | | >100 | | 19 | | >100 | | >100 | | 15 | | – | | – | |
|
|
|
|
|
|
|
|
|
|
|
|
|
|
|
|
|
|
|
|
|
|
|
| |
| Vaccines | 527 | | 31 | | 25 | | 412 | | 5 | | 3 | | 387 | | 17 | | 20 | | 366 | | 44 | | 48 | |
| Hepatitis | 128 | | 19 | | 14 | | 114 | | (2 | ) | (5 | ) | 121 | | 3 | | 4 | | 116 | | 18 | | 23 | |
| Infanrix, Pediarix | 136 | | 29 | | 21 | | 122 | | 6 | | 3 | | 129 | | 38 | | 40 | | 124 | | 54 | | 59 | |
| Boostrix | 18 | | 73 | | 64 | | 18 | | 64 | | 64 | | 14 | | >100 | | >100 | | 10 | | >100 | | >100 | |
|
|
|
|
|
|
|
|
|
|
|
|
|
|
|
|
|
|
|
|
|
|
|
| |
| Cardiovascular and urogenital | 421 | | 25 | | 15 | | 406 | | 23 | | 18 | | 383 | | 21 | | 23 | | 426 | | 29 | | 37 | |
| Coreg | 199 | | 39 | | 25 | | 195 | | 32 | | 27 | | 160 | | 29 | | 28 | | 225 | | 53 | | 67 | |
| Levitra | 12 | | 30 | | 20 | | 11 | | 22 | | 22 | | 9 | | (18 | ) | (18 | ) | 11 | | – | | 10 | |
| Avodart | 61 | | 67 | | 56 | | 57 | | 61 | | 58 | | 51 | | 79 | | 82 | | 47 | | 73 | | 81 | |
| Arixtra | 21 | | >100 | | >100 | | 13 | | 100 | | 86 | | 13 | | >100 | | >100 | | 11 | | >100 | | >100 | |
| Fraxiparine | 53 | | (2 | ) | (4 | ) | 49 | | 2 | | – | | 56 | | – | | 2 | | 51 | | (4 | ) | (2 | ) |
|
|
|
|
|
|
|
|
|
|
|
|
|
|
|
|
|
|
|
|
|
|
|
| |
| Anti-bacterials | 354 | | (8 | ) | (13 | ) | 311 | | (8 | ) | (11 | ) | 326 | | (8 | ) | (6 | ) | 378 | | (12 | ) | (9 | ) |
| Augmentin | 145 | | (11 | ) | (15 | ) | 121 | | (15 | ) | (19 | ) | 134 | | (15 | ) | (13 | ) | 170 | | (14 | ) | (11 | ) |
| Zinnat/Ceftin | 42 | | (19 | ) | (22 | ) | 35 | | (10 | ) | (15 | ) | 37 | | (10 | ) | (8 | ) | 50 | | (23 | ) | (19 | ) |
|
|
|
|
|
|
|
|
|
|
|
|
|
|
|
|
|
|
|
|
|
|
|
| |
| Oncology and emesis | 213 | | (11 | ) | (21 | ) | 279 | | 11 | | 6 | | 289 | | 15 | | 17 | | 288 | | 14 | | 23 | |
| Zofran | 165 | | (19 | ) | (28 | ) | 223 | | 8 | | 4 | | 229 | | 11 | | 12 | | 230 | | 13 | | 22 | |
| Hycamtin | 28 | | 20 | | 12 | | 28 | | 12 | | 8 | | 28 | | 22 | | 22 | | 29 | | 8 | | 16 | |
|
|
|
|
|
|
|
|
|
|
|
|
|
|
|
|
|
|
|
|
|
|
|
| |
| Other | 257 | | 2 | | (4 | ) | 229 | | (7 | ) | (10 | ) | 238 | | (9 | ) | (10 | ) | 249 | | (6 | ) | (1 | ) |
| Zantac | 55 | | (5 | ) | (14 | ) | 51 | | (11 | ) | (16 | ) | 61 | | 2 | | 2 | | 65 | | 7 | | 10 | |
|
|
|
|
|
|
|
|
|
|
|
|
|
|
|
|
|
|
|
|
|
|
|
| |
| Total | 5,136 | | 8 | | 1 | | 4,876 | | 7 | | 4 | | 5,021 | | 10 | | 11 | | 5,045 | | 10 | | 16 | |
|
|
|
|
|
|
|
|
|
|
|
|
|
|
|
|
|
|
|
|
|
|
|
| |
Pharmaceutical turnover includes co-promotion income.
| |
|
| GSK Annual Report 2006 |
| 168 |
<Back to Contents
| |
| Financial record |
| continued |
|
| |
Pharmaceutical turnover – USA
| | Q4 2006 | | Q3 2006 | | Q2 2006 | | Q1 2006 | |
| |
| |
| |
| |
| |
| | £m | | CER % | | £% | | £m | | CER % | | £% | | £m | | CER % | | £% | | £m | | CER % | | £% | |
| |
| Respiratory | 616 | | (7 | ) | (16 | ) | 593 | | (4 | ) | (9 | ) | 582 | | (4 | ) | (4 | ) | 670 | | 4 | | 13 | |
| Seretide/Advair | 493 | | 11 | | – | | 464 | | 17 | | 11 | | 453 | | 13 | | 14 | | 460 | | 11 | | 21 | |
| Flixotide/Flovent | 79 | | 22 | | 10 | | 64 | | 3 | | (2 | ) | 69 | | 8 | | 8 | | 86 | | 30 | | 41 | |
| Serevent | 22 | | (17 | ) | (24 | ) | 20 | | (16 | ) | (20 | ) | 21 | | (19 | ) | (19 | ) | 23 | | (13 | ) | (4 | ) |
| Flixonase/Flonase | 17 | | (85 | ) | (87 | ) | 39 | | (70 | ) | (72 | ) | 34 | | (68 | ) | (70 | ) | 94 | | (27 | ) | (22 | ) |
| |
| Central Nervous System | 660 | | 25 | | 13 | | 661 | | 34 | | 28 | | 644 | | 35 | | 37 | | 623 | | 19 | | 30 | |
| Seroxat/Paxil | 49 | | 72 | | 53 | | 33 | | 62 | | 57 | | 40 | | 40 | | 33 | | 53 | | (4 | ) | 6 | |
| Paxil IR | 3 | | – | | – | | 2 | | 100 | | 100 | | 8 | | 50 | | 33 | | 6 | | (55 | ) | (45 | ) |
| Paxil CR | 46 | | 59 | | 44 | | 31 | | 60 | | 55 | | 32 | | 38 | | 33 | | 47 | | 10 | | 21 | |
| Wellbutrin | 208 | | 10 | | (2 | ) | 229 | | 28 | | 22 | | 232 | | 39 | | 41 | | 213 | | 23 | | 33 | |
| Wellbutrin IR, SR | 22 | | 25 | | 10 | | 22 | | 21 | | 16 | | 24 | | >100 | | >100 | | 21 | | (33 | ) | (30 | ) |
| Wellbutrin XL | 186 | | 9 | | (3 | ) | 207 | | 29 | | 23 | | 208 | | 34 | | 36 | | 192 | | 35 | | 48 | |
| Imigran/Imitrex | 138 | | 12 | | – | | 144 | | 15 | | 10 | | 134 | | 19 | | 20 | | 135 | | – | | 10 | |
| Lamictal | 204 | | 39 | | 25 | | 201 | | 43 | | 39 | | 186 | | 31 | | 33 | | 174 | | 33 | | 45 | |
| Requip | 52 | | 97 | | 79 | | 46 | | >100 | | 100 | | 41 | | >100 | | >100 | | 37 | | >100 | | >100 | |
| |
| Anti-virals | 333 | | 8 | | (4 | ) | 339 | | 6 | | 2 | | 344 | | 11 | | 13 | | 338 | | 3 | | 12 | |
| HIV | 168 | | (7 | ) | (17 | ) | 168 | | (11 | ) | (15 | ) | 182 | | (5 | ) | (3 | ) | 182 | | (5 | ) | 2 | |
| Combivir | 56 | | (15 | ) | (24 | ) | 57 | | (15 | ) | (20 | ) | 63 | | (11 | ) | (10 | ) | 62 | | (16 | ) | (9 | ) |
| Trizivir | 32 | | (16 | ) | (27 | ) | 34 | | (19 | ) | (21 | ) | 38 | | (5 | ) | (5 | ) | 37 | | (13 | ) | (5 | ) |
| Epivir | 15 | | (23 | ) | (32 | ) | 16 | | (23 | ) | (27 | ) | 18 | | (29 | ) | (25 | ) | 20 | | (24 | ) | (20 | ) |
| Ziagen | 12 | | (7 | ) | (14 | ) | 11 | | (8 | ) | (15 | ) | 12 | | (20 | ) | (20 | ) | 13 | | (8 | ) | – | |
| Agenerase, Lexiva | 19 | | 5 | | (5 | ) | 18 | | (10 | ) | (10 | ) | 18 | | 13 | | 13 | | 19 | | 29 | | 36 | |
| Epzicom/Kivexa | 33 | | 29 | | 18 | | 31 | | 38 | | 29 | | 32 | | 72 | | 78 | | 29 | | 80 | | 93 | |
| | | | | | | | | | | | | | | | | | | | | | | | | |
| Herpes | 154 | | 30 | | 17 | | 160 | | 35 | | 30 | | 151 | | 39 | | 41 | | 145 | | 17 | | 27 | |
| Valtrex | 150 | | 28 | | 15 | | 158 | | 36 | | 31 | | 149 | | 39 | | 41 | | 143 | | 17 | | 28 | |
| Zovirax | 4 | | >100 | | >100 | | 2 | | – | | – | | 2 | | 100 | | 100 | | 2 | | – | | – | |
| | | | | | | | | | | | | | | | | | | | | | | | | |
| Zeffix | 3 | | 33 | | – | | 4 | | – | | 33 | | 3 | | – | | – | | 3 | | – | | – | |
| Relenza | – | | – | | – | | – | | – | | – | | – | | – | | – | | – | | – | | – | |
| |
| Metabolic | 321 | | 45 | | 30 | | 289 | | 15 | | 8 | | 372 | | 37 | | 39 | | 295 | | 26 | | 37 | |
| Avandia | 246 | | 32 | | 17 | | 242 | | 14 | | 8 | | 315 | | 25 | | 27 | | 265 | | 34 | | 46 | |
| Avandamet | 32 | | 40 | | 28 | | 13 | | (64 | ) | (67 | ) | 37 | | >100 | | >100 | | 4 | | (88 | ) | (88 | ) |
| Avandaryl | 14 | | – | | – | | 10 | | – | | – | | 4 | | – | | – | | 12 | | – | | – | |
| Bonviva/Boniva | 29 | | >100 | | >100 | | 24 | | >100 | | >100 | | 16 | | >100 | | >100 | | 14 | | – | | – | |
| |
| Vaccines | 162 | | 84 | | 71 | | 130 | | 8 | | 6 | | 90 | | 35 | | 36 | | 83 | | 41 | | 54 | |
| Hepatitis | 43 | | 38 | | 26 | | 39 | | – | | (9 | ) | 42 | | 24 | | 27 | | 37 | | 27 | | 42 | |
| Infanrix, Pediarix | 47 | | 37 | | 24 | | 45 | | (4 | ) | (6 | ) | 39 | | 25 | | 22 | | 41 | | 32 | | 46 | |
| Boostrix | 13 | | 63 | | 63 | | 14 | | 75 | | 75 | | 9 | | >100 | | >100 | | 5 | | – | | – | |
| |
| Cardiovascular and urogenital | 281 | | 44 | | 29 | | 269 | | 37 | | 31 | | 228 | | 36 | | 36 | | 294 | | 53 | | 67 | |
| Coreg | 198 | | 39 | | 25 | | 193 | | 32 | | 26 | | 158 | | 28 | | 27 | | 224 | | 54 | | 68 | |
| Levitra | 12 | | 44 | | 33 | | 11 | | 71 | | 57 | | 8 | | – | | – | | 10 | | – | | 11 | |
| Avodart | 36 | | 95 | | 71 | | 37 | | 85 | | 85 | | 30 | | >100 | | >100 | | 28 | | >100 | | >100 | |
| Arixtra | 12 | | >100 | | 100 | | 7 | | >100 | | >100 | | 6 | | 50 | | 50 | | 7 | | >100 | | >100 | |
| Fraxiparine | – | | – | | – | | – | | – | | – | | – | | – | | – | | – | | – | | – | |
| |
| Anti-bacterials | 57 | | (15 | ) | (22 | ) | 52 | | (2 | ) | (7 | ) | 46 | | (16 | ) | (16 | ) | 62 | | (25 | ) | (18 | ) |
| Augmentin | 25 | | (20 | ) | (29 | ) | 20 | | (28 | ) | (31 | ) | 18 | | (38 | ) | (38 | ) | 31 | | (38 | ) | (34 | ) |
| Zinnat/Ceftin | 3 | | – | | (25 | ) | 3 | | – | | 50 | | 2 | | 100 | | 100 | | 4 | | 33 | | 33 | |
| |
| Oncology and emesis | 162 | | (10 | ) | (22 | ) | 223 | | 18 | | 12 | | 226 | | 21 | | 23 | | 225 | | 20 | | 32 | |
| Zofran | 130 | | (16 | ) | (27 | ) | 185 | | 16 | | 11 | | 183 | | 18 | | 19 | | 181 | | 19 | | 30 | |
| Hycamtin | 18 | | 18 | | 6 | | 17 | | – | | (6 | ) | 17 | | 21 | | 21 | | 20 | | 6 | | 18 | |
| |
| Other | 18 | | 5 | | (5 | ) | 18 | | 6 | | – | | 22 | | 31 | | 38 | | 25 | | 35 | | 47 | |
| Zantac | 16 | | 12 | | (6 | ) | 16 | | 7 | | 7 | | 19 | | 46 | | 46 | | 21 | | 54 | | 62 | |
| |
| Total | 2,610 | | 15 | | 4 | | 2,574 | | 14 | | 9 | | 2,554 | | 18 | | 20 | | 2,615 | | 15 | | 26 | |
| |
Pharmaceutical turnover includes co-promotion income.
| |
|
| GSK Annual Report 2006 |
| 169 |
<Back to Contents
| |
| Financial record |
| continued |
|
| |
Pharmaceutical turnover – Europe
| | Q4 2006 | | Q3 2006 | | Q2 2006 | | Q1 2006 | |
| |
| |
| |
| |
| |
| | £m | | CER % | | £% | | £m | | CER % | | £% | | £m | | CER % | | £% | | £m | | CER % | | £% | |
| |
| Respiratory | 433 | | 1 | | (1 | ) | 399 | | 4 | | 3 | | 441 | | 3 | | 5 | | 424 | | 3 | | 2 | |
| Seretide/Advair | 293 | | 8 | | 6 | | 271 | | 12 | | 10 | | 293 | | 10 | | 13 | | 276 | | 11 | | 10 | |
| Flixotide/Flovent | 42 | | (12 | ) | (14 | ) | 39 | | (7 | ) | (7 | ) | 45 | | (8 | ) | (6 | ) | 47 | | (4 | ) | (4 | ) |
| Serevent | 33 | | (13 | ) | (15 | ) | 35 | | (11 | ) | (8 | ) | 36 | | (16 | ) | (16 | ) | 36 | | (10 | ) | (10 | ) |
| Flixonase/Flonase | 11 | | (15 | ) | (15 | ) | 10 | | (29 | ) | (29 | ) | 17 | | (11 | ) | (11 | ) | 13 | | (7 | ) | (7 | ) |
|
|
|
|
|
|
|
|
|
|
|
|
|
|
|
|
|
|
|
|
|
|
|
| |
| Central Nervous System | 137 | | (17 | ) | (18 | ) | 142 | | (16 | ) | (17 | ) | 152 | | (18 | ) | (16 | ) | 164 | | (10 | ) | (11 | ) |
| Seroxat/Paxil | 35 | | (10 | ) | (13 | ) | 35 | | (27 | ) | (27 | ) | 38 | | (19 | ) | (19 | ) | 41 | | (21 | ) | (21 | ) |
| Paxil IR | 35 | | (10 | ) | (13 | ) | 35 | | (29 | ) | (29 | ) | 38 | | (17 | ) | (17 | ) | 41 | | (21 | ) | (21 | ) |
| Paxil CR | – | | – | | – | | – | | – | | – | | – | | – | | – | | – | | – | | – | |
| Wellbutrin | – | | – | | – | | 1 | | – | | – | | – | | – | | – | | 1 | | – | | – | |
| Wellbutrin IR, SR | – | | – | | – | | 1 | | – | | – | | – | | – | | – | | 1 | | – | | – | |
| Wellbutrin XL | – | | – | | – | | – | | – | | – | | – | | – | | – | | – | | – | | – | |
| Imigran/Imitrex | 25 | | (34 | ) | (34 | ) | 26 | | (28 | ) | (28 | ) | 30 | | (19 | ) | (19 | ) | 37 | | 12 | | 12 | |
| Lamictal | 39 | | (22 | ) | (24 | ) | 42 | | (16 | ) | (16 | ) | 46 | | (27 | ) | (26 | ) | 48 | | (22 | ) | (24 | ) |
| Requip | 21 | | 16 | | 11 | | 21 | | 24 | | 24 | | 20 | | 18 | | 18 | | 19 | | 27 | | 27 | |
|
|
|
|
|
|
|
|
|
|
|
|
|
|
|
|
|
|
|
|
|
|
|
| |
| Anti-virals | 210 | | 11 | | 8 | | 218 | | 14 | | 13 | | 218 | | 7 | | 10 | | 209 | | 14 | | 12 | |
| HIV | 146 | | (3 | ) | (5 | ) | 149 | | – | | (2 | ) | 163 | | 1 | | 4 | | 163 | | 14 | | 13 | |
| Combivir | 48 | | (9 | ) | (11 | ) | 52 | | (9 | ) | (9 | ) | 58 | | (3 | ) | (3 | ) | 59 | | 5 | | 5 | |
| Trizivir | 25 | | (13 | ) | (17 | ) | 27 | | (10 | ) | (10 | ) | 29 | | (9 | ) | (9 | ) | 32 | | 3 | | 3 | |
| Epivir | 18 | | (34 | ) | (38 | ) | 21 | | (33 | ) | (30 | ) | 25 | | (27 | ) | (24 | ) | 26 | | (10 | ) | (13 | ) |
| Ziagen | 10 | | (9 | ) | (9 | ) | 10 | | (23 | ) | (23 | ) | 10 | | (38 | ) | (38 | ) | 11 | | (21 | ) | (21 | ) |
| Agenerase, Lexiva | 12 | | 18 | | 9 | | 12 | | 33 | | 33 | | 12 | | 50 | | 50 | | 12 | | 71 | | 71 | |
| Epzicom/Kivexa | 29 | | 100 | | 93 | | 26 | | >100 | | >100 | | 23 | | >100 | | >100 | | 19 | | >100 | | >100 | |
| | | | | | | | | | | | | | | | | | | | | | | | | |
| Herpes | 36 | | 9 | | 6 | | 36 | | 3 | | 3 | | 36 | | 3 | | 6 | | 36 | | 3 | | – | |
| Valtrex | 27 | | 17 | | 13 | | 28 | | 12 | | 12 | | 28 | | 13 | | 17 | | 26 | | 8 | | 4 | |
| Zovirax | 9 | | (10 | ) | (10 | ) | 8 | | (20 | ) | (20 | ) | 8 | | (20 | ) | (20 | ) | 10 | | (9 | ) | (9 | ) |
| | | | | | | | | | | | | | | | | | | | | | | | | |
| Zeffix | 6 | | – | | – | | 6 | | 50 | | 50 | | 6 | | (14 | ) | (14 | ) | 5 | | 25 | | 25 | |
| Relenza | 22 | | >100 | | >100 | | 24 | | >100 | | >100 | | 10 | | – | | – | | 6 | | – | | – | |
|
|
|
|
|
|
|
|
|
|
|
|
|
|
|
|
|
|
|
|
|
|
|
| |
| Metabolic | 69 | | 27 | | 25 | | 64 | | 30 | | 28 | | 61 | | 33 | | 36 | | 58 | | 45 | | 45 | |
| Avandia | 30 | | 7 | | 3 | | 30 | | 7 | | 7 | | 33 | | 14 | | 14 | | 32 | | 23 | | 23 | |
| Avandamet | 27 | | 75 | | 69 | | 25 | | 100 | | 92 | | 21 | | 100 | | >100 | | 19 | | >100 | | >100 | |
| Avandaryl | – | | – | | – | | – | | – | | – | | – | | – | | – | | – | | – | | – | |
| Bonviva/Boniva | 5 | | – | | – | | 3 | | >100 | | >100 | | 3 | | – | | – | | 1 | | – | | – | |
|
|
|
|
|
|
|
|
|
|
|
|
|
|
|
|
|
|
|
|
|
|
|
| |
| Vaccines | 200 | | 20 | | 18 | | 169 | | 6 | | 4 | | 175 | | 16 | | 19 | | 165 | | 46 | | 45 | |
| Hepatitis | 60 | | 11 | | 11 | | 54 | | (5 | ) | (8 | ) | 58 | | (11 | ) | (6 | ) | 55 | | 17 | | 15 | |
| Infanrix, Pediarix | 72 | | 36 | | 31 | | 65 | | 16 | | 16 | | 76 | | 45 | | 49 | | 68 | | 73 | | 70 | |
| Boostrix | 5 | | 67 | | 67 | | 3 | | 50 | | 50 | | 4 | | 100 | | 100 | | 3 | | >100 | | >100 | |
|
|
|
|
|
|
|
|
|
|
|
|
|
|
|
|
|
|
|
|
|
|
|
| |
| Cardiovascular and urogenital | 101 | | (1 | ) | (4 | ) | 96 | | (6 | ) | (7 | ) | 102 | | (5 | ) | (2 | ) | 96 | | (6 | ) | (7 | ) |
| Coreg | – | | – | | – | | – | | – | | – | | – | | – | | – | | – | | – | | – | |
| Levitra | – | | – | | – | | – | | – | | – | | 1 | | – | | – | | – | | – | | – | |
| Avodart | 19 | | 27 | | 27 | | 17 | | 21 | | 21 | | 17 | | 14 | | 21 | | 16 | | 42 | | 33 | |
| Arixtra | 7 | | >100 | | >100 | | 6 | | >100 | | >100 | | 6 | | >100 | | >100 | | 4 | | 100 | | 100 | |
| Fraxiparine | 44 | | (4 | ) | (4 | ) | 44 | | 5 | | 2 | | 47 | | – | | 4 | | 44 | | – | | (2 | ) |
|
|
|
|
|
|
|
|
|
|
|
|
|
|
|
|
|
|
|
|
|
|
|
| |
| Anti-bacterials | 164 | | (9 | ) | (11 | ) | 135 | | (13 | ) | (14 | ) | 149 | | (7 | ) | (4 | ) | 180 | | (18 | ) | (19 | ) |
| Augmentin | 67 | | (15 | ) | (17 | ) | 54 | | (21 | ) | (21 | ) | 64 | | (10 | ) | (9 | ) | 83 | | (15 | ) | (15 | ) |
| Zinnat/Ceftin | 22 | | (24 | ) | (24 | ) | 16 | | (16 | ) | (16 | ) | 18 | | (18 | ) | (18 | ) | 26 | | (38 | ) | (38 | ) |
|
|
|
|
|
|
|
|
|
|
|
|
|
|
|
|
|
|
|
|
|
|
|
| |
| Oncology and emesis | 33 | | (15 | ) | (15 | ) | 37 | | (8 | ) | (8 | ) | 42 | | – | | – | | 41 | | (5 | ) | (5 | ) |
| Zofran | 21 | | (30 | ) | (30 | ) | 25 | | (10 | ) | (14 | ) | 31 | | (9 | ) | (3 | ) | 30 | | (6 | ) | (9 | ) |
| Hycamtin | 8 | | 50 | | 33 | | 10 | | 29 | | 43 | | 9 | | 14 | | 29 | | 7 | | 14 | | – | |
|
|
|
|
|
|
|
|
|
|
|
|
|
|
|
|
|
|
|
|
|
|
|
| |
| Other | 80 | | (7 | ) | (7 | ) | 61 | | (18 | ) | (20 | ) | 64 | | (20 | ) | (20 | ) | 58 | | (30 | ) | (28 | ) |
| Zantac | 13 | | (24 | ) | (24 | ) | 11 | | (31 | ) | (31 | ) | 14 | | (13 | ) | (7 | ) | 14 | | (6 | ) | (13 | ) |
|
|
|
|
|
|
|
|
|
|
|
|
|
|
|
|
|
|
|
|
|
|
|
| |
| Total | 1,427 | | 1 | | (1 | ) | 1,321 | | – | | (1 | ) | 1,404 | | – | | 2 | | 1,395 | | 1 | | 1 | |
|
|
|
|
|
|
|
|
|
|
|
|
|
|
|
|
|
|
|
|
|
|
|
| |
Pharmaceutical turnover includes co-promotion income.
| |
|
| GSK Annual Report 2006 |
| 170 |
<Back to Contents
| |
| Financial record |
| continued |
|
| |
Pharmaceutical turnover – International
| | Q4 2006 | | Q3 2006 | | Q2 2006 | | Q1 2006 | |
| |
| |
| |
| |
| |
| | £m | | CER % | | £% | | £m | | CER % | | £% | | £m | | CER % | | £% | | £m | | CER % | | £% | |
|
|
|
|
|
|
|
|
|
|
|
|
|
|
|
|
|
|
|
|
|
|
|
| |
| Respiratory | 220 | | – | | (8 | ) | 193 | | 3 | | (2 | ) | 209 | | 10 | | 11 | | 215 | | 4 | | 13 | |
| Seretide/Advair | 76 | | 1 | | (6 | ) | 78 | | 7 | | 5 | | 76 | | 12 | | 10 | | 80 | | 20 | | 36 | |
| Flixotide/Flovent | 51 | | 4 | | (4 | ) | 42 | | – | | (5 | ) | 50 | | 4 | | 6 | | 45 | | (2 | ) | 2 | |
| Serevent | 19 | | 11 | | – | | 14 | | – | | (13 | ) | 17 | | 6 | | 6 | | 15 | | – | | – | |
| Flixonase/Flonase | 20 | | (8 | ) | (17 | ) | 15 | | 23 | | 15 | | 17 | | – | | 6 | | 24 | | (38 | ) | (35 | ) |
|
|
|
|
|
|
|
|
|
|
|
|
|
|
|
|
|
|
|
|
|
|
|
| |
| Central Nervous System | 118 | | (3 | ) | (11 | ) | 110 | | – | | (7 | ) | 122 | | 5 | | 4 | | 109 | | 9 | | 14 | |
| Seroxat/Paxil | 79 | | (1 | ) | (8 | ) | 69 | | 7 | | (4 | ) | 81 | | 7 | | 7 | | 67 | | 10 | | 10 | |
| Paxil IR | 75 | | – | | (9 | ) | 66 | | 6 | | (3 | ) | 76 | | 5 | | 3 | | 63 | | 7 | | 7 | |
| Paxil CR | 4 | | (25 | ) | – | | 3 | | 25 | | (25 | ) | 5 | | 50 | | >100 | | 4 | | 100 | | 100 | |
| Wellbutrin | 4 | | (25 | ) | – | | 4 | | (20 | ) | (20 | ) | 5 | | >100 | | >100 | | 3 | | (33 | ) | – | |
| Wellbutrin IR, SR | 3 | | (33 | ) | – | | 3 | | (25 | ) | (25 | ) | 3 | | >100 | | >100 | | 2 | | (50 | ) | – | |
| Wellbutrin XL | 1 | | – | | – | | 1 | | – | | – | | 2 | | 100 | | 100 | | 1 | | – | | – | |
| Imigran/Imitrex | 11 | | – | | (8 | ) | 10 | | (15 | ) | (23 | ) | 11 | | (23 | ) | (15 | ) | 10 | | (9 | ) | (9 | ) |
| Lamictal | 14 | | – | | – | | 14 | | 7 | | (7 | ) | 13 | | (7 | ) | (7 | ) | 15 | | 8 | | 25 | |
| Requip | 3 | | – | | 50 | | 3 | | 50 | | 50 | | 3 | | 50 | | 50 | | 2 | | – | | – | |
|
|
|
|
|
|
|
|
|
|
|
|
|
|
|
|
|
|
|
|
|
|
|
| |
| Anti-virals | 163 | | 11 | | 4 | | 146 | | 11 | | 6 | | 157 | | 21 | | 21 | | 152 | | 22 | | 31 | |
| HIV | 46 | | 2 | | (6 | ) | 46 | | (4 | ) | (6 | ) | 48 | | 24 | | 14 | | 54 | | 12 | | 32 | |
| Combivir | 15 | | (20 | ) | (25 | ) | 16 | | (5 | ) | (16 | ) | 20 | | 6 | | 11 | | 22 | | 25 | | 38 | |
| Trizivir | 4 | | – | | 33 | | 2 | | (25 | ) | (50 | ) | 5 | | 33 | | 67 | | 3 | | (25 | ) | (25 | ) |
| Epivir | 10 | | – | | (9 | ) | 9 | | (8 | ) | (31 | ) | 10 | | (9 | ) | (9 | ) | 14 | | 9 | | 27 | |
| Ziagen | 6 | | (22 | ) | (33 | ) | 7 | | – | | – | | 7 | | 40 | | 40 | | 8 | | 17 | | 33 | |
| Agenerase, Lexiva | 3 | | 50 | | 50 | | 2 | | – | | – | | 2 | | – | | – | | 2 | | – | | 100 | |
| Epzicom/Kivexa | 7 | | >100 | | >100 | | 6 | | >100 | | >100 | | 3 | | >100 | | >100 | | 3 | | – | | – | |
| | | | | | | | | | | | | | | | | | | | | | | | | |
| Herpes | 52 | | (5 | ) | (10 | ) | 46 | | – | | (12 | ) | 58 | | 9 | | 7 | | 55 | | 11 | | 17 | |
| Valtrex | 35 | | 6 | | – | | 29 | | – | | (12 | ) | 37 | | 16 | | 16 | | 35 | | 22 | | 30 | |
| Zovirax | 17 | | (22 | ) | (26 | ) | 17 | | – | | (11 | ) | 21 | | – | | (5 | ) | 20 | | (5 | ) | – | |
| | | | | | | | | | | | | | | | | | | | | | | | | |
| Zeffix | 33 | | 3 | | – | | 32 | | 13 | | 7 | | 31 | | 11 | | 15 | | 30 | | 27 | | 36 | |
| Relenza | 15 | | >100 | | >100 | | 6 | | >100 | | >100 | | 7 | | >100 | | >100 | | 1 | | – | | – | |
|
|
|
|
|
|
|
|
|
|
|
|
|
|
|
|
|
|
|
|
|
|
|
| |
| Metabolic | 84 | | 7 | | (2 | ) | 85 | | 10 | | 8 | | 96 | | 15 | | 19 | | 81 | | 17 | | 27 | |
| Avandia | 48 | | 4 | | (4 | ) | 51 | | 16 | | 13 | | 60 | | 19 | | 28 | | 47 | | 17 | | 31 | |
| Avandamet | 9 | | 60 | | 80 | | 6 | | – | | 20 | | 6 | | >100 | | 100 | | 5 | | – | | 25 | |
| Avandaryl | – | | – | | – | | 1 | | – | | – | | 1 | | – | | – | | – | | – | | – | |
| Bonviva/Boniva | – | | – | | – | | – | | – | | – | | – | | – | | – | | – | | – | | – | |
|
|
|
|
|
|
|
|
|
|
|
|
|
|
|
|
|
|
|
|
|
|
|
| |
| Vaccines | 165 | | 10 | | 6 | | 113 | | 2 | | (1 | ) | 122 | | 8 | | 12 | | 118 | | 41 | | 48 | |
| Hepatitis | 25 | | 8 | | 4 | | 21 | | 6 | | 17 | | 21 | | 10 | | – | | 24 | | 10 | | 20 | |
| Infanrix, Pediarix | 17 | | (11 | ) | (11 | ) | 12 | | – | | (14 | ) | 14 | | 44 | | 56 | | 15 | | 40 | | 50 | |
| Boostrix | – | | – | | – | | 1 | | – | | – | | 1 | | 100 | | 100 | | 2 | | >100 | | 100 | |
|
|
|
|
|
|
|
|
|
|
|
|
|
|
|
|
|
|
|
|
|
|
|
| |
| Cardiovascular and urogenital | 39 | | (9 | ) | (11 | ) | 41 | | 23 | | 17 | | 53 | | 30 | | 33 | | 36 | | 10 | | 16 | |
| Coreg | 1 | | – | | – | | 2 | | 100 | | 100 | | 2 | | 100 | | 100 | | 1 | | (50 | ) | (50 | ) |
| Levitra | – | | – | | – | | – | | – | | – | | – | | – | | – | | 1 | | – | | – | |
| Avodart | 6 | | 67 | | 100 | | 3 | | 100 | | 50 | | 4 | | 100 | | 100 | | 3 | | – | | 50 | |
| Arixtra | 2 | | – | | – | | – | | – | | – | | 1 | | 100 | | >100 | | – | | – | | – | |
| Fraxiparine | 9 | | 11 | | – | | 5 | | (17 | ) | (17 | ) | 9 | | – | | (10 | ) | 7 | | (29 | ) | – | |
|
|
|
|
|
|
|
|
|
|
|
|
|
|
|
|
|
|
|
|
|
|
|
| |
| Anti-bacterials | 133 | | (3 | ) | (10 | ) | 124 | | (5 | ) | (9 | ) | 131 | | (5 | ) | (5 | ) | 136 | | 7 | | 14 | |
| Augmentin | 53 | | 2 | | (2 | ) | 47 | | (2 | ) | (10 | ) | 52 | | (9 | ) | (5 | ) | 56 | | 13 | | 19 | |
| Zinnat/Ceftin | 17 | | (14 | ) | (19 | ) | 16 | | (5 | ) | (20 | ) | 17 | | (6 | ) | – | | 20 | | 6 | | 18 | |
|
|
|
|
|
|
|
|
|
|
|
|
|
|
|
|
|
|
|
|
|
|
|
| |
| Oncology and emesis | 18 | | (20 | ) | (28 | ) | 19 | | (13 | ) | (17 | ) | 21 | | (9 | ) | (5 | ) | 22 | | – | | 5 | |
| Zofran | 14 | | (25 | ) | (30 | ) | 13 | | (26 | ) | (32 | ) | 15 | | (6 | ) | (17 | ) | 19 | | (6 | ) | 12 | |
| Hycamtin | 2 | | (50 | ) | – | | 1 | | 100 | | – | | 2 | | 50 | | – | | 2 | | – | | 100 | |
|
|
|
|
|
|
|
|
|
|
|
|
|
|
|
|
|
|
|
|
|
|
|
| |
| Other | 159 | | 6 | | (3 | ) | 150 | | (2 | ) | (7 | ) | 152 | | (8 | ) | (10 | ) | 166 | | 2 | | 8 | |
| Zantac | 26 | | (3 | ) | (13 | ) | 24 | | (10 | ) | (20 | ) | 28 | | (9 | ) | (13 | ) | 30 | | (7 | ) | – | |
|
|
|
|
|
|
|
|
|
|
|
|
|
|
|
|
|
|
|
|
|
|
|
| |
| Total | 1,099 | | 3 | | (5 | ) | 981 | | 3 | | (2 | ) | 1,063 | | 6 | | 7 | | 1,035 | | 12 | | 19 | |
|
|
|
|
|
|
|
|
|
|
|
|
|
|
|
|
|
|
|
|
|
|
|
| |
Pharmaceutical turnover includes co-promotion income.
| |
|
| GSK Annual Report 2006 |
| 171 |
<Back to Contents
| |
| Financial record |
| continued |
|
| |
Five year record
A record of financial performance is provided analysed in accordance with current reporting practice. The transition date to IFRS for GlaxoSmithKline was 1st January 2003. Therefore, the 2006, 2005, 2004 and 2003 information included in the Five year record is in accordance with IFRS as adopted for use in the European Union. For GSK there are no differences between IFRS as adopted for use in the European Union and full IFRS as published by the International Accounting Standards Board. The 2002 information is in accordance with UK GAAP.
To provide a link between IFRS and UK GAAP, 2003 information is also presented under UK GAAP. The accounting policies used in the preparation of the UK GAAP information are disclosed in the 2004 Annual Report. Information prepared under IFRS is not directly comparable with information prepared under UK GAAP.
The Five year record also presents information in accordance with US GAAP.
| Turnover by business segment – IFRS | 2006 | | 2005 | | 2004 | | 2003 | | | |
| | £m | | £m | | £m | | £m | | | |
|
|
|
|
|
|
|
| | | |
| Pharmaceuticals | 20,078 | | 18,661 | | 17,100 | | 18,114 | | | |
| Consumer Healthcare | 3,147 | | 2,999 | | 2,886 | | 2,956 | | | |
|
|
|
|
|
|
|
| | | |
| | 23,225 | | 21,660 | | 19,986 | | 21,070 | | | |
|
|
|
|
|
|
|
| | | |
| | | | | |
| Turnover by business segment – UK GAAP | 2003 | | 2002 | |
| | £m | | £m | |
|
|
|
| |
| Pharmaceuticals | 18,181 | | 17,995 | |
| Consumer Healthcare | 3,260 | | 3,217 | |
|
|
|
| |
| | 21,441 | | 21,212 | |
|
|
|
| |
| | | | | | | | | | | |
| Pharmaceutical turnover by therapeutic area – IFRS | 2006 | | 2005 | | 2004 | | 2003 | | | |
| | £m | | £m | | £m | | £m | | | |
|
|
|
|
|
|
|
| | | |
| Respiratory | 4,995 | | 5,054 | | 4,394 | | 4,390 | | | |
| Central nervous system | 3,642 | | 3,219 | | 3,462 | | 4,446 | | | |
| Anti-virals | 2,827 | | 2,598 | | 2,359 | | 2,345 | | | |
| Metabolic | 1,875 | | 1,495 | | 1,251 | | 1,077 | | | |
| Vaccines | 1,692 | | 1,389 | | 1,194 | | 1,121 | | | |
| Cardiovascular and urogenital | 1,636 | | 1,331 | | 932 | | 770 | | | |
| Anti-bacterials | 1,369 | | 1,519 | | 1,547 | | 1,800 | | | |
| Oncology and emesis | 1,069 | | 1,016 | | 934 | | 1,000 | | | |
| Other | 973 | | 1,040 | | 1,027 | | 1,165 | | | |
|
|
|
|
|
|
|
| | | |
| | 20,078 | | 18,661 | | 17,100 | | 18,114 | | | |
|
|
|
|
|
|
|
| | | |
| | | | | |
| Pharmaceutical turnover by therapeutic area – UK GAAP | 2003 | | 2002 | |
| | £m | | £m | |
|
|
|
| |
| Respiratory | 4,417 | | 3,987 | |
| Central nervous system | 4,455 | | 4,511 | |
| Anti-virals | 2,349 | | 2,299 | |
| Metabolic | 1,079 | | 960 | |
| Vaccines | 1,123 | | 1,080 | |
| Cardiovascular and urogenital | 771 | | 661 | |
| Anti-bacterials | 1,815 | | 2,210 | |
| Oncology and emesis | 1,001 | | 977 | |
| Others | 1,171 | | 1,310 | |
|
|
|
| |
| | 18,181 | | 17,995 | |
|
|
|
| |
| | | | | | | | | | | |
| Pharmaceutical turnover by geographic area – IFRS | 2006 | | 2005 | | 2004 | | 2003 | | | |
| | £m | | £m | | £m | | £m | | | |
|
|
|
|
|
|
|
| | | |
| USA | 10,353 | | 9,106 | | 8,425 | | 9,410 | | | |
| Europe | 5,547 | | 5,537 | | 5,084 | | 5,050 | | | |
| International: | | | | | | | | | | |
| Asia Pacific | 1,377 | | 1,324 | | 1,161 | | 1,138 | | | |
| Japan | 860 | | 854 | | 769 | | 751 | | | |
| Middle East, Africa | 744 | | 746 | | 669 | | 693 | | | |
| Latin America | 714 | | 651 | | 581 | | 598 | | | |
| Canada | 483 | | 443 | | 411 | | 474 | | | |
|
|
|
|
|
|
|
| | | |
| International | 4,178 | | 4,018 | | 3,591 | | 3,654 | | | |
|
|
|
|
|
|
|
| | | |
| | 20,078 | | 18,661 | | 17,100 | | 18,114 | | | |
|
|
|
|
|
|
|
| | | |
| |
|
| GSK Annual Report 2006 |
| 172 |
<Back to Contents
| |
| Financial record |
| continued |
|
| |
| Pharmaceutical turnover by geographic area – UK GAAP | 2003 | | 2002 | |
| | £m | | £m | |
|
|
|
| |
| USA | 9,410 | | 9,797 | |
| Europe | 5,114 | | 4,701 | |
| International: | | | | |
| Asia Pacific | 1,140 | | 1,100 | |
| Japan | 753 | | 712 | |
| Middle East, Africa | 693 | | 652 | |
| Latin America | 597 | | 606 | |
| Canada | 474 | | 427 | |
|
|
|
| |
| International | 3,657 | | 3,497 | |
|
|
|
| |
| | 18,181 | | 17,995 | |
|
|
|
| |
Pharmaceutical turnover in 2006, 2005, 2004 and 2003 includes co-promotion income.
| Consumer healthcare turnover – IFRS | 2006 | | 2005 | | 2004 | | 2003 | | | |
| | £m | | £m | | £m | | £m | | | |
|
|
|
|
|
|
|
| | | |
| OTC medicines | 1,496 | | 1,437 | | 1,400 | | 1,472 | | | |
| Oral care | 993 | | 943 | | 913 | | 915 | | | |
| Nutritional healthcare | 658 | | 619 | | 573 | | 569 | | | |
|
|
|
|
|
|
|
| | | |
| | 3,147 | | 2,999 | | 2,886 | | 2,956 | | | |
|
|
|
|
|
|
|
| | | |
| | | | | |
| Consumer healthcare turnover – UK GAAP | 2003 | | 2002 | |
| | £m | | £m | |
|
|
|
| |
| OTC medicines | 1,556 | | 1,586 | |
| Oral care | 1,082 | | 1,052 | |
| Nutritional healthcare | 622 | | 579 | |
|
|
|
| |
| | 3,260 | | 3,217 | |
|
|
|
| |
| | | | | | | | | | | |
| Financial results – IFRS | 2006 | | 2005 | | 2004 | | 2003 | | | |
| | £m | | £m | | £m | | £m | | | |
|
|
|
|
|
|
|
| | | |
| Turnover | 23,225 | | 21,660 | | 19,986 | | 21,070 | | | |
| Operating profit | 7,808 | | 6,874 | | 5,756 | | 6,050 | | | |
| Profit before taxation | 7,799 | | 6,732 | | 5,779 | | 5,954 | | | |
| Profit after taxation | 5,498 | | 4,816 | | 4,022 | | 4,308 | | | |
| Basic earnings per share (pence) | 95.5 | p | 82.6 | p | 68.1 | p | 72.3 | p | | |
| Diluted earnings per share (pence) | 94.5 | p | 82.0 | p | 68.0 | p | 72.1 | p | | |
| Weighted average number of shares in issue: | | | | | | | | | | |
| Basic | 5,643 | | 5,674 | | 5,736 | | 5,806 | | | |
| Diluted | 5,700 | | 5,720 | | 5,748 | | 5,824 | | | |
|
|
|
|
|
|
|
| | | |
| Return on capital employed (%) | 90.6 | | 99.7 | | 100.2 | | 116.6 | | | |
|
|
|
|
|
|
|
| | | |
| | | | | |
| Financial results – UK GAAP | 2003 | | 2002 | |
| | £m | | £m | |
|
|
|
| |
| Turnover | 21,441 | | 21,212 | |
| Operating profit | 6,376 | | 5,569 | |
| Profit before taxation | 6,313 | | 5,524 | |
| Profit after taxation | 4,584 | | 4,060 | |
| Basic earnings per share (pence) | 77.1 | p | 66.5 | p |
| Diluted earnings per share (pence) | 76.9 | p | 66.3 | p |
| Weighted average number of shares in issue: | | | | |
| Basic | 5,806 | | 5,912 | |
| Diluted | 5,824 | | 5,934 | |
|
|
|
| |
| Return on capital employed (%) | 120.8 | | 110.6 | |
|
|
|
| |
Return on capital employed is calculated as statutory profit before taxation as a percentage of average capital employed over the year.
| |
|
| GSK Annual Report 2006 |
| 173 |
<Back to Contents
| |
| Financial record |
| continued |
|
| |
| Amounts in accordance with US GAAP | 2006 | | 2005 | | 2004 | | 2003 | | 2002 | |
| £m | £m | £m | £m | £m |
|
|
|
|
|
|
|
|
|
| |
| Turnover | 23,225 | | 21,660 | | 19,986 | | 21,117 | | 21,212 | |
| Net income | 4,465 | | 3,336 | | 2,732 | | 2,420 | | 413 | |
| Basic net income per share (pence) | 79.1 | p | 58.8 | p | 47.6 | p | 41.7 | p | 7.0 | p |
| Diluted net income per share (pence) | 78.4 | p | 58.3 | p | 47.5 | p | 41.6 | p | 7.0 | p |
|
|
|
|
|
|
|
|
|
| |
The information presented in accordance with US GAAP is derived from financial information prepared under IFRS, as adopted for use in the European Union, for 2003-2006 and from UK GAAP for 2002.
| Balance sheet – IFRS | | | | | | | | |
| | 2006 | | 2005 | | 2004 | | 2003 | |
| £m | £m | £m | £m |
|
|
|
|
|
|
|
| |
| Non-current assets | 14,561 | | 14,021 | | 12,164 | | 11,622 | |
| Current assets | 10,992 | | 13,177 | | 10,780 | | 10,298 | |
|
|
|
|
|
|
|
| |
| Total assets | 25,553 | | 27,198 | | 22,944 | | 21,920 | |
| Current liabilities | (7,265 | ) | (9,511 | ) | (8,564 | ) | (8,314 | ) |
| Non-current liabilities | (8,640 | ) | (10,117 | ) | (8,443 | ) | (8,008 | ) |
|
|
|
|
|
|
|
| |
| Total liabilities | (15,905 | ) | (19,628 | ) | (17,007 | ) | (16,322 | ) |
|
|
|
|
|
|
|
| |
| Net assets | 9,648 | | 7,570 | | 5,937 | | 5,598 | |
|
|
|
|
|
|
|
| |
| Equity | | | | | | | | |
|
|
|
|
|
|
|
| |
| Shareholders’ equity | 9,386 | | 7,311 | | 5,724 | | 4,917 | |
| Minority interests | 262 | | 259 | | 213 | | 681 | |
|
|
|
|
|
|
|
| |
| | 9,648 | | 7,570 | | 5,937 | | 5,598 | |
|
|
|
|
|
|
|
| |
| | | | | | | | | |
| Balance sheet – UK GAAP | | | | |
| | 2003 | | 2002 | |
| £m | £m |
|
|
|
| |
| Fixed assets | 8,575 | | 8,752 | |
| Current assets | 12,625 | | 10,749 | |
|
|
|
| |
| Total assets | 21,200 | | 19,501 | |
| Current liabilities | (8,471 | ) | (8,724 | ) |
| Non-current liabilities | (6,925 | ) | (6,130 | ) |
|
|
|
| |
| Total liabilities | (15,396 | ) | (14,854 | ) |
|
|
|
| |
| Net assets | 5,804 | | 4,647 | |
|
|
|
| |
| Equity | | | | |
|
|
|
| |
| Shareholders’ equity | 5,059 | | 3,840 | |
| Minority interests | 745 | | 807 | |
|
|
|
| |
| | 5,804 | | 4,647 | |
|
|
|
| |
| | | | | |
| Amounts in accordance with US GAAP | | | | | | | | | | |
| | 2006 | | 2005 | | 2004 | | 2003 | | 2002 | |
| £m | £m | £m | £m | £m |
|
|
|
|
|
|
|
|
|
| |
| Total assets | 54,623 | | 57,218 | | 55,841 | | 56,400 | | 57,671 | |
| Net assets | 34,914 | | 34,599 | | 34,429 | | 34,861 | | 35,729 | |
| Long-term borrowings | (4,806 | ) | (5,293 | ) | (4,374 | ) | (3,640 | ) | (3,085 | ) |
| Shareholders’ equity | 34,653 | | 34,282 | | 34,042 | | 34,116 | | 34,922 | |
|
|
|
|
|
|
|
|
|
| |
| |
|
| GSK Annual Report 2006 |
| 174 |
<Back to Contents
| |
| Financial record |
| continued |
|
| |
| Number of employees | | | | | | | | | | |
| | 2006 | | 2005 | | 2004 | | 2003 | | 2002 | |
|
|
|
|
|
|
|
|
|
| |
| USA | 24,726 | | 23,822 | | 23,782 | | 24,036 | | 23,527 | |
| Europe | 45,758 | | 43,999 | | 44,679 | | 44,559 | | 46,028 | |
| International: | | | | | | | | | | |
| Asia Pacific | 17,570 | | 15,991 | | 16,109 | | 18,373 | | 17,289 | |
| Japan | 3,195 | | 3,098 | | 2,965 | | 2,842 | | 2,952 | |
| Middle East, Africa | 3,204 | | 5,682 | | 5,134 | | 3,400 | | 5,973 | |
| Latin America | 5,856 | | 5,664 | | 5,603 | | 5,916 | | 6,876 | |
| Canada | 2,386 | | 2,472 | | 1,747 | | 1,793 | | 1,854 | |
|
|
|
|
|
|
|
|
|
| |
| International | 32,211 | | 32,907 | | 31,558 | | 32,324 | | 34,944 | |
|
|
|
|
|
|
|
|
|
| |
| | 102,695 | | 100,728 | | 100,019 | | 100,919 | | 104,499 | |
|
|
|
|
|
|
|
|
|
| |
| Manufacturing | 33,235 | | 31,615 | | 31,143 | | 32,459 | | 35,503 | |
| Selling | 44,484 | | 44,393 | | 44,646 | | 43,978 | | 43,994 | |
| Administration | 9,024 | | 9,225 | | 9,193 | | 9,550 | | 10,378 | |
| Research and development | 15,952 | | 15,495 | | 15,037 | | 14,932 | | 14,624 | |
|
|
|
|
|
|
|
|
|
| |
| | 102,695 | | 100,728 | | 100,019 | | 100,919 | | 104,499 | |
|
|
|
|
|
|
|
|
|
| |
The number of employees is the number of permanent employed staff at the end of the financial period. It excludes those employees who are employed and managed by GlaxoSmithKline on a contract basis.
Exchange rates
As a guide to holders of ADRs, the following tables set out, for the periods indicated, information on the exchange rate of US dollars for Sterling as reported by the Federal Reserve Bank of New York (‘noon buying rate’).
| | 2006 | | 2005 | | 2004 | | 2003 | | 2002 | |
|
|
|
|
|
|
|
|
|
| |
| Average | 1.85 | | 1.81 | | 1.84 | | 1.63 | | 1.51 | |
|
|
|
|
|
|
|
|
|
| |
The average rate for the year is calculated as the average of the noon buying rates on the last day of each month during the year.
| | Feb | | Jan | | Dec | | Nov | | Oct | | Sept | |
| 2007 | 2007 | 2006 | 2006 | 2006 | 2006 |
|
|
|
|
|
|
|
|
|
|
|
| |
| High | 1.97 | | 1.98 | | 1.98 | | 1.97 | | 1.91 | | 1.91 | |
| Low | 1.94 | | 1.93 | | 1.95 | | 1.89 | | 1.85 | | 1.86 | |
|
|
|
|
|
|
|
|
|
|
|
| |
The noon buying rate on 23rd February 2007 was £1 = US$1.96.
| |
|
| GSK Annual Report 2006 |
| 175 |
<Back to Contents
| Share price | | | | | | |
| | 2006 | | 2005 | | 2004 | |
| £ | £ | £ |
|
|
|
|
|
| |
| At 1st January | 14.69 | | 12.22 | | 12.80 | |
| High during the year | 15.77 | | 15.44 | | 12.99 | |
| Low during the year | 13.26 | | 11.75 | | 10.42 | |
| At 31st December | 13.44 | | 14.69 | | 12.22 | |
| (Decrease)/Increase | (9)% | | 20% | | (5)% | |
|
|
|
|
|
| |
The table above sets out the middle market closing prices derived from the London Stock Exchange Daily Official List. The company’s share price decreased by 9% in 2006 from a price of £14.69 at 1st January 2006 to £13.44 at 31st December 2006. This compares with an increase in the FTSE 100 index of 11% during the year. The share price on 23rd February 2007 was £14.50.
Market capitalisation
The market capitalisation, based on shares in public issue, of GlaxoSmithKline at 31st December 2006 was £77 billion. At that date GSK was the fourth largest company by market capitalisation on the FTSE index.
SmithKline Beecham plc Floating Rate Unsecured Loan Stock 1990/2010
The loan stock is not listed on any exchange but holders may require SmithKline Beecham plc to redeem their loan stock at par, i.e. £1 for every £1 of loan stock held, on the first business day of March, June, September and December. Holders wishing to redeem all or part of their loan stock should complete the notice on the back of their loan stock certificate and return it to the registrar, to arrive at least 30 days before the relevant redemption date.
Taxation
General information concerning the UK and US tax effects of share ownership is set out in 'Taxation information for shareholders' on page 180.
Dividends
GlaxoSmithKline pays dividends quarterly. Details of the dividends declared, the amount and the payment dates are given in Note 14.
Dividends per share
The table below sets out the dividends per share in the last five years.
| Year | pence | |
|
| |
| 2006 | 48.0 | |
| 2005 | 44.0 | |
| 2004 | 42.0 | |
| 2003 | 41.0 | |
| 2002 | 40.0 | |
|
| |
Dividends per ADS
The table below sets out the dividends per ADS in US dollars in the last five years, translated into US dollars at applicable exchange rates.
| Year | US$ | |
|
| |
| 2006 | 1.80 | |
| 2005 | 1.57 | |
| 2004 | 1.53 | |
| 2003 | 1.39 | |
| 2002 | 1.24 | |
|
| |
| | | |
| Dividend calendar | | |
| Fourth quarter 2006 | | |
|
| |
| Ex-dividend date | 14th February 2007 | |
| Record date | 16th February 2007 | |
| Payable | 12th April 2007 | |
|
| |
| First quarter 2007 | | |
|
| |
| Ex-dividend date | 2nd May 2007 | |
| Record date | 4th May 2007 | |
| Payable | 12th July 2007 | |
|
| |
| Second quarter 2007 | | |
|
| |
| Ex-dividend date | 1st August 2007 | |
| Record date | 3rd August 2007 | |
| Payable | 11th October 2007 | |
|
| |
| Third quarter 2007 | | |
|
| |
| Ex-dividend date | 31st October 2007 | |
| Record date | 2nd November 2007 | |
| Payable | 10th January 2008 | |
|
| |
Internet
Information about the company including details of the share price is available on GSK’s website at www.gsk.com.
Information made available on the website does not constitute part of this Annual Report.
Investor relations
Investor Relations may be contacted as follows:
UK
980 Great West Road, Brentford, Middlesex TW8 9GS
Tel: +44 (0)20 8047 5000
USA
One Franklin Plaza, PO Box 7929, Philadelphia PA 19101
Tel: 1 888 825 5249 toll free
Tel: +1 215 751 4000 outside the USA
| |
|
| GSK Annual Report 2006 |
| 176 |
<Back to Contents
| |
| Shareholder information |
| continued |
|
| |
| Analysis of shareholdings | | | | | | | | |
| Analysis of shareholdings at 31st December 2006 | Number of | % of total | % of total | Number of |
| accounts | accounts | shares | shares |
|
|
|
|
|
|
|
| |
| Holding of shares | | | | | | | | |
| Up to 1,000 | 130,906 | | 71 | | 1 | | 46,807,426 | |
| 1,001 to 5,000 | 41,712 | | 23 | | 2 | | 89,668,014 | |
| 5,001 to 100,000 | 10,210 | | 5 | | 2 | | 148,081,033 | |
| 100,001 to 1,000,000 | 1,048 | | 1 | | 6 | | 366,110,174 | |
| Over 1,000,000 | 490 | | – | | 89 | | 5,340,935,201 | |
|
|
|
|
|
|
|
| |
| Totals | 184,366 | | 100 | | 100 | | 5,991,601,848 | |
|
|
|
|
|
|
|
| |
| Held by | | | | | | | | |
| Nominee companies | 30,702 | | 17 | | 78 | | 4,643,364,576 | |
| Investment and trust companies | 57 | | – | | 1 | | 58,018,488 | |
| Insurance companies | 14 | | – | | – | | 162,380 | |
| Individuals and other corporate bodies | 153,591 | | 83 | | 5 | | 324,318,199 | |
| BNY (Nominees) Limited | 1 | | – | | 12 | | 730,255,527 | |
| Held as Treasury shares by GlaxoSmithKline | 1 | | – | | 4 | | 235,482,678 | |
|
|
|
|
|
|
|
| |
| Totals | 184,366 | | 100 | | 100 | | 5,991,601,848 | |
|
|
|
|
|
|
|
| |
The Bank of New York’s holding held through BNY (Nominees) Limited represents the company’s ADR programme, whereby each ADS represents two Ordinary Shares of 25p nominal value.
At 23rd February 2007, the number of holders of record of shares in the USA was 1,143 with holdings of 1,508,043 shares, and the number of registered holders of the ADRs was 39,173 with holdings of 423,258,574 ADRs. Certain of these shares and ADRs were held by brokers or other nominees. As a result the number of holders of record or registered holders in the USA is not representative of the number of beneficial holders or of the residence of beneficial holders.
Control of company
As far as is known to the company, it is not directly or indirectly owned or controlled by one or more corporations or by any government. The company does not know of any arrangements, the operation of which might result in a change in control of the company.
Major shareholders have the same voting rights per share as all other shareholders.
Substantial shareholdings
| At 23rd February 2007, the company had received notification of the following interests of 3% or more in the shares in issue, excluding Treasury shares: |
| | |
| • | BNY (Nominees) Limited holds 846,517,149 shares representing 14.71%. These shares are held on behalf of holders of ADRs, which evidenceADSs. |
| | |
| • | Legal & General Investment Management Limited holds 218,457,607 shares representing 3.80%. |
| | |
| • | Barclays PLC holds 240,119,101 shares representing 4.17%. |
As far as is known to the company, no other person was the owner of 3% or more of the shares in issue, excluding Treasury Shares of the company.
Directors and Officers
The interests of the Directors and Officers of the company in share options, as defined in the Companies Act 1985, of the company are given in the Remuneration Report (pages 65 to 82).
Exchange controls and other limitations affecting security holders
There are currently no UK laws, decrees or regulations restricting the import or export of capital or affecting the remittance of dividends or other payments to holders of the company’s shares who are non-residents of the UK. There are no limitations relating only to non-residents of the UK under English law or the company’s Memorandum and Articles of Association on the right to be a holder of, and to vote in respect of, the company’s shares.
Documents on display
The Memorandum and Articles of Association of the company and other documents referred to in this Annual Report are available for inspection at the Registered Office of the company.
Publications
In late March 2007 GSK will publish on the website its Corporate Responsibility Report covering performance in areas including community investment, ethics and integrity, access to medicines, R&D and environment health and safety.
| |
|
| GSK Annual Report 2006 |
| 177 |
<Back to Contents
| |
| Shareholder information |
| continued |
|
| |
Nature of trading market
The Ordinary Shares of the company were listed on the London Stock Exchange on 27th December 2000. The shares were also listed on the New York Stock Exchange (NYSE) (in the form of American Depositary Shares ‘ADSs’) from the same date.
The following tables set out, for the periods indicated, the high and low middle market closing quotations in pence for the shares on the London Stock Exchange, and the high and low last reported sales prices in US dollars for the ADSs on the NYSE.
| GlaxoSmithKline | Pence per share | |
|
|
|
| |
| | High | | Low | |
|
|
|
| |
| Quarter ended 31st March 2007* | 1493 | | 1344 | |
| February 2007* | 1493 | | 1386 | |
| January 2007 | 1418 | | 1344 | |
| December 2006 | 1360 | | 1326 | |
| November 2006 | 1427 | | 1331 | |
| October 2006 | 1511 | | 1400 | |
| September 2006 | 1499 | | 1418 | |
| Quarter ended 31st December 2006 | 1511 | | 1326 | |
| Quarter ended 30th September 2006 | 1540 | | 1418 | |
| Quarter ended 30th June 2006 | 1557 | | 1455 | |
| Quarter ended 31st March 2006 | 1577 | | 1424 | |
| Quarter ended 31st December 2005 | 1544 | | 1395 | |
| Quarter ended 30th September 2005 | 1442 | | 1308 | |
| Quarter ended 30th June 2005 | 1377 | | 1201 | |
| Quarter ended 31st March 2005 | 1318 | | 1175 | |
| Year ended 31st December 2004 | 1299 | | 1042 | |
| Year ended 31st December 2003 | 1390 | | 1000 | |
| Year ended 31st December 2002 | 1780 | | 1057 | |
|
|
|
| |
| | | | | |
| | US dollars per ADS | |
|
|
|
| |
| | High | | Low | |
|
|
|
| |
| Quarter ended 31st March 2007* | 58.37 | | 52.66 | |
| February 2007* | 58.37 | | 54.71 | |
| January 2007 | 55.95 | | 52.66 | |
| December 2006 | 53.73 | | 51.93 | |
| November 2006 | 54.21 | | 51.41 | |
| October 2006 | 56.20 | | 53.21 | |
| September 2006 | 56.76 | | 53.23 | |
| Quarter ended 31st December 2006 | 56.20 | | 51.41 | |
| Quarter ended 30th September 2006 | 57.01 | | 53.23 | |
| Quarter ended 30th June 2006 | 58.38 | | 51.48 | |
| Quarter ended 31st March 2006 | 54.94 | | 50.15 | |
| Quarter ended 31st December 2005 | 53.53 | | 49.16 | |
| Quarter ended 30th September 2005 | 51.28 | | 46.47 | |
| Quarter ended 30th June 2005 | 51.40 | | 45.19 | |
| Quarter ended 31st March 2005 | 50.50 | | 44.48 | |
| Year ended 31st December 2004 | 47.50 | | 39.04 | |
| Year ended 31st December 2003 | 47.40 | | 32.75 | |
| Year ended 31st December 2002 | 50.87 | | 32.86 | |
|
|
|
| |
| * to 23rd February 2007 | | | | |
Annual General Meeting 2007
The Queen Elizabeth II Conference Centre, 23rd May 2007 Broad Sanctuary, Westminster, London SW1P 3EE
The Annual General Meeting is the company's principal forum for communication with private shareholders. In addition to the formal business there will be a presentation by the Chief Executive Officer on the performance of the Group and its future development. There will be opportunity for questions to the Board, and the Chairmen of the Board's committees will take questions on matters relating to those committees.
Investors holding shares in the company through a nominee service should arrange with that nominee service to be appointed as a corporate representative or proxy in respect of their shareholding in order to attend and vote at the meeting.
ADR holders wishing to attend the meeting must obtain a proxy from The Bank of New York which will enable them to attend and vote on the business to be transacted. ADR holders may instruct The Bank of New York as to the way in which the shares represented by their ADRs should be voted by completing and returning the voting card provided by the bank in accordance with the instructions given.
Financial reporting
| Financial reporting calendar 2007 | | |
|
| |
| Announcement of 1st Quarter Results | April 2007 | |
|
| |
| Announcement of 2nd Quarter Results | July 2007 | |
|
| |
| Announcement of 3rd Quarter Results | October 2007 | |
|
| |
| Preliminary Announcement of Annual Results | February 2008 | |
|
| |
| Publication of Annual Report/Review | March 2008 | |
|
| |
Results Announcements
Results Announcements are issued to the London Stock Exchange and are available on its news service. Shortly afterwards, they are issued to the media, are made available on the website and sent to the US Securities and Exchange Commission and the NYSE.
Financial reports
The company publishes an Annual Report and, for the investor not needing the full detail of the Report, an Annual Review. These are available from the date of publication on the website.
The Annual Review is sent to all shareholders. Shareholders may also elect to receive the Annual Report by writing to the company’s registrars. Alternatively shareholders may elect to receive notification by email of the publication of financial reports by registering on www.shareview.co.uk.
Copies of previous financial reports are available on the website. Printed copies can be obtained from the registrar in the UK and from the GSK Response Center in the USA.
Queries relating to receipt of duplicate copies of GSK’s publications should be addressed to the registrars.
| |
|
| GSK Annual Report 2006 |
| 178 |
<Back to Contents
| |
| Shareholder information |
| continued |
|
Ordinary shares
The company’s shares are listed on the London Stock Exchange.
Registrar
The company’s registrars are:
Lloyds TSB Registrars
The Causeway, Worthing, West Sussex BN99 6DA
www.shareview.co.uk
Tel: 0870 600 3991 inside the UK
Tel: +44 (0)121 415 7067 outside the UK
The registrars also provide the following services:
| • | GlaxoSmithKline Investment Plan |
| • | GlaxoSmithKline Individual Savings Account |
| • | GlaxoSmithKline Corporate Sponsored Nominee |
| • | Shareview service |
| • | Shareview dealing service |
| • | Dividend reinvestment plan |
Share dealing service
Shareholders may buy or sell shares by internet or telephone through Shareview dealing, a share dealing service provided by Lloyds TSB Registrars. For internet purchases and sales log on to www.shareview.co.uk/dealing and for telephone purchases and sales call 0870 850 0852 (inside the UK only) between 8.00am and 4.30pm, Monday to Friday.
Glaxo Wellcome and SmithKline Beecham corporate PEPs
The Share Centre Limited
Oxford House, Oxford Road, Aylesbury, Bucks HP21 8SZ
Tel: +44 (0)1296 414141
The provision of the details above is not intended to be an invitation or inducement to engage in an investment activity. Advice on share dealing should be obtained from a stockbroker or independent financial adviser.
American Depositary Shares
The company’s shares are listed on the NYSE in the form of American Depositary Shares and these are evidenced by American Depositary Receipts (ADRs), each one of which represents two Ordinary Shares.
In general, the NYSE’s rules permit the company to follow UK corporate governance practices instead of those that apply in the USA, provided that the company explains any significant variations. This explanation is provided on the company’s website.
ADR programme administrator
The ADR programme is administered by:
The Bank of New York
Shareholder Relations
PO Box 11258, Church Street Station
New York NY 10286-1258
www.adrbny.com
Tel: 1 877 353 1154 toll free
Tel: +1 212 815 3700 outside the USA
The administrators also provide Global BuyDIRECT, a direct ADS purchase/sale and dividend reinvestment plan for ADR holders.
GSK Response Center
Tel: 1 888 825 5249 toll free
| |
|
| GSK Annual Report 2006 |
| 179 |
<Back to Contents
| |
| Taxation information for shareholders |
| |
|
| |
Information for shareholders
A summary of the main tax consequences for holders of shares and ADRs who are citizens or residents of the UK or the USA is set out below. It is not a complete analysis of all the possible tax consequences of purchase or ownership of these securities. It is intended only as a general guide. Holders are advised to consult their advisers with respect to the tax consequences of the purchase and ownership of their shares or ADRs, and the consequences under state and local tax laws in the USA and the implications of the current UK/US Income Tax convention.
This statement is based upon UK and US tax laws and practices at the date of this report.
US holders of ADRs generally will be treated as the owners of the underlying shares for the purposes of the current US/UK double taxation conventions relating to income and gains (Income Tax Convention), estate and gift taxes (Estate and Gift Tax Convention) and for the purposes of the US Internal Revenue Code of 1986, as amended (the Code).
UK shareholders
Taxation of dividends
From 6th April 1999, the rate of tax credits was reduced to one ninth. As a result of compensating reductions in the rate of tax on dividend income, there is no increase in the tax borne by UK resident individual shareholders. Tax credits are, however, no longer repayable to shareholders with a tax liability of less than the associated tax credit.
Taxation of capital gains
UK shareholders may be liable for UK tax on gains on the disposal of shares or ADRs. They may also be entitled to indexation relief and taper relief on such sales. Indexation relief is calculated on the market value of shares at 31st March 1982 and on the cost of any subsequent purchases from the date of such purchase. Indexation relief for individual shareholders ceased on 5th April 1998. Taper relief is available to individual shareholders who hold or are deemed to hold shares for at least three years before they are sold.
Inheritance tax
Individual shareholders may be liable to inheritance tax on the transfer of shares or ADRs. Tax may be charged on the amount by which the value of the shareholder's estate is reduced as a result of any transfer by way of gift or other disposal at less than full market value.
Such a gift or other disposal is subject to both UK inheritance tax and US estate or gift tax. The Estate and Gift Tax Convention would generally provide for tax paid in the USA to be credited against tax payable in the UK.
Stamp duty
UK stamp duty or stamp duty reserve tax (SDRT) will, subject to certain exemptions, be payable on the purchase of shares at a rate of 0.5% of the purchase price. There is a minimum charge of £5 where a stamp duty liability arises.
US shareholders
The following is a summary of certain UK taxation and USA federal income tax considerations that may be relevant to a US holder of shares or ADRs. This summary only applies to a shareholder that holds shares or ADRs as capital assets, is a citizen or resident of the USA or a domestic corporation or that is otherwise subject to United States federal income taxation on a net income basis in respect of the shares or ADRs, and is not resident in the UK for UK tax purposes and does not hold shares for the purposes of a trade, profession or vocation that is carried on in the UK through a branch or agency.
Taxation of dividends
The gross amount of dividends received (without reduction for any UK withholding tax) is treated as foreign source dividend income for US tax purposes. It is not eligible for the dividend received deduction allowed to US corporations. Dividends on ADRs are payable in US dollars; dividends on shares are payable in Sterling. Dividends paid in pounds Sterling will be included in income in the US dollar amount calculated by reference to the exchange rate on the day the dividends are received by the holder. Subject to certain exceptions for short-term or hedged positions, an individual eligible US holder will be subject to US taxation at a maximum rate of 15% in respect of qualified dividends received before 2011. Shareholders are advised to consult their own Tax Advisers to confirm their eligibility.
Taxation of capital gains
Generally, US holders will not be subject to UK capital gains tax, but will be subject to US tax on capital gains realised on the sale or other disposal of shares or ADRs.
Estate and gift taxes
Under the Estate and Gift Tax Convention, a US shareholder is not generally subject to UK inheritance tax.
Stamp duty
UK stamp duty or SDRT will, subject to certain exemptions, be payable on any issue or transfer of shares to the ADR custodian or depository at a rate of 1.5% of their price (if issued), the amount of any consideration provided (if transferred on sale), or their value (if transferred for no consideration).
No SDRT would be payable on the transfer of an ADR. No UK stamp duty should be payable on the transfer of an ADR provided that the instrument of transfer is executed and remains at all times outside the UK. Any stamp duty on the transfer of an ADR would be payable at a rate of 0.5% of the consideration for the transfer. Any sale of the underlying shares would result in liability to UK stamp duty or, as the case may be, SDRT at a rate of 0.5% . There is a minimum charge of £5 where a stamp duty liability arises.
| |
|
| GSK Annual Report 2006 |
| 180 |
<Back to Contents
| Terms used in the Annual Report | US equivalent or brief description |
|
| Accelerated capital allowances | Tax allowance in excess of depreciation arising from the purchase of fixed assets that delay the charging and payment of tax. The US equivalent of tax depreciation. |
|
| Advance Corporation Tax (ACT) | An advance payment of UK tax that was made when dividends are paid. No direct US equivalent. |
|
| American Depositary Receipt (ADR) | Receipt evidencing title to an ADS. Each GlaxoSmithKline ADR represents two Ordinary Shares. |
|
| American Depositary Shares (ADSs) | Ordinary Shares registered on the New York Stock Exchange. |
|
| Basic earnings per share | Basic income per share. |
|
| Called-up share capital | Ordinary Shares, issued and fully paid. |
|
| CER growth | Growth at constant exchange rates. |
|
| Combined Code | Guidelines required by the Listing Rules of the Financial Services Authority to address the principal aspects of Corporate Governance. |
|
| The company | GlaxoSmithKline plc. |
|
| Creditors | Accounts payable. |
|
| Currency swap | An exchange of two currencies, coupled with a subsequent re-exchange of those currencies, at agreed exchange rates and dates. |
|
| Debtors | Accounts receivable. |
|
| Defined benefit plan | Pension plan with specific employee benefits, often called ‘final salary scheme’. |
|
| Defined contribution plan | Pension plan with specific contributions and a level of pension dependent upon the growth of the pension fund. |
|
| Derivative financial instrument | A financial instrument that derives its value from the price or rate of some underlying item. |
|
| Diluted earnings per share | Diluted income per share. |
|
| Employee Share Ownership Plan Trusts | Trusts established by the Group to satisfy share-based employee incentive plans. |
|
| Finance lease | Capital lease. |
|
| Freehold | Ownership with absolute rights in perpetuity. |
|
| Gearing ratio | Net debt as a percentage of total equity. |
|
| The Group | GlaxoSmithKline plc and its subsidiary undertakings. |
|
| Hedging | The reduction of risk, normally in relation to foreign currency or interest rate movements, by making off-setting commitments. |
|
| Intangible fixed assets | Assets without physical substance, such as brands, licences, patents, know-how and marketing rights purchased from outside parties. |
|
| Non-equity minority interest | Preference shares issued by a subsidiary to outside parties. |
|
| Preference shares | Shares issued at varying dividend rates that are treated as outside interests. |
|
| Profit | Income. |
|
| Profit attributable to shareholders | Net income. |
|
| Share capital | Ordinary Shares, capital stock or common stock issued and fully paid. |
|
| Shareholders’ funds | Shareholders’ equity. |
|
| Share option | Stock option. |
|
| Share premium account | Additional paid-up capital or paid-in surplus (not distributable). |
|
| Shares in issue | Shares outstanding. |
|
| Statement of recognised income and expense | Statement of comprehensive income. |
|
| Stocks | Inventories. |
|
| Subsidiary undertaking | An affiliate in which GlaxoSmithKline holds a majority shareholding and/or exercises control. |
|
| Treasury share | Treasury stock. |
|
| Turnover | Revenue. |
|
| |
|
| GSK Annual Report 2006 |
| 181 |
<Back to Contents
| |
| Cross reference to Form 20-F |
| |
|
This table has been provided as a cross reference from the information included in this Annual Report to the requirements of Form 20-F.
| Item | | | Page |
|
| 1 | Identity of directors, senior management and advisors | | n/a |
|
| 2 | Offer statistics and expected timetable | | n/a |
|
| 3 | Key information | | |
| A | Selected financial data | | 172-176 |
| D | Risk factors | | 44-47 |
|
| 4 | Information on the company | | |
| A | History and development of the company | | 4 |
| B | Business overview | | |
| | Products | | 27-28,30 |
| | Competition | | 29,30 |
| | Regulation | | 22-23 |
| | Marketing and distribution | | 8 |
| | Manufacture and supply | | 21 |
| | Research and development | | 9-16 |
| | Intellectual property | | 23-24 |
| | Environment, health and safety | | 24-25 |
| | Access to medicines | | 18 |
| | Corporate responsibility and community investment | | 19-20 |
| C | Organisational structure | | 153-155 |
| D | Property, plant and equipment | | |
| | Note 5 – Segment information | | 95-97 |
| | Note 17 – Property, plant and equipment | | 39,103-104 |
|
| 5 | Operating and financial review and prospects | | |
| A | Operating results | | |
| | 2006 and 2005 | | 31-47 |
| | 2005 and 2004 | | 48-52 |
| B | Liquidity and capital resources | | 39-43 |
| C | Research and development, patents and licenses, etc. | | 9-16,6 |
| D | Trend information | | 56 |
| E | Off balance sheet arrangements | | n/a |
| F | Tabular disclosure of contractual obligations | | 40-41 |
|
| 6 | Directors, senior management and employees | | |
| A | Directors and senior management | | 54-55 |
| B | Compensation | | |
| | Remuneration Report | | 65-82 |
| C | Board practices | | |
| | Corporate governance | | 56-64 |
| D | Employees | | |
| | GlaxoSmithKline people | | 17 |
| | Note 8 – Employee costs | | 99 |
| | Note 26 – Pensions and post-employment benefits | | 109-115 |
| | Financial record | | 175 |
| E | Share ownership | | |
| | GlaxoSmithKline people | | 17 |
| | Note 40 – Employee share schemes | | 134-138 |
| | Share options | | 76-78 |
| | Incentive plans | | 79-81 |
| | Directors’ interests | | 76,82 |
|
| 7 | Major shareholders and related party transactions | | |
| A | Major shareholders | | 177 |
| B | Related party transactions | | |
| | Note 33 – Related party transactions | | 120 |
|
| Item | | | Page |
|
| 8 | Financial information | | |
| A | Consolidated statements and other financial information | | |
| | Financial statements | | See item 18 |
| | Legal proceedings | | 156-164 |
| B | Significant changes
Note 38 – Post balance sheet events | | 126 |
|
| 9 | The offer and listing | | |
| A | Share price history | | 176,178 |
| C | Markets | | 178 |
|
| 10 | Additional information | | |
| B | Memorandum and Articles of Association | | Footnote (i) |
| D | Exchange controls | | 177 |
| E | Taxation | | 180 |
| H | Documents on display | | 177 |
|
| 11 | Quantitative and qualitative disclosures about market risk | | |
| | Treasury policies | | 42-43 |
| | Note 39 – Financial instruments and related disclosures | | 127-134 |
|
| 12 | Description of securities other than equity securities | | n/a |
|
| 13 | Defaults, dividend arrearages and delinquencies | | n/a |
|
| 14 | Material modifications to the rights of security holders and use of proceeds | | n/a |
|
| 15 | Controls and procedures | | 59-60 |
|
| 16 | [Reserved] | | |
| A | Audit Committee financial expert | | 61 |
| B | Code of ethics | | 62 |
| C | Principal accountant fees and services | | |
| | Note 7 – Operating profit | | 98 |
| D | Exemptions from the listing standard for audit committees | | n/a |
| E | Purchases of equity securities by the issuer and affiliated purchasers | | 118 |
|
| 17 | Financial statements | | n/a |
|
| 18 | Financial statements | | |
| | Independent auditors’ report | | 85 |
| | Consolidated income statement | | 86 |
| | Consolidated balance sheet | | 87 |
| | Consolidated cash flow statement | | 88 |
| | Consolidated statement of recognised income and expense | | 89 |
| | Notes to the financial statements | | 90-164 |
|
| 19 | Exhibits | | Footnote (ii) |
|
Footnote (i) – information responsive to this item is incorporated by reference to the company's Annual Report on Form 20-F for the year ended 31st December 2005.
Footnote (ii) – see the company’s Form 20-F filing with the Securities and Exchange Commission.
| |
|
| GSK Annual Report 2006 |
| 182 |
<Back to Contents

 | |
| | Do more, feel better, live longer | |
| | | |
| | Head Office and Registered Office | Produced by Corporate Communications, GSK. |
| | GlaxoSmithKline plc | |
| | 980 Great West Road | Designed by CGI London. |
| | Brentford, Middlesex TW8 9GS | |
| | United Kingdom | Printed in the UK by St. Ives Direct Edenbridge Ltd. The paper used in the production of this document is made from pulps harvested from sustainable forests, also using sawmill residues and forest thinnings. It is elemental chlorine-free. |
| | Tel: +44 (0)20 8047 5000 |
| | www.gsk.com |
| | |
Item 19 Exhibits
Exhibit Index
Exhibit No. | Description |
| | |
| 1.1 | Memorandum and Articles of Association of the Registrant as in effect on the date hereof are incorporated by reference to Exhibit 1.1 to the Registrant’s Annual Report on Form 20-F filed with the Commission on March 3, 2006. |
| | |
| 2.1 | Deposit Agreement among the Registrant and The Bank of New York, as Depositary, and the holders from time to time of the American Depositary Receipts issued thereunder, including the form of American Depositary Receipt is incorporated by reference to the Registration Statement on Form F-6 (No. 333-12248) filed with the Commission on July 5, 2000. |
| | |
| 4.1 | Service Agreement between SmithKline Beecham Corporation and Jean-Pierre Garnier is incorporated by reference to Exhibit 4.1 to the Registrant’s Annual Report on Form 20-F filed with the Commission on March 8, 2005. |
| | |
| 4.2 | Service Agreement between GlaxoSmithKline Services Unlimited and Julian Heslop is incorporated by reference to Exhibit 4.3 to the Registrant’s Annual Report on Form 20-F filed with the Commission on March 3, 2006. |
| | |
| |
| | |
| 8.1 | A list of the Registrant’s principal subsidiaries is incorporated by reference to pages 153 to 155 of this Annual Report on Form 20-F. |
| | |
| |
| | |
| |
| | |
| |
| | |
| |
Signature
The registrant hereby certifies that it meets all of the requirements for filing on Form 20-F and that it has duly caused and authorized the undersigned to sign this annual report on its behalf.
| | | |
| | GlaxoSmithKline plc |
|
|
|
| March 2, 2007 | By: | /s/ Julian Heslop |
| | Julian Heslop |
| | |

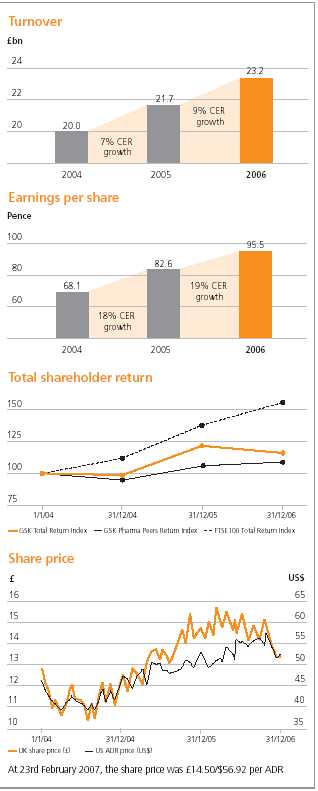
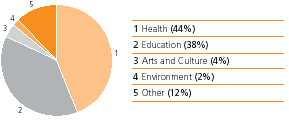
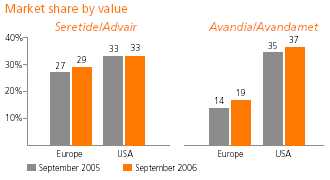
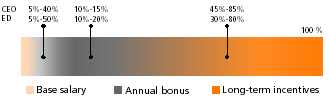
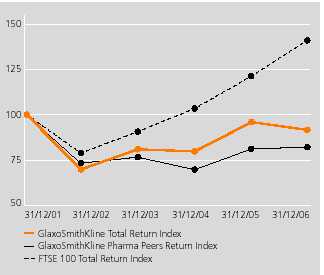
 RPI + 5%