UNITED STATES
SECURITIES AND EXCHANGE COMMISSION
Washington, D.C. 20549
FORM N-CSR
CERTIFIED SHAREHOLDER REPORT OF REGISTERED
MANAGEMENT INVESTMENT COMPANIES
Investment Company Act file number 811-10303
Buffalo Funds
(Exact name of registrant as specified in charter)
5420 W. 61st Place,
Shawnee Mission, KS 66025
(Address of principal executive offices) (Zip code)
Kent Gasaway
5420 W. 61st Place,
Shawnee Mission, KS 66025
(Name and address of agent for service)
913-677-7778
Registrant's telephone number, including area code
Date of fiscal year end: March 31
Date of reporting period: March 31, 2021
Item 1. Reports to Stockholders.


ANNUAL REPORT
March 31, 2021

MESSAGE TO OUR SHAREHOLDERS
DEAR SHAREHOLDERS,
Annual Presidents Letter
As a result of the COVID-19 pandemic, the past 12 months have been filled with hardship, grief, fear, uncertainty and for the optimist, rarely seen investment opportunities. The two U.S. vaccines, brought to the market by Pfizer and Moderna in record time, literally saved us from a possible COVID-19 induced global depression. The vaccines not only saved lives, but changed the mood of consumers, business owners and investors, from grim to hopeful.
To help assure that the U.S. economy would rebound from a 33.0% decline in Q2-2020 GDP and job losses of nearly 24 million workers at the February 2020 bottom, the Federal Reserve, U.S. Treasury and Congress took decisive action, dedicating over $5 trillion to various economic stimulus programs. These included the Payroll Protection Program for small business, stimulus checks to individuals, much wider and richer unemployment benefits, funding to states, municipalities and schools, eviction protection from non-payment of rent and mortgages and deferral of state and federal taxes. Finally, the Federal Reserve cut the Federal funds rate from 1.75% to zero.
The sheer magnitude of the stimulus ($5 trillion was pumped into a $20 trillion GDP economy) virtually guaranteed growth versus contraction. Not until rollout of the vaccines gained steam did expectations for a powerful recovery in jobs, consumer spending, and business spending become mainstream. Thus far, job recovery has reached some 14 million and the unemployment rates has dropped to 6.1%. Pre-pandemic this rate was under 4.0%, very near to the level that is believed to be full employment.
While all the above was worrisome, the stock market continued to make higher highs after the March 2020 bottom. The first stage of the bull run in stocks was by stay-at-home beneficiary growth stocks. This early, powerful move led to the term FAANG to identify those winners that grew to unprecedented weightings in the major stock indexes. These included Facebook, Apple, Amazon, Netflix and Google. These companies also grew to unheard of market capitalizations. These stocks, and growth in general, were the clear winners in calendar year 2020.
This strong performance by growth stocks helped power the Buffalo Funds to new highs in Net Asset Value due to
the firm's leaning as long-term growth investors. Returns for the 12-month period ending March 31, 2021 varied among the six Buffalo equity growth Funds, Investor Class, but at very high levels. Fund returns from highest to lowest included the Buffalo Small Cap Fund, the Buffalo Early Stage Growth Fund, the Buffalo Discovery Fund, the Buffalo Mid Cap Fund, the Buffalo Large Cap Fund and the Buffalo Growth Fund.
Other attractive Investor Class absolute returns for the same period included the Buffalo International Fund, the Dividend Focus Fund, the Buffalo Flexible Income Fund and, finally, the Buffalo High Yield Fund. Please see pages six and seven for a complete listing of Buffalo Funds returns.
Thus far in 2021, leadership in the market has come from more cyclical companies that will benefit from consumer spending returning closer to normal. These include hotels, airlines, restaurants and energy to name a few. The Funds have made some changes to benefit from increased consumer spending.
We appreciate your business and are pleased to have delivered such strong results.
Sincerely

Kent Gasaway
President
Buffalo Funds
The Funds' investment objectives, risks, charges and expenses must be considered carefully before investing. The summary and statutory prospectus contains this and other important information about the investment company, and it may be obtained by calling 1-800-49-BUFFALO or visiting www.buffalofunds.com. Read it carefully before investing.
Past performance does not guarantee future results. Mutual fund investing involves risk. Principal loss is possible.
Kornitzer Capital Management, Inc. is the Advisor to the Buffalo Funds which are distributed by Quasar Distributors, LLC.
Nothing contained in this communication constitutes tax, legal or investment advice. Investors must consult their tax advisors or legal counsel for advice and information concerning their particular situation.
The opinions expressed are those of the Portfolio Manager(s) and are subject to change, are not guaranteed and should not be considered recommendations to buy or sell any security.
Fund performance may be subject to substantial short-term changes.
This page intentionally left blank.
TABLE OF CONTENTS
Investment Results (unaudited) | | | 6 | | |
Portfolio Management Review (unaudited) | | | 11 | | |
Expense Example (unaudited) | | | 22 | | |
Allocation of Portfolio Holdings (unaudited) | | | 26 | | |
Schedules of Investments or Options Written | | | 28 | | |
Buffalo Discovery Fund (BUFTX) | | | 28 | | |
Buffalo Dividend Focus Fund (BUFDX) | | | 33 | | |
Buffalo Early Stage Growth Fund (BUFOX) | | | 41 | | |
Buffalo Flexible Income Fund (BUFBX) | | | 46 | | |
Buffalo Growth Fund (BUFGX) | | | 52 | | |
Buffalo High Yield Fund (BUFHX) | | | 57 | | |
Buffalo International Fund (BUFIX) | | | 71 | | |
Buffalo Large Cap Fund (BUFEX) | | | 81 | | |
Buffalo Mid Cap Fund (BUFMX) | | | 86 | | |
Buffalo Small Cap Fund (BUFSX) | | | 92 | | |
Statements of Assets and Liabilities | | | 98 | | |
Statements of Operations | | | 100 | | |
Statements of Changes in Net Assets | | | 102 | | |
Financial Highlights | | | 106 | | |
Notes to Financial Statements | | | 126 | | |
Report of Independent Registered Public Accounting Firm | | | 137 | | |
Notice to Shareholders (unaudited) | | | 138 | | |
Privacy Policy (unaudited) | | | 150 | | |
INVESTMENT RESULTS (UNAUDITED)
Total Returns as of March 31, 2021
| | | | | | Average Annual | |
| | Gross Expense
Ratio**** | | Six
Months | | One Year | | Five Years | | Ten Years | | Investor
Class
Since
Inception | | Institutional
Class
Since
Inception | |
Buffalo Discovery Fund — Investor Class
(inception date 4/16/01) | | | 1.02 | % | | | 22.82 | % | | | 67.49 | % | | | 17.86 | % | | | 14.82 | % | | | 10.66 | % | | | N/A | | |
Buffalo Discovery Fund — Institutional Class
(inception date 7/1/19)1 | | | 0.87 | % | | | 22.93 | % | | | 67.75 | % | | | 18.05 | % | | | 15.00 | % | | | N/A | | | | 22.01 | % | |
Morningstar US Mid Growth Index | | | N/A | | | | 17.44 | % | | | 73.26 | % | | | 20.59 | % | | | 14.32 | % | | | 9.80 | % | | | 25.90 | % | |
Lipper Multi-Cap Growth Funds Index | | | N/A | | | | 16.75 | % | | | 73.18 | % | | | 20.91 | % | | | 15.02 | % | | | 8.94 | % | | | 28.97 | % | |
Buffalo Dividend Focus Fund — Investor Class
(inception date 12/03/12) | | | 0.96 | % | | | 20.75 | % | | | 54.29 | % | | | 14.32 | % | | | N/A | | | | 13.91 | % | | | N/A | | |
Buffalo Dividend Focus Fund —
Institutional Class (inception date 7/1/19)1 | | | 0.81 | % | | | 20.85 | % | | | 54.52 | % | | | 14.49 | % | | | N/A | | | | N/A | | | | 18.92 | % | |
Morningstar US Large-Mid Cap Index | | | N/A | | | | 19.41 | % | | | 59.31 | % | | | 16.64 | % | | | N/A | | | | 15.73 | % | | | 21.38 | % | |
S&P 500 Index | | | N/A | | | | 19.07 | % | | | 56.35 | % | | | 16.29 | % | | | N/A | | | | 15.57 | % | | | 20.39 | % | |
Lipper Equity Income Funds Index | | | N/A | | | | 22.37 | % | | | 47.41 | % | | | 11.69 | % | | | N/A | | | | 11.64 | % | | | 12.62 | % | |
Buffalo Early Stage Growth Fund —
Investor Class (inception date 5/21/04) | | | 1.51 | % | | | 40.48 | % | | | 112.86 | % | | | 24.47 | % | | | 10.70 | % | | | 11.45 | % | | | N/A | | |
Buffalo Early Stage Growth Fund —
Institutional Class (inception date 7/1/19)1 | | | 1.37 | % | | | 40.56 | % | | | 113.25 | % | | | 24.66 | % | | | 17.01 | % | | | N/A | | | | 35.43 | % | |
Morningstar US Small Growth Index | | | N/A | | | | 27.57 | % | | | 81.92 | % | | | 19.43 | % | | | 13.36 | % | | | 11.10 | % | | | 25.25 | % | |
Lipper Small-Cap Growth Funds Index | | | N/A | | | | 30.33 | % | | | 89.96 | % | | | 20.49 | % | | | 13.47 | % | | | 10.83 | % | | | 25.90 | % | |
Buffalo Flexible Income Fund —
Investor Class (inception date 8/12/94) | | | 1.02 | % | | | 20.28 | % | | | 40.94 | % | | | 7.82 | % | | | 7.12 | % | | | 7.16 | % | | | N/A | | |
Buffalo Flexible Income Fund —
Institutional Class (inception date 7/1/19)1 | | | 0.87 | % | | | 20.43 | % | | | 41.15 | % | | | 7.99 | % | | | 7.28 | % | | | N/A | | | | 7.03 | % | |
Morningstar Moderately Aggressive
Target Risk Index* | | | N/A | | | | 18.04 | % | | | 45.13 | % | | | 11.81 | % | | | 8.84 | % | | | N/A | | | | 14.32 | % | |
60% Morningstar US Large Cap Index/
40% ICE BofAML US High Yield Master II Index | | | N/A | | | | 13.06 | % | | | 42.01 | % | | | 13.47 | % | | | 11.16 | % | | | 9.36 | % | | | 15.52 | % | |
Bank of America Merrill Combined Index
(60% S&P 500® Index/40% ICE BofAML US
High Yield Master II Index) | | | N/A | | | | 14.39 | % | | | 45.52 | % | | | 13.02 | % | | | 10.93 | % | | | 9.45 | % | | | 14.70 | % | |
Lipper Mixed-Asset Target Allocation
Moderate Funds Index | | | N/A | | | | 13.06 | % | | | 33.64 | % | | | 9.34 | % | | | 7.46 | % | | | 7.25 | % | | | 12.09 | % | |
Buffalo Growth Fund — Investor Class
(inception date 5/19/95) | | | 0.93 | % | | | 12.99 | % | | | 53.98 | % | | | 17.09 | % | | | 13.63 | % | | | 11.01 | % | | | N/A | | |
Buffalo Growth Fund — Institutional Class
(inception date 7/1/19)1 | | | 0.79 | % | | | 13.08 | % | | | 54.26 | % | | | 17.26 | % | | | 13.80 | % | | | N/A | | | | 19.91 | % | |
Morningstar US Growth Index** | | | N/A | | | | 13.36 | % | | | 64.45 | % | | | 21.81 | % | | | 16.70 | % | | | N/A | | | | 29.49 | % | |
Lipper Large Cap Growth Funds Index | | | N/A | | | | 12.93 | % | | | 62.69 | % | | | 20.97 | % | | | 15.44 | % | | | 9.68 | % | | | 27.56 | % | |

6
| | | | | | Average Annual | |
| | Gross Expense
Ratio**** | | Six
Months | | One Year | | Five Years | | Ten Years | | Investor
Class
Since
Inception | | Institutional
Class
Since
Inception | |
Buffalo High Yield Fund — Investor Class
(inception date 5/19/95) | | | 1.03 | % | | | 9.42 | % | | | 27.07 | % | | | 6.54 | % | | | 5.68 | % | | | 7.08 | % | | | N/A | | |
Buffalo High Yield Fund — Institutional Class
(inception date 7/1/19)1 | | | 0.89 | % | | | 9.54 | % | | | 27.28 | % | | | 6.68 | % | | | 5.83 | % | | | N/A | | | | 8.79 | % | |
ICE BofAML US High Yield Master II Index | | | N/A | | | | 7.44 | % | | | 23.31 | % | | | 7.94 | % | | | 6.31 | % | | | 7.15 | % | | | 6.18 | % | |
Lipper High Yield Bond Funds Index | | | N/A | | | | 8.01 | % | | | 24.07 | % | | | 7.30 | % | | | 5.38 | % | | | 5.95 | % | | | 5.71 | % | |
Buffalo International Fund — Investor Class
(inception date 9/28/07) | | | 1.05 | % | | | 15.61 | % | | | 51.79 | % | | | 13.51 | % | | | 8.42 | % | | | 6.17 | % | | | N/A | | |
Buffalo International Fund —
Institutional Class (inception date 7/1/19)1 | | | 0.90 | % | | | 15.73 | % | | | 52.12 | % | | | 13.69 | % | | | 8.58 | % | | | N/A | | | | 16.62 | % | |
Morningstar Global Markets ex-US Index | | | N/A | | | | 21.49 | % | | | 51.53 | % | | | 10.02 | % | | | 5.43 | % | | | 3.28 | % | | | 12.57 | % | |
Lipper International Funds Index | | | N/A | | | | 22.41 | % | | | 54.06 | % | | | 10.17 | % | | | 6.13 | % | | | 3.40 | % | | | 14.41 | % | |
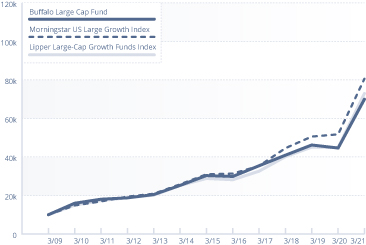
Buffalo Large Cap Fund — Investor Class
(inception date 5/19/95) | | | 0.95 | % | | | 13.42 | % | | | 56.78 | % | | | 18.56 | % | | | 14.50 | % | | | 10.67 | % | | | N/A | | |
Buffalo Large Cap Fund — Institutional Class
(inception date 7/1/19)1 | | | 0.81 | % | | | 13.46 | % | | | 57.02 | % | | | 18.74 | % | | | 14.67 | % | | | N/A | | | | 22.96 | % | |
Morningstar US Large Growth Index*** | | | N/A | | | | 8.09 | % | | | 55.78 | % | | | 20.77 | % | | | 16.89 | % | | | N/A | | | | 26.19 | % | |
Lipper Large-Cap Growth Funds Index | | | N/A | | | | 12.93 | % | | | 62.69 | % | | | 20.97 | % | | | 15.44 | % | | | 9.68 | % | | | 27.56 | % | |
Buffalo Mid Cap Fund — Investor Class
(inception date 12/17/01) | | | 1.03 | % | | | 26.11 | % | | | 65.92 | % | | | 17.12 | % | | | 11.96 | % | | | 9.85 | % | | | N/A | | |
Buffalo Mid Cap Fund — Institutional Class
(inception date 7/1/19)1 | | | 0.90 | % | | | 26.11 | % | | | 66.18 | % | | | 17.28 | % | | | 12.12 | % | | | N/A | | | | 26.08 | % | |
Morningstar US Mid Growth Index | | | N/A | | | | 17.44 | % | | | 73.26 | % | | | 20.59 | % | | | 14.32 | % | | | 10.47 | % | | | 25.90 | % | |
Lipper Mid-Cap Growth Funds Index | | | N/A | | | | 20.78 | % | | | 72.37 | % | | | 19.39 | % | | | 13.27 | % | | | 9.96 | % | | | 23.79 | % | |
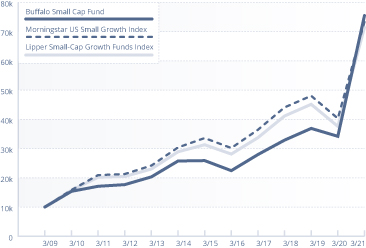
Buffalo Small Cap Fund — Investor Class
(inception date 4/14/98) | | | 1.02 | % | | | 39.62 | % | | | 120.78 | % | | | 27.45 | % | | | 16.01 | % | | | 14.02 | % | | | N/A | | |
Buffalo Small Cap Fund — Institutional Class
(inception date 7/1/19)1 | | | 0.87 | % | | | 39.64 | % | | | 121.14 | % | | | 27.63 | % | | | 16.18 | % | | | N/A | | | | 45.09 | % | |
Morningstar US Small Growth Index | | | N/A | | | | 27.57 | % | | | 81.92 | % | | | 19.43 | % | | | 13.36 | % | | | 7.59 | % | | | 25.25 | % | |
Lipper Small-Cap Growth Funds Index | | | N/A | | | | 30.33 | % | | | 89.96 | % | | | 20.49 | % | | | 13.47 | % | | | 8.58 | % | | | 25.90 | % | |
1 The Institutional Class commenced operations on 7/1/2019. Performance for periods prior to 7/1/2019 is based on the performance of the Investor Class adjusted for the Shareholder Services fee of the Investor Class.
* The inception date of the Morningstar Moderately Aggressive Target Risk Index is February 18, 2009. The annualized return since inception as of March 31, 2021 is 7.34%.
** The inception date of the Morningstar US Growth Index is July 3, 2002. The annualized return since inception as of March 31, 2021 is 8.32%.
*** The inception date of the Morningstar US Large Growth Index is July 3, 2002. The annualized return since inception as of March 31, 2021 is 7.55%.
**** As reported in the Funds' Prospectus dated July 1, 2020. Current period gross expense ratio for each Fund can be found on the Financial Highlights, beginning on page 108.
Performance data quoted represents past performance; past performance does not guarantee future results. The investment return and principal value of an investment will fluctuate so that an investor's shares, when redeemed, may be worth more or less than their original cost. Current performance of the Funds may be lower or higher than the performance quoted. Performance data current as of the most recent month-end may be obtained by calling 1-800-49-BUFFALO or by visiting the website at www.buffalofunds.com.

7
The Funds' returns shown do not reflect the deduction of taxes that a shareholder would pay on distributions or the redemption of shares. The benchmark returns shown, excluding the Lipper Indices, reflect the reinvestment of dividends and capital gains but do not reflect the deduction of any investment management fees, other expenses or taxes. The performance of the Lipper Indices is presented net of fees and expenses; however, applicable sales charges are not taken into consideration. One cannot invest directly in an index.
The Morningstar US Mid Growth Index measures the performance of US mid-cap stocks that are expected to grow at a faster pace than the rest of the market as measured by forward earnings, historical earnings, book value, cash flow and sales. The Lipper Multi-Cap Growth Funds Index is an unmanaged index that reflects the net asset value weighted return of 30 of the largest multi-cap growth funds tracked by Lipper. Its returns include net reinvested dividends. The Morningstar US Large-Mid Cap Index measures the performance of the US equity market targeting the top 90% of stocks by market capitalization. Lipper Equity Income Funds Index tracks funds that seek relatively high current income and growth of income by investing at least 65% of their portfolio in dividend-paying equity securities. These funds' gross or net yield must be at least 125% of the average gross or net yield of the U.S. diversified equity fund universe. The Morningstar US Small Growth Index measures the performance of US small-cap stocks that are expected to grow at a faster pace than the rest of the market as measured by forward earnings, historical earnings, book value, cash flows and sales. The Lipper Small-Cap Growth Funds Index is an unmanaged, equally weighted performance index of the 30 largest qualifying mutual funds (based on net assets) in the Lipper Small-Cap classification. The Morningstar US Large Cap Index measures the performance of the US equity market targeting the top 70% of stocks by market capitalization. The ICE BofAML US High Yield Master II Index tracks the performance of below investment grade U.S. dollar-denominated corporate bonds publicly issued in the U.S. domestic market. The Lipper Mixed-Asset Target Allocation Moderate Funds Index is an average of funds that, by portfolio practice, maintain a mix of between 40%-60% equity securities, with the remainder invested in bonds, cash, and cash equivalents. The total return of the Lipper Average does not include the effect of sales charges. The Morningstar US Growth Index measures the performance of US stocks that are expected to grow at a faster pace than the rest of the market as measured by forward earnings, historical earnings, book value, cash flow and sales. The Lipper Large Cap Growth Funds Index is an unmanaged, equally weighted performance index of the 30 largest qualifying mutual funds (based on net assets) in the Lipper Large-Cap classification. The Lipper High Yield Bond Funds Index is a widely recognized index of the 30 largest mutual funds that invest primarily in high yield bonds. The Morningstar Global Market ex-US Index is designed to provide exposure to the top 97% market capitalization in each of two market segments, developed markets, excluding the United States, and emerging markets. The Lipper International Funds Index is an unmanaged, equally weighted performance index of the 30 largest qualifying mutual funds (based on net assets) in the Lipper International classification. The Morningstar US Large Growth Index measures the performance of US large-cap stocks that are expected to grow at a faster pace than the rest of the market as measured by forward earnings, historical earnings, book value, cash flow and sales. The Lipper Mid-Cap Growth Funds Index is an unmanaged, equally weighted performance index of the 30 largest qualifying mutual funds (based on net assets) in the Lipper Mid-Cap classification. The S&P 500 Index is a capitalization weighted index of 500 large capitalization stocks which is designed to measure broad domestic securities markets. The Morningstar Moderately Aggressive Target Risk Index is designed to meet the needs of investors who would like to maintain a target level of equity exposure through a portfolio diversified across equities, bonds and inflation-hedged instruments. The Russell 1000 Growth Index measures the performance of those Russell 1000 Index companies with higher price-to-book ratios and higher forecasted growth values. The Russell 2000 Growth Index is a small-cap stock market index of the bottom 2,000 stocks in the Russell 3000 Index. The Russell Mid Cap Growth Index measures the performance of those Russell Midcap companies with higher price-to-book ratios and higher forecasted growth values.
Please refer to the prospectus for special risks associated with investing in the Buffalo Funds, including, but not limited to, risks involved with investments in healthcare and information technology companies, foreign securities, debt securities, lower- or unrated securities and medium and small companies. Fund holdings and sector allocations are subject to change at any time and should not be considered a recommendation to buy or sell any security. Please refer to the Schedule of Investments for a complete list of Fund holdings.

8
INVESTMENT RESULTS (UNAUDITED) Continued
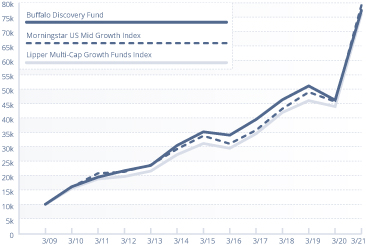
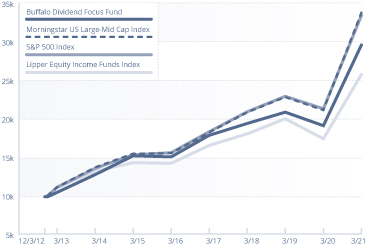
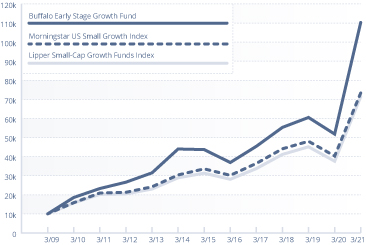
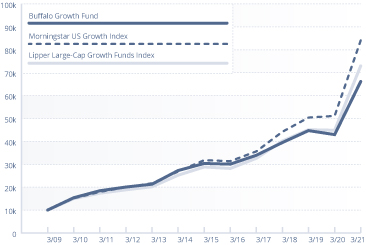
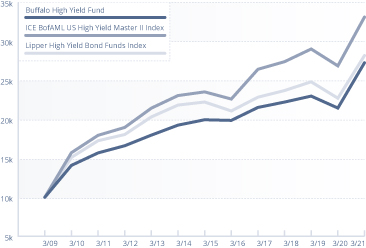
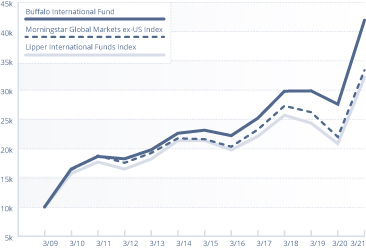
Growth of $10,000 Investment — Investor Class
BUFFALO DISCOVERY FUND
BUFFALO DIVIDEND FOCUS FUND
BUFFALO EARLY STAGE
GROWTH FUND
BUFFALO GROWTH FUND
BUFFALO HIGH YIELD FUND
BUFFALO INTERNATIONAL FUND

9
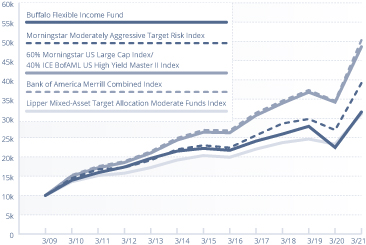
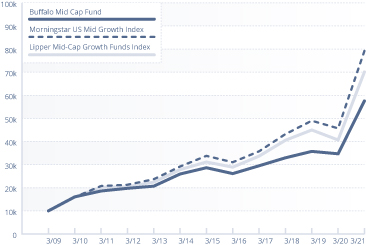
Growth of $10,000 Investment
BUFFALO FLEXIBLE INCOME FUND
BUFFALO MID CAP FUND
BUFFALO LARGE CAP FUND
BUFFALO SMALL CAP FUND

10
PORTFOLIO MANAGEMENT REVIEW (UNAUDITED)
BUFFALO DISCOVERY FUND
The Buffalo Discovery Fund gained 67.49% during the fiscal year, underperforming the Morningstar US Mid Growth Index's gain of 73.26%. The Fund outperformed in Consumer Discretionary and Healthcare but lagged mainly in Technology and, to a lesser extent, in Real Estate and Financials. The index's large weighting in and big returns from high multiple, high growth software and IT services companies was the main source of underperformance as our valuation discipline and industry underweights kept relative performance in check. Simply put, the Fund's 69.4% return and 700 basis point underweight in Technology (33% vs 40.3%) just wasn't enough to keep up with the index. Interestingly, our stock selection had a positive contribution to return overall, with all of the underperformance coming from allocation effect, or sector allocation.
eHealth was the largest detractor from performance. The provider of Medicare insurance stumbled during the fiscal year as higher than expected customer churn forced revenue growth to slow and the stock's multiple declined. The Fund continues to hold a position in the company as we believe the company is taking appropriate steps to reduce churn and improve sentiment on the stock. A couple of activist firms have initiated campaigns to improve shareholder value and the company has wisely engaged with them to right the ship.
Etsy was the largest positive contributor to the Fund over the past year. A beneficiary of COVID-19, Etsy rose as their availability of homemade masks during the beginning of the pandemic attracted a significant number of new customers to the site of the online marketplace for craft goods, and revenues accelerated from the mid-thirties percent annual growth to well over one hundred percent. The stock hit our target price late in the fiscal year and was sold.
Penn National Gaming was another large contributor during the fiscal year. The company's partial acquisition of Barstool Sports as the brand behind their foray into online sports betting has been pivotal for the company and investors have responded favorably. The company has successfully navigated mandated closures and reduced capacity due to COVID-19 by reducing costs and
driving traffic from their best customers. Several states will launch online sports betting and online casinos this year, which could continue to benefit Penn.
The outlook for the Fund remains generally positive as robust monetary and fiscal stimulus provides an inviting backdrop for investors. While a quick rise in interest rates has given some pause on growth stocks and facilitated a catchup trade for value stocks, we do not believe the prospect of a low single digit yield on a ten-year government bond is going to provide a suitable enough return for investors to begin to abandon equities. 2021 should continue to benefit from a recovering economy with above average gross domestic product (GDP) growth, but as we return to pre-COVID-19 levels, we believe economic growth likely gets stymied as higher federal debt levels and higher taxes eventually slow the economy, which may again command premium multiples on companies that can grow faster than the market. While there is also chatter about inflation ruining the party, we believe we remain below a level that gets the Fed concerned enough to take action on interest rates. Meanwhile COVID-19 variants and the durability of responses to vaccinations remain a wildcard, but the rapid dissemination of vaccines by the new administration is definitely a positive for economic recovery and a return to normalcy. Higher tax rates will be required to pay for the additional fiscal stimulus and could take a small bite out of earnings growth, but we do not believe there is enough political capital or will to raise taxes high enough to choke the market.
We continue to narrow the portfolio and focus on our favorite stocks as there are now 81 positions in the Fund. We have continued the process we started last year in getting a little more cyclical in the portfolio and remain ever mindful of valuations as there are still signs of excess in areas like high growth software. We have also steadily added companies at the lower end of the market cap range as smaller companies generally outperform coming out of periods of recession, are trading at attractive valuations, and have solid operating leverage. As always, we continue to focus on premier, innovative companies that benefit from long-term trends and trade at attractive valuations and appreciate your continued support.

11
BUFFALO DIVIDEND FOCUS FUND
The Buffalo Dividend Focus Fund posted a return of 54.29% for the annual reporting period, but underperformed the Morningstar US Large-Mid Cap Index return of 59.31% and the S&P 500 Index return of 56.35%. All sectors in the Fund and index posted positive returns. The Fund's Consumer Discretionary, Energy, Financials and Industrials sectors had favorable relative performance. Communications Services, Consumer Staples, Health Care, Information Technology, Materials, Real Estate, and Utilities detracted from relative performance.
Specific securities that contributed most positively to performance include Apple (AAPL), Microsoft (MSFT) and Cerence (CRNC). Apple (consumer electronics) rose on favorable operating results, new product introductions, and prospects for robust demand for 5G smartphones. Microsoft (software and computer services) improved on growing momentum from its cloud services and enterprise products boosting results above analyst estimates and expansion in the company's valuation metrics. Cerence (voice and software services) climbed on robust operating results, new contract wins, and rising valuation metrics.
Delta Air Lines (DAL), Elanco Animal Health (ELAN) and Viatris (VTRS) detracted from the Fund's performance. Delta (air transportation services) declined on the reduced demand for airline travel due to COVID-19. Elanco (animal healthcare) fell earlier in the year on poor quarterly results due to distributer inventory destocking, and more recently on concerns regarding the safety profile of its Seresto flea collar. Viatris (pharmaceutical) dropped after issuing guidance below Wall Street expectations. The Fund sold its holdings in Delta and Viatris during the fiscal year.
The stock market rallied significantly from the pandemic- influenced sell off last March and has rallied back to record high levels at year end. The rise can be attributed to the expectations that the economy is recovering from the COVID-19 pandemic. The market favorably reacted to strong fiscal and monetary policy responses. Governments around the world approved several trillions of dollars of direct aid to consumers and businesses via several rounds of stimulus programs. Monetary authorities cut interest rates, implemented bond buying programs, and indicated they will maintain accommodative policies for the foreseeable future.
Investors bid up security prices in spite of declining economic growth, rising unemployment, and spiking COVID-19 infections. Policy provided some downside protection and investors anticipated the eventual economic recovery. New COVID-19 infections, hospitalizations and deaths have declined in the U.S. as vaccines have been approved and injected into arms. Although the Fed continues to indicate that it is on hold for the foreseeable future on raising interest rates, the longer end of the treasury market recently sold off on concerns that inflation will increase. The rise in interest rates resulted in some sector rotation in the market as investors shifted assets from growth to value sectors during the last quarter of the fiscal year. As the calendar year continues to unfold, investors will be focused on the prospects for passage of the administration's recently announced Infrastructure proposal, vaccine rollouts, easing of lockdowns due to COVID-19, and how long monetary policy will remain accommodative.
Despite the uncertainty created by the pandemic, we remain focused on wide moat, large capitalization companies trading at reasonable valuations, in our view. As always, the Fund will continue to emphasize on competitively advantaged companies that can be purchased at a fair value, in our opinion. As stock market volatility spikes, we will look for opportunities to find companies that fit our investment criteria, as we continue to follow our process of finding new investment ideas and to be ready when market declines provide better entry points.
BUFFALO EARLY STAGE GROWTH FUND
The Buffalo Early Stage Growth Fund, effective October 16, 2020, changed its name from the Buffalo Emerging Opportunities Fund. We believe "Early Stage Growth" better captures the spirit of the Fund, seeking holdings that are generally smaller than the median market capitalization of the benchmark and are bringing innovation to their industries through new products and/or services.
On a trailing 12 month basis, the Fund returned 112.86% as of 3/31/2021. This compared favorably to the primary benchmark Morningstar US Small Growth return of 81.92% and the Russell 2000 Growth Index return of 90.20%.
The Fund had positive attribution across every market sector leading to the significant outperformance during

12
the period. The leaders of the positive attribution included the Information Technology, Financials, and Consumer Discretionary sectors.
Small capitalization stocks had a strong year, outperforming their mid and large cap peers. The Russell 2000 Growth Index (small cap growth) was up 90.20% compared to the Russell Midcap Growth Index return of 68.61% and the Russell 1000 Growth Index (large cap) return of 62.74%.
The outsized positive returns in the last year were the result of the market rebounding off the lows from a year ago when the global pandemic began. This rebound was aided by the Federal government's response, which included unprecedented amounts of direct payments to individuals and businesses along with the Federal Reserve providing ongoing monetary stimulus. The rebound was further accelerated by the approval of COVID-19 vaccines and subsequent strong vaccination rates achieved in the calendar first quarter of 2021 in the United States.
As has been the case over the last decade, the Federal Reserve (and more recently, the Federal Government) has shown its ability to support markets with calendar 2020 being one for the record books. The Federal Reserve's balance sheet expanded along with M2 money supply (a calculation of the money supply that includes cash, checking accounts, savings accounts, mutual funds and money market funds) as a result of direct payments to individuals and business owners (stimulus checks, enhanced unemployment benefits, payroll protection program, etc.).
The Fund ended the quarter with 64 holdings. During the past year, management entered 21 new holdings and exited 13.
The success of vaccination rollout in the U.S. along with continued monetary and fiscal stimulus has created a strong outlook for the domestic economy for the remainder of 2021. COVID-19 hospitalizations are down to 35,000, as of the date of this letter, from a high of 125,000 in early January 2021 and almost 70% of the most susceptible population, those over 65, have been fully vaccinated. Additionally, another stimulus bill for $1.9 billion was passed in early March that provided more direct payments to households in the U.S. Coupled with Federal Reserve statements of continuing monetary policy support, the economic landscape remains favorable. Personal incomes, checking/savings account balances, and money market fund balances are at record
levels. This continues to provide strong support for equity prices in the near future.
With the strong recovery in equity markets given the economic backdrop mentioned above, we are vigilant of where valuation multiples stand across our holdings. Additionally, the debate on sustained or transitory inflation has taken hold.
Regardless of all the various backdrops we are presented with, our job remains to find attractive small cap companies that have not been fully appreciated by the market or are mispriced due to recent results or events. We believe less investor interest in our segment of the market creates opportunity for us to uncover value.
The Fund typically invests at the smaller end of the small cap growth spectrum and the managers continue to seek companies with sustainable growth due to secular growth trends or innovative or disruptive products. We remain focused primarily on identifying innovation within U.S. companies with North American revenue bases. With an active share of greater than 95%, the Fund will continue to offer a distinct offering from the Index and category peers.
BUFFALO FLEXIBLE INCOME FUND
For the twelve months ended 3/31/21, the Buffalo Flexible Income Fund returned 40.94% compared to a return of 45.13% for the Morningstar Moderately Aggressive Target Risk Index.
The top three contributors to the Fund's performance during the year were Microsoft, Nuance Communications and Qualcomm while the top three detractors were Royal Dutch Shell, Gilead Sciences, and BP.
Microsoft's share appreciation reflects its market leadership positions in software, cloud computing, and gaming. Over the past year, the company has executed well resulting in positive earnings revisions and a favorable growth outlook. Nuance Communications returns have been driven by positive business transformation. The company rationalized its product portfolio and the remaining company began to execute showing better growth and margin expansion. Qualcomm stock has appreciated due to the resolution of various legal issues and a favorable growth outlook due to the rollout of 5G networks in the future.
The primary reason for the underperformance in Royal Dutch Shell and BP was related to weak oil prices and soft demand due to the COVID-19 pandemic.

13
The S&P 500 Index achieved a record high during the period and ended the annual period just below the peak. The market's rise can be attributed to the expectation that the economy can recover from the COVID-19 pandemic. New COVID-19 infections, hospitalizations and deaths have declined in the U.S. as vaccines have been approved and injected into arms. The market favorably reacted to the new administration, passage of additional fiscal stimulus, and the central banks' continued accommodative policies. Although the Fed continues to indicate that interest rate increases are on hold for the near future, the longer end of the treasury market sold off on concerns that inflation will increase. The rise in bond yields resulted in some market rotation as investors shifted from growth to value sectors. As the year continues to unfold, investors will be focused on the administration's recently announced infrastructure proposal, vaccine rollouts, COVID-19 related reopening, and the length of accommodative monetary policy.
Despite the uncertainty created by the pandemic, we remain focused on wide moat, large capitalization dividend paying companies trading at reasonable valuations, in our view.
BUFFALO GROWTH FUND
The Buffalo Growth Fund gained 53.98% in the fiscal year ended March 31, 2021 versus the Morningstar U.S. Growth Index's gain of 64.45%. Stock selection in the Consumer Discretionary sector and the drag from un-invested cash were the leading causes of relative underperformance. Allocation effect and stock selection within the Information Technology and Financials sectors were also a headwind. All remaining sectors contributed positively relative to the index but the cumulative effect was not enough to offset the headwinds. Within the Consumer Discretionary sector, the underperformance was driven by not owning Tesla, a relatively large benchmark position, which was up over 500% during the period. The company was a 512 basis point headwind in the fiscal year. Excluding Tesla, the remaining Consumer Discretionary sector proved to be a positive relative contributor. In general, with unprecedented fiscal and monetary stimulus and interest rates expected to be "lower for longer", sales growth was rewarded over profitability and valuation-sensitivity. Regarding our un-invested cash, while not a level we consider elevated, cash averaged 2.25% of Fund assets, and any allocation to cash holds back performance when the index is up over 64%.
Microsoft Corporation, the top contributor to the Fund during the fiscal year continued its streak of beating and raising expectations for revenue and earnings per share. The company was a prime beneficiary of workplace digital transformation and the move from on-premise IT infrastructure to the cloud. As the economy emerges from the pandemic Microsoft appears well positioned to gain share of rising IT budgets.
Amazon.com, Inc. (AMZN) Amazon was another top contributor, with shares up over 58%. The ongoing shift to ecommerce continued throughout the fiscal year as consumers avoided brick-and-mortar stores during the pandemic. Furthermore, the company's web services division was well positioned to benefit from the growing need for cloud computing in a world with more people working from home.
Wells Fargo shares contributed negatively as the position was sold at a loss early in the fiscal year in favor of more attractive price to growth alternatives.
Verisk Analytics, Inc. is a data analytics provider for customers in insurance, financial services and energy markets. Its shares came under pressure when the company missed revenue growth and profitability expectations in the Energy and Financial Services segments which combined represent just under 20% of corporate-wide EBITDA, or earnings before interest, taxes, dividends and amortization. These two business segments tend to be more cyclical where pandemic effects negatively impacted results. The remaining 80%+ of corporate EBITDA is derived from the Insurance vertical where Verisk maintains a durable franchise with attractive long-term growth prospects.
The market environment remains constructive for active growth stock investing. Interest rates and inflation remain relatively low by historical standards providing a healthy backdrop for corporate earnings growth and investors' allocation to equities. Meanwhile, global central bankers have pledged to sustain aggressive monetary and fiscal stimulus measures to ward off deflation and spur along continued economic recovery. Recent improvement in vaccine availability has accelerated shots-in-arms and is a much-needed spark that should help ignite economic recovery and a return to normalcy. We are seeing mobility and economic activity levels begin to rebound across many countries and sectors. Consumer and business confidence is rising too as the world has found innovative ways to adapt, progress and grow despite the one-hundred-year pandemic still in our midst.

14
We are constructive about continued recovery and believe a rising and strengthening economic tide is likely to materialize in 2021 producing above average GDP growth. The market should continue to broaden out as more sectors of the economy recover and as underappreciated growth and/or operating leverage materialize. Underappreciated is key. Compared to history, valuations are higher than normal in the early stages of this economic recovery due to the faith placed in the ability of unprecedented fiscal and monetary stimulus to ignite and sustain earnings recovery. Interest rates are lower too in support of higher valuations and we are likely to embark on a period of rising revenue and earnings expectations on relatively easy growth comparisons which is fuel for optimism and sustained multiples.
For 2021, we believe there's ample room for earnings upside potential in our investable universe and are constructive on the prospects for the portfolio. On a broader level, earnings growth expectations for 2021 S&P 500 earnings are reasonable at about $175 per share, 26% higher than 2020's COVID-19 impacted earnings but only about 9% higher than pre-pandemic earnings in 2019 implying about 4.5% cumulative annualized growth over the two-year period. 2022 S&P 500 earnings expectations at about $201 per share again imply a reasonable 7.8% cumulative annualized growth rate expected over the 2019 to 2022 period.
As we get deeper into recovery and positive estimate revisions slow, the interplay between interest rates and stock market multiples will likely wax more prominently while concerns about high debt levels and rising tax rates could also begin to affect broader valuation levels. That said, we think under-appreciated growth and operating leverage will be ample and rewarded throughout 2021.
Economic conditions may ebb and flow, but our focus remains constant; we invest in attractively priced, financially strong, well-managed companies benefitting from secular growth opportunities. Thank you for your support.
BUFFALO HIGH YIELD FUND
The Buffalo High Yield Fund generated a 27.07% return for the fiscal year ended March 31, 2021, outperforming the ICE BofAML US High Yield Master II Index, which returned 23.31% during the same period. After the high yield sector suffered a significant correction in the fiscal fourth quarter ended March '20 driven by the COVID-19
outbreak and plunging crude oil prices, the high yield market, which is identified and defined as U.S. dollar denominated, below investment-grade rated debt securities that are publicly issued in the U.S. domestic capital market, produced positive returns in all four quarters of fiscal 2021. The market's positive performance throughout the year was driven by: (i) aggressive monetary and fiscal responses from the Federal government, (ii) a full recovery in crude oil prices, and (iii) a modest recovery in the labor market and U.S. gross domestic product (GDP) as the year progressed. The Fed enacted extraordinary measures including slashing interest rates, removing the caps on the size of asset purchases, and restarting TALF just to name a few. In concert with the Fed moves, Congress passed multiple trillion dollar economic relief packages. Most importantly, the creation and rollout of the multiple vaccines for COVID-19 gave the market hope for a return to normal sometime in 2021. The 10-year Treasury bond returned a negative 8.2% during the fiscal year while the S&P 500 Index returned positive 56.35%.
Following the market crash last spring, high yield mutual funds experienced significant cash inflows during the June and September quarters of about $51.4 billion before slowing down and eventually experiencing outflows in the March quarter. This late stage reversal was driven by rising 10-year Treasury rates and concerns that the Fed may begin reigning in the stimulus. Despite the March quarter outflow, $50 billion of inflow for the fiscal year was significantly better than the $9.2 billion of outflows in the previous fiscal year. $537 billion of high yield new issuance in the fiscal year 2021 nearly doubled the $243 billion from the previous period as companies took advantage of strong investor demand for fixed income yield.
During the fiscal year, the 10-year Treasury bond yield declined from 1.74% to a period low of 0.67% while the 2-year Treasury bond only shed 8 basis points (bps) ending the year at 16 bps. The drop in the yield curve was driven by the aggressive monetary actions from the Federal Reserve. Reversing course from the previous year, the lower quality end of the high yield risk spectrum outperformed the higher credit quality issues as investors regained confidence in issuers' ability to weather the shutdown early in the year, and then shying away from interest rate sensitive issues as the treasury rate curve began to steepen. The Fund has historically taken a more defensive position relative to the indices but its convertible bond holdings which are equity

15
sensitive led to relative outperformance during the period.
According to data from JP Morgan, the previously mentioned high yield market's spread to worst ended at 406 bps, 543 bps wider than the preceding March 2020 quarter, but 194 bps tighter than the 20-year average of 600 bps. The yield to worst for the high yield market at fiscal year-end was 4.72%, also well below the 20-year average of 8.34% and the 10.00% yield at the end of fiscal year 2019.
The Fund's cash balance at the end of the year increased from the previous year's levels by 580 bps as a wave of holdings were called by the issuers in the final few weeks of the year and attractive reinvestment opportunities were limited. The portfolio's composition by asset class during the fiscal year was as follows:
| | 3/31/2020 | | 6/30/2020 | | 9/30/2020 | | 12/31/2020 | | 3/31/2021 | |
Straight
Corporates | | | 60.1 | % | | | 55.4 | % | | | 60.6 | % | | | 61.0 | % | | | 62.7 | % | |
Convertibles | | | 16.7 | % | | | 20.1 | % | | | 17.6 | % | | | 14.7 | % | | | 16.3 | % | |
Bank Loans | | | 19.1 | % | | | 16.6 | % | | | 16.3 | % | | | 17.2 | % | | | 11.2 | % | |
Preferred
Stocks | | | 1.3 | % | | | 1.7 | % | | | 1.5 | % | | | 1.2 | % | | | 2.2 | % | |
Convertible
Preferreds | | | 0.0 | % | | | 0.0 | % | | | 0.0 | % | | | 0.0 | % | | | 0.0 | % | |
Common
Stocks | | | 1.0 | % | | | 0.6 | % | | | 0.4 | % | | | 0.1 | % | | | 0.0 | % | |
Cash | | | 1.8 | % | | | 5.6 | % | | | 3.6 | % | | | 5.8 | % | | | 7.6 | % | |
Total | | | 100.0 | % | | | 100.0 | % | | | 100.0 | % | | | 100.0 | % | | | 100.0 | % | |
The approximate rate and contribution of return from the various asset classes in the Fund during the fiscal year is as follows:
| | | Approximate
Contribution
to Return | |
Straight Corporates | | | 14.36 | % | |
Convertibles | | | 8.81 | % | |
Bank Loans | | | 3.48 | % | |
Preferred Stocks | | | 1.01 | % | |
Convertible Preferreds | | | 0.00 | % | |
Common Stocks | | | 0.43 | % | |
Total | | | 27.07 | % | |
Specific securities that contributed most positively to performance include Cerence 3.0% convertible bonds, Nuance Communications 1.5% convertible bonds, and MPLX 6.875% corporate bonds. Cerence is a leader in AI voice recognition technology in automobiles and rode the tech rally throughout the year as it continued to win significant contracts with major car manufacturers. Nuance, the former parent company of Cerence, had a
similar trajectory as it consistently beat earnings expectations and buyers poured into software as a service and technology stocks. MPLX was one of the worst perfomers in the previous fiscal year as crude oil cratered in the spring, but the bond rallied significantly as crude recovered back to pre-pandemic levels.
Specific securities that detracted the most from performance included, SmileDirectClub 0.0% convertible bonds, Bandwidth 0.5% convertible bonds, and Mitek Systems 0.75% convertible bonds. All three convertible bonds were purchased on their initial offerings during the fiscal fourth quarter, shortly before the 10-year Treasury rate began to rise and investors sold Tech/Healthcare and rolled into more cyclical sectors that had been lagging.
Looking ahead, we are concerned first and foremost about the ongoing COVID-19 pandemic and the fallout on global economies along with the Federal Reserve's responses to emerging inflation. The potential for new regulatory changes to various industries from the Biden administration is a secondary focus. We are managing the Fund cautiously yet actively, focusing on high quality, below investment grade issuers with defensive business models and manageable credit metrics. We will continue to deploy cash in opportunities that we believe offer the most appealing risk/reward tradeoff with a bias toward shorter durations and less levered credits. Additionally, we believe bank loans offer a more defensive position as they provide senior positioning in the capital structure and less interest rate sensitivity due to their floating rate structures. Finally, we continue to look for opportunities in convertible bonds and preferred stocks. We ended the period with 143 positions, up slightly from the previous year's level of 136 (excluding cash).
BUFFALO INTERNATIONAL FUND
The Buffalo International Fund produced a return of 51.79% for the annual period ended March 31, 2021, a result that was in-line with the Morningstar Global Markets ex-US Index's return of 51.53%. Excluding cash, both sector allocation impact and stock selection were relative contributors to performance. Cash averaged just over 6% during the period, but was a meaningful drag during the strong market advance. Stock selection was constructive in Financials led by gains in Ashtead Group plc, as well as in Information Technology, with gains in shares of Taiwan Semiconductor Manufacturing Co and Infineon Technologies. Partially offsetting the relative

16
contribution from these sectors was weak performance overall from the Fund's investments in the Consumer Discretionary and Materials sectors. The Fund was also overweight healthcare, an underperforming group in the period which also detracted from relative results. Overall we are fairly pleased with a 50%+ return in the period given the dire economic and social impact as a result of the pandemic.
Top contributors in the period included Taiwan Semiconductor Manufacturing, Ashtead Group Plc, and Sartorius Stedim Biotech SA. Taiwan Semiconductor, the largest contract semiconductor manufacturer in the world, continued to benefit from its technology leadership and dominant market share with higher growth and improving margins. Ashtead, an equipment rental company headquartered in the UK, generates the majority of its revenue in the US. The stock benefitted from momentum in more cyclically-driven stocks later in the period, and the longer-term outlook is underpinned by a secular trend toward outsourcing among construction companies, Ashtead's largest customer base. Potential expansion of the equipment rental market into other areas such as entertainment/media and sports also propelled the stock higher. Sartorius Stedim Biotech, headquartered in France, is a global provider of equipment used in manufacturing biologic drugs. Such therapies include vaccines, among many other types of therapy, thus the company has benefitted recently from the ramp-up in vaccine production.
Top detractors in the annual period were Alibaba Group, Grifols, S.A, and Jardine Matheson Holdings Limited. Alibaba, the largest ecommerce company in China, saw a reduction in its stock price after it confronted some issues with the Chinese central government. The government is increasing regulation of the ecommerce and fintech industries in China, and put a stop to the initial public offering (IPO) of one of Alibaba's equity holdings until such regulations are clear. Grifols, a pharma company focused on the plasma derivatives business, had a weak stock performance due to concerns around the collection of plasma from human donors in the face of the circulating virus, as well as positive data from a potential future competitor in one business area. While we think the pandemic presented some challenges and will add to costs, the long-term growth of the business continues to be attractive in our view, for a company operating in an industry with high barriers to entry. Jardine Matheson, a conglomerate of consumer-driven businesses in the Asia-Pacific region, reported
results that were pressured by pandemic-related declines in consumption and reported greater impacts from COVID-19 disruptions than had been expected.
Now that vaccinations are ramping up in the US, and the ensuing economic momentum is apparent, there is much enthusiasm for the same to be seen around the world. Despite Europe's hiccups and slower rollout of vaccines, there is optimism that a similar economic recovery could happen come summertime. Meanwhile, many emerging markets, Brazil and India among them, are seeing a strong resurgence in virus cases and are on a potential path for more negative economic impact. In reality, the exact timeline is not yet known for a widespread global economic recovery, but despite continued potential setbacks from vaccine supply hiccups and variants, there is good reason to believe the worst is now behind us in terms of global economic paralysis. Much of the recent debate revolves around inflation, which we are seeing mostly in the U.S., and in some global commodity prices. The possibility of a more persistent upswing in global inflation, however, is not yet fully clear. For now, it seems that vaccine and virus news could continue to cause volatility in international markets, as well as signs of inflation.
Throughout the continued volatility, our strategy remains the same, as we will seek opportunities to invest in high quality companies with sound business models whose secular growth opportunities can generate growth for years to come. Our focus remains steadfast on investing in attractively priced, financially stable, well-managed companies with innovative strategies fueled by secular growth attributes. We believe this discipline should lead to superior risk-adjusted returns over the long term.
BUFFALO LARGE CAP FUND
The Buffalo Large Cap Fund gained 56.78% in the annual review period, slightly outperforming the Morningstar US Large Growth Index's gain of 55.78%. Stock selection drove the outperformance during the period and all sectors contributed positively relative to the index with the exception of Consumer Discretionary. Stock selection within Industrials was particularly strong led by the Fund's investments in FedEx and the railroader Kansas City Southern. Within Consumer Discretionary, the underperformance was driven by not owning Tesla in the Fund. Tesla is a large benchmark position and the stock was up over 530% during the period. Excluding Tesla, stock selection within Consumer Discretionary would

17
have been a positive contributor to relative results. In general, with unprecedented fiscal and monetary stimulus and ultra-low interest rates during the period, sales growth was rewarded over profitability and valuation-sensitivity.
Microsoft Corporation was the top contributor to the Fund during the fiscal year as the company continued its streak of beating and raising expectations for revenue and earnings. The company was a prime beneficiary of workplace digital transformation and the move from on-premise IT infrastructure to the cloud. As the economy emerges from the pandemic Microsoft is well positioned to gain share of rising IT budgets.
Amazon.com, Inc. was another top contributor, with shares up over 58%. The ongoing shift to ecommerce continued throughout the fiscal year as consumers avoided brick-and-mortar stores during the pandemic. Furthermore, the company's web services division was well positioned to benefit from the growing need for cloud computing in a world with more people working from home.
Marriott International was the largest detractor from Fund results as the stock dropped over 20% during the period. Shares of the hotel chain declined on government induced lockdowns and weak demand for hotel rooms due to COVID-19 during the period.
Interest rates and inflation remain relatively low by historical standards providing a healthy backdrop for corporate earnings growth and investors' allocation to equities. Meanwhile, global central bankers have pledged to sustain aggressive monetary and fiscal stimulus measures to ward off deflation and spur along continued economic recovery. Recent improvement in vaccine availability has accelerated shots-in-arms and is a much-needed spark that should help ignite economic recovery and a return to normalcy. We are seeing mobility and economic activity levels begin to rebound across many countries and sectors. Consumer and business confidence is rising too as the world has found innovative ways to adapt, progress and grow despite the one-hundred-year pandemic still in our midst.
The market should continue to broaden out as more sectors of the economy recover and as underappreciated growth and/or operating leverage materialize. Valuations are higher than normal in the early stages of this economic recovery due to the faith placed in the ability of unprecedented fiscal and monetary stimulus to ignite
and sustain earnings recovery. Within this environment, we are managing the Fund cautiously yet opportunistically. We continue to focus on companies with strong business models and margin structures, that generate solid cash flow and have solid balance sheets.
BUFFALO MID CAP FUND
The Buffalo Mid Cap Fund returned 65.92% for the 12-month period ended March 31, 2021, compared to a return of 73.26% for the Fund's benchmark, the Morningstar US Mid Growth Index. An underweight position in technology stocks, in addition to our decision to avoid some of the most expensive stocks in the index, contributed to the relative underperformance. An average cash position of 1.89%, while not at a level we would consider to be elevated, was also a drag on performance in a period where stocks were rapidly rising in value.
The top contributor in the fiscal year was a recent addition, Lyft, Inc., which benefited from the vaccine rollout and economic reopening. The company released several positive updates during the most recent quarter detailing improvements in ride volume. Also, Lyft cut significant costs to preserve cash during the downturn, and they expect to maintain much of these savings even as the business resumes growth. This should have the effect of driving the company to profitability quickly as business normalizes.
Another recent purchase, TripAdvisor, was also among the leading contributors for the portfolio in the year. While the company's results remain impacted by COVID-19, the outlook for the future has improved with the rollout of vaccines. In addition, TripAdvisor is starting a new subscription service that will provide travelers with discounts. This could address a key long-term weakness for the company by converting its under-monetized, large user base into a sustainable growth engine.
Longtime holding, CBRE Group was another top contributor in the year. The company reported several better than expected quarters throughout the year. The resilience of their outsourcing business has impressed investors, while the more cyclical sales and leasing advisory business also held up better than expected.
GDS Holdings, a Chinese data center developer and operator, was a drag in the period. The stock initially sold off when the market soured on high growth stocks. Then, it experienced further weakness in sympathy with

18
disappointing reports from US data center companies. After GDS reported solid earnings, the stock began to recover only to be hit again by government plans to delist Chinese ADRs, or American Depositary Receipts, three years from now, unless China allows US audit oversight. GDS's growth outlook remains unchanged, but the valuation is much more attractive at current levels.
Western Digital was also among the top detractors during the fiscal year. Demand for their data storage technologies is driven by computing demand across enterprise and consumer markets. While there were pockets of strong demand from cloud and consumer computing, these where more than offset by weakness in enterprise storage and a decline in mobile device sales. In addition, new management surprised investors by eliminating its dividend in favor of investing for growth. This was perhaps a good long-term move, but it created a shock to the cohort of investors who value dividend payments and led to a turnover in the shareholder base. We sold the stock to recognize a loss for tax purposes and used the proceeds to purchase another semiconductor company, Micron Technology.
Economic growth is likely to be robust this year. Pent-up demand and easy comparisons from pandemic induced lockdowns should drive a rapid recovery in spending and hiring. On top of this, the new Biden administration has approved significant fiscal stimulus, and the Federal Reserve appears committed to an accommodative monetary policy until inflation picks up.
In the near term, growth will likely be better in cyclical companies that benefit from rapid economic growth and easy comparisons against pandemic depressed numbers. However, the style rotation in the most recent quarter has taken some of that into account, and valuations on some secular growth companies are starting to appear more reasonable. While we are mindful of macroeconomic conditions, we will continue to manage the portfolio from the bottom-up, investing in businesses with solid growth opportunities, durable competitive advantages, scalable business models, and good management teams, when they are trading at attractive valuations. Thank you for your continued support.
BUFFALO SMALL CAP FUND
The market had an amazing bounce back from the lows of the pandemic-based sell off that occurred at the end of last fiscal year. Growth stocks led for the first half of the current fiscal year then ceded leadership to value as
investors sought companies with higher operating leverage as the economy showed signs of acceleration. Overall, the market posted some eye-popping returns given the low starting point with the Fund gaining 121.14% for the annual period, which compares very favorably to the Morningstar US Small Growth Index gain of 81.92%. The index was driven by broad participation across all sectors with notable strength in Consumer Discretionary, Information Technology, Industrials and Healthcare. The Fund outperformed in all sectors except Energy where the portfolio had no investment exposure. Stock selection drove all the outperformance and the best relative contribution was found in Information Technology, Healthcare, and Consumer Discretionary.
eHealth was the largest detractor during the fiscal year. A leading online insurance brokerage, especially in Medicare Advantage plans for seniors, the company stumbled during the year as a focus on growth caused the company to struggle with member churn. The company is taking steps to improve retention and execution.
Livongo Health was the largest contributor during the fiscal year. The stock was initially purchased late in 2019 with additional purchases through the first quarter of 2020. The provider of digital health monitoring solutions for patients with chronic health conditions, like diabetes, witnessed a strong move in its stock as digital health experienced accelerating growth in membership and revenues as well as high investor interest as a COVID-19 beneficiary. The company eventually was purchased by Teledoc leading to significant gains for the Fund.
Lovesac was also a significant contributor to performance for the year. A designer of premium seating solutions for the home, Lovesac adroitly managed increased tariffs on goods sourced from China and adjusted to the pandemic which temporarily forced the closure of the company's retail locations and caused the company to quickly pivot to ecommerce. The company took advantage of consumers' willingness to spend on items for the home during the pandemic and the stock responded well to the sales and cash flow acceleration, gaining over 800% for the year.
The outlook for the Fund remains generally positive as robust monetary and fiscal stimulus provides an inviting backdrop for investors. While a quick rise in interest rates has given some pause on growth stocks and facilitated a catchup trade for value stocks, we do not believe the prospect of a low single digit yield on a ten-year

19
government bond is going to provide a suitable enough return for investors to begin to abandon equities. 2021 should continue to benefit from a recovering economy with above average gross domestic product (GDP) growth, but as we return to pre-COVID-19 levels, we believe economic growth likely gets stymied as higher federal debt levels and higher taxes eventually slow the economy, which may again command premium multiples on companies that can grow faster than the market. While there is also chatter about inflation ruining the party, we believe we remain below a level that gets the Fed concerned enough to take action on interest rates. Meanwhile COVID-19 variants and the durability of responses to vaccinations remain a wildcard, but the rapid dissemination of vaccines by the new administration is definitely a positive for economic recovery and a return to normalcy. Higher tax rates will be required to pay for the additional fiscal stimulus and could take a small bite out of earnings growth, but we do not believe there is enough political capital or will to raise taxes high enough to choke the market.
We continue to follow our discipline of selling stocks that have become too large in market cap (generally in the $10-12 billion range) and trimming or selling positions where we feel the downside risk greatly exceeds our upside opportunity. Over the past few quarters, we have increased portfolio holdings in cyclical growth companies, a move that helped our relative performance during the market rotation to value and cyclicals. In March 2021, we witnessed an acceleration in the move to value at the expense of growth and are starting to see more compelling valuations in high secular growth companies that had previously become rather expensive. We also are starting to see some attractive valuations in companies that were perceived to be COVID-19 beneficiaries, but have recently sold off on fears of tough comparisons over the next few quarters. As usual, we continue to look for ways to optimize the portfolio and remain busy with evaluating new companies. We appreciate your continued support as shareholders.
Sincerely,

John C. Kornitzer
President, KCM

20
Bond ratings are grades given to bonds that indicate their credit quality as determined by a private independent rating service such as Standard & Poor's. The firm evaluates a bond issuer's financial strength, or its ability to pay a bond's principal and interest in a timely fashion. Ratings are expressed as letters ranging from 'AAA', which is the highest grade, to 'D', which is the lowest grade. In limited situations when the rating agency has not issued a formal rating, the Advisor will classify the security as nonrated.
Earnings growth is not representative of a fund's future performance.
A basis point is one hundredth of a percentage point (0.01%) Yield is the income return on an investment.
Yield to worst is the lowest potential yield that can be received on a bond without the issuer actually defaulting. A Spread is the difference between the bid and the ask price of a security.
Spread to worst is the difference between the yield to worst of a bond and the yield to worst of a U.S. Treasury security with similar duration.
The London Interbank offered Rate (LIBOR) is a benchmark interest rate at which major global banks lead to one another in the international interbank market for short-term loans.
Duration is a commonly used measure of the potential volatility of the price of a debt security, or the aggregate market value of a portfolio of debt securities, prior to maturity. Securities with a longer duration generally have more volatile prices than securities of comparable quality with a shorter duration.
Active share is a measure of the percentage of stock holdings in a manager's portfolio that differs from the benchmark index.
Cash flow is the net amount of cash and cash-equivalents being transferred into and out of a business.
Earnings per share is calculated as a company's profit divided by the outstanding shares of its common stock.
EBITDA, or earnings before interest, taxes, depreciation and amortization, is a measure of a company's overall financial performance.
A yield curve is a line that plots yields (interest rates) of bonds having equal credit quality but differing maturity dates. The slope of the yield curve gives an idea of future interest rate changes and economic activity.

21
EXPENSE EXAMPLE (UNAUDITED)
As a shareholder of the Funds, you incur two types of costs: (1) transaction costs (including redemption fees) and (2) ongoing costs, including management fees, shareholder servicing fees (Investor Class only) and other Fund specific expenses. The examples below are intended to help you understand your ongoing costs (in dollars) of investing in the Funds and to compare these costs with the ongoing costs of investing in other mutual funds. The example is based on an investment of $1,000 invested at the beginning of the period and held for the entire period (October 1, 2020 – March 31, 2021).
ACTUAL EXPENSES
The first line of each table below provides information about actual account values and actual expenses. You may use the information in this line, together with the amount you invested, to estimate the expenses that you paid over the period. Simply divide your account by $1,000 (for example, an $8,600 account value divided by $1,000 = 8.6), then multiply the result by the number in the first line under the heading entitled "Expenses Paid During the Period" to estimate the expenses you paid on your account during the period. Although the Funds charge no sales load or transaction fees, you will be assessed fees for outgoing wire transfers, returned checks and stop payment orders at prevailing rates charged by U.S. Bancorp Fund Services, LLC, the Funds' transfer agent. If you request that a redemption be made by wire transfer, currently a $15.00 fee is charged by the Funds' transfer agent. To the extent a Fund invests in shares of other investment companies as part of its investment strategy, you will indirectly bear your proportionate share of any fees and expenses charged by
the underlying funds in which the Fund invests in addition to the expenses of the Fund. Actual expenses of the underlying funds are expected to vary among the various underlying funds. These expenses are not included in the examples below. The examples below include management fees, registration fees and other expenses. However, the examples below do not include portfolio trading commissions and related expenses and other extraordinary expenses as determined under U.S. generally accepted accounting principles.
HYPOTHETICAL EXAMPLE FOR COMPARISON PURPOSES
The second line of each table below provides information about hypothetical account values and hypothetical expenses based on the Funds' actual expense ratios and an assumed rate of return of 5% per year before expenses, which are not the Funds' actual returns. The hypothetical account values and expenses may not be used to estimate the actual ending account balance or expenses you paid for the period. You may use this information to compare the ongoing costs of investing in our Funds and other funds. To do so, compare this 5% hypothetical example with the 5% hypothetical examples that appear in the shareholder reports of the other funds. Please note that the expenses shown in the tables are meant to highlight your ongoing costs only and do not reflect any transactional costs. Therefore, the second line of the tables is useful in comparing ongoing costs only, and will not help you determine the relative total costs of owning different funds. In addition, if these transactional costs were included, your costs would have been higher.
BUFFALO DISCOVERY FUND | | Beginning
Account Value
October 1, 2020 | | Ending
Account Value
March 31, 2021 | | Expenses Paid During
Period October 1, 2020 -
March 31, 2021* | |
Investor Class | | | | | | | |
Actual | | $ | 1,000.00 | | | $ | 1,228.20 | | | $ | 5.56 | | |
Hypothetical (5% return before expenses) | | $ | 1,000.00 | | | $ | 1,019.95 | | | $ | 5.04 | | |
Institutional Class | | | | | | | |
Actual | | $ | 1,000.00 | | | $ | 1,229.30 | | | $ | 4.78 | | |
Hypothetical (5% return before expenses) | | $ | 1,000.00 | | | $ | 1,020.64 | | | $ | 4.33 | | |
* Expenses for the Investor Class are equal to the Fund's annualized expense ratio of 1.00%, multiplied by the average account value over the period, multiplied by 182/365 to reflect the one-half year period. Expenses for the Institutional Class are equal to the Fund's annualized expense ratio of 0.86%, multiplied by the average account value over the period, multiplied by 182/365 to project a one-half year period.

22
BUFFALO DIVIDEND FOCUS FUND | | Beginning
Account Value
October 1, 2020 | | Ending
Account Value
March 31, 2021 | | Expenses Paid During
Period October 1, 2020 -
March 31, 2021* | |
Investor Class | | | | | | | |
Actual | | $ | 1,000.00 | | | $ | 1,207.50 | | | $ | 5.12 | | |
Hypothetical (5% return before expenses) | | $ | 1,000.00 | | | $ | 1,020.29 | | | $ | 4.68 | | |
Institutional Class | | | | | | | |
Actual | | $ | 1,000.00 | | | $ | 1,208.50 | | | $ | 4.29 | | |
Hypothetical (5% return before expenses) | | $ | 1,000.00 | | | $ | 1,021.04 | | | $ | 3.93 | | |
* Expenses for the Investor Class are equal to the Fund's annualized expense ratio of 0.93%, multiplied by the average account value over the period, multiplied by 182/365 to reflect the one-half year period. Expenses for the Institutional Class are equal to the Fund's annualized expense ratio of 0.78%, multiplied by the average account value over the period, multiplied by 182/365 to project a one-half year period.
BUFFALO EARLY STAGE GROWTH FUND | | Beginning
Account Value
October 1, 2020 | | Ending
Account Value
March 31, 2021 | | Expenses Paid During
Period October 1, 2020 -
March 31, 2021* | |
Investor Class | | | | | | | |
Actual | | $ | 1,000.00 | | | $ | 1,404.80 | | | $ | 8.93 | | |
Hypothetical (5% return before expenses) | | $ | 1,000.00 | | | $ | 1,017.50 | | | $ | 7.49 | | |
Institutional Class | | | | | | | |
Actual | | $ | 1,000.00 | | | $ | 1,405.60 | | | $ | 8.04 | | |
Hypothetical (5% return before expenses) | | $ | 1,000.00 | | | $ | 1,018.25 | | | $ | 6.74 | | |
* Expenses for the Investor Class are equal to the Fund's annualized expense ratio of 1.49%, multiplied by the average account value over the period, multiplied by 182/365 to reflect the one-half year period. Expenses for the Institutional Class are equal to the Fund's annualized expense ratio of 1.34%, multiplied by the average account value over the period, multiplied by 182/365 to project a one-half year period.
BUFFALO FLEXIBLE INCOME FUND | | Beginning
Account Value
October 1, 2020 | | Ending
Account Value
March 31, 2021 | | Expenses Paid During
Period October 1, 2020 -
March 31, 2021* | |
Investor Class | | | | | | | |
Actual | | $ | 1,000.00 | | | $ | 1,202.80 | | | $ | 5.55 | | |
Hypothetical (5% return before expenses) | | $ | 1,000.00 | | | $ | 1,019.90 | | | $ | 5.09 | | |
Institutional Class | | | | | | | |
Actual | | $ | 1,000.00 | | | $ | 1,204.30 | | | $ | 4.73 | | |
Hypothetical (5% return before expenses) | | $ | 1,000.00 | | | $ | 1,020.64 | | | $ | 4.33 | | |
* Expenses for the Investor Class are equal to the Fund's annualized expense ratio of 1.01%, multiplied by the average account value over the period, multiplied by 182/365 to reflect the one-half year period. Expenses for the Institutional Class are equal to the Fund's annualized expense ratio of 0.86%, multiplied by the average account value over the period, multiplied by 182/365 to project a one-half year period.
BUFFALO GROWTH FUND | | Beginning
Account Value
October 1, 2020 | | Ending
Account Value
March 31, 2021 | | Expenses Paid During
Period October 1, 2020 -
March 31, 2021* | |
Investor Class | | | | | | | |
Actual | | $ | 1,000.00 | | | $ | 1,129.90 | | | $ | 4.89 | | |
Hypothetical (5% return before expenses) | | $ | 1,000.00 | | | $ | 1,020.34 | | | $ | 4.64 | | |
Institutional Class | | | | | | | |
Actual | | $ | 1,000.00 | | | $ | 1,130.80 | | | $ | 4.09 | | |
Hypothetical (5% return before expenses) | | $ | 1,000.00 | | | $ | 1,021.09 | | | $ | 3.88 | | |
* Expenses for the Investor Class are equal to the Fund's annualized expense ratio of 0.92%, multiplied by the average account value over the period, multiplied by 182/365 to reflect the one-half year period. Expenses for the Institutional Class are equal to the Fund's annualized expense ratio of 0.77%, multiplied by the average account value over the period, multiplied by 182/365 to project a one-half year period.

23
BUFFALO HIGH YIELD FUND | | Beginning
Account Value
October 1, 2020 | | Ending
Account Value
March 31, 2021 | | Expenses Paid During
Period October 1, 2020 -
March 31, 2021* | |
Investor Class | |
Actual | | $ | 1,000.00 | | | $ | 1,094.20 | | | $ | 5.27 | | |
Hypothetical (5% return before expenses) | | $ | 1,000.00 | | | $ | 1,019.90 | | | $ | 5.09 | | |
Institutional Class | |
Actual | | $ | 1,000.00 | | | $ | 1,095.40 | | | $ | 4.49 | | |
Hypothetical (5% return before expenses) | | $ | 1,000.00 | | | $ | 1,020.64 | | | $ | 4.33 | | |
* Expenses for the Investor Class are equal to the Fund's annualized expense ratio of 1.01%, multiplied by the average account value over the period, multiplied by 182/365 to reflect the one-half year period. Expenses for the Institutional Class are equal to the Fund's annualized expense ratio of 0.86%, multiplied by the average account value over the period, multiplied by 182/365 to project a one-half year period.
BUFFALO INTERNATIONAL FUND | | Beginning
Account Value
October 1, 2020 | | Ending
Account Value
March 31, 2021 | | Expenses Paid During
Period October 1, 2020 -
March 31, 2021* | |
Investor Class | | | | | | | |
Actual | | $ | 1,000.00 | | | $ | 1,156.10 | | | $ | 5.59 | | |
Hypothetical (5% return before expenses) | | $ | 1,000.00 | | | $ | 1,019.75 | | | $ | 5.24 | | |
Institutional Class | | | | | | | |
Actual | | $ | 1,000.00 | | | $ | 1,157.30 | | | $ | 4.79 | | |
Hypothetical (5% return before expenses) | | $ | 1,000.00 | | | $ | 1,020.49 | | | $ | 4.48 | | |
* Expenses for the Investor Class are equal to the Fund's annualized expense ratio of 1.04%, multiplied by the average account value over the period, multiplied by 182/365 to reflect the one-half year period. Expenses for the Institutional Class are equal to the Fund's annualized expense ratio of 0.89%, multiplied by the average account value over the period, multiplied by 182/365 to project a one-half year period.
BUFFALO LARGE CAP FUND | | Beginning
Account Value
October 1, 2020 | | Ending
Account Value
March 31, 2021 | | Expenses Paid During
Period October 1, 2020 -
March 31, 2021* | |
Investor Class | | | | | | | |
Actual | | $ | 1,000.00 | | | $ | 1,134.20 | | | $ | 4.95 | | |
Hypothetical (5% return before expenses) | | $ | 1,000.00 | | | $ | 1,020.29 | | | $ | 4.68 | | |
Institutional Class | | | | | | | |
Actual | | $ | 1,000.00 | | | $ | 1,134.60 | | | $ | 4.15 | | |
Hypothetical (5% return before expenses) | | $ | 1,000.00 | | | $ | 1,021.04 | | | $ | 3.93 | | |
* Expenses for the Investor Class are equal to the Fund's annualized expense ratio of 0.93%, multiplied by the average account value over the period, multiplied by 182/365 to reflect the one-half year period. Expenses for the Institutional Class are equal to the Fund's annualized expense ratio of 0.78%, multiplied by the average account value over the period, multiplied by 182/365 to project a one-half year period.
BUFFALO MID CAP FUND | | Beginning
Account Value
October 1, 2020 | | Ending
Account Value
March 31, 2021 | | Expenses Paid During
Period October 1, 2020 -
March 31, 2021* | |
Investor Class | | | | | | | |
Actual | | $ | 1,000.00 | | | $ | 1,261.10 | | | $ | 5.75 | | |
Hypothetical (5% return before expenses) | | $ | 1,000.00 | | | $ | 1,019.85 | | | $ | 5.14 | | |
Institutional Class | | | | | | | |
Actual | | $ | 1,000.00 | | | $ | 1,261.10 | | | $ | 4.90 | | |
Hypothetical (5% return before expenses) | | $ | 1,000.00 | | | $ | 1,020.59 | | | $ | 4.38 | | |
* Expenses for the Investor Class are equal to the Fund's annualized expense ratio of 1.02%, multiplied by the average account value over the period, multiplied by 182/365 to reflect the one-half year period. Expenses for the Institutional Class are equal to the Fund's annualized expense ratio of 0.87%, multiplied by the average account value over the period, multiplied by 182/365 to project a one-half year period.

24
BUFFALO SMALL CAP FUND | | Beginning
Account Value
October 1, 2020 | | Ending
Account Value
March 31, 2021 | | Expenses Paid During
Period October 1, 2020 -
March 31, 2021* | |
Investor Class | | | | | | | |
Actual | | $ | 1,000.00 | | | $ | 1,396.20 | | | $ | 5.97 | | |
Hypothetical (5% return before expenses) | | $ | 1,000.00 | | | $ | 1,019.95 | | | $ | 5.04 | | |
Institutional Class | | | | | | | |
Actual | | $ | 1,000.00 | | | $ | 1,396.40 | | | $ | 5.14 | | |
Hypothetical (5% return before expenses) | | $ | 1,000.00 | | | $ | 1,020.64 | | | $ | 4.33 | | |
* Expenses for the Investor Class are equal to the Fund's annualized expense ratio of 1.00%, multiplied by the average account value over the period, multiplied by 182/365 to reflect the one-half year period. Expenses for the Institutional Class are equal to the Fund's annualized expense ratio of 0.86%, multiplied by the average account value over the period, multiplied by 182/365 to project a one-half year period.

25
ALLOCATION OF PORTFOLIO HOLDINGS
(UNAUDITED)
Percentages represent market value as a percentage of investments as of March 31, 2021.
BUFFALO DISCOVERY
FUND
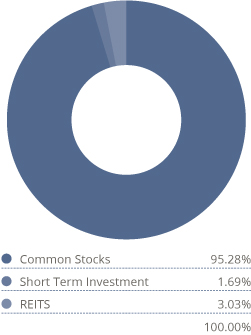
BUFFALO DIVIDEND
FOCUS FUND
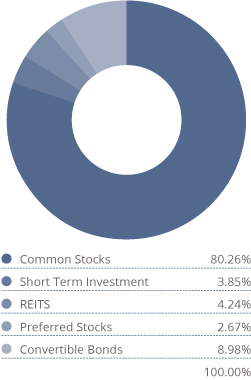
BUFFALO EARLY STAGE GROWTH FUND


BUFFALO FLEXIBLE
INCOME FUND
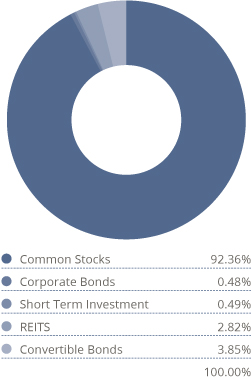
BUFFALO GROWTH
FUND
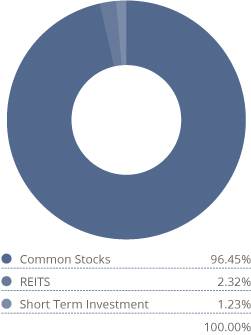
BUFFALO HIGH YIELD
FUND
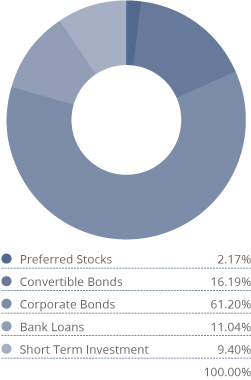
26
Percentages represent market value as a percentage of investments as of March 31, 2021.
BUFFALO
INTERNATIONAL FUND
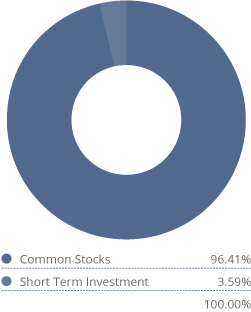
BUFFALO LARGE CAP
FUND
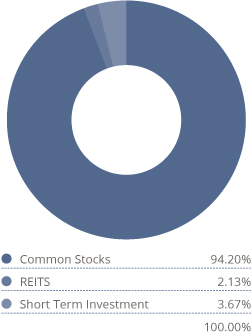
BUFFALO MID CAP
FUND
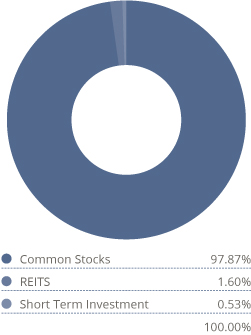
BUFFALO SMALL CAP
FUND
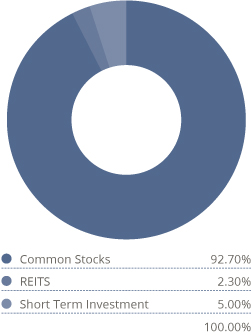

27
BUFFALO DISCOVERY FUND
SCHEDULE OF INVESTMENTS
MARCH 31, 2021
Shares or Face Amount | | | | $ Fair Value* | |
Common Stocks | | | 95.35 | % | |
Communication Services | | | 2.47 | % | |
| | | | | Diversified Telecommunication Services | | | 1.67 | % | |
| | 233,954 | | | Bandwidth, Inc.(a) | | | 29,651,330 | | |
| | | | | Entertainment | | | 0.80 | % | |
| | 81,003 | | | Take-Two Interactive Software, Inc.(a) | | | 14,313,230 | | |
| Total Communication Services (Cost $39,016,397) | | | 43,964,560 | | |
Consumer Discretionary | | | 12.12 | % | |
| | | | | Hotels, Restaurants & Leisure | | | 5.35 | % | |
| | 12,277 | | | Chipotle Mexican Grill, Inc.(a) | | | 17,443,407 | | |
| | 236,443 | | | Darden Restaurants, Inc. | | | 33,574,906 | | |
| | 396,150 | | | MGM Resorts International | | | 15,049,739 | | |
| | 277,635 | | | Penn National Gaming, Inc.(a) | | | 29,107,253 | | |
| | | | 95,175,305 | | |
| | | | | Internet & Direct Marketing Retail | | | 2.24 | % | |
| | 231,845 | | | Expedia Group, Inc.(a) | | | 39,905,161 | | |
| | | | | Specialty Retail | | | 3.51 | % | |
| | 111,650 | | | Five Below, Inc.(a) | | | 21,301,704 | | |
| | 154,917 | | | Ross Stores, Inc. | | | 18,576,097 | | |
| | 127,425 | | | Tractor Supply Co. | | | 22,564,419 | | |
| | | | 62,442,220 | | |
| | | | | Textiles, Apparel & Luxury Goods | | | 1.02 | % | |
| | 227,153 | | | VF Corp. | | | 18,154,068 | | |
| Total Consumer Discretionary (Cost $130,852,783) | | | 215,676,754 | | |
Financials | | | 5.14 | % | |
| | | | | Capital Markets | | | 2.52 | % | |
| | 151,540 | | | Intercontinental Exchange, Inc. | | | 16,923,987 | | |
| | 66,495 | | | MSCI, Inc. | | | 27,880,024 | | |
| | | | 44,804,011 | | |
| | | | | Diversified Financial Services | | | 1.62 | % | |
| | 143,274 | | | Global Payments Inc. | | | 28,881,173 | | |
| | | | | Insurance | | | 1.00 | % | |
| | 245,550 | | | eHealth, Inc.(a) | | | 17,858,851 | | |
| Total Financials (Cost $58,198,739) | | | 91,544,035 | | |

The accompanying notes are an integral part of these financial statements.
28
BUFFALO DISCOVERY FUND
SCHEDULE OF INVESTMENTS
MARCH 31, 2021 Continued
Shares or Face Amount | | | | $ Fair Value* | |
Health Care | | | 21.02 | % | |
| | | | | Biotechnology | | | 3.77 | % | |
| | 247,425 | | | Ligand Pharmaceuticals, Inc.(a) | | | 37,719,941 | | |
| | 289,495 | | | Natera, Inc.(a) | | | 29,395,323 | | |
| | | | 67,115,264 | | |
| | | | | Health Care Equipment & Supplies | | | 5.22 | % | |
| | 188,200 | | | Alcon, Inc. — ADR(a)(b) | | | 13,207,876 | | |
| | 579,200 | | | Boston Scientific Corp.(a) | | | 22,386,080 | | |
| | 284,770 | | | Hologic, Inc.(a) | | | 21,181,193 | | |
| | 24,237 | | | IDEXX Laboratories, Inc.(a) | | | 11,859,406 | | |
| | 152,299 | | | Zimmer Biomet Holdings, Inc. | | | 24,380,024 | | |
| | | | 93,014,579 | | |
| | | | | Health Care Providers & Services | | | 2.00 | % | |
| | 101,140 | | | Guardant Health, Inc.(a) | | | 15,439,021 | | |
| | 297,850 | | | HealthEquity, Inc.(a) | | | 20,253,800 | | |
| | | | 35,692,821 | | |
| | | | | Life Sciences Tools & Services | | | 7.39 | % | |
| | 374,775 | | | Adaptive Biotechnologies Corporation(a) | | | 15,088,441 | | |
| | 140,815 | | | Agilent Technologies, Inc. | | | 17,903,219 | | |
| | 863,625 | | | Avantor, Inc.(a) | | | 24,984,671 | | |
| | 21,380 | | | Bio-Rad Laboratories, Inc.(a) | | | 12,211,615 | | |
| | 74,975 | | | Charles River Laboratories International, Inc.(a) | | | 21,730,004 | | |
| | 115,506 | | | ICON PLC. — ADR(a)(b) | | | 22,681,913 | | |
| | 675,910 | | | Sotera Health Co.(a) | | | 16,870,714 | | |
| | | | 131,470,577 | | |
| | | | | Pharmaceuticals | | | 2.64 | % | |
| | 205,860 | | | Catalent, Inc.(a) | | | 21,679,117 | | |
| | 274,600 | | | Horizon Therapeutics Plc — ADR(a)(b) | | | 25,274,184 | | |
| | | | 46,953,301 | | |
| Total Health Care (Cost $281,120,671) | | | 374,246,542 | | |
Industrials | | | 20.14 | % | |
| | | | | Commercial Services & Supplies | | | 2.02 | % | |
| | 211,816 | | | Copart, Inc.(a) | | | 23,005,336 | | |
| | 867,540 | | | KAR Auction Services, Inc.(a) | | | 13,013,100 | | |
| | | | 36,018,436 | | |
| | | | | Construction & Engineering | | | 1.69 | % | |
| | 320,540 | | | MasTec, Inc.(a) | | | 30,034,598 | | |

The accompanying notes are an integral part of these financial statements.
29
BUFFALO DISCOVERY FUND
SCHEDULE OF INVESTMENTS
MARCH 31, 2021 Continued
Shares or Face Amount | | | | $ Fair Value* | |
| | | | | Electrical Equipment | | | 3.64 | % | |
| | 230,015 | | | AMETEK, Inc. | | | 29,379,816 | | |
| | 108,150 | | | Generac Holdings, Inc.(a) | | | 35,413,717 | | |
| | | | 64,793,533 | | |
| | | | | Machinery | | | 0.91 | % | |
| | 329,116 | | | Ingersoll Rand, Inc.(a) | | | 16,195,798 | | |
| | | | | Professional Services | | | 7.68 | % | |
| | 31,966 | | | CoStar Group, Inc.(a) | | | 26,272,536 | | |
| | 356,495 | | | IHS Markit Ltd. — ADR(b) | | | 34,501,586 | | |
| | 230,664 | | | TransUnion | | | 20,759,760 | | |
| | 705,590 | | | Upwork, Inc.(a) | | | 31,589,264 | | |
| | 133,737 | | | Verisk Analytics, Inc. | | | 23,629,991 | | |
| | | | 136,753,137 | | |
| | | | | Road & Rail | | | 3.09 | % | |
| | 139,790 | | | Kansas City Southern | | | 36,893,377 | | |
| | 285,443 | | | Lyft, Inc.(a) | | | 18,034,289 | | |
| | | | 54,927,666 | | |
| | | | | Trading Companies & Distributors | | | 1.11 | % | |
| | 392,325 | | | Fastenal Co. | | | 19,726,101 | | |
| Total Industrials (Cost $192,297,876) | | | 358,449,269 | | |
Information Technology | | | 32.18 | % | |
| | | | | Communications Equipment | | | 4.28 | % | |
| | 51,479 | | | Arista Networks Inc.(a) | | | 15,540,995 | | |
| | 343,785 | | | Ciena Corp.(a) | | | 18,811,915 | | |
| | 64,211 | | | F5 Networks, Inc.(a) | | | 13,395,699 | | |
| | 310,936 | | | Lumentum Holdings, Inc.(a) | | | 28,404,004 | | |
| | | | 76,152,613 | | |
| | | | | Electronic Equipment, Instruments & Components | | | 4.25 | % | |
| | 377,274 | | | Amphenol Corp. — Class A | | | 24,888,766 | | |
| | 213,930 | | | Keysight Technologies, Inc.(a) | | | 30,677,562 | | |
| | 463,933 | | | National Instruments Corp. | | | 20,034,947 | | |
| | | | 75,601,275 | | |
| | | | | Internet Software & Services | | | 1.23 | % | |
| | 1,799,700 | | | Cloudera, Inc.(a) | | | 21,902,349 | | |

The accompanying notes are an integral part of these financial statements.
30
BUFFALO DISCOVERY FUND
SCHEDULE OF INVESTMENTS
MARCH 31, 2021 Continued
Shares or Face Amount | | | | $ Fair Value* | |
| | | | | IT Services | | | 5.28 | % | |
| | 144,005 | | | Akamai Technologies, Inc.(a) | | | 14,674,109 | | |
| | 61,084 | | | EPAM Systems, Inc.(a) | | | 24,231,412 | | |
| | 91,566 | | | FleetCor Technologies, Inc.(a) | | | 24,597,375 | | |
| | 296,630 | | | GoDaddy, Inc. — Class A(a) | | | 23,024,421 | | |
| | 22,202 | | | Twilio Inc. — Class A(a) | | | 7,565,553 | | |
| | | | 94,092,870 | | |
| | | | | Semiconductors & Semiconductor Equipment | | | 5.54 | % | |
| | 90,000 | | | KLA-Tencor Corporation | | | 29,736,000 | | |
| | 346,854 | | | Marvell Technology Group Ltd. — ADR(b) | | | 16,988,909 | | |
| | 223,745 | | | Micron Technology, Inc.(a) | | | 19,736,546 | | |
| | 135,509 | | | Universal Display Corp. | | | 32,084,466 | | |
| | | | 98,545,921 | | |
| | | | | Software | | | 11.60 | % | |
| | 663,745 | | | 8x8, Inc.(a) | | | 21,531,888 | | |
| | 90,539 | | | Aspen Technology, Inc.(a) | | | 13,067,494 | | |
| | 154,043 | | | Guidewire Software, Inc.(a) | | | 15,655,390 | | |
| | 23,613 | | | HubSpot, Inc.(a) | | | 10,725,261 | | |
| | 194,890 | | | Lightspeed POS, Inc. — ADR(a)(b) | | | 12,241,041 | | |
| | 70,000 | | | Palo Alto Networks, Inc.(a) | | | 22,544,200 | | |
| | 583,015 | | | SVMK, Inc.(a) | | | 10,680,835 | | |
| | 92,330 | | | Synopsys, Inc.(a) | | | 22,877,527 | | |
| | 567,355 | | | Tenable Holdings, Inc.(a) | | | 20,529,741 | | |
| | 41,191 | | | Tyler Technologies, Inc.(a) | | | 17,486,815 | | |
| | 396,345 | | | Varonis Systems, Inc.(a) | | | 20,348,352 | | |
| | 141,807 | | | Zendesk, Inc.(a) | | | 18,806,444 | | |
| | | | 206,494,988 | | |
| Total Information Technology (Cost $407,494,277) | | | 572,790,016 | | |
Materials | | | 2.28 | % | |
| | | | | Construction Materials | | | 1.43 | % | |
| | 75,798 | | | Martin Marietta Materials, Inc. | | | 25,454,484 | | |
| | | | | Containers & Packaging | | | 0.85 | % | |
| | 107,500 | | | AptarGroup, Inc. | | | 15,229,525 | | |
| Total Materials (Cost $32,258,659) | | | 40,684,009 | | |
| Total Common Stocks (Cost $1,141,239,402) | | | 1,697,355,185 | | |

The accompanying notes are an integral part of these financial statements.
31
BUFFALO DISCOVERY FUND
SCHEDULE OF INVESTMENTS
MARCH 31, 2021 Continued
Shares or Face Amount | | | | $ Fair Value* | |
REITs | | | 3.03 | % | |
Real Estate | | | 3.03 | % | |
| | | | | Equity Real Estate Investment Trusts (REITs) | | | 3.03 | % | |
| | 277,429 | | | CyrusOne, Inc. | | | 18,787,492 | | |
| | 22,655 | | | Equinix Inc. | | | 15,396,112 | | |
| | 71,515 | | | SBA Communications Corp. | | | 19,848,988 | | |
| Total Real Estate (Cost $41,455,936) | | | 54,032,592 | | |
| Total REITs (Cost $41,455,936) | | | 54,032,592 | | |
Short Term Investments | | | 1.69 | % | |
Investment Company | | | 1.69 | % | |
| | 30,031,329 | | | Fidelity Investments Money Market Funds — Government Portfolio — Class I — 0.01%(c) | | | 30,031,329 | | |
Total Investment Company | | | 30,031,329 | | |
| Total Short Term Investments (Cost $30,031,329) | | | 30,031,329 | | |
Total Investments (Cost $1,212,726,667)
| | | 100.07
1,781,419,106 | % | |
Liabilities in Excess of Other Assets
| | | (0.07
(1,274,864) | )% | |
Total Net Assets
| | | 100.00
1,780,144,242 | % | |
ADR American Depositary Receipt
PLC Public Limited Company
(a) Non Income Producing.
(b) Foreign Issued Security. The total value of these securities amounted to $124,895,509 (7.02% of net assets) at March 31, 2021.
(c) The rate quoted is the annualized seven-day effective yield as of March 31, 2021.
* See Note 1A of the accompanying Notes to Financial Statements regarding valuation of securities.
The Global Industry Classification Standard (GICS) was developed by and/or is the exclusive property of MSCI, Inc. and Standard & Poor's Financial Services LLC ("S&P"). GICS is a service mark of MSCI and S&P and has been licensed for use by U.S. Bancorp Fund Services, LLC.

The accompanying notes are an integral part of these financial statements.
32
BUFFALO DIVIDEND FOCUS FUND
SCHEDULE OF INVESTMENTS
MARCH 31, 2021
Shares or Face Amount | | | | $ Fair Value | |
Common Stocks | | | 80.24 | % | |
Communication Services | | | 7.72 | % | |
| | | | | Diversified Telecommunication Services | | | 0.61 | % | |
| | 10,625 | | | Verizon Communications, Inc. | | | 617,844 | | |
| | | | | Entertainment | | | 2.38 | % | |
| | 10,750 | | | Activision Blizzard, Inc. | | | 999,750 | | |
| | 7,605 | | | The Walt Disney Co.(a) | | | 1,403,274 | | |
| | | | 2,403,024 | | |
| | | | | Interactive Media & Services | | | 3.52 | % | |
| | 630 | | | Alphabet, Inc. — Class A(a) | | | 1,299,388 | | |
| | 650 | | | Alphabet, Inc. — Class C(a) | | | 1,344,609 | | |
| | 3,100 | | | Facebook, Inc. — Class A(a) | | | 913,043 | | |
| | | | 3,557,040 | | |
| | | | | Media | | | 1.21 | % | |
| | 22,500 | | | Comcast Corp. — Class A | | | 1,217,475 | | |
| Total Communication Services (Cost $3,286,636) | | | 7,795,383 | | |
Consumer Discretionary | | | 4.62 | % | |
| | | | | Hotels, Restaurants & Leisure | | | 1.66 | % | |
| | 6,775 | | | Cedar Fair, L.P.(a) | | | 336,582 | | |
| | 5,000 | | | Las Vegas Sands Corp(a) | | | 303,800 | | |
| | 9,500 | | | Starbucks Corp. | | | 1,038,065 | | |
| | | | 1,678,447 | | |
| | | | | Internet & Direct Marketing Retail | | | 1.68 | % | |
| | 550 | | | Amazon.com, Inc.(a) | | | 1,701,744 | | |
| | | | | Specialty Retail | | | 1.28 | % | |
| | 4,225 | | | The Home Depot, Inc. | | | 1,289,681 | | |
| Total Consumer Discretionary (Cost $1,974,064) | | | 4,669,872 | | |
Consumer Staples | | | 2.88 | % | |
| | | | | Beverages | | | 0.78 | % | |
| | 5,550 | | | PepsiCo, Inc. | | | 785,047 | | |
| | | | | Food & Staples Retailing | | | 0.46 | % | |
| | 3,450 | | | Walmart, Inc. | | | 468,614 | | |

The accompanying notes are an integral part of these financial statements.
33
BUFFALO DIVIDEND FOCUS FUND
SCHEDULE OF INVESTMENTS
MARCH 31, 2021 Continued
Shares or Face Amount | | | | $ Fair Value | |
| | | | | Food Products | | | 0.87 | % | |
| | 11,900 | | | Tyson Foods, Inc. | | | 884,170 | | |
| | | | | Household Products | | | 0.77 | % | |
| | 5,725 | | | The Procter & Gamble Co. | | | 775,337 | | |
| Total Consumer Staples (Cost $1,872,890) | | | 2,913,168 | | |
Energy | | | 6.68 | % | |
| | | | | Oil, Gas & Consumable Fuels | | | 6.68 | % | |
| | 64,800 | | | Energy Transfer Equity, L.P. | | | 497,664 | | |
| | 46,650 | | | Enterprise Products Partners L.P. | | | 1,027,233 | | |
| | 17,200 | | | Enviva Partners LP | | | 831,276 | | |
| | 9,875 | | | Hess Corp. | | | 698,755 | | |
| | 12,126 | | | Marathon Petroleum Corp. | | | 648,620 | | |
| | 7,900 | | | Valero Energy Corp. | | | 565,640 | | |
| | 170,000 | | | Viper Energy Partners LP | | | 2,475,200 | | |
| Total Energy (Cost $5,653,531) | | | 6,744,388 | | |
Financials | | | 16.53 | % | |
| | | | | Banks | | | 10.17 | % | |
| | 59,000 | | | Bank of America Corp. | | | 2,282,710 | | |
| | 29,000 | | | Citigroup, Inc. | | | 2,109,750 | | |
| | 46,500 | | | Citizens Financial Group, Inc. | | | 2,052,975 | | |
| | 12,500 | | | JPMorgan Chase & Co. | | | 1,902,875 | | |
| | 33,000 | | | Truist Financial Corp. | | | 1,924,560 | | |
| | | | 10,272,870 | | |
| | | | | Capital Markets | | | 3.43 | % | |
| | 1,100 | | | BlackRock, Inc. | | | 829,356 | | |
| | 4,025 | | | CME Group, Inc. | | | 822,026 | | |
| | 5,150 | | | S&P Global, Inc. | | | 1,817,280 | | |
| | | | 3,468,662 | | |
| | | | | Diversified Financial Services | | | 1.50 | % | |
| | 27,000 | | | Compass Diversified Holdings | | | 625,050 | | |
| | 4,400 | | | Global Payments Inc. | | | 886,952 | | |
| | | | 1,512,002 | | |
| | | | | Insurance | | | 1.43 | % | |
| | 11,575 | | | Arthur J. Gallagher & Co. | | | 1,444,213 | | |
| Total Financials (Cost $8,840,477) | | | 16,697,747 | | |

The accompanying notes are an integral part of these financial statements.
34
BUFFALO DIVIDEND FOCUS FUND
SCHEDULE OF INVESTMENTS
MARCH 31, 2021 Continued
Shares or Face Amount | | | | $ Fair Value | |
Health Care | | | 14.64 | % | |
| | | | | Health Care Equipment & Supplies | | | 2.79 | % | |
| | 11,600 | | | Baxter International, Inc. | | | 978,344 | | |
| | 7,400 | | | Medtronic, PLC(b) | | | 874,162 | | |
| | 6,000 | | | Zimmer Biomet Holdings, Inc. | | | 960,480 | | |
| | | | 2,812,986 | | |
| | | | | Health Care Providers & Services | | | 7.11 | % | |
| | 3,375 | | | Anthem, Inc. | | | 1,211,456 | | |
| | 24,900 | | | CVS Health Corp. | | | 1,873,227 | | |
| | 8,100 | | | HCA Healthcare, Inc. | | | 1,525,554 | | |
| | 2,500 | | | McKesson Corp. | | | 487,600 | | |
| | 5,600 | | | UnitedHealth Group, Inc. | | | 2,083,592 | | |
| | | | 7,181,429 | | |
| | | | | Pharmaceuticals | | | 4.74 | % | |
| | 3,150 | | | Eli Lilly & Co. | | | 588,483 | | |
| | 24,700 | | | Horizon Therapeutics Plc(a)(b) | | | 2,273,388 | | |
| | 7,125 | | | Johnson & Johnson | | | 1,170,994 | | |
| | 9,800 | | | Merck & Co., Inc. | | | 755,482 | | |
| | | | 4,788,347 | | |
| Total Health Care (Cost $9,219,740) | | | 14,782,762 | | |
Industrials | | | 5.76 | % | |
| | | | | Aerospace & Defense | | | 0.76 | % | |
| | 3,025 | | | The Boeing Co.(a) | | | 770,528 | | |
| | | | | Commercial Services & Supplies | | | 0.95 | % | |
| | 2,800 | | | Cintas Corp. | | | 955,668 | | |
| | | | | Electrical Equipment | | | 0.32 | % | |
| | 2,500 | | | AMETEK, Inc. | | | 319,325 | | |
| | | | | Industrial Conglomerates | | | 0.74 | % | |
| | 3,450 | | | Honeywell International, Inc. | | | 748,891 | | |
| | | | | Machinery | | | 1.23 | % | |
| | 3,950 | | | Parker-Hannifin Corp. | | | 1,245,949 | | |
| | | | | Professional Services | | | 1.25 | % | |
| | 3,200 | | | Equifax, Inc. | | | 579,616 | | |
| | 7,000 | | | IHS Markit Ltd.(b) | | | 677,460 | | |
| | | | 1,257,076 | | |

The accompanying notes are an integral part of these financial statements.
35
BUFFALO DIVIDEND FOCUS FUND
SCHEDULE OF INVESTMENTS
MARCH 31, 2021 Continued
Shares or Face Amount | | | | $ Fair Value | |
| | | | | Trading Companies & Distributors | | | 0.51 | % | |
| | 10,300 | | | Fastenal Co. | | | 517,884 | | |
| Total Industrials (Cost $3,430,116) | | | 5,815,321 | | |
Information Technology | | | 16.24 | % | |
| | | | | Communications Equipment | | | 0.91 | % | |
| | 17,750 | | | Cisco Systems, Inc. | | | 917,853 | | |
| | | | | IT Services | | | 4.26 | % | |
| | 4,400 | | | MasterCard, Inc. — Class A | | | 1,566,620 | | |
| | 12,925 | | | Visa Inc. — Class A | | | 2,736,610 | | |
| | | | 4,303,230 | | |
| | | | | Semiconductors & Semiconductor Equipment | | | 1.74 | % | |
| | 9,075 | | | QUALCOMM, Inc. | | | 1,203,254 | | |
| | 2,950 | | | Texas Instruments, Inc. | | | 557,521 | | |
| | | | 1,760,775 | | |
| | | | | Software | | | 5.57 | % | |
| | 50,100 | | | Absolute Software Corp. — ADR(b) | | | 694,887 | | |
| | 18,650 | | | Microsoft Corp. | | | 4,397,110 | | |
| | 7,700 | | | SS&C Technologies Holdings, Inc. | | | 537,999 | | |
| | | | 5,629,996 | | |
| | | | | Technology Hardware, Storage & Peripherals | | | 3.76 | % | |
| | 31,080 | | | Apple Inc. | | | 3,796,422 | | |
| Total Information Technology (Cost $5,663,134) | | | 16,408,276 | | |
Materials | | | 1.28 | % | |
| | | | | Construction Materials | | | 0.50 | % | |
| | 1,500 | | | Martin Marietta Materials, Inc. | | | 503,730 | | |
| | | | | Containers & Packaging | | | 0.78 | % | |
| | 43,700 | | | Graphic Packaging Holding Co. | | | 793,592 | | |
| Total Materials (Cost $1,045,888) | | | 1,297,322 | | |
Utilities | | | 3.89 | % | |
| | | | | Electric Utilities | | | 3.09 | % | |
| | 15,700 | | | American Electric Power Co., Inc. | | | 1,329,790 | | |
| | 30,550 | | | Edison International | | | 1,790,230 | | |
| | | | 3,120,020 | | |

The accompanying notes are an integral part of these financial statements.
36
BUFFALO DIVIDEND FOCUS FUND
SCHEDULE OF INVESTMENTS
MARCH 31, 2021 Continued
Shares or Face Amount | | | | $ Fair Value | |
| | | | | Multi-Utilities | | | 0.80 | % | |
| | 6,100 | | | Sempra Energy | | | 808,738 | | |
| Total Utilities (Cost $3,582,308) | | | 3,928,758 | | |
| Total Common Stocks (Cost $44,568,784) | | | 81,052,997 | | |
REITs | | | 4.22 | % | |
Real Estate | | | 4.22 | % | |
| | | | | Equity Real Estate Investment Trusts (REITs) | | | 4.22 | % | |
| | 3,200 | | | American Tower Corp. | | | 764,992 | | |
| | 19,106 | | | Community Healthcare Trust, Inc. | | | 881,169 | | |
| | 10,000 | | | CyrusOne, Inc. | | | 677,200 | | |
| | 5,000 | | | Digital Realty Trust, Inc. | | | 704,200 | | |
| | 1,100 | | | Equinix Inc. | | | 747,549 | | |
| | 2,700 | | | Innovative Industrial Properties, Inc. | | | 486,432 | | |
| Total Real Estate (Cost $3,124,949) | | | 4,261,542 | | |
| Total REITs (Cost $3,124,949) | | | 4,261,542 | | |
Convertible Preferred Stocks | | | 2.27 | % | |
Health Care | | | 2.27 | % | |
| | | | | Pharmaceuticals | | | 2.27 | % | |
| | | | | Elanco Animal Health, Inc. | | | |
| | 50,000 | | | 5.000%, 2/1/2023 | | | 2,294,000 | | |
| Total Health Care (Cost $2,429,605) | | | 2,294,000 | | |
| Total Convertible Preferred Stocks (Cost $2,429,605) | | | 2,294,000 | | |
Preferred Stocks | | | 0.38 | % | |
Financials | | | 0.38 | % | |
| | | | | Diversified Financial Services | | | 0.38 | % | |
| | | | | Compass Diversified Holdings | | | |
| | 15,000 | | | 7.875%, 1/30/2025(e) | | | 382,500 | | |
| Total Financials (Cost $379,031) | | | 382,500 | | |
| Total Preferred Stocks (Cost $379,031) | | | 382,500 | | |

The accompanying notes are an integral part of these financial statements.
37
BUFFALO DIVIDEND FOCUS FUND
SCHEDULE OF INVESTMENTS
MARCH 31, 2021 Continued
Shares or Face Amount | | | | $ Fair Value | |
Convertible Bonds | | | 8.97 | % | |
Communication Services | | | 0.68 | % | |
| | | | | Entertainment | | | 0.68 | % | |
| | | | | Zynga, Inc. | | | |
| | 500,000 | | | 0.250%, 06/01/2024 | | | 686,900 | | |
| Total Communication Services (Cost $508,384) | | | 686,900 | | |
Health Care | | | 2.93 | % | |
| | | | | Biotechnology | | | 2.21 | % | |
| | | | | Apellis Pharmaceuticals, Inc. | | | |
| | 300,000 | | | 3.500%, 09/15/2026 | | | 422,671 | | |
| | | | | Exact Sciences Corp. | | | |
| | 100,000 | | | 0.375%, 03/15/2027 | | | 137,250 | | |
| | 750,000 | | | 0.375%, 03/01/2028 | | | 971,250 | | |
| | | | | PTC Therapeutics, Inc. | | | |
| | 600,000 | | | 1.500%, 09/15/2026(c) | | | 703,200 | | |
| | | 2,234,371 | | |
| | | | | Pharmaceuticals | | | 0.72 | % | |
| | | | | Avadel Finance Cayman Ltd. | | | |
| | 650,000 | | | 4.500%, 02/01/2023(b)(c) | | | 730,438 | | |
| Total Health Care (Cost $2,453,292) | | | 2,964,809 | | |
Industrials | | | 1.28 | % | |
| | | | | Airlines | | | 1.28 | % | |
| | | | | Southwest Airlines Co. | | | |
| | 750,000 | | | 1.250%, 05/01/2025 | | | 1,291,406 | | |
| Total Industrials (Cost $750,000) | | | 1,291,406 | | |
Information Technology | | | 4.08 | % | |
| | | | | Communications Equipment | | | 0.87 | % | |
| | | | | Lumentum Holdings, Inc. | | | |
| | 750,000 | | | 0.500%, 12/15/2026 | | | 876,075 | | |

The accompanying notes are an integral part of these financial statements.
38
BUFFALO DIVIDEND FOCUS FUND
SCHEDULE OF INVESTMENTS
MARCH 31, 2021 Continued
Shares or Face Amount | | | | $ Fair Value | |
| | | | | Software | | | 3.21 | % | |
| | | | | Cerence, Inc. | | | |
| | 425,000 | | | 3.000%, 06/01/2025(c) | | | 1,084,281 | | |
| | | | | Guidewire Software, Inc. | | | |
| | 500,000 | | | 1.250%, 03/15/2025 | | | 565,000 | | |
| | | | | Nuance Communications, Inc. | | | |
| | 750,000 | | | 1.500%, 11/01/2035 | | | 1,592,325 | | |
| | | | 3,241,606 | | |
| Total Information Technology (Cost $2,420,199) | | | 4,117,681 | | |
| Total Convertible Bonds (Cost $6,131,875) | | | 9,060,796 | | |
Short Term Investments | | | 3.85 | % | |
Investment Company | | | 3.85 | % | |
| | 3,887,513 | | | Fidelity Investments Money Market Funds — Government Portfolio — Class I — 0.01%(d) | | | 3,887,513 | | |
Total Investment Company | | | 3,887,513 | | |
| Total Short Term Investments (Cost $3,887,513) | | | 3,887,513 | | |
Total Investments (Cost $60,521,757)
| | | 99.93
100,939,348 | % | |
Other Assets in Excess of Liabilities | | | 0.07
70,600 | % | |
Total Net Assets
| | | 100.00
101,009,948 | % | |

The accompanying notes are an integral part of these financial statements.
39
BUFFALO DIVIDEND FOCUS FUND
SCHEDULE OF INVESTMENTS
MARCH 31, 2021 Continued
(a) Non Income Producing
(b) Foreign Issued Security. The total value of these securities amounted to $5,250,335 (5.20% of net assets) at March 31, 2021.
(c) 144A Securities. The total value of these securities is $2,517,919 (2.49% of net assets) at March 31, 2021.
(d) The rate quoted is the annualized seven-day effective yield as of March 31, 2021.
(e) Callable at any dividend payment date on or after date disclosed.
* See Note 1A of the accompanying Notes to Financial Statements regarding valuation of securities.
The Global Industry Classification Standard (GICS) was developed by and/or is the exclusive property of MSCI, Inc. and Standard & Poor's Financial Services LLC ("S&P"). GICS is a service mark of MSCI and S&P and has been licensed for use by U.S. Bancorp Fund Services, LLC.

The accompanying notes are an integral part of these financial statements.
40
BUFFALO EARLY STAGE GROWTH FUND
SCHEDULE OF INVESTMENTS
MARCH 31, 2021
Shares or Face Amount | | | | $ Fair Value* | |
Common Stocks | | | 89.98 | % | |
Communication Services | | | 4.44 | % | |
| | | | | Entertainment | | | 1.48 | % | |
| | 84,000 | | | Motorsport Games, Inc.(a) | | | 1,953,840 | | |
| | | | | Interactive Media & Services | | | 2.06 | % | |
| | 74,700 | | | EverQuote, Inc.(a) | | | 2,710,863 | | |
| | | | | Media | | | 0.90 | % | |
| | 42,800 | | | Liberty Media Corp-Liberty Braves(a) | | | 1,190,696 | | |
| Total Communication Services (Cost $4,907,634) | | | 5,855,399 | | |
Consumer Discretionary | | | 18.45 | % | |
| | | | | Auto Components | | | 1.09 | % | |
| | 64,100 | | | Motorcar Parts of America, Inc.(a) | | | 1,442,250 | | |
| | | | | Diversified Consumer Services | | | 1.31 | % | |
| | 162,000 | | | OneSpaWorld Holdings Ltd. — ADR(a)(b) | | | 1,725,300 | | |
| | | | | Hotels, Restaurants & Leisure | | | 3.69 | % | |
| | 175,500 | | | Accel Entertainment, Inc.(a) | | | 1,918,215 | | |
| | 145,100 | | | Del Taco Restaurants, Inc. | | | 1,390,058 | | |
| | 95,000 | | | Rush Street Interactive, Inc.(a) | | | 1,552,300 | | |
| | | | 4,860,573 | | |
| | | | | Household Durables | | | 5.38 | % | |
| | 13,000 | | | LGI Homes, Inc.(a) | | | 1,941,030 | | |
| | 38,000 | | | Lovesac Co/The(a) | | | 2,150,800 | | |
| | 67,100 | | | Mohawk Group Holdings, Inc.(a) | | | 1,979,450 | | |
| | 18,700 | | | Universal Electronics, Inc.(a) | | | 1,027,939 | | |
| | | | 7,099,219 | | |
| | | | | Internet & Direct Marketing Retail | | | 3.84 | % | |
| | 30,000 | | | Overstock.com, Inc.(a) | | | 1,987,800 | | |
| | 34,500 | | | Shutterstock, Inc. | | | 3,071,880 | | |
| | | | 5,059,680 | | |
| | | | | Leisure Products | | | 1.51 | % | |
| | 24,900 | | | Malibu Boats, Inc. — Class A(a) | | | 1,984,032 | | |
| | | | | Specialty Retail | | | 1.63 | % | |
| | 15,000 | | | Sleep Number Corp.(a) | | | 2,152,350 | | |
| Total Consumer Discretionary (Cost $15,399,631) | | | 24,323,404 | | |

The accompanying notes are an integral part of these financial statements.
41
BUFFALO EARLY STAGE GROWTH FUND
SCHEDULE OF INVESTMENTS
MARCH 31, 2021 Continued
Shares or Face Amount | | | | $ Fair Value* | |
Consumer Staples | | | 0.53 | % | |
| | | | | Food Products | | | 0.53 | % | |
| | 36,000 | | | Tattooed Chef, Inc.(a) | | | 699,480 | | |
| Total Consumer Staples (Cost $642,464) | | | 699,480 | | |
Finance and Insurance | | | 1.79 | % | |
| | | | | Other Financial Investment Activities | | | 1.79 | % | |
| | 160,000 | | | dMY Technology Group Inc II(a) | | | 2,353,600 | | |
| Total Finance and Insurance (Cost $1,707,480) | | | 2,353,600 | | |
Financials | | | 6.99 | % | |
| | | | | Capital Markets | | | 3.97 | % | |
| | 20,585 | | | Hamilton Lane Inc. — Class A | | | 1,823,008 | | |
| | 96,400 | | | Open Lending Corp.(a) | | | 3,414,488 | | |
| | | | 5,237,496 | | |
| | | | | Diversified Financial Services | | | 1.87 | % | |
| | 106,300 | | | Compass Diversified Holdings | | | 2,460,845 | | |
| | | | | Insurance | | | 1.15 | % | |
| | 9,200 | | | Kinsale Capital Group, Inc. | | | 1,516,160 | | |
| Total Financials (Cost $3,408,202) | | | 9,214,501 | | |
Health Care | | | 15.39 | % | |
| | | | | Biotechnology | | | 1.67 | % | |
| | 20,700 | | | Castle Biosciences, Inc.(a) | | | 1,417,122 | | |
| | 17,400 | | | Deciphera Pharmaceuticals, Inc.(a) | | | 780,216 | | |
| | | | 2,197,338 | | |
| | | | | Health Care Equipment & Supplies | | | 7.06 | % | |
| | 34,300 | | | Establishment Labs Holdings, Inc. — ADR(a)(b) | | | 2,144,779 | | |
| | 94,700 | | | GenMark Diagnostics, Inc.(a) | | | 2,263,330 | | |
| | 26,590 | | | OrthoPediatrics Corp.(a) | | | 1,296,262 | | |
| | 261,000 | | | Repro-Med Systems, Inc.(a) | | | 918,720 | | |
| | 153,600 | | | Sientra, Inc.(a) | | | 1,119,744 | | |
| | 14,875 | | | STAAR Surgical Co.(a) | | | 1,567,974 | | |
| | | | 9,310,809 | | |

The accompanying notes are an integral part of these financial statements.
42
BUFFALO EARLY STAGE GROWTH FUND
SCHEDULE OF INVESTMENTS
MARCH 31, 2021 Continued
Shares or Face Amount | | | | $ Fair Value* | |
| | | | | Health Care Providers & Services | | | 0.84 | % | |
| | 5,800 | | | LHC Group, Inc.(a) | | | 1,109,018 | | |
| | | | | Health Care Technology | | | 4.43 | % | |
| | 62,700 | | | HealthStream, Inc.(a) | | | 1,400,718 | | |
| | 6,785 | | | Inspire Medical Systems, Inc.(a) | | | 1,404,427 | | |
| | 23,400 | | | Omnicell, Inc.(a) | | | 3,038,958 | | |
| | | | 5,844,103 | | |
| | | | | Pharmaceuticals | | | 1.39 | % | |
| | 120,851 | | | Verrica Pharmaceuticals, Inc.(a) | | | 1,830,893 | | |
| Total Health Care (Cost $10,644,373) | | | 20,292,161 | | |
Industrials | | | 17.72 | % | |
| | | | | Aerospace & Defense | | | 0.77 | % | |
| | 37,400 | | | Kratos Defense & Security Solutions, Inc.(a) | | | 1,020,272 | | |
| | | | | Air Freight & Logistics | | | 1.64 | % | |
| | 73,900 | | | Air Transport Services Group, Inc.(a) | | | 2,162,314 | | |
| | | | | Building Products | | | 4.36 | % | |
| | 20,000 | | | Advanced Drainage Systems, Inc. | | | 2,067,800 | | |
| | 27,500 | | | Apogee Enterprises, Inc. | | | 1,124,200 | | |
| | 30,000 | | | Patrick Industries, Inc. | | | 2,550,000 | | |
| | | | 5,742,000 | | |
| | | | | Construction & Engineering | | | 2.50 | % | |
| | 34,100 | | | NV5 Global, Inc.(a) | | | 3,293,037 | | |
| | | | | Machinery | | | 3.14 | % | |
| | 56,500 | | | Federal Signal Corporation | | | 2,163,950 | | |
| | 20,000 | | | Kornit Digital Ltd. — ADR(a)(b) | | | 1,982,400 | | |
| | | | 4,146,350 | | |
| | | | | Professional Services | | | 3.37 | % | |
| | 19,700 | | | ICF International, Inc. | | | 1,721,780 | | |
| | 66,300 | | | Willdan Group, Inc.(a) | | | 2,721,615 | | |
| | | | 4,443,395 | | |
| | | | | Trading Companies & Distributors | | | 1.94 | % | |
| | 28,600 | | | Transcat, Inc.(a) | | | 1,403,688 | | |
| | 53,710 | | | Univar Inc.(a) | | | 1,156,913 | | |
| | | | 2,560,601 | | |
| Total Industrials (Cost $14,844,701) | | | 23,367,969 | | |

The accompanying notes are an integral part of these financial statements.
43
BUFFALO EARLY STAGE GROWTH FUND
SCHEDULE OF INVESTMENTS
MARCH 31, 2021 Continued
Shares or Face Amount | | | | $ Fair Value* | |
Information Technology | | | 24.67 | % | |
| | | | | Communications Equipment | | | 1.40 | % | |
| | 53,300 | | | Calix, Inc.(a) | | | 1,847,378 | | |
| | | | | Electronic Equipment, Instruments & Components | | | 0.98 | % | |
| | 40,000 | | | nLight, Inc.(a) | | | 1,296,000 | | |
| | | | | Internet Software & Services | | | 1.01 | % | |
| | 109,400 | | | Cloudera, Inc.(a) | | | 1,331,398 | | |
| | | | | IT Services | | | 5.03 | % | |
| | 72,800 | | | i3 Verticals, Inc. — Class A(a) | | | 2,265,900 | | |
| | 237,000 | | | Paya Holdings, Inc.(a) | | | 2,597,520 | | |
| | 130,500 | | | Verra Mobility Corp.(a) | | | 1,766,318 | | |
| | | | 6,629,738 | | |
| | | | | Semiconductors & Semiconductor Equipment | | | 1.71 | % | |
| | 66,000 | | | MaxLinear, Inc.(a) | | | 2,249,280 | | |
| | | | | Software | | | 14.54 | % | |
| | 119,500 | | | 8x8, Inc.(a) | | | 3,876,580 | | |
| | 190,100 | | | Absolute Software Corp. — ADR(b) | | | 2,636,687 | | |
| | 27,300 | | | Cerence, Inc.(a) | | | 2,445,534 | | |
| | 7,100 | | | CyberArk Software Ltd. — ADR(a)(b) | | | 918,314 | | |
| | 25,205 | | | Envestnet, Inc.(a) | | | 1,820,557 | | |
| | 43,000 | | | Intelligent Systems Corp.(a) | | | 1,759,130 | | |
| | 73,720 | | | Mimecast Ltd. — ADR(a)(b) | | | 2,964,281 | | |
| | 41,700 | | | Varonis Systems, Inc.(a) | | | 2,140,878 | | |
| | 42,000 | | | Yext, Inc.(a) | | | 608,160 | | |
| | | | 19,170,121 | | |
| Total Information Technology (Cost $20,712,342) | | | 32,523,915 | | |
| Total Common Stocks (Cost $72,266,827) | | | 118,630,429 | | |
REITs | | | 1.76 | % | |
Real Estate | | | 1.76 | % | |
| | | | | Equity Real Estate Investment Trusts (REITs) | | | 1.76 | % | |
| | 50,100 | | | Community Healthcare Trust, Inc. | | | 2,310,612 | | |
| Total Real Estate (Cost $1,168,671) | | | 2,310,612 | | |
| Total REITs (Cost $1,168,671) | | | 2,310,612 | | |

The accompanying notes are an integral part of these financial statements.
44
BUFFALO EARLY STAGE GROWTH FUND
SCHEDULE OF INVESTMENTS
MARCH 31, 2021 Continued
Shares or Face Amount | | | | $ Fair Value* | |
Short Term Investments | | | 12.86 | % | |
Investment Company | | | 12.86 | % | |
| | 12,951,759 | | | Fidelity Investments Money Market Funds — Government Portfolio — Class I — 0.01%(c) | | | 12,951,759 | | |
| | 4,000,434 | | | The STIT-Treasury Portfolio 0.01%(c) | | | 4,000,434 | | |
Total Investment Company | | | 16,952,193 | | |
| Total Short Term Investments (Cost $16,952,193) | | | 16,952,193 | | |
| Total Investments (Cost $90,387,691) | | | 104.59
137,893,234 | % | |
Liabilities in Excess of Other Assets | | | (4.59
(6,046,880) | )% | |
Total Net Assets | | | 100.00
131,846,354 | % | |
ADR American Depositary Receipt
(a) Non Income Producing.
(b) Foreign Issued Security. The total value of these securities amounted to $12,371,761 (9.38% of net assets) at March 31, 2021.
(c) The rate quoted is the annualized seven-day effective yield as of March 31, 2021.
* See Note 1A of the accompanying Notes to Financial Statements regarding valuation of securities.
The Global Industry Classification Standard (GICS) was developed by and/or is the exclusive property of MSCI, Inc. and Standard & Poor's Financial Services LLC ("S&P"). GICS is a service mark of MSCI and S&P and has been licensed for use by U.S. Bancorp Fund Services, LLC.

The accompanying notes are an integral part of these financial statements.
45
BUFFALO FLEXIBLE INCOME FUND
SCHEDULE OF INVESTMENTS
MARCH 31, 2021
Shares or Face Amount | | | | $ Fair Value* | |
Common Stocks | | | 92.30 | % | |
Communication Services | | | 5.79 | % | |
| | | | | Diversified Telecommunication Services | | | 4.25 | % | |
| | 310,000 | | | AT&T, Inc. | | | 9,383,700 | | |
| | 150,000 | | | Verizon Communications, Inc. | | | 8,722,500 | | |
| | | | 18,106,200 | | |
| | | | | Entertainment | | | 1.54 | % | |
| | 223,000 | | | Lions Gate Entertainment Corp. — Class A(a)(b) | | | 3,333,850 | | |
| | 250,000 | | | Lions Gate Entertainment Corp. — Class B(a)(b) | | | 3,225,000 | | |
| | | | 6,558,850 | | |
| Total Communication Services (Cost $27,138,186) | | | 24,665,050 | | |
Consumer Staples | | | 19.22 | % | |
| | | | | Beverages | | | 4.70 | % | |
| | 165,000 | | | The Coca Cola Co. | | | 8,697,150 | | |
| | 80,000 | | | PepsiCo, Inc. | | | 11,316,000 | | |
| | | | 20,013,150 | | |
| | | | | Food & Staples Retailing | | | 2.90 | % | |
| | 35,000 | | | Costco Wholesale Corp. | | | 12,336,800 | | |
| | | | | Food Products | | | 4.22 | % | |
| | 160,000 | | | B&G Foods, Inc. | | | 4,969,600 | | |
| | 150,000 | | | General Mills, Inc. | | | 9,198,000 | | |
| | 59,800 | | | Kellogg Co. | | | 3,785,340 | | |
| | | | 17,952,940 | | |
| | | | | Household Products | | | 7.40 | % | |
| | 50,000 | | | The Clorox Co. | | | 9,644,000 | | |
| | 25,000 | | | Colgate-Palmolive Co. | | | 1,970,750 | | |
| | 70,000 | | | Kimberly-Clark Corp. | | | 9,733,500 | | |
| | 75,000 | | | The Procter & Gamble Co. | | | 10,157,250 | | |
| | | | 31,505,500 | | |
| Total Consumer Staples (Cost $36,561,641) | | | 81,808,390 | | |
Energy | | | 21.07 | % | |
| | | | | Energy Equipment & Services | | | 0.98 | % | |
| | 154,000 | | | Schlumberger Ltd. — ADR(b) | | | 4,187,260 | | |

The accompanying notes are an integral part of these financial statements.
46
BUFFALO FLEXIBLE INCOME FUND
SCHEDULE OF INVESTMENTS
MARCH 31, 2021 Continued
Shares or Face Amount | | | | $ Fair Value* | |
| | | | | Oil, Gas & Consumable Fuels | | | 20.09 | % | |
| | 435,000 | | | APA Corp. | | | 7,786,500 | | |
| | 100,000 | | | BP PLC — ADR(b) | | | 2,435,000 | | |
| | 145,000 | | | Chevron Corp. | | | 15,194,550 | | |
| | 219,000 | | | ConocoPhillips | | | 11,600,430 | | |
| | 140,000 | | | Delek Logistics Partners LP | | | 5,038,600 | | |
| | 165,000 | | | Exxon Mobil Corp. | | | 9,211,950 | | |
| | 169,000 | | | Hess Corp. | | | 11,958,440 | | |
| | 252,000 | | | HollyFrontier Corp. | | | 9,016,560 | | |
| | 525,000 | | | Kinder Morgan, Inc. | | | 8,741,250 | | |
| | 85,000 | | | Marathon Petroleum Corp. | | | 4,546,650 | | |
| | | | 85,529,930 | | |
| Total Energy (Cost $83,332,355) | | | 89,717,190 | | |
Financials | | | 7.16 | % | |
| | | | | Banks | | | 2.40 | % | |
| | 175,000 | | | Truist Financial Corp. | | | 10,206,000 | | |
| | | | | Insurance | | | 4.76 | % | |
| | 75,000 | | | Arthur J. Gallagher & Co. | | | 9,357,750 | | |
| | 95,000 | | | The Allstate Corp. | | | 10,915,500 | | |
| | | | 20,273,250 | | |
| Total Financials (Cost $12,486,126) | | | 30,479,250 | | |
Health Care | | | 16.75 | % | |
| | | | | Biotechnology | | | 1.06 | % | |
| | 70,000 | | | Gilead Sciences, Inc. | | | 4,524,100 | | |
| | | | | Health Care Equipment & Supplies | | | 3.89 | % | |
| | 75,000 | | | Abbott Laboratories | | | 8,988,000 | | |
| | 90,000 | | | Baxter International, Inc. | | | 7,590,600 | | |
| | | | 16,578,600 | | |
| | | | | Pharmaceuticals | | | 11.80 | % | |
| | 15,000 | | | Bristol-Myers Squibb Co. | | | 946,950 | | |
| | 65,000 | | | Eli Lilly & Co. | | | 12,143,300 | | |
| | 235,000 | | | GlaxoSmithKline PLC — ADR(b) | | | 8,387,150 | | |
| | 75,000 | | | Johnson & Johnson | | | 12,326,250 | | |
| | 80,000 | | | Merck & Co., Inc. | | | 6,167,200 | | |
| | 270,000 | | | Pfizer Inc. | | | 9,782,100 | | |

The accompanying notes are an integral part of these financial statements.
47
BUFFALO FLEXIBLE INCOME FUND
SCHEDULE OF INVESTMENTS
MARCH 31, 2021 Continued
Shares or Face Amount | | | | $ Fair Value* | |
| | 33,501 | | | Viatris, Inc.(a) | | | 468,009 | | |
| | | | 50,220,959 | | |
| Total Health Care (Cost $35,381,274) | | | 71,323,659 | | |
Industrials | | | 3.27 | % | |
| | | | | Commercial Services & Supplies | | | 3.27 | % | |
| | 435,000 | | | Pitney Bowes Inc.(c) | | | 3,584,400 | | |
| | 80,000 | | | Waste Management, Inc. | | | 10,321,600 | | |
| Total Industrials (Cost $4,227,391) | | | 13,906,000 | | |
Information Technology | | | 17.14 | % | |
| | | | | Communications Equipment | | | 2.43 | % | |
| | 200,000 | | | Cisco Systems, Inc. | | | 10,342,000 | | |
| | | | | IT Services | | | 1.88 | % | |
| | 60,000 | | | International Business Machines Corp. | | | 7,995,600 | | |
| | | | | Semiconductors & Semiconductor Equipment | | | 5.36 | % | |
| | 170,000 | | | Intel Corp. | | | 10,880,000 | | |
| | 90,000 | | | QUALCOMM, Inc. | | | 11,933,100 | | |
| | | | 22,813,100 | | |
| | | | | Software | | | 7.47 | % | |
| | 135,000 | | | Microsoft Corp. | | | 31,828,950 | | |
| Total Information Technology (Cost $23,334,143) | | | 72,979,650 | | |
Materials | | | 1.90 | % | |
| | | | | Chemicals | | | 0.99 | % | |
| | 65,500 | | | Dow Inc. | | | 4,188,070 | | |
| | | | | Metals & Mining | | | 0.91 | % | |
| | 50,000 | | | Rio Tinto PLC — ADR(b) | | | 3,882,500 | | |
| Total Materials (Cost $3,842,134) | | | 8,070,570 | | |
| Total Common Stocks (Cost $226,303,250) | | | 392,949,759 | | |

The accompanying notes are an integral part of these financial statements.
48
BUFFALO FLEXIBLE INCOME FUND
SCHEDULE OF INVESTMENTS
MARCH 31, 2021 Continued
Shares or Face Amount | | | | $ Fair Value* | |
REITs | | | 2.82 | % | |
Real Estate | | | 2.82 | % | |
| | | | | Equity Real Estate Investment Trusts (REITs) | | | 2.82 | % | |
| | 85,300 | | | Digital Realty Trust, Inc. | | | 12,013,652 | | |
| Total Real Estate (Cost $4,814,260) | | | 12,013,652 | | |
| Total REITs (Cost $4,814,260) | | | 12,013,652 | | |
Convertible Bonds | | | 3.85 | % | |
Information Technology | | | 3.85 | % | |
| | | | | Software | | | 3.85 | % | |
| | | | | Nuance Communications, Inc. | | | |
| | 7,725,000 | | | 1.500%, 11/01/2035 | | | 16,400,948 | | |
| Total Information Technology (Cost $7,517,671) | | | 16,400,948 | | |
| Total Convertible Bonds (Cost $7,517,671) | | | 16,400,948 | | |
Corporate Bonds | | | 0.48 | % | |
Financials | | | 0.48 | % | |
| | | | | Diversified Financial Services | | | 0.48 | % | |
| | | | | Everi Payments, Inc. | | | |
| | 1,938,000 | | | 7.500%, 12/15/2025(d) | | | 2,023,359 | | |
| Total Financials (Cost $1,938,000) | | | 2,023,359 | | |
| Total Corporate Bonds (Cost $1,938,000) | | | 2,023,359 | | |
Short Term Investments | | | 0.49 | % | |
Investment Company | | | 0.49 | % | |
| | 2,081,275 | | | Fidelity Investments Money Market Funds — Government Portfolio — Class I — 0.010%(e) | | | 2,081,275 | | |
Total Investment Company | | | 2,081,275 | | |
| Total Short Term Investments (Cost $2,081,275) | | | 2,081,275 | | |
| Total Investments (Cost $242,654,456) | | | 99.94
425,468,993 | % | |

The accompanying notes are an integral part of these financial statements.
49
BUFFALO FLEXIBLE INCOME FUND
SCHEDULE OF INVESTMENTS
MARCH 31, 2021 Continued
Shares or Face Amount | | $ Fair Value* | |
Other Assets in Excess of Liabilities | | | 0.06
239,196 | % | |
Total Net Assets | | | 100.00
425,708,189 | % | |
ADR American Depository Receipt
PLC Public Limited Company
(a) Non Income Producing.
(b) Foreign Issued Security. The total value of these securities amounted to $25,450,760 (5.98% of net assets) at March 31, 2021.
(c) A portion of this investment is segregated as collateral for open written option contracts.
(d) 144A Security. The total value of this security is $2,023,359 (0.48% of net assets) at March 31, 2021.
(e) The rate quoted is the annualized seven-day effective yield as of March 31, 2021.
* See Note 1A of the accompanying Notes to Financial Statements regarding valuation of securities.
The Global Industry Classification Standard (GICS) was developed by and/or is the exclusive property of MSCI, Inc. and Standard & Poor's Financial Services LLC ("S&P"). GICS is a service mark of MSCI and S&P and has been licensed for use by U.S. Bancorp Fund Services, LLC.

The accompanying notes are an integral part of these financial statements.
50
BUFFALO FLEXIBLE INCOME FUND
SCHEDULE OF OPTIONS WRITTEN
MARCH 31, 2021 Continued
Contracts | | | | $ Notional Amount | | $ Value | |
Call Options | | | |
| | | | | Chevron Corp. | | | | | | | | | |
| | 250 | | | Expiration: April 2021, Exercise Price: $115.00 | | | 2,619,750 | | | | 1,250 | | |
| | | | | Hess Corp. | | | | | | | |
| | 500 | | | Expiration: April 2021, Exercise Price: $80.00 | | | 3,538,000 | | | | 14,250 | | |
| | 42 | | | Expiration: April 2021, Exercise Price: $85.00 | | | 297,192 | | | | 1,008 | | |
| | | | | HollyFrontier Corp. | | | | | | | | | |
| | 400 | | | Expiration: June 2021, Exercise Price: $45.00 | | | 1,431,200 | | | | 23,200 | | |
| | | | | Kellogg Co. | | | | | | | | | |
| | 500 | | | Expiration: June 2021, Exercise Price: $67.50 | | | 3,165,000 | | | | 37,500 | | |
| | | | | Lions Gate Entertainment Corp. | | | | | | | | | |
| | 100 | | | Expiration: April 2021, Exercise Price: $19.00 | | | 149,500 | | | | 600 | | |
| | 13 | | | Expiration: April 2021, Exercise Price: $22.00 | | | 19,435 | | | | 1,463 | | |
| | 100 | | | Expiration: June 2021, Exercise Price: $25.00 | | | 149,500 | | | | 1,250 | | |
| | | | | Marathon Petroleum Corp. | | | | | | | | | |
| | 350 | | | Expiration: May 2021, Exercise Price: $65.00 | | | 1,872,150 | | | | 16,975 | | |
| | 1 | | | Expiration: October 2021, Exercise Price: $85.00 | | | 5,349 | | | | 57 | | |
| | | | | Pitney Bowes Inc. | | | | | | | | | |
| | 250 | | | Expiration: April 2021, Exercise Price: $11.00 | | | 206,000 | | | | 1,250 | | |
| | 35 | | | Expiration: July 2021, Exercise Price: $9.00 | | | 28,840 | | | | 3,325 | | |
| | 315 | | | Expiration: July 2021, Exercise Price: $10.00 | | | 259,560 | | | | 22,050 | | |
| | | | | Schlumberger Ltd. | | | | | | | | | |
| | 140 | | | Expiration: April 2021, Exercise Price: $30.00 | | | 380,660 | | | | 280 | | |
| | | | | Truist Financial Corp. | | | | | | | | | |
| | 50 | | | Expiration: April 2021, Exercise Price: $62.50 | | | 291,600 | | | | 1,500 | | |
| | | Total Written Options (Premiums received $189,093) | | | | | | | 125,958 | | |

The accompanying notes are an integral part of these financial statements.
51
BUFFALO GROWTH FUND
SCHEDULE OF INVESTMENTS
MARCH 31, 2021
Shares or Face Amount | | | | $ Fair Value* | |
Common Stocks | | | 95.73 | % | |
Communication Services | | | 16.29 | % | |
| | | | | Entertainment | | | 2.80 | % | |
| | 13,441 | | | Electronic Arts, Inc. | | | 1,819,508 | | |
| | 20,189 | | | The Walt Disney Co.(a) | | | 3,725,274 | | |
| | | | 5,544,782 | | |
| | | | | Interactive Media & Services | | | 11.72 | % | |
| | 3,195 | | | Alphabet, Inc. — Class A(a) | | | 6,589,751 | | |
| | 3,822 | | | Alphabet, Inc. — Class C(a) | | | 7,906,304 | | |
| | 21,281 | | | Facebook, Inc. — Class A(a) | | | 6,267,893 | | |
| | 18,147 | | | Match Group, Inc.(a) | | | 2,493,035 | | |
| | | | 23,256,983 | | |
| | | | | Media | | | 1.77 | % | |
| | 65,000 | | | Comcast Corp. — Class A | | | 3,517,150 | | |
| Total Communication Services (Cost $11,208,996) | | | 32,318,915 | | |
Consumer Discretionary | | | 13.07 | % | |
| | | | | Hotels, Restaurants & Leisure | | | 1.10 | % | |
| | 19,928 | | | Starbucks Corp. | | | 2,177,533 | | |
| | | | | Internet & Direct Marketing Retail | | | 7.84 | % | |
| | 4,125 | | | Amazon.com, Inc.(a) | | | 12,763,080 | | |
| | 1,199 | | | Booking Holdings, Inc.(a) | | | 2,793,478 | | |
| | | | 15,556,558 | | |
| | | | | Specialty Retail | | | 2.48 | % | |
| | 16,138 | | | The Home Depot, Inc. | | | 4,926,125 | | |
| | | | | Textiles, Apparel & Luxury Goods | | | 1.65 | % | |
| | 24,632 | | | NIKE, Inc. — Class B | | | 3,273,346 | | |
| Total Consumer Discretionary (Cost $7,742,898) | | | 25,933,562 | | |
Consumer Staples | | | 1.12 | % | |
| | | | | Personal Products | | | 1.12 | % | |
| | 7,641 | | | The Estee Lauder Companies Inc. — Class A | | | 2,222,385 | | |
| Total Consumer Staples (Cost $1,550,354) | | | 2,222,385 | | |

The accompanying notes are an integral part of these financial statements.
52
BUFFALO GROWTH FUND
SCHEDULE OF INVESTMENTS
MARCH 31, 2021 Continued
Shares or Face Amount | | | | $ Fair Value* | |
Financials | | | 5.25 | % | |
| | | | | Capital Markets | | | 3.98 | % | |
| | 5,397 | | | CME Group, Inc. | | | 1,102,229 | | |
| | 27,056 | | | Intercontinental Exchange, Inc. | | | 3,021,614 | | |
| | 10,702 | | | S&P Global, Inc. | | | 3,776,415 | | |
| | | | 7,900,258 | | |
| | | | | Diversified Financial Services | | | 1.27 | % | |
| | 12,522 | | | Global Payments Inc. | | | 2,524,185 | | |
| Total Financials (Cost $4,056,371) | | | 10,424,443 | | |
Health Care | | | 12.85 | % | |
| | | | | Health Care Equipment & Supplies | | | 6.57 | % | |
| | 13,204 | | | Danaher Corp. | | | 2,971,956 | | |
| | 25,005 | | | Edwards Lifesciences Corp.(a) | | | 2,091,418 | | |
| | 3,897 | | | IDEXX Laboratories, Inc.(a) | | | 1,906,841 | | |
| | 3,950 | | | Intuitive Surgical, Inc.(a) | | | 2,918,813 | | |
| | 19,720 | | | Zimmer Biomet Holdings, Inc. | | | 3,156,778 | | |
| | | | 13,045,806 | | |
| | | | | Health Care Providers & Services | | | 1.69 | % | |
| | 9,000 | | | UnitedHealth Group, Inc. | | | 3,348,630 | | |
| | | | | Health Care Technology | | | 1.10 | % | |
| | 8,323 | | | Veeva Systems, Inc.(a) | | | 2,174,300 | | |
| | | | | Life Sciences Tools & Services | | | 2.70 | % | |
| | 5,806 | | | Illumina, Inc.(a) | | | 2,229,852 | | |
| | 6,859 | | | Thermo Fisher Scientific, Inc. | | | 3,130,311 | | |
| | | | 5,360,163 | | |
| | | | | Pharmaceuticals | | | 0.79 | % | |
| | 9,600 | | | Jazz Pharmaceuticals Public Limited Company — ADR(a)(b) | | | 1,577,952 | | |
| Total Health Care (Cost $17,692,321) | | | 25,506,851 | | |
Industrials | | | 6.85 | % | |
| | | | | Commercial Services & Supplies | | | 1.07 | % | |
| | 19,500 | | | Copart, Inc.(a) | | | 2,117,895 | | |
| | | | | Industrial Conglomerates | | | 1.30 | % | |
| | 11,916 | | | Honeywell International, Inc. | | | 2,586,606 | | |

The accompanying notes are an integral part of these financial statements.
53
BUFFALO GROWTH FUND
SCHEDULE OF INVESTMENTS
MARCH 31, 2021 Continued
Shares or Face Amount | | | | $ Fair Value* | |
| | | | | Professional Services | | | 3.28 | % | |
| | 26,957 | | | IHS Markit Ltd. — ADR(b) | | | 2,608,899 | | |
| | 23,414 | | | TransUnion | | | 2,107,260 | | |
| | 10,100 | | | Verisk Analytics, Inc. | | | 1,784,569 | | |
| | | | 6,500,728 | | |
| | | | | Road & Rail | | | 1.20 | % | |
| | 10,822 | | | Union Pacific Corp. | | | 2,385,277 | | |
| Total Industrials (Cost $9,192,235) | | | 13,590,506 | | |
Information Technology | | | 35.46 | % | |
| | | | | IT Services | | | 7.20 | % | |
| | 13,500 | | | GDS Holdings Ltd. — ADR(a)(b) | | | 1,094,715 | | |
| | 18,310 | | | MasterCard, Inc. — Class A | | | 6,519,276 | | |
| | 10,022 | | | PayPal Holdings, Inc.(a) | | | 2,433,742 | | |
| | 20,007 | | | Visa Inc. — Class A | | | 4,236,082 | | |
| | | | 14,283,815 | | |
| | | | | Semiconductors & Semiconductor Equipment | | | 3.79 | % | |
| | 19,815 | | | Analog Devices, Inc. | | | 3,072,910 | | |
| | 9,615 | | | Broadcom Inc. | | | 4,458,091 | | |
| | | | 7,531,001 | | |
| | | | | Software | | | 18.64 | % | |
| | 6,845 | | | Adobe, Inc.(a) | | | 3,253,908 | | |
| | 4,570 | | | Fair Isaac Corp.(a) | | | 2,221,248 | | |
| | 5,850 | | | Intuit, Inc. | | | 2,240,901 | | |
| | 90,533 | | | Microsoft Corp. | | | 21,344,965 | | |
| | 7,066 | | | Palo Alto Networks, Inc.(a) | | | 2,275,676 | | |
| | 14,222 | | | salesforce.com, Inc.(a) | | | 3,013,215 | | |
| | 5,261 | | | ServiceNow, Inc.(a) | | | 2,631,079 | | |
| | | | 36,980,992 | | |
| | | | | Technology Hardware, Storage & Peripherals | | | 5.83 | % | |
| | 94,716 | | | Apple Inc. | | | 11,569,560 | | |
| Total Information Technology (Cost $31,964,845) | | | 70,365,368 | | |
Materials | | | 3.22 | % | |
| | | | | Chemicals | | | 3.22 | % | |
| | 9,500 | | | Ecolab Inc. | | | 2,033,665 | | |
| | 15,525 | | | Linde PLC — ADR(b) | | | 4,349,174 | | |
| Total Materials (Cost $3,290,082) | | | 6,382,839 | | |

The accompanying notes are an integral part of these financial statements.
54
BUFFALO GROWTH FUND
SCHEDULE OF INVESTMENTS
MARCH 31, 2021 Continued
Shares or Face Amount | | | | $ Fair Value* | |
Real Estate | | | 1.62 | % | |
| | | | | Real Estate Management & Development | | | 1.62 | % | |
| | 40,700 | | | CBRE Group, Inc. — Class A(a) | | | 3,219,777 | | |
| Total Real Estate (Cost $1,666,669) | | | 3,219,777 | | |
| Total Common Stocks (Cost $88,364,771) | | | 189,964,646 | | |
REITs | | | 2.30 | % | |
Real Estate | | | 2.30 | % | |
| | | | | Equity Real Estate Investment Trusts (REITs) | | | 2.30 | % | |
| | 8,395 | | | American Tower Corp. | | | 2,006,908 | | |
| | 3,764 | | | Equinix Inc. | | | 2,557,977 | | |
| Total Real Estate (Cost $1,917,584) | | | 4,564,885 | | |
| Total REITs (Cost $1,917,584) | | | 4,564,885 | | |
Short Term Investments | | | 1.22 | % | |
Investment Company | | | 1.22 | % | |
| | 2,424,521 | | | Fidelity Investments Money Market Funds — Government Portfolio — Class I — 0.010%(c) | | | 2,424,521 | | |
Total Investment Company | | | 2,424,521 | | |
| Total Short Term Investments (Cost $2,424,521) | | | 2,424,521 | | |
| Total Investments (Cost $92,706,876) | | | 99.25
196,954,052 | % | |
Other Assets in Excess of Liabilities | | | 0.75
1,490,366 | % | |
Total Net Assets | | | 100.00
198,444,418 | % | |

The accompanying notes are an integral part of these financial statements.
55
BUFFALO GROWTH FUND
SCHEDULE OF INVESTMENTS
MARCH 31, 2021 Continued
ADR American Depositary Receipt
PLC Public Limited Company
(a) Non Income Producing.
(b) Foreign Issued Security. The total value of these securities amounted to $9,630,740 (4.85% of net assets) at March 31, 2021.
(c) The rate quoted is the annualized seven-day effective yield as of March 31, 2021.
* See Note 1A of the accompanying Notes to Financial Statements regarding valuation of securities.
The Global Industry Classification Standard (GICS) was developed by and/or is the exclusive property of MSCI, Inc. and Standard & Poor's Financial Services LLC ("S&P"). GICS is a service mark of MSCI and S&P and has been licensed for use by U.S. Bancorp Fund Services, LLC.

The accompanying notes are an integral part of these financial statements.
56
BUFFALO HIGH YIELD FUND
SCHEDULE OF INVESTMENTS
MARCH 31, 2021
Shares or Face Amount | | | | $ Fair Value* | |
Preferred Stocks | | | 2.19 | % | |
Energy | | | 1.04 | % | |
| | | | | Oil, Gas & Consumable Fuels | | | 1.04 | % | |
| | | | | NuStar Energy LP | | | |
| | 115,000 | | | 9.000% (effective 12/15/2022, 3 Month LIBOR USD + 6.880%), 12/15/2022(e)(f) | | | 2,855,450 | | |
| Total Energy (Cost $2,487,773) | | | 2,855,450 | | |
Financials | | | 1.15 | % | |
| | | | | Diversified Financial Services | | | 1.15 | % | |
| | | | | Compass Diversified Holdings | | | |
| | 100,000 | | | 7.875%, 7/30/2022(e) | | | 2,550,000 | | |
| | 25,000 | | | 7.250%, 1/30/2025(e) | | | 630,000 | | |
| Total Financials (Cost $3,094,298) | | | 3,180,000 | | |
| Total Preferred Stocks (Cost $5,582,071) | | | 6,035,450 | | |
Convertible Bonds | | | 16.31 | % | |
Communication Services | | | 0.71 | % | |
| | | | | Diversified Telecommunication Services | | | 0.71 | % | |
| | | | | Bandwidth, Inc. | | | |
| | 2,000,000 | | | 0.500%, 04/01/2028(b) | | | 1,950,000 | | |
| Total Communication Services (Cost $2,000,000) | | | 1,950,000 | | |
Consumer Discretionary | | | 0.67 | % | |
| | | | | Diversified Consumer Services | | | 0.67 | % | |
| | | | | Stride, Inc. | | | |
| | 2,000,000 | | | 1.125%, 09/01/2027(b) | | | 1,847,600 | | |
| Total Consumer Discretionary (Cost $1,916,410) | | | 1,847,600 | | |
Financials | | | 0.78 | % | |
| | | | | Consumer Finance | | | 0.78 | % | |
| | | | | PRA Group, Inc. | | | |
| | 2,000,000 | | | 3.500%, 06/01/2023 | | | 2,151,250 | | |
| Total Financials (Cost $2,022,362) | | | 2,151,250 | | |

The accompanying notes are an integral part of these financial statements.
57
BUFFALO HIGH YIELD FUND
SCHEDULE OF INVESTMENTS
MARCH 31, 2021 Continued
Shares or Face Amount | | | | $ Fair Value* | |
Health Care | | | 4.01 | % | |
| | | | | Biotechnology | | | 0.66 | % | |
| | | | | Flexion Therapeutics, Inc. | | | |
| | 2,000,000 | | | 3.375%, 05/01/2024 | | | 1,831,793 | | |
| | | | | Health Care Equipment & Supplies | | | 1.90 | % | |
| | | | | Haemonetics Corp. | | | |
| | 500,000 | | | 0.000%, 03/01/2026 | | | 476,250 | | |
| | | | | Invacare Corp. | | | |
| | 3,000,000 | | | 4.250%, 03/15/2026(b) | | | 3,005,511 | | |
| | | | | SmileDirectClub, Inc. | | | |
| | 2,000,000 | | | 0.000%, 02/01/2026 | | | 1,761,250 | | |
| | | | 5,243,011 | | |
| | | | | Pharmaceuticals | | | 1.45 | % | |
| | | | | Avadel Finance Cayman Ltd. | | | |
| | 550,000 | | | 4.500%, 02/01/2023(a)(b) | | | 618,062 | | |
| | | | | Revance Therapeutics, Inc. | | | |
| | 3,000,000 | | | 1.750%, 02/15/2027 | | | 3,376,968 | | |
| | | | 3,995,030 | | |
| Total Health Care (Cost $11,084,857) | | | 11,069,834 | | |
Industrials | | | 2.38 | % | |
| | | | | Air Freight & Logistics | | | 1.02 | % | |
| | | | | Air Transport Services Group, Inc. | | | |
| | 2,500,000 | | | 1.125%, 10/15/2024 | | | 2,806,250 | | |
| | | | | Airlines | | | 0.97 | % | |
| | | | | Southwest Airlines Co. | | | |
| | 1,550,000 | | | 1.250%, 05/01/2025 | | | 2,668,906 | | |
| | | | | Machinery | | | 0.39 | % | |
| | | | | The Greenbrier Companies, Inc. | | | |
| | 1,000,000 | | | 2.875%, 02/01/2024 | | | 1,092,500 | | |
Total Industrials (Cost $5,027,373) | | | 6,567,656 | | |
Information Technology | | | 7.76 | % | |
| | | | | Communications Equipment | | | 0.74 | % | |
| | | | | Lumentum Holdings, Inc. | | | |
| | 1,750,000 | | | 0.500%, 12/15/2026 | | | 2,044,175 | | |

The accompanying notes are an integral part of these financial statements.
58
BUFFALO HIGH YIELD FUND
SCHEDULE OF INVESTMENTS
MARCH 31, 2021 Continued
Shares or Face Amount | | | | $ Fair Value* | |
| | | | | IT Services | | | 0.06 | % | |
| | | | | MongoDB, Inc. | | | |
| | 100,000 | | | 0.250%, 01/15/2026 | | | 144,500 | | |
| | | | | Software | | | 6.96 | % | |
| | | | | Avaya Holdings Corp. | | | |
| | 2,000,000 | | | 2.250%, 06/15/2023 | | | 2,478,000 | | |
| | | | | Cerence, Inc. | | | |
| | 775,000 | | | 3.000%, 06/01/2025(b) | | | 1,977,219 | | |
| | | | | Guidewire Software, Inc. | | | |
| | 2,000,000 | | | 1.250%, 03/15/2025 | | | 2,260,000 | | |
| | | | | J2 Global, Inc. | | | |
| | 3,000,000 | | | 1.750%, 11/01/2026(b) | | | 3,530,625 | | |
| | | | | Mitek Systems, Inc. | | | |
| | 2,000,000 | | | 0.750%, 02/01/2026(b) | | | 2,003,750 | | |
| | | | | Nuance Communications, Inc. | | | |
| | 2,810,000 | | | 1.500%, 11/01/2035 | | | 5,965,911 | | |
| | | | | Pluralsight, Inc. | | | |
| | 1,000,000 | | | 0.375%, 03/01/2024 | | | 987,500 | | |
| | | | 19,203,005 | | |
| Total Information Technology (Cost $14,952,131) | | | 21,391,680 | | |
| Total Convertible Bonds (Cost $37,003,133) | | | 44,978,020 | | |
Corporate Bonds | | | 61.63 | % | |
Administrative and Support and Waste Management and Remediation Services | | | 0.19 | % | |
| | | | | Office Administrative Services | | | 0.19 | % | |
| | | | | Cargo Aircraft Management, Inc. | | | |
| | 500,000 | | | 4.750%, 02/01/2028(b) | | | 516,563 | | |
| Total Administrative and Support and Waste Management and Remediation Services (Cost $500,000) | | | 516,563 | | |
Agriculture, Forestry, Fishing and Hunting | | | 0.76 | % | |
| | | | | Forest Nurseries and Gathering of Forest Products | | | 0.76 | % | |
| | | | | Enviva Partners LP / Enviva Partners Finance Corp. | | | |
| | 2,000,000 | | | 6.500%, 01/15/2026(b) | | | 2,098,750 | | |
| Total Agriculture, Forestry, Fishing and Hunting (Cost $2,017,456) | | | 2,098,750 | | |

The accompanying notes are an integral part of these financial statements.
59
BUFFALO HIGH YIELD FUND
SCHEDULE OF INVESTMENTS
MARCH 31, 2021 Continued
Shares or Face Amount | | | | $ Fair Value* | |
Communication Services | | | 4.63 | % | |
| | | | | Entertainment | | | 1.15 | % | |
| | | | | Live Nation Entertainment, Inc. | | | |
| | 1,000,000 | | | 4.875%, 11/01/2024(b) | | | 1,019,200 | | |
| | 500,000 | | | 5.625%, 03/15/2026(b) | | | 520,050 | | |
| | 250,000 | | | 4.750%, 10/15/2027(b) | | | 252,266 | | |
| | | | | Netflix, Inc. | | | |
| | 250,000 | | | 5.500%, 02/15/2022 | | | 260,469 | | |
| | 1,000,000 | | | 5.750%, 03/01/2024 | | | 1,123,315 | | |
| | | | 3,175,300 | | |
| | | | | Interactive Media & Services | | | 2.11 | % | |
| | | | | Cars.com, Inc. | | | |
| | 2,500,000 | | | 6.375%, 11/01/2028(b) | | | 2,609,375 | | |
| | | | | Match Group, Inc. | | | |
| | 1,000,000 | | | 5.000%, 12/15/2027(b) | | | 1,051,060 | | |
| | | | | TripAdvisor, Inc. | | | |
| | 2,000,000 | | | 7.000%, 07/15/2025(b) | | | 2,166,750 | | |
| | | | 5,827,185 | | |
| | | | | Media | | | 1.37 | % | |
| | | | | AMC Networks, Inc. | | | |
| | 596,000 | | | 5.000%, 04/01/2024 | | | 604,195 | | |
| | | | | The E.W. Scripps Co. | | | |
| | 250,000 | | | 5.125%, 05/15/2025(b) | | | 255,468 | | |
| | | | | Gray Television, Inc. | | | |
| | 2,060,000 | | | 5.875%, 07/15/2026(b) | | | 2,138,537 | | |
| | 500,000 | | | 4.750%, 10/15/2030(b) | | | 496,563 | | |
| | | | | Townsquare Media, Inc. | | | |
| | 250,000 | | | 6.875%, 02/01/2026(b) | | | 266,719 | | |
| | | | 3,761,482 | | |
| Total Communication Services (Cost $12,186,514) | | | 12,763,967 | | |
Communications | | | 0.38 | % | |
| | | | | Radio and Television Broadcasting | | | 0.38 | % | |
| | | | | Entercom Media Corp. | | | |
| | 1,000,000 | | | 7.250%, 11/01/2024(b) | | | 1,036,875 | | |
| Total Communications (Cost $1,009,986) | | | 1,036,875 | | |

The accompanying notes are an integral part of these financial statements.
60
BUFFALO HIGH YIELD FUND
SCHEDULE OF INVESTMENTS
MARCH 31, 2021 Continued
Shares or Face Amount | | | | $ Fair Value* | |
Consumer Staples | | | 1.14 | % | |
| | | | | Food Products | | | 1.14 | % | |
| | | | | Performance Food Group, Inc. | | | |
| | 3,000,000 | | | 5.500%, 10/15/2027(b) | | | 3,142,770 | | |
| Total Consumer Staples (Cost $3,000,000) | | | 3,142,770 | | |
Consumer Discretionary | | | 5.10 | % | |
| | | | | Commercial Services | | | 0.76 | % | |
| | | | | Compass Group Diversified Holdings LLC | | | |
| | 2,000,000 | | | 8.000%, 05/01/2026(b) | | | 2,093,200 | | |
| | | | | Hotels, Restaurants & Leisure | | | 1.78 | % | |
| | | | | Nathan's Famous, Inc. | | | |
| | 1,500,000 | | | 6.625%, 11/01/2025(b) | | | 1,545,000 | | |
| | | | | Royal Caribbean Cruises Ltd. | | | |
| | 1,615,000 | | | 7.500%, 10/15/2027(a) | | | 1,823,941 | | |
| | | | | Six Flags Entertainment Corp. | | | |
| | 1,500,000 | | | 5.500%, 04/15/2027(b) | | | 1,556,250 | | |
| | | | 4,925,191 | | |
| | | | | Leisure Products | | | 1.24 | % | |
| | | | | Brunswick Corp. | | | |
| | 3,000,000 | | | 7.375%, 09/01/2023 | | | 3,416,066 | | |
| | | | | Textiles, Apparel & Luxury Goods | | | 1.32 | % | |
| | | | | PVH Corp. | | | |
| | 3,120,000 | | | 7.750%, 11/15/2023 | | | 3,639,212 | | |
| Total Consumer Discretionary (Cost $12,416,693) | | | 14,073,669 | | |
Consumer Staples | | | 1.83 | % | |
| | | | | Food Products | | | 1.83 | % | |
| | | | | Pilgrim's Pride Corp. | | | |
| | 1,000,000 | | | 5.750%, 03/15/2025(b) | | | 1,021,850 | | |
| | | | | TreeHouse Foods, Inc. | | | |
| | 4,000,000 | | | 4.000%, 09/01/2028 | | | 4,035,780 | | |
| Total Consumer Staples (Cost $4,986,230) | | | 5,057,630 | | |

The accompanying notes are an integral part of these financial statements.
61
BUFFALO HIGH YIELD FUND
SCHEDULE OF INVESTMENTS
MARCH 31, 2021 Continued
Shares or Face Amount | | | | $ Fair Value* | |
Energy | | | 16.69 | % | |
| | | | | Energy Equipment & Services | | | 1.54 | % | |
| | | | | Bristow Group, Inc. | | | |
| | 1,750,000 | | | 6.875%, 03/01/2028(b) | | | 1,747,611 | | |
| | | | | Precision Drilling Corp. | | | |
| | 2,500,000 | | | 7.750%, 12/15/2023(a) | | | 2,510,938 | | |
| | | | 4,258,549 | | |
| | | | | Oil, Gas & Consumable Fuels | | | 15.15 | % | |
| | | | | Antero Midstream Partners LP / Antero Midstream Finance Corp. | | | |
| | 2,000,000 | | | 7.875%, 05/15/2026(b) | | | 2,154,790 | | |
| | | | | Antero Resources Corp. | | | |
| | 3,000,000 | | | 5.625%, 06/01/2023 | | | 3,013,890 | | |
| | 1,000,000 | | | 8.375%, 07/15/2026(b) | | | 1,104,375 | | |
| | 500,000 | | | 7.625%, 02/01/2029(b) | | | 533,437 | | |
| | | | | California Resources Corp. | | | |
| | 3,500,000 | | | 7.125%, 02/01/2026(b) | | | 3,566,360 | | |
| | | | | CNX Resources Corp. | | | |
| | 4,000,000 | | | 7.250%, 03/14/2027(b) | | | 4,301,440 | | |
| | 100,000 | | | 6.000%, 01/15/2029(b) | | | 104,105 | | |
| | | | | Comstock Resources, Inc. | | | |
| | 3,500,000 | | | 9.750%, 08/15/2026 | | | 3,810,625 | | |
| | 600,000 | | | 6.750%, 03/01/2029(b) | | | 616,125 | | |
| | | | | Delek Logistics Partners LP / Delek Logistics Finance Corp. | | | |
| | 3,000,000 | | | 6.750%, 05/15/2025 | | | 3,010,935 | | |
| | | | | Energy Transfer Operating LP | | | |
| | 1,500,000 | | | 7.125% (5 Year CMT Rate + 5.306%), 11/15/2165 | | | 1,465,200 | | |
| | | | | MEG Energy Corp. | | | |
| | 2,000,000 | | | 7.125%, 02/01/2027(a)(b) | | | 2,098,750 | | |
| | | | | MPLX LP | | | |
| | 7,000,000 | | | 6.875% (3 Month LIBOR USD + 4.652%), 08/15/2023 | | | 7,035,000 | | |
| | | | | Northern Oil and Gas, Inc. | | | |
| | 5,600,000 | | | 8.125%, 03/01/2028(b) | | | 5,578,300 | | |
| | | | | Seven Generations Energy Ltd. | | | |
| | 1,500,000 | | | 5.375%, 09/30/2025(a)(b) | | | 1,557,863 | | |
| | | | | Viper Energy Partners LP | | | |
| | 1,750,000 | | | 5.375%, 11/01/2027(b) | | | 1,823,281 | | |
| | | | 41,774,476 | | |
| Total Energy (Cost $44,967,089) | | | 46,033,025 | | |

The accompanying notes are an integral part of these financial statements.
62
BUFFALO HIGH YIELD FUND
SCHEDULE OF INVESTMENTS
MARCH 31, 2021 Continued
Shares or Face Amount | | | | $ Fair Value* | |
Finance and Insurance | | | 0.27 | % | |
| | | | | Activities Related to Credit Intermediation | | | 0.27 | % | |
| | | | | Scripps Escrow II, Inc. | | | |
| | 500,000 | | | 3.875%, 01/15/2029(b) | | | 492,188 | | |
| | 250,000 | | | 5.375%, 01/15/2031(b) | | | 249,294 | | |
| Total Finance and Insurance (Cost $250,000) | | | 741,482 | | |
Financials | | | 3.73 | % | |
| | | | | Capital Markets | | | 0.95 | % | |
| | | | | Donnelley Financial Solutions, Inc. | | | |
| | 2,500,000 | | | 8.250%, 10/15/2024 | | | 2,612,500 | | |
| | | | | Consumer Finance | | | 1.13 | % | |
| | | | | Curo Group Holdings Corp. | | | |
| | 3,000,000 | | | 8.250%, 09/01/2025(b) | | | 3,012,270 | | |
| | | | | PRA Group, Inc. | | | |
| | 100,000 | | | 7.375%, 09/01/2025(b) | | | 107,187 | | |
| | | | 3,119,457 | | |
| | | | | Diversified Financial Services | | | 0.90 | % | |
| | | | | Cott Holdings, Inc. | | | |
| | 1,250,000 | | | 5.500%, 04/01/2025(b) | | | 1,286,313 | | |
| | | | | Everi Payments, Inc. | | | |
| | 1,160,000 | | | 7.500%, 12/15/2025(b) | | | 1,211,092 | | |
| | | | 2,497,405 | | |
| | | | | Other Telecommunications | | | 0.75 | % | |
| | | | | Uniti Group LP / Uniti Fiber Holdings Inc / CSL Capital LLC | | | |
| | 2,000,000 | | | 7.125%, 12/15/2024(b) | | | 2,061,250 | | |
| Total Financials (Cost $9,974,404) | | | 10,290,612 | | |

The accompanying notes are an integral part of these financial statements.
63
BUFFALO HIGH YIELD FUND
SCHEDULE OF INVESTMENTS
MARCH 31, 2021 Continued
Shares or Face Amount | | | | $ Fair Value* | |
Health Care | | | 2.57 | % | |
| | | | | Pharmaceuticals | | | 2.57 | % | |
| | | | | Bausch Health Americas, Inc. | | | |
| | 1,000,000 | | | 9.250%, 04/01/2026(a)(b) | | | 1,109,300 | | |
| | | | | Bausch Health Companies Inc. | | | |
| | 1,500,000 | | | 5.500%, 11/01/2025(a)(b) | | | 1,542,570 | | |
| | 500,000 | | | 9.000%, 12/15/2025(a)(b) | | | 544,063 | | |
| | | | | Horizon Therapeutics USA, Inc. | | | |
| | 1,000,000 | | | 5.500%, 08/01/2027(b) | | | 1,069,190 | | |
| | | | | Teva Pharmaceutical Industries Ltd. | | | |
| | 2,500,000 | | | 6.750%, 03/01/2028(a) | | | 2,813,312 | | |
| Total Health Care (Cost $6,350,872) | | | 7,078,435 | | |
Industrials | | | 9.57 | % | |
| | | | | Aerospace & Defense | | | 0.38 | % | |
| | | | | TransDigm, Inc. | | | |
| | 500,000 | | | 6.250%, 03/15/2026(b) | | | 530,578 | | |
| | 500,000 | | | 6.375%, 06/15/2026 | | | 517,812 | | |
| | | | 1,048,390 | | |
| | | | | Building Products | | | 1.68 | % | |
| | | | | Builders FirstSource, Inc. | | | |
| | 402,000 | | | 6.750%, 06/01/2027(b) | | | 431,647 | | |
| | 4,000,000 | | | 5.000%, 03/01/2030(b) | | | 4,199,200 | | |
| | | | 4,630,847 | | |
| | | | | Commercial Services & Supplies | | | 4.63 | % | |
| | | | | Cimpress NV | | | |
| | 2,000,000 | | | 7.000%, 06/15/2026(a)(b) | | | 2,118,520 | | |
| | | | | Covanta Holding Corp. | | | |
| | 1,500,000 | | | 5.875%, 07/01/2025 | | | 1,557,967 | | |
| | 250,000 | | | 5.000%, 09/01/2030 | | | 252,813 | | |
| | | | | KAR Auction Services, Inc. | | | |
| | 2,500,000 | | | 5.125%, 06/01/2025(b) | | | 2,531,875 | | |
| | | | | Matthews International Corp. | | | |
| | 2,260,000 | | | 5.250%, 12/01/2025(b) | | | 2,344,513 | | |
| | | | | Quad Graphics, Inc. | | | |
| | 4,000,000 | | | 7.000%, 05/01/2022 | | | 3,965,940 | | |
| | | | 12,771,628 | | |

The accompanying notes are an integral part of these financial statements.
64
BUFFALO HIGH YIELD FUND
SCHEDULE OF INVESTMENTS
MARCH 31, 2021 Continued
Shares or Face Amount | | | | $ Fair Value* | |
| | | | | Construction & Engineering | | | 1.68 | % | |
| | | | | Great Lakes Dredge & Dock Corp. | | | |
| | 1,500,000 | | | 8.000%, 05/15/2022 | | | 1,515,000 | | |
| | | | | Tutor Perini Corp. | | | |
| | 3,000,000 | | | 6.875%, 05/01/2025(b) | | | 3,105,900 | | |
| | | | 4,620,900 | | |
| | Trading Companies & Distributors | | | | | | 1.20 | % | |
| | | | | Alta Equipment Group, Inc. | | | |
| | 1,250,000 | | | 5.625%, 04/15/2026(b) | | | 1,268,750 | | |
| | | | | Fly Leasing Ltd. | | | |
| | 2,000,000 | | | 5.250%, 10/15/2024(a) | | | 2,045,000 | | |
| | | | 3,313,750 | | |
| Total Industrials (Cost $25,628,987) | | | 26,385,515 | | |
| Information | | | 3.64 | % | |
| | | | | Data Processing, Hosting, and Related Services | | | 0.37 | % | |
| | | | | VM Consolidated, Inc. | | | |
| | 1,000,000 | | | 5.500%, 04/15/2029(b) | | | 1,025,930 | | |
| | | | | Motion Picture and Video Industries | | | 0.73 | % | |
| | | | | Lions Gate Capital Holdings LLC | | | |
| | 2,000,000 | | | 5.500%, 04/15/2029(b) | | | 2,005,220 | | |
| | | | | Other Telecommunications | | | 1.46 | % | |
| | | | | Avaya, Inc. | | | |
| | 1,500,000 | | | 6.125%, 09/15/2028(b) | | | 1,598,512 | | |
| | | | | Consolidated Communications, Inc. | | | |
| | 2,250,000 | | | 6.500%, 10/01/2028(b) | | | 2,433,668 | | |
| | | | 4,032,180 | | |
| | | | | Radio and Television Broadcasting | | | 1.08 | % | |
| | | | | Entercom Media Corp. | | | |
| | 200,000 | | | 6.750%, 03/31/2029(b) | | | 208,260 | | |
| | | | | iHeartCommunications, Inc. | | | |
| | 2,000,000 | | | 8.375%, 05/01/2027 | | | 2,150,000 | | |
| | 100,000 | | | 5.250%, 08/15/2027(b) | | | 103,030 | | |
| | | | | Nexstar Broadcasting, Inc. | | | |
| | 500,000 | | | 4.750%, 11/01/2028(b) | | | 506,205 | | |
| | | 2,967,495 | | |
| Total Information (Cost $10,194,150) | | | 10,030,825 | | |

The accompanying notes are an integral part of these financial statements.
65
BUFFALO HIGH YIELD FUND
SCHEDULE OF INVESTMENTS
MARCH 31, 2021 Continued
Shares or Face Amount | | | | $ Fair Value* | |
Information Technology | | | 2.99 | % | |
| | | | | Electronic Equipment, Instruments & Components | | | 0.93 | % | |
| | | | | Itron, Inc. | | | |
| | 2,500,000 | | | 5.000%, 01/15/2026(b) | | | 2,565,938 | | |
| | | | | IT Services | | | 0.37 | % | |
| | | | | Cardtronics Inc / Cardtronics USA, Inc. | | | |
| | 1,000,000 | | | 5.500%, 05/01/2025(a)(b) | | | 1,030,000 | | |
| | | | | Technology Hardware, Storage & Peripherals | | | 1.69 | % | |
| | | | | Diebold Nixdorf, Inc. | | | |
| | 4,000,000 | | | 8.500%, 04/15/2024 | | | 4,091,000 | | |
| | 500,000 | | | 9.375%, 07/15/2025(b) | | | 557,812 | | |
| | | | 4,648,812 | | |
| Total Information Technology (Cost $7,962,319) | | | 8,244,750 | | |
Management of Companies and Enterprises | | | 0.79 | % | |
| | | | | Management of Companies and Enterprises | | | 0.79 | % | |
| | | | | At Home Holding III, Inc. | | | |
| | 2,000,000 | | | 8.750%, 09/01/2025(b) | | | 2,186,250 | | |
| Total Management of Companies and Enterprises (Cost $2,055,691) | | | 2,186,250 | | |
Manufacturing | | | 0.81 | % | |
| | | | | Resin, Synthetic Rubber, and Artificial Synthetic Fibers and Filaments Manufacturing | | | 0.81 | % | |
| | | | | Rayonier AM Products, Inc. | | | |
| | 2,100,000 | | | 7.625%, 01/15/2026(b) | | | 2,233,875 | | |
| Total Manufacturing (Cost $2,155,151) | | | 2,233,875 | | |
Materials | | | 2.61 | % | |
| | | | | Chemicals | | | 0.76 | % | |
| | | | | Chemours Co/The | | | |
| | 2,000,000 | | | 5.750%, 11/15/2028(b) | | | 2,109,580 | | |

The accompanying notes are an integral part of these financial statements.
66
BUFFALO HIGH YIELD FUND
SCHEDULE OF INVESTMENTS
MARCH 31, 2021 Continued
Shares or Face Amount | | | | $ Fair Value* | |
| | | | | Metals & Mining | | | 1.85 | % | |
| | | | | Commercial Metals Co. | | | |
| | 250,000 | | | 5.375%, 07/15/2027 | | | 263,125 | | |
| | 500,000 | | | 3.875%, 02/15/2031 | | | 491,355 | | |
| | | | | Taseko Mines Ltd. | | | |
| | 3,000,000 | | | 7.000%, 02/15/2026(a)(b) | | | 3,057,750 | | |
| | | | | Warrior Met Coal, Inc. | | | |
| | 1,250,000 | | | 8.000%, 11/01/2024(b) | | | 1,282,225 | | |
| | | | 5,094,455 | | |
| Total Materials (Cost $7,057,308) | | | 7,204,035 | | |
Professional, Scientific, and Technical Services | | | 0.59 | % | |
| | | | | Other Professional, Scientific, and Technical Services | | | 0.59 | % | |
| | | | | Sabre GLBL, Inc. | | | |
| | 1,500,000 | | | 7.375%, 09/01/2025(b) | | | 1,636,875 | | |
| Total Professional, Scientific, and Technical Services (Cost $1,514,336) | | | 1,636,875 | | |
Real Estate and Rental and Leasing | | | 0.07 | % | |
| | | | | Lessors of Real Estate | | | 0.07 | % | |
| | | | | Uniti Group LP / Uniti Group Finance Inc / CSL Capital LLC | | | |
| | 200,000 | | | 6.500%, 02/15/2029(b) | | | 199,050 | | |
| Total Real Estate and Rental and Leasing (Cost $200,000) | | | 199,050 | | |
Retail Trade | | | 1.20 | % | |
| | | | | Sporting Goods, Hobby, and Musical Instrument Stores | | | 1.20 | % | |
| | | | | Michaels Stores, Inc. | | | |
| | 3,000,000 | | | 8.000%, 07/15/2027(b) | | | 3,320,070 | | |
| Total Retail Trade (Cost $2,934,805) | | | 3,320,070 | | |
Wholesale Trade | | | 2.07 | % | |
| | | | | Drugs and Druggists' Sundries Merchant Wholesalers | | | 1.34 | % | |
| | | | | Herbalife Nutrition Ltd / HLF Financing, Inc. | | | |
| | 500,000 | | | 7.875%, 09/01/2025(a)(b) | | | 544,375 | | |
| | | | | HLF Financing Sarl LLC / Herbalife International, Inc. | | | |
| | 3,000,000 | | | 7.250%, 08/15/2026(b) | | | 3,147,195 | | |
| | | | 3,691,570 | | |

The accompanying notes are an integral part of these financial statements.
67
BUFFALO HIGH YIELD FUND
SCHEDULE OF INVESTMENTS
MARCH 31, 2021 Continued
Shares or Face Amount | | | | $ Fair Value* | |
| | | | | Machinery, Equipment, and Supplies Merchant Wholesalers | | | 0.73 | % | |
| | | | | TransDigm, Inc. | | | |
| | 1,000,000 | | | 5.500%, 11/15/2027 | | | 1,035,250 | | |
| | 1,000,000 | | | 4.625%, 01/15/2029(b) | | | 986,040 | | |
| | | | 2,021,290 | | |
| Total Wholesale Trade (Cost $5,552,446) | | | 5,712,860 | | |
| Total Corporate Bonds (Cost $162,914,437) | | | 169,987,883 | | |
Bank Loans | | | 11.12 | % | |
| | | | | Aerospace & Defense | | | 1.99 | % | |
| | 3,609,671 | | | Maxar Technologies Ltd., Senior Secured First Lien Term Loan (1 Month LIBOR USD + 2.750%) | | | 3,573,574 | | |
| | 1,925,823 | | | TransDigm, Inc., Senior Secured First Lien Term Loan (1 Month LIBOR USD + 2.250%) | | | 1,892,949 | | |
| | | | 5,466,523 | | |
| | | | | Broadcasting | | | 0.36 | % | |
| | 559,678 | | | CBS Radio, Senior Secured First Lien Term Loan (1 Month LIBOR USD + 2.500%) | | | 548,905 | | |
| | 431,373 | | | Nexstar Media Group, Inc., Senior Secured First Lien Term Loan (1 Month LIBOR USD + 2.500%) | | | 428,813 | | |
| | | | 977,718 | | |
| | | | | Construction & Engineering | | | 0.91 | % | |
| | 2,492,500 | | | Tutor Perini Corp., Senior Secured First Lien Term Loan (3 Month LIBOR USD + 4.500%) | | | 2,524,441 | | |
| | | | | Diversified Consumer Services | | | 0.70 | % | |
| | 1,931,412 | | | Weight Watchers International, Inc., Senior Secured First Lien Term Loan
(1 Month LIBOR USD + 4.750%) | | | 1,933,025 | | |
| | | | | Finance | | | 0.72 | % | |
| | 1,975,000 | | | Fly Willow Funding Ltd., Senior Secured First Lien Term Loan (3 Month LIBOR USD + 6.000%) | | | 1,989,812 | | |
| | | | | Food Products | | | 0.61 | % | |
| | 1,678,839 | | | Atkins Nutritionals, Inc., Senior Secured First Lien Term Loan (1 Month LIBOR USD + 3.750%)(c) | | | 1,685,974 | | |
| | | | | Health Care Equipment & Services | | | 0.64 | % | |
| | 1,771,429 | | | RadNet, Inc., Senior Secured First Lien Term Loan (6 Month LIBOR USD + 3.500%) | | | 1,775,122 | | |
| | | | | IT Services | | | 0.36 | % | |
| | 1,000,000 | | | Endurance International Group Holdings, Inc., Senior Secured First Lien Term Loan
(6 Month LIBOR USD + 3.500%) | | | 991,250 | | |
| | | | | Media | | | 0.79 | % | |
| | 980,075 | | | The E.W. Scripps Co., Senior Secured First Lien Term Loan (1 Month LIBOR USD + 2.562%) | | | 977,012 | | |
| | 249,375 | | | The E.W. Scripps Co., Senior Secured First Lien Term Loan (1 Month LIBOR USD + 3.000%) | | | 248,889 | | |
| | 965,000 | | | The E.W. Scripps Co., Senior Secured First Lien Term Loan (1 Month LIBOR USD + 2.000%) | | | 965,101 | | |
| | | | 2,191,002 | | |
| | | | | Metals & Mining | | | 0.67 | % | |
| | 1,910,969 | | | U.S. Silica Co., Senior Secured First Lien Term Loan (1 Month LIBOR USD + 4.000%) | | | 1,849,818 | | |

The accompanying notes are an integral part of these financial statements.
68
BUFFALO HIGH YIELD FUND
SCHEDULE OF INVESTMENTS
MARCH 31, 2021 Continued
Shares or Face Amount | | | | $ Fair Value* | |
| | | | | Oil, Gas & Consumable Fuels | | | 0.35 | % | |
| | 972,500 | | | Keane Group Holdings, LLC, Senior Secured First Lien Term Loan (1 Month LIBOR USD + 4.000%) | | | 955,078 | | |
| | | | | Services | | | 0.55 | % | |
| | 1,496,250 | | | Sabre GLBL, Inc. Senior Secured First Lien Term Loan (1 Month LIBOR USD + 4.000%) | | | 1,514,025 | | |
| | | | | Software | | | 0.50 | % | |
| | 234,257 | | | SS&C Technologies Holdings, Inc., Senior Secured First Lien Term Loan (1 Month LIBOR USD + 1.750%)(c) | | | 232,223 | | |
| | 174,909 | | | SS&C Technologies Holdings, Inc., Senior Secured First Lien Term Loan (1 Month LIBOR USD + 1.750%)(c) | | | 173,390 | | |
| | 974,499 | | | SS&C Technologies Holdings, Inc., Senior Secured First Lien Term Loan (1 Month LIBOR USD + 1.750%)(c) | | | 966,177 | | |
| | | | 1,371,790 | | |
| | | | | Specialty Retail | | | 0.55 | % | |
| | 1,500,000 | | | Rent-A-Center Inc/TX, Senior Secured First Lien Term Loan (1 Month LIBOR USD + 4.000%) | | | 1,510,628 | | |
| | | | | Telecommunications | | | 1.42 | % | |
| | 1,500,000 | | | Avaya, Inc., Senior Secured First Lien Term Loan (1 Month LIBOR USD + 4.000%) | | | 1,501,612 | | |
| | 1,428,009 | | | Consolidated Communications, Inc., Senior Secured First Lien Term Loan
(1 Month LIBOR USD + 4.7500%) | | | 1,431,801 | | |
| | 1,000,000 | | | Consolidated Communications, Inc., Senior Secured First Lien Term Loan
(3 Month LIBOR USD + 4.25%) | | | 1,002,500 | | |
| | | | 3,935,913 | | |
| Total Bank Loans (Cost $30,665,356) | | | 30,672,119 | | |
Short Term Investments — 9.46% | |
Investment Company | | | 9.46 | % | |
| | 24,140,870 | | | Fidelity Investments Money Market Funds — Government Portfolio — Class I — 0.010%(d) | | | 24,140,870 | | |
| | 1,959,948 | | | The STIT-Treasury Portfolio 0.010%(d) | | | 1,959,948 | | |
Total Investment Company | | | 26,100,818 | | |
| Total Short Term Investments (Cost $26,100,818) | | | 26,100,818 | | |
| Total Investments (Cost $262,265,815) | | | 100.71
277,774,290 | % | |
Liabilities in Excess of Other Assets | | | (0.71
(1,949,142) | )% | |
Total Net Assets | | | 100.00
275,825,148 | % | |

The accompanying notes are an integral part of these financial statements.
69
BUFFALO HIGH YIELD FUND
SCHEDULE OF INVESTMENTS
MARCH 31, 2021 Continued
(a) Foreign Issued Securities. The total value of these securities amounted to $23,414,444 (8.49% of net assets) at March 31, 2021.
(b) 144A securities. The total value of these securities amounted to $125,860,010 (45.63% of net assets) at March 31, 2021.
(c) Illiquid Security. The total value of these securities amounted to $3,057,764 (1.11% of net assets) at March 31, 2021.
(d) The rate quoted is the annualized seven-day effective yield as of March 31, 2021.
(e) Callable at any dividend payment date on or after date disclosed.
(f) Fixed to floating rate. Effective date of change and formula disclosed. Rate disclosed is as of March 31, 2021.
* See Note 1A of the accompanying Notes to Financial Statements regarding valuation of securities.
The Global Industry Classification Standard (GICS) was developed by and/or is the exclusive property of MSCI, Inc. and Standard & Poor's Financial Services LLC ("S&P"). GICS is a service mark of MSCI and S&P and has been licensed for use by U.S. Bancorp Fund Services, LLC.

The accompanying notes are an integral part of these financial statements.
70
BUFFALO INTERNATIONAL FUND
SCHEDULE OF INVESTMENTS
MARCH 31, 2021
Shares or Face Amount | | | | $ Fair Value* | |
Common Stocks | | | 95.73 | % | |
Belgium | | | 1.44 | % | |
| | | | | Beverages | | | 1.44 | % | |
| | 83,500 | | | Anheuser-Busch InBev SA/NV | | | 5,249,066 | | |
| | 41,500 | | | Anheuser-Busch InBev SA/NV — ADR | | | 2,608,275 | | |
| | | | 7,857,341 | | |
| Total Belgium (Cost $8,039,001) | | | 7,857,341 | | |
Canada | | | 1.42 | % | |
| | | | | Road & Rail | | | 1.42 | % | |
| | 67,000 | | | Canadian National Railway Co. — ADR | | | 7,770,660 | | |
| Total Canada (Cost $4,822,925) | | | 7,770,660 | | |
Cayman Islands | | | 1.54 | % | |
| | | | | Interactive Media & Services | | | 1.54 | % | |
| | 105,000 | | | Tencent Holdings Ltd. — ADR | | | 8,379,000 | | |
| Total Cayman Islands (Cost $4,497,658) | | | 8,379,000 | | |
Denmark | | | 1.12 | % | |
| | | | | Pharmaceuticals | | | 1.12 | % | |
| | 15,000 | | | Novo Nordisk A/S | | | 1,010,755 | | |
| | 76,000 | | | Novo Nordisk A/S — ADR | | | 5,123,920 | | |
| | | | 6,134,675 | | |
| Total Denmark (Cost $5,103,075) | | | 6,134,675 | | |
France | | | 16.46 | % | |
| | | | | Aerospace & Defense | | | 0.82 | % | |
| | 45,000 | | | Thales SA | | | 4,466,239 | | |
| | | | | Beverages | | | 1.29 | % | |
| | 37,500 | | | Pernod Ricard SA | | | 7,019,246 | | |
| | | | | Chemicals | | | 1.53 | % | |
| | 51,062 | | | Air Liquide SA | | | 8,337,226 | | |

The accompanying notes are an integral part of these financial statements.
71
BUFFALO INTERNATIONAL FUND
SCHEDULE OF INVESTMENTS
MARCH 31, 2021 Continued
Shares or Face Amount | | | | $ Fair Value* | |
| | | | | Construction & Engineering | | | 1.05 | % | |
| | 56,000 | | | Vinci SA | | | 5,735,642 | | |
| | | | | Electrical Equipment | | | 2.48 | % | |
| | 89,000 | | | Schneider Electric SE | | | 13,557,878 | | |
| | | | | Hotels, Restaurants & Leisure | | | 0.42 | % | |
| | 50,000 | | | La Francaise des Jeux SAEM | | | 2,272,111 | | |
| | | | | Life Sciences Tools & Services | | | 2.49 | % | |
| | 33,000 | | | Sartorius Stedim Biotech | | | 13,581,146 | | |
| | | | | Pharmaceuticals | | | 0.90 | % | |
| | 99,587 | | | Sanofi — ADR | | | 4,925,573 | | |
| | | | | Professional Services | | | 1.47 | % | |
| | 283,000 | | | Bureau Veritas SA | | | 8,053,264 | | |
| | | | | Software | | | 1.10 | % | |
| | 28,000 | | | Dassault Systemes SE | | | 5,984,710 | | |
| | | | | Textiles, Apparel & Luxury Goods | | | 2.91 | % | |
| | 10,300 | | | Kering SA | | | 7,107,620 | | |
| | 13,100 | | | LVMH Moet Hennessy Louis Vuitton SE | | | 8,750,197 | | |
| | | | 15,857,817 | | |
| Total France (Cost $46,789,951) | | | 89,790,852 | | |
Germany | | | 21.94 | % | |
| | | | | Capital Markets | | | 1.36 | % | |
| | 172,000 | | | DWS Group GmbH & Co KGaA | | | 7,436,353 | | |
| | | | | Chemicals | | | 1.25 | % | |
| | 56,000 | | | Symrise AG | | | 6,794,589 | | |
| | | | | Electrical Equipment | | | 0.41 | % | |
| | 62,600 | | | Siemens Energy AG(a) | | | 2,247,938 | | |
| | | | | Electronic Equipment, Instruments & Components | | | 0.85 | % | |
| | 153,711 | | | Jenoptik AG | | | 4,619,815 | | |
| | | | | Health Care Equipment & Supplies | | | 1.81 | % | |
| | 65,525 | | | Carl Zeiss Meditec AG | | | 9,876,900 | | |
| | | | | Health Care Providers & Services | | | 0.96 | % | |
| | 117,000 | | | Fresenius SE & Co. KGaA | | | 5,213,584 | | |

The accompanying notes are an integral part of these financial statements.
72
BUFFALO INTERNATIONAL FUND
SCHEDULE OF INVESTMENTS
MARCH 31, 2021 Continued
Shares or Face Amount | | | | $ Fair Value* | |
| | | | | Household Products | | | 0.43 | % | |
| | 23,900 | | | Henkel AG & Co. KGaA | | | 2,367,837 | | |
| | | | | Industrial Conglomerates | | | 1.96 | % | |
| | 65,200 | | | Siemens A.G. — ADR | | | 10,713,154 | | |
| | | | | Insurance | | | 2.66 | % | |
| | 34,000 | | | Hannover Rueck SE | | | 6,208,682 | | |
| | 26,900 | | | Muenchener Rueckversicherungs-Gesellschaft AG in Muenchen | | | 8,284,399 | | |
| | | | 14,493,081 | | |
| | | | | Pharmaceuticals | | | 1.99 | % | |
| | 63,500 | | | Merck KGaA | | | 10,861,973 | | |
| | | | | Semiconductors & Semiconductor Equipment | | | 1.98 | % | |
| | 254,000 | | | Infineon Technologies AG | | | 10,807,128 | | |
| | | | | Software | | | 2.36 | % | |
| | 64,800 | | | SAP SE — ADR | | | 7,956,792 | | |
| | 115,000 | | | TeamViewer AG(a) | | | 4,918,140 | | |
| | | | 12,874,932 | | |
| | | | | Textiles, Apparel & Luxury Goods | | | 2.15 | % | |
| | 19,700 | | | adidas AG | | | 6,154,123 | | |
| | 57,160 | | | Puma SE | | | 5,604,074 | | |
| | | | 11,758,197 | | |
| | | | | Trading Companies & Distributors | | | 1.77 | % | |
| | 113,000 | | | Brenntag AG | | | 9,653,501 | | |
| Total Germany (Cost $69,841,916) | | | 119,718,982 | | |
India | | | 2.09 | % | |
| | | | | Banks | | | 2.09 | % | |
| | 27,500 | | | HDFC Bank Ltd. — ADR(a) | | | 2,136,475 | | |
| | 577,480 | | | ICICI Bank Ltd. — ADR(a) | | | 9,257,004 | | |
| | | | 11,393,479 | | |
| Total India (Cost $6,904,141) | | | 11,393,479 | | |
Ireland | | | 8.65 | % | |
| | | | | Chemicals | | | 2.40 | % | |
| | 46,760 | | | Linde PLC | | | 13,116,414 | | |

The accompanying notes are an integral part of these financial statements.
73
BUFFALO INTERNATIONAL FUND
SCHEDULE OF INVESTMENTS
MARCH 31, 2021 Continued
Shares or Face Amount | | | | $ Fair Value* | |
| | | | | Construction Materials | | | 1.66 | % | |
| | 78,000 | | | CRH PLC — ADR | | | 3,664,440 | | |
| | 5,000 | | | CRH PLC | | | 234,403 | | |
| | 110,000 | | | CRH public limited company | | | 5,147,659 | | |
| | | | 9,046,502 | | |
| | | | | Food Products | | | 0.62 | % | |
| | 27,000 | | | Kerry Group Plc | | | 3,372,017 | | |
| | | | | Health Care Equipment & Supplies | | | 1.68 | % | |
| | 77,400 | | | Medtronic, PLC — ADR | | | 9,143,262 | | |
| | | | | Hotels, Restaurants & Leisure | | | 0.27 | % | |
| | 300,015 | | | Dalata Hotel Group PLC(a) | | | 1,486,477 | | |
| | | | | Insurance | | | 2.02 | % | |
| | 48,000 | | | Aon Plc — ADR | | | 11,045,280 | | |
| Total Ireland (Cost $30,064,352) | | | 47,209,952 | | |
Japan | | | 6.11 | % | |
| | | | | Beverages | | | 0.91 | % | |
| | 117,000 | | | Asahi Group Holdings Ltd. | | | 4,952,700 | | |
| | | | | Electronic Equipment, Instruments & Components | | | 3.23 | % | |
| | 7,000 | | | KEYENCE CORP. | | | 3,190,294 | | |
| | 75,000 | | | Murata Manufacturing Co., Ltd. | | | 6,037,159 | | |
| | 107,000 | | | Omron Corp. | | | 8,381,568 | | |
| | | | 17,609,021 | | |
| | | | | Entertainment | | | 1.08 | % | |
| | 10,500 | | | Nintendo Co Ltd. | | | 5,918,173 | | |
| | | | | Machinery | | | 0.89 | % | |
| | 18,500 | | | FANUC Corp. | | | 4,447,532 | | |
| | 18,000 | | | FANUC Corp. — ADR(a) | | | 433,935 | | |
| | | | 4,881,467 | | |
| Total Japan (Cost $23,862,707) | | | 33,361,361 | | |
Luxembourg | | | 2.46 | % | |
| | | | | Life Sciences Tools & Services | | | 2.08 | % | |
| | 119,000 | | | EUROFINS SCIENTIFI(a) | | | 11,374,094 | | |

The accompanying notes are an integral part of these financial statements.
74
BUFFALO INTERNATIONAL FUND
SCHEDULE OF INVESTMENTS
MARCH 31, 2021 Continued
Shares or Face Amount | | | | $ Fair Value* | |
| | | | | Personal Products | | | 0.38 | % | |
| | 730,750 | | | L'Occitane International SA | | | 2,045,776 | | |
| Total Luxembourg (Cost $6,338,530) | | | 13,419,870 | | |
Netherlands | | | 8.60 | % | |
| | | | | Beverages | | | 1.46 | % | |
| | 710,000 | | | Davide Campari-Milano NV | | | 7,946,755 | | |
| | | | | IT Services | | | 1.31 | % | |
| | 3,200 | | | Adyen NV(a) | | | 7,140,523 | | |
| | | | | Semiconductors & Semiconductor Equipment | | | 3.93 | % | |
| | 25,741 | | | ASML Holding NV — NY Shares — ADR | | | 15,891,464 | | |
| | 65,000 | | | STMicroelectronics N.V. | | | 2,483,358 | | |
| | 80,600 | | | STMicroelectronics N.V. — NY Shares — ADR | | | 3,089,398 | | |
| | | | 21,464,220 | | |
| | | | | Trading Companies & Distributors | | | 1.90 | % | |
| | 75,000 | | | IMCD N.V. | | | 10,397,368 | | |
| Total Netherlands (Cost $15,061,191) | | | 46,948,866 | | |
Norway | | | 1.62 | % | |
| | | | | Commercial Services & Supplies | | | 1.62 | % | |
| | 203,000 | | | Tomra Systems ASA | | | 8,811,763 | | |
| Total Norway (Cost $1,789,628) | | | 8,811,763 | | |
Republic of Korea | | | 0.80 | % | |
| | | | | Semiconductors & Semiconductor Equipment | | | 0.80 | % | |
| | 60,000 | | | Samsung Electronic Co., Ltd. | | | 4,340,677 | | |
| Total Republic of Korea (Cost $2,338,574) | | | 4,340,677 | | |

The accompanying notes are an integral part of these financial statements.
75
BUFFALO INTERNATIONAL FUND
SCHEDULE OF INVESTMENTS
MARCH 31, 2021 Continued
Shares or Face Amount | | | | $ Fair Value* | |
Spain | | | 1.26 | % | |
| | | | | Biotechnology | | | 0.81 | % | |
| | 257,200 | | | Grifols SA — ADR | | | 4,446,988 | | |
| | | | | Specialty Retail | | | 0.45 | % | |
| | 73,500 | | | Industria de Diseno Textil, S.A. | | | 2,428,446 | | |
| Total Spain (Cost $6,652,736) | | | 6,875,434 | | |
Sweden | | | 3.26 | % | |
| | | | | Communications Equipment | | | 0.60 | % | |
| | 250,000 | | | Telefonaktirbolaget LM Ericsson — ADR | | | 3,297,500 | | |
| | | | | Electronic Equipment, Instruments & Components | | | 2.34 | % | |
| | 138,000 | | | Hexagon AB — B Shares | | | 12,738,551 | | |
| | | | | Software | | | 0.32 | % | |
| | 10,000 | | | Sinch AB(a) | | | 1,757,760 | | |
| Total Sweden (Cost $11,050,671) | | | 17,793,811 | | |
Switzerland | | | 6.48 | % | |
| | | | | Capital Markets | | | 0.60 | % | |
| | 51,037 | | | Julius Baer Group Ltd. | | | 3,261,441 | | |
| | | | | Construction Materials | | | 0.75 | % | |
| | 70,000 | | | LafargeHolcim Ltd. | | | 4,116,348 | | |
| | | | | Electrical Equipment | | | 1.24 | % | |
| | 222,500 | | | ABB Ltd. — ADR | | | 6,779,575 | | |
| | | | | Food Products | | | 0.41 | % | |
| | 20,000 | | | Nestle SA | | | 2,229,528 | | |
| | | | | Health Care Equipment & Supplies | | | 0.59 | % | |
| | 46,000 | | | Alcon, Inc. | | | 3,228,068 | | |
| | | | | Life Sciences Tools & Services | | | 1.85 | % | |
| | 18,000 | | | Lonza Group AG | | | 10,067,391 | | |
| | | | | Pharmaceuticals | | | 1.04 | % | |
| | 11,800 | | | Roche Holding AG | | | 3,822,532 | | |
| | 45,400 | | | Roche Holding AG — ADR | | | 1,841,424 | | |
| | | | 5,663,956 | | |
| Total Switzerland (Cost $24,280,338) | | | 35,346,307 | | |

The accompanying notes are an integral part of these financial statements.
76
BUFFALO INTERNATIONAL FUND
SCHEDULE OF INVESTMENTS
MARCH 31, 2021 Continued
Shares or Face Amount | | | | $ Fair Value* | |
Taiwan, Province of China | | | 2.80 | % | |
| | | | | Semiconductors & Semiconductor Equipment | | | 2.80 | % | |
| | 129,281 | | | Taiwan Semiconductor Manufacturing Co. Ltd. — ADR | | | 15,291,357 | | |
| Total Taiwan, Province of China (Cost $1,607,686) | | | 15,291,357 | | |
United Kingdom | | | 7.68 | % | |
| | | | | Aerospace & Defense | | | 0.56 | % | |
| | 440,000 | | | BAE Systems Plc | | | 3,064,207 | | |
| | | | | Beverages | | | 1.21 | % | |
| | 40,300 | | | Diageo PLC — ADR | | | 6,617,663 | | |
| | | | | Food Products | | | 1.00 | % | |
| | 97,200 | | | Unilever PLC — ADR | | | 5,426,676 | | |
| | | | | Health Care Equipment & Supplies | | | 0.88 | % | |
| | 127,000 | | | Smith & Nephew Plc — ADR | | | 4,813,300 | | |
| | | | | Hotels, Restaurants & Leisure | | | 0.61 | % | |
| | 48,100 | | | InterContinental Hotels Group PLC(a) | | | 3,307,823 | | |
| | | | | Personal Products | | | 0.08 | % | |
| | 8,000 | | | Unilever Plc | | | 446,378 | | |
| | | | | Pharmaceuticals | | | 1.02 | % | |
| | 94,000 | | | AstraZeneca PLC — ADR | | | 4,673,680 | | |
| | 9,000 | | | AstraZeneca PLC | | | 898,282 | | |
| | | | 5,571,962 | | |
| | | | | Trading Companies & Distributors | | | 2.32 | % | |
| | 212,000 | | | Ashtead Group Plc | | | 12,655,543 | | |
| Total United Kingdom (Cost $27,473,597) | | | 41,903,552 | | |
| Total Common Stocks (Cost $296,518,677) | | | 522,347,939 | | |

The accompanying notes are an integral part of these financial statements.
77
BUFFALO INTERNATIONAL FUND
SCHEDULE OF INVESTMENTS
MARCH 31, 2021 Continued
Shares or Face Amount | | | | $ Fair Value* | |
Short Term Investments | | | 3.57 | % | |
Investment Company | | | 3.57 | % | |
| | 19,453,902 | | | Fidelity Investments Money Market Funds — Government Portfolio — Class I — 0.010%(b) | | | 19,453,902 | | |
Total Investment Company | | | 19,453,902 | | |
| Total Short Term Investments (Cost $19,453,902) | | | 19,453,902 | | |
| Total Investments (Cost $315,972,579) | | | 99.30
541,801,841 | % | |
Other Assets in Excess of Liabilities | | | 0.70
3,837,611 | % | |
Total Net Assets | | | 100.00
545,639,452 | % | |
ADR American Depositary Receipt
PLC Public Limited Company
(a) Non Income Producing.
(b) The rate quoted is the annualized seven-day effective yield as of March 31, 2021.
* See Note 1A of the accompanying Notes to Financial Statements regarding valuation of securities.
The Global Industry Classification Standard (GICS) was developed by and/or is the exclusive property of MSCI, Inc. and Standard & Poor's Financial Services LLC ("S&P"). GICS is a service mark of MSCI and S&P and has been licensed for use by U.S. Bancorp Fund Services, LLC.

The accompanying notes are an integral part of these financial statements.
78
BUFFALO INTERNATIONAL FUND
SCHEDULE OF INVESTMENTS
MARCH 31, 2021 Continued
As of March 31, 2021, the industry diversification was as follows:
| | | $ Fair Value | | Percentage | |
Common Stocks | |
Aerospace & Defense | | | 7,530,446 | | | | 1.38 | % | |
Banks | | | 11,393,479 | | | | 2.09 | % | |
Beverages | | | 34,393,705 | | | | 6.30 | % | |
Biotechnology | | | 4,446,988 | | | | 0.82 | % | |
Capital Markets | | | 10,697,794 | | | | 1.96 | % | |
Chemicals | | | 28,248,229 | | | | 5.18 | % | |
Commercial Services & Supplies | | | 8,811,763 | | | | 1.61 | % | |
Communications Equipment | | | 3,297,500 | | | | 0.60 | % | |
Construction & Engineering | | | 5,735,642 | | | | 1.05 | % | |
Construction Materials | | | 13,162,850 | | | | 2.41 | % | |
Electrical Equipment | | | 22,585,391 | | | | 4.14 | % | |
Electronic Equipment, Instruments & Components | | | 34,967,387 | | | | 6.41 | % | |
Entertainment | | | 5,918,173 | | | | 1.08 | % | |
Food Products | | | 11,028,221 | | | | 2.02 | % | |
Health Care Equipment & Supplies | | | 27,061,530 | | | | 4.96 | % | |
Health Care Providers & Services | | | 5,213,584 | | | | 0.96 | % | |
Hotels, Restaurants & Leisure | | | 7,066,411 | | | | 1.30 | % | |
Household Products | | | 2,367,837 | | | | 0.43 | % | |
Industrial Conglomerates | | | 10,713,154 | | | | 1.96 | % | |
Insurance | | | 25,538,361 | | | | 4.68 | % | |
Interactive Media & Services | | | 8,379,000 | | | | 1.54 | % | |
IT Services | | | 7,140,523 | | | | 1.31 | % | |
Life Sciences Tools & Services | | | 35,022,631 | | | | 6.42 | % | |
Machinery | | | 4,881,467 | | | | 0.89 | % | |
Personal Products | | | 2,492,154 | | | | 0.46 | % | |
Pharmaceuticals | | | 33,158,139 | | | | 6.08 | % | |
Professional Services | | | 8,053,264 | | | | 1.48 | % | |
Road & Rail | | | 7,770,660 | | | | 1.42 | % | |
Semiconductors & Semiconductor Equipment | | | 51,903,382 | | | | 9.51 | % | |
Software | | | 20,617,402 | | | | 3.78 | % | |
Specialty Retail | | | 2,428,446 | | | | 0.45 | % | |
Textiles, Apparel & Luxury Goods | | | 27,616,014 | | | | 5.06 | % | |
Trading Companies & Distributors | | | 32,706,412 | | | | 5.99 | % | |
Total Common Stocks | | | 522,347,939 | | | | 95.73 | % | |

The accompanying notes are an integral part of these financial statements.
79
BUFFALO INTERNATIONAL FUND
SCHEDULE OF INVESTMENTS
MARCH 31, 2021 Continued
| | | $ Fair Value | | Percentage | |
Short Term Investment | |
Investment Company | | | 19,453,902 | | | | 3.57 | % | |
Total Short Term Investment | | | 19,453,902 | | | | 3.57 | % | |
Total Investments | | | 541,801,841 | | | | 99.30 | % | |
Liabilities in Excess of Other Assets | | | 3,837,611 | | | | 0.70 | % | |
Total Net Assets | | | 545,639,452 | | | | 100.00 | % | |

The accompanying notes are an integral part of these financial statements.
80
BUFFALO LARGE CAP FUND
SCHEDULE OF INVESTMENTS
MARCH 31, 2021
Shares or Face Amount | | | | $ Fair Value* | |
Common Stocks | | | 94.26% | | |
Communication Services | | | 11.38 | % | |
| | | | | Entertainment | | | 2.60 | % | |
| | 12,510 | | | Electronic Arts, Inc. | | | 1,693,479 | | |
| | 6,150 | | | The Walt Disney Co.(a) | | | 1,134,798 | | |
| | | | 2,828,277 | | |
| | | | | Interactive Media & Services | | | 8.78 | % | |
| | 2,845 | | | Alphabet, Inc. — Class A(a) | | | 5,867,869 | | |
| | 1,148 | | | Alphabet, Inc. — Class C(a) | | | 2,374,787 | | |
| | 4,450 | | | Facebook, Inc. — Class A(a) | | | 1,310,659 | | |
| | | | 9,553,315 | | |
| Total Communication Services (Cost $4,045,526) | | | 12,381,592 | | |
Consumer Discretionary | | | 16.60 | % | |
| | | | | Hotels, Restaurants & Leisure | | | 2.55 | % | |
| | 26,555 | | | Las Vegas Sands Corp(a) | | | 1,613,482 | | |
| | 10,740 | | | Yum! Brands, Inc. | | | 1,161,853 | | |
| | | | 2,775,335 | | |
| | | | | Internet & Direct Marketing Retail | | | 8.40 | % | |
| | 2,485 | | | Amazon.com, Inc.(a) | | | 7,688,789 | | |
| | 625 | | | Booking Holdings, Inc.(a) | | | 1,456,150 | | |
| | | | 9,144,939 | | |
| | | | | Specialty Retail | | | 4.03 | % | |
| | 10,300 | | | Lowe's Companies, Inc. | | | 1,958,854 | | |
| | 2,350 | | | O'Reilly Automotive, Inc.(a) | | | 1,192,037 | | |
| | 18,645 | | | The TJX Companies, Inc. | | | 1,233,367 | | |
| | | | 4,384,258 | | |
| | | | | Textiles, Apparel & Luxury Goods | | | 1.62 | % | |
| | 13,260 | | | NIKE, Inc. — Class B | | | 1,762,121 | | |
| Total Consumer Discretionary (Cost $6,884,067) | | | 18,066,653 | | |
Consumer Staples | | | 1.40 | % | |
| | | | | Personal Products | | | 1.40 | % | |
| | 5,235 | | | The Estee Lauder Companies Inc. — Class A | | | 1,522,600 | | |
| Total Consumer Staples (Cost $490,027) | | | 1,522,600 | | |

The accompanying notes are an integral part of these financial statements.
81
BUFFALO LARGE CAP FUND
SCHEDULE OF INVESTMENTS
MARCH 31, 2021 Continued
Shares or Face Amount | | | | $ Fair Value* | |
Financials | | | 6.75 | % | |
| | | | | Capital Markets | | | 6.75 | % | |
| | 10,125 | | | CME Group, Inc. | | | 2,067,829 | | |
| | 17,850 | | | Intercontinental Exchange, Inc. | | | 1,993,488 | | |
| | 6,475 | | | S&P Global, Inc. | | | 2,284,833 | | |
| | 5,800 | | | T Rowe Price Group, Inc. | | | 995,280 | | |
| Total Financials (Cost $2,321,644) | | | 7,341,430 | | |
Health Care | | | 16.01 | % | |
| | | | | Biotechnology | | | 0.75 | % | |
| | 5,760 | | | Alnylam Pharmaceuticals, Inc.(a) | | | 813,254 | | |
| | | | | Health Care Equipment & Supplies | | | 8.03 | % | |
| | 13,890 | | | Abbott Laboratories | | | 1,664,578 | | |
| | 2,995 | | | The Cooper Companies, Inc. | | | 1,150,349 | | |
| | 12,150 | | | Danaher Corp. | | | 2,734,722 | | |
| | 13,200 | | | Medtronic, PLC — ADR(b) | | | 1,559,316 | | |
| | 10,210 | | | Zimmer Biomet Holdings, Inc. | | | 1,634,417 | | |
| | | | 8,743,382 | | |
| | | | | Health Care Providers & Services | | | 2.92 | % | |
| | 6,460 | | | Laboratory Corporation of America Holdings(a) | | | 1,647,494 | | |
| | 4,125 | | | UnitedHealth Group, Inc. | | | 1,534,789 | | |
| | | | 3,182,283 | | |
| | | | | Life Sciences Tools & Services | | | 1.15 | % | |
| | 3,260 | | | Illumina, Inc.(a) | | | 1,252,036 | | |
| | | | | Pharmaceuticals | | | 3.16 | % | |
| | 12,860 | | | Catalent, Inc.(a) | | | 1,354,286 | | |
| | 34,285 | | | Roche Holding AG — ADR(b) | | | 1,390,600 | | |
| | 49,430 | | | Viatris, Inc.(a) | | | 690,537 | | |
| | | | 3,435,423 | | |
| Total Health Care (Cost $11,555,420) | | | 17,426,378 | | |
Industrials | | | 9.57 | % | |
| | | | | Air Freight & Logistics | | | 1.89 | % | |
| | 7,225 | | | FedEx Corp. | | | 2,052,189 | | |
| | | | | Airlines | | | 0.68 | % | |
| | 15,340 | | | Delta Air Lines, Inc.(a) | | | 740,615 | | |

The accompanying notes are an integral part of these financial statements.
82
BUFFALO LARGE CAP FUND
SCHEDULE OF INVESTMENTS
MARCH 31, 2021 Continued
Shares or Face Amount | | | | $ Fair Value* | |
| | | | | Building Products | | | 1.52 | % | |
| | 27,660 | | | Masco Corp. | | | 1,656,834 | | |
| | | | | Commercial Services & Supplies | | | 1.64 | % | |
| | 13,800 | | | Waste Management, Inc. | | | 1,780,476 | | |
| | | | | Industrial Conglomerates | | | 1.42 | % | |
| | 7,100 | | | Honeywell International, Inc. | | | 1,541,197 | | |
| | | | | Road & Rail | | | 2.42 | % | |
| | 10,000 | | | Kansas City Southern | | | 2,639,200 | | |
| Total Industrials (Cost $5,851,490) | | | 10,410,511 | | |
Information Technology | | | 30.66 | % | |
| | | | | Electronic Equipment, Instruments & Components | | | 1.39 | % | |
| | 19,395 | | | Trimble, Inc.(a) | | | 1,508,737 | | |
| | | | | IT Services | | | 6.08 | % | |
| | 16,275 | | | Black Knight, Inc.(a) | | | 1,204,187 | | |
| | 10,425 | | | PayPal Holdings, Inc.(a) | | | 2,531,607 | | |
| | 13,615 | | | Visa Inc. — Class A | | | 2,882,704 | | |
| | | | 6,618,498 | | |
| | | | | Semiconductors & Semiconductor Equipment | | | 3.66 | % | |
| | 13,875 | | | QUALCOMM, Inc. | | | 1,839,686 | | |
| | 7,370 | | | Texas Instruments, Inc. | | | 1,392,857 | | |
| | 6,050 | | | Xilinx, Inc. | | | 749,595 | | |
| | | | 3,982,138 | | |
| | | | | Software | | | 13.70 | % | |
| | 4,775 | | | DocuSign, Inc.(a) | | | 966,699 | | |
| | 3,825 | | | Intuit, Inc. | | | 1,465,204 | | |
| | 43,800 | | | Microsoft Corp. | | | 10,326,726 | | |
| | 10,115 | | | salesforce.com, Inc.(a) | | | 2,143,065 | | |
| | | | 14,901,694 | | |
| | Technology Hardware, Storage & Peripherals | | | | | | 5.83 | % | |
| | 51,980 | | | Apple Inc. | | | 6,349,357 | | |
| Total Information Technology (Cost $10,955,933) | | | 33,360,424 | | |

The accompanying notes are an integral part of these financial statements.
83
BUFFALO LARGE CAP FUND
SCHEDULE OF INVESTMENTS
MARCH 31, 2021 Continued
Shares or Face Amount | | | | $ Fair Value* | |
Materials | | | 1.89 | % | |
| | | | | Chemicals | | | 1.89 | % | |
| | 7,355 | | | Linde PLC — ADR(b) | | | 2,060,430 | | |
| Total Materials (Cost $1,202,212) | | | 2,060,430 | | |
| Total Common Stocks (Cost $43,306,319) | | | 102,570,018 | | |
REITS | | | 2.13 | % | |
Real Estate | | | 2.13 | % | |
| | | | | Equity Real Estate Investment Trusts (REITs) | | | 2.13 | % | |
| | 3,411 | | | Equinix Inc. | | | 2,318,082 | | |
| Total Real Estate (Cost $713,694) | | | 2,318,082 | | |
| Total REITS (Cost $713,694) | | | 2,318,082 | | |
Short Term Investments | | | 3.68 | % | |
Investment Company | | | 3.68 | % | |
| | 3,999,235 | | | Fidelity Investments Money Market Funds — Government Portfolio — Class I — 0.01%(c) | | | 3,999,235 | | |
Total Investment Company | | | 3,999,235 | | |
| Total Short Term Investments (Cost $3,999,235) | | | 3,999,235 | | |
| Total Investments (Cost $48,019,248) | | | 100.07
108,887,335 | % | |
Liabilities in Excess of Other Assets
| | | (0.07
(80,476) | )% | |
Total Net Assets | | | 100.00
108,806,859 | % | |

The accompanying notes are an integral part of these financial statements.
84
BUFFALO LARGE CAP FUND
SCHEDULE OF INVESTMENTS
MARCH 31, 2021 Continued
ADR American Depositary Receipt
PLC Public Limited Company
(a) Non Income Producing.
(b) Foreign Issued Security. The total value of these securities amounted to $5,010,346 (4.60% of net assets) at March 31, 2021.
(c) The rate quoted is the annualized seven-day effective yield as of March 31, 2021.
* See Note 1A of the accompanying Notes to Financial Statements regarding valuation of securities.
The Global Industry Classification Standard (GICS) was developed by and/or is the exclusive property of MSCI, Inc. and Standard & Poor's Financial Services LLC ("S&P"). GICS is a service mark of MSCI and S&P and has been licensed for use by U.S. Bancorp Fund Services, LLC.

The accompanying notes are an integral part of these financial statements.
85
BUFFALO MID CAP FUND
SCHEDULE OF INVESTMENTS
MARCH 31, 2021
Shares or Face Amount | | | | $ Fair Value | |
Common Stocks | | | 97.15 | % | |
Communication Services | | | 7.94 | % | |
| | | | | Entertainment | | | 2.12 | % | |
| | 23,537 | | | Live Nation Entertainment, Inc.(a) | | | 1,992,407 | | |
| | 11,640 | | | Take-Two Interactive Software, Inc.(a) | | | 2,056,788 | | |
| | | | 4,049,195 | | |
| | | | | Interactive Media & Services | | | 5.37 | % | |
| | 22,590 | | | IAC/InterActiveCorp(a) | | | 4,886,443 | | |
| | 99,540 | | | TripAdvisor, Inc.(a) | | | 5,354,257 | | |
| | | | 10,240,700 | | |
| | | | | Media | | | 0.45 | % | |
| | 22,329 | | | Liberty Media Corp-Liberty Formula One(a) | | | 853,414 | | |
| Total Communication Services (Cost $8,710,264) | | | 15,143,309 | | |
Consumer Discretionary | | | 7.11 | % | |
| | | | | Distributors | | | 0.43 | % | |
| | 19,223 | | | LKQ Corp.(a) | | | 813,710 | | |
| | | | | Diversified Consumer Services | | | 2.16 | % | |
| | 10,550 | | | Bright Horizons Family Solutions, Inc.(a) | | | 1,808,797 | | |
| | 48,500 | | | Terminix Global Holdings, Inc.(a) | | | 2,311,995 | | |
| | | | 4,120,792 | | |
| | | | | Hotels, Restaurants & Leisure | | | 0.91 | % | |
| | 5,956 | | | Vail Resorts, Inc.(a) | | | 1,737,127 | | |
| | | | | Specialty Retail | | | 2.56 | % | |
| | 24,835 | | | CarMax, Inc.(a) | | | 3,294,611 | | |
| | 40,930 | | | Vroom, Inc.(a) | | | 1,595,861 | | |
| | | | 4,890,472 | | |
| | | | | Textiles, Apparel & Luxury Goods | | | 1.05 | % | |
| | 83,570 | | | Levi Strauss & Co. | | | 1,998,159 | | |
| Total Consumer Discretionary (Cost $8,500,770) | | | 13,560,260 | | |
Consumer Staples | | | 0.61 | % | |
| | | | | Beverages | | | 0.61 | % | |
| | 960 | | | The Boston Beer Co, Inc. — Class A(a) | | | 1,158,029 | | |
| Total Consumer Staples (Cost $347,494) | | | 1,158,029 | | |

The accompanying notes are an integral part of these financial statements.
86
BUFFALO MID CAP FUND
SCHEDULE OF INVESTMENTS
MARCH 31, 2021 Continued
Shares or Face Amount | | | | $ Fair Value | |
Energy | | | 2.37 | % | |
| | | | | Energy Equipment & Services | | | 0.93 | % | |
| | 65,100 | | | Schlumberger Ltd.(b) | | | 1,770,069 | | |
| | | | | Oil, Gas & Consumable Fuels | | | 1.44 | % | |
| | 38,000 | | | EOG Resources, Inc. | | | 2,756,140 | | |
| Total Energy (Cost $3,036,806) | | | 4,526,209 | | |
Financials | | | 6.15 | % | |
| | | | | Capital Markets | | | 6.15 | % | |
| | 6,225 | | | MarketAxess Holdings, Inc. | | | 3,099,552 | | |
| | 9,074 | | | Moody's Corp. | | | 2,709,587 | | |
| | 14,116 | | | MSCI, Inc. | | | 5,918,557 | | |
| Total Financials (Cost $894,843) | | | 11,727,696 | | |
Health Care | | | 19.77 | % | |
| | | | | Aerospace & Defense | | | 1.18 | % | |
| | 5,400 | | | Teleflex, Inc. | | | 2,243,484 | | |
| | | | | Biotechnology | | | 0.96 | % | |
| | 13,950 | | | Exact Sciences Corp.(a) | | | 1,838,331 | | |
| | | | | Health Care Equipment & Supplies | | | 4.81 | % | |
| | 6,700 | | | ABIOMED, Inc.(a) | | | 2,135,491 | | |
| | 5,650 | | | The Cooper Companies, Inc. | | | 2,170,109 | | |
| | 75,810 | | | Envista Holdings Corp.(a) | | | 3,093,048 | | |
| | 7,720 | | | Masimo Corp.(a) | | | 1,772,975 | | |
| | | | 9,171,623 | | |
| | | | | Health Care Providers & Services | | | 3.27 | % | |
| | 14,280 | | | AmerisourceBergen Corp. | | | 1,686,039 | | |
| | 4,440 | | | Chemed Corp. | | | 2,041,601 | | |
| | 30,720 | | | Encompass Health Corp. | | | 2,515,968 | | |
| | | | 6,243,608 | | |
| | | | | Health Care Technology | | | 2.27 | % | |
| | 16,550 | | | Veeva Systems, Inc.(a) | | | 4,323,522 | | |

The accompanying notes are an integral part of these financial statements.
87
BUFFALO MID CAP FUND
SCHEDULE OF INVESTMENTS
MARCH 31, 2021 Continued
Shares or Face Amount | | | | $ Fair Value | |
| | | | | Life Sciences Tools & Services | | | 5.88 | % | |
| | 9,500 | | | Agilent Technologies, Inc. | | | 1,207,830 | | |
| | 5,160 | | | Bio-Rad Laboratories, Inc.(a) | | | 2,947,237 | | |
| | 12,390 | | | Bio-Techne Corp. | | | 4,732,113 | | |
| | 6,055 | | | Illumina, Inc.(a) | | | 2,325,483 | | |
| | | | 11,212,663 | | |
| | | | | Pharmaceuticals | | | 1.40 | % | |
| | 9,000 | | | Jazz Pharmaceuticals Public Limited Company —(a)(b) | | | 1,479,330 | | |
| | 7,592 | | | Zoetis, Inc. | | | 1,195,588 | | |
| | | | 2,674,918 | | |
| Total Health Care (Cost $21,448,909) | | | 37,708,149 | | |
Industrials | | | 25.88 | % | |
| | | | | Aerospace & Defense | | | 2.20 | % | |
| | 27,760 | | | BWX Technologies, Inc. | | | 1,830,495 | | |
| | 4,000 | | | TransDigm Group, Inc.(a) | | | 2,351,680 | | |
| | | | 4,182,175 | | |
| | | | | Building Products | | | 1.01 | % | |
| | 21,002 | | | Trex Co., Inc.(a) | | | 1,922,523 | | |
| | | | | Commercial Services & Supplies | | | 2.95 | % | |
| | 25,041 | | | Copart, Inc.(a) | | | 2,719,703 | | |
| | 52,666 | | | IAA Inc.(a) | | | 2,904,003 | | |
| | | | 5,623,706 | | |
| | | | | Electrical Equipment | | | 2.36 | % | |
| | 35,255 | | | AMETEK, Inc. | | | 4,503,121 | | |
| | | | | Professional Services | | | 9.54 | % | |
| | 6,155 | | | CoStar Group, Inc.(a) | | | 5,058,733 | | |
| | 12,483 | | | Equifax, Inc. | | | 2,261,046 | | |
| | 64,388 | | | IHS Markit Ltd. —(b) | | | 6,231,471 | | |
| | 26,303 | | | Verisk Analytics, Inc. | | | 4,647,477 | | |
| | | | 18,198,727 | | |
| | | | | Road & Rail | | | 7.82 | % | |
| | 14,508 | | | Kansas City Southern | | | 3,828,951 | | |
| | 121,000 | | | Lyft, Inc.(a) | | | 7,644,780 | | |
| | 63,200 | | | Uber Technologies, Inc.(a) | | | 3,445,032 | | |
| | | | 14,918,763 | | |
| Total Industrials (Cost $23,173,630) | | | 49,349,015 | | |

The accompanying notes are an integral part of these financial statements.
88
BUFFALO MID CAP FUND
SCHEDULE OF INVESTMENTS
MARCH 31, 2021 Continued
Shares or Face Amount | | | | $ Fair Value | |
Information Technology | | | 21.95 | % | |
| | | | | Communications Equipment | | | 1.81 | % | |
| | 16,570 | | | F5 Networks, Inc.(a) | | | 3,456,833 | | |
| | | | | IT Services | | | 5.34 | % | |
| | 7,380 | | | EPAM Systems, Inc.(a) | | | 2,927,572 | | |
| | 21,800 | | | Euronet Worldwide, Inc.(a) | | | 3,014,940 | | |
| | 17,500 | | | Gartner, Inc.(a) | | | 3,194,625 | | |
| | 13,000 | | | GDS Holdings Ltd. — ADR(a)(b) | | | 1,054,170 | | |
| | | | 10,191,307 | | |
| | | | | Semiconductors & Semiconductor Equipment | | | 5.27 | % | |
| | 30,455 | | | Maxim Integrated Products, Inc. | | | 2,782,673 | | |
| | 37,300 | | | Micron Technology, Inc.(a) | | | 3,290,233 | | |
| | 43,310 | | | ON Semiconductor Corp.(a) | | | 1,802,129 | | |
| | 9,140 | | | Universal Display Corp. | | | 2,164,078 | | |
| | | | 10,039,113 | | |
| | | | | Software | | | 9.53 | % | |
| | 23,235 | | | Aspen Technology, Inc.(a) | | | 3,353,508 | | |
| | 21,862 | | | Guidewire Software, Inc.(a) | | | 2,221,835 | | |
| | 10,030 | | | Palo Alto Networks, Inc.(a) | | | 3,230,262 | | |
| | 2,630 | | | ServiceNow, Inc.(a) | | | 1,315,289 | | |
| | 40,989 | | | SS&C Technologies Holdings, Inc. | | | 2,863,902 | | |
| | 6,640 | | | Tyler Technologies, Inc.(a) | | | 2,818,879 | | |
| | 9,540 | | | Workday, Inc.(a) | | | 2,370,022 | | |
| | | | 18,173,697 | | |
| Total Information Technology (Cost $25,283,841) | | | 41,860,950 | | |
Materials | | | 2.67 | % | |
| | | | | Chemicals | | | 1.35 | % | |
| | 23,310 | | | FMC Corp. | | | 2,578,319 | | |
| | | | | Construction Materials | | | 1.32 | % | |
| | 7,500 | | | Martin Marietta Materials, Inc. | | | 2,518,650 | | |
| Total Materials (Cost $1,847,509) | | | 5,096,969 | | |

The accompanying notes are an integral part of these financial statements.
89
BUFFALO MID CAP FUND
SCHEDULE OF INVESTMENTS
MARCH 31, 2021 Continued
Shares or Face Amount | | | | $ Fair Value | |
Real Estate | | | 2.70 | % | |
| | | | | Real Estate Management & Development | | | 2.70 | % | |
| | 65,022 | | | CBRE Group, Inc. — Class A(a) | | | 5,143,890 | | |
| Total Real Estate (Cost $2,929,008) | | | 5,143,890 | | |
| Total Common Stocks (Cost $96,173,074) | | | 185,274,476 | | |
REITS | | | 1.59 | % | |
Real Estate | | | 1.59 | % | |
| | | | | Equity Real Estate Investment Trusts (REITs) | | | 1.59 | % | |
| | 3,344 | | | Equinix Inc. | | | 2,272,549 | | |
| | 10,500 | | | Welltower, Inc. | | | 752,115 | | |
| Total Real Estate (Cost $1,259,698) | | | 3,024,664 | | |
| Total REITS (Cost $1,259,698) | | | 3,024,664 | | |
Short Term Investments | | | 0.53 | % | |
Investment Company | | | 0.53 | % | |
| | 1,005,097 | | | Fidelity Investments Money Market Funds — Government Portfolio — Class I — 0.010%(c) | | | 1,005,097 | | |
Total Investment Company | | | 1,005,097 | | |
| Total Short Term Investments (Cost $1,005,097) | | | 1,005,097 | | |
| Total Investments (Cost $98,437,869) | | | 99.27
189,304,237 | % | |
Other Assets in Excess of Liabilities | | | 0.73
1,399,122 | % | |
Total Net Assets | | | 100.00
190,703,359 | % | |

The accompanying notes are an integral part of these financial statements.
90
BUFFALO MID CAP FUND
SCHEDULE OF INVESTMENTS
MARCH 31, 2021 Continued
ADR American Depositary Receipt
(a) Non Income Producing.
(b) Foreign Issued Securities. The total value of these securities amounted to $10,535,040 (5.52% of net assets) at March 31, 2021.
(c) The rate quoted is the annualized seven-day effective yield as of March 31, 2021.
* See Note 1A of the accompanying Notes to Financial Statements regarding valuation of securities.
The Global Industry Classification Standard (GICS) was developed by and/or is the exclusive property of MSCI, Inc. and Standard & Poor's Financial Services LLC ("S&P"). GICS is a service mark of MSCI and S&P and has been licensed for use by U.S. Bancorp Fund Services, LLC.

The accompanying notes are an integral part of these financial statements.
91
BUFFALO SMALL CAP FUND
SCHEDULE OF INVESTMENTS
MARCH 31, 2021
Shares or Face Amount | | | | $ Fair Value | |
Common Stocks | | | 93.42 | % | |
Communication Services | | | 4.59 | % | |
| | | | | Diversified Telecommunication Services | | | 1.71 | % | |
| | 152,135 | | | Bandwidth, Inc.(a) | | | 19,281,590 | | |
| | | | | Interactive Media & Services | | | 2.88 | % | |
| | 777,755 | | | Eventbrite, Inc.(a) | | | 17,235,050 | | |
| | 421,920 | | | EverQuote, Inc.(a) | | | 15,311,477 | | |
| | | | 32,546,527 | | |
| Total Communication Services (Cost $42,248,145) | | | 51,828,117 | | |
Consumer Discretionary | | | 12.97 | % | |
| | | | | Hotels, Restaurants & Leisure | | | 4.99 | % | |
| | 174,860 | | | Bally's Corp.(a) | | | 11,362,403 | | |
| | 1,021,650 | | | Everi Holdings Inc.(a) | | | 14,415,482 | | |
| | 710,955 | | | Rush Street Interactive, Inc.(a) | | | 11,617,005 | | |
| | 121,130 | | | Texas Roadhouse, Inc.(a) | | | 11,621,212 | | |
| | 58,290 | | | Wingstop, Inc. | | | 7,412,739 | | |
| | | | 56,428,841 | | |
| | | | | Household Durables | | | 1.52 | % | |
| | 303,072 | | | Lovesac Co/The(a) | | | 17,153,875 | | |
| | | | | Internet & Direct Marketing Retail | | | 1.83 | % | |
| | 513,020 | | | RealReal Inc/The(a) | | | 11,609,642 | | |
| | 101,995 | | | Shutterstock, Inc. | | | 9,081,635 | | |
| | | | 20,691,277 | | |
| | | | | Specialty Retail | | | 3.65 | % | |
| | 42,120 | | | Five Below, Inc.(a) | | | 8,036,075 | | |
| | 647,690 | | | Guess?, Inc. | | | 15,220,715 | | |
| | 698,670 | | | Shift Technologies, Inc.(a) | | | 5,812,934 | | |
| | 311,850 | | | Vroom, Inc.(a) | | | 12,159,032 | | |
| | | | 41,228,756 | | |
| | | | | Textiles, Apparel & Luxury Goods | | | 0.98 | % | |
| | 295,497 | | | Steven Madden Ltd. | | | 11,010,218 | | |
| Total Consumer Discretionary (Cost $93,498,727) | | | 146,512,967 | | |

The accompanying notes are an integral part of these financial statements.
92
BUFFALO SMALL CAP FUND
SCHEDULE OF INVESTMENTS
MARCH 31, 2021 Continued
Shares or Face Amount | | | | $ Fair Value | |
Consumer Staples | | | 0.78 | % | |
| | | | | Beverages | | | 0.78 | % | |
| | 148,065 | | | MGP Ingredients, Inc. | | | 8,758,045 | | |
| Total Consumer Staples (Cost $4,771,239) | | | 8,758,045 | | |
Finance and Insurance | | | 1.05 | % | |
| | | | | Other Financial Investment Activities | | | 1.05 | % | |
| | 807,815 | | | dMY Technology Group Inc II(a) | | | 11,882,958 | | |
| Total Finance and Insurance (Cost $9,474,574) | | | 11,882,958 | | |
Financials | | | 5.37 | % | |
| | | | | Capital Markets | | | 2.29 | % | |
| | 151,195 | | | Hamilton Lane Inc. — Class A | | | 13,389,829 | | |
| | 351,595 | | | Open Lending Corp.(a) | | | 12,453,495 | | |
| | | | 25,843,324 | | |
| | | | | Consumer Finance | | | 0.80 | % | |
| | 199,000 | | | Green Dot Corp.(a) | | | 9,112,210 | | |
| | | | | Insurance | | | 2.28 | % | |
| | 144,765 | | | eHealth, Inc.(a) | | | 10,528,758 | | |
| | 226,993 | | | Palomar Holdings, Inc.(a) | | | 15,217,611 | | |
| | | | 25,746,369 | | |
| Total Financials (Cost $31,284,516) | | | 60,701,903 | | |
Health Care | | | 26.68 | % | |
| | | | | Biotechnology | | | 12.33 | % | |
| | 992,543 | | | Avid Bioservices, Inc.(a) | | | 18,094,059 | | |
| | 267,979 | | | CareDx, Inc.(a) | | | 18,246,690 | | |
| | 245,177 | | | Castle Biosciences, Inc.(a) | | | 16,784,817 | | |
| | 327,360 | | | Deciphera Pharmaceuticals, Inc.(a) | | | 14,678,822 | | |
| | 172,405 | | | DermTech, Inc.(a) | | | 8,756,450 | | |
| | 411,695 | | | Halozyme Therapeutics, Inc.(a) | | | 17,163,565 | | |
| | 157,350 | | | Ligand Pharmaceuticals, Inc.(a) | | | 23,988,008 | | |
| | 212,470 | | | Natera, Inc.(a) | | | 21,574,204 | | |
| | | | 139,286,615 | | |

The accompanying notes are an integral part of these financial statements.
93
BUFFALO SMALL CAP FUND
SCHEDULE OF INVESTMENTS
MARCH 31, 2021 Continued
Shares or Face Amount | | | | $ Fair Value | |
| | | | | Health Care Equipment & Supplies | | | 5.88 | % | |
| | 116,995 | | | Establishment Labs Holdings, Inc. — ADR(a)(b) | | | 7,315,697 | | |
| | 967,710 | | | GenMark Diagnostics, Inc.(a) | | | 23,128,269 | | |
| | 763,140 | | | OraSure Technologies, Inc.(a) | | | 8,905,844 | | |
| | 1,287,900 | | | SmileDirectClub, Inc.(a) | | | 13,278,249 | | |
| | 130,925 | | | STAAR Surgical Co.(a) | | | 13,800,804 | | |
| | | | 66,428,863 | | |
| | | | | Health Care Providers & Services | | | 1.72 | % | |
| | 325,840 | | | Biodesix, Inc.(a) | | | 6,617,811 | | |
| | 188,148 | | | HealthEquity, Inc.(a) | | | 12,794,064 | | |
| | | | 19,411,875 | | |
| | | | | Health Care Technology | | | 1.29 | % | |
| | 280,574 | | | Phreesia, Inc.(a) | | | 14,617,905 | | |
| | | | | Life Sciences Tools & Services | | | 4.66 | % | |
| | 254,325 | | | Adaptive Biotechnologies Corporation(a) | | | 10,239,124 | | |
| | 250,915 | | | Quanterix Corp.(a) | | | 14,671,000 | | |
| | 464,805 | | | Sotera Health Co.(a) | | | 11,601,533 | | |
| | 213,560 | | | Syneos Health, Inc.(a) | | | 16,198,526 | | |
| | | | 52,710,183 | | |
| | | | | Pharmaceuticals | | | 0.80 | % | |
| | 598,985 | | | Verrica Pharmaceuticals, Inc.(a) | | | 9,074,623 | | |
| Total Health Care (Cost $188,858,539) | | | 301,530,064 | | |
Industrials | | | 21.40 | % | |
| | | | | Air Freight & Logistics | | | 1.57 | % | |
| | 605,355 | | | Air Transport Services Group, Inc.(a) | | | 17,712,687 | | |
| | | | | Building Products | | | 2.96 | % | |
| | 176,920 | | | Advanced Drainage Systems, Inc. | | | 18,291,759 | | |
| | 599,150 | | | PGT Innovations, Inc.(a) | | | 15,128,537 | | |
| | | | 33,420,296 | | |
| | | | | Commercial Services & Supplies | | | 1.67 | % | |
| | 183,105 | | | IAA Inc.(a) | | | 10,096,410 | | |
| | 588,685 | | | KAR Auction Services, Inc.(a) | | | 8,830,275 | | |
| | | | 18,926,685 | | |
| | | | | Construction & Engineering | | | 2.67 | % | |
| | 191,965 | | | MasTec, Inc.(a) | | | 17,987,121 | | |
| | 125,785 | | | NV5 Global, Inc.(a) | | | 12,147,057 | | |
| | | | 30,134,178 | | |

The accompanying notes are an integral part of these financial statements.
94
BUFFALO SMALL CAP FUND
SCHEDULE OF INVESTMENTS
MARCH 31, 2021 Continued
Shares or Face Amount | | | | $ Fair Value | |
| | | | | Electrical Equipment | | | 2.66 | % | |
| | 538,400 | | | Array Technologies, Inc.(a) | | | 16,055,088 | | |
| | 164,370 | | | Vicor Corp.(a) | | | 13,976,381 | | |
| | | | 30,031,469 | | |
| | | | | Machinery | | | 3.99 | % | |
| | 141,680 | | | Hydrofarm Holdings Group, Inc.(a) | | | 8,546,137 | | |
| | 119,870 | | | John Bean Technologies Corp. | | | 15,983,466 | | |
| | 207,305 | | | Kornit Digital Ltd. — ADR(a)(b) | | | 20,548,072 | | |
| | | | 45,077,675 | | |
| | | | | Professional Services | | | 5.14 | % | |
| | 124,710 | | | FTI Consulting, Inc.(a) | | | 17,473,118 | | |
| | 240,588 | | | ICF International, Inc. | | | 21,027,391 | | |
| | 437,915 | | | Upwork, Inc.(a) | | | 19,605,455 | | |
| | | | 58,105,964 | | |
| | | | | Trading Companies & Distributors | | | 0.74 | % | |
| | 49,390 | | | SiteOne Landscape Supply, Inc.(a) | | | 8,432,849 | | |
| Total Industrials (Cost $160,110,676) | | | 241,841,803 | | |
Information Technology | | | 19.43 | % | |
| | | | | Communications Equipment | | | 7.41 | % | |
| | 998,620 | | | ADTRAN, Inc. | | | 16,656,982 | | |
| | 429,005 | | | Calix, Inc.(a) | | | 14,869,313 | | |
| | 504,997 | | | Cambium Networks Corp. — ADR(a)(b) | | | 23,593,460 | | |
| | 194,700 | | | Ciena Corp.(a) | | | 10,653,984 | | |
| | 196,090 | | | Lumentum Holdings, Inc.(a) | | | 17,912,821 | | |
| | | | 83,686,560 | | |
| | | | | Internet Software & Services | | | 1.17 | % | |
| | 1,081,630 | | | Cloudera, Inc.(a) | | | 13,163,437 | | |
| | | | | IT Services | | | 2.33 | % | |
| | 128,700 | | | Endava PLC — ADR(a)(b) | | | 10,899,603 | | |
| | 1,412,150 | | | Paya Holdings, Inc.(a) | | | 15,477,164 | | |
| | | | 26,376,767 | | |
| | | | | Semiconductors & Semiconductor Equipment | | | 2.60 | % | |
| | 468,570 | | | MaxLinear, Inc.(a) | | | 15,968,866 | | |
| | 95,345 | | | Silicon Laboratories, Inc.(a) | | | 13,450,319 | | |
| | | | 29,419,185 | | |

The accompanying notes are an integral part of these financial statements.
95
BUFFALO SMALL CAP FUND
SCHEDULE OF INVESTMENTS
MARCH 31, 2021 Continued
Shares or Face Amount | | | | $ Fair Value | |
| | | | | Software | | | 5.92 | % | |
| | 397,540 | | | 8x8, Inc.(a) | | | 12,896,197 | | |
| | 259,641 | | | Mimecast Ltd. — ADR(a)(b) | | | 10,440,165 | | |
| | 416,300 | | | SVMK, Inc.(a) | | | 7,626,616 | | |
| | 409,625 | | | Tenable Holdings, Inc.(a) | | | 14,822,281 | | |
| | 247,065 | | | Varonis Systems, Inc.(a) | | | 12,684,317 | | |
| | 158,665 | | | Viant Technology, Inc.(a) | | | 8,391,792 | | |
| | | | 66,861,368 | | |
| Total Information Technology (Cost $153,162,604) | | | 219,507,317 | | |
Materials | | | 1.15 | % | |
| | | | | Construction Materials | | | 1.15 | % | |
| | 463,433 | | | Summit Materials, Inc. — Class A(a) | | | 12,985,393 | | |
| Total Materials (Cost $7,412,638) | | | 12,985,393 | | |
| Total Common Stocks (Cost $690,821,658) | | | 1,055,548,567 | | |
REITS | | | 2.32 | % | |
Real Estate | | | 2.32 | % | |
| | | | | Equity Real Estate Investment Trusts (REITs) | | | 2.32 | % | |
| | 169,360 | | | CyrusOne, Inc. | | | 11,469,059 | | |
| | 237,895 | | | QTS Realty Trust, Inc. | | | 14,759,006 | | |
| Total Real Estate (Cost $20,676,749) | | | 26,228,065 | | |
| Total REITS (Cost $20,676,749) | | | 26,228,065 | | |

The accompanying notes are an integral part of these financial statements.
96
BUFFALO SMALL CAP FUND
SCHEDULE OF INVESTMENTS
MARCH 31, 2021 Continued
Shares or Face Amount | | | | $ Fair Value | |
Short Term Investments | | | 5.03 | % | |
Investment Company | | | 5.03 | % | |
| | 56,852,506 | | | Fidelity Investments Money Market Funds — Government Portfolio — Class I — 0.010%(c) | | | 56,852,506 | | |
Total Investment Company | | | 56,852,506 | | |
| Total Short Term Investments (Cost $56,852,506) | | | 56,852,506 | | |
| Total Investments (Cost $768,350,913) | | | 100.77
1,138,629,138 | % | |
Liabilities in Excess of Other Assets | | | (0.77
(8,653,498) | )% | |
Total Net Assets | | | 100.00
1,129,975,640 | % | |
ADR American Depositary Receipt
PLC Public Limited Company
(a) Non Income Producing.
(b) Foreign Issued Security. The total value of these securities amounted to $72,796,996 (6.44% of net assets) at March 31, 2021.
(c) The rate quoted is the annualized seven-day effective yield as of March 31, 2021.
* See Note 1A of the accompanying Notes to Financial Statements regarding valuation of securities.
The Global Industry Classification Standard (GICS) was developed by and/or is the exclusive property of MSCI, Inc. and Standard & Poor's Financial Services LLC ("S&P"). GICS is a service mark of MSCI and S&P and has been licensed for use by U.S. Bancorp Fund Services, LLC.

The accompanying notes are an integral part of these financial statements.
97
STATEMENTS OF ASSETS AND
LIABILITIES
MARCH 31, 2021
| | | Buffalo
Discovery
Fund | | Buffalo
Dividend Focus
Fund | | Buffalo
Early
Stage Growth
Fund | | Buffalo
Flexible Income
Fund | | Buffalo
Growth
Fund | |
ASSETS: | |
Investments in securities, at cost: | | $ | 1,212,726,667 | | | $ | 60,521,757 | | | $ | 90,387,691 | | | $ | 242,654,456 | | | $ | 92,706,876 | | |
Cash denominated in foreign currencies, at cost: | | | — | | | | — | | | | — | | | | — | | | | — | | |
Investments in securities, at value: | | | 1,781,419,106 | | | | 100,939,348 | | | | 137,893,234 | | | | 425,468,993 | | | | 196,954,052 | | |
Cash: | | | — | | | | — | | | | — | | | | — | | | | — | | |
Cash denominated in foreign currency, at value: | | | — | | | | — | | | | — | | | | — | | | | — | | |
Receivables: | |
Investments sold | | | 882,937 | | | | — | | | | — | | | | — | | | | 1,410,376 | | |
Fund shares sold | | | 1,209,958 | | | | 165,262 | | | | 113,600 | | | | 39,148 | | | | 283,755 | | |
Dividends | | | 308,532 | | | | 56,820 | | | | 9,342 | | | | 813,593 | | | | 20,643 | | |
Interest | | | — | | | | 20,635 | | | | — | | | | 91,079 | | | | — | | |
Other assets | | | 46,196 | | | | 15,235 | | | | 107,335 | | | | 16,137 | | | | 14,279 | | |
Total assets | | | 1,783,866,729 | | | | 101,197,300 | | | | 138,123,511 | | | | 426,428,950 | | | | 198,683,105 | | |
LIABILITIES: | |
Payables: | |
Investments purchased | | | — | | | | — | | | | 6,048,980 | | | | — | | | | — | | |
Written options, at value(1) (Note 8) | | | — | | | | — | | | | — | | | | 125,958 | | | | — | | |
Fund shares purchased | | | 2,015,806 | | | | 117,591 | | | | 36,663 | | | | 177,640 | | | | 54,492 | | |
Management fees (Note 3) | | | 1,275,765 | | | | 63,941 | | | | 147,939 | | | | 307,167 | | | | 125,357 | | |
Custodian fees (Note 3) | | | — | | | | — | | | | — | | | | — | | | | — | | |
Accrued shareholder service fees — Investor Class (Note 7) | | | 429,720 | | | | 3,024 | | | | 35,382 | | | | 56,837 | | | | 40,930 | | |
Other payables | | | — | | | | — | | | | — | | | | — | | | | — | | |
Accrued expenses | | | 1,196 | | | | 2,796 | | | | 8,193 | | | | 53,159 | | | | 17,908 | | |
Total liabilities | | | 3,722,487 | | | | 187,352 | | | | 6,277,157 | | | | 720,761 | | | | 238,687 | | |
NET ASSETS | | $ | 1,780,144,242 | | | $ | 101,009,948 | | | $ | 131,846,354 | | | $ | 425,708,189 | | | $ | 198,444,418 | | |
NET ASSETS CONSIST OF: | |
Capital (capital stock and paid-in capital) | | $ | 1,075,388,877 | | | $ | 59,618,859 | | | $ | 74,025,968 | | | $ | 231,749,335 | | | $ | 86,282,117 | | |
Total distributable earnings | | | 704,755,365 | | | | 41,391,089 | | | | 57,820,386 | | | | 193,958,854 | | | | 112,162,301 | | |
NET ASSETS APPLICABLE TO OUTSTANDING SHARES | | $ | 1,780,144,242 | | | $ | 101,009,948 | | | $ | 131,846,354 | | | $ | 425,708,189 | | | $ | 198,444,418 | | |
Net Assets — Investor Class | | $ | 1,442,145,264 | | | $ | 28,605,440 | | | $ | 82,823,642 | | | $ | 277,905,982 | | | $ | 112,398,638 | | |
Outstanding Shares — Investor Class | | | 46,787,261 | | | | 1,234,977 | | | | 3,467,930 | | | | 17,109,043 | | | | 3,617,873 | | |
NET ASSET VALUE PER SHARE — Investor Class | | $ | 30.82 | | | $ | 23.16 | | | $ | 23.88 | | | $ | 16.24 | | | $ | 31.07 | | |
Net Assets — Institutional Class | | $ | 337,998,979 | | | $ | 72,404,508 | | | $ | 49,022,712 | | | $ | 147,802,208 | | | $ | 86,045,780 | | |
Outstanding Shares — Institutional Class | | | 10,932,643 | | | | 3,126,015 | | | | 2,046,385 | | | | 9,102,673 | | | | 2,764,317 | | |
NET ASSET VALUE PER SHARE — Institutional Class | | $ | 30.92 | | | $ | 23.16 | | | $ | 23.96 | | | $ | 16.24 | | | $ | 31.13 | | |
Capital shares, $1.00 par value: | |
Authorized | | | Unlimited | | | | Unlimited | | | | Unlimited | | | | Unlimited | | | | Unlimited | | |
| (1) Written options, premiums received | | | — | | | | — | | | | — | | | | 189,093 | | | | — | | |

The accompanying notes are an integral part of these financial statements.
98
| | | Buffalo
High Yield
Fund | | Buffalo
International
Fund | | Buffalo
Large Cap
Fund | | Buffalo
Mid Cap
Fund | | Buffalo
Small Cap
Fund | |
ASSETS: | |
Investments in securities, at cost: | | $ | 262,265,815 | | | $ | 315,972,579 | | | $ | 48,019,248 | | | $ | 98,437,869 | | | $ | 768,350,913 | | |
Cash denominated in foreign currencies, at cost: | | | — | | | | 19,330 | | | | — | | | | — | | | | — | | |
Investments in securities, at value: | | | 277,774,290 | | | | 541,801,841 | | | | 108,887,335 | | | | 189,304,237 | | | | 1,138,629,138 | | |
Cash: | | | 113,136 | | | | 27,839 | | | | — | | | | — | | | | — | | |
Cash denominated in foreign currency, at value: | | | — | | | | 19,342 | | | | — | | | | — | | | | — | | |
Receivables: | |
Investments sold | | | 24,621 | | | | 1,102,852 | | | | — | | | | 1,457,710 | | | | 574,536 | | |
Fund shares sold | | | 432,678 | | | | 1,312,956 | | | | 208,917 | | | | 87,694 | | | | 3,715,199 | | |
Dividends | | | — | | | | 2,015,347 | | | | 34,803 | | | | 35,773 | | | | 286,701 | | |
Interest | | | 3,045,832 | | | | — | | | | — | | | | — | | | | — | | |
Other assets | | | 26,858 | | | | 25,899 | | | | 13,731 | | | | 16,014 | | | | 55,286 | | |
Total assets | | | 281,417,415 | | | | 546,306,076 | | | | 109,144,786 | | | | 190,901,428 | | | | 1,143,260,860 | | |
LIABILITIES: | |
Payables: | |
Investments purchased | | | 5,297,104 | | | | 19,342 | | | | 235,834 | | | | — | | | | 11,519,643 | | |
Written options, at value(1) (Note 8) | | | — | | | | — | | | | — | | | | — | | | | — | | |
Fund shares purchased | | | 94,616 | | | | 103,759 | | | | 25,015 | | | | 10,629 | | | | 479,074 | | |
Management fees (Note 3) | | | 197,614 | | | | 390,072 | | | | 68,152 | | | | 136,968 | | | | 815,961 | | |
Custodian fees (Note 3) | | | — | | | | 20,544 | | | | — | | | | — | | | | — | | |
Accrued shareholder service fees — Investor Class (Note 7) | | | — | | | | 32,540 | | | | 7,753 | | | | 37,074 | | | | 464,199 | | |
Other payables | | | — | | | | 98,321 | | | | — | | | | — | | | | — | | |
Accrued expenses | | | 2,933 | | | | 2,046 | | | | 1,173 | | | | 13,398 | | | | 6,343 | | |
Total liabilities | | | 5,592,267 | | | | 666,624 | | | | 337,927 | | | | 198,069 | | | | 13,285,220 | | |
NET ASSETS | | $ | 275,825,148 | | | $ | 545,639,452 | | | $ | 108,806,859 | | | $ | 190,703,359 | | | $ | 1,129,975,640 | | |
NET ASSETS CONSIST OF: | |
Capital (capital stock and paid-in capital) | | $ | 253,579,657 | | | $ | 320,071,289 | | | $ | 46,838,641 | | | $ | 87,620,400 | | | $ | 639,919,729 | | |
Total distributable earnings | | | 22,245,491 | | | | 225,568,163 | | | | 61,968,218 | | | | 103,082,959 | | | | 490,055,911 | | |
NET ASSETS APPLICABLE TO OUTSTANDING SHARES | | $ | 275,825,148 | | | $ | 545,639,452 | | | $ | 108,806,859 | | | $ | 190,703,359 | | | $ | 1,129,975,640 | | |
Net Assets — Investor Class | | $ | 50,109,780 | | | $ | 260,044,356 | | | $ | 37,412,976 | | | $ | 107,060,870 | | | $ | 801,388,062 | | |
Outstanding Shares — Investor Class | | | 4,238,242 | | | | 12,677,105 | | | | 809,327 | | | | 5,303,802 | | | | 36,196,592 | | |
NET ASSET VALUE PER SHARE — Investor Class | | $ | 11.82 | | | $ | 20.51 | | | $ | 46.23 | | | $ | 20.19 | | | $ | 22.14 | | |
Net Assets — Institutional Class | | $ | 225,715,367 | | | $ | 285,595,096 | | | $ | 71,393,883 | | | $ | 83,642,489 | | | $ | 328,587,578 | | |
Outstanding Shares — Institutional Class | | | 19,105,646 | | | | 13,912,987 | | | | 1,541,840 | | | | 4,131,994 | | | | 14,798,850 | | |
NET ASSET VALUE PER SHARE — Institutional Class | | $ | 11.81 | | | $ | 20.53 | | | $ | 46.30 | | | $ | 20.24 | | | $ | 22.20 | | |
Capital shares, $1.00 par value: | |
Authorized | | | Unlimited | | | | Unlimited | | | | Unlimited | | | | Unlimited | | | | Unlimited | | |
| (1) Written options, premiums received | | | — | | | | — | | | | — | | | | — | | | | — | | |

99
STATEMENTS OF OPERATIONS
FOR THE YEAR ENDED MARCH 31, 2021
| | | Buffalo
Discovery
Fund | | Buffalo
Dividend Focus
Fund | | Buffalo
Early
Stage Growth
Fund | | Buffalo
Flexible Income
Fund | | Buffalo
Growth
Fund | |
INVESTMENT INCOME: | |
Interest | | | — | | | $ | 82,649 | | | | — | | | $ | 426,590 | | | | — | | |
Dividends from securities | | $ | 5,924,316 | | | | 1,225,671 | | | $ | 259,780 | | | | 12,625,945 | | | $ | 1,355,544 | | |
Foreign tax withheld | | | — | | | | (345 | ) | | | (1,417 | ) | | | (12,891 | ) | | | (1,168 | ) | |
Total investment income | | | 5,924,316 | | | | 1,307,975 | | | | 258,363 | | | | 13,039,644 | | | | 1,354,376 | | |
EXPENSES: | |
Management fees (Note 3) | | | 14,069,595 | | | | 624,307 | | | | 1,314,222 | | | | 3,634,059 | | | | 1,393,340 | | |
Shareholder Service Fees — Investor Class (Note 7) | | | 2,080,950 | | | | 40,881 | | | | 97,160 | | | | 426,383 | | | | 163,212 | | |
Registration fees | | | 71,629 | | | | 34,151 | | | | 45,804 | | | | 37,567 | | | | 36,201 | | |
Custody fees | | | — | | | | — | | | | — | | | | — | | | | — | | |
Other expenses | | | 28,784 | | | | 1,672 | | | | 1,755 | | | | 9,111 | | | | 3,457 | | |
Total expenses | | | 16,250,958 | | | | 701,011 | | | | 1,458,941 | | | | 4,107,120 | | | | 1,596,210 | | |
Net investment income (loss) | | | (10,326,642 | ) | | | 606,964 | | | | (1,200,578 | ) | | | 8,932,524 | | | | (241,834 | ) | |
NET REALIZED AND UNREALIZED GAIN (LOSS): | |
Net realized gain (loss) from: | |
Investment transactions | | | 322,324,905 | | | | 2,703,910 | | | | 24,524,120 | | | | 11,369,753 | | | | 20,363,885 | | |
Options written (Note 8) | | | — | | | | — | | | | — | | | | 1,396,677 | | | | — | | |
Net unrealized appreciation/depreciation during the year on: | |
Investments | | | 509,250,181 | | | | 31,172,434 | | | | 46,689,428 | | | | 124,694,287 | | | | 55,554,120 | | |
Options written (Note 8) | | | — | | | | — | | | | — | | | | 63,136 | | | | — | | |
Net realized and unrealized gain (loss) | | | 831,575,086 | | | | 33,876,344 | | | | 71,213,548 | | | | 137,523,853 | | | | 75,918,005 | | |
Net decrease in net assets resulting from operations | | $ | 821,248,444 | | | $ | 34,483,308 | | | $ | 70,012,970 | | | $ | 146,456,377 | | | $ | 75,676,171 | | |

The accompanying notes are an integral part of these financial statements.
100
| | | Buffalo
High Yield
Fund | | Buffalo
International
Fund | | Buffalo
Large Cap
Fund | | Buffalo
Mid Cap
Fund | | Buffalo
Small Cap
Fund | |
INVESTMENT INCOME: | |
Interest | | $ | 12,627,878 | | | | — | | | | — | | | | — | | | | — | | |
Dividends from securities | | | 244,414 | | | $ | 6,830,190 | | | $ | 773,291 | | | $ | 663,096 | | | $ | 1,467,766 | | |
Foreign tax withheld | | | — | | | | (783,546 | ) | | | (6,852 | ) | | | — | | | | — | | |
Total investment income | | | 12,872,292 | | | | 6,046,644 | | | | 766,439 | | | | 663,096 | | | | 1,467,766 | | |
EXPENSES: | |
Management fees (Note 3) | | | 2,033,536 | | | | 4,086,300 | | | | 738,054 | | | | 1,432,127 | | | | 6,544,601 | | |
Shareholder Service Fees — Investor Class (Note 7) | | | 73,017 | | | | 364,338 | | | | 53,494 | | | | 148,659 | | | | 870,904 | | |
Registration fees | | | 36,288 | | | | 49,170 | | | | 35,367 | | | | 39,275 | | | | 40,293 | | |
Custody fees | | | — | | | | 104,852 | | | | — | | | | — | | | | — | | |
Other expenses | | | 4,756 | | | | 7,985 | | | | 2,129 | | | | 3,291 | | | | 9,448 | | |
Total expenses | | | 2,147,597 | | | | 4,612,645 | | | | 829,044 | | | | 1,623,352 | | | | 7,465,246 | | |
Net investment income (loss) | | | 10,724,695 | | | | 1,433,999 | | | | (62,605 | ) | | | (960,256 | ) | | | (5,997,480 | ) | |
NET REALIZED AND UNREALIZED GAIN (LOSS): | |
Net realized gain (loss) from: | |
Investment transactions | | | 6,896,478 | | | | 1,772,922 | | | | 1,438,010 | | | | 26,406,775 | | | | 219,482,041 | | |
Options written (Note 8) | | | — | | | | — | | | | — | | | | — | | | | — | | |
Net unrealized appreciation/depreciation during the year on: | |
Investments | | | 36,810,629 | | | | 185,957,714 | | | | 39,787,915 | | | | 57,028,018 | | | | 308,472,234 | | |
Options written (Note 8) | | | — | | | | — | | | | — | | | | — | | | | — | | |
Net realized and unrealized gain (loss) | | | 43,707,107 | | | | 187,730,636 | | | | 41,225,925 | | | | 83,434,793 | | | | 527,954,275 | | |
Net decrease in net assets resulting from operations | | $ | 54,431,802 | | | $ | 189,164,635 | | | $ | 41,163,320 | | | $ | 82,474,537 | | | $ | 521,956,795 | | |

101
STATEMENTS OF CHANGES IN
NET ASSETS
| | | Buffalo
Discovery Fund | | Buffalo
Dividend Focus Fund | | Buffalo
Early Stage Growth Fund | |
| | | Year Ended
March 31, 2021 | | Year Ended
March 31, 2020 | | Year Ended
March 31, 2021 | | Year Ended
March 31, 2020 | | Year Ended
March 31, 2021 | | Year Ended
March 31, 2020 | |
OPERATIONS: | |
Net investment income (loss) | | $ | (10,326,642 | ) | | $ | (5,147,410 | ) | | $ | 606,964 | | | $ | 682,638 | | | $ | (1,200,578 | ) | | $ | (898,309 | ) | |
Net realized gain on investment transactions | | | 322,324,905 | | | | 239,791,313 | | | | 2,703,910 | | | | (1,235,429 | ) | | | 24,524,120 | | | | 4,967,396 | | |
Net unrealized appreciation/depreciation during the year on investments and translation of
assets and liabilities in foreign currencies | | | 509,250,181 | | | | (372,840,225 | ) | | | 31,172,434 | | | | (6,938,944 | ) | | | 46,689,428 | | | | (14,748,717 | ) | |
Net increase (decrease) in net assets resulting from operations | | | 821,248,444 | | | | (138,196,322 | ) | | | 34,483,308 | | | | (7,491,735 | ) | | | 70,012,970 | | | | (10,679,630 | ) | |
DISTRIBUTIONS TO SHAREHOLDERS: | |
Distributable earnings | | | (135,340,074 | ) | | | (236,305,302 | ) | | | (603,921 | ) | | | (708,148 | ) | | | (11,977,369 | ) | | | (4,253,755 | ) | |
Paid in Capital | | | — | | | | — | | | | — | | | | (42,916 | ) | | | — | | | | — | | |
Total distributions | | | (135,340,074 | ) | | | (236,305,302 | ) | | | (603,921 | ) | | | (751,064 | ) | | | (11,977,369 | ) | | | (4,253,755 | ) | |
CAPITAL SHARE TRANSACTIONS: | |
Shares sold | |
Investor Class | | | 149,611,384 | | | | 206,300,631 | | | | 2,831,032 | | | | 6,815,282 | | | | 12,452,018 | | | | 6,245,478 | | |
Institutional Class | | | 96,646,218 | | | | 322,701,272 | | | | 17,170,546 | | | | 52,078,530 | | | | 6,151,289 | | | | 31,935,871 | | |
Reinvested dividends and distributions | |
Investor Class | | | 110,352,380 | | | | 197,048,623 | | | | 161,501 | | | | 414,171 | | | | 7,394,722 | | | | 2,727,174 | | |
Institutional Class | | | 21,348,611 | | | | 32,726,500 | | | | 421,740 | | | | 312,479 | | | | 4,253,752 | | | | 1,395,082 | | |
Shares Issued | | | 377,958,593 | | | | 758,777,026 | | | | 20,584,819 | | | | 59,620,462 | | | | 30,251,781 | | | | 42,303,605 | | |
Redemptions | |
Investor Class | | | (530,764,960 | ) | | | (716,838,812 | ) | | | (9,627,763 | ) | | | (40,365,885 | ) | | | (17,078,266 | ) | | | (42,636,704 | ) | |
Institutional Class | | | (90,624,869 | ) | | | (74,031,084 | ) | | | (8,534,071 | ) | | | (4,602,812 | ) | | | (5,097,713 | ) | | | (3,031,053 | ) | |
Shares repurchased | | | (621,389,829 | ) | | | (790,869,896 | ) | | | (18,161,834 | ) | | | (44,968,697 | ) | | | (22,175,979 | ) | | | (45,667,757 | ) | |
Net increase (decrease) from capital share transactions | | | (243,431,236 | ) | | | (32,092,870 | ) | | | 2,422,985 | | | | 14,651,765 | | | | 8,075,802 | | | | (3,364,152 | ) | |
Total increase (decrease) in net assets | | | 442,477,134 | | | | (406,594,494 | ) | | | 36,302,372 | | | | 6,408,966 | | | | 66,111,403 | | | | (18,297,537 | ) | |
NET ASSETS: | |
Beginning of period | | | 1,337,667,108 | | | | 1,744,261,602 | | | | 64,707,576 | | | | 58,298,610 | | | | 65,734,951 | | | | 84,032,488 | | |
End of period | | $ | 1,780,144,242 | | | $ | 1,337,667,108 | | | $ | 101,009,948 | | | $ | 64,707,576 | | | $ | 131,846,354 | | | $ | 65,734,951 | | |
Fund share transactions: | |
Shares issued | |
Investor Class | | | 5,500,653 | | | | 8,114,121 | | | | 141,111 | | | | 383,278 | | | | 567,291 | | | | 395,510 | | |
Institutional Class | | | 3,308,615 | | | | 12,059,154 | | | | 832,698 | | | | 2,957,318 | | | | 273,406 | | | | 1,950,037 | | |
| | | | 8,809,268 | | | | 20,173,275 | | | | 973,809 | | | | 3,340,596 | | | | 840,697 | | | | 2,345,547 | | |
Reinvested dividends and distributions | |
Investor Class | | | 3,704,344 | | | | 8,210,360 | | | | 7,919 | | | | 24,235 | | | | 341,558 | | | | 164,090 | | |
Institutional Class | | | 714,717 | | | | 1,362,469 | | | | 20,360 | | | | 18,699 | | | | 195,935 | | | | 83,839 | | |
| | | | 4,419,061 | | | | 9,572,829 | | | | 28,279 | | | | 42,934 | | | | 537,493 | | | | 247,929 | | |
Shares Issued | | | 13,228,329 | | | | 29,746,104 | | | | 1,002,088 | | | | 3,383,530 | | | | 1,378,190 | | | | 2,593,476 | | |
Shares repurchased | |
Investor Class | | | (19,361,212 | ) | | | (28,341,179 | ) | | | (491,618 | ) | | | (2,332,103 | ) | | | (852,378 | ) | | | (2,639,316 | ) | |
Institutional Class | | | (3,408,874 | ) | | | (3,103,438 | ) | | | (435,000 | ) | | | (268,060 | ) | | | (269,189 | ) | | | (187,644 | ) | |
Total Shares Repurchased | | | (22,770,086 | ) | | | (31,444,617 | ) | | | (926,618 | ) | | | (2,600,163 | ) | | | (1,121,567 | ) | | | (2,826,960 | ) | |
Net increase (decrease) in fund shares | | | (9,541,757 | ) | | | (1,698,513 | ) | | | 75,470 | | | | 783,367 | | | | 256,623 | | | | (233,484 | ) | |

The accompanying notes are an integral part of these financial statements.
102
| | | Buffalo
Flexible Income Fund | | Buffalo
Growth Fund | |
| | | Year Ended
March 31, 2021 | | Year Ended
March 31, 2020 | | Year Ended
March 31, 2021 | | Year Ended
March 31, 2020 | |
OPERATIONS: | |
Net investment income (loss) | | $ | 8,932,524 | | | $ | 12,513,985 | | | $ | (241,834 | ) | | $ | 276,759 | | |
Net realized gain on investment transactions | | | 12,766,430 | | | | 9,291,793 | | | | 20,363,885 | | | | 17,594,269 | | |
Net unrealized appreciation/depreciation during the year on investments and translation of
assets and liabilities in foreign currencies | | | 124,757,423 | | | | (125,026,078 | ) | | | 55,554,120 | | | | (22,605,705 | ) | |
Net increase (decrease) in net assets resulting from operations | | | 146,456,377 | | | | (103,220,300 | ) | | | 75,676,171 | | | | (4,734,677 | ) | |
DISTRIBUTIONS TO SHAREHOLDERS: | |
Distributable earnings | | | (14,924,358 | ) | | | (16,305,324 | ) | | | (9,555,575 | ) | | | (22,442,337 | ) | |
Paid in Capital | | | — | | | | — | | | | — | | | | — | | |
Total distributions | | | (14,924,358 | ) | | | (16,305,324 | ) | | | (9,555,575 | ) | | | (22,442,337 | ) | |
CAPITAL SHARE TRANSACTIONS: | |
Shares sold | |
Investor Class | | | 5,998,019 | | | | 8,468,198 | | | | 8,115,877 | | | | 6,138,725 | | |
Institutional Class | | | 6,056,964 | | | | 192,711,625 | | | | 8,440,623 | | | | 72,785,092 | | |
Reinvested dividends and distributions | |
Investor Class | | | 9,615,886 | | | | 11,940,056 | | | | 5,431,116 | | | | 13,954,602 | | |
Institutional Class | | | 4,671,983 | | | | 3,679,342 | | | | 4,021,245 | | | | 8,131,987 | | |
Shares Issued | | | 26,342,852 | | | | 216,799,221 | | | | 26,008,861 | | | | 101,010,406 | | |
Redemptions | |
Investor Class | | | (98,594,572 | ) | | | (291,492,747 | ) | | | (28,516,879 | ) | | | (94,869,871 | ) | |
Institutional Class | | | (40,830,504 | ) | | | (23,871,195 | ) | | | (11,526,887 | ) | | | (7,174,880 | ) | |
Shares repurchased | | | (139,425,076 | ) | | | (315,363,942 | ) | | | (40,043,766 | ) | | | (102,044,751 | ) | |
Net increase (decrease) from capital share transactions | | | (113,082,224 | ) | | | (98,564,721 | ) | | | (14,034,905 | ) | | | (1,034,345 | ) | |
Total increase (decrease) in net assets | | | 18,449,795 | | | | (218,090,345 | ) | | | 52,085,691 | | | | (28,211,359 | ) | |
NET ASSETS: | |
Beginning of period | | | 407,258,394 | | | | 625,348,739 | | | | 146,358,727 | | | | 174,570,086 | | |
End of period | | $ | 425,708,189 | | | $ | 407,258,394 | | | $ | 198,444,418 | | | $ | 146,358,727 | | |
Fund share transactions: | |
Shares issued | |
Investor Class | | | 416,984 | | | | 559,738 | | | | 284,229 | | | | 239,496 | | |
Institutional Class | | | 407,263 | | | | 12,609,730 | | | | 300,559 | | | | 2,703,466 | | |
| | | | 824,247 | | | | 13,169,468 | | | | 584,788 | | | | 2,942,962 | | |
Reinvested dividends and distributions | |
Investor Class | | | 656,101 | | | | 793,912 | | | | 179,600 | | | | 560,201 | | |
Institutional Class | | | 318,733 | | | | 245,232 | | | | 132,758 | | | | 326,455 | | |
| | | | 974,834 | | | | 1,039,144 | | | | 312,358 | | | | 886,656 | | |
Shares Issued | | | 1,799,081 | | | | 14,208,612 | | | | 897,146 | | | | 3,829,618 | | |
Shares repurchased | |
Investor Class | | | (6,880,691 | ) | | | (19,385,727 | ) | | | (1,000,266 | ) | | | (3,600,122 | ) | |
Institutional Class | | | (2,845,684 | ) | | | (1,632,600 | ) | | | (419,001 | ) | | | (279,922 | ) | |
Total Shares Repurchased | | | (9,726,375 | ) | | | (21,018,327 | ) | | | (1,419,267 | ) | | | (3,880,044 | ) | |
Net increase (decrease) in fund shares | | | (7,927,294 | ) | | | (6,809,715 | ) | | | (522,121 | ) | | | (50,426 | ) | |

103
STATEMENTS OF CHANGES IN
NET ASSETS
| | | Buffalo
High Yield Fund | | Buffalo
International Fund | | Buffalo
Large Cap Fund | |
| | | Year Ended
March 31, 2021 | | Year Ended
March 31, 2020 | | Year Ended
March 31, 2021 | | Year Ended
March 31, 2020 | | Year Ended
March 31, 2021 | | Year Ended
March 31, 2020 | |
OPERATIONS: | |
Net investment income (loss) | | $ | 10,724,695 | | | $ | 8,734,875 | | | $ | 1,433,999 | | | $ | 2,552,346 | | | $ | (62,605 | ) | | $ | 226,506 | | |
Net realized gain on investment transactions | | | 6,896,478 | | | | 545,930 | | | | 1,772,922 | | | | 46,628 | | | | 1,438,010 | | | | 116,976 | | |
Net unrealized appreciation/depreciation during the year on investments and translation of
assets and liabilities in foreign currencies | | | 36,810,629 | | | | (24,152,200 | ) | | | 185,957,714 | | | | (34,252,460 | ) | | | 39,787,915 | | | | (3,183,801 | ) | |
Net increase (decrease) in net assets resulting from operations | | | 54,431,802 | | | | (14,871,395 | ) | | | 189,164,635 | | | | (31,653,486 | ) | | | 41,163,320 | | | | (2,840,319 | ) | |
DISTRIBUTIONS TO SHAREHOLDERS: | |
Distributable earnings | | | (10,794,072 | ) | | | (8,705,714 | ) | | | (1,810,577 | ) | | | (2,604,701 | ) | | | (226,492 | ) | | | (1,260,297 | ) | |
Paid in Capital | | | — | | | | — | | | | — | | | | — | | | | — | | | | — | | |
Total distributions | | | (10,794,072 | ) | | | (8,705,714 | ) | | | (1,810,577 | ) | | | (2,604,701 | ) | | | (226,492 | ) | | | (1,260,297 | ) | |
CAPITAL SHARE TRANSACTIONS: | |
Shares sold | |
Investor Class | | | 7,659,688 | | | | 16,651,157 | | | | 76,610,305 | | | | 89,387,217 | | | | 4,685,305 | | | | 5,577,768 | | |
Institutional Class | | | 58,665,709 | | | | 181,490,562 | | | | 68,195,319 | | | | 261,186,092 | | | | 9,245,163 | | | | 54,591,180 | | |
Reinvested dividends and distributions | |
Investor Class | | | 2,076,991 | | | | 3,844,464 | | | | 705,246 | | | | 1,202,548 | | | | 46,663 | | | | 472,165 | | |
Institutional Class | | | 7,577,783 | | | | 4,078,662 | | | | 1,027,962 | | | | 1,214,800 | | | | 171,050 | | | | 739,158 | | |
Shares Issued | | | 75,980,171 | | | | 206,064,845 | | | | 146,538,832 | | | | 352,990,657 | | | | 14,148,181 | | | | 61,380,271 | | |
Redemptions | |
Investor Class | | | (15,115,408 | ) | | | (162,179,247 | ) | | | (97,166,871 | ) | | | (244,307,743 | ) | | | (10,383,103 | ) | | | (48,314,639 | ) | |
Institutional Class | | | (16,448,241 | ) | | | (23,988,189 | ) | | | (51,180,047 | ) | | | (55,210,922 | ) | | | (9,011,030 | ) | | | (4,851,305 | ) | |
Shares repurchased | | | (31,563,649 | ) | | | (186,167,436 | ) | | | (148,346,918 | ) | | | (299,518,665 | ) | | | (19,394,133 | ) | | | (53,165,944 | ) | |
Net increase (decrease) from capital share transactions | | | 44,416,522 | | | | 19,897,409 | | | | (1,808,086 | ) | | | 53,471,992 | | | | 5,245,952 | | | | 8,214,327 | | |
Total increase (decrease) in net assets | | | 88,054,252 | | | | (3,679,700 | ) | | | 185,545,972 | | | | 19,213,805 | | | | 35,690,876 | | | | 4,113,711 | | |
NET ASSETS: | |
Beginning of period | | | 187,770,896 | | | | 191,450,596 | | | | 360,093,480 | | | | 340,879,675 | | | | 73,115,983 | | | | 69,002,272 | | |
End of period | | $ | 275,825,148 | | | $ | 187,770,896 | | | $ | 545,639,452 | | | $ | 360,093,480 | | | $ | 108,806,859 | | | $ | 73,115,983 | | |
Fund share transactions: | |
Shares issued | |
Investor Class | | | 685,046 | | | | 1,516,951 | | | | 4,425,494 | | | | 6,008,278 | | | | 115,539 | | | | 172,360 | | |
Institutional Class | | | 5,312,364 | | | | 16,458,266 | | | | 3,747,339 | | | | 16,486,606 | | | | 227,459 | | | | 1,655,235 | | |
| | | | 5,997,410 | | | | 17,975,217 | | | | 8,172,833 | | | | 22,494,884 | | | | 342,998 | | | | 1,827,595 | | |
Reinvested dividends and distributions | |
Investor Class | | | 187,338 | | | | 350,903 | | | | 35,368 | | | | 71,966 | | | | 1,051 | | | | 13,678 | | |
Institutional Class | | | 680,140 | | | | 372,852 | | | | 51,553 | | | | 72,699 | | | | 3,848 | | | | 21,394 | | |
| | | | 867,478 | | | | 723,755 | | | | 86,921 | | | | 144,665 | | | | 4,899 | | | | 35,072 | | |
Shares Issued | | | 6,864,888 | | | | 18,698,972 | | | | 8,259,754 | | | | 22,639,549 | | | | 347,897 | | | | 1,862,667 | | |
Shares repurchased | |
Investor Class | | | (1,370,951 | ) | | | (14,764,965 | ) | | | (5,354,527 | ) | | | (15,607,068 | ) | | | (251,260 | ) | | | (1,466,945 | ) | |
Institutional Class | | | (1,483,211 | ) | | | (2,234,765 | ) | | | (2,896,307 | ) | | | (3,548,902 | ) | | | (219,968 | ) | | | (146,127 | ) | |
Total Shares Repurchased | | | (2,854,162 | ) | | | (16,999,730 | ) | | | (8,250,834 | ) | | | (19,155,970 | ) | | | (471,228 | ) | | | (1,613,072 | ) | |
Net increase (decrease) in fund shares | | | 4,010,726 | | | | 1,699,241 | | | | 8,920 | | | | 3,483,579 | | | | (123,331 | ) | | | 249,595 | | |

The accompanying notes are an integral part of these financial statements.
104
| | | Buffalo
Mid Cap Fund | | Buffalo
Small Cap Fund | |
| | | Year Ended
March 31, 2021 | | Year Ended
March 31, 2020 | | Year Ended
March 31, 2021 | | Year Ended
March 31, 2020 | |
OPERATIONS: | |
Net investment income (loss) | | $ | (960,256 | ) | | $ | (634,332 | ) | | $ | (5,997,480 | ) | | $ | (3,460,299 | ) | |
Net realized gain on investment transactions | | | 26,406,775 | | | | 11,862,668 | | | | 219,482,041 | | | | 22,298,931 | | |
Net unrealized appreciation/depreciation during the year on investments and translation of
assets and liabilities in foreign currencies | | | 57,028,018 | | | | (15,719,274 | ) | | | 308,472,234 | | | | (51,997,098 | ) | |
Net increase (decrease) in net assets resulting from operations | | | 82,474,537 | | | | (4,490,938 | ) | | | 521,956,795 | | | | (33,158,466 | ) | |
DISTRIBUTIONS TO SHAREHOLDERS: | |
Distributable earnings | | | (12,015,139 | ) | | | (13,465,597 | ) | | | (76,101,843 | ) | | | (46,863,860 | ) | |
Paid in Capital | | | — | | | | — | | | | — | | | | — | | |
Total distributions | | | (12,015,139 | ) | | | (13,465,597 | ) | | | (76,101,843 | ) | | | (46,863,860 | ) | |
CAPITAL SHARE TRANSACTIONS: | |
Shares sold | |
Investor Class | | | 3,660,618 | | | | 46,767,088 | | | | 177,161,629 | | | | 26,737,339 | | |
Institutional Class | | | 8,501,585 | | | | 63,911,053 | | | | 157,633,634 | | | | 120,044,991 | | |
Reinvested dividends and distributions | |
Investor Class | | | 6,861,738 | | | | 8,843,404 | | | | 58,109,075 | | | | 37,817,344 | | |
Institutional Class | | | 5,016,695 | | | | 4,461,718 | | | | 16,517,003 | | | | 8,235,789 | | |
Shares Issued | | | 24,040,636 | | | | 123,983,263 | | | | 409,421,341 | | | | 192,835,463 | | |
Redemptions | |
Investor Class | | | (31,736,812 | ) | | | (97,399,541 | ) | | | (117,827,412 | ) | | | (181,346,811 | ) | |
Institutional Class | | | (9,413,314 | ) | | | (6,535,831 | ) | | | (40,372,895 | ) | | | (8,976,585 | ) | |
Shares repurchased | | | (41,150,126 | ) | | | (103,935,372 | ) | | | (158,200,307 | ) | | | (190,323,396 | ) | |
Net increase (decrease) from capital share transactions | | | (17,109,490 | ) | | | 20,047,891 | | | | 251,221,034 | | | | 2,512,067 | | |
Total increase (decrease) in net assets | | | 53,349,908 | | | | 2,091,356 | | | | 697,075,986 | | | | (77,510,259 | ) | |
NET ASSETS: | |
Beginning of period | | | 137,353,451 | | | | 135,262,095 | | | | 432,899,654 | | | | 510,409,913 | | |
End of period | | $ | 190,703,359 | | | $ | 137,353,451 | | | $ | 1,129,975,640 | | | $ | 432,899,654 | | |
Fund share transactions: | |
Shares issued | |
Investor Class | | | 214,506 | | | | 3,071,189 | | | | 8,586,112 | | | | 1,964,337 | | |
Institutional Class | | | 483,763 | | | | 4,082,600 | | | | 7,457,256 | | | | 8,772,669 | | |
| | | | 698,269 | | | | 7,153,789 | | | | 16,043,368 | | | | 10,737,006 | | |
Reinvested dividends and distributions | |
Investor Class | | | 360,385 | | | | 581,420 | | | | 2,816,727 | | | | 2,782,733 | | |
Institutional Class | | | 262,792 | | | | 293,149 | | | | 798,695 | | | | 605,573 | | |
| | | | 623,177 | | | | 874,569 | | | | 3,615,422 | | | | 3,388,306 | | |
Shares Issued | | | 1,321,446 | | | | 8,028,358 | | | | 19,658,790 | | | | 14,125,312 | | |
Shares repurchased | |
Investor Class | | | (1,880,452 | ) | | | (6,358,182 | ) | | | (6,078,091 | ) | | | (13,476,585 | ) | |
Institutional Class | | | (553,172 | ) | | | (437,136 | ) | | | (2,137,290 | ) | | | (698,052 | ) | |
Total Shares Repurchased | | | (2,433,624 | ) | | | (6,795,318 | ) | | | (8,215,381 | ) | | | (14,174,637 | ) | |
Net increase (decrease) in fund shares | | | (1,112,178 | ) | | | 1,233,040 | | | | 11,443,409 | | | | (49,325 | ) | |

105
FINANCIAL HIGHLIGHTS
BUFFALO DISCOVERY FUND INVESTOR CLASS
The following tables are intended to help you understand the Fund's financial performance for the periods shown. Certain information reflects financial results for a single Fund share. Total returns in the table represent the rate that an investor would have earned (or lost) on an investment in the Fund. Total returns assume reinvestment of all dividends and distributions. Total returns do not reflect payment of sales charges, if any, and are not annualized for periods of less than one year.
| | | Years Ended March 31, | |
Condensed data for a share of capital stock
outstanding throughout the period. | | 2021 | | 2020 | | 2019 | | 2018 | | 2017 | |
Net asset value, beginning of period | | $ | 19.88 | | | $ | 25.29 | | | $ | 24.52 | | | $ | 21.86 | | | $ | 19.30 | | |
Income from investment operations: | |
Net investment loss | | | (0.18 | )(1) | | | (0.06 | ) | | | (0.06 | ) | | | (0.04 | ) | | | (0.02 | ) | |
Net gains (losses) on securities (both realized and unrealized) | | | 13.51 | | | | (1.76 | ) | | | 2.31 | | | | 3.82 | | | | 3.10 | | |
Total from investment operations | | | 13.33 | | | | (1.82 | ) | | | 2.25 | | | | 3.78 | | | | 3.08 | | |
Less distributions: | |
Distributions from capital gains | | | (2.39 | ) | | | (3.59 | ) | | | (1.48 | ) | | | (1.12 | ) | | | (0.52 | ) | |
Total distributions | | | (2.39 | ) | | | (3.59 | ) | | | (1.48 | ) | | | (1.12 | ) | | | (0.52 | ) | |
Paid-in capital from redemption fees(2) | | | — | | | | — | | | | — | | | | — | | | | — | (3) | |
Net asset value, end of period | | $ | 30.82 | | | $ | 19.88 | | | $ | 25.29 | | | $ | 24.52 | | | $ | 21.86 | | |
Total return | | | 67.49 | % | | | (9.64 | %) | | | 10.34 | % | | | 17.35 | % | | | 16.07 | % | |
Ratios/Supplemental Data | |
Net assets, end of period (in thousands) | | $ | 1,442,145 | | | $ | 1,132,237 | | | $ | 1,744,262 | | | $ | 1,896,950 | | | $ | 1,254,238 | | |
Ratio of expenses to average net assets | | | 1.01 | % | | | 1.01 | % | | | 1.01 | % | | | 1.01 | % | | | 1.01 | % | |
Ratio of net investment income (loss) to average net assets | | | (0.65 | %) | | | (0.30 | %) | | | (0.21 | %) | | | (0.20 | %) | | | (0.11 | %) | |
Portfolio turnover rate | | | 84 | % | | | 123 | % | | | 77 | % | | | 42 | % | | | 51 | % | |
(1) Per share amounts have been calculated using the average shares method.
(2) Effective December 1, 2016, the Board of Trustees approved the elimination of redemption fees on shares of the Funds.
(3) Less than $0.01 per share.

106
FINANCIAL HIGHLIGHTS
BUFFALO DISCOVERY FUND INSTITUTIONAL CLASS
The following tables are intended to help you understand the Fund's financial performance for the periods shown. Certain information reflects financial results for a single Fund share. Total returns in the table represent the rate that an investor would have earned (or lost) on an investment in the Fund. Total returns assume reinvestment of all dividends and distributions. Total returns do not reflect payment of sales charges, if any, and are not annualized for periods of less than one year.
Condensed data for a share of capital stock
outstanding throughout the period. | | For the Year Ended
March 31, 2021 | | For the period
July 1, 2019*
through
March 31, 2020 | |
Net asset value, beginning of period | | $ | 19.91 | | | $ | 27.10 | | |
Income from investment operations: | |
Net investment loss | | | (0.14 | )(1) | | | (0.04 | ) | |
Net gains (losses) on securities (both realized and unrealized) | | | 13.54 | | | | (3.56 | ) | |
Total from investment operations | | | 13.40 | | | | (3.60 | ) | |
Less distributions: | |
Distributions from capital gains | | | (2.39 | ) | | | (3.59 | ) | |
Total distributions | | | (2.39 | ) | | | (3.59 | ) | |
Net asset value, end of period | | $ | 30.92 | | | $ | 19.91 | | |
Total return** | | | 67.75 | % | | | (15.55 | %)(2) | |
Ratios/Supplemental Data | |
Net assets, end of period (in thousands) | | $ | 337,999 | | | $ | 205,430 | | |
Ratio of expenses to average net assets*** | | | 0.86 | % | | | 0.86 | % | |
Ratio of net investment income (loss) to average net assets*** | | | (0.50 | %) | | | (0.25 | %) | |
Portfolio turnover rate** | | | 84 | % | | | 123 | % | |
* Inception date
** Not annualized for periods less than one year.
*** Annualized for periods less than one year.
(1) Per share amounts have been calculated using the average shares method.
(2) The return listed is the non-annualized return for the Institutional Class since inception date.

107
FINANCIAL HIGHLIGHTS
BUFFALO DIVIDEND FOCUS FUND INVESTOR CLASS
The following tables are intended to help you understand the Fund's financial performance for the periods shown. Certain information reflects financial results for a single Fund share. Total returns in the table represent the rate that an investor would have earned (or lost) on an investment in the Fund. Total returns assume reinvestment of all dividends and distributions. Total returns do not reflect payment of sales charges, if any, and are not annualized for periods of less than one year.
| | | Years Ended March 31, | |
Condensed data for a share of capital stock
outstanding throughout the period. | | 2021 | | 2020 | | 2019 | | 2018 | | 2017 | |
Net asset value, beginning of period | | $ | 15.10 | | | $ | 16.65 | | | $ | 16.28 | | | $ | 15.32 | | | $ | 13.20 | | |
Income from investment operations: | |
Net investment gain | | | 0.12 | (1) | | | 0.44 | | | | 0.25 | | | | 0.19 | | | | 0.18 | | |
Net gains (losses) on securities (both realized and unrealized) | | | 8.06 | | | | (1.81 | ) | | | 0.91 | | | | 1.11 | | | | 2.22 | | |
Total from investment operations | | | 8.18 | | | | (1.37 | ) | | | 1.16 | | | | 1.30 | | | | 2.40 | | |
Less distributions: | |
Distributions from investment Income | | | (0.12 | ) | | | (0.17 | ) | | | (0.25 | ) | | | (0.19 | ) | | | (0.18 | ) | |
Distributions from capital gains | | | — | | | | — | | | | (0.54 | ) | | | (0.15 | ) | | | (0.10 | ) | |
Distributions from return of capital | | | — | | | | (0.01 | ) | | | — | | | | — | | | | — | | |
Total distributions | | | (0.12 | ) | | | (0.18 | ) | | | (0.79 | ) | | | (0.34 | ) | | | (0.28 | ) | |
Paid-in capital from redemption fees(2) | | | — | | | | — | | | | — | | | | — | | | | — | (3) | |
Net asset value, end of period | | $ | 23.16 | | | $ | 15.10 | | | $ | 16.65 | | | $ | 16.28 | | | $ | 15.32 | | |
Total return | | | 54.29 | % | | | (8.32 | %) | | | 7.48 | % | | | 8.51 | % | | | 18.35 | % | |
Ratios/Supplemental Data | |
Net assets, end of period (in thousands) | | $ | 28,605 | | | $ | 23,821 | | | $ | 58,299 | | | $ | 59,364 | | | $ | 59,795 | | |
Ratio of expenses to average net assets | | | 0.94 | % | | | 0.95 | % | | | 0.94 | % | | | 0.94 | % | | | 0.95 | % | |
Ratio of net investment income (loss) to average net assets | | | 0.63 | % | | | 0.84 | % | | | 1.45 | % | | | 1.16 | % | | | 1.34 | % | |
Portfolio turnover rate | | | 20 | % | | | 31 | % | | | 20 | % | | | 21 | % | | | 26 | % | |
(1) Per share amounts have been calculated using the average shares method.
(2) Effective December 1, 2016, the Board of Trustees approved the elimination of redemption fees on shares of the Funds.
(3) Less than $0.01 per share.

108
FINANCIAL HIGHLIGHTS
BUFFALO DIVIDEND FOCUS FUND INSTITUTIONAL CLASS
The following tables are intended to help you understand the Fund's financial performance for the periods shown. Certain information reflects financial results for a single Fund share. Total returns in the table represent the rate that an investor would have earned (or lost) on an investment in the Fund. Total returns assume reinvestment of all dividends and distributions. Total returns do not reflect payment of sales charges, if any, and are not annualized for periods of less than one year.
Condensed data for a share of capital stock
outstanding throughout the period. | | For the Year Ended
March 31, 2021 | | For the period
July 1, 2019*
through
March 31, 2020 | |
Net asset value, beginning of period | | $ | 15.10 | | | $ | 17.37 | | |
Income from investment operations: | |
Net investment income | | | 0.15 | (1) | | | 0.28 | | |
Net gains (losses) on securities (both realized and unrealized) | | | 8.06 | | | | (2.41 | ) | |
Total from investment operations | | | 8.21 | | | | (2.13 | ) | |
Less distributions: | |
Distributions from investment Income | | | (0.15 | ) | | | (0.13 | ) | |
Distributions from capital gains | | | — | | | | — | | |
Distributions from return of capital | | | — | | | | (0.01 | ) | |
Total distributions | | | (0.15 | ) | | | (0.14 | ) | |
Net asset value, end of period | | $ | 23.16 | | | $ | 15.10 | | |
Total return** | | | 54.52 | % | | | (12.34 | %)(2) | |
Ratios/Supplemental Data | |
Net assets, end of period (in thousands) | | $ | 72,405 | | | $ | 40,887 | | |
Ratio of expenses to average net assets*** | | | 0.79 | % | | | 0.80 | % | |
Ratio of net investment income (loss) to average net assets*** | | | 0.78 | % | | | 1.23 | % | |
Portfolio turnover rate*** | | | 20 | % | | | 31 | % | |
* Inception date
** Not annualized for periods less than one year.
*** Annualized for periods less than one year.
(1) Per share amounts have been calculated using the average shares method.
(2) The return listed is the non-annualized return for the Institutional Class since inception date.

109
FINANCIAL HIGHLIGHTS
BUFFALO EARLY STAGE GROWTH FUND INVESTOR CLASS
The following tables are intended to help you understand the Fund's financial performance for the periods shown. Certain information reflects financial results for a single Fund share. Total returns in the table represent the rate that an investor would have earned (or lost) on an investment in the Fund. Total returns assume reinvestment of all dividends and distributions. Total returns do not reflect payment of sales charges, if any, and are not annualized for periods of less than one year.
| | | Years Ended March 31, | |
Condensed data for a share of capital stock
outstanding throughout the period. | | 2021 | | 2020 | | 2019 | | 2018 | | 2017 | |
Net asset value, beginning of period | | $ | 12.50 | | | $ | 15.30 | | | $ | 16.03 | | | $ | 15.78 | | | $ | 13.89 | | |
Income from investment operations: | |
Net investment loss | | | (0.25 | )(1) | | | (0.15 | ) | | | (0.15 | ) | | | (0.18 | ) | | | (0.13 | ) | |
Net gains (losses) on securities (both realized and unrealized) | | | 14.11 | | | | (1.85 | ) | | | 1.32 | | | | 3.55 | | | | 3.25 | | |
Total from investment operations | | | 13.86 | | | | (2.00 | ) | | | 1.17 | | | | 3.37 | | | | 3.12 | | |
Less distributions: | |
Distributions from capital gains | | | (2.48 | ) | | | (0.80 | ) | | | (1.90 | ) | | | (3.12 | ) | | | (1.23 | ) | |
Total distributions | | | (2.48 | ) | | | (0.80 | ) | | | (0.79 | ) | | | (0.34 | ) | | | (0.28 | ) | |
Paid-in capital from redemption fees(2) | | | — | | | | — | | | | — | | | | — | | | | — | (3) | |
Net asset value, end of period | | $ | 23.88 | | | $ | 12.50 | | | $ | 15.30 | | | $ | 16.03 | | | $ | 15.78 | | |
Total return | | | 112.86 | % | | | (14.38 | %) | | | 9.39 | % | | | 21.84 | % | | | 22.99 | % | |
Ratios/Supplemental Data | |
Net assets, end of period (in thousands) | | $ | 82,824 | | | $ | 42,633 | | | $ | 84,032 | | | $ | 87,969 | | | $ | 85,336 | | |
Ratio of expenses to average net assets | | | 1.50 | % | | | 1.49 | % | | | 1.48 | % | | | 1.48 | % | | | 1.48 | % | |
Ratio of net investment income (loss) to average net assets | | | (1.24 | %) | | | (1.00 | %) | | | (0.94 | %) | | | (1.10 | %) | | | (0.62 | %) | |
Portfolio turnover rate | | | 54 | % | | | 22 | % | | | 40 | % | | | 48 | % | | | 95 | % | |
(1) Per share amounts have been calculated using the average shares method.
(2) Effective December 1, 2016, the Board of Trustees approved the elimination of redemption fees on shares of the Funds.
(3) Less than $0.01 per share.

110
FINANCIAL HIGHLIGHTS
BUFFALO EARLY STAGE GROWTH FUND INSTITUTIONAL CLASS
The following tables are intended to help you understand the Fund's financial performance for the periods shown. Certain information reflects financial results for a single Fund share. Total returns in the table represent the rate that an investor would have earned (or lost) on an investment in the Fund. Total returns assume reinvestment of all dividends and distributions. Total returns do not reflect payment of sales charges, if any, and are not annualized for periods of less than one year.
Condensed data for a share of capital stock
outstanding throughout the period. | | For the Year Ended
March 31, 2021 | | For the period
July 1, 2019*
through
March 31, 2020 | |
Net asset value, beginning of period | | $ | 12.51 | | | $ | 16.44 | | |
Income from investment operations: | |
Net investment loss | | | (0.22 | )(1) | | | (0.14 | ) | |
Net gains (losses) on securities (both realized and unrealized) | | | 14.15 | | | | (2.99 | ) | |
Total from investment operations | | | 13.93 | | | | (3.13 | ) | |
Less distributions: | |
Distributions from investment Income | | | — | | | | — | | |
Distributions from capital gains | | | (2.48 | ) | | | (0.80 | ) | |
Total distributions | | | (2.48 | ) | | | (0.80 | ) | |
Net asset value, end of period | | $ | 23.96 | | | $ | 12.51 | | |
Total return** | | | 113.25 | % | | | (20.25 | %)(2) | |
Ratios/Supplemental Data | |
Net assets, end of period (in thousands) | | $ | 49,023 | | | $ | 23,102 | | |
Ratio of expenses to average net assets*** | | | 1.35 | % | | | 1.35 | % | |
Ratio of net investment income (loss) to average net assets*** | | | (1.09 | %) | | | (1.19 | %) | |
Portfolio turnover rate** | | | 54 | % | | | 22 | % | |
* Inception date
** Not annualized for periods less than one year.
*** Annualized for periods less than one year.
(1) Per share amounts have been calculated using the average shares method.
(2) The return listed is the non-annualized return for the Institutional Class since inception date.

111
FINANCIAL HIGHLIGHTS
BUFFALO FLEXIBLE INCOME FUND INVESTOR CLASS
The following tables are intended to help you understand the Fund's financial performance for the periods shown. Certain information reflects financial results for a single Fund share. Total returns in the table represent the rate that an investor would have earned (or lost) on an investment in the Fund. Total returns assume reinvestment of all dividends and distributions. Total returns do not reflect payment of sales charges, if any, and are not annualized for periods of less than one year.
| | | Years Ended March 31, | |
Condensed data for a share of capital stock
outstanding throughout the period. | | 2021 | | 2020 | | 2019 | | 2018 | | 2017 | |
Net asset value, beginning of period | | $ | 11.93 | | | $ | 15.27 | | | $ | 15.00 | | | $ | 14.74 | | | $ | 13.70 | | |
Income from investment operations: | |
Net investment income | | | 0.29 | (1) | | | 0.72 | | | | 0.39 | | | | 0.34 | | | | 0.35 | | |
Net gains (losses) on securities (both realized and unrealized) | | | 4.53 | | | | (3.63 | ) | | | 0.71 | | | | 0.77 | | | | 1.14 | | |
Total from investment operations | | | 4.82 | | | | (2.91 | ) | | | 1.10 | | | | 1.11 | | | | 1.49 | | |
Less distributions: | |
Distributions from investment Income | | | (0.30 | ) | | | (0.32 | ) | | | (0.39 | ) | | | (0.36 | ) | | | (0.38 | ) | |
Distributions from capital gains | | | (0.21 | ) | | | (0.11 | ) | | | (0.44 | ) | | | (0.49 | ) | | | (0.07 | ) | |
Total distributions | | | (0.51 | ) | | | (0.43 | ) | | | (0.83 | ) | | | (0.85 | ) | | | (0.45 | ) | |
Paid-in capital from redemption fees(2) | | | | | | | — | | | | — | | | | — | | | | — | (3) | |
Net asset value, end of period | | $ | 16.24 | | | $ | 11.93 | | | $ | 15.27 | | | $ | 15.00 | | | $ | 14.74 | | |
Total return | | | 40.94 | % | | | (19.63 | %) | | | 7.73 | % | | | 7.57 | % | | | 11.02 | % | |
Ratios/Supplemental Data | |
Net assets, end of period (in thousands) | | $ | 277,906 | | | $ | 273,416 | | | $ | 625,349 | | | $ | 698,084 | | | $ | 797,453 | | |
Ratio of expenses to average net assets | | | 1.01 | % | | | 1.01 | % | | | 1.01 | % | | | 1.01 | % | | | 1.01 | % | |
Ratio of net investment income (loss) to average net assets | | | 2.04 | % | | | 1.99 | % | | | 2.57 | % | | | 2.27 | % | | | 2.45 | % | |
Portfolio turnover rate | | | 1 | % | | | 5 | % | | | 6 | % | | | 2 | % | | | 1 | % | |
(1) Per share amounts have been calculated using the average shares method.
(2) Effective December 1, 2016, the Board of Trustees approved the elimination of redemption fees on shares of the Funds.
(3) Less than $0.01 per share.

112
FINANCIAL HIGHLIGHTS
BUFFALO FLEXIBLE INCOME FUND INSTITUTIONAL CLASS
The following tables are intended to help you understand the Fund's financial performance for the periods shown. Certain information reflects financial results for a single Fund share. Total returns in the table represent the rate that an investor would have earned (or lost) on an investment in the Fund. Total returns assume reinvestment of all dividends and distributions. Total returns do not reflect payment of sales charges, if any, and are not annualized for periods of less than one year.
Condensed data for a share of capital stock
outstanding throughout the period. | | For the Year Ended
March 31, 2021 | | For the period
July 1, 2019*
through
March 31, 2020 | |
Net asset value, beginning of period | | $ | 11.93 | | | $ | 15.31 | | |
Income from investment operations: | |
Net investment income | | | 0.31 | (1) | | | 0.57 | | |
Net gains (losses) on securities (both realized and unrealized) | | | 4.53 | | | | (3.60 | ) | |
Total from investment operations | | | 4.84 | | | | (3.03 | ) | |
Less distributions: | |
Distributions from investment Income | | | (0.32 | ) | | | (0.25 | ) | |
Distributions from capital gains | | | (0.21 | ) | | | (0.10 | ) | |
Total distributions | | | (0.53 | ) | | | (0.35 | ) | |
Net asset value, end of period | | $ | 16.24 | | | $ | 11.93 | | |
Total return** | | | 41.15 | % | | | (20.20 | %)(2) | |
Ratios/Supplemental Data | |
Net assets, end of period (in thousands) | | $ | 147,802 | | | $ | 133,843 | | |
Ratio of expenses to average net assets*** | | | 0.86 | % | | | 0.86 | % | |
Ratio of net investment income (loss) to average net assets*** | | | 2.19 | % | | | 2.79 | % | |
Portfolio turnover rate** | | | 1 | % | | | 5 | % | |
* Inception date
** Not annualized for periods less than one year.
*** Annualized for periods less than one year.
(1) Per share amounts have been calculated using the average shares method.
(2) The return listed is the non-annualized return for the Institutional Class since inception date.

113
FINANCIAL HIGHLIGHTS
BUFFALO GROWTH FUND INVESTOR CLASS
The following tables are intended to help you understand the Fund's financial performance for the periods shown. Certain information reflects financial results for a single Fund share. Total returns in the table represent the rate that an investor would have earned (or lost) on an investment in the Fund. Total returns assume reinvestment of all dividends and distributions. Total returns do not reflect payment of sales charges, if any, and are not annualized for periods of less than one year.
| | | Years Ended March 31, | |
Condensed data for a share of capital stock
outstanding throughout the period. | | 2021 | | 2020 | | 2019 | | 2018 | | 2017 | |
Net asset value, beginning of period | | $ | 21.20 | | | $ | 25.10 | | | $ | 29.83 | | | $ | 30.83 | | | $ | 28.86 | | |
Income from investment operations: | |
Net investment income (loss) | | | (0.05 | )(1) | | | 0.08 | | | | 0.05 | | | | 0.39 | | | | 0.23 | | |
Net gains (losses) on securities (both realized and unrealized) | | | 11.46 | | | | (0.55 | ) | | | 2.76 | | | | 4.58 | | | | 3.36 | | |
Total from investment operations | | | 11.41 | | | | (0.47 | ) | | | 2.81 | | | | 4.97 | | | | 3.59 | | |
Less distributions: | |
Distributions from investment Income | | | — | | | | (0.08 | ) | | | (0.01 | ) | | | (0.45 | ) | | | (0.22 | ) | |
Distributions from capital gains | | | (1.53 | ) | | | (3.35 | ) | | | (7.53 | ) | | | (5.52 | ) | | | (1.40 | ) | |
Total distributions | | | (1.53 | ) | | | (3.43 | ) | | | (7.54 | ) | | | (5.97 | ) | | | (1.62 | ) | |
Paid-in capital from redemption fees(2) | | | | | | | — | | | | — | | | | — | | | | — | (3) | |
Net asset value, end of period | | $ | 31.07 | | | $ | 21.20 | | | $ | 25.10 | | | $ | 29.83 | | | $ | 30.83 | | |
Total return | | | 53.98 | % | | | (3.90 | %) | | | 13.17 | % | | | 16.42 | % | | | 12.88 | % | |
Ratios/Supplemental Data | |
Net assets, end of period (in thousands) | | $ | 112,399 | | | $ | 88,051 | | | $ | 174,570 | | | $ | 204,251 | | | $ | 326,944 | | |
Ratio of expenses to average net assets | | | 0.92 | % | | | 0.92 | % | | | 0.91 | % | | | 0.91 | % | | | 0.91 | % | |
Ratio of net investment income (loss) to average net assets | | | (0.19 | %) | | | 0.11 | % | | | 0.17 | % | | | 0.90 | % | | | 0.70 | % | |
Portfolio turnover rate | | | 21 | % | | | 33 | % | | | 16 | % | | | 32 | % | | | 18 | % | |
(1) Per share amounts have been calculated using the average shares method.
(2) Effective December 1, 2016, the Board of Trustees approved the elimination of redemption fees on shares of the Funds.
(3) Less than $0.01 per share.

114
FINANCIAL HIGHLIGHTS
BUFFALO GROWTH FUND INSTITUTIONAL CLASS
The following tables are intended to help you understand the Fund's financial performance for the periods shown. Certain information reflects financial results for a single Fund share. Total returns in the table represent the rate that an investor would have earned (or lost) on an investment in the Fund. Total returns assume reinvestment of all dividends and distributions. Total returns do not reflect payment of sales charges, if any, and are not annualized for periods of less than one year.
Condensed data for a share of capital stock
outstanding throughout the period. | | For the Year Ended
March 31, 2021 | | For the period
July 1, 2019*
through
March 31, 2020 | |
Net asset value, beginning of period | | $ | 21.20 | | | $ | 27.10 | | |
Income from investment operations: | |
Net investment income (loss) | | | (0.01 | )(1) | | | 0.15 | | |
Net gains (losses) on securities (both realized and unrealized) | | | 11.47 | | | | (2.59 | ) | |
Total from investment operations | | | 11.46 | | | | (2.44 | ) | |
Less distributions: | |
Distributions from investment Income | | | — | | | | (0.10 | ) | |
Distributions from capital gains | | | (1.53 | ) | | | (3.36 | ) | |
Total distributions | | | (1.53 | ) | | | (3.46 | ) | |
Net asset value, end of period | | $ | 31.13 | | | $ | 21.20 | | |
Total return** | | | 54.26 | % | | | (10.92 | %)(2) | |
Ratios/Supplemental Data | |
Net assets, end of period (in thousands) | | $ | 86,046 | | | $ | 58,307 | | |
Ratio of expenses to average net assets*** | | | 0.77 | % | | | 0.78 | % | |
Ratio of net investment income (loss) to average net assets*** | | | (0.04 | %) | | | 0.28 | % | |
Portfolio turnover rate** | | | 66 | % | | | 33 | % | |
* Inception date
** Not annualized for periods less than one year.
*** Annualized for periods less than one year.
(1) Per share amounts have been calculated using the average shares method.
(2) The return listed is the non-annualized return for the Institutional Class since inception date.

115
FINANCIAL HIGHLIGHTS
BUFFALO HIGH YIELD FUND INVESTOR CLASS
The following tables are intended to help you understand the Fund's financial performance for the periods shown. Certain information reflects financial results for a single Fund share. Total returns in the table represent the rate that an investor would have earned (or lost) on an investment in the Fund. Total returns assume reinvestment of all dividends and distributions. Total returns do not reflect payment of sales charges, if any, and are not annualized for periods of less than one year.
| | | Years Ended March 31, | |
Condensed data for a share of capital stock
outstanding throughout the period. | | 2021 | | 2020 | | 2019 | | 2018 | | 2017 | |
Net asset value, beginning of period | | $ | 9.72 | | | $ | 10.86 | | | $ | 11.04 | | | $ | 11.21 | | | $ | 11.04 | | |
Income from investment operations: | |
Net investment income | | | 0.48 | (1) | | | 1.17 | | | | 0.51 | | | | 0.50 | | | | 0.48 | | |
Net gains (losses) on securities (both realized and unrealized) | | | 2.10 | | | | (1.85 | ) | | | (0.15 | ) | | | (0.15 | ) | | | 0.42 | | |
Total from investment operations | | | 2.59 | | | | (0.68 | ) | | | 0.36 | | | | 0.35 | | | | 0.90 | | |
Less distributions: | |
Distributions from investment Income | | | (0.49 | ) | | | (0.46 | ) | | | (0.51 | ) | | | (0.47 | ) | | | (0.47 | ) | |
Distributions from capital gains | | | — | (2) | | | — | | | | (0.03 | ) | | | (0.05 | ) | | | (0.26 | ) | |
Total distributions | | | (0.49 | ) | | | (0.46 | ) | | | (0.54 | ) | | | (0.52 | ) | | | (0.73 | ) | |
Paid-in capital from redemption fees(3) | | | — | | | | — | | | | — | | | | — | | | | — | (2) | |
Net asset value, end of period | | $ | 11.82 | | | $ | 9.72 | | | $ | 10.86 | | | $ | 11.04 | | | $ | 11.21 | | |
Total return | | | 27.07 | % | | | (6.67 | %) | | | 3.46 | % | | | 3.20 | % | | | 8.37 | % | |
Ratios/Supplemental Data | |
Net assets, end of period (in thousands) | | $ | 50,110 | | | $ | 46,036 | | | $ | 191,451 | | | $ | 231,295 | | | $ | 236,006 | | |
Ratio of expenses to average net assets | | | 1.02 | % | | | 1.02 | % | | | 1.02 | % | | | 1.02 | % | | | 1.02 | % | |
Ratio of net investment income (loss) to average net assets | | | 4.38 | % | | | 3.60 | % | | | 4.68 | % | | | 4.06 | % | | | 4.27 | % | |
Portfolio turnover rate | | | 66 | % | | | 36 | % | | | 22 | % | | | 41 | % | | | 40 | % | |
(1) Per share amounts have been calculated using the average shares method.
(2) Less than $0.01 per share.
(3) Effective December 1, 2016, the Board of Trustees approved the elimination of redemption fees on shares of the Funds.

116
FINANCIAL HIGHLIGHTS
BUFFALO HIGH YIELD FUND INSTITUTIONAL CLASS
The following tables are intended to help you understand the Fund's financial performance for the periods shown. Certain information reflects financial results for a single Fund share. Total returns in the table represent the rate that an investor would have earned (or lost) on an investment in the Fund. Total returns assume reinvestment of all dividends and distributions. Total returns do not reflect payment of sales charges, if any, and are not annualized for periods of less than one year.
Condensed data for a share of capital stock
outstanding throughout the period. | | For the Year Ended
March 31, 2021 | | For the period
July 1, 2019*
through
March 31, 2020 | |
Net asset value, beginning of period | | $ | 9.71 | | | $ | 11.01 | | |
Income from investment operations: | |
Net investment income | | | 0.50 | (1) | | | 0.71 | | |
Net gains (losses) on securities (both realized and unrealized) | | | 2.10 | | | | (1.66 | ) | |
Total from investment operations | | | 2.60 | | | | (0.95 | ) | |
Less distributions: | |
Distributions from investment Income | | | (0.50 | ) | | | (0.35 | ) | |
Distributions from capital gains | | | — | (2) | | | — | | |
Total distributions | | | (0.50 | ) | | | (0.35 | ) | |
Net asset value, end of period | | $ | 11.81 | | | $ | 9.71 | | |
Total return** | | | 27.28 | % | | | (8.94 | %)(3) | |
Ratios/Supplemental Data | |
Net assets, end of period (in thousands) | | $ | 225,715 | | | $ | 141,735 | | |
Ratio of expenses to average net assets*** | | | 0.86 | % | | | 0.88 | % | |
Ratio of net investment income (loss) to average net assets*** | | | 4.51 | % | | | 4.90 | % | |
Portfolio turnover rate** | | | 66 | % | | | 36 | % | |
* Inception date
** Not annualized for periods less than one year.
*** Annualized for periods less than one year.
(1) Per share amounts have been calculated using the average shares method.
(2) Less than $0.01 per share.
(3) The return listed is the non-annualized return for the Institutional Class since inception date.

117
FINANCIAL HIGHLIGHTS
BUFFALO INTERNATIONAL FUND INVESTOR CLASS
The following tables are intended to help you understand the Fund's financial performance for the periods shown. Certain information reflects financial results for a single Fund share. Total returns in the table represent the rate that an investor would have earned (or lost) on an investment in the Fund. Total returns assume reinvestment of all dividends and distributions. Total returns do not reflect payment of sales charges, if any, and are not annualized for periods of less than one year.
| | | Years Ended March 31, | |
Condensed data for a share of capital stock
outstanding throughout the period. | | 2021 | | 2020 | | 2019 | | 2018 | | 2017 | |
Net asset value, beginning of period | | $ | 13.54 | | | $ | 14.76 | | | $ | 15.10 | | | $ | 12.80 | | | $ | 11.40 | | |
Income from investment operations: | |
Net investment income | | | 0.04 | (1) | | | 0.19 | | | | 0.09 | | | | 0.06 | | | | 0.13 | | |
Net gains (losses) on securities (both realized and unrealized) | | | 6.98 | | | | (1.31 | ) | | | (0.11 | ) | | | 2.29 | | | | 1.39 | | |
Total from investment operations | | | 7.02 | | | | (1.12 | ) | | | (0.02 | ) | | | 2.35 | | | | 1.52 | | |
Less distributions: | |
Distributions from investment Income | | | (0.05 | ) | | | (0.10 | ) | | | (0.08 | ) | | | (0.04 | ) | | | (0.12 | ) | |
Distributions from capital gains | | | — | (2) | | | — | | | | (0.24 | ) | | | (0.01 | ) | | | — | | |
Total distributions | | | (0.05 | ) | | | (0.10 | ) | | | (0.32 | ) | | | (0.05 | ) | | | (0.12 | ) | |
Paid-in capital from redemption fees(3) | | | — | | | | — | | | | — | | | | — | | | | — | (2) | |
Net asset value, end of period | | $ | 20.51 | | | $ | 13.54 | | | $ | 14.76 | | | $ | 15.10 | | | $ | 12.80 | | |
Total return | | | 51.79 | % | | | (7.67 | %) | | | 0.11 | % | | | 18.40 | % | | | 13.46 | % | |
Ratios/Supplemental Data | |
Net assets, end of period (in thousands) | | $ | 260,044 | | | $ | 183,809 | | | $ | 340,880 | | | $ | 277,865 | | | $ | 203,276 | | |
Ratio of expenses to average net assets | | | 1.03 | % | | | 1.03 | % | | | 1.04 | % | | | 1.03 | % | | | 1.04 | % | |
Ratio of net investment income (loss) to average net assets | | | 0.22 | % | | | 0.55 | % | | | 0.64 | % | | | 0.42 | % | | | 1.02 | % | |
Portfolio turnover rate | | | 14 | % | | | 13 | % | | | 16 | % | | | 13 | % | | | 4 | % | |
(1) Per share amounts have been calculated using the average shares method.
(2) Less than $0.01 per share.
(3) Effective December 1, 2016, the Board of Trustees approved the elimination of redemption fees on shares of the Funds.

118
FINANCIAL HIGHLIGHTS
BUFFALO INTERNATIONAL FUND INSTITUTIONAL CLASS
The following tables are intended to help you understand the Fund's financial performance for the periods shown. Certain information reflects financial results for a single Fund share. Total returns in the table represent the rate that an investor would have earned (or lost) on an investment in the Fund. Total returns assume reinvestment of all dividends and distributions. Total returns do not reflect payment of sales charges, if any, and are not annualized for periods of less than one year.
Condensed data for a share of capital stock
outstanding throughout the period. | | For the Year Ended
March 31, 2021 | | For the period
July 1, 2019*
through
March 31, 2020 | |
Net asset value, beginning of period | | $ | 13.55 | | | $ | 15.85 | | |
Income from investment operations: | |
Net investment income | | | 0.07 | (1) | | | 0.20 | | |
Net gains (losses) on securities (both realized and unrealized) | | | 6.99 | | | | (2.39 | ) | |
Total from investment operations | | | 7.06 | | | | (2.19 | ) | |
Less distributions: | |
Distributions from investment Income | | | (0.08 | ) | | | (0.11 | ) | |
Distributions from capital gains | | | — | (2) | | | — | | |
Total distributions | | | (0.08 | ) | | | (0.11 | ) | |
Net asset value, end of period | | $ | 20.53 | | | $ | 13.55 | | |
Total return** | | | 52.12 | % | | | (13.95 | %)(3) | |
Ratios/Supplemental Data | |
Net assets, end of period (in thousands) | | $ | 285,595 | | | $ | 176,285 | | |
Ratio of expenses to average net assets*** | | | 0.88 | % | | | 0.88 | % | |
Ratio of net investment income (loss) to average net assets*** | | | 0.37 | % | | | 0.86 | % | |
Portfolio turnover rate** | | | 14 | % | | | 13 | % | |
* Inception date
** Not annualized for periods less than one year.
*** Annualized for periods less than one year.
(1) Per share amounts have been calculated using the average shares method.
(2) Less than $0.01 per share.
(3) The return listed is the non-annualized return for the Institutional Class since inception date.

119
FINANCIAL HIGHLIGHTS
BUFFALO LARGE CAP FUND INVESTOR CLASS
The following tables are intended to help you understand the Fund's financial performance for the periods shown. Certain information reflects financial results for a single Fund share. Total returns in the table represent the rate that an investor would have earned (or lost) on an investment in the Fund. Total returns assume reinvestment of all dividends and distributions. Total returns do not reflect payment of sales charges, if any, and are not annualized for periods of less than one year.
| | | Years Ended March 31, | |
Condensed data for a share of capital stock
outstanding throughout the period. | | 2021 | | 2020 | | 2019 | | 2018 | | 2017 | |
Net asset value, beginning of period | | $ | 29.53 | | | $ | 31.01 | | | $ | 29.08 | | | $ | 26.53 | | | $ | 23.09 | | |
Income from investment operations: | |
Net investment income (loss) | | | (0.07 | )(1) | | | 0.09 | | | | 0.09 | | | | 0.09 | | | | 0.08 | | |
Net gains (losses) on securities (both realized and unrealized) | | | 16.83 | | | | (1.07 | ) | | | 3.46 | | | | 4.01 | | | | 4.18 | | |
Total from investment operations | | | 16.76 | | | | (0.98 | ) | | | 3.55 | | | | 4.10 | | | | 4.26 | | |
Less distributions: | |
Distributions from investment Income | | | (0.06 | ) | | | (0.07 | ) | | | (0.11 | ) | | | (0.04 | ) | | | (0.13 | ) | |
Distributions from capital gains | | | — | | | | (0.43 | ) | | | (1.51 | ) | | | (1.51 | ) | | | (0.69 | ) | |
Total distributions | | | (0.06 | ) | | | (0.50 | ) | | | (1.62 | ) | | | (1.55 | ) | | | (0.82 | ) | |
Paid-in capital from redemption fees(2) | | | | | | | — | | | | — | | | | — | | | | — | (3) | |
Net asset value, end of period | | $ | 46.23 | | | $ | 29.53 | | | $ | 31.01 | | | $ | 29.08 | | | $ | 26.53 | | |
Total return | | | 56.78 | % | | | (3.40 | %) | | | 12.96 | % | | | 15.41 | % | | | 18.67 | % | |
Ratios/Supplemental Data | |
Net assets, end of period (in thousands) | | $ | 37,413 | | | $ | 27,872 | | | $ | 69,002 | | | $ | 69,024 | | | $ | 57,881 | | |
Ratio of expenses to average net assets | | | 0.94 | % | | | 0.94 | % | | | 0.93 | % | | | 0.93 | % | | | 0.95 | % | |
Ratio of net investment income (loss) to average net assets | | | (0.16 | %) | | | 0.21 | % | | | 0.27 | % | | | 0.33 | % | | | 0.34 | % | |
Portfolio turnover rate | | | 7 | % | | | 6 | % | | | 10 | % | | | 40 | % | | | 41 | % | |
(1) Per share amounts have been calculated using the average shares method.
(2) Effective December 1, 2016, the Board of Trustees approved the elimination of redemption fees on shares of the Funds.
(3) Less than $0.01 per share.

120
FINANCIAL HIGHLIGHTS
BUFFALO LARGE CAP FUND INSTITUTIONAL CLASS
The following tables are intended to help you understand the Fund's financial performance for the periods shown. Certain information reflects financial results for a single Fund share. Total returns in the table represent the rate that an investor would have earned (or lost) on an investment in the Fund. Total returns assume reinvestment of all dividends and distributions. Total returns do not reflect payment of sales charges, if any, and are not annualized for periods of less than one year.
Condensed data for a share of capital stock
outstanding throughout the period. | | For the Year Ended
March 31, 2021 | | For the period
July 1, 2019*
through
March 31, 2020 | |
Net asset value, beginning of period | | $ | 29.56 | | | $ | 32.79 | | |
Income from investment operations: | |
Net investment income (loss) | | | (0.00 | )(1)(2) | | | 0.16 | | |
Net gains (losses) on securities (both realized and unrealized) | | | 16.85 | | | | (2.89 | ) | |
Total from investment operations | | | 16.85 | | | | (2.73 | ) | |
Less distributions: | |
Distributions from investment Income | | | (0.11 | ) | | | (0.07 | ) | |
Distributions from capital gains | | | — | | | | (0.43 | ) | |
Total distributions | | | (0.11 | ) | | | (0.50 | ) | |
Net asset value, end of period | | $ | 46.30 | | | $ | 29.56 | | |
Total return** | | | 57.02 | % | | | (8.55 | %)(3) | |
Ratios/Supplemental Data | |
Net assets, end of period (in thousands) | | $ | 71,394 | | | $ | 45,244 | | |
Ratio of expenses to average net assets*** | | | 0.79 | % | | | 0.80 | % | |
Ratio of net investment income (loss) to average net assets*** | | | (0.01 | %) | | | 0.40 | % | |
Portfolio turnover rate** | | | 7 | % | | | 6 | % | |
* Inception date
** Not annualized for periods less than one year.
*** Annualized for periods less than one year.
(1) Per share amounts have been calculated using the average shares method.
(2) Less than $0.01 per share.
(3) The return listed is the non-annualized return for the Institutional Class since inception date.

121
FINANCIAL HIGHLIGHTS
BUFFALO MID CAP FUND INVESTOR CLASS
The following tables are intended to help you understand the Fund's financial performance for the periods shown. Certain information reflects financial results for a single Fund share. Total returns in the table represent the rate that an investor would have earned (or lost) on an investment in the Fund. Total returns assume reinvestment of all dividends and distributions. Total returns do not reflect payment of sales charges, if any, and are not annualized for periods of less than one year.
| | | Years Ended March 31, | |
Condensed data for a share of capital stock
outstanding throughout the period. | | 2021 | | 2020 | | 2019 | | 2018 | | 2017 | |
Net asset value, beginning of period | | $ | 13.02 | | | $ | 14.52 | | | $ | 13.99 | | | $ | 15.68 | | | $ | 15.04 | | |
Income from investment operations: | |
Net investment loss | | | (0.11 | )(1) | | | (0.05 | ) | | | (0.04 | ) | | | (0.03 | ) | | | (0.01 | ) | |
Net gains (losses) on securities (both realized and unrealized) | | | 8.61 | | | | (0.19 | ) | | | 1.11 | | | | 1.77 | | | | 1.85 | | |
Total from investment operations | | | 8.50 | | | | (0.24 | ) | | | 1.07 | | | | 1.74 | | | | 1.84 | | |
Less distributions: | |
Distributions from investment Income | | | — | | | | — | | | | — | | | | — | | | | — | | |
Distributions from capital gains | | | (1.33 | ) | | | (1.26 | ) | | | (0.54 | ) | | | (3.43 | ) | | | (1.20 | ) | |
Total distributions | | | (1.33 | ) | | | (1.26 | ) | | | (0.54 | ) | | | (3.43 | ) | | | (1.20 | ) | |
Paid-in capital from redemption fees(3) | | | — | | | | — | | | | — | | | | — | | | | — | (2) | |
Net asset value, end of period | | $ | 20.19 | | | $ | 13.02 | | | $ | 14.52 | | | $ | 13.99 | | | $ | 15.68 | | |
Total return | | | 65.92 | % | | | (2.89 | %) | | | 8.40 | % | | | 11.69 | % | | | 12.94 | % | |
Ratios/Supplemental Data | |
Net assets, end of period (in thousands) | | $ | 107,061 | | | $ | 86,030 | | | $ | 135,262 | | | $ | 155,587 | | | $ | 395,413 | | |
Ratio of expenses to average net assets | | | 1.03 | % | | | 1.02 | % | | | 1.02 | % | | | 1.01 | % | | | 1.01 | % | |
Ratio of net investment loss to average net assets | | | (0.63 | %) | | | (0.39 | %) | | | (0.27 | %) | | | (0.13 | %) | | | (0.09 | %) | |
Portfolio turnover rate | | | 41 | % | | | 52 | % | | | 36 | % | | | 51 | % | | | 51 | % | |
(1) Per share amounts have been calculated using the average shares method.
(2) Less than $0.01 per share.
(3) Effective December 1, 2016, the Board of Trustees approved the elimination of redemption fees on shares of the Funds.

122
FINANCIAL HIGHLIGHTS
BUFFALO MID CAP FUND INSTITUTIONAL CLASS
The following tables are intended to help you understand the Fund's financial performance for the periods shown. Certain information reflects financial results for a single Fund share. Total returns in the table represent the rate that an investor would have earned (or lost) on an investment in the Fund. Total returns assume reinvestment of all dividends and distributions. Total returns do not reflect payment of sales charges, if any, and are not annualized for periods of less than one year.
Condensed data for a share of capital stock
outstanding throughout the period. | | For the Year Ended
March 31, 2021 | | For the period
July 1, 2019*
through
March 31, 2020 | |
Net asset value, beginning of period | | $ | 13.03 | | | $ | 15.63 | | |
Income from investment operations: | |
Net investment loss | | | (0.09 | )(1) | | | (0.04 | ) | |
Net gains (losses) on securities (both realized and unrealized) | | | 8.63 | | | | (1.30 | ) | |
Total from investment operations | | | 8.54 | | | | (1.34 | ) | |
Less distributions: | |
Distributions from investment Income | | | — | | | | — | | |
Distributions from capital gains | | | (1.33 | ) | | | (1.26 | ) | |
Total distributions | | | (1.33 | ) | | | (1.26 | ) | |
Net asset value, end of period | | $ | 20.24 | | | $ | 13.03 | | |
Total return** | | | 66.18 | % | | | (9.72 | %)(2) | |
Ratios/Supplemental Data | |
Net assets, end of period (in thousands) | | $ | 83,642 | | | $ | 51,324 | | |
Ratio of expenses to average net assets*** | | | 0.88 | % | | | 0.89 | % | |
Ratio of net investment loss to average net assets*** | | | (0.48 | %) | | | (0.38 | %) | |
Portfolio turnover rate** | | | 41 | % | | | 52 | % | |
* Inception date
** Not annualized for periods less than one year.
*** Annualized for periods less than one year.
(1) Per share amounts have been calculated using the average shares method.
(2) The return listed is the non-annualized return for the Institutional Class since inception date.

123
FINANCIAL HIGHLIGHTS
BUFFALO SMALL CAP FUND INVESTOR CLASS
The following tables are intended to help you understand the Fund's financial performance for the periods shown. Certain information reflects financial results for a single Fund share. Total returns in the table represent the rate that an investor would have earned (or lost) on an investment in the Fund. Total returns assume reinvestment of all dividends and distributions. Total returns do not reflect payment of sales charges, if any, and are not annualized for periods of less than one year.
| | | Years Ended March 31, | |
Condensed data for a share of capital stock
outstanding throughout the period. | | 2021 | | 2020 | | 2019 | | 2018 | | 2017 | |
Net asset value, beginning of period | | $ | 10.94 | | | $ | 12.89 | | | $ | 15.00 | | | $ | 16.61 | | | $ | 16.64 | | |
Income from investment operations: | |
Net investment loss | | | (0.15 | )(1) | | | (0.08 | ) | | | (0.08 | ) | | | (0.09 | ) | | | (0.13 | ) | |
Net gains (losses) on securities (both realized and unrealized) | | | 13.23 | | | | (0.62 | ) | | | 1.25 | | | | 2.92 | | | | 3.19 | | |
Total from investment operations | | | 13.08 | | | | (0.70 | ) | | | 1.17 | | | | 2.83 | | | | 3.06 | | |
Less distributions: | |
Distributions from investment Income | | | — | | | | — | | | | — | | | | — | | | | — | | |
Distributions from capital gains | | | (1.88 | ) | | | (1.25 | ) | | | (3.28 | ) | | | (4.44 | ) | | | (3.09 | ) | |
Total distributions | | | (1.88 | ) | | | (1.25 | ) | | | (3.28 | ) | | | (4.44 | ) | | | (3.09 | ) | |
Paid-in capital from redemption fees(2) | | | — | | | | — | | | | — | | | | — | | | | — | (3) | |
Net asset value, end of period | | $ | 22.14 | | | $ | 10.94 | | | $ | 12.89 | | | $ | 15.00 | | | $ | 16.61 | | |
Total return | | | 120.78 | % | | | (7.33 | %) | | | 12.19 | % | | | 17.65 | % | | | 24.51 | % | |
Ratios/Supplemental Data | |
Net assets, end of period (in thousands) | | $ | 801,388 | | | $ | 337,804 | | | $ | 510,410 | | | $ | 535,820 | | | $ | 563,002 | | |
Ratio of expenses to average net assets | | | 1.01 | % | | | 1.01 | % | | | 1.01 | % | | | 1.01 | % | | | 1.01 | % | |
Ratio of net investment loss to average net assets | | | (0.81 | %) | | | (0.65 | %) | | | (0.55 | %) | | | (0.64 | %) | | | (0.52 | %) | |
Portfolio turnover rate | | | 63 | % | | | 67 | % | | | 57 | % | | | 49 | % | | | 45 | % | |
(1) Per share amounts have been calculated using the average shares method.
(2) Effective December 1, 2016, the Board of Trustees approved the elimination of redemption fees on shares of the Funds.
(3) Less than $0.01 per share.

124
FINANCIAL HIGHLIGHTS
BUFFALO SMALL CAP FUND INSTITUTIONAL CLASS
The following tables are intended to help you understand the Fund's financial performance for the periods shown. Certain information reflects financial results for a single Fund share. Total returns in the table represent the rate that an investor would have earned (or lost) on an investment in the Fund. Total returns assume reinvestment of all dividends and distributions. Total returns do not reflect payment of sales charges, if any, and are not annualized for periods of less than one year.
Condensed data for a share of capital stock
outstanding throughout the period. | | For the Year Ended
March 31, 2021 | | For the period
July 1, 2019*
through
March 31, 2020 | |
Net asset value, beginning of period | | $ | 10.96 | | | $ | 13.78 | | |
Income from investment operations: | |
Net investment loss | | | (0.13 | )(1) | | | (0.06 | ) | |
Net gains (losses) on securities (both realized and unrealized) | | | 13.24 | | | | (1.51 | ) | |
Total from investment operations | | | 13.11 | | | | (1.57 | ) | |
Less distributions: | |
Distributions from investment Income | | | — | | | | — | | |
Distributions from capital gains | | | (1.88 | ) | | | (1.25 | ) | |
Total distributions | | | (1.88 | ) | | | (1.25 | ) | |
Net asset value, end of period | | $ | 22.20 | | | $ | 10.96 | | |
Total return** | | | 121.14 | % | | | (13.24 | %)(2) | |
Ratios/Supplemental Data | |
Net assets, end of period (in thousands) | | $ | 328,588 | | | $ | 95,095 | | |
Ratio of expenses to average net assets*** | | | 0.86 | % | | | 0.86 | % | |
Ratio of net investment loss to average net assets*** | | | (0.67 | %) | | | (0.73 | %) | |
Portfolio turnover rate** | | | 63 | % | | | 67 | % | |
* Inception date
** Not annualized for periods less than one year.
*** Annualized for periods less than one year.
(1) Per share amounts have been calculated using the average shares method.
(2) The return listed is the non-annualized return for the Institutional Class since inception date.

125
NOTES TO FINANCIAL STATEMENTS
March 31, 2021

1. SIGNIFICANT ACCOUNTING POLICIES:
The Buffalo Funds (comprised of the Buffalo Discovery Fund, Buffalo Dividend Focus Fund, Buffalo Early Stage Growth Fund (formerly known as the Buffalo Emerging Opportunities Fund), Buffalo Flexible Income Fund, Buffalo Growth Fund, Buffalo High Yield Fund, Buffalo International Fund, Buffalo Large Cap Fund, Buffalo Mid Cap Fund, and Buffalo Small Cap Fund) (the "Funds") are registered under the Investment Company Act of 1940, as amended (the "1940 Act"), as a diversified open-end management investment company. The shares of the Buffalo Funds are issued in multiple series, with each series, in effect, representing a separate fund.
Each of the Funds offers two classes of shares, Investor Class and Institutional Class. Each class of share represents an equal interest in the Fund, except the difference of class specific expenses, which reflects the difference in the range of services provided to each class. The shareholder servicing fees for the Investor Class represent the class specific expenses. See Note 7 for more information regarding shareholder servicing fees for the Investor Class. Income, expenses (other than class specific), and realized and unrealized gains and losses on investments are allocated daily to each class based on relative net assets.
The investment objective of the Buffalo Discovery Fund, Buffalo Early Stage Growth Fund, Buffalo Growth Fund, Buffalo International Fund, Buffalo Large Cap Fund, Buffalo Mid Cap Fund and Buffalo Small Cap Fund is long-term growth of capital. The investment objective of the Buffalo Flexible Income Fund is high current income, with long-term growth of capital as a secondary objective. The investment objectives of the Buffalo Dividend Focus Fund and Buffalo High Yield Fund are current income, with long-term growth of capital as a secondary objective.
Each Fund is an investment company and accordingly follows the investment company accounting and reporting guidance of the Financial Accounting Standards Board ("FASB") Accounting Standard Codification ("ASC") Topic 946 "Financial Services — Investment Companies."
The following is a summary of significant accounting policies consistently followed by the Funds in the preparation of their financial statements.
A. INVESTMENT VALUATION — In accordance with FASB ASC 820, Fair Value Measurements ("ASC 820"), fair value is defined as the price that a Fund would receive to sell an investment or pay to transfer a liability in an orderly transaction with an independent buyer in the principal market, or in the absence of a principal market, the most advantageous market for the investment or liability.
Equity securities and debt securities traded on a national securities exchange or national market, except those traded using the National Association of Securities Dealers' Automated Quotation System ("NASDAQ"), are valued at the latest sales price thereof, or if no sale was reported on that date, the mean between the most recent quoted bid and ask price is used. All equity securities that are traded using NASDAQ are valued using the NASDAQ Official Closing Price ("NOCP"), which may not necessarily represent the last sales price. If there has been no sale on such exchange or on NASDAQ on such day, the security is valued at the mean between the most recent quoted bid and ask price.
When market quotations are not readily available, any security or other asset is valued at its fair value as determined in good faith under procedures approved by the Board of Trustees (the "Board"). If events occur that will affect the value of a Fund's portfolio securities before the net asset value ("NAV") has been calculated (a "significant event"), the security will generally be priced using a fair value procedure. The Board has adopted specific procedures for valuing portfolio securities and delegated the responsibility of fair value determinations to the Valuation Committee. Some of the factors that may be considered by the Valuation Committee in determining fair value are fundamental analytical data relating to the investment; the nature and duration of any restriction on disposition; trading in similar securities of the same issuer or comparable companies; information from broker-dealers; and an evaluation of the forces that influence the market in which the securities are purchased or sold. As of March 31, 2021, none of the Funds held fair
126
valued securities. In addition, with respect to the valuation of securities principally traded on foreign markets, the Buffalo International Fund uses a fair value pricing service approved by the Funds' Board which employs quantitative models to adjust for "stale" prices caused by the movement of other markets and other factors occurring after the close of the foreign markets, but before the close of the New York Stock Exchange ("NYSE"). As of March 31, 2021, the Buffalo International Fund held 60 securities where a foreign fair value factor was applied, with a market value of $375,801,443 or 68.87% of total net assets.
Debt securities, including treasury bills, commercial paper, corporate and convertible bonds, bank loans, etc., with remaining maturities of 60 days or less are normally valued at the last reported sale price. If there is no trade on the valuation date, then the security will be priced at the mean between the most recent bid and ask prices.
Restricted securities include securities that have not been registered under the Securities Act of 1933, as amended, and securities that are subject to restrictions on resale. The Funds may invest in restricted securities that are consistent with the Funds' investment objectives and investment strategies. In some cases, the issuer of restricted securities has agreed to register such securities for resale, at the issuer's expense either upon demand by the Funds or in connection with another registered offering of the securities. Investments in restricted securities are valued utilizing the Funds' valuation policies.
ASC 820 establishes a three-tier hierarchy to distinguish between (1) inputs that reflect the assumptions market participants would use in pricing an asset or liability developed based on market data obtained from sources independent of the reporting entity (observable inputs) and (2) inputs that reflect the reporting entity's own assumptions about the assumptions market participants would use in pricing an asset or liability developed based on the best information available in the circumstances (unobservable inputs) and to establish classification of fair value measurements for disclosure purposes. Various inputs are used in determining the value of the Funds' investments. The inputs are summarized in the three broad levels listed below:
Level 1 — Valuations based on quoted prices for investments in active markets that a Fund has the ability to access at the measurement date. Valuation adjustments are not applied to Level 1 investments.
Level 2 — Valuations based on other significant observable inputs (including quoted prices for similar securities, interest rates, prepayment speeds, credit risks, etc.).
Level 3 — Valuations based on significant unobservable inputs (including a Fund's own assumptions and judgment in determining the fair value of investments).
Inputs that are used in determining fair value of an investment may include price information, credit data, volatility statistics, and other factors. These inputs can be either observable or unobservable. The availability of observable inputs can vary between investments, and is affected by various factors such as the type of investment, and the volume and level of activity for that investment or similar investments in the market place. The inputs will be considered by Kornitzer Capital Management, Inc. ("Advisor" or "KCM"), the Funds' investment advisor, along with any other relevant factors in the calculation of an investment's fair value. The Funds use prices and inputs that are current as of the measurement date, which may include periods of market dislocations. During these periods, the availability of prices and inputs may be reduced for many investments. This condition could cause an investment to be reclassified between the various levels within the hierarchy.
Non-U.S. equity securities actively traded in foreign markets may be reflected in Level 2 despite the availability of closing prices, because the Funds evaluate and determine whether those closing prices reflect fair value at the close of the NYSE or require adjustment, as described above and in Note 9 — Foreign Investment Risk.
Investments falling into the Level 3 category are primarily supported by quoted prices from brokers and dealers participating in the market for those investments. However, these may be classified as Level 3 investments due to lack of market transparency and corroboration to support these quoted prices. Additionally, valuation models may be used as the pricing source for any remaining investments classified as Level 3. These models rely on one or more significant unobservable inputs and/or significant assumptions made by the Valuation Committee. Inputs used in valuations may include, but are not limited to, financial statement analysis, capital account balances, discount rates and estimated cash flows, and comparable company data.
The inputs or methodology used for valuing securities are not necessarily an indication of the risk associated with investing in those securities.

127

The following table provides the fair value measurement of applicable Fund assets and liabilities by level within the fair value hierarchy as of March 31, 2021. These assets are measured on a recurring basis.
BUFFALO DISCOVERY FUND
| | Level 1 | | Level 2 | | Level 3 | | Total | |
Common Stocks | | $ | 1,697,355,185 | | | | — | | | | — | | | $ | 1,697,355,185 | | |
REITS | | | 54,032,592 | | | | — | | | | — | | | | 54,032,592 | | |
Short Term Investments | | | 30,031,329 | | | | — | | | | — | | | | 30,031,329 | | |
Total* | | $ | 1,781,419,106 | | | $ | — | | | $ | — | | | $ | 1,781,419,106 | | |
BUFFALO DIVIDEND FOCUS FUND
| | Level 1 | | Level 2 | | Level 3 | | Total | |
Common Stocks | | $ | 81,052,997 | | | | — | | | | — | | | $ | 81,052,997 | | |
REITS | | | 4,261,542 | | | | — | | | | — | | | | 4,261,542 | | |
Convertible Preferred Stocks | | | 2,294,000 | | | | — | | | | — | | | | 2,294,000 | | |
Preferred Stocks | | | 382,500 | | | | — | | | | — | | | | 382,500 | | |
Convertible Bonds | | | — | | | | 9,060,796 | | | | — | | | | 9,060,796 | | |
Short Term Investments | | | 3,887,513 | | | | — | | | | — | | | | 3,887,513 | | |
Total* | | $ | 91,878,552 | | | $ | 9,060,796 | | | $ | — | | | $ | 100,939,348 | | |
BUFFALO EARLY STAGE GROWTH FUND
| | Level 1 | | Level 2 | | Level 3 | | Total | |
Common Stocks | | $ | 118,630,429 | | | | — | | | | — | | | $ | 118,630,429 | | |
REITS | | | 2,310,612 | | | | — | | | | — | | | | 2,310,612 | | |
Short Term Investments | | | 16,952,193 | | | | — | | | | — | | | | 16,952,193 | | |
Total* | | $ | 137,893,234 | | | $ | — | | | $ | — | | | $ | 137,893,234 | | |
BUFFALO FLEXIBLE INCOME FUND
| | Level 1 | | Level 2 | | Level 3 | | Total | |
Common Stocks | | $ | 392,949,759 | | | | — | | | | — | | | $ | 392,949,759 | | |
REITS | | | 12,013,652 | | | | — | | | | — | | | | 12,013,652 | | |
Convertible Bonds | | | — | | | | 16,400,948 | | | | — | | | | 16,400,948 | | |
Corporate Bonds | | | — | | | | 2,023,359 | | | | — | | | | 2,023,359 | | |
Short Term Investments | | | 2,081,275 | | | | — | | | | — | | | | 2,081,275 | | |
Total* | | $ | 407,044,686 | | | $ | 18,424,307 | | | $ | — | | | $ | 425,468,993 | | |
Written Options | | $ | 91,012 | | | $ | 34,946 | | | | — | | | $ | 125,958 | | |
BUFFALO GROWTH FUND
| | Level 1 | | Level 2 | | Level 3 | | Total | |
Common Stocks | | $ | 189,964,646 | | | | — | | | | — | | | $ | 189,964,646 | | |
REITS | | | 4,564,885 | | | | — | | | | — | | | | 4,564,885 | | |
Short Term Investments | | | 2,424,521 | | | | — | | | | — | | | | 2,424,521 | | |
Total* | | $ | 196,954,052 | | | $ | — | | | $ | — | | | $ | 196,954,052 | | |
BUFFALO HIGH YIELD FUND
| | Level 1 | | Level 2 | | Level 3 | | Total | |
Preferred Stocks | | $ | 6,035,450 | | | | — | | | | — | | | $ | 6,035,450 | | |
Convertible Bonds | | | — | | | | 44,978,020 | | | | — | | | | 44,978,020 | | |
Corporate Bonds | | | — | | | | 169,987,883 | | | | — | | | | 169,987,883 | | |
Bank Loans | | | — | | | | 30,672,119 | | | | — | | | | 30,672,119 | | |
Short Term Investments | | | 26,100,818 | | | | — | | | | — | | | | 26,100,818 | | |
Total* | | $ | 32,136,268 | | | $ | 245,638,022 | | | $ | — | | | $ | 277,774,290 | | |
128
BUFFALO INTERNATIONAL FUND
| | Level 1 | | Level 2 | | Level 3 | | Total | |
Common Stocks | | $ | 146,546,496 | | | $ | 375,801,443 | | | | — | | | $ | 522,347,939 | | |
Short Term Investments | | | 19,453,902 | | | | — | | | | — | | | | 19,453,902 | | |
Total* | | $ | 541,801,841 | | | $ | — | | | $ | — | | | $ | 541,801,841 | | |
BUFFALO LARGE CAP FUND
| | Level 1 | | Level 2 | | Level 3 | | Total | |
Common Stocks | | $ | 102,570,018 | | | | — | | | | — | | | $ | 102,570,018 | | |
REITS | | | 2,318,082 | | | | — | | | | — | | | | 2,318,082 | | |
Short Term Investments | | | 3,999,235 | | | | — | | | | — | | | | 3,999,235 | | |
Total* | | $ | 108,887,335 | | | $ | — | | | $ | — | | | $ | 108,887,335 | | |
BUFFALO MID CAP FUND
| | Level 1 | | Level 2 | | Level 3 | | Total | |
Common Stocks | | $ | 185,274,476 | | | | — | | | | — | | | $ | 185,274,476 | | |
REITS | | | 3,024,664 | | | | — | | | | — | | | | 3,024,664 | | |
Short Term Investments | | | 1,005,097 | | | | — | | | | — | | | | 1,005,097 | | |
Total* | | $ | 189,304,237 | | | $ | — | | | $ | — | | | $ | 189,304,237 | | |
BUFFALO SMALL CAP FUND
| | Level 1 | | Level 2 | | Level 3 | | Total | |
Common Stocks | | $ | 1,055,548,567 | | | | — | | | | — | | | $ | 1,055,548,567 | | |
REITS | | | 26,228,065 | | | | — | | | | — | | | | 26,228,065 | | |
Short Term Investments | | | 56,852,506 | | | | — | | | | — | | | | 56,852,506 | | |
Total* | | $ | 1,138,629,138 | | | $ | — | | | $ | — | | | $ | 1,138,629,138 | | |
* Additional information regarding the industry and/or geographical classification of these investments is disclosed in the schedule of investments.
B. FEDERAL INCOME TAXES — Each Fund complies with the requirements of Subchapter M of the Internal Revenue Code necessary to qualify as a regulated investment company and makes the requisite distributions of income and capital gains to its shareholders sufficient to relieve it from all or substantially all federal income and excise taxes. Therefore, no federal income tax provision has been provided.
At March 31, 2021, the Funds did not have any tax positions that did not meet the "more likely-than-not" threshold of being sustained by the applicable tax authority. The Funds recognize interest and penalties, if any, related to unrecognized tax benefits as other expense in the Statement of Operations. During the year, the Funds did not incur any interest or penalties.
The Funds have analyzed all open tax years, as defined by the statute of limitations, for all major jurisdictions. Open tax years are those that are open for exam by taxing authorities. Open tax years include the tax years ended March 31, 2018 through March 31, 2021. The Funds have no examinations in progress.
C. INVESTMENT TRANSACTIONS AND INVESTMENT INCOME — Investment transactions are accounted for on the date the securities are purchased or sold (trade date). Dividend income is recorded on the ex-dividend date except that certain dividends for foreign securities where the ex-dividend date may have passed are recorded as soon as the Fund is informed of the dividend in the exercise of reasonable diligence. Interest income is recognized on the accrual basis. Realized gains and losses from investment transactions are reported on the identified cost basis. All discounts/premiums are accreted/amortized for financial reporting purposes and are included in interest income.
D. DISTRIBUTIONS TO SHAREHOLDERS — Distributions to shareholders are recorded on the ex-dividend date. Distributions are determined in accordance with income tax regulations, which may differ from U.S. generally accepted accounting principles ("GAAP"). These differences are primarily due to differing treatments for premium amortization on debt securities, deferral of late year and wash sale losses, and partnership investment income.

129

E. USE OF ESTIMATES — The preparation of financial statements in conformity with GAAP requires management to make estimates and assumptions that affect the amounts reported in the financial statements and accompanying notes. Actual results could differ from such estimates.
F. FOREIGN CURRENCY TRANSLATION — Values of investments denominated in foreign currencies are converted into U.S. dollars using a spot market rate of exchange on the day of valuation. Purchases and sales of investments and dividend and interest income are translated to U.S. dollars using a spot market rate of exchange prevailing on the respective dates of such transactions. The portion of security gains or losses resulting from changes in foreign exchange rates is included with net realized and unrealized gain or loss from investments, as appropriate, for both financial reporting and tax purposes.
G. PURCHASED AND WRITTEN OPTION CONTRACTS — Certain Funds may purchase and write call or put options on securities and indices and enter into related closing transactions. As a holder of a call option, a Fund has the right, but not the obligation, to purchase a security at the exercise price during the exercise period. As the writer of a call option, a Fund has the obligation to sell the security at the exercise price during the exercise period. The Fund's maximum payout in the case of written call option contracts cannot be determined. As a holder of a put option, a Fund has the right, but not the obligation, to sell a security at the exercise price during the exercise period. As the writer of a put option, a Fund has the obligation to buy the underlying security at the exercise price during the exercise period. The Funds did not hold any written put options as of March 31, 2021.
The premium that a Fund pays when purchasing an option or receives when writing an option will reflect, among other things, the market price of the security, the relationship of the exercise price to the market price of the security, the relationship of the exercise price to the volatility of the security, the length of the option period and supply and demand factors. The premium is the market value of an option at the time of purchase.
A purchaser (holder) of a put option pays a non-refundable premium to the seller (writer) of a put option to obtain the right to sell a specified amount of a security at a fixed price (the exercise price) during a specified period (exercise period). Conversely, the seller (writer) of a put option, upon payment by the holder of the premium, has the obligation to buy the security from the holder of the put option at the exercise price during the exercise period.
Exchange traded options are valued at the composite price, using the National Best Bid and Offer quotes ("NBBO"). NBBO consists of the highest bid prices and lowest ask prices across any of the exchanges on which an option is quoted, thus providing a view across the entire U.S. options marketplace. Specifically, composite pricing looks at the last trades on the exchanges where the options are traded. If there are no trades for the option on a given business day, composite option pricing calculates the mean of the highest bid price and lowest ask price across the exchanges where the option is traded. Non exchange traded options also will be valued at the mean between the last bid and ask quotations. For options where market quotations are not readily available, a fair value shall be determined as set forth in the Funds' fair valuation guidelines.
The Funds may use options with the objective to generate income as a non-principal investment strategy. Currently, the Buffalo Flexible Income Fund makes use of the options strategy to a greater extent than the other Funds because high income generation is a primary investment objective of the Buffalo Flexible Income Fund. The primary strategy used by Buffalo Flexible Income Fund to achieve income generation through the use of options is to write covered calls with the strike price above the cost basis and the value the portfolio managers believe will be achieved before the expiration of the option and also at a value that the portfolio managers are willing to sell if the option is exercised. The collected premiums generate income for the Fund, and if the option is exercised, a gain will also be achieved. A risk of using derivatives is that the counterparty to a derivative may fail to comply with their obligation to the Funds. See Note 7 for written option activity.
H. INDEMNIFICATIONS — Under the Funds' organizational documents, officers and trustees are indemnified against certain liabilities arising out of the performance of their duties to the Funds. In addition, in the normal course of business, the Funds enter into contracts that provide general indemnification to other parties. The Funds' maximum exposure under these arrangements is unknown as this would involve future claims that may be made against the Funds that have not yet occurred, and may not occur. However, the Funds have not had prior claims or losses pursuant to these contracts and expect the risk of loss to be remote.
130
I. RECENT ACCOUNTING PRONOUNCEMENTS — In March 2020, FASB issued Accounting Standards Update 2020-04, Reference Rate Reform: Facilitation of the Effects of Reference Rate Reform on Financial Reporting ("ASU 2020-04"). The main objective of ASU 2020-04 is to provide relief to companies that will be impacted by the expected change in benchmark interest rates at the end of 2021, when participating banks will no longer be required to submit London Inter-bank Offered Rate ("LIBOR") quotes by the UK Financial Conduct Authority. ASU 2020-04 allows companies to, provided the only change to existing contracts are a change to an approved benchmark interest rate, account for modifications as a continuance of the existing contract without additional analysis. In addition, derivative contracts that qualified for hedge accounting prior to modification, will be allowed to continue to receive such treatment, even if critical terms change due to a change in the benchmark interest rate. For new and existing contracts, the Funds may elect to apply the amendments as of March 12, 2020 through December 31, 2022. Management is currently assessing the impact of the adoption of ASU 2020-04 to the Funds' financial statements and various filings.
In August 2018, FASB issued ASU 2018-13, Fair Value Measurement (Topic 820): Disclosure Framework — Changes to the Disclosure Requirements for Fair Value Measurement ("ASU 2018-13"). The primary focus of ASU 2018-13 is to improve the effectiveness of the disclosure requirements for fair value measurements. The changes affect all companies that are required to include fair value measurement disclosures. In general, the amendments in ASU 2018-13 are effective for all entities for fiscal years and interim periods within those fiscal years, beginning after December 15, 2019. An entity is permitted to early adopt the removed or modified disclosures upon the issuance of ASU 2018-13 and may delay adoption of the additional disclosures, which are required for public companies only, until their effective date. These updates have been incorporated in the Funds' financial statements and have no impact on each of the Fund's net assets or results of operations.
2. FEDERAL TAX MATTERS:
The tax character of distributions paid during the year ended March 31, 2021 and the year ended March 31, 2020 were as follows:
| | | Year Ended March 31, 2021 | | Year Ended March 31, 2020 | |
| | | Ordinary
Income | | Long-Term
Capital Gains* | | Ordinary
Income | | Return
of Capital | | Long-Term
Capital Gains | |
Buffalo Discovery Fund | | $ | 38,071,743 | | | $ | 97,268,331 | | | $ | 44,023,909 | | | $ | — | | | $ | 192,281,393 | | |
Buffalo Dividend Focus Fund | | | 603,921 | | | | — | | | | 708,148 | | | | 42,916 | | | | — | | |
Buffalo Early Stage Growth Fund | | | 3,781,350 | | | | 8,196,019 | | | | — | | | | — | | | | 4,253,755 | | |
Buffalo Flexible Income Fund | | | 10,003,773 | | | | 4,920,585 | | | | 13,493,126 | | | | — | | | | 2,812,198 | | |
Buffalo Growth Fund | | | — | | | | 9,555,575 | | | | 1,002,914 | | | | — | | | | 21,439,423 | | |
Buffalo High Yield Fund | | | 10,794,072 | | | | — | | | | 8,705,714 | | | | — | | | | — | | |
Buffalo International Fund | | | 1,745,735 | | | | 64,842 | | | | 2,604,701 | | | | — | | | | — | | |
Buffalo Large Cap Fund | | | 226,492 | | | | — | | | | 657,920 | | | | — | | | | 602,377 | | |
Buffalo Mid Cap Fund | | | 1,244,192 | | | | 10,770,947 | | | | — | | | | — | | | | 13,465,597 | | |
Buffalo Small Cap Fund | | | 40,701,261 | | | | 35,400,582 | | | | — | | | | — | | | | 46,863,860 | | |
* The Funds designate as long-term capital gain dividends, pursuant to Internal Revenue Code Section 852(b)(3)(C), the amounts necessary to reduce the earnings and profits of the Funds related to net capital gain to zero for the tax period ended March 31, 2021.
For tax purposes, distributions from short-term capital gain distributions are included in ordinary income distributions.
Additionally, GAAP requires that certain components of net assets relating to permanent differences be reclassified between financial and tax reporting. These reclassifications have no effect on net assets or net asset value per share. For the year ended March 31, 2021, the following table shows the reclassifications made:
| Funds | | Distributable
Earnings | | Paid In
Capital | |
Buffalo Discovery Fund | | $ | (25,670,908 | ) | | $ | 25,670,908 | | |
Buffalo Dividend Focus Fund | | | (33,393 | ) | | | 33,393 | | |
Buffalo Early Stage Growth Fund | | | (970,643 | ) | | | 970,643 | | |
Buffalo Flexible Income Fund | | | (596,731 | ) | | | 596,731 | | |
Buffalo Growth Fund | | | (1,152,264 | ) | | | 1,152,264 | | |

131

| Funds | | Distributable
Earnings | | Paid In
Capital | |
Buffalo High Yield Fund | | $ | (202,037 | ) | | $ | 202,037 | | |
Buffalo International Fund | | | (698,314 | ) | | | 698,314 | | |
Buffalo Large Cap Fund | | | (137,618 | ) | | | 137,618 | | |
Buffalo Mid Cap Fund | | | (1,593,697 | ) | | | 1,593,697 | | |
Buffalo Small Cap Fund | | | (7,812,394 | ) | | | 7,812,394 | | |
The permanent differences primarily relate to net operating losses and utilization of earnings and profit distributions to shareholders on redemption of shares.
As of March 31, 2021, the components of distributable earnings (losses) for income tax purposes were as follows:
| | Buffalo
Discovery
Fund | | Buffalo
Dividend Focus
Fund | | Buffalo
Early
Stage Growth
Fund | | Buffalo
Flexible Income
Fund | | Buffalo
Growth
Fund | |
Tax cost of Investments(a) | | $ | 1,219,821,689 | | | $ | 60,583,938 | | | $ | 91,289,344 | | | $ | 242,962,436 | | | $ | 92,707,801 | | |
Unrealized Appreciation | | | 590,691,327 | | | | 41,258,235 | | | | 49,827,163 | | | | 206,901,667 | | | | 104,901,180 | | |
Unrealized Depreciation | | | (29,093,910 | ) | | | (902,825 | ) | | | (3,223,273 | ) | | | (24,395,110 | ) | | | (654,929 | ) | |
Net unrealized appreciation | | | 561,597,417 | | | | 40,355,410 | | | | 46,603,890 | | | | 182,506,557 | | | | 104,246,251 | | |
Undistributed Ordinary Income | | | 89,977,978 | | | | 459,514 | | | | 4,799,969 | | | | 674,486 | | | | — | | |
Undistributed Long Term
Capital Gain | | | 53,315,779 | | | | 576,165 | | | | 6,416,527 | | | | 10,802,744 | | | | 8,025,977 | | |
Distributable earnings | | | 143,293,757 | | | | 1,035,679 | | | | 11,216,496 | | | | 11,477,230 | | | | 8,025,977 | | |
Other accumulated gain/(loss) | | | (135,809 | ) | | | — | | | | — | | | | (24,933 | ) | | | (109,927 | ) | |
Total distributable earnings | | | 704,755,365 | | | | 41,391,089 | | | | 57,820,386 | | | | 193,958,854 | | | | 112,162,301 | | |
| | Buffalo
High Yield
Fund | | Buffalo
International
Fund | | Buffalo
Large Cap
Fund | | Buffalo
Mid Cap
Fund | | Buffalo
Small Cap
Fund | |
Tax cost of Investments(a) | | $ | 262,378,986 | | | $ | 316,044,769 | | | $ | 48,048,034 | | | $ | 98,437,869 | | | $ | 769,607,747 | | |
Unrealized Appreciation | | | 16,554,615 | | | | 228,910,050 | | | | 61,143,895 | | | | 91,392,428 | | | | 394,821,486 | | |
Unrealized Depreciation | | | (1,159,311 | ) | | | (3,152,978 | ) | | | (304,594 | ) | | | (526,060 | ) | | | (25,800,096 | ) | |
Net unrealized appreciation | | | 15,395,304 | | | | 225,757,072 | | | | 60,839,301 | | | | 90,866,368 | | | | 369,021,390 | | |
Undistributed Ordinary Income | | | 5,595,425 | | | | 122,197 | | | | 693,994 | | | | 3,986,687 | | | | 52,124,491 | | |
Undistributed Long Term
Capital Gain | | | 1,254,762 | | | | — | | | | 439,170 | | | | 8,229,904 | | | | 68,910,030 | | |
Distributable earnings | | | 6,850,187 | | | | 122,197 | | | | 1,133,164 | | | | 12,216,591 | | | | 121,034,521 | | |
Other accumulated gain/(loss) | | | — | | | | (311,106 | ) | | | (4,247 | ) | | | — | | | | — | | |
Total distributable earnings | | | 22,245,491 | | | | 225,568,163 | | | | 61,968,218 | | | | 103,082,959 | | | | 490,055,911 | | |
The differences between book-basis and tax-basis unrealized appreciation/depreciation are attributable primarily to the tax deferral of losses on wash sales, premium amortization, and publicly traded partnership investments.
Other accumulated gain/(loss) is generally comprised of capital loss carryforwards, qualified late year losses and/or straddle loss deferrals.
(a) Represents cost for federal income tax purposes and may differ from the cost for financial reporting purposes.
As of March 31, 2021, the Buffalo Funds had no capital loss carryovers available to offset future taxable gains.
In order to meet certain excise tax distribution requirements, the Funds are required to measure and distribute annually net capital gains realized during a twelve month period ending October 31 and net investment income earned during a twelve month period ending December 31. In connection with this, the Funds are permitted for tax purposes to defer into their next fiscal year qualified late year losses. Qualified late year capital losses are any net capital losses incurred between November 1 and the end of their fiscal year, March 31, 2021. Qualified late year ordinary losses are generally losses incurred between January 1 and the end of their fiscal year, March 31, 2021.
132
At March 31, 2021, the following Funds deferred, on a tax basis, qualified late year losses, consisting of ordinary and capital losses, as follows:
| Funds | | Qualified Late Year
Ordinary Losses | | Qualified Late Year
Capital Losses | |
Buffalo Discovery Fund | | $ | — | | | $ | — | | |
Buffalo Dividend Focus Fund | | | — | | | | — | | |
Buffalo Early Stage Growth Fund | | | — | | | | — | | |
Buffalo Flexible Income Fund | | | — | | | | — | | |
Buffalo Growth Fund | | | 109,927 | | | | — | | |
Buffalo High Yield Fund | | | — | | | | — | | |
Buffalo International Fund | | | — | | | | 334,761 | | |
Buffalo Large Cap Fund | | | 4,247 | | | | — | | |
Buffalo Mid Cap Fund | | | — | | | | — | | |
Buffalo Small Cap Fund | | | — | | | | — | | |
For the year ended March 31, 2021, the Buffalo International Fund earned foreign source income and paid foreign taxes, as noted below, which it intends to pass through to its shareholders pursuant to Section 853 of the Internal Revenue Code.
| | | Gross Foreign
Income | | Foreign Tax
Paid | |
Buffalo International Fund | | | 6,774,252 | | | | 783,546 | | |
3. RELATED PARTY TRANSACTIONS:
Management fees are paid to KCM at the rate of 0.85% per annum of the average daily net asset values of the Funds, except for the Buffalo Early Stage Growth Fund, Buffalo Dividend Focus Fund, Buffalo Growth Fund and Buffalo Large Cap Fund which have a management fee rate of 1.30%, 0.75%, 0.75% and 0.75%, respectively. The management fees are for services which include the costs of all management, supervisory and administrative services required in the normal operation of the Funds. This includes investment management and supervision; fees of the custodian (except for the additional cost of maintaining custody of assets in foreign jurisdictions, when compared to domestic custody costs), independent registered public accounting firm and legal counsel; fees and expenses of officers, trustees and other personnel; rent; and other items incidental to corporate administration. Pursuant to a Master Services Agreement with U.S. Bancorp Fund Services, LLC, doing business as U.S. Bank Global Fund Services ("GFS"), KCM pays GFS a fee of 30/100 of 1% (0.30%) of each Funds' average daily net assets out of the fees KCM receives from the Funds, except for the Buffalo Dividend Focus Fund, Buffalo Growth Fund and the Buffalo Large Cap Fund, where GFS receives 25/100 of 1% (0.25%). GFS provides or obtains various operational services required by the Funds, pays various Fund expenses and acts as paying agent to compensate other Fund service providers. Some of the other Fund service providers are affiliates of GFS.
With respect to the Buffalo Small Cap Fund only, the annual management fee rate of 0.85% of the Buffalo Small Cap Fund's average daily net assets is a base fee paid to KCM that is subject to reduced fees paid on assets in excess of certain levels (breakpoints). The fee paid by KCM to GFS is also subject to breakpoints on assets in excess of certain levels. The breakpoint schedules for the management fees paid by the Buffalo Small Cap Fund to KCM and the fees paid by KCM to GFS are set forth in the following table:
BUFFALO SMALL CAP FUND FEE BREAKPOINTS
| | | (As a % Of Average Daily Net Assets) | |
Asset Level | | Management Fee | | GFS Fee | |
Assets up to $6 billion | | | 0.85 | % | | | 0.300 | % | |
Assets over $6 billion up to $7 billion | | | 0.80 | % | | | 0.275 | % | |
Assets over $7 billion up to $8 billion | | | 0.75 | % | | | 0.250 | % | |
Assets over $8 billion up to $9 billion | | | 0.70 | % | | | 0.225 | % | |
Assets over $9 billion | | | 0.65 | % | | | 0.200 | % | |

133

The management fees do not include the cost of acquiring and disposing of portfolio securities, taxes, if any, imposed directly on the Funds and their shares, insurance, certain trustee expenses and the cost of qualifying the Funds' shares for sale in any jurisdiction. Certain officers of the Funds are also officers and/or directors of KCM. With respect to each Fund's Investor Class, the management fees do not include the shareholder servicing fees.
The Buffalo International Fund incurred $104,852 in custody fees during the period ended March 31, 2021, and owed $20,544 for custody fees as of March 31, 2021.
4. AGGREGATE COMPENSATION TO TRUSTEES:
The Funds do not directly compensate any of their trustees. GFS pays trustee fees to non-interested Board members from its share of the management fee that it receives from KCM. The aggregate compensation paid to the Funds' non-interested trustees for their service on the Funds' Board for the period ended March 31, 2021 was $153,000. Interested trustees who are affiliated with KCM do not receive any compensation from the Funds, but are compensated directly by KCM in connection with their employment with KCM.
5. INVESTMENT TRANSACTIONS:
The aggregate purchases and sales of securities, excluding short-term investments and U.S. government securities, for the Funds for the year ended March 31, 2021, were as follows:
| | | Buffalo
Discovery
Fund | | Buffalo
Dividend Focus
Fund | | Buffalo
Early
Stage Growth
Fund | | Buffalo
Flexible Income
Fund | | Buffalo
Growth
Fund | |
Purchases | | $ | 1,324,352,980 | | | $ | 15,957,944 | | | $ | 48,181,774 | | | $ | 4,794,940 | | | $ | 38,053,620 | | |
Proceeds from Sales | | | 1,661,118,564 | | | | 15,508,511 | | | | 54,396,506 | | | | 119,124,713 | | | | 62,025,126 | | |
| | | Buffalo
High Yield
Fund | | Buffalo
International
Fund | | Buffalo
Large Cap
Fund | | Buffalo
Mid Cap
Fund | | Buffalo
Small Cap
Fund | |
Purchases | | $ | 174,755,564 | | | $ | 69,948,605 | | | $ | 6,220,660 | | | $ | 67,333,004 | | | $ | 597,904,817 | | |
Proceeds from Sales | | | 148,966,100 | | | | 59,475,075 | | | | 11,381,012 | | | | 90,456,750 | | | | 469,196,361 | | |
There were no purchases or sales of long-term U.S. government securities for any Funds during the period ended March 31, 2021.
6. TRANSACTIONS WITH AFFILIATES:
Investments representing 5% or more of the outstanding voting securities of a portfolio company result in that company being considered an affiliated company, as defined in the 1940 Act. There were no affiliated companies held in any of the Funds during the period ended March 31, 2021.
7. SHAREHOLDER SERVICING PLAN:
The Trust, on behalf of the Funds, has adopted a Shareholder Servicing Plan, to pay a fee at an annual rate of up to 0.15% of average daily net assets of the Investor Class shares serviced by shareholder servicing agents who provide administrative and support services to their customers. No shareholder servicing fees are charged to the Institutional Class. For the period ended March 31, 2021, Investor Class shareholder servicing fees were as follows:
Fund: | | Investor Class
Shareholder
Servicing Fee | |
Buffalo Discovery Fund | | $ | 2,080,950 | | |
Buffalo Dividend Focus Fund | | | 40,881 | | |
Buffalo Early Stage Growth Fund | | | 97,160 | | |
Buffalo Flexible Income Fund | | | 426,383 | | |
Buffalo Growth Fund | | | 163,212 | | |
Buffalo High Yield Fund | | | 73,017 | | |
Buffalo International Fund | | | 364,338 | | |
134
Fund: | | Investor Class
Shareholder
Servicing Fee | |
Buffalo Large Cap Fund | | $ | 53,494 | | |
Buffalo Mid Cap Fund | | | 148,659 | | |
Buffalo Small Cap Fund | | | 870,904 | | |
8. OPTIONS WRITTEN:
FASB ASC 815, Derivatives and Hedging (ASC 815) requires disclosures to enable investors to better understand how and why the Funds use derivative instruments, how these derivative instruments are accounted for and their effects on the Funds' financial position and results of operations. The Buffalo Flexible Income Fund is the only Fund that has maintained any positions in derivative instruments or engaged in hedging activities during the year ended March 31, 2021. For the year ended March 31, 2021, the quarterly average gross notional amount of derivatives held by the Fund was $10,581,049, representing holdings in written options. The Fund utilizes these written options as a substitute for a comparable market position in the respective underlying security of the written options.
As of March 31, 2021, the Buffalo Flexible Income Fund was invested in written option contracts.
The following is a summary of the location of derivative investments on the Fund's Statement of Assets and Liabilities as of March 31, 2021:
Derivative Investment Type | | Value | |
Liability Derivatives | |
Buffalo Flexible Income Fund | | | |
Written Options — equity contracts | | $ | 125,958 | | |
The following is a summary of the effect of derivative investments on Realized Gain (loss) and Change in Unrealized Appreciation/Depreciation on Options in the Fund as of March 31, 2021:
Derivative Investment Type | | Realized Gain (Loss) on Options | |
Liability Derivatives | |
Buffalo Flexible Income Fund | | | |
Written Options — equity contracts | | $ | 64,664 | | |
Derivative Investment Type | | Change in Unrealized Appreciation/Depreciation on Options | |
Liability Derivatives | |
Buffalo Flexible Income Fund | | | |
Written Options — equity contracts | | $ | 22,437 | | |
The following table presents derivative assets and liabilities net of amounts available for offset under Master Netting Agreements (MNA) and net of related collateral received or pledged, if any, as of March 31, 2021:
GROSS AMOUNTS NOT OFFSET IN THE STATEMENT OF ASSETS AND LIABILITIES AND SUBJECT TO MNAs
| | | Gross | | Gross
Amounts
Offset In The | | Net Amounts
Presented In | | Gross Amounts Not Offset
In The Statement Of
Financial Position | | | |
Liabilities: | | Amounts Of
Recognized
Liabilities | | Statement
Of Financial
Position | | The Statement
Of Financial
Position | | Financial
Instruments | | Collateral
Pledged/
(Received)* | | Net
Amount | |
Description | |
Written Options | | $ | 125,958 | | | $ | — | | | $ | 125,958 | | | $ | 125,958 | | | $ | 125,958 | | | $ | — | | |
| | | $ | 125,958 | | | $ | — | | | $ | 125,958 | | | $ | 125,958 | | | $ | 125,958 | | | $ | — | | |
* Any over-collateralization of total financial instruments or cash is not shown.
9. FOREIGN INVESTMENT RISK:
When the Buffalo International Fund buys or sells securities on a foreign stock exchange, the transaction is undertaken in the local currency rather than in U.S. dollars. In purchasing or selling local currency to execute

135

transactions on foreign exchanges, the Buffalo International Fund will be exposed to the risk that the value of the foreign currency will increase or decrease, which may impact the value of the portfolio holdings. China has, and may continue to adopt, internal economic policies that affect its currency valuations in a manner that may be disadvantageous for U.S. investors or U.S. companies seeking to do business in China. In addition, a country may impose formal or informal currency exchange controls (or "capital controls"). These types of controls may restrict or prohibit the Buffalo International Fund's ability to repatriate both investment capital and income, which could undermine the value of the portfolio holdings and potentially place the Buffalo International Fund's assets at risk of total loss.
Investing in securities of foreign corporations and governments involves additional risks relating to: political, social, religious and economic developments abroad; market instability; fluctuations in foreign exchange rates; different regulatory requirements, market practices, accounting standards and practices; and less publicly available information about foreign issuers. Additionally, these investments may be less liquid, carry higher brokerage commissions and other fees, and procedures and regulations governing transactions and custody in foreign markets also may involve delays in payment, delivery or recovery of money or investments. Investments in common stocks of U.S. companies with international operations, and the purchase of sponsored or unsponsored ADRs (American Depositary Receipt) carry similar risks. In addition to risks associated with investing in foreign securities, there are special risks associated with investments in China and Hong Kong, including exposure to currency fluctuations, less liquidity, expropriation, confiscatory taxation, nationalization, exchange control regulations, differing legal standards and rapid fluctuations in inflation and interest rates. The Chinese government could, at any time, alter or discontinue economic reform programs implemented since 1978.
10. LINE OF CREDIT:
U.S. Bank, N.A. has made available to the Funds an unsecured line of credit pursuant to a Loan Agreement for the Funds which matures, unless renewed, on July 30, 2021. The line of credit is intended to provide short-term financing, if necessary, subject to certain restrictions, in connection with shareholder redemptions. The Funds may borrow up to the lesser of $50,000,000 or certain percentage amounts based on the net assets of the Funds.
The interest rate paid by the Funds on outstanding borrowings is equal to the Prime Rate. As of March 31, 2021, the Prime Rate was 3.25%. During the year ended March 31, 2021, the Buffalo Flexible Income Fund had average outstanding borrowings of $3,178 under the credit facility and paid a weighted average interest rate of 3.25%, totaling $104.72 which is included in the other expenses on the Statement of Operations. During the year ended March 31, 2021, the Buffalo Mid Cap Fund had average outstanding borrowings of $9,395 under the credit facility and paid a weighted average interest rate of 3.25%, totaling $310 which is included in the other expenses on the Statement of Operations. The July 6, 2020 balance of $3,429,000 for the Buffalo Mid Cap Fund was the maximum borrowing during the year ended March 31, 2021. None of the other Buffalo Funds had borrowings under the credit facility during the year ended March 31, 2021.
11. IMPACT OF COVID-19:
The global outbreak of COVID-19 has disrupted economic markets and the prolonged economic impact is uncertain. The operational and financial performance of the issuers of securities in which the Funds invest depends on future developments, including the duration and spread of the outbreak, and such uncertainty may in turn impact the value of a Fund's investments. The rapid development and fluidity of this situation precludes any prediction as to the ultimate adverse impact of COVID-19. Nevertheless, COVID-19 presents material uncertainty and risk with respect to the Funds' performance and financial results.
12. SUBSEQUENT EVENTS:
Management has evaluated the events and transactions that have occurred after March 31, 2021 and through the date the financial statements were issued.
Effective April 8, 2021, due to the resignation of Mr. Alexander Hancock, Mr. Ken Laudan has been added as the Portfolio Manager of the Buffalo Large Cap Fund and Messrs. Robert Male and Jamie Cuellar continue to serve as Co-Portfolio Managers of the Buffalo Small Cap Fund.
136
REPORT OF INDEPENDENT REGISTERED PUBLIC ACCOUNTING FIRM
To the Shareholders and the Board of Trustees of Buffalo Funds
Opinion on the Financial Statements
We have audited the accompanying statements of assets and liabilities of the Buffalo Funds (the "Trust") (comprising the Buffalo Discovery Fund, Buffalo Dividend Focus Fund, Buffalo Early Stage Growth Fund (formerly, Buffalo Emerging Opportunities Fund), Buffalo Flexible Income Fund, Buffalo Growth Fund, Buffalo High Yield Fund, Buffalo International Fund, Buffalo Large Cap Fund, Buffalo Mid Cap Fund, and Buffalo Small Cap Fund (collectively referred to as the "Funds")), including the schedules of investments, as of March 31, 2021, and the related statements of operations for the year then ended, the statements of changes in net assets for each of the two years in the period then ended, the financial highlights for each of the five years in the period then ended and the related notes (collectively referred to as the "financial statements"). In our opinion, the financial statements present fairly, in all material respects, the financial position of each of the Funds comprising the Buffalo Funds at March 31, 2021, the results of their operations for the year then ended, the changes in their net assets for each of the two years in the period then ended and their financial highlights for each of the five years in the period then ended, in conformity with U.S. generally accepted accounting principles.
Basis for Opinion
These financial statements are the responsibility of the Trust's management. Our responsibility is to express an opinion on each of the Funds' financial statements based on our audits. We are a public accounting firm registered with the Public Company Accounting Oversight Board (United States) ("PCAOB") and are required to be independent with respect to the Trust in accordance with the U.S. federal securities laws and the applicable rules and regulations of the Securities and Exchange Commission and the PCAOB.
We conducted our audits in accordance with the standards of the PCAOB. Those standards require that we plan and perform the audit to obtain reasonable assurance about whether the financial statements are free of material misstatement, whether due to error or fraud. The Trust is not required to have, nor were we engaged to perform, an audit of the Trust's internal control over financial reporting. As part of our audits we are required to obtain an understanding of internal control over financial reporting but not for the purpose of expressing an opinion on the effectiveness of the Trust's internal control over financial reporting. Accordingly, we express no such opinion.
Our audits included performing procedures to assess the risks of material misstatement of the financial statements, whether due to error or fraud, and performing procedures that respond to those risks. Such procedures included examining, on a test basis, evidence regarding the amounts and disclosures in the financial statements. Our procedures included confirmation of securities owned as of March 31, 2021, by correspondence with the custodian, brokers, and agent banks or by other appropriate auditing procedures where replies from brokers and agent banks were not received. Our audits also included evaluating the accounting principles used and significant estimates made by management, as well as evaluating the overall presentation of the financial statements. We believe that our audits provide a reasonable basis for our opinion.

We have served as the auditor of the Buffalo Funds since 1994.
Kansas City, Missouri
May 26, 2021

137
NOTICE TO SHAREHOLDERS (UNAUDITED)
MARCH 31, 2021
TAX INFORMATION
For the fiscal year ended March 31, 2021, certain dividends paid by the Funds may be subject to a maximum tax rate of 23.8%, as provided for by the Jobs and Growth Tax Relief Reconciliation Act of 2003. The percentage of dividends declared from ordinary income designated as qualified dividend income was as follows (unaudited):
Buffalo Discovery Fund | | | 3.98 | % | |
Buffalo Dividend Focus Fund | | | 100.00 | % | |
Buffalo Early Stage Growth Fund | | | 2.27 | % | |
Buffalo Flexible Income Fund | | | 100.00 | % | |
Buffalo Growth Fund | | | 0.00 | % | |
Buffalo High Yield Fund | | | 1.37 | % | |
Buffalo International Fund | | | 100.00 | % | |
Buffalo Large Cap Fund | | | 100.00 | % | |
Buffalo Mid Cap Fund | | | 11.35 | % | |
Buffalo Small Cap Fund | | | 1.31 | % | |
For corporate shareholders, the percent of ordinary income distributions qualifying for the corporate dividends received deduction for the fiscal year ended March 31, 2021 was as follows (unaudited):
Buffalo Discovery Fund | | | 3.73 | % | |
Buffalo Dividend Focus Fund | | | 100.00 | % | |
Buffalo Early Stage Growth Fund | | | 2.16 | % | |
Buffalo Flexible Income Fund | | | 100.00 | % | |
Buffalo Growth Fund | | | 0.00 | % | |
Buffalo High Yield Fund | | | 1.37 | % | |
Buffalo International Fund | | | 0.00 | % | |
Buffalo Large Cap Fund | | | 100.00 | % | |
Buffalo Mid Cap Fund | | | 10.32 | % | |
Buffalo Small Cap Fund | | | 1.31 | % | |
FOREIGN SHAREHOLDERS: The percentage of taxable ordinary income distributions that are designated as short-term capital gain distributions under Internal Revenue Section 871(k)(2)(C) for the year ended March 31, 2021 was as follows (unaudited).
Buffalo Discovery Fund | | | 100.00 | % | |
Buffalo Dividend Focus Fund | | | 11.90 | % | |
Buffalo Early Stage Growth Fund | | | 100.00 | % | |
Buffalo Flexible Income Fund | | | 11.90 | % | |
Buffalo Growth Fund | | | 0.00 | % | |
Buffalo High Yield Fund | | | 0.70 | % | |
Buffalo International Fund | | | 0.00 | % | |
Buffalo Large Cap Fund | | | 0.00 | % | |
Buffalo Mid Cap Fund | | | 100.00 | % | |
Buffalo Small Cap Fund | | | 100.00 | % | |

138
With respect to the taxable year ended March 31, 2021, the Funds hereby designate as capital gain dividends the amounts listed below, or, if subsequently determined to be different, the net capital gains of such year:
Funds | | From long-term capital
gains, subject to the 15%
rate gains category: | | From long-term capital
gains, using proceeds from
shareholder redemptions: | |
Buffalo Discovery Fund | | $ | 97,268,331 | | | $ | 25,670,908 | | |
Buffalo Dividend Focus Fund | | | — | | | | 33,393 | | |
Buffalo Early Stage Growth Fund | | | 8,196,019 | | | | 970,643 | | |
Buffalo Flexible Income Fund | | | 4,920,585 | | | | 596,731 | | |
Buffalo Growth Fund | | | 9,555,575 | | | | 1,284,170 | | |
Buffalo High Yield Fund | | | — | | | | 202,227 | | |
Buffalo International Fund | | | 64,842 | | | | 698,314 | | |
Buffalo Large Cap Fund | | | — | | | | 137,618 | | |
Buffalo Mid Cap Fund | | | 10,770,947 | | | | 1,593,697 | | |
Buffalo Small Cap Fund | | | 35,400,582 | | | | 8,726,321 | | |

139
Trustees and Officers of the Funds
The management and affairs for the Funds are supervised by the Board of Trustees ("Trustees") under the laws of the State of Delaware. The Trustees and executive officers of the Funds and their principal occupations for the last five years are set forth below. Each may have held other positions with the named companies during that period. The Funds' Statement of Additional Information includes additional information about the Trustees and is available without charge, upon request, by calling the Funds toll-free at 1-800-49-BUFFALO.
Name, Age and Address | | Position(s) Held
with Funds | | Term of Office
and Length of
Time Served | | Principal Occupation(s)
During Past Five Years | | Number of
Portfolios in
Fund Complex
Overseen by
Trustee | | Other Directorships
Held by Trustee During
the Past Five Years | |
INTERESTED TRUSTEES(1) | | | | | | | | | | | |
Robert J. Male
5420 West 61st Place
Shawnee Mission, KS 66205
Year of Birth: 1963 | | Trustee | | Indefinite term and served since April 2020. | | Portfolio Manager, Kornitzer Capital Management, Inc. (management company) 1991-present. | | | 10 | | | | None | | |
INDEPENDENT TRUSTEES | | | | | | | | | | | |
Philip J. Kennedy
5420 West 61st Place
Shawnee Mission, KS 66205
Year of Birth: 1945 | | Trustee | | Indefinite term and served since May 1995. | | Business Consultant | | | 10 | | | | None | | |
Rachel F. Lupardus
5420 West 61st Place
Shawnee Mission, KS 66205
Year of Birth: 1972 | | Trustee | | Indefinite term and served since October 2015. | | Chief Operating Officer/Chief Financial Officer, Trozzolo Communications Group (marketing communications agency), 2015-present; Chief Financial Officer, Customer Engagement, KBM Group LLC (marketing services company) 2014-2015. | | | 10 | | | | None | | |
Jeffrey D. Yowell
5420 West 61st Place
Shawnee Mission, KS 66205
Year of Birth: 1967 | | Chairman
Trustee | | One year term and served since December 2017.
Indefinite term and served since October 2015. | | President and Owner, Getter Farms, LLC (agriculture and farm-related operations), 2007-present. | | | 10 | | | | None | | |
OFFICERS | | | | | | | | | | | |
Kent Gasaway
5420 West 61st Place
Shawnee Mission, KS 66205
Year of Birth: 1960 | | President and Treasurer | | One year term and served since April 2020. | | Portfolio Manager, Kornitzer Capital Management, Inc. (management company) 1991-present. | | | N/A | | | | None | | |
Fred Coats
5420 West 61st Place
Shawnee Mission, KS 66205
Year of Birth: 1965 | | Chief Compliance Officer
Anti-Money Laundering Officer
Secretary | | Indefinite term and served since May 2015.
Indefinite term and served since May 2015.
Indefinite term and served since August 2019. | | Chief Compliance Officer, Kornitzer Capital Management, Inc. (management company) May 2015-present; Private Practice Attorney May 1993-present. | | | N/A | | | | None | | |
1 Mr. Robert J. Male is deemed to be an interested person of the Funds as that term is defined in the 1940 Act, by virtue of the fact that he is an employee and stockholder of the Advisor.

140
A NOTE ON FORWARD-LOOKING STATEMENTS
Except for historical information contained in this annual report for the Funds, the matters discussed in this report may constitute forward-looking statements made pursuant to the safe harbor provisions of the Securities Litigation Reform Act of 1995. These include any advisor and/or portfolio manager predictions, assessments, analyses or outlooks for individual securities, industries, market sectors and/or markets. These statements involve risks and uncertainties. In addition to the general risks described for the Funds in the current Prospectus, other factors bearing on these reports include the accuracy of the Advisor's or portfolio managers' forecasts and predictions, and the appropriateness of the investment programs designed by the Advisor or portfolio manager to implement their strategies efficiently and effectively. Any one or more of these factors, as well as other risks affecting the securities markets and investment instruments generally, could cause the actual results of the Funds to differ materially as compared to benchmarks associated with the Funds.
ADDITIONAL INFORMATION
The Buffalo Funds have adopted proxy voting policies and procedures that delegate to Kornitzer Capital Management, Inc., the Funds' investment advisor, the authority to vote proxies. A description of the Buffalo Funds' proxy voting policies and procedures is available without charge, upon request, by calling the Funds toll free at 1-800-49-BUFFALO. A description of these policies and procedures is also included in the Funds' Statement of Additional Information, which is available on the SEC's website at http://www.sec.gov.
The actual voting records relating to portfolio securities during the most recent twelve month period ended June 30 (as filed with the SEC on Form N-PX) are available without charge, upon request, by calling the Funds toll free at 1-800-49-BUFFALO or by accessing the SEC's website at http://www.sec.gov.
The Funds file their complete schedule of portfolio holdings with the SEC four times each fiscal year at quarter-ends. The Trust files the Schedule of Portfolio Holdings with the SEC on Form N-CSR (second and fourth quarters) and as an exhibit to its reports on Form N-PORT (first and third quarters). Shareholders may view the Funds' Forms N-CSR and N-PORT on the SEC's website at http://www.sec.gov.

141
APPROVAL OF INVESTMENT
ADVISORY CONTRACTS
The Board of Trustees (the "Trustees") of Buffalo Funds, a Delaware statutory trust, on behalf of its series, Buffalo Flexible Income Fund, Buffalo High Yield Fund, Buffalo Large Cap Fund, Buffalo Small Cap Fund, Buffalo Growth Fund, Buffalo Discovery Fund, Buffalo Mid Cap Fund, Buffalo Early Stage Growth Fund, Buffalo International Fund and Buffalo Dividend Focus Fund (all such funds referred to collectively as the "Funds") met on November 19, 2020 to consider the renewal of the Amended and Restated Management Agreements (the "Agreements") between the Trust, on behalf of the Funds, and Kornitzer Capital Management, Inc., the Funds' investment adviser (the "Adviser" or "KCM"). In advance of the meeting, the Trustees requested and received materials to assist them in considering the renewal of the Agreements. The materials provided contained information with respect to the factors enumerated below, including a copy of the Agreements, a memorandum prepared by the Trust's outside legal counsel discussing the Trustees' fiduciary obligations and the factors they should assess in considering the renewal of the Agreements, detailed comparative information relating to the management fees, overall expenses and performance of the Funds, due diligence materials relating to the Adviser (including the Adviser's Form ADV, information regarding key personnel, information relating to the Adviser's and the Funds' compliance programs, including risk management, and the Code of Ethics), select financial information of KCM, other comparative performance and fee information, information that the Adviser regularly provides to the Trustees in connection with reports on its activities and the activities of the Funds at the Trustees' periodic Board meetings, and other pertinent information. In addition, the Independent Trustees, as defined below, met with their independent counsel on November 10, 2020 and immediately prior to the Board meeting held on November 19, 2020, to review and discuss the information provided to them and their duties and responsibilities in connection with the renewal of the Agreements. Based on their evaluation of information provided by the Adviser, in conjunction with the Funds' other service providers, the Trustees, by a unanimous vote (including a separate vote of the Trustees who are not "interested persons," as that term is defined in the Investment Company Act of 1940, as amended (the "Independent Trustees")), approved the renewal of the
Agreements for an additional term of one year ending November 30, 2021.
In considering the renewal of the Agreements, the Trustees reviewed and analyzed various factors that they determined were relevant, including the factors enumerated below.
1. Nature, Extent and Quality of Services Provided to the Funds
The Trustees considered the nature, extent and quality of services provided by KCM to the Funds and the amount of time devoted to the Funds' affairs by KCM's staff. The Trustees considered KCM's specific responsibilities in all aspects of day-to-day management of the Funds, including the investment strategies implemented by KCM, as well as the qualifications, experience and responsibilities of the Funds' portfolio managers and other key personnel at KCM involved in the day-to-day activities of the Funds. In executive session the Independent Trustees reviewed information provided by KCM in response to the Board's 15(c) Request for Information, including the structure of KCM's compliance program and KCM's continuing commitment to the growth of the Funds' assets. The Trustees noted during the course of the prior year they had met with representatives of KCM in person to discuss the Funds' performance and outlook, along with the marketing and compliance efforts made by KCM throughout the year. The Trustees also noted any services that extended beyond portfolio management, and they considered the trading capability of KCM, and the lack of both significant shareholder complaints and financial statement issues. The Trustees discussed KCM's handling of compliance matters, including the quarterly and annual reports of the Trust's chief compliance officer to the Trustees on the effectiveness of KCM's compliance program. The Trustees also considered KCM's implementation and operational effectiveness of its business continuity plan in response to the novel coronavirus (COVID-19) pandemic and challenges to day-to-day operations in a predominately work-from-home environment. The Trustees concluded that KCM had sufficient quality and depth of personnel, resources, investment methods and compliance policies and procedures essential to performing its duties under the Agreements and that the nature, overall quality and extent of the management services provided to the Funds, as well as KCM's compliance program, were satisfactory.

142
2. Investment Performance of the Funds and KCM
In assessing the quality of the portfolio management services delivered by KCM, the Trustees compared the short-term and longer-term performance of the Investor Class shares of each Fund on both an absolute basis and in comparison to a benchmark index and in comparison to a peer group as constructed using data from Morningstar, Inc. (each a "Morningstar Peer Group").
Buffalo Discovery Fund. The Trustees noted the Buffalo Discovery Fund's performance for the ten-year period ended September 30, 2020 was above the median for the Morningstar Peer Group of U.S. open-end mid cap growth funds, falling within the second quartile of the Morningstar Peer Group. The Trustees also noted the Buffalo Discovery Fund's performance for the year-to-date, one-year, three-year and five-year periods was below the median for the Morningstar Peer Group, falling into the third quartile of the Morningstar Peer Group for the year-to-date period and within the fourth quartile of the Morningstar Peer Group for the one-year, three-year and five-year periods ended September 30, 2020. The Trustees further noted for the since inception period ended September 30, 2020, the Buffalo Discovery Fund outperformed the Morningstar US Mid Growth Total Return Index, the Russell Midcap Growth Total Return Index and the Lipper Multi Cap Growth Funds Index. The Trustees also noted the Buffalo Discovery Fund underperformed the Morningstar US Mid Growth Total Return Index, the Russell Midcap Growth Total Return Index and the Lipper Multi Cap Growth Funds Index for the year-to-date, one-year, five-year and ten-year periods ended September 30, 2020. The Trustees also compared the performance of the Buffalo Discovery Fund to that of other accounts managed by KCM using investment strategies substantially similar to that of the Fund, and noted for all periods the performance of the Fund was comparable to that of the other accounts, noting the performance for the other accounts was presented gross of fees.
Buffalo Dividend Focus Fund. The Trustees noted the Buffalo Dividend Focus Fund's performance for the five-year period ended September 30, 2020 was above the median for the Morningstar Peer Group of U.S. open-end large blend category funds, falling within the second quartile of the Morningstar Peer Group. The Trustees further noted the Buffalo Dividend Focus Fund's performance for the year-to-date, one-year and three-year periods ended September 30, 2020 was below the median for the Morningstar Peer Group, falling into the
third quartile for each period. The Trustees further noted that for the one-year, three-year, five-year and since inception periods ended September 30, 2020, the Buffalo Dividend Focus Fund outperformed the Lipper Equity Income Funds Index. The Trustees noted that the Buffalo Dividend Focus Fund had underperformed the Morningstar US Large-Mid TR Index and the S&P 500 Index for the year-to-date, one-year, three-year, five-year and since inception periods ended September 30, 2020.
Buffalo Early Stage Growth Fund. The Trustees noted the Buffalo Early Stage Growth Fund's performance for the year-to-date, one-year, three-year, five-year and ten-year periods ended September 30, 2020 was above the median for the Morningstar Peer Group of U.S. open-end small growth funds, falling into the first quartile for the five-year and ten-year periods and within the second quartile for the year-to-date, one-year and three-year periods. The Trustees next noted for the year-to-date, one-year, three-year, five-year, ten-year and since inception periods ended September 30, 2020, the Buffalo Early Stage Growth Fund outperformed the Lipper Small Cap Growth Funds Index and the Russell 2000 Growth Total Return Index. The Trustees further noted that the Buffalo Early Stage Growth Fund outperformed the Morningstar US Small Growth Index for the year-to-date, one-year, three-year, five-year and ten-year periods ended September 30, 2020, but had slightly underperformed the Morningstar US Small Growth Index for the since inception period ended September 30, 2020.
Buffalo Flexible Income Fund. The Trustees noted the Buffalo Flexible Income Fund's performance for the year-to-date, one-year, three-year, five-year and ten-year periods ended September 30, 2020 was below the median for the Morningstar Peer Group of U.S. open-end allocation 85%+ equity funds, falling within the fourth quartile of the Morningstar Peer Group for each period. The Trustees next noted for the year-to-date, one-year, three-year, five-year, ten-year and since inception periods ended September 30, 2020, the Buffalo Flexible Income Fund underperformed the Lipper Mixed-Asset Target Allocation Moderate Funds Index and the ICE BofAML US High Yield Master II Index. The Trustees also noted that the Buffalo Flexible Income Fund underperformed a blended index of 60% Morningstar U.S. Large Cap Index and 40% ICE BofAML US High Yield Master II Index, a blended index of 60% S&P 500 Index and 40% ICE BofAML US High Yield Master II Index and the Morningstar US Large Cap Index for all periods ended September 30, 2020.

143
Buffalo Growth Fund. The Trustees noted the Buffalo Growth Fund's performance for the year-to-date, one-year, three-year, five-year and ten-year periods ended September 30, 2020 was below the median for the Morningstar Peer Group of U.S. open-end large growth funds, falling within the third quartile of the Morningstar Peer Group for each period. The Trustees next noted that for the since-inception period ended September 30, 2020, the Buffalo Growth Fund outperformed the Lipper Large Cap Growth Funds Index and the Russell 1000 Growth Index. The Trustees further noted that for the year-to-date, one-year, three-year, five-year and ten-year periods ended September 30, 2020, the Buffalo Growth Fund underperformed the Morningstar US Growth Index, the Lipper Large Cap Growth Funds Index and the Russell 1000 Growth Index. The Trustees also compared the performance of the Buffalo Growth Fund to that of other accounts managed by KCM using investment strategies substantially similar to that of the Fund and noted for all periods the performance of the Fund was comparable to that of the other accounts, noting that the performance for the other accounts was presented gross of fees.
Buffalo High Yield Fund. The Trustees noted the Buffalo High Yield Fund's performance for the year-to-date, one-year and three-year periods ended September 30, 2020, was above the Morningstar Peer Group of U.S. open-end high yield bond funds, falling within the first quartile for the year-to-date and one-year periods and within the second quartile for the three-year period. The Trustees then noted the Buffalo High Yield Fund's performance for the five-year and ten-year periods ended September 30, 2020 was below the median of the Morningstar Peer Group, falling within the third quartile of the Morningstar Peer Group for the ten-year period, and within the fourth quartile for the five-year period. The Trustees next noted for the year-to-date, one-year and three-year periods ended September 30, 2020, the Buffalo High Yield Fund outperformed the Lipper High Yield Bond Funds Index and the ICE BofAML US High Yield Master II Index, but had underperformed each Index for the five-year and ten-year periods ended September 30, 2020. The Trustees further noted that for the since-inception period ended September 30, 2020, the Buffalo High Yield Fund outperformed the Lipper High Yield Bond Funds Index, but had underperformed the ICE BofAML US High Yield Master II Index.
Buffalo International Fund. The Trustees noted the Buffalo International Fund's performance for the year-to-date and one-year periods ended September 30, 2020 was in line with the median for the Morningstar Peer Group of
U.S. open-end foreign large growth funds, and for the three-year, five-year and ten-year periods ended September 30, 2020 was above the Morningstar Peer Group median, noting the Fund's performance was in the first quartile for the five-year and ten-year periods, and within the second quartile for the three-year period. The Trustees further noted for the year-to-date, one-year, three-year, five-year, ten-year and since-inception periods ended September 30, 2020, the Buffalo International Fund outperformed the Lipper International Funds Index and the Morningstar Global Markets ex-US Index. The Trustees also compared the performance of the Buffalo International Fund to that of other accounts managed by KCM using investment strategies substantially similar to that of the Fund and noted for all periods the performance of the Fund was comparable to that of the other accounts, noting that the performance for the other accounts was presented gross of fees.
Buffalo Large Cap Fund. The Trustees noted the Buffalo Large Cap Fund's performance for the three-year, five-year and ten-year periods ended September 30, 2020 was generally in line with the median for the Morningstar Peer Group of U.S. open-end large growth funds. The Trustees then noted that the Buffalo Large Cap Fund's performance for the year-to-date and one-year periods ended September 30, 2020 was below the Morningstar Peer Group median and fell within the third quartile for each period. The Trustees next noted that for the since-inception period ended September 30, 2020, the Buffalo Large Cap Fund outperformed the Lipper Large Cap Growth Funds Index but underperformed slightly the Russell 1000 Growth Total Return Index. The Trustees further noted that for the year-to-date, one-year, three-year, five-year and ten-year periods ended September 30, 2020, the Buffalo Large Cap Fund underperformed the Morningstar US Large Growth Total Return Index, the Lipper Large Cap Growth Funds Index and the Russell 1000 Growth Total Return Index. The Trustees also compared the performance of the Buffalo Large Cap Fund to that of other accounts managed by KCM using investment strategies substantially similar to that of the Fund and noted for all periods the performance of the Fund was comparable to that of the other accounts, noting that the performance for the other accounts was presented gross of fees.
Buffalo Mid Cap Fund. The Trustees noted the Buffalo Mid Cap Fund's performance for the year-to-date, one-year, three-year, five-year and ten-year periods ended September 30, 2020 was below the median for the Morningstar Peer Group of U.S. open-end mid-cap

144
growth funds, falling within the third quartile for the year-to-date, one-year, three-year and five-year periods ended September 30, 2020, and within the fourth quartile for the ten-year period. The Trustees also noted the Buffalo Mid Cap Fund underperformed the Lipper Mid Cap Growth Funds Index, the Morningstar US Mid Growth Index and the Russell Midcap Growth Total Return Index for the year-to-date, one-year, three-year, five-year, ten-year and since-inception periods ended September 30, 2020. The Trustees also compared the performance of the Buffalo Mid Cap Fund to that of other accounts managed by KCM using investment strategies substantially similar to that of the Fund and noted for all periods the performance of the Fund was comparable to that of the other accounts, noting that the performance for the other accounts was presented gross of fees.
Buffalo Small Cap Fund. The Trustees noted the Buffalo Small Cap Fund's performance for the year-to-date, one-year, three-year, five-year and ten-year periods ended September 30, 2020 was above the median of the Morningstar Peer Group of U.S. open-end small growth funds, falling within the first quartile of the Morningstar Peer Group for each period. The Trustees further noted that for the year-to-date, one-year, three-year, five-year, ten-year and since-inception periods ended September 30, 2020, the Buffalo Small Cap Fund outperformed the Russell 2000 Growth Total Return Index, the Lipper Small Cap Growth Funds Index, and the Morningstar US Small Growth Index. The Trustees also compared the performance of the Buffalo Small Cap Fund to that of other accounts managed by KCM using investment strategies substantially similar to that of the Fund and noted for all periods the performance of the Fund was comparable to that of the other accounts, noting that the performance for the other accounts was presented gross of fees.
After considering all of the information including specific responses regarding Fund performance, including KCM's efforts to improve performance of underperforming Funds, the Trustees concluded that the performance obtained by KCM for the Funds was satisfactory under current market conditions and in light of each Fund's investment objective, strategies and policies. Although past performance is not a guarantee or indication of future results, the Trustees determined that the Funds and their shareholders were likely to benefit from KCM's continued management.
3. Costs of Services Provided and Profits Realized by KCM
The Trustees considered the cost of services and the structure of KCM's fees, including a review of the expense analyses and other pertinent material with respect to the Funds. The Trustees reviewed related statistical information, including the comparative expenses, expense components and peer group selections. The Trustees considered the cost structure of each Fund relative to its Morningstar Peer Group.
The Trustees also considered the overall profitability of the Funds to KCM and examined the level of profits that could be expected to accrue to KCM from the fees payable under the Agreements, as well as the Funds' brokerage commissions and use of soft dollars by KCM. The Trustees also considered the profitability of each Fund before and after any distribution costs borne by KCM. These considerations were based on materials requested by the Trustees specifically for the meeting, as well as the presentations made by KCM over the course of the year.
In reviewing the Morningstar 15(c) materials, the Board noted the Institutional Class shares of the Buffalo Funds operate under a unitary fee structure whereby many of the Funds' ordinary operating expenses are paid by KCM out of its advisory fee rather than paid directly by the Funds. The Board noted the difficulty of comparing the Buffalo Funds' to non-unitary fee funds and observed that the advisory fee comparison in the Board materials which used the management fee excluding the fees paid by KCM to U.S. Bancorp Fund Services, LLC under a master servicing agreement, and referred to below as the net management fee, was the most appropriate. The Board also noted the net expense ratio used in the Morningstar comparative data excludes any 12b-1 fees imposed by other funds.
Buffalo Discovery Fund. The Trustees noted the Buffalo Discovery Fund's net management fee of 0.55% fell within the first quartile and was below both the Morningstar Peer Group average of 0.77% and the Morningstar Peer Group median of 0.75%. The Trustees further noted the net expense ratio of 0.86% for the Buffalo Discovery Fund fell in the second quartile, below the Morningstar Peer Group average of 0.91%, which also fell in the second quartile. Based on a profitability analysis prepared by KCM, the Trustees concluded that KCM's profit from sponsoring the Discovery Fund had not been, and

145
currently was not, excessive and that KCM maintained adequate profit levels to support its services to the Fund.
Buffalo Dividend Focus Fund. The Trustees noted the Buffalo Dividend Focus Fund's net management fee of 0.50% was below both the Morningstar Peer Group median of 0.70% and the Morningstar Peer Group average of 0.70%. The Trustees further noted the net expense ratio of 0.80% for the Buffalo Dividend Focus Fund fell into the second quartile, below the Morningstar Peer Group average of 0.89%, which also fell into the second quartile. Based on a profitability analysis prepared by KCM, the Trustees concluded while KCM was not realizing profits in connection with its management of the Dividend Focus Fund, KCM maintained adequate profit levels to support its services to the Fund from the revenues of its overall investment advisory business.
Buffalo Early Stage Growth Fund. The Trustees noted the Buffalo Early Stage Growth Fund's net management fee of 1.00% was above the Morningstar Peer Group average of 0.81% and median of 0.85%. The Trustees further noted the net expense ratio of 1.35% for the Buffalo Early Stage Growth Fund fell within the fourth quartile, above the Morningstar Peer Group average of 1.08%, which fell into the third quartile. The Trustees noted that based on information provided by KCM, the Early Stage Growth Fund would more closely align with a micro-cap category, but Morningstar does not have such a category and is therefore included in the small growth category. Based on a profitability analysis prepared by KCM, the Trustees concluded that while KCM was not realizing profits in connection with its management of the Early Stage Growth Fund, KCM maintained adequate profit levels to support its services to the Fund from the revenues of its overall investment advisory business.
Buffalo Flexible Income Fund. The Trustees noted the Buffalo Flexible Income Fund's net management fee of 0.55% fell within the second quartile and was below the Morningstar Peer Group average of 0.58% and median of 0.60%. The Trustees further noted the net expense ratio of 0.86% for the Buffalo Flexible Income Fund fell within the second quartile, above the Morningstar Peer Group average of 0.77%, which also fell within the second quartile. Based on a profitability analysis prepared by KCM, the Trustees concluded that KCM's profits from sponsoring the Flexible Income Fund had not been, and currently were not excessive and that KCM maintained adequate profit levels to support its services to the Fund.
Buffalo Growth Fund. The Trustees noted the Buffalo Growth Fund's net management fee of 0.50% fell within the first quartile, below the Morningstar Peer Group average of 0.67% and median of 0.70%. The Trustees further noted the net expense ratio of 0.78% for the Buffalo Growth Fund fell within the second quartile, below the Morningstar Peer Group average of 0.86%, which fell in the third quartile. Based on a profitability analysis prepared by KCM, the Trustees concluded that KCM's profits from sponsoring the Growth Fund had not been, and currently were not excessive and that KCM maintained adequate profit levels to support its services to the Fund.
Buffalo High Yield Fund. The Trustees noted the Buffalo High Yield Fund's net management fee of 0.55% was equal to the Morningstar Peer Group median and below the average of 0.57%. The Trustees further noted the net expense ratio of 0.88% for the Buffalo High Yield Fund fell at the bottom of the fourth quartile, above the Morningstar Peer Group average of 0.74%, which fell within the second quartile. Based on a profitability analysis prepared by KCM, the Trustees concluded that KCM's profit from sponsoring the High Yield Fund had not been, and currently was not, excessive and that KCM maintained adequate profit levels to support its services to the Fund.
Buffalo International Fund. The Trustees noted the Buffalo International Fund's net management fee of 0.55% fell in the first quartile, below the Morningstar Peer Group average and median of 0.75%. The Trustees further noted the net expense ratio of 0.88% for the Buffalo International Fund fell within the second quartile, below the Morningstar Peer Group average of 0.90%, which fell between the second and third quartiles, and the Morningstar Peer Group median of 0.90%. Based on a profitability analysis prepared by KCM, the Trustees concluded that KCM's profits, before distribution costs, were not excessive and that KCM maintained adequate profit levels to support its services to the Fund.
Buffalo Large Cap Fund. The Trustees noted the Buffalo Large Cap Fund's net management fee of 0.50% fell into the first quartile, below the Morningstar Peer Group average of 0.66% and the Morningstar Peer Group median of 0.65%. The Trustees further noted the net expense ratio of 0.80% for the Buffalo Large Cap Fund fell within the second quartile, below the Morningstar Peer Group average of 0.87%, which fell within the third quartile, and the Morningstar Peer Group median of

146
0.86%. Based on a profitability analysis prepared by KCM, the Trustees concluded that KCM's profits from sponsoring the Large Cap Fund had not been, and currently were not excessive and that KCM maintained adequate profit levels to support its services to the Fund.
Buffalo Mid Cap Fund. The Trustees noted the Buffalo Mid Cap Fund's net management fee of 0.55% fell within the first quartile, below the Morningstar Peer Group average of 0.76% and median of 0.75%. The Trustees further noted the net expense ratio of 0.89% for the Buffalo Mid Cap Fund fell in the second quartile, below the Morningstar Peer Group average of 0.99%, which fell within the third quartile, and below the median of 0.96%. Based on a profitability analysis prepared by KCM, the Trustees concluded that while KCM was not realizing profits in connection with its management of the Mid Cap Fund, KCM maintained adequate profit levels to support its services to the Fund from the revenues of its overall investment advisory business.
Buffalo Small Cap Fund. The Trustees noted the Buffalo Small Cap Fund's net management fee of 0.55% fell within the first quartile and was below the Morningstar Peer Group average of 0.78% and Morningstar Peer Group median of 0.79%. The Trustees further noted the net expense ratio of 0.86% for the Buffalo Small Cap Fund fell within the second quartile and was below the Morningstar Peer Group average of 0.98%, which also fell within the second quartile and below the Morningstar Peer Group median of 0.99%. The Trustees further noted the annual management fee is subject to reduced fees paid on assets in excess of certain levels. Based on a profitability analysis prepared by KCM, the Trustees concluded that KCM's profit from sponsoring the Small Cap Fund had not been, and currently was not, excessive and that KCM maintained adequate profit levels to support its services to the Fund.
The Trustees concluded that each Fund's expenses and the management fees paid to KCM were fair and reasonable in light of the comparative performance, expense and management fee information. The Trustees further concluded that KCM's profit from sponsoring the Funds had not been, and currently was not, excessive and that KCM maintained adequate profit levels to support the services to the Funds.
4. Extent of Economies of Scale as the Funds Grow
The Trustees compared each Fund's expenses relative to its peer group and discussed realized and potential economies of scale. In considering the economies of
scale for each Fund, the Board considered that the Buffalo Funds' Institutional Class shares operate under a unitary fee structure whereby many of the Funds' ordinary operating expenses are paid by KCM out of its advisory fee rather than being paid directly by the Funds.
Buffalo Discovery Fund. The Trustees reviewed the structure of the Buffalo Discovery Fund's management fee and total expense ratio, and considered whether the Fund was large enough to generate economies of scale for shareholders or whether economies of scale would be expected to be realized as Fund assets grow (and if so, how those economies of scale were being or would be shared with shareholders). The Trustees noted the Buffalo Discovery Fund's management fee structure did not contain any breakpoint reductions as the Fund's assets grow in size, but that the feasibility of incorporating breakpoints would continue to be reviewed on a regular basis.
Buffalo Dividend Focus Fund. The Trustees reviewed the structure of the Buffalo Dividend Focus Fund's management fee and total expense ratio, and considered whether the Fund was large enough to generate economies of scale for shareholders or whether economies of scale would be expected to be realized as Fund assets grow (and if so, how those economies of scale were being or would be shared with shareholders). The Trustees noted the Buffalo Dividend Focus Fund's management fee structure did not contain any breakpoint reductions as the Fund's assets grow in size, but that the feasibility of incorporating breakpoints would continue to be reviewed on a regular basis.
Buffalo Early Stage Growth Fund. The Trustees reviewed the structure of the Buffalo Early Stage Growth Fund's management fee and total expense ratio, and considered whether the Fund was large enough to generate economies of scale for shareholders or whether economies of scale would be expected to be realized as Fund assets grow (and if so, how those economies of scale were being or would be shared with shareholders). The Trustees noted the Buffalo Early Stage Growth Fund's management fee structure did not contain any breakpoint reductions as the Fund's assets grow in size, but that the feasibility of incorporating breakpoints would continue to be reviewed on a regular basis.
Buffalo Flexible Income Fund. The Trustees reviewed the structure of the Buffalo Flexible Income Fund's management fee and total expense ratio, and considered whether the Fund was large enough to generate

147
economies of scale for shareholders or whether economies of scale would be expected to be realized as Fund assets grow (and if so, how those economies of scale were being or would be shared with shareholders). The Trustees noted the Buffalo Flexible Income Fund's management fee structure did not contain any breakpoint reductions as the Fund's assets grow in size, but that the feasibility of incorporating breakpoints would continue to be reviewed on a regular basis.
Buffalo Growth Fund. The Trustees reviewed the structure of the Buffalo Growth Fund's management fee and total expense ratio, and considered whether the Fund was large enough to generate economies of scale for shareholders or whether economies of scale would be expected to be realized as Fund assets grow (and if so, how those economies of scale were being or would be shared with shareholders). The Trustees noted the Buffalo Growth Fund's management fee structure did not contain any breakpoint reductions as the Fund's assets grow in size, but that the feasibility of incorporating breakpoints would continue to be reviewed on a regular basis.
Buffalo High Yield Fund. The Trustees reviewed the structure of the Buffalo High Yield Fund's management fee and total expense ratio, and considered whether the Fund was large enough to generate economies of scale for shareholders or whether economies of scale would be expected to be realized as Fund assets grow (and if so, how those economies of scale were being or would be shared with shareholders). The Trustees noted the Buffalo High Yield Fund's management fee structure did not contain any breakpoint reductions as the Fund's assets grow in size, but that the feasibility of incorporating breakpoints would continue to be reviewed on a regular basis.
Buffalo International Fund. The Trustees reviewed the structure of the Buffalo International Fund's management fee and total expense ratio, and considered whether the Fund was large enough to generate economies of scale for shareholders or whether economies of scale would be expected to be realized as Fund assets grow (and if so, how those economies of scale were being or would be shared with shareholders). The Trustees noted the Buffalo International Fund's management fee structure did not contain any breakpoint reductions as the Fund's assets grow in size, but that the feasibility of incorporating breakpoints would continue to be reviewed on a regular basis.
Buffalo Large Cap Fund. The Trustees reviewed the structure of the Buffalo Large Cap Fund's management fee and total expense ratio, and considered whether the Fund was large enough to generate economies of scale for shareholders or whether economies of scale would be expected to be realized as Fund assets grow (and if so, how those economies of scale were being or would be shared with shareholders). The Trustees noted the Buffalo Large Cap Fund's management fee structure did not contain any breakpoint reductions as the Fund's assets grow in size, but that the feasibility of incorporating breakpoints would continue to be reviewed on a regular basis.
Buffalo Mid Cap Fund. The Trustees reviewed the structure of the Buffalo Mid Cap Fund's management fee and total expense ratio, and considered whether the Fund was large enough to generate economies of scale for shareholders or whether economies of scale would be expected to be realized as Fund assets grow (and if so, how those economies of scale were being or would be shared with shareholders). The Trustees noted the Buffalo Mid Cap Fund's management fee structure did not contain any breakpoint reductions as the Fund's assets grow in size, but that the feasibility of incorporating breakpoints would continue to be reviewed on a regular basis.
Buffalo Small Cap Fund. The Trustees reviewed the structure of the Buffalo Small Cap Fund's management fee and total expense ratio, and considered whether the Fund was large enough to generate economies of scale for shareholders or whether economies of scale would be expected to be realized as Fund assets grow (and if so, how those economies of scale were being or would be shared with shareholders). The Trustees further noted the Buffalo Small Cap Fund's management fee structure contained breakpoint reductions as the Fund's assets grow in size.
The Trustees concluded that the current fee structure for each Fund was reasonable and reflected a sharing of economies of scale between KCM and each Fund at each Fund's current asset levels.
5. Benefits Derived from the Relationship with the Funds
The Trustees considered the direct and indirect benefits that could be received by KCM from its association with the Funds. The Trustees examined the brokerage and commissions of KCM with respect to the Funds. The Trustees concluded that the benefits KCM may receive,

148
such as greater name recognition, growth in separate account management services, greater exposure to press coverage, or increased ability to obtain research or brokerage services, appear to be reasonable, and may benefit the Funds through growth in assets.
CONCLUSIONS
The Trustees considered all of the foregoing factors. In considering the Agreements, the Trustees did not identify
any one factor as all-important, but rather considered these factors collectively in light of the Funds' surrounding circumstances and concluded that the Funds and their shareholders would benefit from the Adviser's continued management. Based on this review, the Trustees, including a majority of the Independent Trustees, approved the renewal of the Agreements with the Funds as being in the best interests of the Funds and their shareholders.

149
PRIVACY POLICY (UNAUDITED)
This Privacy Policy has been adopted by the Buffalo Funds. The Funds are each an open-end diversified management investment company registered under the Investment Company Act of 1940 (the "1940 Act").
This Privacy Policy has also been adopted by KCM, an investment advisor registered with the Securities and Exchange Commission that serves as the investment advisor and manager of the Funds.
The Funds and the Adviser are collectively referred to as the "Companies," "we," "our" or "us."
As a part of providing you services and products we collect non-public personally identifiable information ("Personal Information") about you. Some of this is information you provide and some is obtained from other sources. In some circumstances, a necessary part of providing products and services to you requires that we disclose Personal Information about you to third parties.
We want you to understand how we handle your Personal Information. Please read the Privacy Policy carefully. It has information about our policies for the collection, use, disclosure, and protection of your Personal Information. If you have any questions, you can obtain additional information from the following:
Buffalo Funds
c/o U.S. Bancorp Fund Services, LLC
P.O. Box 701
Milwaukee, Wisconsin 53201-0701
www.buffalofunds.com
1-800-492-8332
Please be aware that we periodically update or revise the Privacy Policy. As methods of doing business change, we reflect any applicable changes in our Privacy Policy. If you are our customer, we will send you an update as and when it occurs.
SALE/DISCLOSURE OF YOUR PERSONAL INFORMATION
We promise that we will not sell your Personal Information to any person.
Also, we will not disclose your Personal Information to any third person aside from the disclosures described below. These disclosures generally relate to marketing or maintaining products or services provided to you.
WHAT INFORMATION DO WE COLLECT?
Personal, Financial and Product Information
To be able to offer, provide and maintain these products and services, the Companies collect a variety of Personal Information about you. The Personal Information we collect will vary depending upon the product or service you select.
The following is a general list of the Personal Information. Not all of the Personal Information will be collected every time you do business with us.
Personal Information
• Name
• Address
• Birthdate
• Phone number
• Social Security Number
• E-mail address
• Product-Related Personal Information
• Product Activity History (things you have done with your mutual funds such as deposits, transfers, redemptions, etc.)
GENERAL PRIVACY PROCESSES
How do we collect Personal Information?
We use a variety of methods to collect Personal Information. We collect Personal Information directly from you with paper forms (for example, new account and other administrative forms), over the phone or through facsimile transmissions. We also collect Personal Information from our web site and through other electronic means. We collect some Personal Information through joint marketing programs where we offer a product or service through another financial institution. In some of these instances, you may be considered a customer of both entities.
Who has access to this Personal Information?
Generally, only the Companies' staff and certain companies working on the Companies' behalf have access to this Personal Information.

150
Those Working on Our Behalf
Depending on the product or service you select, there may be a number of third parties that will have access to your Personal Information since they are working on our behalf. This access is necessary because these third parties perform a task or provide administrative services for the product you seek or have purchased from us. If we do not share the Personal Information, we cannot provide you the product or service you requested. In certain cases, affiliates are the entities performing such services on our behalf.
When we share Personal Information with non-affiliated companies working on our behalf, we protect your Personal Information by requiring such companies to adopt our privacy policy or have a policy providing protection similar to ours.
Required Disclosures
Certain Personal Information may also be disclosed to third parties without your consent if disclosure is necessary to comply with: 1) legal processes; 2) to protect the rights, property, or personal safety of the Funds, their shareholders or the public; 3) as part of inspections or examinations conducted by our regulatory agencies; and 4) in other situations required by law.
Joint Marketing
In certain circumstances, the Companies may jointly market a product or service with another financial institution. In these circumstances, we have arranged to offer our products through these entities and their representatives or through electronic systems (for example, the Internet).
The Companies may make other disclosures authorized by law.
Requested Disclosures
We will disclose your Personal Information if you request it to those persons that you designate. Examples of this are to: members of your family; registered investment advisors, attorneys and CPAs who you have retained to advise you in a transaction; and persons whom you have designated to represent you in dealings with us.
What do we do with the Personal Information?
The Companies make use of the Personal Information to provide you with the financial products and services that we offer.
At the point that you cease being a customer, we will maintain your Personal Information and handle it just the same as our current customers.
The Companies restrict access to the Personal Information to those who need to know it for ordinary business purposes. We also maintain physical, electronic, and procedural safeguards that comply with federal standards to guard your Personal Information.
What are your options regarding corrections of Personal Information?
Generally, upon your written request, we will make available Personal Information for your review. Please note, Personal Information collected that relates to a disputed claim or legal proceeding will not be made available. If you notify us that the Personal Information is incorrect, we will review it and if we agree, correct our records. If we do not agree, you may submit a short comment, which we will include in future third party disclosures, if any occur, of Personal Information.

151

This page intentionally left blank.
152
This page intentionally left blank.

153


1-800-49-BUFFALO
(1-800-492-8332)
Buffalo Funds
c/o U.S. Bancorp Fund Services, LLC
P.O. Box 701
Milwaukee, WI 53201-0701
www.buffalofunds.com
Buffalofundannual
Item 2. Code of Ethics.
The Registrant has adopted a code of ethics that applies to the Registrant’s principal executive officer and principal financial officer. The Registrant has not made any amendments to its code of ethics during the period covered by this report. The Registrant has not granted any waivers from any provisions of the code of ethics during the period covered by this report. A copy of the Registrant’s Code of Ethics is incorporated by reference to the Registrant’s Form N-CSR filed on June 3, 2011.
Item 3. Audit Committee Financial Expert.
The Registrant’s Board of Trustees has determined that there is at least one audit committee financial expert serving on its audit committee. The name of the audit committee financial experts are Philip J. Kennedy and Rachel F. Lupardus. Both Mr. Kennedy and Ms. Lupardus are “independent” as defined in Item 3(a)(2) of Form N-CSR.
Item 4. Principal Accountant Fees and Services.
The registrant has engaged its principal accountant to perform audit services, audit-related services, tax services and other services during the past two fiscal years. “Audit services” refer to performing an audit of the registrant's annual financial statements or services that are normally provided by the accountant in connection with statutory and regulatory filings or engagements for those fiscal years. “Audit-related services” refer to the assurance and related services by the principal accountant that are reasonably related to the performance of the audit. “Tax services” refer to professional services rendered by the principal accountant for tax compliance, tax advice, and tax planning. There were no “Other services” provided by the principal accountant. The following table details the aggregate fees billed or expected to be billed for each of the last two fiscal years for audit fees, audit-related fees, tax fees and other fees by the principal accountant.
| | FYE 03/31/2021 | FYE 03/31/2020 |
| ( a ) Audit Fees | $229,000 | $223,000 |
| ( b ) Audit-Related Fees | $7,600 | $7,600 |
| ( c ) Tax Fees | $38,000 | $36,500 |
| ( d ) All Other Fees | $0 | $0 |
(e)(1) The audit committee has adopted pre-approval policies and procedures that require the audit committee to pre-approve all audit and non-audit services of the registrant, including services provided to any entity affiliated with the registrant.
(e)(2) The percentage of fees billed by Ernst & Young LLP applicable to non-audit services pursuant to waiver of pre-approval requirement were as follows:
| | FYE 03/31/2021 | FYE 03/31/2020 |
| Audit-Related Fees | 0% | 0% |
| Tax Fees | 0% | 0% |
| All Other Fees | 0% | 0% |
(f) All of the principal accountant’s hours spent on auditing the registrant’s financial statements were attributed to work performed by full-time permanent employees of the principal accountant.
(g) The following table indicates the non-audit fees billed or expected to be billed by the registrant’s accountant for services to the registrant and to the registrant’s investment adviser (and any other controlling entity, etc.—not sub-adviser) for the last two years.
| Non-Audit Related Fees | FYE 3/31/2021 | FYE 3/31/2020 |
| Registrant | N/A | N/A |
| Registrant’s Investment Adviser | N/A | N/A |
(h) The audit committee of the board of trustees/directors has considered whether the provision of non-audit services that were rendered to the registrant's investment adviser is compatible with maintaining the principal accountant's independence and has concluded that the provision of such non-audit services by the accountant has not compromised the accountant’s independence.
(i) Not applicable
(j) Not applicable
Item 5. Audit Committee of Listed Registrants.
Not applicable to registrants who are not listed issuers (as defined in Rule 10A-3 under the Securities Exchange Act of 1934).
Item 6. Investments.
| (a) | Schedule of Investments is included as part of the report to shareholders filed under Item 1 of this Form. |
Item 7. Disclosure of Proxy Voting Policies and Procedures for Closed-End Management Investment Companies.
Not applicable to open-end investment companies.
Item 8. Portfolio Managers of Closed-End Management Investment Companies.
Not applicable to open-end investment companies.
Item 9. Purchases of Equity Securities by Closed-End Management Investment Company and Affiliated Purchasers.
Not applicable to open-end investment companies.
Item 10. Submission of Matters to a Vote of Security Holders.
There have been no material changes to the procedures by which shareholders may recommend nominees to the registrant’s Board of Trustees.
Item 11. Controls and Procedures.
| (a) | The Registrant’s [President/Principal Executive Officer] and [Treasurer/Principal Financial Officer] have reviewed the Registrant's disclosure controls and procedures (as defined in Rule 30a-3(c) under the Investment Company Act of 1940 (the “Act”)) as of a date within 90 days of the filing of this report, as required by Rule 30a-3(b) under the Act and Rules 13a-15(b) or 15d-15(b) under the Securities Exchange Act of 1934. Based on their review, such officers have concluded that the disclosure controls and procedures are effective in ensuring that information required to be disclosed in this report is appropriately recorded, processed, summarized and reported and made known to them by others within the Registrant and by the Registrant’s service provider. |
| (b) | There were no changes in the Registrant's internal control over financial reporting (as defined in Rule 30a-3(d) under the Act) that occurred during the period covered by this report that have materially affected, or are reasonably likely to materially affect, the Registrant's internal control over financial reporting. |
Item 12. Disclosure of Securities Lending Activities for Closed-End Management Investment Companies
Not applicable to open-end investment companies.
Item 13. Exhibits.
(2) Certifications pursuant to Section 302(a) of the Sarbanes-Oxley Act of 2002 are filed herewith.
(3) Not applicable because the Registrant is an open-end investment company.
(4) There was no change in the registrant’s independent public accountant for the period covered by this report.
SIGNATURES
Pursuant to the requirements of the Securities Exchange Act of 1934 and the Investment Company Act of 1940, the registrant has duly caused this report to be signed on its behalf by the undersigned, thereunto duly authorized.
Buffalo Funds
| By | /s/ Kent W. Gasaway | |
| | Kent W. Gasaway | |
| | President and Treasurer | |
Pursuant to the requirements of the Securities Exchange Act of 1934 and the Investment Company Act of 1940, this report has been signed below by the following person on behalf of the registrant and in the capacities and on the date indicated.
Buffalo Funds
| By | /s/ Kent W. Gasaway | |
| | Kent W. Gasaway | |
| | President and Treasurer | |