 J U L Y 2 0 0 6 P R O J E C T A L P H A HIGHLY CONFIDENTIAL Review of Special Committee Analysis and Assumptions |
 P R O J E C T A L P H A English_General This presentation was prepared exclusively for the benefit and internal use of the JPMorgan client to whom it is directly addressed and delivered (including such client’s subsidiaries, the “Company”) in order to assist the Company in evaluating, on a preliminary basis, the feasibility of a possible transaction or transactions and does not carry any right of publication or disclosure, in whole or in part, to any other party. This presentation is for discussion purposes only and is incomplete without reference to, and should be viewed solely in conjunction with, the oral briefing provided by JPMorgan. Neither this presentation nor any of its contents may be disclosed or used for any other purpose without the prior written consent of JPMorgan. The information in this presentation is based upon any management forecasts supplied to us and reflects prevailing conditions and our views as of this date, all of which are accordingly subject to change. JPMorgan’s opinions and estimates constitute JPMorgan’s judgment and should be regarded as indicative, preliminary and for illustrative purposes only. In preparing this presentation, we have relied upon and assumed, without independent verification, the accuracy and completeness of all information available from public sources or which was provided to us by or on behalf of the Company or which was otherwise reviewed by us. In addition, our analyses are not and do not purport to be appraisals of the assets, stock, or business of the Company or any other entity. JPMorgan makes no representations as to the actual value which may be received in connection with a transaction nor the legal, tax or accounting effects of consummating a transaction. Unless expressly contemplated hereby, the information in this presentation does not take into account the effects of a possible transaction or transactions involving an actual or potential change of control, which may have significant valuation and other effects. Notwithstanding anything herein to the contrary, the Company and each of its employees, representatives or other agents may disclose to any and all persons, without limitation of any kind, the U.S. federal and state income tax treatment and the U.S. federal and state income tax structure of the transactions contemplated hereby and all materials of any kind (including opinions or other tax analyses) that are provided to the Company relating to such tax treatment and tax structure insofar as such treatment and/or structure relates to a U.S. federal or state income tax strategy provided to the Company by JPMorgan. JPMorgan’s policies prohibit employees from offering, directly or indirectly, a favorable research rating or specific price target, or offering to change a rating or price target, to a subject company as consideration or inducement for the receipt of business or for compensation. JPMorgan also prohibits its research analysts from being compensated for involvement in investment banking transactions except to the extent that such participation is intended to benefit investors. IRS Circular 230 Disclosure: JPMorgan Chase & Co. and its affiliates do not provide tax advice. Accordingly, any discussion of U.S. tax matters included herein (including any attachments) is not intended or written to be used, and cannot be used, in connection with the promotion, marketing or recommendation by anyone not affiliated with JPMorgan Chase & Co. of any of the matters addressed herein or for the purpose of avoiding U.S. tax-related penalties. JPMorgan is a marketing name for investment banking businesses of JPMorgan Chase & Co. and its subsidiaries worldwide. Securities, syndicated loan arranging, financial advisory and other investment banking activities are performed by a combination of J.P. Morgan Securities Inc., J.P. Morgan plc, J.P. Morgan Securities Ltd. and the appropriately licensed subsidiaries of JPMorgan Chase & Co. in Asia-Pacific, and lending, derivatives and other commercial banking activities are performed by JPMorgan Chase Bank, N.A. JPMorgan deal team members may be employees of any of the foregoing entities. This presentation does not constitute a commitment by any JPMorgan entity to underwrite, subscribe for or place any securities or to extend or arrange credit or to provide any other services. |
 P R O J E C T A L P H A English_Fairness or valuation Goldman Sachs does not provide legal, tax or accounting advice. Any tax statements made herein were not intended or written to be used, and can not be used, for the purpose of avoiding penalties imposed on the relevant taxpayer for noncompliance of U.S. federal tax laws. Clients of Goldman Sachs considering the information discussed herein should obtain their own independent tax advice based on their particular circumstances. Goldman Sachs is committed to managing securities offerings such that our clients are treated fairly and to conducting our business with integrity and according to proper standards. Our policy is that the pricing of bookbuilt securities offerings and allocations to investors should be transparent to the issuer or seller(s), consistent with our responsibilities to our investing clients. We will endeavor to make available to the issuer or seller(s) relevant information to make its own, independent decision with respect to the price, structure, timing and other terms of the offering. The investors to whom we allocate securities may also be clients of Goldman Sachs or have other relationships with the firm. To the extent that actual or potential conflicts arise between the interests of such investors and those of the issuer or seller(s), we will endeavor in good faith to manage such conflicts fairly. We will not make allocations as an inducement for the payment of excessive compensation in respect of unrelated services, in consideration of the past or future award of corporate finance business, or expressly or implicitly conditional upon the receipt of other orders for investments or the purchase of other services. Where we underwrite an offering or otherwise guarantee a price in connection with an offering, we will take into account our prudential responsibilities to manage our risk properly when determining allocations and their manner and timing. |
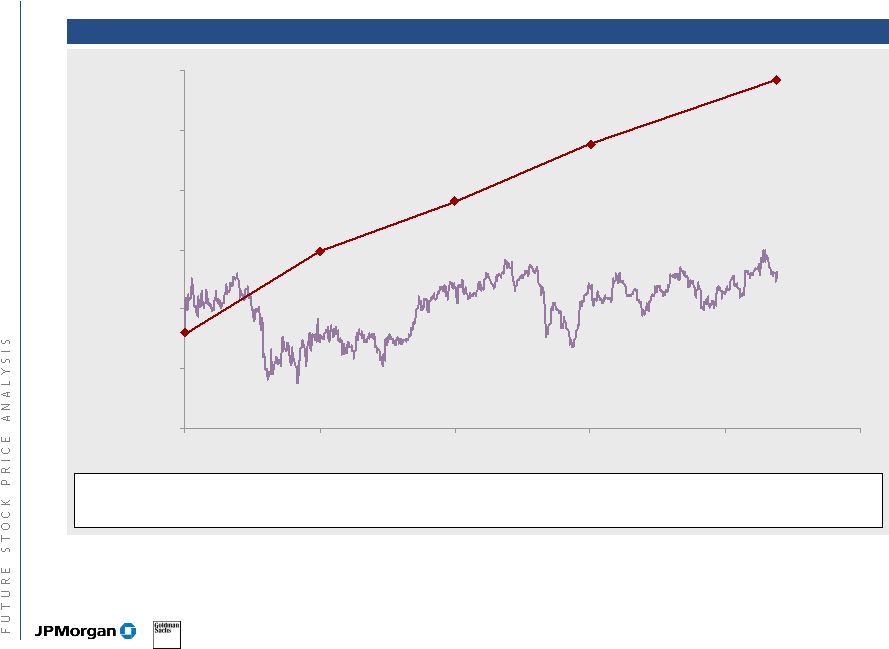
 P R O J E C T A L P H A Executive summary JPMorgan and Goldman Sachs understand that Credit Suisse has reviewed with the Special Committee, among other things, Alpha’s stand-alone alternatives and intrinsic value, using the management case financials Value from stand-alone alternatives measured by an assessment of future potential stock price both with and without a large share repurchase Intrinsic value determined by a discounted cash flow analysis JPMorgan and Goldman Sachs believe that the assessment of future stock price is an inappropriate valuation methodology Inherently academic and subjective with value being created through arbitrage between assumed stock price growth and selected discount rate Core assumption is contradicted by 4.5 years of actual trading history The Credit Suisse share repurchase analysis compounds the impact of the future stock price assessment methodology Even more “value” generated on paper through selected enhanced inputs and the period of time the model is allowed to run Besides the inherent unreliability of a future stock price assessment, JPMorgan and Goldman Sachs disagree with various assumptions used in Credit Suisse’ share repurchase analysis, including: Credit Suisse analysis assumes built-in multiple expansion by applying an average historical P/E multiple, which implies FV/EBITDA multiple expansion into the future Disregards impact on cost of equity of a substantially riskier investment from higher leverage Quantitative output doesn’t factor feasibility of execution, negative consequences of a buyback of 40% of outstanding shares (including potential liquidity constraints), ownership consequences of a non-pro rata tender and advisability of operating as a highly leveraged public company JPMorgan and Goldman Sachs believe that there are several assumptions being used in the Credit Suisse DCF analysis that are yielding results above true intrinsic value Credit Suisse analysis adjusts acquisition assumptions and assumes aggressive terminal value multiple which yields an excessively high terminal growth rate JPMorgan and Goldman Sachs believe that using only the management case financials in performing a stand-alone or intrinsic value assessment is incomplete Management case assumes organic growth, capital intensity declines and margin expansion improvements over historical results Management's forecasting / budgeting philosophy is to set stretch goals 2006 YTD actual results are trending below the management case estimate 1 |
 P R O J E C T A L P H A Valuation range summary Price per share Credit Suisse case Adjusted Credit Suisse case JPMorgan/ Goldman Sachs case Unaffected stock price (as of 4/28/06) $28.11 Offer price $32.00 Future stock price analysis $31.00—$33.00 $29.19—$32.94 Not valid analysis Share buyback $31.00—$36.00 $30.71—$32.23 $29.81—$30.21 Discounted cash flow $34.00—$40.00 $26.62—$37.54 $26.62—$37.54 2 |
 Agenda Page P R O J E C T A L P H A Appendix Review of management projections Discounted cash flow analysis Leveraged recap analysis Future stock price analysis 3 3 10 16 20 25 |
 P R O J E C T A L P H A $0.97 $1.19 $1.26 $1.39 $1.53 2001 2002 2003 2004 2005 Alpha historical EPS Historically, Alpha stock price has not appreciated in-line with EPS growth and forward P/E has been declining Historical 12-month forward P/E 13.0x 14.0x 15.0x 16.0x 17.0x 18.0x 19.0x 04/28/03 01/27/04 10/27/04 07/28/05 04/28/06 Source: Company filings and Factset Source: Tradeline Note: CAGR based on stock price performance over 4.5 years; Alpha IPO price of $23 and price as of 4/28/06 of $28.11 Source: Factset Average historical P/E 1 year 15.8x 2 years 16.1x 3 years 16.5x Stock price performance since IPO $15 $20 $25 $30 $35 12/11/01 01/14/03 02/18/04 03/24/05 04/28/06 Alpha historical EBITDA $648 $730 $838 $836 $895 2001 2002 2003 2004 2005 4 |
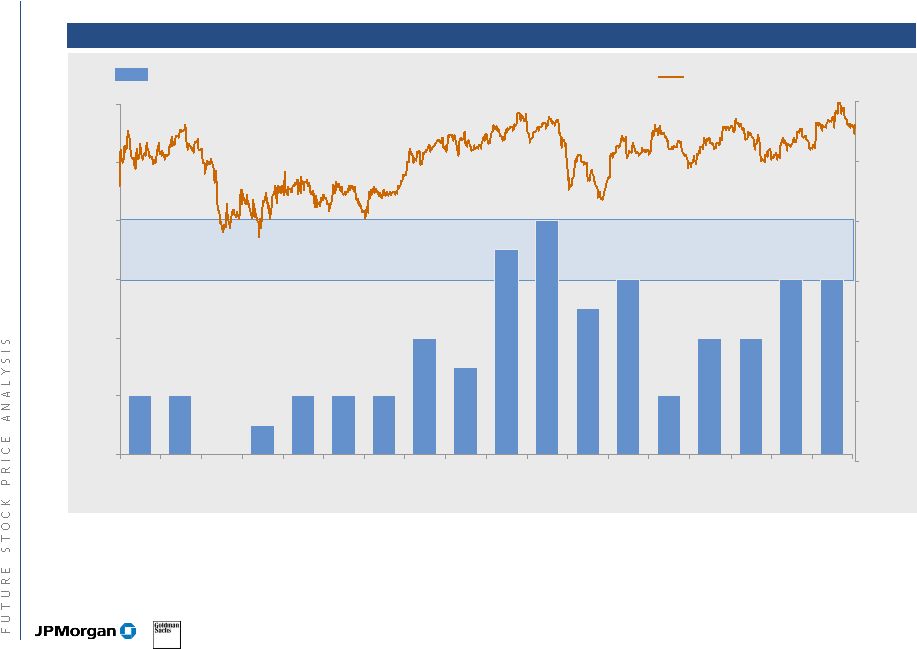 P R O J E C T A L P H A Organic growth remains the primary driver of Alpha’s stock price… Alpha stock price performance Note: All organic growth rates from quarterly and annual reports, except for Sep-02 and Sep-03 which were derived from press releases and JPM estimates YOY organic revenue growth Stock price and organic growth performance since IPO 2.0% 2.0% 0.0% 2.0% 2.0% 3.0% 5.0% 2.0% 4.0% 4.0% 6.0% 6.0% 6.0% 4.0% 8.0% 7.0% 2.0% 1.0% 0% 2% 4% 6% 8% 10% 12% Dec- 01 Mar- 02 Jun- 02 Sep- 02 Dec- 02 Mar- 03 Jun- 03 Sep- 03 Dec- 03 Mar- 04 Jun- 04 Sep- 04 Dec- 04 Mar- 05 Jun- 05 Sep- 05 Dec- 05 Mar- 06 $0.0 $5.0 $10.0 $15.0 $20.0 $25.0 $30.0 5 |
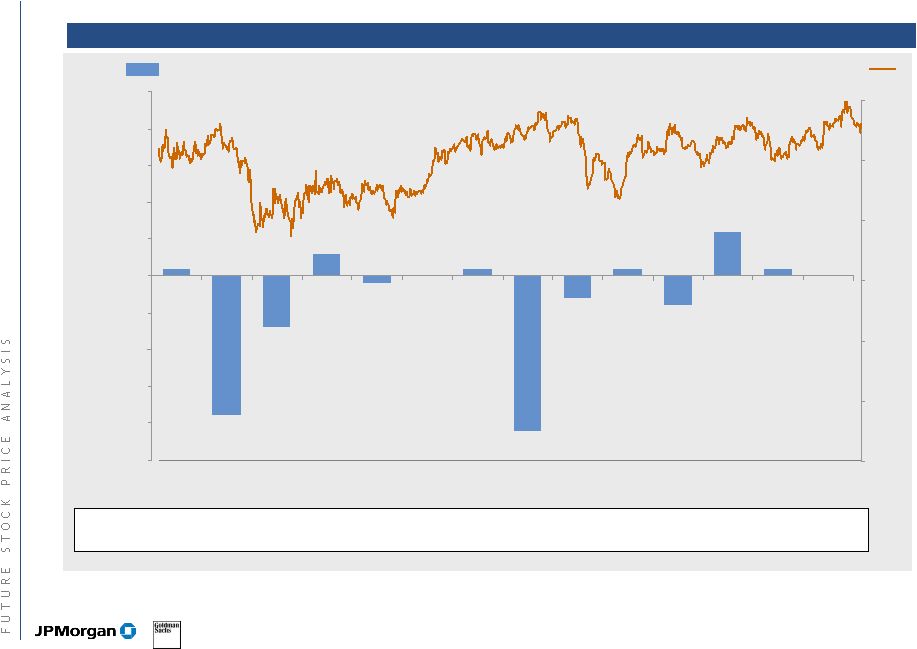 P R O J E C T A L P H A 0.1% (1.9%) (0.7%) 0.0% 0.1% (0.3%) 0.6% 0.0% 0.3% (0.1%) 0.1% (0.4%) (2.1%) 0.1% (2.5%) (2.0%) (1.5%) (1.0%) (0.5%) 0.0% 0.5% 1.0% 1.5% 2.0% 2.5% Dec-02 Mar-03 Jun-03 Sep-03 Dec-03 Mar-04 Jun-04 Sep-04 Dec-04 Mar-05 Jun-05 Sep-05 Dec-05 Mar-06 …though operating leverage is a key measure of earnings sustainability and quality Note: All operating profit margins taken from quarterly and annual reports Stock price and operating margin performance since IPO Alpha stock price performance YOY change in operating profit margin Op. profit margin: 5.7% 4.3% 5.5% 7.8% 5.6% 4.3% 5.6% 5.7% 5.3% 4.4% 5.2% 6.3% 5.4% 4.4% $0.0 $5.0 $10.0 $15.0 $20.0 $25.0 $30.0 6 |
 P R O J E C T A L P H A Credit Suisse future stock price analysis Credit Suisse assumptions and methodology Credit Suisse analysis A. Grow stock price at by applying constant P/E multiple (i.e. stock grows by EPS growth) B. Project out up to three years C. Apply 16.5x-17.0x 12-month forward P/E, based on unaffected P/E multiple Based on Alpha 3 year historical forward P/E D. Discount at cost of equity of 11% JPM/GS review of Credit Suisse assumptions A. Since the IPO, Alpha EPS has grown 12.1% per year, whereas stock price has only appreciated by 4.6% per year B. Creates more value the further out you grow the stock price due to the arbitrage between modeled EPS growth and cost of equity assumption C. Current 12-month forward P/E multiple on unaffected price is 16.0x (current 12- month forward FV/EBITDA multiple is 7.1x)¹ Alpha historical forward multiple has been declining over time — 3-year average forward multiple is 16.5x — 2-year average forward multiple is 16.1x — 1-year average forward multiple is 15.8x D. Cost of equity is inherently subjective Credit Suisse analysis adjusted by JPM/GS 1 Current 12-month forward EBITDA multiple calculated as of 04/28/06; assumes 12-month forward EBITDA of $1,000mm based on 2006E EBITDA of $958mm and 2007E EBITDA of $1,030mm; fully diluted shares of 181.2mm and net debt (includes off-balance sheet debt of $206mm) as of latest 10-Q 2 Assumes ending diluted shares outstanding of 179.8mm (reflecting no share repurchases) based on management projections; cash flow to paydown debt adjusted to include annual dividends of $50mm 7 Stock price projected to 2007 Forward P/E multiple 16.5x 2008 EPS $2.16 Implied stock price in 2007 $35.64 Cost of equity 11.0% Present value of stock $32.11 Stock price projected to 2008 Forward P/E multiple 16.5x 2009 EPS $2.46 Implied stock price in 2008 $40.66 Cost of equity 11.0% Present value of stock $32.94 Stock price projected to 2007 Forward P/E multiple (7.1x forward FV/EBITDA) 2 15.8x 2008 EPS $2.16 Implied stock price in 2007 $34.14 Cost of equity 11.0% Present value of stock $30.76 Stock price projected to 2008 Forward P/E multiple (7.1x forward FV/EBITDA) 2 15.8x 2009 EPS $2.46 Implied stock price in 2008 $38.81 Cost of equity 11.0% Present value of stock $31.50 |
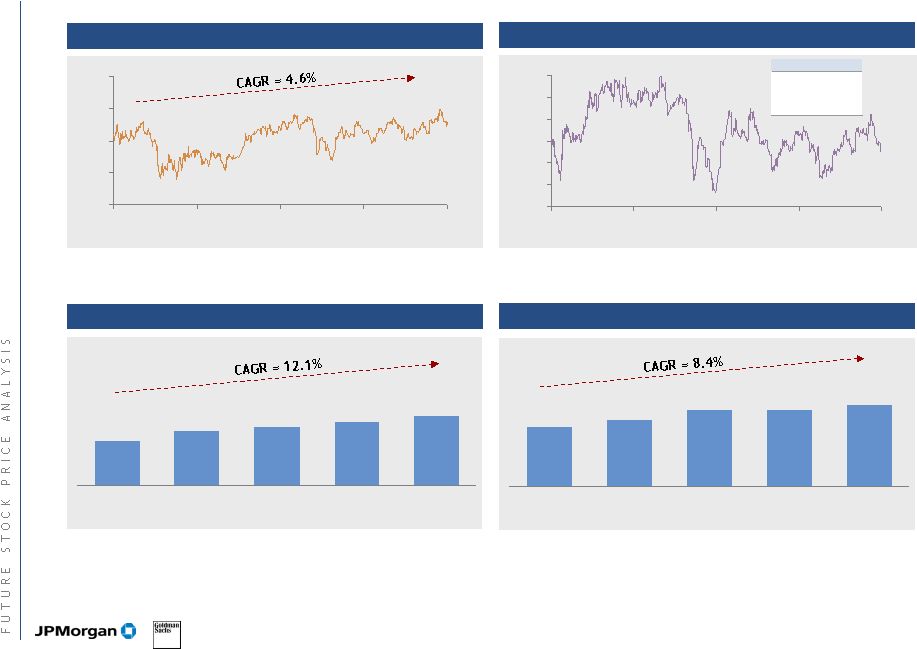
 P R O J E C T A L P H A Credit Suisse future stock price sensitivities Implied stock price based on forward P/E multiple Credit Suisse analysis adjusted by JPMorgan/Goldman Sachs 2008E PV of stock 15.0x 2009E EPS/(6.9x 2009E EBITDA) $29.95 15.5x 2009E EPS/(7.0x 2009E EBITDA) $30.95 16.0x 2009E EPS/(7.2x 2009E EBITDA) $31.95 Implied stock price based on forward P/E multiple 2007E PV of stock 15.0x 2008E EPS/(6.9x 2008E EBITDA) $29.19 15.5x 2008E EPS/(7.0x 2008E EBITDA) $30.16 16.0x 2008E EPS/(7.2x 2008E EBITDA) $31.14 1 Assumes historical CAGR is applied to Alpha undisturbed price as of 4/28/06; implied price in 2008 is discounted back to present using 11% cost of equity 2 Implied forward P/E based on 2009E EPS of $2.46 Historical CAGR (‘01-‘05) % PV of price1 Implied fwd P/E2 Stock price appreciation 4.6% $24.94 12.5x EBITDA CAGR 8.4% $26.81 13.4x EPS CAGR 12.1% $28.65 14.4x Historical CAGR analysis 8 |
 P R O J E C T A L P H A This future stock price analysis as of the IPO would indicate a $44.28 stock price in 2006 Source: Tradeline 1 Based on $23 price at IPO $15 $20 $25 $30 $35 $40 $45 Stock price performance since IPO Actual Future Fwd EPS $1.19 $1.36 $1.55 $1.77 $2.02 $2.30 EPS growth NA 14% 14% 14% 14% 14% P/E multiple¹ 19.3x 19.3x 19.3x 19.3x 19.3x 19.3x 2001 2002 2003 2004 2005 2006 YTD 9 |
 Agenda Page P R O J E C T A L P H A Appendix Review of management projections Discounted cash flow analysis Leveraged recap analysis Future stock price analysis 10 3 10 16 20 25 |
 P R O J E C T A L P H A Critique of key assumptions and methodology Credit Suisse assumptions and methodology JPM and GS review of CS assumptions Repurchase 35%-40% of shares outstanding at $32 to mid-$30s 4.5x leverage is outlier high in public peer group Increased financial and business risk of operating below investment grade as a public company Total leverage post buyback of 4.5x Refinance existing capital structure; average cost of debt 7%-8% Estimate future stock price over two to three years based on accreted EPS growth rate Since the IPO, Alpha EPS has grown at 12.1% per year whereas stock price has only appreciated by 4.6% per year Inflates value based on high EPS growth from deleveraging, which will not be accorded the same value as core earnings growth Not a valid comparison to a static purchase price 1 turn multiple discount to 16.5x-17.0x P/E is applied due to increased leverage Discount at 11% cost of equity Value to shareholders based on blended value Current 12-month forward P/E multiple on unaffected stock price is 16.0x (represents 7.1x FV/EBITDA) 1 turn discount is subjective Cost of equity inherently subjective; no attempt to compensate for increased risk due to proforma leverage 40% of shares could impact trading fundamentals A non-pro rata tender could result in an unexpected change in control 11 |
 P R O J E C T A L P H A Leveraged share buyback—review of Credit Suisse’s analysis Credit Suisse analysis Credit Suisse analysis adjusted by JPM/GS $ millions, except per share data Price per share $32.00 New debt $2,250 Shares repurchased 70.3 % reduction in shares 39.1% 2006 total debt $4,325 2006 EBITDA $958 2006 total debt/EBITDA 4.5x Pro forma 2009E EPS $2.94 Forward P/E multiple (7.1x fwd FV/EBITDA) 14.1x 2008E share price $41.33 Cost of equity 13.0% Present value of stock price $32.37 % of shares remaining 60.9% Blended value to shareholders $32.23 $ in millions, except per share data Price per share $32.00 New debt $2,250 Shares repurchased 70.3 % reduction in shares 39.1% 2006 total debt $4,325 2006 EBITDA $958 2006 total debt/EBITDA 4.5x 2006 effective interest rate 7.5% Pro forma 2009E EPS $2.94 Standalone forward multiple 17.0x Multiple discount (1.0x) Pro forma forward multiple 16.0x 2008E share price $46.98 Cost of equity 11.0% Present value of stock price $38.13 % of shares remaining 60.9% Blended value to shareholders $35.73 Illustrative example: 35—40% buyback Blended value sensitivities¹ Forward P/E multiple 15.5x 16.0x 16.5x Implied fwd FV/EBITDA 7.5x 7.7x 7.8x 1 year $33.41 $34.08 $34.76 2 years $35.01 $35.73 $36.46 3 years $36.17 $36.93 $37.69 Forward P/E multiple ² 13.6x 14.1x 14.6x Implied fwd FV/EBITDA 7.0x 7.1x 7.3x 12.0% $31.87 $32.58 $33.29 13.0% $31.52 $32.23 $32.93 14.0% $31.19 $31.88 $32.57 Forward P/E multiple 13.6x 14.1x 14.6x Implied fwd FV/EBITDA 7.0x 7.1x 7.3x 1 year $30.49 $31.15 $31.81 2 years $31.52 $32.23 $32.93 3 years $32.15 $32.87 $33.60 Blended value sensitivities Note: Alpha stand-alone EPS of $1.86, $2.16 and $2.46 in 2007E, 2008E, and 2009E respectively 1 Assumes repurchase at $32.00 a share, cost of equity at 11% 2 Assumes repurchase at $32.00 a share, valuation at 2 years 3 Assumes repurchase at $32.00 a share, cost of equity at 13% 12 2 2 3 2 |
 P R O J E C T A L P H A Leveraged share buyback—review of Credit Suisse’s analysis Credit Suisse analysis Credit Suisse analysis adjusted by JPM/GS $ millions, except per share data Price per share $32.00 New debt $500 Shares repurchased 15.6 % reduction in shares 8.7% 2006 total debt $2,575 2006 EBITDA $958 2006 total debt/EBITDA 2.7x Pro forma 2009E EPS $2.50 Forward P/E multiple (7.1x fwd FV/EBITDA) 15.6x 2008E share price $39.06 Cost of equity 13.0% Present value of stock price $30.59 % of shares remaining 91.3% Blended value to shareholders $30.71 $ in millions, except per share data Price per share $32.00 New debt $500 Shares repurchased 15.6 % reduction in shares 8.7% 2006 total debt $2,575 2006 EBITDA $958 2006 total debt/EBITDA 2.7x 2006 effective interest rate 7.5% Pro forma 2009E EPS $2.50 Standalone forward multiple 16.5x Multiple discount (1.0x) Pro forma forward multiple 15.5x 2008E share price $38.76 Cost of equity 11.0% Present value of stock price $31.46 % of shares remaining 91.3% Blended value to shareholders $31.50 Illustrative example: 8—10% buyback Blended value sensitivities¹ Forward P/E multiple 15.0x 15.5x 16.0x Implied fwd FV/EBITDA 6.9x 7.1x 7.3x 1 year $29.44 $30.33 $31.22 2 years $30.58 $31.50 $32.43 3 years $31.31 $32.27 $33.22 Blended value sensitivities Forward P/E multiple 15.1x 15.6x 16.1x Implied fwd FV/EBITDA 7.0x 7.1x 7.3x 12.0% $30.30 $31.21 $32.12 13.0% $29.82 $30.71 $31.61 14.0% $29.35 $30.23 $31.10 Forward P/E multiple 15.1x 15.6x 16.1x Implied fwd FV/EBITDA 7.0x 7.1x 7.3x 1 year $29.18 $30.05 $30.93 2 years $29.82 $30.71 $31.61 3 years $30.05 $30.95 $31.85 Note: Alpha stand-alone EPS of $1.86, $2.16 and $2.46 in 2007E, 2008E, and 2009E respectively 1 Assumes repurchase at $32.00 a share, cost of equity at 11% 2 Assumes repurchase at $32.00 a share, valuation at 2 years 3 Assumes repurchase at $32.00 a share, cost of equity at 13% 13 2 2 3 2 2 |
  P R O J E C T A L P H A $ millions, except per share values Source: Management projections Note: Unaffected stock price as of 04/28/06; assumes transaction date of 09/30/06; Average share count of 179.8mm in 2007 and 179.8mm in 2008 1 Buyback financed with senior unsecured term loan at L + 125 bps; existing capital structure remains in place; financing fees of $15mm amortized over 7 years; denotes risk of negative outlook or one notch downgrade from indicated rating 2 Buyback financed with senior secured term loan at L + 175 bps; $250mm 5% senior notes due 2012 remain outstanding, and all other existing debt refinanced with senior secured credit facilities at L + 175 bps; total financing fees for new and refinanced debt of $47mm amortized over 7 years 3 Buyback financed with $1,450mm senior secured term loan at L + 200 bps and $500mm senior unsecured notes priced at 7.50%; $250mm 5% senior notes dues 2012 remain in place, all other existing debt refinanced with senior secured credit facilities at L + 200 bps; total financing fees for new and refinanced debt of $54mm amortized over 7 years 4 Assumes unaffected P/E of 15.1x (based on standalone 2007E EPS and share price of $28.11 as of 4/28/06) applied to PF EPS JPMorgan and Goldman Sachs leveraged recap analysis Scenario 1 Scenario 2 Scenario 3 Amount of repurchase: Standalone $1,000 million¹ $1,450 million $1,950 million³ Price paid per share $28.11 $30.00 $31.00 $32.00 $30.00 $31.00 $32.00 $30.00 $31.00 $32.00 % premium 6.7% 10.3% 13.8% 6.7% 10.3% 13.8% 6.7% 10.3% 13.8% Shares repurchased (mm) 33.3 32.3 31.3 48.3 46.8 45.3 65.0 62.9 60.9 % reduction in shares 18.5% 17.9% 17.4% 26.9% 26.0% 25.2% 36.1% 35.0% 33.9% EPS accretion - FY2007E $1.86 7.1% 6.3% 5.6% 5.3% 4.1% 2.9% 6.7% 4.8% 3.1% EPS accretion - FY2008E $2.16 9.0% 8.2% 7.5% 9.2% 7.9% 6.8% 12.8% 10.8% 9.0% EPS LTGR (06-11 CAGR) 14.1% 16.8% 16.7% 16.5% 17.8% 17.5% 17.2% 19.4% 18.9% 18.5% Pro forma share price $30.26 $30.04 $29.84 $29.75 $29.40 $29.08 $30.15 $29.61 $29.12 Blended value $30.21 $30.21 $30.21 $29.82 $29.81 $29.81 $30.10 $30.09 $30.09 Total debt/2006E EBITDA 2.0x 3.2x 3.2x 3.2x 3.7x 3.7x 3.7x 4.3x 4.3x 4.3x 2006E EBITDA/net int exp 7.5x 4.9x 4.9x 4.9x 3.9x 3.9x 3.9x 3.3x 3.3x 3.3x Implied pro forma rating BBB- BB+ BB+ BB+ BB BB BB BB- BB- BB- Total debt $2,075 $3,091 $3,091 $3,091 $3,572 $3,572 $3,572 $4,080 $4,080 $4,080 JPMorgan and Goldman Sachs do not view future stock price convention to be a valid methodology for comparisons to a static purchase price 14 2 4 |
 P R O J E C T A L P H A Share repurchase sensitivity analysis Note: Assumes transaction date of 09/30/06 1 Assumes unaffected P/E of 15.1x (based on standalone 2007E EPS and share price of $28.11 as of 4/28/06) applied to PF EPS 2 Assumes shares repurchased at $31.00 Pro forma price per share sensitivies¹ Blended value sensitivities² Share repurchase ($mm) $500 $1,000 $1,450 $1,950 $28.11 $29.48 $30.74 $30.50 $31.35 $29.00 $29.38 $30.50 $30.13 $30.75 $30.00 $29.27 $30.26 $29.75 $30.15 $31.00 $29.18 $30.04 $29.40 $29.61 $32.00 $29.09 $29.84 $29.08 $29.12 $33.00 $29.00 $29.65 $28.78 $28.67 Share repurchase ($mm) $500 $1,000 $1,450 $1,950 13.6x $26.71 $27.77 $27.66 $28.19 14.1x $27.59 $28.59 $28.38 $28.82 14.6x $28.46 $29.40 $29.10 $29.46 15.1x $29.34 $30.21 $29.81 $30.09 15.6x $30.22 $31.03 $30.53 $30.73 16.0x $30.83 $31.60 $31.04 $31.18 Management case 15 |
 Agenda Page P R O J E C T A L P H A Appendix Review of management projections Discounted cash flow analysis Leveraged recap analysis Future stock price analysis 16 3 10 16 20 25 |
 P R O J E C T A L P H A Summary of projected free cash flows: Management projections 2007E 2008E 2009E 2010E 2011E Sales $12,222 $12,904 $13,624 $14,378 $15,162 EBITDA 1,030 1,103 1,171 1,248 1,320 EBIT 664 721 780 836 899 Non tax-deductible amortization 57 56 49 51 41 EBITA 721 778 828 888 940 Taxes 270 292 311 333 352 EBIAT 451 486 518 555 587 Depreciation $267 $281 $296 $311 $327 Tax-deductible amortization 41 44 47 50 53 Capital expenditures (341) (352) (372) (392) (414) Increase in working capital (13) (14) (14) (14) (14) Deferred taxes 4 6 7 8 9 Other non-cash items 8 8 8 9 9 Acquisitions (20) (20) (85) (37) (23) Unlevered free cash flow $397 $439 $406 $489 $534 Terminal value adjustments Deferred taxes deducted since not in perpetuity (9) Other non-cash items deducted since not in perpetuity (9) Capital expenditures reduced to equal depreciation in perpetuity 87 Tax-deductible amortization prorated for 2.5% long-term growth rate (11) Acquisitions added back since not in perpetuity 23 Terminal value $615 Difference with CS Add back acquisitions $20 $20 $85 $37 $23 Unlevered free cash flow $417 $459 $490 $526 $557 Terminal value (should be unchanged from Credit Suisse) $615 US $ millions Note: Does not add back non-cash impact of options expense; assumes dilution from future stock option issuance is equal to cash cost of stock options expense 17 |
 P R O J E C T A L P H A Discounted cash flow analysis: Management projections 1,2 CS case (excludes acquisitions, end-of-year convention) Equity value per share 3,4 Implied perpetuity growth rates of FCF 3,4 Terminal multiple of 2011E EBITDA 8.00x 8.25x 8.50x 8.75x 9.00x 10.00% 3.9% 4.1% 4.3% 4.4% 4.6% 9.75% 3.7% 3.9% 4.0% 4.2% 4.3% 9.50% 3.5% 3.6% 3.8% 4.0% 4.1% 9.25% 3.2% 3.4% 3.6% 3.7% 3.9% 9.00% 3.0% 3.2% 3.3% 3.5% 3.6% Equity value per share Implied terminal EBITDA multiple Perpetuity growth rate 2.00% 2.25% 2.50% 2.75% 3.00% 10.00% $26.62 $27.55 $28.54 $29.59 $30.72 9.75% $27.81 $28.81 $29.87 $31.01 $32.23 9.50% $29.08 $30.16 $31.30 $32.54 $33.87 9.25% $30.44 $31.60 $32.84 $34.18 $35.63 9.00% $31.90 $33.15 $34.50 $35.96 $37.54 Perpetuity growth rate 2.00% 2.25% 2.50% 2.75% 3.00% 10.00% 6.2x 6.4x 6.7x 6.9x 7.2x 9.75% 6.4x 6.7x 6.9x 7.2x 7.5x 9.50% 6.6x 6.9x 7.1x 7.4x 7.7x 9.25% 6.9x 7.1x 7.4x 7.7x 8.0x 9.00% 7.1x 7.4x 7.7x 8.0x 8.4x 1 Projections as per management as of April 19, 2006 2 Free cash flow discounted to end of September 2006. Terminal value calculated as of fiscal year 2011 3 Assumes net debt of $2,031 and 181.2 million basics shares outstanding as of 30 September 2006. Net debt also includes $206 million A/R facility 4 Assumes 11.2 million options outstanding with a weighted average strike price of $24.09 per share Terminal multiple of 2011E EBITDA 8.00x 8.25x 8.50x 8.75x 9.00x 10.00% $34.44 $35.51 $36.57 $37.64 $38.70 9.75% $34.90 $35.97 $37.05 $38.13 $39.20 9.50% $35.36 $36.44 $37.53 $38.62 $39.71 9.25% $35.82 $36.92 $38.03 $39.13 $40.23 9.00% $36.29 $37.41 $38.52 $39.64 $40.75 GS-JPM case (includes acquisitions, mid-year convention) 18 |
 P R O J E C T A L P H A Discounted cash flow analysis: Management projections sensitivities 1,2 Sales growth 4.4% 4.7% 5.0% 5.3% 5.6% 8.4 % $26.80 $27.47 $28.14 $28.83 $29.52 8.5 % $27.42 $28.10 $28.78 $29.48 $30.18 8.6 % $28.04 $28.73 $29.42 $30.12 $30.83 8.7 % $28.67 $29.36 $30.06 $30.77 $31.49 8.8 % $29.29 $29.99 $30.70 $31.42 $32.14 1 Projections as per management as of April 19, 2006 as adjusted to assume flat annual sales growth rates and EBITDA margins based on sensitivity 2 Free cash flow discounted to end of September 2006. Terminal value calculated as of fiscal year 2011 3 Assumes net debt of $2,031 and 181.2 million basics shares outstanding as of 30 September 2006. Net debt also includes $206 million A/R facility 4 Assumes 11.2 million options outstanding with a weighted average strike price of $24.09 per share 5 Assumes 9.5% discount rate and 2.5% perpetuity growth rate Sensitized management projections Equity value per share 3,4,5 19 |
 Agenda Page P R O J E C T A L P H A Appendix Review of management projections Discounted cash flow analysis Leveraged recap analysis Future stock price analysis 20 3 10 16 20 25 |
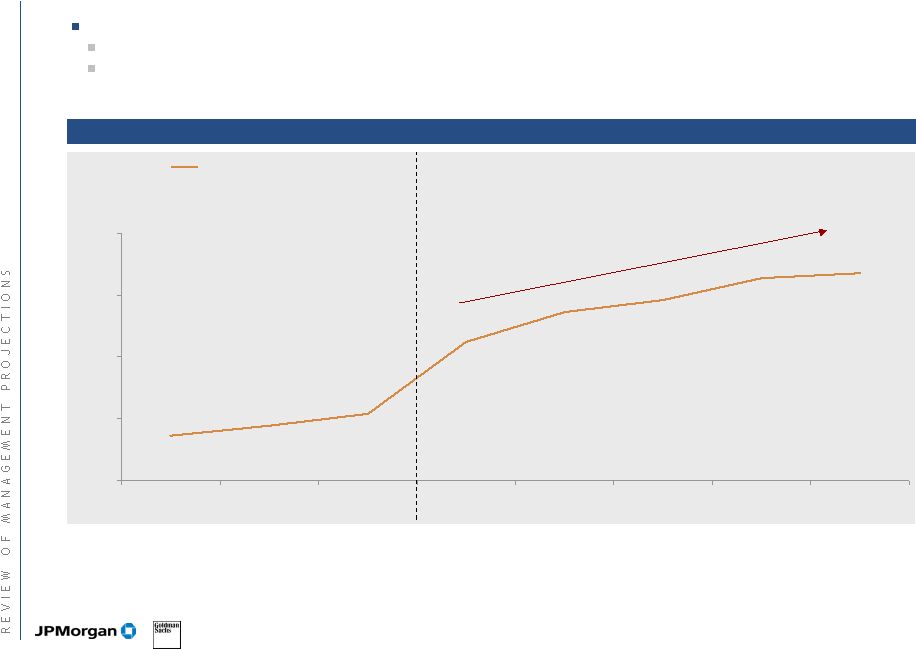
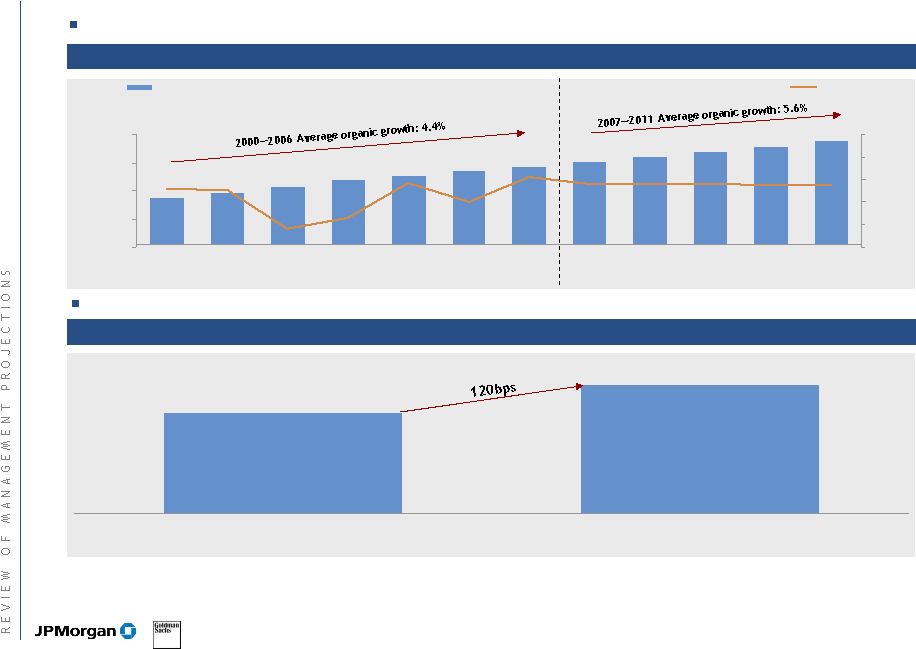 P R O J E C T A L P H A Historic revenue growth: organic revenue growth in the last six years has been 4.4% and as low as 1.7% Management is projecting an increase in organic growth 2000A—2011E Source: Management Note: 2006P uses year-over-year growth rate as a proxy for organic growth. Does not reverse impact of acquired revenue from SeamlessWeb or Park Avenue acquisitions Historical vs. projected organic growth 4.4% 5.6% 2000A—2006P 2006P—2011E 4.4% historical organic growth compares to management’s projection of 5.6% for the next five years $7,048 $7,686 $8,595 $9,591 $10,212 $10,894 $11,572 $12,222 $12,904 $13,624 $14,378 $15,162 5.5% 5.5% 5.6% 5.6% 5.6% 6.2% 4.0% 5.7% 5.2% 5.1% 1.7% 2.6% 0 4,000 8,000 12,000 $16,000 2000A 2001A 2002A 2003A 2004A 2005A 2006F 2007E 2008E 2009E 2010E 2011E 0.0% 2.0% 4.0% 6.0% 8.0% 10.0% Historic and projected revenue growth 2000A—2011E ($ millions) Organic growth Revenue 21 |
 P R O J E C T A L P H A 8.18% 8.22% 8.27% 8.56% 8.68% 8.73% 8.82% 8.84% 8.00% 8.25% 8.50% 8.75% 9.00% 2004A 2005A 2006F 2007E 2008E 2009E 2010E 2011E Projected EBITDA margin expansion ($ millions) 2006—2011 = 57bps of margin expansion Management is projecting unprecedented margin expansion 2004A—2011E Source: Management Note: 2006 EBITDA assumes May Forecast and add-back of management’s estimate of $16.8mm in non-cash options expense due to adoption of SFAS No. 123 in FY 1Q06. EBITDA margin in projected period also pro forma for non-cash options expense developed by Ernst & Young in consultation with the Company Management’s assumes 57 basis points of EBITDA margin expansions Alpha’s projected margin expansion would exceed historical results Average EBITDA margin in 2004—2006 was 8.22% 2004—2006: Average of 8.22% EBITDA margin 22 |
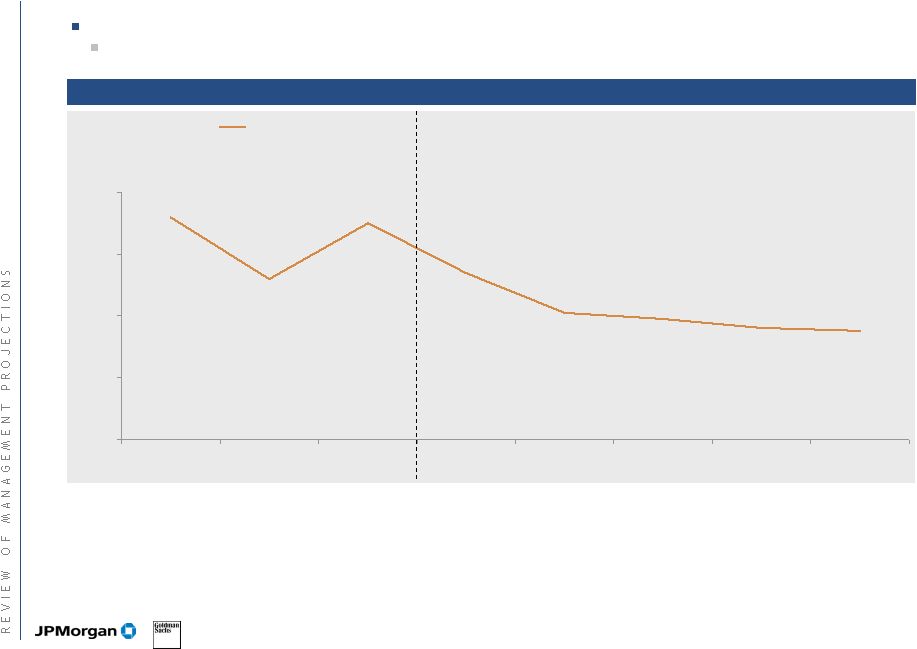 P R O J E C T A L P H A Management is projecting a less capital intensive business 2004A—2011E Source: Management Note: CapEx/EBITDA assumes May Forecast and does not include ordinary course disposals, Acquisition CapEx, or SeamlessWeb earnout of $85mm Management projections assume that the business will become less capital intensive over time 347 basis point decline in Capex/EBITDA between 2006 and 2011 Capex/EBITDA vs. EBITDA margin: 2004A—2011E 37.2% 35.2% 37.0% 35.4% 34.1% 33.9% 33.6% 33.5% 30.0% 32.0% 34.0% 36.0% 38.0% 2004A 2005A 2006F 2007E 2008E 2009E 2010E 2011E 2007—2011: Average of 34.11% 2004—2006: Average of 36.45% CapEx as a % of EBITDA 23 |
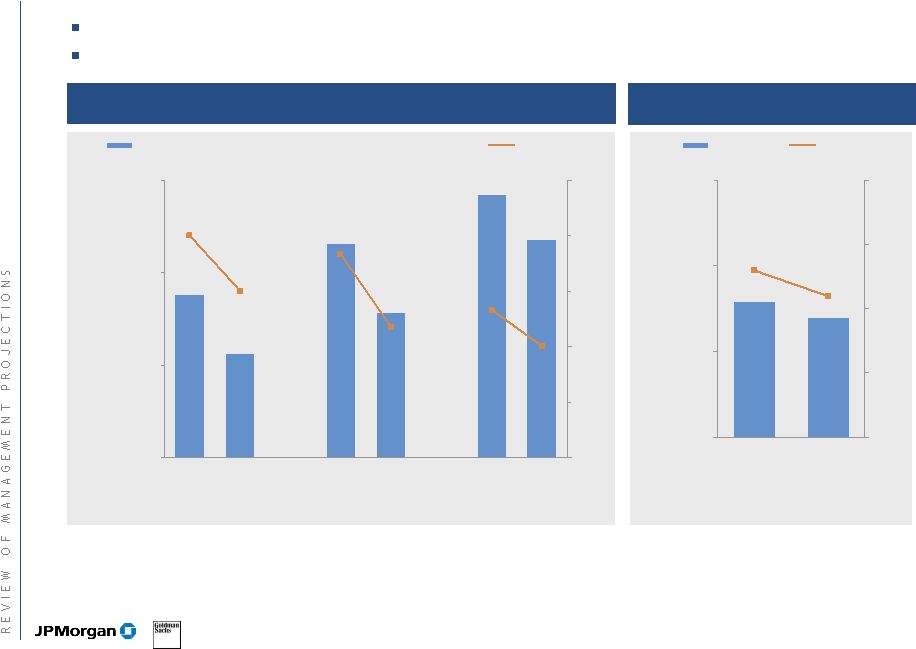 P R O J E C T A L P H A $588.5 $556.2 $615.8 $578.6 $642.2 $618.0 6.1% 5.7% 5.8% 5.6% 5.9% 6.2% 500 550 600 $650 2003P 2003A 2004P 2004A 2005P 2005A 5.0% 5.3% 5.6% 5.9% 6.2% 6.5% Management has underperformed projected margins 2003A—2005A Source: Management Note: EBITDA is not pro forma for non-cash options expense of $16.8mm per adoption of SFAS No.123 in 1Q06 2003—2005 EBIT (Pre-corporate) ($ millions) Actual EBIT has underperformed plan in both absolute dollars (4% to 6% shortfall) and margins (20—30 basis point shortfall) Latest management estimate (May Forecast) of 2006 EBITDA has been a downward revision on both a dollar and margin basis Actual vs. plan (5)% (6)% (4)% EBIT margin EBIT $958.4 $940.0 8.3% 8.1% 800 900 1,000 $1,100 2006P 2006 May frcst. 7.0% 7.5% 8.0% 8.5% 9.0% 2006 EBITDA—plan vs. May forecast ($ millions) Plan vs. May frcst. (2)% EBITDA margin EBITDA 24 |
 Agenda Page P R O J E C T A L P H A Appendix Review of management projections Discounted cash flow analysis Leveraged recap analysis Future stock price analysis 25 3 10 16 20 25 |
 P R O J E C T A L P H A Proposed offer price Transaction value Transaction metrics $ millions, except per share data Alpha stock price (4/28/06) $28.11 Offer price $32.00 % premium 13.8% Basic shares¹ 181.2 Options² 2.8 Fully diluted shares 184.0 Equity value $5,887 Net debt³ 2,031 Transaction value $7,918 $ millions, except per share data Premiums to undisturbed: 1-week average $27.76 15.3% 1-month average $28.39 12.7% 52-week/all time high $29.93 6.9% Implied multiples Metric Multiple Firm value/revenue 2006E $11,552 0.69x 2007E 12,222 0.65 Firm value/EBITDA 2006E $958 8.3x 2006E (revised) 940 8.4 2007E 1,030 7.7 Note: Transaction date as of 9/30/06 Source: Company filings, management projections and Tradeline 1 Includes basic shares outstanding of 179.8mm and restricted stock of 1.4mm based on management 2 Calculated using treasury stock method 3 As of 9/30/06; includes off-balance sheet debt of $206mm 26 |