 Project Arrow DRAFT CONFIDENTIAL PRELIMINARY | SUBJECT TO FURTHER REVIEW AND EVALUATION THESE MATERIALS MAY NOT BE USED OR RELIED UPON FOR ANY PURPOSE OTHER THAN AS SPECIFICALLY CONTEMPLATED BY A WRITTEN AGREEMENT WITH CREDIT SUISSE. Presentation to the Special Committee July 17, 2006 |
 2 CONFIDENTIAL | PRELIMINARY ANALYSIS D R A F T Table of Contents 1. Introduction 2. Updated Preliminary Financial Analysis 3. Review of Selected Alternatives A. Share Repurchase B. Leveraged Buyout Appendix A. Supplemental LBO Materials B. Supplemental Materials |
 3 CONFIDENTIAL | PRELIMINARY ANALYSIS 1. Introduction |
 4 CONFIDENTIAL | PRELIMINARY ANALYSIS D R A F T Since the Special Committee’s last meeting, the Consortium has offered a revised proposal $32.75 per share (a 2.3% increase vs. prior proposal and a 16.5% premium over the pre- proposal price) Key provisions include (i) absence of a “Majority of the Unaffiliated Stockholders” vote condition and (ii) an ability for Mr. Neubauer to vote his shares The Consortium also cited a willingness to consider some form of “go shop” provision depending on the level of market check performed to date In addition, Arrow management has notified CS of several issues that have resulted in a downward revision to the 2006 financial projections In aggregate, the downward revisions are expected to result in a per share impact of $0.17 in Q3 2006, including a non-cash charge of $0.12 per share CS has updated its analysis to reflect the revised projections as noted in the following table The enclosed preliminary analysis is intended to update the Special Committee on the analysis reviewed to date in light of the revised projections Introduction Note: CS estimates based on management guidance. ($ in millions) Projected EBITDA – Management Case Variance May 25 Today $ % 2006 $954 $940 ($14) (1.5%) 2007 1,025 1,017 (8) (0.7%) 2008 1,097 1,094 (3) (0.3%) |
 5 CONFIDENTIAL | PRELIMINARY ANALYSIS 2. Updated Preliminary Financial Analysis |
 6 CONFIDENTIAL | PRELIMINARY ANALYSIS D R A F T Financial Summary – Management Case Arrow management provided the financial forecast detailed above to CS on May 25 and an update on July 6, 2006. ($ in millions) Historical Projected CAGR FYE 9/30, 2001 2002 2003 2004 2005 2006E 2007E 2008E 2009E 2010E 2011E '01A–'05A'05A–'11E Total Revenue $7,359 $8,264 $9,448 $10,192 $10,963 $11,599 $12,222 $12,904 $13,624 $14,378 $15,162 10.5% 5.6% % Growth 7.7% 12.3% 14.3% 7.9% 7.6% 5.8% 5.4% 5.6% 5.6% 5.5% 5.5% % Organic Growth 5.1% 1.7% 2.6% 5.7% 4.0% 5.8% 5.4% 5.6% 5.6% 5.5% 5.5% 3.5% 5.6% Avg. Margins Total EBITDA $630 $710 $809 $833 $900 $940 $1,017 $1,094 $1,165 $1,242 $1,313 9.4% 6.5% '01A–'05A '05A–'11E % Margin 8.6% 8.6% 8.6% 8.2% 8.2% 8.1% 8.3% 8.5% 8.5% 8.6% 8.7% 8.4% 8.4% Diluted EPS (1) $1.00 $1.25 $1.34 $1.36 $1.53 $1.55 $1.78 $2.06 $2.35 $2.63 $2.94 9.1% 13.7% % Growth 15.1% 24.8% 7.2% 1.5% 12.5% 1.2% 14.7% 16.0% 14.1% 11.9% 11.8% Total Capex (2) $204 $223 $303 $330 $295 $316 $341 $351 $436 $409 $416 9.6% 5.9% % of Revenue 2.8% 2.7% 3.2% 3.2% 2.7% 2.7% 2.8% 2.7% 3.2% 2.8% 2.7% Source: Management estimates provided to CS on May 25 and June 6, 2006. (1) EPS reflects downward revision per management guidance. (2) Excludes $20 million of annual capex for acquisitions during the projected period, includes Seamless Web earnout. |
 7 CONFIDENTIAL | PRELIMINARY ANALYSIS D R A F T Preliminary Selected Companies Analysis Dividend Yield Ratio 0.9% 16.7% 0.9% 16.7% 1.0% 16.7% 2.1% 39.1% 11.6% NA 4.0% 65.7% 1.3% 41.7% 2.0% 68.6% 4.2% 53.8% 2.1% 53.7% 1.0% 18.0% 0.2% 3.6% 0.5% 7.1% 3.8% 57.1% 4.8% 41.4% 2.1% 25.4% 1.0% 18.0% 3.1% 38.0% 2.0% 41.4% ($ in millions, except per share values) Share Share 2007E (1) I/B/E/S LT Tot. Debt / Price as of Price as of Equity Enterprise EV / EBITDA EV / EBIT P/E Revenue EBITDA Growth LTM Company Last Meeting 7/14/06 % Change Value Value LTM 2006E 2007E 2006E 2007E 2006E 2007E Growth Margin Rate (2) EBITDA Arrow (Current) $32.92 $32.57 (1.1%) $5,945 $7,997 8.6x 8.4x 7.8x 13.0x 11.6x 20.2x 17.8x 7.3% 8.2% 11.9% 2.3x Arrow (Offer) 32.00 32.75 2.3% 5,979 8,031 8.6x 8.5x 7.8x 13.1x 11.7x 20.3x 17.9x 7.3% 8.2% 11.9% 2.3x Arrow (Pre-Offer) 28.11 28.11 – 5,066 7,118 7.6x 7.5x 6.9x 11.6x 10.3x 17.1x 15.2x 7.3% 8.2% 11.9% 2.3x Food and Support Services Autogrill $14.83 $14.58 (1.7%) $3,709 $4,952 8.1x 7.7x 7.2x 12.2x 11.1x 20.0x 17.7x 4.8% 13.6% 10.0% 2.0x Centerplate (3) 13.30 13.50 1.5% 304 485 9.1x 8.9x 8.8x 18.6x 18.1x NM NM 2.6% 8.1% 3.0% 4.0x Compass 4.66 4.53 (2.7%) 9,769 11,996 8.8x 8.8x 8.3x 12.9x 12.2x 21.9x 16.3x 4.6% 6.7% 7.0% 2.0x Elior (4) 13.74 13.74 – 1,815 2,348 8.3x 7.9x 7.4x 11.0x 10.2x 15.1x 13.5x 5.4% 8.3% NA 2.3x Sodexho 45.70 48.01 5.1% 7,714 9,117 9.5x 9.3x 8.6x 12.7x 11.6x 20.2x 17.4x 5.2% 6.4% 5.0% 2.5x Mean 8.8x 8.5x 8.1x 13.5x 12.6x 19.3x 16.2x 4.5% 8.6% 6.3% 2.6x Median 8.8x 8.8x 8.3x 12.7x 11.6x 20.1x 16.8x 4.8% 8.1% 6.0% 2.3x Uniform and Career Apparel United States Cintas $39.71 $36.68 (7.6%) $6,179 $6,736 9.5x 9.3x 8.5x 12.0x 10.8x 18.2x 16.4x 12.0% 20.0% 14.3% 1.1x G&K Services 34.98 32.70 (6.5%) 697 905 7.6x 7.6x 6.9x 11.8x 10.3x 16.2x 14.3x 6.5% 13.8% 13.2% 1.9x Unifirst 31.60 31.95 1.1% 616 813 7.2x 6.8x 6.2x 11.1x 9.8x 15.7x 13.0x 8.5% 14.6% 14.0% 1.8x International Davis Service Group $8.30 $8.37 0.8% $1,428 $1,824 4.6x 4.6x 4.5x 11.1x 10.6x 13.3x 12.5x 2.8% 32.4% 7.0% 1.5x Rentokil 2.78 2.80 0.7% 5,074 6,665 7.1x 7.7x 7.4x 12.5x 11.9x 14.9x 13.4x 7.5% 22.0% NA 2.3x Mean 7.2x 7.2x 6.7x 11.7x 10.7x 15.7x 13.9x 7.5% 20.6% 12.1% 1.7x Median 7.2x 7.6x 6.9x 11.8x 10.6x 15.7x 13.4x 7.5% 20.0% 13.6% 1.8x Overall Mean 8.0x 7.9x 7.4x 12.6x 11.6x 17.3x 14.9x 6.0% 14.6% 9.2% 2.2x Overall Median 8.2x 7.8x 7.4x 12.1x 11.0x 16.2x 14.3x 5.3% 13.7% 8.5% 2.0x Source: I/B/E/S, Investext equity research and Company filings. (1) 2007E combined FSS revenue growth and EBITDA margin of 5.4% and 7.6%, respectively; 2007E AUCA revenue growth and EBITDA margin are 5.1% and 12.7%, respectively; corporate expense allocated based on EBITDA contribution. (2) Based on I/B/E/S 5-year long-term growth rates. (3) Centerplate trades as an Income Deposit Security. (4) As ofJanuary 11, 2006, the day before Robert Zolade announced he was reviewingthepossibility ofopening his share capital to new investors. Acash tender was launchedon March 27, 2006. Note: Multiplesbased onfinancialestimatescalendarized to Arrow's fiscal year end of 9/30. Research reports for foreign peers do not explicitly breakout amortization expense during the forecast period. As a result, EBIT and earnings metrics may not be directly comparable with U.S. peers. |
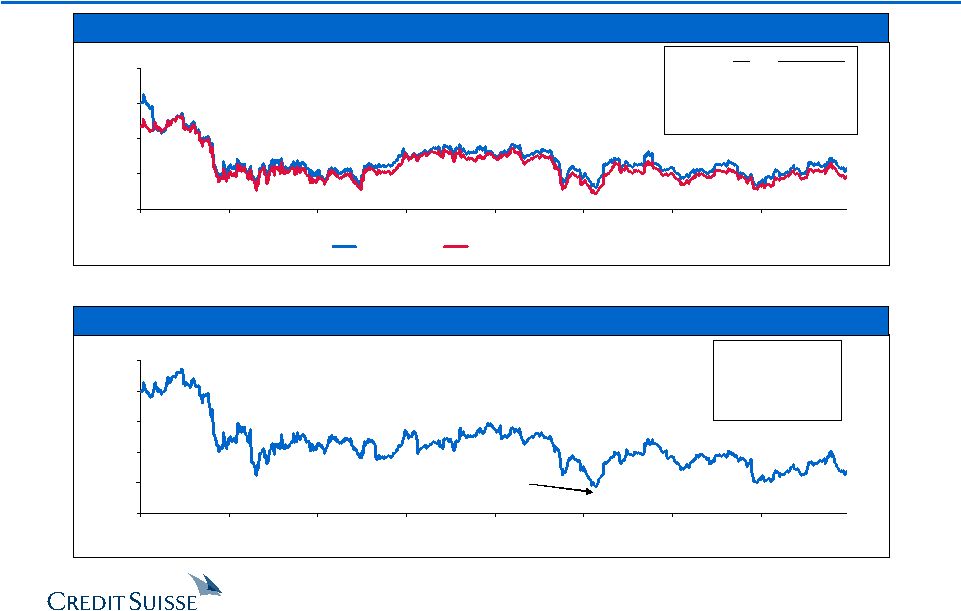 8 CONFIDENTIAL | PRELIMINARY ANALYSIS D R A F T Historical Trading Multiples Forward P/E Enterprise Value / LTM Trailing EBITDA 12.0x 16.0x 20.0x 24.0x 28.0x 1/31/02 8/13/02 2/25/03 9/5/03 3/18/04 9/29/04 4/12/05 10/20/05 CS Approach Consortium Approach CS Consortium Mean: 17.5x 16.9x Median: 17.0x 16.3x Max: 25.1x 22.6x Min: 14.4x 13.7x 4/28/06: 16.7x 15.8x Note: CS Approach based on estimated earnings for next four unreported quarters as of each respective date. Consortium Approach based on calendarized estimated earnings for next twelve months as of each respective date using fiscal year projections. One and two year median multiples using the CS Approach are 16.4x and 16.7x, respectively, as compared with the Consortium Approach of 15.8x and 16.0x, respectively . 6.0x 7.0x 8.0x 9.0x 10.0x 11.0x 1/31/02 8/13/02 2/25/03 9/5/03 3/18/04 9/29/04 4/12/05 10/20/05 Mean: 8.2x Median: 8.1x Max: 10.7x Min: 6.9x 4/28/06: 7.6x Minimum 6.9x 10/25/04 Note: One and two year median multiples are 7.6x and 7.7x, respectively. Source: FactSet Research Systems. |
 9 CONFIDENTIAL | PRELIMINARY ANALYSIS D R A F T Preliminary Selected Companies Analysis ($ in millions, except per share values) Arrow Multiple Range Implied Enterprise Value Performance Low – High Low – High Food and Support Services FY 2006E EBITDA $783 7.5x – 9.0x $5,871 – $7,045 FY 2007E EBITDA 849 7.0x – 8.5x 5,944 – 7,217 FY 2006E EBIT 529 11.0x – 13.0x 5,819 – 6,877 FY 2007E EBIT 567 10.0x – 12.0x 5,669 – 6,803 Segment Reference Range $5,800 – $6,900 Uniform and Career Apparel FY 2006E EBITDA $218 7.0x – 9.5x $1,523 – $2,067 FY 2007E EBITDA 231 6.5x – 8.5x 1,505 – 1,968 FY 2006E EBIT 148 11.0x – 12.0x 1,625 – 1,773 FY 2007E EBIT 154 10.0x – 11.0x 1,537 – 1,691 Segment Reference Range $1,550 – $1,900 Subtotal $7,350 – $8,800 Unallocated Corporate Expense (1) ($60) 7.4x – 9.1x (446) – (550) Implied Enterprise Value Range $6,904 – $8,250 (–) Enterprise Value Adjustments (2) (2,031) – (2,049) Implied Equity Value Reference Range $4,872 – $6,202 – Diluted Shares Outstanding 183.8 – 183.8 Implied Equity Value per Share Reference Range $27 – $34 Enterprise Value / LTM 3/31/06 EBITDA 7.4x – 8.9x FY 2006E EBITDA 7.3x – 8.8x FY 2007E EBITDA 6.8x – 8.1x Source: Management estimates provided to CS on May 25 and June 6, 2006 and public filings. (1) Includes total unallocated corporate expenses multiplied by a segment weighted FY 2006E EBITDA multiple. (2) Adjustments include proceeds from options exercised and SURP liability which vary with share price. |
 10 CONFIDENTIAL | PRELIMINARY ANALYSIS D R A F T Preliminary Selected Acquisitions Analysis Implies a 2006E forward EBITDA multiple of 9.5x ($ in millions) CLOSING ENTERPRISE ENTERPRISE VALUE / LTM EBITDA DATE ACQUIROR TARGET VALUE SALES EBITDA EBIT (1) MARGIN Food and Support Services Pending Holding Bercy Investissement (2) Elior $3,055 0.8x 10.1x 14.2x 8.2% Jun-06 EQT / Macquarie Bank Compass Group's SSP Unit 3,172 1.0x 10.9x 16.0x 9.3% Jan-06 Compass Group Levy Restaurants 490 0.9x NA NA NA Jul-05 EQT and Goldman Sachs ISS A/S 4,774 0.7x 10.2x 13.0x 7.2% Jun-04 Charterhouse Capital Partners Autobar Ltd. 967 0.7x NA NA NA Dec-02 ARAMARK Fine Host 102 0.3x NA NA NA Mar-02 Compass Group Bon Appetit 156 0.6x NA NA NA Jan-02 Compass Group Seiyo Food Systems 541 0.9x NA NA NA Nov-01 ARAMARK ServiceMaster 791 0.4x 8.9x 11.4x 4.7% Aug-01 Compass Group Crothall Services Group 170 0.5x NA 9.7x NA Jul-01 Sodexho Alliance SA Sogeres and Wood Dining Services 444 0.7x NA NA NA Jun-01 Sodexho Alliance SA Sodexho Marriott Services 2,984 0.6x 10.1x 14.3x 6.1% Jun-01 LSG Lufthansa AG Sky Chefs Inc. 2,468 1.3x NA 22.8x NA May-01 Compass Group Selecta 735 1.6x 8.6x 15.1x 18.3% Apr-01 Compass Group Morrison Management Specialists 634 1.2x 17.5x 21.2x 7.1% Dec-00 Autogrill Passaggio Holding AG 153 1.0x 12.7x NA 7.8% Jul-00 Granada Compass 9,808 1.3x 17.8x 24.2x 7.1% Sep-99 Autogrill Host Marriott Services 946 0.7x 7.1x 13.8x 9.3% Jul-99 SAir Group Dobbs International Services 780 0.9x NA 10.9x NA Jul-97 Compass Daka 183 0.5x 10.2x NA 4.5% Feb-97 Investcorp Welcome Break 762 1.4x NA 14.8x NA Median 0.8x 10.2x 14.5x 7.2% Sep-03 Unifirst Textilease $178 1.9x 18.7x 27.4x 10.0% Jun-03 California Investment Fund National Services Industries 104 0.2x 7.3x NM 2.8% Jul-02 Paribas Affaires Industrielles Elis Group 1,516 1.9x NA NA NA Jun-02 Davis Service Group Sophus Berendsen 669 1.3x NA 14.1x NA May-02 Cintas Omni Services 657 2.0x 11.6x 18.4x 17.5% Mar-99 Cintas Unitog 446 1.6x 10.1x 17.7x 15.7% Apr-98 Cintas Uniforms To You 169 1.1x NA 9.9x NA Jul-97 G&K Services 29 NLS Facilities 287 1.4x NA NA NA Median 1.5x 10.8x 17.7x 12.9% Overall Median 0.9x 10.2x 14.8x 7.5% Source: Company filings, press releases, SDC, Capital IQ. Excludes non-recurring items. (1) Excludes goodwill amortization where applicable. (2) Uniform and Career Apparel (2) Holding Bercy Investissement (HBI) is controlled by Robert Zolade (Elior's founder and president), Charterhouse and Chequers Capital. As ofJuly 3,2006, HBI held 92.5% of Elior's outstanding shares and94.9% of Oceanes (convertibledebt)as a result of ongoingtender offers. |
 11 CONFIDENTIAL | PRELIMINARY ANALYSIS D R A F T Preliminary Selected Acquisitions Analysis (cont’d) ($ in millions, except per share values) Arrow Multiple Range Implied Enterprise Value Performance Low – High Low – High Food and Support Services LTM 3/31/06 EBITDA $763 9.0x – 10.5x $6,863 – $8,006 LTM 3/31/06 EBIT 512 13.0x – 15.0x 6,661 – 7,686 Segment Reference Range $6,700 – $7,750 Uniform and Career Apparel LTM 3/31/06 EBITDA $216 9.0x – 11.5x $1,948 – $2,489 LTM 3/31/06 EBIT 139 15.0x – 18.0x 2,078 – 2,493 Segment Reference Range $2,000 – $2,500 Subtotal $8,700 – $10,250 Unallocated Corporate Expense (1) ($38) 9.0x – 10.7x ($345) – ($411) Implied Enterprise Value Range $8,355 – $9,839 (–) Enterprise Value Adjustments (2) (1,865) – (1,884) Implied Equity Value Reference Range $6,490 – $7,955 – Fully Diluted Shares Outstanding 192.4 – 192.4 Implied Equity Value per Share Reference Range $34 – $41 Enterprise Value / LTM 3/31/06 EBITDA 8.8x – 10.3x FY 2006E EBITDA 8.7x – 10.2x FY 2007E EBITDA 8.1x – 9.5x LTM 3/31/06 EBIT 13.4x – 15.7x FY 2006E EBIT 13.1x – 15.4x FY 2007E EBIT 12.5x – 14.7x Source: Management estimates provided to CS on May 25 and June 6, 2006. (1) Includes unallocated cash corporate expenses multiplied by a segment weighted FY 2006E EBITDA multiple. (2) Adjustments include proceeds from options exercised and SURP liability which vary with share price. |
 12 CONFIDENTIAL | PRELIMINARY ANALYSIS D R A F T Discount Terminal LTM EBITDA Multiple Rate 6.9x 7.5x 8.5x 9.5x 8.5% 2.1% 2.6% 3.3% 3.8% 9.5% 3.1% 3.6% 4.2% 4.8% 10.5% 4.0% 4.5% 5.2% 5.7% Implied Share Price Source: Management estimates provided to CS on May 26 and July 6, 2006 and adjusted for AUCA Direct Marketing per management guidance, resulting in a $7mm and $3mm decrease in EBITDA for ‘07 and ‘08. Note: Consolidated financials include corporate overhead. (1) Includes Seamless Web earnout. (2) Includes other corporate adjustments. Consolidated Preliminary DCF Analysis – Management Case Arrow est. 5 yr. Low (Oct. 2004) Arrow April 28 7.6x Arrow est. 5 yr. Average 8.2x Compass 8.9x Sodexho 9.7x Implied Perpetuity Growth Rate (1) (1) Reflects nominal growth. Discount Terminal LTM EBITDA Multiple Rate 6.9x 7.5x 8.5x 9.5x 8.5% $31.48 $34.17 $38.65 $43.13 9.5% $29.83 $32.40 $36.68 $40.96 10.5% $28.27 $30.73 $34.81 $38.90 ($ in millions) Projected '05A-'11E FYE 9/30, 2005A 2006E 2007E 2008E 2009E 2010E 2011E CAGR Sales $10,963.4 $11,599.3 $12,222.1 $12,904.1 $13,624.5 $14,377.5 $15,162.1 5.6% % growth – 5.8% 5.4% 5.6% 5.6% 5.5% 5.5% EBITDA $900.3 $940.0 $1,017.4 $1,093.8 $1,164.8 $1,241.9 $1,312.9 6.5% % margin 8.2% 8.1% 8.3% 8.5% 8.5% 8.6% 8.7% Unlevered Net Income $363.3 $385.2 $410.9 $449.3 $487.7 $523.1 $562.4 7.6% % Margin 3.3% 3.3% 3.4% 3.5% 3.6% 3.6% 3.7% Depreciation & Amortization $319.0 $323.6 $360.0 $375.0 $384.5 $404.9 $413.1 % of sales 2.9% 2.8% 2.9% 2.9% 2.8% 2.8% 2.7% Capital Expenditures (1) ($294.9) ($316.3) ($340.5) ($351.4) ($435.9) ($408.7) ($416.3) % of sales (2.7%) (2.7%) (2.8%) (2.7%) (2.7%) (2.7%) (2.7%) (Incr.)/Decr. in Working Capital ($46.1) ($23.2) ($13.0) ($13.8) ($13.6) ($13.9) ($14.3) % of sales (0.4%) (0.2%) (0.1%) (0.1%) (0.1%) (0.1%) (0.1%) Other Adjustments ($2.4) ($12.6) $11.8 $14.0 $15.4 $16.8 $18.3 Unlevered FCF (2) $338.9 $356.8 $429.1 $473.1 $438.2 $522.3 $563.2 8.8% |
 13 CONFIDENTIAL | PRELIMINARY ANALYSIS D R A F T Consolidated Preliminary DCF Analysis – Acquisition Sensitivities Implied Share Price Implied Perpetuity Growth Rate (1) Discount Terminal LTM EBITDA Multiple Rate 6.9x 7.5x 8.5x 9.5x 8.5% $32.41 $35.14 $39.71 $44.27 9.5% $30.73 $33.34 $37.70 $42.06 10.5% $29.13 $31.63 $35.80 $39.96 Discount Terminal LTM EBITDA Multiple Rate 6.9x 7.5x 8.5x 9.5x 8.5% 2.1% 2.5% 3.2% 3.7% 9.5% 3.0% 3.5% 4.2% 4.7% 10.5% 3.9% 4.4% 5.1% 5.7% Implied Share Price Implied Perpetuity Growth Rate (1) Discount Terminal LTM EBITDA Multiple Rate 6.9x 7.5x 8.5x 9.5x 8.5% $31.41 $34.10 $38.58 $43.05 9.5% $29.76 $32.33 $36.61 $40.89 10.5% $28.20 $30.66 $34.75 $38.83 Discount Terminal LTM EBITDA Multiple Rate 6.9x 7.5x 8.5x 9.5x 8.5% 2.3% 2.8% 3.4% 3.9% 9.5% 3.3% 3.7% 4.4% 4.9% 10.5% 4.2% 4.7% 5.3% 5.9% Assumes $20mm of acquisition spending with no EBITDA contribution Assumes $150mm of acquisition spending with contribution as outlined by management (1) Reflects nominal growth. (1) Reflects nominal growth. |
 14 CONFIDENTIAL | PRELIMINARY ANALYSIS D R A F T Acquisition Matrix ($ in millions, except per share figures) Pre-Bid (1) Offer Current Acquisition Price per Share $28.11 $32.75 $32.57 $33.00 $34.00 $35.00 $36.00 $37.00 $38.00 Premium to Current (07/14/06) (13.7%) 0.6% – 1.3% 4.4% 7.5% 10.5% 13.6% 16.7% Premium to Pre-Announcement (04/28/06) – 16.5% 15.9% 17.4% 21.0% 24.5% 28.1% 31.6% 35.2% Fully-Diluted Shares Outstanding 183.8 192.4 192.4 192.4 192.4 192.4 192.4 192.4 192.4 Equity Value $5,167 $6,302 $6,267 $6,350 $6,542 $6,735 $6,927 $7,120 $7,312 Enterprise Value Adjustments 1,957 1,862 1,862 1,863 1,866 1,868 1,871 1,873 1,876 Enterprise Value $7,124 $8,164 $8,129 $8,213 $8,408 $8,603 $8,798 $8,993 $9,188 PF Buyer Adjustments (+) Estimated Option Premium Tax Shield $7 $29 $29 $30 $33 $35 $38 $41 $44 (–) Debt Prepayments (9) (9) (9) (9) (9) (9) (9) (9) (9) PF Buyer Enterprise Value $7,122 $8,185 $8,149 $8,234 $8,432 $8,629 $8,827 $9,025 $9,223 Enterprise Value / LTM EBITDA (3/31/06) $954 7.6x 8.6x 8.5x 8.6x 8.8x 9.0x 9.2x 9.4x 9.6x FY2006E EBITDA 962 7.6 8.5 8.5 8.5 8.7 8.9 9.1 9.3 9.6 FY2007E EBITDA 1,034 7.0 7.9 7.9 7.9 8.1 8.3 8.5 8.7 8.9 LTM EBIT (3/31/06) $626 11.8x 13.0x 13.0x 13.1x 13.4x 13.7x 14.1x 14.4x 14.7x FY2006E EBIT 638 11.6 12.8 12.7 12.9 13.2 13.5 13.8 14.1 14.4 FY2007E EBIT 674 10.8 12.1 12.1 12.2 12.5 12.8 13.0 13.3 13.6 Equity Value / LTM Net Income (3/31/06) $328 15.7x 19.2x 19.1x 19.3x 19.9x 20.5x 21.1x 21.7x 22.3x FY2006E Net Income 312 16.5 20.2 20.1 20.3 20.9 21.6 22.2 22.8 23.4 FY2007E Net Income 338 15.3 18.6 18.5 18.8 19.3 19.9 20.5 21.0 21.6 Source: Management estimates provided to CS on May 25 and July 6, 2006 and public filings. Note: LTM, FY2006E and FY2007E EBITDA, EBIT and net income exclude non-cash FAS 123 and RSU corporate expenses of $22.0mm, $22.0mm and $17.0mm, respectively, (per management estimates). (1) Assumes exercisable options in the calculations of fully diluted shares outstanding and the enterprise value adjustment; assumes debt as of 3/31/06. |
 15 CONFIDENTIAL | PRELIMINARY ANALYSIS 3. Review of Selected Alternatives |
 16 CONFIDENTIAL | PRELIMINARY ANALYSIS A. Share Repurchase |
 17 CONFIDENTIAL | PRELIMINARY ANALYSIS D R A F T CS believes Arrow may be able to perform a stock repurchase via a debt issuance, increasing leverage to 2.5x - 4.5x EBITDA. CS believes Arrow may be able to increase leverage to approximately 2.5x EBITDA while maintaining its investment grade rating CS believes leverage of 4.5x EBITDA could be achieved in the current market without the market viewing Arrow as “over-levered” Analysis of Share Repurchase Recapitalization / Repurchase ($ in millions, except per share data) Repurchase Price per Share $32.00 $32.00 $32.00 % Premium 13.8% 13.8% 13.8% Pro Forma LTM Credit Statistics Status Quo (1) Debt / EBITDA 2.0x 2.5x 3.5x 4.5x Transaction Overview New Debt Issued $563 $1,525 $2,487 Shares Repurchased (MM) 17.2 46.5 75.8 % of Basic Shares Outstanding 9.5% 25.8% 42.1% Financing Rate (2) 7.62% 7.80% 7.88% Assumed FY07E P/E Multiple 16.7x 16.1x 15.5x Implied 2007E EBITDA Multiple 7.6x 7.6x 7.6x Effective Value Per Average Share Average Value Received in Repurchase $3.05 $8.26 $13.48 Residual Value of Arrow Equity 27.52 22.11 16.97 Total Effective Value per Share $30.57 $30.37 $30.45 % Premium to Pre-Offer Price 8.7% 8.0% 8.3% Note: Analysis based on management estimates provided to CS on May 25 and July 6, 2006, Arrow pre-offer stock price of $28.11 and 180 million basic shares outstanding. (1) Assumes debt balance at the end of FY2006 of $1,842.0 million and leverage multiple based on 6/30/06E LTM adjusted EBITDA of $962.1 million (per management estimates). (2) Assumes financing rates of L + 2.00% on new bank debt and 8.00% on new senior unsecured notes; assumes financing fees of 2.5%. |
 18 CONFIDENTIAL | PRELIMINARY ANALYSIS D R A F T Several factors may influence Arrow’s stock price in the event of a major repurchase in lieu of a transaction: Mr. Neubauer’s participation (e.g., potential for increased “overhang” if he does not participate) Assumption on pro forma trading multiple Impact of leverage Impact on rotation into / out of stock Execution risk in plan Impact on stock price of repurchase in lieu of transaction Ratings Analysis of Share Repurchase (cont’d) Recapitalization / Repurchase Pro Forma Ownership @ 2.5x Leverage (shares in millions) Current Participates Pro Rata Does Not Participate Joseph Neubauer A Shares 23.8 21.5 23.8 B Shares 0.0 0.0 0.0 Total Shares 23.8 21.5 23.8 Economic Interest 13.3% 13.3% 14.7% Voting Interest 33.7% 33.7% 36.3% Public Float 67.2% 67.2% 66.1% Note: Assumes shares repurchased at $32.00 per share. Pro Forma Ownership @ 3.5x Leverage (shares in millions) Current Participates Pro Rata Does Not Participate Joseph Neubauer A Shares 23.8 17.6 23.8 B Shares 0.0 0.0 0.0 Total Shares 23.8 17.7 23.8 Economic Interest 13.3% 13.3% 17.9% Voting Interest 33.7% 33.7% 42.0% Public Float 67.2% 67.2% 63.6% Note: Assumes shares repurchased at $32.00 per share. Pro Forma Ownership @ 4.5x Leverage (shares in millions) Current Participates Pro Rata Does Not Participate Joseph Neubauer A Shares 23.8 13.8 23.8 B Shares 0.0 0.0 0.0 Total Shares 23.8 13.8 23.8 Economic Interest 13.3% 13.3% 22.9% Voting Interest 33.7% 33.7% 49.7% Public Float 67.2% 67.2% 59.7% Note: Assumes shares repurchased at $32.00 per share. |
 19 CONFIDENTIAL | PRELIMINARY ANALYSIS D R A F T Analysis of Share Repurchase (cont’d) Recapitalization / Repurchase Projected Share Price and Value per Share at Total Leverage of 3.5x EBITDA Note: These calculations are based upon management estimates of EPS growth rates and current public market trading multiples. These calculations do not purport to reflect the value of these securities or the prices at which securities actually may be sold. Calculations based upon estimates of future results are not necessarily indicative of actual future results, which may be significantly more or less favorable than those suggested by these calculations. Note: Analysis assumes repurchase price of $32 per share. (1) Implied price per share discounted to present value at cost of equity of 11.0%. ($ in millions) LTM Projected Fiscal Year Ending September 30, 09/30/06 2007 2008 2009 Revenues $11,599 $12,222 $12,904 $13,624 % Growth -- 5.4% 5.6% 5.6% Adjusted Net Income $215 $250 $292 $331 Adjusted EPS $1.59 $1.85 $2.15 $2.44 Assumed Forward P/E Multiple 16.1x 16.1x 16.1x 16.1x FV Implied Price per Share $29.80 $34.63 $39.27 $43.60 Effective Present Value per Share (1) Average Value Received in Repurchase $8.26 $8.26 $8.26 $8.26 Residual Value of Arrow Equity 22.11 23.14 23.64 23.64 Effective Present Value per Share $30.37 $31.41 $31.91 $31.91 |
 20 CONFIDENTIAL | PRELIMINARY ANALYSIS D R A F T Share Repurchase Sensitivities Recapitalization / Repurchase @ 2.5x Total Leverage @ 3.5x Total Leverage @ 4.5x Total Leverage Note: Multiples represent the implied forward EBITDA multiple. Share prices discounted at 11% cost of equity. For each 1% variation in the cost of equity, PV of share prices is impacted by $0.55 – $0.60. Effective PV Value Per Share Sensitivity Note: These calculations are based upon management estimates of EPS growth rates and current public market trading multiples. These calculations do not purport to reflect the value of these securities or the prices at which securities actually may be sold. Calculations based upon estimates of future results are not necessarily indicative of actual future results, which may be significantly more or less favorable than those suggested by these calculations. P/E Ratio 14.6x 15.5x 09/30/06 $29.49 $30.45 7.4x 7.6x 09/30/08 $31.29 $32.37 7.5x 7.7x P/E Ratio 15.2x 16.1x 09/30/06 $29.16 $30.37 7.3x 7.6x 09/30/08 $30.61 $31.91 7.5x 7.8x P/E Ratio 15.8x 16.7x 09/30/06 $29.11 $30.57 7.3x 7.6x 09/30/08 $30.13 $31.65 7.6x 7.9x |
 21 CONFIDENTIAL | PRELIMINARY ANALYSIS B. Leveraged Buyout |
 22 CONFIDENTIAL | PRELIMINARY ANALYSIS D R A F T Summary Observations Credit markets have tightened over the last 4 weeks Current funded leverage levels have contracted Leverage multiples for deals to be funded in the future remain relatively unchanged; however, interest rate spreads have widened Revised estimates of the cost of financing are reflected below CS has analyzed 2 cases with respect to a potential LBO: Management Case Estimated Consortium Case CS / Management Case (7.0x leverage) Assumed Consortium Case (6.5x leverage) Tranche Original Revised Original (1) Revised (2) Term Loan L + 225 L + 250 L + 250 L + 250 Sr. Unsecurred Notes 9.00% 9.50% 8.25% 9.50% Sr. Toggle Notes 9.75% 10.25% 8.75% NA Sr. Subordinated Notes 10.25% 10.75% 10.00% 11.00% Holdco PIK 12.50% 13.50% NA NA (1) Received from management. (2) Received from the consortium. |
 23 CONFIDENTIAL | PRELIMINARY ANALYSIS D R A F T Preliminary LBO Analysis: Management Case (7.0x Leverage @ $34) Sources and Uses Financial Summary Source: Management estimates provided to CS on May 25 and July 6, 2006. (1) Annual stock option expense of approximately $17 – $20 million added back during forecast period. ($ in millions) LTM Projected Fiscal Year Ending September 30, 09/30/06 2007 2008 2009 2010 2011 Revenues $11,599 $12,222 $12,904 $13,624 $14,378 $15,162 % Growth -- 5.4% 5.6% 5.6% 5.5% 5.5% EBITDA (1) $973 $1,034 $1,112 $1,184 $1,262 $1,334 % Margin 8.4% 8.5% 8.6% 8.7% 8.8% 8.8% Balance Sheet Summary Cash $44 $44 $44 $44 $44 $44 Bank Debt $3,127 $3,052 $2,924 $2,824 $2,634 $2,394 Total Debt $6,735 $6,693 $6,603 $6,546 $6,405 $6,219 Cumulative Debt Paid Down 0.6% 2.0% 2.8% 4.9% 7.7% Credit Statistics Summary Senior Debt / EBITDA 3.2x 3.0x 2.6x 2.4x 2.1x 1.8x Total Debt / EBITDA 6.9x 6.5x 5.9x 5.5x 5.1x 4.7x EBITDA / Int. Exp. 1.6x 1.8x 1.9x 2.1x 2.2x 2.4x ($ in millions) Spread / x of LTM Sources Amount % Int. Rate Adj. EBITDA Uses Amount % Excess Cash $0.0 0% – 0.00x Equity Purchase Price @ $34 per Share $6,270.8 73% Term Loan B $3,126.8 37% 2.50% 3.25x Refinance Term Loan B 1,592.0 19% A/R Securitization Facility 225.0 3% 1.00% 0.23x Rollover A/R Securitization Facility 225.0 3% 5.0% Notes due 2012 250.0 3% 5.00% 0.26x Rollover 5.00% Notes 250.0 3% Senior Unsecured Notes 841.8 10% 9.50% 0.88x Est. Prepayment Penalties 8.9 0% Senior Toggle Notes 841.8 10% 10.25% 0.88x Transaction Expenses 200.0 2% Senior Subordinated Notes 1,202.6 14% 10.75% 1.25x Holdco PIK 246.6 3% 13.50% 0.26x Total Debt $6,734.5 79% – 7.00x Sponsors' Equity 1,812.1 21% – – Total Sources $8,546.6 100% – – Total Uses $8,546.6 100% Note: Leverage multiple based on 6/30/06E LTM adjusted EBITDA of $962.1 million (per management estimates). |
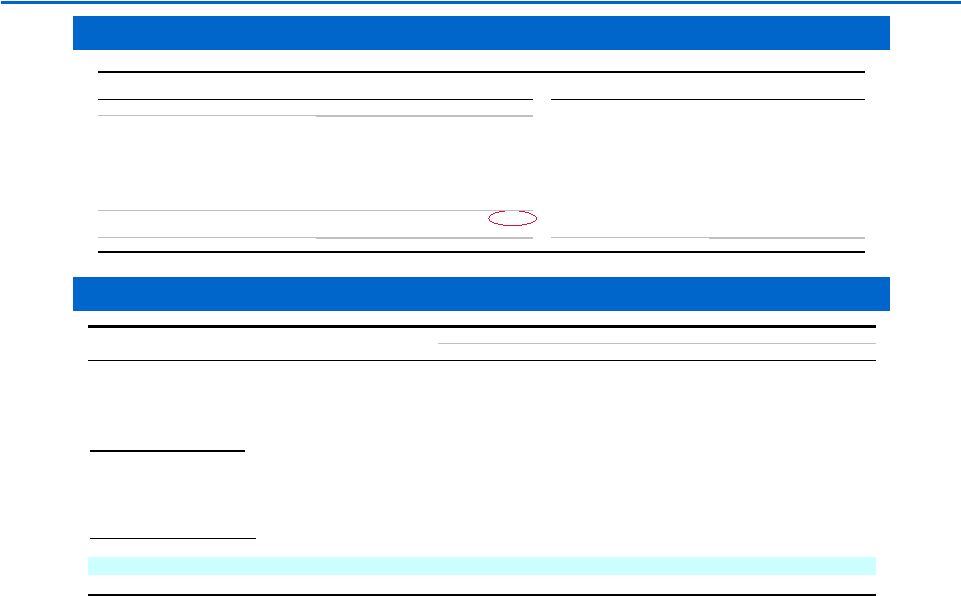
 24 CONFIDENTIAL | PRELIMINARY ANALYSIS D R A F T No Management Promote Note: Assume 5-year return and leverage of 6.49x LTM 6/30/06 EBITDA. Promote structured as options with roughly 70% bought at the time of transaction based on the current equity value, and the remaining 30% bought throughout the investment period at 1.5x the initial equity value. Illustrative LBO Return Sensitivity Analysis: Management Case – Purchase Price vs. Exit Multiple 5% Management Promote 10% Management Promote 17.5% Management Promote Assumes Consortium Leverage of 6.49x LTM 6/30/06 EBITDA Premium to Pre-Bid 16.5% 17.4% 21.0% 24.5% Implied Offer Price $32.75 $33.00 $34.00 $35.00 Entry '06E EBITDA x 8.3x 8.3x 8.5x 8.7x 7.5x 17.0% 16.5% 14.5% 12.8% 8.0x 20.2% 19.7% 17.7% 15.9% 8.5x 23.1% 22.6% 20.6% 18.7% 9.0x 25.8% 25.3% 23.2% 21.3% Premium to Pre-Bid 16.5% 17.4% 21.0% 24.5% Implied Offer Price $32.75 $33.00 $34.00 $35.00 Entry '06E EBITDA x 8.3x 8.3x 8.5x 8.7x 7.5x 16.4% 15.9% 14.1% 12.4% 8.0x 19.6% 19.1% 17.1% 15.4% 8.5x 22.4% 21.9% 19.9% 18.1% 9.0x 25.0% 24.5% 22.5% 20.7% Premium to Pre-Bid 16.5% 17.4% 21.0% 24.5% Implied Offer Price $32.75 $33.00 $34.00 $35.00 Entry '06E EBITDA x 8.3x 8.3x 8.5x 8.7x 7.5x 15.9% 15.4% 13.6% 12.0% 8.0x 19.0% 18.5% 16.6% 14.9% 8.5x 21.8% 21.3% 19.3% 17.6% 9.0x 24.3% 23.8% 21.8% 20.0% Premium to Pre-Bid 16.5% 17.4% 21.0% 24.5% Implied Offer Price $32.75 $33.00 $34.00 $35.00 Entry '06E EBITDA x 8.3x 8.3x 8.5x 8.7x 7.5x 15.2% 14.8% 13.0% 11.5% 8.0x 18.2% 17.7% 15.9% 14.3% 8.5x 20.9% 20.4% 18.5% 16.8% 9.0x 23.3% 22.8% 20.9% 19.2% |
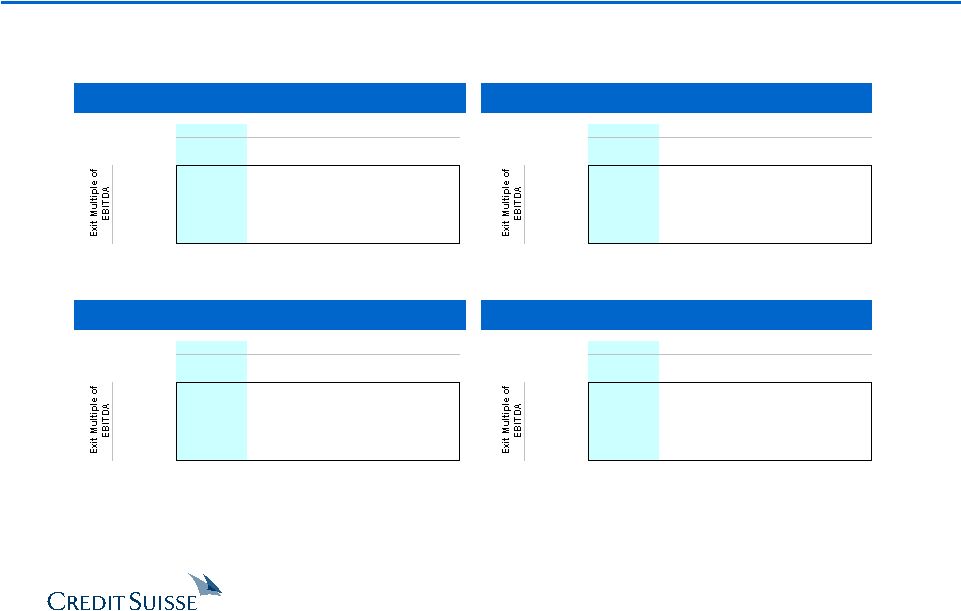
 25 CONFIDENTIAL | PRELIMINARY ANALYSIS D R A F T No Management Promote Illustrative LBO Return Sensitivity Analysis: Management Case – Purchase Price vs. Exit Multiple 5% Management Promote 10% Management Promote 17.5% Management Promote Assumes CS Leverage of 7.0x LTM 6/30/06 EBITDA Premium to Pre-Bid 16.5% 17.4% 21.0% 24.5% Implied Offer Price $32.75 $33.00 $34.00 $35.00 Entry '06E EBITDA x 8.3x 8.3x 8.5x 8.7x 7.5x 19.3% 18.7% 16.1% 13.9% 8.0x 23.2% 22.5% 19.9% 17.6% 8.5x 26.7% 26.0% 23.3% 20.9% 9.0x 29.8% 29.1% 26.3% 23.9% Premium to Pre-Bid 16.5% 17.4% 21.0% 24.5% Implied Offer Price $32.75 $33.00 $34.00 $35.00 Entry '06E EBITDA x 8.3x 8.3x 8.5x 8.7x 7.5x 18.7% 18.1% 15.6% 13.5% 8.0x 22.5% 21.8% 19.3% 17.1% 8.5x 25.9% 25.2% 22.6% 20.3% 9.0x 29.0% 28.2% 25.5% 23.2% Premium to Pre-Bid 16.5% 17.4% 21.0% 24.5% Implied Offer Price $32.75 $33.00 $34.00 $35.00 Entry '06E EBITDA x 8.3x 8.3x 8.5x 8.7x 7.5x 18.2% 17.5% 15.1% 13.1% 8.0x 21.9% 21.2% 18.7% 16.5% 8.5x 25.2% 24.5% 21.9% 19.7% 9.0x 28.1% 27.4% 24.8% 22.5% Premium to Pre-Bid 16.5% 17.4% 21.0% 24.5% Implied Offer Price $32.75 $33.00 $34.00 $35.00 Entry '06E EBITDA x 8.3x 8.3x 8.5x 8.7x 7.5x 17.4% 16.8% 14.5% 12.5% 8.0x 20.9% 20.3% 17.9% 15.8% 8.5x 24.1% 23.5% 21.0% 18.8% 9.0x 27.0% 26.3% 23.8% 21.6% Note: Assume 5-year return and leverage of 7.0x LTM 6/30/06 EBITDA. Promote structured as options with roughly 70% bought at the time of transaction based on the current equity value, and the remaining 30% bought throughout the investment period at 1.5x the initial equity value. |
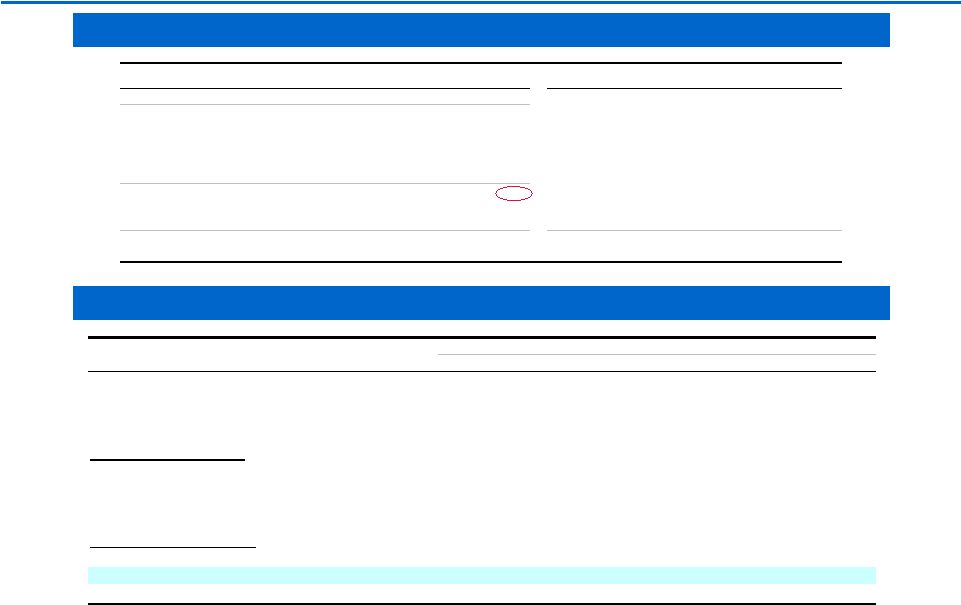
 26 CONFIDENTIAL | PRELIMINARY ANALYSIS D R A F T Illustrative LBO Return Sensitivity Analysis: Est. Consortium Case – Purchase Price vs. Exit Multiple No Management Promote 5% Management Promote 10% Management Promote 17.5% Management Promote Assumes Consortium Leverage of 6.49x LTM 6/30/06 EBITDA Premium to Pre-Bid 16.5% 17.4% 21.0% 24.5% Implied Offer Price $32.75 $33.00 $34.00 $35.00 Entry '06E EBITDA x 8.2x 8.3x 8.5x 8.6x 7.5x 12.4% 11.9% 10.1% 8.4% 8.0x 15.8% 15.3% 13.5% 11.8% 8.5x 18.9% 18.4% 16.5% 14.7% 9.0x 21.7% 21.2% 19.2% 17.4% Premium to Pre-Bid 16.5% 17.4% 21.0% 24.5% Implied Offer Price $32.75 $33.00 $34.00 $35.00 Entry '06E EBITDA x 8.2x 8.3x 8.5x 8.6x 7.5x 11.9% 11.5% 9.7% 8.1% 8.0x 15.3% 14.8% 13.0% 11.4% 8.5x 18.3% 17.8% 15.9% 14.2% 9.0x 21.0% 20.5% 18.6% 16.9% Premium to Pre-Bid 16.5% 17.4% 21.0% 24.5% Implied Offer Price $32.75 $33.00 $34.00 $35.00 Entry '06E EBITDA x 8.2x 8.3x 8.5x 8.6x 7.5x 11.5% 11.1% 9.4% 7.9% 8.0x 14.8% 14.3% 12.6% 11.0% 8.5x 17.7% 17.2% 15.4% 13.8% 9.0x 20.4% 19.9% 18.0% 16.3% Premium to Pre-Bid 16.5% 17.4% 21.0% 24.5% Implied Offer Price $32.75 $33.00 $34.00 $35.00 Entry '06E EBITDA x 8.2x 8.3x 8.5x 8.6x 7.5x 11.0% 10.6% 9.0% 7.5% 8.0x 14.1% 13.7% 12.0% 10.5% 8.5x 16.9% 16.5% 14.7% 13.1% 9.0x 19.5% 19.0% 17.2% 15.6% Note: Assume 5-year return and leverage of 6.49x LTM 6/30/06 EBITDA. Promote structured as options with roughly 70% bought at the time of transaction based on the current equity value, and the remaining 30% bought throughout the investment period at 1.5x the initial equity value. |
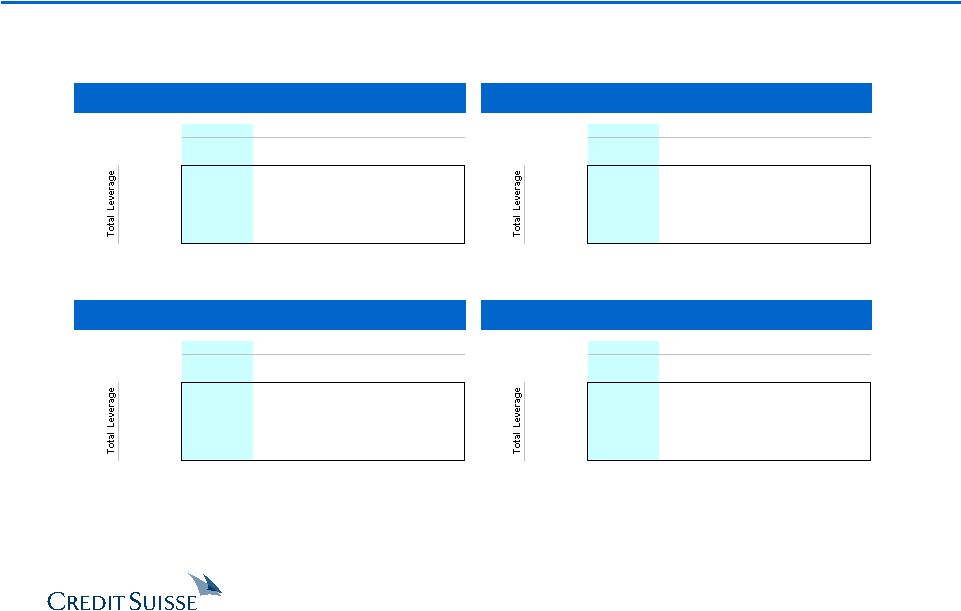
 27 CONFIDENTIAL | PRELIMINARY ANALYSIS D R A F T Illustrative LBO Return Sensitivity Analysis: Est. Consortium Case – Purchase Price vs. Exit Multiple No Management Promote 5% Management Promote 10% Management Promote 17.5% Management Promote Assumes CS Leverage of 7.0x LTM 6/30/06 EBITDA Premium to Pre-Bid 16.5% 17.4% 21.0% 24.5% Implied Offer Price $32.75 $33.00 $34.00 $35.00 Entry '06E EBITDA x 8.2x 8.3x 8.5x 8.6x 7.5x 13.9% 13.3% 10.9% 8.8% 8.0x 18.1% 17.5% 15.0% 12.9% 8.5x 21.8% 21.1% 18.6% 16.4% 9.0x 25.1% 24.4% 21.8% 19.6% Premium to Pre-Bid 16.5% 17.4% 21.0% 24.5% Implied Offer Price $32.75 $33.00 $34.00 $35.00 Entry '06E EBITDA x 8.2x 8.3x 8.5x 8.6x 7.5x 13.4% 12.8% 10.5% 8.5% 8.0x 17.5% 16.9% 14.5% 12.4% 8.5x 21.1% 20.5% 18.0% 15.9% 9.0x 24.3% 23.7% 21.1% 18.9% Premium to Pre-Bid 16.5% 17.4% 21.0% 24.5% Implied Offer Price $32.75 $33.00 $34.00 $35.00 Entry '06E EBITDA x 8.2x 8.3x 8.5x 8.6x 7.5x 13.0% 12.4% 10.2% 8.2% 8.0x 17.0% 16.3% 14.0% 12.0% 8.5x 20.5% 19.8% 17.4% 15.3% 9.0x 23.6% 22.9% 20.5% 18.3% Premium to Pre-Bid 16.5% 17.4% 21.0% 24.5% Implied Offer Price $32.75 $33.00 $34.00 $35.00 Entry '06E EBITDA x 8.2x 8.3x 8.5x 8.6x 7.5x 12.4% 11.8% 9.7% 7.9% 8.0x 16.2% 15.6% 13.4% 11.4% 8.5x 19.6% 18.9% 16.6% 14.6% 9.0x 22.6% 21.9% 19.6% 17.5% Note: Assume 5-year return and leverage of 7.0x LTM 6/30/06 EBITDA. Promote structured as options with roughly 70% bought at the time of transaction based on the current equity value, and the remaining 30% bought throughout the investment period at 1.5x the initial equity value. |
 28 CONFIDENTIAL | PRELIMINARY ANALYSIS D R A F T Leverage levels Management promote Reduce size of promote Increase performance-based component Target IRRs Assumed exit multiple Key Drivers of Value in LBO |
 29 CONFIDENTIAL | PRELIMINARY ANALYSIS Appendix |
 30 CONFIDENTIAL | PRELIMINARY ANALYSIS A. Supplemental LBO Materials |
 31 CONFIDENTIAL | PRELIMINARY ANALYSIS D R A F T Financial Summary Sources and Uses Preliminary LBO Analysis: Est. Consortium Case (6.49x Leverage @ $32.75) Source: Represents Consortium LBO with annual estimated revenue growth of 5.0% and EBITDA margin of 8.4%. ($ in millions) LTM Projected Fiscal Year Ending September 30, 09/30/06 2007 2008 2009 2010 2011 Revenues $11,552 $12,130 $12,736 $13,373 $14,042 $14,744 % Growth -- 5.0% 5.0% 5.0% 5.0% 5.0% EBITDA $973 $1,022 $1,073 $1,126 $1,183 $1,242 % Margin 8.4% 8.4% 8.4% 8.4% 8.4% 8.4% Balance Sheet Summary Cash $44 $44 $44 $44 $44 $44 Bank Debt $3,594 $3,510 $3,390 $3,312 $3,161 $2,971 Total Debt $6,194 $6,110 $5,990 $5,912 $5,761 $5,571 Cumulative Debt Paid Down 1.4% 3.3% 4.6% 7.0% 10.1% Credit Statistics Summary Senior Debt / EBITDA 3.7x 3.4x 3.2x 2.9x 2.7x 2.4x Total Debt / EBITDA 6.4x 6.0x 5.6x 5.2x 4.9x 4.5x EBITDA / Int. Exp. 1.8x 1.9x 2.0x 2.2x 2.3x 2.5x ($ in millions) Spread / x of LTM Sources Amount % Int. Rate Adj. EBITDA Uses Amount % Excess Cash $0.0 0% – 0.0x Equity Purchase Price $6,031.0 72% Term Loan B $3,615.0 43% 2.50% 3.8x Refinance Term Loan B 1,574.0 19% 5.0% Notes due 2012 250.0 3% 5.00% 0.3x Refinance 5.0% Notes due 2012 250.0 3% Senior Unsecured Notes 1,670.0 20% 9.50% 1.7x Refinance A/R Securitization Facility 225.0 3% Senior Subordinated Notes 480.0 6% 11.00% 0.5x Est. Prepayment Penalties 16.0 0% A/R Securitization Facility 225.0 3% 1.00% 0.2x Transaction Expenses 258.0 3% Total Debt $6,240.0 75% – 6.5x Management's Contribution (1) 317.1 4% – – Sponsors' Equity 1,796.9 22% – – Total Equity 2,114.0 25% Total Sources $8,354.0 100% – – Total Uses $8,354.0 100% Note:Leverage multiple based on 6/30/06E LTM adjusted EBITDA of $962.1 million (per management estimates). (1) Excludes management's promote. |
 32 CONFIDENTIAL | PRELIMINARY ANALYSIS D R A F T Note: Assume 5-year return and LTM exit multiple of 8.5x FY11E EBITDA. Assumes current consortium leverage based on 6.49x 6/30 LTM EBITDA. Promote structured as options with roughly 70% bought at the time of transaction based on the current equity value, and the remaining 30% bought throughout the investment period at 1.5x the beginning equity value. Illustrative LBO Return Sensitivity Analysis: Est. Consortium Case – Purchase Price vs. Leverage No Management Promote 5% Management Promote 10% Management Promote 17.5% Management Promote Premium to Pre-Bid 16.5% 17.4% 21.0% 24.5% Implied Offer Price $32.75 $33.00 $34.00 $35.00 Entry '06E EBITDA x 8.2x 8.3x 8.5x 8.6x 6.25x 17.9% 17.5% 15.7% 14.2% 6.49x 18.9% 18.4% 16.5% 14.7% 6.75x 20.3% 19.7% 17.5% 15.5% 7.00x 21.8% 21.1% 18.6% 16.4% Premium to Pre-Bid 16.5% 17.4% 21.0% 24.5% Implied Offer Price $32.75 $33.00 $34.00 $35.00 Entry '06E EBITDA x 8.2x 8.3x 8.5x 8.6x 6.25x 17.3% 16.9% 15.2% 13.7% 6.49x 18.3% 17.8% 15.9% 14.2% 6.75x 19.6% 19.0% 16.9% 15.0% 7.00x 21.1% 20.5% 18.0% 15.9% Premium to Pre-Bid 16.5% 17.4% 21.0% 24.5% Implied Offer Price $32.75 $33.00 $34.00 $35.00 Entry '06E EBITDA x 8.2x 8.3x 8.5x 8.6x 6.25x 16.8% 16.4% 14.7% 13.2% 6.49x 17.7% 17.2% 15.4% 13.8% 6.75x 19.0% 18.4% 16.4% 14.5% 7.00x 20.5% 19.8% 17.4% 15.3% Premium to Pre-Bid 16.5% 17.4% 21.0% 24.5% Implied Offer Price $32.75 $33.00 $34.00 $35.00 Entry '06E EBITDA x 8.2x 8.3x 8.5x 8.6x 6.25x 16.0% 15.6% 14.1% 12.6% 6.49x 16.9% 16.5% 14.7% 13.1% 6.75x 18.1% 17.6% 15.6% 13.8% 7.00x 19.6% 18.9% 16.6% 14.6% |
 33 CONFIDENTIAL | PRELIMINARY ANALYSIS D R A F T Note: Assume 5-year return and LTM exit multiple of 8.5x FY11E EBITDA. Assumes current consortium leverage based on 6.49x 6/30 LTM EBITDA. Promote structured as options with roughly 70% bought at the time of transaction based on the current equity value, and the remaining 30% bought throughout the investment period at 1.5x the beginning equity value. Illustrative LBO Return Sensitivity Analysis: Management Case – Purchase Price vs. Leverage No Management Promote 5% Management Promote 10% Management Promote 17.5% Management Promote Premium to Pre-Bid 16.5% 17.4% 21.0% 24.5% Implied Offer Price $32.75 $33.00 $34.00 $35.00 Entry '06E EBITDA x 8.3x 8.3x 8.5x 8.7x 6.25x 21.2% 20.7% 18.9% 17.3% 6.49x 22.4% 21.9% 19.9% 18.1% 6.75x 24.1% 23.5% 21.2% 19.2% 7.00x 25.9% 25.2% 22.6% 20.3% Premium to Pre-Bid 16.5% 17.4% 21.0% 24.5% Implied Offer Price $32.75 $33.00 $34.00 $35.00 Entry '06E EBITDA x 8.3x 8.3x 8.5x 8.7x 6.25x 21.9% 21.4% 19.6% 17.9% 6.49x 23.1% 22.6% 20.6% 18.7% 6.75x 24.9% 24.2% 21.9% 19.8% 7.00x 26.7% 26.0% 23.3% 20.9% Premium to Pre-Bid 16.5% 17.4% 21.0% 24.5% Implied Offer Price $32.75 $33.00 $34.00 $35.00 Entry '06E EBITDA x 8.3x 8.3x 8.5x 8.7x 6.25x 20.6% 20.1% 18.4% 16.8% 6.49x 21.8% 21.3% 19.3% 17.6% 6.75x 23.4% 22.8% 20.6% 18.6% 7.00x 25.2% 24.5% 21.9% 19.7% Premium to Pre-Bid 16.5% 17.4% 21.0% 24.5% Implied Offer Price $32.75 $33.00 $34.00 $35.00 Entry '06E EBITDA x 8.3x 8.3x 8.5x 8.7x 6.25x 19.7% 19.2% 17.6% 16.1% 6.49x 20.9% 20.4% 18.5% 16.8% 6.75x 22.4% 21.9% 19.7% 17.8% 7.00x 24.1% 23.5% 21.0% 18.8% |
 34 CONFIDENTIAL | PRELIMINARY ANALYSIS B. Supplemental Materials |
 35 CONFIDENTIAL | PRELIMINARY ANALYSIS D R A F T Management Financial Summary ($ in millions) Historical Projected CAGR FYE 9/30, 2001 2002 2003 2004 2005 2006E 2007E 2008E 2009E 2010E 2011E '01A–'05A '05A–'11E Revenue FSS–United States $4,816 $5,625 $6,545 $6,879 $7,129 $7,456 $7,925 $8,375 $8,853 $9,349 $9,862 10.3% 5.6% % Growth 9.3% 16.8% 16.4% 5.1% 3.6% 4.6% 6.3% 5.7% 5.7% 5.6% 5.5% FSS–International $1,109 $1,201 $1,424 $1,830 $2,280 $2,513 $2,584 $2,739 $2,901 $3,074 $3,258 19.7% 6.1% % Growth 10.7% 8.2% 18.6% 28.6% 24.6% 10.2% 2.8% 6.0% 5.9% 6.0% 6.0% AUCA $1,434 $1,439 $1,479 $1,483 $1,554 $1,630 $1,713 $1,790 $1,870 $1,954 $2,042 2.0% 4.7% % Growth 0.6% 0.3% 2.8% 0.3% 4.8% 4.9% 5.1% 4.5% 4.5% 4.5% 4.5% Total Revenue $7,359 $8,264 $9,448 $10,192 $10,963 $11,599 $12,222 $12,904 $13,624 $14,378 $15,162 10.5% 5.6% % Growth 7.7% 12.3% 14.3% 7.9% 7.6% 5.8% 5.4% 5.6% 5.6% 5.5% 5.5% % Organic Growth 5.1% 1.7% 2.6% 5.7% 4.0% 5.8% 5.4% 5.6% 5.6% 5.5% 5.5% 3.5% 5.6% EBITDA FSS–United States $393 $469 $559 $562 $597 $625 $679 $728 $773 $825 $873 11.0% 6.6% % Margin 8.2% 8.3% 8.5% 8.2% 8.4% 8.4% 8.6% 8.7% 8.7% 8.8% 8.9% FSS–International $59 $67 $86 $104 $128 $158 $170 $183 $195 $208 $222 21.3% 9.6% % Margin 5.3% 5.6% 6.1% 5.7% 5.6% 6.3% 6.6% 6.7% 6.7% 6.8% 6.8% AUCA $202 $205 $204 $206 $213 $218 $231 $250 $268 $283 $297 1.4% 5.7% % Margin 14.1% 14.2% 13.8% 13.9% 13.7% 13.4% 13.5% 14.0% 14.3% 14.5% 14.5% Corporate ($24) ($30) ($40) ($40) ($37) ($60) ($63) ($67) ($71) ($74) ($79) 11.8% 13.5% Avg. Margins Total EBITDA $630 $710 $809 $833 $900 $940 $1,017 $1,094 $1,165 $1,242 $1,313 9.4% 6.5% '01A–'05A '05A–'11E % Margin 8.6% 8.6% 8.6% 8.2% 8.2% 8.1% 8.3% 8.5% 8.5% 8.6% 8.7% 8.4% 8.4% Diluted EPS (2) $1.00 $1.25 $1.34 $1.36 $1.53 $1.55 $1.78 $2.06 $2.35 $2.63 $2.94 9.1% 13.7% % Growth 15.1% 24.8% 7.2% 1.5% 12.5% 1.2% 14.7% 16.0% 14.1% 11.9% 11.8% Capex FSS–United States $96 $130 $174 $185 $168 $220 $222 $226 $239 $253 $267 15.0% 8.0% % of Revenue 2.0% 2.3% 2.7% 2.7% 2.4% 3.0% 2.8% 2.7% 2.7% 2.7% 2.7% FSS–International $29 $22 $35 $43 $63 $46 $55 $58 $62 $65 $69 21.4% 1.5% % of Revenue 2.6% 1.9% 2.5% 2.4% 2.8% 1.8% 2.1% 2.1% 2.1% 2.1% 2.1% AUCA $79 $71 $94 $101 $95 $88 $94 $98 $103 $108 $113 4.6% 3.0% % of Revenue 5.5% 4.9% 6.4% 6.8% 6.1% 5.4% 5.5% 5.5% 5.5% 5.5% 5.5% Asset Disposal – – – – ($31) ($38) ($30) ($31) ($33) ($35) ($36) Total Capex (3) $204 $223 $303 $330 $295 $316 $341 $351 $436 $409 $416 9.6% 5.9% % of Revenue 2.8% 2.7% 3.2% 3.2% 2.7% 2.7% 2.8% 2.7% 3.2% 2.8% 2.7% Revenue Mix FSS–United States 65.4% 68.1% 69.3% 67.5% 65.0% 64.3% 64.8% 64.9% 65.0% 65.0% 65.0% FSS–International 15.1% 14.5% 15.1% 18.0% 20.8% 21.7% 21.1% 21.2% 21.3% 21.4% 21.5% AUCA 19.5% 17.4% 15.7% 14.5% 14.2% 14.0% 14.0% 13.9% 13.7% 13.6% 13.5% Source: Management estimates provided to CS on May 25 and June 6, 2006. (1) Includes $22 million of 2006E corporate overhead comprised of non-cash FAS 123 and RSU expenses. (2) EPS reflects downward revision per management guidance. (3) Excludes$20 million of annual capex foracquisitions during the projected period; includesSeamlessWeb earnout. (1) |
 36 CONFIDENTIAL | PRELIMINARY ANALYSIS D R A F T Preliminary Selected Companies Analysis ($ in millions, except per share values) EV / EBITDA P/E (1) Share Price as of 2006E 2007E 2006E 2007E Last Last Last Last Last Company Meeting Today % Change Meeting Today Meeting Today Meeting Today Meeting Today Arrow (Current) $32.57 (1.1%) 8.5x 8.4x 7.9x 7.8x 20.1x 20.2x 17.8x 17.8x Arrow (Offer) 32.75 2.3% 8.3x 8.5x 7.7x 7.8x 19.5x 20.3x 17.3x 17.9x Arrow (Pre-Offer) 28.11 – 7.5x 7.5x 6.9x 6.9x 17.1x 17.1x 15.2x 15.2x Food and Support Services Autogrill $14.58 (1.7%) 7.9x 7.7x 7.4x 7.2x 20.3x 20.0x 18.1x 17.7x Centerplate (2) 13.50 1.5% 8.7x 8.9x 8.3x 8.8x NM NM NM NM Compass 4.53 (2.7%) 9.1x 8.8x 8.6x 8.3x 22.7x 21.9x 16.9x 16.3x Elior (3) 13.74 – 7.9x 7.9x 7.4x 7.4x 15.1x 15.1x 13.5x 13.5x Sodexho 48.01 5.1% 9.2x 9.3x 8.2x 8.6x 19.4x 20.2x 16.9x 17.4x Mean 0.5% 8.5x 8.5x 8.0x 8.1x 19.4x 19.3x 16.3x 16.2x Median (0.1%) 8.7x 8.8x 8.2x 8.3x 19.8x 20.1x 16.9x 16.8x Uniform and Career Apparel United States Cintas $36.68 (7.6%) 9.7x 9.3x 8.9x 8.5x 19.7x 18.2x 17.3x 16.4x G&K Services 32.70 (6.5%) 8.0x 7.6x 7.3x 6.9x 17.4x 16.2x 15.3x 14.3x Unifirst 31.95 1.1% 6.8x 6.8x 6.2x 6.2x 16.0x 15.7x 13.7x 13.0x International Davis Service Group $8.37 0.8% 4.6x 4.6x 4.5x 4.5x 13.3x 13.3x 12.5x 12.5x Rentokil 2.80 0.7% 7.4x 7.7x 7.0x 7.4x 14.2x 14.9x 13.0x 13.4x Mean (2.3%) 7.3x 7.2x 6.8x 6.7x 16.1x 15.7x 14.4x 13.9x Median 0.7% 7.4x 7.6x 7.0x 6.9x 16.0x 15.7x 13.7x 13.4x Overall Mean (1.0%) 7.9x 7.9x 7.4x 7.4x 17.6x 17.3x 15.2x 14.9x Overall Median 0.7% 7.9x 7.8x 7.4x 7.4x 17.4x 16.2x 15.3x 14.3x Note: Last Meeting reflects share prices and valuation as of June 23, 2006; Today reflects share prices and valuation as of July 14, 2006. (1) EPS estimates based on Investext equity research. (2) Centerplate trades as an Income Deposit Security. (3) As of January 11, 2006, the day before Robert Zolade announced that he was reviewing the possibility of opening his share capital to new investors. A cash tender was launched on March 27, 2006. $39.71 $14.83 4.66 13.30 2.78 $8.30 45.70 13.74 34.98 31.60 28.11 32.00 $32.92 |
 37 CONFIDENTIAL | PRELIMINARY ANALYSIS D R A F T Preliminary Selected Companies Analysis (cont’d) ($ in millions, except per share values) EV / EBITDA P/E (1) Share Price as of 2006E 2007E 2006E 2007E Company Pre-bid Today % Change Pre-bid Today Pre-bid Today Pre-bid Today Pre-bid Today Arrow (Current) $32.57 15.9% 7.5x 8.4x 7.0x 7.8x 17.1x 20.2x 15.2x 17.8x Arrow (Offer) 32.75 2.3% 8.3x 8.5x 7.7x 7.8x 19.5x 20.3x 17.3x 17.9x Arrow (Pre-Offer) 28.11 – 7.5x 7.5x 6.9x 6.9x 17.1x 17.1x 15.2x 15.2x Food and Support Services Autogrill $14.58 (10.3%) 8.4x 7.7x 7.9x 7.2x 22.1x 20.0x 19.7x 17.7x Centerplate (2) 13.50 3.4% 8.6x 8.9x 8.2x 8.8x NM NM NM NM Compass 4.53 5.4% 8.5x 8.8x 8.1x 8.3x 21.0x 21.9x 15.6x 16.3x Elior (3) 13.74 – 7.9x 7.9x 7.4x 7.4x 15.1x 15.1x 13.5x 13.5x Sodexho 48.01 (0.1%) 9.5x 9.3x 8.5x 8.6x 20.3x 20.2x 17.6x 17.4x Mean (0.4%) 8.6x 8.5x 8.0x 8.1x 19.6x 19.3x 16.6x 16.2x Median 1.6% 8.5x 8.8x 8.1x 8.3x 20.6x 20.1x 16.6x 16.8x Uniform and Career Apparel United States Cintas $36.68 (12.6%) 10.3x 9.3x 9.3x 8.5x 20.8x 18.2x 18.3x 16.4x G&K Services 32.70 (20.2%) 9.1x 7.6x 8.3x 6.9x 20.3x 16.2x 17.9x 14.3x Unifirst 31.95 3.0% 6.7x 6.8x 6.1x 6.2x 15.7x 15.7x 13.5x 13.0x International Davis Service Group $8.37 (1.8%) 4.7x 4.6x 4.6x 4.5x 13.6x 13.3x 12.8x 12.5x Rentokil 2.80 (3.7%) 7.5x 7.7x 7.2x 7.4x 14.9x 14.9x 13.6x 13.4x Mean (7.1%) 7.6x 7.2x 7.1x 6.7x 17.1x 15.7x 15.2x 13.9x Median (3.7%) 7.5x 7.6x 7.2x 6.9x 15.7x 15.7x 13.6x 13.4x Overall Mean (4.1%) 8.1x 7.9x 7.6x 7.4x 18.2x 17.3x 15.8x 14.9x Overall Median (1.8%) 8.5x 7.8x 8.0x 7.4x 20.3x 16.2x 15.6x 14.3x Note: Pre-bid reflects share prices and valuation as of April 28, 2006; Today reflects share prices and valuation as of July 14, 2006. (1) EPS estimates based on Investext equity research. (2) Centerplate trades as an Income Deposit Security. (3) As of January 11, 2006, the day before Robert Zolade announced that he was reviewing the possibility of opening his share capital to new investors. A cash tender was launched on March 27, 2006. 2.90 $41.98 40.97 31.02 $8.52 13.06 4.30 13.74 48.05 $28.11 32.00 28.11 $16.26 |
 38 CONFIDENTIAL | PRELIMINARY ANALYSIS D R A F T Preliminary Enterprise Value Adjustments The enterprise value adjustments table below serves as the bridge between Arrow’s enterprise value and implied equity value ($ in millions) Adjustment Value Description (+) Excess Cash $0 All cash on balance sheet required for working capital per Company (+) Cash Proceeds From Option Exercise 95 – 280 Proceeds received upon option exercise (dependant on stock price) (–) SURP Liability (108) – (70) Liability from RSU's held in plan (–) Est. Funded Debt (1) (1,842) Debt held on the balance sheet (–) A/R Securitization Facility (205) Average balance of facility throughout year (–) Minority Interest (13) Minority interest of consolidated JV's Total Enterprise Value Adjustments ($2,072) – ($1,850) Source: Management estimates and public filings. (1) Estimated as of September 30, 2006. |
 39 CONFIDENTIAL | PRELIMINARY ANALYSIS D R A F T CS does not provide any tax advice. Any tax statement herein regarding any US federal tax is not intended or written to be used, and cannot be used, by any taxpayer for the purpose of avoiding any penalties. Any such statement herein was written to support the marketing or promotion of the transaction(s) or matter(s) to which the statement relates. Each taxpayer should seek advice based on the taxpayer's particular circumstances from an independent tax advisor. These materials have been provided to you by Credit Suisse ("CS") in connection with an actual or potential mandate or engagement and may not be used or relied upon for any purpose other than as specifically contemplated by a written agreement with CS. In addition, these materials may not be disclosed, in whole or in part, or summarized or otherwise referred to except as agreed in writing by CS. The information used in preparing these materials was obtained from or through you or your representatives or from public sources. CS assumes no responsibility for independent verification of such information and has relied on such information being complete and accurate in all material respects. To the extent such information includes estimates and forecasts of future financial performance (including estimates of potential cost savings and synergies) prepared by or reviewed or discussed with the managements of your company and/or other potential transaction participants or obtained from public sources, we have assumed that such estimates and forecasts have been reasonably prepared on bases reflecting the best currently available estimates and judgments of such managements (or, with respect to estimates and forecasts obtained from public sources, represent reasonable estimates). These materials were designed for use by specific persons familiar with the business and the affairs of your company and CS assumes no obligation to update or otherwise revise these materials. Nothing contained herein should be construed as tax, accounting or legal advice. You (and each of your employees, representatives or other agents) may disclose to any and all persons, without limitation of any kind, the tax treatment and tax structure of the transactions contemplated by these materials and all materials of any kind (including opinions or other tax analyses) that are provided to you relating to such tax treatment and structure. For this purpose, the tax treatment of a transaction is the purported or claimed U.S. federal income tax treatment of the transaction and the tax structure of a transaction is any fact that may be relevant to understanding the purported or claimed U.S. federal income tax treatment of the transaction. CS has adopted policies and guidelines designed to preserve the independence of its research analysts. CS’s policies prohibit employees from directly or indirectly offering a favorable research rating or specific price target, or offering to change a research rating or price target, as consideration for or an inducement to obtain business or other compensation. CS’s policies prohibit research analysts from being compensated for their involvement in investment banking transactions. |