 Project Arrow CONFIDENTIAL THESE MATERIALS MAY NOT BE USED OR RELIED UPON FOR ANY PURPOSE OTHER THAN AS SPECIFICALLY CONTEMPLATED BY A WRITTEN AGREEMENT WITH CREDIT SUISSE. Presentation to the Special Committee August 7, 2006 |
 1 CONFIDENTIAL Table of Contents 1. Overview of the Consortium’s Proposal 2. Arrow Overview 3. Financial Overview A. Overview of Financial Projections B. Financial Analysis Appendices A. Management Case Financial Projections B. Enterprise Value Adjustments C. Segment DCF Detail and DCF Sensitivities D. Precedent Transaction Premiums E. Historical Trading Multiples F. Illustrative LBO Assumptions |
 2 CONFIDENTIAL 1. Overview of the Consortium’s Proposal |
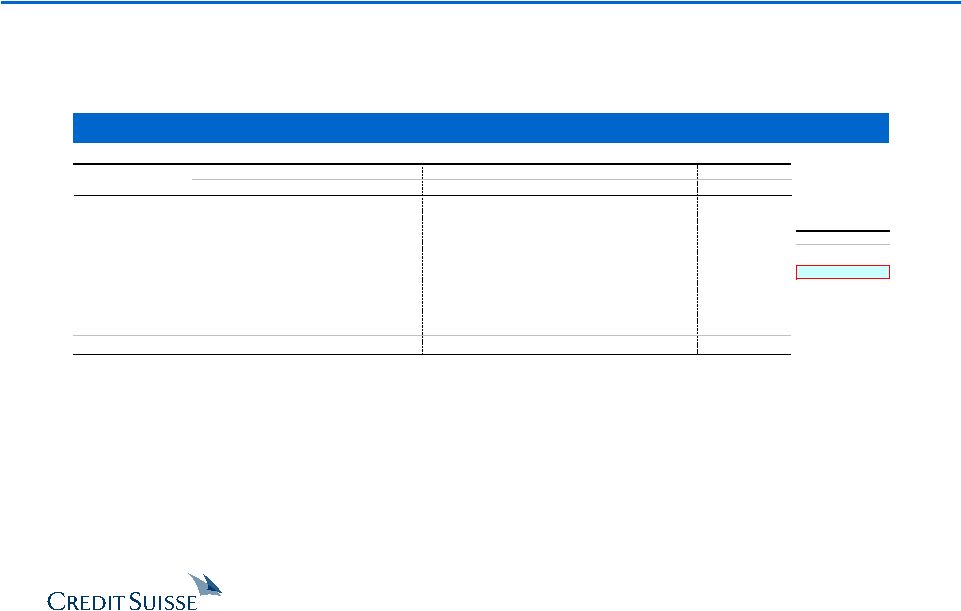
 3 CONFIDENTIAL Overview of Consortium’s Current Proposal (1) Based on treasury method. (2) Adjustments based on management guidance. Debt and A/R facility balance as of June 30, 2006. Note: LTM EBITDA and EBIT as of June 30, 2006. Financials include $22mm, $22mm and $17mm of option and RSU expenses in LTM 6/30/06, 2006E and 2007E, respectively. Excluding these expenses, multiples are 9.0x, 8.9x and 8.4x for LTM, 2006E and 2007E EBITDA, 13.9x, 13.8x and 13.0x for LTM, 2006E and 2007E EBIT, and 20.8x and 19.0x for 2006E and 2007E EPS, respectively. (3) Management estimates provided to CS on May 25, as adjusted on July 6 and August 2, 2006, based on management guidance. (4) I/B/E/S consensus data as of August 7, 2006. ($ in millions, except per share prices) Proposed Share Price $33.80 Diluted Shares Outstanding (1) 184.5 Equity Value $6,236 Adjustments (2) Funded Debt 1,982 A/R Facility 225 Minority Interest 13 SURP Liability 81 Enterprise Value $8,537 % Premium to Pre-Announcement: Share Price as of 4/28/06 ($28.11) 20.2% 30–Trading Days Prior ($29.05) 16.4% 10–Trading Day Average ($27.88) 21.2% 30–Trading Day Average ($28.67) 17.9% 60–Trading Day Average ($28.42) 18.9% LTM High – 3/27/06 – ($29.93) 12.9% LTM Low – 4/29/05 – ($24.51) 37.9% Implied Multiples – Management Case (3) Implied Enterprise Value / Metric Multiple LTM EBITDA $928 9.2x 2006E EBITDA 937 9.1x 2007E EBITDA 1,005 8.5x LTM EBIT $594 14.4x 2006E EBIT 598 14.3x 2007E EBIT 640 13.3x Price / 2006E EPS $1.55 21.8x 2007E EPS 1.73 19.6x Implied Multiples – I/B/E/S Consensus (4) Implied Enterprise Value / Metric Multiple 2006E EBITDA $951 9.0x 2007E EBITDA 1,029 8.3x 2006E EBIT $596 14.3x 2007E EBIT 671 12.7x Price / 2006E EPS $1.61 21.0x 2007E EPS 1.83 18.5x |
 4 CONFIDENTIAL 2. Arrow Overview |
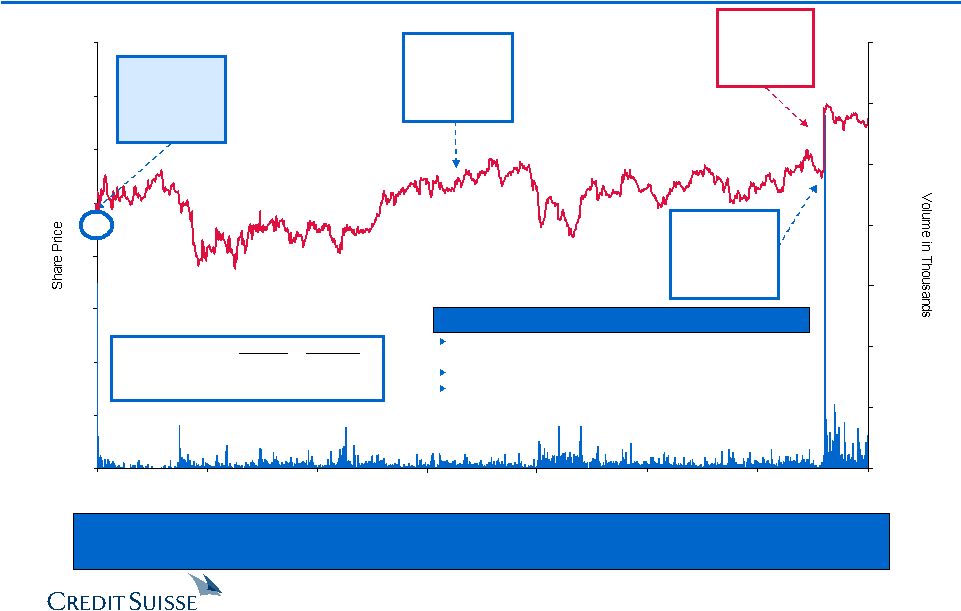 5 CONFIDENTIAL Dec - 01 Aug - 02 Apr - 03 Dec - 03 Aug - 04 Apr - 05 Dec - 05 Aug - 06 $0 $5 $10 $15 $20 $25 $30 $35 $40 0 5,000 10,000 15,000 20,000 25,000 30,000 35,000 Arrow Stock Performance – IPO to Today Despite its consistent EPS growth, Arrow’s stock price has remained relatively flat in absolute terms and has experienced P/E multiple contraction. Source: FactSet. Note: Data reflects daily closing price and shares traded. 24.2% of public float traded on day of announcement. (1) Excludes day of announcement. Date: 4/28/06 Price: $28.11 % CAGR: 4.7% NTM EPS: $1.68 % CAGR: 11.1% NTM P/E: 16.7x Date: 12/11/01 Price: $23.00 % CAGR: NA NTM EPS: $1.06 % CAGR: NA NTM P/E: 21.7x 5/1/06 Consortium Announces Proposal: $32.00 Date: 2/18/04 Price: $26.98 % CAGR: 7.6% NTM EPS: $1.42 % CAGR: 14.3% NTM P/E: 19.0x Pre-Ann’t Post-Ann’t High: $29.93 $34.24 Low: $18.75 $31.80 Pre-Announcement: $28.11 - $23 Stock price has remained relatively flat since IPO, despite solid earnings growth Multiple contraction has occurred since IPO The stock has traded heavily since the Consortium’s announcement (average daily volume of approximately 530,000 shares since IPO vs. 1.7 million since announcement (1) ) Observations |
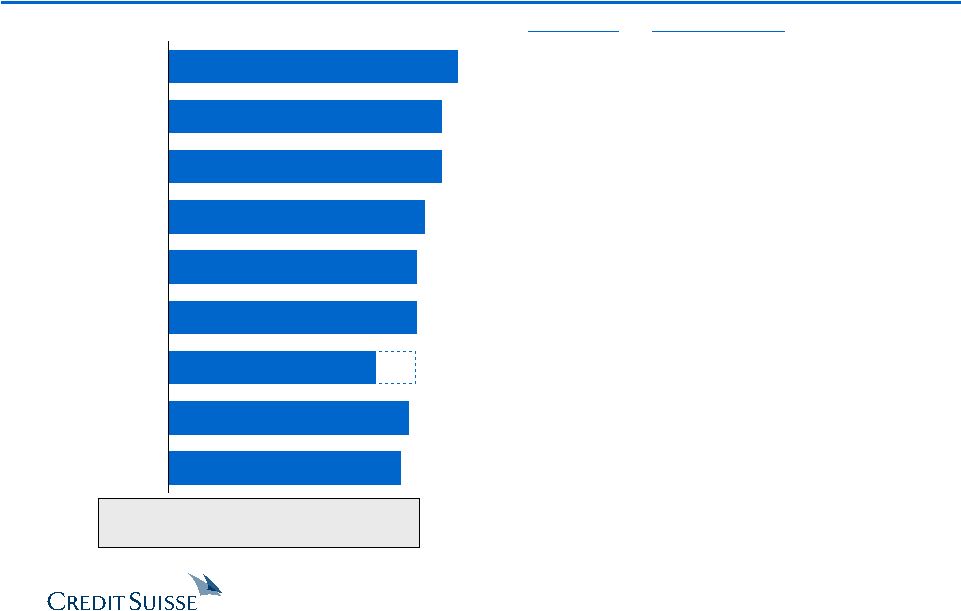 6 CONFIDENTIAL Wall Street Research Analyst Price Target Summary: Pre-Announcement 20.3x CY06 EPS (slight premium to CTAS) 7.0x CY06E EBITDA; 14.8x CY06E EPS (current valuation) 16.5x Forward EPS (flat valuation levels) DCF & EVA Models (equates to 15x CY07E EPS) 15–18x CY06E EPS (historical levels) 17.5x NTM EPS (historical levels) Valuation Method Mean $30.72 Median $30.00 Source: Investext equity research and FactSet Research Systems. Note: As of 4/28/06. Mean and median calculations derived using mid-point of Wachovia’s valuation range ($27.50). Excludes William Blair, Thomas Weisel, JP Morgan, Oddo Securities and Oscar Gruss research reports due to lack of price target or availability. (1) Represents valuation range. Specific price target not disclosed. 7.5x CY07E EBITDA; 16.5x CY07E EPS (peers) 17.0x CY06E EPS (historical levels) Sum-of-the-Parts Report Date 02/08/06 04/13/06 02/09/06 04/28/06 02/08/06 02/09/06 02/08/06 02/08/06 02/09/06 $30 (1) $28 $29 $30 $30 $31 $33 $33 $35 $25 Credit Suisse Goldman Sachs Wachovia Lehman Brothers CIBC Morgan Stanley Robert W. Baird Citigroup Deutsche Bank |
 7 CONFIDENTIAL Wall Street’s View on Arrow’s Financial Outlook “Regarding fundamentals, operating performance has been mixed in recent quarters, but we see scope for better growth and margins going forward. Given a few quarters, we expect the healthy top line growth to translate into modest operating leverage…Longer term, we see room for this business to become less commoditized, and assuming that the company’s efforts continue to gain traction, this should have positive implications for growth and margins in the longer term.” Morgan Stanley – July 12, 2006 “…Given today’s pre-announcement, we have less visibility on an improvement in the company’s operating fundamentals. In our opinion, Arrow continues to face relatively easy margin comparisons over the next few quarters due to a poor performance at its international operations and the hurricanes, which hurt its F2H’05 results. However, given the apparent larger-than-expected profitability problems in Uniform Direct Marketing operations, we no longer expect Arrow to return to posting year-over-year operating margin expansion (on an apples-to-apples ex-options expense basis) in FY ‘06… ” Lehman Brothers – July 12, 2006 “We think Arrow is well-positioned to capitalize on the worldwide outsourcing trend, given the company’s strong position in the outsourced market for food service, and uniform and career apparel.” Wachovia Securities – July 12, 2006 “…Arrow is pursuing areas perceived to have higher growth, which are not as far along on the outsourcing spectrum but obviously in need of Arrow’s services, such as correction institutions. There remains considerable scope for further international expansion as well. Finally, we believe the company has the opportunity to improve margins over time, in part from the continued reversal of deterioration in certain problem areas that plagued 2004 margins, and in part due to potential upside within its uniform division, which has profitability levels well below its primary competitor, Cintas.” Citigroup – July 12, 2006 |
 8 CONFIDENTIAL Arrow Historical Financial Performance Source: Management. Management estimates provided to CS on May 25, as adjusted on July 6 and August 2, 2006, based on management guidance. (1) Non-cash FAS 123 and RSU expenses are included in corporate overhead. YTD 2006 and 2006E include add-back of $42.9mm and $45.9mm, respectively, for asset writedown related to AUCA Direct Marketing. ($ in millions) Historical YTD Projected FYE 9/30, 2001 2002 2003 2004 2005 6/30/06 2006E Total Revenue $7,359 $8,264 $9,448 $10,192 $10,963 $8,689 $11,581 % Growth 7.7% 12.3% 14.3% 7.9% 7.6% – 5.6% % Organic Growth 5.1% 1.7% 2.6% 5.7% 4.0% – 5.6% Avg. Margin Total EBITDA (1) $630 $710 $809 $833 $900 $668 $937 '01A–'05A % Margin 8.6% 8.6% 8.6% 8.2% 8.2% 7.7% 8.1% 8.4% Total Capex $204 $223 $303 $330 $295 $226 $316 % of Revenue 2.8% 2.7% 3.2% 3.2% 2.7% 2.6% 2.7% Acquisition Capex $73 $898 $272 $161 $90 $121 $20 Total Capex w/ Acquisitions $277 $1,121 $575 $490 $385 $347 $336 |
 9 CONFIDENTIAL $431 $623 $600 $575 $553 $417 $598 $580 $538 $552 Budget Actual 2003 2004 2005 2006E 2006YTD (1)(3) (2)(4) Historical Performance vs. Budget Sales EBIT $8,675 $11,664 $11,030 $10,059 $9,466 $8,689 $11,581 $10,963 $10,192 $9,448 Budget Actual 2003 2004 2005 2006E 2006YTD (1) (2) Note: Budget reflects Arrow’s Board plan submitted to Board in fiscal Q2 each year. (1) Original plan as of late summer 2005. Current forecast reflects Management Case and was provided to CS on May 25, as adjusted on July 6 and August 2, 2006, based on management guidance. (2) YTD through June 2006. (3) EBIT excludes $45.9mm asset impairment charge. (4) EBIT excludes $42.9mm asset impairment charge. ($ in millions) ($ in millions) Original Forecast Current Forecast Original Forecast Current Forecast Percent Difference (Actual / Budget) (0.2%) 1.3% (0.6%) (0.7%) 0.2% Percent Difference (Actual / Budget) (0.2%) (6.9%) (3.4%) (4.2%) (3.4%) |
 10 CONFIDENTIAL 3. Financial Overview |
 11 CONFIDENTIAL A. Overview of Financial Projections |
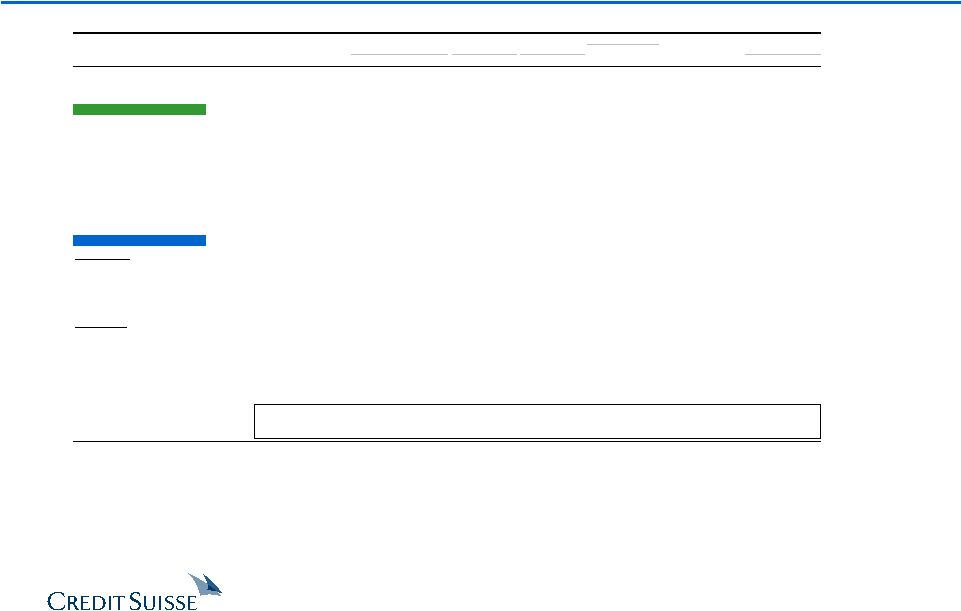
 12 CONFIDENTIAL The financial results detailed below provide a summary of the financial projections provided to CS by Arrow management updated based on supplemental information and guidance provided to CS by the Company (the “Management Case”). Management submitted its 6-year projections to CS on May 25 On July 6, Arrow management notified CS of several issues that resulted in a downward revision to the 2006 financial projections, and verbally communicated downward adjustments to its 2007 projections Certain contract performance issues impacted 2006 results Ongoing operational challenges in AUCA Direct Marketing are expected to impact 2006 and 2007 On August 2, Arrow management provided revised 2006 and 2007 guidance to reflect a decline in several business units Overview of Management Case Projections (1) Includes adjustment for AUCA Direct Marketing and new monthly financial data gathered by management since May 25, 2006. August 2 adjustment excludes AUCA Direct Marketing asset impairment of $45.9mm. (2) Adjustment based on management’s current estimate of an anticipated $20 – $30mm shortfall in EBIT vs. May 25 projection relating primarily to performance in Arrow’s uniform business, certain segments of its FSS business and the performance of a recent acquisition. For purposes of this analysis, CS has assumed the midpoint. ($ in millions) Projected EBITDA – Management Case 5/25 – 8/2 Variance May 25 July 6 August 2 $ % 2006 (1) 954 940 937 (17) (1.8%) 2007 (2) 1,030 1,022 1,005 (25) (2.5%) |
 13 CONFIDENTIAL Management Case Financial Summary Management Case Source: Management. Management estimates provided to CS on May 25, as adjusted on July 6 and August 2, 2006, based on management guidance. (1) Non-cash FAS 123 and RSU expenses are included in corporate overhead. 2006E includes add-back of $45.9mm for asset writedown related to AUCA Direct Marketing. (2) Net amount and includes Seamless Web earnout. ($ in millions) Historical Projected CAGR FYE 9/30, 2001 2002 2003 2004 2005 2006E 2007E 2008E 2009E 2010E 2011E '01A–'05A '05A–'11E Total Revenue $7,359 $8,264 $9,448 $10,192 $10,963 $11,581 $12,222 $12,904 $13,624 $14,378 $15,162 10.5% 5.6% % Growth 7.7% 12.3% 14.3% 7.9% 7.6% 5.6% 5.5% 5.6% 5.6% 5.5% 5.5% % Organic Growth 5.1% 1.7% 2.6% 5.7% 4.0% 5.6% 5.5% 5.6% 5.6% 5.5% 5.5% 3.5% 5.6% Avg. Margins Total EBITDA (1) $630 $710 $809 $833 $900 $937 $1,005 $1,103 $1,171 $1,248 $1,320 9.4% 6.6% '01A–'05A '05A–'11E % Margin 8.6% 8.6% 8.6% 8.2% 8.2% 8.1% 8.2% 8.5% 8.6% 8.7% 8.7% 8.4% 8.4% Total Capex (2) $204 $223 $303 $330 $295 $316 $341 $351 $436 $409 $416 9.6% 5.9% % of Revenue 2.8% 2.7% 3.2% 3.2% 2.7% 2.7% 2.8% 2.7% 3.2% 2.8% 2.7% Acquisition Capex $73 $898 $272 $161 $90 $20 $20 $20 $20 $20 $20 Total Capex w/ Acquisitions $277 $1,121 $575 $490 $385 $336 $361 $371 $456 $429 $436 8.5% 2.1% |
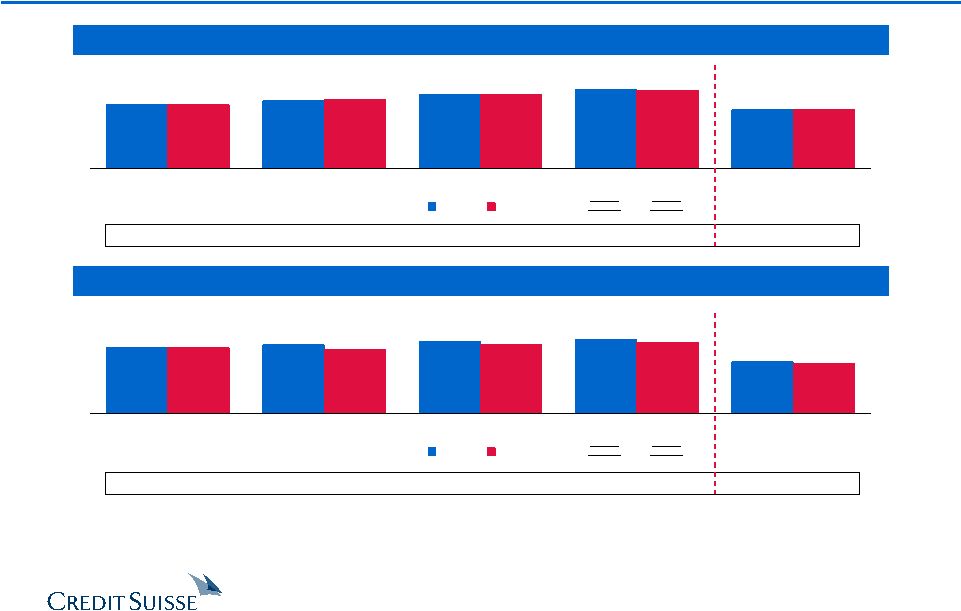
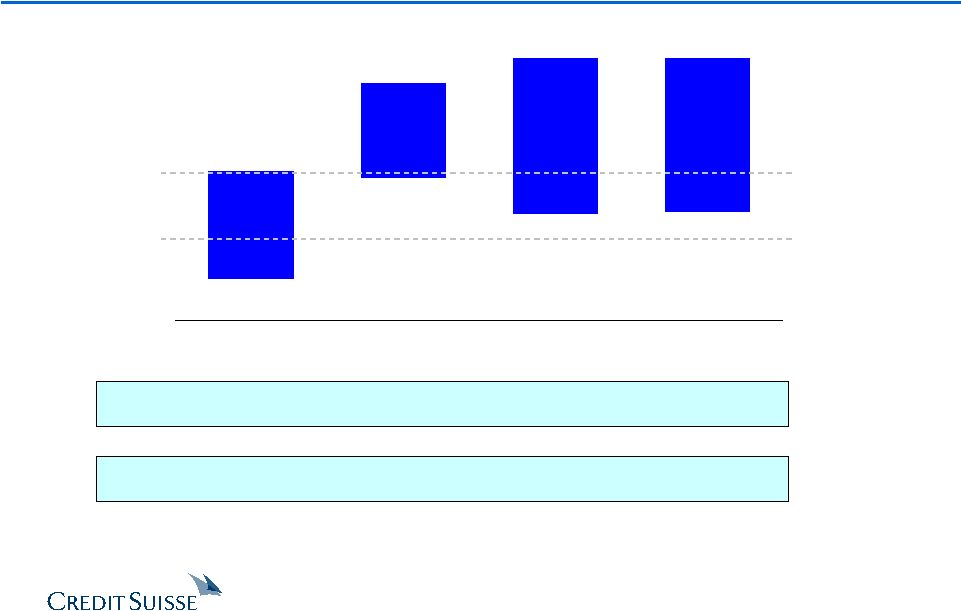
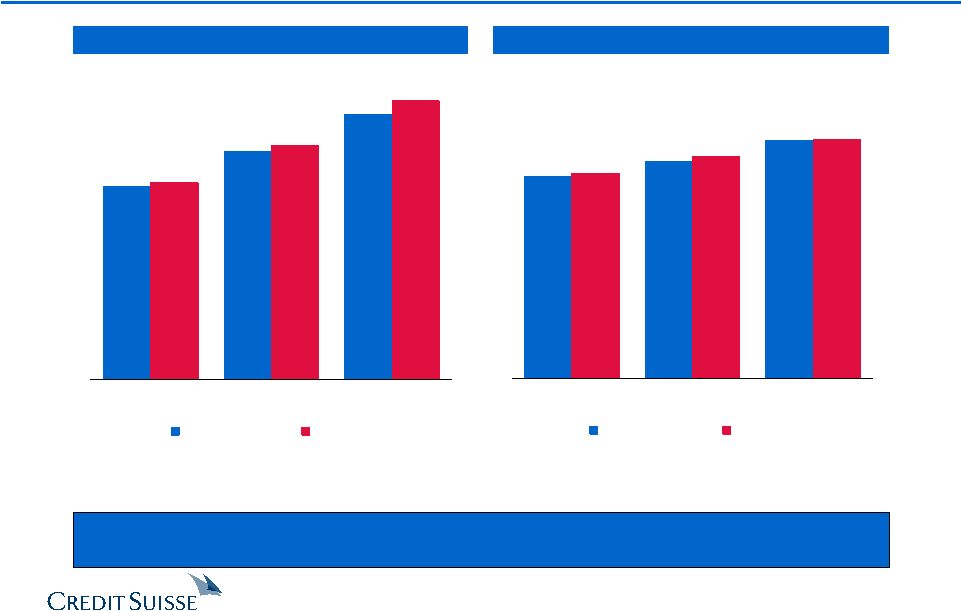 14 CONFIDENTIAL Management Case vs. Wall Street Arrow’s internal forecasted top-line growth and EBITDA are lower than Wall Street estimates. $12,904 $12,222 $11,581 $13,162 $12,337 $11,645 Management Case Wall Street 2006E 2007E 2008E (1) (2) $937 $1,005 $1,103 $951 $1,029 $1,106 Management Case Wall Street 2006E 2007E 2008E (2) (1) (1) Management Case was provided to CS on May 25, as adjusted on July 6 and August 2, 2006, based on management guidance. (2) Based on I/B/E/S consensus estimates as of August 7, 2006. ($ in millions) ($ in millions) Sales EBITDA Percent Difference (Management Case / Wall Street) (1.5%) (2.4%) (0.3%) Percent Difference (Management Case / Wall Street) (0.5%) (0.9%) (2.0%) |
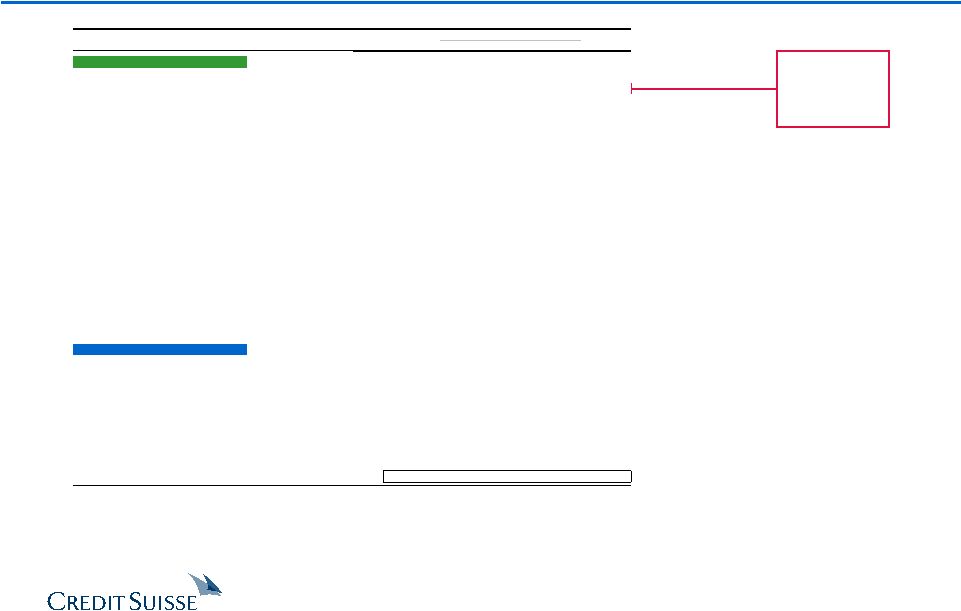
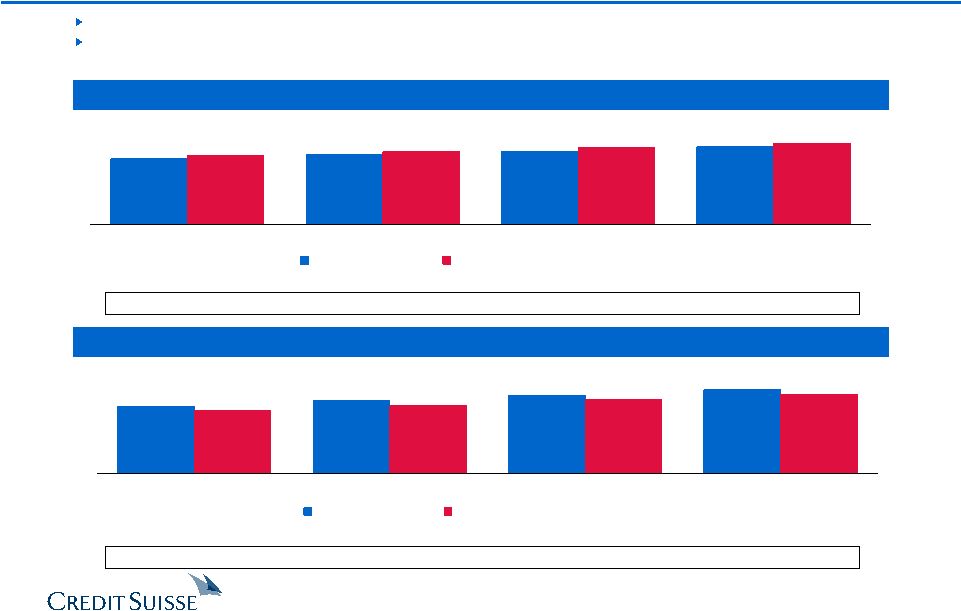 15 CONFIDENTIAL $1,240 $1,160 $1,080 $990 $1,171 $1,103 $1,005 $937 2006E 2007E 2008E 2009E Management Case vs. December 2005 Forecast Sales EBITDA $13,100 $12,300 $11,700 $11,000 $13,624 $12,904 $12,222 $11,581 2006E 2007E 2008E 2009E (1) December 2005 forecast as presented to Board of Directors on December 6, 2005. (2) Management Case was provided to CS on May 25, as adjusted on July 6 and August 2, 2006, based on management guidance. ($ in millions) ($ in millions) December 2005 Management Case (1) (2) December 2005 Management Case (1) (2) December 2005 Forecast – reflects top-down forecast prepared by senior management Management Case – based on review by management with operating segment heads in Q2/Q3 2006 (provided by management to Consortium) Percent Difference (Management Case / Dec. 2005) (5.3%) (7.0%) (4.9%) (5.6%) Percent Difference (Management Case / Dec. 2005) 5.3% 4.5% 4.9% 4.0% |
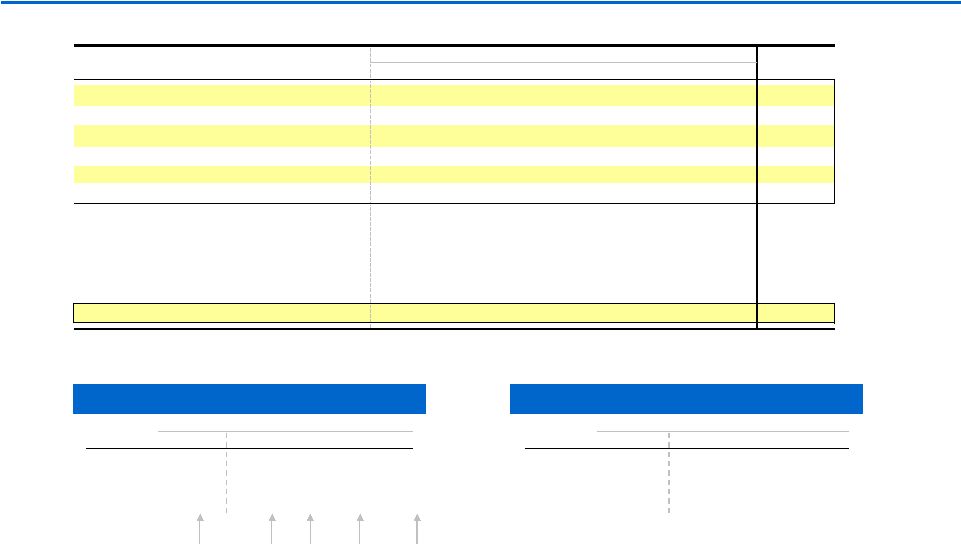
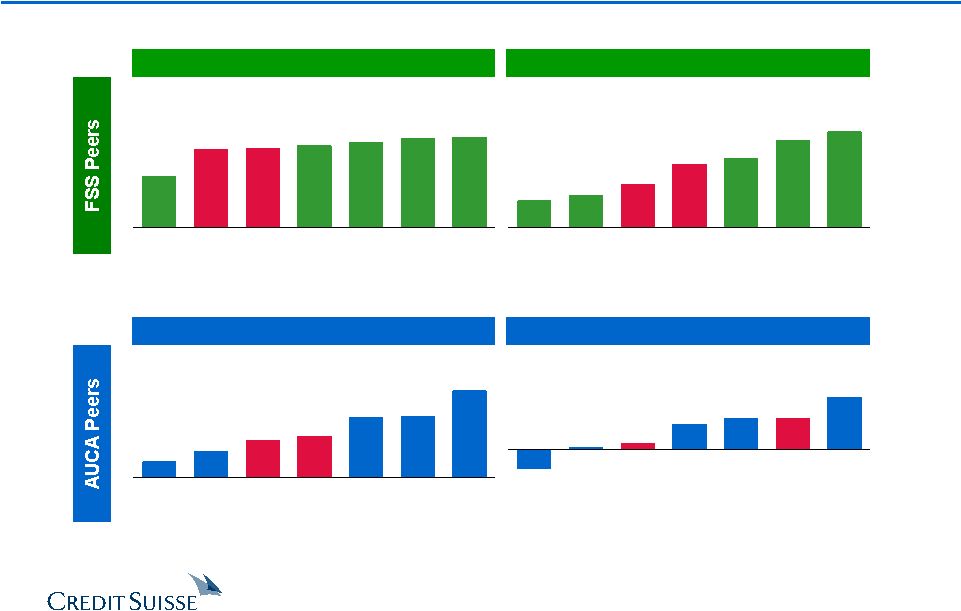 16 CONFIDENTIAL 9.4% 5.7% 5.7% 4.6% 1.2% 0.4% (3.4%) Rentokil Davis Arrow AUCA UniFirst Arrow Consolidated G&K Services Cintas 8.6% 6.2% 7.8% 5.7% 3.9% 2.9% 2.4% Centerplate Compass Arrow FSS Arrow Consolidated Elior Autogrill Sodexho Performance vs. Segment Peers – Arrow Revenue and EBITDA Growth 2005A–2007E Revenue CAGR 2005A–2007E EBITDA CAGR 2005A–2007E Revenue CAGR 2005A–2007E EBITDA CAGR 6.5% 6.4% 6.1% 5.9% 5.7% 5.6% 3.7% Centerplate Arrow Consolidated Arrow FSS Elior Sodexho Autogrill Compass Source: Company public filings and management projections provided to CS on May 25, as adjusted on July 6 and August 2, 2006, based on management guidance. Note: Growth and EBITDA margins based on 9/30 calendarized financials. Arrow segment EBITDA and EBITDA margins include corporate overhead allocated based on EBITDA contribution. Compass 2005 results PF for sale of SSP. 11.7% 8.2% 8.1% 5.6% 5.0% 3.5% 2.1% Davis Rentokil Arrow AUCA Arrow Consolidated UniFirst G&K Services Cintas Note: Percentages inside bars reflect average margins from 2005A – 2007E. Note: Percentages inside bars reflect average margins from 2005A – 2007E. 6.9% 8.1% 7.5% 13.4% 6.2% 8.2% 32.8% 13.0% 14.9% 13.9% 20.5% 23.3% 8.2% 8.1% |
 17 CONFIDENTIAL B. Financial Analysis |
 18 CONFIDENTIAL Summary Financial Analysis Pre-Announcement Price $28.11 Implied Per Share Values Source: Management projections and public filings. Note: Corporate expense allocated based on EBITDA contribution. Implied multiples unadjusted for options and RSU expenses. (1) The Management Case – As Adjusted represents the Management Case excluding $20mm of acquisition spending. (1) Consortium Proposal $33.80 Implied EV / EBITDA Multiples LTM 6/30/06 7.4x – 9.1x 9.1x – 10.7x 8.3x – 11.0x 8.4x – 11.0x FY06E 7.3x – 9.0x 9.0x – 10.6x 8.3x – 10.9x 8.3x – 10.9x FY07E 6.8x – 8.4x 8.4x – 9.9x 7.7x – 10.1x 7.7x – 10.1x Implied EV / EBIT Multiples LTM 6/30/06 11.5x – 14.3x 14.2x – 16.7x 13.0x – 17.1x 13.1x – 17.1x FY06E 11.4x – 14.2x 14.1x – 16.6x 12.9x – 17.0x 13.0x – 17.0x FY07E 10.7x – 13.3x 13.2x – 15.5x 12.1x – 15.9x 12.1x – 15.9x $33.95 $41.00 $43.00 $43.05 $25.25 $33.35 $30.50 $30.65 Selected Companies Analysis Selected Acquisitions Analysis DCF – Management Case DCF – Management Case – As Adjusted |
 19 CONFIDENTIAL Preliminary Selected Companies Analysis ($ in millions, except per share values) Share 2007E (1) I/B/E/S LT Tot. Debt / Price as of Equity Enterprise EV / EBITDA EV / EBIT P/E Revenue EBITDA Growth LTM Dividend Company 8/7/06 Value Value LTM 2006E 2007E 2006E 2007E 2006E 2007E Growth Margin Rate (2) EBITDA Yield Ratio Arrow (Current) $33.05 $6,037 $8,089 8.7x 8.5x 7.9x 13.2x 11.7x 20.5x 18.1x 7.3% 8.2% 11.9% 2.3x 0.8% 16.7% Arrow (Pre-Offer) 28.11 5,066 7,118 7.6x 7.5x 6.9x 11.6x 10.3x 17.1x 15.2x 7.3% 8.2% 11.9% 2.3x 1.0% 16.7% Food and Support Services Autogrill $15.48 $3,939 $5,203 8.4x 8.0x 7.5x 12.6x 11.5x 20.8x 18.5x 4.8% 13.6% 10.0% 2.0x 2.0% 39.1% Centerplate (3) 14.30 322 503 9.5x 9.2x 9.1x 19.3x 18.8x NM NM 2.6% 8.1% 3.0% 4.0x 10.9% NA Compass 4.80 10,346 12,665 8.9x 8.9x 8.5x 13.1x 12.3x 22.3x 16.5x 4.6% 6.7% 7.0% 2.0x 3.9% 65.7% Elior (4) 13.74 1,815 2,348 8.3x 7.9x 7.4x 11.0x 10.2x 15.1x 13.5x 5.4% 8.3% NA 2.3x 1.3% 41.7% Sodexho 51.01 8,203 9,630 9.9x 9.7x 8.9x 13.2x 12.0x 21.1x 18.2x 5.2% 6.4% 5.0% 2.5x 1.9% 68.6% Mean 9.0x 8.7x 8.3x 13.8x 13.0x 19.8x 16.7x 4.5% 8.6% 6.3% 2.6x 4.0% 53.8% Median 8.9x 8.9x 8.5x 13.1x 12.0x 21.0x 17.4x 4.8% 8.1% 6.0% 2.3x 2.0% 53.7% Uniform and Career Apparel United States Cintas $35.26 $5,939 $6,496 9.2x 8.9x 8.2x 11.5x 10.5x 17.5x 15.7x 12.0% 20.0% 14.3% 1.1x 1.0% 18.0% G&K Services 32.92 702 910 7.7x 7.6x 7.0x 11.9x 10.3x 16.3x 14.4x 6.5% 13.8% 13.2% 1.9x 0.2% 3.6% Unifirst 30.89 595 793 7.0x 6.7x 6.1x 10.8x 9.5x 15.2x 12.6x 8.5% 14.6% 14.0% 1.8x 0.5% 7.1% International Davis Service Group $9.15 $1,562 $1,974 4.7x 4.8x 4.6x 11.5x 11.0x 13.9x 13.1x 2.8% 32.4% 7.0% 1.5x 3.6% 57.1% Rentokil 3.12 5,664 7,320 7.5x 8.1x 7.8x 13.2x 12.5x 16.0x 14.4x 7.5% 22.0% NA 2.3x 4.5% 41.4% Mean 7.2x 7.2x 6.7x 11.8x 10.8x 15.8x 14.0x 7.5% 20.6% 12.1% 1.7x 2.0% 25.4% Median 7.5x 7.6x 7.0x 11.5x 10.5x 16.0x 14.4x 7.5% 20.0% 13.6% 1.8x 1.0% 18.0% Overall Mean 8.1x 8.0x 7.5x 12.8x 11.9x 17.6x 15.2x 6.0% 14.6% 9.2% 2.2x 3.0% 38.0% Overall Median 8.3x 8.1x 7.7x 12.2x 11.2x 16.3x 14.4x 5.3% 13.7% 8.5% 2.0x 1.9% 41.4% Source: I/B/E/S, Investext equity research and Company filings. Note: Multiples based on financial estimates calendarized to Arrow's fiscal year end of 9/30. Research reports for foreign peers do not explicitly breakout amortization expense during the forecast period. As a result, EBIT and earnings metrics may not be directly comparable with U.S. peers. (1) (2) Based on I/B/E/S 5-year long-term growth rates. (3) Centerplate trades as an Income Deposit Security. (4) As of January 11, 2006, the day before Robert Zolade announced he was reviewing the possibility of opening his share capital to new investors; on June 27, 2006, a take-over bid from HBI and Charterhouse Capital was approved by the EU at €13.40 per share. 8.1% and 13.5%, respectively. 2007E FSS revenue growth and EBITDA margin before corporate expense allocation are 5.4% and 8.1%, respectively. 2007E AUCA revenue growth and EBITDA margin before corporate expense allocation are |
 20 CONFIDENTIAL Preliminary Selected Companies Analysis (cont’d) Source: Management estimates provided to CS on May 25, as adjusted on July 6 and August 2, 2006, based on management guidance, and public filings. Note: Financials include $22mm, $22mm and $17mm of option and RSU expenses in LTM 6/30/06, 2006E and 2007E, respectively. (1) Includes total unallocated corporate expenses multiplied by a segment weighted FY 2006E EBITDA multiple. (2) Adjustments include proceeds from options exercised, $1,982mm of reported debt as of 6/30/06, $225mm A/R facility and SURP liability which varies with share price. ($ in millions, except per share values) Arrow Multiple Range Implied Enterprise Value Performance Low – High Low – High Food and Support Services FY 2006E EBITDA $780 7.5x – 9.5x $5,848 – $7,408 FY 2007E EBITDA 831 7.0x – 9.0x 5,818 – 7,480 13.5x FY 2006E EBIT 519 11.0x – 13.5x 5,708 – 7,005 FY 2007E EBIT 549 10.0x – 12.5x 5,489 – 6,861 Segment Reference Range $5,700 – $7,200 Uniform and Career Apparel FY 2006E EBITDA $218 7.5x – 9.0x $1,633 – $1,960 FY 2007E EBITDA 232 7.0x – 8.5x 1,622 – 1,969 FY 2006E EBIT 140 11.0x – 12.0x 1,539 – 1,679 FY 2007E EBIT 154 10.0x – 11.0x 1,539 – 1,693 Segment Reference Range $1,600 – $1,850 Subtotal $7,300 – $9,050 Unallocated Corporate Expense (1) ($60) 7.5x – 9.4x (453) – (567) Implied Enterprise Value Range $6,847 – $8,483 (–) Enterprise Value Adjustments (2) (2,161) – (2,182) Implied Equity Value Reference Range $4,686 – $6,301 – Diluted Shares Outstanding 185.5 – 185.5 Implied Equity Value per Share Reference Range $25.26 – $33.96 Enterprise Value / LTM 6/30/06 EBITDA 7.4x – 9.1x FY 2006E EBITDA 7.3x – 9.1x FY 2007E EBITDA 6.8x – 8.4x |
 21 CONFIDENTIAL Preliminary Selected Acquisitions Analysis Implies a 2006E forward EBITDA multiple of 9.5x ($ in millions) ANNOUNCE ENTERPRISE ENTERPRISE VALUE / LTM EBITDA DATE ACQUIROR TARGET VALUE SALES EBITDA EBIT (1) MARGIN Food and Support Services Apr-06 EQT / Macquarie Bank Compass Group's SSP Unit $3,172 1.0x 10.9x 16.0x 9.3% Mar-06 Holding Bercy Investissement (2) Elior 2,909 0.8x 10.1x 14.2x 8.2% Jan-06 Compass Group Levy Restaurants 490 0.9x NA NA NA Jul-05 EQT and Goldman Sachs ISS A/S 4,774 0.7x 10.2x 13.0x 7.2% May-04 Charterhouse Capital Partners Autobar Ltd. 960 0.7x NA NA NA Oct-02 ARAMARK Fine Host 102 0.3x NA NA NA Mar-02 Compass Group Bon Appetit 156 0.6x NA NA NA Dec-01 Compass Group Seiyo Food Systems 535 0.9x NA NA NA Dec-01 ARAMARK ServiceMaster 791 0.4x 8.9x 11.4x 4.7% Aug-01 Compass Group Crothall Services Group 170 0.5x NA 9.7x NA Jun-01 Sodexho Alliance SA (3) Sodexho Marriott Services 2,984 0.6x 10.1x 14.3x 6.1% Apr-01 Sodexho Alliance SA Sogeres and Wood Dining Services 475 0.7x NA NA NA Mar-01 LSG Lufthansa AG Sky Chefs Inc. 2,406 1.3x NA 22.8x NA Jan-01 Sodexho Alliance SA (4) Sodexho Marriott Services 2,624 0.5x 8.9x 12.4x 6.2% Feb-01 Compass Group Selecta 790 1.6x 8.6x 15.1x 18.3% Feb-01 Compass Group Morrison Management Specialists 634 1.2x 17.5x 21.2x 7.1% Dec-00 Autogrill Passaggio Holding AG 149 1.0x 12.8x NA 7.8% Apr-00 Granada Compass 10,273 1.3x 17.8x 24.2x 7.1% Jul-99 Autogrill Host Marriott Services 948 0.7x 7.1x 13.8x 9.3% May-99 SAir Group Dobbs International Services 780 0.9x NA 10.9x NA May-97 Compass Daka 183 0.5x 10.2x NA 4.5% Feb-97 Investcorp Welcome Break 762 1.4x NA 14.8x NA Median 0.8x 10.2x 14.2x 7.2% Jul-03 Unifirst Textilease $178 1.9x 18.7x 27.4x 10.0% Apr-03 California Investment Fund National Services Industries 104 0.2x 7.3x NM 2.8% Jul-02 Paribas Affaires Industrielles Elis Group 1,516 1.9x NA NA NA Mar-02 Davis Service Group Sophus Berendsen 607 1.3x NA 14.1x NA Mar-02 Cintas Omni Services 657 2.0x 11.6x 18.4x 17.5% Mar-99 Cintas Unitog 449 1.6x 10.2x 17.8x 15.7% Apr-98 Cintas Uniforms To You 169 1.1x NA 9.9x NA Jun-97 G&K Services 29 NLS Facilities 287 1.4x NA NA NA Median 1.5x 10.9x 17.8x 12.9% Overall Median 0.9x 10.2x 14.3x 7.5% Source: Company filings, press releases, SDC, Capital IQ. Excludes non-recurring items. (1) Excludes goodwill amortization where applicable. (2) As of July 17, 2006, HBI held94.2% ofElior'soutstandingshares and 96.7%of Oceanes (convertible debt); the tenderofferhas beenapproved by theEU. (3) Represents final offer price of $32.00 per share. (4) Represents initial offer price of $27.00 per share. Uniform and Career Apparel (2) Holding Bercy Investissement (HBI) is controlled by Robert Zolade (Elior'sfounder and president), Charterhouse and Chequers Capital. |
 22 CONFIDENTIAL Preliminary Selected Acquisitions Analysis (cont’d) Source: Management estimates provided to CS on May 25, as adjusted on July 6 and August 2, 2006, based on management guidance, and public filings. Note: Corporate expense allocated based on EBITDA contribution. Financials exclude $22mm, $22mm and $17mm of option and RSU expenses in LTM 6/30/06, 2006E and 2007E, respectively. Multiples including these expenses are 9.1x to 10.7x, 9.0x to 10.6x and 8.4x to 9.9x for LTM, 2006E and 2007E EBITDA, and 14.2x to 16.7x, 14.1x to 16.6x and 13.2x to 15.5x for LTM, 2006E and 2007E EBIT. (1) Includes unallocated cash corporate expenses multiplied by a segment weighted FY 2006E EBITDA multiple. (2) Adjustments include proceeds from options exercised, $1,982mm of reported debt as of 6/30/06, $225mm A/R facility and SURP liability which varies with share price. ($ in millions, except per share values) Arrow Multiple Range Implied Enterprise Value Performance Low – High Low – High Food and Support Services LTM 6/30/06 EBITDA $768 9.0x – 10.5x $6,913 – $8,065 LTM 6/30/06 EBIT 513 13.0x – 15.0x 6,665 – 7,690 Segment Reference Range $6,800 – $7,900 Uniform and Career Apparel LTM 6/30/06 EBITDA $214 9.0x – 11.5x $1,930 – $2,466 LTM 6/30/06 EBIT 136 15.0x – 18.0x 2,038 – 2,445 Segment Reference Range $2,000 – $2,450 Subtotal $8,800 – $10,350 Unallocated Corporate Expense (1) ($38) 9.0x – 10.7x ($346) – ($412) Implied Enterprise Value Range $8,454 – $9,938 (–) Enterprise Value Adjustments (2) (2,043) – (2,061) Implied Equity Value Reference Range $6,412 – $7,877 – Fully Diluted Shares Outstanding 192.1 – 192.1 Implied Equity Value per Share Reference Range $33.37 – $41.00 Enterprise Value / LTM 6/30/06 EBITDA 8.9x – 10.5x FY 2006E EBITDA 8.8x – 10.4x FY 2007E EBITDA 8.3x – 9.7x LTM 6/30/06 EBIT 13.7x – 16.1x FY 2006E EBIT 13.6x – 16.0x FY 2007E EBIT 12.9x – 15.1x |
 23 CONFIDENTIAL Implied Share Price Source: Management estimates provided to CS on May 25, as adjusted on July 6 and August 2, 2006, based on management guidance. Projections are discounted to September 2006 and assume debt of $1,838mm estimated at that time. Note: Consolidated financials include corporate overhead. (1) Includes Seamless Web earnout. (2) Includes other corporate adjustments. Consolidated DCF Analysis – Management Case Arrow est. 5 yr. Low Oct. 2004 6.9x Arrow April 28 7.6x Arrow est. 5 yr. Average 8.2x Compass LTM 8.9x Sodexho LTM 9.9x Implied Perpetuity Growth Rate (3) (3) Reflects nominal growth. Discount Terminal LTM EBITDA Multiple Rate 6.9x 7.5x 8.5x 9.5x 8.5% 2.3% 2.8% 3.4% 3.9% 9.5% 3.3% 3.7% 4.4% 4.9% 10.5% 4.2% 4.7% 5.3% 5.9% Discount Terminal LTM EBITDA Multiple Rate 6.9x 7.5x 8.5x 9.5x 8.5% $31.26 $33.97 $38.48 $42.99 9.5% $29.61 $32.20 $36.51 $40.81 10.5% $28.05 $30.52 $34.64 $38.75 ($ in millions) Projected '06E-'11E FYE 9/30, 2006E 2007E 2008E 2009E 2010E 2011E CAGR Sales $11,581.5 $12,222.1 $12,904.1 $13,624.5 $14,377.5 $15,162.1 5.5% % growth 5.6% 5.5% 5.6% 5.6% 5.5% 5.5% EBITDA $937.1 $1,004.7 $1,102.6 $1,170.9 $1,248.4 $1,319.8 7.1% % margin 8.1% 8.2% 8.5% 8.6% 8.7% 8.7% Unlevered Net Income $374.0 $399.8 $451.3 $487.7 $523.1 $562.4 8.5% % margin 3.2% 3.3% 3.5% 3.6% 3.6% 3.7% Depreciation & Amortization $338.7 $365.0 $380.6 $390.6 $411.4 $419.9 % of sales 2.9% 3.0% 2.9% 2.9% 2.9% 2.8% Capital Expenditures (1) ($336.3) ($360.5) ($371.4) ($455.8) ($428.7) ($436.3) % of sales (2.9%) (2.9%) (2.9%) (2.9%) (2.9%) (2.9%) (Incr.)/Decr. in Working Capital ($23.2) ($13.0) ($13.8) ($13.6) ($13.9) ($14.3) % of sales (0.2%) (0.1%) (0.1%) (0.1%) (0.1%) (0.1%) Unlevered FCF (2) $340.6 $403.1 $460.7 $424.3 $508.8 $550.0 10.1% |
 24 CONFIDENTIAL Implied Share Price Source: Management estimates provided to CS on May 25, as adjusted on July 6 and August 2, 2006, based on management guidance. Projections are discounted to September 2006 and assume debt of $1,838mm estimated at that time. Note: Consolidated financials include corporate overhead. (1) Includes Seamless Web earnout. (2) Includes other corporate adjustments. Consolidated DCF Analysis – Management Case – As Adjusted Implied Perpetuity Growth Rate (3) (3) Reflects nominal growth. The Management Case – As Adjusted represents the Management Case excluding $20 million of acquisition spending. Arrow est. 5 yr. Low Oct. 2004 6.9x Arrow April 28 7.6x Arrow est. 5 yr. Average 8.2x Compass LTM 8.9x Sodexho LTM 9.9x Discount Terminal LTM EBITDA Multiple Rate 6.9x 7.5x 8.5x 9.5x 8.5% 2.2% 2.6% 3.3% 3.8% 9.5% 3.1% 3.6% 4.2% 4.8% 10.5% 4.0% 4.5% 5.2% 5.7% Discount Terminal LTM EBITDA Multiple Rate 6.9x 7.5x 8.5x 9.5x 8.5% $31.38 $34.07 $38.56 $43.05 9.5% $29.73 $32.31 $36.59 $40.88 10.5% $28.17 $30.63 $34.72 $38.82 ($ in millions) Projected '06E-'11E FYE 9/30, 2006E 2007E 2008E 2009E 2010E 2011E CAGR Sales $11,581.5 $12,222.1 $12,904.1 $13,624.5 $14,377.5 $15,162.1 5.5% % growth 5.6% 5.5% 5.6% 5.6% 5.5% 5.5% EBITDA $937.1 $999.6 $1,097.0 $1,164.8 $1,241.9 $1,312.9 7.0% % margin 8.1% 8.2% 8.5% 8.5% 8.6% 8.7% Unlevered Net Income $374.0 $399.8 $451.3 $487.7 $523.1 $562.4 8.5% % margin 3.2% 3.3% 3.5% 3.6% 3.6% 3.7% Depreciation & Amortization $338.7 $360.0 $375.0 $384.5 $404.9 $413.1 % of sales 2.9% 2.9% 2.9% 2.8% 2.8% 2.7% Capital Expenditures (1) ($316.3) ($340.5) ($351.4) ($435.8) ($408.7) ($416.3) % of sales (2.7%) (2.8%) (2.7%) (2.7%) (2.7%) (2.7%) (Incr.)/Decr. in Working Capital ($23.2) ($13.0) ($13.8) ($13.6) ($13.9) ($14.3) % of sales (0.2%) (0.1%) (0.1%) (0.1%) (0.1%) (0.1%) Unlevered FCF (2) $360.6 $418.0 $475.1 $438.2 $522.2 $563.1 9.3% |
 25 CONFIDENTIAL DCF Acquisition Sensitivity Analysis Management Case – As Further Adjusted (with $150mm of Acquisitions) If Arrow were to make $150 million of acquisitions per year and achieve financial performance in-line with its historical model, per share value would increase by approximately $1.00 per share. Management provided CS with an analysis of incremental results from an assumed acquisition program. Management’s sensitivity assumes $150mm of acquisitions per year, generally consistent with historical acquisition spending $100mm of FSS acquisitions $50mm of AUCA acquisitions Target sales growth and margin expansion are assumed to be achieved over a 5-year time horizon per management assumptions (1) (1) Represents Arrow estimated 5-year low LTM EBITDA multiple (October 2004). Discount Terminal LTM EBITDA Multiple Rate 6.9x 7.5x 8.5x 9.5x 8.5% $32.31 $35.05 $39.63 $44.20 9.5% $30.63 $33.25 $37.61 $41.98 10.5% $29.03 $31.53 $35.71 $39.88 |
 26 CONFIDENTIAL Sum-of-the-Parts DCF Analysis – Management Case Source: Management estimates provided to CS on May 25, as adjusted on July 6 and August 2, 2006, based on management guidance, and public filings. Note: Corporate expense allocated based on EBITDA contribution. Financials exclude $22mm, $22mm and $17mm of option and RSU expenses in LTM 6/30/06, 2006E and 2007E, respectively. Multiples including these expenses are 8.3x to 10.9x, 8.2x to 10.8x and 7.7x to 10.1x for LTM, 2006E and 2007E EBITDA, 13.0x to 17.0x, 12.9x to 16.9x and 12.0x to 15.8x for LTM, 2006E and 2007E EBIT, and 19.5x to 27.4x and 17.6x to 24.7x for 2006E and 2007E EPS, respectively. (1) Adjustments include proceeds from options exercised, $1,838mm of estimated 9/30/06 debt, $210mm A/R Facility and SURP liability which varies with share price. ($ in millions, except per share values) Arrow FY2006E Multiple Range Implied Enterprise Value Performance Low – High Low – High Segment Reference Range Food and Support Services $780 8.0x – 10.4x $6,200 – $8,100 Uniform and Career Apparel $218 6.9x – 9.2x 1,500 – 2,000 Implied Enterprise Value Range $7,700 – $10,100 (–) Enterprise Value Adjustments (1) (1,876) – (1,906) Implied Equity Value Reference Range $5,824 – $8,194 – Fully Diluted Shares Outstanding 192.1 – 192.1 Implied Equity Value per Share Reference Range $30.31 – $42.65 Enterprise Value / LTM EBITDA 8.1x – 10.6x FY 2006E EBITDA 8.0x – 10.5x FY 2007E EBITDA 7.5x – 9.9x LTM EBIT 12.5x – 16.4x FY 2006E EBIT 12.4x – 16.3x FY 2007E EBIT 11.7x – 15.4x Price / FY 2006E EPS 18.6x – 26.2x FY 2007E EPS 17.0x – 23.9x |
 27 CONFIDENTIAL Arrow Premiums Paid Analysis Source: SDC. Median Premium to Implied per Share Price Pre-Announcement Share Price @ Median Premiums 1 Day 1 Month 1 Day 1 Month Arrow Base Price $28.11 $29.05 – – Consortium Proposal of $33.80 20.2% 16.4% – – High 75.4% 105.8% U.S. Cash Transactions > $5 billion Median 33.8% 36.4% $37.61 $39.62 Low 8.3% 9.6% High 62.9% 61.9% LBO Transactions > $3 billion Median 21.4% 23.2% $34.13 $35.79 Low 2.7% 4.1% |
 28 CONFIDENTIAL Appendices |
 29 CONFIDENTIAL A. Management Case Financial Projections |
 30 CONFIDENTIAL Management Case Financial Summary Source: Management. Management estimates provided to CS on May 25, as adjusted on July 6 and August 2, 2006, based on management guidance. (1) Non-cash FAS 123, RSU expenses and acquisition amortization are included in corporate overhead. $45.9mm of AUCA Direct Marketing asset impairment is added back in 2006. (2) EPS reflects downward revision per management guidance and excludes $45.9mm of AUCA Direct Marketing asset impairment in 2006. (3) Net amount and includes Seamless Web earnout. ($ in millions) Historical Projected CAGR FYE 9/30, 2001 2002 2003 2004 2005 2006E 2007E 2008E 2009E 2010E 2011E '01A–'05A '05A–'11E Revenue FSS–United States $4,816 $5,625 $6,545 $6,879 $7,129 $7,444 $7,925 $8,375 $8,853 $9,349 $9,862 10.3% 5.6% % Growth 9.3% 16.8% 16.4% 5.1% 3.6% 4.4% 6.5% 5.7% 5.7% 5.6% 5.5% FSS–International $1,109 $1,201 $1,424 $1,830 $2,280 $2,512 $2,584 $2,739 $2,901 $3,074 $3,258 19.7% 6.1% % Growth 10.7% 8.2% 18.6% 28.6% 24.6% 10.2% 2.9% 6.0% 5.9% 6.0% 6.0% AUCA $1,434 $1,439 $1,479 $1,483 $1,554 $1,625 $1,713 $1,790 $1,870 $1,954 $2,042 2.0% 4.7% % Growth 0.6% 0.3% 2.8% 0.3% 4.8% 4.6% 5.4% 4.5% 4.5% 4.5% 4.5% Total Revenue $7,359 $8,264 $9,448 $10,192 $10,963 $11,581 $12,222 $12,904 $13,624 $14,378 $15,162 10.5% 5.6% % Growth 7.7% 12.3% 14.3% 7.9% 7.6% 5.6% 5.5% 5.6% 5.6% 5.5% 5.5% % Organic Growth 5.1% 1.7% 2.6% 5.7% 4.0% 5.6% 5.5% 5.6% 5.6% 5.5% 5.5% 3.5% 5.6% EBITDA FSS–United States $393 $469 $559 $562 $597 $619 $661 $728 $773 $825 $873 11.0% 6.6% % Margin 8.2% 8.3% 8.5% 8.2% 8.4% 8.3% 8.3% 8.7% 8.7% 8.8% 8.9% FSS–International $59 $67 $86 $104 $128 $161 $170 $183 $195 $208 $222 21.3% 9.6% % Margin 5.3% 5.6% 6.1% 5.7% 5.6% 6.4% 6.6% 6.7% 6.7% 6.8% 6.8% AUCA $202 $205 $204 $206 $213 $218 $232 $253 $268 $283 $297 1.4% 5.7% % Margin 14.1% 14.2% 13.8% 13.9% 13.7% 13.4% 13.5% 14.1% 14.3% 14.5% 14.5% Corporate ($24) ($30) ($40) ($40) ($37) ($60) ($58) ($61) ($64) ($68) ($72) 11.8% 11.8% Avg. Margins Total EBITDA (1) $630 $710 $809 $833 $900 $937 $1,005 $1,103 $1,171 $1,248 $1,320 9.4% 6.6% '01A–'05A '05A–'11E % Margin 8.6% 8.6% 8.6% 8.2% 8.2% 8.1% 8.2% 8.5% 8.6% 8.7% 8.7% 8.4% 8.4% Diluted EPS (2) $1.00 $1.25 $1.34 $1.36 $1.53 $1.55 $1.73 $2.07 $2.35 $2.63 $2.95 9.2% 13.7% % Growth 15.1% 24.8% 7.2% 1.5% 12.5% 1.6% 11.0% 20.0% 13.5% 11.9% 12.2% Capex FSS–United States $96 $130 $174 $185 $168 $220 $222 $226 $239 $253 $267 15.0% 8.0% % of Revenue 2.0% 2.3% 2.7% 2.7% 2.4% 3.0% 2.8% 2.7% 2.7% 2.7% 2.7% FSS–International $29 $22 $35 $43 $63 $46 $55 $58 $62 $65 $69 21.4% 1.5% % of Revenue 2.6% 1.9% 2.5% 2.4% 2.8% 1.8% 2.1% 2.1% 2.1% 2.1% 2.1% AUCA $79 $71 $94 $101 $95 $88 $94 $98 $103 $108 $113 4.6% 3.0% % of Revenue 5.5% 4.9% 6.4% 6.8% 6.1% 5.4% 5.5% 5.5% 5.5% 5.5% 5.5% Asset Disposal – – – – ($31) ($38) ($30) ($31) ($33) ($35) ($36) Total Capex (3) $204 $223 $303 $330 $295 $316 $341 $351 $436 $409 $416 9.6% 5.9% % of Revenue 2.8% 2.7% 3.2% 3.2% 2.7% 2.7% 2.8% 2.7% 3.2% 2.8% 2.7% Acquisition Capex $73 $898 $272 $161 $90 $20 $20 $20 $20 $20 $20 Total Capex w/ Acquisitions $277 $1,121 $575 $490 $385 $336 $361 $371 $456 $429 $436 8.5% 2.1% Revenue Mix FSS–United States 65.4% 68.1% 69.3% 67.5% 65.0% 64.3% 64.8% 64.9% 65.0% 65.0% 65.0% FSS–International 15.1% 14.5% 15.1% 18.0% 20.8% 21.7% 21.1% 21.2% 21.3% 21.4% 21.5% AUCA 19.5% 17.4% 15.7% 14.5% 14.2% 14.0% 14.0% 13.9% 13.7% 13.6% 13.5% |
 31 CONFIDENTIAL B. Enterprise Value Adjustments |
 32 CONFIDENTIAL Preliminary Enterprise Value Adjustments The enterprise value adjustments table below serves as the bridge between Arrow’s enterprise value and implied equity value ($ in millions) Adjustment Value Description (+) Excess Cash $0 All cash on balance sheet required for working capital per management (+) Cash Proceeds From Option Exercise 119 – 257 Proceeds received upon option exercise (dependant on stock price) (–) SURP Liability (103) – (61) Obligation associated with cash-out of DSU shares held for employee retirement (–) Est. Funded Debt (1) (1,982) Debt on the balance sheet (–) A/R Securitization Facility (225) Average balance of facility throughout year (–) Minority Interest (13) Minority interest of consolidated JVs Total Enterprise Value Adjustments ($2,203) – ($2,023) Source: Management estimates and public filings. (1) Estimated as of June 30, 2006. |
 33 CONFIDENTIAL C. Segment DCF Detail and DCF Sensitivities |
 34 CONFIDENTIAL Source: Management estimates provided to CS on May 25, as adjusted on July 6 and August 2, 2006, based on management guidance. Note: Corporate overhead and Seamless Web earnout allocated based on EBITDA contribution. (1) Includes Seamless Web earnout. (2) Includes other corporate adjustments. FSS DCF Analysis (3) Reflects nominal growth. Implied Enterprise Value Implied Perpetuity Growth Rate (3) Discount Terminal LTM EBITDA Multiple Rate 6.9x 7.5x 8.5x 9.5x 8.5% 1.9% 2.4% 3.1% 3.6% 9.5% 2.9% 3.4% 4.0% 4.6% 10.5% 3.8% 4.3% 5.0% 5.5% Discount Terminal LTM EBITDA Multiple Rate 6.9x 7.5x 8.5x 9.5x 8.5% $6,309 $6,724 $7,414 $8,105 9.5% $6,054 $6,450 $7,110 $7,769 10.5% $5,812 $6,190 $6,821 $7,451 ($ in millions) Projected '06E-'11E FYE 9/30, 2006E 2007E 2008E 2009E 2010E 2011E CAGR Sales $9,956.4 $10,508.9 $11,114.2 $11,754.3 $12,423.3 $13,119.9 5.7% % growth 5.8% 5.5% 5.8% 5.8% 5.7% 5.6% EBITDA $732.5 $785.7 $862.9 $917.1 $979.7 $1,038.3 7.2% % margin 7.4% 7.5% 7.8% 7.8% 7.9% 7.9% Unlevered Net Income $294.8 $311.5 $352.2 $382.0 $410.5 $444.1 8.5% % margin 3.0% 3.0% 3.2% 3.3% 3.3% 3.4% Depreciation & Amortization $260.9 $287.3 $299.4 $305.9 $323.0 $327.7 % of sales 2.6% 2.7% 2.7% 2.6% 2.6% 2.5% Capital Expenditures (1) ($252.8) ($269.6) ($276.2) ($342.2) ($320.8) ($326.5) % of sales (2.5%) (2.6%) (2.5%) (2.5%) (2.5%) (2.5%) (Incr.)/Decr. in Working Capital ($9.0) $4.6 $1.6 $2.5 $2.9 $3.3 % of sales (0.1%) 0.0% 0.0% 0.0% 0.0% 0.0% Unlevered FCF (2) $284.0 $343.1 $387.9 $360.3 $428.8 $463.0 10.3% |
 35 CONFIDENTIAL Source: Management estimates provided to CS on May 25, as adjusted on July 6 and August 2, 2006, based on management guidance. Note: Corporate overhead and Seamless Web earnout allocated based on EBITDA contribution. (1) Includes Seamless Web earnout. (2) Includes other corporate adjustments. AUCA DCF Analysis Implied Enterprise Value Implied Perpetuity Growth Rate (3) (3) Reflects nominal growth. Discount Terminal LTM EBITDA Multiple Rate 6.9x 7.5x 8.5x 9.5x 9.0% $1,550 $1,660 $1,843 $2,026 10.0% $1,486 $1,591 $1,766 $1,940 11.0% $1,425 $1,525 $1,692 $1,860 Discount Terminal LTM EBITDA Multiple Rate 6.9x 7.5x 8.5x 9.5x 9.0% 4.2% 4.6% 5.1% 5.5% 10.0% 5.1% 5.5% 6.0% 6.4% 11.0% 6.1% 6.5% 7.0% 7.4% ($ in millions) Projected '06E-'11E FYE 9/30, 2006E 2007E 2008E 2009E 2010E 2011E CAGR Sales $1,625.0 $1,713.2 $1,789.9 $1,870.2 $1,954.2 $2,042.1 4.7% % growth 4.6% 5.4% 4.5% 4.5% 4.5% 4.5% EBITDA $204.6 $219.0 $239.7 $253.8 $268.7 $281.5 6.6% % margin 12.6% 12.8% 13.4% 13.6% 13.8% 13.8% Unlevered Net Income $79.2 $85.1 $95.6 $101.9 $108.6 $114.0 7.6% % margin 4.9% 5.0% 5.3% 5.4% 5.6% 5.6% Depreciation & Amortization $77.9 $82.8 $86.8 $90.8 $95.0 $99.1 % of sales 4.8% 4.8% 4.9% 4.9% 4.9% 4.9% Capital Expenditures (1) ($83.5) ($91.0) ($95.2) ($113.7) ($107.9) ($109.8) % of sales (5.1%) (5.3%) (5.3%) (5.3%) (5.3%) (5.3%) (Incr.)/Decr. in Working Capital ($14.2) ($17.6) ($15.3) ($16.1) ($16.8) ($17.6) % of sales (0.9%) (1.0%) (0.9%) (0.9%) (0.9%) (0.9%) Unlevered FCF (2) $56.6 $61.9 $74.9 $66.3 $82.4 $89.6 9.6% |
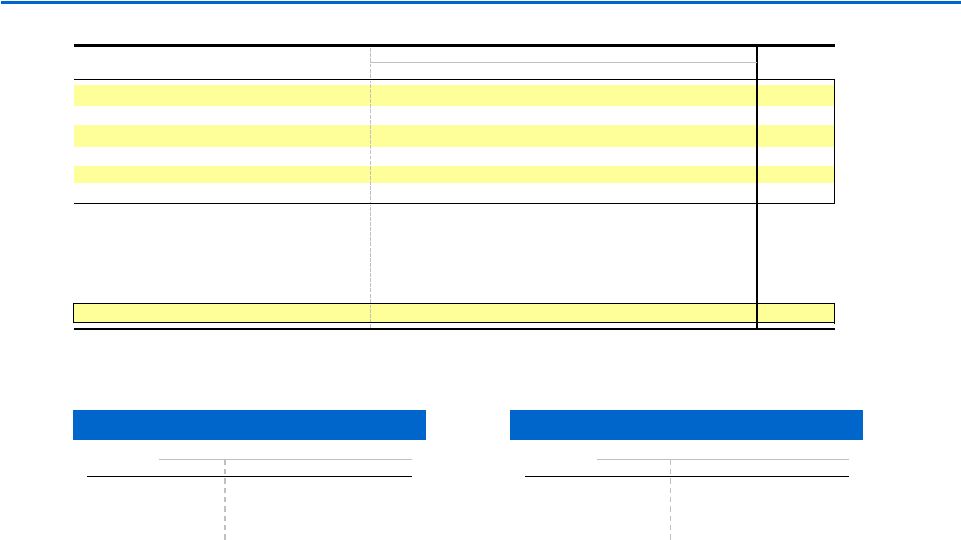
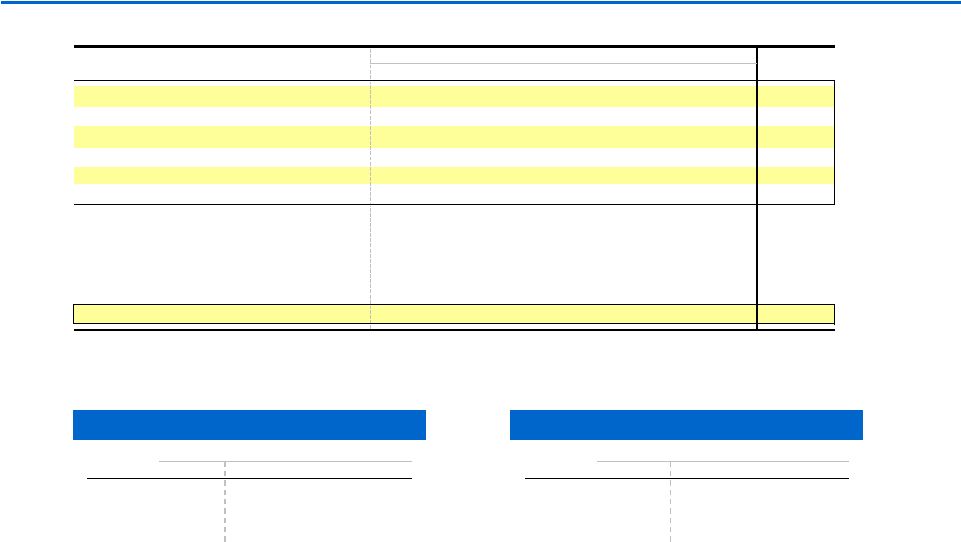
 36 CONFIDENTIAL Revenue Growth and EBITDA Margin Sensitivity Analysis – Implied Share Price Sensitivity Other DCF Sensitivity Analyses Revenue Growth vs. EBITDA Margin % of Plan Achieved Implied Revenue Growth and EBITDA Margin Revenue CAGR – 5.5% Avg. EBITDA Margin – 8.5% Note: Assumes terminal EBITDA multiple of 8.5x and discount rate of 9.5%. Note: Assumes terminal EBITDA multiple of 8.5x and discount rate of 9.5%. Management Case ($ in millions) Percent of Revenue Achieved 96.0% 98.0% 100.0% 102.0% 104.0% 96.0% $34.10 $35.11 $36.13 $37.14 $38.16 98.0% $34.28 $35.30 $36.32 $37.34 $38.36 100.0% $34.45 $35.48 $36.51 $37.53 $38.56 102.0% $34.63 $35.66 $36.69 $37.73 $38.76 104.0% $34.81 $35.85 $36.88 $37.92 $38.96 ($ in millions) Average Annual Revenue Growth Achieved 3.5% 4.5% 5.5% 6.5% 7.5% 6.5% $21.04 $22.86 $24.72 $26.64 $28.62 7.5% $26.51 $28.53 $30.63 $32.83 $35.13 8.5% $31.82 $34.11 $36.51 $39.01 $41.63 9.5% $37.12 $39.69 $42.38 $45.20 $48.14 10.5% $42.42 $45.27 $48.26 $51.38 $54.65 |
 37 CONFIDENTIAL D. Precedent Transaction Premiums |
 38 CONFIDENTIAL Premiums Paid in Large U.S. Public Cash Transactions ($ in billions) Date Transaction Premium to Price Prior to Announcement Announced Target Acquiror Value 1 Day 1 Week 1 Month 02/17/04 AT&T Wireless Services Inc Cingular Wireless LLC $47.1 75.4% 82.7% 105.8% 07/24/06 Hospital Corporation of America Investor Group 33.0 17.8% 15.9% 15.3% 05/29/06 Kinder Morgan Inc Investor Group 26.5 18.5% 19.6% 13.6% 11/13/05 Georgia-Pacific Corp Koch Forest Products Inc 20.5 38.5% 46.8% 54.7% 06/27/06 Univision Communications Inc Investor Group 13.4 38.9% 35.4% 29.4% 08/20/04 Rouse Co General Growth Properties Inc 11.9 33.4% 38.3% 41.2% 02/17/06 KeySpan Corp National Grid PLC 11.9 16.1% 16.8% 16.0% 01/15/01 Ralston Purina Co Nestle SA 11.7 36.0% 38.9% 30.4% 03/21/05 SunGard Data Systems Inc Investor Group 10.8 44.3% 41.5% 37.3% 05/04/04 Charter One Financial Citizens Financial Group,RI 10.5 24.7% 31.5% 25.7% 06/06/03 PeopleSoft Inc Oracle Corp 8.9 75.4% 61.7% 64.5% 08/26/01 American Water Works Co Inc RWE AG 8.1 40.5% 37.6% 47.7% 06/04/04 Mandalay Resort Group MGM Mirage Inc 7.6 30.0% 29.4% 34.9% 12/20/05 Nextel Partners Inc Sprint Nextel Corp 7.5 8.3% 8.5% 9.6% 03/17/05 Toys "R" Us Inc Investor Group 6.1 62.9% 59.0% 61.9% 06/30/06 Michaels Stores Inc Investor Group 5.6 29.6% 34.2% 37.7% 11/18/05 Scientific Atlanta Inc Cisco Systems Inc 5.3 18.1% 27.9% 21.8% 07/30/01 Heller Financial Inc General Electric Capital Corp 5.3 49.7% 48.6% 36.4% 05/02/05 Neiman Marcus Group Inc Investor Group 5.2 33.8% 37.4% 38.5% Mean 36.4% 37.5% 38.0% Median 33.8% 37.4% 36.4% Source: SDC. |
 39 CONFIDENTIAL Premiums Paid in Large LBO Transactions ($ in billions) Date Transaction Premium to Price Prior to Announcement Announced Target Acquiror Value 1 Day 1 Week 1 Month 07/24/06 Hospital Corporation of America Investor Group $33.0 17.8% 15.9% 15.3% 05/29/06 Kinder Morgan Inc Investor Group 26.5 18.5% 19.6% 13.6% 06/27/06 Univision Communications Inc Investor Group 13.4 38.9% 35.4% 29.4% 03/21/05 SunGard Data Systems Inc Investor Group 11.3 44.3% 41.5% 37.3% 11/30/05 TDC A/S Nordic Telephone Co ApS 10.6 24.4% 22.8% 23.2% 01/16/06 VNU NV Valcon Acquisition BV 10.3 9.3% 9.9% 11.7% 03/31/06 ITV PLC Investor Group 10.2 12.2% 16.8% 18.4% 03/29/06 Assoc British Ports Hldgs PLC Admiral Acquisitions UK Ltd 6.1 30.8% 44.6% 46.7% 03/17/05 Toys "R" Us Inc Investor Group 6.1 62.9% 59.0% 61.9% 06/30/06 Michaels Stores Inc Investor Group 5.6 29.6% 34.2% 37.7% 05/02/05 Neiman Marcus Group Inc Investor Group 5.2 33.8% 37.4% 38.5% 03/29/05 ISS A/S PurusCo AS 5.1 31.3% 30.6% 33.0% 04/03/06 Gambro AB Indap AB 4.6 22.3% 26.3% 38.7% 08/27/04 LNR Property Corp Riley Property Holdings LLC 4.0 6.7% 10.7% 16.8% 05/31/06 West Corp Investor Group 3.8 13.0% 18.2% 5.8% 06/28/06 Highwoods Properties Inc Capital Partners Inc 3.7 9.1% 11.8% 16.1% 03/20/06 Kerzner International Ltd Investor Group 3.6 15.1% 16.7% 19.7% 10/17/03 Chelsfield LTD Duelguide PLC 3.4 2.7% 4.9% 4.1% 02/21/06 MeriStar Hospitality Corp Blackstone Group LP 3.4 5.2% 5.5% 9.8% 03/07/05 Insight Communications Co Investor Group 3.3 21.4% 23.7% 12.6% 03/05/04 Extended Stay America Inc Blackstone Group LP 3.2 24.6% 26.3% 27.4% 03/06/06 Education Management Corp Investor Group 3.1 16.3% 13.0% 34.1% Mean 22.5% 24.2% 25.5% Median 21.4% 22.8% 23.2% Source: SDC. Note: Includes worldwide LBO transactions in excess of $3.0 billion of deal value. Premiums adjusted for pre-announcements and other market leaks. |
 40 CONFIDENTIAL E. Historical Trading Multiples |
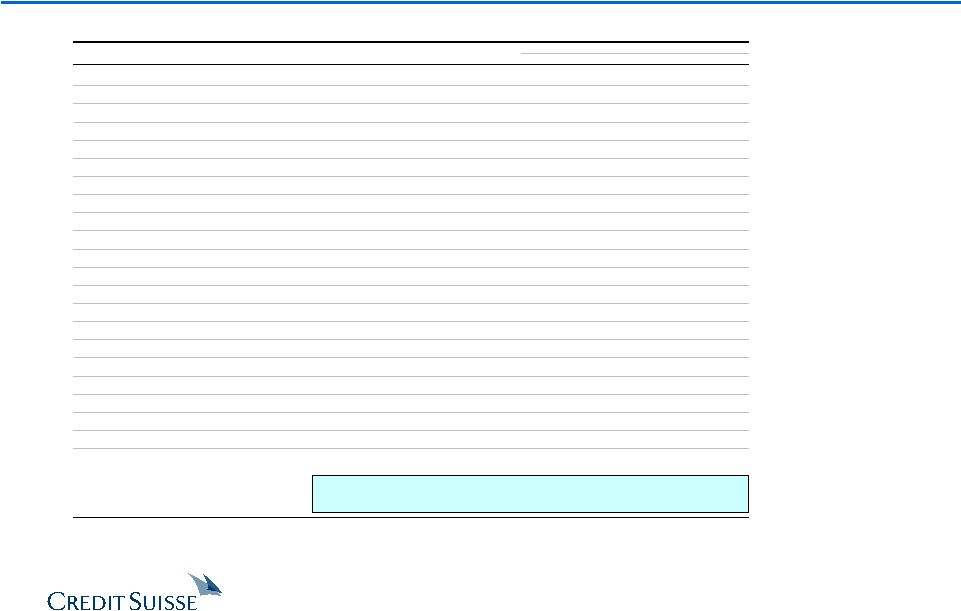
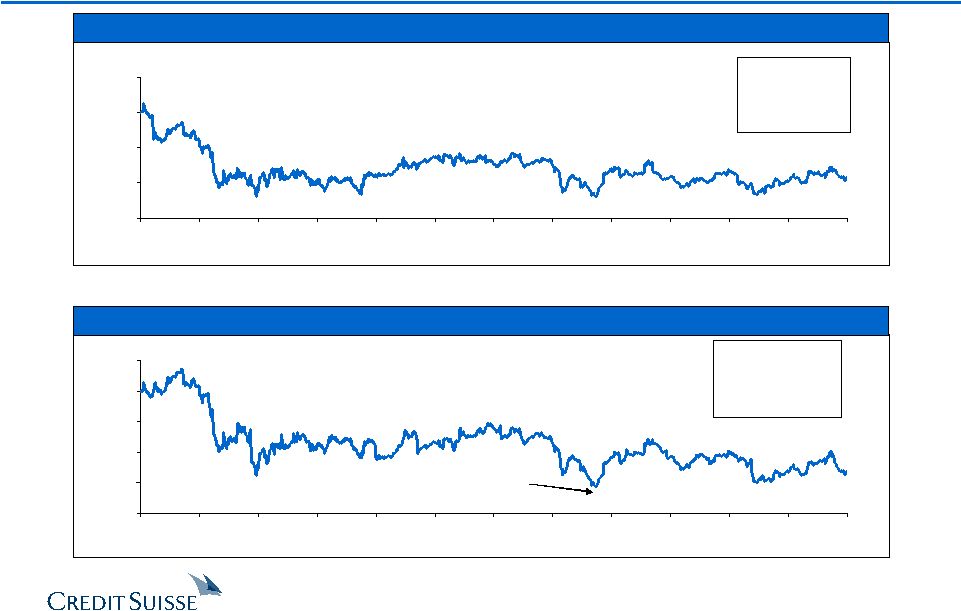 41 CONFIDENTIAL Historical Trading Multiples Forward P/E Enterprise Value / LTM Trailing EBITDA 12.0x 16.0x 20.0x 24.0x 28.0x 1/31/02 6/10/02 10/15/02 2/24/03 7/1/03 11/5/03 3/16/04 7/23/04 11/29/04 4/7/05 8/12/05 12/19/05 4/28/06 Mean: 17.5x Median: 17.0x Max: 25.1x Min: 14.4x 4/28/06: 16.7x Note: Based on estimated earnings for next four unreported quarters as of each respective date. 6.0x 7.0x 8.0x 9.0x 10.0x 11.0x 1/31/02 6/10/02 10/15/02 2/24/03 7/1/03 11/5/03 3/16/04 7/23/04 11/29/04 4/7/05 8/12/05 12/19/05 4/28/06 Mean: 8.2x Median: 8.1x Max: 10.7x Min: 6.9x 4/28/06: 7.6x Minimum 6.9x 10/25/04 Note: One– and two–year median multiples are 7.6x and 7.7x, respectively. Source: FactSet Research Systems. |
 42 CONFIDENTIAL F. Illustrative LBO Assumptions |
 43 CONFIDENTIAL Est. Consortium Sources and Uses Sources and Uses Source: Management and discussions with Consortium. Note: Assumes a purchase price of $33.80 per share. (1) Excludes management promote. ($ in millions) % of Sources Amount Total Uses Amount Term Loan B $3,755 43.7% Equity Purchase Price $6,236 5.0% Notes due 2012 250 2.9% Refinance Term Loan B 1,588 Senior Unsecured Notes 850 9.9% Refinance 5.0% Notes due 2012 250 Senior Toggle Notes 850 9.9% Refinance A/R Securitization Facility 210 Senior Subordinated Notes 770 9.0% Est. Transaction Expenses 316 A/R Securitization Facility 225 2.6% Total Debt $6,700 77.9% Management's Contribution (1) 250 2.9% Sponsor Consortium Equity 1,650 19.2% Total Equity $1,900 22.1% Total Sources $8,600 100.0% Total Uses $8,600 |
 44 CONFIDENTIAL CS does not provide any tax advice. Any tax statement herein regarding any US federal tax is not intended or written to be used, and cannot be used, by any taxpayer for the purpose of avoiding any penalties. Any such statement herein was written to support the marketing or promotion of the transaction(s) or matter(s) to which the statement relates. Each taxpayer should seek advice based on the taxpayer's particular circumstances from an independent tax advisor. These materials have been provided to you by Credit Suisse ("CS") in connection with an actual or potential mandate or engagement and may not be used or relied upon for any purpose other than as specifically contemplated by a written agreement with CS. In addition, these materials may not be disclosed, in whole or in part, or summarized or otherwise referred to except as agreed in writing by CS. The information used in preparing these materials was obtained from or through you or your representatives or from public sources. CS assumes no responsibility for independent verification of such information and has relied on such information being complete and accurate in all material respects. To the extent such information includes estimates and forecasts of future financial performance (including estimates of potential cost savings and synergies) prepared by or reviewed or discussed with the managements of your company and/or other potential transaction participants or obtained from public sources, we have assumed that such estimates and forecasts have been reasonably prepared on bases reflecting the best currently available estimates and judgments of such managements (or, with respect to estimates and forecasts obtained from public sources, represent reasonable estimates). These materials were designed for use by specific persons familiar with the business and the affairs of your company and CS assumes no obligation to update or otherwise revise these materials. Nothing contained herein should be construed as tax, accounting or legal advice. You (and each of your employees, representatives or other agents) may disclose to any and all persons, without limitation of any kind, the tax treatment and tax structure of the transactions contemplated by these materials and all materials of any kind (including opinions or other tax analyses) that are provided to you relating to such tax treatment and structure. For this purpose, the tax treatment of a transaction is the purported or claimed U.S. federal income tax treatment of the transaction and the tax structure of a transaction is any fact that may be relevant to understanding the purported or claimed U.S. federal income tax treatment of the transaction. CS has adopted policies and guidelines designed to preserve the independence of its research analysts. CS’s policies prohibit employees from directly or indirectly offering a favorable research rating or specific price target, or offering to change a research rating or price target, as consideration for or an inducement to obtain business or other compensation. CS’s policies prohibit research analysts from being compensated for their involvement in investment banking transactions. |