 PROJECT ARROW DRAFT CONFIDENTIAL Presentation to the Special Committee June 25, 2006 PRELIMINARY | SUBJECT TO FURTHER REVIEW AND EVALUATION THESE MATERIALS MAY NOT BE USED OR RELIED UPON FOR ANY PURPOSE OTHER THAN AS SPECIFICALLY CONTEMPLATED BY A WRITTEN AGREEMENT WITH CREDIT SUISSE. |
 2 CONFIDENTIAL | PRELIMINARY ANALYSIS D R A F T Table of Contents 1. Market Update 2. Update on Consortium Proposal 3. Preliminary Review of Selected Alternatives 4. Next Steps Appendix A. Supplemental Analysis B. Updated Preliminary Financial Analysis |
 3 CONFIDENTIAL | PRELIMINARY ANALYSIS D R A F T Today’s Agenda An overview of recent capital market conditions An update on stock price performance of selected companies A discussion of certain stockholder reactions to the proposal, including the Special Committee’s meeting with Eminence Capital Current Market Conditions A preliminary review of the potential value implications of implementing various strategic alternatives A preliminary review of an LBO done in conjunction with a sale of AUCA A further discussion of financial and ownership implications of a significant share repurchase Discussion of Selected Alternatives A discussion of how the Special Committee could respond to the consortium and other interested parties, as well as next steps in its consideration of alternatives Next Steps A review of CS’s and S&S’s meeting with consortium representatives A review of discussions with other parties Update on the Current Proposal and Other Inquiries |
 CONFIDENTIAL | PRELIMINARY ANALYSIS 4 1. Market Update |
 5 CONFIDENTIAL | PRELIMINARY ANALYSIS D R A F T Arrow Share Price Performance Since June 2 Meeting Broader equity indices have been under pressure and Arrow’s average daily trading volume has remained relatively high. Stock has held steady above the offer price of $32 (1) Average daily trading volume remains high, with approximately 2.1 million shares trading daily (2) vs. 530,000 shares pre-announcement Equity research target prices, reactions and recommendations have not changed since the Committee’s last meeting Significant shareholder activity Ariel Capital Management, formerly Arrow’s largest shareholder, sold approximately 11 million of its 15.2 million shares Eminence Capital, Arrow’s largest institutional shareholder with 6.3%, has increased its shareholding by over 230,000 shares since our last meeting Observations Source: FactSet. (1) Since the proposal was announced, Arrow’s stock price has closed below the offer price only once ($31.80 on June 13, 2006). (2) 2.1 million share ADTV since announcement represents 1.8% of public float; 24.2% of public float traded on day of announcement. Trading Performance Arrow % Daily Change Date Price Volume Arrow S&P 400 DJIA Nasdaq 5/31/06 $32.75 3,455,000 -- -- -- -- 6/1/06 33.00 1,092,700 0.8% 1.5% 0.8% 1.9% 6/2/06 33.06 993,400 0.2% 0.4% (0.1%) (0.0%) 6/5/06 32.70 1,222,700 (1.1%) (2.4%) (1.8%) (2.2%) 6/6/06 32.70 854,400 0.0% (0.6%) (0.4%) (0.3%) 6/7/06 32.84 1,234,600 0.4% (0.8%) (0.6%) (0.5%) 6/8/06 32.77 1,230,900 (0.2%) (0.5%) 0.1% (0.3%) 6/9/06 32.66 588,700 (0.3%) (0.2%) (0.4%) (0.5%) 6/12/06 32.30 893,800 (1.1%) (2.2%) (0.9%) (2.0%) 6/13/06 31.80 3,930,400 (1.5%) (1.6%) (0.8%) (0.9%) 6/14/06 32.50 2,270,500 2.2% 0.5% 1.0% 0.7% 6/15/06 32.67 612,700 0.5% 3.2% 1.8% 2.8% 6/16/06 32.80 689,700 0.4% (0.4%) (0.0%) (0.7%) 6/19/06 33.10 715,300 0.9% (1.6%) (0.7%) (0.9%) 6/20/06 33.15 1,214,800 0.2% (0.4%) 0.3% (0.2%) 6/21/06 33.11 1,144,400 (0.1%) 1.8% 0.0% 1.6% 6/22/06 32.81 1,308,000 (0.9%) (0.6%) 0.4% (0.9%) 6/23/06 32.92 1,033,900 0.3% 0.9% (0.3%) (0.1%) Total Percent Change 0.5% (3.2%) (1.6%) (2.6%) |
 6 CONFIDENTIAL | PRELIMINARY ANALYSIS D R A F T Equity Market Update Debt Market Update The equity markets continue to reflect broad investor sentiment that the US economy is headed for a slowdown The S&P 500 is down 3.4% since June 2nd and 6.1% since May 5th (LTM high) Investors are focused on economic data, particularly signs of inflation, and how the Federal Reserve will respond Core CPI for Q1 revised upwards and economists expect the same for GDP Market is pricing-in an almost certain 25-bp hike at the next FOMC meeting (June 28/29) Investors are struggling with whether the Fed has gone too far Market is expected to continue to focus on economic data until Q2 earnings season and possible 2006 forecast revisions come into play (expected late July) The high yield market has softened recently, driven in part by rising interest rates, uncertainty surrounding the Fed and an imbalance in supply/demand technicals The 10-Year Treasury is up 20 bps in June The high yield forward issue calendar reached $9.3bn last week, the highest it has been since January High yield mutual funds experienced outflows of roughly $325mm last week, bringing YTD outflows to $1.9bn Uncertainty remains whether recent contraction is a semi-annual market correction that has occurred in recent years, or indicative of larger market concerns Default rates, currently at approximately 2%, remain well below historical averages Given treasury movements, spreads have actually compressed YTD, implying that the recent sell-off is not a result of credit concerns Equity and debt markets have experienced downward pressure recently. Review of Capital Market Conditions |
 7 CONFIDENTIAL | PRELIMINARY ANALYSIS D R A F T Changes in Selected Companies Valuation Multiples Despite recent declines in share prices, food and support services valuation multiples have remained largely unchanged, while uniform multiples have contracted slightly. ($ in millions, except per share values) EV / EBITDA P/E (1) Share Price as of 2006E 2007E 2006E 2007E Last Last Last Last Last Company Meeting Today % Change Meeting Today Meeting Today Meeting Today Meeting Today Arrow (Current) $33.06 $32.92 (0.4%) 8.5x 8.5x 7.9x 7.9x 20.2x 20.1x 17.9x 17.8x Arrow (Offer) $32.00 $32.00 NA 8.3x 8.3x 7.7x 7.7x 19.5x 19.5x 17.3x 17.3x Arrow (Pre-Offer) $28.11 $28.11 NA 7.5x 7.5x 6.9x 6.9x 17.1x 17.1x 15.2x 15.2x Food and Support Services Autogrill $15.79 $14.83 (6.1%) 8.1x 7.9x 7.6x 7.4x 20.9x 20.3x 18.6x 18.1x Centerplate (2) $14.17 $13.30 (6.1%) 9.0x 8.7x 8.7x 8.3x NM NM NM NM Compass $4.60 $4.66 1.3% 8.7x 9.1x 8.3x 8.6x 21.6x 22.7x 16.0x 16.9x Elior (3) $13.74 $13.74 0.0% 7.7x 7.7x 7.3x 7.3x 15.1x 15.1x 13.5x 13.5x Sodexho $46.21 $45.70 (1.1%) 9.0x 9.2x 8.1x 8.2x 19.0x 19.4x 16.5x 16.9x Mean (2.4%) 8.5x 8.5x 8.0x 8.0x 19.2x 19.4x 16.2x 16.3x Median (1.1%) 8.7x 8.7x 8.1x 8.2x 19.9x 19.8x 16.3x 16.9x Uniform and Career Apparel United States Cintas $42.17 $39.71 (5.8%) 10.3x 9.7x 9.4x 8.9x 20.9x 19.7x 18.3x 17.3x G&K Services $39.27 $34.98 (10.9%) 8.8x 8.0x 8.0x 7.3x 19.5x 17.4x 17.2x 15.3x Unifirst $32.02 $31.60 (1.3%) 6.8x 6.8x 6.3x 6.2x 16.2x 16.0x 13.9x 13.7x International Davis Service Group $8.64 $8.30 (3.9%) 4.6x 4.6x 4.5x 4.5x 13.3x 13.3x 12.5x 12.5x Rentokil $2.73 $2.78 1.6% 7.1x 7.4x 6.8x 7.0x 13.5x 14.2x 12.3x 13.0x Mean (4.1%) 7.5x 7.3x 7.0x 6.8x 16.7x 16.1x 14.9x 14.4x Median (3.9%) 7.1x 7.4x 6.8x 7.0x 16.2x 16.0x 13.9x 13.7x Overall Mean (3.2%) 8.0x 7.9x 7.5x 7.4x 17.8x 17.6x 15.5x 15.2x Overall Median (2.6%) 8.4x 7.9x 7.8x 7.4x 19.0x 17.4x 16.0x 15.3x Note: Last Meeting reflects share prices and valuation as of May 31, 2006; Today reflects share prices and valuation as of June 23, 2006. (1) EPS estimates based on Investext equity research. (2) Centerplate trades as an Income Deposit Security. (3) As of January 11, 2006, the day before Robert Zolade announced that he was reviewing the possibility of opening his share capital to new investors. A cash tender was launched on March 27, 2006. |
 8 CONFIDENTIAL | PRELIMINARY ANALYSIS D R A F T Review of Eminence Capital Presentation On June 12, Eminence Capital presented its view on valuation and strategic alternatives to selected members of the Special Committee, Credit Suisse and Shearman & Sterling. Eminence provided a summary valuation using precedent transaction and LBO analyses that values Arrow between $37.00 - $48.17 Eminence also stated its belief that Arrow equity research price targets are flawed in two respects: Pre-Offer price targets are based on GAAP EPS, while Arrow’s primary comparables trade on “Cash EPS” Post-Offer price targets incorporate multiple flawed assumptions Eminence is optimistic about Arrow’s prospects based on its consistent growth, predictable results, high returns on capital, strong free cash flow generation and recognized leadership position Eminence also outlined a number of options that it believes are available to the Special Committee Negotiate with the buying group for a price at or near fair value Initiate an auction for the Company and allow the CEO-led offering group to bid If an offer at or near fair value does not materialize, then repurchase 20% - 30% of shares outstanding via a Dutch tender offer and highlight “Cash EPS” Eminence’s projections are based on publicly available information and Eminence estimates (1) Source: Eminence Capital. ($ in millions) EBITDA 2006 2007 2008 2009 2010 2011 Eminence Projections (1) $948 $1,034 $1,106 $1,184 $1,266 $1,355 Management Plan 954 1,030 1,103 1,171 1,248 1,320 % Difference (0.6%) 0.4% 0.3% 1.1% 1.4% 2.7% |
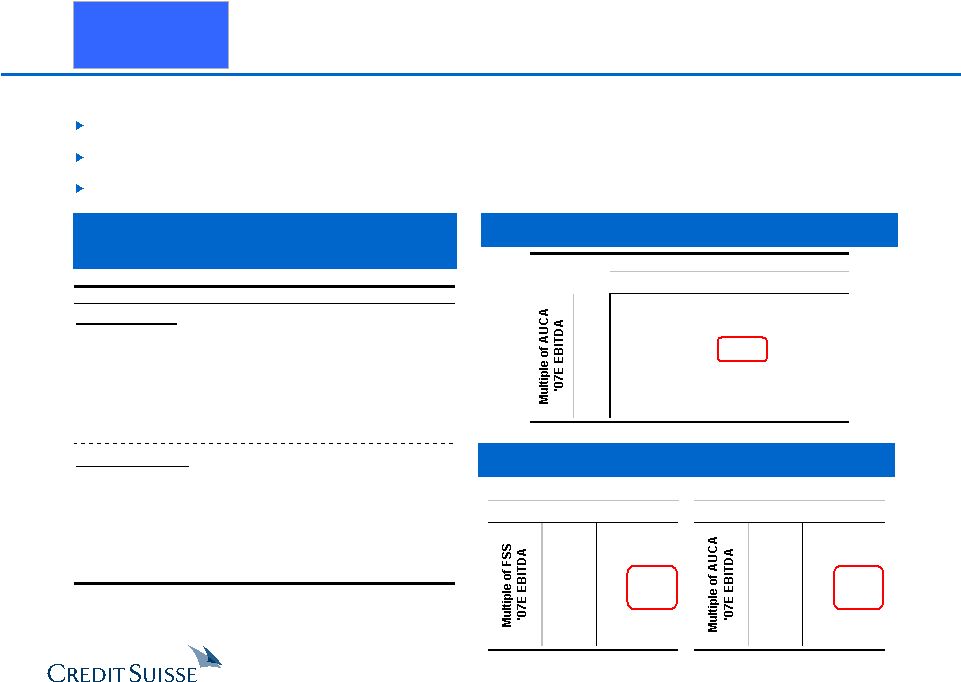
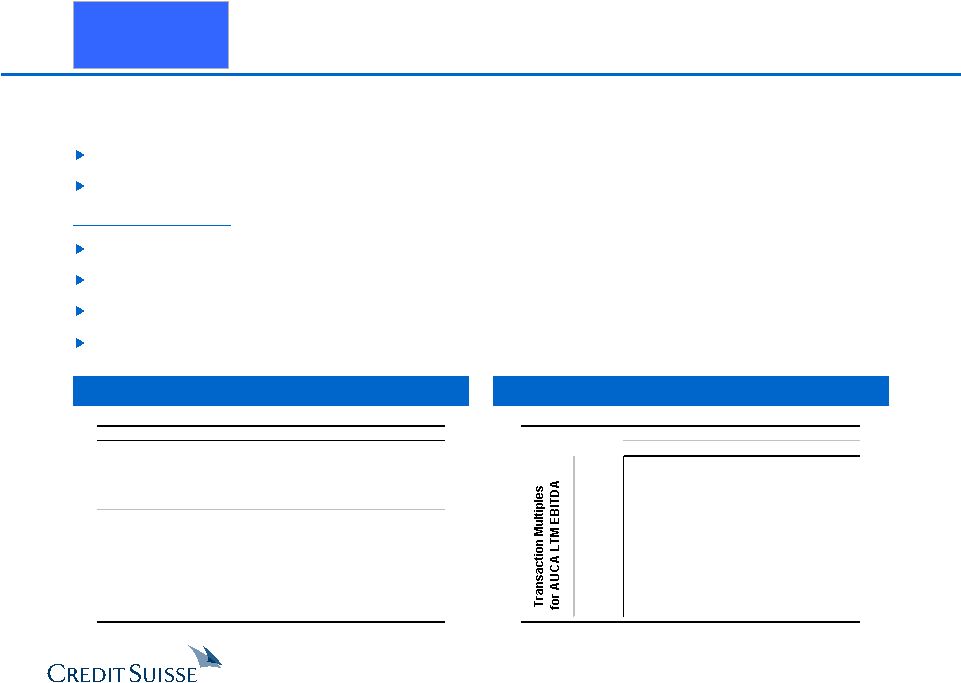
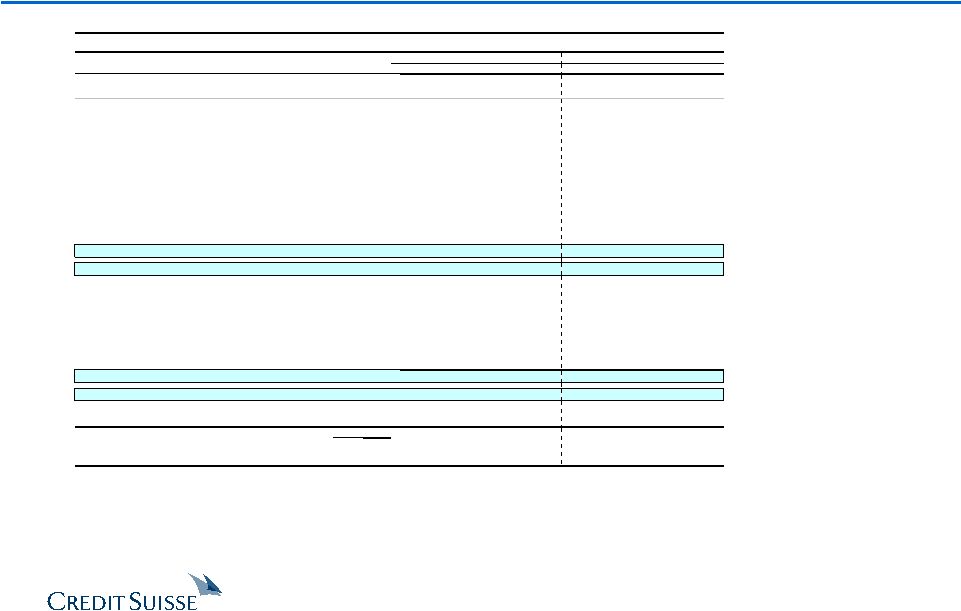
 9 CONFIDENTIAL | PRELIMINARY ANALYSIS D R A F T Implied Valuation Range $32.00 – $37.00 Financial projections based on Arrow five-year plan $13-$14 million of working capital increases per annum Exit multiple range of 8.5x LTM EBITDA Cost of debt of 8.56% Implied IRR of approximately 17-30% depending on purchase price Leverage of 7.0x based on 6/30/06E adjusted LTM EBITDA ($6,770mm of debt financing) Targeting a 15.0% to 20.0% IRR using the Management Case would yield an implied valuation range of $35.32 to $37.84 per share, respectively (excluding management promote) Selected list of recent transactions highlighting Elior and SSP as most relevant (e.g., EQT/SSP, HBI/Elior, Charterhouse/PHS Group, EQT/ISS, Consortium/SunGuard) Price Range (1) $37.00 – $41.26 Implied EBITDA Multiple 9.0x – 9.8x Assumed 2006E EBITDA: $948mm Selected transactions based on a broad number of transactions in Arrow’s core segments (e.g., EQT/SSP, HBI/Elior, Sodexho/SMS, Cintas/Omni Services, Cintas/Unitog) A complete list of relevant transactions can be found on slide 42 Price Range $34.00 – $41.00 Implied EBITDA Multiple 8.8x – 10.3x Assumed 2006E EBITDA: $954mm Implied Valuation Range $38.91 – $42.49 Financial projections based on publicly available information and Eminence estimates No assumed increase in working capital requirements Exit multiple of 8.25x NTM EBITDA Cost of debt of 7.81% Assumed IRR of 15-20% Leverage of ~6.5x based on 6/30/06E adjusted LTM EBITDA (consistent with consortium proposal of $6,250mm of debt financing) Eminence Analysis Comparison of Assumptions LBO Analysis Precedent Transactions CS Analysis (1) $37.00 per share based on average EV/EBITA multiple of 12.9x for selected transactions. Note: EBITDA based 9/30/06 assumptions. |
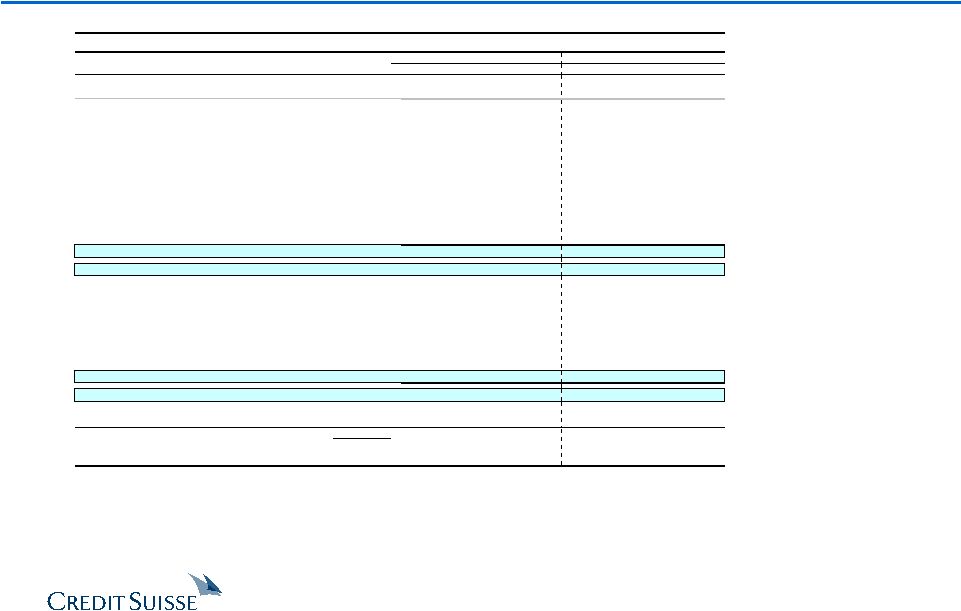
 10 CONFIDENTIAL | PRELIMINARY ANALYSIS D R A F T Assumes 16.3x NTM EPS and 3.0x leverage – 25.2% of total shares outstanding Estimated debt of $1,657mm as of 9/30/06 Financing based on 2007E EBITDA of $1,034mm at 7.25% cost of debt Assumes post tender offer trading multiple based on average of Sodexho, Compass and Cintas (FY 2007E) Assume transaction occurs end of FY 2007 Assumes “Cash EPS” Implied 2007E Share Price (1) $38.12 at 3.0x leverage and a $32.00 repurchase price Assumes 16.7x NTM EPS and 4.5x leverage – 40.8% of total shares outstanding Estimated debt of $1,869mm as of 9/30/06 Financing based on 6/30/06 PF EBITDA of $967mm and 7.44% cost of debt Assumes post tender offer trading multiple based on NTM EPS consensus estimate one day prior to the announced proposal Assumes transaction occurs end of FY 2006 Assumes GAAP EPS Implied 2007E Share Price (1)(2)(3) $37.91 at 3.0x leverage and a $32.00 repurchase price $37.56 at 4.5x leverage and a $34.00 repurchase price Comparison of Assumptions (cont’d) Repurchase Eminence Analysis CS Analysis (1) Excludes value associated with cash in repurchase. (2) Based on illustrative future share price analysis; the present values of the $37.91 and $37.56 share prices are $34.15 and $33.84, respectively, discounted at 11% cost of equity. (3) These calculations are based upon management estimates of EPS growth rates and current public market trading multiples. These calculations do not purport to reflect the value of these securities or the prices at which securities actually may be sold. Calculations based upon estimates of future results are not necessarily indicative of actual future results, which may be significantly more or less favorable than those suggested by these calculations. |
 CONFIDENTIAL | PRELIMINARY ANALYSIS 11 2. Update on Consortium Proposal |
 12 CONFIDENTIAL | PRELIMINARY ANALYSIS D R A F T Consortium Proposal Consortium Members: Arrow Management GS Capital Partners J.P. Morgan Partners Thomas H. Lee Partners Warburg Pincus LLC Offer Price: $32 per share (13.8% premium to closing market price as of April 28, 2006) Equity Value: $5.9 billion (19.5x 2006E Net Income; 17.3x 2007E Net Income) Enterprise Value: $7.9 billion (8.1x 2006E EBITDA; 7.5x 2007E EBITDA) Form of Consideration: 100% Cash Financing: Debt Approximately $6.24 billion of debt or approximately 6.5x LTM Adjusted EBITDA as of June 30, 2006 ($3.62 billion of bank, $2.62 billion of bond and $600 million of unfunded revolver) To be arranged by Goldman Sachs Credit Partners L.P. and J.P. Morgan Securities, Inc. “Highly confident” letter provided by the banks listed above Debt commitment letters to be provided (consortium has indicated they are prepared to sign current letters) Preliminary rating view: B2/B Equity Approximately $1.9 billion of equity to be provided by the Consortium Members Equity commitment letters to be provided Debt Commitment Letters: No market Material Adverse Change (“MAC”) provision Business MAC to conform to purchase agreement Representations and Warranties to conform to purchase agreement Syndication is not a condition to closing No leverage or minimum EBITDA condition No conditions on new information Post-closing collateral flexibility “Covenant light” financing package Source: Consortium financial and legal advisors. (1) CS has been informed that discussions regarding equity participation have been had with Mr. Neubauer (CEO), Fred Sutherland (CFO) and Bart Colli (GC). Note: Certain terms of the proposal, including management’s participation, have not been finalized among the Consortium Members. Text in blue represents new information since June 2, 2006 meeting. On June 14 , the consortium’s financial and legal advisors met with Credit Suisse and Shearman & Sterling and discussed additional detail of the equity arrangement and financing plan supporting its proposal. th (1) |
 13 CONFIDENTIAL | PRELIMINARY ANALYSIS D R A F T Consortium Proposal (cont’d) Source: Consortium financial and legal advisors. (1) Mr. Neubauer is expected to reinvest between 30% and 50% of his existing shareholding, and may increase participation above 2/3 depending upon the level of participation by Arrow Senior Managers. (2) Allocation of options to Arrow Senior Managers to be determined by Mr. Neubauer with the consent of the Sponsors. Note: Certain terms of the proposal, including management’s participation, have not be finalized among the Consortium Members. Text in blue represents new information since June 2, 2006 meeting. (1) Board Composition: For the Initial 4-Year Period (“Initial Period”) 11 Directors – Mr. Neubauer (Chairman and CEO) – 6 Independent Directors (to be approved by Nominating Committee, which will be selected by Mr. Neubauer) – 4 Directors representing the 4 sponsors (subject to Mr. Neubauer’s consent) For 2 Years Following the Initial Period Sponsors to select the 6 Independent Directors (with influence from Mr. Neubauer) Mr. Neubauer’s Rights: Veto rights on an IPO and / or sale of the Company for Initial Period Rights remain essentially the same if Mr. Neubauer relinquishes CEO role but maintains current ownership Sponsor Rights: Affirmative consent from Sponsors required for (i) material acquisitions and divestitures (ii) equity issuance and (iii) other material transactions Management Participation: Equity roll-over equal to at least 10%, but likely closer to 15% – Mr. Neubauer: 2/3 of total roll-over – 250 Arrow Senior Managers: 1/3 Management Options (2) : 17.5% of fully diluted equity (12.5% issued at closing at transaction price; 5% in future years) 1/3 performance based; 2/3 time vested Arrow Senior Managers are eligible for option grants; however, eligibility contingent upon participation in the equity roll-over Additional equity grants to be considered by the Board |
 CONFIDENTIAL | PRELIMINARY ANALYSIS 14 3. Preliminary Review of Selected Alternatives |
 15 CONFIDENTIAL | PRELIMINARY ANALYSIS D R A F T ADVANTAGE CONSIDERATIONS PRELIMINARY IMPLIED VALUE RANGE Modest growth with relatively low risk profile Appears to indicate upside potential in pre- announcement stock price Deliver value through organic growth and margin improvement Fragmented market provides “bolt-on” acquisition opportunities Market might ask “What’s next?” Likely result in immediate stock price reduction Potential exposure to near- term underperformance relative to Street expectations Illustrative Future Share Price Analysis: $32 - $34, depending on future P/E multiple Range of DCF Analysis (1) : $32 - $43 Expands potential buyer universe Cash proceeds from divestiture(s) could be used for a number of alternatives (distribution, significant acquisition) Lack of significant multiple differentiation between segments May restrict strategic transactions post-separation if spin-off Tax leakage impacts value creation opportunity Spin-off AUCA: $28 - $35, depending on pro forma trading multiples Divest AUCA: $27 - $34, depending on AUCA sale multiple and pro forma FSS trading multiple Immediate return of value to stockholders – potentially at premium to current stock price in a repurchase Could structure repurchase with ESOP component to enhance employee ownership EPS accretive transaction Potentially results in ratings downgrade / increased cost of capital May increase Mr. Neubauer’s voting position depending on his participation $31 - $36, depending on future P/E multiple Realize change of control value for stockholders May capture differential between public and private market valuations Increased financial risk / reduces financial flexibility $32 - $37, depending on leverage, financial projection assumptions, IRR targets and level of management promote Realize strategic value for stockholders Potential synergies may facilitate attractive valuation Limited universe of strategic buyers with both an appetite and financial capability Potential for premium valuation depending on third-party interest Uncertain interest level, but ongoing discussions Note: Illustrative value ranges to be considered in conjunction with detailed analysis and sensitivities contained herein. (1) Based on consolidated DCF. Recapitalization / Repurchase / Special Dividend Preliminary Review of Selected Alternatives Implement Strategic Plan Leveraged Buyout Corporate Merger / Sale of Company Separate Business Units |
 CONFIDENTIAL | PRELIMINARY ANALYSIS 16 4. Next Steps |
 17 CONFIDENTIAL | PRELIMINARY ANALYSIS D R A F T Next Steps Refine execution strategy around desirable alternatives, as appropriate Construct strategy with respect to external and internal communications Develop strategy for communicating with consortium / other bidders |
 CONFIDENTIAL | PRELIMINARY ANALYSIS 18 Appendix |
 CONFIDENTIAL | PRELIMINARY ANALYSIS 19 A. Supplemental Analysis |
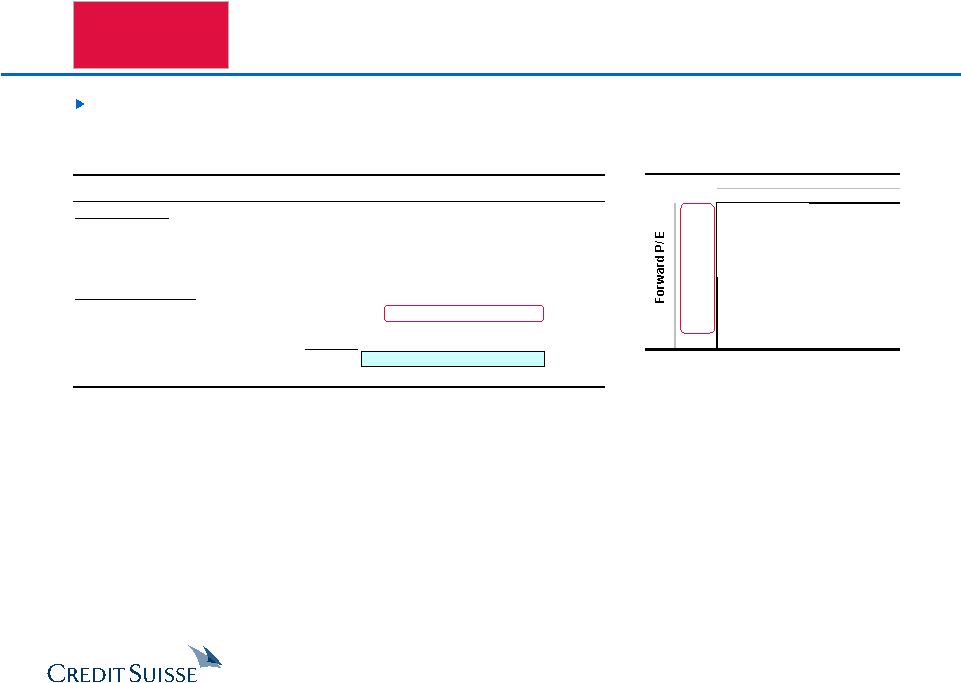 20 CONFIDENTIAL | PRELIMINARY ANALYSIS D R A F T Implement Strategic Plan Analysis assumes an estimate of Arrow’s share price discounted to September 2006 Illustrative Future Share Price Analysis These calculations are based upon management estimates of EPS growth rates and current public market trading multiples. These calculations do not purport to reflect the value of these securities or the prices at which securities actually may be sold. Calculations based upon estimates of future results are not necessarily indicative of actual future results, which may be significantly more or less favorable than those suggested by these calculations. ($ in millions, except per share data) '05 - '09 FYE 9/30, 2005A 2006E 2007E 2008E 2009E CAGR Management Case Revenue $10,963 $11,599 $12,222 $12,904 $13,624 5.6% % Growth 7.6% 5.8% 5.4% 5.6% 5.6% EPS $1.53 $1.62 $1.86 $2.16 $2.46 12.6% % Growth 12.5% 5.9% 14.8% 16.1% 13.9% Implied Value per Share Assumed Forward P/E Multiple 16.7x 16.7x 16.7x Implied Future Stock Price $36.07 $41.08 $46.26 PV Stock Price Status Quo @ 11.0% Cost of Equity (1) $28.11 $32.50 $33.33 $33.81 % Premium / (Discount) to Pre-Offer 15.6% 18.6% 20.3% (1) Based on beta of 0.67 from Barra; risk-free rate of 5.2%; size premium of 0.75% from Ibbotson 2005 yearbook. Sensitivity Analysis – Implied PV of 2008E Stock Price '05 - '09 EPS CAGR 11.6% 12.6% 13.6% 15.0x $28.89 $29.94 $31.02 (13.3%) (10.2%) (6.9%) 16.0x $30.82 $31.94 $33.09 (7.5%) (4.2%) (0.7%) 16.7x $32.17 $33.33 $34.53 (3.5%) 0.0% 3.6% 18.0x $34.67 $35.93 $37.22 4.0% 7.8% 11.7% 19.0x $36.60 $37.92 $39.29 9.8% 13.8% 17.9% Note:Arrow's historical 3-year averageforward P/E multipleis 17.1x. Note: Percentages reflect premium / (discount) to management's plan. |
 21 CONFIDENTIAL | PRELIMINARY ANALYSIS D R A F T A spin-off of AUCA could be a tax-efficient alternative to a straight sale. Stockholders could benefit from pure-play economics Assumes spin-off is effective September 2006 Multiples have been adjusted versus June 2 meeting to reflect current valuation Separate Business Units Spin-Off AUCA Implied Effective Value – Consolidated Pro Forma Stand-alone Business Unit Financials Implied Effective Value – By Segment Note: Percentages below per share values represent accretion / (dilution) to pre-offer Arrow share price of $28.11. 7.1x multiple equates to comparable company trading multiple adjusted for management’s projections. Note: Percentages below per share values represent segment’s contribution to overall share price. 7.1x multiple equates to comparable company trading multiple adjusted for management’s projections. ($ in milliions) FYE 9/30, 2006E 2007E FSS Standalone Revenue $9,969.8 $10,508.9 % Growth 6.0% 5.4% EBITDA (1) $748.2 $799.8 % Margin 7.5% 7.6% Debt / EBITDA (1) 2.2x – AUCA Standalone Revenue $1,629.5 $1,713.2 % Growth 4.9% 5.1% EBITDA (1) $205.6 $224.8 % Margin 12.6% 13.1% Debt / EBITDA (1) 2.2x – Source: Management estimates provided to CS on May 25, 2006. (1) Assumes 100% of corporate overhead and debt allocated based on EBITDA contribution PF Trading Multiple of FSS '07E EBITDA 6.5x 7.0x 8.5x $25.05 $27.20 $33.64 (10.9%) (3.2%) 19.7% $26.26 $28.41 $34.84 (6.6%) 1.1% 24.0% $27.47 $29.61 $36.05 (2.3%) 5.3% 28.2% 8.5x 7.5x 6.5x Multiple of AUCA '07E EBITDA Multiple of FSS '07E EBITDA AUCA Midpoint 7.5x FSS Midpoint 7.0x $19.83 $5.63 75.5% 20.7% $21.83 $6.58 76.9% 23.1% $27.92 $7.54 80.1% 25.4% 6.5x 7.5x 8.5x 6.5x 7.0x 8.5x nd |
 22 CONFIDENTIAL | PRELIMINARY ANALYSIS D R A F T While a sale of AUCA would provide significant cash proceeds to Arrow, it would also res ult in significant tax leakage under most sale structures. Small group of possible strategic buyers CS believes an auction would garner significant financial sponsor interest Key Assumptions Transaction close of September 2006 AUCA is sold for 9.0x – 11.5x LTM EBITDA Tax basis of $960 million (based on management estimates) Proceeds used to pay down debt (alternative uses could include share buyback) Illustrative Analysis of Proceeds Estimated Value to Arrow Stockholders Separate Business Units Divest AUCA Note: Percentages below per share values represent accretion / (dilution) to pre-offer Arrow share price of $28.11. 7.1x multiple equates to comparable company trading multiple adjusted for management’s projections. ($ in millions) LOW HIGH Potential Sale of AUCA $1,969 – $2,516 Assumed Tax Basis 960 Gain on Sale $1,009 – $1,556 Cash Taxes (at 37.5%) 378 – 584 Net Cash Proceeds to Arrow $1,591 – $1,933 Implied Effective Multiple 7.3x – 8.8x PF Multiples of Arrow '07E EBITDA 6.5x 7.0x 8.5x 9.00x $25.26 $27.37 $33.70 (10.1%) (2.6%) 19.9% 10.25x $25.72 $27.83 $34.16 (8.5%) (1.0%) 21.5% 11.50x $26.18 $28.29 $34.62 (6.9%) 0.6% 23.1% |
 23 CONFIDENTIAL | PRELIMINARY ANALYSIS D R A F T CS believes Arrow may be able to perform a stock repurchase via a debt issuance, increasing leverage to 2.5x - 4.5x EBITDA. CS believes Arrow may be able to increase leverage to approximately 2.5x EBITDA while maintaining its investment grade rating CS believes leverage of 4.5x EBITDA could be achieved in the current market without the market viewing Arrow as “over-levered” Analysis of Share Repurchase Recapitalization / Repurchase Pro Forma Ownership @ 4.5x Leverage (shares in millions) Current Participates Pro Rata Does Not Participate Joseph Neubauer A Shares 23.8 14.3 23.8 B Shares 0.0 0.0 0.0 Total Shares 23.8 14.4 23.8 Economic Interest 13.3% 13.3% 22.0% Voting Interest 33.7% 33.7% 48.4% Public Float 67.2% 67.2% 60.4% Note: Assumes shares repurchased at $34.00 per share. Pro Forma Ownership @ 2.5x Leverage (shares in millions) Current Participates Pro Rata Does Not Participate Joseph Neubauer A Shares 23.8 21.7 23.8 B Shares 0.0 0.0 0.0 Total Shares 23.8 21.7 23.8 Economic Interest 13.3% 13.3% 14.6% Voting Interest 33.7% 33.7% 36.1% Public Float 67.2% 67.2% 66.2% Note: Assumes shares repurchased at $34.00 per share. ($ in millions, except per share data) Repurchase Price per Share Repurchase Price per Share $32.00 $34.00 $36.00 $32.00 $34.00 $36.00 % Premium 13.8% 21.0% 28.1% 13.8% 21.0% 28.1% Pro Forma LTM Credit Statistics Status Quo (1) Debt / EBITDA 2.0x 2.5x 2.5x 2.5x 4.5x 4.5x 4.5x Transaction Overview New Debt Issued $548 $548 $548 $2,483 $2,483 $2,483 Shares Repurchased (MM) 16.7 15.7 14.9 75.6 71.2 67.2 % of Basic Shares Outstanding 9.3% 8.8% 8.3% 42.2% 39.7% 37.5% Financing Rate (2) 7.39% 7.39% 7.39% 7.42% 7.42% 7.42% Total Effective Value per Share $31.49 $31.50 $31.50 $31.85 $31.88 $31.90 % Premium to Pre-Offer Price 12.0% 12.1% 12.1% 13.3% 13.4% 13.5% Note: Analysis based on management estimates provided to CS on May 25, 2006, Arrow pre-offer stock price of $28.11 and 179 million basic shares outstanding. (1) Assumes debt balance at the end of FY2006 of $1,869.5 million and leverage multiple based on 6/30/06E LTM adjusted EBITDA of $967.1 million (per management estimates). (2) Assumes financing rates of L + 1.75% on new bank debt and 7.50% on new senior unsecured notes. |
 24 CONFIDENTIAL | PRELIMINARY ANALYSIS D R A F T Average Value Received in Repurchase Effective Value per Share ($ in millions) LTM Projected Fiscal Year Ending September 30, 09/30/06 2007 2008 2009 2010 2011 Revenues $11,599 $12,222 $12,904 $13,624 $14,378 $15,162 Adjusted Net Income – $215.3 $263 $313 $363 $421 Adjusted EPS – $1.97 $2.42 $2.88 $3.35 $3.88 % Accretion / (Dilution) – 5.7% 12.2% 17.2% 20.8% 24.0% P/E Multiple 15.5x 15.5x 15.5x 15.5x 15.5x NA PV Implied Price per Share (1) $30.48 $33.84 $36.28 $37.93 $39.61 NA $13.50 $13.50 $13.50 $13.50 $13.50 $13.50 Residual Value of Arrow Equity 18.38 20.40 21.87 22.87 23.88 NA Effective Value per Share $31.88 $33.90 $35.37 $36.37 $37.38 NA Analysis of Share Repurchase (cont’d) Recapitalization / Repurchase Projected Share Price and Value per Share at Total Leverage of 4.5x EBITDA Projected Share Price and Value per Share at Total Leverage of 2.5x EBITDA Note: These calculations are based upon management estimates of EPS growth rates and current public market trading multiples. These calculations do not purport to reflect the value of these securities or the prices at which securities actually may be sold. Calculations based upon estimates of future results are not necessarily indicative of actual future results, which may be significantly more or less favorable than those suggested by these calculations. (1) Analysis assumes implied price per share discounted to present value at cost of equity of 11.0%. Average Value Received in Repurchase Effective Value per Share ($ in millions) LTM Projected Fiscal Year Ending September 30, 09/30/06 2007 2008 2009 2010 2011 Revenues $11,599 $12,222 $12,904 $13,624 $14,378 $15,162 Adjusted Net Income – $308.9 $361 $416 $471 $534 Adjusted EPS – $1.87 $2.20 $2.53 $2.87 $3.25 % Accretion / (Dilution) – 0.6% 2.0% 3.0% 3.6% 4.0% P/E Multiple 16.7x 16.7x 16.7x 16.7x 16.7x NA PV Implied Price per Share (1) $31.26 $33.14 $34.35 $35.05 $35.80 NA $2.98 $2.98 $2.98 $2.98 $2.98 $2.98 Residual Value of Arrow Equity 28.52 30.24 31.34 31.98 32.66 NA Effective Value per Share $31.50 $33.22 $34.32 $34.96 $35.65 NA |
 25 CONFIDENTIAL | PRELIMINARY ANALYSIS D R A F T Share Repurchase Funding Alternatives Recapitalization / Repurchase The issuance of traditional debt is the most common funding source for large share repurchases. Opportunity to re-lever the balance sheet Credit spreads remain at historical lows with large investor appetite for quality stories A leveraged recapitalization can be achieved with historically high leverage multiples without negatively impacting equity share price Share repurchase funded with a convertible security is a viable alternative to a traditional debt-funded repurchase. Repurchase shares at lower price than conversion price on convertible May be more accretive to EPS than straight debt funding alternative In the event Mr. Neubauer elects not to participate in repurchase, a convert may mitigate accretion in his voting position Can be structured to provide equity credit from a ratings perspective Convertible Debt Traditional Debt |
 26 CONFIDENTIAL | PRELIMINARY ANALYSIS D R A F T ($ in millions) Spread / x of LTM Sources Amount % Int. Rate Adj. EBITDA Uses Amount % Excess Cash $0.0 0% – 0.00x Equity Purchase Price @ $35 per Share $6,455.2 74% Term Loan B $3,143.2 36% 2.25% 3.25x Refinance Term Loan B 1,619.5 18% A/R Securitization Facility 225.0 3% 1.00% 0.23x Rollover A/R Securitization Facility 225.0 3% 5.0% Notes due 2012 250.0 3% 5.00% 0.26x Rollover 5.00% Notes 250.0 3% Senior Unsecured Notes 846.3 10% 9.00% 0.88x Est. Prepayment Penalties 8.9 0% Senior Toggle Notes 846.3 10% 9.75% 0.88x Transaction Expenses 200.0 2% Senior Sub. Notes 1,208.9 14% 10.25% 1.25x Holdco PIK 250.4 3% 12.50% 0.26x Total Debt $6,770.0 77% – 7.00x Sponsors' Equity 1,988.6 23% – – Total Sources $8,758.6 100% – – Total Uses $8,758.6 100% Note: Leverage multiple based on 6/30/06E LTM adjusted EBITDA of $967.1 million (per management estimates). Preliminary LBO Analysis: Management Case (7.0x Leverage @ $35) Sources and Uses Financial Summary Leveraged Buyout ($ in millions) LTM Projected Fiscal Year Ending September 30, 09/30/06 2007 2008 2009 2010 2011 Revenues $11,599 $12,222 $12,904 $13,624 $14,378 $15,162 % Growth -- 5.4% 5.6% 5.6% 5.5% 5.5% EBITDA $982 $1,025 $1,097 $1,165 $1,242 $1,313 % Margin 8.5% 8.4% 8.5% 8.5% 8.6% 8.7% Balance Sheet Summary Cash $44 $44 $44 $44 $44 $44 Bank Debt $3,143 $3,038 $2,886 $2,762 $2,546 $2,276 Total Debt $6,770 $6,696 $6,580 $6,495 $6,323 $6,104 Cumulative Debt Paid Down 1.1% 2.8% 4.1% 6.6% 9.8% Credit Statistics Summary Senior Debt / EBITDA 3.2x 3.0x 2.6x 2.4x 2.0x 1.7x Total Debt / EBITDA 6.9x 6.5x 6.0x 5.6x 5.1x 4.6x EBITDA / Int. Exp. 1.8x 1.8x 2.0x 2.2x 2.3x 2.6x Source: Management estimates provided to CS on May 25, 2006. |
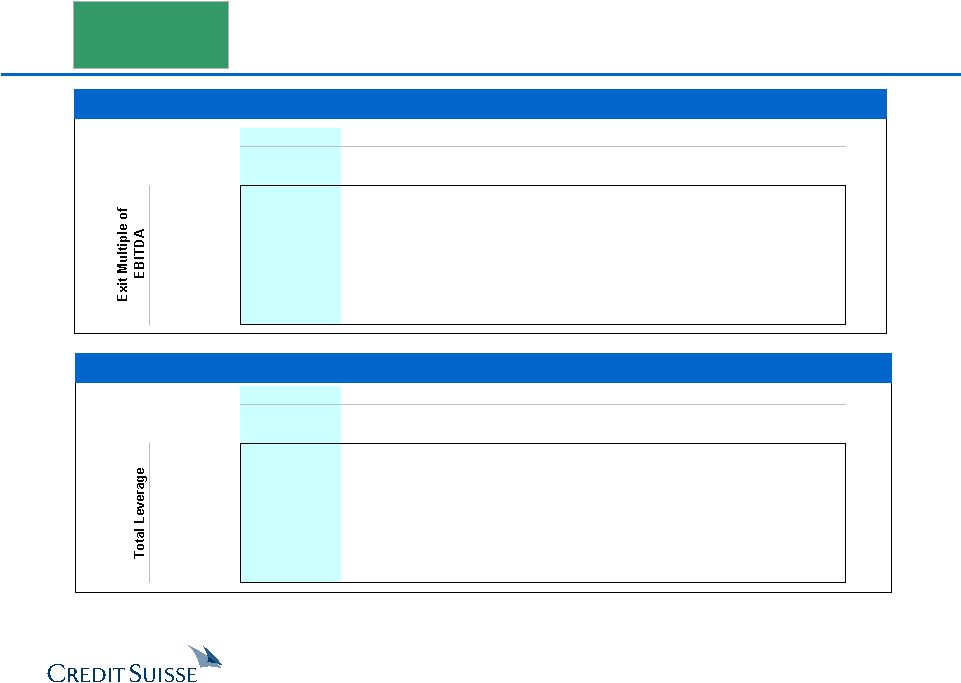 27 CONFIDENTIAL | PRELIMINARY ANALYSIS D R A F T Purchase Price vs. Exit Multiple @ 7.0x Leverage Purchase Price vs. Leverage Note: Assumes 5-year return and total leverage at close of 7.0x 6/30/06E LTM adjusted EBITDA. Excludes management promote. Note: Assumes 5-year return and exit multiple of 8.5x FY11E EBITDA. Excludes management promote. A promote of 17.5% of diluted equity impacts original equity IRRs by approximately 350 to 400 bps. Illustrative LBO Return Sensitivity Analysis: Management Case Leveraged Buyout Premium to Pre-Bid 13.8% 21.0% 24.5% 28.1% 31.6% 35.2% Implied Offer Price $32.00 $34.00 $35.00 $36.00 $37.00 $38.00 Entry '06E EBITDA x 8.1x 8.5x 8.7x 8.9x 9.0x 9.2x 7.5x 21.8% 16.1% 13.7% 11.7% 9.8% 8.1% 8.0x 25.8% 19.9% 17.4% 15.3% 13.4% 11.6% 8.5x 29.3% 23.2% 20.7% 18.5% 16.5% 14.7% 9.0x 32.5% 26.2% 23.7% 21.4% 19.4% 17.5% 9.5x 35.4% 29.0% 26.4% 24.1% 22.0% 20.1% Premium to Pre-Bid 13.8% 21.0% 24.5% 28.1% 31.6% 35.2% Implied Offer Price $32.00 $34.00 $35.00 $36.00 $37.00 $38.00 Entry '06E EBITDA x 8.1x 8.5x 8.7x 8.9x 9.0x 9.2x 6.45x 24.7% 20.2% 18.3% 16.6% 15.0% 13.6% 6.50x 25.0% 20.5% 18.5% 16.8% 15.2% 13.7% 6.75x 27.0% 21.8% 19.6% 17.6% 15.8% 14.2% 7.00x 29.3% 23.2% 20.7% 18.5% 16.5% 14.7% 7.25x 32.3% 25.0% 22.1% 19.6% 17.3% 15.3% |
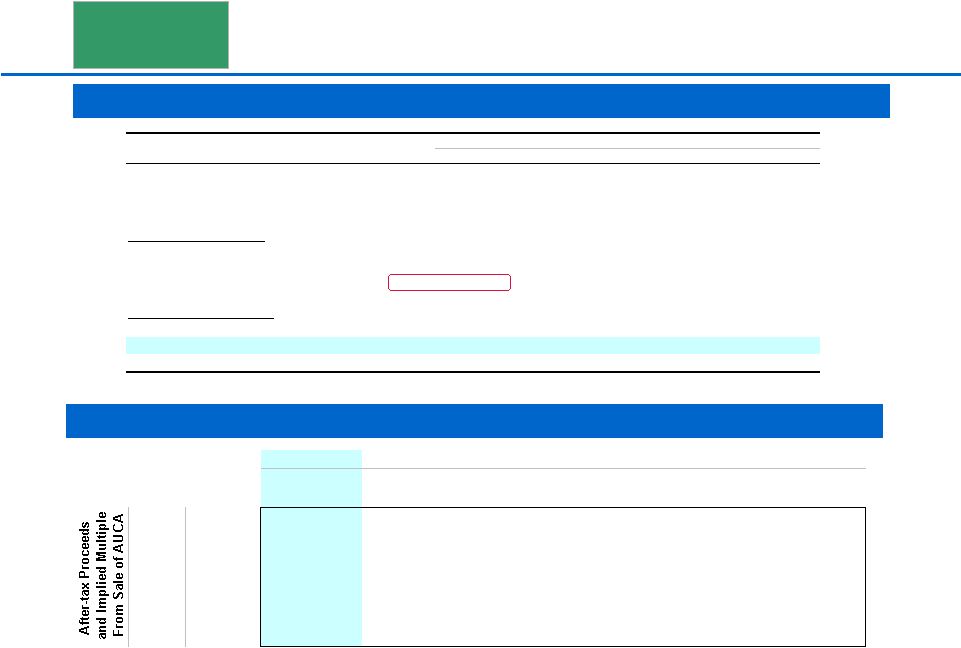
 28 CONFIDENTIAL | PRELIMINARY ANALYSIS D R A F T LBO Analysis with Sale of AUCA: Management Case While a sale of AUCA would provide significant cash proceeds to Arrow, it would also result in significant tax leakage under most sale structures. Small group of possible strategic buyers CS believes that an auction would garner significant financial sponsor interest Key Assumptions CS has assumed a sale of AUCA one year after the close of the LBO with proceeds used to pay down debt Use of management’s financial projections AUCA is sold for 9.0x – 11.5x LTM EBITDA Tax basis of $960 million (based on management estimates) Total leverage available at close of 7.0x 6/30/06 LTM EBITDA Leveraged Buyout Divest AUCA ($ in millions) 2007E EBITDA $239 Sale Multiple 9.00x 10.25x 11.50x Proceeds $2,148 $2,447 $2,745 Tax Basis 960 960 960 Gain 1,188 1,487 1,785 Tax on Gain (37.5%) 446 557 669 After-Tax Proceeds $1,703 $1,889 $2,076 |
 29 CONFIDENTIAL | PRELIMINARY ANALYSIS D R A F T LBO Analysis with Sale of AUCA: Management Case Financial Summary Purchase Price vs. Sale Proceeds of AUCA Note: Assumes AUCA divestiture at 10.25x FY07E EBITDA, 5-year return, 7.0x leverage and exit multiple of 8.5x FY11E EBITDA. Leveraged Buyout Premium to Pre-Bid 13.8% 21.0% 24.5% 28.1% 31.6% 35.2% Implied Offer Price $32.00 $34.00 $35.00 $36.00 $37.00 $38.00 Entry '06E EBITDA x 8.1x 8.5x 8.7x 8.9x 9.0x 9.2x 9.00x $1,703 26.1% 20.1% 17.7% 15.6% 13.6% 11.9% 9.50x $1,777 26.6% 20.6% 18.2% 16.0% 14.1% 12.3% 10.25x $1,889 27.3% 21.3% 18.9% 16.7% 14.7% 13.0% 11.00x $2,001 28.0% 22.0% 19.5% 17.4% 15.4% 13.6% 11.50x $2,076 28.5% 22.5% 20.0% 17.8% 15.8% 14.0% ($ in millions) LTM Projected Fiscal Year Ending September 30, 09/30/06 2007 2008 2009 2010 2011 Revenues $11,599 $12,222 $11,114 $11,754 $12,423 $13,120 % Growth -- 5.4% (9.1%) 5.8% 5.7% 5.6% EBITDA $982 $1,025 $858 $912 $975 $1,033 % Margin 8.5% 8.4% 7.7% 7.8% 7.8% 7.9% Balance Sheet Summary Cash $44 $44 $44 $44 $44 $44 Bank Debt $3,143 $1,152 $969 $813 $570 $276 Total Debt $6,770 $4,810 $4,662 $4,546 $4,348 $4,104 Cumulative Debt Paid Down 29.0% 31.1% 32.8% 35.8% 39.4% Credit Statistics Summary Senior Debt / EBITDA (1) 3.2x 1.4x 1.1x 0.9x 0.6x 0.3x Total Debt / EBITDA (1) 6.9x 6.0x 5.4x 5.0x 4.5x 4.0x EBITDA / Int. Exp. 1.7x 2.0x 2.1x 2.4x 2.6x 2.9x Source: Management estimates provided to CS on May 25, 2006. (1) Credit statistics are pro forma for the sale of AUCA beginning in 2007. |
 30 CONFIDENTIAL | PRELIMINARY ANALYSIS D R A F T Consortium Proposal – Estimated Sources & Uses The sources and uses table below is based on CS’s current understanding of the consortium’s proposed financing arrangement CS has performed an LBO analysis using estimated “Consortium Projections” that represent the midpoint between the consortium’s bank case and management’s projections Actual consortium “base case” could be higher or lower Returns are based on the financing structure outlined above A sensitivity is performed assuming a sale of AUCA one year after closing Leveraged Buyout Preliminary Sources & Uses ($ in millions) Spread / x of LTM Sources Amount % Int. Rate Adj. EBITDA Uses Amount % Excess Cash $0.0 0% – 0.0x Equity Purchase Price $5,886.9 72% Term Loan B $3,615.0 44% 2.50% 3.7x Refinance Term Loan B 1,528.0 19% 5.0% Notes due 2012 250.0 3% 5.00% 0.3x Refinance 5.0% Notes due 2012 250.0 3% Senior Unsecured Notes 835.0 10% 8.25% 0.9x Refinance A/R Securitization Facility 225.0 3% Senior Toggle Notes 835.0 10% 8.75% 0.9x Est. Prepayment Penalties 7.2 0% Senior Subordinated Notes 480.0 6% 10.00% 0.5x Transaction Expenses 264.9 3% A/R Securitization Facility 225.0 3% 1.00% 0.2x Total Debt $6,240.0 76% – 6.5x Management's Contribution (1) 288.3 4% – – Sponsors' Equity 1,633.7 20% – – Total Equity 1,922.0 24% Total Sources $8,162.0 100% – – Total Uses $8,162.0 100% Note: Leverage multiple based on 6/30/06E LTM adjusted EBITDA of $967.1 million (per management estimates). (1) Excludes management's promote. |
 31 CONFIDENTIAL | PRELIMINARY ANALYSIS D R A F T LBO Analysis: Consortium Case Leveraged Buyout Financial Summary Purchase Price vs. Exit Multiple Purchase Price vs. Leverage Note: Assumes consortium leverage of 6.45x 6/30/06 EBITDA. Excludes management promote. A promote of 17.5% of diluted equity impacts original equity IRRs by approximately 350 to 400 bps. Premium to Pre-Bid 13.8% 21.0% 24.5% 28.1% 31.6% 35.2% Implied Offer Price $32.00 $34.00 $35.00 $36.00 $37.00 $38.00 Entry '06E EBITDA x 8.0x 8.4x 8.6x 8.8x 9.0x 9.2x 7.5x 15.9% 11.8% 10.0% 8.4% 6.9% 5.5% 8.0x 19.4% 15.1% 13.3% 11.6% 10.1% 8.7% 8.5x 22.5% 18.1% 16.2% 14.5% 12.9% 11.5% 9.0x 25.3% 20.8% 18.9% 17.1% 15.5% 14.0% 9.5x 27.9% 23.3% 21.3% 19.5% 17.9% 16.4% Premium to Pre-Bid 13.8% 21.0% 24.5% 28.1% 31.6% 35.2% Implied Offer Price $32.00 $34.00 $35.00 $36.00 $37.00 $38.00 Entry '06E EBITDA x 8.0x 8.4x 8.6x 8.8x 9.0x 9.2x 6.00x 20.1% 16.5% 15.0% 13.5% 12.2% 10.9% 6.25x 21.3% 17.4% 15.6% 14.0% 12.6% 11.2% 6.45x 22.5% 18.1% 16.2% 14.5% 13.0% 11.5% 6.75x 24.7% 19.5% 17.3% 15.4% 13.6% 12.0% 7.00x 27.0% 20.9% 18.4% 16.3% 14.3% 12.5% ($ in millions) LTM Projected Fiscal Year Ending September 30, 09/30/06 2007 2008 2009 2010 2011 Revenues $11,614 $12,205 $12,839 $13,508 $14,204 $14,927 % Growth -- 5.1% 5.2% 5.2% 5.2% 5.1% EBITDA $981 $1,025 $1,084 $1,141 $1,207 $1,270 % Margin 8.4% 8.4% 8.4% 8.4% 8.5% 8.5% Balance Sheet Summary Cash $44 $44 $44 $44 $44 $44 Bank Debt $3,640 $3,536 $3,383 $3,304 $3,144 $2,940 Total Debt $6,240 $6,136 $5,983 $5,904 $5,744 $5,540 Cumulative Debt Paid Down 1.7% 4.1% 5.4% 8.0% 11.2% Credit Statistics Summary Senior Debt / EBITDA 3.7x 3.5x 3.1x 2.9x 2.6x 2.3x Total Debt / EBITDA 6.4x 6.0x 5.5x 5.2x 4.8x 4.4x EBITDA / Int. Exp. 1.9x 2.0x 2.1x 2.3x 2.4x 2.6x Source: CS estimates. |
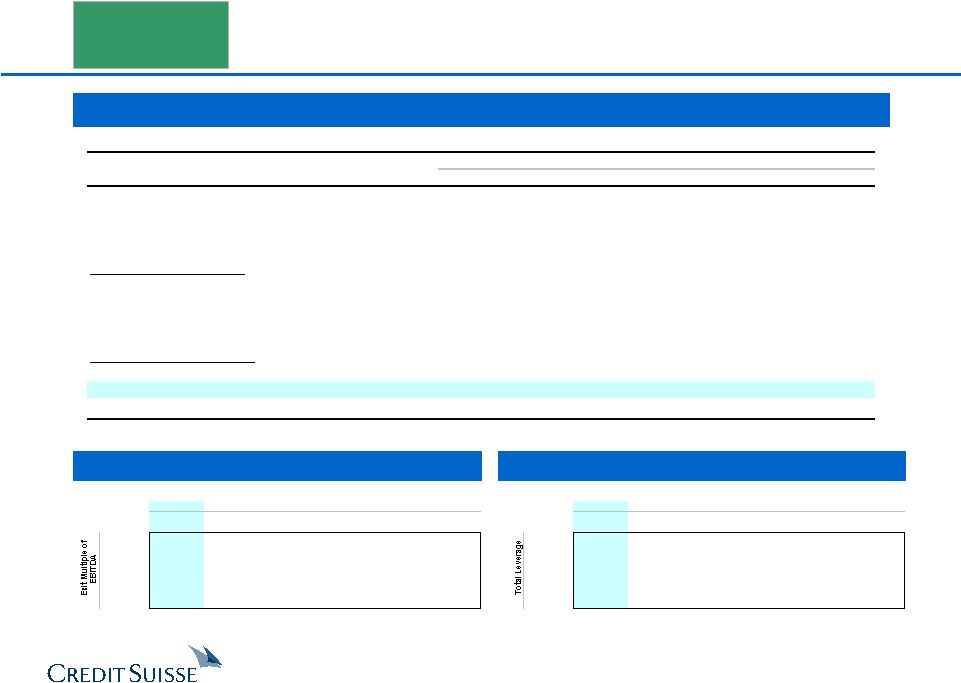
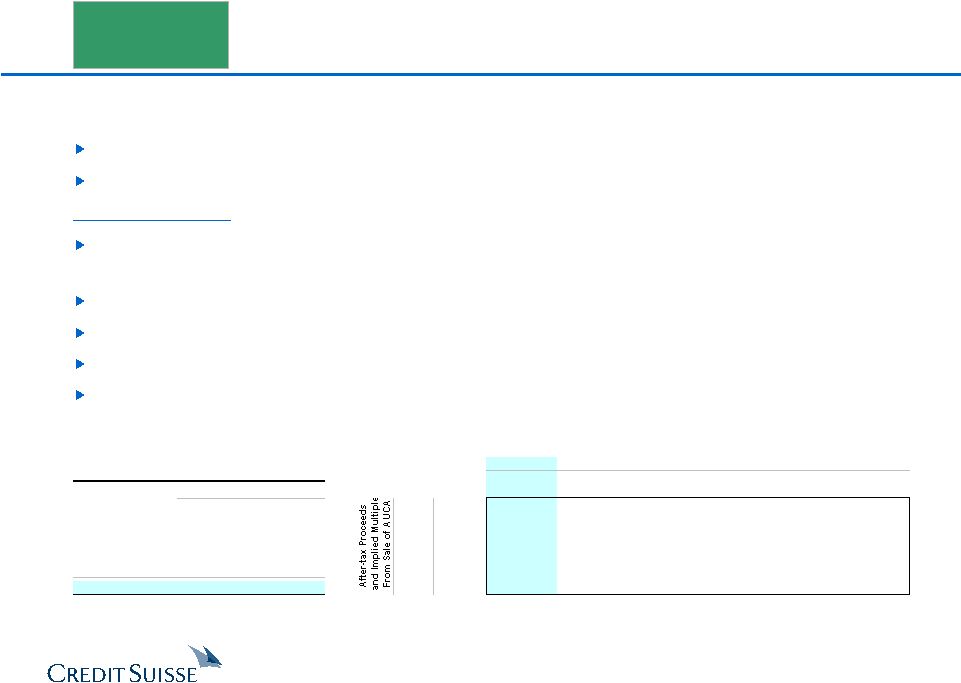 32 CONFIDENTIAL | PRELIMINARY ANALYSIS D R A F T LBO Analysis with Sale of AUCA: Consortium Case While a sale of AUCA would provide significant cash proceeds to Arrow, it would also result in significant tax leakage under most sale structures. Small group of possible strategic buyers CS believes that an auction would garner significant financial sponsor interest Key Assumptions CS has assumed a sale of AUCA one year after the close of the LBO with proceeds used to pay down debt Use of CS estimates of consortium financial projections AUCA is sold for 9.0x – 11.5x LTM EBITDA Tax basis of $960 million (based on management estimates) Total leverage available at close of 6.45x 6/30/06 LTM EBITDA Leveraged Buyout Divest AUCA ($ in millions) 2007E EBITDA $225 Sale Multiple 9.00x 10.25x 11.50x Proceeds $2,023 $2,304 $2,585 Tax Basis 960 960 960 Gain 1,063 1,344 1,625 Tax on Gain (37.5%) 399 504 610 After-Tax Proceeds $1,625 $1,800 $1,976 Premium to Pre-Bid 13.8% 21.0% 24.5% 28.1% 31.6% 35.2% Implied Offer Price $32.00 $34.00 $35.00 $36.00 $37.00 $38.00 Entry '06E EBITDA x 8.0x 8.4x 8.6x 8.8x 9.0x 9.2x 9.00x $1,625 19.7% 15.4% 13.5% 11.9% 10.3% 8.9% 9.50x $1,695 20.1% 15.8% 13.9% 12.3% 10.7% 9.3% 10.25x $1,800 20.7% 16.4% 14.5% 12.9% 11.3% 9.9% 11.00x $1,906 21.4% 17.0% 15.1% 13.4% 11.9% 10.4% 11.50x $1,976 21.8% 17.4% 15.5% 13.8% 12.3% 10.8% |
 33 CONFIDENTIAL | PRELIMINARY ANALYSIS D R A F T Merger Consequences – Compass Acquires Arrow Source: Compass estimates based on Investext equity research. (1) Based on management estimates of $171 million. (2) Excludes amortization of identifiable assets resulting from transaction. (3) Acquiror total and net debt include convertible debt and capitalized leases. Note: Assumes transaction closes 9/30/06; interest rate of 8.0% and 8.5% on new debt in 50% cash / 50% stock scenario and 100% cash scenario, respectively. identifiable intangibles of 15% of excess purchase price amortized over 10 years. Compass could pursue a rights offering to mitigate pro forma acquisition debt. Compass FYE as of September 30. ($ in millions) 100% Cash / 0% Stock 50% Cash / 50% Stock Acquisition Price / Share Acquisition Price / Share $35.00 $38.00 $40.00 $35.00 $38.00 $40.00 Premium to Current (6/23/06) 6.3% 15.4% 21.5% 6.3% 15.4% 21.5% Equity Value $6,455 $7,032 $7,610 $6,455 $7,032 $7,610 Enterprise Value $8,302 $8,879 $9,457 $8,302 $8,879 $9,457 Multiple of 2006E EBITDA 8.7x 9.3x 9.9x 8.7x 9.3x 9.9x Pro Forma Compass Ownership 100.0% 100.0% 100.0% 75.7% 74.1% 72.6% Pro Forma Arrow Ownership – – – 24.3% 25.9% 27.4% FY2007E Pro Forma EPS Excluding Synergies $0.23 $0.21 $0.19 $0.24 $0.23 $0.22 $ Accretion / (Dilution) (0.05) (0.07) (0.09) (0.04) (0.05) (0.06) % Accretion / (Dilution) (17.4%) (24.2%) (31.0%) (12.7%) (17.3%) (21.8%) Pre-Tax Synergies Required to Break-Even $152 $211 $270 $148 $207 $265 % Accretion / (Dilution) with $171MM of Synergies (1) 2.2% (4.6%) (11.4%) 2.0% (3.0%) (7.8%) PF Cash EPS % Accretion / (Dilution) Excluding Synergies (2) (5.3%) (11.1%) (16.9%) (3.7%) (7.8%) (11.7%) PF Cash EPS % Accretion / (Dilution) with $171MM of Synergies (1)(2) 14.3% 8.5% 2.7% 11.0% 6.5% 2.3% FY2008E Pro Forma EPS Excluding Synergies $0.29 $0.27 $0.25 $0.29 $0.27 $0.26 $ Accretion / (Dilution) (0.02) (0.04) (0.06) (0.03) (0.04) (0.05) % Accretion / (Dilution) (7.5%) (13.8%) (20.1%) (8.3%) (12.9%) (17.3%) Pre-Tax Synergies Required to Break-Even $70 $129 $188 $105 $167 $230 % Accretion / (Dilution) with $171MM of Synergies (1) 10.8% 4.5% (1.9%) 5.2% 0.3% (4.4%) PF Cash EPS % Accretion / (Dilution) Excluding Synergies (2) 3.8% (1.6%) (7.0%) 0.0% (4.1%) (8.1%) PF Cash EPS % Accretion / (Dilution) with $171MM of Synergies (1)(2) 22.0% 16.6% 11.2% 13.5% 9.0% 4.8% Preliminary Credit Analysis Stand-Alone Total Debt (3) / LTM EBITDA 2.0x 4.8x 5.1x 5.4x 3.4x 3.5x 3.7x Total Debt (3) / Book Capitalization 38.9% 72.7% 73.8% 74.7% 51.5% 51.4% 51.4% |
 34 CONFIDENTIAL | PRELIMINARY ANALYSIS D R A F T Merger Consequences – Sodexho Acquires Arrow Source: Sodexho estimates based on Investext equity research. (1) Based on management estimates of $171 million. (2) Excludes amortization of identifiable assets resulting from transaction. (3) Acquiror total and net debt include convertible debt and capitalized leases. Note: Assumes transaction closes 9/30/06; interest rate of 8.0% and 8.5% on new debt in 50% cash / 50% stock scenario and 100% cash scenario, respectively; identifiable intangibles of 15% of excess purchase price amortized over 10 years. Sodexho could pursue a rights offering to mitigate pro forma acquisition debt. Sodexho FYE as of August 31. ($ in millions) 100% Cash / 0% Stock 50% Cash / 50% Stock Acquisition Price / Share Acquisition Price / Share $35.00 $38.00 $40.00 $35.00 $38.00 $40.00 Premium to Current (6/23/06) 6.3% 15.4% 21.5% 6.3% 15.4% 21.5% Equity Value $6,455 $7,032 $7,610 $6,455 $7,032 $7,610 Enterprise Value $8,302 $8,879 $9,457 $8,302 $8,879 $9,457 Multiple of 2006E EBITDA 8.7x 9.3x 9.9x 8.7x 9.3x 9.9x Pro Forma Sodexho Ownership 100.0% 100.0% 100.0% 69.5% 67.6% 65.9% Pro Forma Arrow Ownership – – – 30.5% 32.4% 34.1% FY2007E Pro Forma EPS Excluding Synergies $2.11 $1.87 $1.63 $2.31 $2.15 $2.01 $ Accretion / (Dilution) (0.61) (0.85) (1.09) (0.41) (0.56) (0.71) % Accretion / (Dilution) (22.3%) (31.2%) (40.1%) (15.2%) (20.8%) (26.0%) Pre-Tax Synergies Required to Break-Even $148 $207 $266 $146 $205 $264 % Accretion / (Dilution) with $171MM of Synergies (1) 3.4% (5.5%) (14.4%) 2.5% (3.5%) (9.2%) PF Cash EPS % Accretion / (Dilution) Excluding Synergies (2) (6.5%) (14.1%) (21.6%) (4.3%) (9.2%) (14.0%) PF Cash EPS % Accretion / (Dilution) with $171MM of Synergies (1)(2) 19.2% 11.6% 4.0% 13.5% 8.0% 2.9% FY2008E Pro Forma EPS Excluding Synergies $2.82 $2.58 $2.34 $2.80 $2.63 $2.48 $ Accretion / (Dilution) (0.27) (0.51) (0.76) (0.30) (0.46) (0.62) % Accretion / (Dilution) (8.8%) (16.6%) (24.4%) (9.6%) (14.9%) (20.0%) Pre-Tax Synergies Required to Break-Even $66 $126 $185 $105 $168 $230 % Accretion / (Dilution) with $171MM of Synergies (1) 13.8% 5.9% (1.9%) 6.0% 0.3% (5.2%) PF Cash EPS % Accretion / (Dilution) Excluding Synergies (2) 5.1% (1.6%) (8.2%) 0.0% (4.8%) (9.3%) PF Cash EPS % Accretion / (Dilution) with $171MM of Synergies (1)(2) 27.7% 21.0% 14.3% 15.6% 10.4% 5.5% Preliminary Credit Analysis Stand-Alone Total Debt (3) / LTM EBITDA 2.3x 5.6x 5.9x 6.2x 3.8x 4.0x 4.1x Total Debt (3) / Book Capitalization 43.8% 79.3% 80.2% 81.0% 54.9% 54.7% 54.5% |
 35 CONFIDENTIAL | PRELIMINARY ANALYSIS D R A F T Acquisition Matrix ($ in millions, except per share figures) Pre-Bid (1) Offer Current Acquisition Price per Share $28.11 $32.00 $32.92 $34.00 $36.00 $38.00 $40.00 $42.00 $44.00 Premium to Current (06/23/06) (14.6%) (2.8%) – 3.3% 9.4% 15.4% 21.5% 27.6% 33.7% Premium to Pre-Announcement (04/28/06) – 13.8% 17.1% 21.0% 28.1% 35.2% 42.3% 49.4% 56.5% Fully-Diluted Shares Outstanding 183.8 192.4 192.4 192.4 192.4 192.4 192.4 192.4 192.4 Equity Value $5,167 $6,157 $6,335 $6,542 $6,927 $7,312 $7,697 $8,082 $8,467 Enterprise Value Adjustments 2,096 1,888 1,890 1,893 1,898 1,903 1,908 1,913 1,918 Enterprise Value $7,263 $8,046 $8,225 $8,435 $8,825 $9,215 $9,605 $9,995 $10,385 PF Buyer Adjustments (+) Estimated Option Premium Tax Shield $7 $27 $30 $33 $38 $44 $51 $58 $65 (–) Debt Prepayments (9) (9) (9) (9) (9) (9) (9) (9) (9) PF Buyer Enterprise Value $7,261 $8,064 $8,246 $8,459 $8,855 $9,251 $9,647 $10,044 $10,441 Enterprise Value / LTM EBITDA (3/31/06) $954 7.6x 8.4x 8.6x 8.8x 9.3x 9.7x 10.1x 10.5x 10.9x FY2006E EBITDA 976 7.4 8.2 8.4 8.6 9.0 9.4 9.8 10.2 10.6 FY2007E EBITDA 1,042 7.0 7.7 7.9 8.1 8.5 8.8 9.2 9.6 10.0 LTM EBIT (3/31/06) $626 11.6x 12.9x 13.1x 13.5x 14.1x 14.7x 15.3x 16.0x 16.6x FY2006E EBIT 638 11.4 12.6 12.9 13.2 13.8 14.5 15.1 15.7 16.3 FY2007E EBIT 682 10.7 11.8 12.1 12.4 12.9 13.5 14.1 14.7 15.2 Equity Value / LTM Net Income (3/31/06) $328 15.7x 18.7x 19.3x 19.9x 21.1x 22.3x 23.4x 24.6x 25.8x FY2006E Net Income 312 16.5 19.7 20.3 20.9 22.2 23.4 24.6 25.9 27.1 FY2007E Net Income 346 14.9 17.8 18.3 18.9 20.0 21.1 22.2 23.4 24.5 Source: Management estimates provided to CS on May 25, 2006 and public filings. Note: LTM and FY2006E EBITDA, EBIT and net income exclude non-cash FAS 123 and RSU corporate expenses of $22.0 million (per management estimates). FY2007E financials exclude $17.0 million. (1) Assumes exercisable options in the calculations of fully diluted shares outstanding and the enterprise value adjustment; Assumes debt as of 3/31/06. |
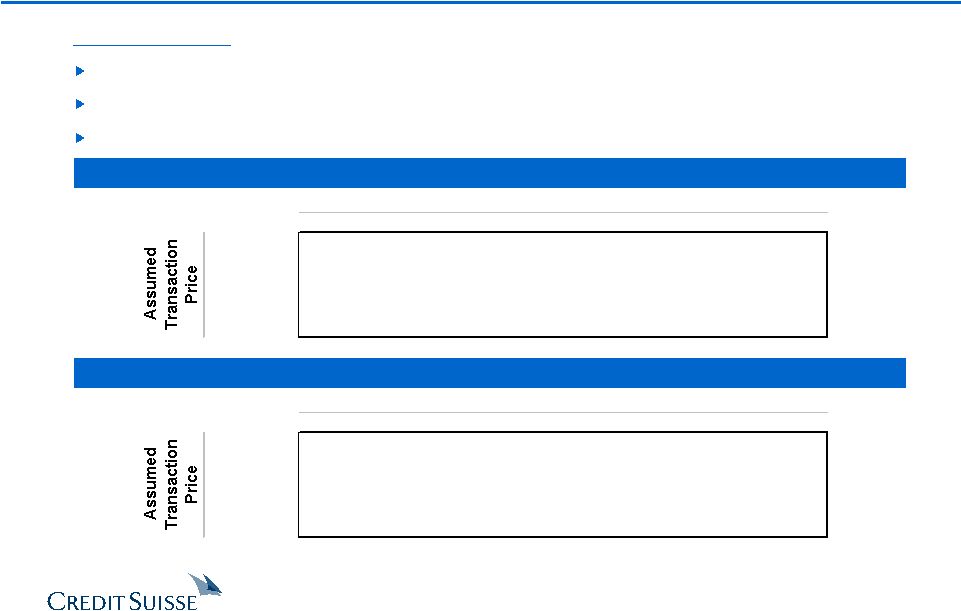 36 CONFIDENTIAL | PRELIMINARY ANALYSIS D R A F T Purchase Price vs. Transaction Price Note: Assumes 4 month holding period, leverage of 2:1 and annual interest rate of 5.75%. Note: Assumes $32 per share purchase price, leverage of 2:1 and annual interest rate of 5.75%. Highest price traded post announcement was $34.26. Key Assumptions Arbitrage Funds entered on May 1 Assumed leverage is 2:1 Annual interest of 5.75% Arbitrage Funds - Implied Annual Returns Holding Period vs. Transaction Price Estimated Holding Period (Months) 3.0 4.0 5.0 6.0 7.0 $34.00 83.9% 53.9% 40.6% 30.6% 24.0% $35.00 150.2% 94.2% 69.6% 52.9% 42.2% $36.00 232.9% 140.8% 101.8% 76.8% 61.3% $37.00 334.5% 194.4% 137.2% 102.5% 81.4% Arrow Purchase Price 194.4% $32.00 $32.50 $33.00 $33.50 $34.00 $34.00 53.9% 35.2% 18.6% 3.8% (9.3%) $35.00 94.2% 71.7% 51.6% 33.7% 17.7% $36.00 140.8% 114.1% 90.1% 68.7% 49.4% $37.00 194.4% 162.9% 134.7% 109.3% 86.4% |
 CONFIDENTIAL | PRELIMINARY ANALYSIS 37 B. Updated Preliminary Financial Analysis |
 38 CONFIDENTIAL | PRELIMINARY ANALYSIS D R A F T Management Financial Summary Arrow management provided CS with the financial forecast detailed above on May 25, 2006. ($ in millions) Historical Projected CAGR FYE 9/30, 2001 2002 2003 2004 2005 2006E 2007E 2008E 2009E 2010E 2011E '01A–'05A '05A–'11E Revenue FSS–United States $4,816 $5,625 $6,545 $6,879 $7,129 $7,456 $7,925 $8,375 $8,853 $9,349 $9,862 10.3% 5.6% % Growth 9.3% 16.8% 16.4% 5.1% 3.6% 4.6% 6.3% 5.7% 5.7% 5.6% 5.5% FSS–International $1,109 $1,201 $1,424 $1,830 $2,280 $2,513 $2,584 $2,739 $2,901 $3,074 $3,258 19.7% 6.1% % Growth 10.7% 8.2% 18.6% 28.6% 24.6% 10.2% 2.8% 6.0% 5.9% 6.0% 6.0% AUCA $1,434 $1,439 $1,479 $1,483 $1,554 $1,630 $1,713 $1,790 $1,870 $1,954 $2,042 2.0% 4.7% % Growth 0.6% 0.3% 2.8% 0.3% 4.8% 4.9% 5.1% 4.5% 4.5% 4.5% 4.5% Total Revenue $7,359 $8,264 $9,448 $10,192 $10,963 $11,599 $12,222 $12,904 $13,624 $14,378 $15,162 10.5% 5.6% % Growth 7.7% 12.3% 14.3% 7.9% 7.6% 5.8% 5.4% 5.6% 5.6% 5.5% 5.5% % Organic Growth 5.1% 1.7% 2.6% 5.7% 4.0% 5.8% 5.4% 5.6% 5.6% 5.5% 5.5% 3.5% 5.6% EBITDA FSS–United States $393 $469 $559 $562 $597 $637 $679 $728 $773 $825 $873 11.0% 6.6% % Margin 8.2% 8.3% 8.5% 8.2% 8.4% 8.5% 8.6% 8.7% 8.7% 8.8% 8.9% FSS–International $59 $67 $86 $104 $128 $160 $170 $183 $195 $208 $222 21.3% 9.6% % Margin 5.3% 5.6% 6.1% 5.7% 5.6% 6.3% 6.6% 6.7% 6.7% 6.8% 6.8% AUCA $202 $205 $204 $206 $213 $219 $239 $253 $268 $283 $297 1.4% 5.7% % Margin 14.1% 14.2% 13.8% 13.9% 13.7% 13.4% 13.9% 14.1% 14.3% 14.5% 14.5% Corporate ($24) ($30) ($40) ($40) ($37) ($61) ($63) ($67) ($71) ($74) ($79) 11.8% 13.5% Total EBITDA $630 $710 $809 $833 $900 $954 $1,025 $1,097 $1,165 $1,242 $1,313 9.4% 6.5% % Margin 8.6% 8.6% 8.6% 8.2% 8.2% 8.2% 8.4% 8.5% 8.5% 8.6% 8.7% Diluted EPS $1.00 $1.25 $1.34 $1.36 $1.53 $1.62 $1.86 $2.16 $2.46 $2.77 $3.13 10.1% 14.1% % Growth 15.1% 24.8% 7.2% 1.5% 12.5% 5.9% 14.8% 16.1% 13.9% 12.6% 13.0% Capex FSS–United States $96 $130 $174 $185 $168 $220 $222 $226 $239 $253 $267 15.0% 8.0% % of Revenue 2.0% 2.3% 2.7% 2.7% 2.4% 3.0% 2.8% 2.7% 2.7% 2.7% 2.7% FSS–International $29 $22 $35 $43 $63 $46 $55 $58 $62 $65 $69 21.4% 1.5% % of Revenue 2.6% 1.9% 2.5% 2.4% 2.8% 1.8% 2.1% 2.1% 2.1% 2.1% 2.1% AUCA $79 $71 $94 $101 $95 $88 $94 $98 $103 $108 $113 4.6% 3.0% % of Revenue 5.5% 4.9% 6.4% 6.8% 6.1% 5.4% 5.5% 5.5% 5.5% 5.5% 5.5% Asset Disposal – – – – ($9) ($9) ($8) ($8) ($8) ($9) ($9) Total Capex $204 $223 $303 $330 $317 $345 $363 $374 $395 $417 $440 11.6% 5.6% % of Revenue 2.8% 2.7% 3.2% 3.2% 2.9% 3.0% 3.0% 2.9% 2.9% 2.9% 2.9% Revenue Mix FSS–United States 65.4% 68.1% 69.3% 67.5% 65.0% 64.3% 64.8% 64.9% 65.0% 65.0% 65.0% FSS–International 15.1% 14.5% 15.1% 18.0% 20.8% 21.7% 21.1% 21.2% 21.3% 21.4% 21.5% AUCA 19.5% 17.4% 15.7% 14.5% 14.2% 14.0% 14.0% 13.9% 13.7% 13.6% 13.5% Source: Management estimates provided to CS on May 25, 2006. (1) $22 million of 2006E corporate overhead comprised of non-cash FAS 123 and RSU expenses. (1) |
 39 CONFIDENTIAL | PRELIMINARY ANALYSIS D R A F T Preliminary Selected Companies Analysis ($ in millions, except per share values) Share 2007E I/B/E/S LT Debt / Price as of Equity Enterprise EV / EBITDA EV / EBIT P/E Revenue EBITDA EBIT Growth LTM Dividend LTM Company 6/23/06 Value Value 2006E 2007E 2006E 2007E 2006E 2007E Growth Margin Margin Rate (1) EBITDA Yield Ratio ROIC (2) Arrow (Current) $32.92 $6,012 $8,064 8.5x 7.9x 11.7x 10.4x 20.1x 17.8x 7.3% 8.2% 6.2% 11.9% 2.2x 0.9% 16.7% 10.9% Arrow (Offer) $32.00 $5,836 $7,888 8.3x 7.7x 11.4x 10.2x 19.5x 17.3x 7.3% 8.2% 6.2% 11.9% 2.2x 0.9% 16.7% 10.9% Arrow (Pre-Offer) $28.11 $5,066 $7,118 7.5x 6.9x 10.3x 9.2x 17.1x 15.2x 7.3% 8.2% 6.2% 11.9% 2.2x 1.0% 16.7% 10.9% Food and Support Services Autogrill $14.83 $3,773 $5,004 7.9x 7.4x 12.4x 11.3x 20.3x 18.1x 4.8% 13.6% 8.9% 10.0% 2.0x 1.7% 39.1% 13.5% Centerplate (3) 13.30 300 481 8.7x 8.3x 17.9x 17.0x NM NM 3.6% 8.4% 4.1% 3.0% 4.0x 6.0% NA 6.0% Compass 4.66 10,041 12,250 9.1x 8.6x 13.3x 12.5x 22.7x 16.9x 4.6% 6.7% 4.6% 7.0% 1.9x 3.8% 51.6% 9.6% Elior (4) 13.74 1,972 2,371 7.7x 7.3x 10.9x 10.2x 15.1x 13.5x 5.8% 8.5% 6.0% NA 1.9x 1.2% 36.4% 10.8% Sodexho 45.70 7,337 8,727 9.2x 8.2x 12.2x 10.9x 19.4x 16.9x 4.7% 6.4% 4.8% 5.0% 2.3x 2.1% 74.6% 10.1% Mean 8.5x 8.0x 13.4x 12.4x 19.4x 16.3x 4.7% 8.7% 5.7% 6.3% 2.4x 2.9% 50.4% 10.0% Median 8.7x 8.2x 12.4x 11.3x 19.8x 16.9x 4.7% 8.4% 4.8% 6.0% 2.0x 2.1% 45.4% 10.1% Uniform and Career Apparel United States Cintas $39.71 $6,691 $7,078 9.7x 8.9x 12.5x 11.2x 19.7x 17.3x 11.0% 20.3% 16.1% 14.3% 0.9x 0.9% 18.9% 11.7% G&K Services 34.98 747 955 8.0x 7.3x 12.5x 10.8x 17.4x 15.3x 6.5% 13.8% 9.3% 13.2% 1.9x 0.2% 3.6% 6.5% Unifirst 31.60 609 798 6.8x 6.2x 11.1x 9.9x 16.0x 13.7x 6.6% 14.8% 9.2% 14.0% 1.7x 0.2% 7.3% 6.8% International Davis Service Group $8.30 $1,417 $1,809 4.6x 4.5x 11.1x 10.6x 13.3x 12.5x 2.8% 32.4% 13.6% 7.0% 1.5x 3.8% 26.0% 8.8% Rentokil 2.78 5,041 6,747 7.4x 7.0x 12.4x 11.5x 14.2x 13.0x 6.1% 20.3% 12.4% NA 2.4x 4.5% 38.8% 10.8% Mean 7.3x 6.8x 11.9x 10.8x 16.1x 14.4x 6.6% 20.3% 12.1% 12.1% 1.7x 1.9% 18.9% 8.9% Median 7.4x 7.0x 12.4x 10.8x 16.0x 13.7x 6.5% 20.3% 12.4% 13.6% 1.7x 0.9% 18.9% 8.8% Overall Mean 7.9x 7.4x 12.6x 11.6x 17.6x 15.2x 5.7% 14.5% 8.9% 9.2% 2.1x 2.4% 32.9% 9.5% Overall Median 7.9x 7.4x 12.4x 11.1x 17.4x 15.3x 5.3% 13.7% 9.0% 8.5% 1.9x 1.9% 36.4% 9.8% Source: I/B/E/S, Investext equity research and Company filings. Note: Multiples based on financial estimates calendarized to Arrow's fiscal year end of 9/30. (1) Based on I/B/E/S 5-year long-term growth rates. (2) Defined as net operating profit after taxes / total book capital. (3) Centerplate trades as an Income Deposit Security. (4) As of January 11, 2006, the day before Robert Zolade announced he was reviewing the possibility of opening his share capital to new investors. A cash tender was launched on March 27, 2006. |
 40 CONFIDENTIAL | PRELIMINARY ANALYSIS D R A F T Preliminary Selected Companies Analysis (cont’d) ($ in millions, except per share values) Arrow Multiple Range Implied Enterprise Value Performance Low – High Low – High Food and Support Services FY 2006E EBITDA $796 7.5x – 9.0x $5,971 – $7,165 FY 2007E EBITDA 849 7.0x – 8.5x 5,944 – 7,217 FY 2006E EBIT 529 10.0x – 12.5x 5,290 – 6,613 FY 2007E EBIT 567 9.0x – 12.0x 5,102 – 6,803 Segment Reference Range $5,800 – $6,900 Uniform and Career Apparel FY 2006E EBITDA $219 7.5x – 10.0x $1,641 – $2,188 FY 2007E EBITDA 239 7.0x – 9.0x 1,671 – 2,148 FY 2006E EBIT 148 11.0x – 12.5x 1,625 – 1,847 FY 2007E EBIT 161 10.0x – 11.0x 1,609 – 1,770 Segment Reference Range $1,600 – $2,000 Subtotal $7,400 – $8,900 Unallocated Corporate Expense (1) ($39) 7.5x – 9.2x (293) – (360) Implied Enterprise Value Range $7,107 – $8,540 (–) Enterprise Value Adjustments (2) (2,061) – (2,080) Implied Equity Value Reference Range $5,046 – $6,460 Diluted Shares Outstanding 183.8 – 183.8 Implied Equity Value per Share Reference Range $27 – $35 Enterprise Value / FY 2006E EBITDA 7.5x – 9.0x FY 2007E EBITDA 6.9x – 8.3x Source: Management estimates provided to CS on May 25, 2006 and public filings. (1) Includes unallocated cash corporate expenses multiplied by a segment weighted FY 2006E EBITDA multiple. (2) (2) Adjustments include proceeds from options exercised and SURP liability which vary with share price. Including FAS 123 non-cash charges in unallocated corporate expense implies an equity value per share of approximately $27 to $34. |
 41 CONFIDENTIAL | PRELIMINARY ANALYSIS D R A F T Preliminary Enterprise Value Adjustments The enterprise value adjustments table below serves as the bridge between Arrow’s enterprise value and implied equity value ($ in millions) Adjustment Value Description (+) Excess Cash $0 All cash on balance sheet required for working capital per Company (+) Cash Proceeds From Option Exercise 95 – 280 Proceeds received upon option exercise (dependant on stock price) (–) SURP Liability (107) – (67) Liability from RSU's held in plan (–) Est. Funded Debt (1) (1,869) Debt held on the balance sheet (–) A/R Securitization Facility (205) Average balance of facility throughout year (–) Minority Interest (13) Minority interest of consolidated JV's Total Enterprise Value Adjustments ($2,099) – ($1,874) Source: Management estimates and public filings. (1) Estimated as of September 30, 2006. |
 42 CONFIDENTIAL | PRELIMINARY ANALYSIS D R A F T Preliminary Selected Acquisitions Analysis ($ in millions) CLOSING ENTERPRISE ENTERPRISE VALUE / LTM EBITDA DATE ACQUIROR TARGET VALUE SALES EBITDA EBIT (1) MARGIN Food and Support Services Pending EQT / Macquarie Bank Compass Group's SSP Unit $3,172 1.0x 10.9x 16.0x 9.3% Pending Holding Bercy Investissement (2) Elior 2,727 0.8x 9.7x 13.6x 8.3% Jan-06 Compass Group Levy Restaurants 490 0.9x NA NA NA Jul-05 EQT and Goldman Sachs ISS A/S 4,774 0.7x 10.2x 13.0x 7.2% Jun-04 Charterhouse Capital Partners Autobar Ltd. 967 0.7x NA NA NA Dec-02 ARAMARK Fine Host 102 0.3x NA NA NA Mar-02 Compass Group Bon Appetit 156 0.6x NA NA NA Jan-02 Compass Group Seiyo Food Systems 541 0.9x NA NA NA Nov-01 ARAMARK ServiceMaster 791 0.4x 8.9x 11.4x 4.7% Aug-01 Compass Group Crothall Services Group 170 0.5x NA 9.7x NA Jul-01 Sodexho Alliance SA Sogeres and Wood Dining Services 444 0.7x NA NA NA Jun-01 Sodexho Alliance SA Sodexho Marriott Services 2,984 0.6x 10.1x 14.3x 6.1% Jun-01 LSG Lufthansa AG Sky Chefs Inc. 2,468 1.3x NA 22.8x NA May-01 Compass Group Selecta 735 1.6x 8.6x 15.1x 18.3% Apr-01 Compass Group Morrison Management Specialists 634 1.2x 17.5x 21.2x 7.1% Dec-00 Autogrill Passaggio Holding AG 153 1.0x 12.7x NA 7.8% Jul-00 Granada Compass 9,808 1.3x 17.8x 24.2x 7.1% Sep-99 Autogrill Host Marriott Services 946 0.7x 7.1x 13.8x 9.3% Jul-99 SAir Group Dobbs International Services 780 0.9x NA 10.9x NA Jul-97 Compass Daka 183 0.5x 10.2x NA 4.5% Feb-97 Investcorp Welcome Break 762 1.4x NA 14.8x NA Median 0.8x 10.2x 14.3x 7.2% Sep-03 Unifirst Textilease $178 1.9x 18.7x 27.4x 10.0% Jun-03 California Investment Fund National Services Industries 104 0.2x 7.3x NM 2.8% Jul-02 Paribas Affaires Industrielles Elis Group 1,516 1.9x NA NA NA Jun-02 Davis Service Group Sophus Berendsen 669 1.3x NA 14.1x NA May-02 Cintas Omni Services 657 2.0x 11.6x 18.4x 17.5% Mar-99 Cintas Unitog 446 1.6x 10.1x 17.7x 15.7% Apr-98 Cintas Uniforms To You 169 1.1x NA 9.9x NA Jul-97 G&K Services 29 NLS Facilities 287 1.4x NA NA NA Median 1.5x 10.8x 17.7x 12.9% Overall Median 0.9x 10.2x 14.5x 7.8% Source: Company filings, press releases, SDC, Capital IQ. Excludes non-recurring items. (1) Excludes goodwill amortization where applicable. Uniform and Career Apparel (2) Holding Bercy Investissement (HBI) is controlled by Robert Zolade (Elior's founder and president), Charterhouse and Chequers Capital. Multiples calculated using 9/30/05 Eliorfinancials. €13.40 offer price implies a 9/30/06E EBITDA multiple of 8.8x, EBIT multiple of 12.5x and sales multiple of 0.8x. |
 43 CONFIDENTIAL | PRELIMINARY ANALYSIS D R A F T Preliminary Selected Acquisitions Analysis (cont’d) ($ in millions, except per share values) Arrow Multiple Range Implied Enterprise Value Performance Low – High Low – High Food and Support Services LTM 3/31/06 EBITDA $763 9.0x – 10.5x $6,863 – $8,006 LTM 3/31/06 EBIT 512 13.0x – 15.0x 6,661 – 7,686 Segment Reference Range $6,700 – $7,750 Uniform and Career Apparel LTM 3/31/06 EBITDA $216 9.0x – 11.5x $1,948 – $2,489 LTM 3/31/06 EBIT 139 15.0x – 18.0x 2,078 – 2,493 Segment Reference Range $2,000 – $2,500 Subtotal $8,700 – $10,250 Unallocated Corporate Expense (1) ($39) 9.0x – 10.7x ($351) – ($419) Implied Enterprise Value Range $8,349 – $9,831 (–) Enterprise Value Adjustments (2) (1,892) – (1,911) Implied Equity Value Reference Range $6,457 – $7,920 Fully Diluted Shares Outstanding 192.4 – 192.4 Implied Equity Value per Share Reference Range $34 – $41 Enterprise Value / FY 2006E EBITDA 8.8x – 10.3x FY 2007E EBITDA 8.1x – 9.6x FY 2006E EBIT 13.6x – 16.0x FY 2007E EBIT 12.6x – 14.8x Price / FY 2006E EPS 20.7x – 25.4x FY 2007E EPS 18.0x – 22.1x Source: Management estimates provided to CS on May 25, 2006. (1) Includes unallocated cash corporate expenses multiplied by a segment weighted FY 2006E EBITDA multiple. (2) Adjustments include proceeds from options exercised and SURP liability which vary with share price. |
 44 CONFIDENTIAL | PRELIMINARY ANALYSIS D R A F T Preliminary Segment DCF Analysis ($ in millions, except per share values) Arrow FY2006E Multiple Range Implied Enterprise Value Performance Low – High Low – High Segment Reference Range Food and Support Services $796 8.4x – 10.5x $6,700 – $8,350 Uniform and Career Apparel $219 8.0x – 10.1x 1,750 – 2,200 Subtotal $8,450 – $10,550 Unallocated Corporate Expense (1) ($39) 8.3x – 10.4x ($325) – ($406) Implied Enterprise Value Range $8,125 – $10,144 (–) Enterprise Value Adjustments (2) (1,889) – (1,915) Implied Equity Value Reference Range $6,236 – $8,229 – Fully Diluted Shares Outstanding 192.4 – 192.4 Implied Equity Value per Share Reference Range $32 – $43 Enterprise Value / FY 2006E EBITDA 8.5x – 10.6x FY 2007E EBITDA 7.9x – 9.9x FY 2006E EBIT 13.2x – 16.5x FY 2007E EBIT 12.2x – 15.3x Price / FY 2006E EPS 20.0x – 26.4x FY 2007E EPS 17.4x – 23.0x Source: Management estimates provided to CS on May 25, 2006. (1) Includes unallocated cash corporate expenses multiplied by a segment weighted FY 2006E EBITDA multiple. (2) Adjustments include proceeds from options exercised and SURP liability which vary with share price. |
 45 CONFIDENTIAL | PRELIMINARY ANALYSIS D R A F T Food and Support Services – Preliminary DCF Analysis Implied Enterprise Value Implied Perpetuity Growth Rate Source: Management estimates provided to CS on May 25, 2006. Note: Segment financials exclude corporate overhead. (1) Assumes disposal of long-term assets allocated based on share of total capital expenditures. (2) Includes other corporate adjustments allocated based on EBITDA contribution. ($ in millions) Projected '05A-'11E FYE 9/30, 2005A 2006E 2007E 2008E 2009E 2010E 2011E CAGR Sales $9,409 $9,970 $10,509 $11,114 $11,754 $12,423 $13,120 5.7% % growth – 6.0% 5.4% 5.8% 5.8% 5.7% 5.6% EBITDA $724.1 $796.1 $849.1 $910.7 $967.6 $1,033.0 $1,094.6 7.1% % margin 7.7% 8.0% 8.1% 8.2% 8.2% 8.3% 8.3% Unlevered Net Income $300.6 $330.6 $354.3 $385.6 $417.4 $447.8 $483.6 8.2% % Margin 3.2% 3.3% 3.4% 3.5% 3.6% 3.6% 3.7% Depreciation & Amortization $243.0 $267.1 $282.2 $293.8 $299.8 $316.5 $320.9 % of sales 2.6% 2.7% 2.7% 2.6% 2.6% 2.5% 2.4% Capital Expenditures ($209.2) ($237.8) ($254.6) ($261.2) ($276.4) ($292.4) ($309.0) % of sales (2.2%) (2.4%) (2.4%) (2.4%) (2.4%) (2.4%) (2.4%) (Incr.)/Decr. in Working Capital ($31.8) ($8.1) $3.7 $1.6 $2.5 $2.9 $3.3 % of sales (0.3%) (0.1%) 0.0% 0.0% 0.0% 0.0% 0.0% Unlevered FCF (1) $300.9 $324.6 $381.6 $416.7 $440.5 $472.3 $496.5 8.7% Discount Terminal EBITDA Multiple Rate 7.5x 8.0x 8.5x 9.0x 9.5x 8.5% $7,181 $7,545 $7,909 $8,273 $8,637 9.0% $7,034 $7,390 $7,746 $8,101 $8,457 9.5% $6,891 $7,238 $7,586 $7,934 $8,281 10.0% $6,751 $7,091 $7,430 $7,770 $8,110 10.5% $6,615 $6,947 $7,279 $7,611 $7,944 Discount Terminal EBITDA Multiple Rate 7.5x 8.0x 8.5x 9.0x 9.5x 8.5% 2.3% 2.7% 3.0% 3.3% 3.6% 9.0% 2.8% 3.2% 3.5% 3.8% 4.0% 9.5% 3.3% 3.6% 4.0% 4.2% 4.5% 10.0% 3.7% 4.1% 4.4% 4.7% 5.0% 10.5% 4.2% 4.6% 4.9% 5.2% 5.5% |
 46 CONFIDENTIAL | PRELIMINARY ANALYSIS D R A F T Uniform and Career Apparel – Preliminary DCF Analysis Source: Management estimates provided to CS on May 25, 2006. Note: Segment financials exclude corporate overhead. (1) Assumes disposal of long-term assets allocated based on share of total capital expenditures. (2) Includes other corporate adjustments allocated based on EBITDA contribution. Implied Enterprise Value Implied Perpetuity Growth Rate ($ in millions) Projected '05A-'11E FYE 9/30, 2005A 2006E 2007E 2008E 2009E 2010E 2011E CAGR Sales $1,554 $1,630 $1,713 $1,790 $1,870 $1,954 $2,042 4.7% % growth – 4.9% 5.1% 4.5% 4.5% 4.5% 4.5% EBITDA $212.9 $218.8 $238.7 $253.0 $267.7 $283.3 $296.8 5.7% % margin 13.7% 13.4% 13.9% 14.1% 14.3% 14.5% 14.5% Unlevered Net Income $85.6 $92.3 $100.6 $107.4 $114.4 $121.8 $127.9 6.9% % Margin 5.5% 5.7% 5.9% 6.0% 6.1% 6.2% 6.3% Depreciation & Amortization $75.9 $71.1 $77.7 $81.2 $84.7 $88.5 $92.2 % of sales 4.9% 4.4% 4.5% 4.5% 4.5% 4.5% 4.5% Capital Expenditures ($85.7) ($78.5) ($86.0) ($90.2) ($94.6) ($99.3) ($104.1) % of sales (5.5%) (4.8%) (5.0%) (5.0%) (5.1%) (5.1%) (5.1%) (Incr.)/Decr. in Working Capital ($14.3) ($15.1) ($16.7) ($15.3) ($16.1) ($16.8) ($17.6) % of sales (0.9%) (0.9%) (1.0%) (0.9%) (0.9%) (0.9%) (0.9%) Unlevered FCF (1) $61.0 $62.4 $74.5 $82.2 $87.7 $93.5 $97.7 8.2% Discount Terminal EBITDA Multiple Rate 8.0x 8.5x 9.0x 9.5x 10.0x 9.0% $1,878 $1,975 $2,071 $2,167 $2,264 9.5% $1,839 $1,933 $2,027 $2,121 $2,216 10.0% $1,800 $1,892 $1,985 $2,077 $2,169 10.5% $1,763 $1,853 $1,943 $2,033 $2,123 11.0% $1,727 $1,815 $1,903 $1,991 $2,079 Discount Terminal EBITDA Multiple Rate 8.0x 8.5x 9.0x 9.5x 10.0x 9.0% 4.7% 4.9% 5.2% 5.3% 5.5% 9.5% 5.2% 5.4% 5.6% 5.8% 6.0% 10.0% 5.7% 5.9% 6.1% 6.3% 6.5% 10.5% 6.1% 6.4% 6.6% 6.8% 7.0% 11.0% 6.6% 6.9% 7.1% 7.3% 7.5% |
 47 CONFIDENTIAL | PRELIMINARY ANALYSIS D R A F T Implied Share Price Implied Perpetuity Growth Rate Source: Management estimates provided to CS on May 25, 2006. Note: Consolidated financials include corporate overhead. (1) Includes other corporate adjustments. Consolidated Preliminary DCF Analysis ($ in millions) Projected '05A-'11E FYE 9/30, 2005A 2006E 2007E 2008E 2009E 2010E 2011E CAGR Sales $10,963 $11,599 $12,222 $12,904 $13,624 $14,378 $15,162 5.6% % growth – 5.8% 5.4% 5.6% 5.6% 5.5% 5.5% EBITDA $900.3 $953.8 $1,024.6 $1,097.0 $1,164.8 $1,241.9 $1,312.9 6.5% % margin 8.2% 8.2% 8.4% 8.5% 8.5% 8.6% 8.7% Unlevered Net Income $363.3 $384.8 $415.4 $451.3 $487.7 $523.1 $562.4 7.6% % Margin 3.3% 3.3% 3.4% 3.5% 3.6% 3.6% 3.7% Depreciation & Amortization $319.0 $338.1 $360.0 $375.0 $384.5 $404.9 $413.1 % of sales 2.9% 2.9% 2.9% 2.9% 2.8% 2.8% 2.7% Capital Expenditures ($294.9) ($316.3) ($340.5) ($351.4) ($371.0) ($391.6) ($413.2) % of sales (2.7%) (2.7%) (2.8%) (2.7%) (2.7%) (2.7%) (2.7%) (Incr.)/Decr. in Working Capital ($46.1) ($23.2) ($13.0) ($13.8) ($13.6) ($13.9) ($14.3) % of sales (0.4%) (0.2%) (0.1%) (0.1%) (0.1%) (0.1%) (0.1%) Unlevered FCF (1) $338.9 $370.8 $433.6 $475.1 $503.0 $539.3 $566.2 8.9% Discount Terminal EBITDA Multiple Rate 7.5x 8.0x 8.5x 9.0x 9.5x 8.5% $34.49 $36.75 $39.02 $41.29 $43.56 9.0% $33.57 $35.79 $38.01 $40.23 $42.44 9.5% $32.69 $34.85 $37.02 $39.19 $41.36 10.0% $31.82 $33.94 $36.06 $38.18 $40.30 10.5% $30.98 $33.05 $35.12 $37.19 $39.26 Discount Terminal EBITDA Multiple Rate 7.5x 8.0x 8.5x 9.0x 9.5x 8.5% 2.6% 2.9% 3.3% 3.5% 3.8% 9.0% 3.1% 3.4% 3.7% 4.0% 4.3% 9.5% 3.5% 3.9% 4.2% 4.5% 4.7% 10.0% 4.0% 4.4% 4.7% 5.0% 5.2% 10.5% 4.5% 4.8% 5.2% 5.4% 5.7% |
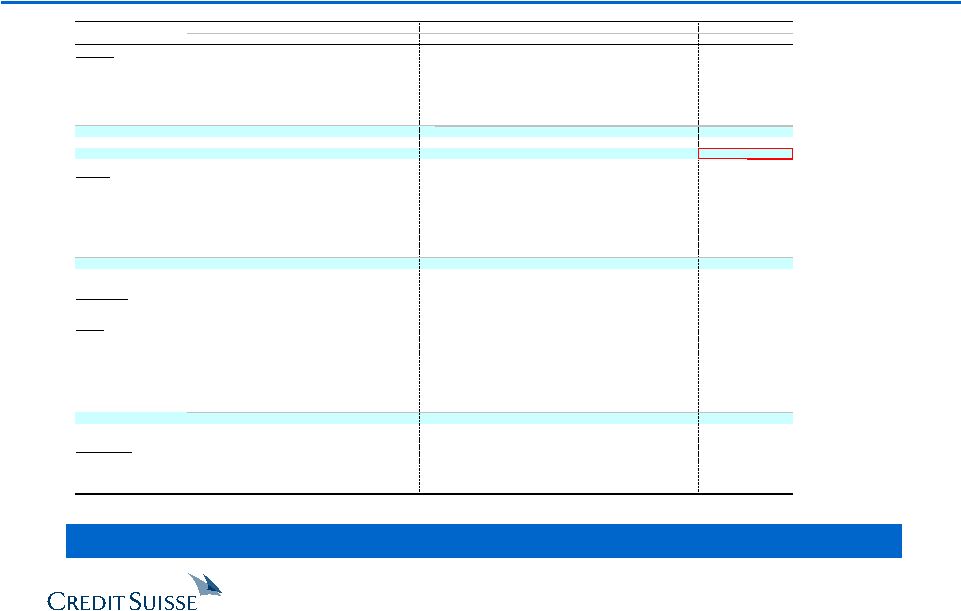
 48 CONFIDENTIAL | PRELIMINARY ANALYSIS D R A F T Sensitivity Considerations An average of $150 million of acquisitions per year at historical valuation and performance metrics results in approximately $1.00 per share in value Every 50 basis point change in capital expenditure as a percent of revenue equates to approximately $1.35 per share in value Revenue Growth and EBITDA Margin Sensitivity Analysis – Implied Share Price Sensitivity Every 1.0% of incremental revenue growth equates to approximately $475 million of enterprise value (or approximately $2.45 per share). Every 1.0% of incremental EBITDA margin equates to approximately $1150 million of enterprise value (or approximately $5.80 per share). Preliminary DCF Sensitivity Analysis ($ in millions) Incremental Revenue Growth (200) bps (100) bps 0 bps 100 bps 200 bps (100) bps $26.19 $28.17 $30.24 $32.40 $34.66 (50) bps $28.82 $30.94 $33.15 $35.46 $37.88 0 bps $31.45 $33.70 $36.06 $38.53 $41.10 50 bps $34.08 $36.47 $38.97 $41.59 $44.33 100 bps $36.70 $39.23 $41.88 $44.65 $47.55 Note: Assumes terminal EBITDA multiple of 8.5x and discount rate of 10.0%. |
 49 CONFIDENTIAL | PRELIMINARY ANALYSIS D R A F T CS does not provide any tax advice. Any tax statement herein regarding any US federal tax is not intended or written to be used, and cannot be used, by any taxpayer for the purpose of avoiding any penalties. Any such statement herein was written to support the marketing or promotion of the transaction(s) or matter(s) to which the statement relates. Each taxpayer should seek advice based on the taxpayer's particular circumstances from an independent tax advisor. These materials have been provided to you by Credit Suisse ("CS") in connection with an actual or potential mandate or engagement and may not be used or relied upon for any purpose other than as specifically contemplated by a written agreement with CS. In addition, these materials may not be disclosed, in whole or in part, or summarized or otherwise referred to except as agreed in writing by CS. The information used in preparing these materials was obtained from or through you or your representatives or from public sources. CS assumes no responsibility for independent verification of such information and has relied on such information being complete and accurate in all material respects. To the extent such information includes estimates and forecasts of future financial performance (including estimates of potential cost savings and synergies) prepared by or reviewed or discussed with the managements of your company and/or other potential transaction participants or obtained from public sources, we have assumed that such estimates and forecasts have been reasonably prepared on bases reflecting the best currently available estimates and judgments of such managements (or, with respect to estimates and forecasts obtained from public sources, represent reasonable estimates). These materials were designed for use by specific persons familiar with the business and the affairs of your company and CS assumes no obligation to update or otherwise revise these materials. Nothing contained herein should be construed as tax, accounting or legal advice. You (and each of your employees, representatives or other agents) may disclose to any and all persons, without limitation of any kind, the tax treatment and tax structure of the transactions contemplated by these materials and all materials of any kind (including opinions or other tax analyses) that are provided to you relating to such tax treatment and structure. For this purpose, the tax treatment of a transaction is the purported or claimed U.S. federal income tax treatment of the transaction and the tax structure of a transaction is any fact that may be relevant to understanding the purported or claimed U.S. federal income tax treatment of the transaction. CS has adopted policies and guidelines designed to preserve the independence of its research analysts. CS’s policies prohibit employees from directly or indirectly offering a favorable research rating or specific price target, or offering to change a research rating or price target, as consideration for or an inducement to obtain business or other compensation. CS’s policies prohibit research analysts from being compensated for their involvement in investment banking transactions except to the extent such participation is intended to benefit investor clients. |