 PROJECT ARROW DRAFT CONFIDENTIAL Presentation to the Special Committee June 2, 2006 PRELIMINARY | SUBJECT TO FURTHER REVIEW AND EVALUATION THESE MATERIALS MAY NOT BE USED OR RELIED UPON FOR ANY PURPOSE OTHER THAN AS SPECIFICALLY CONTEMPLATED BY A WRITTEN AGREEMENT WITH CREDIT SUISSE. |
 1 CONFIDENTIAL D R A F T Table of Contents 1. Executive Summary 2. Preliminary Perspectives on Arrow 3. Preliminary Financial Analysis 4. Review of Current Proposal 5. Preliminary Review of Selected Alternatives 6. Next Steps Appendix |
 CONFIDENTIAL 2 1. Executive Summary |
 3 CONFIDENTIAL D R A F T Agenda Today we will review a preliminary financial analysis of Arrow and the Company’s alternatives in the context of the Company’s recent stock price performance and its long-term prospects. Discuss our preliminary perspectives on Arrow Arrow stock price performance and public market valuation since its IPO Arrow performance relative to its peers Recent Stock Price Performance / Public Market Valuation The value of Arrow’s stand-alone plan (including a continuing acquisition program) The impact of separating Food and Support Services (“FSS”) and Uniform and Career Apparel (“AUCA”) segments The impact of divesting the Company’s FSS – International division or AUCA business The implications of a significant share repurchase program (through a leveraged recapitalization) or capital distribution on value to Arrow’s stockholders Alternatives as an Independent Company The range of alternatives to the stand-alone plan (e.g., sale to strategic acquiror, leveraged buyout) An overview of the potential acquirors and their likely appetite and financial capacity to pursue a transaction with Arrow – strategic and/or financial buyers Alternatives Regarding a Sale of the Company A discussion of how the Special Committee could respond to Mr. Neubauer and next steps in its consideration of alternatives Discussion of Next Steps A review of Mr. Neubauer’s May 1 proposal A discussion of Street and certain stockholder reactions to the proposal Review of Current Proposal st |
 4 CONFIDENTIAL D R A F T Over the past three weeks, CS has performed initial due diligence on Arrow. Reviewed certain publicly available business and financial information relating to Arrow Reviewed certain other information relating the Company, including financial forecasts, provided to us by Company management On May 18 and 19 , CS met with certain members of Arrow’s senior management including Joe Neubauer (Chairman and CEO), Fred Sutherland (EVP and CFO), Andrew Kerin (SVP & President, FSS– U.S.), Ravi Saligram (SVP & President, FSS–International), Tom Vozzo (SVP & President, AUCA), Alan Griffith (SVP, Finance), Chris Holland (VP & Treasurer) and Joe Delaney (VP, Corporate Planning) to discuss the business and prospects of the Company Reviewed information with members of senior management in several subsequent discussions, and requested and discussed supplemental diligence information Participated with the Special Committee’s legal counsel in a call with counsel for Mr. Neubauer and counsel for the financial sponsor consortium to discuss the history of conversations and arrangements contemplated between the consortium and senior management Reviewed the proposed draft merger agreement Worked with the Special Committee’s legal counsel to review the results of legal due diligence Reviewed the financeability of Arrow given the financial forecasts provided by the Company CS continues to request and review information on the Company and its financial performance. Selected CS Activities Performed to Date th th |
 5 CONFIDENTIAL D R A F T Executive Summary CS has engaged in discussions with Company management and has conducted a review of Arrow’s business, including industry dynamics, performance, prospects and a preliminary financial analysis. Arrow has a strong market position in most of its segments and enjoys stable cash flows Arrow’s recent performance has been impacted by business interruptions due to the 2005 hurricane season, the loss of two stadium contracts and difficulties in its international FSS segment, but recent operating and strategi c initiatives indicate improving financial results Arrow’s stock has recently traded at a discount to primary foodservice and uniform peers The current proposal from Mr. Neubauer does not appear to be as attractive as alternatives that may be available to the Company. Since announcing the proposal, the stock has continued to trade above the $32 proposed price Arrow’s Special Committee has requested that CS assist it in considering the Company’s alternatives and in determining whether to pursue any further discussions with Mr. Neubauer and the sponsor consortium or other alternatives |
 6 CONFIDENTIAL D R A F T Executive Summary (cont’d) CS’s preliminary analysis indicates that stockholder value could be created if Arrow were to pursue certain alternatives. Successfully executing the stand-alone plan appears to indicate that there is not meaningful upside in the stock price on a PV basis above the current proposal unless the Company experiences significant P/E multiple expansion; however, a DCF of the current company plan appears to indicate value in excess of the current proposal A transformational acquisition is unlikely to be actionable in the short-term and presents integration risks; at current valuations it may be difficult to create value in excess of the stand-alone plan Given FSS – International’s strategic importance to serving global customers and tax leakage, a sale of the unit is unlikely to create incremental value A separation of AUCA either through a spin-off or divestiture may be a viable approach to resolving the Company’s consolidated valuation discount through obtaining a market valuation for the segment A major share repurchase may be a viable alternative, either alone or in combination with other alternatives, to offer a monetization event at a premium and create additional value for remaining shareholders as well as provide a competitive alternative to an LBO CS believes an LBO could be affected at a premium to the current proposal while still achieving desired returns on equity Broad strategic interest in pursuing a transaction is likely limited; however, Sodexho appears best positioned to explore a combination |
 CONFIDENTIAL 7 2. Preliminary Perspectives on Arrow |
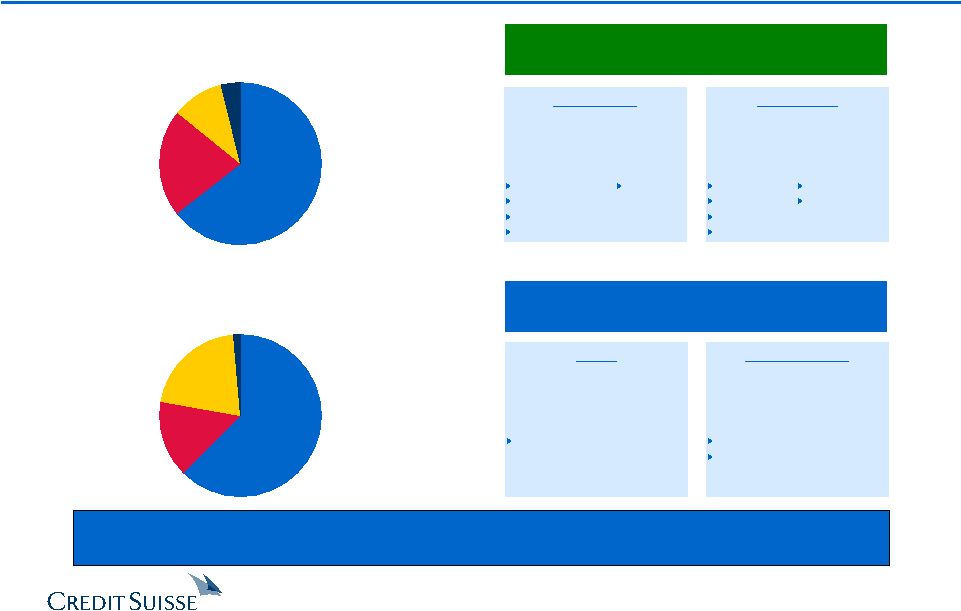 8 CONFIDENTIAL D R A F T International Principal Business Units: Ireland Canada Germany Chile FSS–U.S. 65% FSS–Int'l 21% AUCA–Renta 10% AUCA–Direct Marketing 4% FSS–U.S. 63% FSS–Int'l 15% AUCA–Rental 21% AUCA–Direct Marketing 2% Arrow Business Overview LTM Revenue Mix ($11.3 billion) LTM EBITDA Mix ($931.8 million) (1) Arrow’s business model is heavily focused on its FSS segment. Furthermore, FSS and AUCA operate fairly autonomously. Source: Public filings. Note: LTM figures as of 3/31/06. (1) LTM EBITDA of $931.8 million includes corporate expense allocation. Spain Japan (JV) United States Principal Business Units: Business Services Healthcare Corrections Sports & Entertainment LTM Revenue $7.3B LTM EBITDA $612M % Margin 8.4% LTM Revenue $2.4B LTM EBITDA $150M % Margin 6.2% Food and Support Services (“FSS”) Rental Principal Business Unit: Uniform Rental Services Direct Marketing Principal Business Units: Wearmark / Crest Galls LTM Revenue $1.2B LTM EBITDA $202M % Margin 17.3% LTM Revenue $427M LTM EBITDA $15M % Margin 3.5% Uniform and Career Apparel (“AUCA”) Education |
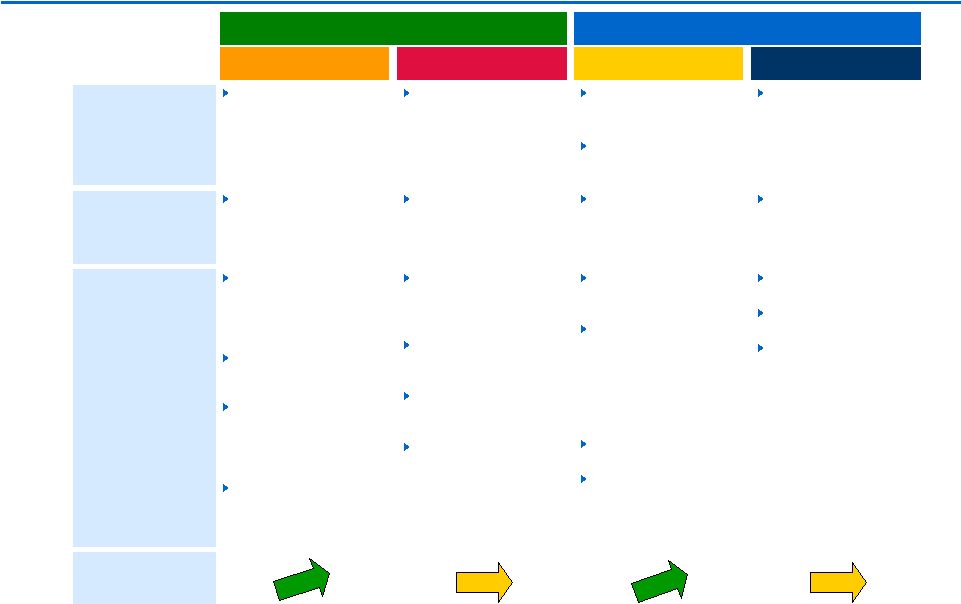 9 CONFIDENTIAL D R A F T Business Perspectives Arrow Position Summary of Opportunities & Challenges United States International Rental Direct Marketing Business Services (10.2% of consolidated revenues) is highly competitive; pricing pressure Sports & Entertainment increasingly competitive with lumpy results Further growth in Corrections and Healthcare due to operating leverage and market foothold Potential for same-store sales growth in Higher Education given current initiatives Most markets are business services- oriented, causing margin pressure Opportunity to expand Healthcare operations in multiple countries Several large contracts in the UK (e.g., BP) up for renewal Management issues appear to be addressed (e.g., UK and Spain) and turnarounds are underway Customer Connect initiative to drive margin expansion Disparate operating standards and capabilities resulting from acquisition vs. greenfield historical growth inhibits operational efficiency Opportunities to benefit from Asian sourcing High energy costs negatively impacting margins Increased competition from new entrants Large inventory requirements Lower discretionary spending budgets in the military and local police have impacted comparable period results Food and Support Services Uniform and Career Apparel Market leader, with particularly strong positions in Corrections and Higher Education Leading share in select markets, but generally trailing major competitors #2 market position in U.S. with strong nationwide network Significant domestic presence with approximately 4% market share Trend Market Landscape Highly concentrated market with three major players: Arrow, Compass and Sodexho Compass and Sodexho strong internationally in most markets; numerous strong regional/country level competitors Four major national players: Cintas, Arrow, G&K and UniFirst Localized competition Highly fragmented market with no clear market leader |
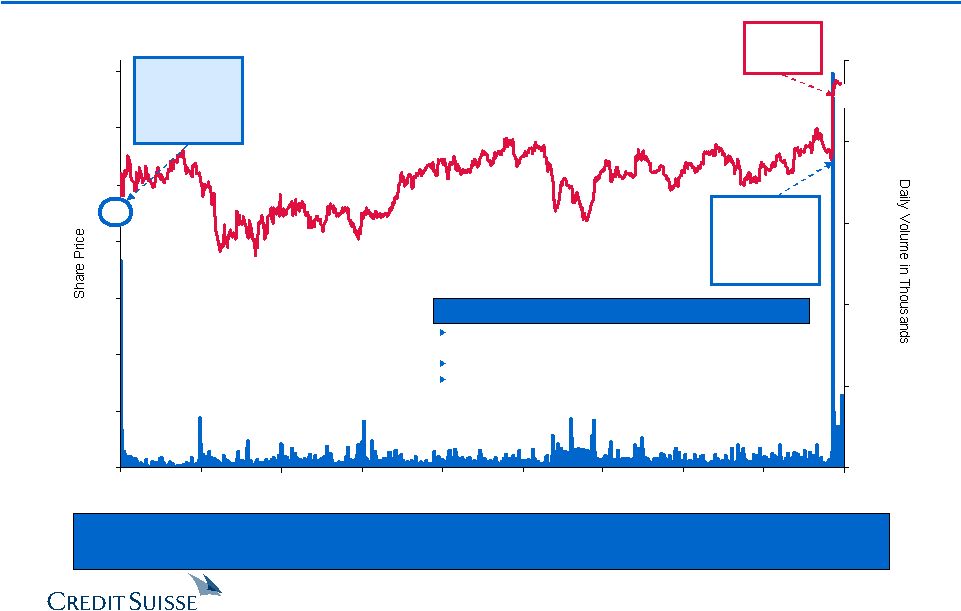 10 CONFIDENTIAL D R A F T $0 $5 $10 $15 $20 $25 $30 $35 Dec-01 Jun-02 Dec-02 Jun-03 Dec-03 Jun-04 Nov-04 May-05 Nov-05 May-06 0 6,000 12,000 18,000 24,000 30,000 Arrow Stock Performance – IPO to Today Despite its consistent EPS growth, Arrow’s stock price has remained relatively flat in absolute terms and has experienced P/E multiple contraction. $23 Source: FactSet. Note: Data reflects daily closing price and shares traded. Note: 24.2% of public float traded on day of announcement. Date: 4/28/06 Price: $28.11 % CAGR: 4.7% NTM EPS: $1.74 % CAGR: 9.3% NTM P/E: 16.7x Stock price has remained relatively flat since IPO, despite solid earnings growth Multiple contraction has occurred since IPO The stock has traded heavily since Mr. Neubauer’s announcement (average daily volume of approximately 530 thousand shares since IPO vs. 2.8 million since announcement) Observations Date: 12/11/01 Price: $23.00 % CAGR: NA NTM EPS: $1.18 % CAGR: NA NTM P/E: 19.5x $32 5/1/06 Bid Price: $32.00 |
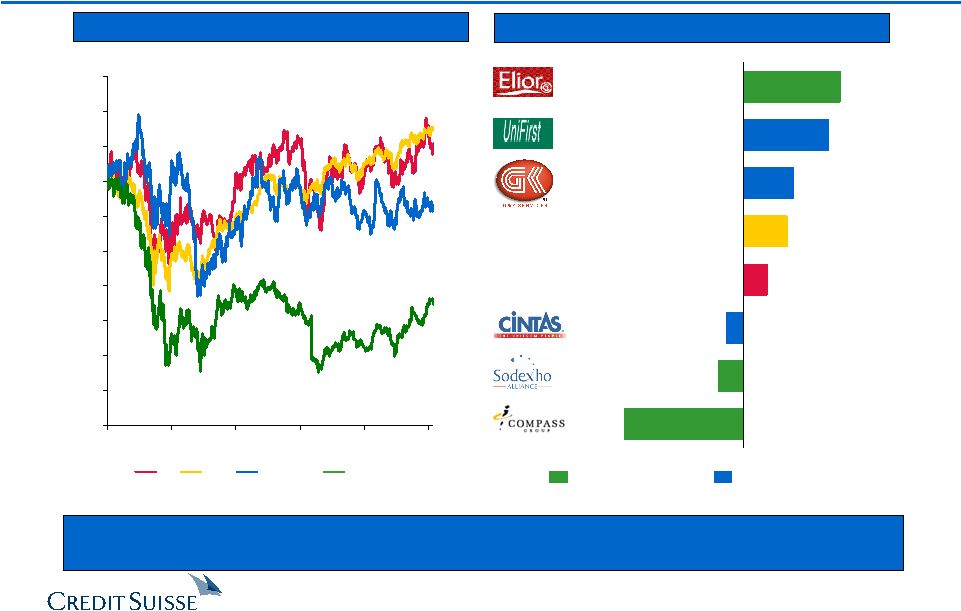 11 CONFIDENTIAL D R A F T 30 40 50 60 70 80 90 100 110 120 130 12/11/01 10/22/02 9/2/03 7/13/04 5/24/05 4/4/06 Arrow Relative Performance – IPO to Pre-Offer Arrow’s share price has outperformed its peer groups since its IPO, although it has performed in the middle of its peer group on a total return basis. Relative Stock Price Performance Total Annualized Shareholder Return Source: FactSet Note: Stock price performance and total annualized return calculated from December 11, 2001 through April 28, 2006. 15.2% (7.1%) (35.3%) Arrow S&P 500 AUCA Composite FSS Composite 10.7% Note: AUCA Composite includes Cintas, G&K and UniFirst. Note: FSS Composite includes Compass, Elior and Sodexho. Food and Support Services Uniform and Career Apparel Note: Reflects stock price appreciation and dividend distributions from Arrow IPO to April 28, 2006, the close prior to Mr. Neubauer’s bid. Note: Elior stock price and dividend appreciation as of January 11, 2006, the close prior to Robert Zolade’s tender consideration announcement. S&P 500 (13.9%) (2.9%) (2.0%) 2.8% 5.1% 5.9% 10.0% 11.3% Arrow |
 12 CONFIDENTIAL D R A F T Wall Street Perspectives on Arrow “A flurry of recent challenges, including management disruption, underperforming hospital contracts, a few lost stadium contracts, and last year’s hurricanes have resulted in some earnings volatility for [Arrow].” Deutsche Bank – May 10, 2006 “…operating performance has been mixed in recent quarters, but we see scope for better growth and margins going forward. Given a few quarters, we expect the healthy top line growth to translate into modest operating leverage.” Morgan Stanley – May 10, 2006 Analyst EPS Estimates Target Long-Term Firm Date Recommendation FY06E FY07E Price (1) EPS Growth CIBC 05/10/06 Sector Performer $1.65 $1.85 $30.00 10% Citigroup 05/10/06 Hold 1.64 1.84 33.00 12% Credit Suisse 05/10/06 Market Weight 1.64 1.87 28.00 NA Deutsche Bank 05/10/06 Hold 1.70 1.85 35.00 NA Goldman Sachs 05/10/06 Neutral 1.63 1.86 29.00 NA JP Morgan 05/01/06 Neutral 1.67 1.82 NA NA Lehman Brothers 05/11/06 Equal-weight 1.65 1.81 30.00 10% Merrill Lynch 05/11/06 No Rating 1.63 1.80 31.00 13% Morgan Stanley 05/10/06 Equal-weight 1.64 1.95 35.00 NA Robert W. Baird 05/11/06 Neutral 1.63 1.90 33.00 10% Thomas Weisel 05/10/06 Outperform 1.64 1.85 NA 12% Wachovia 05/10/06 Market Perform 1.63 1.76 28.00 12% William Blair 05/10/06 Market Perform 1.63 1.81 NA 12% Mean $1.64 $1.84 $31.20 11% Median 1.64 1.85 30.50 12% Management Plan $1.62 $1.80 NA 13% % Variance to Street Mean (1%) (2%) NA 11% Source: Wall Street equity research, Bloomberg and FactSet. (1) Refers to research analyst's target price prior to Mr. Neubauer's bid on May 1, 2006. (2) Arrow long-term EPS growth calculated as management's 2005A–2010E EPS CAGR (5-year growth rate). (2) |
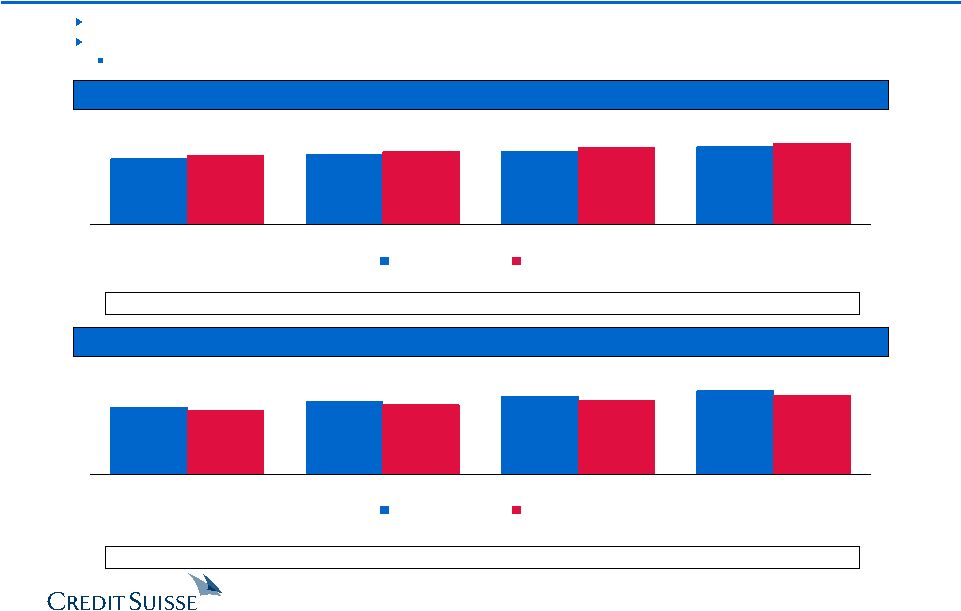
 13 CONFIDENTIAL D R A F T $311 $690 $642 $616 $589 $313 $677 $618 $579 $593 Budget Actual 2003 2004 2005 2006E 2006YTD (1) (2) Historical Performance vs. Budget Arrow’s historical sales and operating profit have been consistent with the Company’s budgeted operating plan. Sales EBIT $5,718 $11,664 $11,030 $10,059 $9,466 $5,755 $11,599 $10,963 $10,192 $9,448 Budget Actual 2003 2004 2005 2006E 2006YTD (1) (2) Note: Budget reflects Arrow’s Board plan submitted to Board in fiscal Q2 each year. (1) Original plan as of late summer 2005. Current forecast was provided to CS on May 25, 2006. (2) YTD through March 2006. ($ in millions) ($ in millions) Original Forecast Current Forecast Original Forecast Current Forecast Percent Difference (Actual / Budget) (0.2%) 1.3% (0.6%) (0.6%) 0.7% Percent Difference (Actual / Budget) 0.7% (6.4%) (3.9%) (1.9%) 0.9% |
 14 CONFIDENTIAL D R A F T Management Financial Summary Arrow management provided CS with the financial forecast detailed above on May 25, 2006. ($ in millions) Historical Projected CAGR FYE 9/30, 2001 2002 2003 2004 2005 2006E 2007E 2008E 2009E 2010E 2011E '01A–'05A '05A–'11E Revenue FSS–United States $4,816 $5,625 $6,545 $6,879 $7,129 $7,456 $7,925 $8,375 $8,853 $9,349 $9,862 10.3% 5.6% % Growth 9.3% 16.8% 16.4% 5.1% 3.6% 4.6% 6.3% 5.7% 5.7% 5.6% 5.5% FSS–International $1,109 $1,201 $1,424 $1,830 $2,280 $2,513 $2,584 $2,739 $2,901 $3,074 $3,258 19.7% 6.1% % Growth 10.7% 8.2% 18.6% 28.6% 24.6% 10.2% 2.8% 6.0% 5.9% 6.0% 6.0% AUCA $1,434 $1,439 $1,479 $1,483 $1,554 $1,630 $1,713 $1,790 $1,870 $1,954 $2,042 2.0% 4.7% % Growth 0.6% 0.3% 2.8% 0.3% 4.8% 4.9% 5.1% 4.5% 4.5% 4.5% 4.5% Total Revenue $7,359 $8,264 $9,448 $10,192 $10,963 $11,599 $12,222 $12,904 $13,624 $14,378 $15,162 10.5% 5.6% % Growth 7.7% 12.3% 14.3% 7.9% 7.6% 5.8% 5.4% 5.6% 5.6% 5.5% 5.5% % Organic Growth 5.1% 1.7% 2.6% 5.7% 4.0% 5.8% 5.4% 5.6% 5.6% 5.5% 5.5% 3.5% 5.6% EBITDA FSS–United States $393 $469 $559 $562 $597 $637 $679 $728 $773 $825 $873 11.0% 6.6% % Margin 8.2% 8.3% 8.5% 8.2% 8.4% 8.5% 8.6% 8.7% 8.7% 8.8% 8.9% FSS–International $59 $67 $86 $104 $128 $160 $170 $183 $195 $208 $222 21.3% 9.6% % Margin 5.3% 5.6% 6.1% 5.7% 5.6% 6.3% 6.6% 6.7% 6.7% 6.8% 6.8% AUCA $202 $205 $204 $206 $213 $219 $239 $253 $268 $283 $297 1.4% 5.7% % Margin 14.1% 14.2% 13.8% 13.9% 13.7% 13.4% 13.9% 14.1% 14.3% 14.5% 14.5% Corporate ($24) ($30) ($40) ($40) ($37) ($61) ($58) ($61) ($64) ($68) ($72) 11.8% 11.8% Avg. Margins Total EBITDA $630 $710 $809 $833 $900 $954 $1,030 $1,103 $1,171 $1,248 $1,320 9.4% 6.6% '01A–'05A '05A–'11E % Margin 8.6% 8.6% 8.6% 8.2% 8.2% 8.2% 8.4% 8.5% 8.6% 8.7% 8.7% 8.4% 8.5% Diluted EPS $0.90 $1.25 $1.34 $1.36 $1.53 $1.62 $1.86 $2.16 $2.46 $2.77 $3.13 12.5% 14.1% % Growth 15.4% 38.9% 7.2% 1.5% 12.5% 5.9% 14.8% 16.1% 13.9% 12.6% 13.0% Capex FSS–United States $96 $130 $174 $185 $168 $220 $222 $226 $239 $253 $267 15.0% 8.0% % of Revenue 2.0% 2.3% 2.7% 2.7% 2.4% 3.0% 2.8% 2.7% 2.7% 2.7% 2.7% FSS–International $29 $22 $35 $43 $63 $46 $55 $58 $62 $65 $69 21.4% 1.5% % of Revenue 2.6% 1.9% 2.5% 2.4% 2.8% 1.8% 2.1% 2.1% 2.1% 2.1% 2.1% AUCA $79 $71 $94 $101 $95 $88 $94 $98 $103 $108 $113 4.6% 3.0% % of Revenue 5.5% 4.9% 6.4% 6.8% 6.1% 5.4% 5.5% 5.5% 5.5% 5.5% 5.5% Total Capex $204 $223 $303 $330 $326 $354 $371 $382 $404 $426 $450 12.4% 5.5% % of Revenue 2.8% 2.7% 3.2% 3.2% 3.0% 3.1% 3.0% 3.0% 3.0% 3.0% 3.0% Revenue Mix FSS–United States 65.4% 68.1% 69.3% 67.5% 65.0% 64.3% 64.8% 64.9% 65.0% 65.0% 65.0% FSS–International 15.1% 14.5% 15.1% 18.0% 20.8% 21.7% 21.1% 21.2% 21.3% 21.4% 21.5% AUCA 19.5% 17.4% 15.7% 14.5% 14.2% 14.0% 14.0% 13.9% 13.7% 13.6% 13.5% Source: Management estimates provided to CS on May 25, 2006. (1) $21 million of 2006E corporate overhead comprised of non-cash FAS 123 and RSU expenses. (1) |
 15 CONFIDENTIAL D R A F T $1,240 $1,160 $1,080 $990 $1,171 $1,103 $1,030 $954 2006E 2007E 2008E 2009E Current Forecast vs. December 2005 Forecast Sales EBITDA $13,100 $12,300 $11,700 $11,000 $13,624 $12,904 $12,222 $11,599 2006E 2007E 2008E 2009E (1) December 2005 forecast as presented to Board of Directors on December 6, 2005. (2) Current forecast was provided to CS on May 25, 2006. ($ in millions) ($ in millions) Percent Difference (Current / Dec. 2005) 5.4% 4.5% 4.9% 4.0% Percent Difference (Current / Dec. 2005) (3.7%) (4.7%) (4.9%) (5.6%) December 2005 Current (1) (2) December 2005 Current (1) (2) December 2005 Forecast – reflects top-down forecast prepared by senior management Current Forecast – based on review by management with operating segment heads Provided by management to bidding group |
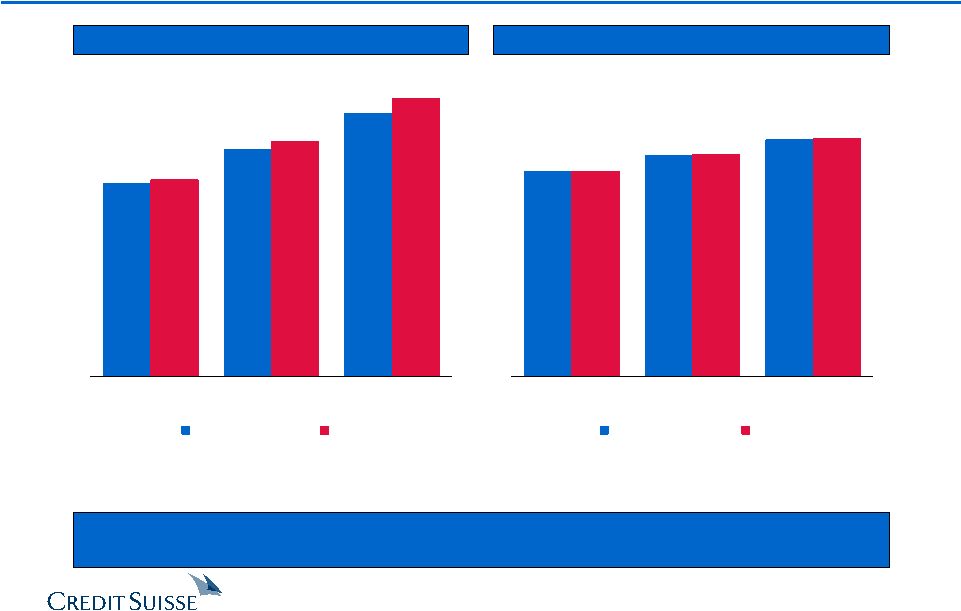 16 CONFIDENTIAL D R A F T Current Forecast vs. Street Arrow’s internal forecasted top-line growth is lower than Wall Street estimates while EBITDA is generally in-line. $12,904 $12,222 $11,599 $13,177 $12,388 $11,663 Current Forecast Street 2006E 2007E 2008E $954 $1,030 $1,103 $955 $1,035 $1,109 Current Forecast Street 2006E 2007E 2008E Note: 2006E–2008E estimated sales and EBITDA based on I/B/E/S consensus estimates. ($ in millions) ($ in millions) Sales EBITDA Percent Difference (Current Forecast / Street) (0.2%) (0.5%) (0.6%) Percent Difference (Current Forecast / Street) (0.5%) (1.3%) (2.1%) |
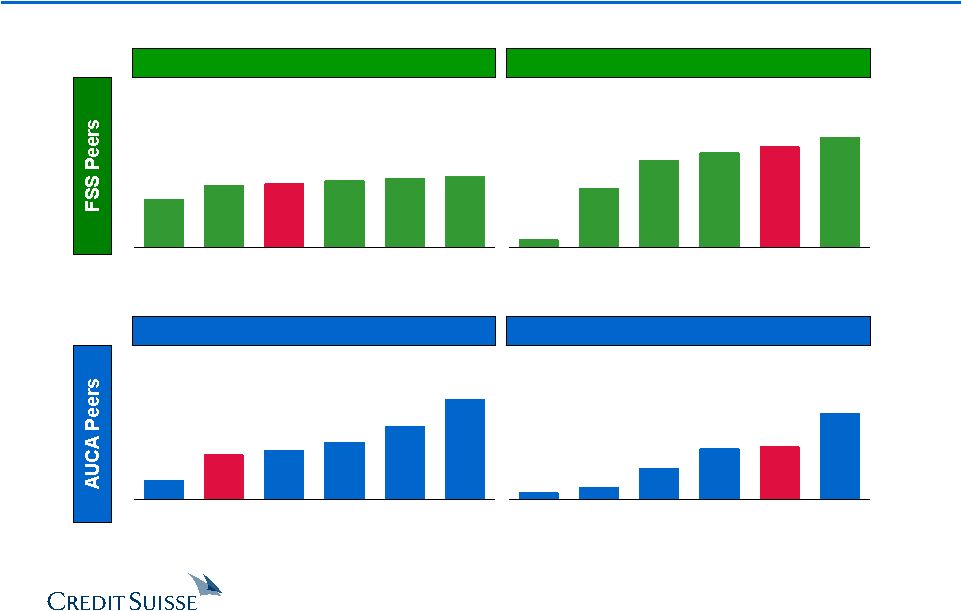 17 CONFIDENTIAL D R A F T Performance vs. Segment Peers – Arrow Revenue and EBITDA Growth 2005A–2007E Revenue CAGR 2005A–2007E EBITDA CAGR 2005A–2007E Revenue CAGR 2005A–2007E EBITDA CAGR 4.3% 5.6% 6.0% 6.4% 5.7% 6.2% Centerplate Compass Arrow Elior Sodexho Autogrill Source: Company public filings and management projections provided to CS on May 25, 2006. Note: Growth and margins based on 9/30 calendarized financials. Note: Arrow segment EBITDA margins exclude corporate overhead allocation. Compass 2005 results PF for sale of SSP. 8.2% 5.5% 11.3% 6.4% 5.0% 2.1% Davis Arrow Rentokil UniFirst G&K Services Cintas 8.3% 7.2% 9.1% 7.8% 4.9% 0.6% Compass Centerplate Elior Autogrill Arrow Sodexho 5.9% 3.5% 9.7% 5.7% 1.3% 0.7% Davis Rentokil UniFirst G&K Services Arrow Cintas Note: Percentages inside bars reflect average margins from 2005A – 2007E. Note: Percentages inside bars reflect average margins from 2005A – 2007E. 8.3% 8.4% 13.4% 7.9% 6.2% 6.7% 20.9% 14.9% 13.9% 13.8% 20.5% 6.7% |
 CONFIDENTIAL 18 3. Preliminary Financial Analysis |
 19 CONFIDENTIAL D R A F T Overview of Financial Analysis Each methodology was applied to Arrow’s FSS and AUCA segments to derive valuation Various other considerations were factored into valuation Corporate overhead A/R facility SURP liability Valuation is contingent upon further evaluation of historical and projected results Arrow’s Estimated Valuation “Private” market value Implied “change of control” value based on multiples paid for comparable companies in acquisition transactions Selected Acquisitions Analysis Considerations Quality of comparables Availability of data Consistency of accounting Impacted by deal-specific issues (e.g., strategic importance, synergies) Public market value Implied market trading value based on comparable companies’ relative benchmarks Selected Company Analysis Considerations Market environment Quality of comparables Assessment of differences versus comparables (size, float / liquidity, coverage) Consistency of accounting Considerations Based on financial forecasts developed by Arrow management Discount rate and cost of capital Terminal value assumptions Sensitivity analysis (growth, margins) Discounted Cash Flow Analysis Present value of projected unlevered free cash flows Implied “intrinsic” value based on timing, magnitude and risk profile of prospective cash flows |
 20 CONFIDENTIAL D R A F T Preliminary Selected Companies Analysis Selected Companies ($ in millions, except per share values) Share 2007E I/B/E/S LT Debt / Price as of Equity Enterprise EV / EBITDA EV / EBIT P/E Revenue EBITDA EBIT Growth LTM Dividend LTM Company 5/31/06 Value Value 2006E 2007E 2006E 2007E 2006E 2007E Growth Margin Margin Rate (1) EBITDA Yield Ratio ROIC (2) Arrow (Current) $32.75 $5,979 $7,826 8.3x 7.6x 11.4x 10.1x 20.0x 17.7x 7.3% 8.2% 6.2% 11.9% 2.0x 0.9% 16.7% 11.5% Arrow (Offer) $32.00 $5,836 $7,683 8.1x 7.5x 11.2x 9.9x 19.5x 17.3x 7.3% 8.2% 6.2% 11.9% 2.0x 0.9% 16.7% 11.5% Arrow (Pre-Offer) $28.11 $5,066 $6,913 7.3x 6.7x 10.0x 8.9x 17.1x 15.2x 7.3% 8.2% 6.2% 11.9% 2.0x 1.0% 16.7% 11.5% Food and Support Services Autogrill $15.68 $3,990 $5,253 8.1x 7.6x 12.7x 11.6x 20.9x 18.6x 4.8% 13.6% 8.9% 10.0% 2.0x 1.6% 39.1% 13.5% Centerplate (3) 14.05 316 498 9.0x 8.6x 18.6x 17.6x NM NM 3.6% 8.4% 4.1% 3.0% 4.0x 5.7% NA 6.0% Compass 4.43 9,542 11,814 8.5x 8.1x 12.5x 11.8x 21.0x 15.6x 4.6% 6.7% 4.6% 7.0% 1.9x 4.1% 51.6% 9.6% Elior (4) 14.59 1,932 2,478 7.6x 7.2x 10.8x 10.0x 15.1x 13.5x 5.8% 8.5% 6.0% NA 2.3x 1.2% 36.4% 9.8% Sodexho 44.79 7,185 8,611 8.8x 7.9x 11.7x 10.5x 18.5x 16.1x 4.7% 6.4% 4.8% 5.0% 2.3x 2.2% 74.6% 10.1% Mean 8.4x 7.9x 13.3x 12.3x 18.9x 16.0x 4.7% 8.7% 5.7% 6.3% 2.5x 3.0% 50.4% 9.8% Median 8.5x 7.9x 12.5x 11.6x 19.7x 15.8x 4.7% 8.4% 4.8% 6.0% 2.3x 2.2% 45.4% 9.8% Uniform and Career Apparel United States Cintas $42.36 $7,139 $7,527 10.4x 9.4x 13.3x 11.9x 21.0x 18.4x 11.0% 20.3% 16.1% 14.3% 0.9x 0.8% 18.9% 11.7% G&K Services 38.62 826 1,034 8.7x 7.9x 13.5x 11.7x 19.2x 16.9x 6.5% 13.8% 9.3% 12.8% 1.9x 0.2% 3.6% 6.5% Unifirst 32.05 618 807 6.8x 6.3x 11.2x 10.1x 16.2x 13.9x 6.6% 14.8% 9.2% 12.3% 1.7x 0.2% 7.3% 6.8% International Davis Service Group $8.35 $1,425 $1,829 4.5x 4.4x 10.9x 10.4x 13.0x 12.2x 2.8% 32.4% 13.6% 8.0% 1.5x 3.9% 26.0% 8.8% Rentokil 2.71 4,922 6,677 7.1x 6.8x 11.9x 11.1x 13.5x 12.3x 6.1% 20.3% 12.4% NA 2.4x 4.8% 38.8% 10.8% Mean 7.5x 7.0x 12.2x 11.0x 16.6x 14.8x 6.6% 20.3% 12.1% 11.9% 1.7x 2.0% 18.9% 8.9% Median 7.1x 6.8x 11.9x 11.1x 16.2x 13.9x 6.5% 20.3% 12.4% 12.6% 1.7x 0.8% 18.9% 8.8% Overall Mean 7.9x 7.4x 12.7x 11.7x 17.6x 15.3x 5.7% 14.5% 8.9% 9.1% 2.1x 2.5% 32.9% 9.4% Overall Median 8.3x 7.7x 12.2x 11.3x 18.5x 15.6x 5.3% 13.7% 9.0% 9.0% 2.0x 1.9% 36.4% 9.7% Source: I/B/E/S, Investext equity research and Company filings. Note: Multiples based on financial estimates calendarized to Arrow's fiscal year end of 9/30. (1) Based on I/B/E/S 5-year long-term growth rates. (2) Defined as net operating profit after taxes / total book capitalization. (3) Centerplate trades as an Income Deposit Security. (4) As of January 11, 2006, the day before Robert Zolade announced he was reviewing the possibility of opening his share capital to new investors; A cash tender was launched on March 27, 2006. |
 21 CONFIDENTIAL D R A F T Preliminary Selected Companies Analysis (cont’d) ($ in millions, except per share values) Arrow Multiple Range Implied Enterprise Value Performance Low – High Low – High Food and Support Services FY 2006E EBITDA $796 7.5x – 9.0x $5,971 – $7,165 FY 2007E EBITDA 849 7.0x – 8.5x 5,944 – 7,217 FY 2006E EBIT 529 10.0x – 12.5x 5,290 – 6,613 FY 2007E EBIT 567 9.0x – 11.0x 5,102 – 6,236 Segment Reference Range $5,800 – $6,900 Uniform and Career Apparel FY 2006E EBITDA $219 7.5x – 10.0x $1,641 – $2,188 FY 2007E EBITDA 239 7.0x – 9.0x 1,671 – 2,148 FY 2006E EBIT 148 10.0x – 12.5x 1,477 – 1,847 FY 2007E EBIT 161 9.0x – 11.0x 1,448 – 1,770 Segment Reference Range $1,600 – $2,000 Subtotal $7,400 – $8,900 Unallocated Corporate Expense (1) ($39) 7.5x – 9.2x (293) – (360) Implied Enterprise Value Range $7,107 – $8,540 (–) Enterprise Value Adjustments as of 3/31/06 (2) (2,005) – (2,005) Implied Equity Value Reference Range $5,102 – $6,536 Diluted Shares Outstanding 183.8 – 183.8 Implied Equity Value per Share Reference Range $28 – $36 Enterprise Value / FY 2006E EBITDA 7.3x – 8.8x FY 2007E EBITDA 6.8x – 8.2x Source: Management estimates provided to CS on May 25, 2006. (1) Includes unallocated cash corporate expenses multiplied by a segment weighted FY 2006E EBITDA multiple. (2) Including FAS 123 non-cash charges in unallocated corporate expense implies an equity value per share of approximately $27 to $34. (2) Adjustments include option proceeds based on exercisable options. |
 22 CONFIDENTIAL D R A F T Preliminary Enterprise Value Adjustments The enterprise value adjustments table below serves as the bridge between Arrow’s enterprise value and implied equity value ($ in millions) Adjustment Value Description (+) Excess Cash $0 – All cash on balance sheet required for working capital per Company (+) Cash Proceeds From Option Exercise 95 – 280 – Proceeds received upon option exercise (dependant on stock price) (–) SURP Liability (81) – Liability from RSU's held in plan (–) Est. Funded Debt (1,803) – Debt held on the balance sheet (–) A/R Securitization Facility (205) – Average balance of facility throughout year (–) Minority Interest (12) – Minority interest of consolidated JV's Total Enterprise Value Adjustments ($2,005) – ($1,821) Source: Management estimates. |
 23 CONFIDENTIAL D R A F T Preliminary Selected Acquisitions Analysis Selected Acquisitions ($ in millions) CLOSING ENTERPRISE ENTERPRISE VALUE / LTM EBITDA DATE ACQUIROR TARGET VALUE SALES EBITDA EBIT (1) MARGIN Food and Support Services Pending EQT / Macquarie Bank Compass Group's SSP Unit $3,172 1.0x 10.9x 16.0x 9.3% Pending Holding Bercy Investissement (2) Elior 2,727 0.8x 9.7x 13.6x 8.3% Jan-06 Compass Group Levy Restaurants 490 0.9x NA NA NA Jul-05 EQT and Goldman Sachs ISS A/S 4,774 0.7x 10.2x 13.0x 7.2x Jun-04 Charterhouse Capital Partners Autobar Ltd. 967 0.7x NA NA NA Dec-02 ARAMARK Fine Host 102 0.3x NA NA NA Mar-02 Compass Group Bon Appetit 156 0.6x NA NA NA Jan-02 Compass Group Seiyo Food Systems 541 0.9x NA NA NA Nov-01 ARAMARK ServiceMaster 791 0.4x 8.9x 11.4x 4.7% Aug-01 Compass Group Crothall Services Group 170 0.5x NA 9.7x NA Jul-01 Sodexho Alliance SA Sogeres and Wood Dining Services 444 0.7x NA NA NA Jun-01 Sodexho Alliance SA Sodexho Marriott Services 2,984 0.6x 10.1x 14.3x 6.1% Jun-01 LSG Lufthansa AG Sky Chefs Inc. 2,468 1.3x NA 22.8x NA May-01 Compass Group Selecta 735 1.6x 8.6x 15.1x 18.3% Apr-01 Compass Group Morrison Management Specialists 634 1.2x 17.5x 21.2x 7.1% Dec-00 Autogrill Passaggio Holding AG 153 1.0x 12.7x NA 7.8% Jul-00 Granada Compass 9,808 1.3x 17.8x 24.2x 7.1% Sep-99 Autogrill Host Marriott Services 946 0.7x 7.1x 13.8x 9.3% Jul-99 SAir Group Dobbs International Services 780 0.9x NA 10.9x NA Jul-97 Compass Daka 183 0.5x 10.2x NA 4.5% Feb-97 Investcorp Welcome Break 762 1.4x NA 14.8x NA Median 0.8x 10.2x 14.3x 7.8% Sep-03 Unifirst Textilease $178 1.9x 18.7x 27.4x 10.0% Jun-03 California Investment Fund National Services Industries 104 0.2x 7.3x NM 2.8% Jul-02 Paribas Affaires Industrielles Elis Group 1,516 1.9x NA NA NA Jun-02 Davis Service Group Sophus Berendsen 669 1.3x NA 14.1x NA May-02 Cintas Omni Services 657 2.0x 11.6x 18.4x 17.5% Mar-99 Cintas Unitog 446 1.6x 10.1x 17.7x 15.7% Apr-98 Cintas Uniforms To You 169 1.1x NA 9.9x NA Jul-97 G&K Services 29 NLS Facilities 287 1.4x NA NA NA Median 1.5x 10.8x 17.7x 0.1x Overall Median 0.9x 10.2x 14.5x 0.1x Source: Company filings, press releases, SDC, Capital IQ. Excludes non-recurring items. (1) Excludes goodwill amortization where applicable. (2) Holding Bercy Investissement (HBI) is controlled by Robert Zolade (Elior's founder and president), Charterhouse and Chequers Capital. Uniform and Career Apparel |
 24 CONFIDENTIAL D R A F T Preliminary Selected Acquisitions Analysis (cont’d) ($ in millions, except per share values) Arrow Multiple Range Implied Enterprise Value Performance Low – High Low – High Food and Support Services LTM 3/31/06 EBITDA $763 9.0x – 10.5x $6,863 – $8,006 LTM 3/31/06 EBIT 512 13.0x – 15.0x 6,661 – 7,686 Segment Reference Range $6,700 – $7,750 Uniform and Career Apparel LTM 3/31/06 EBITDA $216 9.0x – 11.5x $1,948 – $2,489 LTM 3/31/06 EBIT 139 15.0x – 18.0x 2,078 – 2,493 Segment Reference Range $2,000 – $2,500 Subtotal $8,700 – $10,250 Unallocated Corporate Expense (1) ($39) 9.0x – 10.7x ($351) – ($419) Implied Enterprise Value Range $8,349 – $9,831 (–) Enterprise Value Adjustments as of 3/31/06 (2) (1,821) – (1,821) Implied Equity Value Reference Range $6,528 – $8,010 Fully Diluted Shares Outstanding 192.4 – 192.4 Implied Equity Value per Share Reference Range $34 – $42 Enterprise Value / FY 2006E EBITDA 8.6x – 10.1x FY 2007E EBITDA 8.0x – 9.4x FY 2006E EBIT 13.1x – 15.4x FY 2007E EBIT 12.2x – 14.3x Price / FY 2006E EPS 20.9x – 25.7x FY 2007E EPS 18.2x – 22.4x Source: Management estimates provided to CS on May 25, 2006. (1) Includes unallocated cash corporate expenses multiplied by a segment weighted FY 2006E EBITDA multiple. (2) Adjustments include option proceeds based on total outstanding options. |
 25 CONFIDENTIAL D R A F T Preliminary Segment DCF Analysis ($ in millions, except per share values) Arrow FY2006E Multiple Range Implied Enterprise Value Performance Low – High Low – High Segment Reference Range Food and Support Services $796 8.2x – 10.4x $6,500 – $8,300 Uniform and Career Apparel $219 7.8x – 10.1x 1,700 – 2,200 Subtotal $8,200 – $10,500 Unallocated Corporate Expense (1) ($39) 8.1x – 10.3x ($316) – ($404) Implied Enterprise Value Range $7,884 – $10,096 (–) Enterprise Value Adjustments as of 3/31/06 (2) (1,821) – (1,821) Implied Equity Value Reference Range $6,064 – $8,275 Fully Diluted Shares Outstanding 192.4 – 192.4 Implied Equity Value per Share Reference Range $32 – $43 Enterprise Value / FY 2006E EBITDA 8.1x – 10.3x FY 2007E EBITDA 7.5x – 9.6x FY 2006E EBIT 12.4x – 15.8x FY 2007E EBIT 11.5x – 14.7x Price / FY 2006E EPS 19.5x – 26.5x FY 2007E EPS 16.9x – 23.1x Source: Management estimates provided to CS on May 25, 2006. (1) Includes unallocated cash corporate expenses multiplied by a segment weighted FY 2006E EBITDA multiple. (2) Adjustments include option proceeds based on total outstanding options. |
 26 CONFIDENTIAL D R A F T Food and Support Services – Preliminary DCF Analysis Implied Enterprise Value Implied Perpetuity Growth Rate Source: Management estimates provided to CS on May 25, 2006. Note: Segment financials exclude corporate overhead. (1) Working capital is allocated based on historical percentage of FSS revenue. ($ in millions) Projected '05A-'11E FYE 9/30, 2005A 2006E 2007E 2008E 2009E 2010E 2011E CAGR Sales $9,409 $9,970 $10,509 $11,114 $11,754 $12,423 $13,120 5.7% % growth – 6.0% 5.4% 5.8% 5.8% 5.7% 5.6% EBITDA $724.1 $796.1 $849.1 $910.7 $967.6 $1,033.0 $1,094.6 7.1% % margin 7.7% 8.0% 8.1% 8.2% 8.2% 8.3% 8.3% Unlevered Net Income $300.6 $330.6 $354.3 $385.6 $417.4 $447.8 $483.6 8.2% % Margin 3.2% 3.3% 3.4% 3.5% 3.6% 3.6% 3.7% Depreciation & Amortization $243.0 $267.1 $282.2 $293.8 $299.8 $316.5 $320.9 % of sales 2.6% 2.7% 2.7% 2.6% 2.6% 2.5% 2.4% Capital Expenditures ($231.2) ($266.2) ($277.0) ($284.2) ($300.8) ($318.1) ($336.3) % of sales (2.5%) (2.7%) (2.6%) (2.6%) (2.6%) (2.6%) (2.6%) (Incr.)/Decr. in Working Capital (1) ($31.8) ($8.1) $6.5 $4.7 $5.8 $6.5 $7.2 % of sales (0.3%) (0.1%) 0.1% 0.0% 0.0% 0.1% 0.1% Unlevered FCF $280.7 $323.4 $366.1 $399.9 $422.2 $452.7 $475.4 9.2% Discount Terminal EBITDA Multiple Rate 7.5x 8.0x 8.5x 9.0x 9.5x 9.0% $6,895 $7,243 $7,591 $7,939 $8,287 9.5% $6,747 $7,087 $7,427 $7,767 $8,107 10.0% $6,604 $6,936 $7,268 $7,600 $7,932 10.5% $6,465 $6,789 $7,113 $7,437 $7,761 Discount Terminal EBITDA Multiple Rate 7.5x 8.0x 8.5x 9.0x 9.5x 9.0% 3.0% 3.4% 3.7% 4.0% 4.2% 9.5% 3.5% 3.9% 4.2% 4.5% 4.7% 10.0% 4.0% 4.3% 4.7% 4.9% 5.2% 10.5% 4.5% 4.8% 5.1% 5.4% 5.7% |
 27 CONFIDENTIAL D R A F T Uniform and Career Apparel – Preliminary DCF Analysis Source: Management estimates provided to CS on May 25, 2006. Note: Segment financials exclude corporate overhead. (1) Working capital is allocated based on historical percentage of AUCA revenue. Implied Enterprise Value Implied Perpetuity Growth Rate ($ in millions) Projected '05A-'11E FYE 9/30, 2005A 2006E 2007E 2008E 2009E 2010E 2011E CAGR Sales $1,554 $1,630 $1,713 $1,790 $1,870 $1,954 $2,042 4.7% % growth – 4.9% 5.1% 4.5% 4.5% 4.5% 4.5% EBITDA $212.9 $218.8 $238.7 $253.0 $267.7 $283.3 $296.8 5.7% % margin 13.7% 13.4% 13.9% 14.1% 14.3% 14.5% 14.5% Unlevered Net Income $85.6 $92.3 $100.6 $107.4 $114.4 $121.8 $127.9 6.9% % Margin 5.5% 5.7% 5.9% 6.0% 6.1% 6.2% 6.3% Depreciation & Amortization $75.9 $71.1 $77.7 $81.2 $84.7 $88.5 $92.2 % of sales 4.9% 4.4% 4.5% 4.5% 4.5% 4.5% 4.5% Capital Expenditures ($94.7) ($87.8) ($93.5) ($98.1) ($103.0) ($108.0) ($113.3) % of sales (6.1%) (5.4%) (5.5%) (5.5%) (5.5%) (5.5%) (5.5%) (Incr.)/Decr. in Working Capital (1) ($14.3) ($15.1) ($16.7) ($15.3) ($16.1) ($16.8) ($17.6) % of sales (0.9%) (0.9%) (1.0%) (0.9%) (0.9%) (0.9%) (0.9%) Unlevered FCF $52.6 $60.5 $68.1 $75.1 $80.1 $85.4 $89.2 9.2% Discount Terminal EBITDA Multiple Rate 8.0x 8.5x 9.0x 9.5x 10.0x 9.5% 5.5% 5.8% 6.0% 6.1% 6.3% 10.0% 6.0% 6.2% 6.4% 6.6% 6.8% 10.5% 6.5% 6.7% 6.9% 7.1% 7.3% 11.0% 7.0% 7.2% 7.4% 7.6% 7.8% Discount Terminal EBITDA Multiple Rate 8.0x 8.5x 9.0x 9.5x 10.0x 9.5% $1,784 $1,876 $1,969 $2,061 $2,153 10.0% $1,745 $1,835 $1,925 $2,015 $2,105 10.5% $1,707 $1,795 $1,883 $1,971 $2,058 11.0% $1,670 $1,756 $1,842 $1,927 $2,013 |
 28 CONFIDENTIAL D R A F T Implied Share Price Implied Perpetuity Growth Rate Source: Management estimates provided to CS on May 25, 2006. Note: Consolidated financials include corporate overhead. Consolidated Preliminary DCF Analysis Discount Terminal EBITDA Multiple Rate 7.5x 8.0x 8.5x 9.0x 9.5x 9.0% $34.71 $36.93 $39.14 $41.36 $43.58 9.5% $33.78 $35.94 $38.10 $40.27 $42.43 10.0% $32.87 $34.98 $37.09 $39.21 $41.32 10.5% $31.99 $34.05 $36.11 $38.18 $40.24 Discount Terminal EBITDA Multiple Rate 7.5x 8.0x 8.5x 9.0x 9.5x 9.0% 3.2% 3.5% 3.9% 4.1% 4.4% 9.5% 3.7% 4.0% 4.3% 4.6% 4.9% 10.0% 4.2% 4.5% 4.8% 5.1% 5.3% 10.5% 4.6% 5.0% 5.3% 5.6% 5.8% ($ in millions) Projected '05A-'11E FYE 9/30, 2005A 2006E 2007E 2008E 2009E 2010E 2011E CAGR Sales $10,963 $11,599 $12,222 $12,904 $13,624 $14,378 $15,162 5.6% % growth – 5.8% 5.4% 5.6% 5.6% 5.5% 5.5% EBITDA $900.3 $975.8 $1,046.7 $1,120.6 $1,189.9 $1,268.4 $1,340.8 6.9% % margin 8.2% 8.4% 8.6% 8.7% 8.7% 8.8% 8.8% Unlevered Net Income $386.3 $423.0 $454.9 $493.0 $531.7 $569.6 $611.5 8.0% % Margin 3.5% 3.6% 3.7% 3.8% 3.9% 4.0% 4.0% Depreciation & Amortization $319.0 $338.1 $360.0 $375.0 $384.5 $404.9 $413.1 % of sales 2.9% 2.9% 2.9% 2.9% 2.8% 2.8% 2.7% Capital Expenditures ($325.9) ($354.0) ($370.5) ($382.3) ($403.7) ($426.1) ($449.6) % of sales (3.0%) (3.1%) (3.0%) (3.0%) (3.0%) (3.0%) (3.0%) (Incr.)/Decr. in Working Capital ($46.1) ($23.2) ($10.2) ($10.6) ($10.2) ($10.3) ($10.4) % of sales (0.4%) (0.2%) (0.1%) (0.1%) (0.1%) (0.1%) (0.1%) Unlevered FCF $333.3 $383.9 $434.1 $475.0 $502.3 $538.2 $564.6 9.2% |
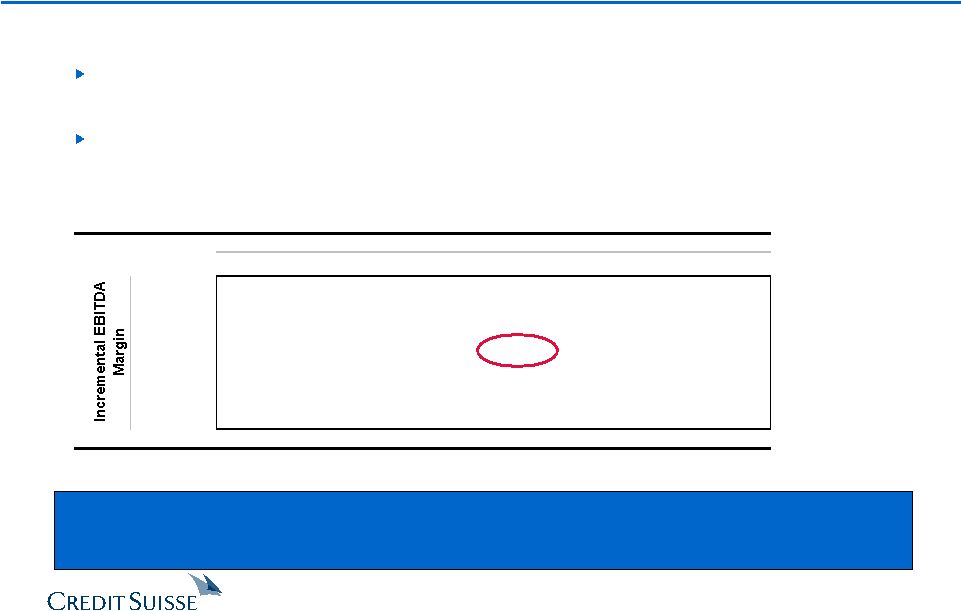 29 CONFIDENTIAL D R A F T ($ in millions) Incremental Revenue Growth (200) bps (100) bps 0 bps 100 bps 200 bps (100) bps $33.08 $34.22 $35.38 $36.57 $37.78 (50) bps $33.91 $35.06 $36.24 $37.44 $38.67 0 bps $34.74 $35.90 $37.09 $38.31 $39.56 50 bps $35.57 $36.75 $37.95 $39.19 $40.45 100 bps $36.40 $37.59 $38.81 $40.06 $41.34 Note: Assumes terminal EBITDA multiple of 8.5x and discount rate of 10.0%. Sensitivity Considerations An average of $150 million of acquisitions per year at historical valuation and performance metrics results in approximately $0.75 to $0.85 per share in value Every 50 basis point change in capital expenditure as a percent of revenue equates to $1.40 per share in value Revenue Growth and EBITDA Margin Sensitivity Analysis – Implied Share Price Sensitivity Every 1.0% of incremental revenue growth equates to approximately $475 million of enterprise value (or approximately $1.20 per share). Every 1.0% of incremental EBITDA margin equates to approximately $330 million of enterprise value (or approximately $1.70 per share). Preliminary DCF Sensitivity Analysis |
 30 CONFIDENTIAL D R A F T Acquisition Matrix ($ in millions, except per share figures) Pre-Bid (1) Offer Current Acquisition Price per Share $28.11 $32.00 $32.75 $34.00 $36.00 $38.00 $40.00 $42.00 $44.00 Premium to Current (05/31/06) (14.2%) (2.3%) – 3.8% 9.9% 16.0% 22.1% 28.2% 34.4% Premium to Pre-Announcement (04/28/06) – 13.8% 16.5% 21.0% 28.1% 35.2% 42.3% 49.4% 56.5% Fully-Diluted Shares Outstanding 183.8 192.4 192.4 192.4 192.4 192.4 192.4 192.4 192.4 Equity Value $5,167 $6,157 $6,302 $6,542 $6,927 $7,312 $7,697 $8,082 $8,467 Enterprise Value Adjustments (as of 3/31/06) 2,005 1,821 1,821 1,821 1,821 1,821 1,821 1,821 1,821 Enterprise Value $7,172 $7,978 $8,123 $8,363 $8,748 $9,133 $9,518 $9,903 $10,287 PF Buyer Adjustments (+) Estimated Option Premium Tax Shield $7 $27 $29 $33 $38 $44 $51 $58 $65 (–) Debt Prepayments (9) (9) (9) (9) (9) (9) (9) (9) (9) PF Buyer Enterprise Value $7,170 $7,997 $8,143 $8,387 $8,777 $9,168 $9,560 $9,951 $10,343 Enterprise Value / LTM EBITDA (3/31/06) $954 7.5x 8.4x 8.5x 8.8x 9.2x 9.6x 10.0x 10.4x 10.8x FY2006E EBITDA 976 7.3 8.2 8.3 8.6 9.0 9.4 9.8 10.1 10.5 FY2007E EBITDA 1,047 6.9 7.6 7.8 8.0 8.4 8.7 9.1 9.5 9.8 LTM EBIT (3/31/06) $626 11.5x 12.7x 13.0x 13.4x 14.0x 14.6x 15.2x 15.8x 16.4x FY2006E EBIT 638 11.2 12.5 12.7 13.1 13.7 14.3 14.9 15.5 16.1 FY2007E EBIT 687 10.4 11.6 11.8 12.2 12.7 13.3 13.9 14.4 15.0 Equity Value / LTM Net Income (3/31/06) $328 15.7x 18.7x 19.2x 19.9x 21.1x 22.3x 23.4x 24.6x 25.8x FY2006E Net Income 312 16.5 19.7 20.2 20.9 22.2 23.4 24.6 25.9 27.1 FY2007E Net Income 346 14.9 17.8 18.2 18.9 20.0 21.1 22.2 23.4 24.5 Source: Management estimates provided to CS on May 25, 2006. Note: LTM and FY2006E EBITDA, EBIT and net income exclude non-cash FAS 123 and RSU corporate expenses of $22.0 million (per management estimates). FY2007E financials exclude $17.0 million. (1) Assumes exercisable options in the calculations of fully diluted shares outstanding and the enterprise value adjustment. |
 CONFIDENTIAL 31 4. Review of Current Proposal |
 32 CONFIDENTIAL D R A F T CS Understanding of Consortium Proposal Offer Price: $32 per share (13.8% premium to closing market price as of April 28, 2006) Equity Value: $5.9 billion (19.8x 2006E Net Income; 17.2x 2007E Net Income) Enterprise Value: $7.9 billion (8.3x 2006E EBITDA; 7.7x 2007E EBITDA) Form of Consideration: 100% Cash Financing: Debt • Approximately $6.24 billion of debt or approximately 6.4x LTM Adjusted EBITDA as of June 30, 3006 ($3.62 billion of bank, $2.62 billion of bond) • To be arranged by Goldman Sachs Credit Partners L.P. and J.P. Morgan Securities, Inc. • “Highly confident” letter provided by the banks listed above • Debt commitment letters to be provided Equity • Approximately $1.9 billion of equity to be provided by the Consortium Members • Equity commitment letters to be provided Consortium Members: Arrow Management (1) GS Capital Partners J.P. Morgan Partners Thomas H. Lee Partners Warburg Pincus LLC Management Participation: Joseph Neubauer (CEO): To roll over equity equal to at least 10% (2) 200 - 250 Arrow senior managers: 5% (3) Management Options (4) : 15-17.5% of fully diluted equity 1/3 performance based; 2/3 time-vested Governance: Board composition: Independent directors to be agreed upon between Mr. Neubauer and the Sponsors; Sponsors will not control Board until 4 years after closing Veto rights: Mr. Neubauer to have a veto on an IPO and sale of the Company for 4 years after closing Note: Certain terms of the proposal, including management’s participation, have not be finalized among the Consortium Members. (1) CS has been informed that discussions regarding equity participation have been had with Mr. Neubauer (CEO), Fred Sutherland (CFO) and Bart Colli (General Counsel). (2) Mr. Neubauer is expected to reinvest between 30% and 50% of his existing shareholding. (3) Mr. Neubauer is expected to backstop 50% of the 5% equity participation by the remaining Arrow management. (4) Allocation of options to Arrow management to be determined by Mr. Neubauer with the consent of the Sponsors. |
 33 CONFIDENTIAL D R A F T Current Proposal – Estimated Sources & Uses The sources and uses table below is based on CS’s understanding of the consortium’s proposed financing arrangement Preliminary Sources & Uses ($ in millions) Spread / x of LTM Sources Amount % Int. Rate Adj. EBITDA Uses Amount % Excess Cash $0.0 0% – 0.0x Equity Purchase Price $5,886.9 72% Term Loan B $3,615.0 44% 2.50% 3.7x Refinance Term Loan B 1,553.0 19% 5.0% Notes due 2012 250.0 3% 5.00% 0.3x Refinance 5.0% Notes due 2012 250.0 3% Senior Unsecured Notes 835.0 10% 8.25% 0.9x Refinance A/R Securitization Facility 200.0 2% Senior Toggle Notes 835.0 10% 8.75% 0.9x Est. Prepayment Penalties 7.2 0% Senior Sub. Notes 480.0 6% 10.00% 0.5x Transaction Expenses 264.9 3% A/R Securitization Facility 225.0 3% 1.00% 0.2x Total Debt $6,240.0 76% – 6.4x Management's Contribution (1) 288.3 4% – – Sponsors' Equity 1,633.7 20% – – Total Sources $8,162.0 100% – – Total Uses $8,162.0 100% Note: Leverage multiple based on 6/30/06E LTM adjusted EBITDA of $968.3 million (per management estimates). (1) Excludes management's promote. |
 34 CONFIDENTIAL D R A F T Street and Shareholder Reaction “[The offer is]…grossly inadequate and we will not support any transaction with consideration anywhere near that price…We believe the company is worth at least $40 per share.” “In the event that you are not able to negotiate an appropriate transaction with the buying group, we strongly urge the board of directors to pursue a leveraged recapitalization through a large Dutch tender offer to repurchase Arrow’s shares at $32 per share.” Eminence Capital LLC – May 4, 2006 “…we think the board’s special committee will require a higher price, in the mid-$30s.” “…we don’t see opposing offers as likely, and we don’t think management has the appetite for a really aggressive bid. Consequently, if management walks away, we see the stock returning to perhaps $30, or less.” Morgan Stanley – May 10, 2006 "We think an appropriate LBO value for this high-quality, stable franchise is $35-$38 per share, or over 9x forward EBITDA. Indeed, our DCF model suggests an intrinsic value of $40 per share…we think it is likely that shareholder pressure prompts the Board of Directors to drive a higher price." Robert W. Baird – May 11, 2006 "We do not see any potential strategic buyers for the business, particularly on the foodservice side, so any premium to the $32 offer price will likely come from negotiations between the board and the investor group." Goldman Sachs – May 1, 2006 "This price however remains below [Arrow's] global peers Compass, Elior and Sodexho, who trade as a group at an average multiple of 8.4x, and within a range of 7.9x - 8.7x. If this same multiple range was applied to Arrow, it would imply a price of $36 - $40…we think it is likely that no other bidders will step in, that the transaction will proceed, but it is also likely that a higher price may be demanded by the independent directors…" Citigroup – May 1, 2006 "We believe that a price above $35 seems somewhat unlikely due to the high levels of leverage and premium valuations implied by these price levels." “…we believe the offer price will likely need to come up by $2 receive the approval of the board's special committee." Lehman Brothers – May 11, 2006 - $3 to the $34 - $35 per share range in order to |
 CONFIDENTIAL 35 5. Preliminary Review of Selected Alternatives |
 36 CONFIDENTIAL D R A F T DESCRIPTION ADVANTAGE CONSIDERATIONS Focus on executing current plan supplemented with acquisition growth Modest growth with relatively low risk profile Appears to indicate upside potential in pre-announcement stock price Deliver value through organic growth and margin improvement Fragmented market provides “bolt- on” acquisition opportunities Market might ask “What’s next?” Likely result in immediate stock price reduction Potential exposure to near-term underperformance relative to Street expectations Pursue strategic acquisitions Potential candidates include Elior and G&K Services Opportunity to create value through synergies Broadens product portfolio / leverages technology infrastructure if acquire new leg (Cintas strategy) Opportunity to increase market presence Lack of actionable targets in near- term Limited opportunity for multiple expansion given comparable valuations of segments Integration and execution risk Consider “unlocking” value by separating units Expands potential buyer universe Cash proceeds from divestiture(s) could be used for a number of alternatives (distribution, significant acquisition) Lack of significant multiple differentiation between segments May restrict strategic transactions post-separation if spin-off Tax leverage impacts value creation opportunity Increase debt for shareholder distribution (repurchase or dividend) Immediate return of value to stockholders �� potentially at premium to current stock price in a repurchase Potentially results in ratings downgrade / increased cost of capital Special dividend impact limited vs. repurchase given accretion effect Acquisition by financial sponsor Realize change of control value for stockholders Captures differential between public and private market valuations Increased financial risk / reduces financial flexibility Sale to or combination with a strategic party Realize strategic value for stockholders Potential synergies may facilitate attractive valuation Limited universe of strategic buyers with both an appetite and financial capability Recapitalization / Repurchase Preliminary Review of Selected Alternatives Pursue Significant Acquisition(s) Implement Strategic Plan Leveraged Buyout Corporate Merger / Sale of Company Separate Business Units |
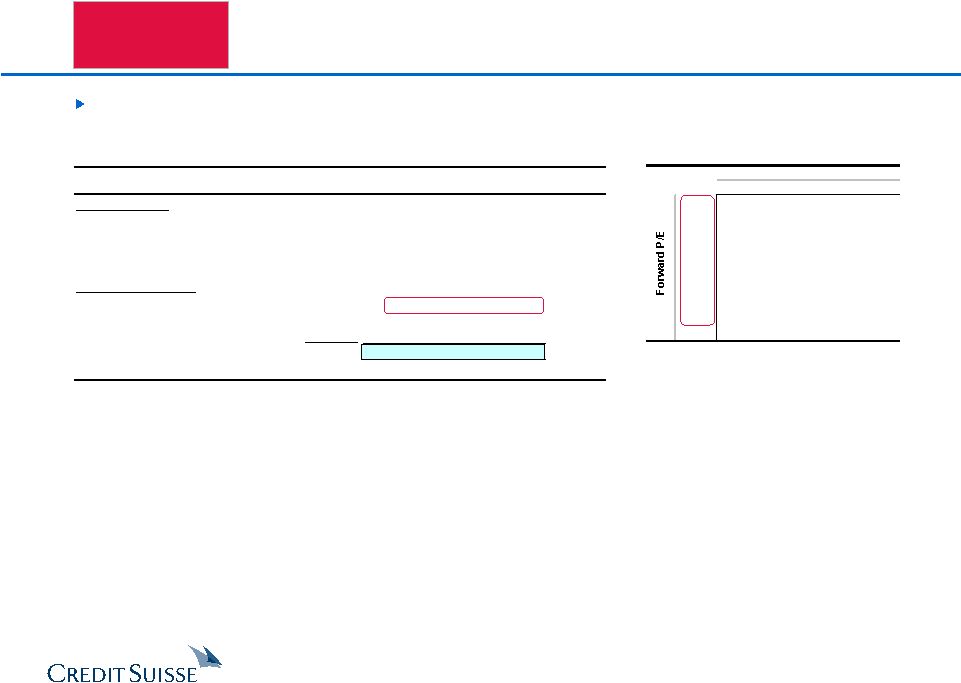 37 CONFIDENTIAL D R A F T Sensitivity Analysis – Implied PV of 2008E Stock Price '05 - '09 EPS CAGR 11.6% 12.6% 13.6% 15.0x $28.89 $29.94 $31.02 (13.3%) (10.2%) (6.9%) 16.0x $30.82 $31.94 $33.09 (7.5%) (4.2%) (0.7%) 16.7x $32.17 $33.33 $34.53 (3.5%) 0.0% 3.6% 18.0x $34.67 $35.93 $37.22 4.0% 7.8% 11.7% 19.0x $36.60 $37.92 $39.29 9.8% 13.8% 17.9% Note: Arrow's historical 3-year average forward P/E multiple is 17.1x. Note: Percentages reflect premium / (discount) to management's plan. Implement Strategic Plan Analysis assumes an estimate of Arrow’s share price discounted to September 2006 Illustrative Future Share Price Analysis ($ in millions, except per share data) '05 - '09 FYE 9/30, 2005A 2006E 2007E 2008E 2009E CAGR Management Case Revenue $10,963 $11,599 $12,222 $12,904 $13,624 5.6% % Growth 7.6% 5.8% 5.4% 5.6% 5.6% EPS $1.53 $1.62 $1.86 $2.16 $2.46 12.6% % Growth 12.5% 5.9% 14.8% 16.1% 13.9% Implied Value per Share Assumed Forward P/E Multiple 16.7x 16.7x 16.7x Implied Future Stock Price $36.07 $41.08 $46.26 PV Stock Price Status Quo @ 11.0% Cost of Equity (1) $28.11 $32.50 $33.33 $33.81 % Premium / (Discount) to Pre-Offer 15.6% 18.6% 20.3% (1) Based on beta of 0.67 from Barra; risk-free rate of 5.2%; size premium of 0.75% from Ibbotson 2005 yearbook. to reflect the value of these securities or the prices at which securities actually may be sold. Calculations based upon estimates of future results are not necessarily indicative of actual future results, which may be significantly more or less favorable than These calculations are based upon management estimates of EPS growth rates and current public market trading multiples. These calculations do not purport those suggested by these calculations. |
 38 CONFIDENTIAL D R A F T ALTERNATIVE RATIONALE CONSIDERATIONS Willingness of G&K to sell; may require premium multiple Improves margins, but may not significantly impact top-line growth Integration risk Potentially higher growth, higher margin businesses (e.g., consumables, etc.) Multiple opportunities for cross-selling to existing client base Further diversifies revenue stream Identifying actionable businesses of scale Potentially higher valuations Integration risk / management expertise to run new businesses Expand AUCA via Acquisition of G&K Expand FSS via Acquisition of Elior New Market Opportunities Significantly expands Arrow’s operations in Europe Further diversifies Arrow’s geographic presence Potential to realize material synergies Actionability given current going-private tender offer – Consortium led by founder and CEO who controls 20% stake – Recommended by board and approved by European Commission Business mix – Concentration in French market (59% of revenue) – Concession catering (39% of revenue) generally viewed as less attractive than contract catering Integration risk Most actionable of the three remaining U.S. public players Complementary geographic coverage Potential to realize material synergies Pursue Significant Acquisition(s) Selected Acquisition Opportunities Other Potential Targets Elis Davis Service Group UniFirst Autogrill Delaware North Dussmann ISS |
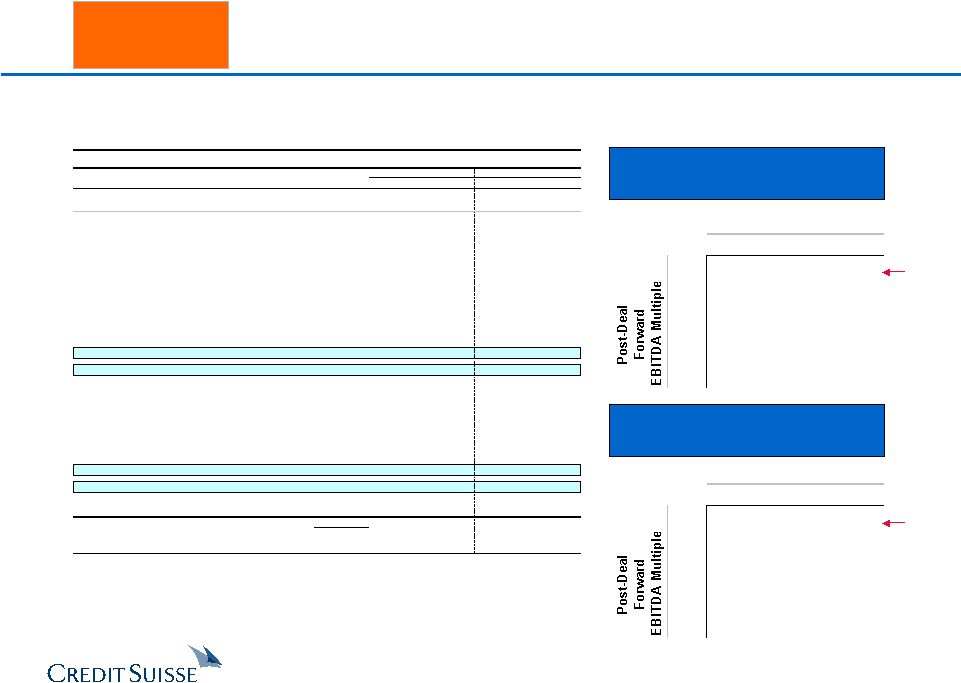 39 CONFIDENTIAL D R A F T Pursue Significant Acquisition(s) G&K Services Acquisition Post-Deal Share Price without synergies Post-Deal Share Price with $50mm synergies (100% Cash) (100% Cash) Note: Percentages below per share values represent accretion / (dilution) to pre-offer Arrow share price of $28.11. Current Multiple Current Multiple ($ in millions) 100% Cash / 0% Stock 50% Cash / 50% Stock Acquisition Price / Share Acquisition Price / Share $45.00 $50.00 $45.00 $50.00 Premium to Current (5/31/06) 16.5% 29.5% 16.5% 29.5% Equity Value $970 $1,083 $970 $1,083 Enterprise Value $1,178 $1,291 $1,178 $1,291 Multiple of 2006E EBITDA 10.1x 11.1x 10.1x 11.1x Pro Forma Arrow Ownership 100.0% 100.0% 92.5% 91.7% Pro Forma G&K Services Ownership – – 7.5% 8.3% FY2007E Pro Forma EPS Excluding Synergies $1.83 $1.80 $1.82 $1.78 $ Accretion / (Dilution) (0.03) (0.07) (0.05) (0.08) % Accretion / (Dilution) (1.7%) (3.7%) (2.5%) (4.4%) Pre-Tax Synergies Required to Break-Even $9 $19 $14 $25 % Accretion / (Dilution) with $50MM of Synergies (1) 8.0% 6.0% 6.5% 4.4% PF Cash EPS % Accretion / (Dilution) Excluding Synergies (2) 0.6% (1.1%) (0.4%) (2.0%) PF Cash EPS % Accretion / (Dilution) with $50MM of Synergies (1)(2) 10.3% 8.6% 8.6% 6.9% FY2008E Pro Forma EPS Excluding Synergies $2.18 $2.14 $2.14 $2.10 $ Accretion / (Dilution) 0.02 (0.02) (0.02) (0.06) % Accretion / (Dilution) 0.9% (0.8%) (1.0%) (2.8%) Pre-Tax Synergies Required to Break-Even NM $5 $7 $18 % Accretion / (Dilution) with $50MM of Synergies (1) 9.3% 7.5% 6.7% 4.8% PF Cash EPS % Accretion / (Dilution) Excluding Synergies (2) 2.9% 1.4% 0.8% (0.7%) PF Cash EPS % Accretion / (Dilution) with $50MM of Synergies (1)(2) 11.3% 9.8% 8.6% 6.9% Preliminary Credit Analysis Stand-Alone Total Debt (3) / LTM EBITDA 2.0x 2.9x 3.0x 2.4x 2.5x Total Debt (3) / Book Capitalization 57.4% 68.9% 69.7% 58.1% 57.9% (1) Company estimates. (2) Excludes amortization expense associated with the transaction. (3) Acquiror total and net debt include convertible debt and capitalized leases. Note: Assumes transaction closes 9/30/06; interest rate of 7.5% on new debt; identifiable intangibles at 15% of excess purchase price over net tangible book value, amortized Note: over 10 years. Acquisition Purchase Price $45.00 $50.00 $27.98 $27.33 (0.5%) (2.8%) $29.35 $28.70 4.4% 2.1% $32.05 $31.40 14.0% 11.7% $34.76 $34.11 23.7% 21.3% 6.7x 7.0x 7.5x 8.0x Acquisition Purchase Price $45.00 $50.00 $26.12 $25.47 (7.1%) (9.4%) $27.40 $26.75 (2.5%) (4.8%) $29.97 $29.32 6.6% 4.3% $32.54 $31.89 15.7% 13.4% 6.7x 7.0x 7.5x 8.0x |
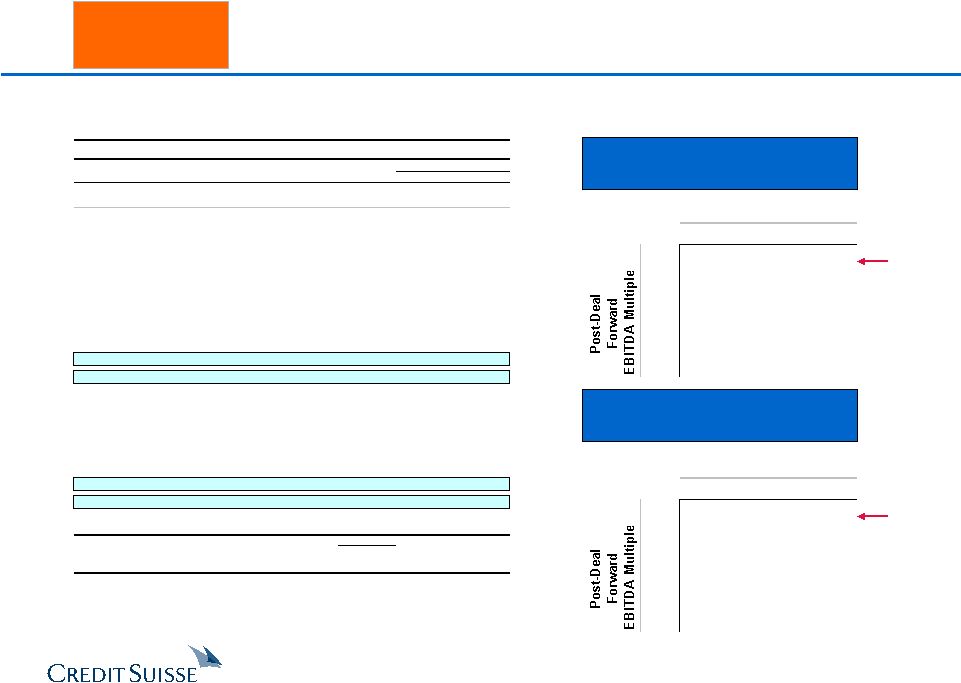 40 CONFIDENTIAL D R A F T Pursue Significant Acquisition(s) Elior Acquisition Post-Deal Share Price without synergies Post-Deal Share Price with $40mm synergies (100% Cash) (100% Cash) Note: Percentages below per share values represent accretion / (dilution) to pre-offer Arrow share price of $28.11. Current Multiple Current Multiple Acquisition Purchase Price Offer Price 10% Premium $25.18 $23.93 (10.4%) (14.9%) $26.21 $24.98 (6.7%) (11.1%) $28.80 $27.54 2.4% (2.0%) $31.35 $30.10 11.5% 7.1% 6.7x 7.0x 7.5x 8.0x Acquisition Purchase Price Offer Price 10% Premium $26.67 $25.42 (5.1%) (9.6%) $27.77 $26.54 (1.2%) (5.6%) $30.47 $29.21 8.4% 3.9% $33.13 $31.88 17.9% 13.4% 6.7x 7.0x 7.5x 8.0x ($ in millions) 100% Cash / 0% Stock Offer Price (1) $16.53 $18.19 Premium to Current (5/31/06) – 10.0% Equity Value $2,182 $2,402 Enterprise Value $2,749 $2,968 Multiple of 2006E EBITDA 8.5x 9.1x Pro Forma Arrow Ownership 100.0% 100.0% Pro Forma Elior Ownership – – FY2007E Pro Forma EPS Excluding Synergies $1.79 $1.70 $ Accretion / (Dilution) (0.08) (0.16) % Accretion / (Dilution) (4.2%) (8.8%) Pre-Tax Synergies Required to Break-Even $22 $45 % Accretion / (Dilution) with $40MM of Synergies (2) 3.6% (1.0%) PF Cash EPS % Accretion / (Dilution) Excluding Synergies (3) 3.8% (0.2%) PF Cash EPS % Accretion / (Dilution) with $40MM of Synergies (2)(3) 11.5% 7.6% FY2008E Pro Forma EPS Excluding Synergies $2.15 $2.06 $ Accretion / (Dilution) (0.01) (0.10) % Accretion / (Dilution) (0.7%) (4.6%) Pre-Tax Synergies Required to Break-Even $4 $28 % Accretion / (Dilution) with $40MM of Synergies (2) 6.0% 2.1% PF Cash EPS % Accretion / (Dilution) Excluding Synergies (3) 6.2% 2.8% PF Cash EPS % Accretion / (Dilution) with $40MM of Synergies (2)(3) 12.9% 9.5% Preliminary Credit Analysis Stand-Alone Total Debt (4) / LTM EBITDA 2.0x 3.8x 3.9x Total Debt (4) / Book Capitalization 57.4% 77.2% 78.0% (1) Current bid of €13.40 converted at $1.2338 / €1.000. (2) Assumes synergies of 1.5% of target revenues. (3) Excludes amortization expense associated with the transaction. (4) Acquiror total net debt includes convertible debt and capital leases. Note: Assumes transaction closes 9/30/06; interest rate of 9.0% on new debt; identifiable intangibles of 15% of excess purchse price Note: amortized over 10 years. |
 41 CONFIDENTIAL D R A F T ALTERNATIVE ADVANTAGES CONSIDERATIONS Current initiatives aimed at unlocking synergy value Dilutive to margins / ROIC Creates pure-play foodservice company Historically limited synergy between segments Promotes management focus / facilitates creation of incentive tools on individual segments Important to servicing global customers Tax leakage Probable valuation discount to recent historical trends Appears to be value dilutive to neutral Divest FSS – International Divest AUCA Promotes focus on higher margin U.S. businesses Cash proceeds could be used to expand higher ROIC businesses Would likely attract interest from several potential strategic buyers Separate Business Units Divestiture Considerations PROCESS OBSERVATIONS Spin-off / Split-off Increases probability of realizing higher multiple for uniform business Potentially tax-efficient structure Viable public market company Allows stockholders to “self select” May increase value enhancing alternatives for uniform segment Sale Likely significant interest from financial sponsors Limited group of strategic buyers given transaction size Tax leakage Sale appears to provide some value accretion Likely not candidate for public market alternatives Could expect significant interest in sale process |
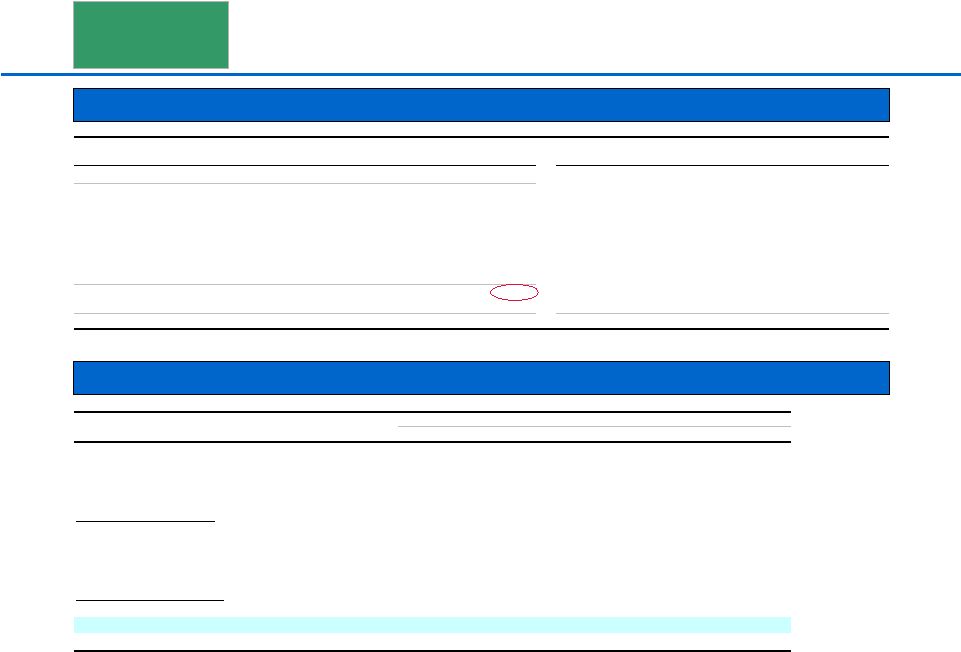
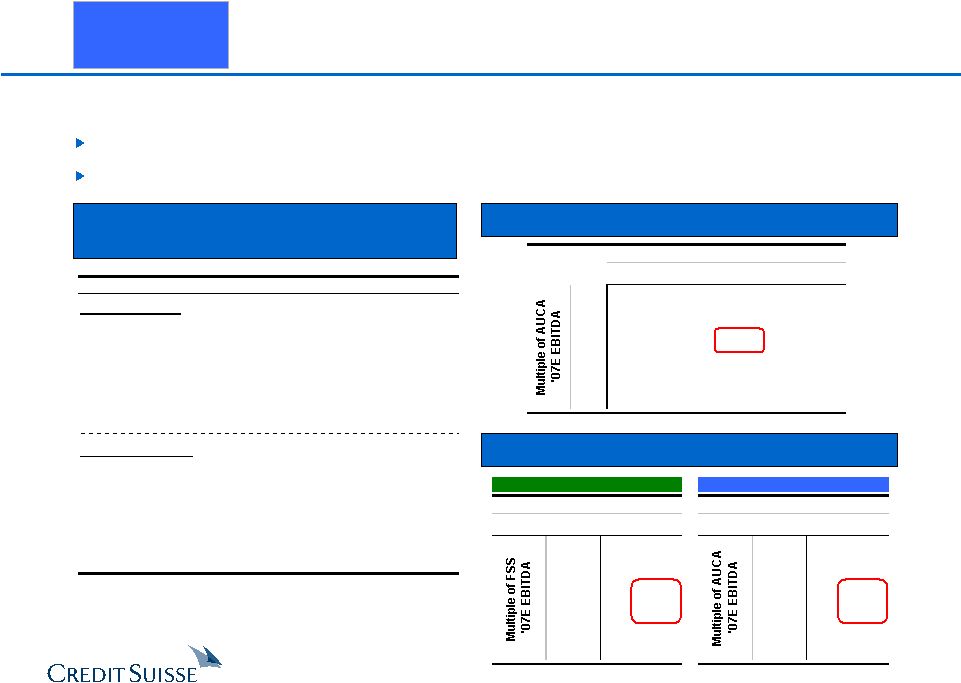 42 CONFIDENTIAL D R A F T A spin-off of AUCA could be a tax-efficient alternative to a straight sale Stockholders could benefit from pure-play economics Assumes spin-off is effective September 2006 Separate Business Units Spin-Off AUCA Implied Effective Value – Consolidated Pro Forma Stand-alone Business Unit Financials Implied Effective Value – By Segment Note: Percentages below per share values represent accretion / (dilution) to pre-offer Arrow share price of $28.11. Note: Percentages below per share values represent segment’s contribution to overall share price. ($ in milliions) FYE 9/30, 2006E 2007E FSS Standalone Revenue $9,969.8 $10,508.9 % Growth 6.0% 5.4% EBITDA (1) $748.2 $803.7 % Margin 7.5% 7.6% Debt / EBITDA (1) 2.1x – AUCA Standalone Revenue $1,629.5 $1,713.2 % Growth 4.9% 5.1% EBITDA (1) $205.6 $225.9 % Margin 12.6% 13.2% Debt / EBITDA (1) 2.1x – Source: Management estimates provided to CS on May 25, 2006. (1) Assumes 100% of corporate overhead and debt allocated based on EBITDA contribution PF Trading Multiple of FSS '07E EBITDA 6.0x 6.7x 8.0x $23.92 $26.99 $32.68 (14.9%) (4.0%) 16.2% $25.16 $28.22 $33.90 (10.5%) 0.4% 20.6% $26.39 $29.45 $35.13 (6.1%) 4.8% 25.0% 9.0x 8.0x 7.0x FSS AUCA Multiple of AUCA '07E EBITDA Multiple of FSS '07E EBITDA AUCA Midpoint 8.0x FSS Midpoint 6.7x $18.30 $6.13 72.7% 22.7% $21.13 $7.09 74.9% 25.1% $26.47 $8.07 78.1% 27.4% 6.0x 6.7x 8.0x 7.0x 8.0x 9.0x |
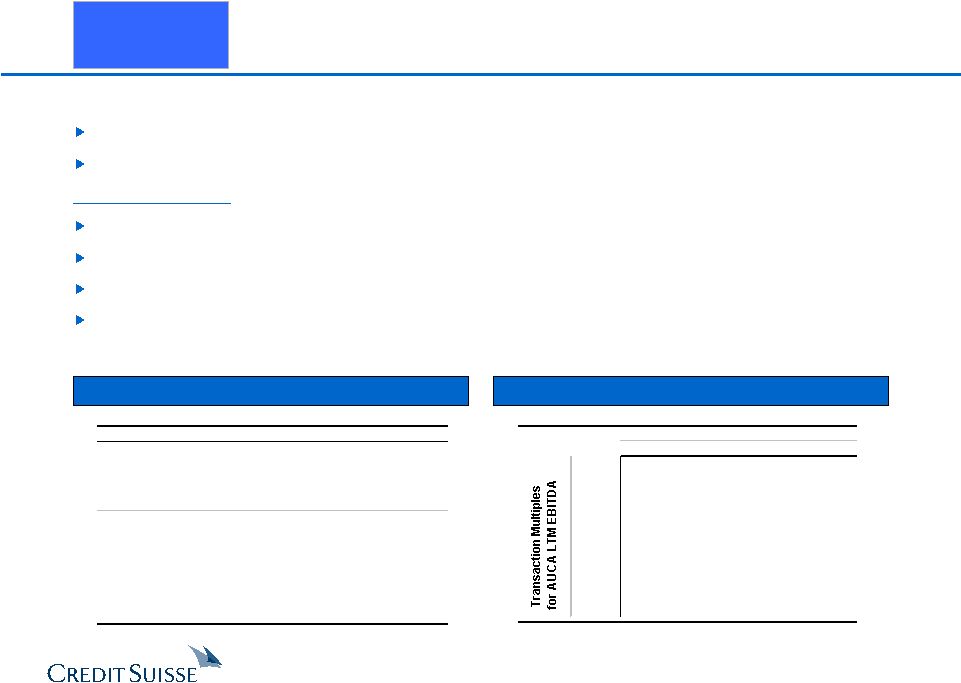 43 CONFIDENTIAL D R A F T A sale of AUCA would provide significant cash proceeds to Arrow Limited group of strategic buyers CS believes an auction would garner significant financial sponsor interest Key Assumptions Transaction close of September 2006 AUCA is sold for 9.0x – 11.5x LTM EBITDA Tax basis of $960 million (based on management estimates) Proceeds used to pay down debt (alternative uses could include share buyback) Illustrative Analysis of Proceeds Estimated Value to Arrow Stockholders Separate Business Units Divest AUCA ($ in millions) LOW HIGH Potential Sale of AUCA $1,948 – $2,381 Assumed Tax Basis 960 Gain on Sale $988 – $1,421 Cash Taxes (at 37.5%) 370 – 533 Net Cash Proceeds to Arrow $1,577 – $1,848 Implied Effective Multiple 7.3x – 8.5x Note: Percentages below per share values represent accretion / (dilution) to pre-offer Arrow share price of $28.11. PF Multiples of Arrow '07E EBITDA 6.0x 6.7x 8.0x 9.00x $26.02 $29.26 $35.26 (7.4%) 4.1% 25.4% 10.25x $26.94 $30.18 $36.18 (4.2%) 7.3% 28.7% 11.50x $27.86 $31.09 $37.10 (0.9%) 10.6% 32.0% |
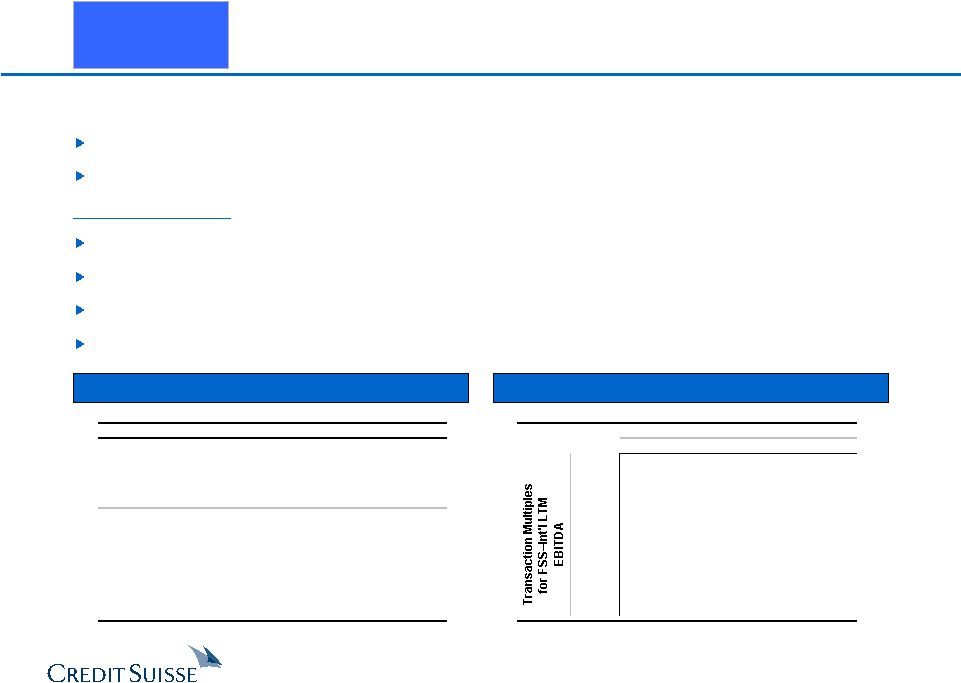 44 CONFIDENTIAL D R A F T Arrow could sell its International business and focus exclusively on its U.S. operations Would be attractive to both strategic buyers and financial sponsors Historical performance vs. broader peer group could lead to discounted valuation Key Assumptions Transaction close as of September 2006 FSS–International is sold for 8.0x – 10.0x LTM EBITDA Tax basis of $728 million (based on management estimates) Proceeds used to pay down debt (alternative uses could include share buyback) Illustrative Analysis of Proceeds Estimated Value to Arrow Stockholders Separate Business Units Divest FSS–International ($ in millions) LOW HIGH Potential Sale of FSS–Int'l $903 – $1,204 Assumed Tax Basis 728 Gain on Sale $175 – $476 Cash Taxes (at 37.5%) 65 – 178 Net Cash Proceeds to Arrow $837 – $1,025 Implied Effective Multiple 5.6x – 6.8x Note: Percentages below per share values represent accretion / (dilution) to pre-offer Arrow share price of $28.11. (x) PF Multiples of Arrow '07E EBITDA 6.0x 6.7x 8.0x 8.0x $25.25 $28.75 $35.24 (10.2%) 2.3% 25.4% 9.0x $25.77 $29.26 $35.75 (8.3%) 4.1% 27.2% 10.0x $26.28 $29.77 $36.26 (6.5%) 5.9% 29.0% |
 45 CONFIDENTIAL D R A F T ALTERNATIVE ADVANTAGES CONSIDERATIONS One-time benefit Depresses stock option value Forego EPS accretion associated with a repurchase Can be modified opportunistically to manage capital structure Equitable way to return cash to stockholders Unlikely to be viable response to current proposal Decreases future flexibility – difficult to decrease once raised Depresses stock option value Forego EPS accretion Increase Regular Dividend Significant Share Repurchase Issue Special Dividend Significant repurchase can be affected at a premium to current stock price Allows stockholders to “self select”; helps manage exodus of arbs in the absence of a transaction EPS accretive Increases leverage Depending on insider participation, may enhance control position Provides credible signal about strong future cash flow generation Facilitates payout ratio which compares more favorably to peer group Equitable way to return cash to stockholders Perceived as good corporate governance, as regular dividends reduce investor concerns regarding EPS management vs. a repurchase strategy Recapitalization / Repurchase Overview of Capital Distribution Strategies |
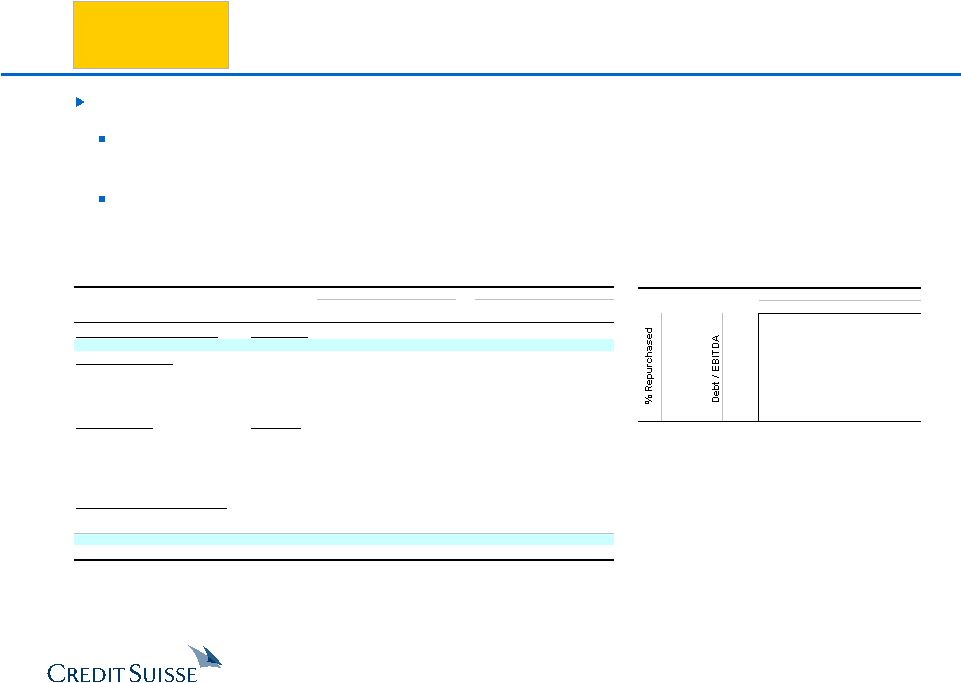 46 CONFIDENTIAL D R A F T Analysis reflects the value of Arrow on a per share basis assuming a recapitalization CS believes Arrow could increase leverage to 2.5x EBITDA and repurchase a meaningful amount of stock, while maintaining its investment grade rating CS believes leverage of 4.5x EBITDA could be achieved without the market viewing Arrow as “over-levered” Analysis of Share Repurchase Recapitalization / Repurchase PF Value Per Share (@ $34 Repurchase Price) – % Premium to Pre-Offer Price Forward P/E $0.00 15.5x 16.7x 17.5x 10% 2.5x $29.70 $31.73 $33.09 5.7% 12.9% 17.7% 26% 3.5x $31.18 $32.91 $34.07 10.9% 17.1% 21.2% 42% 4.5x $32.53 $33.94 $34.88 15.7% 20.7% 24.1% ($ in millions, except per share data) Repurchase Price per Share Repurchase Price per Share $32.00 $34.00 $36.00 $32.00 $34.00 $36.00 % Premium 13.8% 21.0% 28.1% 13.8% 21.0% 28.1% Pro Forma LTM Credit Statistics Status Quo (1) Debt / EBITDA 1.9x 2.5x 2.5x 2.5x 4.5x 4.5x 4.5x Transaction Overview New Debt Issued $618 $618 $618 $2,554 $2,554 $2,554 Shares Repurchased (MM) 19.3 18.2 17.2 79.8 75.1 71.0 % of Shares Outstanding 10.8% 10.1% 9.6% 44.5% 41.9% 39.6% Financing Rate (2) 7.15% 7.15% 7.15% 7.26% 7.26% 7.26% Implied Valuation Status Quo FY07E EPS $1.86 $1.90 $1.88 $1.87 $2.12 $2.03 $1.95 % Accretion / (Dilution) 2.0% 1.3% 0.7% 14.1% 9.1% 5.1% FY07E P/E Multiple 16.7x 16.7x 16.7x 15.5x 15.5x 15.5x PF Implied Arrow Stock Price $31.69 $31.48 $31.28 $32.88 $31.46 $30.30 Implied 2007E EBITDA Multiple 7.4x 7.4x 7.4x 7.6x 7.6x 7.6x Effective Value Per Average Share Average Value Received in Repurchase $3.45 $3.45 $3.45 $14.25 $14.25 $14.25 Residual Value of Arrow Equity 28.28 28.29 28.29 18.24 18.28 18.31 Total Value per Share $31.73 $31.73 $31.74 $32.49 $32.53 $32.55 % Premium to Pre-Offer Price 12.9% 12.9% 12.9% 15.6% 15.7% 15.8% Note: Analysis assumes management estimates provided to CS on May 25, 2006, Arrow pre-offer stock price of $28.11 and 179 million basic shares outstanding. (1) Assumes debt balance at the end of FY2006 of $1,803.0 million and EBITDA of $968.3 million. (2) Assumes financing rates of L + 1.75% on new bank debt and 7.50% on new senior unsecured notes. |
 47 CONFIDENTIAL D R A F T Analysis of Share Repurchase (cont’d) Recapitalization / Repurchase Analysis reflects the value of Arrow on a per share basis assuming a recapitalization Assumes PF total debt / LTM 6/30/06E EBITDA of 4.5x and repurchase at $34 per share, or approximately 42% of outstanding shares Sources & Uses ($ in millions) Spread / x of LTM Sources Amount % Int. Rate Adj. EBITDA Uses Amount % New Bank Debt $1,109.9 43% 1.75% 1.1x Repurchase Shares $2,490.6 98% Senior Unsecured Notes 1,444.6 57% 7.50% 1.5x Transaction Expenses 63.9 3% Total Sources $2,554.4 100% – 2.6x Total Uses $2,554.4 100% Note: Leverage multiple based on 6/30/06E LTM adjusted EBITDA of $968.3 million (per management estimates). These calculations are based upon management estimates of EPS growth rates and current public market trading multiples. These calculations do not purport to reflect the value of these securities or the prices at which securities actually may be sold. Calculations based upon estimates of future results are not necessarily indicative of actual future results, which may be significantly more or less favorable than those suggested by these calculations. Summary Projected Financials ($ in millions) LTM Projected Fiscal Year Ending September 30, 09/30/06 2007 2008 2009 2010 2011 Revenues $11,599 $12,222 $12,904 $13,624 $14,378 $15,162 % Growth -- 5.4% 5.6% 5.6% 5.5% 5.5% Adjusted Net Income $207 $214 $261 $310 $355 $409 % Margin 1.8% 1.8% 2.0% 2.3% 2.5% 2.7% Adjusted EPS $1.90 $2.03 $2.49 $2.96 $3.39 $3.90 % Accretion / (Dilution) 17.5% 9.1% 15.5% 20.3% 22.5% 24.7% P/E Multiple 15.5x 15.5x 15.5x 15.5x 15.5x NA PV Implied Price per Share (1) $31.46 $34.83 $37.23 $38.45 $39.86 NA Effective Value per Share Average Value Received in Repurchase $14.25 $14.25 $14.25 $14.25 $14.25 $14.25 Residual Value of Arrow Equity 18.28 20.24 21.63 22.33 23.16 NA Effective Value per Share $32.53 $34.48 $35.87 $36.58 $37.41 NA Balance Sheet Summary Cash $44 $44 $44 $44 $44 $44 Bank Debt $2,663 $2,445 $2,176 $1,934 $1,599 $1,211 Cumulative Bank Debt Paid Down 8.2% 18.3% 27.4% 40.0% 54.5% Total Debt $4,357 $4,139 $3,870 $3,628 $3,294 $2,906 Credit Statistics Summary Senior Debt / EBITDA 2.7x 2.4x 2.0x 1.7x 1.3x 0.9x Total Debt / EBITDA 4.4x 4.0x 3.5x 3.1x 2.6x 2.2x Note: Analysis assumes implied price per share discounted to present value at cost of equity of 11.0%. Pro Forma Ownership (shares in millions) Current Participates Pro Rata Does Not Participate Joseph Neubauer A Shares 23.8 13.8 23.8 B Shares 0.0 0.0 0.0 Total Shares 23.8 13.8 23.8 Economic Interest 13.3% 13.3% 22.8% Voting Interest 33.7% 33.7% 49.6% Public Float 67.2% 67.2% 59.8% |
 48 CONFIDENTIAL D R A F T Analysis of Share Repurchase (cont’d) Recapitalization / Repurchase Analysis reflects the value of Arrow on a per share basis assuming a recapitalization Assumes PF total debt / LTM 6/30/06E EBITDA of 2.5x and repurchase at $34 per share, or approximately 10% of outstanding shares Sources & Uses ($ in millions) Spread / x of LTM Sources Amount % Int. Rate Adj. EBITDA Uses Amount % New Bank Debt $383.6 62% 1.75% 0.4x Repurchase Shares $602.3 98% Senior Unsecured Notes 234.2 38% 7.50% 0.2x Transaction Expenses 15.4 3% Total Sources $617.8 100% – 0.6x Total Uses $617.8 100% Note: Leverage multiple based on 6/30/06E LTM adjusted EBITDA of $968.3 million (per management estimates). These calculations are based upon management estimates of EPS growth rates and current public market trading multiples. These calculations do not purport to reflect the value of these securities or the prices at which securities actually may be sold. Calculations based upon estimates of future results are not necessarily indicative of actual future results, which may be significantly more or less favorable than those suggested by these calculations. Summary Projected Financials ($ in millions) LTM Projected Fiscal Year Ending September 30, 09/30/06 2007 2008 2009 2010 2011 Revenues $11,599 $12,222 $12,904 $13,624 $14,378 $15,162 % Growth -- 5.4% 5.6% 5.6% 5.5% 5.5% Adjusted Net Income $295 $307 $357 $409 $459 $518 % Margin 2.5% 2.5% 2.8% 3.0% 3.2% 3.4% Adjusted EPS $1.78 $1.88 $2.21 $2.53 $2.84 $3.20 % Accretion / (Dilution) 9.8% 1.3% 2.2% 2.9% 2.6% 2.3% P/E Multiple 16.7x 16.7x 16.7x 16.7x 16.7x NA PV Implied Price per Share (1) $31.48 $33.20 $34.32 $34.70 $35.24 NA Effective Value per Share Average Value Received in Repurchase $3.45 $3.45 $3.45 $3.45 $3.45 $3.45 Residual Value of Arrow Equity 28.29 29.84 30.84 31.18 31.67 NA Effective Value per Share $31.73 $33.28 $34.29 $34.63 $35.12 NA Balance Sheet Summary Cash $44 $44 $44 $44 $44 $44 Bank Debt $1,937 $1,633 $1,274 $938 $506 $15 Cumulative Bank Debt Paid Down 15.7% 34.2% 51.6% 73.9% 99.2% Total Debt $2,421 $2,117 $1,758 $1,422 $990 $499 Credit Statistics Summary Senior Debt / EBITDA 2.0x 1.6x 1.2x 0.8x 0.4x 0.0x Total Debt / EBITDA 2.5x 2.1x 1.6x 1.2x 0.8x 0.4x Note: Analysis assumes implied price per share discounted to present value at cost of equity of 11.0%. Pro Forma Ownership (shares in millions) Current Participates Pro Rata Does Not Participate Joseph Neubauer A Shares 23.8 21.4 23.8 B Shares 0.0 0.0 0.0 Total Shares 23.8 21.4 23.8 Economic Interest 13.3% 13.3% 14.8% Voting Interest 33.7% 33.7% 36.5% Public Float 67.2% 67.2% 66.1% |
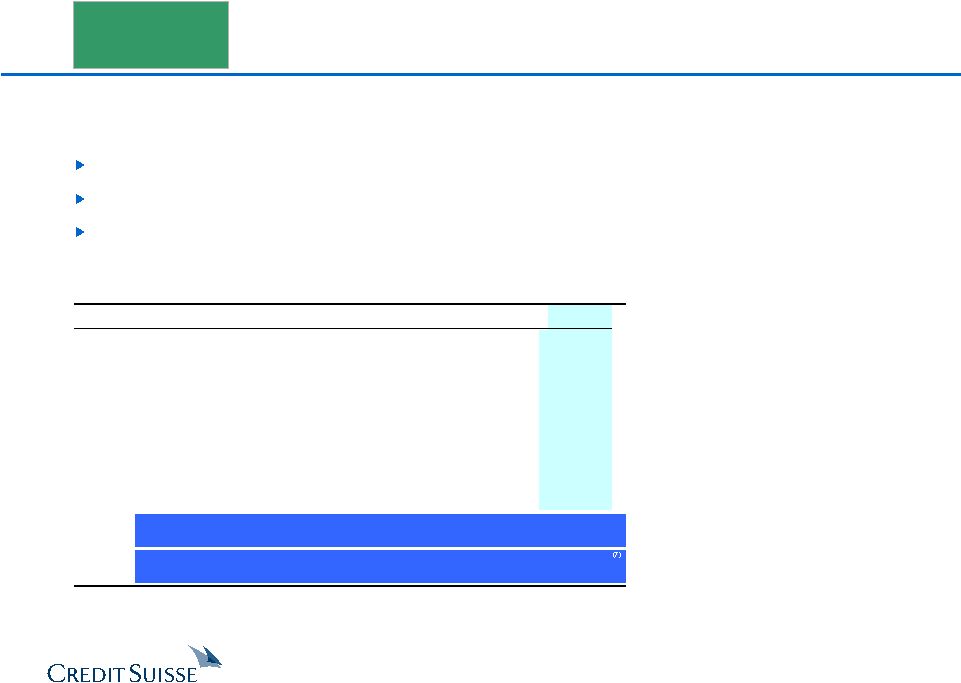  49 CONFIDENTIAL D R A F T Recent LBO precedents indicate the debt markets are willing to finance highly leveraged transactions. Debt markets remain very strong by historical standards A number of recent “going private” transactions have employed significant leverage Based on preliminary analysis, CS believes an LBO could be affected with leverage levels ranging from 6.5x – 7.0x debt / LTM EBITDA (1) Equity Invested includes $160 million of rollover equity. Assumes $500 million Holdco bridge outstanding. (2) Not pro forma for the Dovonex acquisition. (3) Equity Invested includes $119 million of rollover equity. (4) Equity Invested includes $35 million of non-cash consideration in form of warrants issued to Time Warner, offset in part by write-off of $11 million of prepaid financing-related fees. (5) As of the time of the Dynamit Nobel acquisition. Equity Invested includes $404 million of new cash equity (6) Equity Invested includes $309 million of rollover equity. (7) Based on adjusted LTM EBITDA (June 30) of $968.3 million. Leveraged Buyout Overview of Recent LBOs Recent Large LBO Transactions ($ in millions) Date of Enterprise Initial Equity Total Debt Equity Total Debt / Acquisition Transaction Value Invested as % of EV as % of EV EBITDA Jul-05 Sungard (1) $12,138 $3,660 69.8% 30.2% 7.5x Jan-05 Warner Chilcott (2) 3,283 1,283 60.9% 39.1% 7.3x Pending EDMC 3,250 1,300 60.0% 40.0% 6.7x Sep-04 Vanguard Health (3) 1,930 749 61.2% 38.8% 6.7x Jul-04 PanAm Sat 4,370 550 87.4% 12.6% 6.4x Oct-05 Neiman Marcus 4,740 1,467 69.1% 30.9% 6.3x Apr-04 Warner Music (4) 2,924 1,074 63.3% 36.7% 5.9x Jan-05 Intelsat 5,172 515 90.0% 10.0% 5.9x Jul-04 Rockwood (5) 3,666 760 79.3% 20.7% 5.9x Jul-04 Loews Theaters 1,545 447 71.1% 28.9% 5.4x Sep-04 Jostens (6) 2,267 568 74.9% 25.1% 5.1x Mean $4,117 $1,125 71.5% 28.5% 6.3x Median 3,283 760 69.8% 30.2% 6.3x Current Proposal $7,853 $1,922 75.5% 24.5% 6.4x % Variance to Mean 90.8% 70.9% 5.6% (14.0%) 2.0% |
 50 CONFIDENTIAL D R A F T Adjustments focused on getting “credit” for unusual items that have negatively impacted LTM performance CS has assumed the adjustments taken would be accepted by the market Further support increased leverage in the capital structure Leveraged Buyout LTM Adjusted EBITDA Bridge ($ in millions) As of 6/30/06 Reported EBITDA $938.7 Adjustments: Non-cash option expense $12.9 RSU's 4.0 PF SeamlessWeb EBITDA 5.0 $26.5 PF Iron City EBITDA 2.4 PF Park Avenue EBITDA 2.2 Hurricane impact 5.5 New Orleans Convention Center 4.1 Loss on sale of Glen Cove 2.1 Spain business conduct policy 1.9 Bad debts – airline bankruptcies 1.6 Schlumberger business conduct policy 1.2 Divested earnings (Quantum) (1.1) Gain on disposal of vending divisions (1.2) Gain on Premier (1.9) Gain on Quantum divestiture (2.9) Katrina insurance proceeds (6.2) Total Adjustments $29.7 Adjusted LTM EBITDA $968.3 The following adjustments have been proposed by the management team to the financing consortium as the “financeable LTM 6/30/06E EBITDA ” |
 51 CONFIDENTIAL D R A F T ($ in millions) Spread / x of LTM Sources Amount % Int. Rate Adj. EBITDA Uses Amount % Excess Cash $0.0 0% – 0.00x Equity Purchase Price @ $35 per Share $6,455.2 74% Term Loan B $3,147.0 36% 2.25% 3.25x Refinance Term Loan B 1,553.0 18% A/R Securitization Facility 225.0 3% 1.00% 0.23x Rollover A/R Securitization Facility 225.0 3% 5.0% Notes due 2012 250.0 3% 5.00% 0.26x Rollover 5.00% Notes 250.0 3% Senior Unsecured Notes 847.3 10% 9.00% 0.88x Est. Prepayment Penalties 8.9 0% Senior Toggle Notes 847.3 10% 9.75% 0.88x Transaction Expenses 200.0 2% Senior Sub. Notes 1,210.4 14% 10.25% 1.25x Holdco PIK 251.2 3% 12.50% 0.26x Total Debt $6,778.2 78% – 7.00x Sponsors' Equity 1,913.9 22% – – Total Sources $8,692.1 100% – – Total Uses $8,692.1 100% Note: Leverage multiple based on 6/30/06E LTM adjusted EBITDA of $968.3 million (per management estimates). Leveraged Buyout Preliminary LBO Analysis Sources and Uses Financial Summary ($ in millions) LTM Projected Fiscal Year Ending September 30, 09/30/06 2007 2008 2009 2010 2011 Revenues $11,599 $12,222 $12,904 $13,624 $14,378 $15,162 % Growth -- 5.4% 5.6% 5.6% 5.5% 5.5% EBITDA $984 $1,030 $1,103 $1,171 $1,248 $1,320 % Margin 8.5% 8.4% 8.5% 8.6% 8.7% 8.7% Balance Sheet Summary Cash $44 $44 $44 $44 $44 $44 Bank Debt $3,622 $3,563 $3,459 $3,390 $3,236 $3,038 Cumulative Bank Debt Paid Down 1.6% 4.5% 6.4% 10.6% 16.1% Total Debt $6,778 $6,719 $6,616 $6,546 $6,393 $6,194 Credit Statistics Summary Senior Debt / EBITDA 3.7x 3.5x 3.1x 2.9x 2.6x 2.3x Total Debt / EBITDA 6.9x 6.5x 6.0x 5.6x 5.1x 4.7x EBITDA / Int. Exp. 1.7x 1.8x 1.9x 2.1x 2.2x 2.4x Source: Management estimates provided to CS on May 25, 2006. |
 52 CONFIDENTIAL D R A F T Purchase Price vs. Exit Multiple @ 7.0x Leverage Purchase Price vs. Leverage Note: Assumes 5-year return and total leverage at close of 7.0x 6/30/06E LTM adjusted EBITDA. Note: Assumes 5-year return and exit multiple of 8.5x FY11E EBITDA. Leveraged Buyout Illustrative LBO Return Sensitivity Analysis Premium to Pre-Bid 13.8% 21.0% 24.5% 28.1% 31.6% 35.2% Implied Offer Price $32.00 $34.00 $35.00 $36.00 $37.00 $38.00 Entry '06E EBITDA x 8.0x 8.4x 8.6x 8.8x 9.0x 9.2x 7.5x 22.9% 16.8% 14.4% 12.2% 10.3% 8.5% 8.0x 27.0% 20.7% 18.2% 15.9% 13.9% 12.1% 8.5x 30.5% 24.1% 21.5% 19.2% 17.1% 15.3% 9.0x 33.8% 27.2% 24.5% 22.1% 20.0% 18.1% 9.5x 36.7% 30.0% 27.3% 24.8% 22.7% 20.7% Premium to Pre-Bid 13.8% 21.0% 24.5% 28.1% 31.6% 35.2% Implied Offer Price $32.00 $34.00 $35.00 $36.00 $37.00 $38.00 Entry '06E EBITDA x 8.0x 8.4x 8.6x 8.8x 9.0x 9.2x 6.50x 25.8% 21.1% 19.1% 17.3% 15.6% 14.1% 6.75x 28.0% 22.5% 20.2% 18.2% 16.3% 14.6% 7.00x 30.5% 24.1% 21.5% 19.2% 17.1% 15.3% 7.25x 34.0% 26.1% 23.1% 20.4% 18.1% 16.0% 7.50x 38.7% 28.7% 25.1% 22.0% 19.2% 16.9% |
 53 CONFIDENTIAL D R A F T Possible Lead Sponsor Candidates Approx. Fund Size $16.0 15.0 12.5 10.2 8.0 7.9 7.3 7.3 6.1 5.8 5.2 Note: Fund size represents largest current fund. ($ in billions) CS believes there are a limited number of sponsors who have the required equity available to compete in a process. 1 - 2 additional consortia bidders may be formed Key considerations: Management willingness to partner with another sponsor group – Unclear whether another consortium would proceed with a bid without management’s backing – Management has stated its strong desire to partner with existing group – New sponsor’s willingness to offer management terms as attractive as existing agreement Alternatives to existing management team Strategic interest / ability to pay Leveraged Buyout Preliminary List of Potential Financial Buyers |
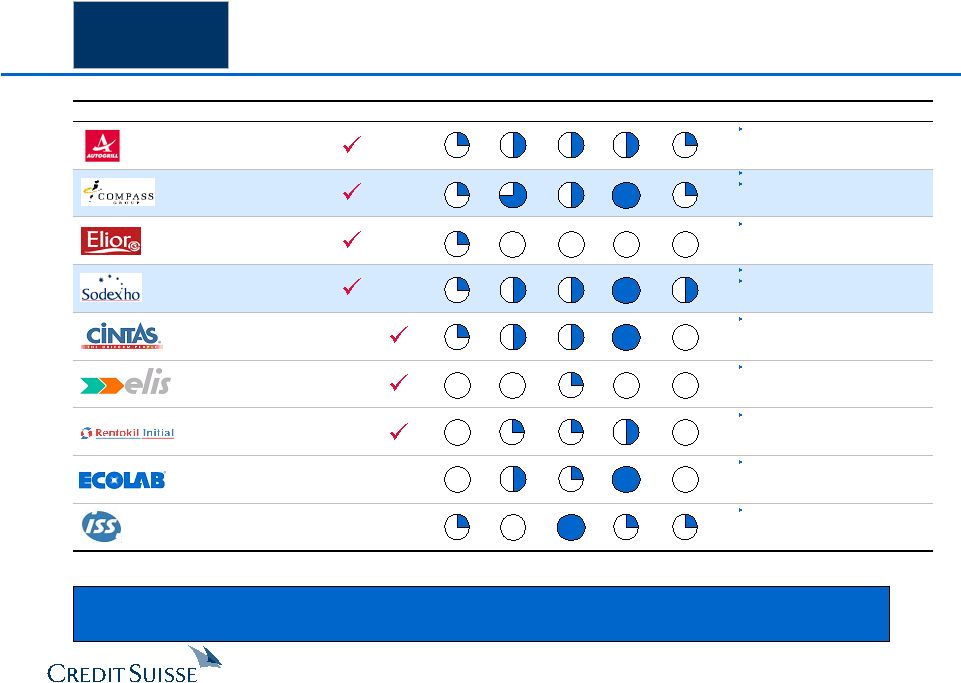 54 CONFIDENTIAL D R A F T ($ in millions) Foodservice Uniform Interest Financial U.S. Overall Buyer Financial Summary Focus Focus in Whole Capability Acquisitive Interest Assessment Comments '06E Sales $4,801 Mkt. Cap. 3,977 '06E Sales $20,913 Mkt. Cap. 9,568 '06E Sales $3,847 Mkt. Cap. 2,198 '06E Sales $16,091 Mkt. Cap. 7,345 '06E Sales $3,550 Mkt. Cap. 6,959 '06E Sales $1,278 Owned by Paribas Affaires Industrielles '06E Sales $4,544 Mkt. Cap. 5,022 '06E Sales $4,775 Mkt. Cap. 9,994 '06E Sales $7,921 Owned by GS Capital and EQT Note: Sodexho, Autogrill, Elior and Elis are converted at €1.272 / $1.000; Compass and Rentokil are converted at £1.855 / $1.000; ISS is converted at 0.171DKK / $1.000. While it may appear that there are a number of possible strategic parties, CS believes strategic interest in the whole Company will be limited. Primarily focused on roadway catering Internally focused Likely restricted to cash consideration given potential flowback or raising cash through sale of equity Recent LBO Has expressed interest Significant potential synergies No interest in foodservice; non-union focus in uniforms Large acquisition; likely focused on uniforms May be interested in uniform segment Has historically declined to compete with clients Recent LBO and overlapping investor limits credibility as competing bidder Corporate Merger / Sale of Company Potential Strategic Buyer Landscape |
 55 CONFIDENTIAL D R A F T Corporate Merger / Sale of Company Merger Consequences – Compass Acquires Arrow Source: Compass estimates based on Investext equity research. ($ in millions) 100% Cash / 0% Stock 50% Cash / 50% Stock Acquisition Price / Share Acquisition Price / Share $35.00 $38.00 $40.00 $35.00 $38.00 $40.00 Premium to Current (5/31/06) 6.9% 16.0% 22.1% 6.9% 16.0% 22.1% Equity Value $6,455 $7,032 $7,610 $6,455 $7,032 $7,610 Enterprise Value $8,302 $8,879 $9,457 $8,302 $8,879 $9,457 Multiple of 2006E EBITDA 8.7x 9.3x 9.9x 8.7x 9.3x 9.9x Pro Forma Compass Ownership 100.0% 100.0% 100.0% 74.7% 73.1% 71.5% Pro Forma Arrow Ownership – – – 25.3% 26.9% 28.5% FY2007E Pro Forma EPS Excluding Synergies $0.21 $0.19 $0.17 $0.23 $0.22 $0.21 $ Accretion / (Dilution) (0.07) (0.09) (0.11) (0.05) (0.07) (0.08) % Accretion / (Dilution) (24.3%) (31.6%) (38.8%) (18.2%) (23.1%) (27.7%) Pre-Tax Synergies Required to Break-Even $217 $282 $348 $221 $287 $352 % Accretion / (Dilution) with $171MM of Synergies (1) (5.2%) (12.5%) (19.8%) (4.2%) (9.3%) (14.3%) PF Cash EPS % Accretion / (Dilution) Excluding Synergies (2) (12.5%) (18.8%) (25.1%) (9.6%) (13.9%) (18.1%) PF Cash EPS % Accretion / (Dilution) with $171MM of Synergies (1)(2) 6.5% 0.2% (6.1%) 4.5% (0.2%) (4.7%) FY2008E Pro Forma EPS Excluding Synergies $0.28 $0.25 $0.23 $0.28 $0.26 $0.25 $ Accretion / (Dilution) (0.05) (0.07) (0.09) (0.04) (0.06) (0.07) % Accretion / (Dilution) (14.1%) (20.9%) (27.6%) (13.7%) (18.5%) (23.1%) Pre-Tax Synergies Required to Break-Even $136 $201 $266 $182 $251 $320 % Accretion / (Dilution) with $171MM of Synergies (1) 3.6% (3.1%) (9.9%) (0.8%) (5.9%) (10.8%) PF Cash EPS % Accretion / (Dilution) Excluding Synergies (2) (3.2%) (9.0%) (14.9%) (5.8%) (10.1%) (14.3%) PF Cash EPS % Accretion / (Dilution) with $171MM of Synergies (1)(2) 14.6% 8.7% 2.8% 7.1% 2.5% (2.0%) Preliminary Credit Analysis Stand-Alone Total Debt (3) / LTM EBITDA 3.7x 5.8x 6.1x 6.3x 4.4x 4.5x 4.7x Total Debt (3) / Book Capitalization 54.5% 76.0% 76.8% 77.5% 57.9% 57.6% 57.4% (1) Based on management estimates of $171 million. (2) Excludes amortization expense associated with the transaction. (3) Acquiror total and net debt include convertible debt and capitalized leases. Note: Assumes transaction closes 9/30/06; interest rate of 9.5% on new debt; identifiable intangibles at 15% of excess purchase price over net tangible book value, amortized over 10 years. |
 56 CONFIDENTIAL D R A F T Corporate Merger / Sale of Company Merger Consequences – Arrow Acquires Compass Source: Compass estimates based on Investext equity research. ($ in millions) 100% Cash / 0% Stock 50% Cash / 50% Stock Acquisition Price / Share Acquisition Price / Share $5.00 $5.50 $6.00 $5.00 $5.50 $6.00 Premium to Current (5/31/06) 13.0% 24.3% 35.6% 13.0% 24.3% 35.6% Equity Value $10,802 $11,912 $13,028 $10,802 $11,912 $13,028 Enterprise Value $15,480 $16,590 $17,706 $15,480 $16,590 $17,706 Multiple of 2006E EBITDA 11.1x 11.9x 12.8x 11.1x 11.9x 12.8x Pro Forma Arrow Ownership 100.0% 100.0% 100.0% 52.7% 50.3% 48.0% Pro Forma Compass Ownership – – – 47.3% 49.7% 52.0% FY2007E Pro Forma EPS Excluding Synergies $0.57 $0.12 ($0.34) $1.29 $1.10 $0.93 $ Accretion / (Dilution) (1.29) (1.75) (2.20) (0.57) (0.76) (0.93) % Accretion / (Dilution) (69.3%) (93.6%) (118.0%) (30.8%) (40.9%) (50.1%) Pre-Tax Synergies Required to Break-Even $358 $483 $609 $305 $424 $545 % Accretion / (Dilution) with $171MM of Synergies (1) (36.3%) (60.5%) (84.9%) (13.6%) (24.5%) (34.4%) PF Cash EPS % Accretion / (Dilution) Excluding Synergies (2) (30.7%) (51.8%) (72.9%) (10.7%) (20.1%) (28.7%) PF Cash EPS % Accretion / (Dilution) with $171MM of Synergies (1)(2) 2.3% (18.7%) (39.8%) 6.6% (3.6%) (13.0%) FY2008E Pro Forma EPS Excluding Synergies $1.11 $0.65 $0.20 $1.57 $1.37 $1.18 $ Accretion / (Dilution) (1.05) (1.51) (1.96) (0.59) (0.79) (0.98) % Accretion / (Dilution) (48.8%) (69.7%) (90.8%) (27.4%) (36.7%) (45.2%) Pre-Tax Synergies Required to Break-Even $292 $417 $542 $313 $441 $569 % Accretion / (Dilution) with $171MM of Synergies (1) (20.2%) (41.2%) (62.2%) (12.5%) (22.5%) (31.6%) PF Cash EPS % Accretion / (Dilution) Excluding Synergies (2) (15.4%) (33.6%) (51.8%) (10.0%) (18.7%) (26.7%) PF Cash EPS % Accretion / (Dilution) with $171MM of Synergies (1)(2) 13.1% (5.1%) (23.3%) 4.9% (4.5%) (13.2%) Preliminary Credit Analysis Stand-Alone Total Debt (3) / LTM EBITDA 2.0x 7.7x 8.2x 8.7x 5.4x 5.6x 5.9x Total Debt (3) / Book Capitalization 57.4% 92.5% 92.9% 93.3% 64.7% 64.0% 63.3% (1) Based on management estimates of $171 million. (2) Excludes amortization expense associated with the transaction. (3) Acquiror total and net debt include convertible debt and capitalized leases. Note: Assumes transaction closes 9/30/06; interest rate of 9.5% on new debt; identifiable intangibles of 15% of excess purchse price amortized over 10 years. |
 57 CONFIDENTIAL D R A F T Corporate Merger / Sale of Company Merger Consequences – Sodexho Acquires Arrow Source: Sodexho estimates based on Investext equity research. ($ in millions) 100% Cash / 0% Stock 50% Cash / 50% Stock Acquisition Price / Share Acquisition Price / Share $35.00 $38.00 $40.00 $35.00 $38.00 $40.00 Premium to Current (5/31/06) 6.9% 16.0% 22.1% 6.9% 16.0% 22.1% Equity Value $6,455 $7,032 $7,610 $6,455 $7,032 $7,610 Enterprise Value $8,302 $8,879 $9,457 $8,302 $8,879 $9,457 Multiple of 2006E EBITDA 8.7x 9.3x 9.9x 8.7x 9.3x 9.9x Pro Forma Sodexho Ownership 100.0% 100.0% 100.0% 69.0% 67.1% 65.4% Pro Forma Arrow Ownership – – – 31.0% 32.9% 34.6% FY2007E Pro Forma EPS Excluding Synergies $2.19 $1.94 $1.70 $2.34 $2.19 $2.04 $ Accretion / (Dilution) (0.61) (0.85) (1.09) (0.45) (0.60) (0.75) % Accretion / (Dilution) (21.7%) (30.3%) (39.0%) (16.1%) (21.6%) (26.8%) Pre-Tax Synergies Required to Break-Even $148 $207 $266 $160 $220 $280 % Accretion / (Dilution) with $171MM of Synergies (1) 3.3% (5.4%) (14.0%) 1.1% (4.8%) (10.5%) PF Cash EPS % Accretion / (Dilution) Excluding Synergies (2) (6.3%) (13.7%) (21.1%) (5.5%) (10.4%) (15.1%) PF Cash EPS % Accretion / (Dilution) with $171MM of Synergies (1)(2) 18.7% 11.3% 3.9% 11.7% 6.3% 1.2% FY2008E Pro Forma EPS Excluding Synergies $2.90 $2.66 $2.42 $2.83 $2.67 $2.51 $ Accretion / (Dilution) (0.27) (0.51) (0.75) (0.34) (0.51) (0.66) % Accretion / (Dilution) (8.5%) (16.2%) (23.8%) (10.7%) (15.9%) (20.9%) Pre-Tax Synergies Required to Break-Even $66 $125 $185 $121 $185 $249 % Accretion / (Dilution) with $171MM of Synergies (1) 13.4% 5.8% (1.8%) 4.4% (1.2%) (6.5%) PF Cash EPS % Accretion / (Dilution) Excluding Synergies (2) 5.0% (1.5%) (8.0%) (1.4%) (6.1%) (10.6%) PF Cash EPS % Accretion / (Dilution) with $171MM of Synergies (1)(2) 27.0% 20.5% 14.0% 13.7% 8.6% 3.7% Preliminary Credit Analysis Stand-Alone Total Debt (3) / LTM EBITDA 2.3x 5.5x 5.8x 6.1x 3.8x 4.0x 4.1x Total Debt (3) / Book Capitalization 43.8% 78.9% 79.8% 80.6% 54.8% 54.6% 54.4% (1) Based on management estimates of $171 million. (2) Excludes amortization expense associated with the transaction. (3) Acquiror total and net debt include convertible debt and capitalized leases. Note: Assumes transaction closes 9/30/06; interest rate of 8.0% and 8.5% on new debt in 50% cash / 50% stock scenario and 100% cash scenario, respectively ; identifiable intangibles at 15% of excess Note: purchase price over net tangible book value, amortized over 10 years. |
 CONFIDENTIAL 58 6. Next Steps |
 59 CONFIDENTIAL D R A F T Next Steps Agree on strategic path Investigate the operational, tax and legal ramifications of different potential timing sequences of various strategic alternatives, as necessary Determine optimal path – utilize multiple-track approach to maximize leverage and execution Construct strategy with respect to external and internal communications |
 CONFIDENTIAL 60 Appendix |
 61 CONFIDENTIAL D R A F T Arrow Shareholder Profile Arrow’s officers, employees and directors hold approximately two-thirds of the voting shares. Rank Shareholder Class A Shares (1) Class B Shares Total Shares Held % Total Shares Held % Voting Shares Held (2) Portfolio Turnover Corporate Governance Sensitivity 1 Ariel Capital Management LLC – 15,191,950 15,191,950 8.5% 2.2% $ 2 Eminence Capital LLC – 11,121,975 11,121,975 6.2% 1.6% 3 Fidelity Management & Research Co. – 10,238,959 10,238,959 5.7% 1.5% 4 Lazard Asset Management – 6,731,120 6,731,120 3.8% 1.0% $ 5 Cooke & Bieler LP – 5,683,915 5,683,915 3.2% 0.8% 6 American Century Investment Mgmt. – 5,083,428 5,083,428 2.8% 0.7% 7 Jarislowsky, Fraser Ltd. – 4,588,067 4,588,067 2.6% 0.7% $ 8 Brown Brothers Harriman & Co. – 3,243,383 3,243,383 1.8% 0.5% 9 Harris Associates LP – 3,145,200 3,145,200 1.8% 0.4% $ 10 Vanguard Group, Inc. – 2,253,992 2,253,992 1.3% 0.3% Top 10 Institutions – 67,281,989 67,281,989 37.5% 9.6% Other Institutions – 50,915,268 50,915,268 28.4% 7.2% Legend Total Institutions – 118,197,257 118,197,257 65.9% 16.8% GARP High High Joseph Neubauer 23,895,683 40,305 23,935,988 13.3% 34.0% Index Moderate Moderate/High Arrow Retirement and Savings Plan (3) 15,035,660 312,038 15,347,698 8.6% 21.4% Value Low Moderate James Ksansnak 2,460,732 459 2,461,191 1.4% 3.5% Hedge Fund Moderate/Low Bruce Lindsay (4) 1,777,596 – 1,777,596 1.0% 2.5% Yield % L. Frederick Sutherland 1,755,812 – 1,755,812 1.0% 2.5% Other Executive Directors and Officers 2,489,603 256,938 2,746,541 1.5% 3.6% Total Executive Directors and Officers 47,415,086 609,740 48,024,826 26.8% 67.6% Other Shareholders 10,701,463 2,480,344 13,181,807 7.3% 15.6% Total Shares Outstanding (5) 58,116,549 121,287,341 179,403,890 100.0% 100.0% Source: Public company filings, SEC filings and FactSet Research Systems. (1) Class A shares entitle holders to ten votes per share, while the Class B stockholders are entitled to one vote per share (although both shares carry the same economic interest). (2) Calculated by weighting Class A shares 10 to 1 against Class B shares. (3) U.S. Trust is the independent trustee. The vote is passed through by U.S. Trust to the participants in the relevant plan. (4) Mr. Lindsay acts as an independent trustee with sole voting power for shares held for the benefit of Neubauer family trusts. (5) Excludes stock options. Investment Orientation |
 62 CONFIDENTIAL D R A F T CS does not provide any tax advice. Any tax statement herein regarding any US federal tax is not intended or written to be used, and cannot be used, by any taxpayer for the purpose of avoiding any penalties. Any such statement herein was written to support the marketing or promotion of the transaction(s) or matter(s) to which the statement relates. Each taxpayer should seek advice based on the taxpayer's particular circumstances from an independent tax advisor. These materials have been provided to you by Credit Suisse ("CS") in connection with an actual or potential mandate or engagement and may not be used or relied upon for any purpose other than as specifically contemplated by a written agreement with CS. In addition, these materials may not be disclosed, in whole or in part, or summarized or otherwise referred to except as agreed in writing by CS. The information used in preparing these materials was obtained from or through you or your representatives or from public sources. CS assumes no responsibility for independent verification of such information and has relied on such information being complete and accurate in all material respects. To the extent such information includes estimates and forecasts of future financial performance (including estimates of potential cost savings and synergies) prepared by or reviewed or discussed with the managements of your company and/or other potential transaction participants or obtained from public sources, we have assumed that such estimates and forecasts have been reasonably prepared on bases reflecting the best currently available estimates and judgments of such managements (or, with respect to estimates and forecasts obtained from public sources, represent reasonable estimates). These materials were designed for use by specific persons familiar with the business and the affairs of your company and CS assumes no obligation to update or otherwise revise these materials. Nothing contained herein should be construed as tax, accounting or legal advice. You (and each of your employees, representatives or other agents) may disclose to any and all persons, without limitation of any kind, the tax treatment and tax structure of the transactions contemplated by these materials and all materials of any kind (including opinions or other tax analyses) that are provided to you relating to such tax treatment and structure. For this purpose, the tax treatment of a transaction is the purported or claimed U.S. federal income tax treatment of the transaction and the tax structure of a transaction is any fact that may be relevant to understanding the purported or claimed U.S. federal income tax treatment of the transaction. CS has adopted policies and guidelines designed to preserve the independence of its research analysts. CS’s policies prohibit employees from directly or indirectly offering a favorable research rating or specific price target, or offering to change a research rating or price target, as consideration for or an inducement to obtain business or other compensation. CS’s policies prohibit research analysts from being compensated for their involvement in investment banking transactions. |