Exhibit 99.29
| | |
 | | 700 Selkirk House 555 – 4th Avenue S.W. Calgary, Alberta Canada T2P 3E7 Phone: (403) 262-6307 Fax: (403) 261-2792 |
| |
Anderson Energy Announces
2010 Fourth Quarter and Year End Results
Calgary, Alberta, March 28, 2011—Anderson Energy Ltd. (“Anderson Energy” or the “Company”) (TSX:AXL) is pleased to announce its operating and financial results for the fourth quarter and year ended December 31, 2010.
Repositioning for oil production growth continues to be the primary focus of the Company in light of the current and projected weakness in natural gas pricing. As detailed in the following discussion, production from the Cardium horizontal oil drilling program initiated in the summer of 2010 started to come on-stream in the fourth quarter of 2010. The Company is making progress in its efforts to acquire additional Cardium acreage and implement drilling and completion initiatives to lower costs and improve well productivity and reserves.
HIGHLIGHTS:
| | • | | As of March 25, 2011, the Company has 31 gross (22.5 net) producing Cardium horizontal oil wells. Current Cardium production is approximately 1,800 to 1,900 BOED (85% oil and NGL), with an additional 10 gross (7.3 net) Cardium horizontal wells expected to be on production in the second quarter of 2011. |
| | • | | Current oil and NGL production is approximately 2,450 bpd, up from 1,130 bpd in the first quarter of 2010. Of this number, 1,780 bpd or 73% is crude oil production, compared to 345 bpd or 31% in the first quarter of 2010. |
| | • | | Year end reserves were 31.7 MMBOE on a proved plus probable (“P&P”) basis, of which 21% were oil and NGL. The reserve life index was 11.5 years. The Company replaced 224% of its production with new P&P reserves and replaced 697% of its oil and NGL production with new oil and NGL P&P reserves. |
| | • | | Oil & NGL reserves increased from 3.7 MMBOE at the end of 2009 to 6.6 MMBOE on a P&P basis at December 31, 2010. After drilling 22 gross (15.4 net) wells in our first year in the play, Cardium reserves were 2.37 MMBOE of total proved (“TP”) and 4.7 MMBOE of P&P reserves and represent 14.8% of total P&P reserves. The Company expects that the Cardium reserves will continue to grow and become a larger percentage of TP and P&P reserves in future years. |
| | • | | Finding, development and acquisition costs in 2010, including future development capital, additions and technical revisions but excluding natural gas related economic factors, were $22.30 per BOE TP and $22.35 per BOE P&P. |
| | • | | The Company estimates its net asset value per share to be approximately $1.78 per share. |
| | • | | Since the inception of the Cardium horizontal oil program, 37 gross (26.7 net) wells have been drilled with a 100% success rate. In the first quarter of 2011, 15 gross (11.3 net) Cardium horizontal oil wells have been drilled to date, with four drilling rigs still working in the field. |
| | • | | The Company has increased its Cardium horizontal well prospective lands from its January 17, 2011 update by 10% to 112.5 gross (65.8 net) sections. Based on a drilling density of three wells per section, the Company estimates it could potentially drill 338 gross (197.4 net) Cardium horizontal wells. The Company’s drill ready non-contingent development drilling inventory has increased by 30% since January 17, 2011 to 183 gross (111.2 net) locations. |
| | • | | The Company has a $75 million capital budget in 2011 to be spent almost exclusively on the Cardium horizontal oil drilling program. The Company continues to review the commodity price outlook and could potentially expand its 2011 drilling program in the last half of the year with additional Cardium horizontal drilling. |
| | |
| 2 | | ANDERSON ENERGY PRESS RELEASE MARCH 28, 2011 |
FINANCIAL AND OPERATING HIGHLIGHTS
| | | | | | | | | | | | | | | | | | | | | | | | |
| | | Three months ended
December 31, | | | %
Change | | | Year ended December 31, | | | %
Change | |
| (thousands of dollars) | | 2010 | | | 2009 | | | | | | 2010 | | | 2009 | | | | |
Oil and gas revenue before royalties(1) | | $ | 23,946 | | | $ | 20,439 | | | | 17 | % | | $ | 86,457 | | | $ | 76,993 | | | | 12 | % |
Funds from operations | | $ | 9,515 | | | $ | 9,151 | | | | 4 | % | | $ | 37,180 | | | $ | 31,258 | | | | 19 | % |
Funds from operations per share | | | | | | | | | | | | | | | | | | | | | | | | |
Basic | | $ | 0.06 | | | $ | 0.06 | | | | — | | | $ | 0.22 | | | $ | 0.25 | | | | (12 | %) |
Diluted | | $ | 0.06 | | | $ | 0.06 | | | | — | | | $ | 0.22 | | | $ | 0.25 | | | | (12 | %) |
Net loss | | $ | (11,741 | ) | | $ | (6,457 | ) | | | (82 | %) | | $ | (35,631 | ) | | $ | (36,458 | ) | | | 2 | % |
Net loss per share | | | | | | | | | | | | | | | | | | | | | | | | |
Basic | | $ | (0.07 | ) | | $ | (0.04 | ) | | | (75 | %) | | $ | (0.21 | ) | | $ | (0.29 | ) | | | 28 | % |
Diluted | | $ | (0.07 | ) | | $ | (0.04 | ) | | | (75 | %) | | $ | (0.21 | ) | | $ | (0.29 | ) | | | 28 | % |
Capital expenditures, including acquisitions net of dispositions | | $ | 26,473 | | | $ | 11,312 | | | | 134 | % | | $ | 112,173 | | | $ | 33,558 | | | | 234 | % |
Bank loans plus cash working capital deficiency | | | | | | | | | | | | | | $ | 71,507 | | | $ | 72,524 | | | | (1 | %) |
Convertible debentures | | | | | | | | | | | | | | $ | 43,460 | | | $ | — | | | | 100 | % |
Shareholders’ equity | | | | | | | | | | | | | | $ | 333,791 | | | $ | 332,719 | | | | — | |
Average shares outstanding (thousands) | | | | | | | | | | | | | | | | | | | | | | | | |
Basic | | | 172,464 | | | | 150,500 | | | | 15 | % | | | 170,298 | | | | 125,047 | | | | 36 | % |
Diluted | | | 172,464 | | | | 150,500 | | | | 15 | % | | | 170,298 | | | | 125,047 | | | | 36 | % |
Ending shares outstanding (thousands) | | | | | | | | | | | | | | | 172,485 | | | | 150,500 | | | | 15 | % |
Average daily sales | | | | | | | | | | | | | | | | | | | | | | | | |
Natural gas (Mcfd) | | | 38,479 | | | | 34,938 | | | | 10 | % | | | 37,124 | | | | 38,489 | | | | (4 | %) |
Liquids (bpd) | | | 1,815 | | | | 1,257 | | | | 44 | % | | | 1,379 | | | | 1,189 | | | | 16 | % |
Barrels of oil equivalent (BOED) | | | 8,228 | | | | 7,080 | | | | 16 | % | | | 7,566 | | | | 7,603 | | | | — | |
Average prices | | | | | | | | | | | | | | | | | | | | | | | | |
Natural gas ($/Mcf) | | $ | 3.48 | | | $ | 4.28 | | | | (19 | %) | | $ | 3.96 | | | $ | 3.95 | | | | — | |
Liquids ($/bbl) (1) | | $ | 69.11 | | | $ | 53.79 | | | | 28 | % | | $ | 63.24 | | | $ | 48.22 | | | | 31 | % |
Barrels of oil equivalent ($/BOE) (1) | | $ | 31.63 | | | $ | 31.38 | | | | 1 | % | | $ | 31.31 | | | $ | 27.74 | | | | 13 | % |
Realized loss on derivative contracts ($/BOE) | | $ | (0.17 | ) | | $ | — | | | | (100 | %) | | $ | (0.05 | ) | | $ | — | | | | (100 | %) |
Royalties ($/BOE) | | $ | 2.98 | | | $ | 2.66 | | | | 12 | % | | $ | 3.26 | | | $ | 2.97 | | | | 10 | % |
Operating costs ($/BOE) | | $ | 11.62 | | | $ | 10.49 | | | | 11 | % | | $ | 10.56 | | | $ | 9.70 | | | | 9 | % |
Operating netback ($/BOE) | | $ | 16.86 | | | $ | 18.23 | | | | (8 | %) | | $ | 17.44 | | | $ | 15.07 | | | | 16 | % |
General and administrative ($/BOE) | | $ | 2.87 | | | $ | 2.94 | | | | (2 | %) | | $ | 2.80 | | | $ | 2.52 | | | | 11 | % |
Reserves (MBOE) | | | | | | | | | | | | | | | | | | | | | | | | |
Total proved | | | | | | | | | | | | | | | 20,117 | | | | 23,615 | | | | (15 | %) |
Total proved plus probable | | | | | | | | | | | | | | | 31,687 | | | | 34,896 | | | | (9 | %) |
Wells drilled (gross) | | | 6 | | | | 107 | | | | (94 | %) | | | 49 | | | | 118 | | | | (58 | %) |
Undeveloped land (thousands of acres) | | | | | | | | | | | | | | | | | | | | | | | | |
Gross | | | | | | | | | | | | | | | 99 | | | | 123 | | | | (20 | %) |
Net | | | | | | | | | | | | | | | 47 | | | | 62 | | | | (24 | %) |
| (1) | Excludes realized loss on derivative contracts of $0.1 million and unrealized loss on derivative contracts of $1.9 million pertaining to fixed price crude oil swaps recorded in the fourth quarter of 2010. |
| | |
| 3 | | ANDERSON ENERGY PRESS RELEASE MARCH 28, 2011 |
OPERATIONS:
Cardium Horizontal Oil. In 2010, 22 gross (15.4 net revenue) Cardium horizontal oil wells were drilled. In the fourth quarter of 2010, 6 gross (4.6 net revenue) Cardium horizontal oil wells were drilled. To date in the first quarter of 2011, the Company has drilled 15 gross (11.3 net revenue) Cardium horizontal oil wells, and currently has four drilling rigs still working in the field finishing the remainder of the winter program (4 gross (3.1 net) wells). As of December 31, 2010, the Company had 13.4 net wells producing. Today, 22.5 net Cardium horizontal wells are producing with 7.3 net new Cardium horizontal oil wells expected to be on-stream in the second quarter of 2011. Cardium production was approximately 1,800 to 1,900 BOED (85% oil and NGL) as of March 25, 2011. Oil and NGL production is approximately 2,450 bpd, up substantially from 1,130 bpd in the first quarter of 2010. Of this number, 1,780 bpd or 73% is crude oil production, compared to 345 bpd or 31% in the first quarter of 2010. The Company plans to drill 32 gross (22.0 net capital, 20.0 net revenue) Cardium horizontal oil wells in 2011. A summary of Cardium horizontal well activity since the first quarter of 2010 is shown below:
| | | | | | | | | | | | | | | | |
| Cardium Cumulative Drilling Program | | Wells Drilled | | | Wells On Production | |
| | | Gross | | | Net | | | Gross | | | Net | |
Up to March 25, 2011 | | | 37 | | | | 26.7 | | | | 31 | | | | 22.5 | |
Estimated up to June 30, 2011 | | | 41 | | | | 29.8 | | | | 41 | | | | 29.8 | |
“Net”is net revenue interest earned.
The Company’s Cardium prospective land inventory is 112.5 gross (65.8 net) sections, which has appreciated 10% since the update provided in our January 17, 2011 press release. Based on a development drilling density of three wells per section, the Company estimates it could potentially drill 338 gross (197.4 net) Cardium horizontal wells. From this location list, the Company has advanced 183 gross (111.2 net) horizontal locations to be drilled in the next few years (including wells drilled to date). Each location is a development location that is technically feasible and not contingent upon the drilling of other wells. Successful drilling of these wells and wells being drilled by third parties offsetting Company lands and new land deals have increased the count by 30% since the January 17, 2011 press release. The Company continues to explore opportunities to increase its land position in the play through acquisitions and farm-ins in its existing areas of focus and to improve operating efficiencies in the drilling and completion of wells. A more detailed discussion and review of the Cardium drilling program and go forward plans is shown in the investor presentation at www.andersonenergy.ca.
In February 2011, the Company switched from oil based fracture stimulations to water based fracture stimulations of the Cardium. Well performance has been encouraging and the Company is planning to conduct future fracture stimulations with water. The capital cost savings of this change has been approximately $500,000 per well. The Company estimates its full cycle drill, complete, equip and tie-in costs for the Cardium horizontal program with water based fracture stimulation to be approximately $2.8 to $3.0 million per well.
In 2010, $6.6 million was spent on the installation of multi-well Cardium oil tank batteries and associated pipelines, some of which will be of use for production from drilling in 2011 and beyond.
PRODUCTION
For the year ended December 31, 2010, production averaged 7,566 BOED. Production for the fourth quarter of 2010 was 8,228 BOED, up 16% from the same period last year. Oil and NGL production in the fourth quarter of 2010 was 1,815 bpd, up 44% from the same period last year.
Production from the winter drilling program is being brought on-stream in the second half of March and throughout the second quarter of 2011. The production guidance estimate for the 2011 fiscal year is approximately 7,500 BOED. The Company estimates oil and NGL production will be approximately one third of that estimate.
| | |
| 4 | | ANDERSON ENERGY PRESS RELEASE MARCH 28, 2011 |
The following graph illustrates the growth in Cardium production since inception of the play in the first quarter of 2010. The graph shows the contribution to production since October 2010 from net wells completed and brought on production in 2010 and to date in 2011. The graph illustrates how the Company has been able to ramp up its Cardium production in the past few months and also illustrates how quickly the production curve stabilizes.
Cardium Production Growth
(BOED, 85% oil and NGL)
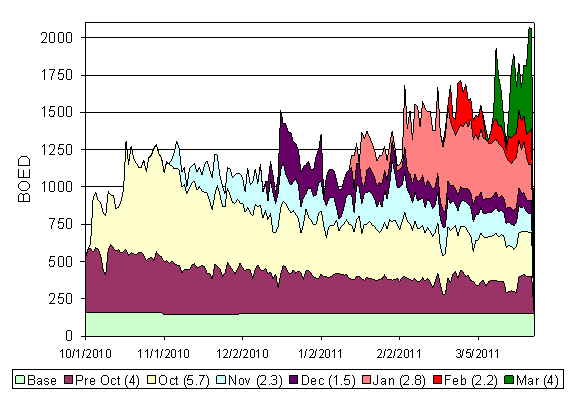
The numbers in brackets in the legend are the net number of wells included in the data above.
FINANCIAL RESULTS
Capital expenditures were $112.2 million in 2010 with $72.9 million spent on drilling and completions and $40.1 million spent on facilities. This compares to capital expenditures of $33.6 million in 2009.
Funds from operations were $37.2 million in 2010 as compared to $31.3 million in 2009. The average natural gas sales price was $3.96 per Mcf in 2010 as compared to $3.95 per Mcf in 2009. Natural gas sales prices in 2010 were $5.22 per Mcf in the first quarter, $3.78 per Mcf in the second quarter, $3.43 per Mcf in the third quarter and $3.48 per Mcf in the fourth quarter. Natural gas prices continue to be low in the first quarter of 2011. The Company’s average crude oil and natural gas liquids sales price in 2010 was $63.24 per bbl as compared to $48.22 per bbl in 2009. Operating expenses in 2010 were $10.56 per BOE, which was 9% higher than $9.70 per BOE in 2009. Start up costs associated with new Cardium production, various production optimization initiatives, reclassification of co-gen power credits and a large one time compressor repair cost at Buck Lake offset some of the cost savings associated with the Edmonton Sands lower operating cost gas production during 2010. The largest part of these adjustments was recorded in the fourth quarter of the year. The operating netback was $17.44 per BOE in 2010 as compared to $15.07 per BOE in 2009. The increase in the operating netback was primarily due to the impact of Cardium horizontal oil production in the fourth quarter of 2010.
| | |
| 5 | | ANDERSON ENERGY PRESS RELEASE MARCH 28, 2011 |
In 2011, the Company will be adopting International Financial Reporting Standards. The adoption date of January 1, 2011 requires restatement, for comparative purposes, of amounts reported by the Company for the year ended December 31, 2010, including the opening balance sheet as at January 1, 2010. The changeover will have a significant effect on reported results. The impacts are discussed in more detail in Management’s Discussion and Analysis for the year ended December 31, 2010 and we encourage shareholders to look there for more information.
FINANCING
On December 31, 2010, the Company completed a $50.0 million convertible subordinated debenture financing. The debentures have a five year term with a 7.5% coupon and a conversion price of $1.55 per share. Proceeds were initially used to reduce the Company’s bank indebtedness and provide financial flexibility for its 2011 capital program. The Company closed the sale of $5.1 million in properties on February 9, 2011. During the first quarter of 2011, the Company also signed agreements to sell surplus drilling incentive credits and other properties for expected proceeds of $0.4 million. The Company intends to sell a total of $10 million in assets in 2011. The Company is financing its drilling program with bank loans, convertible debentures, cash flow and dispositions in 2011. The Company has credit facilities of $125 million with a syndicate of three Canadian banks.
2011 CAPITAL PROGRAM
The Company has a capital budget of $75 million, net of $10 million of planned dispositions in 2011, which will be spent almost exclusively on the Cardium oil horizontal drilling program. The Company is planning to drill 32 gross (22 net capital, 20 net revenue) Cardium horizontal oil wells in Central Alberta. At the May 16, 2011 annual shareholder’s meeting, the Company will update its shareholders on timing of any potential expansion of the drilling program.
COMMODITY CONTRACTS
The Company has fixed price swaps for 1,000 barrels per day of crude oil for calendar 2011 at a NYMEX crude oil price of Canadian $88.45 per barrel and for 250 barrels per day of crude oil for calendar 2012 at a NYMEX crude oil price of Canadian $103.20 per barrel. The Company reviews commodity contracts as part of its price management strategy on an ongoing basis.
RESERVES
GLJ Petroleum Consultants (“GLJ”) was engaged to prepare an evaluation of the Company’s reserves as of December 31, 2010 in accordance with NI51-101.
A summary of the Company’s reserves evaluation is shown below as of December 31, 2010.
| | | | | | | | | | | | | | | | |
| Reserves Category | | Natural Gas
(Bcf) | | | Oil (Mbbls) | | | Natural Gas
Liquids
(Mbbls) | | | Barrels
of Oil
equivalent
(MBOE) | |
Proved Developed Producing | | | 52.5 | | | | 1,303 | | | | 1,376 | | | | 11,428 | |
Proved Developed Non Producing | | | 7.5 | | | | 168 | | | | 50 | | | | 1,461 | |
Proved Undeveloped | | | 37.3 | | | | 755 | | | | 247 | | | | 7,228 | |
Total Proved | | | 97.3 | | | | 2,226 | | | | 1,673 | | | | 20,117 | |
Total Proved plus Probable | | | 150.6 | | | | 3,908 | | | | 2,676 | | | | 31,687 | |
At the end of 2009, the Company had 0.14 MMBOE of TP and 0.47 MMBOE of P&P reserves associated with the Cardium horizontal oil play, representing approximately 1.4% of the total P&P reserves. At the end of 2010, the Company had 2.37 MMBOE of TP and 4.7 MMBOE of P&P reserves associated with the Cardium horizontal oil play, after producing approximately 124.3 MBOE of production in 2010. Today the Cardium represents 14.8% of the Company’s P&P reserves. Oil and NGL have grown from 10% of TP and P&P reserves in 2009 to 19% of TP and 21% of P&P reserves in 2010. The Company expects that the Cardium reserves will continue to grow and become a larger percentage of the Company’s TP and P&P reserves in future years as the play is
| | |
| 6 | | ANDERSON ENERGY PRESS RELEASE MARCH 28, 2011 |
developed. In management’s opinion, the GLJ report is conservative on Cardium oil reserves as this is the first year an independent evaluation has been prepared on this new and emerging play for the Company.
The Company’s reserve life indices are 7.3 years TP and 11.5 years P&P, based on 2010 annual production. In 2010, the Company replaced 224% of production with new P&P reserves additions, net of technical revisions. The Company replaced 697% of its oil and NGL production with new P&P oil and NGL reserves.
Proved developed producing (“PDP”) reserves grew 24% in 2010. The PDP net present value at a 10% pre-tax discount rate (“NPV 10”) increased 6% in 2010. Reserves grew due to positive additions and revisions in both natural gas and oil. The percentage of PDP reserves relating to oil and NGL was 23% in 2010 compared to 18% in 2009. The PDP NPV 10 value was negatively impacted by reductions in forecast natural gas prices.
In 2010, the Company experienced positive technical revisions of 3.3 MMBOE TP and 0.3 MMBOE P&P. These were offset by negative economic factors of 7.1 MMBOE TP and 6.6 MMBOE P&P. Almost the entire economic factor related to the undeveloped gas and NGL reserves in the Edmonton Sands. The economic factor was due to a 25% reduction in GLJ’s natural gas price outlook for the years 2011 to 2015, and 16% thereafter. This was partially offset by the fact that there was improved performance in the proved developed producing category for the Edmonton Sands resulting in positive additions and revisions of 2.2 MMBOE.
The Company’s 2010 finding, development and acquisition costs (“FD&A”) for additions only were $17.56 per BOE TP and $15.81 per BOE P&P. FD&A, including future development capital and additions and technical revisions but excluding economic factors, were $22.30 per BOE TP and $22.35 per BOE P&P. The Company’s 2010 FD&A costs were higher than in 2009, as the Company’s capital investments were geared to starting up the more capital intensive Cardium horizontal oil drilling program, building Cardium multi-well batteries and completing its 2009/2010 winter shallow gas drilling program. With a WTI oil price of $100 US, the Cardium wellhead operating netback is approximately $75 per BOE and the $22.35 per BOE FD&A is very acceptable, providing a recycle ratio of 3.3 times. Management’s Discussion and Analysis contains more details on the calculation of FD&A costs.
| | | | | | | | | | | | |
| | | Total Proved
Developed
Producing
(MBOE) | | | Total Proved
(MBOE) | | | Total Proved
plus Probable
(MBOE) | |
Opening Balance, December 31, 2009 | | | 9,223 | | | | 23,615 | | | | 34,896 | |
Additions | | | 3.270 | | | | 3,023 | | | | 5,913 | |
Technical revisions | | | 2.124 | | | | 3,318 | | | | 269 | |
Production | | | (2,761 | ) | | | (2,761 | ) | | | (2,761 | ) |
Economic factors | | | (428 | ) | | | (7,078 | ) | | | (6,630 | ) |
| | | | | | | | | | | | |
Closing Balance, December 31, 2010 | | | 11,428 | | | | 20,117 | | | | 31,687 | |
| | | | | | | | | | | | |
NET ASSET VALUATION 1
As at December 31, 2010
| | | | |
| ($ millions, unless otherwise stated) | | | |
P&P reserves (pretax 10% discount rate) | | $ | 271 | |
Undeveloped land (excluding Cardium horizontal prospective lands) | | | 5 | |
Cardium horizontal prospective lands | | | 166 | |
Stock option proceeds | | | 6 | |
Bank loans plus cash working capital deficiency | | | (71 | ) |
| | | | |
Net asset value estimate, December 31, 2010 | | $ | 377 | |
Net asset value estimate per fully diluted share, December 31, 2010* | | $ | 1.78 | |
* based on 211.3 million outstanding shares on a fully diluted basis
| 1 | The net asset valuation shows what the Corporation’s reserves would be produced at using forecast prices and costs. The value is a snapshot in time and based on various assumptions including commodity prices that vary over time. It should not be assumed that NAV represents the fair market value of Anderson Energy shares. |
| | |
| 7 | | ANDERSON ENERGY PRESS RELEASE MARCH 28, 2011 |
It was assumed in the NAV calculation that the convertible debenture would be converted at $1.55 per share and the outstanding shares were adjusted accordingly.
The GLJ price forecast as of December 31, 2010 is shown in Management’s Discussion and Analysis for the year ended December 31, 2010. Complete reserves disclosure as required under NI 51-101 will be contained in the Company’s 2010 Annual Information Form, to be filed on SEDAR by March 31, 2011.
The Company has 98,813 gross (47,300 net) undeveloped acres of land excluding Cardium horizontal prospective land as of December 31, 2010 and has assigned a value of $5.0 million to this acreage position. The Company used a $3.0 million per net section valuation for Cardium lands that were not assigned drilling locations in the GLJ reserves report. The Company believes that these locations were not assigned reserves as there was insufficient production or horizontal well control to book reserves under the criteria of NI51-101, and/or the locations were picked based on land deals done after December 31, 2010. The Company’s engineers have estimated the potential net present value of an average unbooked Cardium location to be approximately $2.2 million per location, using GLJ’s price forecast, a 10% pretax discount rate, farm-in and straight up economics over a four year time span of drilling activity. The Company has an inventory of 74.7 net Cardium locations not booked in the GLJ reserves report.
As of March 25, 2011, the Company’s drill ready non-contingent development Cardium horizontal drilling inventory is as follows:
| | | | | | | | |
| Cardium Locations | | Gross | | | Net | |
Inventory at March 25, 2011 | | | 183 | | | | 111.2 | |
Drilled to March 25, 2011 | | | (37 | ) | | | (26.7 | ) |
| | | | | | | | |
Remaining | | | 146 | | | | 84.5 | |
| | | | | | | | |
OUTLOOK
The last two years have been very difficult in the natural gas business, and 2011 does not currently look like it will be much better. Oil prices continue to remain strong due increasing demand and ongoing geopolitical events in the world. The Company’s response to a very weak and uncertain gas price environment was to switch its capital program to light oil horizontal drilling. The Company was able to position itself and make the switch in the last half of 2010. The Company was able to move up the learning curve in the Cardium play in 2010 and in the first quarter of 2011 with its drilling, completion and production initiatives. The Company is very focused on increasing its land position in the Cardium and utilizing new technologies to lower costs and enhance well performance. The addition of water based fracture stimulation in February 2011 is one example of new initiatives. At WTI oil prices of $100 U.S. per bbl, operating netbacks in the Cardium program are approximately $75.00 per BOE as compared to operating netbacks in the Edmonton Sands shallow gas program of $15.00 per BOE.
Current oil & NGL production is approximately 2,450 bpd and the Company’s goal is grow its oil production to achieve 50% of total production being oil and NGL production by early 2012. By the second quarter of this year, the Company will have drilled and brought on production 41 gross (29.8 net) Cardium oil horizontal wells. The Company has increased its Cardium development drilling inventory by 30% in the past few months and is becoming one of the industry leaders in lower capital costs. The Company believes it is well positioned in the Cardium horizontal oil play and the results from the winter drilling program will help in peeling the natural gas label off the Company’s stock price and reward the shareholders with more of an oil company evaluation.
The Company will be assessing the potential to increase its 2011 capital program in the second quarter.
PEOPLE
On February 28, 2011, Patrick O’Rourke joined the Company as Vice President of Production. Patrick is a professional engineer with 22 years of experience in both technical and managerial positions in facilities and
| | |
| 8 | | ANDERSON ENERGY PRESS RELEASE MARCH 28, 2011 |
production engineering. Patrick will be focused on optimizing our new Cardium oil production and reducing overall operating expenses in 2011. We welcome Patrick to the management team.
2010 was a year of repositioning. The Company would like to thank its shareholders and its employees for their support throughout this year of transition. The Company invites its shareholders to attend the annual meeting on May 16, 2011 at the Metropolitan Centre in Calgary, Alberta at 2:00 pm MDT and encourages anyone interested in further details to visit the Company’s website at www.andersonenergy.ca.
Brian H. Dau
President & Chief Executive Officer
March 28, 2011
| | |
| 9 | | ANDERSON ENERGY PRESS RELEASE MARCH 28, 2011 |
This page has been left blank intentionally. The Company’s Management’s Discussion and Analysis for the year ended December 31, 2010 and the Company’s Consolidated Financial Statements as at December 31, 2010 have been filed under separate cover.
| | |
| 10 | | ANDERSON ENERGY PRESS RELEASE MARCH 28, 2011 |
ADVISORY
Certain information regarding Anderson Energy Ltd. in this news release including, without limitation, management’s assessment of future plans and operations, benefits and valuation of the development prospects described herein, number of locations in drilling inventory and wells to be drilled, timing and location of drilling and tie-in of wells and the costs thereof, productive capacity of the wells, timing of and construction of facilities, expected production rates, dates of commencement of production, amount of capital expenditures and timing thereof, value of undeveloped land, extent of reserves additions, ability to attain cost savings, drilling program success, impact of changes in commodity prices on operating results, impact of changes to the royalty regime applicable to the Company, including payment of drilling incentive credits, commodity price outlook and general economic outlook may constitute forward-looking statements under applicable securities laws and necessarily involve risks and assumptions made by management of the Company including, without limitation, risks associated with oil and gas exploration, development, exploitation, production, marketing and transportation, loss of markets, volatility of commodity prices, currency fluctuations, imprecision of reserves estimates, environmental risks, competition from other producers, inability to retain drilling rigs and other services, capital expenditure costs, including drilling, completion and facilities costs, unexpected decline rates in wells, wells not performing as expected, incorrect assessment of the value of acquisitions and farm-ins, failure to realize the anticipated benefits of acquisitions and farm-ins, delays resulting from or inability to obtain required regulatory approvals, changes to government regulation and ability to access sufficient capital from internal and external sources. As a consequence, actual results may differ materially from those anticipated in the forward-looking statements. Readers are cautioned that the foregoing list of factors is not exhaustive. Additional information on these and other factors that could affect Anderson Energy’s operations and financial results are included in reports on file with Canadian securities regulatory authorities and may be accessed through the SEDAR website (www.sedar.com) and at Anderson Energy’s website (www.andersonenergy.ca).
Furthermore, the forward-looking statements contained in this news release are made as at the date of this news release and Anderson Energy does not undertake any obligation to update publicly or to revise any of the included forward-looking statements, whether as a result of new information, future events or otherwise, except as may be required by applicable securities laws.
Disclosure provided herein in respect of barrels of oil equivalent (BOE) may be misleading, particularly if used in isolation. A BOE conversion ratio of 6 Mcf: 1 bbl is based on an energy equivalency conversion method primarily applicable at the burner tip and does not represent a value equivalency at the wellhead.
| | |
| 11 | | ANDERSON ENERGY PRESS RELEASE MARCH 28, 2011 |
Corporate Information
Head Office
700 Selkirk House
555 4th Avenue S.W.
Calgary, Alberta
Canada T2P 3E7
Phone (403) 262-6307
Fax (403) 261-2792
Website www.andersonenergy.ca
Directors
J.C. Anderson
Calgary, Alberta
Brian H. Dau
Calgary, Alberta
Christopher L. Fong (1)(2)(3)
Calgary, Alberta
Glenn D. Hockley (1)(3)
Calgary, Alberta
David J. Sandmeyer (2)(3)
Calgary, Alberta
David G. Scobie (1)(2)
Calgary, Alberta
Member of:
| (2) | Compensation & Corporate Governance Committee |
Auditors
KPMG LLP
Independent Engineers
GLJ Petroleum Consultants
Legal Counsel
Bennett Jones LLP
Registrar & Transfer Agent
Valiant Trust Company
Stock Exchange
The Toronto Stock Exchange
Symbol AXL, AXL.DB
Contact Information
Anderson Energy Ltd.
Brian H. Dau
President & Chief Executive Officer
(403) 262-6307
Officers
J.C. Anderson
Chairman of the Board
Brian H. Dau
President & Chief Executive Officer
David M. Spyker
Chief Operating Officer
M. Darlene Wong
Vice President Finance, Chief Financial
Officer & Secretary
Blaine M. Chicoine
Vice President, Operations
Sandra M. Drinnan
Vice President, Land
Philip A. Harvey
Vice President, Exploitation
Jamie A. Marshall
Vice President, Exploration
Patrick M. O’Rourke
Vice President, Production
Abbreviations used
AECO – intra-Alberta Nova inventory transfer price
bbl – barrel
bpd – barrels per day
Mbbls – thousand barrels
Mstb – thousand stock tank barrels
BOE – barrels of oil equivalent
BOED – barrels of oil equivalent per day
MBOE – thousand barrels of oil equivalent
MMBOE – million barrels of oil equivalent
GJ – gigajoule
Mcf – thousand cubic feet
Mcfd – thousand cubic feet per day
MMcf – million cubic feet
MMcfd – million cubic feet per day
Bcf – billion cubic feet
NGL – natural gas liquids