Exhibit 99.3
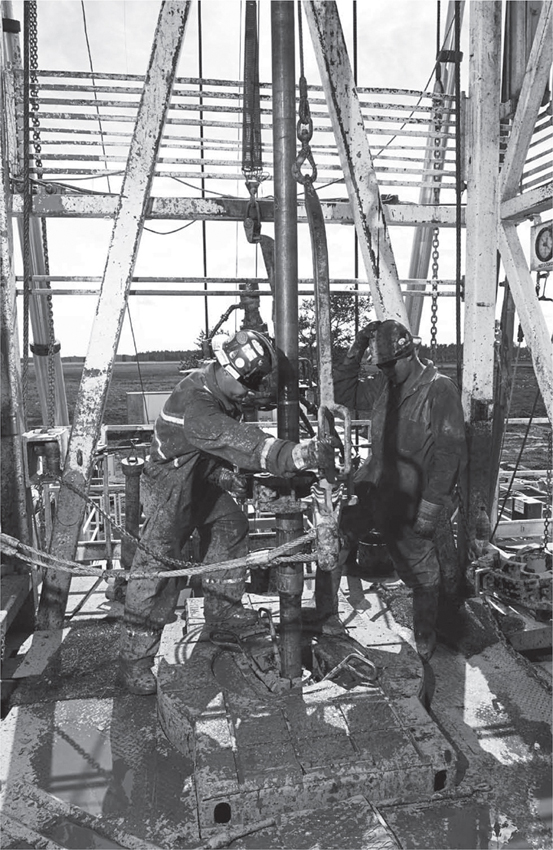
UNLOCKING VALUE through new opportunities in the Cardium oil and Whitemud Sands gas plays. The development landscape in the Company’s core area of Garrington-Sylvan Lake-Pembina has been revolutionized by the use of horizontal well, multistage hydraulic fracturing technology. This technology is well suited to low permeability reservoirs, where oil and gas accumulations have been known to exist but where exploitation to date has been limited by the use of vertical wells with single hydraulic fractures. With these new horizontal wells, the objective is to obtain a greater than fourfold increase in initial rates and ultimate reserves for approximately twice the cost of a vertical well. The Company has extensive holdings of Cardium oil and Whitemud Sands gas in lower permeability reservoirs and believes the application of horizontal well, multistage hydraulic fracturing technology provides significant option value to shareholders.
About the Company
Anderson Energy Ltd. (“Anderson Energy” or the “Company”) was initially established as a private company in 2002. Most of the management team and directors of the Company were previously part of the management team and/or directors of Anderson Exploration Ltd. Anderson Energy went public through a plan of arrangement in 2005. The common shares of the Company are listed on the TSX under the symbol AXL. Management, directors and Mr. Anderson’s family own over 14% of the basic shares of the Company. Anderson Energy operates primarily in central Alberta with an 84% leverage to natural gas. The Company’s main areas of operations are in the Edmonton Sands shallow gas resource play and in two emerging high-impact horizontal multistage frac opportunities in the Cardium for oil and the Whitemud Sands for natural gas. The Company’s focus in 2010 will be to unlock shareholder value through its drilling programs in these areas.
2009 Annual Review
Anderson Energy Ltd. presents the following review of its operating and financial performance for 2009 and its prospects for 2010. This information is a summary of the Company’s annual results taken from the December 31, 2009 audited financial statements, management’s discussion and analysis, and annual information form. A complete copy of these documents can be found at the Company’s website at www.andersonenergy.ca, on the SEDAR website at www.sedar.com or by contacting the Company at (403)262-6307 or at info@andersonenergy.ca.
ANNUAL GENERAL MEETING The Annual General Meeting of Shareholders will be held on May 13, 2010 at 2:00 pm MDT at the Metropolitan Conference Centre, 333 - 4th Avenue S.W., Calgary, Alberta.
| | | | |
| ANDERSON ENERGY 2009 ANNUAL REVIEW | | | 5 | |
Financial and Operating Highlights
| | | | | | | | | | | | |
| | | 2009 | | | 2008 | | | % change | |
FINANCIAL (thousands of dollars, except share data) | | | | | | | | | | | | |
Oil and gas sales | | | 76,993 | | | | 156,245 | | | | (51% | ) |
Revenue, net of royalties | | | 68,895 | | | | 122,274 | | | | (44% | ) |
Funds from operations | | | 31,258 | | | | 79,328 | | | | (61% | ) |
Per common share (basic) | | | 0.25 | | | | 0.91 | | | | (73% | ) |
Per common share (diluted) | | | 0.25 | | | | 0.91 | | | | (73% | ) |
Earnings (loss) before goodwill impairment | | | (36,458 | ) | | | 8,500 | | | | (529% | ) |
Per common share (basic) | | | (0.29 | ) | | | 0.10 | | | | (390% | ) |
Per common share (diluted) | | | (0.29 | ) | | | 0.10 | | | | (390% | ) |
Earnings (loss) | | | (36,458 | ) | | | (26,864 | ) | | | (36% | ) |
Per common share (basic) | | | (0.29 | ) | | | (0.31 | ) | | | 6% | |
Per common share (diluted) | | | (0.29 | ) | | | (0.31 | ) | | | 6% | |
Capital expenditures | | | 33,558 | | | | 106,669 | | | | (69% | ) |
Debt, net of working capital | | | 72,524 | | | | 125,280 | | | | (42% | ) |
Shareholders’ equity | | | 332,719 | | | | 309,612 | | | | 7% | |
Average shares outstanding (thousands) | | | | | | | | | | | | |
Basic | | | 125,047 | | | | 87,298 | | | | 43% | |
Diluted | | | 125,047 | | | | 87,298 | | | | 43% | |
Ending shares outstanding (thousands) | | | 150,500 | | | | 87,300 | | | | 72% | |
| | | |
OPERATING | | | | | | | | | | | | |
Average daily sales | | | | | | | | | | | | |
Natural gas (Mcfd) | | | 38,489 | | | | 38,968 | | | | (1% | ) |
Light/medium crude oil (bpd) | | | 395 | | | | 487 | | | | (19% | ) |
NGL (bpd) | | | 794 | | | | 806 | | | | (1% | ) |
Barrels of oil equivalent (BOED) | | | 7,603 | | | | 7,787 | | | | (2% | ) |
Average prices | | | | | | | | | | | | |
Natural gas ($/Mcf) | | | 3.95 | | | | 8.13 | | | | (51% | ) |
Light/medium crude oil ($/bbl) | | | 59.26 | | | | 92.27 | | | | (36% | ) |
NGL ($/bbl) | | | 42.73 | | | | 71.78 | | | | (40% | ) |
Barrels of oil equivalent ($/BOE) | | | 27.74 | | | | 54.82 | | | | (49% | ) |
Royalties ($/BOE) | | | 2.97 | | | | 11.94 | | | | (75% | ) |
Operating costs ($/BOE) | | | 9.70 | | | | 11.27 | | | | (14% | ) |
Operating netback ($/BOE) | | | 15.07 | | | | 31.61 | | | | (52% | ) |
G&A expense ($/BOE) | | | 2.52 | | | | 2.24 | | | | 12% | |
Reserves | | | | | | | | | | | | |
Natural Gas (MMcf) | | | | | | | | | | | | |
Proved | | | 127,965 | | | | 125,389 | | | | 2% | |
Proved plus probable | | | 186,995 | | | | 172,911 | | | | 8% | |
Crude oil and NGL (Mbbls) | | | | | | | | | | | | |
Proved | | | 2,287 | | | | 2,498 | | | | (8% | ) |
Proved plus probable | | | 3,730 | | | | 3,478 | | | | 7% | |
Undeveloped land (thousands of acres) | | | | | | | | | | | | |
Gross/net | | | 123/62 | | | | 153/77 | | | | (20%/19% | ) |
Drilling activity (gross/net wells) | | | | | | | | | | | | |
Gas | | | 109/82 | | | | 196/135 | | | | (44%/39% | ) |
Oil | | | 0/0 | | | | 6/3 | | | | (100%/100% | ) |
Dry | | | 9/8 | | | | 15/10 | | | | (40%/20% | ) |
| | | | | | | | | | | | |
Total | | | 118/90 | | | | 217/148 | | | | (46%/39% | ) |
| | | | | | | | | | | | |
To our Shareholders,
In January 2009, Anderson Energy announced a significant farm-in transaction that defined it as the preeminent Edmonton Sands natural gas drilling and production company. In May 2009, the Company successfully completed a $60 million equity financing, which was used to reduce bank indebtedness and to finance the farm-in drilling program. The farm-in drilling program commenced in November 2009, with 106 wells drilled in 2009 and 20 wells drilled in the first quarter of 2010. The Company also initiated two high-impact horizontal multistage frac well opportunities in the first quarter of 2010. The first was in the Cardium formation for light oil with three gross (2.25 net) wells drilled, and the second was in the Whitemud Sands formation for gas with two gross (2.0 net) wells drilled. In February 2010, the Company completed a $32 million equity financing to expand its Cardium horizontal light oil drilling program.
2009 was a very challenging year for junior natural gas companies and natural gas markets. The average price of natural gas in 2009 at AECO was $3.75 per Mcf, compared to $7.71 per Mcf in 2008. The unprecedented changes in capital markets that occurred in the latter part of 2008 continued to impact commodity prices in 2009. The natural gas business remained difficult throughout the year. The level of natural gas in storage in the United States attained unprecedented high levels in 2009, which negatively impacted the price of natural gas throughout the year. Anderson Energy’s quarterly gas prices in 2009 were $5.15 per Mcf in the first quarter, $3.43 per Mcf in the second quarter, $2.81 per Mcf in the third quarter and $4.28 per Mcf in the fourth quarter. The combination of new supplies from United States shale gas, reduced industrial consumption of natural gas and cooler summer weather created the storage imbalance. U.S. gas production grew from 55.6 Bcfd in 2008 to 57.8 Bcfd in 2009. The U.S. natural gas drilling rig count dropped almost 46% from an average of 1,491 drilling rigs in 2008 to an average of 801 natural gas drilling rigs in 2009. However, the rapid pace of well completions and well tie-ins continued in 2009 due to an inventory of uncompleted and unconnected wells from previous years. The pace of horizontal well shale gas development continued, with only an 18% drop in horizontal well utilization between 2008 and 2009. The combination of these events flattened out U.S. gas production in the latter part of 2009. In Canada, natural gas production fell throughout the year, with year end 2009 production being 0.7 Bcfd or 4% lower than year end 2008. Canadian drilling rig activity was down almost 42% in 2009 versus 2008.
Winter weather and a slowly improving U.S. economy helped to eat into the storage overhang. In early December 2009, there was 482 Bcf more gas in U.S. storage than in the previous year. At the time of writing this report, there is 40 Bcf less natural gas in storage than in the previous year. U.S. shale gas discoveries have made an impact, at least in the short term, on the economics of the natural gas business in North America. Anderson Energy’s response to this has been to drive down its cost of doing business to be competitive with the U.S. shale gas plays.
EDMONTON SANDS COMPARED TO U.S. SHALE GAS PLAYS
| | | | | | | | | | | | |
| Play | | Royalty | | | F&D | | | Rate of Return | |
| | | (%) | | | ($U.S./Mcf) | | | ($U. S. 6/Mcf NYMEX) (%) | |
Marcellus | | | 15 | | | | 0.95 | | | | 64 | |
Fayetteville | | | 16 | | | | 1.29 | | | | 52 | |
Edmonton Sands (Farm-in Economics) | | | 10 | | | | 1.64 | | | | 41 | |
Barnett | | | 25 | | | | 1.22 | | | | 39 | |
Haynesville | | | 25 | | | | 1.51 | | | | 36 | |
Based on U.S. shale gas producer presentations and Edmonton Sands commitment plus option economics.
| | | | |
| ANDERSON ENERGY 2009 ANNUAL REVIEW | | | 7 | |
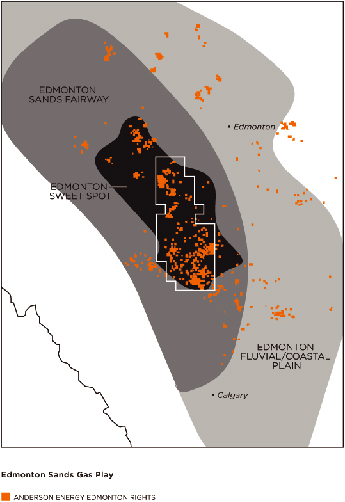
FARM-IN TRANSACTION
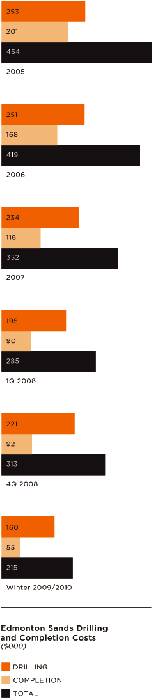
On January 30, 2009, the Company announced a significant farm-in transaction in which the Company gained access to 388 gross sections of Edmonton Sands prospective lands in the heart of the Edmonton Sands fairway. Company geologists believe that 293 of the 388 sections of the farm-in lands are prospective for Edmonton Sands development. The Company is committed to drill 200 wells by December 31, 2010 to earn an interest in up to 120 sections of land. To date, the Company has drilled 126 wells and will be drilling the remaining 74 wells in the remainder of 2010. Following the commitment, the Company has an option to earn additional lands with similar terms as in the commitment phase. The Company has been able to substantially bring down drilling and completion costs from an average of $313,000 per well in the fourth quarter of 2008 to $215,000 per well in this winter’s drilling program. The money saved on the drilling program was invested in new plant infrastructure to bring down operating expenses and reduce fuel/shrinkage losses. Production from this winter’s drilling program is being brought on stream at an average operating expense of $5.00 per BOE, which is substantially less than historical Edmonton Sands costs of $9.00 per BOE.
There were several business reasons for entering into the farm-in transaction:
| a) | Increase the Company’s reserves, production and net asset value; |
| b) | Obtain individual well productivity and reserves greater than the original Anderson Energy lands due to the geological setting and under-exploited nature of the farm-in lands—i.e., increase our “zinger” well percentage (see page 11 for more details); |
| c) | Develop the farm-in lands with new plant infrastructure that provides lower operating expenses and less fuel/shrinkage loss, yielding higher operating margins. In addition, the new plant infrastructure will ultimately service some of the wells drilled on existing Anderson Energy lands, which are currently being produced through plant infrastructure with more expensive operating costs and higher fuel/shrinkage losses; |
| d) | Potentially earn additional interests owned by third parties on the farm-in lands; |
| e) | Develop shallower zones on the farm-in lands that are higher pressured and higher productivity than the Edmonton Sands; and |
| f) | Earn more Whitemud Sands prospective lands that are amenable to horizontal development. |
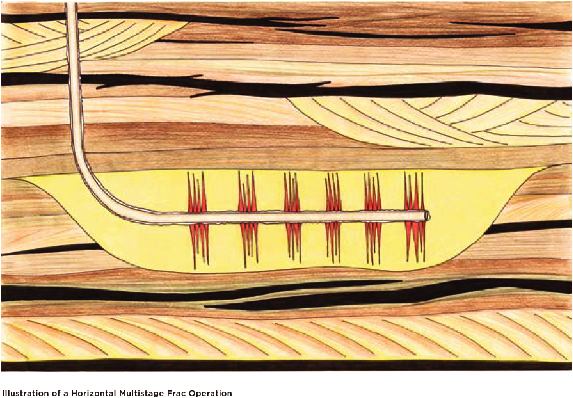
HORIZONTAL MULTISTAGE FRAC DEVELOPMENT
The Company has exposure to two high-impact horizontal multistage frac opportunities.
The first opportunity is the Cardium light oil play in the Pembina, Willesden Green, Ferrier and Garrington areas. Anderson Energy has 85 gross (47 net) sections of land in this new play. Potential development drilling density could be two to four wells per section. On a three well per section drilling density, the Company has a potential inventory of 240 gross (141 net) locations. In the first quarter of 2010, three gross (2.25 net) wells were drilled at Garrington and Pembina. The two 100% working interest wells encountered 850 meters and 1,300 meters of horizontal oil pay respectively. One well was completed and is now tied in for production. During spring breakup, the well will be produced intermittently through a temporary single well battery. The well is currently flowing without artificial lift at 200 barrels of light oil per day. The remaining wells will be completed after spring breakup. This summer, the Company is planning to drill four gross (3.0 net) additional locations to allow the Company to further delineate areas for near-term development. The Company’s exposure in the Cardium oil horizontal play has the potential to significantly increase future production.
The second opportunity is the Whitemud Sands zone, which is an Edmonton Sands zone that is not being effectively drained through completions in vertical gas wells. The Whitemud Sands are at an average of 600 meters vertical depth and each horizontal well is expected to traverse 1,000 to 1,200 meters through the formation. The Company drilled two 100% working interest horizontal wells in the first quarter of 2010 to evaluate this opportunity. Both wells were recently completed and flow-back operations are being conducted to determine a stabilized rate for these wells. The Company has 200 sections of prospective Whitemud Sands land that it owns or controls with an approximate working interest of 60%.
DEEPER DRILLING
The Company has a substantial vertical well drilling inventory for horizons deeper than the Edmonton Sands. In 2010, the Company plans to drill a total of six gross (4.9 net) locations at Westpem and Sylvan Lake and also has plans for two gross (1.5 net) recompletion opportunities. The deeper drilling initiatives are all infill gas wells, and typical initial production rates are 1 MMcfd with a six-month average stabilized rate of 500 Mcfd and 40 bbls per MMscf of natural gas liquids. In the first quarter of 2010, the Company drilled and tied in two of the deeper prospects in the Westpem area targeting the Rock Creek formation.
RESERVES AND NET ASSET VALUATION
GLJ Petroleum Consultants (“GLJ”) has evaluated all of the Company’s petroleum and natural gas reserves as of December 31, 2009. During the year, the Company was able to grow its petroleum and natural gas reserves by 8% to 34,896 MBOE on a proved plus probable (“P&P”) basis. The Company estimates its fully diluted net asset value to be $2.52 per share. GLJ’s December 31, 2009 price forecast was used in the calculation.
NET ASSET VALUE ESTIMATE AT DECEMBER 31, 2009
| | | | |
| ($ millions, unless otherwise stated) | | Net Asset Value | |
P&P reserves (pre-tax 10% discount rate) | | $ | 364.1 | |
Undeveloped land (excluding Cardium horizontal potential lands) | | | 6.2 | |
Cardium horizontal prospective lands (at $7,100 per net hectare) | | | 85.0 | |
Stock option proceeds and drilling incentive credits | | | 5.2 | |
Net debt, December 31, 2009 | | | (72.5 | ) |
| | | | |
Net asset value estimate, December 31, 2009* | | $ | 388.0 | |
Net asset value estimate per fully diluted share, December 31, 2009* | | $ | 2.52 | |
| | | | |
| | * | Does not include changes made by the Alberta Government on March 11, 2010 making the 5% Crown royalty on the first year of production on new wells a permanent measure. |
The Cardium horizontal opportunity was conservatively valued based on recent land sale activity. The net asset value calculation as presented does not include value for the development potential of the Cardium play, the option phase of the Edmonton Sands farm-in, nor the Whitemud horizontal program. The Company assigned $7,100 per hectare to its Cardium horizontal prospective lands, which is the average of the last three Cardium Crown land sales. Company engineers have estimated the potential net present value of a Cardium well to be $3.3 million, using a $75 per barrel Canadian oil price and a 10% pre-tax discount rate. The Company has an inventory of 141 net Cardium wells based on a three well per section development.
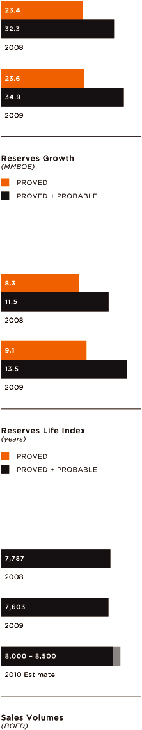
In 2009, the Company’s finding, development and acquisition costs were $7.76 per BOE total proved and $7.97 per BOE total proved plus probable, including revisions, changes in future development capital and estimates made for drilling incentive credits. The Company’s reserve life index was 9.1 years total proved and 13.5 years total proved plus probable.
| | | | |
| ANDERSON ENERGY 2009 ANNUAL REVIEW | | | 9 | |
OUTLOOK
There is still is a good deal of uncertainty in the marketplace with respect to supply and consumption of natural gas. Accordingly, the Company entered into physical fixed price sales contracts to protect its capital program in the first quarter of the year. The Company hedged 20,000 GJ per day of natural gas at an average AECO Canadian dollar price of $5.41 per GJ for each of January, February and March of 2010. This is approximately 19 MMcfd of natural gas at an AECO Canadian dollar price of $5.71 per Mcf and is approximately 50% of the Company’s estimated barrel of oil equivalent production for the first quarter of 2010. The Company reviews hedging as part of a price management strategy on an ongoing basis.
The results from the first phase of the farm-in program have exceeded management expectations with average completion test rate results 40% higher than the previous winter. The Company expects similar results next winter. During this winter’s program, the locations drilled were predominantly on Crown land. Next winter, the Company will be drilling more freehold lands and lands where subsurface poolings are being completed, as well as delineating discoveries made this winter. Many of the new locations to be drilled will connect to the new plant infrastructure being built this winter.
2009 was a difficult year and Anderson Energy would like to thank its shareholders and its employees for their support throughout the year. The Company believes the horizontal multistage frac opportunities represent a significant option value to its shareholders that will materialize if the development of these prospects is successful. The Company has started 2010 with excellent drilling results and expects to unlock significant shareholder value throughout the year.
PEOPLE
In May 2009, Vincent Chahley retired from the Board of Directors to return to his career in investment banking. The Company thanks Vincent for his contributions to the Board. Chris Fong joined the Board in June 2009. Chris is a professional engineer who retired in 2009 from his position as Global Head, Corporate Banking, Energy with RBC Capital Markets. He recently helped to oversee the fiscal side of the Alberta Natural Gas and Conventional Oil Investment Competitiveness Study. David Sandmeyer will be nominated to join the Board at the May 2010 annual meeting of shareholders. David is a professional engineer and a corporate director, and former President and Chief Executive Officer of Freehold Royalty Trust and Rife Resources Ltd. During the year, the Company promoted Dave Spyker to the position of Chief Operating Officer. To take advantage of its new opportunities, the Company has restructured into two business units. The Edmonton Sands business unit manages all of the Edmonton Sands development and Dave Spyker oversees that unit. The New Ventures business unit manages all of the horizontal and deep drilling initiatives and Phil Harvey, Vice President of Exploitation, oversees that unit.
Management thanks the Board for their guidance and stewardship throughout 2009 and looks forward to a more prosperous year in 2010.
Signed: Brian Dau
Brian Dau
President and Chief Executive Officer
March 22, 2010
| | | | |
| ANDERSON ENERGY 2009 ANNUAL REVIEW | | | 11 | |
Principal Properties
EDMONTON SANDS
The Edmonton Sands group is an attractive and rewarding resource play. High-quality reservoir sands were deposited in a large number of channels across central Alberta throughout the two extensive classic wedges that dominated the late Cretaceous period. The Edmonton Sands are divided into two groups: the upper member is called the Scollard and the lower member is called the Horseshoe Canyon. Wells are typically drilled to 800 to 1,100 meters in depth, targeting sands from 350 to 1,100 meters in depth. There can be 18 Edmonton Sands in one wellbore and the Company averages six zones completed and commingled per wellbore. With shallow drill depths, no hydrogen sulphide, no moveable water and extensive existing infrastructure, the Company is able to utilize low cost, low impact drilling, completion and production techniques. With a comprehensive understanding of the geology and operational experience, we have become an industry leader in this emerging resource play with over 595 operated wells drilled by the Company to date.
Anderson Energy has completed geological mapping of all 18 identified Edmonton Sands over an area of 2,200 sections. Today the Company owns or controls 613 gross (344 net) sections of Edmonton Sands prospective lands within the mapped area.
Environmental considerations are integral to the Company’s operations. During the initial planning stage, drilling locations and pipeline routings are selected with input from landowners and occupants to minimize surface impacts. To protect shallow freshwater aquifers, surface casing is set below the depth of the deepest water well in the area and cemented to surface using a preset rig. Surface casing depths range from 100 meters to 140 meters in this area. A coiled tubing drilling rig is then moved on to the location to drill to the base of the Edmonton Sands group, which ranges from 800 to 1,100 meters in depth in this area. The production casing string is cemented full length to eliminate any possibility of contaminating the shallow freshwater aquifers. Cased hole logs are run to identify prospective horizons in the Edmonton Sands group. The surface casing interval is logged to identify the location of freshwater aquifers in the surface holed section. Cement bond logs are run to verify the integrity of the production casing cement job prior to completing the wells. Coil tubing fracturing technology is utilized, enabling up to 18 individual zones to be stimulated in one day.
Typical well site production equipment consists of a wet meter skid, except for the central compression sites, which consist of an inlet separator, dehydrator skid, compressor and water tank. The final footprint occupied by a wet meter skid is an area measuring 2.8 meters x 1.2 meters on a typical lease measuring 110 meters x 110 meters. To minimize the surface impact to the landowner or occupant, supervisory control and data acquisition systems (“SCADA”) are installed on well sites that do not have compressors situated on them and these well sites and their accesses are restored as a “minimum impact site”, thereby permitting the landowner/occupant to farm over the access road and up to the production equipment on the lease. Multiple wells are produced into central compression sites that are selected to maximize the distance to the residents in an area, thereby minimizing noise impacts. Additional sound attenuation equipment is added to the compressors as required to ensure sound levels meet the Energy Resources Conservation Board guidance of 35 decibels or less at the closest residence.
| | | | |
| ANDERSON ENERGY 2009 ANNUAL REVIEW | | | 13 | |
In the past, the Company approached the development of the Edmonton Sands play statistically, drilling four to six wells per section. The Company has now reevaluated this approach and has been using a more geologically focused interpretation of drilling density to target zones that have a greater probability of having higher production and reserves. Internally, the Company uses the term “zinger” to describe a well having much higher reserves and productivity. Historically, 16% of the Company’s Edmonton Sands natural gas wells were zingers. In 2009 and early 2010, the Company believes it has confirmed the concept behind this new approach by more than doubling its zinger success rate.
In 2005, the Company averaged four days to drill an Edmonton Sands well. Today, with the use of preset rigs and hybrid coiled tubing rigs, a well can be drilled in less than 36 hours. The Company continues to implement newer technology, newer processes and business practice changes and has driven the drill and completion costs down to $215,000 per well.
The Company estimates that the flat natural gas price (over the life of the reserves) needed to achieve a recycle ratio of two times (return of two times the capital employed) and one times is shown below:
EDMONTON SANDS FARM-IN ECONOMICS
| | | | | | | | |
| | | Recycle Ratio of
One Times | | | Recycle Ratio of
Two Times | |
Four wells per section development* | | $ | 2.92 | | | $ | 4.90 | |
| | * | $5.00 per BOE operating expenses and 10% royalty, without $200 per meter drilling incentive credits |
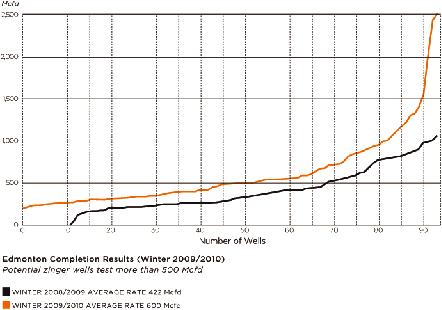
A summary of this winter’s Edmonton drilling program completion results as compared to last winter’s drilling program is shown below. For a well to be a potential zinger, it must test at a rate greater than 500 Mcfd. This winter’s program more than doubled the potential for zinger wells as compared to last winter.
| | | | |
| ANDERSON ENERGY 2009 ANNUAL REVIEW | | | 15 | |
CARDIUM
Encased in thick shale deposits, the Cardium formation is the result of the growth, modification, and preservation of shoreface sands and conglomerates shed from the mountain belts into the western Canadian sedimentary basin. Located in central Alberta, several large Cardium light oil pools and the giant Pembina Cardium oil field have produced in excess of a billion barrels of oil during the last half century. Traditionally, production from vertical wells has been controlled by the presence of very specific reservoir characteristics. These conditions typically exist in just a fraction of the overall oil pay column, over only a portion of the Cardium formation’s distribution, and dictate the location of these traditional pools. However, horizontal multistage frac technology has unlocked the entire Cardium light oil pay column, has expanded the prospective area to include most of the Cardium formation distribution, and has opened up the Cardium resource play to exploitation. Horizontal opportunities exist in the traditional pools as well as the halo play offsetting the traditional pools.
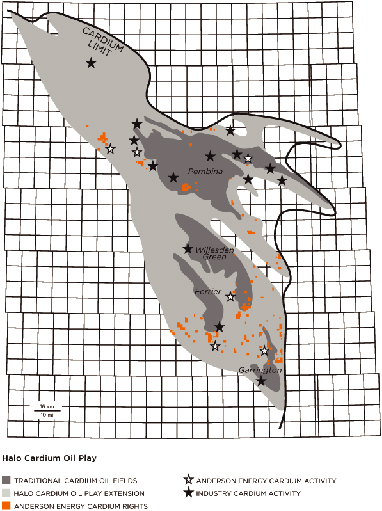
The Company has 85 gross (47 net) sections of land in the Cardium horizontal multistage frac fairway. Its land position offsets industry activity on the west and east sides of the Pembina field, at Willesden Green, Ferrier and in the Garrington/Markerville areas.
Potential development drilling density could be two to four wells per section. On a three well per section drilling density, the Company has a potential inventory of 240 gross (141 net) locations. In their public disclosures, industry competitors have quoted initial production rates of 200 to 300 barrels of light oil per day with six-month production rates of 80 barrels per day, and have estimated ultimate recoveries of 200 to 250 MBOE of reserves.
The Company drilled three gross (2.25 net) Cardium light oil horizontal oil wells in the first quarter of 2010. The Company’s 100% working interest well in Garrington has been completed with an eight stage frac and is now tied in for production. During spring breakup, the well will be produced intermittently through a temporary single well battery. A permanent single well battery will be operational in June 2010. The well is currently flowing without artificial lift at 200 barrels of light oil per day. This well encountered approximately 850 meters of pay in the horizontal well section. The 100% working interest well in Pembina encountered approximately 1,300 meters of pay in the horizontal section. The Pembina well and the third non-operated well are expected to be completed after spring breakup. The Company is planning to drill four gross (3.0 net) locations in the second and third quarters of 2010 at Garrington, Willesden Green, Pembina and Ferrier to allow the Company to further delineate areas for near-term development. The Company’s exposure in the Cardium oil horizontal play has the potential to significantly increase future production.
WHITEMUD SANDS
Within the Edmonton Group lies a thick, extensive, gas-filled pay column called the Whitemud Sands. The Whitemud Sands are approximately 600 meters in depth and are approximately 12 to 20 meters thick, with average porosities ranging from 12% to 20%. The ancient volcanic activity of the Kneehills Tuff member following the deposition of these sands in wide, channel-filled valley systems introduced secondary clays into the Whitemud. As a result, porosity is retained, but permeability of Whitemud reservoirs is somewhat decreased to one to five millidarcies, as compared to 10 to 50 millidarcies in the typical Edmonton Sands. The result is a thick, pervasive gas-filled reservoir that has seen only limited vertical exploitation, but that contains vast quantities of sweet, dry natural gas.
The Whitemud Sands do produce gas in vertically drilled wells, but at lower rates than other Edmonton Sands. Horizontal multistage frac technology has opened up these massive reservoirs. The Company drilled and completed two 100% working interest Whitemud horizontal gas wells in the first quarter of 2010. Both wells were recently completed and the Company is currently conducting flowback operations to determine a stabilized rate for these wells. The wells are at approximately 600 meters vertical depth and traverse 1,000 to 1,200 meters horizontally through the formation.
Based on the Company’s internal mapping, the Company owns or controls 200 sections of prospective Whitemud Sands with an average working interest of 60%. Company engineers have estimated that the initial gas in place could be 2.5 Bcf per section.

| | | | |
| ANDERSON ENERGY 2009 ANNUAL REVIEW | | | 19 | |
DEEPER DRILLING
The Company has a substantial vertical well drilling inventory for horizons deeper than the Edmonton Sands. In 2010, the Company plans to drill a total of six gross (4.9 net) locations, of which four gross (4.0 net) are at Westpem targeting the Rock Creek formation and two gross (0.9 net) are in the Sylvan Lake area targeting the Ellerslie formation. As well, the Company has two gross (1.5 net) recompletion opportunities in the Cardium formation. The deeper drilling initiatives are all infill gas wells and typically have initial production of approximately one MMcfd with a six-month average stabilized rate of 500 Mcfd with 40 bbls per MMscf of natural gas liquids. In the first quarter of 2010, the Company drilled two of these deeper prospects in the Westpem area targeting the Rock Creek formation. The wells were completed at rates of 1.1 and 1.5 MMcfd of raw gas respectively, with associated natural gas liquids. The wells are expected to be tied in for production late in the first quarter of 2010.
If the pace of development of the horizontal multistage frac opportunities is accelerated, the remaining deeper drilling initiatives may be deferred until 2011.
Drilling Inventory
| | | | | | | | |
| As at December 31, 2009 | | | | | | |
Vertical Drilling Locations | | | Gross | | | | Net | |
Edmonton Sands with GLJ Assigned P&P Reserves | | | 865 | | | | 457 | |
Edmonton Sands on Farm-in Option Lands | | | 317 | | | | 207 | |
Horseshoe Canyon CBM with GLJ Assigned P&P Reserves | | | 99 | | | | 20 | |
Deep Drilling | | | 24 | | | | 20 | |
| | | | | | | | |
Total | | | 1,305 | | | | 704 | |
| | | | | | | | |
| | |
Horizontal Multistage Frac Potential Locations | | | Gross | | | | Net | |
Cardium Light Oil (3 wells per section drilling density) | | | 240 | | | | 141 | |
Whitemud Sands Gas (2 wells per section drilling density) | | | 400 | | | | 240 | |
| | | | | | | | |
Total | | | 640 | | | | 381 | |
| | | | | | | | |
Reserves
GLJ Petroleum Consultants completed an evaluation of all of the Company’s petroleum and natural gas reserves effective December 31, 2009. The tables and ratios in this section are an excerpt from the Company’s annual information form for the year ended December 31, 2009. Complete reserves disclosure as required by National Instrument 51-101 is contained in the Company’s annual information form which is filed on SEDAR.
RESERVES
| | | | | | | | | | | | |
| As at December 31, 2009 | | Oil & Natural Gas Liquids | | | Natural Gas | | | BOE | |
| | | (Mbbls) | | | (MMcf) | | | (MBOE) | |
Proved | | | | | | | | | | | | |
Producing | | | 1,629 | | | | 45,562 | | | | 9,223 | |
Developed non-producing | | | 134 | | | | 15,466 | | | | 2,712 | |
Undeveloped | | | 524 | | | | 66,937 | | | | 11,680 | |
Total Proved | | | 2,287 | | | | 127,965 | | | | 23,615 | |
Proved plus Probable | | | 3,730 | | | | 186,995 | | | | 34,896 | |
The Company’s finding, development and acquisition costs in 2009 were $7.76 per BOE total proved and $7.97 per BOE total proved plus probable including revisions, changes to future development capital and estimates for drilling incentive credits.1 The Company’s recycle ratio for both total proved reserves and total proved plus probable reserves was 1.9. The Company’s reserves replacement ratio was 194% for total proved plus probable reserves in 2009. The reserves life index on a proved basis was 9.1 years and on a proved plus probable basis was 13.5 years, based on annualized 2009 fourth quarter production.
CONTINUITY OF GROSS RESERVES
| | | | | | | | |
| | | | | | Proved plus | |
| | | Proved (MBOE) | | | Probable (MBOE) | |
Opening | | | 23,396 | | | | 32,297 | |
Additions | | | 6,089 | | | | 8,779 | |
Revisions | | | (3,095 | ) | | | (3,405 | ) |
Production | | | (2,775 | ) | | | (2,775 | ) |
Closing | | | 23,615 | | | | 34,896 | |
GLJ assigned proved plus probable reserves to the Company’s Edmonton Sands farm-in for the lands in the commitment phase of the farm-in; however, no reserves were assigned to the option phase of the farm-in. Due to the limitations within the rules of NI 51-101, only one probable undeveloped Whitemud location and 2.5 probable undeveloped net Cardium locations were assigned reserves by GLJ.
Production
Sales volumes averaged 7,603 BOED in 2009 compared to 7,787 BOE in 2008. Production declined slightly from the previous year due to the sale of B.C. gas properties late in 2008 and due to the suspension of drilling activity until the fourth quarter of 2009 to conserve capital for the Edmonton Sands farm-in commitment. Over 90% of the Company’s production came from central Alberta in 2009. Production was weighted 84% to natural gas in 2009. Production is expected to average between 8,000 and 8,500 BOED in 2010.
| (1) | The aggregate of the exploration, development and acquisition costs incurred in the most recent financial year and the change during the year in estimated future development costs generally will not reflect total finding, development and acquisition costs related to reserves additions for that year. Management’s discussion and analysis contains more details on the calculation of finding, development and acquisition costs. |
| | | | |
| ANDERSON ENERGY 2009 ANNUAL REVIEW | | | 21 | |
Health, Safety & Environment
HEALTH AND SAFETY
Anderson Energy is committed to conducting its operations in a safe manner, protecting the health and safety of employees, contractors and community residents.
Anderson Energy maintains a rigorous approved contractor selection process in which contractor and subcontractor health and safety compliance and programs are factored in as a condition of hire.
An Enform internal audit of Anderson Energy’s Health and Safety program was conducted in 2009 in preparation for the 2010 external Alberta Partnership Certificate of Recognition (“COR”) recertification audit. Anderson achieved its highest audit score to date, reflecting the Company’s commitment to continuous improvement.
In August 2009, Anderson Energy received the coveted Work Safe Alberta Best Safety Performers Award for 2008. The Annual Best Safety Performer Awards recognize Alberta employers with exceptional performance in workplace health and safety.
ENVIRONMENT
Anderson Energy is committed to minimizing the impact of its activities on the environment while developing its energy resources economically and efficiently. The Company has established an environmental policy that integrates the following guiding principles:
| • | | Comply with applicable environmental law, industry standards and internal policies; |
| • | | Make environmental considerations an integral part of planning processes; |
| • | | Operate facilities and handle raw materials in a manner that protects the environment, and the health and safety of employees, contractors and the public; |
| • | | Promptly provide relevant information to all stakeholders affected by our operations and be responsive and sensitive to legitimate stakeholder concerns; |
| • | | Identify and mitigate the adverse impacts of operations on the environment in keeping with good environmental and business practices; |
| • | | Respond to emergencies in a prompt and efficient manner; and |
| • | | Commit sufficient resources to ensure that our employees are fully informed of their responsibilities and are trained to protect the environment while performing their duties. |
CORPORATE CITIZENSHIP
Establishing and maintaining good community relations is a high priority for the Company. As part of our strategy for improving landowner communications, an open house was held at the Leedale Hall in September 2009 to present our 2009-2010 development plans for the greater Edmonton Sands development area. Response to the open house was positive and our development projects are proceeding with the support of the public. Responsibility for protecting the environment, as well as the health and safety of employees, contractors and the public, is a commitment made by everyone at Anderson Energy—from senior management to our field employees.
Corporate Information
HEAD OFFICE
700 Selkirk House
555 Fourth Avenue S.W.
Calgary, Alberta
Canada T2P 3E7
Phone (403) 262-6307
Fax (403) 261-2792
Website www.andersonenergy.ca
DIRECTORS
J.C. Anderson (2)(3)
Calgary, Alberta
Brian H. Dau (3)
Calgary, Alberta
Chris L. Fong (1)(2)
Calgary, Alberta
Glenn D. Hockley (1)(3)
Calgary, Alberta
David G. Scobie (1)(2)
Calgary, Alberta
Member of
| (2) | Compensation and Corporate Governance Committee |
AUDITORS
KPMG LLP
INDEPENDENT ENGINEERS
LEGAL COUNSEL
Bennett Jones LLP
REGISTRAR & TRANSFER AGENT
STOCK EXCHANGE
The Toronto Stock Exchange
Symbol: AXL
CONTACT INFORMATION
Anderson Energy Ltd.
Brian H. Dau
President & Chief Executive Officer
(403) 262-6307
OFFICERS
J.C. Anderson
Brian H. Dau
| President | & Chief Executive Officer |
David M. Spyker
M. Darlene Wong
| Chief | Financial Officer & Secretary |
Blaine M. Chicoine
| Vice | President, Operations |
Philip A. Harvey
| Vice | President, Exploitation |
Daniel F. Kell
Jamie A. Marshall
| Vice | President, Exploration |
ABBREVIATIONS USED
| | |
| AECO | | intra-Alberta Nova inventory transfer price |
| bbl | | barrel |
| bpd | | barrels per day |
| Mbbls | | thousand barrels |
| BOE | | barrels of oil equivalent |
| BOED | | barrels of oil equivalent per day |
| MBOE | | thousand barrels of oil equivalent |
| MMBOE | | million barrels of oil equivalent |
| CBM | | Coal Bed Methane |
| GJ | | gigajoule |
| Mcf | | thousand cubic feet |
| Mcfd | | thousand cubic feet per day |
| MMcf | | million cubic feet |
| MMscf | | million standard cubic feet |
| MMcfd | | million cubic feet per day |
| Bcf | | billion cubic feet |
| Bcfd | | billion cubic feet per day |
| Tcf | | trillion cubic feet |

700 Selkirk House
555 Fourth Avenue S.W., Calgary, Alberta T2P 3E7
Tel: (403) 262-6307 Fax: (403) 261-2792
www.andersonenergy.ca
ADVISORY: Certain information regarding Anderson Energy Ltd. in this annual review including, without limitation, management’s assessment of future plans and operations, benefits and valuation of the development prospects described herein, number of locations in drilling inventory and wells to be drilled, timing and location of drilling and tie-in of wells and the costs thereof, productive capacity of the wells, timing of and construction of facilities, expected production rates, dates of commencement of production, amount of capital expenditures and timing thereof, value of undeveloped land, extent of reserves additions, ability to attain cost savings, drilling program success, impact of changes to the royalty regime applicable to the Company, including payment of drilling incentive credits, commodity price outlook and general economic outlook may constitute forward-looking statements under applicable securities laws and necessarily involve risks and assumptions made by management of the Company including, without limitation, risks associated with oil and gas exploration, development, exploitation, production, marketing and transportation, loss of markets, volatility of commodity prices, currency fluctuations, imprecision of reserves estimates, environmental risks, competition from other producers, inability to retain drilling rigs and other services, capital expenditure costs, including drilling, completion and facilities costs, unexpected decline rates in wells, wells not performing as expected, incorrect assessment of the value of acquisitions and farm-ins, failure to realize the anticipated benefits of acquisitions and farm-ins, delays resulting from or inability to obtain required regulatory approvals and ability to access sufficient capital from internal and external sources. As a consequence, actual results may differ materially from those anticipated in the forward-looking statements. Readers are cautioned that the foregoing list of factors is not exhaustive. Additional information on these and other factors that could affect Anderson Energy’s operations and financial results are included in reports on file with Canadian securities regulatory authorities and may be accessed through the SEDAR website (www.sedar.com) and at Anderson Energy’s website (www.andersonenergy.ca).
Furthermore, the forward-looking statements contained in this annual review are made as at the date of this annual review and Anderson Energy does not undertake any obligation to update publicly or to revise any of the included forward-looking statements, whether as a result of new information, future events or otherwise, except as may be required by applicable securities laws.
Disclosure provided herein in respect of barrels of oil equivalent (BOE) may be misleading, particularly if used in isolation. A BOE conversion ratio of 6 Mcf: 1 bbl is based on an energy equivalency conversion method primarily applicable at the burner tip and does not represent a value equivalency at the wellhead.