Exhibit 99.6


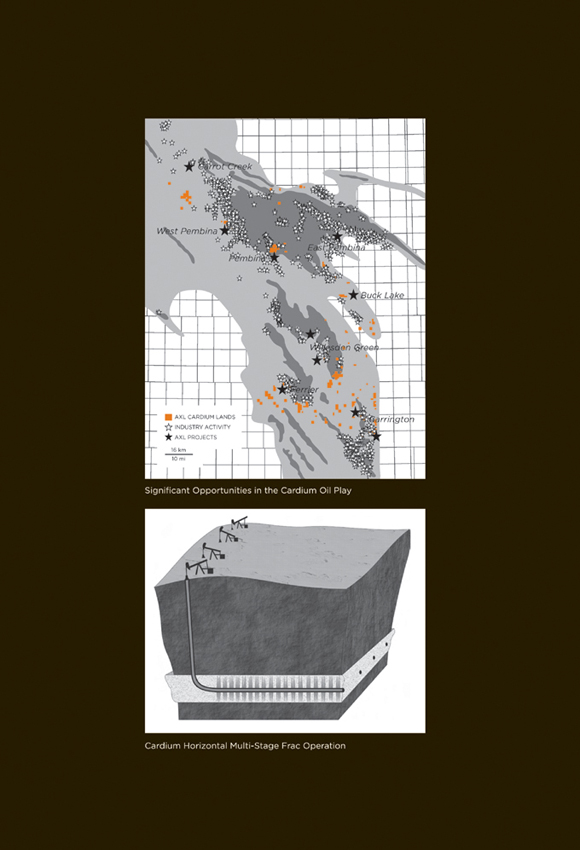
MUSCLING UP TO THE FRONT OF THE CARDIUM PLAY Anderson Energy is a resource-based oil and gas development company. Its principal property is in central Alberta around the Sylvan Lake and Pembina fields. The Company’s development strategy is focused on high-impact, multi-stage horizontal frac opportunities for Cardium light oil. The Company has drilled 37 gross (27 net) Cardium horizontal oil wells to March 25, 2011 and has identified an additional 146 gross (84 net) drilling locations to be drilled over the next few years. Anderson Energy’s Cardium prospective land inventory is 112 gross (66 net) sections. While the Company also has a significant inventory of natural gas drilling locations, repositioning for oil production growth is the primary focus of the Company in light of the current weakness in natural gas prices. Oil production from the Cardium horizontal oil drilling program initiated in the summer of 2010 started coming on stream in the fourth quarter of 2010. The Company is focused on increasing its land position and utilizing new technologies to lower costs and enhance well performance. We have “muscled up” by increasing our financial flexibility, our technical horsepower and our expertise to develop the Cardium horizontal oil play.
The common shares of the Company are listed on the TSX under the symbol AXL. Management, directors and the Anderson family own over 14% of the basic shares of the Company.
2010 Annual Review
Anderson Energy presents the following review of its operating and financial performance for 2010 and its prospects for 2011. This information is a summary of the Company’s annual results taken from the previously released December 31, 2010 audited financial statements, management’s discussion and analysis and annual information form. A complete copy of these documents can be found at the Company’s website at www.andersonenergy.ca, on the SEDAR website at www.sedar.com or by contacting the Company at (403) 262-6307 or at info@andersonenergy.ca.
ANNUAL MEETING The Annual Meeting of Shareholders will be held on May 16, 2011, at 2:00 pm at the Metropolitan Conference Centre, 333-4th Avenue S.W., Calgary, Alberta.
| | | | |
| ANDERSON ENERGY 2010 ANNUAL REVIEW | | | 3 | |
Financial and Operating Highlights
| | | | | | | | | | | | |
| | | 2010 | | | 2009 | | | % Change | |
FINANCIAL (thousands of dollars, except share data) | | | | | | | | | | | | |
Oil and gas sales | | | 86,457 | | | | 76,993 | | | | 12% | |
Revenue, net of royalties* | | | 77,411 | | | | 68,895 | | | | 13% | |
Funds from operations | | | 37,180 | | | | 31,258 | | | | 19% | |
Per common share (basic) | | | 0.22 | | | | 0.25 | | | | (12% | ) |
Per common share (diluted) | | | 0.22 | | | | 0.25 | | | | (12% | ) |
Net loss | | | (35,631 | ) | | | (36,458 | ) | | | 2% | |
Per common share (basic) | | | (0.21 | ) | | | (0.29 | ) | | | 28% | |
Per common share (diluted) | | | (0.21 | ) | | | (0.29 | ) | | | 28% | |
Capital expenditures | | | 112,173 | | | | 33,558 | | | | 234% | |
Bank loans plus cash working capital deficiency | | | 71,507 | | | | 72,524 | | | | (1% | ) |
Convertible debentures | | | 43,460 | | | | — | | | | 100% | |
Shareholders’ equity | | | 333,791 | | | | 332,719 | | | | — | |
Average shares outstanding (thousands) | | | | | | | | | | | | |
Basic | | | 170,298 | | | | 125,047 | | | | 36% | |
Diluted | | | 170,298 | | | | 125,047 | | | | 36% | |
Ending shares outstanding (thousands) | | | 172,485 | | | | 150,500 | | | | 15% | |
| | | |
OPERATING | | | | | | | | | | | | |
Average daily sales: | | | | | | | | | | | | |
Natural gas (Mcfd) | | | 37,124 | | | | 38,489 | | | | (4% | ) |
Light/medium crude oil (bpd) | | | 601 | | | | 395 | | | | 52% | |
NGL (bpd) | | | 778 | | | | 794 | | | | (2% | ) |
Barrels of oil equivalent (BOED) | | | 7,566 | | | | 7,603 | | | | — | |
Average prices: | | | | | | | | | | | | |
Natural gas ($/Mcf) | | | 3.96 | | | | 3.95 | | | | — | |
Light/medium crude oil ($/bbl) | | | 73.62 | | | | 59.26 | | | | 24% | |
NGL ($/bbl) | | | 55.22 | | | | 42.73 | | | | 29% | |
Barrels of oil equivalent ($/BOE) | | | 31.31 | | | | 27.74 | | | | 13% | |
Realized loss on derivative contracts ($/BOE) | | | (0.05 | ) | | | — | | | | (100% | ) |
Royalties ($/BOE) | | | 3.26 | | | | 2.97 | | | | 10% | |
Operating costs ($/BOE) | | | 10.56 | | | | 9.70 | | | | 9% | |
Operating netback ($/BOE) | | | 17.44 | | | | 15.07 | | | | 16% | |
G&A expense ($/BOE) | | | 2.80 | | | | 2.52 | | | | 11% | |
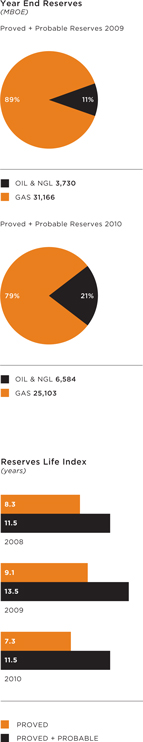
Reserves: | | | | | | | | | | | | |
Natural gas (MMcf) | | | | | | | | | | | | |
Proved | | | 97,313 | | | | 127,965 | | | | (24% | ) |
Proved plus probable | | | 150,621 | | | | 186,995 | | | | (19% | ) |
Crude oil and NGL (Mbbls) | | | | | | | | | | | | |
Proved | | | 3,899 | | | | 2,287 | | | | 70% | |
Proved plus probable | | | 6,584 | | | | 3,730 | | | | 77% | |
Undeveloped land (thousands of acres) | | | | | | | | | | | | |
Gross/net | | | 99/47 | | | | 123/62 | | | | (20%/24% | ) |
| | | | | | | | | | | | |
Drilling activity (gross/net wells) | | | | | | | | | | | | |
Gas | | | 23/19 | | | | 109/82 | | | | (79%/77% | ) |
Oil | | | 22/16 | | | | 0/0 | | | | 100%/100% | |
Dry | | | 4/3 | | | | 9/8 | | | | (56%/62% | ) |
| | | | | | | | | | | | |
Total | | | 49/38 | | | | 118/90 | | | | (58%/58% | ) |
| | | | | | | | | | | | |
|
|
| *excludes unrealized losses on derivative contracts |
To Our Shareholders,
In 2010, the Company repositioned itself for oil production and oil reserves growth as it started to shift its emphasis from a natural gas driller and producer to a Cardium light oil horizontal driller and oil producer. The culmination of weak natural gas markets, the weak outlook for natural gas and the Cardium horizontal oil discoveries offsetting the Company’s land in central Alberta caused the Company to completely rethink its strategy. Although this was an easy decision to make, it took time to implement as the Company had to move up the learning curve on the Cardium play, wind up some of its natural gas drilling and tie-in initiatives, and defer its shallow gas drilling commitments. As well, the Company had to finance the strategy change. 2010 was a transition year to reposition the Company for future oil production and oil reserves growth and 2011 will be the year that the Company and its shareholders will benefit from the repositioning. In January 2011, Anderson established a 2011 capital budget of $75 million almost entirely focused on drilling Cardium light oil horizontal oil wells.
Two financings were completed in 2010. In February 2010, the Company issued 21.9 million common shares at $1.45 per share for gross proceeds of $31.8 million, pursuant to a bought deal financing. The proceeds were used to commence the evaluation of the Cardium horizontal oil play. On December 31, 2010, the Company issued $50 million of convertible debentures with a five-year term, a 7.5% coupon and a conversion price of $1.55 per share. Proceeds were used to reduce bank debt and will provide financial flexibility for the Company’s 2011 capital program.
NATURAL GAS MARKETS
In last year’s annual report, we characterized 2009 as a very challenging year for junior natural gas companies and natural gas markets. 2010 was no different. In 2010, the average price for natural gas at AECO was $4.00 per Mcf, compared to $3.95 per Mcf in 2009 and $8.13 per Mcf in 2008. The level of natural gas in storage in the United States continued to remain at very high levels throughout 2010 and into 2011. In January and February 2010, we saw a “normal” winter which prompted very good supply withdrawals for the heating season. This past summer was hot in eastern Canada and the eastern United States, which created strong demand for natural gas to generate electricity for air conditioning. However, the price of natural gas was suppressed due to increasing U.S. gas supply driven primarily by the U.S. shale gas plays. The large amount of gas in storage, combined with strong U.S. gas production and financial market fears, has suppressed the price of natural gas. The future price for natural gas is at a level that should not support most drilling projects on either side of the border. However, drilling continues in U.S. shale gas plays, partly due to lease retention and partly due to the large number of U.S. shale gas joint venture projects, where third parties are obligated to drill to earn lands owned by U.S. shale gas producers. In Canada, drilling continues primarily in areas where the gas target is liquids rich.
The best cure for low natural gas prices is periods of low natural gas prices, where ultimately drilling rig counts fall to the point where supply and demand become more balanced. Natural gas is still a cyclical commodity. When the markets start to believe that supply and demand are more balanced, natural gas prices should strengthen. However, from our shareholders’ perspective, we cannot wait for the return of stronger natural gas prices. We were successful in the winter of 2009/2010 in reducing both capital and operating costs in our natural gas business; however, the cash flow coming from our natural gas business was not enough in a low natural gas price environment to sustain the Company’s drilling plans. In a higher natural gas price market, the Company has a sizeable natural gas asset base and drilling prospects that can generate considerable production growth. However, for now, our solution to low natural gas prices is to drill for light oil in the Cardium horizontal play.
| | | | |
| ANDERSON ENERGY 2010 ANNUAL REVIEW | | | 5 | |
CRUDE OIL MARKETS
Crude oil prices strengthened considerably in 2010, with the average West Texas Intermediate (WTI) oil price in Canadian dollars being $82 per bbl as compared to $70 per bbl in 2009. WTI oil prices in Canadian dollars year to date in 2011 have been even higher with the recent political unrest in the Middle East. Future strip prices for the balance of 2011 are over $100 per bbl. We expect oil prices to remain high but to continue to be volatile, as crude oil remains a geopolitical commodity. On a relative basis, the difference between the Company’s realized field oil price and wellhead natural gas price is currently 25:1 as compared to the commonly used energy equivalency ratio of 6:1.
THE CARDIUM HORIZONTAL OIL PLAY
The Company’s initial land position in the Cardium horizontal oil play was primarily acquired in a 2007 property acquisition, where the Company bought high quality deeper producing rights along with shallower Edmonton Sands rights and key facility infrastructure. Initially the Company successfully developed the deep liquids rich natural gas prospects at Westpem, Bigoray and Willesden Green, as well as the Edmonton Sands shallow potential in these lands. It is now developing the Cardium oil prospects.
In late 2009, the industry aggressively started to acquire land and drill horizontal light oil wells in the Cardium. The Company reassigned one of its most senior geologists (who had previous Cardium experience) away from the shallow gas operations to focus on analyzing the Cardium. A lot of time was spent analyzing cores at the Energy Resources Conservation Board (ERCB) core storage facility. The conclusions were that the Company’s land was well positioned geologically to drill Cardium horizontal wells. Initial concerns with the play were focussed on geological risk, drilling and completion risk and cost control.
The Company believed that with the significant well and core control, geological risk could be managed. Outside consultants were hired to acquire horizontal drilling and multi-stage frac completion technologies. The Company operated the drilling of two wells and participated in another well in the first quarter of 2010 and completed them in the second quarter of 2010. Initial completion results were encouraging. The Company was one of the early adopters of monobore drilling technology, which is now the industry standard. After drilling 22 wells in 2010, the drilling risk in this play is minimal and controllable.
On the well completion front, consistent with other operators in the play, the initial multi-stage fracture stimulations were done using diesel, and then later using synthetic oil as the frac fluid. Today, as part of a general shift up the learning curve, water is used as the frac fluid for several key reasons:
| | • | | The stimulation cost is reduced by approximately $500,000 when compared to using a hydrocarbon based frac fluid; |
| | • | | The cycle time to get new oil on stream is reduced significantly. With a water based frac, the first oil to surface is new oil and typically occurs three to four days after the frac stimulation has been completed. With a hydrocarbon based frac, all the hydrocarbon (diesel or synthetic oil, called load fluid) that was put down the wellbore when conducting the fracture stimulation must be recovered at surface before incremental volumes are deemed new oil. This load fluid recovery process can take three to four weeks; |
| | • | | Water is a superior frac fluid to hydrocarbon based fluids in terms of its density and compressibility / shear properties; and |
| | • | | Initial concerns that the introduction of water into the highly oil saturated Cardium reservoir would result in a reduction of permeability and hence poor post stimulation production performance have proven to be unfounded. |
It is the Company’s view that the multi-stage fracture stimulation process is what carries the most risk in the play. Some of the early wells were not effectively stimulated along the whole horizontal length due to difficulties in shifting open some of the frac ports. The Company has successfully made a number of changes to date to mitigate this risk.
Since the play inception, the Company has reduced the costs of the play from $3.5 million per well to $3.0 million per well for full cycle drill, complete, equip and tie-in costs.
As we accomplished in the Edmonton Sands shallow gas business, our objective with this play is to be an industry leader in capital costs and build our own infrastructure to reduce operating expenses, improve operating margins and deliver strong recycle ratios.
Anderson has 112.5 gross (65.8 net) sections of Cardium prospective land and, based on a drilling density of three wells per section, could have 338 gross (197.4 net) drilling locations. The Company has high-graded this list of locations to a non-contingent development drilling list of 183 gross (111.2 net) locations. As of March 25, 2011, the Company has drilled 37 gross (26.7 net) wells, leaving a remaining non-contingent development drilling inventory of 146 gross (84.5 net) wells. The Company continues to add to its land position with farm-in deals, property swaps and acquisitions.
NON-CONTINGENT DEVELOPMENT LOCATIONS
(gross number of wells)
| | | | | | | | | | | | | | | | | | | | |
| | | Q1 2010 | | | Q2 2010 | | | Q3 2010 | | | Q4 2010 | | | March 25, 2011 | |
Drilling prospects | | | 3 | | | | 58 | | | | 80 | | | | 143 | | | | 183 | |
Cumulative wells drilled | | | 3 | | | | 5 | | | | 16 | | | | 22 | | | | 37 | |
The Company has created core areas in Garrington, Pembina East and Willesden Green and is developing a new core area in Ferrier. In each core area, the Company builds central tank batteries and pipelines to these facilities. Where possible, tank batteries are connected to oil pipeline systems for transportation to market. The Company consolidates its position in each area through land deals, and once battery infrastructure is in place, infill drilling can commence. Ultimately, waterflooding could significantly improve recovery rates in the Cardium, and the Company plans to pursue this further in 2012.
In the past 12 months of operating in this play, the Company has learned some valuable lessons:
| | • | | The longer the horizontal well, the better the well, as long as the well is in good quality rock with sufficient net pay and permeability; |
| | • | | Well performance is independent of wellbore orientation. Theoretically, the best wells should be positioned northwest to southeast. However, it is more important to position the well to intersect the thickest oil pay and best permeability; |
| | • | | Geology is more important than geography; |
| | • | | It is important to locate the wells away from areas of significant pressure depletion from existing mature vertically drilled Cardium fields; and |
| | • | | Oil recovery is higher in under-saturated oil reservoirs (lower gas oil ratio), than in saturated reservoirs (higher gas oil ratios below bubble point pressure/gas caps). |
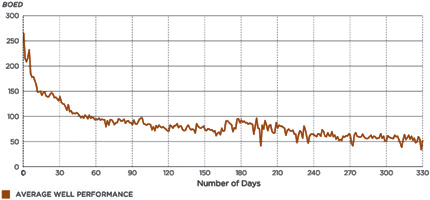
For example, initial production data can be misleading. The table on the following page describes two Company-operated wells. The 5-25 well is a saturated reservoir and the 5-24 well is an under-saturated reservoir. Although the 5-25 well had excellent initial production data with high gas oil ratios, its oil reserves on a proved plus probable basis are less than half of the 5-24 well.
| | | | |
| ANDERSON ENERGY 2010 ANNUAL REVIEW | | | 7 | |
INITIAL PRODUCTION DATA - WHICH IS THE BETTER WELL?
| | | | | | | | | | | | | | | | |
| Days on Production | | Pembina 5-25 BOED | | | Pembina 5-25 BOPD | | | Pembina 5-24 BOED | | | Pembina 5-24 BOPD | |
| | | (Oil & Gas) | | | (Oil Only) | | | (Oil & Gas) | | | (Oil Only) | |
24 hours | | | 944 | | | | 709 | | | | 293 | | | | 280 | |
7 days | | | 607 | | | | 364 | | | | 265 | | | | 254 | |
30 days | | | 351 | | | | 189 | | | | 193 | | | | 188 | |
60 days | | | 255 | | | | 130 | | | | 171 | | | | 163 | |
90 days | | | 210 | | | | 103 | | | | 160 | | | | 149 | |
The Company’s normalized time zero production graph for operated wells is presented below:
INDIVIDUAL WELL PRODUCTION VS DAYS ON PRODUCTION
FOR OPERATED CARDIUM WELLS
(BOED, 87% oil and NGL on average)
The following graph illustrates the growth in Cardium production since October 1, 2010. The graph shows the contribution to production from wells drilled in 2010 and to date in 2011. The graph illustrates how the Company has been able to ramp up its Cardium production in the past year and also illustrates how quickly the production curve stabilizes over time.
CARDIUM PRODUCTION GROWTH
(BOED, 85% oil and NGL)
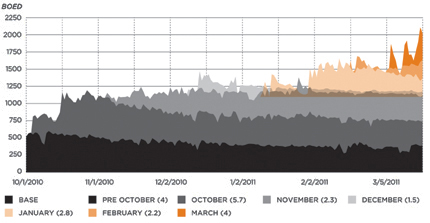
The numbers in brackets in the legend are the net number of wells included in the data above.
2011 CAPITAL BUDGET
The Company is planning to direct almost all of its 2011 capital program to Cardium oil horizontal drilling. Anderson’s Board of Directors has approved a capital budget (net of dispositions) of $75 million for 2011. The associated production guidance for 2011 is approximately 7,500 BOED (net of dispositions), of which 33% is oil and NGLs, up from 18% oil and NGLs in 2010. The Company is estimating it could potentially exit 2011 with 40% to 50% of its production being oil and NGLs. The Company considered alternative spending plans that yielded higher BOED production growth through spending on natural gas prospects, but elected to proceed with the oil focused capital budget as it yields higher cash flows through stronger oil netbacks. The Company is not planning to spend any capital on its natural gas properties in 2011 and therefore estimates that production from its gas and NGL properties will fall at an annual decline rate of approximately 25%. The Company believes that in the current commodity price environment with future strip pricing of greater than $100 per barrel WTI for oil and less than $4.00 per GJ AECO for gas, a capital program focused primarily on Cardium horizontal oil is prudent. At WTI oil prices of $100 U.S. per barrel, the operating netback for Cardium light oil projects is currently about $75 per BOE, compared to the operating netback for Edmonton Sands shallow gas projects of about $15 per BOE. Based on current strip pricing, the Company’s 2011 cash flow is estimated to be approximately 50% higher than its 2010 cash flow.
The budget includes the drilling of 32 gross (22.0 net capital, 20.0 net revenue) Cardium horizontal oil wells in 2011, of which 15 gross (13.6 net capital, 11.3 net revenue) wells are planned to be drilled in the first quarter. The Cardium drilling program in the first quarter of 2011 is designed to add significant oil volumes by the second quarter. We plan to have a total of 41 gross (29.8 net) Cardium horizontal oil wells on production before the end of the second quarter of 2011. The Company continues to review the commodity price outlook and could potentially add to its 2011 drilling program with additional Cardium oil horizontal drilling locations.
Using the GLJ Petroleum Consultants (“GLJ”) January 1, 2011 price deck, management’s view of the economics of the Cardium horizontal play is as follows:
SINGLE-WELL ECONOMICS FOR CARDIUM HORIZONTAL OIL WELLS
| | | | | | | | |
| | | 155 MBOE | | | 180 MBOE | |
| | | Reserves | | | Reserves | |
Initial production - first 30 days
(BOED - 92% oil) | | | 139 | | | | 164 | |
Total capital per well (millions of dollars) | | | 3.0 | | | | 3.0 | |
Finding and development cost ($/BOE) | | $ | 19.35 | | | $ | 16.66 | |
Pretax operating netback ($/BOE) | | $ | 68.77 | | | $ | 69.25 | |
Pretax recycle ratio (times) | | | 3.6 | | | | 4.2 | |
Pretax rate of return (%) | | | 76 | | | | 83 | |
Pretax payout (months) | | | 25 | | | | 24 | |
Pretax NPV 10 (millions of dollars) | | | 3.1 | | | | 3.5 | |
| | | | |
| ANDERSON ENERGY 2010 ANNUAL REVIEW | | | 9 | |
RESERVES AND NET ASSET VALUATION
GLJ has evaluated all of the Company’s petroleum and natural gas reserves as of December 31, 2010. The Company estimates its fully diluted net asset value to be $1.78 per share. See the table below for the assumptions used in this calculation. GLJ’s January 1, 2011, price forecast was used in the calculation and is available on GLJ’s website and in the Company’s Management’s Discussion and Analysis for the year ended December 31, 2010.
NET ASSET VALUE ESTIMATE AT DECEMBER 31, 2010
| | | | |
| ($ millions, unless otherwise stated) | | Net Asset Value1 | |
Proved plus probable reserves (pretax 10% discount rate) | | $ | 271 | |
Undeveloped land (excluding Cardium horizontal prospective lands) | | | 5 | |
Cardium horizontal prospective lands (not in reserve report) | | | 166 | |
Stock option proceeds | | | 6 | |
Bank loans plus cash working capital deficiency, December 31, 2010 | | | (71 | ) |
| | | | |
Net asset value estimate, December 31, 2010 | | $ | 377 | |
| | | | |
Net asset value estimate per fully diluted share, December 31, 2010* | | $ | 1.78 | |
| | | | |
| | * | based on 211.3 million outstanding shares on a fully diluted basis at December 31, 2010 |
Reserves related to the Cardium horizontal oil play made up 14.8% of total proved plus probable reserves at December 31, 2010, compared to 1.4% at December 31, 2009. The percentage of total reserves from oil and NGL increased to 21% at December 31, 2010, from 11% at December 31, 2009. The Company has 98,813 gross (47,300 net) undeveloped acres of land excluding Cardium prospective lands as at December 31, 2010, and has assigned a value of $5.0 million to this land. The Company has assigned a value of $3.0 million per net section for Cardium lands that were not assigned drilling locations in the GLJ reserves report. These locations have not been included in the reserve report as they do not yet meet the criteria for recognition established under NI 51-101, either because there was insufficient production or horizontal well control to book the reserves, or the land deals were completed after December 31, 2010. The Company’s engineers have estimated the potential net present value of an average unbooked Cardium location to be approximately $2.2 million per location, using GLJ’s price forecast, a 10% pretax discount rate, farm-in and straight up economics over a four year time span of drilling activity. The Company has an inventory of 74.7 net Cardium locations not booked in the GLJ reserves report. The net asset value calculation also assumes that in-the-money stock options are exercised and convertible debentures are converted to common shares at $1.55 per share. Outstanding shares on a fully diluted basis are adjusted accordingly.
| (1) | The net asset valuation shows what the Company’s reserves would be produced at using forecast prices and costs. The value is a snapshot in time and is based on various assumptions, including commodity prices that vary over time. It should not be assumed that net asset value represents fair value of Anderson Energy shares. |
OUTLOOK
The Company’s increasing oil production is expected to start improving operating netbacks and cash flow in 2011. As a result, the performance of the stock should also start to improve as the “gas label” starts to peel off the stock. Junior oil companies trade at better evaluation metrics than natural gas companies, and management believes that as we progress through 2011, we will start to attract more of a junior oil company evaluation. In 2010, 18% of the Company’s production came from oil and NGL. Our current estimate for 2011 is 33%. The Company is striving to be 40 to 50% oil and NGL by late 2011 or early 2012. The Company was able to move up the learning curve in 2010 and in the first quarter of 2011 with its drilling, completion and production initiatives. Currently, the Company is one of the industry leaders in terms of low capital costs. The Company is very focused on increasing its land position in the Cardium and utilizing new technologies to lower costs and enhance well performance. The addition of water based fracture stimulation in February 2011 is one example of new initiatives. The convertible debenture financing conducted in December 2010 gives the Company the financial flexibility to possibly expand its initial 2011 capital program beyond $75 million. In the second quarter of 2011, the Company will review the potential for budget and guidance expansion.
PEOPLE
In May 2010, we welcomed David Sandmeyer to the Board of Directors. David is a professional engineer and corporate director and the former President and Chief Executive Officer of Freehold Royalty Trust and Rife Resources Ltd.
In September 2010, Dan Kell retired as Vice President, Land. We thank Dan for his many years of valuable service to the Company. Sandy Drinnan was promoted to Vice President, Land upon Dan’s retirement. Sandy had previously been the Manager, Land with Anderson Energy and held senior land positions at Anderson Exploration and Devon Canada for several years before that. She has over 25 years of experience in the industry.
In February 2011, we welcomed Patrick O’Rourke to the newly created position of Vice President, Production. Patrick is a professional engineer with 22 years of experience in both technical and managerial positions in facilities and production engineering. Patrick will be focused on optimizing our new Cardium oil production and reducing overall operating expenses in 2011.
Management thanks the Board for their guidance and stewardship throughout 2010. We are excited about the opportunities in front of us and look forward to muscling up to the front of the Cardium play in 2011.

Brian H. Dau
President and Chief Executive Officer
March 28, 2011
| | | | |
| ANDERSON ENERGY 2010 ANNUAL REVIEW | | | 13 | |
Cardium Horizontal Oil Play
GEOLOGY
The Cardium Formation was deposited as a complex sandstone wedge along the western margin of the Western Interior Seaway during the late Cretaceous. Three main cycles define the deposition of Cardium sediments which were shed from the developing mountains to the west and transported eastward to the margin of a shallow sea.
The Lower Cardium Formation is typified by shallow water extensively mixed mudstones which transition to shoreface and beach deposits. Long, narrow, northwest-southeast trending sand and conglomerate ridges are found within the interval and are productive primarily in the southern portion of central Alberta.
The Middle Cardium Formation is comprised of a widespread sandy shelf that accumulated in response to a fall in sea level. Shoreface sandstones and conglomerates dominate the sequence and have been modified during a following sea level rise. This has left a widespread erosional surface in the sequence and produced the conglomerate cap which forms the major traditional Cardium reservoirs such as Pembina, Willesden Green, Ferrier, and Garrington. Beneath the conglomeratic cap lies a thick sequence of sandy oil charged reservoir that is a prime driver of recent Cardium activity across central Alberta.
The Upper Cardium Formation represents the further development of the sandy wedge back into the sea following a further sea level rise. The uplift and erosion of Devonian, Carboniferous and Permian limestones and dolomites during later Cardium time resulted in the development of muddy, fine grained silt and sandstone deposits with only occasional conglomerates. A further sea level rise at the end of Cardium time sealed the sandstone wedge with a thick sequence of deep water marine shales. The Upper Cardium is productive in local trends in the northwest portion of central Alberta.
While the Lower and Upper Cardium are productive along well established trends in some parts of central Alberta, the Middle Cardium contains not only the major fields but offers the most extensive and attractive opportunities for horizontal Cardium development. The traditional Middle Cardium fields such as Pembina and Willesden Green have produced vast amounts of high quality, water-free oil from the reworked conglomerates over more than half a century. Vertical development is extensive, well established, and effective at recovering oil from the upper conglomerate portion of the section. However, this rock type only makes up a portion of the entire reservoir thickness and the finer grained sediments of the underlying shoreface sands contain a large volume of unrecovered oil.
The remaining oil is unlocked using new horizontal drilling with multi-stage fracture stimulation technologies. These new technologies have allowed us to expand the area of existing productive Cardium reservoirs, develop the full thickness of Cardium sandstones, and discover and develop entirely new Cardium oil pools.
| | | | |
| ANDERSON ENERGY 2010 ANNUAL REVIEW | | | 15 | |
DEVELOPMENT
Environmental considerations are integral to the Company’s operations at all stages of Cardium oil development from initial site selection to production of the well. To lessen the environmental footprint, multi-well pad sites are constructed wherever possible, as opposed to single well sites, thereby reducing the total land area required for development. Well sites and oil batteries are constructed to contain any potential spills or releases on site. To protect groundwater during drilling operations, surface casing is cemented full length to 600 meters in depth which is below the base of the groundwaters in the area. In addition, the production casing is cemented to surface and a cement bond log is run to verify the integrity of the production casing cement job prior to completing the wells. During drilling operations, secondary containment is used under the drilling rig to catch any spills of drilling fluids. Drill cuttings are trucked to a landfill site for treating and disposal. Recovered fluids from the multi-stage fracture stimulation are recycled for reuse when possible. Electric drivers are used on pumpjacks instead of gas engines to minimize noise and reduce emissions. Environmental stuffing boxes are installed to eliminate any spills from polish rod breaks and stuffing box leaks. Production skids have drip trays installed to catch any fluid leaks. To minimize traffic related to trucking produced fluids from individual well sites in the Garrington area, a majority of the wells drilled will be flow lined directly into the central battery site located at 15-34-035-03W5M, which will ultimately be connected to sales via a pipeline.
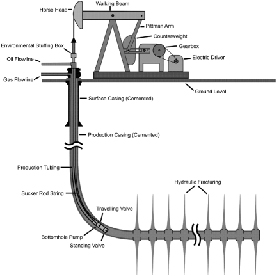
The Cardium development incorporates two technologies commonly used in the oil industry today - horizontal drilling and multi-stage hydraulic fracture stimulation. Historically, wells were drilled vertically and only a small portion of the productive zone was exposed by the perpendicular path of the vertical wellbore as it penetrated the zone. With advances in directional drilling, wells are now drilled horizontally along the length of the productive zone, thereby greatly increasing the overall length of the zone exposed to the wellbore. Whereas a typical vertical well in the Cardium would expose only 2 meters of the productive zone, a horizontal well now exposes close to 1,400 meters of the zone along the length of the wellbore.
After the well is drilled horizontally, permanent tools to facilitate a multi-stage hydraulic fracture stimulation of the Cardium zone are run as part of the production casing into the horizontal section of the well. Hydraulic fracturing is a stimulation technique in which fluids are injected at high pressures into the wellbore, creating vertical cracks in the reservoir rock. Sand is injected with the fluid to prop open the fractures, thereby creating high conductivity flow paths for the oil to the wellbore. The permanent tools run on the casing enable the hydraulic fracturing process to be performed in multiple stages along the length of the wellbore, hence the name “multi-stage hydraulic fracturing”.
When the bottomhole pressure in the reservoir is too low to enable reservoir fluids to flow all the way to the surface, an artificial lift system consisting of a bottomhole pump and sucker rod string is run into the production tubing inside the well and connected to a pumpjack unit on the surface. The artificial lift system mechanically lifts liquids out of the well.
The Company has created four core areas in the Cardium. In each core area, central tank batteries are built and individual wells are pipelined to a tank battery. Where possible, tank batteries are connected to oil pipeline systems for transportation to market. The Company consolidates its position in each area through land deals, and once battery infrastructure is in place, infill drilling can commence. In 2010, the Company established new core areas in Garrington, Pembina East and Willesden Green. In the first quarter of 2011, a new core area is starting to be developed in Ferrier. The ultimate development plan is to waterflood the Cardium. The primary recovery factor for the Cardium is 10 to 12%. Waterflooding, with due consideration for reservoir heterogeneities, is expected to increase the recovery factor to 20 to 25%.
Westpem and Edmonton Sands Natural Gas
The Company’s Notikewin, Rock Creek and Viking liquids-rich gas development plan for Westpem is based on a three vertical well per section drilling density and commingled production. Eleven drilling locations and six recompletion opportunities have been identified and will be pursued at such time as natural gas prices recover. These development wells are characterized by initial productivity exceeding one MMcfd, low decline rates, and NGL yields of 50 to 60 bbls per MMscf.
The Edmonton Sands project in central Alberta takes advantage of low capital costs, low operating costs and low decline water-free production from the development of the Company’s large drilling inventory. Fit-for-purpose Company infrastructure, efficient minimal disturbance drilling techniques, and proprietary knowledge will provide a value advantage for the Edmonton Sands drilling programs with a recovery of natural gas pricing.
| | | | |
| ANDERSON ENERGY 2010 ANNUAL REVIEW | | | 19 | |
Drilling Inventory
HORIZONTAL CARDIUM OIL DRILLING LOCATIONS
| | | | | | | | |
| As at March 25, 2011 | | Gross | | | Net* | |
Garrington | | | 60 | | | | 40.6 | |
Willesden Green | | | 45 | | | | 29.0 | |
Ferrier | | | 29 | | | | 16.6 | |
Pembina | | | 49 | | | | 25.0 | |
| | | | | | | | |
Total drillable today | | | 183 | | | | 111.2 | |
Drilled as of March 25, 2011 | | | 37 | | | | 26.7 | |
| | | | | | | | |
Remaining to be drilled as of March 25, 2011 | | | 146 | | | | 84.5 | |
| | | | | | | | |
| | |
* net revenue interest | | | | | | | | |
Reserves
GLJ Petroleum Consultants completed an evaluation of all of the Company’s reserves effective December 31, 2010. The tables and ratios in this section are an excerpt from what will be contained in the Company’s annual information form for the year ended December 31, 2010. Complete reserves disclosure as required by National Instrument 51-101 is contained in the Company’s annual information form, which is filed on SEDAR.
RESERVES
| | | | | | | | | | | | |
| As at December 31, 2010 | | Oil & Natural Gas Liquids | | | Natural Gas | | | BOE | |
| | | (Mbbls) | | | (MMcf) | | | (MBOE) | |
Proved | | | | | | | | | | | | |
Developed producing | | | 2,679 | | | | 52,498 | | | | 11,428 | |
Developed non-producing | | | 218 | | | | 7,457 | | | | 1,461 | |
Undeveloped | | | 1,002 | | | | 37,358 | | | | 7,228 | |
| | | | | | | | | | | | |
Total proved | | | 3,899 | | | | 97,313 | | | | 20,117 | |
| | | | | | | | | | | | |
Proved plus probable | | | 6,584 | | | | 150,621 | | | | 31,687 | |
| | | | | | | | | | | | |
CONTINUITY OF COMPANY WORKING INTEREST RESERVES
| | | | | | | | |
| As of December 31, 2010 | | Proved | | | Proved plus | |
| | | (MBOE) | | | Probable (MBOE) | |
Opening | | | 23,615 | | | | 34,896 | |
Additions | | | 3,023 | | | | 5,913 | |
Technical revisions | | | 3,318 | | | | 269 | |
Economic factors | | | (7,078 | ) | | | (6,630 | ) |
Production | | | (2,761 | ) | | | (2,761 | ) |
| | | | | | | | |
Closing | | | 20,117 | | | | 31,687 | |
| | | | | | | | |
At the end of 2009, the Company had 0.14 MMBOE of proved and 0.47 MMBOE of proved plus probable reserves associated with the Cardium horizontal oil play, representing approximately 1.4% of the total proved plus probable reserves. At the end of 2010, the Company had 2.37 MMBOE of proved and 4.7 MMBOE of proved plus probable reserves associated with the Cardium horizontal oil play, after producing approximately 124.3 MBOE of production in 2010. Today, the Cardium represents 14.8% of the Company’s proved plus probable reserves. Oil and NGL have grown from 10% of proved and proved plus probable
reserves in 2009 to 19% of proved and 21% of proved plus probable reserves in 2010. The Company expects that the Cardium reserves will continue to grow and become a larger percentage of the Company’s reserves in future years as the play is developed and we get more production history. In management’s opinion, the GLJ report is conservative on Cardium oil reserves as this is the first year an independent evaluation has been prepared on this new and emerging play for the Company.
The Company’s reserves life indices are 7.3 years for proved and 11.5 years for proved plus probable reserves, based on 2010 annual production. In 2010, the Company replaced 224% of production with new proved plus probable reserves additions, net of technical revisions. The Company replaced 697% of its oil and NGL production with new proved plus probable reserves.
Proved developed producing (“PDP”) reserves grew 24% in 2010. The PDP net present value at a 10% pre-tax discount rate (“NPV 10”) increased 6% in 2010. Reserves grew due to positive additions and revisions in both natural gas and oil. The percentage of PDP reserves relating to oil and NGL was 23% in 2010 compared to 18% in 2009. The PDP NPV 10 value was negatively impacted by reductions in forecast natural gas prices.
In 2010, the Company experienced positive technical revisions of 3.3 MMBOE proved and 0.3 MMBOE proved plus probable. These were offset by negative economic factors of 7.1 MMBOE proved and 6.6 MMBOE proved plus probable. Almost the entire economic factors adjustment related to the undeveloped gas and NGL reserves in the Edmonton Sands. The economic factor adjustment was due to a 25% reduction in GLJ’s natural gas price outlook for the years 2011 to 2015, and 16% thereafter. This was partially offset by the fact that there was improved performance in the proved developed producing category for the Edmonton Sands resulting in a positive additions and revisions of 2.2 MMBOE.
| | | | |
| ANDERSON ENERGY 2010 ANNUAL REVIEW | | | 21 | |
The Company’s 2010 finding, development and acquisition (“FD&A”) costs, including future development capital and additions only, were $17.56 per BOE proved and $15.81 per BOE proved plus probable. Finding, development and acquisitions costs, including future development capital and additions and technical revisions but excluding economic factors, were $22.30 per BOE proved and $22.35 per BOE proved plus probable.(2) The Company’s 2010 FD&A costs were higher than in 2009, as the Company’s capital investments were geared to starting up the more capital intensive Cardium horizontal oil drilling program, building Cardium multi-well batteries and completing its 2009/2010 winter shallow gas drilling program. With a WTI oil price of $100 U.S., the Cardium wellhead operating netback is approximately $75 per BOE and the FD&A were very acceptable, providing a recycle ratio of 3.3 times.
| (2) | The aggregate of the exploration and development costs incurred in the most recent financial year and the change during the year in estimated future development costs generally will not reflect total finding and development costs related to reserves additions for that year. BOEs may be misleading, particularly if used in isolation. A BOE conversion ratio of 6 Mcf:1 bbl is based on an energy equivalency conversion method primarily applicable at the burner tip and does not represent a value equivalency at the wellhead. See Management’s Discussion and Analysis for details of the calculation. |
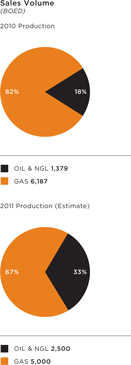
Production
Sales volumes averaged 7,566 BOED in 2010 compared to 7,603 BOE in 2009. Production in 2010 was similar to the previous year due to the deferral of the balance of the Edmonton Sands farm-in commitment. Later in 2010, higher value light crude oil became significant, averaging 992 BOPD in the fourth quarter. Once more, over 90% of the Company’s production came from central Alberta. In the fourth quarter of 2010, oil and NGL production averaged 22% by volume and 48% by revenue. Liquids targets for 2011 are for 33% oil and NGL by volume, comprising 60% of the Company’s revenue stream. Overall production is expected to average approximately 7,500 BOED in 2011.
The following table shows the growth in the Company’s Cardium production on a BOED basis per quarter in 2010 and our estimate as of March 25, 2011.
| | | | | | | | | | | | | | | | | | | | |
| | | | | | | | | | | | | | | March 25 | |
| | | | | | | | | | | | | | | Current | |
| | | Q1 2010 | | | Q2 2010 | | | Q3 2010 | | | Q4 2010 | | | Estimate | |
Cardium oil BOPD | | | 69 | | | | 248 | | | | 297 | | | | 777 | | | | 1,570 | |
Cardium oil BOED | | | 162 | | | | 336 | | | | 460 | | | | 1,035 | | | | 1,850 | |
Total oil & NGL bpd | | | 1,130 | | | | 1,232 | | | | 1,329 | | | | 1,815 | | | | 2,450 | |
| | |
| 22 | | HEALTH, SAFETY, ENVIRONMENT AND CORPORATE CITIZENSHIP |
Health, Safety & Environment
HEALTH AND SAFETY
Anderson Energy is committed to conducting its operation in a safe manner, protecting the health and safety of employees, contractors and community residents.
As part of this commitment, the Company strives to identify unsafe conditions and hazards in the workplace and implement engineering and administrative controls before operations begin. Ongoing hazard assessments are conducted during operations through the use of regularly conducted inspections, safety meetings and incident/near miss reporting to ensure hazards are eliminated or controlled.
Anderson Energy first achieved the Enform Alberta Partnership Certificate of Recognition (“COR”) in 2007 and successfully completed an external recertification audit of its Health and Safety program in 2010. The Company’s COR certificate has been renewed for an additional three years. Maintenance audits will be conducted yearly to ensure continuous improvement.
ENVIRONMENT
Anderson Energy is committed to minimizing the impact of its activities on the environment, while developing its energy resources economically and efficiently. The Company has established an environmental policy that integrates the following guiding principles:
| • | | Comply with applicable environmental law, industry standards and internal policies; |
| • | | Make environmental considerations an integral part of planning processes; |
| • | | Operate facilities and handle raw materials in a manner that protects the environment, health and safety of employees, contractors and the public; |
| • | | Promptly provide relevant information to all stakeholders affected by our operations and be responsive and sensitive to legitimate stakeholder concerns; |
| • | | Identify and mitigate the adverse impacts of operations on the environment in keeping with good environmental and business practices; |
| • | | Respond to emergencies in a prompt and efficient manner; and |
| • | | Commit sufficient resources to ensure that our employees are fully informed of their responsibilities and are trained to protect the environment while performing their duties. |
CORPORATE CITIZENSHIP
Responsibility for protecting the environment, as well as the health and safety of employees, contractors and the public is a commitment made by everyone at the Company - from senior management to our field employees.
In 2010, Anderson Energy was at the forefront of the Community Partners Program, an industry initiative to conduct business in a respectful manner in the local communities in which it operates. The Community Partners Program outlines respectful and courteous behavior in regards to communication with residents, security, dust, noise and garbage. These elements of the program are in turn an expectation for all employees, consultants and contractors.
Corporate Information
|
| HEAD OFFICE |
|
| 700 Selkrik House |
| 555 4th Avenue S.W. |
| Calgary, Alberta |
| Canada T2P 3E7 |
| Phone (403) 262-6307 |
| Fax (403) 261-2792 |
| Website www.andersonenergy.ca |
|
| DIRECTORS |
| J.C. Anderson |
| Calgary, Alberta |
|
| Brian H. Dau |
| Calgary, Alberta |
|
| Christopher L. Fong(1)(2)(3) |
| Calgary, Alberta |
|
| Glenn D. Hockley(1)(3) |
| Calgary, Alberta |
|
| David J. Sandmeyer(2)(3) |
| Calgary, Alberta |
|
| David G. Scobie(2)(3) |
| Calgary, Alberta |
|
| Member of |
(1) Audit Committee |
(2) Compensation & Corporate Governance Committee |
(3) Reserves Committee |
|
| AUDITORS |
| KPMG LLP |
|
| INDEPENDENT ENGINEERS |
| GLJ Petroleum Consultants |
|
| LEGAL COUNSEL |
| Bennett Jones LLP |
|
| REGISTRAR & TRANSFER AGENT |
| Valiant Trust Company |
|
| STOCK EXCHANGE |
| The Toronto Stock Exchange |
| Symbol: AXL, AXL.DB |
|
| CONTACT INFORMATION |
| Anderson Energy Ltd. |
| Brian H. Dau |
| President & Chief Executive Officer |
| (403) 262-6307 |
|
| OFFICERS |
| J.C. Anderson |
| Chairman of the Board |
|
| Brian H. Dau |
| President & Chief Executive Officer |
|
| David M. Spyker |
| Chief Operating Officer |
|
|
| M. Darlene Wong |
| Vice President, Finance |
| Chief Financial Officer & Secretary |
|
| Blaine M. Chicoine |
| Vice President, Operations |
|
| Sandra M. Drinnan |
| Vice President, Land |
|
| Philip A. Harvey |
| Vice President, Exploitation |
|
| Jamie A. Marshall |
| Vice President, Exploration |
|
| Patrick M. O’Rourke |
| Vice President, Production |
ABBREVIATIONS USED
| AECO | intra-Alberta Nova inventory transfer price |
| BOE | barrels of oil equivalent |
| BOED | barrels of oil equivalent per day |
| BOPD | barrels of oil per day |
| MBOE | thousand barrels of oil equivalent |
| MMBOE | million barrels of oil equivalent |
| Mcfd | thousand cubic feet per day |
| MMcfd | million cubic feet per day |
| MMscf | million standard cubic feet |

700 Selkirk House
555 Fourth Avenue S.W., Calgary, Alberta T2P 3E7
Tel: (403) 262-6307 Fax: (403) 261-2792
www.andersonenergy.ca
ADVISORY: Certain information regarding Anderson Energy Ltd. in this annual review including, without limitation, management’s assessment of future plans and operations, benefits and valuation of the development prospects described herein, number of locations in drilling inventory and wells to be drilled, timing and location of drilling and tie-in of wells and the costs thereof, productive capacity of the wells, timing of and construction of facilities, expected production rates, dates of commencement of production, amount of capital expenditures and timing thereof, value of undeveloped land, extent of reserves additions, ability to attain cost savings, drilling program success, impact of changes in commodity prices on operating results, impact of changes to the royalty regime applicable to the Company, including payment of drilling incentive credits, commodity price outlook and general economic outlook may constitute forward-looking statements under applicable securities laws and necessarily involve risks and assumptions made by management of the Company including, without limitation, risks associated with oil and gas exploration, development, exploitation, production, marketing and transportation, loss of markets, volatility of commodity prices, currency fluctuations, imprecision of reserves estimates, environmental risks, competition from other producers, inability to retain drilling rigs and other services, capital expenditure costs, including drilling, completion and facilities costs, unexpected decline rates in wells, wells not performing as expected, incorrect assessment of the value of acquisitions and farm-ins, failure to realize the anticipated benefits of acquisitions and farm-ins, delays resulting from or inability to obtain required regulatory approvals, changes to government regulation and ability to access sufficient capital from internal and external sources. As a consequence, actual results may differ materially from those anticipated in the forward-looking statements. Readers are cautioned that the foregoing list of factors is not exhaustive. Additional information on these and other factors that could affect Anderson Energy’s operations and financial results are included in reports on file with Canadian securities regulatory authorities and may be accessed through the SEDAR website (www.sedar.com) and at Anderson Energy’s website (www.andersonenergy.ca).
Furthermore, the forward-looking statements contained in this annual review are made as at the date of this annual review and Anderson Energy does not undertake any obligation to update publicly or to revise any of the included forward-looking statements, whether as a result of new information, future events or otherwise, except as may be required by applicable securities laws.
Disclosure provided herein in respect of barrels of oil equivalent (BOE) may be misleading, particularly if used in isolation. A BOE conversion ratio of 6 Mcf: 1 bbl is based on an energy equivalency conversion method primarily applicable at the burner tip and does not represent a value equivalency at the wellhead.