Exhibit (c)(15)
|
STRICTLY CONFIDENTIAL
Project Napa
Presentation to the Special Committee of the Board of Directors
July 25, 2016
|
Table of Contents
I. Overview 3 II. Napa Public Market Perspectives 9 III. Napa Financial Analysis 16
Appendix
A. Additional Valuation Detail 31 B. Napa Overview 39
[ 1 ]
|

Disclaimer
This presentation has been prepared by Moelis & Company LLC (“Moelis”) for exclusive use of the Special Committee of the Board of Directors of Orlando Corporation (“Orlando” or the “Company”) in considering the transaction described herein based on information provided by the Company and upon information from Napa Inc., and from third party sources. Moelis has not assumed any responsibility for independently verifying the accuracy of such information, and disclaims any liability with respect to the information herein. In this presentation, Moelis, at the direction of the Special Committee of the Board of Directors of Orlando, has used certain projections, forecasts or other forward-looking statements with respect to the Company and/or other parties involved in the transaction which were provided to Moelis by the Company and/or such other parties and which Moelis has assumed, at the direction of the Special Committee of the Board of Directors of Orlando, were prepared based on the best available estimates and judgments of the management of the Company and/or such other parties as to the future performance of the Company and/or such other parties. This presentation is provided as of the date hereof and Moelis assumes no obligation to update it or correct any information herein.
This presentation is solely for informational purposes. This presentation is not intended to provide the sole basis for any decision on any transaction and is not a recommendation with respect to any transaction. The recipient should make its own independent business decision based on all other information, advice and the recipient’s own judgment. This presentation is not an offer to sell or a solicitation of an offer to buy any business, security, option, commodity, future, loan or currency. It is not a commitment to underwrite any security, to loan any funds or to make any investment. Moelis does not offer tax, accounting, actuarial or legal advice. Absent Moelis’ prior written consent, this material, whether in whole or in part, may not be copied, photocopied, or duplicated in any form by any means, or redistributed.
Moelis and its related investment banking entities provide mergers and acquisitions, recapitalization, restructuring, corporate finance and other financial advisory services to clients and affiliates of Moelis provide investment management services to clients. Personnel of Moelis or such affiliates may make statements or provide advice that is contrary to information included in this material. The proprietary interests of Moelis or its affiliates may conflict with your interests. In addition, Moelis and its affiliates and their personnel may from time to time have positions in or effect transactions in securities referred to in this material (or derivatives of such securities), or serve as a director of companies referred to in this presentation. Moelis and its affiliates may have advised, may seek to advise and may in the future advise or invest in companies referred to in this presentation.
This presentation is confidential and may not be disclosed to any other person or relied upon without the prior written consent of Moelis.
[ 2 ]
|

I. Overview
|

Background
Moelis has held discussions with the Special Committee (the “Special Committee” or the “Committee”) of the Board of Directors of Orlando, Orlando’s management, Napa’s management and its advisors, and has also reviewed a number of public and private information sources in forming its perspectives
Moelis has been retained by the Special Committee to act as financial advisor to the Committee in connection with the Committee’s consideration of a potential transaction involving Napa and alternatives thereto, following an initial meeting with the Committee on April 19, 2016
Orlando’s Committee was assembled in part because of common ownership between Napa and Orlando, with E and family owning ~46% of Napa and ~27% of Orlando common shares outstanding
On May 20, 2016, the Committee held a meeting with Orlando management, Moelis, and Skadden to discuss the merits of a potential transaction with Napa, with Moelis and Orlando management discussing their preliminary perspectives based on due diligence that included: On May 5, 2016, Moelis, Orlando, Skadden, and a representative from the Committee attended a management presentation with members of Napa management and Napa’s advisors to discuss a number of topics, including an overview of Napa’s business, a review of Napa’s go-to-market approach, and a review of Napa’s financials
On May 11, 2016, Moelis and Orlando held a telephonic discussion with Napa’s CFO to review a number of topics around Napa’s financials and related business considerations At the May 20, 2016 meeting, the Committee determined it was appropriate to explore a potential transaction with Napa. Following the Committee’s approval, Moelis and Orlando held a telephonic discussion on May 23, 2016 to review Orlando’s preliminary financial model for Napa and assumptions underlying the projections.
On May 27, 2016, the Committee held a meeting with Orlando, Moelis, and Skadden to discuss Moelis’ and Orlando’s further findings and preliminary financial analysis. At this meeting, the Committee authorized Moelis to communicate a proposal to Napa’s advisors that Orlando would be prepared to enter into a transaction at $100 / share for Napa.
On June 1, 2016, at the direction of the Committee, Moelis communicated Orlando’s initial offer of $100 / share for Napa to Napa’s financial advisors, with additional price negotiations between Orlando, Napa, and its advisors continuing through July 15, 2016 and multiple additional Committee meetings during this period
During this period, on July 6, 2016, Moelis and Orlando held a telephonic discussion with Napa’s CFO to review Napa’s Q2 preliminary financial results and related business considerations, with follow-up financial information provided by Napa to Orlando through its advisors on July 10 and July 11, 2016
[4]
|

Background (cont’d)
On July 13, 2016, following a Committee meeting, the Committee authorized Moelis to offer to enter into a transaction at $109 / share, which Moelis communicated to Napa’s financial advisors and Napa accepted through its advisors
Beginning on July 15, 2016, Orlando and Napa entered into an exclusivity agreement at a potential transaction price of $109 / share, commencing a two-week diligence period during which multiple telephonic and in-person diligence sessions occurred between Orlando, Napa, and their respective advisors to cover business areas that included: Inbound Licensing Finance & Accounting Business Outlook Tax Products & Technology Human Resources Pricing Sales & Marketing
In addition to due diligence sessions and conference calls with Orlando, Skadden, the Committee, and Napa and its advisors, Moelis reviewed:
Orlando management’s financial projections for Napa under Orlando ownership, demonstrating the incremental impact of Napa to Orlando’s revenue and cash flows and including the impact of synergies and other benefits that are available only to Orlando pro forma for the acquisition Publicly available business and financial information relating to Orlando and Napa Information relating to the business, earnings, cash flow, balance sheet and prospects of Napa, including financial forecasts prepared by Napa Assumptions that were provided to Moelis by Orlando around Napa’s financial forecasts, relating to certain projection set components (e.g., working capital, capital expenditures, and depreciation and amortization assumptions) not received as part of
Napa’s standalone forecast
During the course of its engagement, Moelis held several conference calls with members of Orlando and the Committee to discuss due diligence findings and the potential acquisition:
April 19, 2016 May 27, 2016June 14, 2016July 8, 2016July 13, 2016 May 20, 2016June 8, 2016 June 30, 2016 July 12, 2016
Throughout the course of the engagement, Moelis operated as instructed by the Special Committee, and is not aware of any communications between Orlando management, the Committee, and E regarding a potential Napa transaction
[5]
|
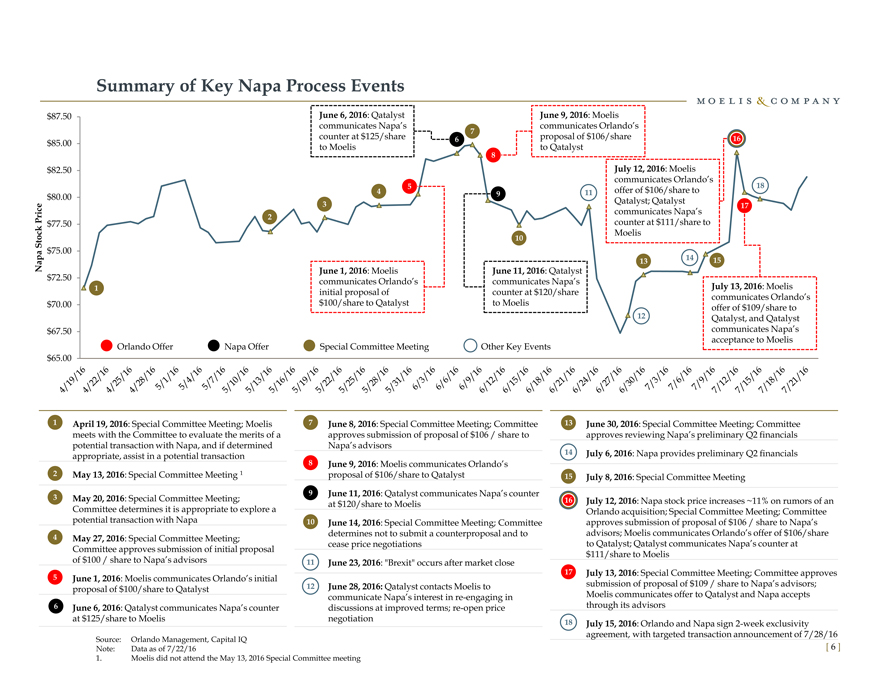
Summary of Key Napa Process Events
$87.50 June 6, 2016: Qatalyst June 9, 2016: Moelis
communicates Napa’s communicates Orlando’s
7
counter at $125/share 6 proposal of $106/share 16
$85.00 to Moelis to Qatalyst
8
$82.50 July 12, 2016: Moelis
communicates Orlando’s
4 5 offer of $106/share to 18
$80.00 9 11 Qatalyst; Qatalyst
3 17
Price 2 communicates Napa’s
$77.50 counter at $111/share to
k
c Moelis
o 10
St $75.00
Napa 13 14 15
June 1, 2016: Moelis June 11, 2016: Qatalyst
$72.50 communicates Orlando’s communicates Napa’s
1 July 13, 2016: Moelis
initial proposal of counter at $120/share communicates Orlando’s
$70.00 $100/share to Qatalyst to Moelis offer of $109/share to
12 Qatalyst, and Qatalyst
$67.50 communicates Napa’s
acceptance to Moelis
Orlando Offer Napa Offer Special Committee Meeting Other Key Events
$65.00
1 April 19, 2016: Special Committee Meeting; Moelis 7 June 8, 2016: Special Committee Meeting; Committee June 30, 2016: Special Committee Meeting; Committee
meets with the Committee to evaluate the merits of a approves submission of proposal of $106 / share to approves reviewing Napa’s preliminary Q2 financials
potential transaction with Napa, and if determined Napa’s advisors
appropriate, assist in a potential transaction 14 July 6, 2016: Napa provides preliminary Q2 financials
8 June 9, 2016: Moelis communicates Orlando’s
2 May 13, 2016: Special Committee Meeting 1 proposal of $106/share to Qatalyst 15 July 8, 2016: Special Committee Meeting
9 June 11, 2016: Qatalyst communicates Napa’s counter
3 May 20, 2016: Special Committee Meeting; at $120/share to Moelis 16 July 12, 2016: Napa stock price increases ~11% on rumors of an
Committee determines it is appropriate to explore a Orlando acquisition; Special Committee Meeting; Committee
potential transaction with Napa 10 June 14, 2016: Special Committee Meeting; Committee approves submission of proposal of $106 / share to Napa’s
4 May 27, 2016: Special Committee Meeting; determines not to submit a counterproposal and to advisors; Moelis communicates Orlando’s offer of $106/share
Committee approves submission of initial proposal cease price negotiations to Qatalyst; Qatalyst communicates Napa’s counter at
$111/share to Moelis
of $100 / share to Napa’s advisors 11 June 23, 2016: “Brexit” occurs after market close
5 June 1, 2016: Moelis communicates Orlando’s initial 17 July 13, 2016: Special Committee Meeting; Committee approves
proposal of $100/share to Qatalyst 12 June 28, 2016: Qatalyst contacts Moelis to submission of proposal of $109 / share to Napa’s advisors;
communicate Napa’s interest in re-engaging in Moelis communicates offer to Qatalyst and Napa accepts
6 June 6, 2016: Qatalyst communicates Napa’s counter discussions at improved terms; re-open price through its advisors
at $125/share to Moelis negotiation 18 July 15, 2016: Orlando and Napa sign 2-week exclusivity
Source: Orlando Management, Capital IQ agreement, with targeted transaction announcement of 7/28/16
Note: Data as of 7/22/16
1. Moelis did not attend the May 13, 2016 Special Committee meeting
[ 6 ]
|
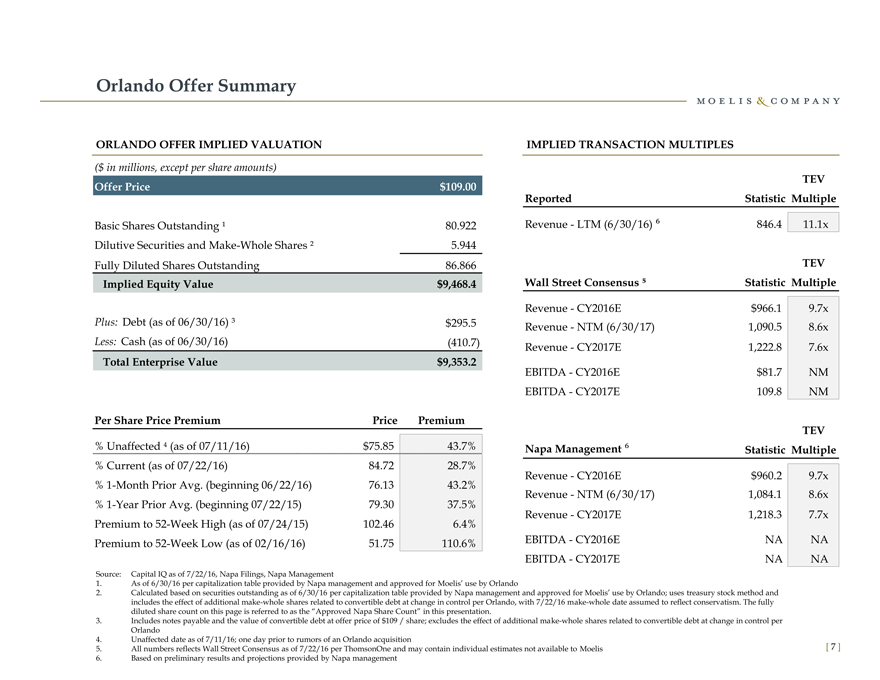
Orlando Offer Summary
ORLANDO OFFER IMPLIED VALUATION IMPLIED TRANSACTION MULTIPLES
($ in millions, except per share amounts)
TEV
Offer Price $109.00
Reported Statistic Multiple
Basic Shares Outstanding ¹ 80.922 Revenue—LTM (6/30/16) ? 846.4 11.1x
Dilutive Securities and Make-Whole Shares ² 5.944
Fully Diluted Shares Outstanding 86.866 TEV
Implied Equity Value $9,468.4 Wall Street Consensus Statistic Multiple
Revenue—CY2016E $966.1 9.7x
Plus: Debt (as of 06/30/16) ³ $295.5 Revenue—NTM (6/30/17) 1,090.5 8.6x
Less: Cash (as of 06/30/16)(410.7) Revenue—CY2017E 1,222.8 7.6x
Total Enterprise Value $9,353.2
EBITDA—CY2016E $81.7 NM
EBITDA—CY2017E 109.8 NM
Per Share Price Premium Price Premium
TEV
% Unaffected (as of 07/11/16) $75.85 43.7% Napa Management ? Statistic Multiple
% Current (as of 07/22/16) 84.72 28.7%
Revenue—CY2016E $960.2 9.7x
% 1-Month Prior Avg. (beginning 06/22/16) 76.13 43.2%
Revenue—NTM (6/30/17) 1,084.1 8.6x
% 1-Year Prior Avg. (beginning 07/22/15) 79.30 37.5%
Revenue—CY2017E 1,218.3 7.7x
Premium to 52-Week High (as of 07/24/15) 102.46 6.4%
Premium to 52-Week Low (as of 02/16/16) 51.75 110.6% EBITDA—CY2016E NA NA
EBITDA—CY2017E NA NA
EBITDA—CY2017E NA
Source: Capital IQ as of 7/22/16, Napa Filings, Napa Management
1. As of 6/30/16 per capitalization table provided by Napa management and approved for Moelis’ use by Orlando
2. Calculated based on securities outstanding as of 6/30/16 per capitalization table provided by Napa management and approved for Moelis’ use by Orlando; uses treasury stock method and includes the effect of additional make-whole shares related to convertible debt at change in control per Orlando, with 7/22/16 make-whole date assumed to reflect conservatism. The fully diluted share count on this page is referred to as the “Approved Napa Share Count” in this presentation.
3. Includes notes payable and the value of convertible debt at offer price of $109 / share; excludes the effect of additional make-whole shares related to convertible debt at change in control per Orlando
4. Unaffected date as of 7/11/16; one day prior to rumors of an Orlando acquisition
5. All numbers reflects Wall Street Consensus as of 7/22/16 per ThomsonOne and may contain individual estimates not available to Moelis
6. Based on preliminary results and projections provided by Napa management
[7]
|
Orlando Offer Summary (cont’d)
PRICE
FINANCING
VOTING AGREEMENT
TERMINATION FEES
EXPENSE REIMBURSEMENT
UNAFFILIATED TENDER CONDITION
REPRESENTATIONS AND WARRANTIES
OTHER
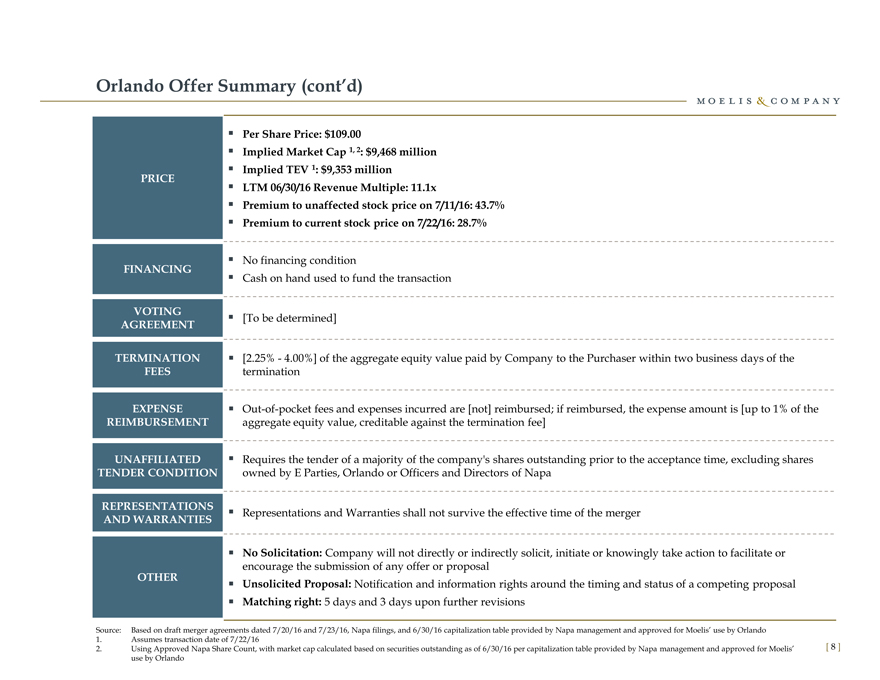
Per Share Price: $109.00
Implied Market Cap 1, 2: $9,468 million Implied TEV 1: $9,353 million LTM 06/30/16 Revenue Multiple: 11.1x
Premium to unaffected stock price on 7/11/16: 43.7% Premium to current stock price on 7/22/16: 28.7%
No financing condition
Cash on hand used to fund the transaction
[To be determined]
[2.25%—4.00%] of the aggregate equity value paid by Company to the Purchaser within two business days of the termination
Out-of-pocket fees and expenses incurred are [not] reimbursed; if reimbursed, the expense amount is [up to 1% of the aggregate equity value, creditable against the termination fee]
Requires the tender of a majority of the company’s shares outstanding prior to the acceptance time, excluding shares owned by E Parties, Orlando or Officers and Directors of Napa
Representations and Warranties shall not survive the effective time of the merger
No Solicitation: Company will not directly or indirectly solicit, initiate or knowingly take action to facilitate or encourage the submission of any offer or proposal Unsolicited Proposal: Notification and information rights around the timing and status of a competing proposal Matching right: 5 days and 3 days upon further revisions
Source: Based on draft merger agreements dated 7/20/16 and 7/23/16, Napa filings, and 6/30/16 capitalization table provided by Napa management and approved for Moelis’ use by Orlando
1. Assumes transaction date of 7/22/16
2. Using Approved Napa Share Count, with market cap calculated based on securities outstanding as of 6/30/16 per capitalization table provided by Napa management and approved for Moelis’ use by Orlando
[8]
|

II. Napa Public Market Perspectives
|
Napa Annotated 3-Year Share Price Performance
$120 3 5.0
2
7
$110
8
$100 10 4.0
$90 5 6 15
1 4 13
9
$80 )
e m
3.0
Pric $70 14(m
k TRADING STATISTICS ume
Stoc 11 l
$60 Napa Vo
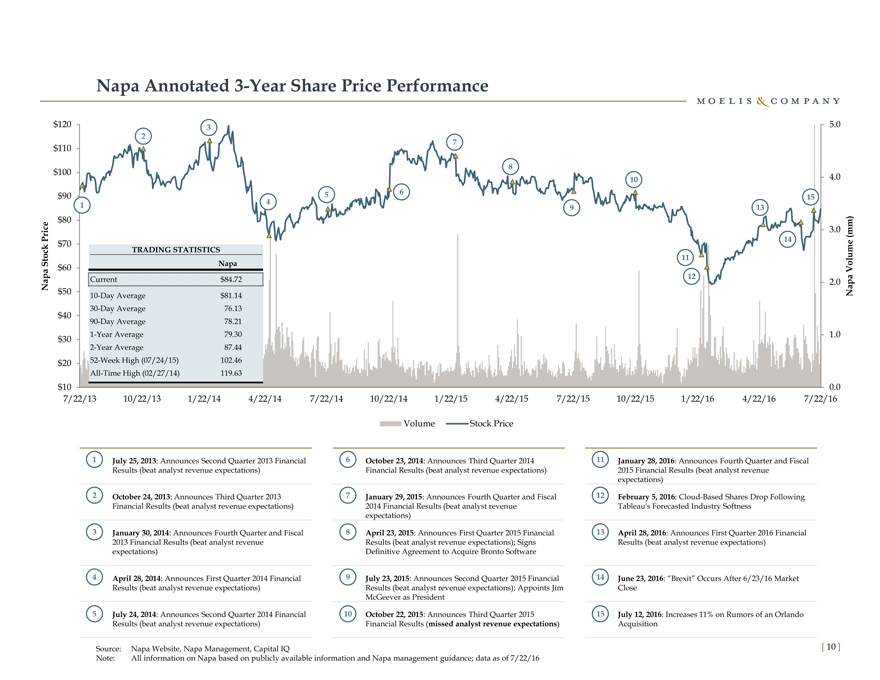
Napa Current $ 84.72 12 2.0 pa
$50 10-Day Average $ 81.14 Na
30-Day Average 76.13
$40
90-Day Average 78.21
$30 1-Year Average 79.30 1.0
2-Year Average 87.44
$20 52-Week High (07/24/15) 102.46
All-Time High (02/27/14) 119.63
$10 0.0
7/22/13 10/22/13 1/22/14 4/22/14 7/22/14 10/22/14 1/22/15 4/22/15 7/22/15 10/22/15 1/22/16 4/22/16 7/22/16
Volume Stock Price
1 July 25, 2013: Announces Second Quarter 2013 Financial 6 October 23, 2014: Announces Third Quarter 2014 11 January 28, 2016: Announces Fourth Quarter and Fiscal
Results (beat analyst revenue expectations) Financial Results (beat analyst revenue expectations) 2015 Financial Results (beat analyst revenue
expectations)
2 October 24, 2013: Announces Third Quarter 2013 7 January 29, 2015: Announces Fourth Quarter and Fiscal 12 February 5, 2016: Cloud-Based Shares Drop Following
Financial Results (beat analyst revenue expectations) 2014 Financial Results (beat analyst revenue Tableau’s Forecasted Industry Softness
expectations)
3 January 30, 2014: Announces Fourth Quarter and Fiscal 8 April 23, 2015: Announces First Quarter 2015 Financial 13 April 28, 2016: Announces First Quarter 2016 Financial
2013 Financial Results (beat analyst revenue Results (beat analyst revenue expectations); Signs Results (beat analyst revenue expectations)
expectations) Definitive Agreement to Acquire Bronto Software
4 April 28, 2014: Announces First Quarter 2014 Financial 9 July 23, 2015: Announces Second Quarter 2015 Financial 14 June 23, 2016: “Brexit” Occurs After 6/23/16 Market
Results (beat analyst revenue expectations) Results (beat analyst revenue expectations); Appoints Jim Close
McGeever as President
5 July 24, 2014: Announces Second Quarter 2014 Financial 10 October 22, 2015: Announces Third Quarter 2015 15 July 12, 2016: Increases 11% on Rumors of an Orlando
Results (beat analyst revenue expectations) Financial Results (missed analyst revenue expectations) Acquisition
Source: Napa Website, Napa Management, Capital IQ
Note: All information on Napa based on publicly available information and Napa management guidance; data as of 7/22/16
[ 10 ]
|
Napa’s Quarterly Revenue History vs. Wall Street Consensus
FY2013 FY2014 FY2015 FY2016
($ in millions) Q1 Q2 Q3 Q4 Q1 Q2 Q3 Q4 Q1 Q2 Q3 Q4 Q1 Q2
Reported:
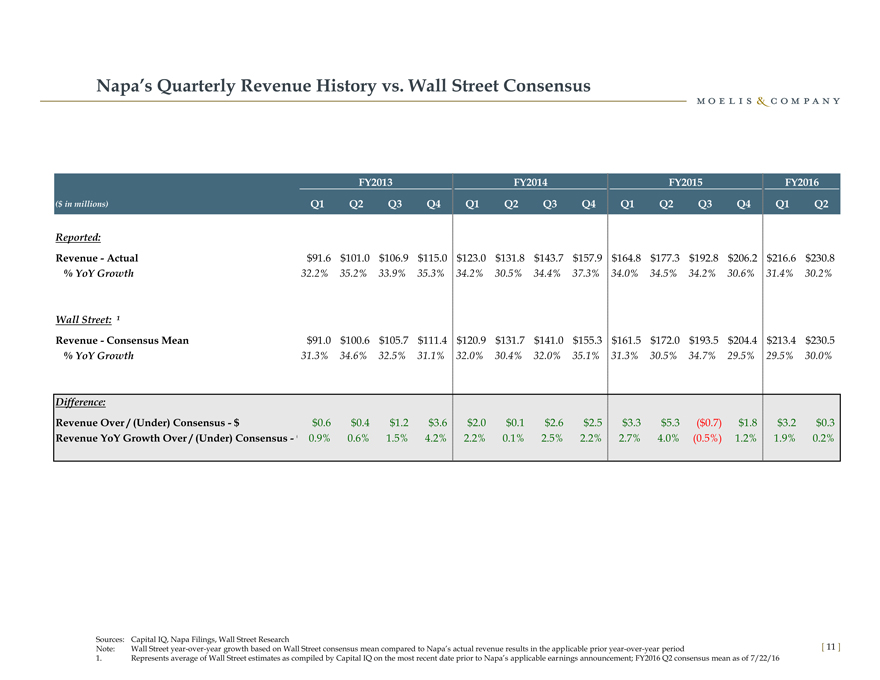
Revenue—Actual $91.6 $101.0 $106.9 $115.0 $123.0 $131.8 $143.7 $157.9 $164.8 $177.3 $192.8 $206.2 $216.6 $230.8
% YoY Growth 32.2% 35.2% 33.9% 35.3% 34.2% 30.5% 34.4% 37.3% 34.0% 34.5% 34.2% 30.6% 31.4% 30.2%
Wall Street: ¹
Revenue—Consensus Mean $91.0 $100.6 $105.7 $111.4 $120.9 $131.7 $141.0 $155.3 $161.5 $172.0 $193.5 $204.4 $213.4 $230.5
% YoY Growth 31.3% 34.6% 32.5% 31.1% 32.0% 30.4% 32.0% 35.1% 31.3% 30.5% 34.7% 29.5% 29.5% 30.0%
Difference:
Revenue Over / (Under) Consensus—$ $0.6 $0.4 $1.2 $3.6 $2.0 $0.1 $2.6 $2.5 $3.3 $5.3($0.7) $1.8 $3.2 $0.3
Revenue YoY Growth Over / (Under) Consensus—0.9% 0.6% 1.5% 4.2% 2.2% 0.1% 2.5% 2.2% 2.7% 4.0%(0.5%) 1.2% 1.9% 0.2%
Sources: Capital IQ, Napa Filings, Wall Street Research
Note: Wall Street year-over-year growth based on Wall Street consensus mean compared to Napa’s actual revenue results in the applicable prior year-over-year period
1. Represents average of Wall Street estimates as compiled by Capital IQ on the most recent date prior to Napa’s applicable earnings announcement; FY2016 Q2 consensus mean as of 7/22/16
[11]
|
3-Year Relative Share Price Trading
TRADING GAIN / LOSS
Selected
Public SaaS
Napa NASDAQ Companies
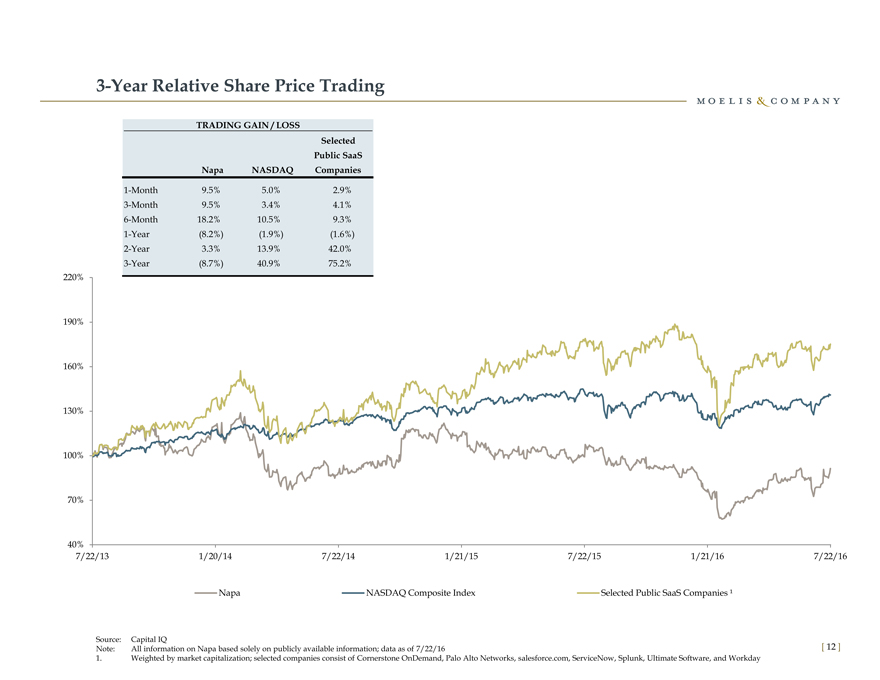
1-Month 9.5% 5.0% 2.9%
3-Month 9.5% 3.4% 4.1%
6-Month 18.2% 10.5% 9.3%
1-Year(8.2%)(1.9%)(1.6%)
2-Year 3.3% 13.9% 42.0%
3-Year(8.7%) 40.9% 75.2%
220%
190%
160%
130%
100%
70%
40%
7/22/13 1/20/14 7/22/14 1/21/15 7/22/15 1/21/16 7/22/16
Napa NASDAQ Composite Index Selected Public SaaS Companies ¹
Source: Capital IQ
Note: All information on Napa based solely on publicly available information; data as of 7/22/16
1. Weighted by market capitalization; selected companies consist of Cornerstone OnDemand, Palo Alto Networks, salesforce.com, ServiceNow, Splunk, Ultimate Software, and Workday
[ 12 ]
|
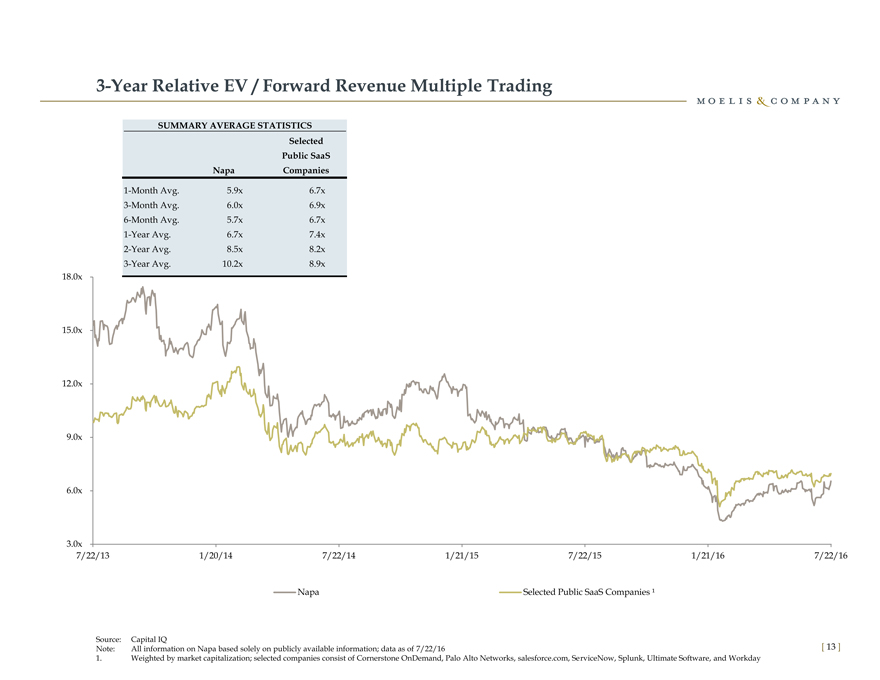
3-Year Relative EV / Forward Revenue Multiple Trading
SUMMARY AVERAGE STATISTICS
Selected
Public SaaS
Napa Companies
1-Month Avg. 5.9x 6.7x
3-Month Avg. 6.0x 6.9x
6-Month Avg. 5.7x 6.7x
1-Year Avg. 6.7x 7.4x
2-Year Avg. 8.5x 8.2x
3-Year Avg. 10.2x 8.9x
18.0x
15.0x
12.0x
9.0x
6.0x
3.0x
7/22/13 1/20/14 7/22/14 1/21/15 7/22/15 1/21/16 7/22/16
Napa Selected Public SaaS Companies ¹
Source: Capital IQ
Note: All information on Napa based solely on publicly available information; data as of 7/22/16
1. Weighted by market capitalization; selected companies consist of Cornerstone OnDemand, Palo Alto Networks, salesforce.com, ServiceNow, Splunk, Ultimate Software, and Workday
[13]
|
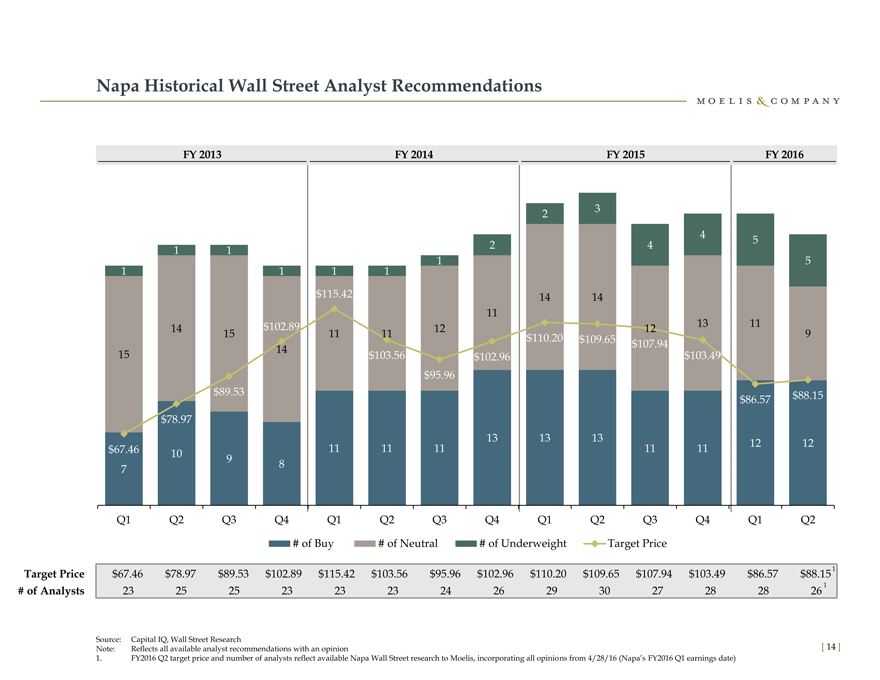
Napa Historical Wall Street Analyst Recommendations
FY 2013 FY 2014 FY 2015 FY 2016
2 3
4 5
1 1 2 4
1 5
1 1 1 1
$115.42 14 14
11
14 $102.89 12 12 13 11
15 11 11 $110.20 $109.65 9
14 $107.94
15 $103.56 $102.96 $103.49
$95.96
$89.53 $88.15
$86.57
$78.97
13 13 13 12 12
$67.46 10 11 11 11 11 11
9 8
7
Q1 Q2 Q3 Q4 Q1 Q2 Q3 Q4 Q1 Q2 Q3 Q4 Q1 Q2
# of Buy # of Neutral # of Underweight Target Price
Target Price $67.46 $78.97 $89.53 $102.89 $115.42 $103.56 $95.96 $102.96 $110.20 $109.65 $107.94 $103.49 $86.57 $88.15 1
# of Analysts 23 25 25 23 23 23 24 26 29 30 27 28 28 26 1
Source: Capital IQ, Wall Street Research
Note: Reflects all available analyst recommendations with an opinion
1. FY2016 Q2 target price and number of analysts reflect available Napa Wall Street research to Moelis, incorporating all opinions from 4/28/16 (Napa’s FY2016 Q1 earnings date)
[14]
|
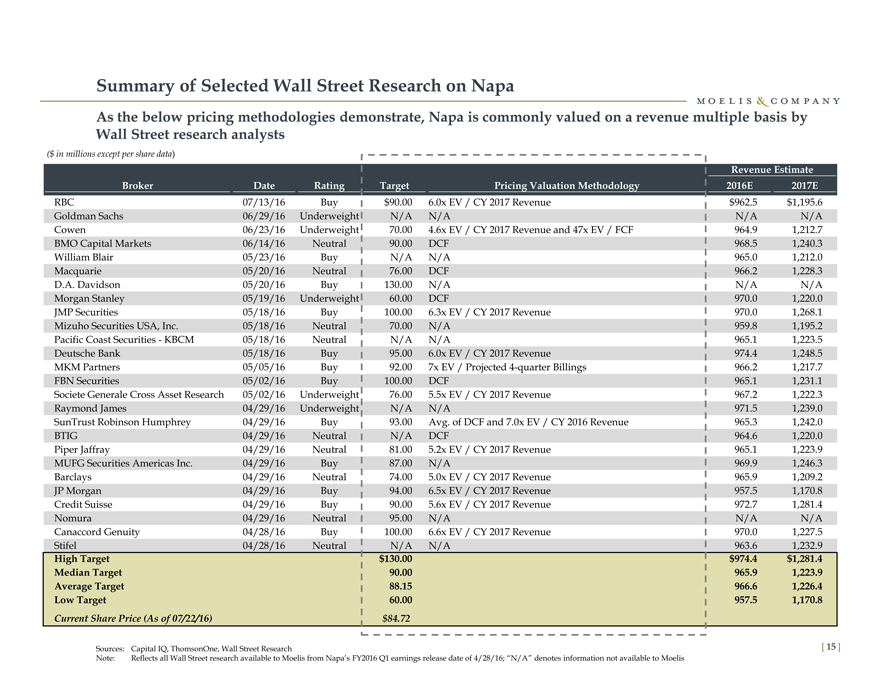
Summary of Selected Wall Street Research on Napa
As the below pricing methodologies demonstrate, Napa is commonly valued on a revenue multiple basis by
Wall Street research analysts
($ in millions except per share data)
Revenue Estimate
Broker Date Rating Target Pricing Valuation Methodology 2016E 2017E
RBC 07/13/16 Buy $90.00 6.0x EV / CY 2017 Revenue $ 962.5 $1,195.6
Goldman Sachs 06/29/16 Underweight N/A N/A N/A N/A
Cowen 06/23/16 Underweight 70.00 4.6x EV / CY 2017 Revenue and 47x EV / FCF 964.9 1,212.7
BMO Capital Markets 06/14/16 Neutral 90.00 DCF 968.5 1,240.3
William Blair 05/23/16 Buy N/A N/A 965.0 1,212.0
Macquarie 05/20/16 Neutral 76.00 DCF 966.2 1,228.3
D.A. Davidson 05/20/16 Buy 130.00 N/A N/A N/A
Morgan Stanley 05/19/16 Underweight 60.00 DCF 970.0 1,220.0
JMP Securities 05/18/16 Buy 100.00 6.3x EV / CY 2017 Revenue 970.0 1,268.1
Mizuho Securities USA, Inc. 05/18/16 Neutral 70.00 N/A 959.8 1,195.2
Pacific Coast Securities—KBCM 05/18/16 Neutral N/A N/A 965.1 1,223.5
Deutsche Bank 05/18/16 Buy 95.00 6.0x EV / CY 2017 Revenue 974.4 1,248.5
MKM Partners 05/05/16 Buy 92.00 7x EV / Projected 4-quarter Billings 966.2 1,217.7
FBN Securities 05/02/16 Buy 100.00 DCF 965.1 1,231.1
Societe Generale Cross Asset Research 05/02/16 Underweight 76.00 5.5x EV / CY 2017 Revenue 967.2 1,222.3
Raymond James 04/29/16 Underweight N/A N/A 971.5 1,239.0
SunTrust Robinson Humphrey 04/29/16 Buy 93.00 Avg. of DCF and 7.0x EV / CY 2016 Revenue 965.3 1,242.0
BTIG 04/29/16 Neutral N/A DCF 964.6 1,220.0
Piper Jaffray 04/29/16 Neutral 81.00 5.2x EV / CY 2017 Revenue 965.1 1,223.9
MUFG Securities Americas Inc. 04/29/16 Buy 87.00 N/A 969.9 1,246.3
Barclays 04/29/16 Neutral 74.00 5.0x EV / CY 2017 Revenue 965.9 1,209.2
JP Morgan 04/29/16 Buy 94.00 6.5x EV / CY 2017 Revenue 957.5 1,170.8
Credit Suisse 04/29/16 Buy 90.00 5.6x EV / CY 2017 Revenue 972.7 1,281.4
Nomura 04/29/16 Neutral 95.00 N/A N/A N/A
Canaccord Genuity 04/28/16 Buy 100.00 6.6x EV / CY 2017 Revenue 970.0 1,227.5
Stifel 04/28/16 Neutral N/A N/A 963.6 1,232.9
High Target $130.00 $ 974.4 $1,281.4
Median Target 90.00 965.9 1,223.9
Average Target 88.15 966.6 1,226.4
Low Target 60.00 957.5 1,170.8
Current Share Price (As of 07/22/16) $84.72
Sources: Capital IQ, ThomsonOne, Wall Street Research
Note: Reflects all Wall Street research available to Moelis from Napa’s FY2016 Q1 earnings release date of 4/28/16; “N/A” denotes information not available to Moelis
[15]
|

III. Napa Financial Analysis
|

Review of Financial Projections
Moelis reviewed projection sets and adjustments thereto provided by Orlando, Napa and publicly available Wall Street estimates in connection with its financial analysis:
Orlando Case: 5-year projections / 3 cases (Conservative, Base, Upside)
Orlando created its projections on an incremental basis, demonstrating the illustrative value of Napa to Orlando’s revenue and cash flows and including the impact of synergies and other benefits that are available only to Orlando pro forma for the acquisition. During diligence Orlando’s model was revised to incorporate its findings, please see page 29 for description of changes.
Orlando did not prepare projections for Napa on a standalone basis separating out synergies, that is consistent with Orlando’s practice in other acquisitions
Napa Case: 5-year projections on a standalone basis
Wall Street estimates of Napa on a standalone basis
For purposes of its discounted cash flow analyses, Moelis used the most recent projection set available from Orlando, approved for
Moelis’ use by the Special Committee
For comparative purposes, the Orlando projection set was set forth alongside Wall Street consensus estimates, which were calendarized to a May 31 fiscal-year end to align with Orlando’s fiscal calendar
For purposes of the Selected Public SaaS Companies and Selected Precedent Transactions analyses, Moelis used the most recent financial projections available from Napa management and the most recent preliminary 6/30/16 results from Napa management, in each case approved for Moelis’ use by the Special Committee
[17]
|
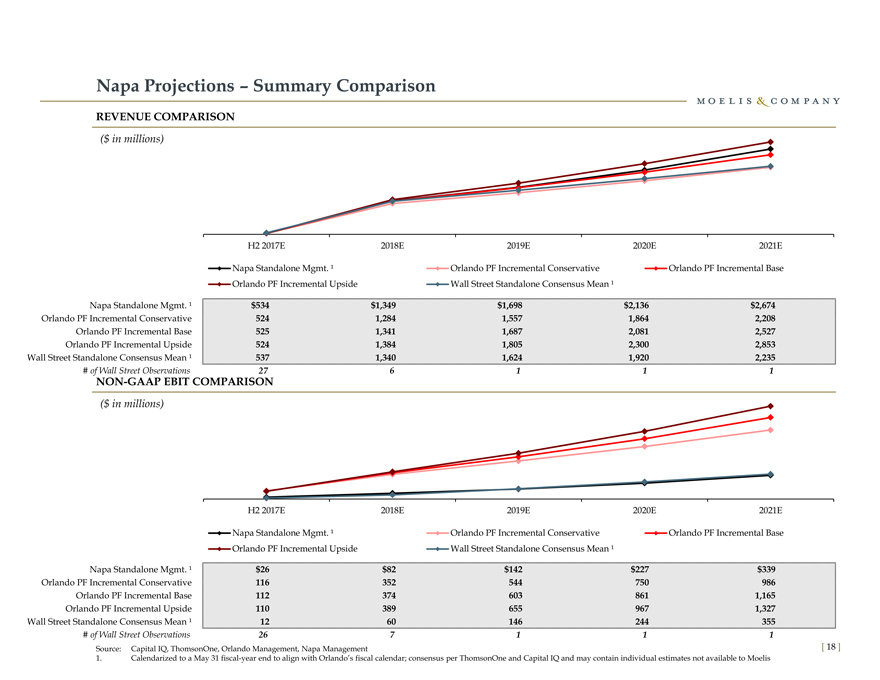
Napa Projections – Summary Comparison
REVENUE COMPARISON
($ in millions)
H2 2017E 2018E 2019E 2020E 2021E
Napa Standalone Mgmt. ¹ Orlando PF Incremental Conservative Orlando PF Incremental Base
Orlando PF Incremental Upside Wall Street Standalone Consensus Mean ¹
Napa Standalone Mgmt. ¹ $534 $1,349 $1,698 $2,136 $2,674
Orlando PF Incremental Conservative 524 1,284 1,557 1,864 2,208
Orlando PF Incremental Base 525 1,341 1,687 2,081 2,527
Orlando PF Incremental Upside 524 1,384 1,805 2,300 2,853
Wall Street Standalone Consensus Mean ¹ 537 1,340 1,624 1,920 2,235
# of Wall Street Observations 27 6 1 1 1
NON-GAAP EBIT COMPARISON
($ in millions)
H2 2017E 2018E 2019E 2020E 2021E
Napa Standalone Mgmt. ¹ Orlando PF Incremental Conservative Orlando PF Incremental Base
Orlando PF Incremental Upside Wall Street Standalone Consensus Mean ¹
Napa Standalone Mgmt. ¹ $26 $82 $142 $227 $339
Orlando PF Incremental Conservative 116 352 544 750 986
Orlando PF Incremental Base 112 374 603 861 1,165
Orlando PF Incremental Upside 110 389 655 967 1,327
Wall Street Standalone Consensus Mean ¹ 12 60 146 244 355
# of Wall Street Observations 26 7 1 1 1
Source: Capital IQ, ThomsonOne, Orlando Management, Napa Management
1. Calendarized to a May 31 fiscal-year end to align with Orlando’s fiscal calendar; consensus per ThomsonOne and Capital IQ and may contain individual estimates not available to Moelis
[ 18 ]
|
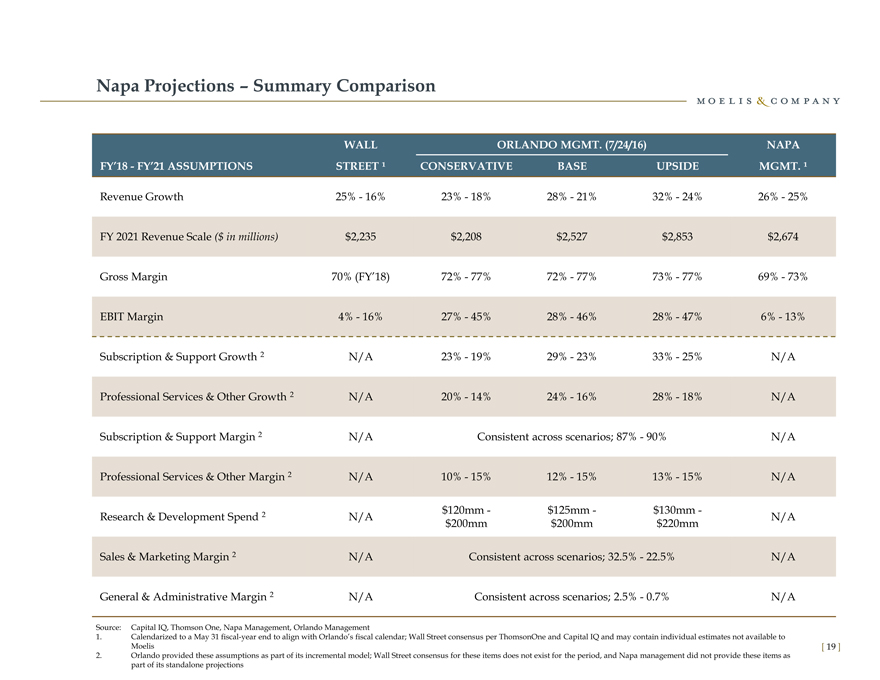
Napa Projections – Summary Comparison
WALL ORLANDO MGMT. (7/24/16) NAPA
FY’18—FY’21 ASSUMPTIONS STREET ¹ CONSERVATIVE BASE UPSIDE MGMT. ¹
Revenue Growth 25%—16% 23%—18% 28%—21% 32%—24% 26%—25%
FY 2021 Revenue Scale ($ in millions) $2,235 $2,208 $2,527 $2,853 $2,674
Gross Margin 70% (FY’18) 72%—77% 72%—77% 73%—77% 69%—73%
EBIT Margin 4%—16% 27%—45% 28%—46% 28%—47% 6%—13%
Subscription & Support Growth 2 N/A 23%—19% 29%—23% 33%—25% N/A
Professional Services & Other Growth 2 N/A 20%—14% 24%—16% 28%—18% N/A
Subscription & Support Margin 2 N/A Consistent across scenarios; 87%—90% N/A
Professional Services & Other Margin 2 N/A 10%—15% 12%—15% 13%—15% N/A
$120mm—$125mm—$130mm -
Research & Development Spend 2 N/A N/A
$200mm $200mm $220mm
Sales & Marketing Margin 2 N/A Consistent across scenarios; 32.5%—22.5% N/A
General & Administrative Margin 2 N/A Consistent across scenarios; 2.5%—0.7% N/A
Source: Capital IQ, Thomson One, Napa Management, Orlando Management
1. Calendarized to a May 31 fiscal-year end to align with Orlando’s fiscal calendar; Wall Street consensus per ThomsonOne and Capital IQ and may contain individual estimates not available to Moelis
2. Orlando provided these assumptions as part of its incremental model; Wall Street consensus for these items does not exist for the period, and Napa management did not provide these items as part of its standalone projections
[19]
|
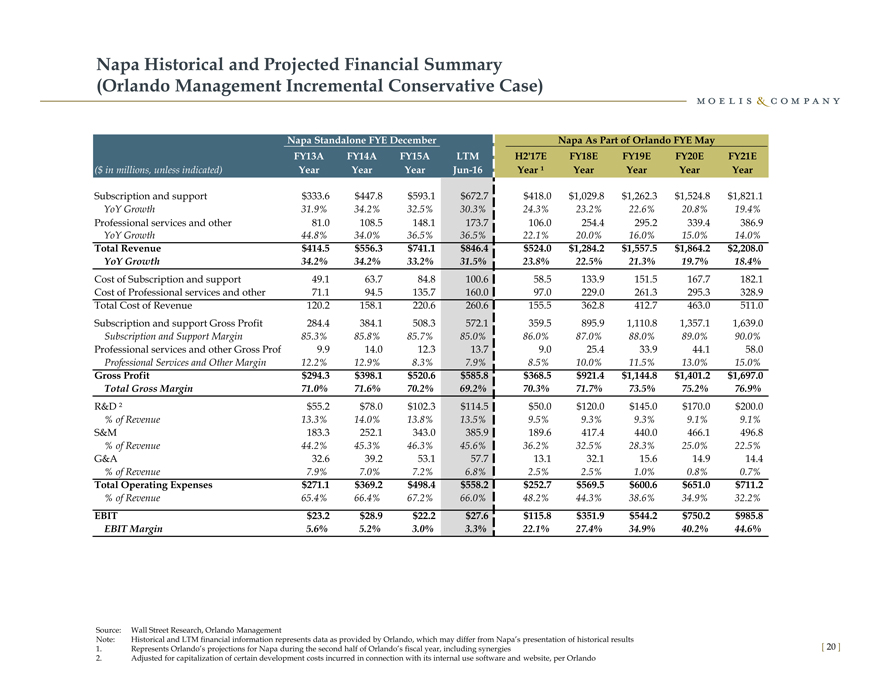
Napa Historical and Projected Financial Summary
(Orlando Management Incremental Conservative Case)
Napa Standalone FYE December Napa As Part of Orlando FYE May
FY13A FY14A FY15A LTM H2’17E FY18E FY19E FY20E FY21E
($ in millions, unless indicated) Year Year Year Jun-16 Year ¹ Year Year Year Year
Subscription and support $333.6 $447.8 $593.1 $672.7 $418.0 $1,029.8 $1,262.3 $1,524.8 $1,821.1
YoY Growth 31.9% 34.2% 32.5% 30.3% 24.3% 23.2% 22.6% 20.8% 19.4%
Professional services and other 81.0 108.5 148.1 173.7 106.0 254.4 295.2 339.4 386.9
YoY Growth 44.8% 34.0% 36.5% 36.5% 22.1% 20.0% 16.0% 15.0% 14.0%
Total Revenue $414.5 $556.3 $741.1 $846.4 $524.0 $1,284.2 $1,557.5 $1,864.2 $2,208.0
YoY Growth 34.2% 34.2% 33.2% 31.5% 23.8% 22.5% 21.3% 19.7% 18.4%
Cost of Subscription and support 49.1 63.7 84.8 100.6 58.5 133.9 151.5 167.7 182.1
Cost of Professional services and other 71.1 94.5 135.7 160.0 97.0 229.0 261.3 295.3 328.9
Total Cost of Revenue 120.2 158.1 220.6 260.6 155.5 362.8 412.7 463.0 511.0
Subscription and support Gross Profit 284.4 384.1 508.3 572.1 359.5 895.9 1,110.8 1,357.1 1,639.0
Subscription and Support Margin 85.3% 85.8% 85.7% 85.0% 86.0% 87.0% 88.0% 89.0% 90.0%
Professional services and other Gross Profi 9.9 14.0 12.3 13.7 9.0 25.4 33.9 44.1 58.0
Professional Services and Other Margin 12.2% 12.9% 8.3% 7.9% 8.5% 10.0% 11.5% 13.0% 15.0%
Gross Profit $294.3 $398.1 $520.6 $585.8 $368.5 $921.4 $1,144.8 $1,401.2 $1,697.0
Total Gross Margin 71.0% 71.6% 70.2% 69.2% 70.3% 71.7% 73.5% 75.2% 76.9%
R&D ² $55.2 $78.0 $102.3 $114.5 $50.0 $120.0 $145.0 $170.0 $200.0
% of Revenue 13.3% 14.0% 13.8% 13.5% 9.5% 9.3% 9.3% 9.1% 9.1%
S&M 183.3 252.1 343.0 385.9 189.6 417.4 440.0 466.1 496.8
% of Revenue 44.2% 45.3% 46.3% 45.6% 36.2% 32.5% 28.3% 25.0% 22.5%
G&A 32.6 39.2 53.1 57.7 13.1 32.1 15.6 14.9 14.4
% of Revenue 7.9% 7.0% 7.2% 6.8% 2.5% 2.5% 1.0% 0.8% 0.7%
Total Operating Expenses $271.1 $369.2 $498.4 $558.2 $252.7 $569.5 $600.6 $651.0 $711.2
% of Revenue 65.4% 66.4% 67.2% 66.0% 48.2% 44.3% 38.6% 34.9% 32.2%
EBIT $23.2 $28.9 $22.2 $27.6 $115.8 $351.9 $544.2 $750.2 $985.8
EBIT Margin 5.6% 5.2% 3.0% 3.3% 22.1% 27.4% 34.9% 40.2% 44.6%
Source: Wall Street Research, Orlando Management
Note: Historical and LTM financial information represents data as provided by Orlando, which may differ from Napa’s presentation of historical results
1. Represents Orlando’s projections for Napa during the second half of Orlando’s fiscal year, including synergies
2. Adjusted for capitalization of certain development costs incurred in connection with its internal use software and website, per Orlando
[20]
|
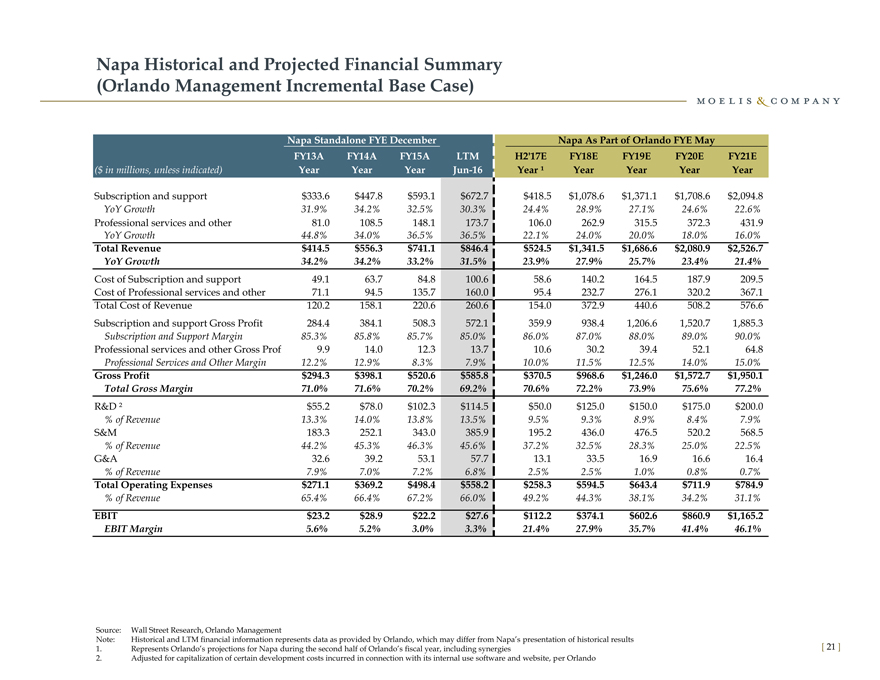
Napa Historical and Projected Financial Summary
(Orlando Management Incremental Base Case)
Napa Standalone FYE December Napa As Part of Orlando FYE May
FY13A FY14A FY15A LTM H2’17E FY18E FY19E FY20E FY21E
($ in millions, unless indicated) Year Year Year Jun-16 Year ¹ Year Year Year Year
Subscription and support $333.6 $447.8 $593.1 $672.7 $418.5 $1,078.6 $1,371.1 $1,708.6 $2,094.8
YoY Growth 31.9% 34.2% 32.5% 30.3% 24.4% 28.9% 27.1% 24.6% 22.6%
Professional services and other 81.0 108.5 148.1 173.7 106.0 262.9 315.5 372.3 431.9
YoY Growth 44.8% 34.0% 36.5% 36.5% 22.1% 24.0% 20.0% 18.0% 16.0%
Total Revenue $414.5 $556.3 $741.1 $846.4 $524.5 $1,341.5 $1,686.6 $2,080.9 $2,526.7
YoY Growth 34.2% 34.2% 33.2% 31.5% 23.9% 27.9% 25.7% 23.4% 21.4%
Cost of Subscription and support 49.1 63.7 84.8 100.6 58.6 140.2 164.5 187.9 209.5
Cost of Professional services and other 71.1 94.5 135.7 160.0 95.4 232.7 276.1 320.2 367.1
Total Cost of Revenue 120.2 158.1 220.6 260.6 154.0 372.9 440.6 508.2 576.6
Subscription and support Gross Profit 284.4 384.1 508.3 572.1 359.9 938.4 1,206.6 1,520.7 1,885.3
Subscription and Support Margin 85.3% 85.8% 85.7% 85.0% 86.0% 87.0% 88.0% 89.0% 90.0%
Professional services and other Gross Profi 9.9 14.0 12.3 13.7 10.6 30.2 39.4 52.1 64.8
Professional Services and Other Margin 12.2% 12.9% 8.3% 7.9% 10.0% 11.5% 12.5% 14.0% 15.0%
Gross Profit $294.3 $398.1 $520.6 $585.8 $370.5 $968.6 $1,246.0 $1,572.7 $1,950.1
Total Gross Margin 71.0% 71.6% 70.2% 69.2% 70.6% 72.2% 73.9% 75.6% 77.2%
R&D ² $55.2 $78.0 $102.3 $114.5 $50.0 $125.0 $150.0 $175.0 $200.0
% of Revenue 13.3% 14.0% 13.8% 13.5% 9.5% 9.3% 8.9% 8.4% 7.9%
S&M 183.3 252.1 343.0 385.9 195.2 436.0 476.5 520.2 568.5
% of Revenue 44.2% 45.3% 46.3% 45.6% 37.2% 32.5% 28.3% 25.0% 22.5%
G&A 32.6 39.2 53.1 57.7 13.1 33.5 16.9 16.6 16.4
% of Revenue 7.9% 7.0% 7.2% 6.8% 2.5% 2.5% 1.0% 0.8% 0.7%
Total Operating Expenses $271.1 $369.2 $498.4 $558.2 $258.3 $594.5 $643.4 $711.9 $784.9
% of Revenue 65.4% 66.4% 67.2% 66.0% 49.2% 44.3% 38.1% 34.2% 31.1%
EBIT $23.2 $28.9 $22.2 $27.6 $112.2 $374.1 $602.6 $860.9 $1,165.2
EBIT Margin 5.6% 5.2% 3.0% 3.3% 21.4% 27.9% 35.7% 41.4% 46.1%
Source: Wall Street Research, Orlando Management
Note: Historical and LTM financial information represents data as provided by Orlando, which may differ from Napa’s presentation of historical results
1. Represents Orlando’s projections for Napa during the second half of Orlando’s fiscal year, including synergies
2. Adjusted for capitalization of certain development costs incurred in connection with its internal use software and website, per Orlando
[21]
|

Napa Historical and Projected Financial Summary
(Orlando Management Incremental Upside Case)
Napa Standalone FYE December Napa As Part of Orlando FYE May
FY13A FY14A FY15A LTM H2’17E FY18E FY19E FY20E FY21E
($ in millions, unless indicated) Year Year Year Jun-16 Year ¹ Year Year Year Year
Subscription and support $333.6 $447.8 $593.1 $672.7 $418.0 $1,112.3 $1,468.6 $1,892.3 $2,372.3
YoY Growth 31.9% 34.2% 32.5% 30.3% 24.3% 33.0% 32.0% 28.9% 25.4%
Professional services and other 81.0 108.5 148.1 173.7 106.0 271.4 336.5 407.2 480.5
YoY Growth 44.8% 34.0% 36.5% 36.5% 22.1% 28.0% 24.0% 21.0% 18.0%
Total Revenue $414.5 $556.3 $741.1 $846.4 $524.0 $1,383.7 $1,805.1 $2,299.5 $2,852.8
YoY Growth 34.2% 34.2% 33.2% 31.5% 23.8% 32.0% 30.5% 27.4% 24.1%
Cost of Subscription and support 49.1 63.7 84.8 100.6 58.5 144.6 176.2 208.2 237.2
Cost of Professional services and other 71.1 94.5 135.7 160.0 93.8 236.1 291.1 346.1 408.4
Total Cost of Revenue 120.2 158.1 220.6 260.6 152.3 380.7 467.3 554.3 645.7
Subscription and support Gross Profit 284.4 384.1 508.3 572.1 359.5 967.7 1,292.4 1,684.1 2,135.1
Subscription and Support Margin 85.3% 85.8% 85.7% 85.0% 86.0% 87.0% 88.0% 89.0% 90.0%
Professional services and other Gross Profi 9.9 14.0 12.3 13.7 12.2 35.3 45.4 61.1 72.1
Professional Services and Other Margin 12.2% 12.9% 8.3% 7.9% 11.5% 13.0% 13.5% 15.0% 15.0%
Gross Profit $294.3 $398.1 $520.6 $585.8 $371.7 $1,003.0 $1,337.8 $1,745.2 $2,207.1
Total Gross Margin 71.0% 71.6% 70.2% 69.2% 70.9% 72.5% 74.1% 75.9% 77.4%
R&D ² $55.2 $78.0 $102.3 $114.5 $50.0 $130.0 $155.0 $185.0 $220.0
% of Revenue 13.3% 14.0% 13.8% 13.5% 9.5% 9.4% 8.6% 8.0% 7.7%
S&M 183.3 252.1 343.0 385.9 198.9 449.7 509.9 574.9 641.9
% of Revenue 44.2% 45.3% 46.3% 45.6% 38.0% 32.5% 28.3% 25.0% 22.5%
G&A 32.6 39.2 53.1 57.7 13.1 34.6 18.1 18.4 18.5
% of Revenue 7.9% 7.0% 7.2% 6.8% 2.5% 2.5% 1.0% 0.8% 0.7%
Total Operating Expenses $271.1 $369.2 $498.4 $558.2 $262.0 $614.3 $683.0 $778.3 $880.4
% of Revenue 65.4% 66.4% 67.2% 66.0% 50.0% 44.4% 37.8% 33.8% 30.9%
EBIT $23.2 $28.9 $22.2 $27.6 $109.7 $388.7 $654.8 $967.0 $1,326.7
EBIT Margin 5.6% 5.2% 3.0% 3.3% 20.9% 28.1% 36.3% 42.1% 46.5%
Source: Wall Street Research, Orlando Management
Note: Historical and LTM financial information represents data as provided by Orlando, which may differ from Napa’s presentation of historical results
1. Represents Orlando’s projections for Napa during the second half of Orlando’s fiscal year, including synergies
2. Adjusted for capitalization of certain development costs incurred in connection with its internal use software and website, per Orlando
[22]
|
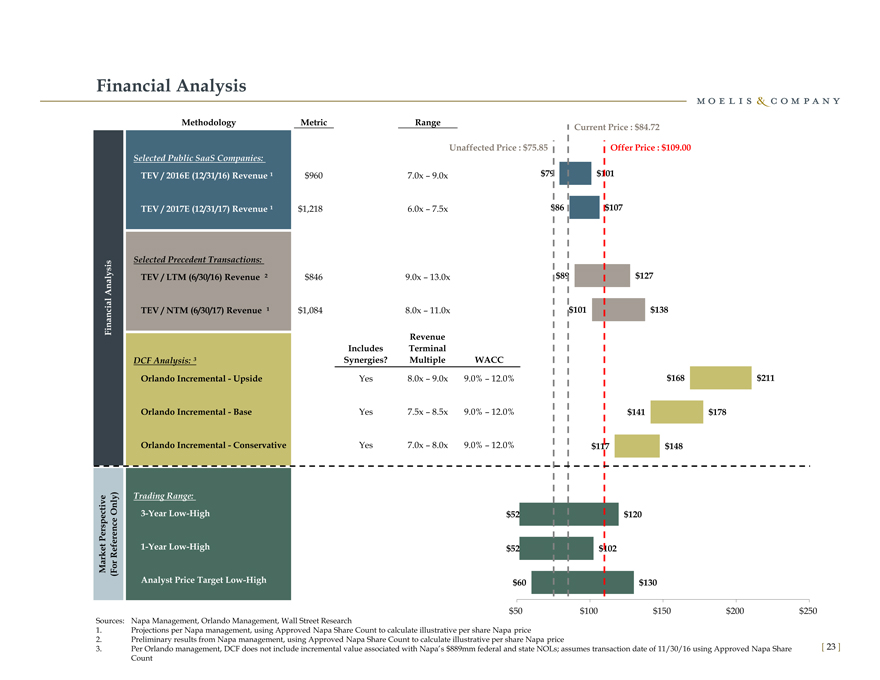
Financial Analysis
Methodology Metric Range Current Price : $84.72
Unaffected Price : $75.85 Offer Price : $109.00
Selected Public SaaS Companies:
TEV / 2016E (12/31/16) Revenue ¹ $960 7.0x – 9.0x $79 $101
TEV / 2017E (12/31/17) Revenue ¹ $1,218 6.0x – 7.5x $86 $107
Selected Precedent Transactions:
ysis
l TEV / LTM (6/30/16) Revenue ² $846 9.0x – 13.0x $89 $127
na
A
Financial TEV / NTM (6/30/17) Revenue ¹ $1,084 8.0x – 11.0x $101 $138
Revenue
Includes Terminal
DCF Analysis: ³ Synergies? Multiple WACC
Orlando Incremental—Upside Yes 8.0x – 9.0x 9.0% – 12.0% $168 $211
Orlando Incremental—Base Yes 7.5x – 8.5x 9.0% – 12.0% $141 $178
Orlando Incremental—Conservative Yes 7.0x – 8.0x 9.0% – 12.0% $117 $148
ve y) Trading Range:
cti Onl 3-Year Low-High $52 $120
spe ce
Per re n
e
e t f 1-Year Low-High $52 $102
k Re
r
Ma (For
Analyst Price Target Low-High $60 $130
$50 $100 $150 $200 $250
Sources: Napa Management, Orlando Management, Wall Street Research
1. Projections per Napa management, using Approved Napa Share Count to calculate illustrative per share Napa price
2. Preliminary results from Napa management, using Approved Napa Share Count to calculate illustrative per share Napa price
3. Per Orlando management, DCF does not include incremental value associated with Napa’s $889mm federal and state NOLs; assumes transaction date of 11/30/16 using Approved Napa Share
Count
[ 23 ]
|
Selected Public SaaS Companies
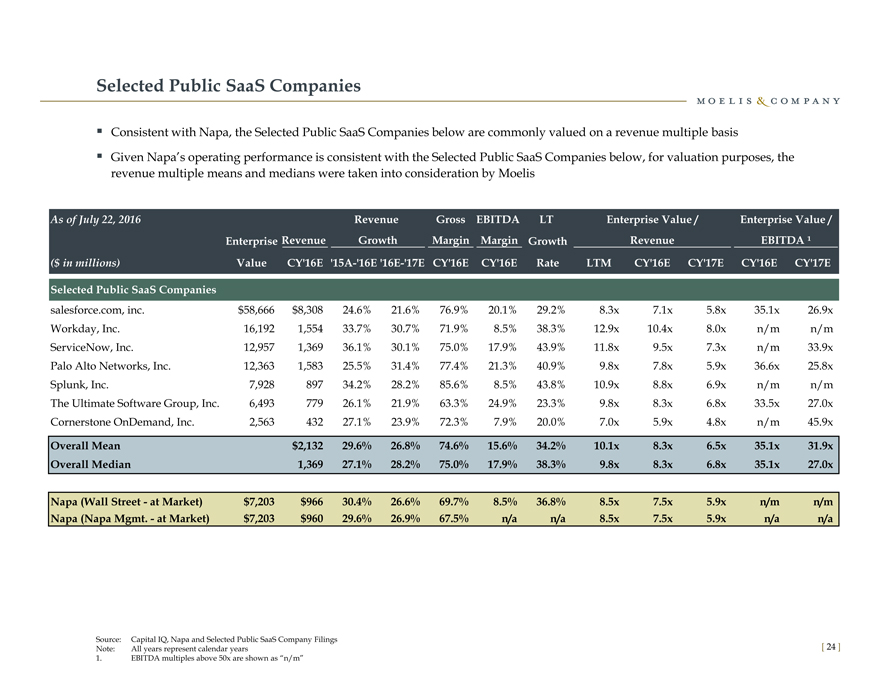
Consistent with Napa, the Selected Public SaaS Companies below are commonly valued on a revenue multiple basis
Given Napa’s operating performance is consistent with the Selected Public SaaS Companies below, for valuation purposes, the revenue multiple means and medians were taken into consideration by Moelis
As of July 22, 2016 Revenue Gross EBITDA LT Enterprise Value / Enterprise Value /
Enterprise Revenue Growth Margin Margin Growth Revenue EBITDA ¹
($ in millions) Value CY’16E ‘15A-‘16E ‘16E-‘17E CY’16E CY’16E Rate LTM CY’16E CY’17E CY’16E CY’17E
Selected Public SaaS Companies
salesforce.com, inc. $58,666 $8,308 24.6% 21.6% 76.9% 20.1% 29.2% 8.3x 7.1x 5.8x 35.1x 26.9x
Workday, Inc. 16,192 1,554 33.7% 30.7% 71.9% 8.5% 38.3% 12.9x 10.4x 8.0x n/m n/m
ServiceNow, Inc. 12,957 1,369 36.1% 30.1% 75.0% 17.9% 43.9% 11.8x 9.5x 7.3x n/m 33.9x
Palo Alto Networks, Inc. 12,363 1,583 25.5% 31.4% 77.4% 21.3% 40.9% 9.8x 7.8x 5.9x 36.6x 25.8x
Splunk, Inc. 7,928 897 34.2% 28.2% 85.6% 8.5% 43.8% 10.9x 8.8x 6.9x n/m n/m
The Ultimate Software Group, Inc. 6,493 779 26.1% 21.9% 63.3% 24.9% 23.3% 9.8x 8.3x 6.8x 33.5x 27.0x
Cornerstone OnDemand, Inc. 2,563 432 27.1% 23.9% 72.3% 7.9% 20.0% 7.0x 5.9x 4.8x n/m 45.9x
Overall Mean $2,132 29.6% 26.8% 74.6% 15.6% 34.2% 10.1x 8.3x 6.5x 35.1x 31.9x
Overall Median 1,369 27.1% 28.2% 75.0% 17.9% 38.3% 9.8x 8.3x 6.8x 35.1x 27.0x
Napa (Wall Street—at Market) $7,203 $966 30.4% 26.6% 69.7% 8.5% 36.8% 8.5x 7.5x 5.9x n/m n/m
Napa (Napa Mgmt.—at Market) $7,203 $960 29.6% 26.9% 67.5% n/a n/a 8.5x 7.5x 5.9x n/a n/a
Source: Capital IQ, Napa and Selected Public SaaS Company Filings Note: All years represent calendar years
1. EBITDA multiples above 50x are shown as “n/m”
[24]
|
Selected Precedent Transactions
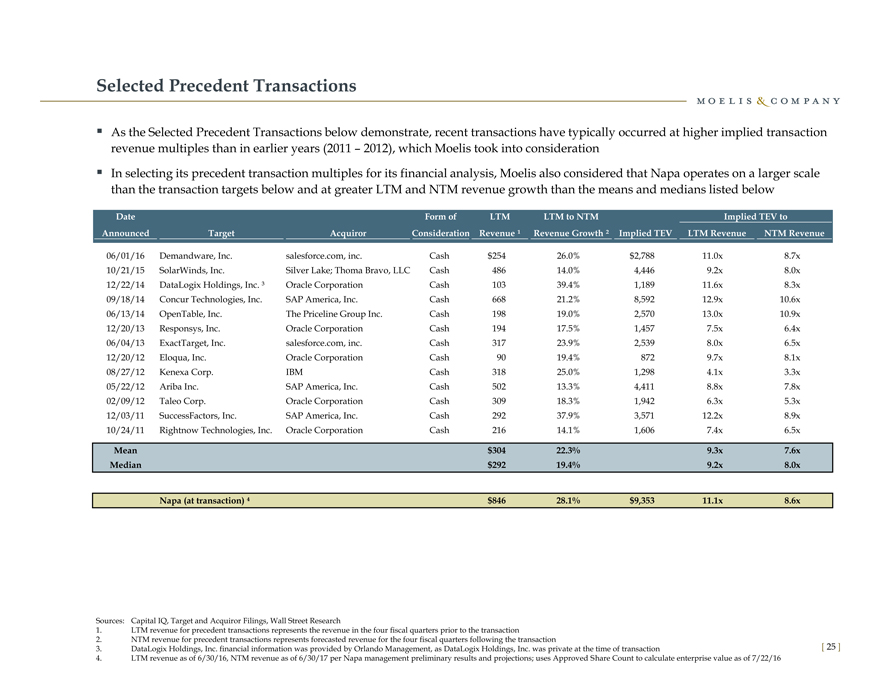
As the Selected Precedent Transactions below demonstrate, recent transactions have typically occurred at higher implied transaction revenue multiples than in earlier years (2011 – 2012), which Moelis took into consideration In selecting its precedent transaction multiples for its financial analysis, Moelis also considered that Napa operates on a larger scale than the transaction targets below and at greater LTM and NTM revenue growth than the means and medians listed below
Date Form of LTM LTM to NTM Implied TEV to
Announced Target Acquiror Consideration Revenue ¹ Revenue Growth ² Implied TEV LTM Revenue NTM Revenue
06/01/16 Demandware, Inc. salesforce.com, inc. Cash $ 254 26.0% $2,788 11.0x 8.7x
10/21/15 SolarWinds, Inc. Silver Lake; Thoma Bravo, LLC Cash 486 14.0% 4,446 9.2x 8.0x
12/22/14 DataLogix Holdings, Inc. ³ Oracle Corporation Cash 103 39.4% 1,189 11.6x 8.3x
09/18/14 Concur Technologies, Inc. SAP America, Inc. Cash 668 21.2% 8,592 12.9x 10.6x
06/13/14 OpenTable, Inc. The Priceline Group Inc. Cash 198 19.0% 2,570 13.0x 10.9x
12/20/13 Responsys, Inc. Oracle Corporation Cash 194 17.5% 1,457 7.5x 6.4x
06/04/13 ExactTarget, Inc. salesforce.com, inc. Cash 317 23.9% 2,539 8.0x 6.5x
12/20/12 Eloqua, Inc. Oracle Corporation Cash 90 19.4% 872 9.7x 8.1x
08/27/12 Kenexa Corp. IBM Cash 318 25.0% 1,298 4.1x 3.3x
05/22/12 Ariba Inc. SAP America, Inc. Cash 502 13.3% 4,411 8.8x 7.8x
02/09/12 Taleo Corp. Oracle Corporation Cash 309 18.3% 1,942 6.3x 5.3x
12/03/11 SuccessFactors, Inc. SAP America, Inc. Cash 292 37.9% 3,571 12.2x 8.9x
10/24/11 Rightnow Technologies, Inc. Oracle Corporation Cash 216 14.1% 1,606 7.4x 6.5x
Mean $ 304 22.3% 9.3x 7.6x
Median $ 292 19.4% 9.2x 8.0x
Napa (at transaction) $ 846 28.1% $9,353 11.1x 8.6x
Sources: Capital IQ, Target and Acquiror Filings, Wall Street Research
1. LTM revenue for precedent transactions represents the revenue in the four fiscal quarters prior to the transaction
2. NTM revenue for precedent transactions represents forecasted revenue for the four fiscal quarters following the transaction
3. DataLogix Holdings, Inc. financial information was provided by Orlando Management, as DataLogix Holdings, Inc. was private at the time of transaction
4. LTM revenue as of 6/30/16, NTM revenue as of 6/30/17 per Napa management preliminary results and projections; uses Approved Share Count to calculate enterprise value as of 7/22/16
[25]
|

Napa Discounted Cash Flow Analysis
(Orlando Incremental Model Conservative Case)
The analysis below is not a standalone DCF of Napa, and instead illustrates the DCF value of the incremental
impact of Napa to Orlando’s revenue and cash flows and includes the impact of synergies and other benefits
that are available only to Orlando pro forma for the acquisition; this does not reflect any value upside
associated with Napa’s NOL balance per Orlando management
For the Fiscal Year Ended May 31, Terminal
($ in millions) H2 2017E 2018E 2019E 2020E 2021E Value
Total Revenue $524 $1,284 $1,557 $1,864 $2,208
% Growth — 145.1% 21.3% 19.7% 18.4%
Non-GAAP EBIT 116 352 544 750 986
% Margin 22.1% 27.4% 34.9% 40.2% 44.6%
Less: Stock-based Compensation ¹(79)(193)(234)(280)(331)
Less: Cash Taxes ²(13)(56)(109)(165)(229)
Plus: Depreciation & Amortization ³ 26 64 78 93 110
Less: Capital Expenditures(26)(64)(78)(93)(110)
Plus: Working Capital & Other — — — — —
Unlevered Free Cash Flow $24 $104 $202 $306 $425 $17,664
% Growth — 328.1% 95.0% 51.5% 39.1%
DISCOUNTED CASH FLOW ANALYSIS: SENSITIVITY TABLES
Implied Share Price Implied Perpetuity Growth Rate
Discount LTM Revenue Terminal Multiple Discount LTM Revenue Terminal Multiple
Rate 7.00x 7.25x 7.50x 7.75x 8.00x Rate 7.00x 7.25x 7.50x 7.75x 8.00x
9.0% |
| $131.16 $135.31 $139.44 $143.58 $147.72 9.0% 6.1% 6.2% 6.3% 6.4% 6.4% |
10.0% |
| 125.98 129.95 134.21 138.18 142.15 10.0% 7.1% 7.2% 7.2% 7.3% 7.4% |
11.0% |
| 121.31 125.13 129.23 133.04 136.85 11.0% 8.0% 8.1% 8.2% 8.3% 8.4% |
12.0% |
| 116.87 120.54 124.49 128.15 131.81 12.0% 9.0% 9.1% 9.2% 9.3% 9.4% |
Source: Orlando Management, Napa Filings
Note: Analysis reflects Napa under Orlando ownership. Assumed date of 11/30/16
1. Assumed to be 15% of annual revenue for the forecasting period and is tax-deductible per Orlando Management
2. sumes 35% tax rate, per Orlando Management
3. Per O ando 5/27/16 Financial Presentation; assumes H2 2017E is half of full-year projection provided at the time
4. Assumed to equal annual depreciation & amortization expense, per Orlando Management
5. Assumed to be zero, per Orlando Management
[26]
|

Napa Discounted Cash Flow Analysis
(Orlando Incremental Model Base Case)
The analysis below is not a standalone DCF of Napa, and instead illustrates the DCF value of the incremental
impact of Napa to Orlando’s revenue and cash flows and includes the impact of synergies and other benefits
that are available only to Orlando pro forma for the acquisition; this does not reflect any value upside
associated with Napa’s NOL balance per Orlando management
For the Fiscal Year Ended May 31, Terminal
($ in millions) H2 2017E 2018E 2019E 2020E 2021E Value
Total Revenue $525 $1,341 $1,687 $2,081 $2,527
% Growth — 155.8% 25.7% 23.4% 21.4%
Non-GAAP EBIT 112 374 603 861 1,165
% Margin 21.4% 27.9% 35.7% 41.4% 46.1%
Less: Stock-based Compensation ¹(79)(201)(253)(312)(379)
Less: Cash Taxes ²(12)(61)(122)(192)(275)
Plus: Depreciation & Amortization ³ 26 67 84 104 126
(26)(67)(84)(104)(126)
Unlevered Free Cash Flow $22 $112 $227 $357 $511 $20,214
% Growth — 415.7% 102.2% 57.0% 43.3%
DISCOUNTED CASH FLOW ANALYSIS: SENSITIVITY TABLES
Implied Share Price Implied Perpetuity Growth Rate
Discount LTM Revenue Terminal Multiple Discount LTM Revenue Terminal Multiple
Rate 7.50x 7.75x 8.00x 8.25x 8.50x Rate 7.50x 7.75x 8.00x 8.25x 8.50x
9.0% $158.58 $163.31 $168.04 $172.78 $177.51 9.0% 6.1% 6.2% 6.3% 6.4% 6.5%
10.0% 152.58 157.13 161.67 166.21 170.76 10.0% 7.1% 7.2% 7.3% 7.4% 7.4%
11.0% 146.88 151.24 155.60 159.97 164.33 11.0% 8.1% 8.2% 8.3% 8.3% 8.4%
12.0% 141.45 145.64 149.83 154.02 158.21 12.0% 9.1% 9.2% 9.2% 9.3% 9.4%
Analysis reflects Napa under Orlando ownership. Assumed date of 11/30/16
1. Assumed to be 15% of annual revenue for the forecasting period and is tax-deductible per Orlando Management
2. Assumes 35% tax rate, per Orlando Management
3. Per Orlando 5/27/16 Financial Presentation; assumes H2 2017E is half of full-year projection provided at the time
4. Assumed to equal annual depreciation & amortization expense, per Orlando Management
5. Assumed to be zero, per Orlando Management
[27]
|
Napa Discounted Cash Flow Analysis
(Orlando Incremental Model Upside Case)
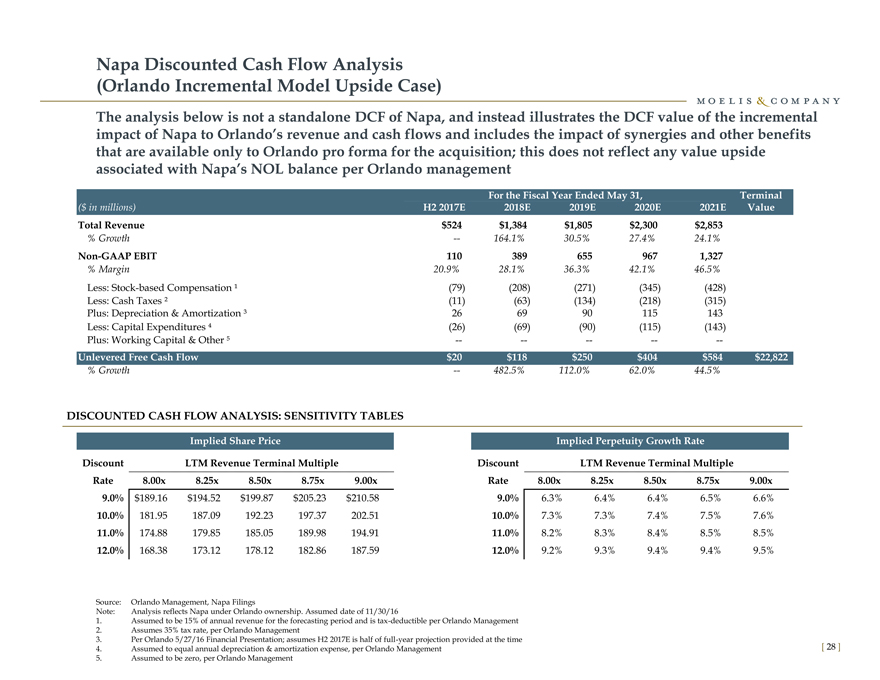
The analysis below is not a standalone DCF of Napa, and instead illustrates the DCF value of the incremental
impact of Napa to Orlando’s revenue and cash flows and includes the impact of synergies and other benefits
that are available only to Orlando pro forma for the acquisition; this does not reflect any value upside
associated with Napa’s NOL balance per Orlando management
For the Fiscal Year Ended May 31, Terminal
($ in millions) H2 2017E 2018E 2019E 2020E 2021E Value
Total Revenue $524 $1,384 $1,805 $2,300 $2,853
% Growth — 164.1% 30.5% 27.4% 24.1%
Non-GAAP EBIT 110 389 655 967 1,327
% Margin 20.9% 28.1% 36.3% 42.1% 46.5%
Less: Stock-based Compensation ¹(79)(208)(271)(345)(428)
Less: Cash Taxes ²(11)(63)(134)(218)(315)
Plus: Depreciation & Amortization ³ 26 69 90 115 143
Less: Capital Expenditures(26)(69)(90)(115)(143)
Plus: Working Capital & Other — — — — —
Unlevered Free Cash Flow $20 $118 $250 $404 $584 $22,822
% Growth — 482.5% 112.0% 62.0% 44.5%
DISCOUNTED CASH FLOW ANALYSIS: SENSITIVITY TABLES
Implied Share Price Implied Perpetuity Growth Rate
Discount LTM Revenue Terminal Multiple Discount LTM Revenue Terminal Multiple
Rate 8.00x 8.25x 8.50x 8.75x 9.00x Rate 8.00x 8.25x 8.50x 8.75x 9.00x
9.0% $189.16 $194.52 $199.87 $205.23 $210.58 9.0% 6.3% 6.4% 6.4% 6.5% 6.6%
10.0% 181.95 187.09 192.23 197.37 202.51 10.0% 7.3% 7.3% 7.4% 7.5% 7.6%
11.0% 174.88 179.85 185.05 189.98 194.91 11.0% 8.2% 8.3% 8.4% 8.5% 8.5%
12.0% 168.38 173.12 178.12 182.86 187.59 12.0% 9.2% 9.3% 9.4% 9.4% 9.5%
Source: Orlando Management, Napa Filings Note: Analysis reflects Napa under Orlando ownership. Assumed date of 11/30/16
1. Assumed to be 15% of annual revenue for the forecasting period and is tax-deductible per Orlando Management
2. Assumes 35% tax rate, per Orlando Management
3. Per Orlando 5/27/16 Financial Presentation; assumes H2 2017E is half of full-year projection provided at the time
4. Assumed to equal annual depreciation & amortization expense, per Orlando Management
5. Assumed to be zero, per Orlando Management
[28]
|
Napa Projections – Orlando Incremental Case Comparison Over Time
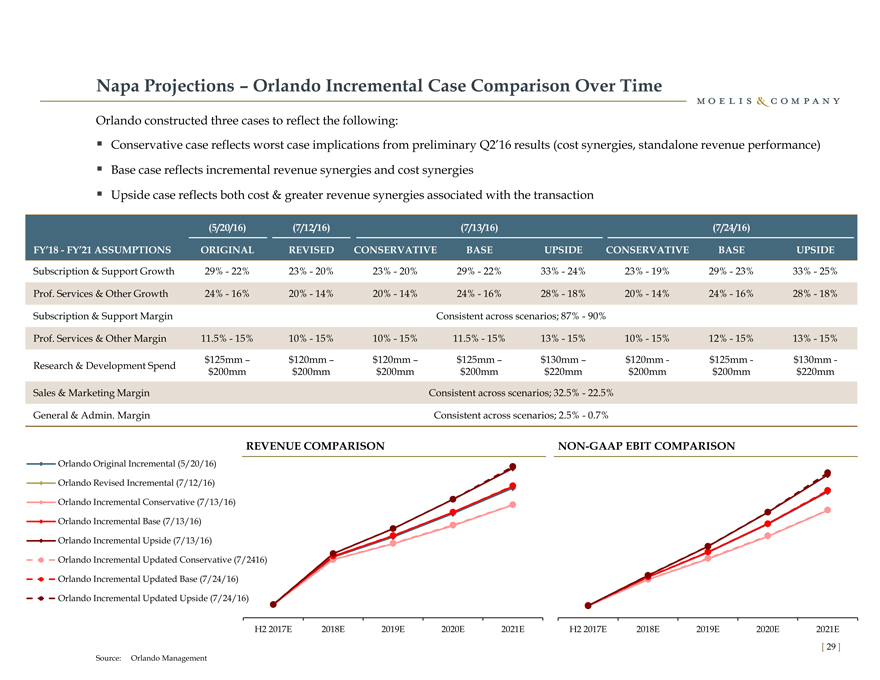
Orlando constructed three cases to reflect the following:
Conservative case reflects worst case implications from preliminary Q2’16 results (cost synergies, standalone revenue performance)
Base case reflects incremental revenue synergies and cost synergies
Upside case reflects both cost & greater revenue synergies associated with the transaction
(5/20/16)(7/12/16)(7/13/16)(7/24/16)
FY’18—FY’21 ASSUMPTIONS ORIGINAL REVISED CONSERVATIVE BASE UPSIDE CONSERVATIVE BASE UPSIDE
Subscription & Support Growth 29%—22% 23%—20% 23%—20% 29%—22% 33%—24% 23%—19% 29%—23% 33%—25%
Prof. Services & Other Growth 24%—16% 20%—14% 20%—14% 24%—16% 28%—18% 20%—14% 24%—16% 28%—18%
Subscription & Support Margin Consistent across scenarios; 87%—90%
Prof. Services & Other Margin 11.5%—15% 10%—15% 10%—15% 11.5%—15% 13%—15% 10%—15% 12%—15% 13%—15%
$125mm – $120mm – $120mm – $125mm – $130mm – $120mm—$125mm—$130mm -
Research & Development Spend $200mm $200mm $200mm $200mm $220mm $200mm $200mm $220mm
Sales & Marketing Margin Consistent across scenarios; 32.5%—22.5%
General & Admin. Margin Consistent across scenarios; 2.5%—0.7%
REVENUE COMPARISON NON-GAAP EBIT COMPARISON
Orlando Original Incremental (5/20/16)
Orlando Revised Incremental (7/12/16)
Orlando Incremental Conservative (7/13/16)
Orlando Incremental Base (7/13/16)
Orlando Incremental Upside (7/13/16)
Orlando Incremental Updated Conservative (7/2416)
Orlando Incremental Updated Base (7/24/16)
Orlando Incremental Updated Upside (7/24/16)
H2 2017E 2018E 2019E 2020E 2021E H2 2017E 2018E 2019E 2020E 2021E
Source: Orlando Management
[29]
|

Appendix
|

A. Additional Valuation Detail
|
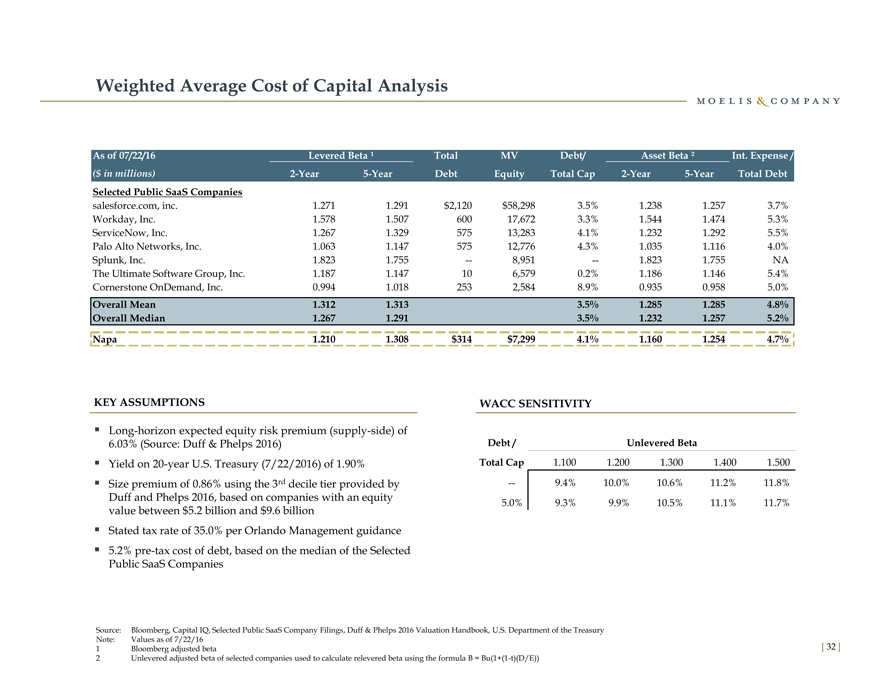
Weighted Average Cost of Capital Analysis
As of 07/22/16 Levered Beta ¹ Total MV Debt/ Asset Beta ² Int. Expense /
($ in millions) 2-Year 5-Year Debt Equity Total Cap 2-Year 5-Year Total Debt
Selected Public SaaS Companies
salesforce.com, inc. 1.271 1.291 $2,120 $58,298 3.5% 1.238 1.257 3.7%
Workday, Inc. 1.578 1.507 600 17,672 3.3% 1.544 1.474 5.3%
ServiceNow, Inc. 1.267 1.329 575 13,283 4.1% 1.232 1.292 5.5%
Palo Alto Networks, Inc. 1.063 1.147 575 12,776 4.3% 1.035 1.116 4.0%
Splunk, Inc. 1.823 1.755 — 8,951 — 1.823 1.755 NA
The Ultimate Software Group, Inc. 1.187 1.147 10 6,579 0.2% 1.186 1.146 5.4%
Cornerstone OnDemand, Inc. 0.994 1.018 253 2,584 8.9% 0.935 0.958 5.0%
Overall Mean 1.312 1.313 3.5% 1.285 1.285 4.8%
Overall Median 1.267 1.291 3.5% 1.232 1.257 5.2%
Napa 1.210 1.308 $314 $7,299 4.1% 1.160 1.254 4.7%
KEY ASSUMPTIONS WACC SENSITIVITY
Long-horizon expected equity risk premium (supply-side) of
6.03% (Source: Duff & Phelps 2016) Debt / Unlevered Beta
Yield on 20-year U.S. Treasury (7/22/2016) of 1.90% Total Cap 1.100 1.200 1.300 1.400 1.500
Size premium of 0.86% using the 3rd decile tier provided by — 9.4% 10.0% 10.6% 11.2% 11.8%
Duff and Phelps 2016, based on companies with an equity 5.0% 9.3% 9.9% 10.5% 11.1% 11.7%
value between $5.2 billion and $9.6 billion
Stated tax rate of 35.0% per Orlando Management guidance
5.2% pre-tax cost of debt, based on the median of the Selected
Public SaaS Companies
Source: Bloomberg, Capital IQ, Selected Public SaaS Company Filings, Duff & Phelps 2016 Valuation Handbook, U.S. Department of the Treasury Note: Values as of 7/22/16
1 Bloomberg adjusted beta
2 Unlevered adjusted beta of selected companies used to calculate relevered beta using the formula B = Bu(1+(1-t)(D/E))
[32]
|
Changes and Modifications Since May 27, 2016 Special Committee Presentation
Incorporation of Napa Due Diligence Results
Moelis has incorporated Napa information obtained from the due diligence process into its analysis, as well as due diligence information that
Orlando used as part of its Napa financial analysis
Revised Orlando Management Incremental Model
Moelis received Orlando’s original incremental model on May 20, 2016, a revised incremental model on July 12, 2016, and a 3 case model on July
13, 2016
On July 13, 2016, Orlando created three distinct cases for Napa to detail its conservative, baseline, and upside financial projections
Each case details 6-month illustrative financial projections for Napa as part of Orlando for the fiscal year ending May 31, 2017, differing from
Orlando’s previous 12-month projections for the same fiscal year end
As with its May 27, 2016 financial presentation to the Committee, Orlando created its projections on an incremental basis, demonstrating the
illustrative value of Napa to Orlando’s revenue and cash flows and including the impact of synergies and other benefits that are not available to
Napa shareholders on a standalone basis
On July 24, 2016 Moelis received revised conservative, baseline, and upside financial projections from Orlando
The differences in revenue, non-GAAP EBIT, and related financial assumptions across the Orlando cases over time can be seen on page 29
In its discounted cash flow analyses of the Orlando cases, Moelis used a discount rate range of 9%—12% in all cases to reflect market conditions as
of July 22, 2016
Projection and Treatment of Stock-Based Compensation
Moelis previously assumed that stock-based compensation would be 15% of Napa revenue for the Orlando fiscal year ending May 31, 2017 and
held constant thereafter; stock-based compensation is now assumed to be 15% of Napa’s annual revenue during each year of the projection period,
in-line with current Napa stock-based compensation expense as a percentage of revenue
Stock-based compensation was not previously treated as tax-deductible, which Moelis has modified in accordance with U.S. GAAP
Financial and Price Updates
Napa FY2016 Q2 preliminary revenue results have been incorporated into all Napa LTM revenue multiples
Napa NTM financial projections are therefore now based on the four quarters ending June 30, 2017, per projections by Napa management
Napa common shares outstanding, options, and RSUs have been updated to reflect information as of June 30, 2016
All financial market data is now as of July 22, 2016, updated from data as of May 23, 2016
[ 33 ]
|
Changes and Modifications Since May 27, 2016 Special Committee Presentation (cont’d)
Total Enterprise Value Calculation
Updated calculation of Napa make-whole shares to reflect additional clarification received from Napa as part of its July 20, 2016 accounting
diligence session as well as Napa’s memo on the topic received on the same date
Selected Precedent Transactions
Updated to include the acquisition of Demandware Inc., by Salesforce.com, Inc., as announced after the May 27, 2016 presentation on June 1, 2016
Additional Illustrative Analyses
Moelis has included the standalone financial model provided by Napa on July 20, 2016 to demonstrate an illustrative standalone forecast for Napa
Projections were prepared by Napa Management for its Board of Directors, covering the period from 2016 – 2021
These projections were not relied upon by Orlando management in preparing its Orlando Management Incremental Model for Napa
Napa’s projections as presented do not include any adjustments by Orlando management to the financials provided by Napa management (see
page 38 for further detail); Orlando’s management has not prepared projections based on Napa’s standalone prospects
Moelis has presented an illustrative analysis of the potential benefit associated with Napa’s net operating losses (see page 36 for further detail)
Wall Street Research
Updated to include the most recent financial projections and recommendations available to Moelis, including recently initiated coverage by
Cowen and Company and BMO Capital Markets, and ratings from Goldman Sachs, D.A. Davidson, Nomura, and Stifel
Ratings and price targets from Benchmark Company and Needham & Company have subsequently been removed because of the length of time
since their most recent release (February 1 and January 29, 2016 respectively)
[ 34 ]
|
Comparison of Moelis and Orlando Materials
Selected Publicly Traded SaaS Companies Analysis
Moelis and Orlando each independently selected a series of public companies to incorporate into their respective materials, which differ in certain instances
Orlando presented its selected public companies on an Enterprise Value to LTM Revenue and LTM EBIT multiple basis respectively, also presenting the
corresponding LTM Revenue and EBIT margins
Moelis presented its selected public companies on an Enterprise Value to LTM, calendar year 2016, NTM, and calendar year 2017 revenue multiple basis, as well as on
an Enterprise Value to calendar year 2016 and calendar 2017 EBITDA multiple basis, also detailing annual revenue growth rates, and gross / EBITDA margins
Selected Precedent Transaction Analysis
Moelis and Orlando each independently selected a series of precedent mergers and acquisitions to incorporate into their respective materials, which differ in certain
instances
Orlando presented its selected acquired companies on an Enterprise Value to LTM Revenue and LTM EBIT multiple basis respectively, also detailing the
corresponding LTM Revenue and EBIT margins
Moelis presented its selected acquired companies on an Enterprise Value to LTM and independently projected NTM Revenue basis respectively, also detailing the
projected LTM to NTM Revenue growth at the time of acquisition 1
Moelis and Orlando differed in their approach to treating convertible debt hedges as part of their analyses, thereby affecting their calculated enterprise values and
corresponding revenue multiples
Discounted Cash Flow Analysis
Moelis performed a discounted cash flow analysis to derive a range of illustrative Napa share price values based on projection sets provided by Orlando. Orlando
also performed a discounted cash flow analysis using internal investment hurdle assumptions.
Moelis calculated its illustrative Napa share prices using a range of revenue terminal multiples, which varied across the projection sets to reflect each individual
case (collectively covering a revenue terminal multiple range of 7 – 9x) as well as a discount rate range of 9 – 12% across all cases
Orlando calculated its illustrative Napa share prices using a range of assumptions including terminal multiples, a discount hurdle rate range, and a perpetuity
growth rate range
Stock-based Compensation Expense
As part of its incremental financial projections, Orlando does not include stock-based compensation in its DCF analysis
In incorporating Orlando’s incremental financial projections, Moelis added stock-based compensation expense equal to 15% of Orlando’s revenue projections for
Napa in the second half of its fiscal year ending May 31, 2017, and equal to 15% of Orlando’s revenue projections for Napa in the each of the following fiscal years, in-
line with current Napa stock-based compensation expense as a percentage of revenue
Calculation of Napa Total Enterprise Value
As part of Napa’s issuance of $310 million in convertible notes, a provision exists allowing noteholders to receive additional convertible shares in the event of a
fundamental change in the business, including an acquisition
The number of additional shares is calculated based on both the share price and date of the fundamental change, which impacts the calculation of Napa’s total
enterprise value
For purposes of its analysis, Moelis calculated Napa’s enterprise value as of July 22, 2016, while Orlando assumed a date of November 30, 2016, creating differing
enterprise values for the transaction
1. Projections per Capital IQ
[35]
|
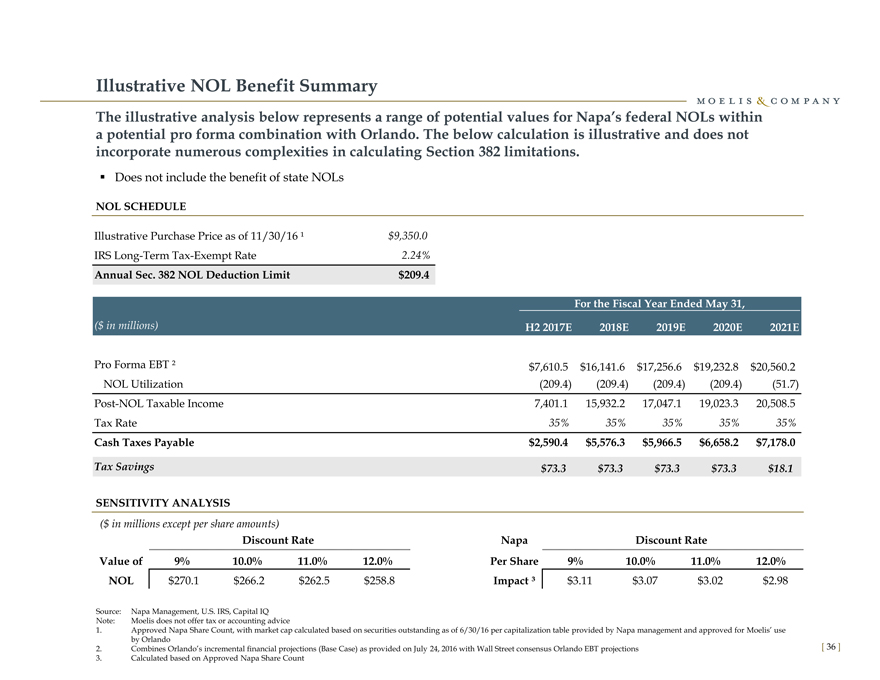
Illustrative NOL Benefit Summary
The illustrative analysis below represents a range of potential values for Napa’s federal NOLs within
a potential pro forma combination with Orlando. The below calculation is illustrative and does not
incorporate numerous complexities in calculating Section 382 limitations.
Does not include the benefit of state NOLs
NOL SCHEDULE
Illustrative Purchase Price as of 11/30/16 ¹ $9,350.0
IRS Long-Term Tax-Exempt Rate 2.24%
Annual Sec. 382 NOL Deduction Limit $209.4
For the Fiscal Year Ended May 31,
($ in millions) H2 2017E 2018E 2019E 2020E 2021E
Pro Forma EBT ² $7,610.5 $16,141.6 $17,256.6 $19,232.8 $20,560.2
NOL Utilization(209.4)(209.4)(209.4)(209.4)(51.7)
Post-NOL Taxable Income 7,401.1 15,932.2 17,047.1 19,023.3 20,508.5
Tax Rate 35% 35% 35% 35% 35%
Cash Taxes Payable $2,590.4 $5,576.3 $5,966.5 $6,658.2 $7,178.0
Tax Savings $73.3 $73.3 $73.3 $73.3 $18.1
SENSITIVITY ANALYSIS
($ in millions except per share amounts)
Discount Rate Napa Discount Rate
Value of 9% 10.0% 11.0% 12.0% Per Share 9% 10.0% 11.0% 12.0%
NOL $270.1 $266.2 $262.5 $258.8 Impact ³ $3.11 $3.07 $3.02 $2.98
Source: Napa Management, U.S. IRS, Capital IQ
Note: Moelis does not offer tax or accounting advice
1. Approved Napa Share Count, with market cap calculated based on securities outstanding as of 6/30/16 per capitalization table provided by Napa management and approved for Moelis’ use
by Orlando
2. Combines Orlando’s incremental financial projections (Base Case) as provided on July 24, 2016 with Wall Street consensus Orlando EBT projections 3. Calculated based on Approved Napa Share Count
[36]
|
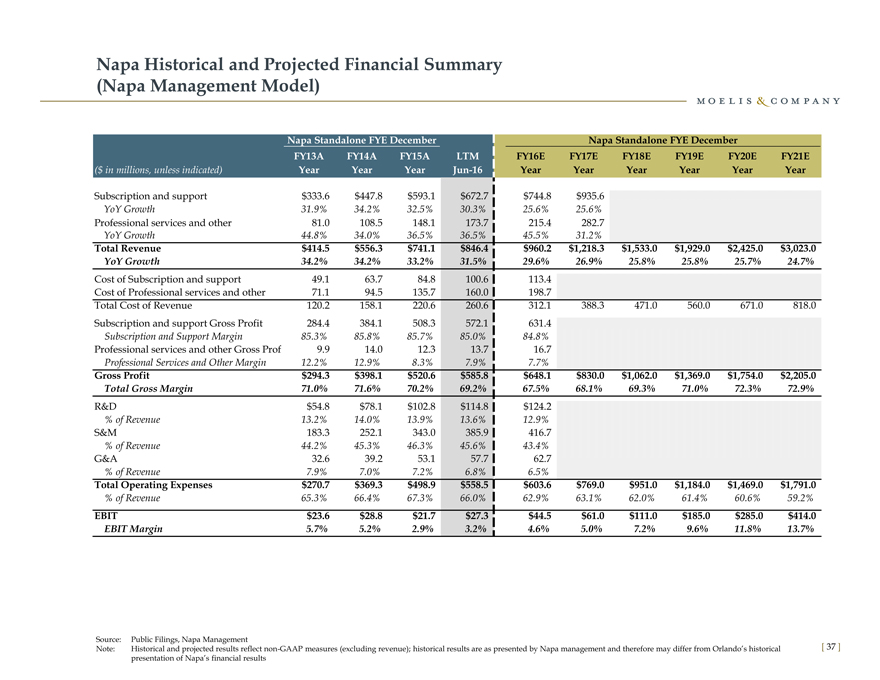
Napa Historical and Projected Financial Summary
(Napa Management Model)
Napa Standalone FYE December Napa Standalone FYE December
FY13A FY14A FY15A LTM FY16E FY17E FY18E FY19E FY20E FY21E
($ in millions, unless indicated) Year Year Year Jun-16 Year Year Year Year Year Year
Subscription and support $333.6 $447.8 $593.1 $672.7 $744.8 $935.6
YoY Growth 31.9% 34.2% 32.5% 30.3% 25.6% 25.6%
Professional services and other 81.0 108.5 148.1 173.7 215.4 282.7
YoY Growth 44.8% 34.0% 36.5% 36.5% 45.5% 31.2%
Total Revenue $414.5 $556.3 $741.1 $846.4 $960.2 $1,218.3 $1,533.0 $1,929.0 $2,425.0 $3,023.0
YoY Growth 34.2% 34.2% 33.2% 31.5% 29.6% 26.9% 25.8% 25.8% 25.7% 24.7%
Cost of Subscription and support 49.1 63.7 84.8 100.6 113.4
Cost of Professional services and other 71.1 94.5 135.7 160.0 198.7
Total Cost of Revenue 120.2 158.1 220.6 260.6 312.1 388.3 471.0 560.0 671.0 818.0
Subscription and support Gross Profit 284.4 384.1 508.3 572.1 631.4
Subscription and Support Margin 85.3% 85.8% 85.7% 85.0% 84.8%
Professional services and other Gross Profi 9.9 14.0 12.3 13.7 16.7
Professional Services and Other Margin 12.2% 12.9% 8.3% 7.9% 7.7%
Gross Profit $294.3 $398.1 $520.6 $585.8 $648.1 $830.0 $1,062.0 $1,369.0 $1,754.0 $2,205.0
Total Gross Margin 71.0% 71.6% 70.2% 69.2% 67.5% 68.1% 69.3% 71.0% 72.3% 72.9%
R&D $54.8 $78.1 $102.8 $114.8 $124.2
% of Revenue 13.2% 14.0% 13.9% 13.6% 12.9%
S&M 183.3 252.1 343.0 385.9 416.7
% of Revenue 44.2% 45.3% 46.3% 45.6% 43.4%
G&A 32.6 39.2 53.1 57.7 62.7
% of Revenue 7.9% 7.0% 7.2% 6.8% 6.5%
Total Operating Expenses $270.7 $369.3 $498.9 $558.5 $603.6 $769.0 $951.0 $1,184.0 $1,469.0 $1,791.0
% of Revenue 65.3% 66.4% 67.3% 66.0% 62.9% 63.1% 62.0% 61.4% 60.6% 59.2%
EBIT $23.6 $28.8 $21.7 $27.3 $44.5 $61.0 $111.0 $185.0 $285.0 $414.0
EBIT Margin 5.7% 5.2% 2.9% 3.2% 4.6% 5.0% 7.2% 9.6% 11.8% 13.7%
Source: Public Filings, Napa Management
Note: Historical and projected results reflect non-GAAP measures (excluding revenue); historical results are as presented by Napa management and therefore may differ from Orlando’s historical presentation of Napa’s financial results
[37]
|
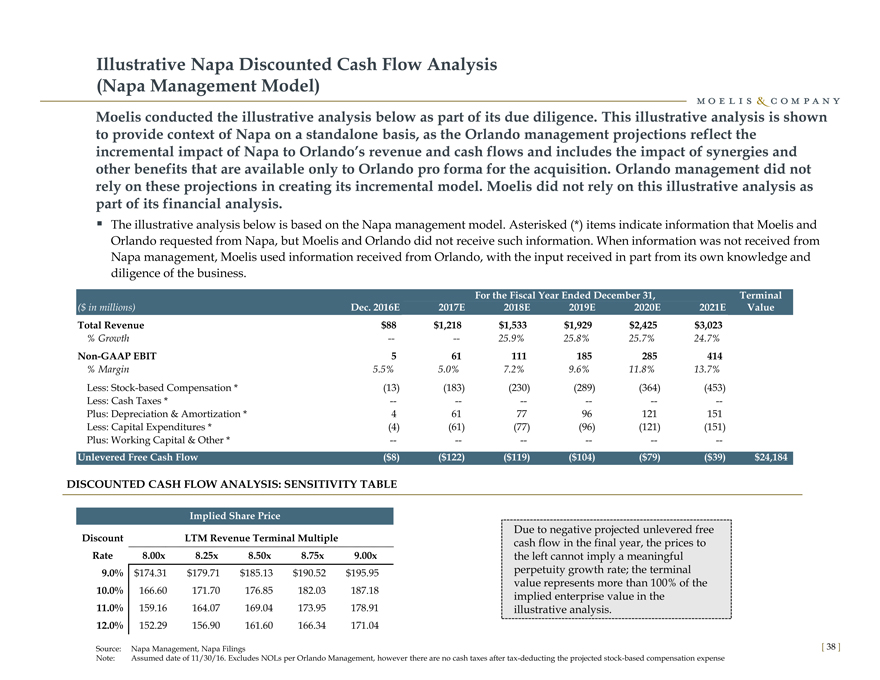
Illustrative Napa Discounted Cash Flow Analysis
(Napa Management Model)
Moelis conducted the illustrative analysis below as part of its due diligence. This illustrative analysis is shown
to provide context of Napa on a standalone basis, as the Orlando management projections reflect the
incremental impact of Napa to Orlando’s revenue and cash flows and includes the impact of synergies and
other benefits that are available only to Orlando pro forma for the acquisition. Orlando management did not
rely on these projections in creating its incremental model. Moelis did not rely on this illustrative analysis as
part of its financial analysis.
The illustrative analysis below is based on the Napa management model. Asterisked (*) items indicate information that Moelis and
Orlando requested from Napa, but Moelis and Orlando did not receive such information. When information was not received from
Napa management, Moelis used information received from Orlando, with the input received in part from its own knowledge and
diligence of the business.
For the Fiscal Year Ended December 31, Terminal
($ in millions) Dec. 2016E 2017E 2018E 2019E 2020E 2021E Value
Total Revenue $88 $1,218 $1,533 $1,929 $2,425 $3,023
% Growth — — 25.9% 25.8% 25.7% 24.7%
Non-GAAP EBIT 5 61 111 185 285 414
% Margin 5.5% 5.0% 7.2% 9.6% 11.8% 13.7%
Less: Stock-based Compensation *(13)(183)(230)(289)(364)(453)
Less: Cash Taxes * — — — — — —
Plus: Depreciation & Amortization * 4 61 77 96 121 151
Less: Capital Expenditures *(4)(61)(77)(96)(121)(151)
Plus: Working Capital & Other * — — — — — —
Unlevered Free Cash Flow($8)($122)($119)($104)($79)($39) $24,184
DISCOUNTED CASH FLOW ANALYSIS: SENSITIVITY TABLE
Implied Share Price
Due to negative projected unlevered free
Discount LTM Revenue Terminal Multiple cash flow in the final year, the prices to
Rate 8.00x 8.25x 8.50x 8.75x 9.00x the left cannot imply a meaningful
9.0% |
| $174.31 $179.71 $185.13 $190.52 $195.95 perpetuity growth rate; the terminal |
value represents more than 100% of the
10.0% |
| 166.60 171.70 176.85 182.03 187.18 implied enterprise value in the |
11.0% |
| 159.16 164.07 169.04 173.95 178.91 illustrative analysis. |
12.0% |
| 152.29 156.90 161.60 166.34 171.04 |
Source: Napa Management, Napa Filings
Note: Assumed date of 11/30/16. Excludes NOLs per Orlando Management, however there are no cash taxes after tax-deducting the projected stock-based compensation expense
[ 38 ]
|

B. Napa Overview
|
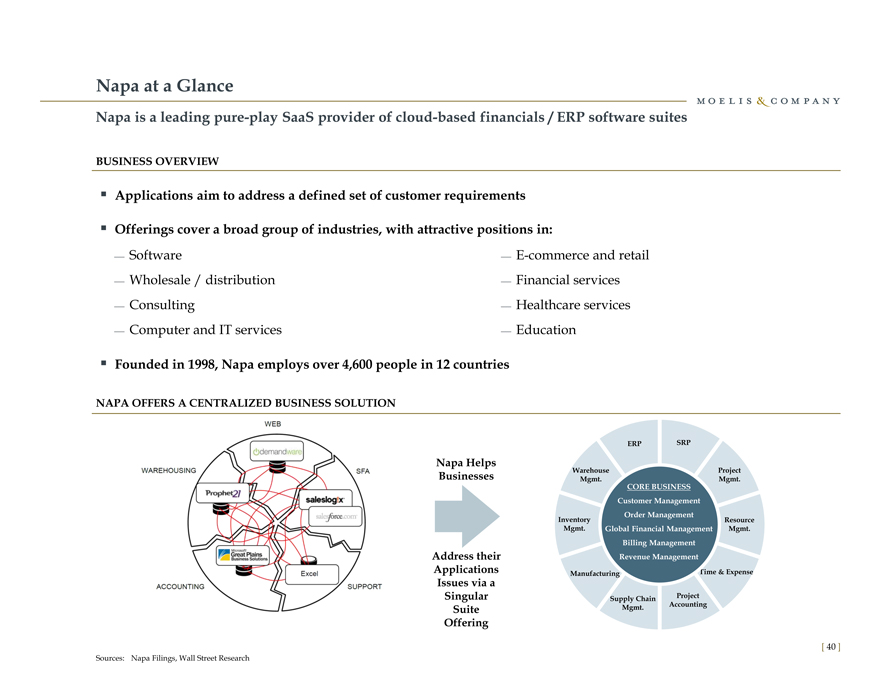
Napa at a Glance
Napa is a leading pure-play SaaS provider of cloud-based financials / ERP software suites
BUSINESS OVERVIEW
Applications aim to address a defined set of customer requirements
Offerings cover a broad group of industries, with attractive positions in:
Software E-commerce and retail
Wholesale / distribution Financial services
Consulting Healthcare services
Computer and IT services Education
Founded in 1998, Napa employs over 4,600 people in 12 countries
NAPA OFFERS A CENTRALIZED BUSINESS SOLUTION
ERP SRP
Napa Helps
Warehouse Project
Businesses Mgmt. Mgmt.
CORE BUSINESS
Customer Management
Order Management
Inventory Resource
Mgmt. Global Financial Management Mgmt.
Billing Management
Address their Revenue Management
Applications Manufacturing Time & Expense
Issues via a
Singular Supply Chain Project
Suite Mgmt. Accounting
Offering
Sources: Napa Filings, Wall Street Research
[40]
|
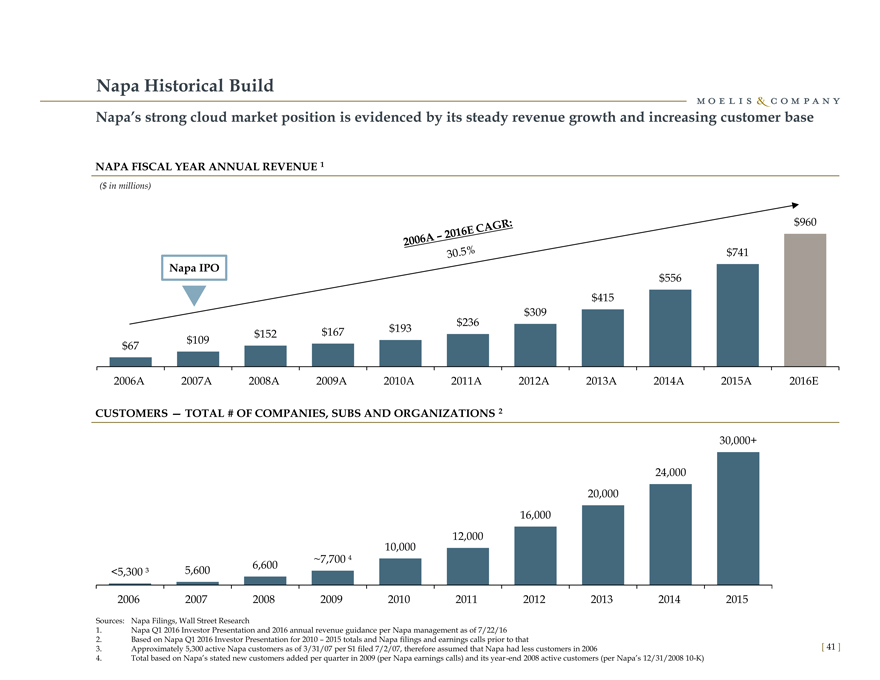
Napa Historical Build
Napa’s strong cloud market position is evidenced by its steady revenue growth and increasing customer base
NAPA FISCAL YEAR ANNUAL REVENUE 1
($ in millions)
$960
$741
Napa IPO
$556
$415
$309
$236
$152 $167 $193
$67 $109
2006A 2007A 2008A 2009A 2010A 2011A 2012A 2013A 2014A 2015A 2016E
CUSTOMERS — TOTAL # OF COMPANIES, SUBS AND ORGANIZATIONS 2
30,000+
24,000
20,000
16,000
12,000
10,000
~7,700
<5,300 ³ 5,600 6,600
2006 2007 2008 2009 2010 2011 2012 2013 2014 2015
Sources: Napa Filings, Wall Street Research
1. |
| Napa Q1 2016 Investor Presentation and 2016 annual revenue guidance per Napa management as of 7/22/16 |
2. Based on Napa Q1 2016 Investor Presentation for 2010 – 2015 totals and Napa filings and earnings calls prior to that
3. Approximately 5,300 active Napa customers as of 3/31/07 per S1 filed 7/2/07, therefore assumed that Napa had less customers in 2006
4. Total based on Napa’s stated new customers added per quarter in 2009 (per Napa earnings calls) and its year-end 2008 active customers (per Napa’s 12/31/2008 10-K)
[ 41 ]
|
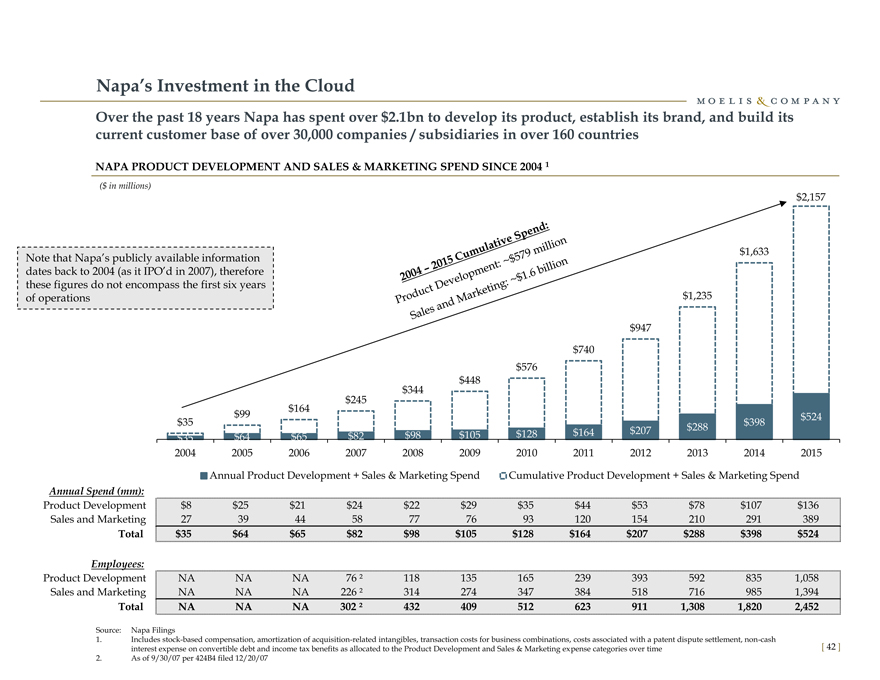
Napa’s Investment in the Cloud
Over the past 18 years Napa has spent over $2.1bn to develop its product, establish its brand, and build its
current customer base of over 30,000 companies / subsidiaries in over 160 countries
NAPA PRODUCT DEVELOPMENT AND SALES & MARKETING SPEND SINCE 2004 1
($ in millions)
$2,157
Note that Napa’s publicly available information $1,633
dates back to 2004 (as it IPO’d in 2007), therefore
these figures do not encompass the first six years
of operations $1,235
$947
$740
$576
$448
$344
$245
$164
$99 $524
$35 $288 $398
$35 $64 $65 $82 $98 $105 $128 $164 $207
2004 2005 2006 2007 2008 2009 2010 2011 2012 2013 2014 2015
Annual Product Development + Sales & Marketing Spend Cumulative Product Development + Sales & Marketing Spend
Annual Spend (mm):
Product Development $8 $25 $21 $24 $22 $29 $35 $44 $53 $78 $107 $136
Sales and Marketing 27 39 44 58 77 76 93 120 154 210 291 389
Total $35 $64 $65 $82 $98 $105 $128 $164 $207 $288 $398 $524
Employees:
Product Development NA NA NA 76 ² 118 135 165 239 393 592 835 1,058
Sales and Marketing NA NA NA 226 ² 314 274 347 384 518 716 985 1,394
Total NA NA NA 302 ² 432 409 512 623 911 1,308 1,820 2,452
Source: Napa Filings
1. Includes stock-based compensation, amortization of acquisition-related intangibles, transaction costs for business combinations, costs associated with a patent dispute settlement, non-cash
interest expense on convertible debt and income tax benefits as allocated to the Product Development and Sales & Marketing expense categories over time
2. |
| As of 9/30/07 per 424B4 filed 12/20/07 |
[ 42 ]
|
Contact Information
Moelis & Company LLC is a U.S.-registered broker dealer and a member of FINRA & SIPC.
Moelis & Company LLC
1999 Avenue of the Stars, Suite 1900 Los Angeles, CA 90067
Tel: (310) 443-2300
399 Park Avenue, 5th Floor New York, NY 10022 Tel: (212) 883-3800
[43]