Exhibit (c)(11)
|

STRICTLY CONFIDENTIAL Project Napa Update Materials for the Special Committee of the Board of Directors June 8, 2016
|
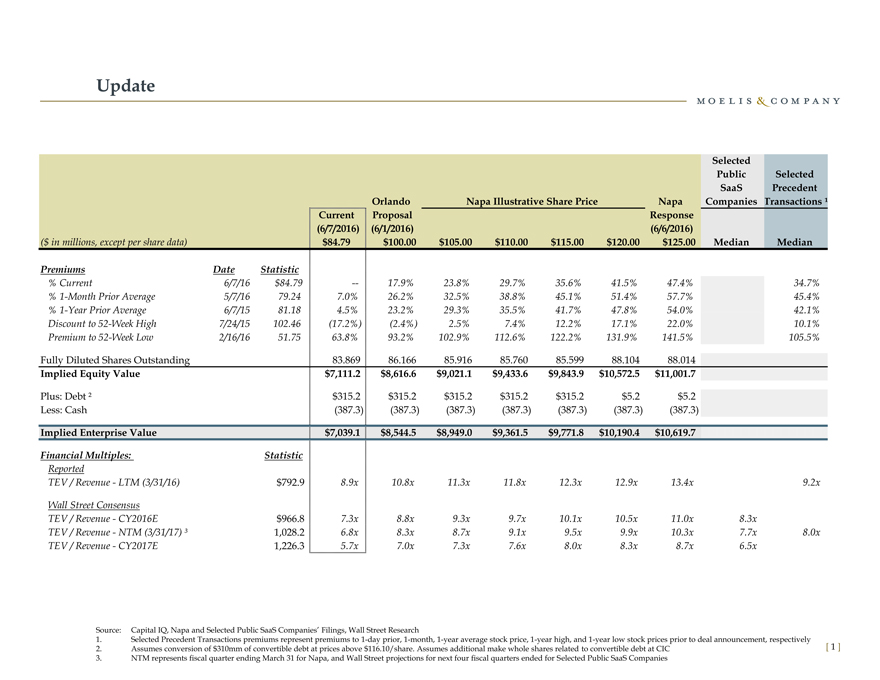
Update Selected Public Selected SaaS Precedent Orlando Napa Illustrative Share Price Napa Companies Transactions ¹ Current Proposal Response (6/7/2016) (6/1/2016) (6/6/2016) ($ in millions, except per share data) $84.79 $100.00 $105.00 $110.00 $115.00 $120.00 $125.00 Median Median Premiums Date Statistic % Current 6/7/16 $84.79 — 17.9% 23.8% 29.7% 35.6% 41.5% 47.4% 34.7% % 1-Month Prior Average 5/7/16 79.24 7.0% 26.2% 32.5% 38.8% 45.1% 51.4% 57.7% 45.4% % 1-Year Prior Average 6/7/15 81.18 4.5% 23.2% 29.3% 35.5% 41.7% 47.8% 54.0% 42.1% Discount to 52-Week High 7/24/15 102.46 (17.2%) (2.4%) 2.5% 7.4% 12.2% 17.1% 22.0% 10.1% Premium to 52-Week Low 2/16/16 51.75 63.8% 93.2% 102.9% 112.6% 122.2% 131.9% 141.5% 105.5% Fully Diluted Shares Outstanding 83.869 86.166 85.916 85.760 85.599 88.104 88.014 Implied Equity Value $7,111.2 $8,616.6 $9,021.1 $9,433.6 $9,843.9 $10,572.5 $11,001.7 Plus: Debt ? $315.2 $315.2 $315.2 $315.2 $315.2 $5.2 $5.2 Less: Cash (387.3) (387.3) (387.3) (387.3) (387.3) (387.3) (387.3) Implied Enterprise Value $7,039.1 $8,544.5 $8,949.0 $9,361.5 $9,771.8 $10,190.4 $10,619.7 Financial Multiples: Statistic Reported TEV / Revenue—LTM (3/31/16) $792.9 8.9x 10.8x 11.3x 11.8x 12.3x 12.9x 13.4x 9.2x Wall Street Consensus TEV / Revenue—CY2016E $966.8 7.3x 8.8x 9.3x 9.7x 10.1x 10.5x 11.0x 8.3x TEV / Revenue—NTM (3/31/17) ³ 1,028.2 6.8x 8.3x 8.7x 9.1x 9.5x 9.9x 10.3x 7.7x 8.0x TEV / Revenue—CY2017E 1,226.3 5.7x 7.0x 7.3x 7.6x 8.0x 8.3x 8.7x 6.5x Source: Capital IQ, Napa and Selected Public SaaS Companies’ Filings, Wall Street Research 1. Selected Precedent Transactions premiums represent premiums to 1-day prior, 1-month, 1-year average stock price, 1-year high, and 1-year low stock prices prior to deal announcement, respectively 2. Assumes conversion of $310mm of convertible debt at prices above $116.10/share. Assumes additional make whole shares related to convertible debt at CIC [ 1 ] 3. NTM represents fiscal quarter ending March 31 for Napa, and Wall Street projections for next four fiscal quarters ended for Selected Public SaaS Companies
|
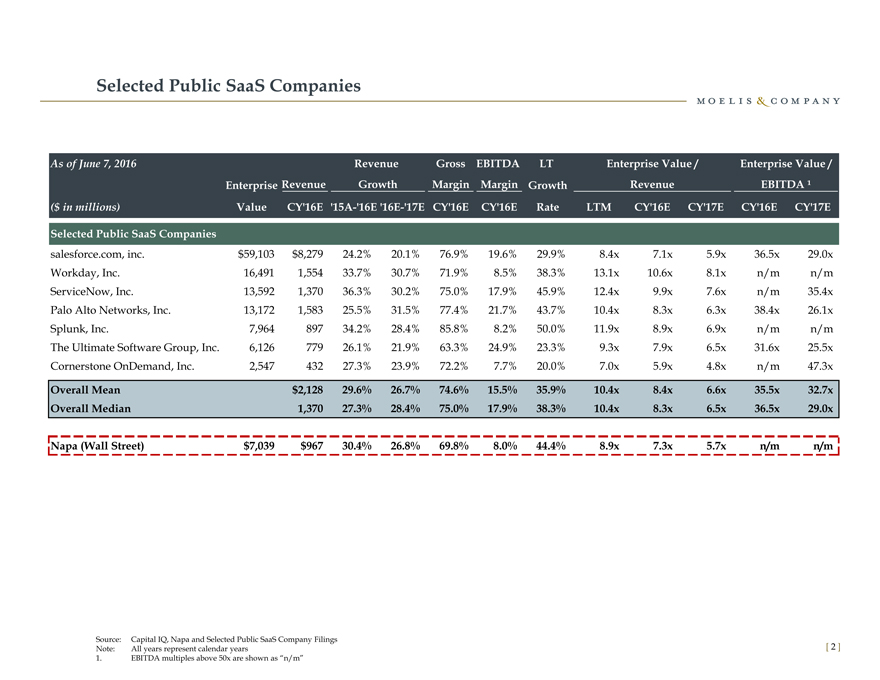
Selected Public SaaS Companies As of June 7, 2016 Revenue Gross EBITDA LT Enterprise Value / Enterprise Value / Enterprise Revenue Growth Margin Margin Growth Revenue EBITDA ¹ ($ in millions) Value CY’16E ‘15A-‘16E ‘16E-‘17E CY’16E CY’16E Rate LTM CY’16E CY’17E CY’16E CY’17E Selected Public SaaS Companies salesforce.com, inc. $59,103 $8,279 24.2% 20.1% 76.9% 19.6% 29.9% 8.4x 7.1x 5.9x 36.5x 29.0x Workday, Inc. 16,491 1,554 33.7% 30.7% 71.9% 8.5% 38.3% 13.1x 10.6x 8.1x n/m n/m ServiceNow, Inc. 13,592 1,370 36.3% 30.2% 75.0% 17.9% 45.9% 12.4x 9.9x 7.6x n/m 35.4x Palo Alto Networks, Inc. 13,172 1,583 25.5% 31.5% 77.4% 21.7% 43.7% 10.4x 8.3x 6.3x 38.4x 26.1x Splunk, Inc. 7,964 897 34.2% 28.4% 85.8% 8.2% 50.0% 11.9x 8.9x 6.9x n/m n/m The Ultimate Software Group, Inc. 6,126 779 26.1% 21.9% 63.3% 24.9% 23.3% 9.3x 7.9x 6.5x 31.6x 25.5x Cornerstone OnDemand, Inc. 2,547 432 27.3% 23.9% 72.2% 7.7% 20.0% 7.0x 5.9x 4.8x n/m 47.3x Overall Mean $2,128 29.6% 26.7% 74.6% 15.5% 35.9% 10.4x 8.4x 6.6x 35.5x 32.7x Overall Median 1,370 27.3% 28.4% 75.0% 17.9% 38.3% 10.4x 8.3x 6.5x 36.5x 29.0x Napa (Wall Street) $7,039 $967 30.4% 26.8% 69.8% 8.0% 44.4% 8.9x 7.3x 5.7x n/m n/m Source: Capital IQ, Napa and Selected Public SaaS Company Filings Note: All years represent calendar years [ 2 ] 1. EBITDA multiples above 50x are shown as “n/m”
|
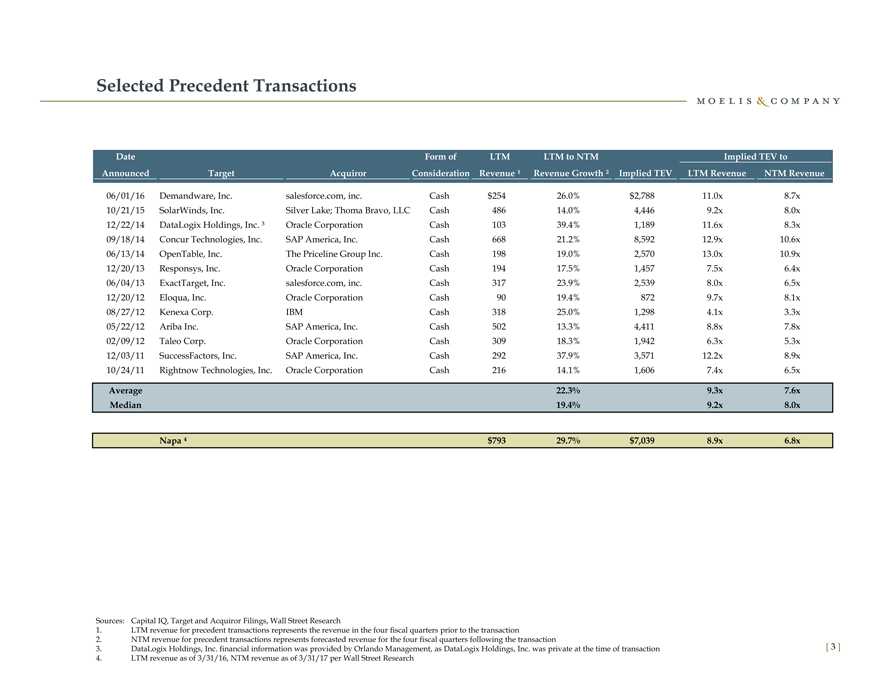
Selected Precedent Transactions Date Form of LTM LTM to NTM Implied TEV to Announced Target Acquiror Consideration Revenue ¹ Revenue Growth ² Implied TEV LTM Revenue NTM Revenue 06/01/16 Demandware, Inc. salesforce.com, inc. Cash $254 26.0% $2,788 11.0x 8.7x 10/21/15 SolarWinds, Inc. Silver Lake; Thoma Bravo, LLC Cash 486 14.0% 4,446 9.2x 8.0x 12/22/14 DataLogix Holdings, Inc. ³ Oracle Corporation Cash 103 39.4% 1,189 11.6x 8.3x 09/18/14 Concur Technologies, Inc. SAP America, Inc. Cash 668 21.2% 8,592 12.9x 10.6x 06/13/14 OpenTable, Inc. The Priceline Group Inc. Cash 198 19.0% 2,570 13.0x 10.9x 12/20/13 Responsys, Inc. Oracle Corporation Cash 194 17.5% 1,457 7.5x 6.4x 06/04/13 ExactTarget, Inc. salesforce.com, inc. Cash 317 23.9% 2,539 8.0x 6.5x 12/20/12 Eloqua, Inc. Oracle Corporation Cash 90 19.4% 872 9.7x 8.1x 08/27/12 Kenexa Corp. IBM Cash 318 25.0% 1,298 4.1x 3.3x 05/22/12 Ariba Inc. SAP America, Inc. Cash 502 13.3% 4,411 8.8x 7.8x 02/09/12 Taleo Corp. Oracle Corporation Cash 309 18.3% 1,942 6.3x 5.3x 12/03/11 SuccessFactors, Inc. SAP America, Inc. Cash 292 37.9% 3,571 12.2x 8.9x 10/24/11 Rightnow Technologies, Inc. Oracle Corporation Cash 216 14.1% 1,606 7.4x 6.5x Average 22.3% 9.3x 7.6x Median 19.4% 9.2x 8.0x Napa $793 29.7% $7,039 8.9x 6.8x Sources: Capital IQ, Target and Acquiror Filings, Wall Street Research 1. LTM revenue for precedent transactions represents the revenue in the four fiscal quarters prior to the transaction 2. NTM revenue for precedent transactions represents forecasted revenue for the four fiscal quarters following the transaction 3. DataLogix Holdings, Inc. financial information was provided by Orlando Management, as DataLogix Holdings, Inc. was private at the time of transaction [ 3 ] 4. LTM revenue as of 3/31/16, NTM revenue as of 3/31/17 per Wall Street Research
|
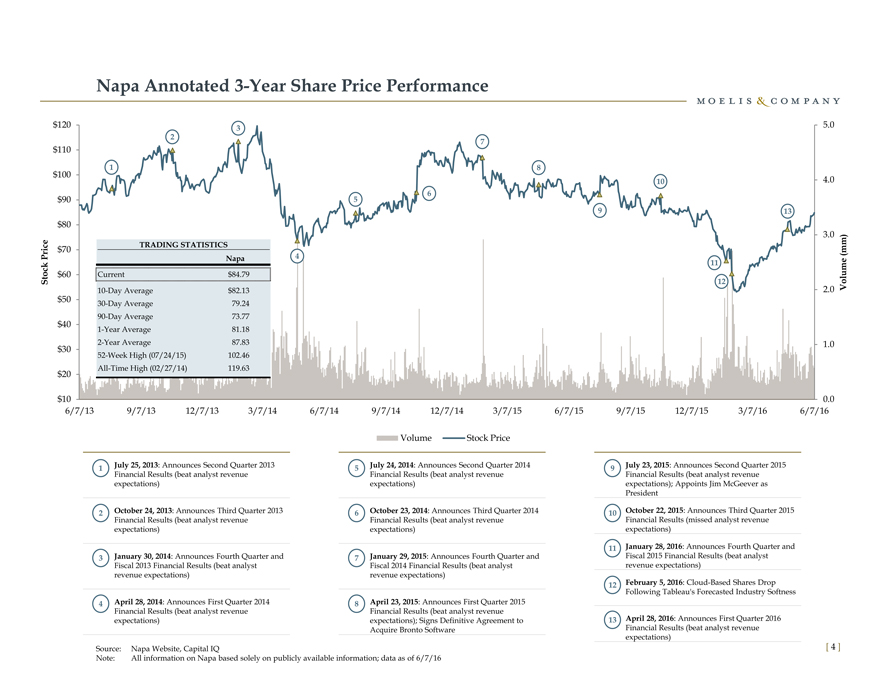
Napa Annotated 3-Year Share Price Performance $120 3 5.0 2 $110 7 1 8 $100 10 4.0 6 $90 5 9 13 $80 3.0 TRADING STATISTICS $70 (mm) Price Napa 4 11 e k Stoc $60 Current $84.79 12 lum 10-Day Average $82.13 2.0 Vo $50 30-Day Average 79.24 $40 90-Day Average 73.77 1-Year Average 81.18 2-Year Average 87.83 1.0 $30 52-Week High (07/24/15) 102.46 All-Time High (02/27/14) 119.63 $20 $10 0.0 6/7/13 9/7/13 12/7/13 3/7/14 6/7/14 9/7/14 12/7/14 3/7/15 6/7/15 9/7/15 12/7/15 3/7/16 6/7/16 Volume Stock Price 1? July 25, 2013: Announces Second Quarter 2013 5? July 24, 2014: Announces Second Quarter 2014 9? July 23, 2015: Announces Second Quarter 2015 Financial Results (beat analyst revenue Financial Results (beat analyst revenue Financial Results (beat analyst revenue expectations) expectations) expectations); Appoints Jim McGeever as President 2? October 24, 2013: Announces Third Quarter 2013 6? October 23, 2014: Announces Third Quarter 2014 10? October 22, 2015: Announces Third Quarter 2015 Financial Results (beat analyst revenue Financial Results (beat analyst revenue Financial Results (missed analyst revenue expectations) expectations) expectations) 11? January 28, 2016: Announces Fourth Quarter and 3? January 30, 2014: Announces Fourth Quarter and 7? January 29, 2015: Announces Fourth Quarter and Fiscal 2015 Financial Results (beat analyst Fiscal 2013 Financial Results (beat analyst Fiscal 2014 Financial Results (beat analyst revenue expectations) revenue expectations) revenue expectations) February 5, 2016: Cloud-Based Shares Drop 12? Following Tableau’s Forecasted Industry Softness 4? April 28, 2014: Announces First Quarter 2014 8? April 23, 2015: Announces First Quarter 2015 Financial Results (beat analyst revenue Financial Results (beat analyst revenue April 28, : Announces expectations) expectations); Signs Definitive Agreement to 13? 2016 First Quarter 2016 Acquire Bronto Software Financial Results (beat analyst revenue expectations) Source: Napa Website, Capital IQ [ 4 ] Note: All information on Napa based solely on publicly available information; data as of 6/7/16
|
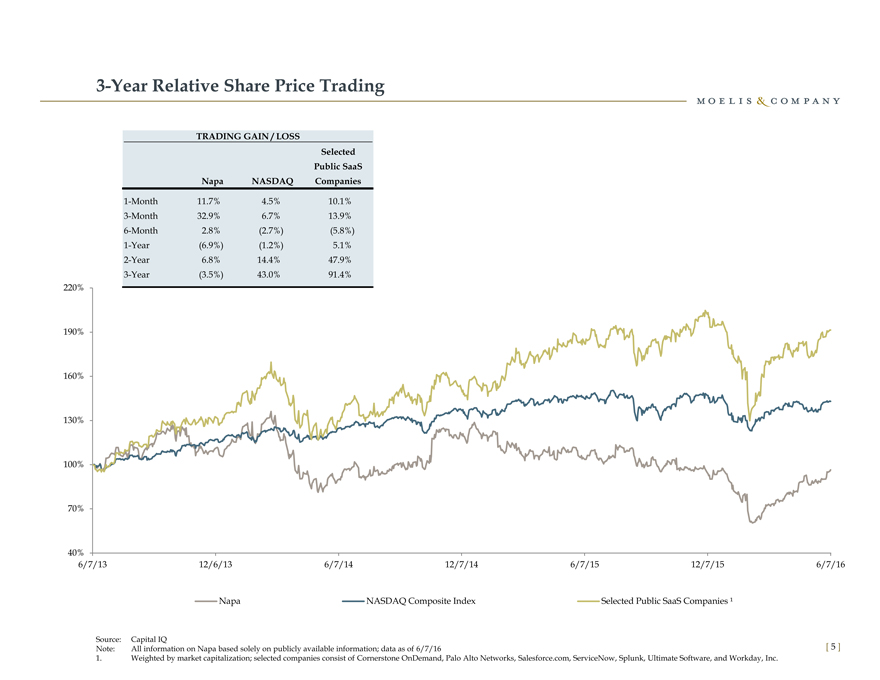
3-Year Relative Share Price Trading TRADING GAIN / LOSS Selected Public SaaS Napa NASDAQ Companies 1-Month 11.7% 4.5% 10.1% 3-Month 32.9% 6.7% 13.9% 6-Month 2.8% (2.7%) (5.8%) 1-Year (6.9%) (1.2%) 5.1% 2-Year 6.8% 14.4% 47.9% 3-Year (3.5%) 43.0% 91.4% 220% 190% 160% 130% 100% 70% 40% 6/7/13 12/6/13 6/7/14 12/7/14 6/7/15 12/7/15 6/7/16 Napa NASDAQ Composite Index Selected Public SaaS Companies ¹ Source: Capital IQ Note: All information on Napa based solely on publicly available information; data as of 6/7/16 [ 5 ] 1. Weighted by market capitalization; selected companies consist of Cornerstone OnDemand, Palo Alto Networks, Salesforce.com, ServiceNow, Splunk, Ultimate Software, and Workday, Inc.
|

3-Year Relative EV / Forward Revenue Multiple Trading SUMMARY AVERAGE STATISTICS Selected Public SaaS Napa Companies 1-Month Avg. 6.1x 6.9x 3-Month Avg. 5.9x 6.9x 6-Month Avg. 5.9x 6.9x 1-Year Avg. 7.1x 7.7x 2-Year Avg. 8.8x 8.3x 3-Year Avg. 10.6x 9.0x 18.0x 15.0x 12.0x 9.0x 6.0x 3.0x 6/7/13 12/6/13 6/7/14 12/7/14 6/7/15 12/7/15 Napa Selected Public SaaS Companies ¹ Source: Capital IQ Note: All information on Napa based solely on publicly available information; data as of 6/7/16 1. Weighted by market capitalization; selected companies consist of Cornerstone OnDemand, Palo Alto Networks, Salesforce.com, ServiceNow, Splunk, Ultimate Software, and Workday, Inc.
|
Contact Information Moelis & Company LLC is a U.S.-registered broker dealer and a member of FINRA & SIPC. Moelis & Company LLC 1999 Avenue of the Stars, Suite 1900 Los Angeles, CA 90067 Tel: (310) 443-2300 399 Park Avenue, 5th Floor New York, NY 10022 Tel: (212) 883-3800 [ 7 ]