Exhibit (c)(13)
|

STRICTLY CONFIDENTIAL
Project Napa
[Graphic Appears Here]
Update Materials for the Special Committee of the Board of Directors
June 30, 2016
|
Update
[Graphic Appears Here]
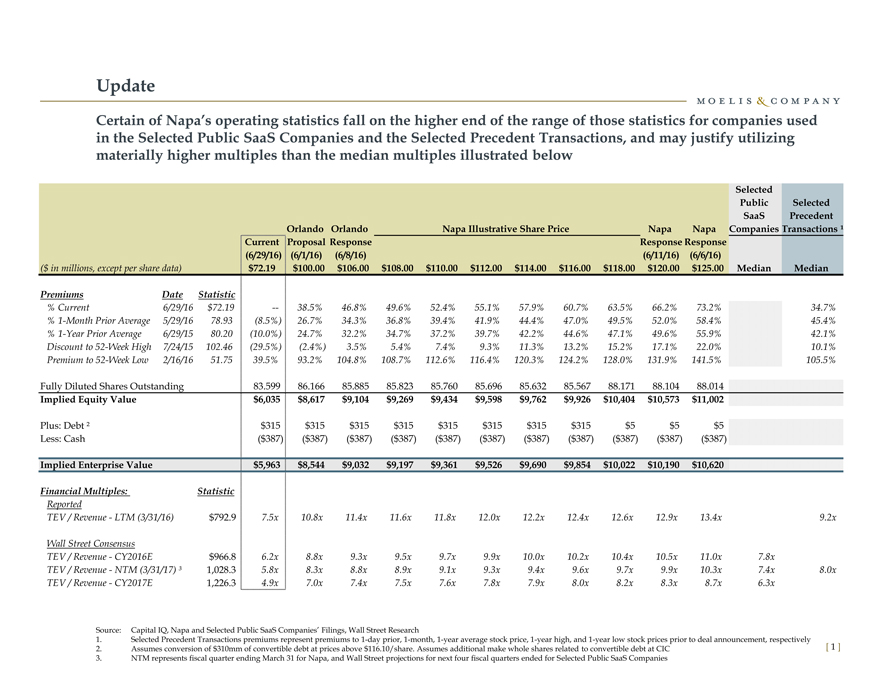
Certain of Napa s operating statistics fall on the higher end of the range of those statistics for companies used in the Selected Public SaaS Companies and the Selected Precedent Transactions, and may justify utilizing materially higher multiples than the median multiples illustrated below
Selected
PublicSelected
SaaSPrecedent
OrlandoOrlandoNapa Illustrative Share PriceNapaNapaCompanies Transactions ¹
Current Proposal ResponseResponse Response
(6/29/16)(6/1/16)(6/8/16)(6/11/16)(6/6/16)
($ in millions, except per share data) $72.19$100.00$106.00$108.00$110.00$112.00$114.00$116.00$118.00$120.00$125.00MedianMedian
Premiums Date Statistic
% Current 6/29/16 $72.19—38.5%46.8%49.6%52.4%55.1%57.9%60.7%63.5%66.2%73.2%34.7%
% 1-Month Prior Average 5/29/16 78.93(8.5%)26.7%34.3%36.8%39.4%41.9%44.4%47.0%49.5%52.0%58.4%45.4%
% 1-Year Prior Average 6/29/15 80.20(10.0%)24.7%32.2%34.7%37.2%39.7%42.2%44.6%47.1%49.6%55.9%42.1%
Discount to 52-Week High 7/24/15 102.46(29.5%)(2.4%)3.5%5.4%7.4%9.3%11.3%13.2%15.2%17.1%22.0%10.1%
Premium to 52-Week Low 2/16/16 51.7539.5%93.2%104.8%108.7%112.6%116.4%120.3%124.2%128.0%131.9%141.5%105.5%
Fully Diluted Shares Outstanding 83.59986.16685.88585.82385.76085.69685.63285.56788.17188.10488.014
Implied Equity Value $6,035$8,617$9,104$9,269$9,434$9,598$9,762$9,926$10,404$10,573$11,002
Plus: Debt ² $315$315$315$315$315$315$315$315$5$5$5
Less: Cash ($387)($387)($387)($387)($387)($387)($387)($387)($387)($387)($387)
Implied Enterprise Value $5,963$8,544$9,032$9,197$9,361$9,526$9,690$9,854$10,022$10,190$10,620
Financial Multiples: Statistic
Reported
TEV / Revenue—LTM (3/31/16) $792.9 7.5x10.8x11.4x11.6x11.8x12.0x12.2x12.4x12.6x12.9x13.4x9.2x
Wall Street Consensus
TEV / Revenue—CY2016E $966.86.2x8.8x9.3x9.5x9.7x9.9x10.0x10.2x10.4x10.5x11.0x7.8x
TEV / Revenue—NTM (3/31/17) ³ 1,028.3 5.8x8.3x8.8x8.9x9.1x9.3x9.4x9.6x9.7x9.9x10.3x7.4x8.0x
TEV / Revenue—CY2017E 1,226.34.9x7.0x7.4x7.5x7.6x7.8x7.9x8.0x8.2x8.3x8.7x6.3x
Source: Capital IQ, Napa and Selected Public SaaS Companies’ Filings, Wall Street Research
1. Selected Precedent Transactions premiums represent premiums to 1-day prior, 1-month, 1-year average stock price, 1-year high, and 1-year low stock prices prior to deal announcement, respectively
2. Assumes conversion of $310mm of convertible debt at prices above $116.10/share. Assumes additional make whole shares related to convertible debt at CIC [ 1 ]
3. NTM represents fiscal quarter ending March 31 for Napa, and Wall Street projections for next four fiscal quarters ended for Selected Public SaaS Companies
|
Selected Public SaaS Companies
[Graphic Appears Here]
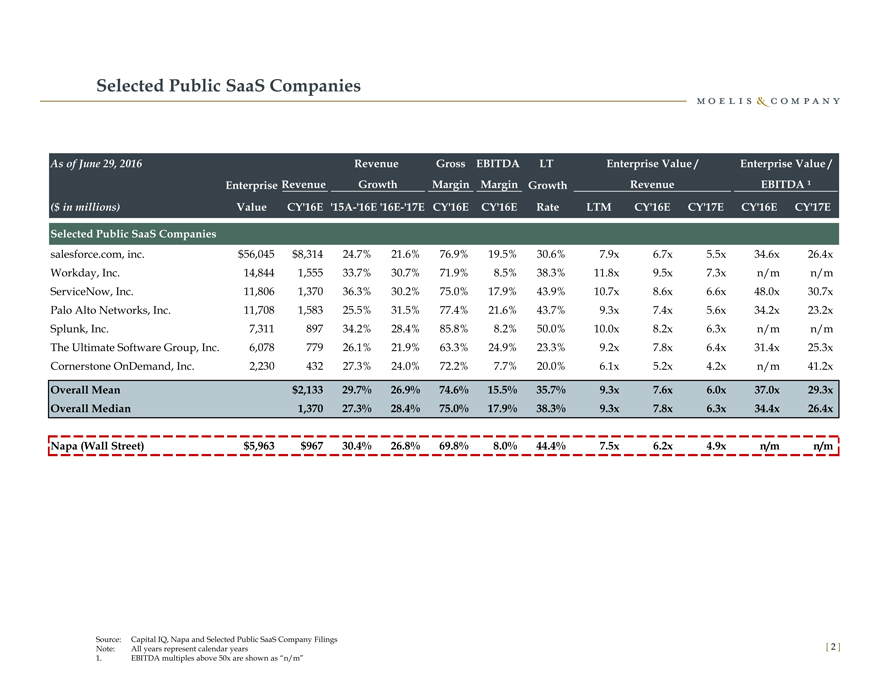
As of June 29, 2016 RevenueGrossEBITDALTEnterprise Value /Enterprise Value /
Enterprise Revenue GrowthMargin Margin GrowthRevenueEBITDA ¹
($ in millions) Value CY’16E’15A-‘16E ‘16E-‘17E CY’16ECY’16ERateLTMCY’16ECY’17ECY’16ECY’17E
Selected Public SaaS Companies
salesforce.com, inc. $56,045 $8,31424.7%21.6%76.9%19.5%30.6%7.9x6.7x5.5x34.6x26.4x
Workday, Inc. 14,844 1,55533.7%30.7%71.9%8.5%38.3%11.8x9.5x7.3xn/mn/m
ServiceNow, Inc. 11,806 1,37036.3%30.2%75.0%17.9%43.9%10.7x8.6x6.6x48.0x30.7x
Palo Alto Networks, Inc. 11,708 1,58325.5%31.5%77.4%21.6%43.7%9.3x7.4x5.6x34.2x23.2x
Splunk, Inc. 7,311 89734.2%28.4%85.8%8.2%50.0%10.0x8.2x6.3xn/mn/m
The Ultimate Software Group, Inc. 6,078 77926.1%21.9%63.3%24.9%23.3%9.2x7.8x6.4x31.4x25.3x
Cornerstone OnDemand, Inc. 2,230 43227.3%24.0%72.2%7.7%20.0%6.1x5.2x4.2xn/m41.2x
Overall Mean $2,13329.7%26.9%74.6%15.5%35.7%9.3x7.6x6.0x37.0x29.3x
Overall Median 1,37027.3%28.4%75.0%17.9%38.3%9.3x7.8x6.3x34.4x26.4x
Napa (Wall Street) $5,963 $96730.4%26.8%69.8%8.0%44.4%7.5x6.2x4.9xn/mn/m
Source: Capital IQ, Napa and Selected Public SaaS Company Filings
Note: All years represent calendar years [ 2 ]
1. EBITDA multiples above 50x are shown as “n/m”
|
Selected Precedent Transactions
[Graphic Appears Here]
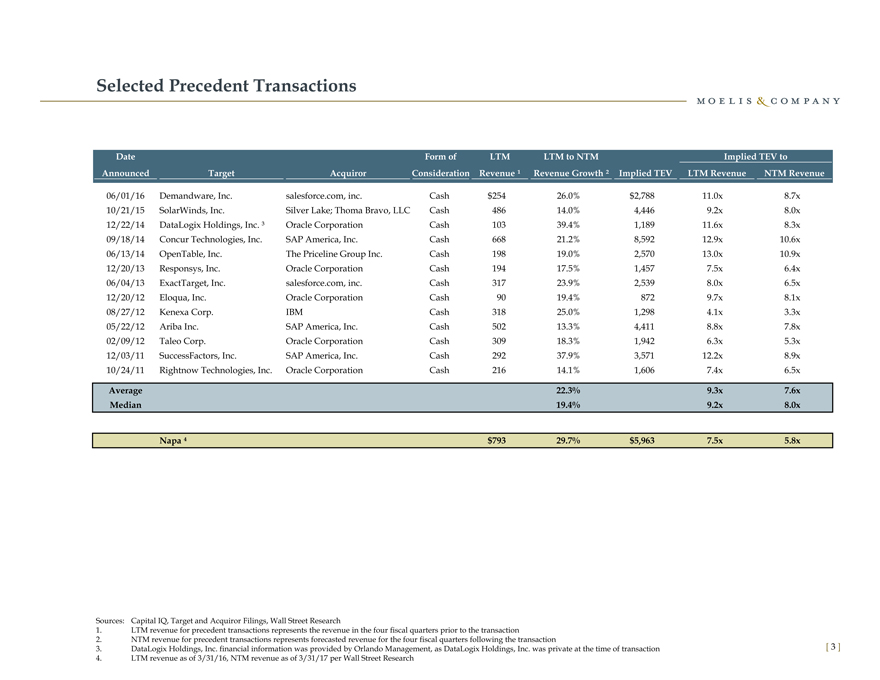
Date Form ofLTMLTM to NTMImplied TEV to
Announced Target AcquirorConsideration Revenue ¹Revenue Growth ² Implied TEVLTM RevenueNTM Revenue
06/01/16 Demandware, Inc. salesforce.com, inc.Cash$25426.0%$2,78811.0x8.7x
10/21/15 SolarWinds, Inc. Silver Lake; Thoma Bravo, LLCCash48614.0%4,4469.2x8.0x
12/22/14 DataLogix Holdings, Inc. ³ Oracle CorporationCash10339.4%1,18911.6x8.3x
09/18/14 Concur Technologies, Inc. SAP America, Inc.Cash66821.2%8,59212.9x10.6x
06/13/14 OpenTable, Inc. The Priceline Group Inc.Cash19819.0%2,57013.0x10.9x
12/20/13 Responsys, Inc. Oracle CorporationCash19417.5%1,4577.5x6.4x
06/04/13 ExactTarget, Inc. salesforce.com, inc.Cash31723.9%2,5398.0x6.5x
12/20/12 Eloqua, Inc. Oracle CorporationCash9019.4%8729.7x8.1x
08/27/12 Kenexa Corp. IBMCash31825.0%1,2984.1x3.3x
05/22/12 Ariba Inc. SAP America, Inc.Cash50213.3%4,4118.8x7.8x
02/09/12 Taleo Corp. Oracle CorporationCash30918.3%1,9426.3x5.3x
12/03/11 SuccessFactors, Inc. SAP America, Inc.Cash29237.9%3,57112.2x8.9x
10/24/11 Rightnow Technologies, Inc. Oracle CorporationCash21614.1%1,6067.4x6.5x
Average 22.3%9.3x7.6x
Median 19.4%9.2x8.0x
Napa $79329.7%$5,9637.5x5.8x
Sources: Capital IQ, Target and Acquiror Filings, Wall Street Research
1. LTM revenue for precedent transactions represents the revenue in the four fiscal quarters prior to the transaction
2. NTM revenue for precedent transactions represents forecasted revenue for the four fiscal quarters following the transaction
3. DataLogix Holdings, Inc. financial information was provided by Orlando Management, as DataLogix Holdings, Inc. was private at the time of transaction [ 3 ]
4. LTM revenue as of 3/31/16, NTM revenue as of 3/31/17 per Wall Street Research
|
Napa Discounted Cash Flow Analysis (Orlando Incremental Model)
[Graphic Appears Here]
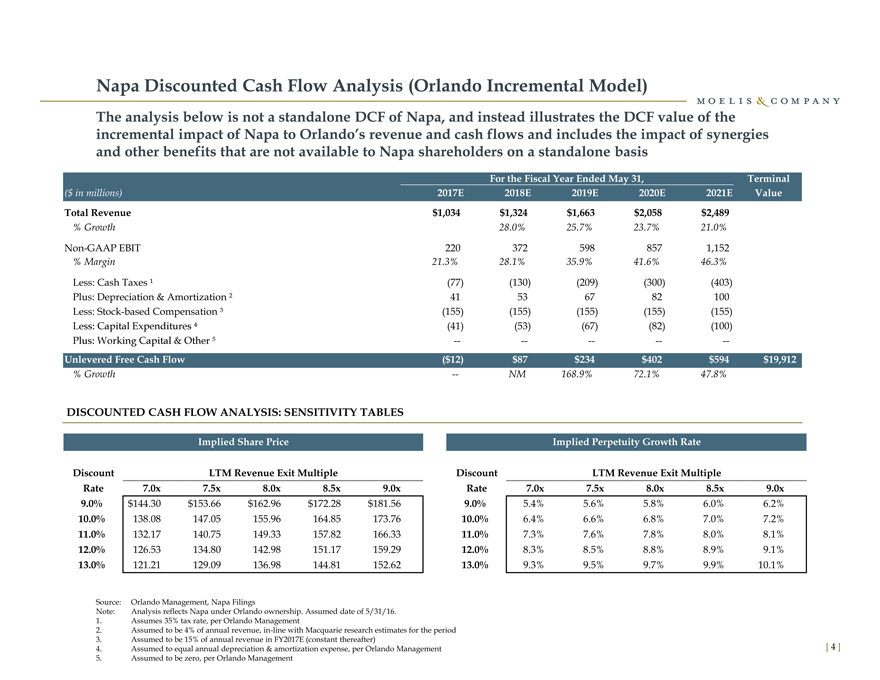
The analysis below is not a standalone DCF of Napa, and instead illustrates the DCF value of the incremental impact of Napa to Orlando s revenue and cash flows and includes the impact of synergies and other benefits that are not available to Napa shareholders on a standalone basis
For the Fiscal Year Ended May 31,Terminal
($ in millions) 2017E2018E2019E2020E2021EValue
Total Revenue $1,034$1,324$1,663$2,058$2,489
% Growth 28.0%25.7%23.7%21.0%
Non-GAAP EBIT 2203725988571,152
% Margin 21.3%28.1%35.9%41.6%46.3%
Less: Cash Taxes ¹ (77)(130)(209)(300)(403)
Plus: Depreciation & Amortization ² 41536782100
Less: Stock-based Compensation ³ (155)(155)(155)(155)(155)
(41)(53)(67)(82)(100)
—————
Unlevered Free Cash Flow ($12)$87$234$402$594$19,912
% Growth —NM168.9%72.1%47.8%
DISCOUNTED CASH FLOW ANALYSIS: SENSITIVITY TABLES
Implied Share PriceImplied Perpetuity Growth Rate
Discount LTM Revenue Exit MultipleDiscountLTM Revenue Exit Multiple
Rate 7.0x 7.5x8.0x8.5x9.0xRate7.0x7.5x8.0x8.5x9.0x
9.0% $144.30 $153.66$162.96$172.28$181.569.0%5.4%5.6%5.8%6.0%6.2%
10.0% 138.08 147.05155.96164.85173.7610.0%6.4%6.6%6.8%7.0%7.2%
11.0% 132.17 140.75149.33157.82166.3311.0%7.3%7.6%7.8%8.0%8.1%
12.0% 126.53 134.80142.98151.17159.2912.0%8.3%8.5%8.8%8.9%9.1%
13.0% 121.21 129.09136.98144.81152.6213.0%9.3%9.5%9.7%9.9%10.1%
Source: Orlando Management, Napa Filings
Note: Analysis reflects Napa under Orlando ownership. Assumed date of 5/31/16.
sumes 35% tax rate, per Orlando Management
sumed to be 4% of annual revenue, in-line with Macquarie research estimates for the period
d to be 15% of annual revenue in FY2017E (constant thereafter)
4. Assumed to equal annual depreciation & amortization expense, per Orlando Management [ 4 ]
5. Assumed to be zero, per Orlando Management
|
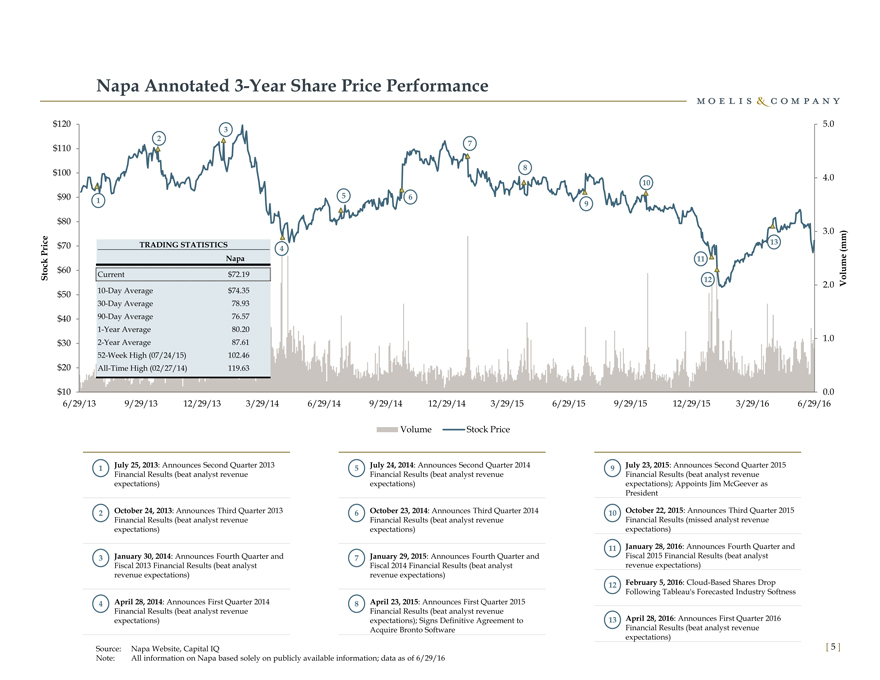
[Graphic Appears Here]
6/29/13 9/29/13 12/29/133/29/146/29/149/29/1412/29/143/29/156/29/159/29/1512/29/153/29/166/29/16
VolumeStock Price
1 July 25, 2013: Announces Second Quarter 2013 5 July 24, 2014: Announces Second Quarter 20149 July 23, 2015: Announces Second Quarter 2015
Financial Results (beat analyst revenue Financial Results (beat analyst revenueFinancial Results (beat analyst revenue
expectations) expectations)expectations); Appoints Jim McGeever as
President
2 October 24, 2013: Announces Third Quarter 2013 6 October 23, 2014: Announces Third Quarter 201410 October 22, 2015: Announces Third Quarter 2015
Financial Results (beat analyst revenue Financial Results (beat analyst revenueFinancial Results (missed analyst revenue
expectations) expectations)expectations)
11 January 28, 2016: Announces Fourth Quarter and
3 January 30, 2014: Announces Fourth Quarter and 7 January 29, 2015: Announces Fourth Quarter andFiscal 2015 Financial Results (beat analyst
Fiscal 2013 Financial Results (beat analyst Fiscal 2014 Financial Results (beat analystrevenue expectations)
revenue expectations) revenue expectations)
12 February 5, 2016: Cloud-Based Shares Drop
Following Tableau’s Forecasted Industry Softness
4 April 28, 2014: Announces First Quarter 2014 8 April 23, 2015: Announces First Quarter 2015
Financial Results (beat analyst revenue Financial Results (beat analyst revenue
expectations) expectations); Signs Definitive Agreement to13 April 28, 2016: Announces First Quarter 2016
Acquire Bronto SoftwareFinancial Results (beat analyst revenue
expectations)
Source: Napa Website, Capital IQ [ 5 ]
Note: All information on Napa based solely on publicly available information; data as of 6/29/16
|
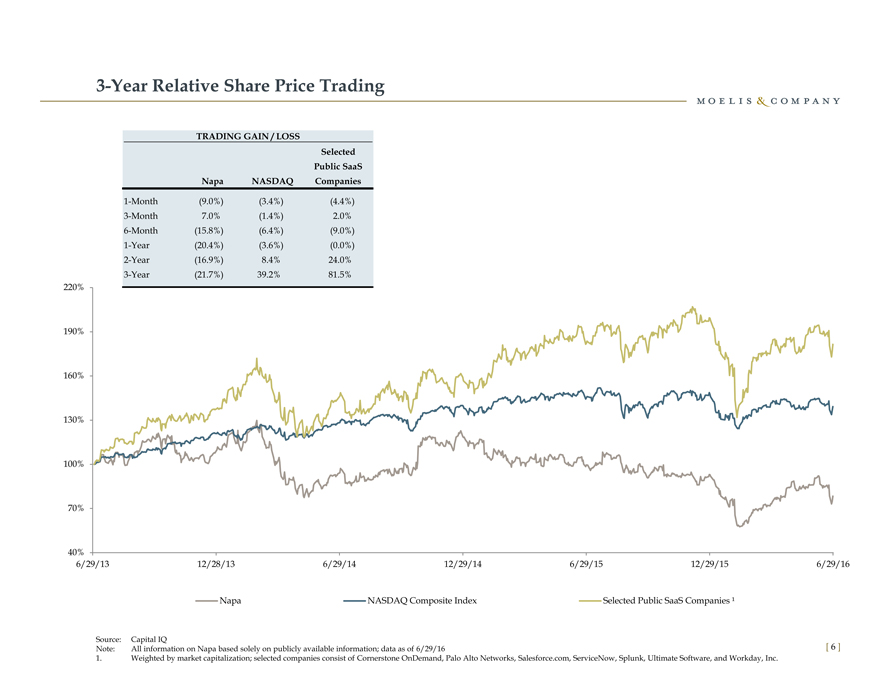
3-Year Relative Share Price Trading
[Graphic Appears Here]
TRADING GAIN / LOSS
Selected
Public SaaS
Napa NASDAQCompanies
1-Month (9.0%) (3.4%)(4.4%)
3-Month 7.0% (1.4%)2.0%
6-Month (15.8%) (6.4%)(9.0%)
1-Year (20.4%) (3.6%)(0.0%)
2-Year (16.9%) 8.4%24.0%
3-Year (21.7%) 39.2%81.5%
[Graphic Appears Here]
|
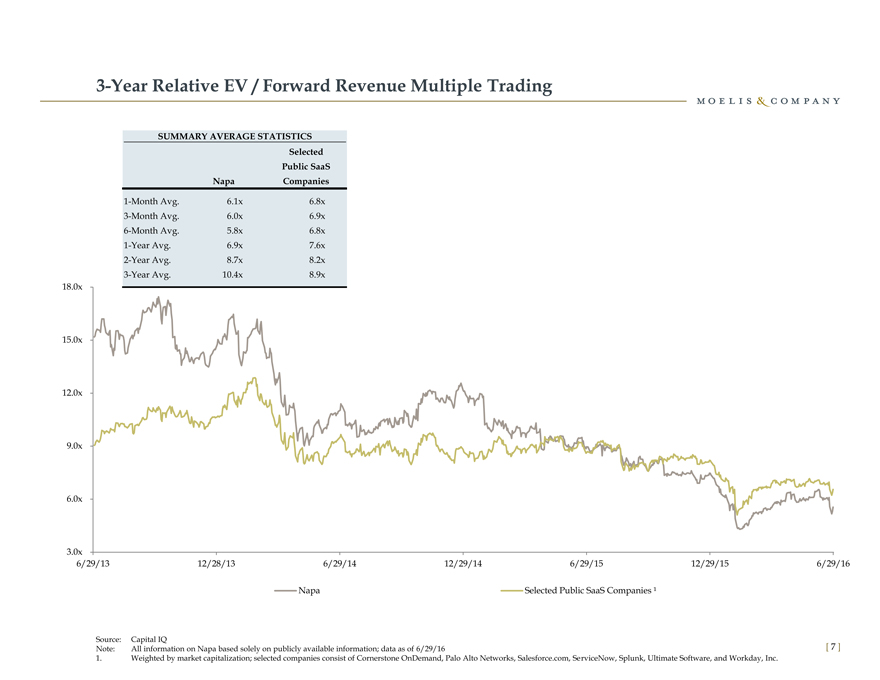
3-Year Relative EV / Forward Revenue Multiple Trading
[Graphic Appears Here]
SUMMARY AVERAGE STATISTICS
Selected
Public SaaS
Napa Companies
1-Month Avg. 6.1x 6.8x
3-Month Avg. 6.0x 6.9x
6-Month Avg. 5.8x 6.8x
1-Year Avg. 6.9x 7.6x
2-Year Avg. 8.7x 8.2x
3-Year Avg. 10.4x 8.9x
[Graphic Appears Here]
|
Contact Information
[Graphic Appears Here]
Moelis & Company LLC is a U.S.-registered broker dealer and a member of FINRA & SIPC.
Moelis & Company LLC
1999 Avenue of the Stars, Suite 1900
Los Angeles, CA 90067
Tel: (310) 443-2300
399 Park Avenue, 5th Floor
New York, NY 10022
Tel: (212) 883-3800
[ 8 ]