Exhibit (c)(10)
|

STRICTLY CONFIDENTIAL Project Napa Presentation to the Special Committee of the Board of Directors Preliminary Financial Analysis May 27, 2016
|

Disclaimer This presentation has been prepared by Moelis & Company LLC (“Moelis”) for exclusive use of the Special Committee of the Board of Directors of Orlando Corporation (“Orlando” or the “Company”) in considering the transaction described herein based on information provided by the Company and upon information from third party sources. Moelis has not assumed any responsibility for independently verifying the accuracy of such information, and disclaims any liability with respect to the information herein. In this presentation, Moelis, at the Company’s direction, has used certain projections, forecasts or other forward-looking statements with respect to the Company and/or other parties involved in the transaction which were provided to Moelis by the Company and/or such other parties and which Moelis has assumed, at the Company’s direction, were prepared based on the best available estimates and judgments of the management of the Company and/or such other parties as to the future performance of the Company and/or such other parties. This presentation is provided as of the date hereof and Moelis assumes no obligation to update it or correct any information herein. This presentation is solely for informational purposes. This presentation is not intended to provide the sole basis for any decision on any transaction and is not a recommendation with respect to any transaction. The recipient should make its own independent business decision based on all other information, advice and the recipient’s own judgment. This presentation is not an offer to sell or a solicitation of an offer to buy any business, security, option, commodity, future, loan or currency. It is not a commitment to underwrite any security, to loan any funds or to make any investment. Moelis does not offer tax, accounting, actuarial or legal advice. Absent Moelis’ prior written consent, this material, whether in whole or in part, may not be copied, photocopied, or duplicated in any form by any means, or redistributed. Moelis and its related investment banking entities provide mergers and acquisitions, recapitalization, restructuring, corporate finance and other financial advisory services to clients and affiliates of Moelis provide investment management services to clients. Personnel of Moelis or such affiliates may make statements or provide advice that is contrary to information included in this material. The proprietary interests of Moelis or its affiliates may conflict with your interests. In addition, Moelis and its affiliates and their personnel may from time to time have positions in or effect transactions in securities referred to in this material (or derivatives of such securities), or serve as a director of companies referred to in this presentation. Moelis and its affiliates may have advised, may seek to advise and may in the future advise or invest in companies referred to in this presentation. This presentation is confidential and may not be disclosed to any other person or relied upon without the prior written consent of Moelis. [ 1 ]
|

Executive Summary Moelis is pleased to meet with the Special Committee (the “Committee”) of the Board of Directors of Orlando to discuss its preliminary financial analysis and potential next steps for Project Napa § Moelis has performed an initial review of both public and private information sources to form its preliminary perspectives § Moelis would like to discuss the following areas with the Committee: 3/4 Preliminary review of public market perspectives on Napa 3/4 Preliminary Napa financial analysis 3/4 Potential next steps and tactics around a potential transaction [ 2 ]
|

Background Moelis has held preliminary discussions with Orlando, Napa and its advisors, and has also reviewed a number of public and private information sources in forming its initial perspectives § On May 5, 2016 Moelis, Orlando, Skadden and a representative from the Committee attended a management presentation with members of Napa and Qatalyst. The session covered a number of topics, including an overview of Napa’s business highlights, a review of Napa’s go-to-market approach, and a review of Napa’s financials § On May 11, 2016 Moelis and Orlando held a telephonic discussion with Napa’s CFO to review a number of topics around Napa’s financials and related business considerations § On May 23, 2016 Moelis and Orlando held a telephonic discussion to review Orlando’s preliminary financial model for Napa and assumptions underlying the projection set § Moelis held subsequent conference calls with members of Orlando and Qatalyst to discuss due diligence findings and the potential acquisition § In addition to the management presentation, due diligence sessions and conference calls with the Napa and Orlando teams, Moelis reviewed: 3/4 Publicly available business and financial information relating to Napa and Orlando 3/4 Information relating to the business, earnings, cash flow, assets, liabilities and prospects of Napa, including financial forecasts prepared by Orlando 3/4 Certain Orlando internal information relating to cost savings, synergies and related expenses expected to result from the transaction [ 3 ]
|

I. Preliminary Public Market Perspectives
|
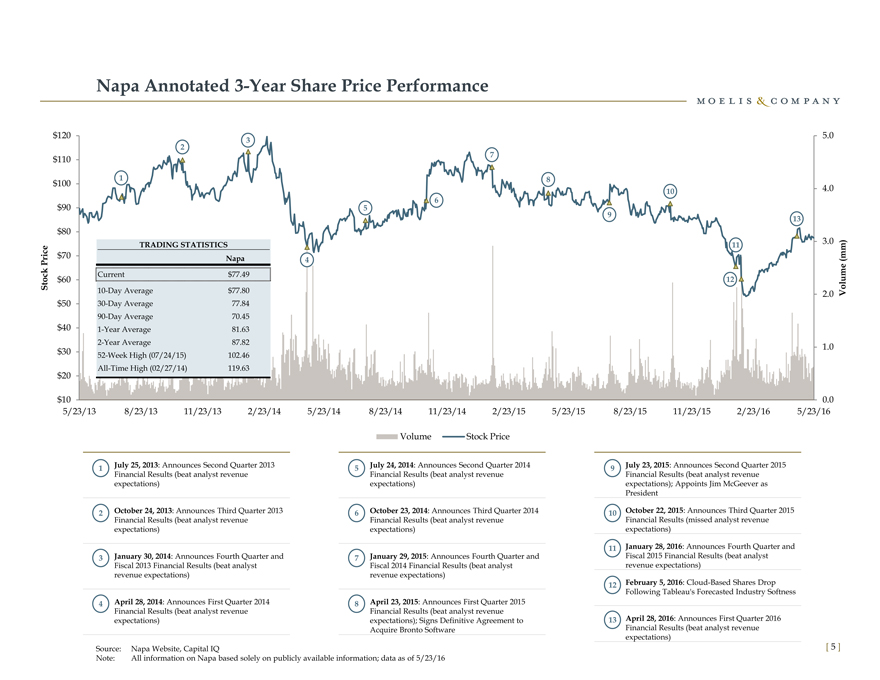
Napa Annotated 3-Year Share Price Performance $120 5.0 2 3 7 $110 1 8 $100 10 4.0 6 $90 5 9 13 $80 TRADING STATISTICS 3.0 11 e $70 Napa 4 (mm ) k Pric Volum e c Current $77.49 St o $60 12 10-Day Average $77.80 2.0 $50 30-Day Average 77.84 90-Day Average 70.45 $40 1-Year Average 81.63 2-Year Average 87.82 1.0 $30 52-Week High (07/24/15) 102.46 $20 All-Time High (02/27/14) 119.63 $10 0.0 5/23/13 8/23/13 11/23/13 2/23/14 5/23/14 8/23/14 11/23/14 2/23/15 5/23/15 8/23/15 11/23/15 2/23/16 5/23/16 Volume Stock Price 1§ July 25, 2013: Announces Second Quarter 2013 5§ July 24, 2014: Announces Second Quarter 2014 9§ July 23, 2015: Announces Second Quarter 2015 Financial Results (beat analyst revenue Financial Results (beat analyst revenue Financial Results (beat analyst revenue expectations) expectations) expectations); Appoints Jim McGeever as President 2§ October 24, 2013: Announces Third Quarter 2013 6§ October 23, 2014: Announces Third Quarter 2014 10§ October 22, 2015: Announces Third Quarter 2015 Financial Results (beat analyst revenue Financial Results (beat analyst revenue Financial Results (missed analyst revenue expectations) expectations) expectations) 11§ January 28, 2016: Announces Fourth Quarter and 3§ January 30, 2014: Announces Fourth Quarter and 7§ January 29, 2015: Announces Fourth Quarter and Fiscal 2015 Financial Results (beat analyst Fiscal 2013 Financial Results (beat analyst Fiscal 2014 Financial Results (beat analyst revenue expectations) revenue expectations) revenue expectations) February 5, 2016: Cloud-Based Shares Drop 12§ Following Tableau’s Forecasted Industry Softness 4§ April 28, 2014: Announces First Quarter 2014 8§ April 23, 2015: Announces First Quarter 2015 Financial Results (beat analyst revenue Financial Results (beat analyst revenue April 28, : Announces expectations) expectations); Signs Definitive Agreement to 13§ 2016 First Quarter 2016 Acquire Bronto Software Financial Results (beat analyst revenue expectations) Source: Napa Website, Capital IQ [ 5 ] Note: All information on Napa based solely on publicly available information; data as of 5/23/16
|
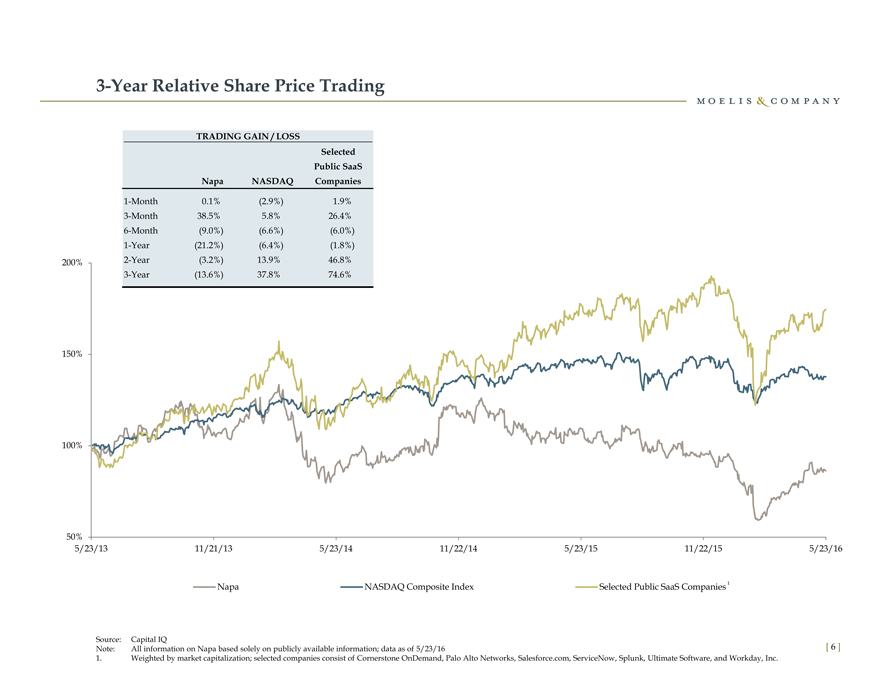
3-Year Relative Share Price Trading TRADING GAIN / LOSS Selected Public SaaS Napa NASDAQ Companies 1-Month 0.1% (2.9%) 1.9% 3-Month 38.5% 5.8% 26.4% 6-Month (9.0%) (6.6%) (6.0%) 1-Year (21.2%) (6.4%) (1.8%) 200% 2-Year (3.2%) 13.9% 46.8% 3-Year (13.6%) 37.8% 74.6% 150% 100% 50% 5/23/13 11/21/13 5/23/14 11/22/14 5/23/15 11/22/15 5/23/16 Napa NASDAQ Composite Index Selected Public SaaS Companies ¹ Source: Capital IQ Note: All information on Napa based solely on publicly available information; data as of 5/23/16 [ 6 ] 1. Weighted by market capitalization; selected companies consist of Cornerstone OnDemand, Palo Alto Networks, Salesforce.com, ServiceNow, Splunk, Ultimate Software, and Workday, Inc.
|

Summary of Selected Wall Street Research on Napa Revenue Estimate Broker Date Rating Target Methodology 2016E 2017E Pacific Crest Securities—KBCM 5/18/2016 Neutral n/a n/a $965.1 $1,223.5 Societe Generale Cross Asset Research 5/2/2016 Underweight $76.00 5.5x EV / CY 2017 Revenue 967.2 1,222.3 FBN Securities 5/2/2016 Buy 100.00 DCF 965.0 1,231.0 William Blair 4/29/2016 Buy n/a n/a 965.0 1,212.0 Piper Jaffray 4/29/2016 Neutral 81.00 5.2x EV / CY 2017 Revenue 965.1 1,223.9 Macquarie 4/29/2016 Neutral 76.00 DCF 966.2 1,228.3 JMP Securities 4/29/2016 Buy 100.00 6.3x EV / CY 2017 Revenue 970.0 1,268.1 Barclays 4/29/2016 Neutral 74.00 5.0x EV / CY 2017 Revenue 965.9 1,209.2 JP Morgan 4/29/2016 Buy 94.00 6.5x EV / CY 2017 Revenue 957.5 1,170.8 Deutsche Bank 4/29/2016 Buy 95.00 6.0x EV / CY 2017 Revenue 974.4 1,248.5 Credit Suisse 4/29/2016 Buy 90.00 5.6x EV / CY 2017 Revenue 972.7 1,281.4 Morgan Stanley 4/29/2016 Underweight 60.00 DCF 970.0 1,220.0 BTIG 4/29/2016 Neutral n/a DCF 964.6 1,220.0 Canaccord Genuity 4/29/2016 Buy 100.00 6.6x EV / CY 2017 Revenue 970.0 1,227.5 Mitsubishi UFJ Securities (USA) 4/29/2016 Buy 87.00 n/a 969.9 1,246.3 Mizuho Securities 4/29/2016 Neutral 70.00 n/a 959.8 1,195.2 MKM Partners LLC 4/29/2016 Buy 92.00 7.0x EV / Projected 4-quarter Billings 966.2 1,217.7 Raymond James 4/29/2016 Underweight n/a n/a 971.5 1,239.4 SunTrust 4/29/2016 Buy 93.00 Avg. of DCF and 7.0x EV / CY 2016 Revenue 965.3 1,242.0 RBC 4/28/2016 Buy 93.00 6.0x EV / CY 2017 Revenue 968.3 1,235.8 Benchmark Company 2/1/2016 Neutral 65.00 n/a 963.2 1,221.0 Needham & Company 1/29/2016 Neutral n/a n/a 955.3 n/a High Target $100.00 $974.4 $1,281.4 Median Target 90.00 966.1 1,223.9 Average Target 85.06 966.3 1,227.8 Low Target 60.00 955.3 1,170.8 Current Share Price (05/23/16) $77.49 Sources: Capital IQ, ThomsonOne and Wall Street Research [ 7 ] Note: “n/a” denotes information not available to Moelis
|

3-Year Relative EV / Forward Revenue Multiple Trading SUMMARY AVERAGE STATISTICS Selected Public SaaS Napa Companies 1-Month Avg. 6.1x 6.9x 3-Month Avg. 5.7x 6.8x 6-Month Avg. 6.0x 7.0x 1-Year Avg. 7.2x 7.8x 2-Year Avg. 8.9x 8.3x 3-Year Avg. 10.7x 8.9x 18.0x 15.0x 12.0x 9.0x 6.0x 3.0x 5/23/13 11/21/13 5/23/14 11/22/14 5/23/15 11/22/15 5/23/16 Napa Selected Public SaaS Companies ¹ Source: Capital IQ Note: All information on Napa based solely on publicly available information; data as of 5/23/16 [ 8 ] 1. Weighted by market capitalization; selected companies consist of Cornerstone OnDemand, Palo Alto Networks, Salesforce.com, ServiceNow, Splunk, Ultimate Software, and Workday, Inc.
|
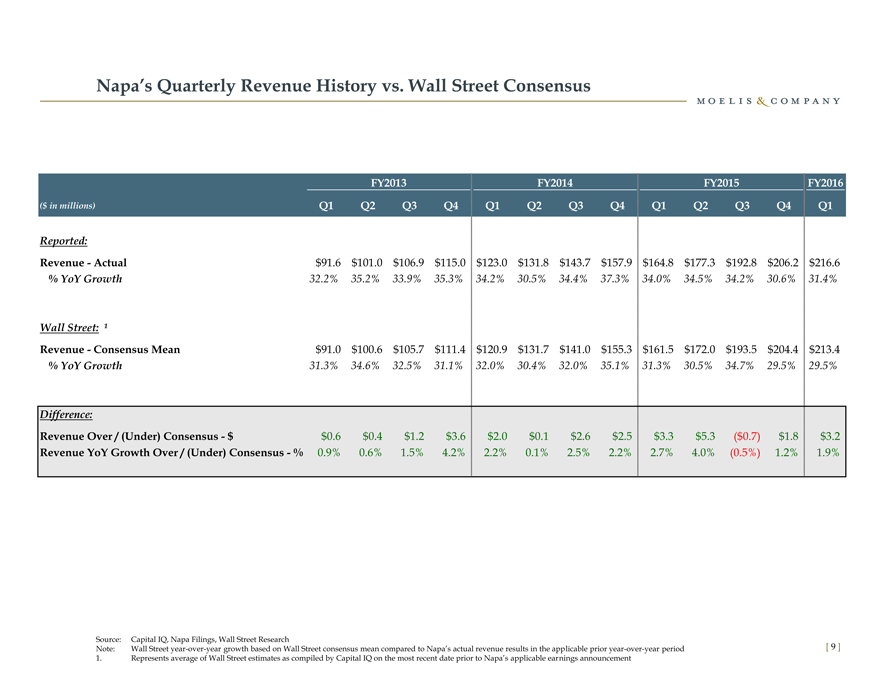
Napa’s Quarterly Revenue History vs. Wall Street Consensus FY2013 FY2014 FY2015 FY2016 ($ in millions) Q1 Q2 Q3 Q4 Q1 Q2 Q3 Q4 Q1 Q2 Q3 Q4 Q1 Reported: Revenue—Actual $91.6 $101.0 $106.9 $115.0 $123.0 $131.8 $143.7 $157.9 $164.8 $177.3 $192.8 $206.2 $216.6 % YoY Growth 32.2% 35.2% 33.9% 35.3% 34.2% 30.5% 34.4% 37.3% 34.0% 34.5% 34.2% 30.6% 31.4% Wall Street: ¹ Revenue—Consensus Mean $91.0 $100.6 $105.7 $111.4 $120.9 $131.7 $141.0 $155.3 $161.5 $172.0 $193.5 $204.4 $213.4 % YoY Growth 31.3% 34.6% 32.5% 31.1% 32.0% 30.4% 32.0% 35.1% 31.3% 30.5% 34.7% 29.5% 29.5% Difference: Revenue Over / (Under) Consensus—$ $0.6 $0.4 $1.2 $3.6 $2.0 $0.1 $2.6 $2.5 $3.3 $5.3 ($0.7) $1.8 $3.2 Revenue YoY Growth Over / (Under) Consensus—% 0.9% 0.6% 1.5% 4.2% 2.2% 0.1% 2.5% 2.2% 2.7% 4.0% (0.5%) 1.2% 1.9% Source: Capital IQ, Napa Filings, Wall Street Research Note: Wall Street year-over-year growth based on Wall Street consensus mean compared to Napa’s actual revenue results in the applicable prior year-over-year period [ 9 ] 1. Represents average of Wall Street estimates as compiled by Capital IQ on the most recent date prior to Napa’s applicable earnings announcement
|

II. Preliminary Napa Financial Analysis
|
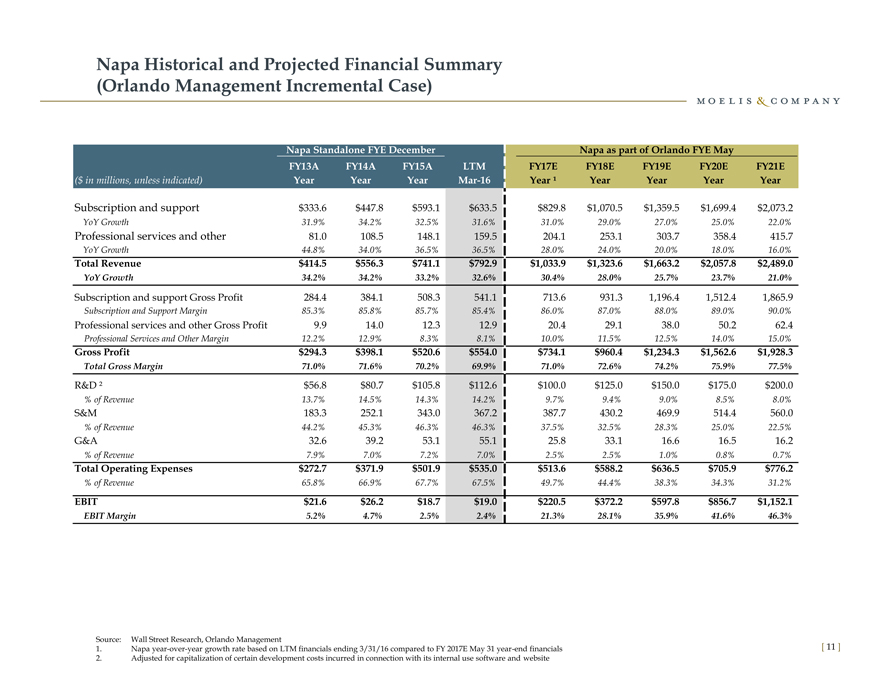
Napa Historical and Projected Financial Summary (Orlando Management Incremental Case) Napa Standalone FYE December Napa as part of Orlando FYE May FY13A FY14A FY15A LTM FY17E FY18E FY19E FY20E FY21E ($ in millions, unless indicated) Year Year Year Mar-16 Year ¹ Year Year Year Year Subscription and support $333.6 $447.8 $593.1 $633.5 $829.8 $1,070.5 $1,359.5 $1,699.4 $2,073.2 YoY Growth 31.9% 34.2% 32.5% 31.6% 31.0% 29.0% 27.0% 25.0% 22.0% Professional services and other 81.0 108.5 148.1 159.5 204.1 253.1 303.7 358.4 415.7 YoY Growth 44.8% 34.0% 36.5% 36.5% 28.0% 24.0% 20.0% 18.0% 16.0% Total Revenue $414.5 $556.3 $741.1 $792.9 $1,033.9 $1,323.6 $1,663.2 $2,057.8 $2,489.0 YoY Growth 34.2% 34.2% 33.2% 32.6% 30.4% 28.0% 25.7% 23.7% 21.0% Subscription and support Gross Profit 284.4 384.1 508.3 541.1 713.6 931.3 1,196.4 1,512.4 1,865.9 Subscription and Support Margin 85.3% 85.8% 85.7% 85.4% 86.0% 87.0% 88.0% 89.0% 90.0% Professional services and other Gross Profit 9.9 14.0 12.3 12.9 20.4 29.1 38.0 50.2 62.4 Professional Services and Other Margin 12.2% 12.9% 8.3% 8.1% 10.0% 11.5% 12.5% 14.0% 15.0% Gross Profit $294.3 $398.1 $520.6 $554.0 $734.1 $960.4 $1,234.3 $1,562.6 $1,928.3 Total Gross Margin 71.0% 71.6% 70.2% 69.9% 71.0% 72.6% 74.2% 75.9% 77.5% R&D ? $56.8 $80.7 $105.8 $112.6 $100.0 $125.0 $150.0 $175.0 $200.0 % of Revenue 13.7% 14.5% 14.3% 14.2% 9.7% 9.4% 9.0% 8.5% 8.0% S&M 183.3 252.1 343.0 367.2 387.7 430.2 469.9 514.4 560.0 % of Revenue 44.2% 45.3% 46.3% 46.3% 37.5% 32.5% 28.3% 25.0% 22.5% G&A 32.6 39.2 53.1 55.1 25.8 33.1 16.6 16.5 16.2 % of Revenue 7.9% 7.0% 7.2% 7.0% 2.5% 2.5% 1.0% 0.8% 0.7% Total Operating Expenses $272.7 $371.9 $501.9 $535.0 $513.6 $588.2 $636.5 $705.9 $776.2 % of Revenue 65.8% 66.9% 67.7% 67.5% 49.7% 44.4% 38.3% 34.3% 31.2% EBIT $21.6 $26.2 $18.7 $19.0 $220.5 $372.2 $597.8 $856.7 $1,152.1 EBIT Margin 5.2% 4.7% 2.5% 2.4% 21.3% 28.1% 35.9% 41.6% 46.3% Source: Wall Street Research, Orlando Management 1. Napa year-over-year growth rate based on LTM financials ending 3/31/16 compared to FY 2017E May 31 year-end financials [ 11 ] 2. Adjusted for capitalization of certain development costs incurred in connection with its internal use software and website
|
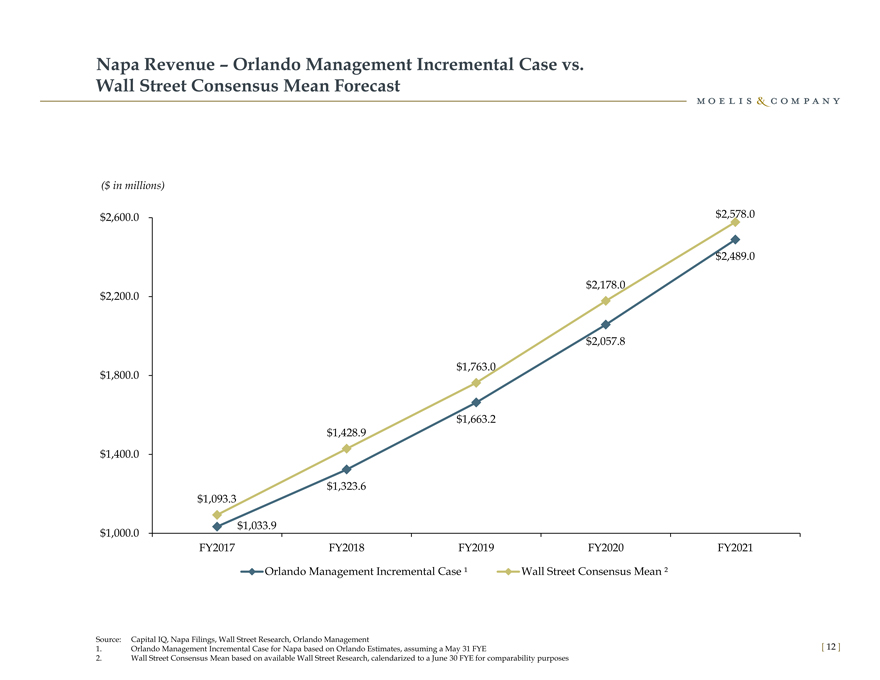
Napa Revenue – Orlando Management Incremental Case vs. Wall Street Consensus Mean Forecast ($ in millions) $2,600.0 $2,578.0 $2,489.0 $2,178.0 $2,200.0 $2,057.8 $1,763.0 $1,800.0 $1,663.2 $1,428.9 $1,400.0 $1,323.6 $1,093.3 $1,033.9 $1,000.0 FY2017 FY2018 FY2019 FY2020 FY2021 Orlando Management Incremental Case ¹ Wall Street Consensus Mean ² Source: Capital IQ, Napa Filings, Wall Street Research, Orlando Management 1. Orlando Management Incremental Case for Napa based on Orlando Estimates, assuming a May 31 FYE [ 12 ] 2. Wall Street Consensus Mean based on available Wall Street Research, calendarized to a June 30 FYE for comparability purposes
|
Orlando Management Incremental Forecast Assumptions and Considerations § Orlando Management Incremental Forecast for Napa Assumptions: 3/4 Model viewed as incremental to Orlando (i.e., under Orlando ownership) 3/4 Revenue growth based on assumed booking trends that are expected to remain inline and decline modestly relative to historical performance 3/4 Assumes a gross margin that approaches 90% in out years 3/4 Orlando combination with Napa creates significant OpEx savings due to increased scale and leverage as well as cost synergies 3/4 Assumes a 35% tax rate § Considerations: 3/4 Projection set lacks Orlando perspectives on the standalone business prospects for Napa 3/4 Does not include a longer-term financial projection set 3/4 No one-time costs have been incorporated to achieve assumed cost savings 3/4 Assumes no year-over-year change in working capital 3/4 Annual depreciation & amortization equals annual capital expenditures 3/4 Stock based compensation expense in projection period to be refined 3/4 Does not take into account the ability to utilize existing Napa NOLs 3/4 Projection set measured on a non-GAAP basis 3/4 Projections subject to change based on continued diligence Source: Orlando Management [ 13 ]
|
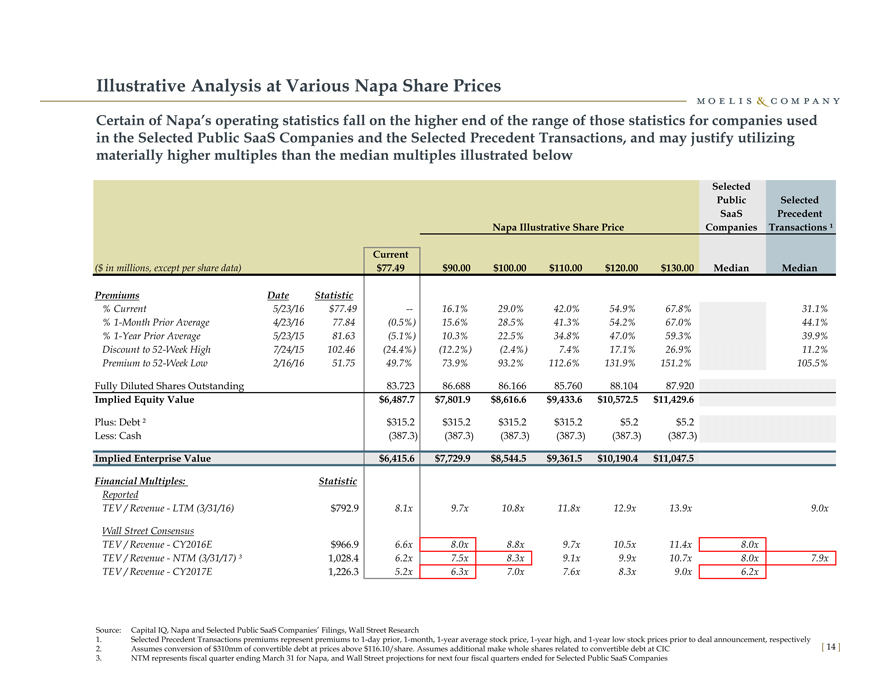
Illustrative Analysis at Various Napa Share Prices Certain of Napa’s operating statistics fall on the higher end of the range of those statistics for companies used in the Selected Public SaaS Companies and the Selected Precedent Transactions, and may justify utilizing materially higher multiples than the median multiples illustrated below Selected Public Selected SaaS Precedent Napa Illustrative Share Price Companies Transactions ¹ Current ($ in millions, except per share data) $77.49 $90.00 $100.00 $110.00 $120.00 $130.00 Median Median Premiums Date Statistic % Current 5/23/16 $77.49 — 16.1% 29.0% 42.0% 54.9% 67.8% 31.1% % 1-Month Prior Average 4/23/16 77.84 (0.5%) 15.6% 28.5% 41.3% 54.2% 67.0% 44.1% % 1-Year Prior Average 5/23/15 81.63 (5.1%) 10.3% 22.5% 34.8% 47.0% 59.3% 39.9% Discount to 52-Week High 7/24/15 102.46 (24.4%) (12.2%) (2.4%) 7.4% 17.1% 26.9% 11.2% Premium to 52-Week Low 2/16/16 51.75 49.7% 73.9% 93.2% 112.6% 131.9% 151.2% 105.5% Fully Diluted Shares Outstanding 83.723 86.688 86.166 85.760 88.104 87.920 Implied Equity Value $6,487.7 $7,801.9 $8,616.6 $9,433.6 $10,572.5 $11,429.6 Plus: Debt ? $315.2 $315.2 $315.2 $315.2 $5.2 $5.2 Less: Cash (387.3) (387.3) (387.3) (387.3) (387.3) (387.3) Implied Enterprise Value $6,415.6 $7,729.9 $8,544.5 $9,361.5 $10,190.4 $11,047.5 Financial Multiples: Statistic Reported TEV / Revenue—LTM (3/31/16) $792.9 8.1x 9.7x 10.8x 11.8x 12.9x 13.9x 9.0x Wall Street Consensus TEV / Revenue—CY2016E $966.9 6.6x 8.0x 8.8x 9.7x 10.5x 11.4x 8.0x TEV / Revenue—NTM (3/31/17) ³ 1,028.4 6.2x 7.5x 8.3x 9.1x 9.9x 10.7x 8.0x 7.9x TEV / Revenue—CY2017E 1,226.3 5.2x 6.3x 7.0x 7.6x 8.3x 9.0x 6.2x Source: Capital IQ, Napa and Selected Public SaaS Companies’ Filings, Wall Street Research 1. Selected Precedent Transactions premiums represent premiums to 1-day prior, 1-month, 1-year average stock price, 1-year high, and 1-year low stock prices prior to deal announcement, respectively 2. Assumes conversion of $310mm of convertible debt at prices above $116.10/share. Assumes additional make whole shares related to convertible debt at CIC [ 14 ] 3. NTM represents fiscal quarter ending March 31 for Napa, and Wall Street projections for next four fiscal quarters ended for Selected Public SaaS Companies
|
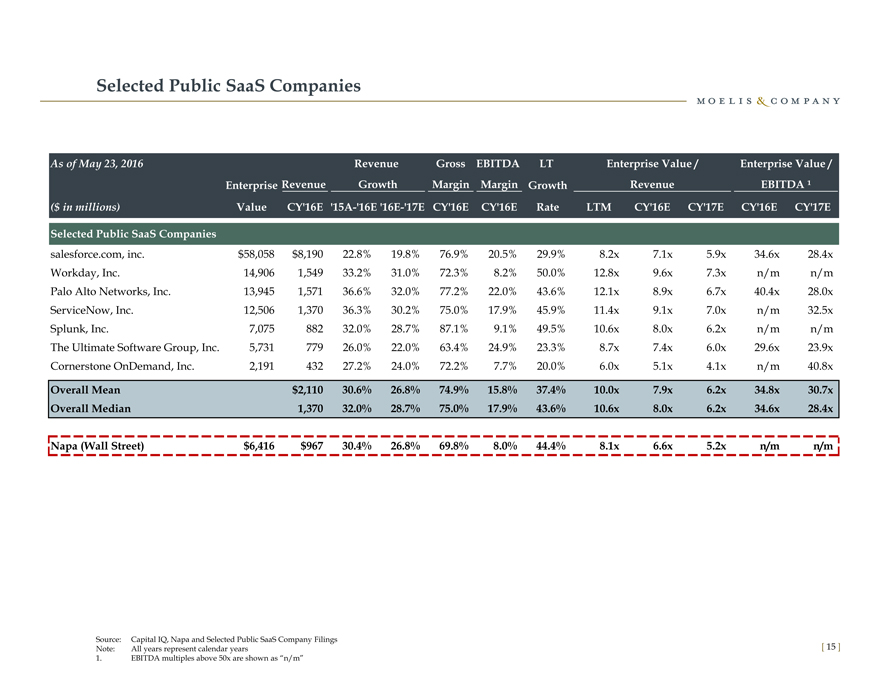
Selected Public SaaS Companies As of May 23, 2016 Revenue Gross EBITDA LT Enterprise Value / Enterprise Value / Enterprise Revenue Growth Margin Margin Growth Revenue EBITDA ¹ ($ in millions) Value CY’16E ‘15A-‘16E ‘16E-‘17E CY’16E CY’16E Rate LTM CY’16E CY’17E CY’16E CY’17E Selected Public SaaS Companies salesforce.com, inc. $58,058 $8,190 22.8% 19.8% 76.9% 20.5% 29.9% 8.2x 7.1x 5.9x 34.6x 28.4x Workday, Inc. 14,906 1,549 33.2% 31.0% 72.3% 8.2% 50.0% 12.8x 9.6x 7.3x n/m n/m Palo Alto Networks, Inc. 13,945 1,571 36.6% 32.0% 77.2% 22.0% 43.6% 12.1x 8.9x 6.7x 40.4x 28.0x ServiceNow, Inc. 12,506 1,370 36.3% 30.2% 75.0% 17.9% 45.9% 11.4x 9.1x 7.0x n/m 32.5x Splunk, Inc. 7,075 882 32.0% 28.7% 87.1% 9.1% 49.5% 10.6x 8.0x 6.2x n/m n/m The Ultimate Software Group, Inc. 5,731 779 26.0% 22.0% 63.4% 24.9% 23.3% 8.7x 7.4x 6.0x 29.6x 23.9x Cornerstone OnDemand, Inc. 2,191 432 27.2% 24.0% 72.2% 7.7% 20.0% 6.0x 5.1x 4.1x n/m 40.8x Overall Mean $2,110 30.6% 26.8% 74.9% 15.8% 37.4% 10.0x 7.9x 6.2x 34.8x 30.7x Overall Median 1,370 32.0% 28.7% 75.0% 17.9% 43.6% 10.6x 8.0x 6.2x 34.6x 28.4x Napa (Wall Street) $6,416 $967 30.4% 26.8% 69.8% 8.0% 44.4% 8.1x 6.6x 5.2x n/m n/m Source: Capital IQ, Napa and Selected Public SaaS Company Filings Note: All years represent calendar years [ 15 ] 1. EBITDA multiples above 50x are shown as “n/m”
|
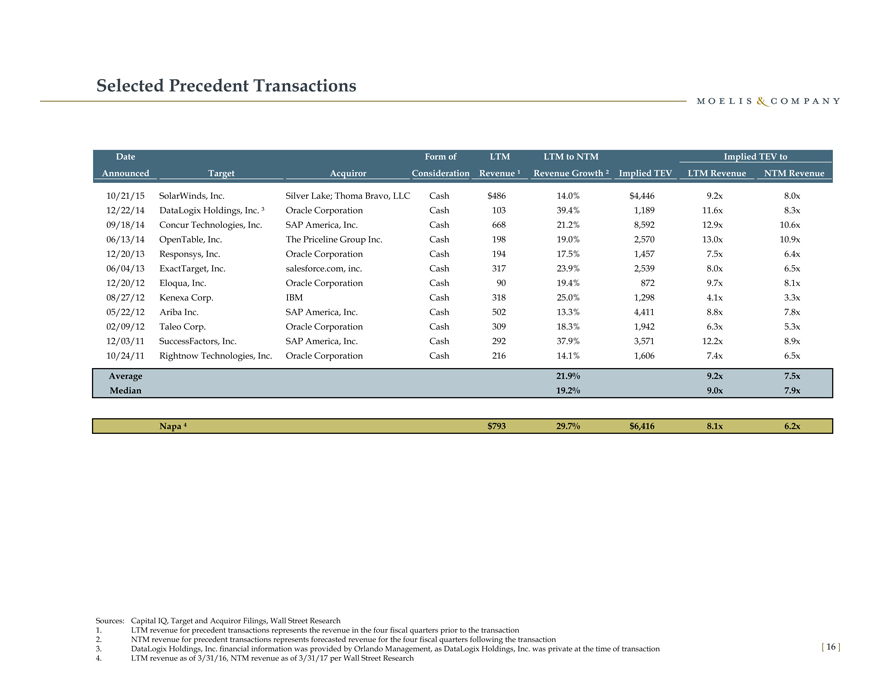
Selected Precedent Transactions Date Form of LTM LTM to NTM Implied TEV to Announced Target Acquiror Consideration Revenue ¹ Revenue Growth ² Implied TEV LTM Revenue NTM Revenue 10/21/15 SolarWinds, Inc. Silver Lake; Thoma Bravo, LLC Cash $486 14.0% $4,446 9.2x 8.0x 12/22/14 DataLogix Holdings, Inc. ³ Oracle Corporation Cash 103 39.4% 1,189 11.6x 8.3x 09/18/14 Concur Technologies, Inc. SAP America, Inc. Cash 668 21.2% 8,592 12.9x 10.6x 06/13/14 OpenTable, Inc. The Priceline Group Inc. Cash 198 19.0% 2,570 13.0x 10.9x 12/20/13 Responsys, Inc. Oracle Corporation Cash 194 17.5% 1,457 7.5x 6.4x 06/04/13 ExactTarget, Inc. salesforce.com, inc. Cash 317 23.9% 2,539 8.0x 6.5x 12/20/12 Eloqua, Inc. Oracle Corporation Cash 90 19.4% 872 9.7x 8.1x 08/27/12 Kenexa Corp. IBM Cash 318 25.0% 1,298 4.1x 3.3x 05/22/12 Ariba Inc. SAP America, Inc. Cash 502 13.3% 4,411 8.8x 7.8x 02/09/12 Taleo Corp. Oracle Corporation Cash 309 18.3% 1,942 6.3x 5.3x 12/03/11 SuccessFactors, Inc. SAP America, Inc. Cash 292 37.9% 3,571 12.2x 8.9x 10/24/11 Rightnow Technologies, Inc. Oracle Corporation Cash 216 14.1% 1,606 7.4x 6.5x Average 21.9% 9.2x 7.5x Median 19.2% 9.0x 7.9x $793 29.7% $6,416 8.1x 6.2x Sources: Capital IQ, Target and Acquiror Filings, Wall Street Research 1. LTM revenue for precedent transactions represents the revenue in the four fiscal quarters prior to the transaction 2. NTM revenue for precedent transactions represents forecasted revenue for the four fiscal quarters following the transaction 3. DataLogix Holdings, Inc. financial information was provided by Orlando Management, as DataLogix Holdings, Inc. was private at the time of transaction [ 16 ] 4. LTM revenue as of 3/31/16, NTM revenue as of 3/31/17 per Wall Street Research
|
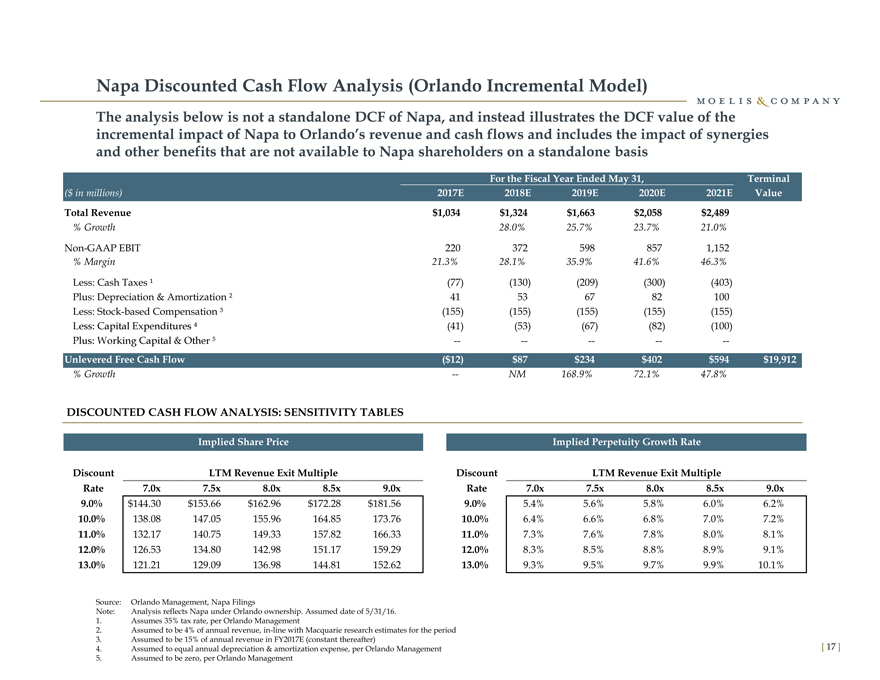
Napa Discounted Cash Flow Analysis (Orlando Incremental Model) The analysis below is not a standalone DCF of Napa, and instead illustrates the DCF value of the incremental impact of Napa to Orlando’s revenue and cash flows and includes the impact of synergies and other benefits that are not available to Napa shareholders on a standalone basis For the Fiscal Year Ended May 31, Terminal ($ in millions) 2017E 2018E 2019E 2020E 2021E Value Total Revenue $1,034 $1,324 $1,663 $2,058 $2,489 % Growth 28.0% 25.7% 23.7% 21.0% Non-GAAP EBIT 220 372 598 857 1,152 % Margin 21.3% 28.1% 35.9% 41.6% 46.3% Less: Cash Taxes ¹ (77) (130) (209) (300) (403) Plus: Depreciation & Amortization ² 41 53 67 82 100 Less: Stock-based Compensation ³ (155) (155) (155) (155) (155) (41) (53) (67) (82) (100) -————- Unlevered Free Cash Flow ($12) $87 $234 $402 $594 $19,912 % Growth — NM 168.9% 72.1% 47.8% DISCOUNTED CASH FLOW ANALYSIS: SENSITIVITY TABLES Implied Share Price Implied Perpetuity Growth Rate Discount LTM Revenue Exit Multiple Discount LTM Revenue Exit Multiple Rate 7.0x 7.5x 8.0x 8.5x 9.0x Rate 7.0x 7.5x 8.0x 8.5x 9.0x 9.0% $144.30 $153.66 $162.96 $172.28 $181.56 9.0% 5.4% 5.6% 5.8% 6.0% 6.2% 10.0% 138.08 147.05 155.96 164.85 173.76 10.0% 6.4% 6.6% 6.8% 7.0% 7.2% 11.0% 132.17 140.75 149.33 157.82 166.33 11.0% 7.3% 7.6% 7.8% 8.0% 8.1% 12.0% 126.53 134.80 142.98 151.17 159.29 12.0% 8.3% 8.5% 8.8% 8.9% 9.1% 13.0% 121.21 129.09 136.98 144.81 152.62 13.0% 9.3% 9.5% 9.7% 9.9% 10.1% Source: Orlando Management, Napa Filings Note: Analysis reflects Napa under Orlando ownership. Assumed date of 5/31/16. sumes 35% tax rate, per Orlando Management sumed to be 4% of annual revenue, in-line with Macquarie research estimates for the period d to be 15% of annual revenue in FY2017E (constant thereafter) 4. Assumed to equal annual depreciation & amortization expense, per Orlando Management [ 17 ] 5. Assumed to be zero, per Orlando Management
|

II. Next Steps & Additional Considerations
|
Next Steps & Additional Considerations Moelis believes Orlando should engage in exploratory next steps with Napa and that several alternatives exist to approach Napa § Initial bid value / form of consideration § The Committee has a number of approach alternatives to Napa including the form and channel of communication § Potential channels of communication 3/4 Financial Advisor (Moelis) to Financial Advisor (Qatalyst) 3/4 Committee Member to Committee Member 3/4 Orlando Management to Napa Management or Financial Advisor (Qatalyst) § Potential form of communication 3/4 Verbal communication of interest 3/4 Written offer and appropriate level of detail Moelis believes that any non-binding indication of interest should include the price and terms under which Orlando would evaluate a potential transaction [ 19 ]
|

Appendix
|
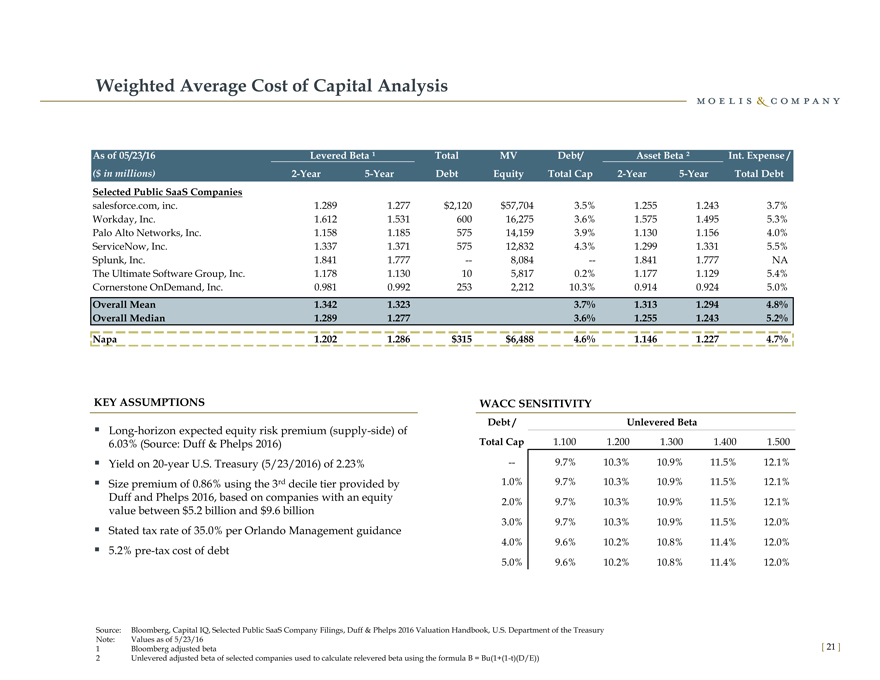
Weighted Average Cost of Capital Analysis As of 05/23/16 Levered Beta ¹ Total MV Debt/ Asset Beta ² Int. Expense / ($ in millions) 2-Year 5-Year Debt Equity Total Cap 2-Year 5-Year Total Debt Selected Public SaaS Companies salesforce.com, inc. 1.289 1.277 $2,120 $57,704 3.5% 1.255 1.243 3.7% Workday, Inc. 1.612 1.531 600 16,275 3.6% 1.575 1.495 5.3% Palo Alto Networks, Inc. 1.158 1.185 575 14,159 3.9% 1.130 1.156 4.0% ServiceNow, Inc. 1.337 1.371 575 12,832 4.3% 1.299 1.331 5.5% Splunk, Inc. 1.841 1.777 — 8,084 — 1.841 1.777 NA The Ultimate Software Group, Inc. 1.178 1.130 10 5,817 0.2% 1.177 1.129 5.4% Cornerstone OnDemand, Inc. 0.981 0.992 253 2,212 10.3% 0.914 0.924 5.0% Overall Mean 1.342 1.323 3.7% 1.313 1.294 4.8% Overall Median 1.289 1.277 3.6% 1.255 1.243 5.2% Napa 1.202 1.286 $315 $6,488 4.6% 1.146 1.227 4.7% KEY ASSUMPTIONS WACC SENSITIVITY Debt / Unlevered Beta § Long-horizon expected equity risk premium (supply-side) of 6.03% (Source: Duff & Phelps 2016) Total Cap 1.100 1.200 1.300 1.400 1.500§ Yield on 20-year U.S. Treasury (5/23/2016) of 2.23% — 9.7% 10.3% 10.9% 11.5% 12.1%§ Size premium of 0.86% using the 3rd decile tier provided by 1.0% 9.7% 10.3% 10.9% 11.5% 12.1% Duff and Phelps 2016, based on companies with an equity 2.0% 9.7% 10.3% 10.9% 11.5% 12.1% value between $5.2 billion and $9.6 billion 3.0% 9.7% 10.3% 10.9% 11.5% 12.0% § Stated tax rate of 35.0% per Orlando Management guidance 4.0% 9.6% 10.2% 10.8% 11.4% 12.0% § 5.2% pre-tax cost of debt 5.0% 9.6% 10.2% 10.8% 11.4% 12.0% Source: Bloomberg, Capital IQ, Selected Public SaaS Company Filings, Duff & Phelps 2016 Valuation Handbook, U.S. Department of the Treasury Note: Values as of 5/23/16 1 Bloomberg adjusted beta [ 21 ] 2 Unlevered adjusted beta of selected companies used to calculate relevered beta using the formula B = Bu(1+(1-t)(D/E))
|
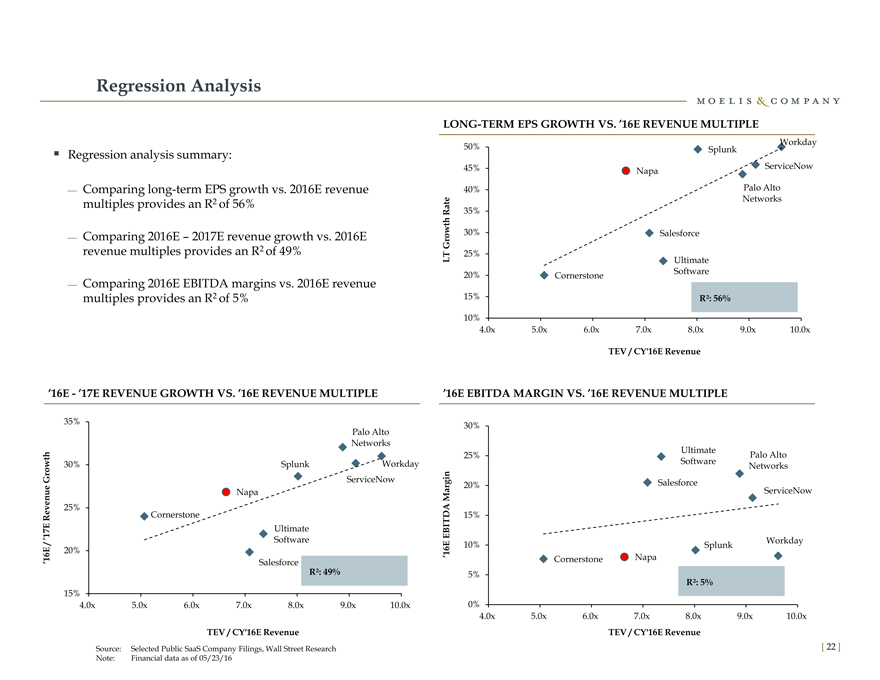
Regression Analysis LONG-TERM EPS GROWTH VS. ’16E REVENUE MULTIPLE Workday 50% Splunk § Regression analysis summary: 45% ServiceNow Napa 3/4 Comparing long-term EPS growth vs. 2016E revenue 40% Palo Alto multiples provides an R2 of 56% Networks 35% 30% Salesforce 3/4 Comparing 2016E – 2017E revenue growth vs. 2016E Growth Rate revenue multiples provides an R2 of 49% LT 25% Ultimate 20% Software Cornerstone 3/4 Comparing 2016E EBITDA margins vs. 2016E revenue multiples provides an R2 of 5% 15% R²: 56% 10% 4.0x 5.0x 6.0x 7.0x 8.0x 9.0x 10.0x TEV / CY’16E Revenue ’16E—’17E REVENUE GROWTH VS. ’16E REVENUE MULTIPLE ’16E EBITDA MARGIN VS. ’16E REVENUE MULTIPLE 35% 30% Palo Alto Networks 25% Ultimate Palo Alto 30% Splunk Workday Software Networks Growth ServiceNow 20% Salesforce ServiceNow Napa 25% Cornerstone 15% Ultimate Software Workday 10% Splunk 20% ’16E EBITDA Margin ’16E / ’17E Revenue Cornerstone Napa Salesforce R²: 49% 5% R²: 5% 15% 4.0x 5.0x 6.0x 7.0x 8.0x 9.0x 10.0x 0% 4.0x 5.0x 6.0x 7.0x 8.0x 9.0x 10.0x TEV / CY’16E Revenue TEV / CY’16E Revenue Source: Selected Public SaaS Company Filings, Wall Street Research [ 22 ] Note: Financial data as of 05/23/16
|
Contact Information Moelis & Company LLC is a U.S.-registered broker dealer and a member of FINRA & SIPC. Moelis & Company LLC 1999 Avenue of the Stars, Suite 1900 Los Angeles, CA 90067 Tel: (310) 443-2300 399 Park Avenue, 5th Floor New York, NY 10022 Tel: (212) 883-3800 [ 23 ]