UNITED STATES
SECURITIES AND EXCHANGE COMMISSION
Washington, D.C. 20549
FORM N-CSR
CERTIFIED SHAREHOLDER REPORT OF REGISTERED MANAGEMENT
INVESTMENT COMPANIES
Investment Company Act file number 811-021979
Nuveen Investment Trust V
(Exact name of registrant as specified in charter)
Nuveen Investments
333 West Wacker Drive Chicago, IL 60606
(Address of principal executive offices) (Zip code)
Kevin J. McCarthy
Nuveen Investments
333 West Wacker Drive Chicago, IL 60606
(Name and address of agent for service)
Registrant’s telephone number, including area code: (312) 917-7700
Date of fiscal year end: December 31
Date of reporting period: June 30, 2008
Form N-CSR is to be used by management investment companies to file reports with the Commission not later than 10 days after the transmission to stockholders of any report that is required to be transmitted to stockholders under Rule 30e-1 under the Investment Company Act of 1940 (17 CFR 270.30e-1). The Commission may use the information provided on Form N-CSR in its regulatory, disclosure review, inspection, and policy making roles.
A registrant is required to disclose the information specified by Form N-CSR, and the Commission will make this information public. A registrant is not required to respond to the collection of information contained in Form N-CSR unless the Form displays a currently valid Office of Management and Budget (“OMB”) control number. Please direct comments concerning the accuracy of the information collection burden estimate and any suggestions for reducing the burden to Secretary, Securities and Exchange Commission, 450 Fifth Street, NW, Washington, DC 20549-0609. The OMB has reviewed this collection of information under the clearance requirements of 44 U.S.C. ss.3507.
Item 1. Reports to Stockholders.
NUVEEN INVESTMENTS MUTUAL FUNDS
| | |
| | |
Semi-Annual Report June 30, 2008 | | For investors seeking a high level of current income and total return. |

Nuveen Investments
Taxable Fixed Income Funds
Nuveen Preferred Securities Fund


NOW YOU CAN RECEIVE YOUR
NUVEEN INVESTMENTS FUND REPORTS FASTER.
NO MORE WAITING.
SIGN UP TODAY TO RECEIVE NUVEEN INVESTMENTS FUND INFORMATION BY E-MAIL.
It only takes a minute to sign up for E-Reports. Once enrolled, you’ll receive an e-mail as soon as your Nuveen Investments Fund information is ready — no more waiting for delivery by regular mail. Just click on the link within the e-mail to see the report, and save it on your computer if your wish.

IT’S FAST, EASY & FREE:
www.investordelivery.com
if you get your Nuveen Investments Fund dividends and statements from your financial advisor or brokerage account.
(Be sure to have the address sheet that accompanied this report handy. You’ll need it to complete the enrollment process.)
OR
www.nuveen.com/accountaccess
if you get your Nuveen Investments Fund dividends and statements directly from Nuveen Investments.

| | | | | | |
| Must be preceded by or accompanied by a prospectus. | | NOT FDIC INSURED | | MAY LOSE VALUE | | NO BANK GUARANTEE |
Dear Fellow Shareholders,
I’d like to use my initial letter to you to accomplish several things. First, I want to report that after fourteen years of service on your Fund’s Board, including the last twelve as chairman, Tim Schwertfeger retired from the Board in June. The Board has elected me to replace him as the chairman, the first time this role has been filled by someone who is not an employee of Nuveen Investments. Electing an independent chairman marks a significant milestone in the management of your Fund, and it aligns us with what is now considered a “best practice” in the fund industry. Further, it demonstrates the independence with which your Board has always acted on your behalf.
Following Tim will not be easy. During my eleven previous years on the Nuveen Fund Board, I found that Tim always set a very high standard by combining insightful industry and market knowledge and sound, clear judgment. While the Board will miss his wise counsel, I am certain we will retain the primary commitment Tim shared with all of us – an unceasing dedication to creating and retaining value for Nuveen Fund shareholders. This focus on value over time is a touchstone that I and all the other Board members will continue to use when making decisions on your behalf.
Second, I also want to report that we are very fortunate to be welcoming two new Board members to our team. John Amboian, the current chairman and CEO of Nuveen Investments, has agreed to replace Tim as Nuveen’s representative on the Board. John’s presence will allow the independent Board members to benefit not only from his leadership role at Nuveen but also his broad understanding of the fund industry and Nuveen’s role within it. We also are adding Terry Toth as an independent director. A former CEO of the Northern Trust Company’s asset management group, Terry will bring extensive experience in the fund industry to our deliberations.
Finally, I urge you to take the time to review the Portfolio Managers’ Comments and Fund Spotlight sections of this report. All of us are grateful that you have chosen Nuveen Investments as a partner as you pursue your financial goals, and, on behalf of myself and the other members of your Fund’s Board, let me say we look forward to continuing to earn your trust in the months and years ahead.
Sincerely,

Robert P. Bremner
Chairman of the Board
August 22, 2008

Robert P. Bremner
Chairman of the Board
Semi-Annual Report l Page 1
Portfolio Managers’ Comments
Portfolio managers John Miller, CFA, Douglas Baker, CFA and Daniel Close, CFA examine the investment philosophy and how it was applied to the Nuveen Preferred Securities Fund. John, who has 15 years of investment experience, has managed the Nuveen Preferred Securities Fund since its inception. Doug and Dan, with 10 years and 9 years of investment experience respectively, have been assistant portfolio managers of the Fund since inception and were named co-portfolio managers shortly after the beginning of the reporting period on January 8, 2008.
How did the Fund perform during the six months ended June 30, 2008?
During the reporting period the Nuveen Preferred Securities Fund (Class A shares at net asset value) outperformed the Market Benchmark Index, while slightly underperforming the Merrill Lynch Preferred Hybrid Securities Index. The primary driver of performance was an underweight to the broker/dealer sector, and an active overweight to the utilities and insurance sectors. In addition, the Fund participated in a number of new issue hybrid and preferred deals. These new issue securities typically featured higher coupons versus existing securities trading in the secondary market. As a result, the new issue securities tended to benefit from a relatively shorter spread duration profile.
What strategies were used to manage the Fund during the reporting period?
Throughout the first half of the year, the Fund purchased a number of securities which offered favorable tax treatment, such as, securities eligible for qualified dividend income (QDI) taxation at 15% or the dividend received deduction (DRD). As new issue market supply continued to weigh on the market, the Fund was able to purchase this tax advantaged paper at negligible concessions to fully taxable structures. At the beginning of the year, the Fund held 26% in QDI paper and 11% in DRD eligible paper. By the end of the second quarter, the Fund had increased its holdings to 41% QDI paper and 23% DRD eligible paper.
Performance of the Fund was helped by its ability to invest up to 20% of its gross assets in securities other than preferred and hybrid issues. Beginning in February 2008, the municipal auction rate security market experienced an unprecedented number of failed auctions. Many of these failed auctions had coupons that reset to punitive maximum rates, sometimes as high as 18%. Leveraging our expertise in the municipal market, the Fund purchased a number of highly-rated municipal auction rate securities at these high reset rates. While these opportunities abated by late May 2008, participation in the municipal auction rate market did help the Fund outperform the benchmark index during the first half of the year.
Late in the second quarter, the Fund sold its exposure in the monoline insurer Security Capital Assurance (SCA). Unfortunately, the price decline of this particular security resulted in a material loss to the Fund. SCA’s exposure to sub-prime mortgage-related collateralized debt obligations (CDOs) was greater than Wall Street analysts’ expectations, major credit rating agencies’ expectations, and Nuveen’s structured finance analyst’s expectations. Exacerbating SCA’s predicament was the company’s rapid deterioration in credit rating, from A2 at the beginning of 2008, down to Ba2 by mid-March 2008, and finally down to Ca near the end of the reporting period.
Discussions of specific investments are for illustration only and are not intended as recommendations of individual investments. The views expressed herein represent those of the portfolio managers as of the date of this report and are subject to change at any time, based on market conditions and other factors. The Funds disclaim any obligation to advise shareholders of such changes.
Semi-Annual Report Page 2
Class A Shares—
Average Annual Total Returns as of 6/30/08
| | | | | | |
| | | Cumulative 6-Month | | 1-Year | | Since
Inception
(12/19/06) |
Nuveen Preferred Securities Fund A Shares at NAV
A Shares at Offer | | -1.08%
-5.79% | | -10.45%
-14.71% | | -7.35%
-10.25% |
Merrill Lynch Preferred Hybrid Securities Index1 | | -1.04% | | -13.74% | | -9.32% |
Market Benchmark Index2 | | -1.37% | | -9.79% | | -6.56% |
Returns quoted represent past performance, which is no guarantee of future results. Returns at NAV would be lower if the sales charge were included. Returns less than one year are cumulative. Current performance may be higher or lower than the performance shown. Investment returns and principal value will fluctuate so that when shares are redeemed, they may be worth more or less than their original cost. Class A shares have a 4.75% maximum sales charge. Returns do not reflect the deduction of taxes that a shareholder would pay on Fund distributions or the redemption of shares. Returns may reflect a voluntary expense limitation by the Funds’ investment adviser that may be modified or discontinued at any time without notice. For the most recent month-end performance, visit www.nuveen.com or call (800) 257-8787.
Please see the Fund’s Spotlight Page later in this report for more complete performance data and expense ratios.
| 1 | The Merrill Lynch Preferred Hybrid Securities Index is an unmanaged index consisting of a set of investment grade exchange-traded preferred stocks with outstanding market values of at least $50 million that are covered by Merrill Lynch Fixed Income Research. The since inception data for the index represents returns for the period 12/31/06-6/30/08, as returns for the index are calculated on a calendar month basis. The returns assume reinvestment of dividends and do not reflect any applicable sales charges. You cannot invest directly in an index. |
| 2 | The Market Benchmark Index is comprised of a 60% weighting in the Merrill Lynch Preferred Hybrid Securities Index, a 35% weighting in the Lehman Brothers USD Capital Securities Index and a 5% weighting in the Merrill Lynch REIT Preferred Stock Index. The Merrill Lynch Preferred Hybrid Securities Index is an unmanaged index consisting of a set of investment grade exchange-traded preferred stocks with outstanding market values of at least $50 million that are covered by Merrill Lynch Fixed Income Research. The Lehman Brothers USD Capital Securities Index contains securities generally viewed as hybrid fixed-income securities that either receive regulatory capital treatment or a degree of “equity credit” from the rating agencies. This generally includes Tier 2/Lower Tier 2 bonds, perpetual step-up debt, step-up preferred securities, and term preferred securities. The Merrill Lynch REIT Preferred Stock Index is an unmanaged index of investment grade REIT preferred shares with a deal size in excess of $100 million, weighted by capitalization and considered representative of investment grade preferred real estate stock performance. The since inception data for the index represents returns for the period 12/31/06-6/30/08, as returns for the index are calculated on a calendar month basis. The returns assume reinvestment of dividends and do not reflect any applicable sales charges. You cannot invest directly in an index. |
Semi-Annual Report Page 3
Fund Spotlight as of 6/30/08 Nuveen Preferred Securities Fund
| | | | | | |
| Quick Facts | | | | | | |
| | | A Shares | | C Shares | | I Shares1 |
Fund Symbols | | NPSAX | | NPSCX | | NPSRX |
NAV | | $16.19 | | $16.17 | | $16.19 |
Latest Monthly Dividend2 | | $0.1050 | | $0.0945 | | $0.1090 |
Inception Date | | 12/19/06 | | 12/19/06 | | 12/19/06 |
Returns quoted represent past performance which is no guarantee of future results. Returns without sales charges would be lower if the sales charge were included. Current performance may be higher or lower than the performance shown. Investment returns and principal value will fluctuate so that when shares are redeemed, they may be worth more or less than their original cost. Returns do not reflect the deduction of taxes that a shareholder would pay on Fund distributions or the redemption of shares. For the most recent month-end performance visit www.nuveen.com or call (800) 257-8787.
Fund returns assume reinvestment of dividends and capital gains. Class A shares have a 4.75% maximum sales charge. Class C shares have a 1% CDSC for redemptions within less than one year, which is not reflected in the one-year total return. Class I shares have no sales charge and may be purchased under limited circumstances or by specified classes of investors.
| | | | |
| Average Annual Total Returns as of 6/30/08 |
| | |
| A Shares | | NAV | | Offer |
1-Year | | -10.45% | | -14.71% |
Since Inception | | -7.35% | | -10.25% |
| | |
| C Shares | | NAV | | |
1-Year | | -11.15% | | |
Since Inception | | -8.07% | | |
| | |
| I Shares | | NAV | | |
1-Year | | -10.26% | | |
Since Inception | | -7.13% | | |
| Yields |
| | |
| A Shares | | NAV | | Offer |
Dividend yield4 | | 7.78% | | 7.41% |
30-day yield4 | | 7.89% | | — |
SEC 30-day yield4,5 | | — | | 7.51% |
| | |
| C Shares | | NAV | | |
Dividend yield4 | | 7.01% | | |
30-day yield4 | | 7.11% | | |
| | |
| I Shares | | NAV | | |
Dividend yield4 | | 8.08% | | |
SEC 30-day yield4 | | 8.16% | | |
| | |
| Top Five Issuers3: |
Federal National Mortgage Association | | 3.9% |
Bank of America Corporation | | 3.6% |
Citigroup Inc. | | 3.5% |
Wells Fargo Capital Trust | | 3.2% |
Constellation Energy Group | | 3.1% |
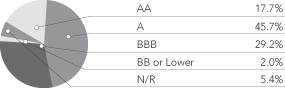
Portfolio Credit Quality3
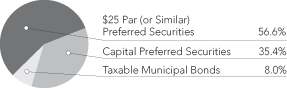
Portfolio Allocation3
| | |
| Portfolio Statistics |
Net Assets ($000) | | $47,067 |
Average Effective Maturity (Years) | | 45.27 |
Average Duration | | 5.34 |
Number of Positions/Holdings | | 90 |
| | | |
| | | | | | |
| Expense Ratios | | | | | | |
| Share Class | | Gross
Expense
Ratios | | Net
Expense
Ratios | | As of
Date |
Class A | | 2.50% | | 0.87% | | 5/01/08 |
Class C | | 3.29% | | 1.62% | | 5/01/08 |
Class I | | 1.80% | | 0.62% | | 5/01/08 |
The expense ratios shown factor in Total Annual Fund Operating Expenses including management fees and other fees and expenses. The Net Expense Ratios were restated to reflect current expense reimbursements as if such expense reimbursements had been in effect during the previous fiscal year, and to better reflect the expected ratios of the Fund for the current fiscal year. The Net Expense Ratios reflect a contractual commitment by the Fund’s investment adviser to waive fees and reimburse expenses through April 30, 2010. The Net Expense Ratios also reflect a custodian fee credit whereby certain fees and expenses are reduced by credits earned on the Fund’s cash on deposit with the bank. There is no guarantee that the Fund will earn such credits in the future. Absent the waiver, reimbursement and custodian fee credit, the Net Expense Ratios would be higher and total returns would be less. These expense ratios may vary from the expense ratios shown elsewhere in the report.
| 1 | Effective May 1, 2008, Class R Shares will be renamed Class I Shares. See the Fund’s prospectus for more information. |
| 3 | As a percentage of total investments, excluding derivative transactions, as of June 30, 2008. Holdings are subject to change. |
| 4 | Dividend yield is the most recent dividend per share (annualized) divided by the appropriate price per share. The SEC 30-Day Yield is computed under an SEC standardized formula and is based on the maximum offer price per share. The 30-Day Yield is computed under the same formula but is based on the Net Asset Value (NAV) per share. The Dividend yield may differ from the SEC 30-Day yield because the Fund may be paying out more or less than it is earning and it may not include the effect of amortization of bond premium. |
| 5 | The SEC 30-Day Yield on A Shares at NAV applies only to A Shares purchased at no-load pursuant to the Fund’s policy permitting waiver of the A Share load in certain specified circumstances. |
Semi-Annual Report Page 4
Fund Spotlight as of 6/30/08 Nuveen Preferred Securities Fund
Industries1
| | |
Commercial Banks | | 31.8% |
Insurance | | 22.5% |
Capital Markets | | 8.5% |
Diversified Financial Services | | 8.1% |
Municipal | | 8.0% |
U.S. Agency | | 7.0% |
Other | | 14.1% |
| 1 | As a percentage of total investments, excluding derivative transactions, as of June 30, 2008. Holdings are subject to change. |
Expense Example
As a shareholder of the Fund, you incur two types of costs: (1) transaction costs, including front and back end sales charges (loads) or redemption fees, where applicable; and (2) ongoing costs, including management fees; distribution and service (12b-1) fees, where applicable; and other Fund expenses. This Example is intended to help you understand your ongoing costs (in dollars) of investing in the Fund and to compare these costs with the ongoing costs of investing in other mutual funds.
The Example below is based on an investment of $1,000 invested at the beginning of the period and held for the period.
The information under “Actual Performance,” together with the amount you invested, allows you to estimate actual expenses incurred over the reporting period. Simply divide your account value by $1,000 (for example, an $8,600 account value divided by $1,000 = 8.60) and multiply the result by the cost shown for your share class, in the row entitled “Expenses Incurred During Period” to estimate the expenses incurred on your account during this period.
The information under “Hypothetical Performance,” provides information about hypothetical account values and hypothetical expenses based on the Fund’s actual expense ratio and an assumed rate of return of 5% per year before expenses, which is not the Fund’s actual return. The hypothetical account values and expenses may not be used to estimate the actual ending account balance or expense you incurred for the period. You may use this information to compare the ongoing costs of investing in the Fund and other Funds. To do so, compare this 5% hypothetical example with the 5% hypothetical examples that appear in the shareholder reports of the other funds.
Please note that the expenses shown in the table are meant to highlight your ongoing costs only and do not reflect any transactional costs, such as front and back end sales charges (loads) or redemption fees, where applicable. Therefore, the hypothetical information is useful in comparing ongoing costs only, and will not help you determine the relative total costs of owning different funds or share classes. In addition, if these transactional costs were included, your costs would have been higher.
| | | | | | | | | | | | | | | | | | |
| | | | | | | | | Hypothetical Performance |
| | | Actual Performance | | (5% annualized return before expenses) |
| | | | | | |
| | | A Shares | | C Shares | | I Shares | | A Shares | | C Shares | | I Shares |
Beginning Account Value (1/01/08) | | $ | 1,000.00 | | $ | 1,000.00 | | $ | 1,000.00 | | $ | 1,000.00 | | $ | 1,000.00 | | $ | 1,000.00 |
Ending Account Value (6/30/08) | | $ | 989.20 | | $ | 985.50 | | $ | 990.60 | | $ | 1,020.24 | | $ | 1,016.51 | | $ | 1,021.48 |
Expenses Incurred During Period | | $ | 4.60 | | $ | 8.29 | | $ | 3.37 | | $ | 4.67 | | $ | 8.42 | | $ | 3.42 |
For each class of the Fund, expenses are equal to the Fund’s annualized net expense ratio of 0.93%, 1.68% and 0.68% for Classes A, C and I, respectively, multiplied by the average account value over the period, multiplied by 182/366 (to reflect the one-half year period).
Semi-Annual Report Page 5
Portfolio of Investments (Unaudited)
Nuveen Preferred Securities Fund
June 30, 2008
| | | | | | | | | |
| Shares | | Description (1) | | Coupon | | Ratings (2) | | Value |
| | | | | | | | | |
| | $25 PAR (OR SIMILAR) PREFERRED SECURITIES – 56.8% | | | | | | | |
| | | | |
| | Capital Markets – 3.4% | | | | | | | |
| | | | |
| 50,000 | | Deutsche Bank Capital Funding Trust V | | 8.050% | | Aa3 | | $ | 1,197,000 |
| | | | |
| 20,000 | | Lehman Brothers Holdings | | 7.950% | | A– | | | 407,000 |
| | Total Capital Markets | | | | | | | 1,604,000 |
| | |
| | Commercial Banks – 20.6% | | | | | | | |
| | | | |
| 37,500 | | ABN AMRO Capital Trust Fund VII | | 6.080% | | A1 | | | 643,500 |
| | | | |
| 29,000 | | Banco Santander Finance | | 6.500% | | AA3 | | | 611,900 |
| | | | |
| 5,000 | | Banco Santander Finance | | 4.000% | | Aa3 | | | 82,875 |
| | | | |
| 50,000 | | Bank of America Corporation | | 8.200% | | A+ | | | 1,240,500 |
| | | | |
| 45,000 | | Barclays Bank PLC | | 8.125% | | Aa3 | | | 1,106,550 |
| | | | |
| 30,000 | | Credit Suisse | | 7.900% | | Aa3 | | | 738,000 |
| | | | |
| 15,000 | | HSBC Finance Corporation | | 6.875% | | AA– | | | 341,400 |
| | | | |
| 20,000 | | HSBC Holdings PLC | | 8.125% | | A1 | | | 520,800 |
| | | | |
| 35,000 | | KeyCorp Capital Trust X | | 8.000% | | BBB | | | 555,625 |
| | | | |
| 31,400 | | M&T Capital Trust IV | | 8.500% | | BBB+ | | | 753,757 |
| | | | |
| 5,000 | | National City Capital Trust IV | | 8.000% | | BBB+ | | | 75,000 |
| | | | |
| 30,000 | | National City Corporation | | 9.875% | | BBB+ | | | 592,950 |
| | | | |
| 15,000 | | PNC Capital Trust | | 7.750% | | A2 | | | 337,050 |
| | | | |
| 15,000 | | Royal Bank of Scotland Group PLC, Series T | | 7.250% | | A1 | | | 306,750 |
| | | | |
| 25,000 | | SunTrust Capital Trust IX | | 7.875% | | A1 | | | 530,750 |
| | | | |
| 30,000 | | U.S. Bancorp. | | 7.875% | | A+ | | | 760,950 |
| | | | |
| 20,000 | | Wells Fargo Capital Trust XII | | 7.875% | | AA2 | | | 499,800 |
| | Total Commercial Banks | | | | | | | 9,698,157 |
| | |
| | Consumer Finance – 0.8% | | | | | | | |
| | | | |
| 10,000 | | SLM Corporation, Series A | | 6.970% | | Baa1 | | | 357,500 |
| | Diversified Financial Services – 5.7% | | | | | | | |
| | | | |
| 50,000 | | Allianz SE | | 8.375% | | A+ | | | 1,245,000 |
| | | | |
| 30,000 | | Citigroup Inc., Series F | | 8.500% | | A | | | 697,200 |
| | | | |
| 30,000 | | ING Groep N.V. | | 8.500% | | A1 | | | 747,000 |
| | Total Diversified Financial Services | | | | | | | 2,689,200 |
| | |
| | Electric Utilities – 3.5% | | | | | | | |
| | | | |
| 30,000 | | American Electric Power | | 8.750% | | Baa3 | | | 772,800 |
| | | | |
| 35,000 | | Xcel Energy Inc. | | 7.600% | | Baa2 | | | 863,450 |
| | Total Electric Utilities | | | | | | | 1,636,250 |
| | |
| | Independent Power Producers & Energy Traders – 3.2% | | | | | | | |
| | | | |
| 59,600 | | Constellation Energy Group | | 8.625% | | BBB– | | | 1,483,444 |
| | Insurance – 8.4% | | | | | | | |
| | | | |
| 25,300 | | Aegon NV | | 7.250% | | A– | | | 500,940 |
| | | | |
| 30,000 | | American International Group | | 7.700% | | A1 | | | 671,700 |
| | | | |
| 25,000 | | Aspen Insurance Holdings Limited | | 7.401% | | BBB– | | | 540,000 |
| | | | |
| 14,439 | | EverestRe Capital Trust II | | 6.200% | | Baa1 | | | 268,854 |
| | | | |
| 30,000 | | MetLife Inc., Series B | | 6.500% | | Baa1 | | | 642,000 |
| | | | |
| 10,000 | | Protective Life Corporation | | 7.250% | | BBB | | | 211,400 |
6
| | | | | | | | | | |
| Shares | | Description (1) | | Coupon | | Ratings (2) | | Value |
| | | | | | | | | | |
| | | Insurance (continued) | | | | | | | |
| | | | |
| | 40,000 | | Prudential Financial Inc. | | 9.000% | | A– | | $ | 996,000 |
| | | | |
| | 5,000 | | UnumProvident Financing Trust I (CORTS) | | 8.500% | | Ba2 | | | 111,550 |
| | | Total Insurance | | | | | | | 3,942,444 |
| | | |
| | | Real Estate Investment Trust – 2.9% | | | | | | | |
| | | | |
| | 5,000 | | AMB Property Corporation, Series M | | 6.750% | | Baa2 | | | 107,550 |
| | | | |
| | 25,000 | | Duke Realty Corporation, Series O | | 8.375% | | BBB | | | 593,000 |
| | | | |
| | 5,000 | | Prologis Trust, Series G | | 6.750% | | BBB | | | 104,500 |
| | | | |
| | 15,000 | | PS Business Parks, Inc. | | 7.000% | | BBB– | | | 306,000 |
| | | | |
| | 5,000 | | PS Business Parks, Inc. | | 6.700% | | BBB– | | | 96,750 |
| | | | |
| | 9,000 | | Public Storage, Inc., Series M | | 6.625% | | BBB+ | | | 178,830 |
| | | Total Real Estate Investment Trust | | | | | | | 1,386,630 |
| | | |
| | | Thrifts & Mortgage Finance – 1.3% | | | | | | | |
| | | | |
| | 35,900 | | Countrywide Capital Trust V | | 7.000% | | A+ | | | 627,891 |
| | | U.S. Agency – 7.0% | | | | | | | |
| | | | |
| | 60,000 | | Federal Home Loan Mortgage Corporation | | 8.375% | | A+ | | | 1,458,000 |
| | | | |
| | 20,000 | | Federal National Mortgage Association | | 8.250% | | AA– | | | 480,400 |
| | | | |
| | 60,000 | | Federal National Mortgage Association | | 8.250% | | AA– | | | 1,377,000 |
| | | Total U.S. Agency | | | | | | | 3,315,400 |
| | | |
| | | Total $25 Par (or similar) Preferred Securities (cost $28,227,649) | | | | | | | 26,740,916 |
| | | |
| | | | |
Principal
Amount (000) | | Description (1) | | Optional Call
Provisions (3) | | Ratings (2) | | Value |
| | | | | | | | | | |
| | | | | | | | | | |
| | | TAXABLE MUNICIPAL BONDS – 8.0% | | | | | | | |
| | | | |
| | | California – 0.4% | | | | | | | |
| | | | |
| $ | 200 | | California Statewide Community Development Authority, Lancer Educational Student Housing Revenue Bonds, California Baptist University, Series 2007, 9.125%, 6/01/13 | | No Opt. Call | | N/R | | $ | 206,328 |
| | | Florida – 1.4% | | | | | | | |
| | | | |
| | 200 | | Northern Palm Beach County Improvement District, Florida, Water Control and Improvement Bonds, Development Unit 46, Series 2007B, 8.250%, 8/01/21 | | 8/14 at 100.00 | | N/R | | | 204,914 |
| | | | |
| | 500 | | Seminole Tribe of Florida, Special Obligation Bonds Series 2007B, 7.804%, 10/01/20 | | 10/18 at 101.00 | | BBB | | | 483,680 |
| | 700 | | Total Florida | | | | | | | 688,594 |
| | | Idaho – 0.4% | | | | | | | |
| | | | |
| | 170 | | Idaho Housing and Finance Association NonProfit Facilities Revenue Bonds, Liberty Charter School, Inc, Series 2008B, 7.500%, 6/01/12 | | No Opt. Call | | BBB | | | 169,089 |
| | | Louisiana – 1.3% | | | | | | | |
| | | | |
| | 200 | | Carter Plantation Land Louisiana, Revenue Bonds, 9.000%, 7/01/17 | | 7/08 at 100.00 | | N/R | | | 177,690 |
| | | | |
| | 440 | | Louisiana Local Government Environmental Facilities and Community Development Authority, Federal Taxable Solid Waste Revenue Bonds, CWI White Oaks Landfill, Series 2007B, 9.750%, 3/01/22 | | 3/10 at 102.00 | | N/R | | | 419,993 |
| | 640 | | Total Louisiana | | | | | | | 597,683 |
| | | New York – 0.8% | | | | | | | |
| | | | |
| | 260 | | New York City Industrial Development Agency, New York, Civic Facility Revenue Bonds, Special Needs Facilities Pooled Program, Series 2008A-2, 7.500%, 7/01/09 | | No Opt. Call | | N/R | | | 260,200 |
| | | | |
| | 60 | | Suffolk County Industrial Development Agency, New York, Civic Facility Revenue Bonds, Special Needs Facilities Pooled Program, Series 2008B-2, 7.500%, 7/01/08 | | No Opt. Call | | N/R | | | 60,001 |
| | | | |
| | 45 | | Yonkers Industrial Development Agency, New York, Civic Facilities Revenue Bonds, Special Needs Facilities Pooled Program Bonds, Series 2008-C2, 7.500%, 7/01/08 | | No Opt. Call | | N/R | | | 45,001 |
| | 365 | | Total New York | | | | | | | 365,202 |
7
Portfolio of Investments (Unaudited)
Nuveen Preferred Securities Fund (continued)
June 30, 2008
| | | | | | | | | | |
Principal
Amount (000) | | Description (1) | | Optional Call
Provisions (3) | | Ratings (2) | | Value |
| | | | | | | | | | |
| | | Texas – 1.7% | | | | | | | |
| | | | |
| $ | 600 | | Danbury Higher Education Authority Inc., Texas, Golden Rule Charter School Revenue Bonds, Series 2008B, 10.000%, 8/15/18 | | No Opt. Call | | BB+ | | $ | 578,436 |
| | | | |
| | 200 | | La Vernia Education Financing Corporation, Texas, Charter School Revenue Bonds, Riverwalk Education Foundation, Series 2007B, 8.750%, 8/15/12 | | 8/11 at 100.00 | | N/R | | | 203,466 |
| | 800 | | Total Texas | | | | | | | 781,902 |
| | | Washington – 2.0% | | | | | | | |
| | | | |
| | 950 | | Washington State Economic Development Finance Authority, Revenue Bonds, Coeur D’Alene Fiber Fuels Inc., Series 2007H, 10.000%, 12/01/11 | | No Opt. Call | | N/R | | | 954,731 |
| $ | 3,825 | | Total Taxable Municipal Bonds (cost $3,821,898) | | | | | | | 3,763,529 |
| | | | | | | | | | | |
Principal
Amount (000)/
Shares | | Description (1) | | Coupon | | Maturity | | Ratings (2) | | Value |
| | | | | | | | | | | |
| | CAPITAL PREFERRED SECURITIES – 35.5% | | | | | | | | | |
| | | | | |
| | Capital Markets – 5.1% | | | | | | | | | |
| | | | | |
| 1,000 | | JP Morgan Chase & Company, | | 7.900% | | | | A1 | | $ | 940,430 |
| | | | | |
| 500 | | MUFG Capital Finance | | 6.346% | | 7/15/56 | | A2 | | | 434,049 |
| | | | | |
| 1,000 | | State Street Capital Trust | | 8.250% | | 9/15/58 | | A1 | | | 1,019,910 |
| | Total Capital Markets | | | | | | | | | 2,394,389 |
| | |
| | Commercial Banks – 11.3% | | | | | | | | | |
| | | | | |
| 500 | | Bank of America Corporation | | 8.000% | | 7/30/58 | | A1 | | | 469,195 |
| | | | | |
| 200 | | BBVA International Unipersonal | | 5.919% | | 4/18/58 | | Aa3 | | | 163,617 |
| | | | | |
| 500 | | BOI Capital Funding 2, 144A | | 5.571% | | 8/01/56 | | A1 | | | 337,885 |
| | | | | |
| 500 | | Credit Suisse | | 5.860% | | 11/15/57 | | Aa3 | | | 417,508 |
| | | | | |
| 500 | | Fifth Third Capital Trust IV | | 6.500% | | 4/15/37 | | A1 | | | 290,335 |
| | | | | |
| 200 | | HBOS PLC, Series 144A | | 6.657% | | 11/21/57 | | A1 | | | 140,496 |
| | | | | |
| 400 | | Lloyd’s TSB Group PLC | | 6.267% | | 11/14/49 | | Aa3 | | | 319,562 |
| | | | | |
| 500 | | PNC Preferred Funding Trust III | | 8.700% | | 3/15/58 | | A– | | | 498,479 |
| | | | | |
| 500 | | Royal Bank of Scotland Group PLC | | 6.990% | | 10/05/49 | | A1 | | | 450,750 |
| | | | | |
| 500 | | Societe Generale | | 5.922% | | 4/05/57 | | A1 | | | 425,593 |
| | | | | |
| 500 | | Wachovia Capital Trust III | | 5.800% | | 3/15/42 | | A3 | | | 340,192 |
| | | | | |
| 500 | | Wachovia Corporation | | 7.980% | | 9/15/49 | | A3 | | | 460,525 |
| | | | | |
| 1,000 | | Wells Fargo Capital Trust XIII | | 7.700% | | 9/26/58 | | AA2 | | | 995,016 |
| | Total Commercial Banks | | | | | | | | | 5,309,153 |
| | |
| | Consumer Finance – 0.5% | | | | | | | | | |
| | | | | |
| 300 | | Mizuho Capital Investment I Limited | | 6.686% | | 3/30/49 | | A2 | | | 255,204 |
| | Diversified Financial Services – 2.4% | | | | | | | | | |
| | | | | |
| 400 | | CIT Group Inc. | | 6.100% | | 3/15/67 | | BBB | | | 184,148 |
| | | | | |
| 1,000 | | Citigroup Inc. | | 8.400% | | | | A | | | 951,860 |
| | Total Diversified Financial Services | | | | | | | | | 1,136,008 |
| | |
| | Electric Utilities – 0.6% | | | | | | | | | |
| | | | | |
| 300 | | Dominion Resources Inc. | | 7.500% | | 6/30/66 | | BBB | | | 279,519 |
8
| | | | | | | | | | | |
Principal
Amount (000)/
Shares | | Description (1) | | Coupon | | Maturity | | Ratings (2) | | Value |
| | | | | | | | | | | |
| | Insurance – 14.2% | | | | | | | | | |
| | | | | |
| 1,100 | | Assured Guaranty US Holdings, Series A | | 6.400% | | 12/15/66 | | A1 | | $ | 726,781 |
| | | | | |
| 400 | | AXA SA, 144A | | 6.379% | | 6/14/57 | | BBB+ | | | 321,740 |
| | | | | |
| 750 | | Genworth Financial Inc. | | 6.150% | | 11/15/66 | | A3 | | | 590,460 |
| | | | | | | | | | | |
| | | | | |
| 1,000 | | Hartford Financial Services Group Inc. | | 8.125% | | 6/15/68 | | A3 | | | 974,882 |
| | | | | |
| 1,000 | | Liberty Mutual Group Inc., 144A | | 10.750% | | 6/15/58 | | Baa3 | | | 959,561 |
| | | | | |
| 400 | | Liberty Mutual Group | | 7.800% | | 3/15/37 | | Baa3 | | | 320,126 |
| | | | | |
| 500 | | MetLife Capital Trust IV | | 7.875% | | 12/15/67 | | BBB+ | | | 491,374 |
| | | | | |
| 750 | | PartnerRe Finance | | 6.440% | | 12/01/66 | | A3 | | | 596,679 |
| | | | | |
| 1,000 | | QBE Capital Funding Trust II, 144A | | 6.797% | | 6/01/49 | | BBB | | | 839,639 |
| | | | | |
| 500 | | Symetra Financial Corporation | | 8.300% | | 10/15/37 | | Baa3 | | | 438,220 |
| | | | | |
| 500 | | ZFS Finance USA Trust V | | 6.500% | | 5/09/67 | | BBB+ | | | 437,105 |
| | Total Insurance | | | | | | | | | 6,696,567 |
| | |
| | Oil, Gas & Consumable Fuels – 0.4% | | | | | | | | | |
| | | | | |
| 200 | | Enterprise Products Operating LP | | 7.034% | | 1/15/68 | | Ba1 | | | 175,142 |
| | Road & Rail – 0.8% | | | | | | | | | |
| | | | | |
| 400 | | Burlington Northern Santa Fe Funding Trust I | | 6.613% | | 12/15/55 | | Baa3 | | | 362,690 |
| | Thrifts & Mortgage Finance – 0.2% | | | | | | | | | |
| | | | | |
| 200 | | Washington Mutual Preferred Funding Delaware, Series A-1, 144A | | 6.534% | | 6/15/56 | | BB+ | | | 88,957 |
| | Total Capital Preferred Securities (cost $18,171,598) | | | | | | | | | 16,697,629 |
| | |
| | Total Investments (cost $50,221,145) – 100.3% | | | | | | | | | 47,202,074 |
| | |
| | Other Assets Less Liabilities – (0.3)% | | | | | | | | | (134,888) |
| | |
| | Net Assets – 100% | | | | | | | | $ | 47,067,186 |
| | |
Futures Contracts outstanding at June 30, 2008:
| | | | | | | | | | | | |
| Type | | Contract
Position | | Number of
Contracts | | Contract
Expiration | | Value at
June 30, 2008 | | Unrealized
Appreciation
(Depreciation) |
| U.S Treasury Bonds | | Long | | 7 | | 9/08 | | $ | 809,156 | | $ | 13,332 |
| | (1) | | All percentages shown in the Portfolio of Investments are based on net assets. |
| | (2) | | Ratings: Using the higher of Standard & Poor’s Group (“Standard & Poor’s”) or Moody’s Investor Service, Inc. (“Moody’s”) rating. Ratings below BBB by Standard & Poor’s or Baa by Moody’s are considered to be below investment grade. |
| | (3) | | Optional Call Provisions: Dates (month and year) and prices of the earliest optional call or redemption. There may be other call provisions at varying prices at later dates. Certain mortgage-backed securities may be subject to periodic principal paydowns. |
| | 144A | | Investment is exempt from registration under Rule 144A of the Securities Act of 1933, as amended. These investments may only be resold in transactions exempt from registration which are normally those transactions with qualified institutional buyers. |
| | CORTS | | Corporate Backed Trust Securities. |
9
Statement of Assets and Liabilities (Unaudited)
June 30, 2008
| | | | |
Assets | | | | |
Investments, at value (cost $50,221,145) | | $ | 47,202,074 | |
Receivables: | | | | |
Dividends | | | 58,382 | |
From Adviser | | | 65,327 | |
Interest | | | 419,957 | |
Investments sold | | | 746,498 | |
Reclaims | | | 69 | |
Shares sold | | | 35,000 | |
Other assets | | | 4 | |
Total assets | | | 48,527,311 | |
Liabilities | | | | |
Cash overdraft | | | 1,147,008 | |
Payables: | | | | |
Shares redeemed | | | 1,969 | |
Variation margin on futures contracts | | | 438 | |
Accrued expenses: | | | | |
12b-1 distribution and service fees | | | 487 | |
Other | | | 65,981 | |
Dividends payable | | | 244,242 | |
Total liabilities | | | 1,460,125 | |
Net assets | | $ | 47,067,186 | |
Class A Shares | | | | |
Net assets | | $ | 782,154 | |
Shares outstanding | | | 48,323 | |
Net asset value per share | | $ | 16.19 | |
Offering price per share (net asset value per share plus
maximum sales charge of 4.75% of offering price) | | $ | 17.00 | |
Class C Shares | | | | |
Net assets | | $ | 402,406 | |
Shares outstanding | | | 24,882 | |
Net asset value and offering price per share | | $ | 16.17 | |
Class I Shares (1) | | | | |
Net assets | | $ | 45,882,626 | |
Shares outstanding | | | 2,834,343 | |
Net asset value and offering price per share | | $ | 16.19 | |
| |
Net Assets Consist of: | | | | |
Capital paid-in | | $ | 51,973,893 | |
Undistributed (Over-distribution of) net investment income | | | (219,653 | ) |
Accumulated net realized gain (loss) from investments and derivative transactions | | | (1,681,315 | ) |
Net unrealized appreciation (depreciation) of investments and derivative transactions | | | (3,005,739 | ) |
Net assets | | $ | 47,067,186 | |
| (1) | Effective May 1, 2008, Class R Shares were renamed Class I Shares. |
See accompanying notes to financial statements.
10
Statement of Operations (Unaudited)
Six Months Ended June 30, 2008
| | | | |
Investment Income | | | | |
Dividends | | $ | 826,363 | |
Interest | | | 666,165 | |
Total Investment Income | | | 1,492,528 | |
Expenses | | | | |
Management fees | | | 141,004 | |
12b-1 service fees – Class A | | | 623 | |
12b-1 distribution and service fees – Class B | | | 840 | |
12b-1 distribution and service fees – Class C | | | 1,466 | |
Shareholders’ servicing agent fees and expenses | | | 1,816 | |
Custodian’s fees and expenses | | | 15,862 | |
Trustees’ fees and expenses | | | 512 | |
Professional fees | | | 28,997 | |
Shareholders’ reports – printing and mailing expenses | | | 915 | |
Federal and state registration fees | | | 78,738 | |
Other expenses | | | 2,593 | |
Total expenses before custodian fee credit and expense reimbursement | | | 273,366 | |
Custodian fee credit | | | (1,326 | ) |
Expense reimbursement | | | (139,019 | ) |
Net expenses | | | 133,021 | |
Net investment income | | | 1,359,507 | |
Realized and Unrealized Gain (Loss) | | | | |
Net realized gain (loss) from: | | | | |
Investments | | | (1,542,532 | ) |
Futures | | | (16,636 | ) |
Change in net unrealized appreciation (depreciation) of: | | | | |
Investments | | | (1,212,486 | ) |
Futures | | | 13,332 | |
Net realized and unrealized gain (loss) | | | (2,758,322 | ) |
Net increase (decrease) in net assets from operations | | $ | (1,398,815 | ) |
See accompanying notes to financial statements.
11
Statement of Changes in Net Assets (Unaudited)
| | | | | | | | |
| | | Six Months Ended
6/30/08 | | | Year Ended
12/31/07 | |
Operations | | | | | | | | |
Net investment income | | $ | 1,359,507 | | | $ | 578,566 | |
Net realized gain (loss) from: | | | | | | | | |
Investments | | | (1,542,532 | ) | | | (86,192 | ) |
Futures | | | (16,636 | ) | | | (30,733 | ) |
Change in net unrealized appreciation (depreciation) of: | | | | | | | | |
Investments | | | (1,212,486 | ) | | | (1,800,543 | ) |
Futures | | | 13,332 | | | | — | |
Net increase (decrease) in net assets from operations | | | (1,398,815 | ) | | | (1,338,902 | ) |
Distributions to Shareholders | | | | | | | | |
From net investment income: | | | | | | | | |
Class A | | | (19,844 | ) | | | (16,160 | ) |
Class B | | | — | | | | (13,343 | ) |
Class C | | | (10,299 | ) | | | (13,343 | ) |
Class I (1) | | | (1,536,798 | ) | | | (563,731 | ) |
Decrease in net assets from distributions to shareholders | | | (1,566,941 | ) | | | (606,577 | ) |
Fund Share Transactions | | | | | | | | |
Proceeds from sale of shares | | | 30,486,226 | | | | 17,326,622 | |
Proceeds from shares issued to shareholders due to reinvestment of distributions | | | 322,633 | | | | 288,403 | |
| | | 30,808,859 | | | | 17,615,025 | |
Cost of shares redeemed | | | (1,356,461 | ) | | | (91,875 | ) |
Net increase (decrease) in net assets from Fund share transactions | | | 29,452,398 | | | | 17,523,150 | |
Net increase (decrease) in net assets | | | 26,486,642 | | | | 15,577,671 | |
Net assets at the beginning of period | | | 20,580,544 | | | | 5,002,873 | |
Net assets at the end of period | | $ | 47,067,186 | | | $ | 20,580,544 | |
Undistributed (Over-distribution of) net investment income at the end of period | | $ | (219,653 | ) | | $ | (12,219 | ) |
| (1) | Effective May 1, 2008, Class R Shares were renamed Class I Shares. |
See accompanying notes to financial statements.
12
Notes to Financial Statements (Unaudited)
1. General Information and Significant Accounting Policies
The Nuveen Investment Trust V (the “Trust”) is an open-end management investment company registered under the Investment Company Act of 1940, as amended. The Trust is comprised of the Nuveen Preferred Securities Fund (the “Fund”). The Trust was organized as a Massachusetts business trust on September 27, 2006.
The Fund seeks to provide a high level of current income and total return. Under normal circumstances the Fund will invest at least 80% of its net assets in preferred securities and may also invest up to 20% of its assets in debt securities, U.S. government and agency debt taxable municipal securities, and convertible preferred securities. The Fund may also invest in futures, forwards, options and swaps, or other derivative financial instruments including credit default swaps.
On March 31, 2008, the Nuveen Mutual Funds announced the following policy changes applicable to the Fund:
| • | | Effective March 31, 2008, Class B shares are no longer available for the Fund. As of March 31, 2008, all outstanding Class B Shares for the Fund were owned by Nuveen Investments, Inc. (“Nuveen”) and transferred to Class I Shares on May 2, 2008. |
| • | | Effective May 1, 2008, Class A share purchases at net asset value of $1 million or more that are subject to a contingent deferred sales charge (“CDSC”), the period over which the CDSC will apply has been reduced from eighteen months to twelve months for all purchases occurring on or after May 1, 2007. Class A shares purchased prior to May 1, 2007 that have not been redeemed are no longer be subject to a CDSC. |
| • | | Effective May 1, 2008, Class R Shares have been renamed Class I Shares and are available for (i) purchases of $1 million or more, (ii) purchases using dividends and capital gains distributions on Class I Shares and (iii) purchase by limited categories of investors. |
The following is a summary of significant accounting policies followed by the Fund in the preparation of its financial statements in accordance with U.S. generally accepted accounting principles.
Investment Valuation
Exchange-listed securities are generally valued at the last sales price on the securities exchange on which such securities are primarily traded. Securities traded on a securities exchange for which there are no transactions on a given day or securities not listed on a securities exchange are valued at the mean of the closing bid and asked prices. Securities traded on Nasdaq are valued at the Nasdaq Official Closing Price. The prices of fixed-income securities are generally provided by an independent pricing service approved by the Fund’s Board of Trustees. When market quotes are not readily available, the pricing service or, in the absence of a pricing service for a particular investment, the Board of Trustees of the Fund, or its designee, may establish fair value using a wide variety of market data including yields or prices of investments of comparable quality, type of issue, coupon, maturity and rating, market quotes or indications of value from securities dealers, evaluations of anticipated cash flows or collateral, general market conditions and other information and analysis, including the obligor’s credit characteristics considered relevant by the pricing service or the Board of Trustee’s designee. Futures contracts are valued using the closing settlement price or, in the absence of such a price, at the mean of the bid and asked prices. If the pricing service is unable to supply a price for an investment or derivative instrument, the Fund may use market quotes provided by major broker/dealers in such investments. If it is determined that the market price for an investment or derivative instrument is unavailable or inappropriate, the Board of Trustees of the Fund, or its designee, may establish fair value in accordance with procedures established in good faith by the Board of Trustees. Short-term investments are valued at amortized cost, which approximates market value.
Investment Transactions
Investment transactions are recorded on a trade date basis. Realized gains and losses from investment transactions are determined on the specific identification method. Investments purchased on a when-issued/delayed delivery basis may have extended settlement periods. Any investments so purchased are subject to market fluctuation during this period. The Fund has instructed the custodian to segregate assets with a current value at least equal to the amount of the when-issued/delayed delivery purchase commitments. At June 30, 2008, the Fund had no such outstanding purchase commitments.
Investment Income
Dividend income is recorded on the ex-dividend date or, for foreign securities, when information is available. Interest income, which includes the amortization of premiums and accretion of discounts for financial reporting purposes, is recorded on an accrual basis. Investment income also includes paydown gains and losses, if any.
Dividends and Distributions to Shareholders
Dividends from net investment income are declared monthly. Net realized capital gains from investment transactions, if any, are declared and distributed to shareholders at least annually. Furthermore, capital gains are distributed only to the extent they exceed available capital loss carryforwards.
Distributions to shareholders are recorded on the ex-dividend date. The amount and timing of distributions are determined in accordance with federal income tax regulations, which may differ from U.S. generally accepted accounting principles.
13
Income Taxes
The Fund intends to distribute substantially all of its net investment income and net capital gains to shareholders and to otherwise comply with the requirements of Subchapter M of the Internal Revenue Code applicable to regulated investment companies. Therefore, no federal income tax provision is required. Net realized capital gains and ordinary income distributions paid by the Fund are subject to federal taxation.
Effective June 29, 2007, the Fund adopted Financial Accounting Standards Board (FASB) Interpretation No. 48 “Accounting for Uncertainty in Income Taxes” (FIN 48). FIN 48 provides guidance for how uncertain tax positions should be recognized, measured, presented and disclosed in the financial statements. FIN 48 requires the affirmative evaluation of tax positions taken or expected to be taken in the course of preparing the Fund’s tax returns to determine whether it is “more-likely-than-not” (i.e., a greater than 50 percent likelihood) of being sustained by the applicable tax authority. Tax positions not deemed to meet the more-likely-than-not threshold may result in a tax expense in the current year.
Implementation of FIN 48 required management of the Fund to analyze all open tax years, as defined by the statute of limitations, for all major jurisdictions, which includes federal and certain states. Open tax years are those that are open for examination by taxing authorities (i.e., generally the last four tax year ends and the interim tax period since then). The Fund has no examinations in progress.
For all open tax years and all major taxing jurisdictions through the end of the reporting period, management of the Fund has reviewed all tax positions taken or expected to be taken in the preparation of the Fund’s tax returns and concluded the adoption of FIN 48 resulted in no impact to the Fund’s net assets or results of operations as of and during the six months ended June 30, 2008.
The Fund is also not aware of any tax positions for which it is reasonably possible that the total amounts of unrecognized tax benefits will significantly change in the next twelve months.
Flexible Sales Charge Program
The Fund offers Class A, C and I Shares. Class A Shares are generally sold with an up-front sales charge and incur a .25% annual 12b-1 service fee. Class A Share purchases of $1 million or more are sold at net asset value without an up-front sales charge but may be subject to a CDSC if redeemed within twelve months of purchase. Class C Shares are sold without an up-front sales charge but incur a .75% annual 12b-1 distribution fee and a .25% annual 12b-1 service fee. Class C Shares are subject to a CDSC of 1% if redeemed within one year of purchase. Class I Shares are not subject to any sales charge or 12b-1 distribution or service fees.
Futures Contracts
The Fund is authorized to invest in futures contracts. Upon entering into a futures contract, the Fund is required to deposit with the broker an amount of cash or liquid securities equal to a specified percentage of the contract amount. This is known as the “initial margin.” Subsequent payments (“variation margin”) are made or received by the Fund each day, depending on the daily fluctuation of the value of the contract.
During the period the futures contract is open, changes in the value of the contract are recognized as an unrealized gain or loss by “marking-to-market” on a daily basis to reflect the changes in market value of the contract. When the contract is closed or expired, the Fund records a realized gain or loss equal to the difference between the value of the contract on the closing date and value of the contract when originally entered into. Cash held by the broker to cover initial margin requirements on open futures contracts, if any, is recognized on the Statement of Assets and Liabilities. Additionally, the Statement of Assets and Liabilities reflects a receivable or payable for the variation margin when applicable.
Risks of investments in futures contracts include the possible adverse movement of the securities or indices underlying the contracts, the possibility that there may not be a liquid secondary market for the contracts and/or that a change in the value of the contract may not correlate with a change in the value of the underlying securities or indices.
Repurchase Agreements
In connection with transactions in repurchase agreements, it is the Fund’s policy that its custodian take possession of the underlying collateral securities, the fair value of which exceeds the principal amount of the repurchase transaction, including accrued interest, at all times. If the seller defaults, and the fair value of the collateral declines, realization of the collateral may be delayed or limited.
Expense Allocation
Expenses of the Fund that are not directly attributable to a specific class of shares are prorated among the classes based on the relative net assets of each class. Expenses directly attributable to a class of shares, which presently only include 12b-1 distribution and service fees, are recorded to the specific class.
Custodian Fee Credit
The Fund has an arrangement with the custodian bank whereby certain custodian fees and expenses are reduced by net credits earned on the Fund’s cash on deposit with the bank. Such deposit arrangements are an alternative to overnight investments. Credits for cash balances may be offset by charges for any days on which the Fund overdraws its account at the custodian bank.
14
Notes to Financial Statements (Unaudited) (continued)
Indemnifications
Under the Trust’s organizational documents, its Officers and Trustees are indemnified against certain liabilities arising out of the performance of their duties to the Trust. In addition, in the normal course of business, the Trust enters into contracts that provide general indemnifications to other parties. The Trust’s maximum exposure under these arrangements is unknown as this would involve future claims that may be made against the Trust that have not yet occurred. However, the Trust has not had prior claims or losses pursuant to these contracts and expects the risk of loss to be remote.
Use of Estimates
The preparation of financial statements in conformity with U.S. generally accepted accounting principles requires management to make estimates and assumptions that affect the reported amounts of assets and liabilities at the date of the financial statements and the reported amounts of increases and decreases in net assets from operations during the reporting period. Actual results may differ from those estimates.
2. Fair Value Measurements
During the current fiscal period, the Fund adopted the provisions of Statement of Financial Accounting Standards No. 157, Fair Value Measurements (SFAS 157). SFAS 157 defines fair value, establishes a framework for measuring fair value in generally accepted accounting principles, and expands disclosure about fair value measurements. In determining the value of the Fund’s investments various inputs are used. These inputs are summarized in the three broad levels listed below:
Level 1 – Quoted prices in active markets for identical securities.
Level 2 – Other significant observable inputs (including quoted prices for similar securities, interest rates, prepayment speeds, credit risk, etc.).
Level 3 – Significant unobservable inputs (including management’s assumptions in determining the fair value of investments).
The inputs or methodology used for valuing securities are not an indication of the risk associated with investing in those securities.
The following is a summary of the Fund’s fair value measurements as of June 30, 2008:
| | | | | | | | | | | | |
| | | Level 1 | | Level 2 | | Level 3 | | Total |
Investments | | $ | 20,199,815 | | $ | 27,002,259 | | $ | — | | $ | 47,202,074 |
Derivatives* | | | 13,332 | | | — | | | — | | | 13,332 |
Total | | $ | 20,213,147 | | $ | 27,002,259 | | $ | — | | $ | 47,215,406 |
* Represents net unrealized appreciation (depreciation).
3. Fund Shares
Transactions in Fund shares were as follows:
| | | | | | | | | | | | | | |
| | | Six Months Ended
6/30/08 | | | Year Ended
12/31/07 | |
| | | Shares | | | Amount | | | Shares | | | Amount | |
Shares sold: | | | | | | | | | | | | | | |
Class A | | 29,590 | | | $ | 504,127 | | | 4,315 | | | $ | 76,500 | |
Class B** | | — | | | | — | | | — | | | | — | |
Class C | | 9,863 | | | | 168,285 | | | — | | | | — | |
Class I | | 1,717,843 | | | | 29,813,814 | | | 947,692 | | | | 17,250,122 | |
Shares issued to shareholders due to reinvestment
of distributions: | | | | | | | | | | | | | | |
Class A | | 656 | | | | 11,160 | | | 829 | | | | 15,551 | |
Class B** | | — | | | | — | | | 712 | | | | 13,343 | |
Class C | | 564 | | | | 9,561 | | | 712 | | | | 13,343 | |
Class I | | 17,820 | | | | 301,912 | | | 13,119 | | | | 246,166 | |
| | | 1,776,336 | | | | 30,808,859 | | | 967,379 | | | | 17,615,025 | |
Shares redeemed: | | | | | | | | | | | | | | |
Class A | | (817 | ) | | | (13,881 | ) | | — | | | | — | |
Class B** | | — | | | | — | | | — | | | | — | |
Class C | | (7 | ) | | | (112 | ) | | — | | | | — | |
Class I | | (80,105 | ) | | | (1,342,468 | ) | | (5,238 | ) | | | (91,875 | ) |
| | | (80,929 | ) | | | (1,356,461 | ) | | (5,238 | ) | | | (91,875 | ) |
Net increase (decrease) | | 1,695,407 | | | $ | 29,452,398 | | | 962,141 | | | $ | 17,523,150 | |
** Effective March 31, 2008, Class B Shares were no longer available to the Funds and transferred to Class I Shares on May 2, 2008.
15
4. Investment Transactions
Purchases and sales (including maturities but excluding short-term investments and derivative transactions) during the six months ended June 30, 2008, were as follows:
| | | |
Purchases: | | | |
Investment securities | | $ | 53,488,831 |
U.S. Government and agency obligations | | | 4,270,367 |
Sales and maturities: | | | |
Investment securities | | | 26,142,252 |
U.S. Government and agency obligations | | | 2,031,406 |
5. Income Tax Information
The following information is presented on an income tax basis. Differences between amounts for financial statement and federal income tax purposes are primarily due to timing differences in recognizing taxable market discount, amortization of premium on taxable debt securities and timing differences in recognizing certain gains and losses on investment transactions. To the extent that differences arise that are permanent in nature, such amounts are reclassified within the capital accounts on the Statement of Assets and Liabilities presented in the annual report, based on their federal tax basis treatment; temporary differences do not require reclassification. Temporary and permanent differences do not impact the net asset value of the Fund.
At June 30, 2008, the cost of investments was $50,236,562.
Gross unrealized appreciation and gross unrealized depreciation of investments at June 30, 2008, were as follows:
| | | | |
Gross unrealized: | | | | |
Appreciation | | $ | 277,430 | |
Depreciation | | | (3,311,918 | ) |
Net unrealized appreciation (depreciation) of investments | | $ | (3,034,488 | ) |
The tax components of undistributed net ordinary income and net long-term capital gains at December 31, 2007, the Fund’s last tax year end, were as follows:
| | | |
Undistributed net ordinary income* | | $ | 3,199 |
Undistributed net long-term capital gains | | | — |
* Net ordinary income consists of net taxable income derived from dividends, interest, and net short-term capital gains, if any.
The tax character of distributions paid during the Fund’s last tax year ended December 31, 2007, was designated for purposes of the dividends paid deduction as follows:
| | | |
Distributions from net ordinary income* | | $ | 606,577 |
Distributions from net long-term capital gains | | | — |
* Net ordinary income consists of net taxable income derived from dividends, interest, and net short-term capital gains, if any.
At December 31, 2007, the Fund’s last tax year end, the Fund had unused capital loss carryforwards of $41,620 available for federal income tax purposes to be applied against future capital gains, if any. If not applied the carryforwards will expire December 31, 2015.
The Fund elected to defer net realized losses from investments incurred from November 1, 2007 through December 31, 2007, the Fund’s last tax year end, (“post-October losses”) in accordance with federal income tax regulations. Post-October losses of $80,529 were treated as having arisen on the first day of the current fiscal year.
6. Management Fees and Other Transactions with Affiliates
The Fund’s management fee is separated into two components – a complex-level component, based on the aggregate amount of all fund assets managed by Nuveen Asset Management (the “Adviser”), a wholly owned subsidiary of Nuveen, and a specific fund-level component, based only on the amount of assets within the Fund. This pricing structure enables Nuveen fund shareholders to benefit from growth in the assets within each individual fund as well as from growth in the amount of complex-wide assets managed by the Adviser.
16
Notes to Financial Statements (Unaudited) (continued)
The annual fund-level fee, payable monthly, is based upon the average daily net assets of the Fund as follows:
| | | |
| Average Daily Net Assets | | Fund-Level Fee Rate | |
For the first $125 million | | .5500 | % |
For the next $125 million | | .5375 | |
For the next $250 million | | .5250 | |
For the next $500 million | | .5125 | |
For the next $1 billion | | .5000 | |
For Net Assets over $2 billion | | .4750 | |
The annual complex-level fee, payable monthly, which is additive to the fund-level fee, for all Nuveen sponsored funds in the U.S., is based on the aggregate amount of total fund assets managed as stated in the table below. As of June 30, 2008, the complex-level fee rate was .1868%.
The complex-level fee schedule is as follows:
| | | |
| Complex-Level Asset Breakpoint Level (1) | | Effective Rate at Breakpoint Level | |
$55 billion | | .2000 | % |
$56 billion | | .1996 | |
$57 billion | | .1989 | |
$60 billion | | .1961 | |
$63 billion | | .1931 | |
$66 billion | | .1900 | |
$71 billion | | .1851 | |
$76 billion | | .1806 | |
$80 billion | | .1773 | |
$91 billion | | .1691 | |
$125 billion | | .1599 | |
$200 billion | | .1505 | |
$250 billion | | .1469 | |
$300 billion | | .1445 | |
| (1) | The complex-level fee component of the management fee for the funds is calculated based upon the aggregate Managed Assets (“Managed Assets” means the average daily net assets of each fund including assets attributable to preferred stock issued by or borrowings by the Nuveen funds) of Nuveen-sponsored funds in the U.S. |
The management fee compensates the Adviser for overall investment advisory and administrative services and general office facilities. The Trust pays no compensation directly to those of its Trustees who are affiliated with the Adviser or to its Officers, all of whom receive remuneration for their services to the Trust from the Adviser or its affiliates. The Board of Trustees has adopted a deferred compensation plan for independent Trustees that enables Trustees to elect to defer receipt of all or a portion of the annual compensation they are entitled to receive from certain Nuveen advised funds. Under the plan, deferred amounts are treated as though equal dollar amounts had been invested in shares of select Nuveen advised funds.
Prior to September 1, 2007, the Adviser agreed to waive part of its management fees and reimburse certain expenses in order to limit operating expenses (excluding 12b-1 distribution and service fees, interest expense, taxes, fees incurred in acquiring and disposing of portfolio securities and extraordinary expenses) from exceeding 1.00% of the average daily net assets. Effective September 1, 2007, the Adviser agreed to waive .05% of its management fees through April 30, 2010. The Adviser also agreed to reimburse all other expenses through April 30, 2010 (excluding 12b-1 distribution and service fees, interest expense, taxes, fees incurred in acquiring and disposing of portfolio securities and extraordinary expenses). Beginning May 1, 2010, the Adviser agreed to waive fees and reimburse expenses in order to limit total operating expenses (excluding 12b-1 distribution and services fees, interest expense, taxes, fees incurred in acquiring and disposing of portfolio securities and extraordinary expenses) from exceeding 1.25% of the average daily net assets. The Adviser may also voluntarily reimburse additional expenses from time to time. Voluntary reimbursements may be terminated at any time at the Adviser’s discretion.
During the six months ended June 30, 2008, Nuveen Investments, LLC (the “Distributor”), a wholly owned subsidiary of Nuveen, compensated financial intermediaries directly with commission advances at the time of purchase as follows:
| | | |
Commission advances | | $ | 1,683 |
To compensate for commissions advanced to financial intermediaries, all 12b-1 service fees collected on Class B Shares during the first year following a purchase, all 12b-1 distribution fees collected on Class B Shares, and all 12b-1 service and distribution fees collected on Class C Shares during the first year following a purchase are retained by the Distributor. During the six months ended June 30, 2008, the Distributor retained such 12b-1 fees as follows:
| | | |
12b-1 fees retained | | $ | 2,334 |
17
The remaining 12b-1 fees charged to the Fund were paid to compensate financial intermediaries for providing services to shareholders relating to their investments.
At June 30, 2008, Nuveen owned 13,648, 13,511 and 240,854 of Class A, C and I Shares, respectively. At June 30, 2008, the Adviser owned 1,365, 1,351 and 2,721 of Class A, C and I Shares, respectively.
7. New Accounting Pronouncement
Financial Accounting Standards Board Statement of Financial Accounting Standards No. 161
In March 2008, the FASB issued SFAS No. 161, “Disclosures about Derivative Instruments and Hedging Activities.” This standard is intended to enhance financial statement disclosures for derivative instruments and hedging activities and enable investors to understand: a) how and why a fund uses derivative instruments, b) how derivative instruments and related hedge items are accounted for, and c) how derivative instruments and related hedge items affect a fund’s financial position, results of operations and cash flows. SFAS No. 161 is effective for financial statements issued for fiscal years and interim periods beginning after November 15, 2008. As of June 30, 2008, management does not believe the adoption of SFAS No. 161 will impact the financial statement amounts; however, additional footnote disclosures may be required about the use of derivative instruments and hedging items.
8. Subsequent Events
Distributions to Shareholders
The Fund declared a dividend distribution from its net investment income which was paid on August 1, 2008, to shareholders of record on July 30, 2008, as follows:
| | | |
Dividend per share: | | | |
Class A | | $ | .1050 |
Class C | | | .0945 |
Class I | | | .1090 |
18
Financial Highlights (Unaudited)
Selected data for a share outstanding throughout each period:
| | | | | | | | | | | | | | | | | | | | | | | | | | | | | | | | | | | | | | | | | | | | | | | | | | | | | | | | | |
| Class (Commencement Date) | | | | | | | | | | | | | | | | | | | | | | | | | | | | | | | | | | | | | | | | | | | | |
| | | | | Investment Operations | | | Less Distributions | | | | | | | | | Ratios/Supplemental Data | |
| | | | | | | | | | | | | | | | | | | | | | | | | | | | Ratios to Average
Net Assets
Before Credit/
Reimbursement | | | Ratios to Average
Net Assets After
Reimbursement(c) | | | Ratios to Average
Net Assets
After Credit/
Reimbursement(d) | | | | |
Year Ended
December 31, | | Beginning
Net
Asset
Value | | Net
Invest-
ment
Income(a) | | Net
Realized/
Unrealized
Gain
(Loss) | | | Total | | | Net
Invest-
ment
Income | | | Capital
Gains | | | Total | | | Ending
Net
Asset
Value | | | Total
Return(b) | | | Ending
Net
Assets
(000) | | Expenses | | | Net
Invest-
ment
Income | | | Expenses | | | Net
Invest-
ment
Income | | | Expenses | | | Net
Invest-
ment
Income | | | Portfolio
Turnover
Rate | |
| Class A (12/06) | | | | | | | | | | | | | | | | | | | | | | | | | | | | | | | | | | | | | | | | | | | | | | | | | | | | | | |
2008(f) | | $ | 16.98 | | $ | .59 | | $ | (.75 | ) | | $ | (.16 | ) | | $ | (.63 | ) | | $ | — | | | $ | (.63 | ) | | $ | 16.19 | | | (1.08 | )% | | $ | 782 | | 1.72 | %* | | 6.14 | %* | | .94 | %* | | 6.92 | %* | | .93 | %* | | 6.93 | %* | | 78 | % |
2007 | | | 20.01 | | | 1.08 | | | (3.03 | ) | | | (1.95 | ) | | | (1.08 | ) | | | — | | | | (1.08 | ) | | | 16.98 | | | (10.12 | ) | | | 321 | | 2.50 | | | 4.23 | | | 1.13 | | | 5.60 | | | 1.07 | | | 5.66 | | | 179 | |
2006(e) | | | 20.00 | | | .03 | | | (.02 | ) | | | .01 | | | | — | | | | — | | | | — | | | | 20.01 | | | .05 | | | | 275 | | 18.18 | * | | (12.06 | )* | | 1.23 | * | | 4.88 | * | | 1.23 | * | | 4.88 | * | | — | |
| Class C (12/06) | | | | | | | | | | | | | | | | | | | | | | | | | | | | | | | | | | | | | | | | | | | | | | | | | | | | | | |
2008(f) | | | 16.96 | | | .53 | | | (.75 | ) | | | (.22 | ) | | | (.57 | ) | | | — | | | | (.57 | ) | | | 16.17 | | | (1.45 | ) | | | 402 | | 2.47 | * | | 5.39 | * | | 1.69 | * | | 6.18 | * | | 1.68 | * | | 6.19 | * | | 78 | |
2007 | | | 20.01 | | | .93 | | | (3.03 | ) | | | (2.10 | ) | | | (.95 | ) | | | — | | | | (.95 | ) | | | 16.96 | | | (10.85 | ) | | | 245 | | 3.29 | | | 3.39 | | | 1.89 | | | 4.79 | | | 1.83 | | | 4.85 | | | 179 | |
2006(e) | | | 20.00 | | | .03 | | | (.02 | ) | | | .01 | | | | — | | | | — | | | | — | | | | 20.01 | | | .05 | | | | 275 | | 18.93 | * | | (12.82 | )* | | 1.99 | * | | 4.12 | * | | 1.99 | * | | 4.12 | * | | — | |
| Class I (12/06)(g) | | | | | | | | | | | | | | | | | | | | | | | | | | | | | | | | | | | | | | | | | | | | | | | | | | | | | | |
2008(f) | | | 16.98 | | | .60 | | | (.74 | ) | | | (.14 | ) | | | (.65 | ) | | | — | | | | (.65 | ) | | | 16.19 | | | (.94 | ) | | | 45,883 | | 1.41 | * | | 6.38 | * | | .69 | * | | 7.10 | * | | .68 | * | | 7.11 | * | | 78 | |
2007 | | | 20.01 | | | 1.18 | | | (3.08 | ) | | | (1.90 | ) | | | (1.13 | ) | | | — | | | | (1.13 | ) | | | 16.98 | | | (9.91 | ) | | | 19,769 | | 1.80 | | | 5.28 | | | .78 | | | 6.30 | | | .72 | | | 6.36 | | | 179 | |
2006(e) | | | 20.00 | | | .04 | | | (.03 | ) | | | .01 | | | | — | | | | — | | | | — | | | | 20.01 | | | .05 | | | | 4,178 | | 17.92 | * | | (11.81 | )* | | .98 | * | | 5.13 | * | | .98 | * | | 5.13 | * | | — | |
| (a) | Per share Net Investment Income is calculated using the average daily shares method. |
| (b) | Total return is the combination of changes in net asset value without any sales charge, reinvested dividend income at net asset value and reinvested capital gains distributions at net asset value, if any. Total returns are not annualized. |
| (c) | After expense reimbursement from the Adviser, where applicable. |
| (d) | After custodian fee credit and expense reimbursement, where applicable. |
| (e) | For the period December 19, 2006 (commencement of operations) through December 31, 2006. |
| (f) | For the six months ended June 30, 2008. |
| (g) | Effective May 1, 2008, Class R Shares were renamed Class I Shares. |
See accompanying notes to financial statements.
19
Annual Investment Management Agreement Approval Process
The Investment Company Act of 1940, as amended (the “1940 Act”), provides, in substance, that each investment advisory agreement between a fund and its investment adviser will continue in effect from year to year only if its continuance is approved at least annually by the fund’s board members, including by a vote of a majority of the board members who are not parties to the advisory agreement or “interested persons” of any parties (the “Independent Board Members”), cast in person at a meeting called for the purpose of considering such approval. In connection with such approvals, the fund’s board members must request and evaluate, and the investment adviser is required to furnish, such information as may be reasonably necessary to evaluate the terms of the advisory agreement. Accordingly, at a meeting held on May 28-29, 2008 (the “May Meeting”), the Board of Trustees (the “Board” and each Trustee, a “Board Member”) of the Fund, including a majority of the Independent Board Members, considered and approved the continuation of the advisory agreement (the “Advisory Agreement”) between the Fund and Nuveen Asset Management (“NAM”) for an additional one-year period. In preparation for their considerations at the May Meeting, the Board also held a separate meeting on April 23, 2008 (the “April Meeting”). Accordingly, the factors considered and determinations made regarding the renewals by the Independent Board Members include those made at the April Meeting.
In addition, in evaluating the Advisory Agreement as described in further detail below, the Independent Board Members reviewed a broad range of information relating to the Fund and NAM, including absolute performance, fee and expense information for the Fund as well as comparative performance, fee and expense information for a comparable peer group of funds, the performance information of recognized and/or customized benchmarks (as applicable), the profitability of Nuveen for its advisory activities (which includes its wholly owned subsidiaries), and other information regarding the organization, personnel, and services provided by NAM. The Independent Board Members also met quarterly as well as at other times as the need arose during the year and took into account the information provided at such meetings and the knowledge gained therefrom. Prior to approving the renewal of the Advisory Agreement, the Independent Board Members reviewed the foregoing information with their independent legal counsel and with management, reviewed materials from independent legal counsel describing applicable law and their duties in reviewing advisory contracts, and met with independent legal counsel in private sessions without management present. The Independent Board Members considered the legal advice provided by independent legal counsel and relied upon their knowledge of NAM, its services and the Fund resulting from their meetings and other interactions throughout the year and their own business judgment in determining the factors to be considered in evaluating the Advisory Agreement. Each Board Member may have accorded different weight to the various factors in reaching his or her conclusions with respect to the Fund’s Advisory Agreement. The Independent Board Members did not identify any single factor as all-important or controlling. The Independent Board Members’ considerations were instead based on a comprehensive consideration of all the information presented. The principal factors considered by the Board and its conclusions are described below.
A. Nature, Extent and Quality of Services
In considering renewal of the Advisory Agreement, the Independent Board Members considered the nature, extent and quality of NAM’s services, including advisory services and administrative services. The Independent Board Members reviewed materials outlining, among other things, NAM’s organization and business; the types of services that NAM or its affiliates provide and are expected to provide to the Fund; the performance record of the Fund (as described in further detail below); and any initiatives Nuveen had taken for the applicable fund product line. With respect to personnel, the Independent Board Members evaluated the background, experience and track record of NAM’s investment personnel. In this regard, the Independent Board Members considered the additional investment in personnel to support Nuveen fund advisory activities, including in operations, product management and marketing as well as related fund support functions, including sales, executive, finance, human resources and information technology. The Independent Board Members also reviewed information regarding portfolio manager compensation arrangements to evaluate NAM’s ability to attract and retain high quality investment personnel.
In evaluating the services of NAM, the Independent Board Members also considered NAM’s ability to supervise the Fund’s other service providers and given the importance of compliance, NAM’s compliance program. Among other things, the Independent Board Members considered the report of the chief compliance officer regarding the Fund’s compliance policies and procedures.
In addition to advisory services, the Independent Board Members considered the quality of administrative services provided by NAM and its affiliates including product management, fund administration, oversight of service providers, shareholder services, administration of Board relations, regulatory and portfolio compliance and legal support.
Based on their review, the Independent Board Members found that, overall, the nature, extent and quality of services provided (and expected to be provided) to the Fund under the Advisory Agreement were satisfactory.
B. The Investment Performance of the Fund and NAM
The Board considered the investment performance of the Fund, including the Fund’s historic performance as well as its performance compared to funds with similar investment objectives (the “Performance Peer Group”) based on data provided by an independent third party (as described below). In addition, the Independent Board Members reviewed the Fund’s historic performance compared to recognized and/or customized benchmarks (as applicable).
In evaluating the performance information, the Board considered whether the Fund has operated within its investment objectives and parameters and the impact that the investment mandates may have had on performance. In addition, in comparing the Fund’s performance with that of its Performance Peer Group, the Independent Board Members took into account that the closest
20
Annual Investment Management Agreement Approval Process (continued)
Performance Peer Group in certain instances may not adequately reflect the respective fund’s investment objectives and strategies thereby hindering a meaningful comparison of the fund’s performance with that of the Performance Peer Group. These Performance Peer Groups include that of the Fund.
The Independent Board Members reviewed performance information including, among other things, total return information compared with the Fund’s Performance Peer Group as well as recognized and/or customized benchmarks (as appropriate) for the one-, three- and five-year periods (as applicable) ending December 31, 2007 and with the Fund’s Performance Peer Group for the quarter, one-, three-, and five- year periods ending March 31, 2008 (as applicable). This information supplemented the Fund performance information provided to the Board at each of its quarterly meetings. Based on their review, the Independent Board Members determined that the Fund’s investment performance over time had been satisfactory.
C. Fees, Expenses and Profitability
1. Fees and Expenses
The Board evaluated the management fees and expenses of the Fund reviewing, among other things, the Fund’s gross management fees (which take into account breakpoints), net management fees (which take into account fee waivers or reimbursements) and total expense ratios (before and after expense reimbursements and/or waivers) in absolute terms as well as compared to the gross management fees, net management fees (after waivers and/or reimbursements) and total expense ratios (before and after waivers) of a comparable universe of unaffiliated funds based on data provided by an independent data provider (the “Peer Universe”) and/or a more focused subset of funds therein (the “Peer Group”). The Independent Board Members further reviewed data regarding the construction of Peer Groups as well as the methods of measurement for the fee and expense analysis and the performance analysis. In reviewing the comparisons of fee and expense information, the Independent Board Members took into account that in certain instances various factors such as the size of the Fund relative to peers, the size and particular composition of the Peer Group, the investment objectives of the peers, expense anomalies, and the timing of information used may impact the comparative data, thereby limiting the ability to make a meaningful comparison. In reviewing the fee schedule for the Fund, the Independent Board Members also considered the fund-level and complex-wide breakpoint schedules (described in further detail below) and any fee waivers and reimbursements provided by Nuveen. Based on their review of the fee and expense information provided, the Independent Board Members determined that the Fund’s management fees and net total expense ratio were reasonable in light of the nature, extent and quality of services provided to the Fund.
2. Comparisons with the Fees of Other Clients
The Independent Board Members further reviewed information regarding the nature of services and fee rates offered by NAM to other clients. Such clients include separately managed accounts (both retail and institutional accounts) and funds that are not offered by Nuveen but are sub-advised by one of Nuveen’s investment management teams. In evaluating the comparisons of fees, the Independent Board Members noted that the fee rates charged to the Fund and other clients vary, among other things, because of the different services involved and the additional regulatory and compliance requirements associated with registered investment companies, such as the Fund. Accordingly, the Independent Board Members considered the differences in the product types, including, but not limited to, the services provided, the structure and operations, product distribution and costs thereof, portfolio investment policies, investor profiles, account sizes and regulatory requirements. The Independent Board Members noted, in particular, that the range of services provided to the Fund (as discussed above) is much more extensive than that provided to separately managed accounts. Given the inherent differences in the products, particularly the extensive services provided to the Fund, the Independent Board Members believe such facts justify the different levels of fees.
3. Profitability of Nuveen
In conjunction with its review of fees, the Independent Board Members also considered the profitability of Nuveen for its advisory activities (which incorporated Nuveen’s wholly-owned affiliated sub-advisers) and its financial condition. The Independent Board Members reviewed the revenues and expenses of Nuveen’s advisory activities for the last two years and the allocation methodology used in preparing the profitability data. The Independent Board Members noted this information supplemented the profitability information requested and received during the year to help keep them apprised of developments affecting profitability (such as changes in fee waivers and expense reimbursement commitments). In this regard, the Independent Board Members noted that they had also appointed an Independent Board Member as a point person to review and keep them apprised of changes to the profitability analysis and/or methodologies during the year. The Independent Board Members considered Nuveen’s profitability compared with other fund sponsors prepared by two independent third party service providers as well as comparisons of the revenues, expenses and profit margins of various unaffiliated management firms with similar amounts of assets under management prepared by Nuveen.
In reviewing profitability, the Independent Board Members recognized the subjective nature of determining profitability which may be affected by numerous factors including the allocation of expenses. Further, the Independent Board Members recognized the difficulties in making comparisons as the profitability of other advisers generally is not publicly available and the profitability information that is available for certain advisers or management firms may not be representative of the industry and may be affected by, among other things, the adviser’s particular business mix, capital costs, types of funds managed and expense allocations.
21
Notwithstanding the foregoing, the Independent Board Members reviewed Nuveen’s methodology and assumptions for allocating expenses across product lines to determine profitability. In reviewing profitability, the Independent Board Members recognized Nuveen’s investment in its fund business.
Based on its review, the Independent Board Members concluded that Nuveen’s level of profitability for its advisory activities was reasonable in light of the services provided.
In evaluating the reasonableness of the compensation, the Independent Board Members also considered other amounts paid to NAM by the Fund as well as any indirect benefits (such as soft dollar arrangements, if any) NAM and its affiliates receive, or are expected to receive, that are directly attributable to the management of the Fund, if any. See Section E below for additional information on indirect benefits NAM may receive as a result of its relationship with the Fund. Based on their review of the overall fee arrangements of the Fund, the Independent Board Members determined that the advisory fees and expenses of the Fund were reasonable.
D. Economies of Scale and Whether Fee Levels Reflect These Economies of Scale
With respect to economies of scale, the Independent Board Members recognized the potential benefits resulting from the costs of a fund being spread over a larger asset base. The Independent Board Members therefore considered whether the Fund has appropriately benefited from any economies of scale and whether there is potential realization of any further economies of scale. In considering economies of scale, the Independent Board Members have recognized that economies of scale are difficult to measure and predict with precision, particularly on a fund-by-fund basis. Notwithstanding the foregoing, one method to help ensure the shareholders share in these benefits is to include breakpoints in the advisory fee schedule. Accordingly, the Independent Board Members reviewed and considered the fund-level breakpoints in the advisory fee schedules that reduce advisory fees.
In addition to fund-level advisory fee breakpoints, the Board also considered the Fund’s complex-wide fee arrangement. Pursuant to the complex-wide fee arrangement, the fees of the funds in the Nuveen complex, including the Fund, are reduced as the assets in the fund complex reach certain levels. In evaluating the complex-wide fee arrangement, the Independent Board Members recognized that the complex-wide fee schedule was recently revised in 2007 to provide for additional fee savings to shareholders and considered the amended schedule. The Independent Board Members further considered that the complex-wide fee arrangement seeks to provide the benefits of economies of scale to fund shareholders when total fund complex assets increase, even if assets of a particular fund are unchanged or have decreased. The approach reflects the notion that some of Nuveen’s costs are attributable to services provided to all its funds in the complex and therefore all funds benefit if these costs are spread over a larger asset base. Based on their review, the Independent Board Members concluded that the breakpoint schedule and complex-wide fee arrangement were acceptable and desirable in providing benefits from economies of scale to shareholders.
E. Indirect Benefits
In evaluating fees, the Independent Board Members received and considered information regarding potential “fall out” or ancillary benefits NAM or its affiliates may receive as a result of its relationship with each Fund. In this regard, the Independent Board Members considered, among other things, any sales charges, distribution fees and shareholder services fees received and retained by the Fund’s principal underwriter, an affiliate of NAM, which includes fees received pursuant to any 12b-1 plan. The Independent Board Members, therefore, considered the 12b-1 fees retained by Nuveen during the last calendar year.
In addition to the above, the Independent Board Members considered whether NAM received any benefits from soft dollar arrangements whereby a portion of the commissions paid by the Fund for brokerage may be used to acquire research that may be useful to NAM in managing the assets of the Fund and other clients. In this regard, the Independent Board Members noted that NAM does not currently have any soft dollar arrangements; however, to the extent certain bona fide agency transactions that occur on markets that traditionally trade on a principal basis and riskless principal transactions are considered as generating “commissions,” NAM intends to comply with the applicable safe harbor provisions.
Based on their review, the Independent Board Members concluded that any indirect benefits received by NAM as a result of its relationship with the Fund were reasonable and within acceptable parameters.
F. Other Considerations
The Independent Board Members did not identify any single factor discussed previously as all-important or controlling. The Board Members, including the Independent Board Members, unanimously concluded that the terms of the Advisory Agreement are fair and reasonable, that NAM’s fees are reasonable in light of the services provided to the Fund and that the Advisory Agreement be renewed.
22
Notes
23
Glossary of Terms Used in this Report
Auction Rate Bond: An auction rate bond is a security whose interest payments are adjusted periodically through an auction process, which process typically also serves as a means for buying and selling the bond. Auctions that fail to attract enough buyers for all the shares offered for sale are deemed to have “failed”, with current holders receiving a formula-based interest rate until the next scheduled auction.
Average Annual Total Return: This is a commonly used method to express an investment’s performance over a particular, usually multi-year time period. It expresses the return that would have been necessary each year to equal the investment’s actual cumulative performance (including change in NAV or offer price and reinvested dividends and capital gains distributions, if any) over the time period being considered.
Average Effective Maturity: The average of the number of years to maturity of the bonds in a Fund’s portfolio, computed by weighting each bond’s time to maturity (the date the security comes due) by the market value of the security. This figure does not account for the likelihood of prepayments or the exercise of call provisions unless an escrow account has been established to redeem the bond before maturity.
Average Duration: Duration is a measure of the expected period over which a bond’s principal and interest will be paid, and consequently is a measure of the sensitivity of a bond’s (or bond fund’s) value to changes when market interest rates change. Generally, the longer a bond or Fund’s duration, the more the price of the bond or Fund will change as interest rates change.
Collateralized Debt Obligations (CDOs): Collateralized debt obligations are a type of asset-backed security constructed from a portfolio of fixed-income assets. CDOs usually are divided into different tranches having different ratings and paying different interest rates. Losses, if any, are applied in reverse order of seniority and so junior tranches generally offer higher coupons to compensate for added default risk.
Dividend Yield (also known as Market Yield or Current Yield): An investment’s current annualized dividend divided by its current offering price.
Hybrid Securities: A hybrid security combines two or more different financial instruments. Hybrid securities generally combine both debt and equity characteristics.
Net Asset Value (NAV): A Fund’s NAV is the dollar value of one share in the Fund. It is calculated by subtracting the liabilities of the Fund from its total assets and then dividing the remainder by the number of shares outstanding. Fund NAVs are calculated at the end of each business day.
SEC 30-Day Yield: A standardized measure of a Fund’s yield that accounts for the future amortization of premiums or discounts of bonds held in the Fund’s portfolio.
24
Fund Information
| | | | |
| | |
Fund Manager Nuveen Asset Management 333 West Wacker Drive Chicago, IL 60606 | | Legal Counsel Chapman and Cutler LLP Chicago, IL Independent Registered Public Accounting Firm Ernst & Young LLP Chicago, IL Custodian State Street Bank & Trust Company Boston, MA | | Transfer Agent and Shareholder Services Boston Financial Data Services, Inc. Nuveen Investor Services P.O. Box 8530 Boston, MA 02266-8530 (800) 257-8787 |
Quarterly Portfolio of Investments and Proxy Voting Information: You may obtain (i) the Fund’s quarterly portfolio of investments, (ii) information regarding how the Fund voted proxies relating to portfolio securities held during the most recent twelve-month period ended June 30, 2008, and (iii) a description of the policies and procedures that the Fund used to determine how to vote proxies relating to portfolio securities without charge, upon request, by calling Nuveen Investments at (800) 257-8787 or on Nuveen’s website at www.nuveen.com.
You may also obtain this and other Fund information directly from the Securities and Exchange Commission (“SEC”). The SEC may charge a copying fee for this information. Visit the SEC on-line at http://www.sec.gov or in person at the SEC’s Public Reference Room in Washington, D.C. Call the SEC at (202) 942-8090 for room hours and operation. You may also request Fund information by sending an e-mail request to publicinfo@sec.gov or by writing to the SEC’s Public Reference Section at 100 F Street NE, Washington, D.C. 20549.
The Financial Industry Regulatory Authority (FINRA) provides a Public Disclosure Program which supplies certain information regarding the disciplinary history of FINRA members and their associated persons in response to either telephone inquiries at (800) 289-9999 or written inquiries at www.finra.org. Financial Industry Regulatory Authority also provides an investor brochure that includes information describing the Public Disclosure Program.
25
Learn more
about Nuveen Funds at
www.nuveen.com/mf
Nuveen Investments:
SERVING Investors
For GENERATIONS
Since 1898, financial advisors and their clients have relied on Nuveen Investments to provide dependable investment solutions. Over this time, Nuveen Investments has adhered to the belief that the best approach to investing is to apply conservative risk-management principles to help minimize volatility.
Building on this tradition, we today offer a range of high quality equity and fixed-income solutions that can be integral parts of a well-diversified core portfolio. Our clients have come to appreciate this diversity, as well as our continued adherence to proven, long-term investing principles.
We offer many different investing solutions for our clients’ different needs.
Nuveen Investments is a global investment management firm that seeks to help secure the long-term goals of institutions and high net worth investors as well as the consultants and financial advisors who serve them. Nuveen Investments markets its growing range of specialized investment solutions under the high-quality brands of HydePark, NWQ, Nuveen, Rittenhouse, Santa Barbara, Symphony and Tradewinds. In total, the Company managed $152 billion of assets on June 30, 2008.
Find out how we can help you reach your financial goals.
An investor should carefully consider the Fund’s objectives, risks, charges and expenses before investing. For a prospectus containing this and other information about the Fund, please contact your financial advisor or Nuveen Investments at (800) 257-8787. Read the prospectus carefully before you invest or send money.
MSA-INV5-0608D
Item 2. Code of Ethics.
Not applicable to this filing.
Item 3. Audit Committee Financial Expert.
Not applicable to this filing.
Item 4. Principal Accountant Fees and Services.
Not applicable to this filing.
Item 5. Audit Committee of Listed Registrants
Not applicable to this registrant.
Item 6. Schedule of Investments
See Portfolio of Investments in Item 1
Item 7. Disclosure of Proxy Voting Policies and Procedures for Closed-End Management Investment Companies
Not applicable to this registrant.
Item 8. Portfolio Managers of Closed-End Management Investment Companies
Not applicable to this registrant.
Item 9. Purchases of Equity Securities by Closed-End Management Investment Company and Affiliated Purchasers
Not applicable to this registrant.
Item 10. Submission of Matters to a Vote of Security Holders
There have been no material changes to the procedures by which shareholders may recommend nominees to the registrant’s Board implemented after the registrant last provided disclosure in response to this Item.
Item 11. Controls and Procedures.
| (a) | The registrant’s principal executive and principal financial officers, or persons performing similar functions, have concluded that the registrant’s disclosure controls and procedures (as defined in Rule 30a-3(c) under the Investment Company Act of 1940, as amended (the “1940 Act”) (17 CFR 270.30a-3(c))) are effective, as of a date within 90 days of the filing date of this report that includes the disclosure required by this paragraph, based on their evaluation of the controls and procedures required by Rule 30a-3(b) under the 1940 Act (17 CFR 270.30a-3(b)) and Rules 13a-15(b) or 15d-15(b) under the Securities Exchange Act of 1934, as amended (the “Exchange Act”) (17 CFR 240.13a-15(b) or 240.15d-15(b)). |
| (b) | There were no changes in the registrant’s internal control over financial reporting (as defined in Rule 30a-3(d) under the 1940 Act (17 CFR 270.30a-3(d)) that occurred during the second fiscal quarter of the period covered by this report that has materially affected, or is reasonably likely to materially affect, the registrant’s internal control over financial reporting. |
Item 12. Exhibits
File the exhibits listed below as part of this Form.
(a)(1) Any code of ethics, or amendment thereto, that is the subject of the disclosure required by Item 2, to the extent that the registrant intends to satisfy the Item 2 requirements through filing of an exhibit: Not applicable to this filing.
(a)(2) A separate certification for each principal executive officer and principal financial officer of the registrant as required by Rule 30a-2(a) under the 1940 Act (17 CFR 270.30a-2(a)) in the exact form set forth below: EX-99.CERT Attached hereto.
(a)(3) Any written solicitation to purchase securities under Rule 23c-1 under the 1940 Act (17 CFR 270.23c-1) sent or given during the period covered by the report by or on behalf of the registrant to 10 or more persons: Not applicable to this registrant.
(b) If the report is filed under Section 13(a) or 15(d) of the Exchange Act, provide the certifications required by Rule 30a-2(b) under the 1940 Act (17 CFR 270.30a-2(b)), Rule 13a-14(b) or Rule 15d-14(b) under the Exchange Act (17 CFR 240.13a-14(b) or 240.15d-14(b)), and Section 1350 of Chapter 63 of Title 18 of the United States Code (18 U.S.C. 1350) as an Exhibit. A certification furnished pursuant to this paragraph will not be deemed “filed” for purposes of Section 18 of the Exchange Act (15 U.S.C. 78r), or otherwise subject to the liability of that section. Such certification will not be deemed to be incorporated by reference into any filing under the Securities Act of 1933 or the Exchange Act, except to the extent that the registration specifically incorporates it by reference. EX-99.906 CERT attached hereto.
SIGNATURES
Pursuant to the requirements of the Securities Exchange Act of 1934 and the Investment Company Act of 1940, the registrant has duly caused this report to be signed on its behalf by the undersigned, thereunto duly authorized.
(Registrant) Nuveen Investment Trust V
| | | | | | |
| By | | (Signature and Title)* | | /s/ Kevin J. McCarthy | | |
| | | | Kevin J. McCarthy Vice President and Secretary | | |
Date September 8, 2008
Pursuant to the requirements of the Securities Exchange Act of 1934 and the Investment Company Act of 1940, this report has been signed below by the following persons on behalf of the registrant and in the capacities and on the dates indicated.
| | | | | | |
| By | | (Signature and Title)* | | /s/ Gifford R. Zimmerman | | |
| | | | Gifford R. Zimmerman Chief Administrative Officer (principal executive officer) | | |
Date September 8, 2008
| | | | | | |
| By | | (Signature and Title)* | | /s/ Stephen D. Foy | | |
| | | | Stephen D. Foy Vice President and Controller (principal financial officer) | | |
Date September 8, 2008
| * | Print the name and title of each signing officer under his or her signature. |