UNITED STATES
SECURITIES AND EXCHANGE COMMISSION
Washington, D.C. 20549
FORM N-CSR
CERTIFIED SHAREHOLDER REPORT OF REGISTERED MANAGEMENT
INVESTMENT COMPANIES
Investment Company Act file number 811-021979
Nuveen Investment Trust V
(Exact name of registrant as specified in charter)
Nuveen Investments
333 West Wacker Drive Chicago, IL 60606
(Address of principal executive offices) (Zip code)
Kevin J. McCarthy
Nuveen Investments
333 West Wacker Drive Chicago, IL 60606
(Name and address of agent for service)
Registrant’s telephone number, including area code: (312) 917-7700
Date of fiscal year end: September 30
Date of reporting period: March 31, 2010
Form N-CSR is to be used by management investment companies to file reports with the Commission not later than 10 days after the transmission to stockholders of any report that is required to be transmitted to stockholders under Rule 30e-1 under the Investment Company Act of 1940 (17 CFR 270.30e-1). The Commission may use the information provided on Form N-CSR in its regulatory, disclosure review, inspection, and policy making roles.
A registrant is required to disclose the information specified by Form N-CSR, and the Commission will make this information public. A registrant is not required to respond to the collection of information contained in Form N-CSR unless the Form displays a currently valid Office of Management and Budget (“OMB”) control number. Please direct comments concerning the accuracy of the information collection burden estimate and any suggestions for reducing the burden to Secretary, Securities and Exchange Commission, 450 Fifth Street, NW, Washington, DC 20549-0609. The OMB has reviewed this collection of information under the clearance requirements of 44 U.S.C. ss.3507.
Item 1. Reports to Stockholders.

Mutual Funds
Nuveen Taxable Fixed Income Funds
For investors seeking a high level of current income and total return.
Semi-Annual Report
March 31, 2010
|
| Nuveen Preferred Securities Fund |
LIFE IS COMPLEX.
Nuveen makes things e-simple.
It only takes a minute to sign up for e-Reports. Once enrolled, you’ll receive an e-mail as soon as your Nuveen Fund information is ready. No more waiting for delivery by regular mail. Just click on the link within the e-mail to see the report and save it on your computer if you wish.
Free e-Reports right to your e-mail!
www.investordelivery.com
If you receive your Nuveen Fund dividends and statements from your financial advisor or brokerage account.
OR
www.nuveen.com/accountaccess
If you receive your Nuveen Fund dividends and statements directly from Nuveen.
| | | | | | |
| Must be preceded by or accompanied by a prospectus. | | NOT FDIC INSURED | | MAY LOSE VALUE | | NO BANK GUARANTEE |
Chairman’s
Letter to Shareholders

Dear Shareholder,
The economic environment in which your Fund operates reflects continuing but uneven
economic recovery. The U.S. and other major industrial countries are experiencing steady but comparatively low levels of economic growth, while emerging market countries are seeing a resumption of relatively strong economic expansion. The largest source of economic uncertainty is the potential impact of steps being considered by many governments to counteract the extraordinary governmental spending and credit expansion carried out to deal with the financial and economic crisis of 2008. Consequently, the implications for future tax rates, government spending, interest rates and the pace of economic recovery in the U.S. and other leading economies are extremely difficult to predict at the present time. The long term health of the global economy depends on restoring some measure of fiscal discipline around the world, but since all of the corrective steps require economic pain, it is not surprising that governments are reluctant to undertake them.
In the near term, governments remain committed to furthering economic recovery and realizing a meaningful reduction in their national unemployment rates. Such an environment should produce continued economic growth and, consequently, attractive investment opportunities. Over the longer term, the larger uncertainty mentioned earlier carries the risk of unexpected potholes in the road to sustained recovery. For this reason, Nuveen’s investment management teams are working hard to balance return and risk by building well-diversified portfolios, among other strategies. I encourage you to read the following commentary on the management of your Fund. As always, I also encourage you to contact your financial consultant if you have any questions about your Nuveen Fund investment.
On behalf of the other members of your Fund’s Board, we look forward to continuing to
earn your trust in the months and years ahead.
Sincerely,

Robert P. Bremner
Chairman of the Board
May 21, 2010
Portfolio Manager’s Comments
Certain statements in this report are forward-looking statements. Discussions of specific investments are for illustration only and are not intended as recommendations of individual investments. The forward looking statements and other views expressed herein are those of the portfolio manager as of the date of this report. Actual future results or occurrences may differ significantly from those anticipated in any forward-looking statements and the views expressed herein are subject to change at any time, due to numerous market and other factors. The Fund disclaims any obligation to update publicly or revise any forward-looking statements or views expressed herein.
The Nuveen Preferred Securities Fund features management by Nuveen Asset Management (NAM), an affiliate of Nuveen Investments. Douglas Baker, CFA, has served as the Fund’s portfolio manager since its inception in 2006, and has more than ten years of investment industry experience. Here Doug discusses the Fund’s performance and investment strategy for the six-month period ended March 31, 2010.
How did the Fund perform during the six-month period ended March 31, 2010?
As shown in the table on page three, the Fund’s Class A Shares at net asset value outperformed each of the comparative indexes during the six-month period ended March 31, 2010.
What strategies were used to manage the Fund during the reporting period?
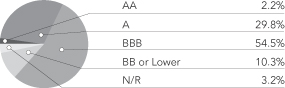
As has been the case for the past several quarters, the Fund continued to receive meaningful inflows during the six-month period ended March 31, 2010. Consistent with our investment process, the cash was invested in securities issued by firms that we deemed to have stable and/or improving credit profiles. These cash flows, coupled with active portfolio management, allowed us to implement strategies like continuing to overweight BBB and BB rated securities that helped the Fund meaningfully outperform its benchmark. Preferred securities typically are rated between three and five notches below the senior unsecured debt ratings of the same issuer, and as of March 31, 2010, the Fund had approximately 56% and 11% allocations to BBB and BB rated preferred securities, respectively, while the Benchmark Index had allocations of 40% and 0%, respectively.
During the first quarter of 2010, lower rated investment grade securities generally outperformed higher rated securities. While the BBB rated subsector of the Barclays Capital U.S. Corporate Bond Index returned 2.86% during the first quarter, the A-rated subsector of the same index only returned 1.78%.
Another factor which helped the Fund outperform the Benchmark Index was our continued overweight to insurance companies, and a corresponding underweight to banks. During the period, the insurance subsector of the Barclays Capital USD Capital Securities Index returned 10.4%, while the bank subsector of the same index returned only 4.25%.
It is the investment team’s opinion that valuations have meaningfully converged between the $25 par retail market and the $1000 par institutional market as of March 31, 2010. As a result, the Fund has adjusted its allocation between the two sectors to be more closely aligned with the Benchmark Index’s allocation of 65% $25 par and 35% $1000 par. As of
| * | Since inception returns for the Fund are as of 12/19/06. Since inception returns for the Indexes are as of 12/31/06. |
| 1 | The Merrill Lynch Hybrid Securities Index is an unmanaged index consisting of a set of investment grade exchange-traded preferred stocks with outstanding market values of at least $50 million that are covered by Merrill Lynch Fixed Income Research. The index includes certain publicly issued, $25- and $1000-par securities with at least one year to maturity. The returns assume reinvestment of dividends and do not reflect any applicable sales charges. You cannot invest directly in an index. |
| 2 | The Market Benchmark Index is comprised of a 60% weighting in the Merrill Lynch Hybrid Securities Index, a 35% weighting in the Barclays Capital USD Capital Securities Index and a 5% weighting in the Merrill Lynch REIT Preferred Stock Index. The Merrill Lynch Hybrid Securities Index is an unmanaged index consisting of a set of investment grade exchange-traded preferred stocks with outstanding market values of at least $50 million that are covered by Merrill Lynch Fixed Income Research. The Barclays Capital USD Capital Securities Index contains securities generally viewed as hybrid fixed income securities that either receive regulatory capital treatment or a degree of “equity credit” from the rating agencies. This generally includes Tier 2/Lower Tier 2 bonds, perpetual step-up debt, step-up preferred securities, and term preferred securities. The Merrill Lynch REIT Preferred Stock Index is an unmanaged index of investment grade REIT preferred shares with a deal size in excess of $100 million, weighted by capitalization and considered representative of investment grade preferred real estate stock performance. The returns assume reinvestment of dividends and do not reflect any applicable sales charges. You cannot invest directly in an index. |
| 3 | Barclays Capital U.S. Corporate Bond Index covers U.S. dollar-denominated, investment-grade, fixed-rate, taxable securities sold by industrial, utility, and financial issuers. It includes publicly issued U.S. corporate debentures and secured notes that meet specific maturity, liquidity, and quality requirements. The returns assume reinvestment of dividends and do not reflect any applicable sales charges. You cannot invest directly in an index. |
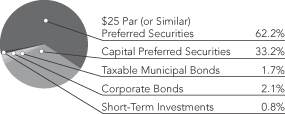
month-end December 2009, the Fund was roughly 54% in $25 par and 46% in $1000 par securities. In contrast, as of month-end March 2010 the Fund was roughly 62% in $25 par and 33% in $1000 par securities, with the remainder tactically allocated to taxable municipal securities.
Finally, the investment management team continued to reduce the Fund’s exposure to higher-equity content, perpetual maturity, Dividend Received Deduction (DRD) securities. This re-allocation began in earnest in late fourth quarter 2009. Our previous overweight to these high equity content structures was in response to opportunities provided to us by investor panic during first quarter 2009. Since these structures typically contain non-cumulative distribution language, investors fled the structures in February and March 2009 as headlines suggested dividend deferrals for preferred securities issued by bank and insurance companies were imminent. Over the ensuing few quarters, these high-equity content securities outperformed competing preferred / hybrid structures. As a result, and due to current valuations, during this reporting period we continued to pare back some of our exposure to these structures. We redeployed the proceeds to other structures which we feel offer more relative value opportunity to our Fund shareholders. As always, we continually evaluate the relative valuation merits of different preferred / hybrid security structures and, as a result, we may discontinue (or accelerate) this reallocation program as market conditions dictate.
Class A Shares – Average Annual Total Returns as of 3/31/10
| | | | | | |
| | | Cumulative | | Average Annual |
| | | 6-Month | | 1-Year | | Since
inception* |
Nuveen Preferred Securities Fund | | | | | | |
A Shares at NAV | | 13.33% | | 98.71% | | 1.16% |
A Shares at Offer | | 7.98% | | 89.24% | | -0.33% |
Merrill Lynch Hybrid Securities Index1 | | 8.53% | | 57.62% | | -1.44% |
Market Benchmark Index2 | | 8.57% | | 56.67% | | 0.78% |
Barclays Capital U.S. Corporate Bond Index3 | | 3.67% | | 23.8% | | 5.76% |
Six-month returns are cumulative; one-year and since inception returns are annualized.
Returns quoted represent past performance which is no guarantee of future results. Current performance may be higher or lower than the performance shown. Investment returns and principal value will fluctuate so that when shares are redeemed, they may be worth more or less than their original cost. Class A Shares have a 4.75% maximum sales charge. Returns at NAV would be lower if the sales charge were included. Returns do not reflect the deduction of taxes that a shareholder would pay on Fund distributions or the redemption of shares. Returns may reflect a contractual agreement between the Fund and the investment adviser to waive certain fees and expenses; see Notes to Financial Statements, Footnote 7 – Management Fees and Other Transactions with Affiliates for more information. In addition, returns may reflect a voluntary expense limitation by the Fund’s investment adviser that may be modified or discontinued at any time without notice. For the most recent month-end performance, visit www.nuveen.com or call (800) 257-8787.
Please see the Fund’s Spotlight Page later in this report for more complete performance data and expense ratios.
Fund Spotlight as of 3/31/10 Nuveen Preferred Securities Fund
| | | | | | | | |
| Quick Facts | | | | | | | | |
| | | A Shares | | C Shares | | R3 Shares | | I Shares |
Fund Symbols | | NPSAX | | NPSCX | | NPSTX | | NPSRX |
NAV | | $16.09 | | $16.10 | | $16.20 | | $16.09 |
Latest Monthly Dividend1 | | $0.0940 | | $0.0845 | | $.0915 | | $0.0970 |
Inception Date | | 12/19/06 | | 12/19/06 | | 9/29/09 | | 12/19/06 |
Returns quoted represent past performance which is no guarantee of future results. Investment returns and principal value will fluctuate so that when shares are redeemed, they may be worth more or less than their original cost. Current performance may be higher or lower than the performance shown. Returns without sales charges would be lower if the sales charge were included. Returns do not reflect the deduction of taxes that a shareholder would pay on Fund distributions or the redemption of shares. For the most recent month-end performance visit www.nuveen.com or call (800) 257-8787.
Class A, C and I Shares are actual. The returns for Class R3 are actual for the period since class inception on 9/29/09, returns prior to class inception are Class I Share returns adjusted for differences in sales charges and expenses, which are primarily differences in distribution and service fees. Fund returns assume reinvestment of dividends and capital gains. Class A Shares have a 4.75% maximum sales charge. Class A Share purchases of $1 million or more are sold at net asset value without an up-front sales charge but may be subject to a contingent deferred sales charge (CDSC), also known as a backend sales charge, if redeemed within twelve months of purchase. Class C Shares have a 1% CDSC for redemptions within less than one year, which is not reflected in the one-year total return. Class R3 Shares have no sales charge and will be available to only certain retirement plan clients of financial intermediaries. Class I Shares have no sales charge and may be purchased under limited circumstances or by specified classes of investors. Returns may reflect an expense limitation by the Fund’s investment adviser.
| | | | |
| Average Annual Total Returns as of 3/31/10 |
| | |
| A Shares | | NAV | | Offer |
1-Year | | 98.71% | | 89.24% |
Since Inception | | 1.16% | | -0.33% |
| | |
| C Shares | | NAV | | |
1-Year | | 97.44% | | |
Since Inception | | 0.43% | | |
| | |
| R3 Shares | | NAV | | |
1-Year | | 98.32% | | |
Since Inception | | 0.92% | | |
| | |
| I Shares | | NAV | | |
1-Year | | 99.19% | | |
Since Inception | | 1.42% | | |
| Yields |
| | |
| A Shares | | NAV | | Offer |
Dividend yield4 | | 7.01% | | 6.68% |
30-day yield4 | | 6.77% | | — |
SEC 30-day yield4,5 | | — | | 6.44% |
| | |
| C Shares | | NAV | | |
Dividend yield4 | | 6.30% | | |
30-day yield4 | | 6.01% | | |
| | |
| R3 Shares1 | | NAV | | |
Dividend yield4 | | 6.78% | | |
SEC 30-day yield4 | | 6.52% | | |
| | |
| I Shares | | NAV | | |
Dividend yield4 | | 7.23% | | |
SEC 30-day yield4 | | 7.02% | | |
| | |
| Top Five Issuers2: |
| JP Morgan Chase & Company | | 7.9% |
| Bank of America Corporation | | 6.0% |
| Wells Fargo and Company | | 5.4% |
| Citigroup Inc. | | 4.8% |
| Deutsche Bank AG | | 4.5% |
Portfolio Credit Quality2
Portfolio Allocation3
| | |
| Portfolio Statistics |
| Net Assets ($000) | | $456,950 |
| Average Duration | | 4.68 |
| Number of Positions/Holdings | | 213 |
| | | |
| | | | |
| Expense Ratios | | | | |
| Share Class | | Gross
Expense
Ratios | | Net
Expense
Ratios |
| Class A | | 1.47% | | 1.00% |
| Class C | | 2.23% | | 1.75% |
| Class R3 | | 1.37% | | 1.25% |
| Class I | | 1.21% | | 0.75% |
The expense ratios shown factor in Total Annual Fund Operating Expenses including management fees and other fees and expenses. The Net Expense Ratios reflect a contractual commitment by the Fund’s investment adviser to waive fees and reimburse expenses through May 31, 2011. The expense ratios are those shown in the most recent Fund prospectus.
| 2 | As a percentage of total investments (excluding short-term investments) as of March 31, 2010. Holdings are subject to change. |
| 3 | As a percentage of total investments as of March 31, 2010. Holdings are subject to change. |
| 4 | Dividend yield is the most recent dividend per share (annualized) divided by the appropriate price per share. The SEC 30-Day Yield is computed under an SEC standardized formula and is based on the maximum offer price per share. The 30-Day Yield is computed under the same formula but is based on the Net Asset Value (NAV) per share. The Dividend yield may differ from the SEC 30-Day yield because the Fund may be paying out more or less than it is earning and it may not include the effect of amortization of bond premium. |
| 5 | The SEC 30-Day Yield on A Shares at NAV applies only to A Shares purchased at no-load pursuant to the Fund’s policy permitting waiver of the A Share load in certain specified circumstances. |
Fund Spotlight as of 3/31/10 Nuveen Preferred Securities Fund
| | |
| Industries1 | | |
Commercial Banks | | 32.0% |
Insurance | | 25.7% |
Diversified Financial Services | | 22.3% |
Capital Markets | | 10.2% |
Repurchase Agreements | | 0.8% |
Other | | 9.0% |
| 1 | As a percentage of total investments as of March 31, 2010. Holdings are subject to change. |
Expense Example
As a shareholder of the Fund, you incur two types of costs: (1) transaction costs, including front and back end sales charges (loads) or redemption fees, where applicable; and (2) ongoing costs, including management fees; distribution and service (12b-1) fees, where applicable; and other Fund expenses. This Example is intended to help you understand your ongoing costs (in dollars) of investing in the Fund and to compare these costs with the ongoing costs of investing in other mutual funds.
The Example below is based on an investment of $1,000 invested at the beginning of the period and held for the period.
The information under “Actual Performance,” together with the amount you invested, allows you to estimate actual expenses incurred over the reporting period. Simply divide your account value by $1,000 (for example, an $8,600 account value divided by $1,000 = 8.60) and multiply the result by the cost shown for your share class, in the row entitled “Expenses Incurred During Period” to estimate the expenses incurred on your account during this period.
The information under “Hypothetical Performance,” provides information about hypothetical account values and hypothetical expenses based on the Fund’s actual expense ratio and an assumed rate of return of 5% per year before expenses, which is not the Fund’s actual return. The hypothetical account values and expenses may not be used to estimate the actual ending account balance or expense you incurred for the period. You may use this information to compare the ongoing costs of investing in the Fund and other Funds. To do so, compare this 5% hypothetical example with the 5% hypothetical examples that appear in the shareholder reports of the other funds.
Please note that the expenses shown in the table are meant to highlight your ongoing costs only and do not reflect any transactional costs, such as front and back end sales charges (loads) or redemption fees, where applicable. Therefore, the hypothetical information is useful in comparing ongoing costs only, and will not help you determine the relative total costs of owning different funds or share classes. In addition, if these transactional costs were included, your costs would have been higher.
| | | | | | | | | | | | | | | | | | | | | | | | | | |
| | | | | | | | | | | | | Hypothetical Performance |
| | | Actual Performance | | | | (5% return before expenses) |
| | | A Shares | | C Shares | | R3 Shares | | I Shares | | | | A Shares | | C Shares | | R3 Shares | | I Shares |
| Beginning Account Value (10/01/09) | | $ | 1,000.00 | | $ | 1,000.00 | | $ | 1,000.00 | | $ | 1,000.00 | | | | $ | 1,000.00 | | $ | 1,000.00 | | $ | 1,000.00 | | $ | 1,000.00 |
| Ending Account Value (3/31/10) | | $ | 1,133.30 | | $ | 1,129.30 | | $ | 1,132.80 | | $ | 1,135.40 | | | | $ | 1,020.29 | | $ | 1,016.55 | | $ | 1,019.05 | | $ | 1,021.54 |
| Expenses Incurred During Period | | $ | 4.95 | | $ | 8.92 | | $ | 6.27 | | $ | 3.62 | | | | $ | 4.68 | | $ | 8.45 | | $ | 5.94 | | $ | 3.43 |
For each class of the Fund, expenses are equal to the Fund’s annualized net expense ratio of 0.93%, 1.68%, 1.18% and 0.68% for Classes A, C, R3, and I, respectively, multiplied by the average account value over the period, multiplied by 182/365 (to reflect the one-half year period).
Portfolio of Investments (Unaudited)
Nuveen Preferred Securities Fund
March 31, 2010
| | | | | | | | | |
| Shares | | Description (1) | | Coupon | | Ratings (2) | | Value |
| | | | | | | | | |
| | $25 PAR (OR SIMILAR) PREFERRED SECURITIES – 62.7% | | | | | | | |
| | | | |
| | Capital Markets – 9.5% | | | | | | | |
| | | | |
| 73,725 | | Ameriprise Financial, Inc. | | 7.750% | | A | | $ | 1,954,450 |
| | | | |
| 11,862 | | BNY Capital Trust IV, Series E | | 6.875% | | A1 | | | 304,498 |
| | | | |
| 27,520 | | BNY Capital Trust V, Series F | | 5.950% | | A1 | | | 690,477 |
| | | | |
| 110,230 | | Credit Suisse | | 7.900% | | A3 | | | 2,853,855 |
| | | | |
| 74,079 | | Deutsche Bank Capital Funding Trust I | | 7.350% | | BBB+ | | | 1,784,563 |
| | | | |
| 57,664 | | Deutsche Bank Capital Funding Trust II | | 6.550% | | BBB+ | | | 1,318,776 |
| | | | |
| 389,651 | | Deutsche Bank Capital Funding Trust V | | 8.050% | | BBB+ | | | 9,924,411 |
| | | | |
| 4,100 | | Deutsche Bank Capital Funding Trust VIII | | 6.375% | | BBB+ | | | 95,899 |
| | | | |
| 291,270 | | Deutsche Bank Contingent Capital Trust III | | 7.600% | | BBB+ | | | 7,235,147 |
| | | | |
| 14,100 | | Goldman Sachs Group Inc., Series 2004-04 (SATURNS) | | 6.000% | | A2 | | | 299,202 |
| | | | |
| 2,179 | | Goldman Sachs Group Inc. | | 6.200% | | BBB | | | 54,911 |
| | | | |
| 46,801 | | Morgan Stanley Capital Trust III | | 6.250% | | BBB | | | 1,048,342 |
| | | | |
| 179,600 | | Morgan Stanley Capital Trust IV | | 6.250% | | BBB | | | 3,978,140 |
| | | | |
| 1,900 | | Morgan Stanley Capital Trust V | | 5.750% | | Baa2 | | | 39,273 |
| | | | |
| 166,510 | | Morgan Stanley Capital Trust VI | | 6.600% | | BBB | | | 3,907,990 |
| | | | |
| 226,329 | | Morgan Stanley Capital Trust VII | | 6.600% | | BBB | | | 5,214,620 |
| | | | |
| 111,921 | | Morgan Stanley Capital Trust VIII | | 6.450% | | BBB | | | 2,484,646 |
| | Total Capital Markets | | | | | | | 43,189,200 |
| | | | |
| | Commercial Banks – 19.5% | | | | | | | |
| | | | |
| 380,854 | | Banco Santander Finance | | 10.500% | | A– | | | 10,759,126 |
| | | | |
| 264,802 | | Barclays Bank PLC | | 8.125% | | A– | | | 6,816,003 |
| | | | |
| 14,234 | | Barclays Bank PLC | | 7.750% | | A– | | | 356,562 |
| | | | |
| 40,141 | | BB&T Capital Trust V | | 8.950% | | A3 | | | 1,091,835 |
| | | | |
| 201,900 | | BB&T Capital Trust VI | | 9.600% | | A3 | | | 5,794,530 |
| | | | |
| 37,375 | | BB&T Capital Trust VII | | 8.100% | | A3 | | | 995,670 |
| | | | |
| 330,250 | | Cobank Agricultural Credit Bank, 144A | | 7.000% | | N/R | | | 13,127,437 |
| | | | |
| 6,755 | | Fifth Third Capital Trust V | | 7.250% | | Baa3 | | | 156,986 |
| | | | |
| 174,388 | | Fifth Third Capital Trust VI | | 7.250% | | Baa3 | | | 4,098,118 |
| | | | |
| 465,007 | | Fifth Third Capital Trust VII | | 8.875% | | Baa3 | | | 12,090,181 |
| | | | |
| 10,000 | | Fleet Capital Trust IX | | 6.000% | | Baa3 | | | 200,800 |
| | | | |
| 31,512 | | HSBC Finance Corporation | | 6.875% | | A | | | 786,224 |
| | | | |
| 500 | | HSBC Finance Corporation | | 6.000% | | A | | | 11,700 |
| | | | |
| 48,948 | | HSBC Holdings PLC | | 8.125% | | A1 | | | 1,309,359 |
| | | | |
| 8,000 | | HSBC USA Inc. | | 4.500% | | A3 | | | 188,080 |
| | | | |
| 6,899 | | KeyCorp Capital Trust V | | 5.875% | | Baa3 | | | 141,705 |
| | | | |
| 84,557 | | KeyCorp Capital Trust IX | | 6.750% | | Baa3 | | | 1,899,996 |
| | | | |
| 247,091 | | KeyCorp Capital Trust X | | 8.000% | | Baa3 | | | 6,105,619 |
| | | | |
| 141,557 | | KeyCorp Capital VIII | | 7.000% | | Baa3 | | | 3,187,864 |
| | | | |
| 2,479 | | M&T Capital Trust IV | | 8.500% | | Baa2 | | | 67,553 |
| | | | |
| 4,400 | | National City Capital Trust II | | 6.625% | | BBB | | | 102,476 |
| | | | |
| 277,365 | | National City Capital Trust IV | | 8.000% | | BBB | | | 7,144,922 |
| | | | |
| 25,200 | | PNC Capital Trust | | 7.750% | | BBB | | | 656,208 |
| | | | |
| 60,357 | | USB Capital Trust XI | | 6.600% | | A2 | | | 1,495,646 |
| | | | |
| 26,547 | | USB Capital XII | | 6.300% | | A2 | | | 630,491 |
| | | | | | | | | |
| Shares | | Description (1) | | Coupon | | Ratings (2) | | Value |
| | | | | | | | | |
| | | | |
| | Commercial Banks (continued) | | | | | | | |
| | | | |
| 13,031 | | Wachovia Capital Trust IX | | 6.375% | | A– | | $ | 297,889 |
| | | | |
| 167,292 | | Wachovia Capital Trust X | | 7.850% | | A– | | | 4,314,461 |
| | | | |
| 20,000 | | Wachovia Trust IV | | 6.375% | | A– | | | 463,000 |
| | | | |
| 111,045 | | Wells Fargo & Company | | 8.000% | | A– | | | 3,031,529 |
| | | | |
| 21,600 | | Wells Fargo Capital Trust XII | | 7.875% | | A– | | | 564,408 |
| | | | |
| 45,180 | | Wells Fargo Capital Trust XIV | | 8.625% | | A– | | | 1,250,582 |
| | Total Commercial Banks | | | | | | | 89,136,960 |
| | | | |
| | Consumer Finance – 0.3% | | | | | | | |
| | | | |
| 12,000 | | Heller Financial Inc. | | 6.687% | | A+ | | | 1,090,126 |
| | | | |
| 5,000 | | HSBC Finance Corporation | | 6.360% | | BBB | | | 115,600 |
| | Total Consumer Finance | | | | | | | 1,205,726 |
| | | | |
| | Diversified Financial Services – 16.9% | | | | | | | |
| | | | |
| 19,850 | | BAC Capital Trust VIII | | 6.000% | | Baa3 | | | 411,888 |
| | | | |
| 2,829 | | BAC Capital Trust X | | 6.250% | | Baa3 | | | 58,277 |
| | | | |
| 27,172 | | BAC Capital Trust XII | | 6.875% | | Baa3 | | | 632,021 |
| | | | |
| 22,000 | | Bank of America Corporation | | 8.625% | | BB | | | 570,900 |
| | | | |
| 70,645 | | Bank One Capital Trust VI | | 7.200% | | A2 | | | 1,799,328 |
| | | | |
| 54,841 | | Citigroup Capital Trust IX | | 6.000% | | Ba1 | | | 1,039,237 |
| | | | |
| 104,260 | | Citigroup Capital Trust VII | | 7.125% | | Ba1 | | | 2,293,720 |
| | | | |
| 123,300 | | Citigroup Capital Trust VIII | | 6.950% | | Ba1 | | | 2,585,601 |
| | | | |
| 50,554 | | Citigroup Capital Trust XI | | 6.000% | | Ba1 | | | 945,360 |
| | | | |
| 93,665 | | Citigroup Capital X | | 6.100% | | Ba1 | | | 1,774,952 |
| | | | |
| 63,650 | | Citigroup Capital XV | | 6.500% | | Ba1 | | | 1,260,270 |
| | | | |
| 80,100 | | Citigroup Capital XVI | | 6.450% | | Ba1 | | | 1,581,975 |
| | | | |
| 72,577 | | Citigroup Capital XVII | | 6.350% | | Ba1 | | | 1,415,252 |
| | | | |
| 82,500 | | Citigroup Capital XIX | | 7.250% | | Ba1 | | | 1,816,650 |
| | | | |
| 38,200 | | Citigroup Capital XX | | 7.875% | | Ba1 | | | 920,620 |
| | | | |
| 463,640 | | Countrywide Capital Trust III | | 7.000% | | Baa3 | | | 10,408,718 |
| | | | |
| 268,598 | | Countrywide Capital Trust IV | | 6.750% | | Baa3 | | | 5,766,799 |
| | | | |
| 112,120 | | Fleet Capital Trust VIII | | 7.200% | | Baa3 | | | 2,581,002 |
| | | | |
| 2,300 | | General Electric Capital Corporation | | 6.625% | | AA+ | | | 58,236 |
| | | | |
| 500 | | General Electric Capital Corporation | | 6.000% | | AA+ | | | 12,435 |
| | | | |
| 356,311 | | ING Groep N.V. | | 8.500% | | Ba1 | | | 8,612,037 |
| | | | |
| 123,332 | | ING Groep N.V. | | 7.375% | | Ba1 | | | 2,708,371 |
| | | | |
| 50,020 | | ING Groep N.V. | | 7.200% | | Ba1 | | | 1,092,437 |
| | | | |
| 58,482 | | ING Groep N.V. | | 7.050% | | Ba1 | | | 1,246,836 |
| | | | |
| 95,000 | | ING Groep N.V. | | 6.375% | | Ba1 | | | 1,824,950 |
| | | | |
| 103,531 | | ING Groep N.V. | | 6.200% | | Ba1 | | | 1,979,513 |
| | | | |
| 68,281 | | ING Groep N.V. | | 6.125% | | Ba1 | | | 1,300,070 |
| | | | |
| 5 | | JP Morgan Chase Capital Trust X | | 7.00% | | A2 | | | 127 |
| | | | |
| 3,573 | | JP Morgan Chase Capital Trust XI | | 5.88% | | A2 | | | 84,144 |
| | | | |
| 5,376 | | JP Morgan Chase Capital Trust XIX, Series S | | 6.63% | | A2 | | | 132,948 |
| | | | |
| 21,214 | | JPMorgan Chase Capital Trust XXIV | | 6.88% | | A2 | | | 537,775 |
| | | | |
| 35,604 | | JPMorgan Chase Capital Trust XXVI | | 8.00% | | A2 | | | 965,937 |
Portfolio of Investments (Unaudited)
Nuveen Preferred Securities Fund (continued)
March 31, 2010
| | | | | | | | | |
| Shares | | Description (1) | | Coupon | | Ratings (2) | | Value |
| | | | | | | | | |
| | | | |
| | Diversified Financial Services (continued) | | | | | | | |
| | | | |
| 125,610 | | JPMorgan Chase Capital Trust XXVIII | | 7.20% | | A2 | | $ | 3,294,750 |
| | | | |
| 411,000 | | JPMorgan Chase Capital Trust XXIX, DD | | 6.70% | | A2 | | | 10,172,250 |
| | | | |
| 61,800 | | MBNA Capital E | | 8.100% | | Baa3 | | | 1,545,000 |
| | | | |
| 93,689 | | MBNA Corporation, Capital Trust D | | 8.125% | | Baa3 | | | 2,326,298 |
| | | | |
| 15,600 | | Merrill Lynch Capital Trust II | | 6.450% | | Baa3 | | | 322,140 |
| | | | |
| 13,200 | | Merrill Lynch Capital Trust III | | 7.375% | | Baa3 | | | 309,936 |
| | | | |
| 11,534 | | National Rural Utilities Cooperative Finance Corporation | | 6.750% | | A3 | | | 295,847 |
| | Total Diversified Financial Services | | | | | | | 76,684,607 |
| | | | |
| | Electric Utilities – 1.3% | | | | | | | |
| | | | |
| 7,800 | | American Electric Power | | 8.750% | | Baa3 | | | 220,740 |
| | | | |
| 7,400 | | DTE Energy Trust I | | 7.800% | | Baa3 | | | 193,658 |
| | | | |
| 1,000 | | DTE Energy Trust II | | 7.500% | | Baa3 | | | 25,620 |
| | | | |
| 57,400 | | Entergy Texas Inc. | | 7.875% | | BBB+ | | | 1,604,330 |
| | | | |
| 21,200 | | FPL Group Capital Inc. | | 7.450% | | A3 | | | 573,460 |
| | | | |
| 9,700 | | FPL Group Capital Inc. | | 6.600% | | A3 | | | 251,618 |
| | | | |
| 8,000 | | Georgia Power Company | | 6.500% | | BBB+ | | | 820,750 |
| | | | |
| 65,000 | | PPL Capital Funding, Inc. | | 6.850% | | Baa2 | | | 1,660,750 |
| | | | |
| 23,000 | | PPL Electric Utilities Corporation | | 6.250% | | BBB | | | 573,563 |
| | Total Electric Utilities | | | | | | | 5,924,489 |
| | | | |
| | Insurance – 10.6% | | | | | | | |
| | | | |
| 38,366 | | Aegon N.V. | | 6.875% | | BBB | | | 827,938 |
| | | | |
| 38,646 | | Aegon N.V. | | 6.500% | | BBB | | | 791,470 |
| | | | |
| 268,134 | | Aegon N.V. | | 6.375% | | BBB | | | 5,453,846 |
| | | | |
| 375,383 | | Aegon N.V. | | 7.250% | | BBB | | | 8,633,809 |
| | | | |
| 651,764 | | Allianz SE | | 8.375% | | A+ | | | 16,864,393 |
| | | | |
| 56,924 | | Axis Capital Holdings Limited | | 7.500% | | BBB | | | 5,052,005 |
| | | | |
| 320,000 | | Financial Security Assurance Holdings | | 6.875% | | A+ | | | 6,432,000 |
| | | | |
| 71,712 | | Financial Security Assurance Holdings | | 6.250% | | A+ | | | 1,387,183 |
| | | | |
| 35,588 | | Financial Security Assurance Holdings | | 5.600% | | A+ | | | 623,904 |
| | | | |
| 12,100 | | MetLife Inc., Series B | | 6.500% | | Baa2 | | | 297,055 |
| | | | |
| 1,200 | | PLC Capital Trust III | | 7.500% | | BBB | | | 29,100 |
| | | | |
| 19,400 | | PLC Capital Trust IV | | 7.250% | | BBB | | | 472,390 |
| | | | |
| 25,000 | | Principal Financial Group | | 6.518% | | Baa3 | | | 589,500 |
| | | | |
| 16,616 | | Protective Life Corporation | | 7.250% | | BBB | | | 389,978 |
| | | | |
| 12,699 | | Prudential Financial Inc. | | 9.000% | | BBB+ | | | 351,127 |
| | | | |
| 12,923 | | Selective Insurance Group | | 7.500% | | Baa3 | | | 296,712 |
| | Total Insurance | | | | | | | 48,492,410 |
| | | | |
| | Multi-Utilities – 0.5% | | | | | | | |
| | | | |
| 60,504 | | Dominion Resources Inc. | | 8.375% | | BBB | | | 1,680,801 |
| | | | |
| 13,300 | | Xcel Energy Inc. | | 7.600% | | Baa2 | | | 358,036 |
| | Total Multi-Utilities | | | | | | | 2,038,837 |
| | | | |
| | Real Estate Investment Trust – 3.8% | | | | | | | |
| | | | |
| 6,131 | | Duke Realty Corporation, Series L | | 6.600% | | Baa3 | | | 132,797 |
| | | | |
| 60,356 | | Duke Realty Corporation, Series O | | 8.375% | | Baa3 | | | 1,543,906 |
| | | | |
| 48,000 | | Duke-Weeks Realty Corporation | | 6.625% | | Baa3 | | | 1,040,640 |
| | | | | | | | | | |
| Shares | | Description (1) | | Coupon | | Ratings (2) | | Value |
| | | | | | | | | | |
| | | | |
| | | Real Estate Investment Trust (continued) | | | | | | | |
| | | | |
| | 65,825 | | Harris Preferred Capital Corporation, Series A | | 7.375% | | A– | | $ | 1,631,144 |
| | | | |
| | 10,300 | | Kimco Realty Corporation, Series G | | 7.750% | | Baa2 | | | 260,281 |
| | | | |
| | 5,900 | | Prologis Trust, Series G | | 6.750% | | Baa3 | | | 129,682 |
| | | | |
| | 5,000 | | PS Business Parks, Inc. | | 7.000% | | Baa3 | | | 116,850 |
| | | | |
| | 48,680 | | Public Storage, Inc., Series K | | 7.250% | | Baa1 | | | 1,226,736 |
| | | | |
| | 69,211 | | Public Storage, Inc., Series M | | 6.625% | | Baa1 | | | 1,686,672 |
| | | | |
| | 31,000 | | Public Storage, Inc., Series W | | 6.500% | | Baa1 | | | 720,750 |
| | | | |
| | 180,554 | | Vornado Realty LP | | 7.875% | | BBB | | | 4,544,544 |
| | | | |
| | 8,930 | | Vornado Realty Trust | | 6.750% | | BBB– | | | 203,336 |
| | | | |
| | 176,800 | | Weingarten Realty Trust | | 8.100% | | BBB | | | 3,930,264 |
| | | Total Real Estate Investment Trust | | | | | | | 17,167,602 |
| | | | |
| | | Thrifts & Mortgage Finance – 0.3% | | | | | | | |
| | | | |
| | 52,900 | | Sovereign Capital Trust V | | 7.75% | | BBB+ | | | 1,332,551 |
| | | | |
| | | U.S. Agency – 0.0% | | | | | | | |
| | | | |
| | 7,000 | | Federal Home Loan Mortgage Corporation, (3) | | 6.420% | | Ca | | | 13,370 |
| | | | |
| | 45,000 | | Federal Home Loan Mortgage Corporation, (3) | | 8.375% | | Ca | | | 57,150 |
| | | | |
| | 45,000 | | Federal National Mortgage Association, (3) | | 8.250% | | Ca | | | 55,350 |
| | | | |
| | 60,000 | | Federal National Mortgage Association, (3) | | 8.250% | | Ca | | | 76,200 |
| | | Total U.S. Agency | | | | | | | 202,070 |
| | | Total $25 Par (or similar) Preferred Securities (cost $251,411,609) | | | | | | | 285,374,452 |
| | | | |
Principal
Amount (000) | | Description (1) | | Optional Call
Provisions (4) | | Ratings (2) | | Value |
| | | TAXABLE MUNICIPAL BONDS – 1.4% | | | | | | | |
| | | | |
| | | California – 0.2% | | | | | | | |
| | | | |
| $ | 485 | | California Municipal Finance Authority, Educational Facilities Revenue Bonds, OCEAA Project, Series 2008B, 11.000%, 10/01/14 | | No Opt. Call | | N/R | | $ | 473,656 |
| | | | |
| | 200 | | California Statewide Community Development Authority, Lancer Educational Student Housing Revenue Bonds, California Baptist University, Series 2007, 9.125%, 6/01/13, 144A | | No Opt. Call | | N/R | | | 199,442 |
| | | | |
| | 200 | | Long Beach, California, Senior Airport Revenue Bonds, Federally Taxable – Build America Bonds, Series 2009C, 7.765%, 6/01/39 | | 12/19 at 100.00 | | A2 | | | 200,978 |
| | | | |
| | 200 | | Southwestern Community College District, San Diego County, California, General Obligation Bonds, Election of 2008, Build America Bonds Series 2009, 7.230%, 8/01/39 | | 8/19 at 100.00 | | AA– | | | 202,950 |
| | 1,085 | | Total California | | | | | | | 1,077,026 |
| | | | |
| | | Florida – 0.4% | | | | | | | |
| | | | |
| | 255 | | Miami-Dade County, Florida, Transit System Sales Surtax Revenue Bonds, Build America Bond Series 2009B, 6.910%, 7/01/39 | | 7/19 at 100.00 | | AA | | | 258,787 |
| | | | |
| | 200 | | Northern Palm Beach County Improvement District, Florida, Water Control and Improvement Bonds, Development Unit 46, Series 2007B, 8.250%, 8/01/21 | | 8/14 at 100.00 | | N/R | | | 182,768 |
| | | | |
| | 200 | | Orlando, Florida, Capital Improvement Special Revenue Bonds, Series 200C, 7.100%, 10/01/39 | | 10/19 at 100.00 | | AA– | | | 207,862 |
| | | | |
| | 250 | | Pasco County, Florida, Water and Sewer Revenue Bonds, Build America Bonds Series 2009B, 6.760%, 10/01/39 | | No Opt. Call | | AA | | | 256,513 |
| | | | |
| | 200 | | Seacoast Utility Authority, Florida, Water and Sewer Utility System Revenue Bonds, Taxable Build America, Series 2009B, 6.680%, 3/01/39 | | 3/20 at 100.00 | | A+ | | | 204,198 |
| | | | |
| | 475 | | Seminole Tribe of Florida, Special Obligation Bonds, Series 2007B, 7.804%, 10/01/20, 144A | | No Opt. Call | | BBB | | | 443,204 |
| | | | |
| | 200 | | South Broward Hospital District, Florida, Revenue Bonds, Build America Taxable Bonds, Series 2009B, 7.278%, 5/01/44 | | 5/19 at 100.00 | | AA– | | | 202,736 |
| | 1,780 | | Total Florida | | | | | | | 1,756,068 |
Portfolio of Investments (Unaudited)
Nuveen Preferred Securities Fund (continued)
March 31, 2010
| | | | | | | | | | |
Principal
Amount (000) | | Description (1) | | Optional Call
Provisions (4) | | Ratings (2) | | Value |
| | | | | | | | | | |
| | | | |
| | | Hawaii – 0.0% | | | | | | | |
| | | | |
| $ | 200 | | Honolulu City and County, Hawaii, General Obligation Bonds, Build America Bonds, Series 2009E, 6.300%, 9/01/34 | | 9/19 at 100.00 | | AA | | $ | 198,020 |
| | | | |
| | | Idaho – 0.0% | | | | | | | |
| | | | |
| | 125 | | Idaho Housing and Finance Association NonProfit Facilities Revenue Bonds, Liberty Charter School, Inc, Series 2008B, 7.500%, 6/01/12 | | No Opt. Call | | BBB | | | 123,194 |
| | | | |
| | | Louisiana – 0.0% | | | | | | | |
| | | | |
| | 195 | | Carter Plantation Land Louisiana, Revenue Bonds, 9.000%, 7/01/17, 144A (5) | | 6/10 at 100.00 | | N/R | | | 98,124 |
| | | | |
| | | Michigan – 0.1% | | | | | | | |
| | | | |
| | 200 | | Croswell & Lexington Community Schools, Michigan, General Obligation Bonds, School Building & Site Series 2009, 6.050%, 5/01/29 | | 5/19 at 100.00 | | AA– | | | 197,758 |
| | | | |
| | 1,500 | | Lansing Tax Increment Finance Authority, Michigan, Tax Increment Bonds, Capital Appreciation Refunding Series 2009, 0.000%, 5/01/31 | | 5/19 at 38.12 | | AA+ | | | 291,945 |
| | 1,700 | | Total Michigan | | | | | | | 489,703 |
| | | | |
| | | Missouri – 0.0% | | | | | | | |
| | | | |
| | 200 | | Missouri Joint Municipal Electric Utility Commission, Power Project Revenue Bonds, Prairie State Project, Federally Taxable Build America Bonds – Direct Pay, Series 2009A, 6.890%, 1/01/42 | | 1/19 at 100.00 | | A3 | | | 207,004 |
| | | | |
| | | Nevada – 0.0% | | | | | | | |
| | | | |
| | 200 | | Clark County, Nevada, Airport Revenue Bonds, Senior Lien Series 2009B, 6.881%, 7/01/42 | | 7/19 at 100.00 | | Aa2 | | | 202,026 |
| | | | |
| | | New Jersey – 0.2% | | | | | | | |
| | | | |
| | 1,000 | | New Jersey Health Care Facilities Financing Authority, Trinitas Hospital Obligated Group, Refunding Series 2007B, 6.500%, 7/01/23 | | 7/17 at 100.00 | | BBB– | | | 913,650 |
| | | | |
| | 200 | | South Jersey Transportation Authority, New Jersey, Transportation System Revenue Bonds, Build America Bond Series 2009A-5, 7.000%, 11/01/38 | | No Opt. Call | | A– | | | 202,214 |
| | 1,200 | | Total New Jersey | | | | | | | 1,115,864 |
| | | | |
| | | Ohio – 0.2% | | | | | | | |
| | | | |
| | 200 | | American Municipal Power Ohio Inc., General Revenue Bonds, Prairie State Energy Campus Project, Taxable Build America Bonds Series 2009, 6.553%, 2/15/39 | | 2/19 at 100.00 | | A1 | | | 196,546 |
| | | | |
| | 200 | | Berea City School District, County, Ohio, Certificates of Participartion, Build America Bonds, Series 2009B, 7.250%, 10/01/39 | | 10/19 at 100.00 | | A3 | | | 196,656 |
| | | | |
| | 250 | | Cuyahoga County, Ohio, Hospital Revenue, MetroHealth System, Series 2010, 8.223%, 2/15/40 | | No Opt. Call | | A2 | | | 264,495 |
| | | | |
| | 200 | | Edgewood City School District, Counties of Butler and Preble, Ohio, School Improvement General Obligation Bonds, Build America Bonds, Series 2009, 7.500%, 12/01/37 | | No Opt. Call | | A+ | | | 208,480 |
| | | | |
| | 200 | | Hamilton, Ohio, Electric System Revenue Bonds, Build America Bonds Series 2009B, 6.600%, 10/01/39 – AGC Insured | | 10/19 at 100.00 | | Aa3 | | | 204,958 |
| | 1,050 | | Total Ohio | | | | | | | 1,071,135 |
| | | | |
| | | Texas – 0.2% | | | | | | | |
| | | | |
| | 600 | | Danbury Higher Education Authority Inc., Texas, Golden Rule Charter School Revenue Bonds, Series 2008B, 10.000%, 8/15/18 | | No Opt. Call | | BB+ | | | 557,706 |
| | | | |
| | 135 | | La Vernia Education Financing Corporation, Texas, Charter School Revenue Bonds, Riverwalk Education Foundation, Series 2007B, 8.750%, 8/15/12 | | 8/11 at 100.00 | | N/R | | | 135,320 |
| | | | |
| | 200 | | North Texas Tollway Authority, System Revenue Bonds, Taxble Build America Bond Series 2009B, 6.718%, 1/01/49 | | No Opt. Call | | A2 | | | 211,348 |
| | 935 | | Total Texas | | | | | | | 904,374 |
| | | | |
| | | Virginia – 0.0% | | | | | | | |
| | | | |
| | 200 | | Metropolitan Washington DC Airports Authority, Virginia, Dulles Toll Road Revenue Bonds, Series 2009D, 7.462%, 10/01/46 – AGC Insured | | No Opt. Call | | BBB+ | | | 207,496 |
| | | | |
| | | Washington – 0.1% | | | | | | | |
| | | | |
| | 520 | | Washington State Economic Development Finance Authority, Revenue Bonds, Coeur D’Alene Fiber Fuels Inc., Series 2007H, 10.000%, 12/01/11 | | No Opt. Call | | N/R | | | 469,127 |
| $ | 9,390 | | Total Taxable Municipal Bonds (cost $8,060,791) | | | | | | | 7,919,161 |
| | | | | | | | | | | | |
Principal
Amount (000) | | Description (1) | | Coupon | | Maturity | | Ratings (2) | | Value |
| | | | | | | | | | | | |
| | | CORPORATE BONDS – 2.1% | | | | | | | | | |
| | | | | |
| | | Insurance – 2.1% | | | | | | | | | |
| | | | | |
| $ | 1,500 | | Nationwide Mutual Insurance Company, 144A | | 7.825% | | 4/01/33 | | A– | | $ | 1,465,781 |
| | | | | |
| | 6,210 | | Nationwide Mutual Insurance Company, 144A | | 9.375% | | 8/15/39 | | A– | | | 7,095,204 |
| | | | | |
| | 700 | | QBE Insurance Group Limited, 144A | | 9.750% | | 3/14/14 | | A | | | 851,437 |
| | 8,410 | | Total Insurance | | | | | | | | | 9,412,422 |
| $ | 8,410 | | Total Corporate Bonds (cost $8,583,674) | | | | | | | | | 9,412,422 |
| | | | | |
Principal
Amount
(000)/Shares | | Description (1) | | Coupon | | Maturity | | Ratings (2) | | Value |
| | | CAPITAL PREFERRED SECURITIES – 33.4% | | | | | | | | | |
| | | | | |
| | | Capital Markets – 0.8% | | | | | | | | | |
| | | | | |
| | 250 | | BNY Institutional Capital, 144A | | 7.780% | | 12/01/26 | | A1 | | $ | 251,834 |
| | | | | |
| | 500 | | Credit Suisse | | 5.860% | | 11/15/57 | | A3 | | | 471,250 |
| | | | | |
| | 1,500 | | Goldman Sachs Group, Inc. | | 6.345% | | 2/15/34 | | A3 | | | 1,389,110 |
| | | | | |
| | 500 | | MUFG Capital Finance | | 6.346% | | 7/25/16 | | BBB+ | | | 496,409 |
| | | | | |
| | 1,000 | | State Street Capital Trust | | 8.250% | | 9/15/58 | | BBB+ | | | 1,035,610 |
| | 3,750 | | Total Capital Markets | | | | | | | | | 3,644,213 |
| | | | | |
| | | Commercial Banks – 12.6% | | | | | | | | | |
| | | | | |
| | 1,650 | | AgFirst Farm Credit Bank | | 7.300% | | 12/15/53 | | A | | | 1,289,937 |
| | | | | |
| | 1,800 | | Barclays Bank PLC | | 6.278% | | 12/15/34 | | A– | | | 1,530,000 |
| | | | | |
| | 4,040 | | BNP Paribas, 144A | | 7.195% | | 12/25/57 | | A | | | 3,939,000 |
| | | | | |
| | 2,477 | | Comerica Capital Trust II | | 6.576% | | 2/20/37 | | Baa1 | | | 2,198,338 |
| | | | | |
| | 1,000 | | Credit Agricole, S.A | | 9.750% | | 12/26/54 | | A– | | | 1,105,000 |
| | | | | |
| | 3,000 | | First Empire Capital Trust I | | 8.234% | | 2/01/27 | | Baa2 | | | 2,673,846 |
| | | | | |
| | 3,380 | | HVB Funding Trust III, 144A | | 9.000% | | | | BBB | | | 3,337,750 |
| | | | | |
| | 300 | | Mizuho Capital Investment I Limited, 144A | | 6.686% | | 3/30/49 | | BBB | | | 256,684 |
| | | | | |
| | 1,481 | | NB Capital Trust II | | 7.830% | | 12/15/26 | | Baa3 | | | 1,473,595 |
| | | | | |
| | 1,000 | | NB Capital Trust IV | | 8.250% | | 4/15/27 | | Baa3 | | | 1,017,500 |
| | | | | |
| | 8,700 | | PNC Preferred Funding Trust III, 144A | | 8.700% | | 3/15/13 | | BBB | | | 9,142,491 |
| | | | | |
| | 5,000 | | Rabobank Nederland, 144A | | 11.000% | | 6/30/19 | | AA– | | | 6,453,155 |
| | | | | |
| | 4,480 | | Sovereign Capital Trust VI | | 7.908% | | 6/13/36 | | BBB+ | | | 4,101,449 |
| | | | | |
| | 5,000 | | Standard Chartered PLC, 144A | | 7.014% | | 7/30/37 | | BBB | | | 4,615,655 |
| | | | | |
| | 2,050 | | Wachovia Capital Trust V, 144A | | 7.965% | | 6/01/27 | | A– | | | 2,021,997 |
| | | | | |
| | 10,580 | | Wells Fargo Capital Trust XIII | | 7.700% | | 9/26/58 | | A– | | | 10,976,750 |
| | | | | |
| | 1,365 | | Wells Fargo Capital Trust XV | | 9.750% | | 9/26/49 | | A– | | | 1,535,625 |
| | 57,303 | | Total Commercial Banks | | | | | | | | | 57,668,772 |
| | | | | |
| | | Consumer Finance – 1.1% | | | | | | | | | |
| | | | | |
| | 5,000 | | Capital One Capital III Corporation | | 7.686% | | 8/15/36 | | Baa3 | | | 4,831,250 |
| | | | | |
| | | Diversified Financial Services – 5.6% | | | | | | | | | |
| | | | | |
| | 247 | | Citigroup Capital Trust XII | | 8.500% | | 3/30/15 | | Ba1 | | | 6,341,696 |
| | | | | |
| | 17,798 | | JPMorgan Chase & Company | | 7.900% | | 4/30/49 | | BBB+ | | | 19,038,589 |
| | 18,045 | | Total Diversified Financial Services | | | | | | | | | 25,380,285 |
| | | | | |
| | | Industrial Conglomerates – 0.2% | | | | | | | | | |
| | | | | |
| | 1,000 | | GE Capital Trust I | | 6.375% | | 11/15/17 | | Aa3 | | | 940,000 |
Portfolio of Investments (Unaudited)
Nuveen Preferred Securities Fund (continued)
March 31, 2010
| | | | | | | | | | | | |
Principal
Amount
(000)/Shares | | Description (1) | | Coupon | | Maturity | | Ratings (2) | | Value |
| | | | | | | | | | | | |
| | | | | |
| | | Insurance – 13.1% | | | | | | | | | |
| | | | | |
| | 1,300 | | Ace Capital Trust II | | 9.700% | | 4/01/30 | | Baa1 | | $ | 1,520,064 |
| | | | | |
| | 1,100 | | Assured Guaranty US Holdings, Series A | | 6.400% | | 12/15/66 | | A– | | | 808,500 |
| | | | | |
| | 4,010 | | AXA SA, 144A | | 6.379% | | 12/14/36 | | Baa1 | | | 3,528,800 |
| | | | | |
| | 3,000 | | Everest Reinsurance Holdings, Inc. | | 6.600% | | 5/15/37 | | Baa1 | | | 2,625,000 |
| | | | | |
| | 2,000 | | Financial Security Assurance Holdings, 144A | | 6.400% | | 12/15/36 | | A– | | | 1,380,000 |
| | | | | |
| | 1,000 | | Hartford Financial Services Group Inc. | | 8.125% | | 6/15/18 | | BB+ | | | 1,047,500 |
| | | | | |
| | 2,000 | | Liberty Mutual Group Inc., 144A | | 10.750% | | 6/15/58 | | Baa3 | | | 2,260,000 |
| | | | | |
| | 100 | | Liberty Mutual Group, 144A | | 7.800% | | 3/15/37 | | Baa3 | | | 89,500 |
| | | | | |
| | 2,500 | | MetLife Capital Trust IV, 144A | | 7.875% | | 12/15/37 | | BBB | | | 2,575,000 |
| | | | | |
| | 4,500 | | MetLife Capital Trust X, 144A | | 9.250% | | 4/08/68 | | BBB | | | 5,107,500 |
| | | | | |
| | 9,000 | | MetLife Inc. | | 10.750% | | 8/01/69 | | BBB | | | 11,630,007 |
| | | | | |
| | 1,110 | | National Financial Services Inc. | | 6.750% | | 5/15/37 | | Baa2 | | | 936,649 |
| | | | | |
| | 13,400 | | Prudential Financial Inc. | | 8.875% | | 6/15/18 | | BBB+ | | | 15,175,499 |
| | | | | |
| | 3,000 | | StanCorp Financial Group Inc. | | 6.900% | | 6/01/17 | | BBB | | | 2,570,820 |
| | | | | |
| | 4,500 | | Swiss Re Capital I, 144A | | 6.854% | | 5/25/16 | | A– | | | 4,111,070 |
| | | | | |
| | 4,000 | | Symetra Financial Corporation, 144A | | 8.300% | | 10/15/37 | | BB+ | | | 3,600,000 |
| | | | | |
| | 485 | | ZFS Finance USA Trust II, 144A | | 6.450% | | 12/15/65 | | A | | | 468,025 |
| | | | | |
| | 516 | | ZFS Finance USA Trust V, 144A | | 6.500% | | 5/09/67 | | A | | | 492,781 |
| | 57,521 | | Total Insurance | | | | | | | | | 59,926,715 |
| | | Total Capital Preferred Securities (cost $124,783,268) | | | | | | | | | 152,391,235 |
| | | | | |
Principal
Amount (000) | | Description (1) | | | | Coupon | | Maturity | | Value |
| | | SHORT-TERM INVESTMENTS – 0.8% | | | | | | | | | |
| | | | |
| $ | 3,598 | | Repurchase Agreement with State Street Bank, dated 3/31/10, repurchase price $3,598,157, collateralized by $3,675,000 U.S. Treasury Bills, 0.000%, due 9/16/10, value $3,671,325 | | 0.000% | | 4/01/10 | | $ | 3,598,157 |
| | | Total Short-Term Investments (cost $3,598,157) | | | | | | | | | 3,598,157 |
| | | Total Investments (cost $396,437,499) – 100.4% | | | | | | | | | 458,695,427 |
| | | Other Assets Less Liabilities – (0.4)% | | | | | | | | | (1,745,244) |
| | | Net Assets – 100% | | | | | | | | $ | 456,950,183 |
| | (1) | | All percentages shown in the Portfolio of Investments are based on net assets. |
| | (2) | | Ratings: Using the higher of Standard & Poor’s Group (“Standard & Poor’s”) or Moody’s Investor Service, Inc. (“Moody’s”) rating. Ratings below BBB by Standard & Poor’s or Baa by Moody’s are considered to be below investment grade. |
| | (3) | | Non-income producing security; issuer has not declared a dividend within the past twelve months. |
| | (4) | | Optional Call Provisions: Dates (month and year) and prices of the earliest optional call or redemption. There may be other call provisions at varying prices at later dates. Certain mortgage-backed securities may be subject to periodic principal paydowns. |
| | (5) | | The Fund’s Adviser has concluded this issue is not likely to meet its future interest payment obligations and has directed the Fund’s custodian to cease accruing additional income on the Fund’s records. |
| | 144A | | Investment is exempt from registration under Rule 144A of the Securities Act of 1933, as amended. These investments may only be resold in transactions exempt from registration which are normally those transactions with qualified institutional buyers. |
| | DD | | Investment or portion of investment purchased on a delayed delivery basis. |
| | SATURNS | | Structured Asset Trust Unit Repackaging. |
See accompanying notes to financial statements.
Statement of Assets and Liabilities (Unaudited)
March 31, 2010
| | | | |
Assets | | | | |
Investments, at value (cost $396,437,499) | | $ | 458,695,427 | |
Receivables: | | | | |
Dividends | | | 556,494 | |
Interest | | | 3,344,340 | |
Investments sold | | | 10,278,460 | |
Shares sold | | | 3,416,494 | |
Other assets | | | 708 | |
Total assets | | | 476,291,923 | |
Liabilities | | | | |
Payables: | | | | |
Dividends | | | 1,272,792 | |
Investments purchased | | | 16,837,390 | |
Shares redeemed | | | 774,963 | |
Accrued expenses: | | | | |
Management fees | | | 134,646 | |
12b-1 distribution and service fees | | | 90,511 | |
Other | | | 231,438 | |
Total liabilities | | | 19,341,740 | |
Net assets | | $ | 456,950,183 | |
Class A Shares | | | | |
Net assets | | $ | 126,888,790 | |
Shares outstanding | | | 7,887,282 | |
Net asset value per share | | $ | 16.09 | |
Offering price per share (net asset value per share plus
maximum sales charge of 4.75% of offering price) | | $ | 16.89 | |
Class C Shares | | | | |
Net assets | | $ | 78,872,950 | |
Shares outstanding | | | 4,900,296 | |
Net asset value and offering price per share | | $ | 16.10 | |
Class R3 Shares | | | | |
Net assets | | $ | 56,395 | |
Shares outstanding | | | 3,482 | |
Net asset value and offering price per share | | $ | 16.20 | |
Class I Shares | | | | |
Net assets | | $ | 251,132,048 | |
Shares outstanding | | | 15,610,120 | |
Net asset value and offering price per share | | $ | 16.09 | |
Net Assets Consist of: | | | | |
Capital paid-in | | $ | 393,148,255 | |
Undistributed (Over-distribution of) net investment income | | | (1,361,269 | ) |
Accumulated net realized gain (loss) | | | 2,905,269 | |
Net unrealized appreciation (depreciation) | | | 62,257,928 | |
Net assets | | $ | 456,950,183 | |
See accompanying notes to financial statements.
Statement of Operations (Unaudited)
Six Months Ended March 31, 2010
| | | | |
Investment Income | | | | |
Dividends | | $ | 7,967,491 | |
Interest | | | 6,320,515 | |
Total investment income | | | 14,288,006 | |
Expenses | | | | |
Management fees | | | 1,260,002 | |
12b-1 service fees – Class A | | | 129,997 | |
12b-1 distribution and service fees – Class C | | | 313,320 | |
12b-1 distribution and service fees – Class R3 | | | 132 | |
Shareholders’ servicing agent fees and expenses | | | 140,959 | |
Custodian’s fees and expenses | | | 35,302 | |
Trustees’ fees and expenses | | | 3,167 | |
Professional fees | | | 39,403 | |
Shareholders’ reports – printing and mailing expenses | | | 85,269 | |
Federal and state registration fees | | | 55,685 | |
Other expenses | | | 14,809 | |
Total expenses before custodian fee credit and expense reimbursement | | | 2,078,045 | |
Custodian fee credit | | | (5 | ) |
Expense reimbursement | | | (461,244 | ) |
Net expenses | | | 1,616,796 | |
Net investment income | | | 12,671,210 | |
Realized and Unrealized Gain (Loss) | | | | |
Net realized gain (loss) from: | | | | |
Investments | | | 14,488,350 | |
Futures contracts | | | (44,310 | ) |
Change in net unrealized appreciation (depreciation) of: | | | | |
Investments | | | 17,480,741 | |
Futures contracts | | | (101,585 | ) |
Net realized and unrealized gain (loss) | | | 31,823,196 | |
Net increase (decrease) in net assets from operations | | $ | 44,494,406 | |
See accompanying notes to financial statements.
Statement of Changes in Net Assets (Unaudited)
| | | | | | | | | | | | |
| | | Six Months Ended
3/31/10 | | | Nine Months Ended
9/30/09 | | | Year Ended
12/31/08 | |
Operations | | | | | | | | | | | | |
Net investment income | | $ | 12,671,210 | | | $ | 9,187,655 | | | $ | 3,535,044 | |
Net realized gain (loss) from: | | | | | | | | | | | | |
Investments | | | 14,488,350 | | | | (5,155,748 | ) | | | (6,250,471 | ) |
Futures contracts | | | (44,310 | ) | | | (160,241 | ) | | | 110,401 | |
Change in net unrealized appreciation (depreciation) of: | | | | | | | | | | | | |
Investments | | | 17,480,741 | | | | 55,164,522 | | | | (8,580,750 | ) |
Futures contracts | | | (101,585 | ) | | | 35,340 | | | | 66,245 | |
Net increase (decrease) in net assets from operations | | | 44,494,406 | | | | 59,071,528 | | | | (11,119,531 | ) |
Distributions to Shareholders | | | | | | | | | | | | |
From net investment income: | | | | | | | | | | | | |
Class A | | | (3,927,883 | ) | | | (3,954,148 | ) | | | (355,033 | ) |
Class C | | | (2,144,385 | ) | | | (1,466,076 | ) | | | (92,502 | ) |
Class R3 | | | (1,883 | ) | | | — | | | | N/A | |
Class I (1) | | | (7,183,726 | ) | | | (4,515,472 | ) | | | (3,062,416 | ) |
Tax return of capital: | | | | | | | | | | | | |
Class A | | | — | | | | — | | | | (39,419 | ) |
Class C | | | — | | | | — | | | | (10,312 | ) |
Class R3 | | | — | | | | — | | | | N/A | |
Class I (1) | | | — | | | | — | | | | (340,963 | ) |
Decrease in net assets from distributions to shareholders | | | (13,257,877 | ) | | | (9,935,696 | ) | | | (3,900,645 | ) |
Fund Share Transactions | | | | | | | | | | | | |
Proceeds from sale of shares | | | 208,734,674 | | | | 198,439,758 | | | | 71,899,868 | |
Proceeds from shares issued to shareholders due to reinvestment of distributions | | | 7,168,164 | | | | 5,060,983 | | | | 1,040,675 | |
| | | 215,902,838 | | | | 203,500,741 | | | | 72,940,543 | |
Cost of shares redeemed | | | (49,584,604 | ) | | | (60,786,567 | ) | | | (10,955,497 | ) |
Net increase (decrease) in net assets from Fund share transactions | | | 166,318,234 | | | | 142,714,174 | | | | 61,985,046 | |
Net increase (decrease) in net assets | | | 197,554,763 | | | | 191,850,006 | | | | 46,964,870 | |
Net assets at the beginning of period | | | 259,395,420 | | | | 67,545,414 | | | | 20,580,544 | |
Net assets at the end of period | | $ | 456,950,183 | | | $ | 259,395,420 | | | $ | 67,545,414 | |
Undistributed (Over-distribution of) net investment income at the end of period | | $ | (1,361,269 | ) | | $ | (774,602 | ) | | $ | 15,345 | |
| (1) | | Effective May 1, 2008, Class R Shares were renamed Class I Shares. |
| N/A | | Fund did not issue Class R3 Shares prior to September 29, 2009. |
See accompanying notes to financial statements.
Notes to Financial Statements (Unaudited)
1. General Information and Significant Accounting Policies
The Nuveen Investment Trust V (the “Trust”) is an open-end management investment company registered under the Investment Company Act of 1940, as amended. The Trust is comprised of the Nuveen Preferred Securities Fund (the “Fund”), among others. The Trust was organized as a Massachusetts business trust on September 27, 2006.
The Fund seeks to provide a high level of current income and total return. Under normal circumstances, the Fund invests at least 80% of its net assets in preferred securities. Preferred securities generally pay fixed or adjustable rate distributions to investors and have preference over common stock in the payment of distributions and the liquidation of a company’s assets, but are junior to all forms of the company’s debt, including both senior and subordinated debt; therefore, the risks and potential rewards of investing in the Fund may at times be similar to the risks and potential rewards of investing in both equity funds and bond funds. The Fund invests primarily in fully taxable preferred securities (i.e., securities that do not qualify for the dividends received deduction). The Fund normally invests at least 60% of its net assets in securities rated investment grade (BBB/Baa or higher) at the time of purchase by at least one independent rating agency and unrated securities judged to be of comparable quality by Nuveen Asset Management (the “Adviser”), a wholly-owned subsidiary of Nuveen Investments Inc. (“Nuveen”). The Fund may invest up to 40% of its net assets in securities rated below investment grade (BB/Ba or lower) at the time of purchase, which are commonly referred to as “high yield,” “high risk” or “junk” securities. Although the Fund invests primarily in securities issued by U.S. companies, the Fund may invest up to 35% of its net assets in U.S. dollar-denominated securities issued by non-U.S. companies. The Fund seeks to meet its investment objective by investing primarily in preferred securities, but it may also invest up to 20% of its net assets in other types of securities, including corporate debt securities, U.S. government and agency debt, taxable municipal securities and convertible preferred securities. The Fund may invest up to 15% of its net assets in securities and other instruments that, at the time of investment, are illiquid (i.e., securities that are not readily marketable). The Fund may also invest in forwards, futures, options and swap contracts, or other derivative financial instruments including credit default swaps.
During the fiscal period ended September 30, 2009, the Fund’s Board of Trustees approved a change in the Fund’s fiscal and tax year ends from December 31 to September 30.
On September 29, 2009, the Fund issued Class R3 Shares. Effective January 30, 2010, the Fund began issuing Class R3 Shares to certain retirement plans. At March 31, 2010, all outstanding Class R3 Shares were owned by the Adviser.
The following is a summary of significant accounting policies followed by the Fund in the preparation of its financial statements in accordance with US generally accepted accounting principles.
Investment Valuation
Exchange-listed securities are generally valued at the last sales price on the securities exchange on which such securities are primarily traded. Securities traded on a securities exchange for which there are no transactions on a given day or securities not listed on a securities exchange are valued at the mean of the closing bid and asked prices. Securities traded on NASDAQ are valued at the NASDAQ Official Closing Price. The prices of fixed-income securities are provided by a pricing service approved by the Fund’s Board of Trustees. Futures contracts are valued using the closing settlement price or, in the absence of such a price, at the mean of the bid and asked prices. When market price quotes are not readily available, the pricing service or, in the absence of a pricing service for a particular investment or derivative instrument, the Board of Trustees of the Fund, or its designee may establish fair value using a wide variety of market data including yields or prices of investments of comparable quality, type of issue, coupon, maturity and rating, market quotes or indications of value from security dealers, evaluations of anticipated cash flows or collateral, general market conditions and other information and analysis, including the obligor’s credit characteristics considered relevant. Short-term investments are valued at amortized cost, which approximates value.
Investment Transactions
Investment transactions are recorded on a trade date basis. Realized gains and losses from investment transactions are determined on the specific identification method. Investments purchased on a when-issued/delayed delivery basis may have extended settlement periods. Any investments so purchased are subject to market fluctuation during this period. The Fund has instructed the custodian to segregate assets with a current value at least equal to the amount of the when-issued/delayed delivery purchase commitments. At March 31, 2010, the Fund had outstanding when-issued/delayed purchase commitments of $4,637,200.
Investment Income
Dividend income is recorded on the ex-dividend date or, for foreign securities, when information is available. Interest income, which includes the amortization of premiums and accretion of discounts for financial reporting purposes, is recorded on an accrual basis. Investment income also includes paydown gains and losses, if any.
Income Taxes
The Fund intends to distribute substantially all of its net investment income and net capital gains to shareholders and to otherwise comply with the requirements of Subchapter M of the Internal Revenue Code applicable to regulated investment companies. Therefore, no federal income tax provision is required.
For all open tax years and all major taxing jurisdictions, management of the Fund has concluded that there are no significant uncertain tax positions that would require recognition in the financial statements. Open tax years are those that are open for examination by
taxing authorities (i.e., generally the last four tax year ends and the interim tax period since then). Furthermore, management of the Fund is also not aware of any tax positions for which it is reasonably possible that the total amounts of unrecognized tax benefits will significantly change in the next twelve months.
Dividends and Distributions to Shareholders
Dividends from net investment income are declared monthly. Net realized capital gains from investment transactions, if any, are declared and distributed to shareholders at least annually. Furthermore, capital gains are distributed only to the extent they exceed available capital loss carryforwards.
Distributions to shareholders are recorded on the ex-dividend date. The amount and timing of distributions are determined in accordance with federal income tax regulations, which may differ from US generally accepted accounting principles.
Flexible Sales Charge Program
Class A Shares are generally sold with an up-front sales charge and incur a .25% annual 12b-1 service fee. Class A Share purchases of $1 million or more are sold at net asset value without an up-front sales charge but may be subject to a contingent deferred sales charge (“CDSC”) if redeemed within twelve months of purchase. Class C Shares are sold without an up-front sales charge but incur a .75% annual 12b-1 distribution fee and a .25% annual 12b-1 service fee. Class C Shares are subject to a CDSC of 1% if redeemed within one year of purchase. Class R3 Shares are sold without an up-front sales charge but incur a .50% annual 12b-1 distribution and service fee. Class I Shares are not subject to any sales charge or 12b-1 distribution or service fees.
Futures Contracts
The Fund is subject to interest rate risk in the normal course of pursuing its investment objectives and is authorized to invest in futures contracts in an attempt to manage such risk. Upon entering into a futures contract, the Fund is required to deposit with the broker an amount of cash or liquid securities equal to a specified percentage of the contract amount. This is known as the “initial margin.” Cash held by the broker to cover initial margin requirements on open futures contracts, if any, is recognized as “Deposits with brokers for open futures contracts” on the Statement of Assets and Liabilities. Subsequent payments (“variation margin”) are made or received by the Fund each day, depending on the daily fluctuation of the value of the contract. Variation margin is recognized as a receivable or payable for “Variation margin on futures contracts” on the Statement of Assets and Liabilities, when applicable.
During the period the futures contract is open, changes in the value of the contract are recorded as an unrealized gain or loss by “marking-to-market” on a daily basis to reflect the changes in market value of the contract and is recognized as “Change in net unrealized appreciation (depreciation) of futures contracts” on the Statement of Operations. When the contract is closed or expired, the Fund records a realized gain or loss equal to the difference between the value of the contract on the closing date and value of the contract when originally entered into and is recognized as “Net realized gain (loss) from futures contracts” on the Statement of Operations.
Risks of investments in futures contracts include the possible adverse movement of the securities or indices underlying the contracts, the possibility that there may not be a liquid secondary market for the contracts and/or that a change in the value of the contract may not correlate with a change in the value of the underlying securities or indices.
The average number of futures contracts outstanding during the six months ended March 31, 2010, was 8. The average number of contracts outstanding is calculated based on the outstanding contracts at the beginning of the fiscal year and at the end of each fiscal quarter within the current fiscal year. The Fund was not invested in futures contracts at the end of the reporting period. Refer to Footnote 3 – Derivative Instruments and Hedging Activities for further details on futures contract activity.
Market and Counterparty Credit Risk
In the normal course of business the Fund may invest in financial instruments and enter into financial transactions where risk of potential loss exists due to changes in the market (market risk) or failure of the other party to the transaction to perform (counterparty credit risk). The potential loss could exceed the value of the financial assets recorded on the financial statements. Financial assets, which potentially expose the Fund to counterparty credit risk, consist principally of cash due from counterparties on forward, option and swap transactions, when applicable. The extent of the Fund’s exposure to counterparty credit risk in respect to these financial assets approximates their carrying value as recorded on the Statement of Assets and Liabilities. Futures contracts, when applicable, expose the Fund to minimal counterparty credit risk as they are exchange traded and the exchange’s clearinghouse, which is counterparty to all exchange traded futures, guarantees the futures contracts against default.
The Fund helps manage counterparty credit risk by entering into agreements only with counterparties the Adviser believes have the financial resources to honor their obligations and by having the Adviser monitor the financial stability of the counterparties. Additionally, counterparties may be required to pledge collateral daily (based on the daily valuation of the financial asset) on behalf of the Fund with a value approximately equal to the amount of any unrealized gain above a pre-determined threshold. Reciprocally, when the Fund has an unrealized loss, the Fund has instructed the custodian to pledge assets of the Fund as collateral with a value approximately equal to the amount of the unrealized loss above a pre-determined threshold. Collateral pledges are monitored and subsequently adjusted if and when the valuations fluctuate, either up or down, by at least the predetermined threshold amount.
Repurchase Agreements
In connection with transactions in repurchase agreements, it is the Fund’s policy that its custodian take possession of the underlying collateral securities, the fair value of which exceeds the principal amount of the repurchase transaction, including accrued interest, at all times. If the seller defaults, and the fair value of the collateral declines, realization of the collateral may be delayed or limited.
Notes to Financial Statements (Unaudited) (continued)
Expense Allocation
Expenses of the Fund that are not directly attributable to a specific class of shares are prorated among the classes based on the relative net assets of each class. Expenses directly attributable to a class of shares, which presently only include 12b-1 distribution and service fees, are recorded to the specific class.
Custodian Fee Credit
The Fund has an arrangement with the custodian bank whereby certain custodian fees and expenses are reduced by net credits earned on the Fund’s cash on deposit with the bank. Such deposit arrangements are an alternative to overnight investments. Credits for cash balances may be offset by charges for any days on which the Fund overdraws its account at the custodian bank.
Indemnifications
Under the Trust’s organizational documents, its officers and trustees are indemnified against certain liabilities arising out of the performance of their duties to the Trust. In addition, in the normal course of business, the Trust enters into contracts that provide general indemnifications to other parties. The Trust’s maximum exposure under these arrangements is unknown as this would involve future claims that may be made against the Trust that have not yet occurred. However, the Trust has not had prior claims or losses pursuant to these contracts and expects the risk of loss to be remote.
Use of Estimates
The preparation of financial statements in conformity with US generally accepted accounting principles requires management to make estimates and assumptions that affect the reported amounts of assets and liabilities at the date of the financial statements and the reported amounts of increases and decreases in net assets from operations during the reporting period. Actual results may differ from those estimates.
2. Fair Value Measurements
In determining the value of the Fund’s investments, various inputs are used. These inputs are summarized in the three broad levels listed below:
| | |
| Level 1 – | | Quoted prices in active markets for identical securities. |
| Level 2 – | | Other significant observable inputs (including quoted prices for similar securities, interest rates, prepayment speeds, credit risk, etc.). |
| Level 3 – | | Significant unobservable inputs (including management’s assumptions in determining the fair value of investments). |
The inputs or methodology used for valuing securities are not an indication of the risk associated with investing in those securities.
The following is a summary of the Fund’s fair value measurements as of March 31, 2010:
| | | | | | | | | | | | |
| | | Level 1 | | Level 2 | | Level 3 | | Total |
Investments: | | | | | | | | | | | | |
Preferred Securities* | | $ | 242,004,537 | | $ | 195,761,150 | | $ | — | | $ | 437,765,687 |
Taxable Municipal Bonds | | | — | | | 7,919,161 | | | — | | | 7,919,161 |
Corporate Bonds | | | — | | | 9,412,422 | | | — | | | 9,412,422 |
Short-Term Investments | | | 3,598,157 | | | — | | | — | | | 3,598,157 |
Total | | $ | 245,602,694 | | $ | 213,092,733 | | $ | — | | $ | 458,695,427 |
| * | Preferred Securities includes Convertible Preferred Securities, $25 Par (or similar) Preferred Securities and Capital Preferred Securities held by the Fund at the end of the reporting period, if any. |
3. Derivative Instruments and Hedging Activities
The Fund records derivative instruments at fair value, with changes in fair value recognized on the Statement of Operations, when applicable. Even though the Fund’s investments in derivatives may represent economic hedges, they are considered to be non-hedge transactions for financial reporting purposes. For additional information on the derivative instruments in which the Fund was invested during and at the end of the reporting period, refer to the Portfolio of Investments, Financial Statements and Footnote 1 – General Information and Significant Accounting Policies.
The following tables present the amount of net realized gain (loss) and change in net unrealized appreciation (depreciation) recognized for the six months ended March 31, 2010, on derivative instruments, as well as the primary risk exposure associated with each. The Fund had no derivative contracts outstanding at March 31, 2010.
| | | | |
| Net Realized Gain (Loss) from Futures Contracts | | | |
Risk Exposure | | | | |
Interest Rate | | $ | (44,310 | ) |
| | | | |
| Change in Net Unrealized Appreciation (Depreciation) of Futures Contracts | | | |
Risk Exposure | | | | |
Interest Rate | | $ | (101,585 | ) |
4. Fund Shares
Transactions in Fund shares were as follows:
| | | | | | | | | | | | | | | | | | | | | |
| | | Six Months Ended
3/31/10 | | | Nine Months Ended
9/30/09 | | | Year Ended
12/31/08 | |
| | | Shares | | | Amount | | | Shares | | | Amount | | | Shares | | | Amount | |
Shares sold: | | | | | | | | | | | | | | | | | | | | | |
Class A | | 3,028,913 | | | $ | 46,661,062 | | | 7,392,665 | | | $ | 86,106,998 | | | 2,293,754 | | | $ | 26,123,279 | |
Class B | | N/A | | | | N/A | | | N/A | | | | N/A | | | — | | | | — | |
Class C | | 1,759,772 | | | | 27,053,028 | | | 2,951,340 | | | | 36,370,246 | | | 538,244 | | | | 6,214,381 | |
Class R3 | | — | | | | — | | | 3,360 | | | | 50,000 | | | N/A | | | | N/A | |
Class I | | 8,805,759 | | | | 135,020,584 | | | 6,088,959 | | | | 75,912,514 | | | 2,530,870 | | | | 39,562,208 | |
Shares issued to shareholders
due to reinvestment of
distributions: | | | | | | | | | | | | | | | | | | | | | |
Class A | | 140,990 | | | | 2,169,011 | | | 158,894 | | | | 1,979,343 | | | 16,592 | | | | 194,768 | |
Class B | | N/A | | | | N/A | | | N/A | | | | N/A | | | 318 | | | | 5,496 | |
Class C | | 81,306 | | | | 1,252,286 | | | 55,612 | | | | 696,869 | | | 4,494 | | | | 54,997 | |
Class R3 | | 122 | | | | 1,883 | | | — | | | | — | | | N/A | | | | N/A | |
Class I | | 243,595 | | | | 3,744,984 | | | 196,138 | | | | 2,384,771 | | | 57,175 | | | | 785,414 | |
| | | 14,060,457 | | | | 215,902,838 | | | 16,846,968 | | | | 203,500,741 | | | 5,441,447 | | | | 72,940,543 | |
Shares redeemed: | | | | | | | | | | | | | | | | | | | | | |
Class A | | (1,664,886 | ) | | | (25,017,132 | ) | | (3,075,410 | ) | | | (38,757,840 | ) | | (423,124 | ) | | | (4,520,859 | ) |
Class B | | N/A | | | | N/A | | | N/A | | | | N/A | | | (14,780 | ) | | | (253,326 | ) |
Class C | | (247,078 | ) | | | (3,817,397 | ) | | (246,900 | ) | | | (2,853,301 | ) | | (10,956 | ) | | | (123,500 | ) |
Class R3 | | — | | | | — | | | — | | | | — | | | N/A | | | | N/A | |
Class I | | (1,360,718 | ) | | | (20,750,075 | ) | | (1,652,818 | ) | | | (19,175,426 | ) | | (463,163 | ) | | | (6,057,812 | ) |
| | | (3,272,682 | ) | | | (49,584,604 | ) | | (4,975,128 | ) | | | (60,786,567 | ) | | (912,023 | ) | | | (10,955,497 | ) |
Net increase (decrease) | | 10,787,775 | | | $ | 166,318,234 | | | 11,871,840 | | | $ | 142,714,174 | | | 4,529,424 | | | $ | 61,985,046 | |
| N/A – | The Fund did not issue Class R3 Shares prior to September 29, 2009. Effective March 31, 2008, Class B Shares were no longer available to the Fund and transferred to Class I Shares on May 2, 2008. |
5. Investment Transactions
Purchases and sales (including maturities but excluding short-term investments and derivative transactions) during the six months ended March 31, 2010, aggregated $280,066,269 and $108,003,104, respectively.
6. Income Tax Information
The following information is presented on an income tax basis. Differences between amounts for financial statement and federal income tax purposes are primarily due to timing differences in recognizing taxable market discount, amortization of premium on taxable debt securities and timing differences in recognizing certain gains and losses on investment transactions. To the extent that differences arise that are permanent in nature, such amounts are reclassified within the capital accounts on the Statement of Assets and Liabilities presented in the annual report, based on their federal tax basis treatment; temporary differences do not require reclassification. Temporary and permanent differences do not impact the net asset values of the Fund.
At March 31, 2010, the cost of investments was $397,489,323.
Gross unrealized appreciation and gross unrealized depreciation of investments at March 31, 2010, were as follows:
| | | | |
Gross unrealized: | | | | |
Appreciation | | $ | 66,574,994 | |
Depreciation | | | (5,368,890 | ) |
Net unrealized appreciation (depreciation) of investments | | $ | 61,206,104 | |
The tax components of undistributed net ordinary income and net long-term capital gains at September 30, 2009, the Fund’s last tax year end, were as follows:
| | | |
Undistributed net ordinary income* | | $ | 183,121 |
Undistributed net long-term capital gains | | | — |
| * | Undistributed net ordinary income (on a tax basis) has not been reduced for the dividend declared on September 10, 2009, paid on October 1, 2009. Net ordinary income consists of net taxable income derived from dividends, interest, and net short-term capital gains, if any. |
Notes to Financial Statements (Unaudited) (continued)
The tax character of distributions paid during the Fund’s last tax years ended September 30, 2009 and December 31, 2008, was designated for purposes of the dividends paid deduction as follows:
| | | |
| Nine months ended September 30, 2009 | | |
Distributions from net ordinary income* | | $ | 9,257,563 |
Distributions from net long-term capital gains | | | — |
Tax return of capital | | | — |
| | | |
| Year ended December 31, 2008 | | |
Distributions from net ordinary income* | | $ | 3,509,653 |
Distributions from net long-term capital gains | | | — |
Tax return of capital | | | 390,694 |
| * | Net ordinary income consists of net taxable income derived from dividends, interest, and net short-term capital gains, if any. |
At September 30, 2009, the Fund’s last tax year end, the Fund had unused capital loss carryforwards available for federal income tax purposes to be applied against future capital gains, if any. If not applied, the carryforwards will expire as follows:
| | | |
Expiration: | | | |
September 30, 2015 | | $ | 41,620 |
September 30, 2016 | | | 5,385,434 |
Total | | $ | 5,427,054 |
The Fund elected to defer net realized losses from investments incurred from January 1, 2009 through September 30, 2009, the Fund’s last tax year end, (“post-October losses”) in accordance with federal income tax regulations. Post-October capital losses of $5,240,828 are treated as having arisen on the first day of the current fiscal year.
7. Management Fees and Other Transactions with Affiliates
The Fund’s management fee is separated into two components – a fund-level fee, based only on the amounts of assets within the Fund, and a complex-level fee, based on the aggregate amount of all fund assets managed by the Adviser. This pricing structure enables Fund shareholders to benefit from growth in the assets within the Fund as well as from growth in the amount of complex-wide assets managed by the Adviser.
The annual fund-level fee, payable monthly, is calculated according to the following schedule:
| | | |
| Average Daily Net Assets* | | Fund-Level Fee Rate | |
For the first $125 million | | .5500 | % |
For the next $125 million | | .5375 | |
For the next $250 million | | .5250 | |
For the next $500 million | | .5125 | |
For the next $1 billion | | .5000 | |
For net assets over $2 billion | | .4750 | |
The annual complex-level fee, payable monthly, is calculated according to the following schedule:
| | | |
| Complex-Level Asset Breakpoint Level* | | Effective Rate at Breakpoint Level | |
$55 billion | | .2000 | % |
$56 billion | | .1996 | |
$57 billion | | .1989 | |
$60 billion | | .1961 | |
$63 billion | | .1931 | |
$66 billion | | .1900 | |
$71 billion | | .1851 | |
$76 billion | | .1806 | |
$80 billion | | .1773 | |
$91 billion | | .1691 | |
$125 billion | | .1599 | |
$200 billion | | .1505 | |
$250 billion | | .1469 | |
$300 billion | | .1445 | |
| * | The complex-level fee component of the management fee for the funds is calculated based upon the aggregate daily managed assets of all Nuveen funds, with such daily managed assets defined separately for each fund in its management agreement, but excluding assets attributable to investments in other Nuveen funds. For the complex-level and fund-level fees, daily managed assets include assets managed by the Adviser that are attributable to financial leverage. For these purposes, financial leverage includes the funds’ use of preferred stock and borrowings and investments in the residual interest certificates (also called inverse floating rate securities) in tender option bond (TOB) trusts, including the portion of assets held by a TOB trust that has been effectively financed by the trust’s issuance of floating rate securities, subject to an agreement by the Adviser to limit the amount of such assets for determining managed assets in certain circumstances. As of March 31, 2010, the complex-level fee rate was .1867%. |
The management fee compensates the Adviser for overall investment advisory and administrative services and general office facilities. The Trust pays no compensation directly to those of its trustees who are affiliated with the Adviser or to its officers, all of whom receive remuneration for their services to the Trust from the Adviser or its affiliates. The Board of Trustees has adopted a deferred compensation plan for independent trustees that enables trustees to elect to defer receipt of all or a portion of the annual compensation they are entitled to receive from certain Nuveen advised funds. Under the plan, deferred amounts are treated as though equal dollar amounts had been invested in shares of select Nuveen advised funds.
The Adviser agreed to waive fees and reimburse expenses, so that total annual fund operating expenses (excluding 12b-1 distribution and service fees, interest expenses, taxes, fees incurred in acquiring and disposing of portfolio securities, and extraordinary expenses) do not exceed .70% through April 30, 2010 (.75% from May 1, 2010 through May 31, 2011 and 1.25% after May 31, 2011) of the average daily net assets of any class of Fund shares. The Adviser may also voluntarily reimburse additional expenses from time to time. Voluntary reimbursements may be terminated at any time at the Adviser’s discretion.
During the six months ended March 31, 2010, Nuveen Investments, LLC (the “Distributor”), a wholly-owned subsidiary of Nuveen, collected sales charges on purchases of Class A shares, the majority of which were paid out as concessions to financial intermediaries as follows:
| | | |
Sales charges collected | | $ | 501,150 |
Paid to financial intermediaries | | | 455,290 |
The Distributor also received 12b-1 service fees on Class A Shares, substantially all of which were paid to compensate financial intermediaries for providing services to shareholders relating to their investments.
During the six months ended March 31, 2010, the Distributor compensated financial intermediaries directly with commission advances at the time of purchase as follows:
| | | |
Commission advances | | $ | 333,351 |
To compensate for commissions advanced to financial intermediaries, and all 12b-1 service and distribution fees collected on Class C Shares during the first year following a purchase are retained by the Distributor. During the six months ended March 31, 2010, the Distributor retained such 12b-1 fees as follows:
| | | |
12b-1 fees retained | | $ | 291,730 |
The remaining 12b-1 fees charged to the Fund were paid to compensate financial intermediaries for providing services to shareholders relating to their investments.
The Distributor also retained $11,638 CDSC on share redemptions during the six months ended March 31, 2010.
At March 31, 2010, the Adviser owned 1,614, 1,575, 3,482 and 3,233 shares of Class A, C, R3 and I, respectively.
8. New Accounting Pronouncements
On January 21, 2010, the Financial Accounting Standards Board (FASB) issued changes to the authoritative guidance under generally accepted accounting principles (GAAP) for fair value measurements. The objective of this guidance is to provide guidance on how investment assets and liabilities are to be valued and disclosed. Specifically, the amendment requires reporting entities to disclose i) the input and valuation techniques used to measure fair value for both recurring and nonrecurring fair value measurements, for both Level 2 and Level 3 positions, ii) transfers between all levels (including Level 1 and Level 2) on a gross basis (i.e., transfers out must be disclosed separately from transfers in) as well as the reason(s) for the transfer and iii) purchases, sales, issuances and settlements in the Level 3 rollforward must be shown on a gross basis rather than as one net number. The effective date of the amendment is for interim and annual periods beginning after December 15, 2009, however, the requirement to provide the Level 3 activity for purchases, sales, issuances and settlements on a gross basis will be effective for interim and annual periods beginning after December 15, 2010. At this time management is evaluating the implications of this guidance and the impact it will have to the financial statement amounts and footnote disclosures, if any.
9. Subsequent Events
Dividends and Distributions – Policy Change
Effective April 1, 2010, the Fund began declaring dividends from its net investment income daily. The Fund will continue to pay such dividends monthly, and Fund shareholders will begin to accrue dividends on the business day after the day when the monies used to purchase Fund shares are collected by the Fund’s transfer agent.
Notes to Financial Statements (Unaudited) (continued)
Distributions to Shareholders
The Fund declared daily dividend distributions from its net investment income for the period April 1, 2010 through April 30, 2010, which were paid on May 3, 2010, to daily shareholders of record, as follows:
| | | | | | |
| | | Daily
Distribution | | Monthly
Distribution |
Dividend per share:* | | | | | | |
Class A | | $ | .0031 | | $ | .0940 |
Class C | | | .0028 | | | .0845 |
Class R3 | |
| .0031
| | | .0915 |
Class I | | | .0032 | |
| .0970
|
| * | Rounded to four decimal places. |
Financial Highlights (Unaudited)
Financial Highlights (Unaudited)
| | | | | | | | | | | | | | | | | | | | | | | | | | | | | | | | | | | | | |
| Selected data for a share outstanding throughout each period: | |
| | | | | | | | |
| Class (Commencement Date) | | | | | | | | | | | | | | | | | | | | | | | | |
| | | | | Investment Operations | | | Less Distributions | |
| | | | | | | | | | | | | | | | | | | | | | | | | | | |
| | | | | | | | | | |
| | | Beginning
Net
Asset
Value | | Net
Invest-
ment
Income(a) | |
Net
Realized/
Unrealized
Gain
(Loss) | | | Total | | | Net
Invest-
ment
Income | | | Capital
Gains | | | Tax
Return
of
Capital | | | Total | | | Ending
Net
Asset
Value | | | Total
Return(b) | |
Class A (12/06) | | | | | | | | | | | | | | | | | | | | | | | | | | | | | | | | | | |
Year Ended 9/30: | | | | | | | | | | | | | | | | | | | | | | | | | | | | | | | | | | | | | |
2010(d) | | $ | 14.73 | | $ | .55 | | $ | 1.38 | | | $ | 1.93 | | | $ | (.57 | ) | | $ | — | | | $ | — | | | $ | (.57 | ) | | $ | 16.09 | | | 13.33 | % |
2009(e) | | | 11.76 | | | .84 | | | 3.00 | | | | 3.84 | | | | (.87 | ) | | | — | | | | — | | | | (.87 | ) | | | 14.73 | | | 35.29 | |
Year Ended 12/31: | | | | | | | | | | | | | | | | | | | | | | | | | | | | | | | | | | | | | |
2008 | | | 16.98 | | | 1.31 | | | (5.30 | ) | | | (3.99 | ) | | | (1.08 | ) | | | — | | | | (.15 | ) | | | (1.23 | ) | | | 11.76 | | | (24.67 | ) |
2007 | | | 20.01 | | | 1.08 | | | (3.03 | ) | | | (1.95 | ) | | | (1.08 | ) | | | — | | | | — | | | | (1.08 | ) | | | 16.98 | | | (10.12 | ) |
2006(f) | | | 20.00 | | | .03 | | | (.02 | ) | | | .01 | | | | — | | | | — | | | | — | | | | — | | | | 20.01 | | | .05 | |
Class C (12/06) | | | | | | | | | | | | | | | | | | | | | | | | | | | | | | | | | | |
Year Ended 9/30: | | | | | | | | | | | | | | | | | | | | | | | | | | | | | | | | | | | | | |
2010(d) | | | 14.74 | | | .50 | | | 1.37 | | | | 1.87 | | | | (.51 | ) | | | — | | | | — | | | | (.51 | ) | | | 16.10 | | | 12.93 | |
2009(e) | | | 11.77 | | | .78 | | | 3.00 | | | | 3.78 | | | | (.81 | ) | | | — | | | | — | | | | (.81 | ) | | | 14.74 | | | 34.48 | |
Year Ended 12/31: | | | | | | | | | | | | | | | | | | | | | | | | | | | | | | | | | | | | | |
2008 | | | 16.96 | | | 1.16 | | | (5.24 | ) | | | (4.08 | ) | | | (.97 | ) | | | — | | | | (.14 | ) | | | (1.11 | ) | | | 11.77 | | | (25.13 | ) |
2007 | | | 20.01 | | | .93 | | | (3.03 | ) | | | (2.10 | ) | | | (.95 | ) | | | — | | | | — | | | | (.95 | ) | | | 16.96 | | | (10.85 | ) |
2006(f) | | | 20.00 | | | .03 | | | (.02 | ) | | | .01 | | | | — | | | | — | | | | — | | | | — | | | | 20.01 | | | .05 | |
Class R3 (9/09) | | | | | | | | | | | | | | | | | | | | | | | | | | | | | | | | | | |
Year Ended 9/30: | | | | | | | | | | | | | | | | | | | | | | | | | | | | | | | | | | | | | |
2010(d) | | | 14.82 | | | .54 | | | 1.39 | | | | 1.93 | | | | (.55 | ) | | | — | | | | — | | | | (.55 | ) | | | 16.20 | | | 13.28 | |
2009(h) | | | 14.88 | | | .01 | | | (.07 | ) | | | (.06 | ) | | | — | | | | — | | | | — | | | | — | | | | 14.82 | | | (.40 | ) |
Class I (12/06)(g) | | | | | | | | | | | | | | | | | | | | | | | | | | | | | | | | | | |
Year Ended 9/30: | | | | | | | | | | | | | | | | | | | | | | | | | | | | | | | | | | | | | |
2010(d) | | | 14.72 | | | .59 | | | 1.37 | | | | 1.96 | | | | (.59 | ) | | | — | | | | — | | | | (.59 | ) | | | 16.09 | | | 13.54 | |
2009(e) | | | 11.76 | | | .86 | | | 3.00 | | | | 3.86 | | | | (.90 | ) | | | — | | | | — | | | | (.90 | ) | | | 14.72 | | | 35.48 | |
Year Ended 12/31: | | | | | | | | | | | | | | | | | | | | | | | | | | | | | | | | | | | | | |
2008 | | | 16.98 | | | 1.19 | | | (5.14 | ) | | | (3.95 | ) | | | (1.14 | ) | | | — | | | | (.13 | ) | | | (1.27 | ) | | | 11.76 | | | (24.45 | ) |
2007 | | | 20.01 | | | 1.18 | | | (3.08 | ) | | | (1.90 | ) | | | (1.13 | ) | | | — | | | | — | | | | (1.13 | ) | | | 16.98 | | | (9.91 | ) |
2006(f) | | | 20.00 | | | .04 | | | (.03 | ) | | | .01 | | | | — | | | | — | | | | — | | | | — | | | | 20.01 | | | .05 | |
| | | | | | | | | | | | | | | | |
| | | | | | | | | | | |
| | | |
| | | | | | | | | | | |
| Ratios/Supplemental Data | |
| | | Ratios to Average
Net Assets
Before
Reimbursement | | | Ratios to Average
Net Assets After
Reimbursement(c) | | | | |
Ending
Net
Assets
(000) | | Expenses | | | Net
Invest-
ment
Income
(Loss) | | | Expenses | | | Net
Invest-
ment
Income
(Loss) | | | Portfolio
Turnover
Rate | |
| | | | | | | | | | | | | | | | |
| | | | | | | | | | | | | | | | |
| $ | 126,889 | | 1.19 | %* | | 6.99 | %* | | .93 | %* | | 7.25 | %* | | 31 | % |
| | 93,983 | | 1.47 | * | | 8.58 | * | | .94 | * | | 9.11 | * | | 30 | |
| | | | | | | | | | | | | | | | |
| | 22,420 | | 1.64 | | | 10.32 | | | .95 | | | 11.02 | | | 99 | |
| | 321 | | 2.50 | | | 4.23 | | | 1.13 | | | 5.60 | | | 179 | |
| | 275 | | 18.18 | * | | (12.06 | )* | | 1.23 | * | | 4.88 | * | | — | |
| | | | | | | | | | | | | | | | |
| | | | | | | | | | | | | | | | |
| | 78,873 | | 1.94 | * | | 6.30 | * | | 1.68 | * | | 6.56 | * | | 31 | |
| | 48,720 | | 2.23 | * | | 7.82 | * | | 1.69 | * | | 8.36 | * | | 30 | |
| | | | | | | | | | | | | | | | |
| | 6,429 | | 2.32 | | | 8.90 | | | 1.70 | | | 9.52 | | | 99 | |
| | 245 | | 3.29 | | | 3.39 | | | 1.89 | | | 4.79 | | | 179 | |
| | 275 | | 18.93 | * | | (12.82 | )* | | 1.99 | * | | 4.12 | * | | — | |
| | | | | | | | | | | | | | | | |
| | | | | | | | | | | | | | | | |
| | 56 | | 1.44 | * | | 6.69 | * | | 1.18 | * | | 6.96 | * | | 31 | |
| | 50 | | 1.37 | * | | 11.62 | * | | 1.20 | * | | 11.79 | * | | 30 | |
| | | | | | | | | | | | | | | | |
| | | | | | | | | | | | | | | | |
| | 251,132 | | .95 | * | | 7.34 | * | | .68 | * | | 7.61 | * | | 31 | |
| | 116,643 | | 1.21 | * | | 9.12 | * | | .69 | * | | 9.64 | * | | 30 | |
| | | | | | | | | | | | | | | | |
| | 38,697 | | 1.26 | | | 7.57 | | | .69 | | | 8.14 | | | 99 | |
| | 19,769 | | 1.80 | | | 5.28 | | | .78 | | | 6.30 | | | 179 | |
| | 4,178 | | 17.92 | * | | (11.81 | )* | | .98 | * | | 5.13 | * | | — | |
| (a) | Per share Net Investment Income is calculated using the average daily shares method. |
| (b) | Total return is the combination of changes in net asset value without any sales charge, reinvested dividend income at net asset value and reinvested capital gains distributions at net asset value, if any. Total returns are not annualized. |
| (c) | After expense reimbursement from the Adviser, where applicable. Expense ratios do not reflect the reduction of custodian fee credits earned on the Fund’s net cash on deposit with the custodian bank, where applicable. |
| (d) | For the six months ended March 31, 2010. |
| (e) | For the nine months ended September 30, 2009. |
| (f) | For the period December 19, 2006 (commencement of operations) through December 31, 2006. |
| (g) | Effective May 1, 2008, Class R Shares were renamed Class I Shares. |
| (h) | For the period September 29, 2009 (commencement of operations) through September 30, 2009. |
See accompanying notes to financial statements.
Annual Investment Management Agreement Approval Process
The Investment Company Act of 1940, as amended (the “1940 Act”), provides, in substance, that each investment advisory agreement between a fund and its investment adviser (including sub-advisers) will continue in effect from year to year only if its continuance is approved at least annually by the fund’s board members, including by a vote of a majority of the board members who are not parties to the advisory agreement or “interested persons” of any parties (the “Independent Board Members”), cast in person at a meeting called for the purpose of considering such approval. In connection with such approvals, the fund’s board members must request and evaluate, and the investment adviser is required to furnish, such information as may be reasonably necessary to evaluate the terms of the advisory agreement. Accordingly, at a meeting held on May 27-29, 2009 (the “May Meeting”), the Board of Trustees (the “Board,” and each Trustee, a “Board Member”) of the Fund, including a majority of the Independent Board Members, considered and approved the continuation of the advisory agreement (the “Advisory Agreement”) between the Fund and Nuveen Asset Management (“NAM”) for an additional one-year period. In preparation for their considerations at the May Meeting, the Board also held a separate meeting on April 21-22, 2009 (the “April Meeting”). Accordingly, the factors considered and determinations made regarding the renewals by the Independent Board Members include those made at the April Meeting.
In addition, in evaluating the Advisory Agreement, the Independent Board Members reviewed a broad range of information relating to the Fund and NAM, including absolute performance, fee and expense information for the Fund as well as comparative performance, fee and expense information for a comparable peer group of funds, the performance information of recognized and/or customized benchmarks (as applicable) of the Fund, the profitability of Nuveen for its advisory activities (which includes its wholly owned subsidiaries other than Winslow Capital Management, Inc. (“Winslow Capital”), which was recently acquired in December 2008), and other information regarding the organization, personnel, and services provided by NAM. The Independent Board Members also met quarterly as well as at other times as the need arose during the year and took into account the information provided at such meetings and the knowledge gained therefrom. Prior to approving the renewal of the Advisory Agreement, the Independent Board Members reviewed the foregoing information with their independent legal counsel and with management, reviewed materials from independent legal counsel describing applicable law and their duties in reviewing advisory contracts, and met with independent legal counsel in private sessions without management present. The Independent Board Members considered the legal advice provided by independent legal counsel and relied upon their knowledge of NAM, its services and the Fund resulting from their meetings and other interactions throughout the year and their own business judgment in determining the factors to be considered in evaluating the Advisory Agreement. Each Board Member may have accorded different weight to the various factors in reaching his or her conclusions with respect to the Advisory Agreement. The Independent Board Members did not identify any single factor as all-important or controlling. The Independent Board Members’ considerations were instead based on a comprehensive consideration of all the information presented. The principal factors considered by the Board and its conclusions are described below.
A. Nature, Extent and Quality of Services
In considering renewal of the Advisory Agreement, the Independent Board Members considered the nature, extent and quality of NAM’s services, including advisory services and administrative services. The Independent Board Members reviewed materials outlining, among other things, NAM’s organization and business; the types of services that NAM or its affiliates provide and are expected to provide to the Fund; the performance record of the Fund (as described in further detail below); and any initiatives Nuveen had taken for the applicable fund product line.
In reviewing the services provided and the initiatives undertaken during the past year, the Independent Board Members recognized the severe market turmoil experienced in the capital markets during recent periods, including sustained periods of high volatility, credit disruption and government intervention. The Independent Board Members considered NAM’s efforts, expertise and other actions taken to address matters as they arose that impacted the Fund. The Independent Board Members recognized the role of the Investment Services group which, among other things, monitors the various positions throughout the Nuveen fund complex to identify and address any systematic risks. In addition, the Capital Markets Committee of NAM provides a multi-departmental venue for developing new policies to mitigate any risks. The Independent Board Members further recognized NAM’s continuous review of the Nuveen funds’ investment strategies and mandates in seeking to continue to refine and improve the investment process for the funds, particularly in light of market conditions. In this regard, the Independent Board Members noted the changes recommended by NAM to various investment mandates for the Nuveen funds in seeking to take advantage of market opportunities and to improve the tools available for managing liquidity and market exposure; the establishment of a team responsible for coordinating the handling of large trades in or out of the Nuveen funds; and the ongoing monitoring of investment management processes.
As part of their review, the Independent Board Members also evaluated the background, experience and track record of NAM’s investment personnel. In this regard, the Independent Board Members considered any changes in the personnel, and the impact on the level of services provided to the Fund, if any. The Independent Board Members also reviewed information regarding portfolio manager compensation arrangements to evaluate NAM’s ability to attract and retain high quality investment personnel, preserve stability, and reward performance but not provide an incentive for taking undue risks.
In addition to advisory services, the Independent Board Members considered the quality of administrative services provided by NAM and its affiliates including product management, fund administration, oversight of service providers, shareholder services, administration of Board relations, regulatory and portfolio compliance and legal support. Given the importance of compliance, the Independent Board Members considered NAM’s compliance program, including the report of the chief compliance officer regarding the Fund’s compliance policies and procedures.
Based on their review, the Independent Board Members found that, overall, the nature, extent and quality of services provided (and expected to be provided) to the Fund under the Advisory Agreement were satisfactory.
B. The Investment Performance of the Fund and NAM
The Board considered the investment performance of the Fund, including the Fund’s historic performance as well as its performance compared to funds with similar investment objectives (the “Performance Peer Group”) based on data provided by an independent provider of mutual fund data as well as recognized and/or customized benchmarks. The Independent Board Members reviewed performance information including, among other things, total return information compared with the Fund’s Performance Peer Group and recognized and/or customized benchmarks for the quarter- and one-year periods ending December 31, 2008 and for the same periods ending March 31, 2009. This information supplemented the Fund performance information provided to the Board at each of its quarterly meetings.
In comparing a fund’s performance with that of its Performance Peer Group, the Independent Board Members took into account that the closest Performance Peer Group in certain instances may not adequately reflect the respective fund’s investment objectives and strategies thereby hindering a meaningful comparison of the fund’s performance with that of the Performance Peer Group. The Independent Board Members further considered the performance of the Fund in the context of the volatile market conditions during the past year, and their impact on various asset classes and the portfolio management of the Fund.
Based on their review and factoring in the severity of market turmoil in 2008, the Independent Board Members determined that the Fund’s investment performance over time had been satisfactory.
C. Fees, Expenses and Profitability
1. Fees and Expenses
The Board evaluated the management fees and expenses of the Fund reviewing, among other things, the Fund’s gross management fees, net management fees and total expense ratios (before and after expense reimbursements and/or waivers) in absolute terms as well as compared to the fee and expenses of a comparable universe of unaffiliated funds based on data provided by an independent fund data provider (the “Peer Universe”) and in certain cases, to a more focused subset of funds in the Peer Universe (the “Peer Group”).
The Independent Board Members further reviewed data regarding the construction of the applicable Peer Universe and Peer Group. In reviewing the comparisons of fee and expense information, the Independent Board Members took into account that in certain instances various factors such as the asset level of a fund relative to peers, the size and particular composition of the Peer Universe or Peer Group, the investment objectives of the peers, expense anomalies, changes in the funds comprising the Peer Universe or Peer Group from year to year, levels of reimbursement and the timing of information used may impact the comparative data, thereby limiting the ability to make a meaningful comparison. In reviewing the fee schedule for the Fund, the Independent Board Members also considered the fund-level and complex-wide breakpoint schedules (described in further detail below) and any fee waivers and reimbursements provided by Nuveen.
Based on their review of the fee and expense information provided, the Independent Board Members determined that the Fund’s management fees and net total expense ratio were reasonable in light of the nature, extent and quality of services provided to the Fund.
2. Comparisons with the Fees of Other Clients
The Independent Board Members further reviewed information regarding the nature of services and fee rates offered by NAM to other clients. Such clients include separately managed accounts (both retail and institutional accounts) and funds that are not offered by Nuveen but are sub-advised by one of Nuveen’s investment management teams. In evaluating the comparisons of fees, the Independent Board Members noted that the fee rates charged to the Fund and other clients vary, among other things, because of the different services involved and the additional regulatory and compliance requirements associated with registered investment companies, such as the Fund. Accordingly, the Independent Board Members considered the differences in the product types, including, but not limited to, the services provided, the structure and operations, product distribution and costs thereof, portfolio investment policies, investor profiles, account sizes and regulatory requirements. The Independent Board Members noted, in particular, that the range of services provided to the Fund (as discussed above) is much more extensive than that provided to separately managed accounts. Given the inherent differences in the products, particularly the extensive services provided to the Fund, the Independent Board Members believe such facts justify the different levels of fees.
3. Profitability of Nuveen
In conjunction with its review of fees, the Independent Board Members also considered the profitability of Nuveen for its advisory activities (which incorporated Nuveen’s wholly-owned affiliated sub-advisers other than Winslow Capital) and its financial condition. The Independent Board Members reviewed the revenues and expenses of Nuveen’s advisory activities for the last two years, the allocation methodology used in preparing the profitability data and an analysis of the key drivers behind the changes in revenues and expenses that impacted profitability in 2008. In addition, the Independent Board Members reviewed information regarding the financial results of Nuveen for 2008 based on its Form 8-K filed on March 31, 2009. The Independent Board Members noted this information supplemented the profitability information requested and received during the year to help keep them apprised of developments affecting profitability (such as changes in fee waivers and expense reimbursement commitments). In this regard, the
Annual Investment Management Agreement Approval Process (continued)
Independent Board Members noted that they had also appointed an Independent Board Member as a point person to review and keep them apprised of changes to the profitability analysis and/or methodologies during the year. The Independent Board Members also considered Nuveen’s revenues for advisory activities, expenses, and profit margin compared to that of various unaffiliated management firms with similar amounts of assets under management and relatively comparable asset composition prepared by Nuveen.
In reviewing profitability, the Independent Board Members recognized the subjective nature of determining profitability which may be affected by numerous factors including the allocation of expenses. Further, the Independent Board Members recognized the difficulties in making comparisons as the profitability of other advisers generally is not publicly available and the profitability information that is available for certain advisers or management firms may not be representative of the industry and may be affected by, among other things, the adviser’s particular business mix, capital costs, types of funds managed and expense allocations. Notwithstanding the foregoing, the Independent Board Members reviewed Nuveen’s methodology and assumptions for allocating expenses across product lines to determine profitability. In reviewing profitability, the Independent Board Members recognized Nuveen’s investment in its fund business. Based on their review, the Independent Board Members concluded that Nuveen’s level of profitability for its advisory activities was reasonable in light of the services provided.
In evaluating the reasonableness of the compensation, the Independent Board Members also considered other amounts paid to NAM by the Fund as well as any indirect benefits (such as soft dollar arrangements, if any) NAM and its affiliates receive, or are expected to receive, that are directly attributable to the management of the Fund, if any. See Section E below for additional information on indirect benefits NAM may receive as a result of its relationship with the Fund. Based on their review of the overall fee arrangements of the Fund, the Independent Board Members determined that the advisory fees and expenses of the Fund were reasonable.
D. Economies of Scale and Whether Fee Levels Reflect These Economies of Scale
With respect to economies of scale, the Independent Board Members have recognized the potential benefits resulting from the costs of a fund being spread over a larger asset base, although economies of scale are difficult to measure and predict with precision, particularly on a fund-by-fund basis. One method to help ensure the shareholders share in these benefits is to include breakpoints in the advisory fee schedule. Generally, management fees for funds in the Nuveen complex are comprised of a fund-level component and a complex-level component, subject to certain exceptions. Accordingly, the Independent Board Members reviewed and considered the applicable fund-level breakpoints in the advisory fee schedules that reduce advisory fees as asset levels increase. While economies of scale result when costs can be spread over a larger asset base, the Independent Board Members also recognized that the asset levels generally declined in 2008 due to, among other things, the market downturn. Accordingly, for funds with a reduction in assets under management, advisory fee levels may have increased as breakpoints in the fee schedule were no longer surpassed.
In addition to fund-level advisory fee breakpoints, the Board also considered the Fund’s complex-wide fee arrangement. Pursuant to the complex-wide fee arrangement, the fees of the funds in the Nuveen complex generally are reduced as the assets in the fund complex reach certain levels. The complex-wide fee arrangement seeks to provide the benefits of economies of scale to fund shareholders when total fund complex assets increase, even if assets of a particular fund are unchanged or have decreased. The approach reflects the notion that some of Nuveen’s costs are attributable to services provided to all its funds in the complex and therefore all funds benefit if these costs are spread over a larger asset base. Generally, the complex-wide pricing reduces Nuveen’s revenue because total complex fund assets have consistently grown in prior years. As noted, however, total fund assets declined in 2008 resulting in a smaller downward adjustment of revenues due to complex-wide pricing compared to the prior year.
Based on their review, the Independent Board Members concluded that the breakpoint schedules and complex-wide fee arrangement (as applicable) were acceptable and reflect economies of scale to be shared with shareholders when assets under management increase.
E. Indirect Benefits
In evaluating fees, the Independent Board Members received and considered information regarding potential “fall out” or ancillary benefits NAM or its affiliates may receive as a result of its relationship with the Fund. In this regard, the Independent Board Members considered, among other things, any sales charges, distribution fees and shareholder services fees received and retained by the Fund’s principal underwriter, an affiliate of NAM, which includes fees received pursuant to any 12b-1 plan. The Independent Board Members, therefore, considered the 12b-1 fees retained by Nuveen during the last calendar year.
In addition to the above, the Independent Board Members considered whether NAM received any benefits from soft dollar arrangements whereby a portion of the commissions paid by the Fund for brokerage may be used to acquire research that may be useful to NAM in managing the assets of the Fund and other clients. The Independent Board Members noted that NAM does not currently have any soft dollar arrangements; however, to the extent certain bona fide agency transactions that occur on markets that traditionally trade on a principal basis and riskless principal transactions are considered as generating “commissions,” NAM intends to comply with the applicable safe harbor provisions.
Based on their review, the Independent Board Members concluded that any indirect benefits received by NAM as a result of its relationship with the Fund were reasonable and within acceptable parameters.
F. Other Considerations
The Independent Board Members did not identify any single factor discussed previously as all-important or controlling. The Board Members, including the Independent Board Members, unanimously concluded that the terms of the Advisory Agreement are fair and reasonable, that NAM’s fees are reasonable in light of the services provided to the Fund and that the Advisory Agreement be renewed.
Notes
Notes
Glossary of Terms Used in this Report
Auction Rate Bond: An auction rate bond is a security whose interest payments are adjusted periodically through an auction process, which process typically also serves as a means for buying and selling the bond. Auctions that fail to attract enough buyers for all the shares offered for sale are deemed to have “failed,” with current holders receiving a formula-based interest rate until the next scheduled auction.
Average Annual Total Return: This is a commonly used method to express an investment’s performance over a particular, usually multi-year time period. It expresses the return that would have been necessary each year to equal the investment’s actual cumulative performance (including change in NAV or offer price and reinvested dividends and capital gains distributions, if any) over the time period being considered.
Average Duration: Duration is a measure of the expected period over which a bond’s principal and interest will be paid, and consequently is a measure of the sensitivity of a bond’s (or bond fund’s) value to changes when market interest rates change. Generally, the longer a bond or Fund’s duration, the more the price of the bond or Fund will change as interest rates change.
Collateralized Debt Obligations (CDOs): Collateralized debt obligations are a type of asset-backed security constructed from a portfolio of fixed-income assets. CDOs usually are divided into different tranches having different ratings and paying different interest rates. Losses, if any, are applied in reverse order of seniority and so junior tranches generally offer higher coupons to compensate for added default risk.
Dividend Yield (also known as Market Yield or Current Yield): An investment’s current annualized dividend divided by its current offering price.
Hybrid Security: A hybrid security combines two or more different financial instruments. A hybrid security generally combines both debt and equity characteristics.
Net Asset Value (NAV): A Fund’s NAV is the dollar value of one share in the Fund. It is calculated by subtracting the liabilities of the Fund from its total assets and then dividing the remainder by the number of shares outstanding. Fund NAVs are calculated at the end of each business day.
SEC 30-Day Yield: A standardized measure of a Fund’s yield that accounts for the future amortization of premiums or discounts of bonds held in the Fund’s portfolio.
Fund Information
Fund Manager
Nuveen Asset Management
333 West Wacker Drive
Chicago, IL 60606
Legal Counsel
Chapman and Cutler LLP
Chicago, IL
Independent Registered
Public Accounting Firm
Ernst & Young LLP
Chicago, IL
Custodian
State Street Bank & Trust Company
Boston, MA
Transfer Agent and Shareholder Services
Boston Financial
Data Services, Inc.
Nuveen Investor Services
P.O. Box 8530
Boston, MA 02266-8530
(800) 257-8787
Quarterly Portfolio of Investments and Proxy Voting Information: You may obtain (i) the Fund’s quarterly portfolio of investments, (ii) information regarding how the Fund voted proxies relating to portfolio securities held during the most recent twelve-month period ended June 30, 2009, and (iii) a description of the policies and procedures that the Fund used to determine how to vote proxies relating to portfolio securities without charge, upon request, by calling Nuveen Investments at (800) 257-8787 or on Nuveen’s website at www.nuveen.com.
You may also obtain this and other Fund information directly from the Securities and Exchange Commission (“SEC”). The SEC may charge a copying fee for this information. Visit the SEC on-line at http://www.sec.gov or in person at the SEC’s Public Reference Room in Washington, D.C. Call the SEC at (202) 942-8090 for room hours and operation. You may also request Fund information by sending an e-mail request to publicinfo@sec.gov or by writing to the SEC’s Public Reference Section at 100 F Street NE, Washington, D.C. 20549.
The Financial Industry Regulatory Authority (FINRA) provides a Public Disclosure Program which supplies certain information regarding the disciplinary history of FINRA members and their associated persons in response to either telephone inquiries at (800) 289-9999 or written inquiries at www.finra.org. Financial Industry Regulatory Authority also provides an investor brochure that includes information describing the Public Disclosure Program.
Nuveen Investments:
Serving Investors For Generations
Since 1898, financial advisors and their clients have relied on Nuveen Investments to provide dependable investment solutions through continued adherence to proven, long-term investing principles. Today, we offer a range of high quality equity and fixed-income solutions designed to be integral components of a well-diversified core portfolio.
Focused on meeting investor needs.
Nuveen Investments is a global investment management firm that seeks to help secure the long-term goals of institutions and high net worth investors as well as the consultants and financial advisors who serve them. We market our growing range of specialized investment solutions under the high-quality brands of HydePark, NWQ, Nuveen, Santa Barbara, Symphony, Tradewinds and Winslow Capital. In total, Nuveen Investments managed approximately $150 billion of assets on March 31, 2010.
Find out how we can help you.
To learn more about how the products and services of Nuveen Investments may be able to help you meet your financial goals, talk to your financial advisor, or call us at (800) 257-8787. Please read the information provided carefully before you invest.
Investors should consider the investment objective and policies, risk considerations, charges and expenses of any investment carefully. Where applicable, be sure to obtain a prospectus, which contains this and other relevant information. To obtain a prospectus, please contact your securities representative or Nuveen Investments, 333 W. Wacker Dr., Chicago, IL 60606. Please read the prospectus carefully before you invest or send money.
Learn more about Nuveen Funds at: www.nuveen.com/mf
| • | | Interactive planning tools |
| | |
Distributed by Nuveen Investments, LLC 333 West Wacker Drive Chicago, IL 60606 www.nuveen.com | | |
MSA-INV5-0310P
Mutual Funds

Nuveen Taxable Fixed Income Funds
For investors seeking current income and capital appreciation.
Semi-Annual Report
March 31, 2010
|
| Nuveen NWQ Preferred Securities Fund |
LIFE IS COMPLEX.
Nuveen makes things e-simple.
It only takes a minute to sign up for e-Reports. Once enrolled, you’ll receive an e-mail as soon as your Nuveen Fund information is ready. No more waiting for delivery by regular mail. Just click on the link within the e-mail to see the report and save it on your computer if you wish.
Free e-Reports right to your e-mail!
www.investordelivery.com
If you receive your Nuveen Fund dividends and statements from your financial advisor or brokerage account.
OR
www.nuveen.com/accountaccess
If you receive your Nuveen Fund dividends and statements directly from Nuveen.
| | | | | | |
| Must be preceded by or accompanied by a prospectus. | | NOT FDIC INSURED | | MAY LOSE VALUE | | NO BANK GUARANTEE |
Chairman’s
Letter to Shareholders

Dear Shareholder,
The economic environment in which your Fund operates reflects continuing but uneven economic recovery. The U.S. and other major industrial countries are experiencing steady but comparatively low levels of economic growth, while emerging market countries are seeing a resumption of relatively strong economic expansion. The largest source of economic uncertainty is the potential impact of steps being considered by many governments to counteract the extraordinary governmental spending and credit expansion carried out to deal with the financial and economic crisis of 2008. Consequently, the implications for future tax rates, government spending, interest rates and the pace of economic recovery in the U.S. and other leading economies are extremely difficult to predict at the present time. The long term health of the global economy depends on restoring some measure of fiscal discipline around the world, but since all of the corrective steps require economic pain, it is not surprising that governments are reluctant to undertake them.
In the near term, governments remain committed to furthering economic recovery and realizing a meaningful reduction in their national unemployment rates. Such an environment should produce continued economic growth and, consequently, attractive investment opportunities. Over the longer term, the larger uncertainty mentioned earlier carries the risk of unexpected potholes in the road to sustained recovery. For this reason, Nuveen’s investment management teams are working hard to balance return and risk by building well-diversified portfolios, among other strategies. I encourage you to read the following commentary on the management of your Fund. As always, I also encourage you to contact your financial consultant if you have any questions about your Nuveen Fund investment.
On behalf of the other members of your Fund’s Board, we look forward to continuing to earn your trust in the months and years ahead.
Sincerely,

Robert P. Bremner
Chairman of the Board
May 21, 2010
Portfolio Manager’s Comments
Certain statements in this report are forward-looking statements. Discussions of specific investments are for illustration only and are not intended as recommendations of individual investments. The forward looking statements and other views expressed herein are those of the portfolio manager as of the date of this report. Actual future results or occurrences may differ significantly from those anticipated in any forward-looking statements and the views expressed herein are subject to change at any time, due to numerous market and other factors. The Fund disclaims any obligation to update publicly or revise any forward-looking statements or views expressed herein.
The Nuveen NWQ Preferred Securities Fund features management NWQ Investment Management Company, LLC, an affiliate of Nuveen Investments. The team is led by Michael Carne, CFA. Michael has more than 20 of investment experience and joined NWQ in 2002. Here Michael discusses the Fund’s performance and investment strategy for the abbreviated reporting period from its inception on December 9, 2009, through March 31, 2010.
How did the Fund perform during the period from its inception through March 31, 2010?
The table on page three provides performance information for the Fund for the abbreviated period ended March 31, 2010. The table also compares the Fund’s performance to appropriate indexes. Over this period, the Fund’s Class A shares at net asset value outperformed the comparative market indexes and a relevant Lipper group index. A more detailed account of the Fund’s relative performance is provided later in this report
What strategies were used to manage the Fund during the reporting period, and how did this affect performance?
Over this initial reporting period, the NWQ fixed-income team sought to meet the Fund’s investment objective to provide current income and capital appreciation by investing primarily in preferred securities. However, the Fund also may invest up to 20% of its net assets in non-preferred securities, including common stock, convertible debt securities, corporate debt securities, mortgage-backed securities and U.S. Government and agency debt securities. The Fund may invest up to 50% of its net assets in below investment-grade securities. Although the Fund invests primarily in securities issued by U.S. companies, it may invest up to 40% of its net assets in U.S. dollar-denominated securities issued by non-U.S. companies.
To meet the Fund’s objectives, we employ a rigorous, bottom-up research-focused investment process that seeks to identify undervalued companies with positive risk/reward characteristics. Our investment process focuses on both equity and fixed-income characteristics of a security, while considering the relative attractiveness of a particular security within a company’s capital structure. We may choose to sell securities or reduce positions if we feel that a company no longer possesses favorable risk/reward characteristics, attractive valuations or catalysts, if we identify better alternatives within a company’s capital structure, or if a company suspends or is projected to suspend its dividend or interest payments.
| * | Fund and Lipper Average returns are as of 12/9/09. Index returns are as of 12/31/09. |
| 1 | The Merrill Lynch Fixed Rate Preferred Securities Index tracks the performance of fixed rate U.S. dollar denominated preferred securities issued in the U.S. domestic market. Qualifying securities must be rated investment grade (based on an average of Moody’s, S&P, and Fitch) and must have an investment grade rated country of risk (based on an average of Moody’s, S&P, and Fitch foreign currency long-term sovereign debt ratings). In addition, qualifying securities must be issued as public securities or through a 144a filing, must be issued in $25, $50, or $100 par/liquidation preference increments, must have a fixed coupon or dividend schedule, and must have a minimum amount outstanding of $100 million. The return assumes reinvestment of dividends and does not reflect any sales charges. You cannot invest directly in an index. |
| 2 | The Barclays Capital U.S. Corporate Bond Index covers U.S. dollar-denominated, investment-grade, fixed-rate, taxable securities sold by industrial, utility, and financial issuers. It includes publicly issued U.S. corporate debentures and secured notes that meet specific maturity, liquidity, and quality requirements. The return assumes reinvestment of dividends and does not reflect any sales charges. You cannot invest directly in an index. |
| 3 | The Lipper Corporate Debt BBB-Rated Funds Average compares funds invested primarily in corporate and government debt issues rated in the top four grades. The return accounts for the effects of management fees and assumes reinvestment of dividends but does not reflect any sales charges. You cannot invest directly in a Lipper average. |
For this abbreviated reporting period, economic data continued to show an acceleration in activity; confirming that the U.S. economy is continuing to claw its way out of the ‘great recession.’ Growth was generally improving, albeit from a low base, in most areas of the country, giving the Federal Reserve cover to continue to reduce its stimulus measures. The central bank ended the last leg of its security purchase program, the $1.25 trillion mortgage-backed securities leg, with little negative impact on spreads in that market and raised the discount rate 25 basis points from 0.50% to 0.75%. Bank earnings season has been mostly positive as the very steep yield curve and modest improvements in consumer credit metrics have bolstered performance. Along with selective equity capital raises, banks are rebuilding their balance sheets and bolstering capital levels.
Investors’ appetite for risk taking remained in force, allowing the preferred market, as measured by the Merrill Lynch Preferred Master Index (MLPMI), to post a very respectable return of 5.6% for the period. While all market sectors produced positive returns for the first quarter, the best performing sectors were insurance, finance and banking. The Fund’s outperformance was due to security selection, which provided the largest source of outperformance versus the benchmark over the period. In particular, holdings of Genworth common stock as well as Barclays and AEGON preferred securities were among the top performers. Our common stock holdings of Motorola and Barrick Gold produced negative returns.
There are several factors in play at this time which will likely serve to make any potential gains in the market for 2010 much more muted. The Federal Reserve has been reducing its stimulus measures and at some point late in 2010 or early 2011 is expected to raise interest rates. The extent and timing of any such move will have an effect on preferred returns. Additionally, the favorable tax treatment for Qualified Dividend Income is scheduled to expire at the end of this year. President Obama’s 2010 budget proposal would maintain some favorable treatment in 2011 by raising the top tax rate on dividends to 20% from 15% instead of treating it as ordinary income taxed at higher marginal rates. But that legislation has not yet passed, and could change over time. As Congress and the President work towards resolving this tax treatment of dividends issue, prices of tax-advantaged preferred securites may experience some volatility.
Class A Shares – Cumulative Total Returns as of 3/31/10
| | |
| | | Since
Inception* |
Nuveen NWQ Preferred Securities Fund | | |
A Shares at NAV | | 10.71% |
A Shares at Offer | | 5.36% |
Merrill Lynch Fixed Rate Preferred Securities Index1 | | 5.60% |
Barclays Capital U.S. Corporate Bond Index2 | | 1.84% |
Lipper Corporate Debt BBB-Rated Funds Average3 | | 2.93% |
Since-inception returns are cumulative.
Returns quoted represent past performance which is no guarantee of future results. Current performance may be higher or lower than the performance shown. Investment returns and principal value will fluctuate so that when shares are redeemed, they may be worth more or less than their original cost. Class A Shares have a 4.75% maximum sales charge. Returns at NAV would be lower if the sales charge were included.
Returns do not reflect the deduction of taxes that a shareholder would pay on Fund distributions or the redemption of shares. Returns may reflect a contractual agreement between the Fund and the investment adviser to waive certain fees and expenses; see Notes to Financial Statements, Footnote 7 – Management Fees and Other Transactions with Affiliates for more information. In addition, returns may reflect a voluntary expense limitation by the Fund’s investment adviser that may be modified or discontinued at any time without notice. For the most recent month-end performance, visit www.nuveen.com or call (800) 257-8787.
Please see the Fund’s Spotlight Page later in this report for more complete performance data and expense ratios.
Fund Spotlight as of 3/31/10 Nuveen NWQ Preferred Securities Fund
| | | | | | | | |
| Quick Facts | | | | | | | | |
| | | A Shares | | C Shares | | R3 Shares | | I Shares |
NAV | | $22.02 | | $21.98 | | $22.00 | | $22.03 |
Latest Monthly Dividend1 | | $0.1225 | | $0.1085 | | $0.1180 | | $0.1270 |
Inception Date | | 12/09/09 | | 12/09/09 | | 12/09/09 | | 12/09/09 |
Returns quoted represent past performance which is no guarantee of future results. Investment returns and principal value will fluctuate so that when shares are redeemed, they may be worth more or less than their original cost. Current performance may be higher or lower than the performance shown. Returns without sales charges would be lower if the sales charge were included. Returns do not reflect the deduction of taxes that a shareholder would pay on Fund distributions or the redemption of shares. For the most recent month-end performance visit www.nuveen.com or call (800) 257-8787.
Returns reflect differences in sales charges and expenses, which are primarily differences in distribution and service fees. Fund returns assume reinvestment of dividends and capital gains. Class A Shares have a 4.75% maximum sales charge. Class A Share purchases of $1 million or more are sold at net asset value without an up-front sales charge but may be subject to a contingent deferred sales charge (CDSC), also known as a backend sales charge, if redeemed within twelve months of purchase. Class C Shares have a 1% CDSC for redemptions within less than one year, which is not reflected in the one-year total return. Class R3 Shares have no sales charge and will be available to only certain retirement plan clients of financial intermediaries. Class I Shares have no sales charge and may be purchased under limited circumstances or by specified classes of investors. Returns may reflect an expense limitation by the Fund’s investment adviser.
| | | | |
| Cumulative Total Returns as of 3/31/10 |
| | |
| A Shares | | NAV | | Offer |
Since Inception | | 10.71% | | 5.36% |
| | |
| C Shares | | NAV | | |
Since Inception | | 10.44% | | |
| | |
| R3 Shares | | NAV | | |
Since Inception | | 10.59% | | |
| | |
| I Shares | | NAV | | |
Since Inception | | 10.79% | | |
| Yields |
| | |
| A Shares | | NAV | | Offer |
Dividend yield3 | | 6.68% | | 6.36% |
30-day yield3 | | 4.89% | | — |
SEC 30-day yield3,4 | | — | | 4.65% |
| | |
| C Shares | | NAV | | |
Dividend yield3 | | 5.92% | | |
30-day yield3 | | 4.14% | | |
| | |
| R3 Shares | | NAV | | |
Dividend yield3 | | 6.44% | | |
SEC 30-day yield3 | | 4.64% | | |
| | |
| I Shares | | NAV | | |
Dividend yield3 | | 6.92% | | |
SEC 30-day yield3 | | 5.14% | | |
| | |
| Top Five Issuers2: |
| Citigroup Inc. | | 6.4% |
| Blackrock | | 5.1% |
| Flaherty and Crumrine/Claymore | | 4.9% |
| Aegon N.V. | | 4.8% |
| JPMorgan Chase & Company | | 4.8% |
Portfolio Allocation2
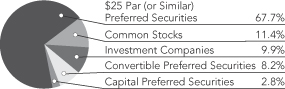
| | |
| Portfolio Statistics |
| Net Assets ($000) | | $2,201 |
| Number of Positions/Holdings | | 33 |
| | | |
| | | | |
| Expense Ratios | | | | |
| Share Class | | Gross
Expense
Ratios | | Net
Expense
Ratios |
| Class A | | 1.40% | | 1.00% |
| Class C | | 2.15% | | 1.75% |
| Class R3 | | 1.65% | | 1.25% |
| Class I | | 1.15% | | 0.75% |
The expense ratios shown factor in Total Annual Fund Operating Expenses including management fees and other fees and expenses. The Net Expense Ratios reflect a contractual commitment by the Fund’s investment adviser to waive fees and reimburse expenses through January 31, 2013. The expense ratios are those shown in the most recent Fund prospectus.
| 2 | As a percentage of total investments (excluding investments in derivatives) as of March 31, 2010. Holdings are subject to change. |
| 3 | Dividend yield is the most recent dividend per share (annualized) divided by the appropriate price per share. The SEC 30-Day Yield is computed under an SEC standardized formula and is based on the maximum offer price per share. The 30-Day Yield is computed under the same formula but is based on the Net Asset Value (NAV) per share. The Dividend yield may differ from the SEC 30-Day yield because the Fund may be paying out more or less than it is earning and it may not include the effect of amortization of bond premium. |
| 4 | The SEC 30-Day Yield on A Shares at NAV applies only to A Shares purchased at no-load pursuant to the Fund’s policy permitting waiver of the A Share load in certain specified circumstances. |
Fund Spotlight as of 3/31/10 Nuveen NWQ Preferred Securities Fund
| | |
| Industries1 | | |
Insurance | | 24.8% |
Diversified Financial Services | | 19.8% |
Commercial Banks | | 18.8% |
Investment Companies | | 9.9% |
Capital Markets | | 4.5% |
Wireless Communications | | 3.4% |
Other | | 18.8% |
| 1 | As a percentage of total investments (excluding investments in derivatives) as of March 31, 2010. Holdings are subject to change. |
Expense Example
As a shareholder of the Fund, you incur two types of costs: (1) transaction costs, including front and back end sales charges (loads) or redemption fees, where applicable; and (2) ongoing costs, including management fees; distribution and service (12b-1) fees, where applicable; and other Fund expenses. This Example is intended to help you understand your ongoing costs (in dollars) of investing in the Fund and to compare these costs with the ongoing costs of investing in other mutual funds. Since the expense examples below reflect only the first 113 days of the Fund’s operations they may not provide a meaningful understanding of the Fund’s ongoing expenses.
The Example below is based on an investment of $1,000 invested at the beginning of the period and held for the period.
The information under “Actual Performance,” together with the amount you invested, allows you to estimate actual expenses incurred over the reporting period. Simply divide your account value by $1,000 (for example, an $8,600 account value divided by $1,000 = 8.60) and multiply the result by the cost shown for your share class, in the row entitled “Expenses Incurred During Period” to estimate the expenses incurred on your account during this period.
The information under “Hypothetical Performance,” provides information about hypothetical account values and hypothetical expenses based on the Fund’s actual expense ratio and an assumed rate of return of 5% per year before expenses, which is not the Fund’s actual return. The hypothetical account values and expenses may not be used to estimate the actual ending account balance or expense you incurred for the period. You may use this information to compare the ongoing costs of investing in the Fund and other Funds. To do so, compare this 5% hypothetical example with the 5% hypothetical examples that appear in the shareholder reports of the other funds.
Please note that the expenses shown in the table are meant to highlight your ongoing costs only and do not reflect any transactional costs, such as front and back end sales charges (loads) or redemption fees, where applicable. Therefore, the hypothetical information is useful in comparing ongoing costs only, and will not help you determine the relative total costs of owning different funds or share classes. In addition, if these transactional costs were included, your costs would have been higher.
| | | | | | | | | | | | | | | | | | | | | | | | | | |
| | | | | | | | | | | | | Hypothetical Performance |
| | | Actual Performance | | | | (5% return before expenses) |
| | | A Shares | | C Shares | | R3 Shares | | I Shares | | | | A Shares | | C Shares | | R3 Shares | | I Shares |
| Beginning Account Value (12/09/09) | | $ | 1,000.00 | | $ | 1,000.00 | | $ | 1,000.00 | | $ | 1,000.00 | | | | $ | 1,000.00 | | $ | 1,000.00 | | $ | 1,000.00 | | $ | 1,000.00 |
| Ending Account Value (3/31/10) | | $ | 1,107.10 | | $ | 1,104.40 | | $ | 1,105.90 | | $ | 1,107.90 | | | | $ | 1,012.30 | | $ | 1,010.00 | | $ | 1,011.54 | | $ | 1,013.07 |
| Expenses Incurred During Period | | $ | 3.20 | | $ | 5.62 | | $ | 4.01 | | $ | 2.39 | | | | $ | 3.06 | | $ | 5.37 | | $ | 3.83 | | $ | 2.29 |
For each class of the Fund, expenses are equal to the Fund’s annualized net expense ratio of 0.99%, 1.74%, 1.24% and 0.74% for Classes A, C, R3 and I, respectively, multiplied by the average account value over the period, multiplied by 113/365 (to reflect the 113 days in the period since the Fund’s commencement of operations).
Portfolio of Investments (Unaudited)
Nuveen NWQ Preferred Securities Fund
March 31, 2010
| | | | | | | | | | | | | |
| Shares | | Description (1) | | | | | | | | | | Value |
| | | | | | | | | | | | | |
| | COMMON STOCKS – 11.3% | | | | | | | | | | | |
| | | | | | |
| | Aerospace & Defense – 1.1% | | | | | | | | | | | |
| | | | | | |
| 300 | | Lockheed Martin Corporation | | | | | | | | | | $ | 24,966 |
| | Communications Equipment – 1.9% | | | | | | | | | | | |
| | | | | | |
| 6,000 | | Motorola, Inc., (2) | | | | | | | | | | | 42,120 |
| | Diversified Financial Services – 2.6% | | | | | | | | | | | |
| | | | | | |
| 14,000 | | Citigroup Inc. | | | | | | | | | | | 56,700 |
| | Insurance – 2.5% | | | | | | | | | | | |
| | | | | | |
| 1,800 | | Genworth Financial Inc., Class A, (2) | | | | | | | | | | | 33,012 |
| | | | | | |
| 800 | | Hartford Financial Services Group, Inc. | | | | | | | | | | | 22,736 |
| | Total Insurance | | | | | | | | | | | 55,748 |
| | Metals & Mining – 1.2% | | | | | | | | | | | |
| | | | | | |
| 700 | | Barrick Gold Corporation | | | | | | | | | | | 26,838 |
| | Pharmaceuticals – 1.0% | | | | | | | | | | | |
| | | | | | |
| 600 | | Merck & Company Inc. | | | | | | | | | | | 22,410 |
| | Tobacco – 1.0% | | | | | | | | | | | |
| | | | | | |
| 400 | | Philip Morris International | | | | | | | | | | | 20,864 |
| | Total Common Stocks (cost $229,446) | | | | | | | | | | | 249,646 |
| | | | | | |
| Shares | | Description (1) | | Coupon | | | | | | Ratings (3) | | Value |
| | CONVERTIBLE PREFERRED SECURITIES – 8.1% | | | | | | | | | | | |
| | | | | | |
| | Commercial Banks – 8.1% | | | | | | | | | | | |
| | | | | | |
| 2,500 | | Sovereign Capital Trust IV, Convertible Bond | | 4.375% | | | | | | BBB+ | | $ | 81,250 |
| | | | | | |
| 100 | | Wells Fargo & Company, Convertible Bond | | 7.500% | | | | | | A– | | | 97,700 |
| | Total Commercial Banks | | | | | | | | | | | 178,950 |
| | Total Convertible Preferred Securities (cost $171,725) | | | | | | | | | | | 178,950 |
| | | | | | |
| Shares | | Description (1) | | Coupon | | | | | | Ratings (3) | | Value |
| | $25 PAR (OR SIMILAR) PREFERRED SECURITIES – 67.5% | | | | | | | | | | | |
| | | | | | |
| | Capital Markets – 4.5% | | | | | | | | | | | |
| | | | | | |
| 4,000 | | Deutsche Bank Contingent Capital Trust III | | 7.600% | | | | | | BBB+ | | $ | 99,360 |
| | Commercial Banks – 10.6% | | | | | | | | | | | |
| | | | | | |
| 2,500 | | Banco Santander Finance | | 10.500% | | | | | | A– | | | 70,625 |
| | | | | | |
| 4,000 | | Barclays Bank PLC | | 6.625% | | | | | | A– | | | 90,800 |
| | | | | | |
| 2,500 | | BB&T Capital Trust VI | | 9.600% | | | | | | A3 | | | 71,750 |
| | Total Commercial Banks | | | | | | | | | | | 233,175 |
| | Consumer Finance – 3.2% | | | | | | | | | | | |
| | | | | | |
| 4,000 | | SLM Corporation | | 6.000% | | | | | | BBB– | | | 71,440 |
| | Diversified Financial Services – 14.3% | | | | | | | | | | | |
| | | | | | |
| 1,000 | | Citigroup Capital Trust VIII | | 6.950% | | | | | | Ba1 | | | 20,970 |
| | | | | | |
| 4,000 | | Fleet Capital Trust VIII | | 7.200% | | | | | | Baa3 | | | 92,080 |
| | | | | | |
| 4,000 | | ING Groep N.V. | | 8.500% | | | | | | Ba1 | | | 96,680 |
| | | | | | |
| 4,000 | | JPMorgan Chase Capital Trust XXVIII | | 7.200% | | | | | | A2 | | | 104,920 |
| | Total Diversified Financial Services | | | | | | | | | | | 314,650 |
| | Electric Utilities – 3.3% | | | | | | | | | | | |
| | | | | | |
| 3,000 | | BGE Capital Trust II | | 6.200% | | | | | | BBB– | | | 72,720 |
Portfolio of Investments (Unaudited)
Nuveen NWQ Preferred Securities Fund (continued)
March 31, 2010
| | | | | | | | | | | |
| Shares | | Description (1) | | Coupon | | | | Ratings (3) | | Value |
| | | | | | | | | | | |
| | Insurance – 22.2% | | | | | | | | | |
| | | | | |
| 3,000 | | Aegon N.V. | | 6.875% | | | | BBB | | $ | 64,740 |
| | | | | |
| 2,000 | | Aegon N.V. | | 6.500% | | | | BBB | | | 40,960 |
| | | | | |
| 2,500 | | Allianz SE | | 8.375% | | | | A+ | | | 64,688 |
| | | | | |
| 3,000 | | Arch Capital Group Limited | | 8.000% | | | | BBB– | | | 77,460 |
| | | | | |
| 3,000 | | Endurance Specialty Holdings Limited | | 7.750% | | | | BBB– | | | 73,530 |
| | | | | |
| 4,000 | | PLC Capital Trust III | | 7.500% | | | | BBB | | | 97,000 |
| | | | | |
| 2,500 | | Prudential Financial Inc. | | 9.000% | | | | BBB+ | | | 69,125 |
| | Total Insurance | | | | | | | | | 487,503 |
| | Multi-Utilities – 3.1% | | | | | | | | | |
| | | | | |
| 2,500 | | Scana Corporation | | 7.700% | | | | BBB– | | | 68,475 |
| | Real Estate Investment Trust – 2.9% | | | | | | | | | |
| | | | | |
| 2,500 | | Vornado Realty LP | | 7.875% | | | | BBB | | | 62,925 |
| | Wireless Telecommunication Services – 3.4% | | | | | | | | | |
| | | | | |
| 3,000 | | Telephone and Data Systems Inc. | | 7.600% | | | | Baa2 | | | 74,400 |
| | Total $25 Par (or similar) Preferred Securities (cost $1,389,650) | | | | | | | | | 1,484,648 |
| | | | | |
Principal
Amount (000)/
Shares | | Description (1) | | Coupon | | Maturity | | Ratings (3) | | Value |
| | CAPITAL PREFERRED SECURITIES – 2.8% | | | | | | | | | |
| | | | | |
| | Diversified Financial Services – 2.8% | | | | | | | | | |
| | | | | |
| 2 | | Citigroup Capital Trust XII | | 8.500% | | 3/30/15 | | Ba1 | | $ | 61,608 |
| | Total Capital Preferred Securities (cost $60,000) | | | | | | | | | 61,608 |
| | | | | |
| Shares | | Description (1) | | | | | | | | Value |
| | INVESTMENT COMPANIES – 9.9% | | | | | | | | | |
| | | | | |
| 11,000 | | BlackRock Credit Allocation Income Trust II | | | | | | | | $ | 110,770 |
| | | | | |
| 7,000 | | Flaherty and Crumrine/Claymore Preferred Securities Income Fund Inc. | | | | | | | | | 107,100 |
| | Total Investment Companies (cost $190,591) | | | | | | | | | 217,870 |
| | Total Investments (cost $2,041,412) – 99.6% | | | | | | | | | 2,192,722 |
| | Other Assets Less Liabilities – 0.4% | | | | | | | | | 8,093 |
| | Net Assets – 100% | | | | | | | | $ | 2,200,815 |
Investments in Derivatives
| | | | | | | | | | | | | |
Number of
Contracts | | Type | | Notional
Amount (4) | | Expiration
Date | | Strike
Price | | Value |
| | CALL OPTIONS WRITTEN – (0.9)% | | | | | | | | | | | |
| | | | | |
| (140) | | Citigroup Inc. | | $ | (56,000) | | 1/22/11 | | $ | 4.0 | | $ | (8,890) |
| | | | | |
| (18) | | Genworth Financial Inc. | | | (27,000) | | 9/18/10 | | | 15.0 | | | (7,605) |
| | | | | |
| (8) | | Hartford Financial Services Group, Inc. | | | (23,200) | | 9/18/10 | | | 29.0 | | | (2,020) |
| | | | | |
| (3) | | Lockheed Martin Corporation | | | (25,500) | | 9/18/10 | | | 85.0 | | | (1,110) |
| | | | | |
| (6) | | Merck & Company Inc. | | | (24,000) | | 7/17/10 | | | 40.0 | | | (423) |
| | | | | |
| (30) | | Motorola, Inc. | | | (24,000) | | 10/16/10 | | | 8.0 | | | (885) |
| (205) | | Total Call Options Written (premiums received $16,346) | | | (179,700) | | | | | | | | (20,933) |
| | (1) | | All percentages shown in the Portfolio of Investments are based on net assets. |
| | (2) | | Non-income producing; issuer has not declared a dividend within the past twelve months. |
| | (3) | | Ratings: Using the higher of Standard & Poor’s Group (“Standard & Poor’s”) or Moody’s Investor Service, Inc. (“Moody’s”) rating. Ratings below BBB by Standard & Poor’s or Baa by Moody’s are considered to be below investment grade. |
| | (4) | | For disclosure purposes, Notional Amount is calculated by multiplying the Number of Contracts by the Strike Price by 100. |
See accompanying notes to financial statements.
Statement of Assets and Liabilities (Unaudited)
March 31, 2010
| | | |
Assets | | | |
Investments, at value (cost $2,041,412) | | $ | 2,192,722 |
Cash | | | 52,384 |
Receivables: | | | |
Dividends | | | 3,155 |
From Adviser | | | 2,192 |
Total assets | | | 2,250,453 |
Liabilities | | | |
Call options written, at value (premiums received $16,346) | | | 20,933 |
Dividends payable | | | 11,900 |
Accrued expenses: | | | |
12b-1 distribution and service fees | | | 814 |
Other | | | 15,991 |
Total liabilities | | | 49,638 |
Net assets | | $ | 2,200,815 |
Class A Shares | | | |
Net assets | | $ | 550,433 |
Shares outstanding | | | 25,000 |
Net asset value per share | | $ | 22.02 |
Offering price per share (net asset value per share plus
maximum sales charge of 4.75% of offering price) | | $ | 23.12 |
Class C Shares | | | |
Net assets | | $ | 549,513 |
Shares outstanding | | | 25,000 |
Net asset value and offering price per share | | $ | 21.98 |
Class R3 Shares | | | |
Net assets | | $ | 550,124 |
Shares outstanding | | | 25,000 |
Net asset value and offering price per share | | $ | 22.00 |
Class I Shares | | | |
Net assets | | $ | 550,745 |
Shares outstanding | | | 25,000 |
Net asset value and offering price per share | | $ | 22.03 |
Net Assets Consist of: | | | |
Capital paid-in | | $ | 2,000,000 |
Undistributed (Over-distribution of) net investment income | | | 29,529 |
Accumulated net realized gain (loss) | | | 24,563 |
Net unrealized appreciation (depreciation) | | | 146,723 |
Net assets | | $ | 2,200,815 |
See accompanying notes to financial statements.
Statement of Operations (Unaudited)
For the Period December 9, 2009 (commencement of operations) through March 31, 2010
| | | | |
Dividend and Interest Income | | $ | 49,040 | |
Expenses | | | | |
Management fees | | | 4,777 | |
12b-1 service fees – Class A | | | 405 | |
12b-1 distribution and service fees – Class C | | | 1,617 | |
12b-1 distribution and service fees – Class R3 | | | 809 | |
Shareholders’ servicing agent fees and expenses | | | 56 | |
Custodian’s fees and expenses | | | 2,223 | |
Trustees’ fees and expenses | | | 14 | |
Professional fees | | | 9,206 | |
Shareholders’ reports – printing and mailing expenses | | | 5,210 | |
Federal and state registration fees | | | 132 | |
Other expenses | | | 361 | |
Total expenses before custodian fee credit and expense reimbursement | | | 24,810 | |
Custodian fee credit | | | (7 | ) |
Expense reimbursement | | | (17,192 | ) |
Net expenses | | | 7,611 | |
Net investment income | | | 41,429 | |
Realized and Unrealized Gain (Loss): | | | | |
Net realized gain (loss) from investments | | | 24,563 | |
Net unrealized appreciation (depreciation) of: | | | | |
Investments | | | 151,310 | |
Call options written | | | (4,587 | ) |
Net realized and unrealized gain (loss) | | | 171,286 | |
Net increase (decrease) in net assets from operations | | $ | 212,715 | |
See accompanying notes to financial statements.
Statement of Changes in Net Assets (Unaudited)
For the Period December 9, 2009 (commencement of operations) through March 31, 2010
| | | | |
Operations | | | | |
Net investment income | | $ | 41,429 | |
Net realized gain (loss) from investments | | | 24,563 | |
Net unrealized appreciation (depreciation) of: | | | | |
Investments | | | 151,310 | |
Call options written | | | (4,587 | ) |
Net increase (decrease) in net assets from operations | | | 212,715 | |
Distributions to Shareholders | | | | |
From net investment income: | | | | |
Class A | | | (3,062 | ) |
Class C | | | (2,713 | ) |
Class R3 | | | (2,950 | ) |
Class I | | | (3,175 | ) |
Decrease in net assets from distributions to shareholders | | | (11,900 | ) |
Fund Share Transactions | | | | |
Proceeds from sale of shares | | | 2,000,000 | |
Net increase (decrease) in net assets from Fund share transactions | | | 2,000,000 | |
Net increase (decrease) in net assets | | | 2,200,815 | |
Net assets at the beginning of period | | | — | |
Net assets at the end of period | | | 2,200,815 | |
Undistributed (Over-distribution of) net investment income at the end of period | | $ | 29,529 | |
See accompanying notes to financial statements.
Notes to Financial Statements (Unaudited)
1. General Information and Significant Accounting Policies
The Nuveen Investment Trust V (the “Trust”) is an open-end management investment company registered under the Investment Company Act of 1940, as amended. The Trust is comprised of the Nuveen NWQ Preferred Securities Fund (the “Fund”), among others. The Trust was organized as a Massachusetts business trust on September 27, 2006. The Fund commenced operations on December 9, 2009.
The Fund’s investment objective is to provide current income and capital appreciation. Under normal market conditions, the Fund invests at least 80% of its net assets in preferred securities. Preferred securities, which generally pay fixed or adjustable rate dividends to investors, have preference over common stock in the payment of dividends and the liquidation of a company’s assets, which means that a company must pay dividends on its preferred securities before paying any dividends on its common stock. The Fund seeks to meet its investment objective by investing primarily in preferred securities, but it may also invest up to 20% of its net assets in non-preferred securities, including common stock, convertible debt securities, corporate debt securities, mortgage-backed securities and U.S. Government and agency debt securities. The Fund may also write covered call options on securities in which the fund holds a long position. The Fund may invest up to 50% of its net assets in below investment-grade securities, commonly referred to as “high yield,” “high risk” or “junk” securities. Although the Fund invests primarily in securities issued by U.S. companies, it may invest up to 40% of its net assets in dollar-denominated securities issued by non-U.S. companies.
The following is a summary of significant accounting policies followed by the Fund in the preparation of its financial statements in accordance with US generally accepted accounting principles.
Investment Valuation
Exchange-listed securities are generally valued at the last sales price on the securities exchange on which such securities are primarily traded. Securities traded on a securities exchange for which there are no transactions on a given day or securities not listed on a securities exchange are valued at the mean of the closing bid and asked prices. Securities traded on NASDAQ are valued at the NASDAQ Official Closing Price. The prices of fixed-income securities are provided by a pricing service approved by the Fund’s Board of Trustees. The value of exchange traded options are based on the last sale price, or in the absence of such a price, at the mean of the bid and asked price. When market price quotes are not readily available, the pricing service or, in the absence of a pricing service for a particular investment or derivative instrument, the Board of Trustees of the Fund, or its designee may establish fair value using a wide variety of market data including yields or prices of investments of comparable quality, type of issue, coupon, maturity and rating, market quotes or indications of value from security dealers, evaluations of anticipated cash flows or collateral, general market conditions and other information and analysis, including the obligor’s credit characteristics considered relevant. Short-term investments are valued at amortized cost, which approximates value.
Investment Transactions
Investment transactions are recorded on a trade date basis. Realized gains and losses from investment transactions are determined on the specific identification method. Investments purchased on a when-issued/delayed delivery basis may have extended settlement periods. Any investments so purchased are subject to market fluctuation during this period. The Fund has instructed the custodian to segregate assets with a current value at least equal to the amount of the when-issued/delayed delivery purchase commitments. At March 31, 2010, the Fund had no outstanding when-issued/delayed purchase commitments.
Investment Income
Dividend income is recorded on the ex-dividend date or, for foreign securities, when information is available. Interest income, which includes the amortization of premiums and accretion of discounts for financial reporting purposes, is recorded on an accrual basis. Investment income also includes paydown gains and losses, if any.
Income Taxes
The Fund intends to distribute substantially all of its net investment income and net capital gains to shareholders and to otherwise comply with the requirements of Subchapter M of the Internal Revenue Code applicable to regulated investment companies. Therefore, no federal income tax provision is required.
For all open tax years and all major taxing jurisdictions, management of the Fund has concluded that there are no significant uncertain tax positions that would require recognition in the financial statements. Open tax years are those that are open for examination by taxing authorities (i.e., generally the last four tax year ends and the interim tax period since then). Furthermore, management of the Fund is also not aware of any tax positions for which it is reasonably possible that the total amounts of unrecognized tax benefits will significantly change in the next twelve months.
Dividends and Distributions to Shareholders
Dividends from net investment income are declared monthly. Net realized capital gains from investment transactions, if any, are declared and distributed to shareholders at least annually. Furthermore, capital gains are distributed only to the extent they exceed available capital loss carryforwards.
Distributions to shareholders are recorded on the ex-dividend date. The amount and timing of distributions are determined in accordance with federal income tax regulations, which may differ from US generally accepted accounting principles.
Flexible Sales Charge Program
Class A Shares are generally sold with an up-front sales charge and incur a .25% annual 12b-1 service fee. Class A Share purchases of $1 million or more are sold at net asset value without an up-front sales charge but may be subject to a contingent deferred sales
charge (“CDSC”) if redeemed within twelve months of purchase. Class C Shares are sold without an up-front sales charge but incur a .75% annual 12b-1 distribution fee and a .25% annual 12b-1 service fee. Class C Shares are subject to a CDSC of 1% if redeemed within one year of purchase. Class R3 Shares are sold without an up-front sales charge but incur a .50% annual 12b-1 distribution and service fee. Class I Shares are not subject to any sales charge or 12b-1 distribution or service fees.
Options Transactions
The Fund is subject to equity price risk in the normal course of pursuing its investment objectives and is authorized to write (sell) call options, in an attempt to manage such risk. When the Fund writes a call option, an amount equal to the net premium received (the premium less commission) is recognized as a component of “Call options written, at value” on the Statement of Assets and Liabilities and is subsequently adjusted to reflect the current value of the written option until the option expires or the Fund enters into a closing purchase transaction. The changes in value of the options written during the reporting period are recognized as “Net unrealized appreciation (depreciation) of call options written” on the Statement of Operations. When a call option expires or the Fund enters into a closing purchase transaction, the difference between the net premium received and any amount paid at expiration or upon executing a closing purchase transaction, including commission, is recognized as “Net realized gain (loss) from call options written” on the Statement of Operations. The Fund, as a writer of a call option, has no control over whether the underlying instrument may be sold (called) and as a result bears the risk of an unfavorable change in the market value of the instrument underlying the written option. There is also the risk the Fund may not be able to enter into a closing transaction because of an illiquid market.
The average notional amount of call options written during the period December 9, 2009 (commencement of operations) through March 31, 2010, was $(89,850). The average notional amount is calculated based on the outstanding amount at the beginning of the fiscal year and at the end of each fiscal quarter within the current fiscal year. Refer to Footnote 3 – Derivative Instruments and Hedging Activities and Footnote 5 – Investment Transactions for further details on call options written.
Market and Counterparty Credit Risk
In the normal course of business the Fund may invest in financial instruments and enter into financial transactions where risk of potential loss exists due to changes in the market (market risk) or failure of the other party to the transaction to perform (counterparty credit risk). The potential loss could exceed the value of the financial assets recorded on the financial statements. Financial assets, which potentially expose the Fund to counterparty credit risk, consist principally of cash due from counterparties on forward, option and swap transactions, when applicable. The extent of the Fund’s exposure to counterparty credit risk in respect to these financial assets approximates their carrying value as recorded on the Statement of Assets and Liabilities. Futures contracts, when applicable, expose the Fund to minimal counterparty credit risk as they are exchange traded and the exchange’s clearinghouse, which is counterparty to all exchange traded futures, guarantees the futures contracts against default.
The Fund helps manage counterparty credit risk by entering into agreements only with counterparties Nuveen Asset Management (the “Adviser”), a wholly-owned subsidiary of Nuveen Investments, Inc (“Nuveen”) believes have the financial resources to honor their obligations and by having the Adviser monitor the financial stability of the counterparties. Additionally, counterparties may be required to pledge collateral daily (based on the daily valuation of the financial asset) on behalf of the Fund with a value approximately equal to the amount of any unrealized gain above a pre-determined threshold. Reciprocally, when the Fund has an unrealized loss, the Fund has instructed the custodian to pledge assets of the Fund as collateral with a value approximately equal to the amount of the unrealized loss above a pre-determined threshold. Collateral pledges are monitored and subsequently adjusted if and when the valuations fluctuate, either up or down, by at least the predetermined threshold amount.
Repurchase Agreements
In connection with transactions in repurchase agreements, it is the Fund’s policy that its custodian take possession of the underlying collateral securities, the fair value of which exceeds the principal amount of the repurchase transaction, including accrued interest, at all times. If the seller defaults, and the fair value of the collateral declines, realization of the collateral may be delayed or limited.
Expense Allocation
Expenses of the Fund that are not directly attributable to a specific class of shares are prorated among the classes based on the relative net assets of each class. Expenses directly attributable to a class of shares, which presently only include 12b-1 distribution and service fees, are recorded to the specific class.
Custodian Fee Credit
The Fund has an arrangement with the custodian bank whereby certain custodian fees and expenses are reduced by net credits earned on the Fund’s cash on deposit with the bank. Such deposit arrangements are an alternative to overnight investments. Credits for cash balances may be offset by charges for any days on which the Fund overdraws its account at the custodian bank.
Indemnifications
Under the Trust’s organizational documents, its officers and trustees are indemnified against certain liabilities arising out of the performance of their duties to the Trust. In addition, in the normal course of business, the Trust enters into contracts that provide general indemnifications to other parties. The Trust’s maximum exposure under these arrangements is unknown as this would involve future claims that may be made against the Trust that have not yet occurred. However, the Trust has not had prior claims or losses pursuant to these contracts and expects the risk of loss to be remote.
Notes to Financial Statements (Unaudited) (continued)
Use of Estimates
The preparation of financial statements in conformity with US generally accepted accounting principles requires management to make estimates and assumptions that affect the reported amounts of assets and liabilities at the date of the financial statements and the reported amounts of increases and decreases in net assets from operations during the reporting period. Actual results may differ from those estimates.
2. Fair Value Measurements
In determining the value of the Fund’s investments, various inputs are used. These inputs are summarized in the three broad levels listed below:
| | |
| Level 1 – | | Quoted prices in active markets for identical securities. |
| Level 2 – | | Other significant observable inputs (including quoted prices for similar securities, interest rates, prepayment speeds, credit risk, etc.). |
| Level 3 – | | Significant unobservable inputs (including management’s assumptions in determining the fair value of investments). |
The inputs or methodology used for valuing securities are not an indication of the risk associated with investing in those securities.
The following is a summary of the Fund’s fair value measurements as of March 31, 2010:
| | | | | | | | | | | | | | |
| | | Level 1 | | | Level 2 | | Level 3 | | Total | |
Investments: | | | | | | | | | | | | | | |
Common Stocks | | $ | 249,646 | | | $ | — | | $ | — | | $ | 249,646 | |
Preferred Securities* | | | 1,579,268 | | | | 145,938 | | | — | | | 1,725,206 | |
Investment Companies | | | 217,870 | | | | — | | | — | | | 217,870 | |
Derivatives: | | | | | | | | | | | | | | |
Call Options Written | | | (20,933 | ) | | | — | | | — | | | (20,933 | ) |
Total | | $ | 2,025,851 | | | $ | 145,938 | | $ | — | | $ | 2,171,789 | |
| * | Preferred Securities includes Convertible Preferred Securities, $25 Par (or similar) Preferred Securities and Capital Preferred Securities held by the Fund at the end of the reporting period, if any. |
3. Derivative Instruments and Hedging Activities
The Fund records derivative instruments at fair value, with changes in fair value recognized on the Statement of Operations, when applicable. Even though the Fund’s investments in derivatives may represent economic hedges, they are considered to be non-hedge transactions for financial reporting purposes. For additional information on the derivative instruments in which the Fund was invested during and at the end of the reporting period, refer to the Portfolio of Investments, Financial Statements and Footnote 1 – General Information and Significant Accounting Policies.
The following table presents the fair value of all derivative instruments held by the Fund as of March 31, 2010, the location of these instruments on the Statement of Assets and Liabilities, and the primary underlying risk exposure.
| | | | | | | | | | | | | | | |
| | | | | Location on the Statement of Assets and Liabilities |
| | | Derivative
Instrument | | Asset Derivatives | | | | | Liability Derivatives |
| Underlying Risk Exposure | | | Location | | Value | | | | | Location | | Value |
Equity Price | | Options | | — | | $ | — | | | | | Call options written, at value | | $ | 20,933 |
The following table presents the net unrealized appreciation (depreciation) recognized for the period December 9, 2009 (commencement of operations) through March 31, 2010, on derivative instruments, as well as the primary risk exposure associated with each.
| | | | |
| Net Unrealized Appreciation (Depreciation) of Call Options Written | | | |
Risk Exposure | | | | |
Equity Price | | $ | (4,587 | ) |
4. Fund Shares
Transactions in Fund shares were as follows:
| | | | | |
| | | For the Period 12/09/09
(commencement of operations)
through 3/31/10 |
| | | Shares | | Amount |
Shares sold: | | | | | |
Class A | | 25,000 | | $ | 500,000 |
Class C | | 25,000 | | | 500,000 |
Class R3 | | 25,000 | | | 500,000 |
Class I | | 25,000 | | | 500,000 |
Net increase (decrease) | | 100,000 | | $ | 2,000,000 |
5. Investment Transactions
Purchases and sales (including maturities but excluding short-term investments and derivative transactions) during the period December 9, 2009 (commencement of operations) through March 31, 2010, aggregated $2,281,934 and $265,086, respectively.
Transactions in call options written during the period December 9, 2009 (commencement of operations) through March 31, 2010, were as follows:
| | | | | |
| | | Number of
Contracts | | Premiums
Received |
Outstanding, beginning of period | | — | | $ | — |
Options written | | 205 | | | 16,346 |
Options terminated in closing purchase transactions | | — | | | — |
Options expired | | — | | | — |
Outstanding, end of period | | 205 | | $ | 16,346 |
6. Income Tax Information
The following information is presented on an income tax basis. Differences between amounts for financial statement and federal income tax purposes are primarily due to timing differences in recognizing certain gains and losses on investment transactions. To the extent that differences arise that are permanent in nature, such amounts are reclassified within the capital accounts on the Statement of Assets and Liabilities presented in the annual report, based on their federal tax basis treatment; temporary differences do not require reclassification. Temporary and permanent differences do not impact the net asset values of the Fund.
At March 31, 2010, the cost of investments was $2,041,412.
Gross unrealized appreciation and gross unrealized depreciation of investments at March 31, 2010, were as follows:
| | | | |
Gross unrealized: | | | | |
Appreciation | | $ | 155,005 | |
Depreciation | | | (3,695 | ) |
Net unrealized appreciation (depreciation) of investments | | $ | 151,310 | |
7. Management Fees and Other Transactions with Affiliates
The Fund’s management fee is separated into two components – a fund-level fee, based only on the amounts of assets within the Fund, and a complex-level fee, based on the aggregate amount of all fund assets managed by the Adviser. This pricing structure enables Fund shareholders to benefit from growth in the assets within the Fund as well as from growth in the amount of complex-wide assets managed by the Adviser.
The annual fund-level fee, payable monthly, is calculated according to the following schedule:
| | | |
| Average Daily Net Assets* | | Fund-Level Fee Rate | |
For the first $125 million | | .5500 | % |
For the next $125 million | | .5375 | |
For the next $250 million | | .5250 | |
For the next $500 million | | .5125 | |
For the next $1 billion | | .5000 | |
For net assets over $2 billion | | .4750 | |
The annual complex-level fee, payable monthly, is calculated according to the following schedule:
| | | |
| Complex-Level Asset Breakpoint Level* | | Effective Rate at Breakpoint Level | |
$55 billion | | .2000 | % |
$56 billion | | .1996 | |
$57 billion | | .1989 | |
$60 billion | | .1961 | |
$63 billion | | .1931 | |
$66 billion | | .1900 | |
$71 billion | | .1851 | |
$76 billion | | .1806 | |
$80 billion | | .1773 | |
$91 billion | | .1691 | |
$125 billion | | .1599 | |
$200 billion | | .1505 | |
$250 billion | | .1469 | |
$300 billion | | .1445 | |
| * | The complex-level fee component of the management fee for the funds is calculated based upon the aggregate daily managed assets of all Nuveen funds, with such daily managed assets defined separately for each fund in its management agreement, but excluding assets attributable to investments in other Nuveen funds. For the complex-level and fund-level fees, daily managed assets include assets managed by the Adviser that are attributable to financial leverage. For these purposes, financial leverage includes the funds’ use of preferred stock and borrowings and investments in the residual interest certificates (also called inverse floating rate securities) in tender option bond (TOB) trusts, including the portion of assets held by a TOB trust that has been effectively financed by the trust’s issuance of floating rate securities, subject to an agreement by the Adviser to limit the amount of such assets for determining managed assets in certain circumstances. As of March 31, 2010, the complex-level fee rate was .1867%. |
Notes to Financial Statements (Unaudited) (continued)
The management fee compensates the Adviser for overall investment advisory and administrative services and general office facilities. The Adviser has entered into a Sub-Advisory Agreement with NWQ Investment Management Company, LLC (“NWQ”), a subsidiary of Nuveen, under which NWQ manages the investment portfolio of the Fund. NWQ is compensated for its services to the Fund from the management fee paid to the Adviser.
The Adviser agreed to waive fees and reimburse expenses, so that total annual fund operating expenses (excluding 12b-1 distribution and service fees, interest expenses, taxes, fees incurred in acquiring and disposing of portfolio securities, and extraordinary expenses) do not exceed .75% through January 31, 2013 (1.25% after January 31, 2013) of the average daily net assets of any class of Fund shares. The Adviser may also voluntarily reimburse additional expenses from time to time. Voluntary reimbursements may be terminated at any time at the Adviser’s discretion.
At March 31, 2010, Nuveen owned all 25,000 shares of Class A, C, R3 and I, respectively.
8. New Accounting Pronouncements
On January 21, 2010, the Financial Accounting Standards Board issued changes to the authoritative guidance under generally accepted accounting principles for fair value measurements. The objective of this guidance is to provide guidance on how investment assets and liabilities are to be valued and disclosed. Specifically, the amendment requires reporting entities to disclose i) the input and valuation techniques used to measure fair value for both recurring and nonrecurring fair value measurements, for both Level 2 and Level 3 positions, ii) transfers between all levels (including Level 1 and Level 2) on a gross basis (i.e., transfers out must be disclosed separately from transfers in) as well as the reason(s) for the transfer and iii) purchases, sales, issuances and settlements in the Level 3 rollforward must be shown on a gross basis rather than as one net number. The effective date of the amendment is for interim and annual periods beginning after December 15, 2009, however, the requirement to provide the Level 3 activity for purchases, sales, issuances and settlements on a gross basis will be effective for interim and annual periods beginning after December 15, 2010. At this time management is evaluating the implications of this guidance and the impact it will have to the financial statement amounts and footnote disclosures, if any.
9. Subsequent Events
Dividends and Distributions — Policy Change
Effective April 1, 2010, the Fund began declaring dividends from its net investment income daily. The Fund will continue to pay such dividends monthly, and Fund shareholders will begin to accrue dividends on the business day after the day when the monies used to purchase Fund shares are collected by the Fund’s transfer agent.
Distributions to Shareholders
The Fund declared daily dividend distributions from its net investment income for the period April 1, 2010 through April 30, 2010, which were paid on May 3, 2010, to daily shareholders of record as follows:
| | | | | | |
| | | Daily Distribution | | Monthly Distribution |
Dividend per share:* | | | | | | |
Class A | | $ | .0041 | | $ | .1225 |
Class C | | | .0036 | | | .1085 |
Class R3 | | | .0039 | | | .1180 |
Class I | | | .0042 | | | .1270 |
| * | Rounded to four decimal places. |
Financial Highlights (Unaudited)
Financial Highlights (Unaudited)
| | | | | | | | | | | | | | | | | | | | | | | | | | | | | |
| Selected data for a share outstanding throughout the period: | |
| | | | | | | |
| Class (Commencement Date) | | | | | | | | | | | | | | | | | |
| | | | | Investment Operations | | Less Distributions | |
| | | | | | | | | | | | | | | | | | | | |
| | | | | | | | | |
| | | Beginning
Net
Asset
Value | | Net
Invest-
ment
Income(a) | |
Net
Realized/
Unrealized
Gain
(Loss) | | Total | | Net
Invest-
ment
Income | | | Capital
Gains | | Total | | | Ending
Net
Asset
Value | | Total
Return(b) | |
Class A (12/09) | | | | | | | | | | | | | | | | | | | | | | | | | | |
2010(d) | | $ | 20.00 | | $ | .43 | | $ | 1.71 | | $ | 2.14 | | $ | (.12 | ) | | $ | — | | $ | (.12 | ) | | $ | 22.02 | | 10.71 | % |
Class C (12/09) | | | | | | | | | | | | | | | | | | | | | | | | | | |
2010(d) | | | 20.00 | | | .38 | | | 1.71 | | | 2.09 | | | (.11 | ) | | | — | | | (.11 | ) | | | 21.98 | | 10.44 | |
Class R3 (12/09) | | | | | | | | | | | | | | | | | | | | | | | | | | |
2010(d) | | | 20.00 | | | .41 | | | 1.71 | | | 2.12 | | | (.12 | ) | | | — | | | (.12 | ) | | | 22.00 | | 10.59 | |
Class I (12/09) | | | | | | | | | | | | | | | | | | | | | | | | | | |
2010(d) | | | 20.00 | | | .44 | | | 1.72 | | | 2.16 | | | (.13 | ) | | | — | | | (.13 | ) | | | 22.03 | | 10.79 | |
| | | | | | | | | | | | | | | | |
| | | | | | | | | | | |
| | | |
| | | | | | | | | | | |
| Ratios/Supplemental Data | |
| | | Ratios to Average
Net Assets Before
Reimbursement | | | Ratios to Average
Net Assets After
Reimbursement(c) | | | | |
Ending
Net
Assets
(000) | | Expenses | | | Net
Invest-
ment
Income | | | Expenses | | | Net
Invest-
ment
Income | | | Portfolio
Turnover
Rate | |
| | | | | | | | | | | | | | | | |
| $ | 550 | | 3.65 | %* | | 3.93 | %* | | .99 | %* | | 6.58 | %* | | 14 | % |
| | | | | | | | | | | | | | | | |
| | 550 | | 4.39 | * | | 3.18 | * | | 1.74 | * | | 5.84 | * | | 14 | |
| | | | | | | | | | | | | | | | |
| | 550 | | 3.89 | * | | 3.68 | * | | 1.24 | * | | 6.34 | * | | 14 | |
| | | | | | | | | | | | | | | | |
| | 551 | | 3.40 | * | | 4.18 | * | | .74 | * | | 6.84 | * | | 14 | |
| (a) | Per share Net Investment Income is calculated using the average daily shares method. |
| (b) | Total return is the combination of changes in net asset value without any sales charge, reinvested dividend income at net asset value and reinvested capital gains distributions at net asset value, if any. Total returns are not annualized. |
| (c) | After expense reimbursement from the Adviser, where applicable. Expense ratios do not reflect the reduction of custodian fee credits earned on the Fund’s net cash on deposit with the custodian bank, where applicable. |
| (d) | For the period December 9, 2009 (commencement of operations) through March 31, 2010. |
See accompanying notes to financial statements.
Annual Investment Management Agreement Approval Process
The Board of Trustees (the “Board,” and each Trustee, a “Board Member”) of the Nuveen NWQ Preferred Securities Fund (the “Fund”) is responsible for approving advisory arrangements for the Fund and, at a meeting held on October 2, 2009 (the “Meeting”), was asked to approve the advisory arrangements for the Fund. At the Meeting, the Board Members, including the Board Members who are not parties to the advisory agreements or “interested persons” of any such parties (the “Independent Board Members”), approved the investment management agreement (the “Investment Management Agreement”) between the Fund and Nuveen Asset Management (“NAM”) and the investment sub-advisory agreement (the “Sub-Advisory Agreement”) between NAM and NWQ Investment Management Company, LLC (the “Sub-Adviser”), on behalf of the Fund. The Sub-Adviser and NAM are each hereafter a “Fund Adviser.” The Investment Management Agreement and the Sub-Advisory Agreement are each hereafter an “Advisory Agreement.”
To assist the Board in its evaluation of an Advisory Agreement with a Fund Adviser at the Meeting, the Independent Board Members had received, in adequate time in advance of the Meeting or at prior meetings, materials which outlined, among other things:
| | • | | the nature, extent and quality of services expected to be provided by the Fund Adviser; |
| | • | | the organization of the Fund Adviser, including the responsibilities of various departments and key personnel; |
| | • | | the expertise and background of the Fund Adviser with respect to the Fund’s investment strategy; |
| | • | | certain performance-related information (as described below); |
| | • | | the profitability of Nuveen Investments, Inc. (“Nuveen”) (which incorporated Nuveen’s wholly-owned affiliated sub-advisers during the relevant period); |
| | • | | the proposed management fees of the Fund Adviser, including comparisons of such fees with the management fees of comparable funds; |
| | • | | the expected expenses of the Fund, including comparisons of the Fund’s expected expense ratio with the expense ratios of comparable funds; and |
| | • | | the soft dollar practices of the Fund Adviser, if any. |
At the Meeting, NAM made a presentation to and responded to questions from the Board. During the Meeting, the Independent Board Members also met privately with their legal counsel to review the Board’s duties under the Investment Company Act of 1940 (the “1940 Act”), the general principles of state law in reviewing and approving advisory contracts, the standards used by courts in determining whether investment company boards of directors have fulfilled their duties, factors to be considered in voting on advisory contracts and an adviser’s fiduciary duty with respect to advisory agreements and compensation. It is with this background that the Independent Board Members considered the Advisory Agreements with the Fund Advisers for the Fund. As outlined in more detail below, the Independent Board Members considered all factors they believed relevant with respect to the Fund, including the following: (a) the nature, extent and quality of the services to be provided by the Fund Adviser; (b) investment performance, as described below; (c) the profitability of Nuveen and its affiliates; (d) the extent to which economies of scale would be realized; and (e) whether fee levels reflect these economies of scale for the benefit of Fund investors.
A. Nature, Extent and Quality of Services
The Independent Board Members considered the nature, extent and quality of the respective Fund Adviser’s services, including advisory services and administrative services. As NAM and the Sub-Adviser already serve as adviser and sub-adviser, respectively, to other Nuveen funds overseen by the Board Members, the Board has a good understanding of each such Fund Adviser’s organization, operations and personnel. As the Independent Board Members meet regularly throughout the year to oversee the Nuveen funds, including funds currently advised by the Fund Advisers, the Independent Board Members have relied upon their knowledge from their meetings and any other interactions throughout the year of the respective Fund Adviser and its services in evaluating the Advisory Agreements.
At the Meeting and at prior meetings, the Independent Board Members reviewed materials outlining, among other things, the respective Fund Adviser’s organization and business; the types of services that such Fund Adviser or its affiliates provide to the Nuveen funds and are expected to provide to the Fund; and the experience of the respective Fund Adviser with applicable investment strategies. Further, the Independent Board Members have evaluated the background, experience and track record of the Fund Adviser’s investment personnel.
In addition to advisory services, the Independent Board Members considered the quality of any administrative or non-advisory services to be provided. In this regard, NAM is expected to provide the Fund with such administrative and other services (exclusive of, and in addition to, any such services provided by others for the Fund) and officers and other personnel as are necessary for the operations of the Fund. In addition to investment management services, NAM and its affiliates will provide the Fund with a wide range of services, including, among other things, product management, fund administration, oversight of service providers, shareholder services, administration of Board relations, regulatory and portfolio compliance and legal support. The Independent Board Members also recognized that NAM would oversee the Sub-Adviser.
In evaluating the services of the Sub-Adviser, the Independent Board Members noted that the Sub-Advisory Agreement was essentially an agreement for portfolio management services only and the Sub-Adviser was not expected to supply other significant administrative services to the Fund. In addition, the Board Members recognized the Sub-Adviser’s experience and established philosophy and process with the asset class of the Fund.
Based on their review, the Independent Board Members found that, overall, the nature, extent and quality of services expected to be provided to the Fund under each Advisory Agreement were satisfactory.
B. Investment Performance
The Fund is new and therefore does not have its own performance history. However, the Independent Board Members are familiar with each Fund Adviser’s performance record on other Nuveen funds. The Independent Board Members also were provided with certain performance information pertaining to the preferred securities sleeves of two Nuveen closed-end funds served by the portfolio manager that is expected to also serve the Fund. This information included returns for the sleeves of such funds and their respective benchmarks for the year-to-date, one-year, three-year (as applicable) and five-year (as applicable) periods, as well as periods since inception, in each case, ending June 30, 2009.
C. Fees, Expenses and Profitability
1. Fees and Expenses
In evaluating the management fees and expenses that the Fund was expected to bear, the Independent Board Members considered, among other things, the Fund’s proposed management fee structure, its proposed sub-advisory fee arrangement, and its expected expense ratios in absolute terms as well as compared with the fees and expense ratios of comparable funds. The Independent Board Members also considered the fund-level breakpoint schedule and the complex-wide breakpoint schedule (described in further detail below) and any applicable fee waivers and expense reimbursements expected to be provided. Based on their review of the fee and expense information provided, the Independent Board Members determined that the Fund’s management fees and net total expense ratio were reasonable in light of the nature, extent and quality of services to be provided to the Fund.
2. Comparisons with the Fees of Other Clients
Due to their experience with other Nuveen funds, the Board Members were familiar with the fees NAM assesses to other clients. Such other clients include separately managed accounts (both retail and institutional accounts) and funds that are not offered by Nuveen but are sub-advised by one of Nuveen’s investment management teams. In evaluating the comparisons of fees, the Independent Board Members have noted, at the Meeting or at prior meetings, that the fee rates charged to a fund (such as the Fund) and charged to other clients vary, among other things, because of the different services involved and the additional regulatory and compliance requirements associated with registered investment companies, such as the Fund. Accordingly, the Independent Board Members have considered the differences in the product types, including, but not limited to, the services to be provided, the structure and operations, product distribution and costs thereof, portfolio investment policies, investor profiles, account sizes and regulatory requirements. The Independent Board Members have noted, in particular, that the range of services as described above to be provided to a fund (such as the Fund) is much more extensive than that provided to separately managed accounts. Given the inherent differences in the products, particularly the extensive services to be provided to the Fund, the Independent Board Members believe such facts justify the different levels of fees.
In considering the advisory fees of the Sub-Adviser, the Independent Board Members are familiar with the pricing schedule the Sub-Adviser charges for similar investment management services for other clients (such as retail and/or institutional managed accounts) as applicable. The Independent Board Members considered the advisory and sub-advisory fee schedules for the other Nuveen funds referred to in Section B above with sleeves that have investment mandates similar to those of the Fund.
3. Profitability of Nuveen
In conjunction with its review of fees at prior meetings, the Independent Board Members have considered the profitability of Nuveen for its advisory activities (which incorporated Nuveen’s wholly-owned affiliated sub-advisers during the relevant period) and its financial condition. At the Meeting or prior meetings, the Independent Board Members reviewed the revenues and expenses of Nuveen’s advisory activities, the allocation methodology used in preparing the profitability data and an analysis of the key drivers behind the changes in revenues and expenses that impacted profitability in 2008. They also reviewed the Form 8-K filed by Nuveen on July 9, 2009 (relating to, among other things, certain operations results and proposed financing and amendments to Nuveen’s credit facility). The Independent Board Members have also considered, at the Meeting or at prior meetings, Nuveen’s revenues for advisory activities, expenses, and profit margin compared to that of various unaffiliated management firms with similar amounts of assets under management and relatively comparable asset composition prepared by Nuveen.
In reviewing profitability, the Independent Board Members have recognized the subjective nature of determining profitability, which may be affected by numerous factors, including the allocation of expenses. Further, the Independent Board Members have recognized the difficulties in making comparisons as the profitability of other advisers generally is not publicly available and the profitability information that is available for certain advisers or management firms may not be representative of the industry and may be affected by, among other things, the adviser’s particular business mix, capital costs, types of funds managed and expense allocations. Notwithstanding the foregoing, the Independent Board Members reviewed Nuveen’s methodology and assumptions for
Annual Investment Management Agreement Approval Process (continued)
allocating expenses across product lines to determine profitability. In reviewing profitability, the Independent Board Members recognized Nuveen’s investment in its fund business. Based on their review, the Independent Board Members concluded that Nuveen’s level of profitability for its advisory activities was reasonable in light of the services to be provided.
In evaluating the reasonableness of the compensation, the Independent Board Members also considered any other amounts expected to be paid to a Fund Adviser as well as any indirect benefits (such as soft dollar arrangements, if any) the respective Fund Adviser and its affiliates are expected to receive that are directly attributable to their management of the Fund, if any. See Section E below for additional information on indirect benefits a Fund Adviser may receive as a result of its relationship with the Fund. Based on their review of the overall fee arrangements of the Fund, the Independent Board Members determined that the advisory fees and expected expenses of the Fund were reasonable.
D. Economies of Scale and Whether Fee Levels Reflect These Economies of Scale
With respect to economies of scale, the Independent Board Members have recognized the potential benefits resulting from the costs of a fund being spread over a larger asset base, although economies of scale are difficult to measure and predict with precision, particularly on a fund-by-fund basis. The Independent Board Members therefore considered whether the Fund could be expected to benefit from any economies of scale. One method to help ensure that shareholders share in these benefits is to include breakpoints in the advisory fee schedule. Generally, management fees for funds in the Nuveen complex are comprised of a fund-level component and a complex-level component. Accordingly, the Independent Board Members received and reviewed the schedule of proposed advisory fees for the Fund, including fund-level breakpoints thereto.
In addition to fund-level advisory fee breakpoints, the Board also considered the Fund’s complex-wide fee arrangement. Pursuant to the complex-wide fee arrangement, the fees of the funds in the Nuveen complex, including the Fund, are generally reduced as the assets in the fund complex reach certain levels. In evaluating the complex-wide fee arrangement, the Independent Board Members have considered that the complex-wide fee arrangement seeks to provide the benefits of economies of scale to fund shareholders when total fund complex assets increase, even if assets of a particular fund are unchanged or have decreased. The approach reflects the notion that some of Nuveen’s costs are attributable to services provided to all its funds in the complex and therefore all funds benefit if these costs are spread over a larger asset base. Based on their review, the Independent Board Members concluded that the breakpoint schedules and complex-wide fee arrangement were acceptable and reflect economies of scale to be shared with the Fund’s shareholders.
E. Indirect Benefits
In evaluating fees, the Independent Board Members also considered information regarding potential “fall out” or ancillary benefits that a Fund Adviser or its affiliates may receive as a result of its relationship with the Fund. In this regard, the Independent Board Members considered, among other things, any sales charges, distribution fees and shareholder services fees expected to be received and retained by such Fund’s principal underwriter, an affiliate of NAM, including fees to be received pursuant to any 12b-1 plan.
In addition to the above, the Independent Board Members considered whether the Fund Advisers will receive any benefits from soft dollar arrangements whereby a portion of the commissions paid by the Fund for brokerage may be used to acquire research that may be useful to a Fund Adviser in managing the assets of the Fund and other clients. With respect to NAM, the Independent Board Members noted that NAM does not currently have any soft dollar arrangements; however, to the extent certain bona fide agency transactions that occur on markets that traditionally trade on a principal basis and riskless principal transactions are considered as generating “commissions,” NAM intends to comply with the applicable safe harbor provisions. The Independent Board Members also considered that the Sub-Adviser may benefit from its soft dollar arrangements pursuant to which it receives research from brokers that execute the Fund’s portfolio transactions. The Independent Board Members noted that the Sub-Adviser’s profitability may be lower if it were required to pay for research that is subject to soft dollar arrangements with hard dollars.
Based on their review, the Independent Board Members concluded that any indirect benefits received by a Fund Adviser as a result of its relationship with the Fund were reasonable and within acceptable parameters.
F. Approval
The Independent Board Members did not identify any single factor discussed previously as all-important or controlling. The Board Members, including a majority of the Independent Board Members, concluded that the terms of the Investment Management Agreement and Sub-Advisory Agreement were fair and reasonable, that the respective Fund Adviser’s fees are reasonable in light of the services to be provided to the Fund and that the Investment Management Agreement and Sub-Advisory Agreement should be and were approved on behalf of the Fund.
Notes
Glossary of Terms Used in this Report
Average Annual Total Return: This is a commonly used method to express an investment’s performance over a particular, usually multi-year time period. It expresses the return that would have been necessary each year to equal the investment’s actual cumulative performance (including change in NAV or offer price and reinvested dividends and capital gains distributions, if any) over the time period being considered.
Dividend Yield (also known as Market Yield or Current Yield): An investment’s current annualized dividend divided by its current offering price.
Net Asset Value (NAV): A Fund’s NAV is the dollar value of one share in the Fund. It is calculated by subtracting the liabilities of the Fund from its total assets and then dividing the remainder by the number of shares outstanding. Fund NAVs are calculated at the end of each business day.
SEC 30-Day Yield: A standardized measure of a Fund’s yield that accounts for the future amortization of premiums or discounts of bonds held in the Fund’s portfolio.
Fund Information
Fund Manager
Nuveen Asset Management
333 West Wacker Drive
Chicago, IL 60606
Sub-Adviser
NWQ Investment Management Company, LLC
2049 Century Park East
Los Angeles, CA 90097
Legal Counsel
Chapman and Cutler LLP
Chicago, IL
Independent Registered
Public Accounting Firm
Ernst & Young LLP
Chicago, IL
Custodian
State Street Bank & Trust Company
Boston, MA
Transfer Agent and Shareholder Services
Boston Financial
Data Services, Inc.
Nuveen Investor Services
P.O. Box 8530
Boston, MA 02266-8530
(800) 257-8787
Nuveen Funds’ Quarterly Portfolio of Investments and Proxy Voting Information: You may obtain (i) each Fund’s quarterly portfolio of investments, (ii) information regarding how the Funds voted proxies relating to portfolio securities held during the most recent twelve-month period ended June 30, 2009, and (iii) a description of the policies and procedures that the Funds used to determine how to vote proxies relating to portfolio securities without charge, upon request, by calling Nuveen Investments at (800) 257-8787 or on Nuveen’s website at www.nuveen.com.
You may also obtain this and other Fund information directly from the Securities and Exchange Commission (“SEC”). The SEC may charge a copying fee for this information. Visit the SEC on-line at http://www.sec.gov or in person at the SEC’s Public Reference Room in Washington, D.C. Call the SEC at (202) 942-8090 for room hours and operation. You may also request Fund information by sending an e-mail request to publicinfo@sec.gov or by writing to the SEC’s Public Reference Section at 100 F Street NE, Washington, D.C. 20549.
The Financial Industry Regulatory Authority (FINRA) provides a Public Disclosure Program which supplies certain information regarding the disciplinary history of FINRA members and their associated persons in response to either telephone inquiries at (800) 289-9999 or written inquiries at www.finra.org. Financial Industry Regulatory Authority also provides an investor brochure that includes information describing the Public Disclosure Program.
Nuveen Investments:
Serving Investors For Generations
Since 1898, financial advisors and their clients have relied on Nuveen Investments to provide dependable investment solutions through continued adherence to proven, long-term investing principles. Today, we offer a range of high quality equity and fixed-income solutions designed to be integral components of a well-diversified core portfolio.
Focused on meeting investor needs.
Nuveen Investments is a global investment management firm that seeks to help secure the long-term goals of institutions and high net worth investors as well as the consultants and financial advisors who serve them. We market our growing range of specialized investment solutions under the high-quality brands of HydePark, NWQ, Nuveen, Santa Barbara, Symphony, Tradewinds and Winslow Capital. In total, Nuveen Investments managed approximately $150 billion of assets on March 31, 2010.
Find out how we can help you.
To learn more about how the products and services of Nuveen Investments may be able to help you meet your financial goals, talk to your financial advisor, or call us at (800) 257-8787. Please read the information provided carefully before you invest.
Investors should consider the investment objective and policies, risk considerations, charges and expenses of any investment carefully. Where applicable, be sure to obtain a prospectus, which contains this and other relevant information. To obtain a prospectus, please contact your securities representative or Nuveen Investments, 333 W. Wacker Dr., Chicago, IL 60606. Please read the prospectus carefully before you invest or send money.
Learn more about Nuveen Funds at: www.nuveen.com/mf
| • | | Interactive planning tools |
| | |
Distributed by Nuveen Investments, LLC 333 West Wacker Drive Chicago, IL 60606 www.nuveen.com | | |
MSA-NWQP-0310P
Item 2. Code of Ethics.
Not applicable to this filing.
Item 3. Audit Committee Financial Expert.
Not applicable to this filing.
Item 4. Principal Accountant Fees and Services.
Not applicable to this filing.
Item 5. Audit Committee of Listed Registrants.
Not applicable to this registrant.
Item 6. Schedule of Investments.
(a) See Portfolio of Investments in Item 1.
(b) Not applicable.
Item 7. Disclosure of Proxy Voting Policies and Procedures for Closed-End Management Investment Companies.
Not applicable to this registrant.
Item 8. Portfolio Managers of Closed-End Management Investment Companies.
Not applicable to this registrant.
Item 9. Purchases of Equity Securities by Closed-End Management Investment Company and Affiliated Purchasers.
Not applicable to this registrant.
Item 10. Submission of Matters to a Vote of Security Holders.
There have been no material changes to the procedures by which shareholders may recommend nominees to the registrant’s Board implemented after the registrant last provided disclosure in response to this Item.
Item 11. Controls and Procedures.
| (a) | The registrant’s principal executive and principal financial officers, or persons performing similar functions, have concluded that the registrant’s disclosure controls and procedures (as defined in Rule 30a-3(c) under the Investment Company Act of 1940, as amended (the “1940 Act”) (17 CFR 270.30a-3(c))) are effective, as of a date within 90 days of the filing date of this report that includes the disclosure required by this paragraph, based on their evaluation of the controls and procedures required by Rule 30a-3(b) under the 1940 Act (17 CFR 270.30a-3(b)) and Rules 13a-15(b) or 15d-15(b) under the Securities Exchange Act of 1934, as amended (the “Exchange Act”) (17 CFR 240.13a-15(b) or 240.15d-15(b)). |
| (b) | There were no changes in the registrant’s internal control over financial reporting (as defined in Rule 30a-3(d) under the 1940 Act (17 CFR 270.30a-3(d)) that occurred during the second fiscal quarter of the period covered by this report that has materially affected, or is reasonably likely to materially affect, the registrant’s internal control over financial reporting. |
Item 12. Exhibits.
File the exhibits listed below as part of this Form.
(a)(1) Any code of ethics, or amendment thereto, that is the subject of the disclosure required by Item 2, to the extent that the registrant intends to satisfy the Item 2 requirements through filing of an exhibit: Not applicable to this filing.
(a)(2) A separate certification for each principal executive officer and principal financial officer of the registrant as required by Rule 30a-2(a) under the 1940 Act (17 CFR 270.30a-2(a)) in the exact form set forth below: See EX-99.CERT attached hereto.
(a)(3) Any written solicitation to purchase securities under Rule 23c-1 under the 1940 Act (17 CFR 270.23c-1) sent or given during the period covered by the report by or on behalf of the registrant to 10 or more persons: Not applicable to this registrant.
(b) If the report is filed under Section 13(a) or 15(d) of the Exchange Act, provide the certifications required by Rule 30a-2(b) under the 1940 Act (17 CFR 270.30a-2(b)), Rule 13a-14(b) or Rule 15d-14(b) under the Exchange Act (17 CFR 240.13a-14(b) or 240.15d-14(b)), and Section 1350 of Chapter 63 of Title 18 of the United States Code (18 U.S.C. 1350) as an Exhibit. A certification furnished pursuant to this paragraph will not be deemed “filed” for purposes of Section 18 of the Exchange Act (15 U.S.C. 78r), or otherwise subject to the liability of that section. Such certification will not be deemed to be incorporated by reference into any filing under the Securities Act of 1933 or the Exchange Act, except to the extent that the registration specifically incorporates it by reference: See EX-99.906 CERT attached hereto.
SIGNATURES
Pursuant to the requirements of the Securities Exchange Act of 1934 and the Investment Company Act of 1940, the registrant has duly caused this report to be signed on its behalf by the undersigned, thereunto duly authorized.
(Registrant) Nuveen Investment Trust V
| | | | | | |
| By | | (Signature and Title) | | /s/ Kevin J. McCarthy | | |
| | | | Kevin J. McCarthy Vice President and Secretary | | |
Date June 7, 2010
Pursuant to the requirements of the Securities Exchange Act of 1934 and the Investment Company Act of 1940, this report has been signed below by the following persons on behalf of the registrant and in the capacities and on the dates indicated.
| | | | | | |
| By | | (Signature and Title) | | /s/ Gifford R. Zimmerman | | |
| | | | Gifford R. Zimmerman Chief Administrative Officer (principal executive officer) | | |
Date June 7, 2010
| | | | | | |
| By | | (Signature and Title) | | /s/ Stephen D. Foy | | |
| | | | Stephen D. Foy Vice President and Controller (principal financial officer) | | |
Date June 7, 2010