UNITED STATES
SECURITIES AND EXCHANGE COMMISSION
Washington, D.C. 20549
FORM N-CSR
CERTIFIED SHAREHOLDER REPORT OF REGISTERED MANAGEMENT
INVESTMENT COMPANIES
Investment Company Act file number 811-21979
Nuveen Investment Trust V
(Exact name of registrant as specified in charter)
Nuveen Investments
333 West Wacker Drive, Chicago, IL 60606
(Address of principal executive offices) (Zip code)
Kevin J. McCarthy
Nuveen Investments
333 West Wacker Drive, Chicago, IL 60606
(Name and address of agent for service)
Registrant’s telephone number, including area code: (312) 917-7700
Date of fiscal year end: September 30
Date of reporting period: March 31, 2013
Form N-CSR is to be used by management investment companies to file reports with the Commission not later than 10 days after the transmission to stockholders of any report that is required to be transmitted to stockholders under Rule 30e-1 under the Investment Company Act of 1940 (17 CFR 270.30e-1). The Commission may use the information provided on Form N-CSR in its regulatory, disclosure review, inspection, and policy making roles.
A registrant is required to disclose the information specified by Form N-CSR, and the Commission will make this information public. A registrant is not required to respond to the collection of information contained in Form N-CSR unless the Form displays a currently valid Office of Management and Budget (“OMB”) control number. Please direct comments concerning the accuracy of the information collection burden estimate and any suggestions for reducing the burden to Secretary, Securities and Exchange Commission, 450 Fifth Street, NW, Washington, DC 20549-0609. The OMB has reviewed this collection of information under the clearance requirements of 44 U.S.C. ss.3507.
Item 1. Reports to Stockholders.

Mutual Funds
Nuveen Taxable Fixed Income Funds
For investors seeking a high level of current income and total return.
Semi-Annual Report
March 31, 2013
| | | | | | | | |
| | | Share Class / Ticker Symbol |
| | | | |
| | | Class A | | Class C | | Class R3 | | Class I |
Nuveen Preferred Securities Fund | | NPSAX | | NPSCX | | NPSTX | | NPSRX |
| | | | | | | | |
LIFE IS COMPLEX.
Nuveen makes things e-simple.
It only takes a minute to sign up for e-Reports. Once enrolled, you’ll receive an e-mail as soon as your Nuveen Fund information is ready. No more waiting for delivery by regular mail. Just click on the link within the e-mail to see the report and save it on your computer if you wish.
Free e-Reports right to your e-mail!
www.investordelivery.com
If you receive your Nuveen Fund distributions and statements from your financial advisor or brokerage account.
OR
www.nuveen.com/accountaccess
If you receive your Nuveen Fund distributions and statements directly from Nuveen.
| | | | | | |
| Must be preceded by or accompanied by a prospectus. | | NOT FDIC INSURED | | MAY LOSE VALUE | | NO BANK GUARANTEE |
Table of Contents
Chairman’s
Letter to Shareholders

Dear Shareholders,
The global economy continues to struggle with low growth rates. The European Central Bank’s commitment to “do what it takes” to support sovereign debt markets has stabilized the broader euro area financial markets. The larger member states of the European Union (EU) are working diligently on a tighter financial and banking union and meaningful progress is being made. However, economic conditions in the southern tier members are not improving and their political leaders are becoming more forceful in their demands for loosening the current EU fiscal targets and timetables. Economic growth in emerging market countries continues to be buffeted by lower overseas demand for their manufactured products and raw materials.
In the U.S., the Fed’s commitment to low interest rates through Quantitative Easing is the subject of increasing debate in its policy making deliberations and many independent economists are expressing concern about the economic distortions resulting from negative real interest rates. There are encouraging signs in Congress that both political parties are working toward compromises on previously irreconcilable issues such as reforming immigration laws and the tax code. It is too early to tell whether those efforts will produce meaningful results or pave the way for cooperation on the major fiscal issues that loom ahead. Over the longer term, there are some positive trends for the U.S. economy: house prices are clearly recovering, banks and corporations continue to strengthen their financial positions and incentives for capital investment in the U.S. by domestic and foreign corporations are increasing due to more competitive energy and labor costs.
During the last eighteen months, U.S. investors have benefited from strong returns in the domestic equity markets and steady total returns in many fixed income markets. However, many macroeconomic risks remain unresolved, including negotiating through the many U.S. fiscal issues, achieving a better balance between fiscal discipline and encouraging economic growth in the euro area and reducing the potential economic impact of geopolitical issues, particularly in the Middle East and East Asia. In the face of these uncertainties, the experienced investment professionals at Nuveen Investments seek out investments that are enjoying positive and sustainable returns. At the same time they are always on the alert for risks in markets that are subject to the excessive optimism that can accompany an extended period of abnormally low interest rates. Monitoring this process is a critical function for the Fund Board as it oversees your Nuveen Fund on your behalf.
As always, I encourage you to communicate with your financial consultant if you have any questions about your investment in a Nuveen Fund. On behalf of the other members of your Fund Board, we look forward to continuing to earn your trust in the months and years ahead.
Sincerely,

Robert P. Bremner
Chairman of the Board
May 24, 2013
Portfolio Managers’ Comments
Certain statements in this report are forward-looking statements. Discussions of specific investments are for illustration only and are not intended as recommendations of individual investments. The forward-looking statements and other views expressed herein are those of the portfolio managers as of the date of this report. Actual future results or occurrences may differ significantly from those anticipated in any forward-looking statements and the views expressed herein are subject to change at any time, due to numerous market and other factors. The Fund disclaims any obligation to update publicly or revise any forward-looking statements or views expressed herein.
Ratings shown are the highest rating given by one of the following national rating agencies: Standard & Poor’s, Moody’s Investors Service, Inc. or Fitch, Inc. Credit ratings are subject to change. AAA, AA, A, and BBB are investment grade ratings; BB, B, CCC, CC, C and D are below-investment grade ratings. Certain bonds backed by U.S. Government or agency securities are regarded as having an implied rating equal to the rating of such securities. Holdings designated N/R are not rated by these national rating agencies.
The Nuveen Preferred Securities Fund features management by Nuveen Asset Management, LLC, an affiliate of Nuveen Investments. Douglas Baker, CFA, has served as the Fund’s portfolio manager since its inception in 2006 and Brenda Langenfeld, CFA, joined the management team in 2012. Here Doug and Brenda discuss the Fund’s performance and its investment strategy for the six-month period ended March 31, 2013.
How did the Fund perform during the six-month reporting period ended March 31, 2013?
The table in the Fund Performance and Expense Ratios section of this report provides total return performance information for the Fund’s Class A Shares at net asset value (NAV) for the six-month, one-year, five-year and since inception periods ended March 31, 2013.
Over this six-month period ended March 31, 2013, the Fund outperformed the BofA Merrill Lynch Fixed Rate Preferred Securities Index, the BofA Merrill Lynch Preferred Stock Hybrid Securities Index, the Custom Benchmark Index and the Lipper average. A more detailed discussion of the Fund’s relative performance is provided later in this report.
Previously, the Fund used the BofA Merrill Lynch Preferred Stock Hybrid Securities Index as its primary benchmark. The Fund changed its primary benchmark to the BofA Merrill Lynch Fixed Rate Preferred Securities Index because it more closely reflects the Fund’s investment universe. The secondary benchmark continues to be the Custom Benchmark Index comprised of a 65% weighting in the BofA Merrill Lynch Fixed Rate Preferred Securities Index and a 35% weighting in the Barclays USD Capital Securities Index. Previously, the Custom Benchmark Index was referred to as the Market Benchmark Index.
What strategies were used to manage the Fund during the reporting period and how did this affect performance?
The Fund seeks to provide a high level of current income and total return with at least 80% allocation to preferred and hybrid securities. The Fund normally invests at least 60% of its net assets in securities rated investment grade. The Fund seeks to meet its investment objective by investing primarily in preferred securities, but it may also invest up to 20% of its net assets in other types of securities, including corporate debt securities, U.S. government and agency debt, taxable municipal securities and convertible preferred securities.
Our investment process begins with us working to identify the investible universe of preferred securities. We then narrow the universe to favored (i.e. highly regulated) industries, such as the banking, utility and insurance sectors. We determine the relative
value across sectors. We perform quantitative analysis on individual securities and then prioritize securities based upon security structure. After narrowing the universe via quantitative analysis, we perform fundamental credit research focusing on stable and improving securities. Lastly, we regularly evaluate investment process and performance via attribution analysis.
Several variables were responsible for the relative outperformance which included an overweight to the insurance sub-sector versus the bank sub-sector, an overweight to lower rated investment grade and below investment grade securities, an overweight to the more subordinate Tier 1 structures versus the more senior Tier 2 structures, as well as an overweight to $1000 par institutional structures versus $25 par retail structures.
While financial services as a whole continued to perform, the insurance sub-sector outperformed on a relative basis, which was well above the bank sub-sector’s return. Supply from the insurance sub-sector continued to be light, thus providing technical support for valuations across the sector. In addition, the bank sub-sector likely lagged due to Cyprus-related headline risk during the latter part of the period, which raised concerns about potential new risks for bank investors and the potential for future burden sharing.
During the reporting period, the relatively subordinate Tier 1 structures outperformed the more senior lower Tier 2 structures. Historically, credit spreads for more subordinate structures, such as Tier 1 securities, tend to move at a disproportionately greater magnitude than their more senior counterparts. Therefore, in a period when credit spreads contract, we would expect credit spreads for Tier 1 structures to decrease at a greater rate than lower Tier 2 structures. With credit spreads performing well during the six months ended March 31, 2013, we were not surprised to see the Fund’s overweight to Tier 1 securities thus contributing to the relative outperformance.
Consistent with our investment process, we continued to invest in those securities issued by firms that we deemed to have stable and/or improving credit profiles. During the period, we maintained an overweight to BBB-rated and BB-rated securities. Please keep in mind that these ratings are at the security level. Preferred securities are typically rated between three and five notches below the senior unsecured debt ratings of any particular issuer. During the measurement period, the A-rated or better subsector of the Barclays Securities Tier 1 index underperformed the BBB-rated subsector of the same index. The investment team believes that the below investment grade segment of the market provides compelling risk adjusted opportunities for investors with adequate research resources. These securities are often neglected due to their lack of representation in the broader preferred/hybrid security indices.
Finally, the Fund’s overweight to $1000 par structures once again contributed to outperformance versus the indexes. We believe that new issue supply primarily focused on the $25 par side of the market likely led to some modest retail investor fatigue. In addition, at the beginning of the measurement period the $1000 par structures were trading cheaper, on an options adjusted spread (OAS) basis compared to competing $25 par structures. As a result, during the period valuations on the $1000 par side of the market converged to those on the $25 par side of the market. Furthermore, we anticipate that the $1000 par side of the market will continue to outperform on a relative basis.
During an environment of rising interest rates, preferred securities with embedded call options, especially those with fixed rate coupons, may exhibit a measure of duration extension. While we do not foresee a significant rise in either longer-term or shorter-term interest rates through 2013, in the eventuality, we may have an allocation to preferred securities with floating rate coupons, and/or fixed-to-floating rate coupons, in order to help manage the risk of lower prices resulting from rising interest rates.
The Fund also used one modest interest rate swap to reduce the duration of the preferred stock portfolio, to better align the Fund’s duration to that of the index. This swap modestly benefited performance during the period.
Risk Considerations
Mutual fund investing involves risk; principal loss is possible. Debt or fixed income securities such as those held by the Fund, are subject to market risk, credit risk, interest rate risk, derivatives risk, illiquid securities risk, concentration risk, non-diversification risk and income risk. As interest rates rise, bond prices fall. Below investment grade or high yield debt securities are subject to liquidity risk and heightened credit risk. Preferred securities are subordinated to bonds and other debt instruments in a company’s capital structure and therefore are subject to greater credit risk. Foreign investments involve additional risks, including currency fluctuation, political and economic instability, lack of liquidity and differing legal and accounting standards.
[THIS PAGE INTENTIONALLY LEFT BLANK]
Fund Performance and Expense Ratios
The Fund Performance and Expense Ratios for the Fund is shown on the following page.
Returns quoted represent past performance, which is no guarantee of future results. Current performance may be higher or lower than the performance shown. Investment returns and principal value will fluctuate so that when shares are redeemed, they may be worth more or less than their original cost. Returns without sales charges would be lower if the sales charge were included. Returns do not reflect the deduction of taxes that a shareholder would pay on Fund distributions or the redemption of Fund shares.
Returns may reflect a contractual agreement between the Fund and the investment adviser to waive certain fees and expenses; see Notes to Financial Statements, Footnote 7 — Management Fees and Other Transactions with Affiliates for more information. In addition, returns may reflect a voluntary expense limitation by the Fund’s investment adviser that may be modified or discontinued at any time without notice. For the most recent month-end performance visit www.nuveen.com or call (800) 257-8787.
Returns reflect differences in sales charges and expenses, which are primarily differences in distribution and service fees. Fund returns assume reinvestment of dividends and capital gains.
Comparative index and Lipper return information is provided for the Fund’s Class A Shares at net asset value (NAV) only.
The expense ratios shown reflect the Fund’s total operating expenses (before fee waivers and/or expense reimbursements, if any) as shown in the Fund’s most recent prospectus. The expense ratios include management fees and other fees and expenses.
Fund Performance and Expense Ratios (continued)
Refer to the first page of this Fund Performance and Expense Ratios section for further explanation of the information included within this page.
Fund Performance
Average Annual Total Returns as of March 31, 2013
| | | | | | | | | | | | | | | | |
| | |
| | | Cumulative | | | Average Annual | |
| | | | |
| | | 6-Month | | | 1-Year | | | 5-Year | | | Since
Inception* | |
Class A Shares at NAV | | | 7.63% | | | | 16.51% | | | | 10.19% | | | | 6.43% | |
Class A Shares at maximum Offering Price | | | 2.49% | | | | 10.94% | | | | 9.13% | | | | 5.61% | |
BofA Merrill Lynch Fixed Rate Preferred Securities Index** | | | 3.52% | | | | 9.39% | | | | 3.29% | | | | 1.57% | |
BofA Merrill Lynch Preferred Stock Hybrid Securities Index** | | | 3.43% | | | | 7.69% | | | | 5.17% | | | | 3.08% | |
Custom Benchmark Index** | | | 4.01% | | | | 10.84% | | | | 5.30% | | | | 3.32% | |
Lipper Flexible Income Funds Classification Average** | | | 4.59% | | | | 10.77% | | | | 8.01% | | | | 5.79% | |
| | | | |
Class C Shares | | | 7.24% | | | | 15.60% | | | | 9.40% | | | | 5.65% | |
Class R3 Shares | | | 7.53% | | | | 16.23% | | | | 9.93% | | | | 6.18% | |
Class I Shares | | | 7.82% | | | | 16.86% | | | | 10.49% | | | | 6.71% | |
Class A Shares have a maximum 4.75% sales charge (Offering Price). Class A Share purchases of $1 million or more are sold at net asset value without an up-front sales charge but may be subject to a contingent deferred sales charge (CDSC), also known as a back-end sales charge, if redeemed within eighteen months of purchase. Class C Shares have a 1% CDSC for redemptions within less than twelve months, which is not reflected in the one-year total return. Class R3 Shares have no sales charge and are only available for purchase by eligible retirement plans. Class I Shares have no sales charge and may be purchased under limited circumstances or by specified classes of investors.
Expense Ratios as of Most Recent Prospectus
| | | | |
| |
| | |
Expense
Ratios | |
Class A Shares | | | 1.07% | |
Class C Shares | | | 1.82% | |
Class R3 Shares | | | 1.32% | |
Class I Shares | | | 0.82% | |
| * | Since inception returns for Class A, C and I Shares, and for the comparative indexes and Lipper classification average, are from 12/19/06. Class A, C, and I Share returns are actual. Class R3 Shares commenced operations on 9/29/09. The returns for Class R3 Shares are actual for the periods since class inception on 9/29/09; returns prior to class inception are Class I Share returns adjusted for the differences in sales charges and expense, which are primarily differences in distribution and service fees. |
| ** | Refer to the Glossary of Terms Used in this Report for definitions. Indexes and Lipper averages are not available for direct investment. |
Yields as of March 31, 2013
Dividend Yield is the most recent dividend per share (annualized) divided by the offering price per share.
The SEC 30-Day Yield is a standardized measure of the Fund’s yield that accounts for the future amortization of premiums or discounts of bonds held in the Fund’s portfolio. The SEC 30-Day Yield is computed under an SEC standardized formula and is based on the maximum offer price per share. Dividend Yield may differ from the SEC 30-Day Yield because the Fund may be paying out more or less than it is earning and it may not include the effect of amortization of bond premium.
| | | | | | | | |
| | |
| | | Dividend
Yield | | | SEC 30-Day
Yield | |
Class A Shares1 | | | 5.60% | | | | 4.04% | |
Class C Shares | | | 5.14% | | | | 3.49% | |
Class R3 Shares | | | 5.64% | | | | 4.01% | |
Class I Shares | | | 6.12% | | | | 4.50% | |
| 1 | The SEC Yield for Class A shares quoted in the table reflects the maximum sales load. Investors paying a reduced load because of volume discounts, investors paying no load because they qualify for one of the several exclusions from the load, and existing shareholders who previously paid a load but would like to know the SEC Yield applicable to their shares on a going-forward basis, should understand that the SEC Yield effectively applicable to them would be higher than the figure quoted in the table. |
Holding Summaries as of March 31, 2013
This data relates to the securities held in the Fund’s portfolio of investments. It should not be construed as a measure of performance for the Fund itself.
Ratings shown are the highest rating given by one of the following national rating agencies: Standard & Poor’s Group, Moody’s Investors Service, Inc. or Fitch, Inc. Credit ratings are subject to change. AAA, AA, A, and BBB are investment grade ratings; BB, B, CCC, CC, C and D are below-investment grade ratings. Certain bonds backed by U.S. Government or agency securities are regarded as having an implied rating equal to the rating of such securities. Holdings designated N/R are not rated by these national rating agencies.
Portfolio Allocation1
| | | | |
| $25 Par (or similar) Retail Structures | | | 22.0% | |
| Taxable Municipal Bonds | | | —% | 3 |
| Corporate Bonds | | | 1.5% | |
| $1,000 Par (or similar) Institutional Structures | | | 76.5% | |
| Short-Term Investments | | | 0.2% | |
Other4 | | | (0.2)% | |
| | | | |
| Top Five Issuers1 | | | |
| JP Morgan Chase & Company | | | 5.1% | |
| Wells Fargo & Company | | | 5.0% | |
| General Electric Company | | | 4.6% | |
| Bank of America Corporation | | | 4.1% | |
| Assured Guaranty Corporation | | | 4.0% | |
| | | | |
| Portfolio Credit Quality2 | | | |
| AA | | | 4.6% | |
| A | | | 17.6% | |
| BBB | | | 54.3% | |
| BB or Lower | | | 22.5% | |
| N/R | | | 1.1% | |
| | | | |
| Portfolio Composition1 | | | |
| Insurance | | | 46.5% | |
| Diversified Financial Services | | | 20.5% | |
| Commercial Banks | | | 16.7% | |
| U.S. Agency | | | 5.0% | |
| Capital Markets | | | 4.9% | |
| Short-Term Investments | | | 0.2% | |
| Other5 | | | 6.2% | |
| 1 | As a percentage of net assets (excluding investments in derivatives). Holdings are subject to change. |
| 2 | As a percentage of net assets (excluding investments in derivatives). Holdings are subject to change. Percentages will not add to 100% due to the exclusion of Short-Term Investments and Other Assets Less Liabilities from the table. |
| 3 | Rounds to less than 0.1%. |
| 4 | Other Assets Less Liabilities. |
| 5 | Includes Other Assets Less Liabilities and all industries less than 4.9% of net assets. |
Expense Examples
As a shareholder of the Fund, you incur two types of costs: (1) transaction costs, including up-front and back-end sales charges (loads) or redemption fees, where applicable; and (2) ongoing costs, including management fees; distribution and service (12b-1) fees, where applicable; and other Fund expenses. This Example is intended to help you understand your ongoing costs (in dollars) of investing in the Fund and to compare these costs with the ongoing costs of investing in other mutual funds.
The Example below is based on an investment of $1,000 invested at the beginning of the period and held through the end of the period.
The information under “Actual Performance,” together with the amount you invested, allows you to estimate actual expenses incurred over the reporting period. Simply divide your account value by $1,000 (for example, an $8,600 account value divided by $1,000 = 8.60) and multiply the result by the cost shown for your share class, in the row entitled “Expenses Incurred During Period” to estimate the expenses incurred on your account during this period.
The information under “Hypothetical Performance,” provides information about hypothetical account values and hypothetical expenses based on the Fund’s actual expense ratio and an assumed rate of return of 5% per year before expenses, which is not the Fund’s actual return. The hypothetical account values and expenses may not be used to estimate the actual ending account balance or expense you incurred for the period. You may use this information to compare the ongoing costs of investing in the Fund and other funds. To do so, compare this 5% hypothetical example with the 5% hypothetical examples that appear in the shareholder reports of the other funds.
Please note that the expenses shown in the table are meant to highlight your ongoing costs only and do not reflect any transaction costs. Therefore, the hypothetical information is useful in comparing ongoing costs only, and will not help you determine the relative total costs of owning different funds or share classes. In addition, if these transaction costs were included, your costs would have been higher.
| | | | | | | | | | | | | | | | | | | | | | | | | | | | | | | | | | |
| | | | | | | | | | | | | | | | | Hypothetical Performance | |
| | | Actual Performance | | | | | (5% annualized return before expenses) | |
| | | A Shares | | | C Shares | | | Class R3 | | | I Shares | | | | | A Shares | | | C Shares | | | Class R3 | | | I Shares | |
| Beginning Account Value (10/01/12) | | $ | 1,000.00 | | | $ | 1,000.00 | | | $ | 1,000.00 | | | $ | 1,000.00 | | | | | $ | 1,000.00 | | | $ | 1,000.00 | | | $ | 1,000.00 | | | $ | 1,000.00 | |
| Ending Account Value (3/31/13) | | $ | 1,076.30 | | | $ | 1,072.40 | | | $ | 1,075.30 | | | $ | 1,078.20 | | | | | $ | 1,019.65 | | | $ | 1,015.91 | | | $ | 1,018.45 | | | $ | 1,020.89 | |
| Expenses Incurred During Period | | $ | 5.49 | | | $ | 9.35 | | | $ | 6.73 | | | $ | 4.20 | | | | | $ | 5.34 | | | $ | 9.10 | | | $ | 6.54 | | | $ | 4.08 | |
For each class of the Fund, expenses are equal to the Fund’s annualized net expense ratio of 1.06%, 1.81%, 1.30% and .81% for Classes A, C, R3 and I, respectively, multiplied by the average account value over the period, multiplied by 182/365 (to reflect the one-half year period).
Portfolio of Investments (Unaudited)
Nuveen Preferred Securities Fund
March 31, 2013
| | | | | | | | | | | | | | | | | | |
| Shares | | | Description (1) | | Coupon | | | | | Ratings (2) | | | Value | |
| | | | | | | | | | | | | | | | | | |
| | | | $25 PAR (OR SIMILAR) RETAIL STRUCTURES – 22.0% | | | | | | | | | | | | | | |
| | | | | |
| | | | Capital Markets – 2.1% | | | | | | | | | | | | | | |
| | | | | |
| | 298,051 | | | Deutsche Bank Capital Funding Trust V | | | 8.050% | | | | | | BBB | | | $ | 8,464,648 | |
| | | | | |
| | 204,179 | | | Deutsche Bank Capital Funding Trust VIII | | | 6.375% | | | | | | BBB | | | | 5,165,729 | |
| | | | | |
| | 179,600 | | | Morgan Stanley Capital Trust IV | | | 6.250% | | | | | | BB+ | | | | 4,516,940 | |
| | | | | |
| | 128,635 | | | Morgan Stanley Capital Trust VI | | | 6.600% | | | | | | BB+ | | | | 3,268,615 | |
| | | | | |
| | 132,715 | | | Morgan Stanley Capital Trust VII | | | 6.600% | | | | | | BB+ | | | | 3,344,418 | |
| | | | | |
| | 126,621 | | | Morgan Stanley Capital Trust VIII | | | 6.450% | | | | | | BB+ | | | | 3,180,720 | |
| | | | Total Capital Markets | | | | | | | | | | | | | 27,941,070 | |
| | | | Commercial Banks – 2.4% | | | | | | | | | | | | | | |
| | | | | |
| | 485,480 | | | PNC Financial Services | | | 6.125% | | | | | | BBB | | | | 13,433,232 | |
| | | | | |
| | 150,000 | | | Private Bancorp Incorporated | | | 7.125% | | | | | | N/R | | | | 4,027,500 | |
| | | | | |
| | 283,670 | | | Regions Financial Corporation | | | 6.375% | | | | | | BB | | | | 7,242,095 | |
| | | | | |
| | 301,600 | | | Texas Capital Bancshares Inc. | | | 6.500% | | | | | | BB | | | | 7,473,648 | |
| | | | Total Commercial Banks | | | | | | | | | | | | | 32,176,475 | |
| | | | Consumer Finance – 0.9% | | | | | | | | | | | | | | |
| | | | | |
| | 469,953 | | | Discover Financial Services | | | 6.500% | | | | | | BB | | | | 12,143,586 | |
| | | | Diversified Financial Services – 5.5% | | | | | | | | | | | | | | |
| | | | | |
| | 147,753 | | | Citigroup Inc. | | | 8.125% | | | | | | BB | | | | 4,342,461 | |
| | | | | |
| | 683,187 | | | Countrywide Capital Trust III | | | 7.000% | | | | | | BB+ | | | | 17,455,428 | |
| | | | | |
| | 552,868 | | | ING Groep N.V. | | | 8.500% | | | | | | BBB– | | | | 14,402,211 | |
| | | | | |
| | 848,155 | | | ING Groep N.V. | | | 7.375% | | | | | | BBB– | | | | 21,543,137 | |
| | | | | |
| | 366,818 | | | ING Groep N.V. | | | 7.200% | | | | | | BBB– | | | | 9,328,182 | |
| | | | | |
| | 58,482 | | | ING Groep N.V. | | | 7.050% | | | | | | BBB– | | | | 1,489,537 | |
| | | | | |
| | 134,010 | | | ING Groep N.V. | | | 6.375% | | | | | | BBB– | | | | 3,336,849 | |
| | | | | |
| | 18,031 | | | ING Groep N.V. | | | 6.200% | | | | | | BBB– | | | | 445,546 | |
| | | | | |
| | 52,681 | | | ING Groep N.V. | | | 6.125% | | | | | | BBB– | | | | 1,292,792 | |
| | | | Total Diversified Financial Services | | | | | | | | | | | | | 73,636,143 | |
| | | | Insurance – 8.0% | | | | | | | | | | | | | | |
| | | | | |
| | 126,070 | | | Aegon N.V. | | | 8.000% | | | | | | Baa1 | | | | 3,618,209 | |
| | | | | |
| | 486,648 | | | Aegon N.V. | | | 7.250% | | | | | | Baa1 | | | | 12,521,453 | |
| | | | | |
| | 48,646 | | | Aegon N.V. | | | 6.500% | | | | | | Baa1 | | | | 1,223,933 | |
| | | | | |
| | 266,764 | | | Aegon N.V. | | | 6.375% | | | | | | Baa1 | | | | 7,037,234 | |
| | | | | |
| | 190,138 | | | Allianz SE, (3) | | | 8.375% | | | | | | A+ | | | | 4,830,703 | |
| | | | | |
| | 509,480 | | | Arch Capital Group Limited | | | 6.750% | | | | | | BBB | | | | 14,189,018 | |
| | | | | |
| | 74,025 | | | Aspen Insurance Holdings Limited | | | 7.250% | | | | | | BBB– | | | | 2,030,506 | |
| | | | | |
| | 868,827 | | | Axis Capital Holdings Limited | | | 6.875% | | | | | | BBB | | | | 23,510,459 | |
| | | | | |
| | 595,781 | | | Endurance Specialty Holdings Limited | | | 7.500% | | | | | | BBB– | | | | 16,121,834 | |
| | | | | |
| | 65,301 | | | Hartford Financial Services Group Inc. | | | 7.875% | | | | | | BB+ | | | | 1,965,560 | |
| | | | | |
| | 485,250 | | | Maiden Holdings Limited | | | 8.250% | | | | | | BB | | | | 12,893,093 | |
| | | | | |
| | 285,000 | | | Reinsurance Group of America Inc. | | | 6.200% | | | | | | BBB | | | | 7,760,550 | |
| | | | Total Insurance | | | | | | | | | | | | | 107,702,552 | |
| | | | Oil, Gas & Consumable Fuels – 0.6% | | | | | | | | | | | | | | |
| | | | | |
| | 320,895 | | | Nustar Logistics Limited Partnership | | | 7.625% | | | | | | Ba2 | | | | 8,603,195 | |
| | | | Real Estate Investment Trust – 0.4% | | | | | | | | | | | | | | |
| | | | | |
| | 64,000 | | | National Retail Properties Inc. | | | 6.625% | | | | | | Baa3 | | | | 1,699,200 | |
| | | | | |
| | 141,067 | | | Vornado Realty Trust | | | 6.875% | | | | | | BBB– | | | | 3,853,950 | |
| | | | Total Real Estate Investment Trust | | | | | | | | | | | | | 5,553,150 | |
| | | | | | | | | | | | | | | | | | | | |
| Shares | | | Description (1) | | Coupon | | | | | | Ratings (2) | | | Value | |
| | | | | | | | | | | | | | | | | | | | |
| | | | U.S. Agency – 2.1% | | | | | | | | | | | | | | | | |
| | | | | |
| | 107,000 | | | Cobank Agricultural Credit Bank, (3) | | | 11.000% | | | | | | | | A– | | | $ | 5,915,099 | |
| | | | | |
| | 200,000 | | | Cobank Agricultural Credit Bank, (3) | | | 6.250% | | | | | | | | A– | | | | 21,256,260 | |
| | | | | |
| | 18,600 | | | Cobank Agricultural Credit Bank, (3) | | | 11.000% | | | | | | | | A– | | | | 954,993 | |
| | | | Total U.S. Agency | | | | | | | | | | | | | | | 28,126,352 | |
| | | | Total $25 Par (or similar) Retail Structures (cost $258,933,376) | | | | | | | | | | | | | | | 295,882,523 | |
| | | | | |
Principal
Amount (000) | | | Description (1) | | | | | Optional Call
Provisions (4) | | | Ratings (2) | | | Value | |
| | | | TAXABLE MUNICIPAL BONDS – 0.0% | | | | | | | | | | | | | | | | |
| | | | | |
| | | | California – 0.0% | | | | | | | | | | | | | | | | |
| | | | | |
| $ | 155 | | | California Municipal Finance Authority, Educational Facilities Revenue Bonds, OCEAA Project, Series 2008B, 11.000%, 10/01/14 | | | | | | | No Opt. Call | | | | N/R | | | $ | 153,777 | |
| | | | | |
| | 100 | | | California Statewide Community Development Authority, Lancer Educational Student Housing Revenue Bonds, California Baptist University, Series 2007, 9.125%, 6/01/13 | | | | | | | No Opt. Call | | | | N/R | | | | 100,169 | |
| $ | 255 | | | Total Taxable Municipal Bonds (cost $255,000) | | | | | | | | | | | | | | | 253,946 | |
| | | | | |
Principal
Amount (000) | | | Description (1) | | Coupon | | | Maturity | | | Ratings (2) | | | Value | |
| | | | CORPORATE BONDS – 1.5% | | | | | | | | | | | | | | | | |
| | | | | |
| | | | Insurance – 1.5% | | | | | | | | | | | | | | | | |
| | | | | |
| $ | 2,000 | | | Nationwide Mutual Insurance Company, 144A | | | 8.250% | | | | 12/01/31 | | | | A– | | | $ | 2,600,224 | |
| | | | | |
| | 3,500 | | | Nationwide Mutual Insurance Company, 144A | | | 7.875% | | | | 4/01/33 | | | | A– | | | | 4,435,743 | |
| | | | | |
| | 7,210 | | | Nationwide Mutual Insurance Company, 144A | | | 9.375% | | | | 8/15/39 | | | | A– | | | | 10,436,670 | |
| | | | | |
| | 2,000 | | | Security Benefit Life Insurance Company, 144A | | | 7.450% | | | | 10/01/33 | | | | BBB | | | | 1,882,351 | |
| $ | 14,710 | | | Total Corporate Bonds (cost $15,500,335) | | | | | | | | | | | | | | | 19,354,988 | |
| | | | | |
Principal
Amount (000)/
Shares | | | Description (1) | | Coupon | | | Maturity | | | Ratings (2) | | | Value | |
| | | | | | | | | | | | | | | | | | | | |
| | | | $1,000 PAR (OR SIMILAR) INSTITUTIONAL STRUCTURES – 76.5% | | | | | | | | | | | | | | | | |
| | | | | |
| | | | Capital Markets – 2.8% | | | | | | | | | | | | | | | | |
| | | | | |
| | 10,000 | | | Aberdeen Asset Management PLC, Perpetual Subordinated Capital Securities | | | 7.900% | | | | N/A (5) | | | | N/R | | | $ | 10,075,000 | |
| | | | | |
| | 8,500 | | | Credit Suisse Guernsey, Reg S | | | 7.875% | | | | 2/24/41 | | | | BBB– | | | | 9,073,750 | |
| | | | | |
| | 15,600 | | | Deutsche Bank Capital Trust, 144A | | | 3.083% | | | | N/A (5) | | | | Ba2 | | | | 12,558,000 | |
| | | | | |
| | 6,775 | | | Goldman Sachs Group, Inc. | | | 6.345% | | | | 2/15/34 | | | | Baa3 | | | | 7,058,723 | |
| | | | Total Capital Markets | | | | | | | | | | | | | | | 38,765,473 | |
| | | | Commercial Banks – 14.3% | | | | | | | | | | | | | | | | |
| | | | | |
| | 15,125 | | | Abbey National Capital Trust I | | | 8.963% | | | | N/A (5) | | | | BBB– | | | | 17,620,625 | |
| | | | | |
| | 3,729 | | | Banco Santander Finance | | | 10.500% | | | | N/A (5) | | | | BB | | | | 3,989,769 | |
| | | | | |
| | 1,900 | | | Barclays Bank PLC | | | 6.278% | | | | N/A (5) | | | | BBB | | | | 1,840,325 | |
| | | | | |
| | 9,149 | | | Barclays Bank PLC, 144A | | | 10.179% | | | | 6/12/21 | | | | A– | | | | 12,253,896 | |
| | | | | |
| | 24,470 | | | BNP Paribas, 144A | | | 7.195% | | | | N/A (5) | | | | BBB | | | | 25,204,100 | |
| | | | | |
| | 1,918 | | | HSBC Capital Funding LP, Debt | | | 10.176% | | | | N/A (5) | | | | BBB+ | | | | 2,704,380 | |
| | | | | |
| | 36,004 | | | Rabobank Nederland, 144A | | | 11.000% | | | | N/A (5) | | | | A– | | | | 48,155,350 | |
| | | | | |
| | 1,000 | | | Republic New York Capital I | | | 7.750% | | | | 11/15/26 | | | | BBB+ | | | | 1,012,500 | |
Portfolio of Investments (Unaudited)
Nuveen Preferred Securities Fund (continued)
March 31, 2013
| | | | | | | | | | | | | | | | | | | | |
| | | | | |
Principal
Amount (000)/
Shares | | | Description (1) | | Coupon | | | Maturity | | | Ratings (2) | | | Value | |
| | | | | | | | | | | | | | | | | | | | |
| | | | Commercial Banks (continued) | | | | | | | | | | | | | | | | |
| | | | | |
| | 10,992 | | | Royal Bank of Scotland Group PLC | | | 7.648% | | | | N/A (5) | | | | BB | | | $ | 11,431,680 | |
| | | | | |
| | 730 | | | Standard Chartered PLC, 144A | | | 7.014% | | | | N/A (5) | | | | BBB+ | | | | 778,944 | |
| | | | | |
| | 58,407 | | | Wells Fargo & Company, Series K | | | 7.980% | | | | N/A (5) | | | | BBB+ | | | | 67,387,076 | |
| | | | Total Commercial Banks | | | | | | | | | | | | | | | 192,378,645 | |
| | | | Diversified Financial Services – 15.0% | | | | | | | | | | | | | | | | |
| | | | | |
| | 19,570 | | | Bank of America Corporation | | | 8.000% | | | | N/A (5) | | | | BB+ | | | | 21,992,766 | |
| | | | | |
| | 14,134 | | | Bank of America Corporation | | | 5.000% | | | | N/A (5) | | | | BB+ | | | | 15,902,969 | |
| | | | | |
| | 3,955 | | | Citigroup Capital III | | | 7.625% | | | | 12/01/36 | | | | BB+ | | | | 4,666,900 | |
| | | | | |
| | 9,000 | | | Citigroup Inc. | | | 5.900% | | | | N/A (5) | | | | BB | | | | 9,340,434 | |
| | | | | |
| | 19,295 | | | Citigroup Inc. | | | 5.950% | | | | N/A (5) | | | | BB | | | | 20,018,563 | |
| | | | | |
| | 52,585 | | | General Electric Capital Corporation | | | 7.125% | | | | N/A (5) | | | | AA– | | | | 61,159,773 | |
| | | | | |
| | 59,395 | | | JP Morgan Chase & Company | | | 7.900% | | | | N/A (5) | | | | BBB | | | | 68,234,698 | |
| | | | Total Diversified Financial Services | | | | | | | | | | | | | | | 201,316,103 | |
| | | | Electric Utilities – 0.6% | | | | | | | | | | | | | | | | |
| | | | | |
| | 7,426 | | | Electricite de France, 144A | | | 5.250% | | | | N/A (5) | | | | A3 | | | | 7,377,285 | |
| | | | Industrial Conglomerates – 0.4% | | | | | | | | | | | | | | | | |
| | | | | |
| | 5,000 | | | Southern California Edison Company | | | 6.250% | | | | N/A (5) | | | | BBB+ | | | | 5,501,400 | |
| | | | Insurance – 37.0% | | | | | | | | | | | | | | | | |
| | | | | |
| | 20,465 | | | American International Group, Inc. | | | 8.175% | | | | 5/15/58 | | | | BBB | | | | 27,551,006 | |
| | | | | |
| | 13,200 | | | Aviva PLC, Reg S | | | 8.250% | | | | N/A (5) | | | | Baa1 | | | | 14,203,200 | |
| | | | | |
| | 27,378 | | | AXA SA, 144A | | | 6.380% | | | | N/A (5) | | | | Baa1 | | | | 27,172,665 | |
| | | | | |
| | 8,516 | | | AXA SA | | | 8.600% | | | | 12/15/30 | | | | A3 | | | | 10,919,905 | |
| | | | | |
| | 41,129 | | | Catlin Insurance Company Limited | | | 7.249% | | | | N/A (5) | | | | BBB+ | | | | 42,260,048 | |
| | | | | |
| | 6,865 | | | Cloverie PLC Zurich Insurance | | | 8.250% | | | | N/A (5) | | | | A | | | | 7,891,318 | |
| | | | | |
| | 8,400 | | | Dai-Ichi Mutual Life, 144A | | | 7.250% | | | | N/A (5) | | | | A3 | | | | 9,484,860 | |
| | | | | |
| | 59,430 | | | Financial Security Assurance Holdings, 144A | | | 6.400% | | | | 12/15/66 | | | | BBB | | | | 53,784,150 | |
| | | | | |
| | 2,825 | | | Friends Life Group PLC | | | 7.875% | | | | N/A (5) | | | | BBB+ | | | | 2,994,500 | |
| | | | | |
| | 43,740 | | | Glen Meadows Pass Through Trust | | | 6.505% | | | | 8/15/67 | | | | BB+ | | | | 41,771,700 | |
| | | | | |
| | 5,000 | | | Great West Life and Annuity Insurance Company, 144A | | | 7.153% | | | | 5/16/46 | | | | A– | | | | 5,300,000 | |
| | | | | |
| | 20,879 | | | Liberty Mutual Group Inc., 144A | | | 10.750% | | | | 6/15/88 | | | | Baa3 | | | | 32,258,055 | |
| | | | | |
| | 13,000 | | | Lincoln National Corporation | | | 7.000% | | | | 5/17/66 | | | | BBB | | | | 13,325,000 | |
| | | | | |
| | 35,231 | | | MetLife Capital Trust X, 144A | | | 9.250% | | | | 4/08/68 | | | | BBB | | | | 49,147,245 | |
| | | | | |
| | 3,492 | | | National Financial Services Inc. | | | 6.750% | | | | 5/15/67 | | | | Baa2 | | | | 3,701,520 | |
| | | | | |
| | 13,095 | | | Provident Financing Trust I. | | | 7.405% | | | | 3/15/38 | | | | Baa3 | | | | 14,189,388 | |
| | | | | |
| | 25,600 | | | Prudential Financial Inc. | | | 5.200% | | | | 3/15/44 | | | | BBB+ | | | | 25,664,000 | |
| | | | | |
| | 3,000 | | | Prudential Financial Inc. | | | 5.875% | | | | 9/15/42 | | | | BBB+ | | | | 3,195,000 | |
| | | | | |
| | 11,705 | | | Prudential PLC | | | 7.750% | | | | N/A (5) | | | | A– | | | | 12,612,138 | |
| | | | | |
| | 855 | | | Prudential PLC | | | 6.500% | | | | N/A (5) | | | | A– | | | | 858,933 | |
| | | | | |
| | 3,000 | | | QBE Capital Funding Trust II, 144A | | | 6.797% | | | | N/A (5) | | | | BBB+ | | | | 2,946,495 | |
| | | | | |
| | 12,770 | | | QBE Capital Funding Trust II, 144A | | | 7.250% | | | | 5/24/41 | | | | BBB+ | | | | 13,408,500 | |
| | | | | |
| | 31,850 | | | Sompo Japan Insurance | | | 5.325% | | | | 3/28/73 | | | | A– | | | | 32,155,760 | |
| | | | | |
| | 21,444 | | | Symetra Financial Corporation, 144A | | | 8.300% | | | | 10/15/37 | | | | BBB– | | | | 22,677,030 | |
| | | | | | | | | | | | | | | | | | | | |
Principal
Amount (000)/
Shares | | | Description (1) | | Coupon | | | Maturity | | | Ratings (2) | | | Value | |
| | | | | | | | | | | | | | | | | | | | |
| | | | Insurance (continued) | | | | | | | | | | | | | | | | |
| | | | | |
| | 25,235 | | | White Mountains Re Group Limited | | | 7.506% | | | | N/A (5) | | | | BB+ | | | $ | 26,708,976 | |
| | | | Total Insurance | | | | | | | | | | | | | | | 496,181,392 | |
| | | | Real Estate Investment Trust – 3.5% | | | | | | | | | | | | | | | | |
| | | | | |
| | 21,596 | | | Sovereign Real Estate Investment Trust, 144A | | | 12.000% | | | | N/A (5) | | | | Ba1 | | | | 27,732,460 | |
| | | | | |
| | 196 | | | Union Planters Preferred Fund, 144A | | | 7.750% | | | | N/A (5) | | | | BB | | | | 19,532,625 | |
| | | | Total Real Estate Investment Trust | | | | | | | | | | | | | | | 47,265,085 | |
| | | | U.S. Agency – 2.9% | | | | | | | | | | | | | | | | |
| | | | | |
| | 18,925 | | | AgFirst Farm Credit Bank | | | 7.300% | | | | N/A (5) | | | | A– | | | | 18,924,016 | |
| | | | | |
| | 15,750 | | | Farm Credit Bank of Texas | | | 10.000% | | | | N/A (5) | | | | A3 | | | | 19,992,657 | |
| | | | Total U.S. Agency | | | | | | | | | | | | | | | 38,916,673 | |
| | | | Total $1,000 Par (or similar) Institutional Structures (cost $948,297,801) | | | | | | | | | | | | 1,027,702,056 | |
| | | | | |
Principal
Amount (000) | | | Description (1) | | Coupon | | | Maturity | | | | | | Value | |
| | | | SHORT-TERM INVESTMENTS – 0.2% | | | | | | | | | | | | | | | | |
| | | | | |
| $ | 2,311 | | | Repurchase Agreement with State Street Bank, dated 3/28/13, repurchase price $2,311,260, collateralized by $2,285,000 U.S. Treasury Notes, 1.375%, due 11/30/15, value $2,358,380 | | | 0.010% | | | | 4/01/13 | | | | | | | $ | 2,311,257 | |
| | | | Total Short-Term Investments (cost $2,311,257) | | | | | | | | | | | | | | | 2,311,257 | |
| | | | Total Investments (cost $1,225,297,769) – 100.2% | | | | | | | | | | | | | | | 1,345,504,770 | |
| | | | Other Assets Less Liabilities – (0.2)% (6) | | | | | | | | | | | | | | | (2,941,901) | |
| | | | Net Assets – 100% | | | | | | | | | | | | | | $ | 1,342,562,869 | |
Investments in Derivatives as of March 31, 2013
Forward Swaps outstanding:
| | | | | | | | | | | | | | | | | | | | | | | | | | | | | | | | |
| Counterparty | | Notional
Amount | | | Fund
Pay/Receive
Floating Rate | | | Floating
Rate Index | | | Fixed Rate
(Annualized) | | | Fixed Rate
Payment
Frequency | | | Effective
Date (7) | | | Termination
Date | | | Unrealized
Appreciation
(Depreciation) (6) | |
Barclays PLC | | $ | 50,000,000 | | | | Receive | | | | 3-Month USD-LIBOR | | | | 2.758% | | | | Semi-Annually | | | | 11/06/14 | | | | 11/06/34 | | | $ | 2,703,185 | |
| | (1) | | All percentages shown in the Portfolio of Investments are based on net assets. |
| | (2) | | Ratings: Using the highest of Standard & Poor’s Group (“Standard & Poor’s”), Moody’s Investors Service, Inc. (“Moody’s”) or Fitch, Inc. (“Fitch”) rating. Ratings below BBB by Standard & Poor’s, Baa by Moody’s or BBB by Fitch are considered to be below investment grade. Holdings designated N/R are not rated by any of these national rating agencies. |
| | (3) | | For fair value measurement disclosure purposes, $25 Par (or similar) Retail Structures classified as Level 2. See Notes to Financial Statements, Footnote 1 – General Information and Significant Accounting Policies, Investment Valuation for more information. |
| | (4) | | Optional Call Provisions: Dates (month and year) and prices of the earliest optional call or redemption. There may be other call provisions at varying prices at later dates. Certain mortgage-backed securities may be subject to periodic principal paydowns. |
| | (5) | | Perpetual security. Maturity date is not applicable. |
| | (6) | | Other Assets Less Liabilities includes the Unrealized Appreciation (Depreciation) of derivative instruments as noted within Investments in Derivatives as of the end of the reporting period. |
| | (7) | | Effective date represents the date on which both the Fund and Counterparty commence interest payment accruals on each forward swap contract. |
| | Reg S | | Regulation S allows U.S. companies to sell securities to persons or entities located outside of the United States without registering those securities with the Securities and Exchange Commission. Specifically, Regulation S provides a safe harbor from the registration requirements of the Securities Act for the offers and sales of securities by both foreign and domestic issuers that are made outside the United States. |
| | 144A | | Investment is exempt from registration under Rule 144A of the Securities Act of 1933, as amended. These investments may only be resold in transactions exempt from registration, which are normally those transactions with qualified institutional buyers. |
| | USD-LIBOR | | United States Dollar – London Inter-Bank Offered Rate |
See accompanying notes to financial statements.
Statement of Assets and Liabilities (Unaudited)
March 31, 2013
| | | | |
Assets | | | | |
Investments, at value (cost $1,225,297,769) | | $ | 1,345,504,770 | |
Cash | | | 611,474 | |
Unrealized appreciation on forward swaps | | | 2,703,185 | |
Receivables: | | | | |
Dividends | | | 1,540,950 | |
Interest | | | 16,972,383 | |
Shares sold | | | 8,053,225 | |
Other assets | | | 21,474 | |
Total assets | | | 1,375,407,461 | |
Liabilities | | | | |
Payables: | | | | |
Dividends | | | 1,190,582 | |
Investments purchased | | | 26,202,321 | |
Shares redeemed | | | 4,023,842 | |
Accrued expenses: | | | | |
Management fees | | | 860,916 | |
Trustees fees | | | 25,571 | |
12b-1 distribution and service fees | | | 224,416 | |
Other | | | 316,944 | |
Total liabilities | | | 32,844,592 | |
Net assets | | $ | 1,342,562,869 | |
Class A Shares | | | | |
Net assets | | $ | 389,438,970 | |
Shares outstanding | | | 21,939,794 | |
Net asset value per share | | $ | 17.75 | |
Offering price per share (net asset value per share plus
maximum sales charge of 4.75% of offering price) | | $ | 18.64 | |
Class C Shares | | | | |
Net assets | | $ | 173,700,477 | |
Shares outstanding | | | 9,781,533 | |
Net asset value and offering price per share | | $ | 17.76 | |
Class R3 Shares | | | | |
Net assets | | $ | 2,839,893 | |
Shares outstanding | | | 158,876 | |
Net asset value and offering price per share | | $ | 17.87 | |
Class I Shares | | | | |
Net assets | | $ | 776,583,529 | |
Shares outstanding | | | 43,743,617 | |
Net asset value and offering price per share | | $ | 17.75 | |
Net assets consist of: | | | | |
Capital paid-in | | $ | 1,215,522,547 | |
Undistributed (Over-distribution of) net investment income | | | (2,004,420 | ) |
Accumulated net realized gain (loss) | | | 6,134,556 | |
Net unrealized appreciation (depreciation) | | | 122,910,186 | |
Net assets | | $ | 1,342,562,869 | |
Authorized shares – per class | | | Unlimited | |
Par value per share | | $ | 0.01 | |
See accompanying notes to financial statements.
Statement of Operations (Unaudited)
Six Months Ended March 31, 2013
| | | | |
Investment Income | | | | |
Dividends (net of tax withheld of $24,781) | | $ | 13,294,713 | |
Interest | | | 24,381,305 | |
Total investment income | | | 37,676,018 | |
Expenses | | | | |
Management fees | | | 3,746,151 | |
12b-1 service fees – Class A | | | 391,582 | |
12b-1 distribution and service fees – Class C | | | 825,223 | |
12b-1 distribution and service fees – Class R3 | | | 5,686 | |
Shareholder servicing agent fees and expenses | | | 341,016 | |
Custodian fees and expenses | | | 82,028 | |
Trustees fees and expenses | | | 14,467 | |
Professional fees | | | 34,354 | |
Shareholder reporting expenses | | | 63,606 | |
Federal and state registration fees | | | 120,158 | |
Other expenses | | | 18,943 | |
Total expenses | | | 5,643,214 | |
Net investment income (loss) | | | 32,032,804 | |
Realized and Unrealized Gain (Loss) | | | | |
Net realized gain (loss) from investments | | | 11,753,658 | |
Change in net unrealized appreciation (depreciation) of: | | | | |
Investments | | | 31,310,338 | |
Forward swaps | | | 2,624,904 | |
Net realized and unrealized gain (loss) | | | 45,688,900 | |
Net increase (decrease) in net assets from operations | | $ | 77,721,704 | |
See accompanying notes to financial statements.
Statement of Changes in Net Assets (Unaudited)
| | | | | | | | |
| | | Six Months Ended
3/31/13 | | | Year Ended
9/30/12 | |
Operations | | | | | | | | |
Net investment income (loss) | | $ | 32,032,804 | | | $ | 46,073,164 | |
Net realized gain (loss) from: | | | | | | | | |
Investments | | | 11,753,658 | | | | 8,539,328 | |
Forward swaps | | | — | | | | (3,865,000 | ) |
Change in net unrealized appreciation (depreciation) of: | | | | | | | | |
Investments | | | 31,310,338 | | | | 95,830,779 | |
Forward swaps | | | 2,624,904 | | | | 609,665 | |
Net increase (decrease) in net assets from operations | | | 77,721,704 | | | | 147,187,936 | |
Distributions to Shareholders | | | | | | | | |
From net investment income: | | | | | | | | |
Class A | | | (9,322,342 | ) | | | (11,223,530 | ) |
Class C | | | (4,317,212 | ) | | | (6,715,011 | ) |
Class R3 | | | (64,103 | ) | | | (8,826 | ) |
Class I | | | (18,785,551 | ) | | | (28,491,920 | ) |
From accumulated net realized gains: | | | | | | | | |
Class A | | | (2,870,394 | ) | | | (4,038,201 | ) |
Class C | | | (1,537,517 | ) | | | (2,711,153 | ) |
Class R3 | | | (23,221 | ) | | | (2,338 | ) |
Class I | | | (5,388,690 | ) | | | (10,111,063 | ) |
Decrease in net assets from distributions to shareholders | | | (42,309,030 | ) | | | (63,302,042 | ) |
Fund Share Transactions | | | | | | | | |
Proceeds from sale of shares | | | 500,173,449 | | | | 459,306,284 | |
Proceeds from shares issued to shareholders due to reinvestment of distributions | | | 33,736,121 | | | | 37,548,291 | |
| | | 533,909,570 | | | | 496,854,575 | |
Cost of shares redeemed | | | (164,720,168 | ) | | | (304,210,105 | ) |
Net increase (decrease) in net assets from Fund share transactions | | | 369,189,402 | | | | 192,644,470 | |
Net increase (decrease) in net assets | | | 404,602,076 | | | | 276,530,364 | |
Net assets at the beginning of period | | | 937,960,793 | | | | 661,430,429 | |
Net assets at the end of period | | $ | 1,342,562,869 | | | $ | 937,960,793 | |
Undistributed (Over-distribution of) net investment income at the end of period | | $ | (2,004,420 | ) | | $ | (1,548,016 | ) |
See accompanying notes to financial statements.
[THIS PAGE INTENTIONALLY LEFT BLANK]
Financial Highlights (Unaudited)
| | | | | | | | | | | | | | | | | | | | | | | | | | | | | | | | | | | | |
| Selected data for a share outstanding throughout each period: | |
| | | | | | | |
| Class (Commencement Date) | | | | | | | | | | | | | | | | | | | | | | |
| | | | | | Investment Operations | | | Less Distributions | | | | |
| | | | | | | | | |
| | | | | | | | | | | | | | | | | | | | | | | | | | | | |
| | | Beginning
Net
Asset
Value | | | Net
Invest-
ment
Income
(Loss)(a) | | | Net
Realized/
Unrealized
Gain
(Loss) | | | Total | | | From
Net
Invest-
ment
Income | | | From
Accum-
ulated
Net
Realized
Gains | | | Return
of
Capital | | | Total | | | Ending
Net
Asset
Value | |
Class A (12/06) | | | | | | | | | | | | | | | | | | | | | | | | | | | | | | | | | |
Year Ended 9/30: | | | | | | | | | | | | | | | | | | | | | | | | | | | | | | | | | | | | |
2013(f) | | $ | 17.15 | | | $ | .51 | | | $ | .77 | | | $ | 1.28 | | | $ | (.52 | ) | | $ | (.16 | ) | | $ | — | | | $ | (.68 | ) | | $ | 17.75 | |
2012 | | | 15.30 | | | | 1.03 | | | | 2.29 | | | | 3.32 | | | | (1.04 | ) | | | (.43 | ) | | | — | | | | (1.47 | ) | | | 17.15 | |
2011 | | | 16.99 | | | | 1.05 | | | | (1.24 | ) | | | (.19 | ) | | | (1.08 | ) | | | (.42 | ) | | | — | | | | (1.50 | ) | | | 15.30 | |
2010 | | | 14.73 | | | | 1.11 | | | | 2.28 | | | | 3.39 | | | | (1.13 | ) | | | — | | | | — | | | | (1.13 | ) | | | 16.99 | |
2009(d) | | | 11.76 | | | | .84 | | | | 3.00 | | | | 3.84 | | | | (.87 | ) | | | — | | | | — | | | | (.87 | ) | | | 14.73 | |
Year Ended 12/31: | | | | | | | | | | | | | | | | | | | | | | | | | | | | | | | | | | | | |
2008 | | | 16.98 | | | | 1.31 | | | | (5.30 | ) | | | (3.99 | ) | | | (1.08 | ) | | | — | | | | (.15 | ) | | | (1.23 | ) | | | 11.76 | |
2007 | | | 20.01 | | | | 1.08 | | | | (3.03 | ) | | | (1.95 | ) | | | (1.08 | ) | | | — | | | | — | | | | (1.08 | ) | | | 16.98 | |
Class C (12/06) | | | | | | | | | | | | | | | | | | | | | | | | | | | | | | | | | |
Year Ended 9/30: | | | | | | | | | | | | | | | | | | | | | | | | | | | | | | | | | | | | |
2013(f) | | | 17.16 | | | | .45 | | | | .77 | | | | 1.22 | | | | (.46 | ) | | | (.16 | ) | | | — | | | | (.62 | ) | | | 17.76 | |
2012 | | | 15.31 | | | | .91 | | | | 2.30 | | | | 3.21 | | | | (.93 | ) | | | (.43 | ) | | | — | | | | (1.36 | ) | | | 17.16 | |
2011 | | | 17.00 | | | | .93 | | | | (1.25 | ) | | | (.32 | ) | | | (.95 | ) | | | (.42 | ) | | | — | | | | (1.37 | ) | | | 15.31 | |
2010 | | | 14.74 | | | | 1.00 | | | | 2.28 | | | | 3.28 | | | | (1.02 | ) | | | — | | | | — | | | | (1.02 | ) | | | 17.00 | |
2009(d) | | | 11.77 | | | | .78 | | | | 3.00 | | | | 3.78 | | | | (.81 | ) | | | — | | | | — | | | | (.81 | ) | | | 14.74 | |
Year Ended 12/31: | | | | | | | | | | | | | | | | | | | | | | | | | | | | | | | | | | | | |
2008 | | | 16.96 | | | | 1.16 | | | | (5.24 | ) | | | (4.08 | ) | | | (.97 | ) | | | — | | | | (.14 | ) | | | (1.11 | ) | | | 11.77 | |
2007 | | | 20.01 | | | | .93 | | | | (3.03 | ) | | | (2.10 | ) | | | (.95 | ) | | | — | | | | — | | | | (.95 | ) | | | 16.96 | |
Class R3 (9/09) | | | | | | | | | | | | | | | | | | | | | | | | | | | | | | | | | |
Year Ended 9/30: | | | | | | | | | | | | | | | | | | | | | | | | | | | | | | | | | | | | |
2013(f) | | | 17.27 | | | | .49 | | | | .77 | | | | 1.26 | | | | (.50 | ) | | | (.16 | ) | | | — | | | | (.66 | ) | | | 17.87 | |
2012 | | | 15.40 | | | | .96 | | | | 2.35 | | | | 3.31 | | | | (1.01 | ) | | | (.43 | ) | | | — | | | | (1.44 | ) | | | 17.27 | |
2011 | | | 17.10 | | | | 1.05 | | | | (1.29 | ) | | | (.24 | ) | | | (1.04 | ) | | | (.42 | ) | | | — | | | | (1.46 | ) | | | 15.40 | |
2010 | | | 14.82 | | | | 1.08 | | | | 2.30 | | | | 3.38 | | | | (1.10 | ) | | | — | | | | — | | | | (1.10 | ) | | | 17.10 | |
2009(e) | | | 14.88 | | | | .01 | | | | (.07 | ) | | | (.06 | ) | | | — | | | | — | | | | — | | | | — | | | | 14.82 | |
Class I (12/06) | | | | | | | | | | | | | | | | | | | | | | | | | | | | | | | | | |
Year Ended 9/30: | | | | | | | | | | | | | | | | | | | | | | | | | | | | | | | | | | | | |
2013(f) | | | 17.15 | | | | .53 | | | | .77 | | | | 1.30 | | | | (.54 | ) | | | (.16 | ) | | | — | | | | (.70 | ) | | | 17.75 | |
2012 | | | 15.30 | | | | 1.07 | | | | 2.30 | | | | 3.37 | | | | (1.09 | ) | | | (.43 | ) | | | — | | | | (1.52 | ) | | | 17.15 | |
2011 | | | 16.99 | | | | 1.10 | | | | (1.25 | ) | | | (.15 | ) | | | (1.12 | ) | | | (.42 | ) | | | — | | | | (1.54 | ) | | | 15.30 | |
2010 | | | 14.72 | | | | 1.16 | | | | 2.28 | | | | 3.44 | | | | (1.17 | ) | | | — | | | | — | | | | (1.17 | ) | | | 16.99 | |
2009(d) | | | 11.76 | | | | .86 | | | | 3.00 | | | | 3.86 | | | | (.90 | ) | | | — | | | | — | | | | (.90 | ) | | | 14.72 | |
Year Ended 12/31: | | | | | | | | | | | | | | | | | | | | | | | | | | | | | | | | | | | | |
2008 | | | 16.98 | | | | 1.19 | | | | (5.14 | ) | | | (3.95 | ) | | | (1.14 | ) | | | — | | | | (.13 | ) | | | (1.27 | ) | | | 11.76 | |
2007 | | | 20.01 | | | | 1.18 | | | | (3.08 | ) | | | (1.90 | ) | | | (1.13 | ) | | | — | | | | — | | | | (1.13 | ) | | | 16.98 | |
| | | | | | | | | | | | | | | | | | | | | | | | | | |
| | | | | | | | | | | |
| | | |
| | | | | | | | | | | |
| | | | Ratios/Supplemental Data | |
| | | | | | | Ratios to Average
Net Assets Before
Waiver/Reimbursement | | | Ratios to Average
Net Assets After
Waiver/Reimbursement(c) | | | | |
Total
Return(b) | | | Ending
Net
Assets
(000) | | | Expenses | | | Net
Invest-
ment
Income
(Loss) | | | Expenses | | |
Net
Invest-
ment
Income
(Loss) | | | Portfolio
Turnover
Rate | |
| | | | | | | | | | | | | | | | | | | | | | | | | | |
| | | | | | | | | | | | | | | | | | | | | | | | | | |
| | 7.63 | % | | $ | 389,439 | | | | 1.06 | %* | | | 5.86 | %* | | | 1.06 | %* | | | 5.86 | %* | | | 12 | % |
| | 23.16 | | | | 267,619 | | | | 1.08 | | | | 6.44 | | | | 1.08 | | | | 6.44 | | | | 53 | |
| | (1.59 | ) | | | 166,611 | | | | 1.10 | | | | 6.21 | | | | 1.03 | | | | 6.28 | | | | 60 | |
| | 23.84 | | | | 185,972 | | | | 1.16 | | | | 6.87 | | | | .95 | | | | 7.07 | | | | 72 | |
| | 35.29 | | | | 93,983 | | | | 1.47 | * | | | 8.58 | * | | | .94 | * | | | 9.11 | * | | | 30 | |
| | | | | | | | | | | | | | | | | | | | | | | | | | |
| | (24.67 | ) | | | 22,420 | | | | 1.64 | | | | 10.32 | | | | .95 | | | | 11.02 | | | | 99 | |
| | (10.12 | ) | | | 321 | | | | 2.50 | | | | 4.23 | | | | 1.13 | | | | 5.60 | | | | 179 | |
| | | | | | | | | | | | | | | | | | | | | | | | | | |
| | | | | | | | | | | | | | | | | | | | | | | | | | |
| | 7.24 | | | | 173,700 | | | | 1.81 | * | | | 5.12 | * | | | 1.81 | * | | | 5.12 | * | | | 12 | |
| | 22.24 | | | | 152,411 | | | | 1.83 | | | | 5.68 | | | | 1.83 | | | | 5.68 | | | | 53 | |
| | (2.32 | ) | | | 97,071 | | | | 1.85 | | | | 5.49 | | | | 1.78 | | | | 5.57 | | | | 60 | |
| | 22.94 | | | | 97,316 | | | | 1.91 | | | | 6.13 | | | | 1.70 | | | | 6.34 | | | | 72 | |
| | 34.48 | | | | 48,720 | | | | 2.23 | * | | | 7.82 | * | | | 1.69 | * | | | 8.36 | * | | | 30 | |
| | | | | | | | | | | | | | | | | | | | | | | | | | |
| | (25.13 | ) | | | 6,429 | | | | 2.32 | | | | 8.90 | | | | 1.70 | | | | 9.52 | | | | 99 | |
| | (10.85 | ) | | | 245 | | | | 3.29 | | | | 3.39 | | | | 1.89 | | | | 4.79 | | | | 179 | |
| | | | | | | | | | | | | | | | | | | | | | | | | | |
| | | | | | | | | | | | | | | | | | | | | | | | | | |
| | 7.53 | | | | 2,840 | | | | 1.30 | * | | | 5.53 | * | | | 1.30 | * | | | 5.53 | * | | | 12 | |
| | 22.82 | | | | 552 | | | | 1.33 | | | | 5.91 | | | | 1.33 | | | | 5.91 | | | | 53 | |
| | (1.78 | ) | | | 170 | | | | 1.35 | | | | 6.20 | | | | 1.28 | | | | 6.25 | | | | 60 | |
| | 23.59 | | | | 62 | | | | 1.42 | | | | 6.59 | | | | 1.20 | | | | 6.81 | | | | 72 | |
| | (.40 | ) | | | 50 | | | | 1.37 | * | | | 11.62 | * | | | 1.20 | * | | | 11.79 | * | | | 30 | |
| | | | | | | | | | | | | | | | | | | | | | | | | | |
| | | | | | | | | | | | | | | | | | | | | | | | | | |
| | 7.82 | | | | 776,584 | | | | .81 | * | | | 6.11 | * | | | .81 | * | | | 6.11 | * | | | 12 | |
| | 23.40 | | | | 517,379 | | | | .83 | | | | 6.68 | | | | .83 | | | | 6.68 | | | | 53 | |
| | (1.28 | ) | | | 397,579 | | | | .85 | | | | 6.51 | | | | .78 | | | | 6.58 | | | | 60 | |
| | 24.23 | | | | 358,371 | | | | .91 | | | | 7.16 | | | | .70 | | | | 7.37 | | | | 72 | |
| | 35.48 | | | | 116,643 | | | | 1.21 | * | | | 9.12 | * | | | .69 | * | | | 9.64 | * | | | 30 | |
| | | | | | | | | | | | | | | | | | | | | | | | | | |
| | (24.45 | ) | | | 38,697 | | | | 1.26 | | | | 7.57 | | | | .69 | | | | 8.14 | | | | 99 | |
| | (9.91 | ) | | | 19,769 | | | | 1.80 | | | | 5.28 | | | | .78 | | | | 6.30 | | | | 179 | |
| (a) | Per share Net Investment Income (Loss) is calculated using the average daily shares method. |
| (b) | Total return is the combination of changes in net asset value without any sales charge, reinvested dividend income at net asset value and reinvested capital gains distributions at net asset value, if any. Total returns are not annualized. |
| (c) | After fee waiver and/or expense reimbursement from the Adviser, where applicable. |
| (d) | For the nine months ended September 30, 2009. |
| (e) | For the period September 29, 2009 (commencement of operations) through September 30, 2009. |
| (f) | For the six months ended March 31, 2013. |
See accompanying notes to financial statements.
Notes to Financial Statements (Unaudited)
1. General Information and Significant Accounting Policies
General Information
The Nuveen Investment Trust V (the “Trust”) is an open-end investment company registered under the Investment Company Act of 1940, as amended. The Trust is comprised of the Nuveen Preferred Securities Fund (the “Fund”), a non-diversified fund, among others. The Trust was organized as a Massachusetts business trust on September 27, 2006.
On December 31, 2012, the Fund’s investment adviser converted from a Delaware corporation to a Delaware limited liability company. As a result, Nuveen Fund Advisers, Inc., a wholly-owned subsidiary of Nuveen Investments, Inc. (“Nuveen”), changed its name to Nuveen Fund Advisers, LLC (the “Adviser”). There were no changes to the identities or roles of any personnel as a result of the change.
The Fund seeks to provide a high level of current income and total return. Under normal market conditions, the Fund invests at least 80% of its net assets (plus the amount of any borrowings for investment purposes) in preferred securities. Preferred securities generally pay fixed or adjustable rate distributions to investors and have preference over common stock in the payment of distributions and the liquidation of a company’s assets, but are junior to most other forms of the company’s debt, including both senior and subordinated debt. The Fund intends to invest at least 25% of its assets in the preferred securities of companies principally engaged in financial services. The Fund normally invests at least 60% of its net assets in securities rated investment grade (BBB/Baa or higher) at the time of purchase by at least one independent rating agency and unrated securities judged to be of comparable quality by Nuveen Asset Management, LLC (the “Sub-Adviser”), a wholly-owned subsidiary of the Adviser. The Fund may invest up to 40% of its net assets in securities rated below investment grade (BB/Ba or lower) at the time of purchase, which are commonly referred to as “high yield,” or “junk bonds.” Although the Fund invests primarily in securities issued by U.S. companies, the Fund may invest up to 35% of its net assets in U.S. dollar-denominated securities issued by non-U.S. companies. The Fund seeks to meet its investment objective by investing primarily in preferred securities, but it may also invest up to 20% of its net assets in other types of securities, including corporate debt securities, U.S. government and agency debt, taxable municipal securities and convertible preferred securities. The Fund may also invest in forwards, futures, options and swap contracts, or other derivative financial instruments including credit default swaps.
The Fund’s most recent prospectus provides further description of the Fund’s investment objective, principal investment strategies and principal risks.
Significant Accounting Policies
The following is a summary of significant accounting policies followed by the Fund in the preparation of its financial statements in accordance with U.S. generally accepted accounting principles (“U.S. GAAP”).
Investment Valuation
Common stocks and other equity-type securities are valued at the last sales price on the securities exchange on which such securities are primarily traded and are generally classified as Level 1 for fair value measurement purposes. Securities primarily traded on the NASDAQ National Market (“NASDAQ”) are valued, except as indicated below, at the NASDAQ Official Closing Price and are generally classified as Level 1. However, securities traded on a securities exchange or NASDAQ for which there were no transactions on a given day or securities not listed on a securities exchange or NASDAQ are valued at the quoted bid price and are generally classified as Level 2.
Prices of fixed-income securities and forward swap contracts are provided by a pricing service approved by the Fund’s Board of Trustees. These securities are generally classified as Level 2. The pricing service establishes a security’s fair value using methods that may include consideration of the following: yields or prices of investments of comparable quality, type of issue, coupon, maturity and rating, market quotes or indications of value from security dealers, evaluations of anticipated cash flows or collateral, general market conditions and other information and analysis, including the obligor’s credit characteristics considered relevant. In pricing certain securities, particularly less liquid and lower quality securities, the pricing service may consider information about a security, its issuer, or market activity provided by the Adviser. These securities are generally classified as Level 2 or Level 3 depending on the priority of the significant inputs.
Repurchase agreements are valued at contract amount plus accrued interest, which approximates market value. These securities are generally classified as Level 2.
Certain securities may not be able to be priced by the pre-established pricing methods as described above. Such securities may be valued by the Fund’s Board of Trustees or its designee at fair value. These securities generally include, but are not limited to, restricted securities (securities which may not be publicly sold without registration under the Securities Act of 1933, as amended) for which a pricing service is unable to provide a market price; securities whose trading has been formally suspended; debt securities that have gone into default and for which there is no current market quotation; a security whose market price is not available from a pre-established pricing source; a security with respect to which an event has occurred that is likely to materially affect the value of the security after the market has closed but before the calculation of the Fund’s net asset value (as may be the case in non-U.S. markets on which the security is primarily traded) or make it difficult or impossible to obtain a reliable market quotation; and a security whose
price, as provided by the pricing service, is not deemed to reflect the security’s fair value. As a general principle, the fair value of a security would appear to be the amount that the owner might reasonably expect to receive for it in a current sale. A variety of factors may be considered in determining the fair value of such securities, which may include consideration of the following: yields or prices of investments of comparable quality, type of issue, coupon, maturity and rating, market quotes or indications of value from security dealers, evaluations of anticipated cash flows or collateral, general market conditions and other information and analysis, including the obligor’s credit characteristics considered relevant. These securities are generally classified as Level 2 or Level 3 depending on the priority of the significant inputs. Regardless of the method employed to value a particular security, all valuations are subject to review by the Fund’s Board of Trustees or its designee.
Refer to Footnote 2 – Fair Value Measurements for further details on the leveling of securities held by the Fund as of the end of the reporting period.
Investment Transactions
Investment transactions are recorded on a trade date basis. Realized gains and losses from investment transactions are determined on the specific identification method, which is the same basis used for federal income tax purposes. Investments purchased on a when-issued/delayed delivery basis may have extended settlement periods. Any investments so purchased are subject to market fluctuation during this period. The Fund has instructed the custodian to earmark securities in the Fund’s portfolio with a current value at least equal to the amount of the when-issued/delayed delivery purchase commitments. As of March 31, 2013, the Fund had no such outstanding purchase commitments.
Investment Income
Dividend income is recorded on the ex-dividend date or, for foreign securities, when information is available. Interest income, which reflects the amortization of premiums and includes accretion of discounts for financial reporting purposes, is recorded on an accrual basis. Interest income also reflects paydown gains and losses, if any.
Professional Fees
Professional fees presented on the Statement of Operations consist of legal fees incurred in the normal course of operations, audit fees, tax consulting fees and, in some cases, workout expenditures. Workout expenditures are incurred in an attempt to protect or enhance an investment, or to pursue other claims or legal actions on behalf of Fund shareholders. Legal fee refund presented on the Statement of Operations reflects a refund of workout expenditures paid in a prior reporting period, when applicable.
Income Taxes
The Fund intends to distribute substantially all of its net investment income and net capital gains to shareholders and to otherwise comply with the requirements of Subchapter M of the Internal Revenue Code applicable to regulated investment companies. Therefore, no federal income tax provision is required.
For all open tax years and all major taxing jurisdictions, management of the Fund has concluded that there are no significant uncertain tax positions that would require recognition in the financial statements. Open tax years are those that are open for examination by taxing authorities (i.e., generally the last four tax year ends and the interim tax period since then). Furthermore, management of the Fund is also not aware of any tax positions for which it is reasonably possible that the total amounts of unrecognized tax benefits will significantly change in the next twelve months.
Dividends and Distributions to Shareholders
The Fund declares dividends from its net investment income daily and pays shareholders monthly. Fund shares begin to accrue dividends on the business day after the day when the monies used to purchase Fund shares are collected by the Fund’s transfer agent.
Net realized capital gains from investment transactions, if any, are declared and distributed to shareholders at least annually. Furthermore, capital gains are distributed only to the extent they exceed available capital loss carryforwards.
Distributions to shareholders are recorded on the ex-dividend date. The amount and timing of distributions are determined in accordance with federal income tax regulations, which may differ from U.S. GAAP.
Share Classes and Sales Charges
Class A Shares are generally sold with an up-front sales charge and incur a .25% annual 12b-1 service fee. Class A Share purchases of $1 million or more are sold at net asset value without an up-front sales charge but may be subject to a contingent deferred sales charge (“CDSC”) if redeemed within eighteen months of purchase. Class C Shares are sold without an up-front sales charge but incur a .75% annual 12b-1 distribution fee and a .25% annual 12b-1 service fee. Class C Shares are subject to a CDSC of 1% if redeemed within twelve months of purchase. Class R3 Shares are sold without an up-front sales charge but incur a .25% annual 12b-1 distribution fee and a .25% annual 12b-1 service fee. Class I Shares are not subject to any sales charge or 12b-1 distribution or service fees.
Forward Swap Contracts
The Fund is authorized to enter into forward interest rate swap contracts consistent with its investment objectives and policies to reduce, increase or otherwise alter its risk profile or to alter its portfolio characteristics (i.e. duration, yield curve positioning and credit quality).
Notes to Financial Statements (Unaudited) (continued)
The Fund is subject to interest rate risk in the normal course of pursuing its investment objectives. The Fund’s use of forward interest rate swap transactions is intended to help the Fund manage its overall interest rate sensitivity, either shorter or longer, generally to more closely align the Fund’s interest rate sensitivity with that of the broader market.
Forward interest rate swap transactions involve the Fund’s agreement with a counterparty to pay, in the future, a fixed or variable rate payment in exchange for the counterparty paying the Fund a variable or fixed rate payment, the accruals for which would begin at a specified date in the future (the “effective date”). The amount of the payment obligation is based on the notional amount of the swap contract and the termination date of the swap (which is akin to a bond’s maturity). The value of the Fund’s swap commitment would increase or decrease based primarily on the extent to which long-term interest rates for bonds having a maturity of the swap’s termination date increase or decrease. Forward interest rate swap contracts are valued daily. The net amount recorded on these transactions for each counterparty is recognized on the Statement of Assets and Liabilities as a component of “Unrealized appreciation or depreciation on forward swaps” with the change during the fiscal period recognized on the Statement of Operations as a component of “Change in net unrealized appreciation (depreciation) of forward swaps.”
The Fund may terminate a forward swap contract prior to the effective date, at which point a realized gain or loss is recognized. When a forward swap is terminated, it ordinarily does not involve the delivery of securities or other underlying assets or principal, but rather is settled in cash on a net basis. Net realized gains and losses during the fiscal period are recognized on the Statement of Operations as a component of “Net realized gain (loss) from forward swaps.” The Fund intends, but is not obligated, to terminate its forward swaps before the effective date. Accordingly, the risk of loss with respect to the swap counterparty on such transactions is limited to the credit risk associated with a counterparty failing to honor its commitment to pay any realized gain to the Fund upon termination.
During the six months ended March 31, 2013, the Fund continued to invest in forward interest rate swap transactions to reduce the duration of the preferred stock portfolio. The average notional amount of forward interest rate swap contracts outstanding during the six months ended March 31, 2013, was $50,000,000. The average notional amount is calculated based on the outstanding notional amount at the beginning of the fiscal year and at the end of each fiscal quarter within the current fiscal year. Refer to Footnote 3 – Derivative Instruments and Hedging Activities for further details on forward interest rate swap contract activity.
Market and Counterparty Credit Risk
In the normal course of business the Fund may invest in financial instruments and enter into financial transactions where risk of potential loss exists due to changes in the market (market risk) or failure of the other party to the transaction to perform (counterparty credit risk). The potential loss could exceed the value of the financial assets recorded on the financial statements. Financial assets, which potentially expose the Fund to counterparty credit risk, consist principally of cash due from counterparties on forward, option and swap transactions, when applicable. The extent of the Fund’s exposure to counterparty credit risk in respect to these financial assets approximates their carrying value as recorded on the Statement of Assets and Liabilities. Futures contracts, when applicable, expose the Fund to minimal counterparty credit risk as they are exchange traded and the exchange’s clearinghouse, which is counterparty to all exchange traded futures, guarantees the futures contracts against default.
The Fund helps manage counterparty credit risk by entering into agreements only with counterparties the Adviser believes have the financial resources to honor their obligations and by having the Adviser monitor the financial stability of the counterparties. Additionally, counterparties may be required to pledge collateral daily (based on the daily valuation of the financial asset) on behalf of the Fund with a value approximately equal to the amount of any unrealized gain above a pre-determined threshold. Reciprocally, when the Fund has an unrealized loss, the Fund has instructed the custodian to pledge assets of the Fund as collateral with a value approximately equal to the amount of the unrealized loss above a pre-determined threshold. Collateral pledges are monitored and subsequently adjusted if and when the valuations fluctuate, either up or down, by at least the pre-determined threshold amount.
Repurchase Agreements
In connection with transactions in repurchase agreements, it is the Fund’s policy that its custodian take possession of the underlying collateral securities, the fair value of which exceeds the principal amount of the repurchase transaction, including accrued interest, at all times. If the counterparty defaults, and the fair value of the collateral declines, realization of the collateral may be delayed or limited.
Zero Coupon Securities
The Fund is authorized to invest in zero coupon securities. A zero coupon security does not pay a regular interest coupon to its holders during the life of the security. Income to the holder of the security comes from accretion of the difference between the original purchase price of the security at issuance and the par value of the security at maturity and is effectively paid at maturity. The market prices of zero coupon securities generally are more volatile than the market prices of securities that pay interest periodically.
Multiclass Operations and Allocations
Income and expenses of the Fund that are not directly attributable to a specific class of shares are prorated among the classes based on the relative settled shares of each class. Expenses directly attributable to a class of shares, which presently only include 12b-1 distribution and service fees, are recorded to the specific class.
Realized and unrealized capital gains and losses of the Fund are prorated among the classes based on the relative net assets of each class.
Indemnifications
Under the Trust’s organizational documents, its officers and trustees are indemnified against certain liabilities arising out of the performance of their duties to the Trust. In addition, in the normal course of business, the Trust enters into contracts that provide general indemnifications to other parties. The Trust’s maximum exposure under these arrangements is unknown as this would involve future claims that may be made against the Trust that have not yet occurred. However, the Trust has not had prior claims or losses pursuant to these contracts and expects the risk of loss to be remote.
Use of Estimates
The preparation of financial statements in conformity with U.S. GAAP requires management to make estimates and assumptions that affect the reported amounts of assets and liabilities at the date of the financial statements and the reported amounts of increases and decreases in net assets from operations during the reporting period. Actual results may differ from those estimates.
2. Fair Value Measurements
Fair value is defined as the price that the Fund would receive upon selling an investment or transferring a liability in an orderly transaction to an independent buyer in the principal or most advantageous market for the investment. A three-tier hierarchy is used to maximize the use of observable market data and minimize the use of unobservable inputs and to establish classification of fair value measurements for disclosure purposes. Observable inputs reflect the assumptions market participants would use in pricing the asset or liability. Observable inputs are based on market data obtained from sources independent of the reporting entity. Unobservable inputs reflect the reporting entity’s own assumptions about the assumptions market participants would use in pricing the asset or liability. Unobservable inputs are based on the best information available in the circumstances. The following is a summary of the three-tiered hierarchy of valuation input levels.
| | |
| Level 1 – | | Inputs are unadjusted and prices are determined using quoted prices in active markets for identical securities. |
| Level 2 – | | Prices are determined using other significant observable inputs (including quoted prices for similar securities, interest rates, prepayment speeds, credit risk, etc.). |
| Level 3 – | | Prices are determined using significant unobservable inputs (including management’s assumptions in determining the fair value of investments). |
The inputs or methodologies used for valuing securities are not an indication of the risks associated with investing in those securities. The following is a summary of the Fund’s fair value measurements as of the end of the reporting period:
| | | | | | | | | | | | | | | | |
| | | Level 1 | | | Level 2 | | | Level 3 | | | Total | |
Long-Term Investments*: | | | | | | | | | | | | | | | | |
$25 Par (or similar) Retail Structures | | $ | 262,925,468 | | | $ | 32,957,055 | | | $ | — | | | $ | 295,882,523 | |
Taxable Municipal Bonds | | | — | | | | 253,946 | | | | — | | | | 253,946 | |
Corporate Bonds | | | — | | | | 19,354,988 | | | | — | | | | 19,354,988 | |
$1,000 Par (or similar) Institutional Structures | | | — | | | | 1,027,702,056 | | | | — | | | | 1,027,702,056 | |
Short-Term Investments: | | | | | | | | | | | | | | | | |
Repurchase Agreements | | | — | | | | 2,311,257 | | | | — | | | | 2,311,257 | |
Derivatives: | | | | | | | | | | | | | | | | |
Forward Swaps** | | | — | | | | 2,703,185 | | | | — | | | | 2,703,185 | |
Total | | $ | 262,925,468 | | | $ | 1,085,282,487 | | | $ | — | | | $ | 1,348,207,955 | |
| * | Refer to the Fund’s Portfolio of Investments for industry classifications and breakdown of $25 Par (or similar) Retail Structures classified as Level 2. |
| ** | Represents net unrealized appreciation (depreciation) as reported in the Fund’s Portfolio of Investments. |
The Nuveen funds’ Board of Directors/Trustees is responsible for the valuation process and has delegated the oversight of the daily valuation process to the Adviser’s Valuation Committee. The Valuation Committee, pursuant to the valuation policies and procedures adopted by the Board of Directors/Trustees, is responsible for making fair value determinations, evaluating the effectiveness of the funds’ pricing policies, and reporting to the Board of Directors/Trustees. The Valuation Committee is aided in its efforts by the Adviser’s dedicated Securities Valuation Team, which is responsible for administering the daily valuation process and applying fair value methodologies as approved by the Valuation Committee. When determining the reliability of independent pricing services for investments owned by the funds, the Valuation Committee, among other things, conducts due diligence reviews of the pricing services and monitors the quality of security prices received through various testing reports conducted by the Securities Valuation Team.
The Valuation Committee will consider pricing methodologies it deems relevant and appropriate when making fair value determinations. Examples of possible methodologies include, but are not limited to, multiple of earnings; discount from market of a similar freely traded security; discounted cash-flow analysis; book value or a multiple thereof; risk premium/yield analysis; yield to maturity; and/or fundamental investment analysis. The Valuation Committee will also consider factors it deems relevant and appropriate in light of the facts and circumstances. Examples of possible factors include, but are not limited to, the type of security; the issuer’s financial statements; the purchase price of the security; the discount from market value of unrestricted securities of the same class at the time of purchase; analysts’ research and observations from financial institutions; information regarding any transactions or offers with respect to the security; the existence of merger proposals or tender offers affecting the security; the price and extent of public trading in similar securities of the issuer or comparable companies; and the existence of a shelf registration for restricted securities.
Notes to Financial Statements (Unaudited) (continued)
For each portfolio security that has been fair valued pursuant to the policies adopted by the Board of Directors/Trustees, the fair value price is compared against the last available and next available market quotations. The Valuation Committee reviews the results of such testing and fair valuation occurrences are reported to the Board of Directors/Trustees.
3. Derivative Instruments and Hedging Activities
The Fund records derivative instruments at fair value, with changes in fair value recognized on the Statement of Operations, when applicable. Even though the Fund’s investments in derivatives may represent economic hedges, they are not considered to be hedge transactions for financial reporting purposes. For additional information on the derivative instruments in which the Fund was invested during and at the end of the reporting period refer to the Portfolio of Investments, Financial Statements and Footnote 1 – General Information and Significant Accounting Policies.
The following table presents the fair value of all derivative instruments held by the Fund as of March 31, 2013, the location of these instruments on the Statement of Assets and Liabilities, and the primary underlying risk exposure.
| | | | | | | | | | | | | | |
| | | | | Location on the Statement of Assets and Liabilities | |
Underlying Risk Exposure | | Derivative Instrument | | Asset Derivatives | | | Liability Derivatives | |
| | | Location | | Value | | | Location | | Value | |
Interest Rate | | Forward Swaps | | Unrealized appreciation on
forward swaps | | $ | 2,703,185 | | | — | | $ | — | |
The following table presents the amount of change in net unrealized appreciation (depreciation) recognized for the six months ended March 31, 2013, on derivative instruments, as well as the primary risk exposure.
| | | | |
| |
| Change in Net Unrealized Appreciation (Depreciation) of Forward Swaps | | | |
Risk Exposure | | | | |
Interest Rate | | $ | 2,624,904 | |
4. Fund Shares
Transactions in Fund shares were as follows:
| | | | | | | | | | | | | | | | |
| | | Six Months Ended
3/31/13 | | | Year Ended
9/30/12 | |
| | | Shares | | | Amount | | | Shares | | | Amount | |
Shares sold: | | | | | | | | | | | | | | | | |
Class A | | | 8,290,550 | | | $ | 145,993,689 | | | | 8,983,479 | | | $ | 148,264,642 | |
Class C | | | 1,718,524 | | | | 30,188,552 | | | | 3,434,974 | | | | 55,780,214 | |
Class R3 | | | 139,226 | | | | 2,444,902 | | | | 26,168 | | | | 445,717 | |
Class I | | | 18,245,835 | | | | 321,546,306 | | | | 15,781,276 | | | | 254,815,711 | |
Shares issued to shareholders due to reinvestment of distributions: | | | | | | | | | | | | | | | | |
Class A | | | 599,241 | | | | 10,487,000 | | | | 617,396 | | | | 9,817,199 | |
Class C | | | 223,667 | | | | 3,913,652 | | | | 366,271 | | | | 5,792,345 | |
Class R3 | | | 4,893 | | | | 86,240 | | | | 688 | | | | 11,092 | |
Class I | | | 1,099,424 | | | | 19,249,229 | | | | 1,380,307 | | | | 21,927,655 | |
| | | | 30,321,360 | | | | 533,909,570 | | | | 30,590,559 | | | | 496,854,575 | |
Shares redeemed: | | | | | | | | | | | | | | | | |
Class A | | | (2,558,580 | ) | | | (44,860,457 | ) | | | (4,883,368 | ) | | | (76,946,191 | ) |
Class C | | | (1,044,385 | ) | | | (18,396,786 | ) | | | (1,259,176 | ) | | | (20,084,961 | ) |
Class R3 | | | (17,186 | ) | | | (304,755 | ) | | | (5,977 | ) | | | (92,418 | ) |
Class I | | | (5,773,482 | ) | | | (101,158,170 | ) | | | (12,974,003 | ) | | | (207,086,535 | ) |
| | | | (9,393,633 | ) | | | (164,720,168 | ) | | | (19,122,524 | ) | | | (304,210,105 | ) |
Net increase (decrease) | | | 20,927,727 | | | $ | 369,189,402 | | | | 11,468,035 | | | $ | 192,644,470 | |
5. Investment Transactions
Purchases and sales (including maturities but excluding short-term investments and derivative transactions) during the six months ended March 31, 2013, aggregated $539,223,319 and $135,191,937, respectively.
6. Income Tax Information
The following information is presented on an income tax basis. Differences between amounts for financial statement and federal income tax purposes are primarily due to timing differences in recognizing certain gains and losses on investment transactions. To the extent that differences arise that are permanent in nature, such amounts are reclassified within the capital accounts as detailed below. Temporary differences do not require reclassification. Temporary and permanent differences do not impact the net asset values of the Fund.
As of March 31, 2013, the cost and unrealized appreciation (depreciation) of investments (excluding investments in derivatives), as determined on a federal income tax basis, were as follows:
| | | | |
Cost of investments | | $ | 1,228,976,311 | |
Gross unrealized: | | | | |
Appreciation | | $ | 121,057,018 | |
Depreciation | | | (4,528,559 | ) |
Net unrealized appreciation (depreciation) of investments | | $ | 116,528,459 | |
Permanent differences, primarily due to distribution character reclassifications, bond premium amortization adjustments, complex securities tax character adjustments and tax equalization, resulted in reclassifications among the Fund’s components of net assets as of September 30, 2012, the Fund’s last tax year end, as follows:
| | | | |
Capital paid in | | $ | 190,101 | |
Undistributed (Over-distribution of) net investment income | | | (690,547 | ) |
Accumulated net realized gain (loss) | | | 500,446 | |
The tax components of undistributed net ordinary income and net long-term capital gains as of September 30, 2012, the Fund’s last tax year end, were as follows:
| | | | |
Undistributed net ordinary income* | | $ | 4,421,888 | |
Undistributed net long-term capital gains | | | 6,227,031 | |
| * | Undistributed net ordinary income (on a tax basis) has not been reduced for the dividend declared during the period September 1, 2012 through September 30, 2012 and paid on October 1, 2012. Net ordinary income consists of net taxable income derived from dividends, interest, and net short-term capital gains, if any. |
The tax character of distributions paid during the Fund’s last tax year ended September 30, 2012, was designated for purposes of the dividends paid deduction as follows:
| | | | |
Distributions from net ordinary income* | | $ | 46,169,728 | |
Distributions from net long-term capital gains | | | 16,457,325 | |
| * | Net ordinary income consists of net taxable income derived from dividends, interest, and net short-term capital gains, if any. |
Under the Regulated Investment Company Modernization Act of 2010, capital losses incurred by the Fund after December 31, 2010 will not be subject to expiration. During the Fund’s last tax year ended September 30, 2012, there were no post-enactment capital losses generated.
7. Management Fees and Other Transactions with Affiliates
The Fund’s management fee consists of two components – a fund-level fee, based only on the amount of assets within the Fund, and a complex-level fee, based on the aggregate amount of all eligible fund assets managed by the Adviser. This pricing structure enables Fund shareholders to benefit from growth in the assets within the Fund as well as from growth in the amount of complex-wide assets managed by the Adviser.
The annual fund-level fee, payable monthly, is calculated according to the following schedule:
| | | | |
| Average Daily Net Assets | | Fund-Level Fee Rate | |
For the first $125 million | | | .5500 | % |
For the next $125 million | | | .5375 | |
For the next $250 million | | | .5250 | |
For the next $500 million | | | .5125 | |
For the next $1 billion | | | .5000 | |
For net assets over $2 billion | | | .4750 | |
Notes to Financial Statements (Unaudited) (continued)
The annual complex-level fee, payable monthly, is calculated according to the following schedule:
| | | | |
| Complex-Level Asset Breakpoint Level* | | Effective Rate at Breakpoint Level | |
$55 billion | | | .2000 | % |
$56 billion | | | .1996 | |
$57 billion | | | .1989 | |
$60 billion | | | .1961 | |
$63 billion | | | .1931 | |
$66 billion | | | .1900 | |
$71 billion | | | .1851 | |
$76 billion | | | .1806 | |
$80 billion | | | .1773 | |
$91 billion | | | .1691 | |
$125 billion | | | .1599 | |
$200 billion | | | .1505 | |
$250 billion | | | .1469 | |
$300 billion | | | .1445 | |
| * | The complex-level fee is calculated based upon the aggregate daily “eligible assets” of all Nuveen Funds. Eligible assets do not include assets attributable to investments in other Nuveen Funds or assets in excess of $2 billion added to the Nuveen Fund complex in connection with the Adviser’s assumption of the management of the former First American Funds effective January 1, 2011. Eligible assets include closed-end fund assets managed by the Adviser that are attributable to financial leverage. For these purposes, financial leverage includes the closed-end funds’ use of preferred stock and borrowings and certain investments in the residual interest certificates (also called inverse floating rate securities) in tender option bond (TOB) trusts, including the portion of assets held by a TOB trust that has been effectively financed by the trust’s issuance of floating rate securities, subject to an agreement by the Adviser as to certain funds to limit the amount of such assets for determining eligible assets in certain circumstances. As of March 31, 2013, the complex-level fee rate for the Fund was .1668%. |
The management fee compensates the Adviser for the overall investment advisory and administrative services and general office facilities. The Adviser is responsible for the Fund’s overall investment strategy and asset allocation decisions. The Adviser has entered into a sub-advisory agreement with the Sub-Adviser, under which the Sub-Adviser manages the investment portfolio of the Fund. The Sub-Adviser is compensated for its services to the Fund from the management fee paid to the Adviser.
The Adviser has contractually agreed to waive fees and/or reimburse expenses, so that total annual Fund operating expenses (excluding 12b-1 distribution and/or service fees, interest expenses, taxes, acquired fund fees and expenses, fees incurred in acquiring and disposing of portfolio securities, and extraordinary expenses) do not exceed .90% through January 31, 2013 (1.25% after January 31, 2013), of the average daily net assets of any class of Fund shares.
The Adviser may voluntarily reimburse additional expenses from time to time. Voluntary reimbursements may be terminated at any time at the Adviser’s discretion.
The Trust pays no compensation directly to those of its trustees who are affiliated with the Adviser or to its officers, all of whom receive remuneration for their services to the Trust from the Adviser or its affiliates. The Board of Trustees has adopted a deferred compensation plan for independent trustees that enables trustees to elect to defer receipt of all or a portion of the annual compensation they are entitled to receive from certain Nuveen-advised funds. Under the plan, deferred amounts are treated as though equal dollar amounts had been invested in shares of select Nuveen-advised funds.
During the six months ended March 31, 2013, Nuveen Securities, LLC (the “Distributor”), a wholly-owned subsidiary of Nuveen, collected sales charges on purchases of Class A Shares, the majority of which were paid out as concessions to financial intermediaries as follows:
| | | | |
Sales charges collected | | $ | 1,022,056 | |
Paid to financial intermediaries | | | 910,643 | |
The Distributor also received 12b-1 service fees on Class A Shares, substantially all of which were paid to compensate financial intermediaries for providing services to shareholders relating to their investments.
During the six months ended March 31, 2013, the Distributor compensated financial intermediaries directly with commission advances at the time of purchase as follows:
| | | | |
Commission advances | | $ | 324,347 | |
To compensate for commissions advanced to financial intermediaries, all 12b-1 service and distribution fees collected on Class C Shares during the first year following a purchase are retained by the Distributor. During the six months ended March 31, 2013, the Distributor retained such 12b-1 fees as follows:
| | | | |
12b-1 fees retained | | $ | 289,753 | |
The remaining 12b-1 fees charged to the Fund were paid to compensate financial intermediaries for providing services to shareholders relating to their investments.
The Distributor also collected and retained $26,553 CDSC on share redemptions during the six months ended March 31, 2013.
8. New Accounting Pronouncements
Financial Accounting Standards Board (“FASB”) Balance Sheet (Topic 210): Disclosures about Offsetting Assets and Liabilities
In January 2013, Accounting Standards Update (“ASU”) 2013-01, Clarifying the Scope of Disclosures about Offsetting Assets and Liabilities, replaced ASU 2011-11, Disclosures about Offsetting Assets and Liabilities. ASU 2013-01 is effective for fiscal years beginning on or after January 1, 2013. ASU 2011-11 was intended to enhance disclosure requirements on the offsetting of financial assets and liabilities. ASU 2013-01 limits the scope of the new balance sheet offsetting disclosures to derivatives, repurchase agreements and securities lending transactions to the extent that they are (1) offset in the financial statements or (2) subject to an enforceable master netting arrangement or similar agreement. Management is currently evaluating the application of ASU 2013-01 and its impact to the financial statements and footnote disclosures, if any.
Notes
Notes
Glossary of Terms Used in this Report
Average Annual Total Return: This is a commonly used method to express an investment’s performance over a particular, usually multi-year time period. It expresses the return that would have been necessary each year to equal the investment’s actual cumulative performance (including change in NAV or offer price and reinvested dividends and capital gains distributions, if any) over the time period being considered.
BofA Merrill Lynch Fixed Rate Preferred Securities Index: An index that tracks the performance of fixed rate U.S. dollar denominated preferred securities issued in the U.S. domestic market. Qualifying securities must be rated investment grade (based on an average of Moody’s, S&P, and Fitch) and must have an investment grade rated country of risk (based on an average of Moody’s, S&P, and Fitch foreign currency long-term sovereign debt ratings). In addition, qualifying securities must be issued as public securities or through a 144a filing, must be issued in $25, $50, or $100 par/liquidation preference increments, must have a fixed coupon or distribution schedule, and must have a minimum amount outstanding of $100 million. Index returns assume reinvestment of distributions, but do not reflect any applicable sales charges or management fees.
BofA Merrill Lynch Preferred Stock Hybrid Securities Index: An unmanaged index consisting of a set of investment grade exchange-traded preferred stocks with outstanding market values of at least $50 million that are covered by BofA Merrill Lynch Fixed Income Research. The index includes certain publicly issued, $25- and $1,000-par securities with at least one year to maturity. Index returns assume reinvestment of distributions, but do not reflect any applicable sales charges or management fees.
Custom Benchmark Index: An index that is comprised of a 65% weighting in the BofA Merrill Lynch Fixed Rate Preferred Securities Index and a 35% weighting in the Barclays USD Capital Securities Index. The BofA Merrill Lynch Fixed Rate Preferred Securities Index is an unmanaged index consisting of a set of investment grade exchange traded preferred stocks with outstanding market values of at least $50 million that are covered by BofA Merrill Lynch Fixed Income Research. The index includes certain publicly issued, $25- and $1,000-par securities with at least one year to maturity. The Barclays USD Capital Securities Index contains securities generally viewed as hybrid fixed income securities that either receive regulatory capital treatment or a degree of “equity credit” from the rating agencies. This generally includes Tier 2/Lower Tier 2 bonds, perpetual step-up debt, step-up preferred securities, and term preferred securities. Index returns assume reinvestment of distributions, but do not reflect any applicable sales charges or management fees.
Duration: Duration is a measure of the expected period over which a bond’s principal and interest will be paid, and consequently is a measure of the sensitivity of a bond’s (or bond Fund’s) value to changes when market interest rates change. Generally, the longer a bond or Fund’s duration, the more the price of the bond or Fund will change as interest rates change.
Forward Interest Rate Swap: A contractual agreement between two counterparties under which one party agrees to make periodic payments to the other for an agreed period of time based on a fixed rate, while the other party agrees to make periodic payments based on a floating rate of interest based on an underlying index. Alternatively, both series of cash flows to be exchanged could be calculated using floating rates of interest but floating rates that are based upon different underlying indexes.
Gross Domestic Product (GDP): The total market value of all final goods and services produced in a country/region in a given year, equal to total consumer, investment and government spending, plus the value of exports, minus the value of imports.
Hybrid Security: A hybrid security combines two or more different financial instruments. A hybrid security generally combines both debt and equity characteristics.
Lipper Flexible Income Funds Classification Average: Represents the average annualized total return for all reporting funds in the Lipper Flexible Income Funds Classification. Lipper returns account for the effects of management fees and assume reinvestment of distributions, but do not reflect any applicable sales charges.
Net Asset Value (NAV): The net market value of all securities held in a portfolio.
Net Asset Value (NAV) Per Share: The market value of one share of a mutual fund or closed-end fund. For a Fund, the NAV is calculated daily by taking the Fund’s total assets (securities, cash, and accrued earnings), subtracting the Fund’s liabilities, and dividing by the number of shares outstanding.
Tax Equalization: The practice of treating a portion of the distribution made to a redeeming shareholder, which represents his proportionate part of undistributed net investment income and capital gain as a distribution for tax purposes. Such amounts are referred to as the equalization debits (or payments) and will be considered a distribution to the shareholder of net investment income and capital gain for calculation of the Fund’s dividends paid deduction.
Additional Fund Information
Fund Manager
Nuveen Fund Advisors, LLC
333 West Wacker Drive
Chicago, IL 60606
Sub-Adviser
Nuveen Asset Management, LLC
333 West Wacker Drive
Chicago, IL 60606
Legal Counsel
Chapman and Cutler LLP
Chicago, IL
Independent Registered
Public Accounting Firm
Ernst & Young LLP
Chicago, IL
Custodian
State Street Bank & Trust Company
Boston, MA
Transfer Agent and
Shareholder Services
Boston Financial
Data Services, Inc.
Nuveen Investor Services
P.O. Box 8530
Boston, MA 02266-8530
(800) 257-8787
Quarterly Form N-Q Portfolio of Investments Information: Each Fund is required to file its complete schedule of portfolio holdings with the Securities and Exchange Commission (SEC) for the first and third quarters of each fiscal year on Form N-Q. You may obtain this information directly from the SEC. Visit the SEC on-line at http://www.sec.gov or in person at the SEC’s Public Reference Room in Washington, D.C. Call the SEC toll-free at (800) SEC -0330 for room hours and operation.
Nuveen Funds’ Proxy Voting Information: You may obtain (i) information regarding how each Fund voted proxies relating to portfolio securities held during the most recent twelve-month period ended June 30, and (ii) a description of the policies and procedures that each Fund used to determine how to vote proxies relating to portfolio securities without charge, upon request, by calling Nuveen Investments toll-free at (800) 257-8787 or on Nuveen’s website at www.nuveen.com. You may also obtain this information directly from the SEC. Visit the SEC on-line at http://www.sec.gov.
The Financial Industry Regulatory Authority (FINRA) provides a Public Disclosure Program which supplies certain information regarding the disciplinary history of FINRA members and their associated persons in response to either telephone inquiries at (800) 289-9999 or written inquiries at www.finra.org. FINRA also provides an investor brochure that includes information describing the Public Disclosure Program.
Nuveen Investments:
Serving Investors for Generations
Since 1898, financial advisors and their clients have relied on Nuveen Investments to provide dependable investment solutions through continued adherence to proven, long-term investing principles. Today, we offer a range of high quality equity and fixed-income solutions designed to be integral components of a well-diversified core portfolio.
Focused on meeting investor needs.
Nuveen Investments provides high-quality investment services designed to help secure the longterm goals of institutional and individual investors as well as the consultants and financial advisors who serve them. Nuveen Investments markets a wide range of specialized investment solutions which provide investors access to capabilities of its high-quality boutique investment affiliates–Nuveen Asset Management, Symphony Asset Management, NWQ Investment Management Company, Santa Barbara Asset Management, Tradewinds Global Investors, Winslow Capital Management, and Gresham Investment Management. In total, Nuveen Investments managed $224 billion as of March 31, 2013.
Find out how we can help you.
To learn more about how the products and services of Nuveen Investments may be able to help you meet your financial goals, talk to your financial advisor, or call us at (800) 257-8787. Please read the information provided carefully before you invest. Investors should consider the investment objective and policies, risk considerations, charges and expenses of any investment carefully. Where applicable, be sure to obtain a prospectus, which contains this and other relevant information. To obtain a prospectus, please contact your securities representative or Nuveen Investments, 333 W. Wacker Dr., Chicago, IL 60606. Please read the prospectus carefully before you invest or send money.
Learn more about Nuveen Funds at: www.nuveen.com/mf
| | |
Distributed by Nuveen Securities, LLC 333 West Wacker Drive Chicago, IL 60606 www.nuveen.com | | |
MSA-INV5-0313P

Mutual Funds
Nuveen Taxable Fixed Income Funds
For investors seeking a high level of current income and capital appreciation.
Semi-Annual Report
March 31, 2013
| | | | | | |
| | | Share Class / Ticker Symbol |
| | | |
| | | Class A | | Class C | | Class I |
Nuveen NWQ Flexible Income Fund | | NWQAX | | NWQCX | | NWQIX |
LIFE IS COMPLEX.
Nuveen makes things e-simple.
It only takes a minute to sign up for e-Reports. Once enrolled, you’ll receive an e-mail as soon as your Nuveen Fund information is ready. No more waiting for delivery by regular mail. Just click on the link within the e-mail to see the report and save it on your computer if you wish.
Free e-Reports right to your e-mail!
www.investordelivery.com
If you receive your Nuveen Fund distributions and statements from your financial advisor or brokerage account.
OR
www.nuveen.com/accountaccess
If you receive your Nuveen Fund distributions and statements directly from Nuveen.
| | | | | | |
| Must be preceded by or accompanied by a prospectus. | | NOT FDIC INSURED | | MAY LOSE VALUE | | NO BANK GUARANTEE |
Table of Contents
Chairman’s
Letter to Shareholders

Dear Shareholders,
The global economy continues to struggle with low growth rates. The European Central Bank’s commitment to “do what it takes” to support sovereign debt markets has stabilized the broader euro area financial markets. The larger member states of the European Union (EU) are working diligently on a tighter financial and banking union and meaningful progress is being made. However, economic conditions in the southern tier members are not improving and their political leaders are becoming more forceful in their demands for loosening the current EU fiscal targets and timetables. Economic growth in emerging market countries continues to be buffeted by lower overseas demand for their manufactured products and raw materials.
In the U.S., the Fed’s commitment to low interest rates through Quantitative Easing is the subject of increasing debate in its policy making deliberations and many independent economists are expressing concern about the economic distortions resulting from negative real interest rates. There are encouraging signs in Congress that both political parties are working toward compromises on previously irreconcilable issues such as reforming immigration laws and the tax code. It is too early to tell whether those efforts will produce meaningful results or pave the way for cooperation on the major fiscal issues that loom ahead. Over the longer term, there are some positive trends for the U.S. economy: house prices are clearly recovering, banks and corporations continue to strengthen their financial positions and incentives for capital investment in the U.S. by domestic and foreign corporations are increasing due to more competitive energy and labor costs.
During the last eighteen months, U.S. investors have benefited from strong returns in the domestic equity markets and steady total returns in many fixed income markets. However, many macroeconomic risks remain unresolved, including negotiating through the many U.S. fiscal issues, achieving a better balance between fiscal discipline and encouraging economic growth in the euro area and reducing the potential economic impact of geopolitical issues, particularly in the Middle East and East Asia. In the face of these uncertainties, the experienced investment professionals at Nuveen Investments seek out investments that are enjoying positive and sustainable returns. At the same time they are always on the alert for risks in markets that are subject to the excessive optimism that can accompany an extended period of abnormally low interest rates. Monitoring this process is a critical function for the Fund Board as it oversees your Nuveen Fund on your behalf.
As always, I encourage you to communicate with your financial consultant if you have any questions about your investment in a Nuveen Fund. On behalf of the other members of your Fund Board, we look forward to continuing to earn your trust in the months and years ahead.
Sincerely,

Robert P. Bremner
Chairman of the Board
May 24, 2013
Portfolio Managers’ Comments
Certain statements in this report are forward-looking statements. Discussions of specific investments are for illustration only and are not intended as recommendations of individual investments. The forward-looking statements and other views expressed herein are those of the portfolio managers as of the date of this report. Actual future results or occurrences may differ significantly from those anticipated in any forward-looking statements and the views expressed herein are subject to change at any time, due to numerous market and other factors. The Fund disclaims any obligation to update publicly or revise any forward-looking statements or views expressed herein.
Ratings shown are the highest rating given by one of the following national rating agencies: Standard & Poor’s, Moody’s Investors Service, Inc. or Fitch, Inc. Credit ratings are subject to change. AAA, AA, A, and BBB are investment grade ratings; BB, B, CCC, CC, C and D are below-investment grade ratings. Certain bonds backed by U.S. Government or agency securities are regarded as having an implied rating equal to the rating of such securities. Holdings designated N/R are not rated by these national rating agencies.
The Nuveen NWQ Flexible Income Fund features management by NWQ Investment Management Company, LLC, an affiliate of Nuveen Investments. Michael J. Carne, CFA, and Kevin A. Hunter manage the NWQ Flexible Income Fund. Here Mr. Carne, Lead Portfolio Manager discusses the Fund’s performance and its investment strategy for the six-month reporting period ended March 31, 2013.
How did the Fund perform during the six-month reporting period ending March 31, 2013?
The table in the Fund Performance and Expense Ratios section of this report provides total return performance information for the Fund’s Class A Shares at net asset value (NAV) for the six-month, one-year and since inception periods ended March 31, 2013. Over the six-month period ended March 31, 2013, the Fund outperformed the BofA Merrill Lynch Fixed Rate Preferred Securities Index, the Morningstar Conservative Target Risk Index and the Lipper classification average. A more detailed discussion of the Fund’s relative performance is provided later in this report.
What was the primary investment strategy for the Fund and how did this strategy affect the Fund’s performance for the six-month reporting period ended March 31, 2013?
Our investment strategy is both bottom-up and fundamentally driven. Security selection incorporates elements of both fixed-income and equity analysis. We utilize NWQ’s equity research team to identify companies we like that seem to offer good downside protection, an attractive valuation and an improving outlook (catalyst). We also use option-adjusted spread analysis and review a potential investment’s total return characteristics versus a set of market scenarios, such as higher/lower rates or wider/tighter spreads. We believe this forward-looking approach helps us to avoid sectors and companies that have deteriorating fundamentals.
Once a company has been identified with suitable investment characteristics, we then engage in the work of deciding the best investment choices. While we primarily make investments in preferred securities, we also have the latitude to invest in other types of income securities such as senior debt and even equities. We look at the specific characteristics of the fixed-income securities available for investment and evaluate the effect on the Fund of holding such an investment. These characteristics might include price, yield, issuer, location in the capital structure, rating, liquidity premium/discount and any other potential issues that can affect the value of the position. Additionally, because the preferred market is very concentrated both by issuer and industry, we pay particular attention to the diversification of the Fund.
During the reporting period, several factors contributed to our outperformance, including our equity, industrial and financial holdings. While our exchange-traded fund holding in REM — iShares FTSE NAREIT Mortgage Plus Capped Index Fund contributed to the Fund’s sector category being the poorest performing sector, all other sectors contributed positively to performance. We sold out of this position during the reporting period.
On an individual basis, our top performing securities for the period included Wells Fargo 7.5% Series L convertible preferred stock, Citigroup Inc. and General Motors Company common stocks. Having doubled in size with its 2008 purchase of Wachovia, Wells Fargo is now one of the four largest banks in the U.S., along with Citigroup, Bank of America and J.P. Morgan Chase. Wells Fargo stands out from its peers not only due to its long history of superb management, but also because of its relatively simple business model. We believe the convertible preferred still offers favorable risk adjusted return potential.
Citigroup Inc.’s share price appreciated due to attractive valuation and improving fundamentals. The company appointed Michael Corbat as its new CEO in late 2012. Corbat’s plan to cut costs by $1.1 billion starting in 2014 was well received by investors. We believe that negative attitudes towards the financial sector have peaked and are likely to improve given strong equity capital ratios and loss reserves built since the credit crisis in 2008. We sold this security during the period.
General Motors Company appreciated as the government reduced its stake in the company, removing a significant overhang on the stock. In December, 2012, the U.S. Treasury sold 200 million shares back to the company and gave indications that it will liquidate its remaining 19% stake in an orderly fashion over the next 12-15 months.
Those positions that detracted from performance included Annaly Capital Management Inc. common stock. Annaly Capital Management is a real estate investment trust, which owns and manages assets and funds on behalf of institutional and individual investors worldwide. The company manages a portfolio of mortgage-backed securities, including mortgage pass through certificates, collaterized mortgage obligations and other securities. Annaly’s stock was hard hit due to the uncertainty of the company’s dividend policy given increased margin compression.
Also detracting from performance was Royal Dutch Shell. Shell, through subsidiaries, explores for, produces and refines petroleum. The company produces fuels, chemicals and lubricants. Shell owns and operates gasoline filling stations worldwide. Shell’s stock suffered mainly due to its weak downstream business and setbacks in its Alaska drilling program.
Lastly, Cisco Systems, Inc. detracted from performance. The company faced increased competition from companies such as Juniper and Alcatel-Lucent, coupled with deteriorating gross margins. These factors pressured the stock during the period and we have sold our position in Cisco Systems during the reporting period.
Also during the reporting period, the Fund wrote covered call options on individual stocks to enhance returns while forgoing some upside potential. Overall these covered call options made a modest positive contribution to performance in the period. The options were terminated prior to the close of the reporting period.
Risk Considerations
Mutual fund investing involves risk; principal loss is possible. Debt and fixed income securities such as those held by the Fund, are subject to market risk, credit risk, interest rate risk, call risk and income risk. As interest rates rise, bond prices fall. Below investment grade or high yield debt securities are subject to liquidity risk and heightened credit risk. Preferred securities are subordinate to bonds and other debt instruments in a company’s capital structure and therefore are subject to greater credit risk. Foreign investments involve additional risks, including currency fluctuation, political and economic instability, lack of liquidity and differing legal and accounting standards. Asset-backed and mortgage-backed securities are subject to additional risks such as prepayment risk, liquidity risk and adverse economic developments. Concentration in the financial services sector may involve greater exposure to adverse economic or regulatory occurrences. Equity investments such as those held by the Fund, are subject to market risk, common stock risk, covered call risk, short sale risk and derivatives risk.
[THIS PAGE INTENTIONALLY LEFT BLANK]
Fund Performance and Expense Ratios
The Fund Performance and Expense Ratios for the Fund is shown on the following page.
Returns quoted represent past performance, which is no guarantee of future results. Current performance may be higher or lower than the performance shown. Investment returns and principal value will fluctuate so that when shares are redeemed, they may be worth more or less than their original cost. Returns without sales charges would be lower if the sales charge were included. Returns do not reflect the deduction of taxes that a shareholder would pay on Fund distributions or the redemption of Fund shares.
Returns may reflect a contractual agreement between the Fund and the investment adviser to waive certain fees and expenses; see Notes to Financial Statements, Footnote 7 — Management Fees and Other Transactions with Affiliates for more information. In addition, returns may reflect a voluntary expense limitation by the Fund’s investment adviser that may be modified or discontinued at any time without notice. For the most recent month-end performance visit www.nuveen.com or call (800) 257-8787.
Returns reflect differences in sales charges and expenses, which are primarily differences in distribution and service fees. Fund returns assume reinvestment of dividends and capital gains.
Comparative index and Lipper return information is provided for the Fund’s Class A Shares at net asset value (NAV) only.
The expense ratios shown reflect the Fund’s total operating expenses (before fee waivers and/or expense reimbursements, if any) as shown in the Fund’s most recent prospectus. The expense ratios include management fees and other fees and expenses.
Fund Performance and Expense Ratios (continued)
Refer to the first page of this Fund Performance and Expense Ratios section for further explanation of the information included within this page.
Fund Performance
Average Annual Total Returns as of March 31, 2013
| | | | | | | | | | | | |
| | |
| | | Cumulative | | | Average Annual | |
| | | |
| | | 6-Month | | | 1-Year | | | Since
Inception* | |
Class A Shares at NAV | | | 5.55% | | | | 12.43% | | | | 13.80% | |
Class A Shares at maximum Offering Price | | | 0.54% | | | | 7.09% | | | | 12.14% | |
BofA Merrill Lynch Fixed Rate Preferred Securities Index** | | | 3.52% | | | | 9.39% | | | | 10.87% | |
Morningstar Conservative Target Risk Index** | | | 4.31% | | | | 7.48% | | | | 7.62% | |
Lipper Flexible Income Funds Classification Average** | | | 4.59% | | | | 10.77% | | | | 10.82% | |
| | | |
Class C Shares | | | 5.17% | | | | 11.62% | | | | 12.96% | |
Class I Shares | | | 5.74% | | | | 12.76% | | | | 14.09% | |
Class A Shares have a maximum 4.75% sales charge (Offering Price). Class A Share purchases of $1 million or more are sold at net asset value without an up-front sales charge but may be subject to a contingent deferred sales charge (CDSC), also known as a back-end sales charge, if redeemed within eighteen months of purchase. Class C Shares have a 1% CDSC for redemptions within less than twelve months, which is not reflected in the one-year total return. Class I Shares have no sales charge and may be purchased under limited circumstances or by specified classes of investors.
Expense Ratios as of Most Recent Prospectus
| | | | | | | | |
| | |
| | | Gross
Expense
Ratios | | | Net
Expense
Ratios | |
Class A Shares | �� | | 4.51% | | | | 0.97% | |
Class C Shares | | | 5.26% | | | | 1.72% | |
Class I Shares | | | 3.58% | | | | 0.72% | |
The Fund’s investment adviser has agreed to waive fees and/or reimburse expenses through January 31, 2014, so that total annual Fund operating expenses (excluding 12b-1 distribution and/or service fees, interest expenses, taxes, acquired fund fees and expenses, fees incurred in acquiring and disposing of portfolio securities and extraordinary expenses) do not exceed 0.75% (1.25% after January 31, 2014) of the average daily net assets of any class of Fund shares. The expense limitation expiring January 31, 2014, may be terminated or modified prior to that date only with the approval of the Board of Trustees of the Fund. The expense limitation in effect thereafter may be terminated or modified only with the approval of shareholders of the Fund.
| * | Since inception returns are from 12/9/09. |
| ** | Refer to the Glossary of Terms Used in this Report for definitions. Indexes and Lipper averages are not available for direct investment. |
Yields as of March 31, 2013
Dividend Yield is the most recent dividend per share (annualized) divided by the offering price per share.
The SEC 30-Day Yield is a standardized measure of the Fund’s yield that accounts for the future amortization of premiums or discounts of bonds held in the Fund’s portfolio. The SEC 30-Day Yield is computed under an SEC standardized formula and is based on the maximum offer price per share. Dividend Yield may differ from the SEC 30-Day Yield because the Fund may be paying out more or less than it is earning and it may not include the effect of amortization of bond premium.
| | | | | | | | |
| | |
| | | Dividend
Yield | | | SEC 30-Day
Yield | |
Class A Shares1 | | | 5.21% | | | | 2.62% | |
Class C Shares | | | 4.72% | | | | 2.01% | |
Class I Shares | | | 5.73% | | | | 3.02% | |
| 1 | The SEC Yield for Class A shares quoted in the table reflects the maximum sales load. Investors paying a reduced load because of volume discounts, investors paying no load because they qualify for one of the several exclusions from the load, and existing shareholders who previously paid a load but would like to know the SEC Yield applicable to their shares on a going-forward basis, should understand that the SEC Yield effectively applicable to them would be higher than the figure quoted in the table. |
Holding Summaries as of March 31, 2013
This data relates to the securities held in the Fund’s portfolio of investments. It should not be construed as a measure of performance for the Fund itself.
Ratings shown are the highest rating given by one of the following national rating agencies: Standard & Poor’s Group, Moody’s Investors Service, Inc. or Fitch, Inc. Credit ratings are subject to change. AAA, AA, A, and BBB are investment grade ratings; BB, B, CCC, CC, C and D are below-investment grade ratings. Certain bonds backed by U.S. Government or agency securities are regarded as having an implied rating equal to the rating of such securities. Holdings designated N/R are not rated by these national rating agencies.
Portfolio Allocation1
| | | | |
| $25 Par (or similar) Retail Structures | | | 79.5% | |
| Short-Term Investments | | | 12.8% | |
| Common Stocks | | | 3.6% | |
| Corporate Bonds | | | 4.1% | |
| $1,000 Par (or similar) Institutional Structures | | | 3.4% | |
| Preferred Stocks | | | 2.3% | |
Convertible Preferred Securities | | | 1.6% | |
Other2 | | | (7.3)% | |
| | | | |
| Portfolio Composition1 | | | |
| Real Estate Investment Trust | | | 31.0% | |
| Insurance | | | 15.3% | |
| Capital Markets | | | 12.6% | |
| Commercial Banks | | | 11.2% | |
| Diversified Financial Services | | | 8.4% | |
| Consumer Finance | | | 3.1% | |
| Short-Term Investments | | | 12.8% | |
| Other3 | | | 5.6% | |
| 1 | As a percentage of net assets. Holdings are subject to change. |
| 2 | Other Assets Less Liabilities. |
| 3 | Includes Other Assets Less Liabilities and all industries less than 3.1% of net assets. |
Expense Examples
As a shareholder of the Fund, you incur two types of costs: (1) transaction costs, including up-front and back-end sales charges (loads) or redemption fees, where applicable; and (2) ongoing costs, including management fees; distribution and service (12b-1) fees, where applicable; and other Fund expenses. This Example is intended to help you understand your ongoing costs (in dollars) of investing in the Fund and to compare these costs with the ongoing costs of investing in other mutual funds.
The Example below is based on an investment of $1,000 invested at the beginning of the period and held through the end of the period.
The information under “Actual Performance,” together with the amount you invested, allows you to estimate actual expenses incurred over the reporting period. Simply divide your account value by $1,000 (for example, an $8,600 account value divided by $1,000 = 8.60) and multiply the result by the cost shown for your share class, in the row entitled “Expenses Incurred During Period” to estimate the expenses incurred on your account during this period.
The information under “Hypothetical Performance,” provides information about hypothetical account values and hypothetical expenses based on the Fund’s actual expense ratio and an assumed rate of return of 5% per year before expenses, which is not the Fund’s actual return. The hypothetical account values and expenses may not be used to estimate the actual ending account balance or expense you incurred for the period. You may use this information to compare the ongoing costs of investing in the Fund and other funds. To do so, compare this 5% hypothetical example with the 5% hypothetical examples that appear in the shareholder reports of the other funds.
Please note that the expenses shown in the table are meant to highlight your ongoing costs only and do not reflect any transaction costs. Therefore, the hypothetical information is useful in comparing ongoing costs only, and will not help you determine the relative total costs of owning different funds or share classes. In addition, if these transaction costs were included, your costs would have been higher.
| | | | | | | | | | | | | | | | | | | | | | | | |
| | | | | | | | | | | | Hypothetical Performance | |
| | | Actual Performance | | | (5% annualized return before expenses) | |
| | | A Shares | | | C Shares | | | I Shares | | | A Shares | | | C Shares | | | I Shares | |
| Beginning Account Value (10/01/12) | | $ | 1,000.00 | | | $ | 1,000.00 | | | $ | 1,000.00 | | | $ | 1,000.00 | | | $ | 1,000.00 | | | $ | 1,000.00 | |
| Ending Account Value (3/31/13) | | $ | 1,055.50 | | | $ | 1,051.70 | | | $ | 1,057.40 | | | $ | 1,020.09 | | | $ | 1,016.36 | | | $ | 1,021.34 | |
| Expenses Incurred During Period | | $ | 4.97 | | | $ | 8.80 | | | $ | 3.69 | | | $ | 4.89 | | | $ | 8.65 | | | $ | 3.63 | |
For each class of the Fund, expenses are equal to the Fund’s annualized net expense ratio of .97%, 1.72% and .72% for Classes A, C and I, respectively, multiplied by the average account value over the period, multiplied by 182/365 (to reflect the one-half year period).
Portfolio of Investments (Unaudited)
Nuveen NWQ Flexible Income Fund
March 31, 2013
| | | | | | | | | | | | | | | | | | |
| Shares | | | Description (1) | | | | | | | | | | Value | |
| | | | | | | | | | | | | | | | | | |
| | | | COMMON STOCKS – 3.6% | | | | | | | | | | | | | | |
| | | | | |
| | | | Capital Markets – 1.6% | | | | | | | | | | | | | | |
| | | | | |
| | 1,200 | | | Apollo Investment Corporation | | | | | | | | | | | | $ | 10,032 | |
| | | | | |
| | 4,500 | | | Ares Capital Corporation | | | | | | | | | | | | | 81,450 | |
| | | | | |
| | 1,343 | | | Medley Capital Corporation | | | | | | | | | | | | | 21,287 | |
| | | | | |
| | 2,100 | | | TCP Capital Corporation | | | | | | | | | | | | | 33,516 | |
| | | | Total Capital Markets | | | | | | | | | | | | | 146,285 | |
| | | | Insurance – 0.2% | | | | | | | | | | | | | | |
| | | | | |
| | 400 | | | American International Group, (2) | | | | | | | | | | | | | 15,528 | |
| | | | Oil, Gas & Consumable Fuels – 0.9% | | | | | | | | | | | | | | |
| | | | | |
| | 1,300 | | | Royal Dutch Shell PLC, Class A | | | | | | | | | | | | | 84,708 | |
| | | | Real Estate Investment Trust – 0.9% | | | | | | | | | | | | | | |
| | | | | |
| | 3,300 | | | PennyMac Mortgage Investment Trust | | | | | | | | | | | | | 85,436 | |
| | | | Total Common Stocks (cost $326,171) | | | | | | | | | | | | | 331,957 | |
| | | | | |
| Shares | | | Description (1) | | Coupon | | | | | | | | Value | |
| | | | PREFERRED STOCKS – 2.3% | | | | | | | | | | | | | | |
| | | | | |
| | | | Real Estate Investment Trust – 2.3% | | | | | | | | | | | | | | |
| | | | | |
| | 2,500 | | | CapLease, Incorporated | | | 7.250% | | | | | | | | | $ | 65,675 | |
| | | | | |
| | 3,000 | | | Hospitality Properties Trust | | | 7.125% | | | | | | | | | | 80,670 | |
| | | | | |
| | 2,250 | | | Penn Real Estate Investment Trust | | | 7.375% | | | | | | | | | | 57,803 | |
| | | | Total Preferred Stocks (cost $200,295) | | | | | | | | | | | | | 204,148 | |
| | | | | |
| Shares | | | Description (1) | | Coupon | | | | | Ratings (3) | | | Value | |
| | | | CONVERTIBLE PREFERRED SECURITIES – 1.6% | | | | | | | | | | | | | | |
| | | | | |
| | | | Real Estate Investment Trust – 0.8% | | | | | | | | | | | | | | |
| | | | | |
| | 3,000 | | | CommonWealth REIT | | | 6.500% | | | | | | Ba1 | | | $ | 71,790 | |
| | | | Thrifts & Mortgage Finance – 0.8% | | | | | | | | | | | | | | |
| | | | | |
| | 1,470 | | | New York Community Capital Trust V | | | 6.000% | | | | | | Baa3 | | | | 71,368 | |
| | | | Total Convertible Preferred Securities (cost $143,055) | | | | | | | | | | | | | 143,158 | |
| | | | | |
| Shares | | | Description (1) | | Coupon | | | | | Ratings (3) | | | Value | |
| | | | $25 PAR (OR SIMILAR) RETAIL STRUCTURES – 79.5% | | | | | | | | | | | | | | |
| | | | | |
| | | | Capital Markets – 10.7% | | | | | | | | | | | | | | |
| | | | | |
| | 2,500 | | | Allied Capital Corporation | | | 6.875% | | | | | | BBB | | | $ | 63,025 | |
| | | | | |
| | 5,000 | | | Apollo Investment Corporation | | | 6.625% | | | | | | BBB | | | | 124,100 | |
| | | | | |
| | 4,000 | | | Fifth Street Finance Corporation | | | 5.875% | | | | | | BBB– | | | | 99,840 | |
| | | | | |
| | 200 | | | Gladstone Investment Corporation | | | 7.125% | | | | | | N/R | | | | 5,316 | |
| | | | | |
| | 2,000 | | | Goldman Sachs Group Inc., Series 2004-4 (CORTS) | | | 6.000% | | | | | | Baa3 | | | | 49,560 | |
| | | | | |
| | 2,500 | | | Goldman Sachs Group Inc., Series GSC-3 (PPLUS) | | | 6.000% | | | | | | Baa3 | | | | 62,150 | |
| | | | | |
| | 1,750 | | | Goldman Sachs Group Inc. | | | 5.950% | | | | | | BB+ | | | | 44,275 | |
| | | | | |
| | 4,000 | | | Hercules Technology Growth Capital Incorporated | | | 7.000% | | | | | | N/R | | | | 103,800 | |
| | | | | |
| | 1,500 | | | Hercules Technology Growth Capital Incorporated | | | 7.000% | | | | | | N/A | | | | 39,015 | |
| | | | | |
| | 100 | | | Horizon Technology Finance Corporation | | | 7.375% | | | | | | N/A | | | | 2,585 | |
| | | | | |
| | 275 | | | Medley Capital Corporation | | | 6.125% | | | | | | N/R | | | | 6,908 | |
| | | | | |
| | 300 | | | Medley Capital Corporation | | | 7.125% | | | | | | N/A | | | | 7,905 | |
| | | | | |
| | 2,175 | | | Morgan Stanley, Series 2006A | | | 4.000% | | | | | | BB+ | | | | 50,025 | |
| | | | | |
| | 4,000 | | | MVC Capital Incorporated | | | 7.250% | | | | | | N/A | | | | 101,240 | |
| | | | | |
| | 4,500 | | | Solar Capital Limited | | | 6.750% | | | | | | BBB– | | | | 111,600 | |
| | | | | |
| | 3,500 | | | Triangle Capital Corporation | | | 6.375% | | | | | | N/A | | | | 89,600 | |
| | | | Total Capital Markets | | | | | | | | | | | | | 960,944 | |
| | | | | | | | | | | | | | | | | | |
| Shares | | | Description (1) | | Coupon | | | | | Ratings (3) | | | Value | |
| | | | | | | | | | | | | | | | | | |
| | | | Commercial Banks – 10.9% | | | | | | | | | | | | | | |
| | | | | |
| | 900 | | | Associated Banc-Corp. | | | 8.000% | | | | | | BB+ | | | $ | 25,857 | |
| | | | | |
| | 1,800 | | | BB&T Corporation | | | 5.625% | | | | | | BBB | | | | 45,972 | |
| | | | | |
| | 250 | | | Cobank Agricultural Credit Bank, (4) | | | 6.250% | | | | | | A– | | | | 26,570 | |
| | | | | |
| | 2,500 | | | First Horizon National Corporation | | | 6.200% | | | | | | BB | | | | 62,375 | |
| | | | | |
| | 1,475 | | | First Niagara Finance Group | | | 8.625% | | | | | | BB+ | | | | 43,336 | |
| | | | | |
| | 800 | | | First Republic Bank of San Francisco | | | 6.200% | | | | | | BBB | | | | 21,624 | |
| | | | | |
| | 1,250 | | | GMAC LLC | | | 7.300% | | | | | | BB– | | | | 31,875 | |
| | | | | |
| | 3,200 | | | HSBC Holdings PLC | | | 8.000% | | | | | | BBB+ | | | | 89,920 | |
| | | | | |
| | 2,000 | | | PNC Financial Services | | | 6.125% | | | | | | BBB | | | | 55,340 | |
| | | | | |
| | 3,500 | | | Private Bancorp Incorporated | | | 7.125% | | | | | | N/A | | | | 93,975 | |
| | | | | |
| | 2,500 | | | Regions Financial Corporation | | | 6.375% | | | | | | BB | | | | 63,825 | |
| | | | | |
| | 1,000 | | | TCF Financial Corporation | | | 7.500% | | | | | | BB | | | | 27,010 | |
| | | | | |
| | 2,500 | | | TCF Financial Corporation | | | 6.450% | | | | | | BB | | | | 62,700 | |
| | | | | |
| | 4,000 | | | Texas Capital Bancshares Inc. | | | 6.500% | | | | | | BB | | | | 99,120 | |
| | | | | |
| | 2,000 | | | U.S. Bancorp. | | | 6.500% | | | | | | BBB+ | | | | 59,720 | |
| | | | | |
| | 1,375 | | | Webster Financial Corporation | | | 6.400% | | | | | | Ba1 | | | | 34,911 | |
| | | | | |
| | 2,775 | | | Zions Bancorporation | | | 9.500% | | | | | | BB | | | | 71,734 | |
| | | | | |
| | 880 | | | Zions Bancorporation | | | 7.900% | | | | | | BB | | | | 24,983 | |
| | | | | |
| | 1,750 | | | Zions Bancorporation | | | 6.300% | | | | | | BB | | | | 46,813 | |
| | | | Total Commercial Banks | | | | | | | | | | | | | 987,660 | |
| | | | Consumer Finance – 3.1% | | | | | | | | | | | | | | |
| | | | | |
| | 2,400 | | | Discover Financial Services | | | 6.500% | | | | | | BB | | | | 62,016 | |
| | | | | |
| | 2,000 | | | GMAC Capital Trust I | | | 8.125% | | | | | | B3 | | | | 54,400 | |
| | | | | |
| | 1,500 | | | GMAC LLC | | | 7.250% | | | | | | BB– | | | | 38,235 | |
| | | | | |
| | 1,650 | | | HSBC Finance Corporation | | | 6.360% | | | | | | A | | | | 41,547 | |
| | | | | |
| | 3,500 | | | SLM Corporation | | | 6.000% | | | | | | BBB– | | | | 85,715 | |
| | | | Total Consumer Finance | | | | | | | | | | | | | 281,913 | |
| | | | Diversified Financial Services – 4.7% | | | | | | | | | | | | | | |
| | | | | |
| | 900 | | | Bank of America Corporation | | | 8.200% | | | | | | BB+ | | | | 22,932 | |
| | | | | |
| | 4,000 | | | KCAP Financial Inc. | | | 7.375% | | | | | | N/A | | | | 104,160 | |
| | | | | |
| | 1,800 | | | KKR Financial Holdings LLC | | | 7.375% | | | | | | BB+ | | | | 46,890 | |
| | | | | |
| | 1,000 | | | Merrill Lynch Preferred Capital Trust V | | | 7.280% | | | | | | BB+ | | | | 25,480 | |
| | | | | |
| | 5,000 | | | Main Street Capital Corporation, (4) | | | 6.125% | | | | | | N/R | | | | 125,000 | |
| | | | | |
| | 4,000 | | | PennantPark Investment Corporation | | | 6.250% | | | | | | BBB– | | | | 100,800 | |
| | | | Total Diversified Financial Services | | | | | | | | | | | | | 425,262 | |
| | | | Diversified Telecommunication Services – 1.5% | | | | | | | | | | | | | | |
| | | | | |
| | 5,000 | | | Qwest Corporation | | | 7.375% | | | | | | BBB– | | | | 132,800 | |
| | | | Electric Utilities – 1.0% | | | | | | | | | | | | | | |
| | | | | |
| | 3,000 | | | PPL Capital Funding, Inc. | | | 5.900% | | | | | | BB+ | | | | 75,660 | |
| | | | | |
| | 500 | | | SCE Trust I | | | 5.625% | | | | | | BBB+ | | | | 13,145 | |
| | | | Total Electric Utilities | | | | | | | | | | | | | 88,805 | |
| | | | Energy Equipment & Services – 0.9% | | | | | | | | | | | | | | |
| | | | | |
| | 4,500 | | | Greenhunter Energy Incorporated | | | 10.000% | | | | | | N/A | | | | 82,440 | |
Portfolio of Investments (Unaudited)
Nuveen NWQ Flexible Income Fund (continued)
March 31, 2013
| | | | | | | | | | | | | | | | | | |
| Shares | | | Description (1) | | Coupon | | | | | Ratings (3) | | | Value | |
| | | | | | | | | | | | | | | | | | |
| | | | Household Durables – 1.4% | | | | | | | | | | | | | | |
| | | | | |
| | 5,000 | | | Pitney Bowes Incorporated | | | 6.700% | | | | | | BBB | | | $ | 128,700 | |
| | | | Insurance – 13.0% | | | | | | | | | | | | | | |
| | | | | |
| | 2,800 | | | Allstate Corporation | | | 5.100% | | | | | | Baa1 | | | | 73,304 | |
| | | | | |
| | 1,660 | | | American Financial Group | | | 7.000% | | | | | | BBB+ | | | | 44,471 | |
| | | | | |
| | 7,050 | | | Argo Group US Inc. | | | 6.500% | | | | | | BBB– | | | | 177,801 | |
| | | | | |
| | 1,100 | | | Aspen Insurance Holdings Limited | | | 7.401% | | | | | | BBB– | | | | 29,920 | |
| | | | | |
| | 3,175 | | | Aspen Insurance Holdings Limited | | | 7.250% | | | | | | BBB– | | | | 87,090 | |
| | | | | |
| | 3,250 | | | Axis Capital Holdings Limited | | | 6.875% | | | | | | BBB | | | | 87,945 | |
| | | | | |
| | 5,000 | | | Endurance Specialty Holdings Limited | | | 7.750% | | | | | | BBB– | | | | 138,550 | |
| | | | | |
| | 1,500 | | | Endurance Specialty Holdings Limited | | | 7.500% | | | | | | BBB– | | | | 40,590 | |
| | | | | |
| | 3,000 | | | Hanover Insurance Group, (4) | | | 6.350% | | | | | | Ba1 | | | | 76,313 | |
| | | | | |
| | 4,000 | | | Maiden Holdings NA Limited | | | 8.000% | | | | | | BBB– | | | | 108,200 | |
| | | | | |
| | 1,900 | | | Principal Financial Group | | | 6.518% | | | | | | BBB | | | | 50,236 | |
| | | | | |
| | 2,500 | | | Protective Life Corporation | | | 6.000% | | | | | | BBB | | | | 64,425 | |
| | | | | |
| | 1,000 | | | Prudential Financial Inc. | | | 9.000% | | | | | | BBB+ | | | | 25,460 | |
| | | | | |
| | 5,200 | | | Prudential Financial Inc. | | | 5.700% | | | | | | BBB+ | | | | 130,520 | |
| | | | | |
| | 1,600 | | | Reinsurance Group of America Inc. | | | 6.200% | | | | | | BBB | | | | 43,568 | |
| | | | Total Insurance | | | | | | | | | | | | | 1,178,393 | |
| | | | Multi-Utilities – 1.4% | | | | | | | | | | | | | | |
| | | | | |
| | 2,000 | | | DTE Energy Company | | | 6.500% | | | | | | Baa2 | | | | 55,100 | |
| | | | | |
| | 2,500 | | | Scana Corporation | | | 7.700% | | | | | | BBB– | | | | 68,850 | |
| | | | Total Multi-Utilities | | | | | | | | | | | | | 123,950 | |
| | | | Oil, Gas & Consumable Fuels – 1.6% | | | | | | | | | | | | | | |
| | | | | |
| | 1,125 | | | Magnum Hunter Resources Corporation | | | 8.000% | | | | | | N/A | | | | 52,785 | |
| | | | | |
| | 3,500 | | | Nustar Logistics Limited Partnership | | | 7.625% | | | | | | Ba2 | | | | 93,835 | |
| | | | Total Oil, Gas & Consumable Fuels | | | | | | | | | | | | | 146,620 | |
| | | | Real Estate Investment Trust – 27.0% | | | | | | | | | | | | | | |
| | | | | |
| | 3,375 | | | AG Mortgage Investment Trust | | | 8.000% | | | | | | N/A | | | | 85,995 | |
| | | | | |
| | 2,250 | | | Annaly Capital Management | | | 7.625% | | | | | | N/A | | | | 57,690 | |
| | | | | |
| | 700 | | | Apartment Investment & Management Company | | | 7.000% | | | | | | N/A | | | | 18,578 | |
| | | | | |
| | 3,275 | | | Apollo Commercial Real Estate Finance | | | 8.625% | | | | | | N/A | | | | 85,969 | |
| | | | | |
| | 3,400 | | | Apollo Residential Mortgage Inc. | | | 8.000% | | | | | | N/A | | | | 86,530 | |
| | | | | |
| | 3,325 | | | Arbor Realty Trust Incorporated | | | 8.250% | | | | | | N/A | | | | 85,951 | |
| | | | | |
| | 3,425 | | | Armour Residential REIT Incorporated | | | 7.875% | | | | | | N/A | | | | 85,625 | |
| | | | | |
| | 2,525 | | | Ashford Hospitality Trust Inc. | | | 9.000% | | | | | | N/A | | | | 69,715 | |
| | | | | |
| | 2,500 | | | Cedar Shopping Centers Inc., Series A | | | 7.250% | | | | | | N/A | | | | 62,875 | |
| | | | | |
| | 800 | | | Chesapeake Lodging Trust | | | 7.750% | | | | | | N/A | | | | 22,272 | |
| | | | | |
| | 1,250 | | | Coresite Realty Corporation | | | 7.250% | | | | | | N/A | | | | 32,750 | |
| | | | | |
| | 2,250 | | | CYS Investments Inc. | | | 7.750% | | | | | | N/A | | | | 56,880 | |
| | | | | |
| | 1,375 | | | DDR Corporation | | | 6.500% | | | | | | Ba1 | | | | 34,774 | |
| | | | | |
| | 2,000 | | | DDR Corporation, (WI/DD) | | | 6.250% | | | | | | Ba1 | | | | 49,700 | |
| | | | | |
| | 3,000 | | | Digital Realty Trust Inc. | | | 7.000% | | | | | | Baa3 | | | | 81,210 | |
| | | | | |
| | 2,600 | | | Dupont Fabros Technology | | | 7.875% | | | | | | Ba2 | | | | 70,018 | |
| | | | | |
| | 3,000 | | | Dynex Capital Inc. | | | 8.500% | | | | | | N/A | | | | 78,870 | |
| | | | | |
| | 1,325 | | | First Potomac Realty Trust | | | 7.750% | | | | | | N/R | | | | 34,450 | |
| | | | | | | | | | | | | | | | | | | | |
| Shares | | | Description (1) | | Coupon | | | | | | Ratings (3) | | | Value | |
| | | | | | | | | | | | | | | | | | | | |
| | | | Real Estate Investment Trust (continued) | | | | | | | | | | | | | | | | |
| | | | | |
| | 2,500 | | | Hatteras Financial Corporation | | | 7.625% | | | | | | | | N/A | | | $ | 63,075 | |
| | | | | |
| | 950 | | | Hersha Hospitality Trust | | | 6.875% | | | | | | | | N/R | | | | 24,358 | |
| | | | | |
| | 2,250 | | | Inland Real Estate Corporation | | | 8.125% | | | | | | | | N/R | | | | 60,345 | |
| | | | | |
| | 2,500 | | | Invesco Mortgage Capital Inc. | | | 7.750% | | | | | | | | N/A | | | | 63,950 | |
| | | | | |
| | 2,000 | | | Kennedy-Wilson Inc. | | | 7.750% | | | | | | | | BB– | | | | 51,780 | |
| | | | | |
| | 1,500 | | | National Retail Properties Inc. | | | 6.625% | | | | | | | | Baa3 | | | | 39,825 | |
| | | | | |
| | 3,325 | | | Northstar Realty Finance Corporation | | | 8.875% | | | | | | | | N/A | | | | 85,951 | |
| | | | | |
| | 3,450 | | | Northstar Realty Finance Corporation | | | 8.250% | | | | | | | | N/R | | | | 85,974 | |
| | | | | |
| | 2,500 | | | Pebblebrook Hotel Trust | | | 6.500% | | | | | | | | N/R | | | | 61,625 | |
| | | | | |
| | 3,000 | | | PS Business Parks, Inc. | | | 5.700% | | | | | | | | Baa2 | | | | 74,640 | |
| | | | | |
| | 5,000 | | | Rait Financial Trust | | | 7.750% | | | | | | | | N/R | | | | 122,500 | |
| | | | | |
| | 1,375 | | | Retail Properties of America | | | 7.000% | | | | | | | | N/A | | | | 34,801 | |
| | | | | |
| | 3,000 | | | Sabra Health Care Real Estate Investment Trust, (4) | | | 7.125% | | | | | | | | B3 | | | | 75,656 | |
| | | | | |
| | 3,000 | | | Senior Housing Properties Trust | | | 5.625% | | | | | | | | BBB– | | | | 75,150 | |
| | | | | |
| | 2,250 | | | Strategic Hotel Capital Inc., Series B | | | 8.250% | | | | | | | | N/R | | | | 55,598 | |
| | | | | |
| | 2,500 | | | Strategic Hotel Capital Inc., Series C | | | 8.250% | | | | | | | | N/R | | | | 61,925 | |
| | | | | |
| | 1,250 | | | Summit Hotel Properties Inc. | | | 7.875% | | | | | | | | N/A | | | | 32,438 | |
| | | | | |
| | 3,000 | | | Taubman Centers Incorporated, Series K | | | 6.250% | | | | | | | | N/R | | | | 74,970 | |
| | | | | |
| | 700 | | | Urstadt Biddle Properties | | | 7.125% | | | | | | | | N/A | | | | 18,872 | |
| | | | | |
| | 3,500 | | | Winthrop Realty Trust Inc. | | | 9.250% | | | | | | | | N/R | | | | 96,774 | |
| | | | | |
| | 3,000 | | | Winthrop Realty Trust Inc. | | | 7.750% | | | | | | | | N/A | | | | 78,000 | |
| | | | Total Real Estate Investment Trust | | | | | | | | | | | | | | | 2,438,059 | |
| | | | Real Estate Management & Development – 0.6% | | | | | | | | | | | | | | | | |
| | | | | |
| | 2,250 | | | Forest City Enterprises Inc. | | | 7.375% | | | | | | | | BB– | | | | 57,218 | |
| | | | Thrifts & Mortgage Finance – 1.7% | | | | | | | | | | | | | | | | |
| | | | | |
| | 3,000 | | | Astoria Financial Corporation, (4) | | | 6.500% | | | | | | | | BB | | | | 75,000 | |
| | | | | |
| | 3,250 | | | Everbank Financial Corporation | | | 6.750% | | | | | | | | N/A | | | | 81,738 | |
| | | | Total Thrifts & Mortgage Finance | | | | | | | | | | | | | | | 156,738 | |
| | | | Total $25 Par (or similar) Retail Structures (cost $7,001,000) | | | | | | | | | | | | | | | 7,189,502 | |
| | | | | |
Principal
Amount (000) | | | Description (1) | | Coupon | | | Maturity | | | Ratings (3) | | | Value | |
| | | | CORPORATE BONDS – 4.1% | | | | | | | | | | | | | | | | |
| | | | | |
| | | | Capital Markets – 0.3% | | | | | | | | | | | | | | | | |
| | | | | |
| $ | 25 | | | Jefferies Group Inc. | | | 6.500% | | | | 1/20/43 | | | | BBB | | | $ | 26,650 | |
| | | | Commercial Services & Supplies – 1.1% | | | | | | | | | | | | | | | | |
| | | | | |
| | 18 | | | RR Donnelley & Son Company | | | 8.250% | | | | 3/15/19 | | | | BB | | | | 19,440 | |
| | | | | |
| | 80 | | | RR Donnelley & Son Company | | | 7.875% | | | | 3/15/21 | | | | BB | | | | 83,400 | |
| | | | Total Commercial Services & Supplies | | | | | | | | | | | | | | | 102,840 | |
| | | | Diversified Financial Services – 2.2% | | | | | | | | | | | | | | | | |
| | | | | |
| | 200 | | | Jefferies Finance LLC, 144A | | | 7.375% | | | | 4/01/20 | | | | B+ | | | | 203,500 | |
| | | | Insurance – 0.5% | | | | | | | | | | | | | | | | |
| | | | | |
| | 32 | | | Protective Life Corporation | | | 8.450% | | | | 10/15/39 | | | | A– | | | | 42,186 | |
| $ | 355 | | | Total Corporate Bonds (cost $365,083) | | | | | | | | | | | | | | | 375,176 | |
Portfolio of Investments (Unaudited)
Nuveen NWQ Flexible Income Fund (continued)
March 31, 2013
| | | | | | | | | | | | | | | | | | | | |
| | | | | |
Principal
Amount (000)/
Shares | | | Description (1) | | Coupon | | | Maturity | | | Ratings (3) | | | Value | |
| | | | $1,000 PAR (OR SIMILAR) INSTITUTIONAL STRUCTURES – 3.4% | | | | | | | | | | | | | | | | |
| | | | | |
| | | | Commercial Banks – 0.3% | | | | | | | | | | | | | | | | |
| | | | | |
| | 20 | | | Wells Fargo & Company | | | 7.500% | | | | N/A (5) | | | | BBB+ | | | $ | 25,775 | |
| | | | Diversified Financial Services – 1.5% | | | | | | | | | | | | | | | | |
| | | | | |
| | 22 | | | Bank of America Corporation | | | 7.250% | | | | N/A (5) | | | | BB+ | | | | 26,800 | |
| | | | | |
| | 100 | | | General Electric Capital Corporation, (6) | | | 6.250% | | | | N/A (5) | | | | AA– | | | | 109,753 | |
| | | | Total Diversified Financial Services | | | | | | | | | | | | | | | 136,553 | |
| | | | Insurance – 1.6% | | | | | | | | | | | | | | | | |
| | | | | |
| | 100 | | | Liberty Mutual Group, 144A, (6) | | | 7.800% | | | | 3/15/37 | | | | Baa3 | | | | 116,500 | |
| | | | | |
| | 6 | | | Prudential PLC, (6) | | | 7.750% | | | | N/A (5) | | | | A– | | | | 6,465 | |
| | | | | |
| | 18 | | | Symetra Financial Corporation, 144A, (6) | | | 8.300% | | | | 10/15/37 | | | | BBB– | | | | 19,035 | |
| | | | Total Insurance | | | | | | | | | | | | | | | 142,000 | |
| | | | Total $1,000 Par (or similar) Institutional Structures (cost $281,954) | | | | | | | | | | | | | | | 304,328 | |
| | | | | |
Principal
Amount (000) | | | Description (1) | | Coupon | | | Maturity | | | | | | Value | |
| | | | SHORT-TERM INVESTMENTS – 12.8% | | | | | | | | | | | | | | | | |
| | | | | |
| $ | 1,160 | | | Repurchase Agreement with State Street Bank, dated 3/28/13, repurchase price $1,160,010, collateralized by $1,135,000 U.S. Treasury Notes, 2.375%, due 10/31/14, value $1,184,416 | | | 0.010% | | | | 4/01/13 | | | | | | | $ | 1,160,009 | |
| | | | Total Short-Term Investments (cost $1,160,009) | | | | | | | | | | | | | | | 1,160,009 | |
| | | | Total Investments (cost $9,477,567) – 107.3% | | | | | | | | | | | | | | | 9,708,278 | |
| | | | Other Assets Less Liabilities – (7.3)% | | | | | | | | | | | | | | | (663,085) | |
| | | | Net Assets – 100% | | | | | | | | | | | | | | $ | 9,045,193 | |
| | | | For Fund portfolio compliance purposes, the Fund’s industry classifications refer to any one or more of the industry sub-classifications used by one or more widely recognized market indexes or ratings group indexes, and/or as defined by Fund management. This definition may not apply for purposes of this report, which may combine industry sub-classifications into sectors for reporting ease. |
| | (1) | | All percentages shown in the Portfolio of Investments are based on net assets. |
| | (2) | | Non-income producing; issuer has not declared a dividend within the past twelve months. |
| | (3) | | Ratings: Using the highest of Standard & Poor’s Group (“Standard & Poor’s”), Moody’s Investors Service, Inc. (“Moody’s”) or Fitch, Inc. (“Fitch”) rating. Ratings below BBB by Standard & Poor’s, Baa by Moody’s or BBB by Fitch are considered to be below investment grade. Holdings designated N/R are not rated by any of these national rating agencies. |
| | (4) | | For fair value measurement disclosure purposes, $25 Par (or similar) Retail Structures classified as Level 2. See Notes to Financial Statements, Footnote 1 – General Information and Significant Accounting Policies, Investment Valuation for more information. |
| | (5) | | Perpetual security. Maturity date is not applicable. |
| | (6) | | For fair value measurement disclosure purposes, $1,000 Par (or similar) Institutional Structures classified as Level 2. See Notes to Financial Statements, Footnote 1 – General Information and Significant Accounting Policies, Investment Valuation for more information. |
| | CORTS | | Corporate Backed Trust Securities. |
| | PPLUS | | PreferredPlus Trust. |
| | WI/DD | | Purchased on a when-issued or delayed delivery basis. |
| | 144A | | Investment is exempt from registration under Rule 144A of the Securities Act of 1933, as amended. These investments may only be resold in transactions exempt from registration, which are normally those transactions with qualified institutional buyers. |
See accompanying notes to financial statements.
Statement of Assets and Liabilities (Unaudited)
March 31, 2013
| | | | |
Assets | | | | |
Long-term investments, at value (cost $8,317,558) | | $ | 8,548,269 | |
Short-term investments, at value (cost approximates value) | | | 1,160,009 | |
Cash | | | 3,299 | |
Receivables: | | | | |
Dividends | | | 33,876 | |
From Adviser | | | 20,095 | |
Interest | | | 5,127 | |
Investments sold | | | 341,596 | |
Shares sold | | | 320,389 | |
Other assets | | | 7 | |
Total assets | | | 10,432,667 | |
Liabilities | | | | |
Payables: | | | | |
Dividends | | | 10,374 | |
Investments purchased | | | 1,341,258 | |
Shares redeemed | | | 9,239 | |
Accrued expenses: | | | | |
Trustees fees | | | 17 | |
12b-1 distribution and service fees | | | 2,029 | |
Other | | | 24,557 | |
Total liabilities | | | 1,387,474 | |
Net assets | | $ | 9,045,193 | |
Class A Shares | | | | |
Net assets | | $ | 5,524,422 | |
Shares outstanding | | | 249,137 | |
Net asset value per share | | $ | 22.17 | |
Offering price per share (net asset value per share plus
maximum sales charge of 4.75% of offering price) | | $ | 23.28 | |
Class C Shares | | | | |
Net assets | | $ | 1,548,466 | |
Shares outstanding | | | 69,967 | |
Net asset value and offering price per share | | $ | 22.13 | |
Class I Shares | | | | |
Net assets | | $ | 1,972,305 | |
Shares outstanding | | | 88,883 | |
Net asset value and offering price per share | | $ | 22.19 | |
Net assets consist of: | | | | |
Capital paid-in | | $ | 8,792,832 | |
Undistributed (Over-distribution of) net investment income | | | (2,519 | ) |
Accumulated net realized gain (loss) | | | 24,169 | |
Net unrealized appreciation (depreciation) | | | 230,711 | |
Net assets | | $ | 9,045,193 | |
Authorized shares – per class | | | Unlimited | |
Par value per share | | $ | 0.01 | |
See accompanying notes to financial statements.
Statement of Operations (Unaudited)
Six Months Ended March 31, 2013
| | | | |
Dividend and Interest Income (net of foreign tax withheld of $135) | | $ | 118,951 | |
Expenses | | | | |
Management fees | | | 13,941 | |
12b-1 service fees – Class A | | | 2,178 | |
12b-1 distribution and service fees – Class C | | | 3,829 | |
Shareholder servicing agent fees and expenses | | | 587 | |
Custodian fees and expenses | | | 12,527 | |
Trustees fees and expenses | | | 226 | |
Professional fees | | | 26,813 | |
Shareholder reporting expenses | | | 8,124 | |
Federal and state registration fees | | | 4,956 | |
Other expenses | | | 2,779 | |
Total expenses before fee waiver/expense reimbursement | | | 75,960 | |
Fee waiver/expense reimbursement | | | (56,010 | ) |
Net expenses | | | 19,950 | |
Net investment income (loss) | | | 99,001 | |
Realized and Unrealized Gain (Loss) | | | | |
Net realized gain (loss) from: | | | | |
Investments | | | 43,936 | |
Call options written | | | 942 | |
Change in net unrealized appreciation (depreciation) of investments | | | 86,815 | |
Net realized and unrealized gain (loss) | | | 131,693 | |
Net increase (decrease) in net assets from operations | | $ | 230,694 | |
See accompanying notes to financial statements.
Statement of Changes in Net Assets (Unaudited)
| | | | | | | | |
| | | Six Months
Ended
3/31/13 | | | Year Ended
9/30/12 | |
Operations | | | | | | | | |
Net investment income (loss) | | $ | 99,001 | | | $ | 117,821 | |
Net realized gain (loss) from: | | | | | | | | |
Investments | | | 43,936 | | | | 108,170 | |
Call options written | | | 942 | | | | 11,917 | |
Change in net unrealized appreciation (depreciation) of: | | | | | | | | |
Investments | | | 86,815 | | | | 135,898 | |
Call options written | | | — | | | | (615 | ) |
Net increase (decrease) in net assets from operations | | | 230,694 | | | | 373,191 | |
Distributions to Shareholders | | | | | | | | |
From net investment income: | | | | | | | | |
Class A | | | (47,665 | ) | | | (30,300 | ) |
Class C | | | (17,982 | ) | | | (26,200 | ) |
Class R3 | | | N/A | | | | (19,222 | ) |
Class I | | | (39,333 | ) | | | (42,283 | ) |
From accumulated net realized gains: | | | | | | | | |
Class A | | | (46,028 | ) | | | (34,250 | ) |
Class C | | | (21,236 | ) | | | (34,250 | ) |
Class R3 | | | N/A | | | | (34,250 | ) |
Class I | | | (49,156 | ) | | | (34,250 | ) |
Decrease in net assets from distributions to shareholders | | | (221,400 | ) | | | (255,005 | ) |
Fund Share Transactions | | | | | | | | |
Proceeds from sale of shares | | | 6,912,287 | | | | 539,500 | |
Proceeds from shares issued to shareholders due to reinvestment of distributions | | | 78,490 | | | | — | |
| | | 6,990,777 | | | | 539,500 | |
Cost of shares redeemed | | | (204,442 | ) | | | (529,500 | ) |
Net increase (decrease) in net assets from Fund share transactions | | | 6,786,335 | | | | 10,000 | |
Net increase (decrease) in net assets | | | 6,795,629 | | | | 128,186 | |
Net assets at the beginning of period | | | 2,249,564 | | | | 2,121,378 | |
Net assets at the end of period | | $ | 9,045,193 | | | $ | 2,249,564 | |
Undistributed (Over-distribution of) net investment income at the end of period | | $ | (2,519 | ) | | $ | 3,460 | |
| N/A – | After the close of business on May 30, 2012, the Fund liquidated all of its Class R3 Shares. |
See accompanying notes to financial statements.
Financial Highlights (Unaudited)
| | | | | | | | | | | | | | | | | | | | | | | | | | | | | | | | |
| Selected data for a share outstanding throughout the period: | |
| | | | | | |
| Class (Commencement Date) | | | | | | | | | | | | | | | | | | | |
| | | | | | Investment Operations | | | Less Distributions | | | | |
| | | | | | | |
| | | | | | | | | | | | | | | | | | | | | | | |
Year Ended
September 30, | | Beginning
Net
Asset
Value | | | Net
Invest-
ment
Income
(Loss)(a) | | |
Net
Realized/
Unrealized
Gain
(Loss) | | | Total | | | From
Net
Invest-
ment
Income | | | From
Accum-
ulated
Net
Realized
Gains | | | Total | | | Ending
Net
Asset
Value | |
Class A (12/09) | | | | | | | | | | | | | | | | | | | | | | | | | | | | | |
2013(e) | | $ | 22.41 | | | $ | .58 | | | $ | .61 | | | $ | 1.19 | | | $ | (.61 | ) | | $ | (.82 | ) | | $ | (1.43 | ) | | $ | 22.17 | |
2012 | | | 21.22 | | | | 1.21 | | | | 2.56 | | | | 3.77 | | | | (1.21 | ) | | | (1.37 | ) | | | (2.58 | ) | | | 22.41 | |
2011 | | | 22.59 | | | | 1.22 | | | | (.37 | ) | | | .85 | | | | (1.43 | ) | | | (.79 | ) | | | (2.22 | ) | | | 21.22 | |
2010(d) | | | 20.00 | | | | 1.07 | | | | 2.38 | | | | 3.45 | | | | (.86 | ) | | | — | | | | (.86 | ) | | | 22.59 | |
Class C (12/09) | | | | | | | | | | | | | | | | | | | | | | | | | | | | | |
2013(e) | | | 22.37 | | | | .48 | | | | .62 | | | | 1.10 | | | | (.52 | ) | | | (.82 | ) | | | (1.34 | ) | | | 22.13 | |
2012 | | | 21.19 | | | | 1.05 | | | | 2.55 | | | | 3.60 | | | | (1.05 | ) | | | (1.37 | ) | | | (2.42 | ) | | | 22.37 | |
2011 | | | 22.55 | | | | 1.06 | | | | (.37 | ) | | | .69 | | | | (1.26 | ) | | | (.79 | ) | | | (2.05 | ) | | | 21.19 | |
2010(d) | | | 20.00 | | | | .94 | | | | 2.37 | | | | 3.31 | | | | (.76 | ) | | | — | | | | (.76 | ) | | | 22.55 | |
Class I (12/09) | | | | | | | | | | | | | | | | | | | | | | | | | | | | | |
2013(e) | | | 22.42 | | | | .58 | | | | .65 | | | | 1.23 | | | | (.64 | ) | | | (.82 | ) | | | (1.46 | ) | | | 22.19 | |
2012 | | | 21.23 | | | | 1.28 | | | | 2.55 | | | | 3.83 | | | | (1.27 | ) | | | (1.37 | ) | | | (2.64 | ) | | | 22.42 | |
2011 | | | 22.60 | | | | 1.28 | | | | (.37 | ) | | | .91 | | | | (1.49 | ) | | | (.79 | ) | | | (2.28 | ) | | | 21.23 | |
2010(d) | | | 20.00 | | | | 1.12 | | | | 2.37 | | | | 3.49 | | | | (.89 | ) | | | — | | | | (.89 | ) | | | 22.60 | |
| | | | | | | | | | | | | | | | | | | | | | | | | | |
| | | | | | | | | | | |
| | | |
| | | | | | | | | | | |
| | | | Ratios/Supplemental Data | |
| | | | | | |
Ratios to Average
Net Assets Before
Waiver/Reimbursement | | | Ratios to Average
Net Assets After
Waiver/Reimbursement(c) | | | | |
Total
Return(b) | | |
Ending
Net
Assets
(000) | | | Expenses | | | Net
Invest-
ment
Income
(Loss) | | | Expenses | | | Net
Invest-
ment
Income
(Loss) | | | Portfolio
Turnover
Rate | |
| | | | | | | | | | | | | | | | | | | | | | | | | | |
| | 5.55 | % | | $ | 5,524 | | | | 3.97 | %* | | | 2.31 | %* | | | .97 | %* | | | 5.31 | %* | | | 24 | % |
| | 19.24 | | | | 560 | | | | 4.52 | | | | 2.07 | | | | .97 | | | | 5.62 | | | | 85 | |
| | 3.78 | | | | 531 | | | | 2.78 | | | | 3.70 | | | | .98 | | | | 5.51 | | | | 76 | |
| | 17.46 | | | | 565 | | | | 3.61 | * | | | 3.55 | * | | | .99 | * | | | 6.17 | * | | | 53 | |
| | | | | | | | | | | | | | | | | | | | | | | | | | |
| | 5.17 | | | | 1,548 | | | | 4.54 | * | | | 1.55 | * | | | 1.72 | * | | | 4.37 | * | | | 24 | |
| | 18.32 | | | | 559 | | | | 5.27 | | | | 1.32 | | | | 1.72 | | | | 4.87 | | | | 85 | |
| | 3.05 | | | | 530 | | | | 3.53 | | | | 2.95 | | | | 1.73 | | | | 4.76 | | | | 76 | |
| | 16.74 | | | | 564 | | | | 4.36 | * | | | 2.80 | * | | | 1.74 | * | | | 5.41 | * | | | 53 | |
| | | | | | | | | | | | | | | | | | | | | | | | | | |
| | 5.74 | | | | 1,972 | | | | 3.48 | * | | | 2.46 | * | | | .72 | * | | | 5.23 | * | | | 24 | |
| | 19.53 | | | | 1,130 | | | | 3.59 | | | | 3.08 | | | | .72 | | | | 5.94 | | | | 85 | |
| | 4.05 | | | | 531 | | | | 2.53 | | | | 3.95 | | | | .73 | | | | 5.76 | | | | 76 | |
| | 17.68 | | | | 565 | | | | 3.36 | * | | | 3.80 | * | | | .74 | * | | | 6.42 | * | | | 53 | |
| (a) | Per share Net Investment Income (Loss) is calculated using the average daily shares method. |
| (b) | Total return is the combination of changes in net asset value without any sales charge, reinvested dividend income at net asset value and reinvested capital gains distributions at net asset value, if any. Total returns are not annualized. |
| (c) | After fee waiver and/or expense reimbursement from the Adviser, where applicable. |
| (d) | For the period December 9, 2009 (commencement of operations) through September 30, 2010. |
| (e) | For the six months ended March 31, 2013. |
See accompanying notes to financial statements.
Notes to Financial Statements (Unaudited)
1. General Information and Significant Accounting Policies
General Information
The Nuveen Investment Trust V (the “Trust”) is an open-end investment company registered under the Investment Company Act of 1940, as amended. The Trust is comprised of Nuveen NWQ Flexible Income Fund (the “Fund”), as a diversified fund, among others. The Trust was organized as a Massachusetts business trust on September 27, 2006.
On December 31, 2012, the Fund’s investment adviser converted from a Delaware corporation to a Delaware limited liability company. As a result, Nuveen Fund Advisors, Inc., a wholly-owned subsidiary of Nuveen Investments, Inc. (“Nuveen”), changed its name to Nuveen Fund Advisors, LLC (the “Adviser”). There were no changes to the identities or roles of any personnel as a result of the change.
The Fund seeks to provide current income and capital appreciation. Under normal market conditions, the Fund invests at least 80% of its net assets in income producing securities. The Fund invests at least 65% of its net assets in preferred and debt securities. Debt securities in which the Fund invests include corporate debt securities, mortgage-backed securities, taxable municipal securities and U.S. Government and agency debt securities. Preferred securities generally pay fixed or adjustable rate distributions to investors and have preference over common stock in the payment of distributions and the liquidation of a company’s assets, but are junior to most other forms of the company’s debt, including both senior and subordinated debt. The Fund will invest at least 25% of its assets in securities of companies principally engaged in financial services. The Fund may invest without limit in below-investment-grade securities, commonly referred to as “high yield” or “junk bonds.” The Fund may invest up to 35% of its net assets in equity securities other than preferred securities, including common stocks, convertible securities, depositary receipts and other types of securities with equity characteristics. The Fund may write covered call options on equity securities to generate additional income. In addition, to manage market risk and credit risk in its portfolio, the Fund may make short sales of equity securities and may enter into credit default swap agreements. The Fund’s short sales may equal up to 10% of the value of the Fund’s net assets. The Fund may invest up to 50% of its net assets in dollar-denominated securities issued by non-U.S. companies.
The Fund’s most recent prospectus provides further description of the Fund’s investment objective, principal investment strategies and principal risks.
Significant Accounting Policies
The following is a summary of significant accounting policies followed by the Fund in the preparation of its financial statements in accordance with U.S. generally accepted accounting principles (“U.S. GAAP”).
Investment Valuation
Common stocks and other equity-type securities are valued at the last sales price on the securities exchange on which such securities are primarily traded and are generally classified as Level 1 for fair value measurement purposes. Securities primarily traded on the NASDAQ National Market (“NASDAQ”) are valued, except as indicated below, at the NASDAQ Official Closing Price and are generally classified as Level 1. However, securities traded on a securities exchange or NASDAQ for which there were no transactions on a given day or securities not listed on a securities exchange or NASDAQ are valued at the quoted bid price and are generally classified as Level 2.
Prices of fixed-income securities are provided by a pricing service approved by the Fund’s Board of Trustees. These securities are generally classified as Level 2. The pricing service establishes a security’s fair value using methods that may include consideration of the following: yields or prices of investments of comparable quality, type of issue, coupon, maturity and rating, market quotes or indications of value from security dealers, evaluations of anticipated cash flows or collateral, general market conditions and other information and analysis, including the obligor’s credit characteristics considered relevant. In pricing certain securities, particularly less liquid and lower quality securities, the pricing service may consider information about a security, its issuer, or market activity provided by the Adviser. These securities are generally classified as Level 2 or Level 3 depending on the priority of the significant inputs.
The value of exchange-traded options are based on the mean of the closing bid and ask prices. Exchange-traded options are generally classified as Level 1. Options traded in the over-the-counter market are valued using an evaluated mean price and are generally classified as Level 2.
Certain securities may not be able to be priced by the pre-established pricing methods as described above. Such securities may be valued by the Fund’s Board of Trustees or its designee at fair value. These securities generally include, but are not limited to, restricted securities (securities which may not be publicly sold without registration under the Securities Act of 1933, as amended) for which a pricing service is unable to provide a market price; securities whose trading has been formally suspended; debt securities that have gone into default and for which there is no current market quotation; a security whose market price is not available from a pre-established pricing source; a security with respect to which an event has occurred that is likely to materially affect the value of the security after the market has closed but before the calculation of the Fund’s net asset value (as may be the case in non-U.S. markets on which the security is primarily traded) or make it difficult or impossible to obtain a reliable market quotation; and a security whose price, as provided by the pricing service, is not deemed to reflect the security’s fair value. As a general principle, the fair value of a security would appear to be the amount that the owner might reasonably expect to receive for it in a current sale. A variety of factors
may be considered in determining the fair value of such securities, which may include consideration of the following: yields or prices of investments of comparable quality, type of issue, coupon, maturity and rating, market quotes or indications of value from security dealers, evaluations of anticipated cash flows or collateral, general market conditions and other information and analysis, including the obligor’s credit characteristics considered relevant. These securities are generally classified as Level 2 or Level 3 depending on the priority of the significant inputs. Regardless of the method employed to value a particular security, all valuations are subject to review by the Fund’s Board of Trustees or its designee.
Refer to Footnote 2 – Fair Value Measurements for further details on the leveling of securities held by the Fund as of the end of the reporting period.
Investment Transactions
Investment transactions are recorded on a trade date basis. Realized gains and losses from investment transactions are determined on the specific identification method, which is the same basis used for federal income tax purposes. Investments purchased on a when-issued/delayed delivery basis may have extended settlement periods. Any investments so purchased are subject to market fluctuation during this period. The Fund has instructed the custodian to earmark securities in the Fund’s portfolio with a current value at least equal to the amount of the when-issued/delayed delivery purchase commitments. As of March 31, 2013, the Fund had outstanding when-issued/delayed delivery purchase commitments of $49,600.
Investment Income
Dividend income is recorded on the ex-dividend date or, for foreign securities, when information is available. Interest income, which reflects the amortization of premiums and includes accretion of discounts for financial reporting purposes, is recorded on an accrual basis. Interest income also reflects paydown gains and losses, if any.
Professional Fees
Professional fees presented on the Statement of Operations consist of legal fees incurred in the normal course of operations, audit fees, tax consulting fees and, in some cases, workout expenditures. Workout expenditures are incurred in an attempt to protect or enhance an investment, or to pursue other claims or legal actions on behalf of Fund shareholders. Legal fee refund presented on the Statement of Operations reflects a refund of workout expenditures paid in a prior reporting period, when applicable.
Income Taxes
The Fund intends to distribute substantially all of its net investment income and net capital gains to shareholders and to otherwise comply with the requirements of Subchapter M of the Internal Revenue Code applicable to regulated investment companies. Therefore, no federal income tax provision is required.
For all open tax years and all major taxing jurisdictions, management of the Fund has concluded that there are no significant uncertain tax positions that would require recognition in the financial statements. Open tax years are those that are open for examination by taxing authorities (i.e., generally the last four tax year ends and the interim tax period since then). Furthermore, management of the Fund is also not aware of any tax positions for which it is reasonably possible that the total amounts of unrecognized tax benefits will significantly change in the next twelve months.
Dividends and Distributions to Shareholders
The Fund declares dividends from its net investment income daily and pays shareholders monthly. Fund shares begin to accrue dividends on the business day after the day when the monies used to purchase Fund shares are collected by the Fund’s transfer agent.
Net realized capital gains from investment transactions, if any, are declared and distributed to shareholders at least annually. Furthermore, capital gains are distributed only to the extent they exceed available capital loss carryforwards.
Distributions to shareholders are recorded on the ex-dividend date. The amount and timing of distributions are determined in accordance with federal income tax regulations, which may differ from U.S. GAAP.
Share Classes and Sales Charges
Class A Shares are generally sold with an up-front sales charge and incur a .25% annual 12b-1 service fee. Class A Share purchases of $1 million or more are sold at net asset value without an up-front sales charge but may be subject to a contingent deferred sales charge (“CDSC”) if redeemed within eighteen months of purchase. Class C Shares are sold without an up-front sales charge but incur a .75% annual 12b-1 distribution fee and a .25% annual 12b-1 service fee. Class C Shares are subject to a CDSC of 1% if redeemed within twelve months of purchase. Class I Shares are not subject to any sales charge or 12b-1 distribution or service fees.
Options Transactions
The Fund is subject to equity price risk in the normal course of pursuing its investment objectives and is authorized to write (sell) call options, in an attempt to manage such risk. When the Fund writes an option, an amount equal to the net premium received (the premium less commission) is recognized as a component of “Call options written, at value” on the Statement of Assets and Liabilities and is subsequently adjusted to reflect the current value of the written option until the option is exercised or expires or the Fund enters into a closing purchase transaction. The changes in the value of options written during the fiscal period are recognized as a component of “Change in net unrealized appreciation (depreciation) of call options written” on the Statement of Operations. When an
Notes to Financial Statements (Unaudited) (continued)
option is exercised or expires or the Fund enters into a closing purchase transaction, the difference between the net premium received and any amount paid at expiration or on executing a closing purchase transaction, including commission, is recognized as a component of “Net realized gain (loss) from call options written“ on the Statement of Operations. The Fund, as a writer of an option, has no control over whether the underlying instrument may be sold (called) and as a result bears the risk of an unfavorable change in the market value of the instrument underlying the written option. There is also the risk the Fund may not be able to enter into a closing transaction because of an illiquid market.
During the six months ended March 31, 2013, the Fund wrote covered call options on individual stocks to enhance returns while foregoing some upside potential. The average notional amount of call options written during the six months ended March 31, 2013, was as follows:
| | | | |
Average notional amount of call options written* | | $ | (8,200 | ) |
| * | The average notional amount is calculated based on the outstanding notional at the beginning of the fiscal year and at the end of each fiscal quarter within the current fiscal year. |
Refer to Footnote 3 – Derivative Instruments and Hedging Activities and Footnote 5 – Investment Transactions for further details on options activity.
Market and Counterparty Credit Risk
In the normal course of business the Fund may invest in financial instruments and enter into financial transactions where risk of potential loss exists due to changes in the market (market risk) or failure of the other party to the transaction to perform (counterparty credit risk). The potential loss could exceed the value of the financial assets recorded on the financial statements. Financial assets, which potentially expose the Fund to counterparty credit risk, consist principally of cash due from counterparties on forward, option and swap transactions, when applicable. The extent of the Fund’s exposure to counterparty credit risk in respect to these financial assets approximates their carrying value as recorded on the Statement of Assets and Liabilities. Futures contracts, when applicable, expose the Fund to minimal counterparty credit risk as they are exchange traded and the exchange’s clearinghouse, which is counterparty to all exchange traded futures, guarantees the futures contracts against default.
The Fund helps manage counterparty credit risk by entering into agreements only with counterparties the Adviser believes have the financial resources to honor their obligations and by having the Adviser monitor the financial stability of the counterparties. Additionally, counterparties may be required to pledge collateral daily (based on the daily valuation of the financial asset) on behalf of the Fund with a value approximately equal to the amount of any unrealized gain above a pre-determined threshold. Reciprocally, when the Fund has an unrealized loss, the Fund has instructed the custodian to pledge assets of the Fund as collateral with a value approximately equal to the amount of the unrealized loss above a pre-determined threshold. Collateral pledges are monitored and subsequently adjusted if and when the valuations fluctuate, either up or down, by at least the pre-determined threshold amount.
Repurchase Agreements
In connection with transactions in repurchase agreements, it is the Fund’s policy that its custodian take possession of the underlying collateral securities, the fair value of which exceeds the principal amount of the repurchase transaction, including accrued interest, at all times. If the counterparty defaults, and the fair value of the collateral declines, realization of the collateral may be delayed or limited.
Zero Coupon Securities
The Fund is authorized to invest in zero coupon securities. A zero coupon security does not pay a regular interest coupon to its holders during the life of the security. Income to the holder of the security comes from accretion of the difference between the original purchase price of the security at issuance and the par value of the security at maturity and is effectively paid at maturity. The market prices of zero coupon securities generally are more volatile than the market prices of securities that pay interest periodically.
Multiclass Operations and Allocations
Income and expenses of the Fund that are not directly attributable to a specific class of shares are prorated among the classes based on the relative settled shares of each class. Expenses directly attributable to a class of shares, which presently only include 12b-1 distribution and service fees, are recorded to the specific class.
Realized and unrealized capital gains and losses of the Fund are prorated among the classes based on the relative net assets of each class.
Indemnifications
Under the Trust’s organizational documents, its officers and trustees are indemnified against certain liabilities arising out of the performance of their duties to the Trust. In addition, in the normal course of business, the Trust enters into contracts that provide general indemnifications to other parties. The Trust’s maximum exposure under these arrangements is unknown as this would involve future claims that may be made against the Trust that have not yet occurred. However, the Trust has not had prior claims or losses pursuant to these contracts and expects the risk of loss to be remote.
Use of Estimates
The preparation of financial statements in conformity with U.S. GAAP requires management to make estimates and assumptions that affect the reported amounts of assets and liabilities at the date of the financial statements and the reported amounts of increases and decreases in net assets from operations during the reporting period. Actual results may differ from those estimates.
2. Fair Value Measurements
Fair value is defined as the price that the Fund would receive upon selling an investment or transferring a liability in an orderly transaction to an independent buyer in the principal or most advantageous market for the investment. A three-tier hierarchy is used to maximize the use of observable market data and minimize the use of unobservable inputs and to establish classification of fair value measurements for disclosure purposes. Observable inputs reflect the assumptions market participants would use in pricing the asset or liability. Observable inputs are based on market data obtained from sources independent of the reporting entity. Unobservable inputs reflect the reporting entity’s own assumptions about the assumptions market participants would use in pricing the asset or liability. Unobservable inputs are based on the best information available in the circumstances. The following is a summary of the three-tiered hierarchy of valuation input levels.
| | |
| Level 1 – | | Inputs are unadjusted and prices are determined using quoted prices in active markets for identical securities. |
| Level 2 – | | Prices are determined using other significant observable inputs (including quoted prices for similar securities, interest rates, prepayment speeds, credit risk, etc.). |
| Level 3 – | | Prices are determined using significant unobservable inputs (including management’s assumptions in determining the fair value of investments). |
The inputs or methodologies used for valuing securities are not an indication of the risks associated with investing in those securities. The following is a summary of the Fund’s fair value measurements as of the end of the reporting period:
| | | | | | | | | | | | | | | | |
| | | Level 1 | | | Level 2 | | | Level 3 | | | Total | |
Long-Term Investments*: | | | | | | | | | | | | | | | | |
Common Stocks | | $ | 331,957 | | | $ | — | | | $ | — | | | $ | 331,957 | |
Preferred Stock | | | 204,148 | | | | — | | | | — | | | | 204,148 | |
Convertible Preferred Securities | | | 143,158 | | | | — | | | | — | | | | 143,158 | |
$25 Par (or similar) Retail Structures | | | 6,810,963 | | | | 378,539 | | | | — | | | | 7,189,502 | |
Corporate Bonds | | | — | | | | 375,176 | | | | — | | | | 375,176 | |
$1,000 Par (or similar) Institutional Structures | | | 52,575 | | | | 251,753 | | | | — | | | | 304,328 | |
Short-Term Investments: | | | | | | | | | | | | | | | | |
Repurchase Agreements | | | — | | | | 1,160,009 | | | | — | | | | 1,160,009 | |
Total | | $ | 7,542,801 | | | $ | 2,165,477 | | | $ | — | | | $ | 9,708,278 | |
| * | Refer to the Fund’s Portfolio of Investments for industry classifications and breakdown of $25 Par (or similar) Retail Structures and $1,000 Par (or similar) Institutional Structures classified as Level 2. |
The table below presents the transfers in and out of the three valuation levels for the Fund as of the end of the reporting period when compared to the valuation levels at the end of the previous fiscal year. Changes in valuation inputs or methodologies may result in transfers into or out of an assigned level within the fair value hierarchy. Transfers in or out of levels are generally due to the availability of publicly available information and to the significance or extent a manager determines that the valuation inputs or methodologies may impact the valuation of those securities.
| | | | | | | | | | |
Level 1 | | Level 2 | | Level 3 |
| Transfers In | | (Transfers Out) | | Transfers In | | (Transfers Out) | | Transfers In | | (Transfers Out) |
$99,624 | | $ — | | $ — | | $(99,624) | | $ — | | $ — |
The Nuveen funds’ Board of Directors/Trustees is responsible for the valuation process and has delegated the oversight of the daily valuation process to the Adviser’s Valuation Committee. The Valuation Committee, pursuant to the valuation policies and procedures adopted by the Board of Directors/Trustees, is responsible for making fair value determinations, evaluating the effectiveness of the funds’ pricing policies, and reporting to the Board of Directors/Trustees. The Valuation Committee is aided in its efforts by the Adviser’s dedicated Securities Valuation Team, which is responsible for administering the daily valuation process and applying fair value methodologies as approved by the Valuation Committee. When determining the reliability of independent pricing services for investments owned by the funds, the Valuation Committee, among other things, conducts due diligence reviews of the pricing services and monitors the quality of security prices received through various testing reports conducted by the Securities Valuation Team.
The Valuation Committee will consider pricing methodologies it deems relevant and appropriate when making fair value determinations. Examples of possible methodologies include, but are not limited to, multiple of earnings; discount from market of a similar freely traded security; discounted cash-flow analysis; book value or a multiple thereof; risk premium/yield analysis; yield to maturity; and/or fundamental investment analysis. The Valuation Committee will also consider factors it deems relevant and appropriate in light of the facts and circumstances. Examples of possible factors include, but are not limited to, the type of security; the issuer’s financial statements; the purchase price of the security; the discount from market value of unrestricted securities of the same class at the time of purchase; analysts’ research and observations from financial institutions; information regarding any transactions or offers with respect to the security; the existence of merger proposals or tender offers affecting the security; the price and extent of public trading in similar securities of the issuer or comparable companies; and the existence of a shelf registration for restricted securities.
For each portfolio security that has been fair valued pursuant to the policies adopted by the Board of Directors/Trustees, the fair value price is compared against the last available and next available market quotations. The Valuation Committee reviews the results of such testing and fair valuation occurrences are reported to the Board of Directors/Trustees.
Notes to Financial Statements (Unaudited) (continued)
3. Derivative Instruments and Hedging Activities
The Fund records derivative instruments at fair value, with changes in fair value recognized on the Statement of Operations, when applicable. Even though the Fund’s investments in derivatives may represent economic hedges, they are not considered to be hedge transactions for financial reporting purposes. For additional information on the derivative instruments in which the Fund was invested during and at the end of the reporting period, refer to the Portfolio of Investments, Financial Statements and Footnote 1 – General Information and Significant Accounting Policies.
The following table presents the amount of net realized gain (loss) recognized for the six months ended March 31, 2013, on derivative instruments, as well as the primary risk exposure.
| | | | |
| Net Realized Gain (Loss) from Call Options Written | | | |
Risk Exposure | | | | |
Equity Price | | $ | 942 | |
4. Fund Shares
Transactions in Fund shares were as follows:
| | | | | | | | | | | | | | | | |
| | | Six Months Ended
3/31/13 | | | Year Ended
9/30/12 | |
| | | Shares | | | Amount | | | Shares | | | Amount | |
Shares sold: | | | | | | | | | | | | | | | | |
Class A | | | 229,861 | | | $ | 5,072,197 | | | | — | | | $ | — | |
Class C | | | 45,497 | | | | 999,420 | | | | — | | | | — | |
Class R3 | | | N/A | | | | N/A | | | | — | | | | — | |
Class I | | | 37,930 | | | | 840,670 | | | | 25,411 | | | | 539,500 | |
Shares issued to shareholders due to reinvestment of distributions: | | | | | | | | | | | | | | | | |
Class A | | | 2,643 | | | | 57,696 | | | | — | | | | — | |
Class C | | | 245 | | | | 5,391 | | | | — | | | | — | |
Class I | | | 705 | | | | 15,403 | | | | — | | | | — | |
| | | | 316,881 | | | | 6,990,777 | | | | 25,411 | | | | 539,500 | |
Shares redeemed: | | | | | | | | | | | | | | | | |
Class A | | | (8,367 | ) | | | (183,834 | ) | | | — | | | | — | |
Class C | | | (775 | ) | | | (17,000 | ) | | | — | | | | — | |
Class R3 | | | N/A | | | | N/A | | | | (25,000 | ) | | | (529,500 | ) |
Class I | | | (163 | ) | | | (3,608 | ) | | | — | | | | — | |
| | | | (9,305 | ) | | | (204,442 | ) | | | (25,000 | ) | | | (529,500 | ) |
Net increase (decrease) | | | 307,576 | | | $ | 6,786,335 | | | | 411 | | | $ | 10,000 | |
| N/A | – After the close of business on May 30, 2012, the Fund liquidated all of its Class R3 Shares. |
5. Investment Transactions
Purchases and sales (including maturities but excluding short-term investments and derivative transactions) during the six months ended March 31, 2013, aggregated $7,129,642 and $936,971, respectively.
Transactions in call options written during the six months ended March 31, 2013, were as follows:
| | | | | | | | |
| | | Number of
Contracts | | | Premiums
Received | |
Call options outstanding, beginning of period | | | — | | | $ | — | |
Call options written | | | 6 | | | | 942 | |
Call options terminated in closing purchase transactions | | | — | | | | — | |
Call options exercised | | | (6 | ) | | | (942 | ) |
Call options outstanding, end of period | | | — | | | $ | — | |
6. Income Tax Information
The following information is presented on an income tax basis. Differences between amounts for financial statement and federal income tax purposes are primarily due to timing differences in recognizing certain gains and losses on investment transactions. To the extent that differences arise that are permanent in nature, such amounts are reclassified within the capital accounts as detailed below. Temporary differences do not require reclassification. Temporary and permanent differences do not impact the net asset values of the Fund.
As of March 31, 2013, the cost and unrealized appreciation (depreciation) of investments (excluding investments in derivatives), as determined on a federal income tax basis, were as follows:
| | | | |
Cost of investments | | $ | 9,488,546 | |
Gross unrealized: | | | | |
Appreciation | | $ | 241,559 | |
Depreciation | | | (21,827 | ) |
Net unrealized appreciation (depreciation) of investments | | $ | 219,732 | |
Permanent differences, primarily due to complex securities tax character adjustments, federal taxes paid, bond premium amortization adjustments and distribution character reclassifications, resulted in reclassifications among the Fund’s components of net assets as of September 30, 2012, the Fund’s last tax year end, as follows:
| | | | |
| | |
| Capital paid in | | $(334) | |
Undistributed (Over-distribution of) net investment income | | | 610 | |
Accumulated net realized gain (loss) | | | (276 | ) |
The tax components of undistributed net ordinary income and net long-term capital gains as of September 30, 2012, the Fund’s last tax year end, were as follows:
| | | | |
| | |
| Undistributed net ordinary income* | | $47,541 | |
Undistributed net long-term capital gains | | | 72,565 | |
| * | Undistributed net ordinary income (on a tax basis) has not been reduced for the dividend declared during the period September 1, 2012 through September 30, 2012 and paid on October 1, 2012. Net ordinary income consists of net taxable income derived from dividends, interest, and net short-term capital gains, if any. |
The tax character of distributions paid during the Fund’s last tax year ended September 30, 2012, was designated for purposes of the dividends paid deduction as follows:
| | | | |
Distributions from net ordinary income* | | $ | 197,783 | |
Distributions from net long-term capital gains | | | 57,000 | |
| * | Net ordinary income consists of net taxable income derived from dividends, interest, and net short-term capital gains, if any. |
Under the Regulated Investment Company Modernization Act of 2010, capital losses incurred by the Fund after December 31, 2010, will not be subject to expiration. During the Fund’s last tax year ended September 30, 2012, there were no post-enactment capital losses generated.
7. Management Fees and Other Transactions with Affiliates
The Fund’s management fee consists of two components – a fund-level fee, based only on the amount of assets within the Fund, and a complex-level fee, based on the aggregate amount of all eligible fund assets managed by the Adviser. This pricing structure enables Fund shareholders to benefit from growth in the assets within the Fund as well as from growth in the amount of complex-wide assets managed by the Adviser.
The annual fund-level fee, payable monthly, is calculated according to the following schedule:
| | | | |
| Average Daily Net Assets | | Fund-Level Fee Rate | |
For the first $125 million | | | .5500 | % |
For the next $125 million | | | .5375 | |
For the next $250 million | | | .5250 | |
For the next $500 million | | | .5125 | |
For the next $1 billion | | | .5000 | |
For net assets over $2 billion | | | .4750 | |
The annual complex-level fee, payable monthly, is calculated according to the following schedule:
| | | | |
| Complex-Level Asset Breakpoint Level* | | Effective Rate at Breakpoint Level | |
$55 billion | | | .2000 | % |
$56 billion | | | .1996 | |
$57 billion | | | .1989 | |
$60 billion | | | .1961 | |
$63 billion | | | .1931 | |
$66 billion | | | .1900 | |
$71 billion | | | .1851 | |
$76 billion | | | .1806 | |
Notes to Financial Statements (Unaudited) (continued)
| | | | |
| Complex-Level Asset Breakpoint Level* | | Effective Rate at Breakpoint Level | |
$80 billion | | | .1773 | |
$91 billion | | | .1691 | |
$125 billion | | | .1599 | |
$200 billion | | | .1505 | |
$250 billion | | | .1469 | |
$300 billion | | | .1445 | |
| * | The complex-level fee is calculated based upon the aggregate daily “eligible assets” of all Nuveen Funds. Eligible assets do not include assets attributable to investments in other Nuveen Funds or assets in excess of $2 billion added to the Nuveen Fund complex in connection with the Adviser’s assumption of the management of the former First American Funds effective January 1, 2011. Eligible assets include closed-end fund assets managed by the Adviser that are attributable to financial leverage. For these purposes, financial leverage includes the closed-end funds’ use of preferred stock and borrowings and certain investments in the residual interest certificates (also called inverse floating rate securities) in tender option bond (TOB) trusts, including the portion of assets held by a TOB trust that has been effectively financed by the trust’s issuance of floating rate securities, subject to an agreement by the Adviser as to certain funds to limit the amount of such assets for determining eligible assets in certain circumstances. As of March 31, 2013, the complex-level fee rate for the Fund was .1668%. |
The management fee compensates the Adviser for overall investment advisory and administrative services and general office facilities. The Adviser is responsible for the Fund’s overall investment strategy and asset allocation decisions. The Adviser has entered into a sub-advisory agreement with NWQ Investment Management Company, LLC (“NWQ”), an affiliate of Nuveen, under which NWQ manages the investment portfolio of the Fund. NWQ is compensated for its services to the Fund from the management fees paid to the Adviser.
The Adviser has contractually agreed to waive fees and/or reimburse expenses (“Expense Cap”), so that total annual Fund operating expenses (excluding 12b-1 distribution and/or service fees, interest expenses, taxes, acquired fund fees and expenses, fees incurred in acquiring and disposing of portfolio securities, and extraordinary expenses) do not exceed .75% through January 31, 2014 (1.25% after January 31, 2014), of the average daily net assets of any class of Fund shares. The Adviser may voluntarily reimburse additional expenses from time to time. Voluntary reimbursements may be terminated at any time at the Adviser’s discretion.
The Trust pays no compensation directly to those of its trustees who are affiliated with the Adviser or to its officers, all of whom receive remuneration for their services to the Trust from the Adviser or its affiliates. The Board of Trustees has adopted a deferred compensation plan for independent trustees that enables trustees to elect to defer receipt of all or a portion of the annual compensation they are entitled to receive from certain Nuveen-advised funds. Under the plan, deferred amounts are treated as though equal dollar amounts had been invested in shares of select Nuveen-advised funds.
During the six months ended March 31, 2013, Nuveen Securities, LLC (the “Distributor”), a wholly-owned subsidiary of Nuveen, collected sales charges on purchases of Class A Shares, the majority of which were paid out as concessions to financial intermediaries as follows:
| | | | |
Sales charges collected | | $ | 42,056 | |
Paid to financial intermediaries | | | 37,441 | |
The Distributor also received 12b-1 service fees on Class A Shares, substantially all of which were paid to compensate financial intermediaries for providing services to shareholders relating to their investments.
During the six months ended March 31, 2013, the Distributor compensated financial intermediaries directly with commission advances at the time of purchase as follows:
| | | | |
Commission advances | | $ | 8,314 | |
To compensate for commissions advanced to financial intermediaries, all 12b-1 service and distribution fees collected on Class C Shares during the first year following a purchase are retained by the Distributor. During the six months ended March 31, 2013, the Distributor retained such 12b-1 fees as follows:
| | | | |
12b-1 fees retained | | $ | 3,747 | |
The remaining 12b-1 fees charged to the Fund were paid to compensate financial intermediaries for providing services to shareholders relating to their investments.
The Distributor also collected and retained CDSC on share redemptions during the six months ended March 31, 2013, as follows:
As of March 31, 2013, Nuveen owned shares of the Fund as follows:
| | | | |
Class A Shares | | | 25,000 | |
Class C Shares | | | 25,000 | |
Class I Shares | | | 49,965 | |
8. New Accounting Pronouncements
Financial Accounting Standards Board (“FASB”) Balance Sheet (Topic 210): Disclosures about Offsetting Assets and Liabilities
In January 2013, Accounting Standards Update (“ASU”) 2013-01, Clarifying the Scope of Disclosures about Offsetting Assets and Liabilities, replaced ASU 2011-11, Disclosures about Offsetting Assets and Liabilities. ASU 2013-01 is effective for fiscal years beginning on or after January 1, 2013. ASU 2011-11 was intended to enhance disclosure requirements on the offsetting of financial assets and liabilities. ASU 2013-01 limits the scope of the new balance sheet offsetting disclosures to derivatives, repurchase agreements and securities lending transactions to the extent that they are (1) offset in the financial statements or (2) subject to an enforceable master netting arrangement or similar agreement. Management is currently evaluating the application of ASU 2013-01 and its impact to the financial statements and footnote disclosures, if any.
Notes
Notes
Glossary of Terms Used in this Report
Average Annual Total Return: This is a commonly used method to express an investment’s performance over a particular, usually multi-year time period. It expresses the return that would have been necessary each year to equal the investment’s actual cumulative performance (including change in NAV or offer price and reinvested dividends and capital gains distributions, if any) over the time period being considered.
BofA Merrill Lynch Fixed Rate Preferred Securities Index: An index that tracks the performance of fixed rate U.S. dollar denominated preferred securities issued in the U.S. domestic market. Qualifying securities must be rated investment grade (based on an average of Moody’s, S&P, and Fitch) and must have an investment grade rated country of risk (based on an average of Moody’s, S&P, and Fitch foreign currency long-term sovereign debt ratings). In addition, qualifying securities must be issued as public securities or through a 144a filing, must be issued in $25, $50, or $100 par/liquidation preference increments, must have a fixed coupon or distribution schedule, and must have a minimum amount outstanding of $100 million. Index returns assume reinvestment of distributions, but do not reflect any applicable sales charges or management fees.
Gross Domestic Product (GDP): The total market value of all final goods and services produced in a country/region in a given year, equal to total consumer, investment and government spending, plus the value of exports, minus the value of imports.
Lipper Flexible Income Funds Classification Average: Represents the average annualized total return for all reporting funds in the Lipper Flexible Income Funds Classification. Lipper returns account for the effects of management fees and assume reinvestment of distributions, but do not reflect any applicable sales charges.
Morningstar Conservative Target Risk Index: An index that seeks to represent a portfolio of global equities, bonds and traditional inflation hedges such as commodities and TIPS. This portfolio is held in a static allocation appropriate for U.S. investors who seek below-average exposure to equity market risk and returns. Index returns assume reinvestment of distributions, but do not reflect any applicable sales charges or management fees.
Net Asset Value (NAV): The net market value of all securities held in a portfolio.
Net Asset Value (NAV) Per Share: The market value of one share of a mutual fund or closed-end fund. For a Fund, the NAV is calculated daily by taking the Fund’s total assets (securities, cash, and accrued earnings), subtracting the Fund’s liabilities, and dividing by the number of shares outstanding.
Additional Fund Information
Fund Manager
Nuveen Fund Advisors, LLC
333 West Wacker Drive
Chicago, IL 60606
Sub-Adviser
NWQ Investment Management Company, LLC
2049 Century Park East
Los Angeles, CA 90097
Legal Counsel
Chapman and Cutler LLP
Chicago, IL
Independent Registered
Public Accounting Firm
Ernst & Young LLP
Chicago, IL
Custodian
State Street Bank & Trust Company
Boston, MA
Transfer Agent and Shareholder Services
Boston Financial
Data Services, Inc.
Nuveen Investor Services
P.O. Box 8530
Boston, MA 02266-8530
(800) 257-8787
Quarterly Form N-Q Portfolio of Investments Information
Each Fund is required to file its complete schedule of portfolio holdings with the Securities and Exchange Commission (SEC) for the first and third quarters of each fiscal year on Form N-Q. You may obtain this information directly from the SEC. Visit the SEC on-line at http://www.sec.gov or in person at the SEC’s Public Reference Room in Washington, D.C. Call the SEC toll-free at (800) SEC -0330 for room hours and operation.
Nuveen Funds’ Proxy Voting Information
You may obtain (i) information regarding how each Fund voted proxies relating to portfolio securities held during the most recent twelve-month period ended June 30, and (ii) a description of the policies and procedures that each Fund used to determine how to vote proxies relating to portfolio securities without charge, upon request, by calling Nuveen Investments toll-free at (800) 257-8787 or on Nuveen’s website at www.nuveen.com. You may also obtain this information directly from the SEC. Visit the SEC on-line at http://www.sec.gov.
The Financial Industry Regulatory Authority (FINRA) provides a Public Disclosure Program which supplies certain information regarding the disciplinary history of FINRA members and their associated persons in response to either telephone inquiries at (800) 289-9999 or written inquiries at www.finra.org. FINRA also provides an investor brochure that includes information describing the Public Disclosure Program.
Nuveen Investments:
Serving Investors for Generations
Since 1898, financial advisors and their clients have relied on Nuveen Investments to provide dependable investment solutions through continued adherence to proven, long-term investing principles. Today, we offer a range of high quality equity and fixed-income solutions designed to be integral components of a well-diversified core portfolio.
Focused on meeting investor needs.
Nuveen Investments provides high-quality investment services designed to help secure the longterm goals of institutional and individual investors as well as the consultants and financial advisors who serve them. Nuveen Investments markets a wide range of specialized investment solutions which provide investors access to capabilities of its high-quality boutique investment affiliates–Nuveen Asset Management, Symphony Asset Management, NWQ Investment Management Company, Santa Barbara Asset Management, Tradewinds Global Investors, Winslow Capital Management, and Gresham Investment Management. In total, Nuveen Investments managed $224 billion as of March 31, 2013.
Find out how we can help you.
To learn more about how the products and services of Nuveen Investments may be able to help you meet your financial goals, talk to your financial advisor, or call us at (800) 257-8787. Please read the information provided carefully before you invest. Investors should consider the investment objective and policies, risk considerations, charges and expenses of any investment carefully. Where applicable, be sure to obtain a prospectus, which contains this and other relevant information. To obtain a prospectus, please contact your securities representative or Nuveen Investments, 333 W. Wacker Dr., Chicago, IL 60606. Please read the prospectus carefully before you invest or send money.
Learn more about Nuveen Funds at: www.nuveen.com/mf
| | |
Distributed by Nuveen Securities, LLC 333 West Wacker Drive Chicago, IL 60606 www.nuveen.com | | |
MSA-NFI-0313P

Mutual Funds
Nuveen Commodity Strategy Funds
For investors seeking the potential for attractive total return.
Semi-Annual Report
March 31, 2013
| | | | | | |
| | | Share Class / Ticker Symbol |
| | | |
| Fund Name | | Class A | | Class C | | Class I |
Nuveen Gresham Diversified Commodity Strategy Fund | | NGVAX | | NGVCX | | NGVIX |
Nuveen Gresham Long/Short Commodity Strategy Fund | | NGSAX | | NGSCX | | NGSIX |
LIFE IS COMPLEX.
Nuveen makes things e-simple.
It only takes a minute to sign up for e-Reports. Once enrolled, you’ll receive an e-mail as soon as your Nuveen Fund information is ready. No more waiting for delivery by regular mail. Just click on the link within the e-mail to see the report and save it on your computer if you wish.
Free e-Reports right to your e-mail!
www.investordelivery.com
If you receive your Nuveen Fund distributions and statements from your financial advisor or brokerage account.
OR
www.nuveen.com/accountaccess
If you receive your Nuveen Fund distributions and statements directly from Nuveen.
| | | | | | |
| Must be preceded by or accompanied by a prospectus. | | NOT FDIC INSURED | | MAY LOSE VALUE | | NO BANK GUARANTEE |
Table of Contents
Chairman’s
Letter to Shareholders

Dear Shareholders,
The global economy continues to struggle with low growth rates. The European Central Bank’s commitment to “do what it takes” to support sovereign debt markets has stabilized the broader euro area financial markets. The larger member states of the European Union (EU) are working diligently on a tighter financial and banking union and meaningful progress is being made. However, economic conditions in the southern tier members are not improving and their political leaders are becoming more forceful in their demands for loosening the current EU fiscal targets and timetables. Economic growth in emerging market countries continues to be buffeted by lower overseas demand for their manufactured products and raw materials.
In the U.S., the Fed’s commitment to low interest rates through Quantitative Easing is the subject of increasing debate in its policy making deliberations and many independent economists are expressing concern about the economic distortions resulting from negative real interest rates. There are encouraging signs in Congress that both political parties are working toward compromises on previously irreconcilable issues such as reforming immigration laws and the tax code. It is too early to tell whether those efforts will produce meaningful results or pave the way for cooperation on the major fiscal issues that loom ahead. Over the longer term, there are some positive trends for the U.S. economy: house prices are clearly recovering, banks and corporations continue to strengthen their financial positions and incentives for capital investment in the U.S. by domestic and foreign corporations are increasing due to more competitive energy and labor costs.
During the last eighteen months, U.S. investors have benefited from strong returns in the domestic equity markets and steady total returns in many fixed income markets. However, many macroeconomic risks remain unresolved, including negotiating through the many U.S. fiscal issues, achieving a better balance between fiscal discipline and encouraging economic growth in the euro area and reducing the potential economic impact of geopolitical issues, particularly in the Middle East and East Asia. In the face of these uncertainties, the experienced investment professionals at Nuveen Investments seek out investments that are enjoying positive and sustainable returns. At the same time they are always on the alert for risks in markets that are subject to the excessive optimism that can accompany an extended period of abnormally low interest rates. Monitoring this process is a critical function for the Fund Board as it oversees your Nuveen Fund on your behalf.
As always, I encourage you to communicate with your financial consultant if you have any questions about your investment in a Nuveen Fund. On behalf of the other members of your Fund Board, we look forward to continuing to earn your trust in the months and years ahead.
Sincerely,

Robert P. Bremner
Chairman of the Board
May 24, 2013
Portfolio Managers’ Comments
Certain statements in this report are forward-looking statements. Discussions of specific investments are for illustration only and are not intended as recommendations of individual investments. The forward-looking statements and other views expressed herein are those of the portfolio managers as of the date of this report. Actual future results or occurrences may differ significantly from those anticipated in any forward-looking statements and the views expressed herein are subject to change at any time, due to numerous market and other factors. The Funds disclaim any obligation to update publicly or revise any forward-looking statements or views expressed herein.
These Funds are managed by Nuveen Fund Advisors LLC. (NFA), a wholly-owned subsidiary of Nuveen Investments. The Funds’ sub-advisors are Gresham Investment Management LLC, acting through its Near Term Active division (Gresham), and Nuveen Asset Management, LLC (Nuveen Asset Management), each of which is an affiliate of Nuveen Investments. Susan Wager and Randy Migdal from Gresham manage the Funds’ commodity investments and Douglas Baker, CFA, from Nuveen Asset Management manages the Funds’ fixed income investments. They have managed the Funds since their inceptions on July 30, 2012.
Effective January 1, 2013, the Funds are subject to regulation as commodity pools under the Commodity Exchange Act, and the Adviser, Nuveen Fund Advisors, LLC, has registered with the Commodity Futures Trading Commission (“CFTC”) as a commodity pool operator. The CFTC has proposed amendments to its rules which, upon their compliance dates, will subject the Funds and the Adviser to additional disclosure, reporting and recordkeeping rules, compliance with which is likely to increase the Funds’ expenses.
Here the managers discuss the key investment strategies and the Funds’ performance during the six-month reporting ended March 31, 2013.
How did the Funds perform during the six-month reporting period ended March 31, 2013?
The tables in the Fund Performance and Expense Ratios section of this report provide total return performance information for the six-month and since inception periods ending March 31, 2013. Each Fund’s Class A Share total returns at net asset value (NAV) are compared with the performance of the appropriate Dow Jones-UBS Commodity IndexSM and Lipper classification average.
What strategies were used to manage the Funds during the reporting period and how did these strategies influence performance?
Nuveen Gresham Diversified Commodity Strategy Fund
The Fund’s Class A Shares at net asset value (NAV) for the Nuveen Gresham Diversified Commodity Strategy Fund outperformed the Dow Jones-UBS Commodity Index and underperformed its Lipper average for the six-month reporting period ended March 31, 2013.
Gresham has developed an investment strategy intended to provide the Fund with exposure to the commodities asset class through a broad portfolio of futures contracts on physical commodities. Commodities have historically offered investors a hedge against
rising inflation and diversification across economic cycles, potentially improving the efficiency of portfolios holding traditional equity and fixed income assets.
The selection and weighting of commodities for the Fund’s portfolio are calculated from historical physical production, pricing in the global markets, the volume of international trade and futures contract liquidity, with limits on portfolio concentration in individual commodities and groups. Once portfolio weights are determined, positions in individual futures contracts are actively managed by Gresham’s seasoned team of portfolio managers and traders, who seek the best opportunities from the available points on the futures contract curve for each commodity, and the most favorable timing of contract purchases and sales.
Commodities prices fell broadly during the reporting period and were off 7.4% as measured by the Dow Jones-UBSCI benchmark. Of the six major commodity groups in the benchmark, the only one to advance was energy. The Fund outperformed in energy and precious metals, and produced performance approximately equal to the benchmark in industrial metals and foods and fibers. It underperformed the benchmark in the agriculture and livestock groups.
In the energy group, prices of crude oil, natural gas and unleaded gasoline gained during the period. For the energy group as a whole, the Fund outperformed the benchmark. Its energy portfolio benefited from overweight positions in crude oil. In the natural gas segment, the portfolio did not realize the full benefit of rising prices due to an underweight position; however, it did benefit from favorable contract implementation of natural gas positions, resulting in overall outperformance in the segment. Gresham’s active contract implementation aims to earn returns above the benchmark by finding better relative value for a given commodity at different points on the futures curve, drawing on the physical market knowledge and futures market experience of its seasoned trading team.
Precious metals prices fell sharply during the reporting period. A small overweight position in gold, plus favorable implementation of contracts in gold and silver, led the Fund to outperform in the group.
The markets for industrial metals were very weak, as prices fell across the board. The Fund’s performance during the period benefited from an underweight position in zinc, but was hurt by unfavorable contract implementation in aluminum. In total, the Fund’s performance for the industrial metals group was approximately equal to the benchmark.
Sugar, coffee and cocoa prices were down sharply in the foods and fibers group during the reporting period, while cotton made a significant gain. The Fund’s underweight position in cotton detracted from performance versus the benchmark, while an underweight position in coffee resulted in a benefit. In sugar, unfavorable contract implementation detracted from performance. Overall, the Fund’s performance in foods and fibers was approximately equal to the benchmark.
In the agriculture group, prices of corn, wheat and the soybean complex (which includes soybeans, soybean meal and soybean oil) were all down sharply during the reporting period. The Fund’s positions in wheat outperformed the benchmark, due to holding an underweight position in Chicago wheat and an overweight position in Minneapolis wheat.
However, this benefit was outweighed by unfavorable implementation of the Fund’s futures contracts in corn, causing the Fund to underperform the benchmark for the agriculture group overall.
Livestock prices also fell during the period. The Fund was generally overweight in the group versus the benchmark, including a position in feeder cattle that is not included in the benchmark. A sharp drop in feeder cattle prices led to underperformance for the livestock group overall.
Nuveen Gresham Long/Short Commodity Strategy Fund
The Fund’s Class A Shares at net asset value (NAV) for the Nuveen Gresham Long/Short Commodity Strategy Fund outperformed both the Dow Jones-UBS Commodity Index and its Lipper average during the six-month reporting period ended March 31, 2013.
In managing the Fund, Gresham invests in futures contracts of major commodities through a momentum strategy, seeking to take advantage of the market dynamics of rising and falling trends in prices to provide an attractive return. The selection and weighting of commodities for the Fund’s portfolio are calculated from historical physical production, pricing in the global markets, volume of international trade and futures contract liquidity, with limits on portfolio concentration from individual commodities and groups. After the determination of commodities and portfolio weights, the Fund takes long positions in commodities showing rising price trends and sells short those commodities where prices have persistently fallen, relying on the six-month moving average of a commodity’s price as a reference point to determine trends. (Long portfolio positions benefit when prices are rising, while short positions benefit when prices are falling.)
At the end of the reporting period, the Fund’s portfolio generally held long positions in the energy group, and short positions in agriculture, industrial metals, livestock and precious metals. In foods and fibers, positions were mixed between long and short. In comparison, the Dow Jones-UBS Commodity Index holds only long positions. During the reporting period, the Fund outperformed the benchmark in four groups — agriculture, industrial metals, precious metals and foods and fibers — and underperformed in energy and livestock.
In agricultural commodities, the Fund began the period with primarily long positions, but held month-end short positions from December 2012 through March 2013. Prices of agricultural commodities fell during the reporting period. The Fund outperformed the benchmark in corn, wheat, soybeans and soybean oil, as well as for the agricultural group overall.
In industrial metals, the Fund moved between month-end long and short positions during the reporting period, ending the period with short positions in all six contracts. Metals prices were weak during the period and the Fund outperformed the benchmark for the group.
Precious metals prices fell sharply during the reporting period. The Fund started the period with long positions and moved most of the group to month-end short positions in December 2012 through March 2013, outperforming the long-only benchmark.
Prices of food and fiber commodities, except cotton, were down for the reporting period. Excluding cotton, the Fund’s portfolio was positioned short at most month ends. The Fund outperformed the benchmark in sugar and coffee, and for the foods and fibers group overall.
In the energy group, the Fund generally held month-end long positions in heating oil, gas oil, natural gas and unleaded gasoline during the reporting period. In crude oil, however, the Fund’s portfolio had a flat position at the start of the period, but held month-end long positions from November 2012 through March 2013. (The Fund’s investment policy does not implement short positions in the petroleum commodities complex. Instead, when price trends indicate a short position, the Fund takes a zero, or flat, position.) Prices of most energy commodities rose during the reporting period. As a result, the Fund showed an underperformance for most energy commodities and for the group overall.
The Fund began the reporting period with short positions in livestock and moved to long positions midway through; however, its short positions were restored by the end of March 2013. Livestock prices fell during the period. As a result of underperformance in live cattle and lean hogs, the Fund underperformed the benchmark in the livestock group.
The Funds’ Fixed Income Investments
During the period, Nuveen Asset Management invested the available fixed income investment proceeds per the mandated investment guidelines. A majority of the assets managed by Nuveen Asset Management were invested in a laddered strategy of U.S. Treasury bills. Nuveen Asset Management does not anticipate deviating materially from this strategy in the near future barring any unforeseen developments in the marketplace.
Risk Considerations
Mutual fund investing involves risk; principal loss is possible. An investor should consider the following risk factors. Investments in commodity-linked derivative instruments have a high degree of price variability and are subject to rapid and substantial price change which may subject the Funds to greater volatility than investments in traditional securities, particularly if the instruments involve leverage. Because the Funds have a significant portion of its assets concentrated in commodity-linked derivative instruments, developments affecting commodities, including political and regulatory changes, seasonal variations, weather, technology, economic and market conditions, will have a disproportionate impact on the Funds. More information on these risks, as well as information on other risks to which the Funds are subject, such as clearing broker, counterparty, credit, derivatives, frequent trading, non-U.S. investment, regulatory, subsidiary, and tax risks, are included in the Fund’s prospectus.
Short Selling Risk: As a result of short selling risk, the Nuveen Gresham Long/Short Commodity Strategy Fund bears the risk of unlimited loss on contracts it sells short.
Fund Performance and Expense Ratios
The Fund Performance and Expense Ratios for each Fund are shown on the following two pages.
Returns quoted represent past performance, which is no guarantee of future results. Current performance may be higher or lower than the performance shown. Investment returns and principal value will fluctuate so that when shares are redeemed, they may be worth more or less than their original cost. Returns without sales charges would be lower if the sales charge were included. Returns do not reflect the deduction of taxes that a shareholder would pay on Fund distributions or the redemption of Fund shares.
Returns may reflect a contractual agreement between certain Funds and the investment adviser to waive certain fees and expenses; see Notes to Financial Statements, Footnote 7 — Management Fees and Other Transactions with Affiliates for more information. In addition, returns may reflect a voluntary expense limitation by the Funds’ investment adviser that may be modified or discontinued at any time without notice. For the most recent month-end performance visit www.nuveen.com or call (800) 257-8787.
Returns reflect differences in sales charges and expenses, which are primarily differences in distribution and service fees. Fund returns assume reinvestment of dividends and capital gains.
Comparative index and Lipper return information is provided for the Funds’ Class A Shares at net asset value (NAV) only.
The expense ratios shown reflect the Funds’ total operating expenses (before fee waivers and/or expense reimbursements, if any) as shown in the Funds’ most recent prospectus. The expense ratios include management fees and other fees and expenses.
Fund Performance and Expense Ratios (continued)
Nuveen Gresham Diversified Commodity Strategy Fund
Refer to the first page of this Fund Performance and Expense Ratios section for further explanation of the information included within this page.
Fund Performance
Cumulative Total Returns as of March 31, 2013
| | | | | | | | |
| |
| | | Cumulative | |
| | |
| | | 6-Month | | | Since
Inception* | |
Class A Shares at NAV | | | -7.20 | | | | -3.91% | |
Class A Shares at maximum Offering Price | | | -12.54 | | | | -9.43% | |
Dow Jones-UBS Commodity Index** | | | -7.39 | | | | -5.53% | |
Lipper Commodities General Funds Classification Average** | | | -6.90 | | | | -5.33% | |
| | |
Class C Shares | | | -7.52 | | | | -4.38% | |
Class I Shares | | | -7.05 | | | | -3.70% | |
Class A Shares have a maximum 5.75% sales charge (Offering Price). Class A Share purchases of $1 million or more are sold at net asset value without an up-front sales charge but may be subject to a contingent deferred sales charge (CDSC), also known as a back-end sales charge, if redeemed within twelve months of purchase. Class C Shares have a 1% CDSC for redemptions within less than twelve months, which is not reflected in the one-year total return. Class I Shares have no sales charge and may be purchased under limited circumstances or by specified classes of investors.
Expense Ratios as of Most Recent Prospectus
| | | | | | | | |
| | |
| | | Gross
Expense
Ratios | | | Net
Expense
Ratios | |
Class A Shares | | | 3.11% | | | | 1.32% | |
Class C Shares | | | 3.86% | | | | 2.07% | |
Class I Shares | | | 2.86% | | | | 1.07% | |
The Fund’s investment adviser has agreed to waive fees and/or reimburse expenses through January 31, 2015 so that total annual Fund operating expenses (excluding 12b-1 distribution and/or service fees, interest expenses, taxes, acquired fund fees and expenses, fees incurred in acquiring and disposing of portfolio securities and extraordinary expenses) do not exceed 1.10% of the average daily net assets of any class of Fund shares. The expense limitation may be terminated or modified prior to its expiration only with the approval of the Board of Trustees of the Fund.
| * | Since inception returns are from 7/30/12. |
| ** | Refer to the Glossary of Terms Used in the Report for definitions. Indexes and Lipper averages are not available for direct investment. |
Fund Performance and Expense Ratios (continued)
Nuveen Gresham Long/Short Commodity Strategy Fund
Refer to the first page of this Fund Performance and Expense Ratios section for further explanation of the information included within this page.
Fund Performance
Cumulative Total Returns as of March 31, 2013
| | | | | | | | |
| |
| | | Cumulative | |
| | | 6-Month | | | Since
Inception* | |
Class A Shares at NAV | | | -4.99 | | | | -6.70% | |
Class A Shares at maximum Offering Price | | | -10.45 | | | | -12.06% | |
Dow Jones-UBS Commodity Index** | | | -7.39 | | | | -5.53% | |
Barclay BTOP50 Index** | | | 0.44 | | | | -1.39% | |
Lipper Commodities General Funds Classification Average** | | | -6.90 | | | | -5.33% | |
| | |
Class C Shares | | | -5.36 | | | | -7.20% | |
Class I Shares | | | -4.93 | | | | -6.59% | |
Class A Shares have a maximum 5.75% sales charge (Offering Price). Class A Share purchases of $1 million or more are sold at net asset value without an up-front sales charge but may be subject to a contingent deferred sales charge (CDSC), also known as a back-end sales charge, if redeemed within twelve months of purchase. Class C Shares have a 1% CDSC for redemptions within less than twelve months, which is not reflected in the one-year total return. Class I Shares have no sales charge and may be purchased under limited circumstances or by specified classes of investors.
Expense Ratios as of Most Recent Prospectus
| | | | | | | | |
| | |
| | | Gross
Expense
Ratios | | | Net
Expense
Ratios | |
Class A Shares | | | 3.28% | | | | 1.72% | |
Class C Shares | | | 4.03% | | | | 2.47% | |
Class I Shares | | | 3.03% | | | | 1.47% | |
The Fund’s investment adviser has agreed to waive fees and/or reimburse expenses through January 31, 2015 so that total annual Fund operating expenses (excluding 12b-1 distribution and/or service fees, interest expenses, taxes, acquired fund fees and expenses, fees incurred in acquiring and disposing of portfolio securities and extraordinary expenses) do not exceed 1.50% of the average daily net assets of any class of Fund shares. The expense limitation may be terminated or modified prior to its expiration only with the approval of the Board of Trustees of the Fund.
| * | Since inception returns are from 7/30/12. |
| ** | Refer to the Glossary of Terms Used in the Report for definitions. Indexes and Lipper averages are not available for direct investment. |
Holding Summaries as of March 31, 2013
This data relates to the securities held in each Fund’s portfolio of investments. It should not be construed as a measure of performance for the Fund itself.
Nuveen Gresham Diversified Commodity Strategy Fund
Commodity Group Weightings1
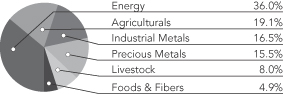
Fixed Income Investments3
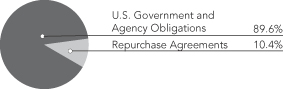
Nuveen Gresham Long/Short Commodity Strategy Fund
Commodity Group Weightings2

Fixed Income Investments3
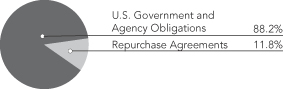
| | | | |
| Top 10 Commodity Holdings1 | | | |
| Crude Oil | | | 20.1% | |
| Gold | | | 11.0% | |
| Copper | | | 8.7% | |
| Natural Gas | | | 7.5% | |
| Soybeans | | | 5.9% | |
| Corn | | | 5.3% | |
| Live Cattle | | | 4.9% | |
| Aluminum | | | 4.4% | |
| Wheat | | | 4.1% | |
| Unleaded Gas | | | 3.7% | |
| | | | |
| Top 5 Long Commodity Holdings2 | | | |
| Crude Oil | | | 18.8% | |
| Natural Gas | | | 8.0% | |
| Unleaded Gas | | | 3.7% | |
| Cotton | | | 1.3% | |
| Coffee | | | 0.6% | |
| |
| Top 5 Short Commodity Holdings2 | | | |
| Gold | | | 11.2% | |
| Copper | | | 7.5% | |
| Soybeans | | | 5.8% | |
| Corn | | | 5.2% | |
Live Cattle | | | 4.9% | |
| | | | | | | | | | | | |
| Long/Short Weightings2 | | Long | | | Short | | | Flat | |
| Energy | | | 30.5% | | | | 0.0% | | | | 5.6% | |
| Agriculturals | | | 0.0% | | | | 19.1% | | | | 0.0% | |
| Precious Metals | | | 0.0% | | | | 16.3% | | | | 0.0% | |
| Industrial Metal | | | 0.0% | | | | 15.7% | | | | 0.0% | |
| Livestock | | | 0.0% | | | | 8.0% | | | | 0.0% | |
| Food & Fibers | | | 1.9% | | | | 2.9% | | | | 0.0% | |
| 1 | Portfolio weights are shown as a percentage of the Fund’s commodity futures portfolio only. These figures do not reflect the Fund’s cash/cash equivalent collateral positions or offsetting short and long futures positions on the London Metal Exchange. Holdings are subject to change. |
| 2 | Portfolio weights are shown as a percentage of the Fund’s commodity futures portfolio only, including gross exposure of long, short, and flat allocations. These figures do not reflect the Fund’s cash/cash equivalent collateral positions or offsetting short and long futures positions on the London Metal Exchange. Holdings are subject to change. |
| 3 | As a percentage of total short-term investments. Holdings are subject to change. |
Expense Examples
As a shareholder of one or more of the Funds, you incur two types of costs: (1) transaction costs, including up-front and back-end sales charges (loads) or redemption fees, where applicable; and (2) ongoing costs, including management fees; distribution and service (12b-1) fees, where applicable; and other Fund expenses. The Examples below are intended to help you understand your ongoing costs (in dollars) of investing in the Funds and to compare these costs with the ongoing costs of investing in other mutual funds.
The Examples below are based on an investment of $1,000 invested at the beginning of the period and held through the end of the period.
The information under “Actual Performance,” together with the amount you invested, allows you to estimate actual expenses incurred over the reporting period. Simply divide your account value by $1,000 (for example, an $8,600 account value divided by $1,000 = 8.60) and multiply the result by the cost shown for your share class, in the row entitled “Expenses Incurred During Period” to estimate the expenses incurred on your account during this period.
The information under “Hypothetical Performance,” provides information about hypothetical account values and hypothetical expenses based on the respective Fund’s actual expense ratio and an assumed rate of return of 5% per year before expenses, which is not the Fund’s actual return. The hypothetical account values and expenses may not be used to estimate the actual ending account balance or expense you incurred for the period. You may use this information to compare the ongoing costs of investing in the Fund and other funds. To do so, compare this 5% hypothetical example with the 5% hypothetical examples that appear in the shareholder reports of the other funds.
Please note that the expenses shown in the tables are meant to highlight your ongoing costs only and do not reflect any transaction costs. Therefore, the hypothetical information is useful in comparing ongoing costs only, and will not help you determine the relative total costs of owning different funds or share classes. In addition, if these transaction costs were included, your costs would have been higher.
Nuveen Gresham Diversified Commodity Strategy Fund
| | | | | | | | | | | | | | | | | | | | | | | | | | |
| | | | | Hypothetical Performance | |
| | | Actual Performance | | | | | (5% annualized return before expenses) | |
| | | A Shares | | | C Shares | | | I Shares | | | | | A Shares | | | C Shares | | | I Shares | |
| Beginning Account Value (10/01/12) | | $ | 1,000.00 | | | $ | 1,000.00 | | | $ | 1,000.00 | | | | | $ | 1,000.00 | | | $ | 1,000.00 | | | $ | 1,000.00 | |
| Ending Account Value (3/31/13) | | $ | 928.00 | | | $ | 924.80 | | | $ | 929.50 | | | | | $ | 1,018.35 | | | $ | 1,014.61 | | | $ | 1,019.60 | |
| Expenses Incurred During Period | | $ | 6.34 | | | $ | 9.93 | | | $ | 5.15 | | | | | $ | 6.64 | | | $ | 10.40 | | | $ | 5.39 | |
For each class of the Fund, expenses are equal to the Fund’s annualized net expense ratio of 1.32%, 2.07% and 1.07% for Classes A, C and I, respectively, multiplied by the average account value over the period, multiplied by 182/365 (to reflect the one-half year period).
Nuveen Gresham Diversified Long/Short Commodity Fund
| | | | | | | | | | | | | | | | | | | | | | | | | | |
| | | | | | | | | | | | | | Hypothetical Performance | |
| | | Actual Performance | | | | | (5% annualized return before expenses) | |
| | | A Shares | | | C Shares | | | I Shares | | | | | A Shares | | | C Shares | | | I Shares | |
| Beginning Account Value (10/01/12) | | $ | 1,000.00 | | | $ | 1,000.00 | | | $ | 1,000.00 | | | | | $ | 1,000.00 | | | $ | 1,000.00 | | | $ | 1,000.00 | |
| Ending Account Value (3/31/13) | | $ | 950.10 | | | $ | 946.40 | | | $ | 950.70 | | | | | $ | 1,016.36 | | | $ | 1,012.62 | | | $ | 1,017.60 | |
| Expenses Incurred During Period | | $ | 8.36 | | | $ | 11.99 | | | $ | 7.15 | | | | | $ | 8.65 | | | $ | 12.39 | | | $ | 7.39 | |
For each class of the Fund, expenses are equal to the Fund’s annualized net expense ratio of 1.72%, 2.47% and 1.47% for Classes A, C and I, respectively, multiplied by the average account value over the period, multiplied by 182/365 (to reflect the one-half year period).
Consolidated Portfolio of Investments (Unaudited)
Nuveen Gresham Diversified Commodity Strategy Fund
March 31, 2013
| | | | | | | | | | | | | | | | | | | | |
Principal
Amount (000) | | | Description (1) | | Coupon | | | Maturity | | | Ratings (2) | | | Value | |
| | | | SHORT-TERM INVESTMENTS – 83.8% | | | | | | | | | | | | | | | | |
| | | | | |
| | | | U.S. Government and Agency Obligations – 75.1% | | | | | | | | | | | | | | | | |
| | | | | |
| $ | 1,500 | | | Fannie Mae Notes | | | 0.000% | | | | 6/03/13 | | | | AA+ | | | $ | 1,499,868 | |
| | | | | |
| | 1,285 | | | U.S. Treasury Bills | | | 0.000% | | | | 5/02/13 | | | | Aaa | | | | 1,284,945 | |
| | | | | |
| | 1,700 | | | U.S. Treasury Bills | | | 0.000% | | | | 5/30/13 | | | | Aaa | | | | 1,699,827 | |
| | | | | |
| | 1,000 | | | U.S. Treasury Bills | | | 0.000% | | | | 6/27/13 | | | | Aaa | | | | 999,831 | |
| | | | | |
| | 1,500 | | | U.S. Treasury Bills | | | 0.000% | | | | 7/25/13 | | | | Aaa | | | | 1,499,652 | |
| | | | | |
| | 1,700 | | | U.S. Treasury Bills | | | 0.000% | | | | 9/19/13 | | | | Aaa | | | | 1,699,172 | |
| | | | | |
| | 1,500 | | | U.S. Treasury Bills | | | 0.000% | | | | 12/12/13 | | | | Aaa | | | | 1,498,831 | |
| | | | | |
| | 1,500 | | | U.S. Treasury Bills | | | 0.000% | | | | 1/09/14 | | | | Aaa | | | | 1,498,645 | |
| | | | | |
| | 1,650 | | | U.S. Treasury Bills | | | 0.000% | | | | 2/06/14 | | | | Aaa | | | | 1,648,256 | |
| | | | | |
| | 1,500 | | | U.S. Treasury Bills | | | 0.000% | | | | 3/06/14 | | | | Aaa | | | | 1,498,202 | |
| | 14,835 | | | Total U.S. Government and Agency Obligations | | | | | | | | | | | | | | | 14,827,229 | |
| | | | Repurchase Agreements – 8.7% | | | | | | | | | | | | | | | | |
| | | | | |
| $ | 1,718 | | | Repurchase Agreement with State Street Bank, dated 3/28/13, repurchase price $1,717,753, collateralized by $1,755,000 Federal National Mortgage Association Notes, 2.140%, due 11/07/22, value $1,755,821 | | | 0.010% | | | | 4/01/13 | | | | N/A | | | | 1,717,751 | |
| | | | Total Short-Term Investments (cost $16,543,643) – 83.8% | | | | | | | | | | | | | | | 16,544,980 | |
| | | | Other Assets Less Liabilities – 16.2% | | | | | | | | | | | | | | | 3,188,911 | |
| | | | Net Assets – 100% | | | | | | | | | | | | | | $ | 19,733,891 | |
Investments in Derivatives as of March 31, 2013
Futures Contracts outstanding:
| | | | | | | | | | | | | | | | | | | | | | |
| Commodity Group | | Contract | | Contract
Position (3) | | | Contract
Expiration | | | Number of Contracts | | | Notional
Amount
at Value | | | Unrealized
Appreciation
(Depreciation) | |
| Energy | | Crude Oil | | | | | | | | | | | | | | | | | | | | |
| | | | | | |
| | ICE Brent Crude Oil Futures Contract | | | Long | | | | July 2013 | | | | 13 | | | $ | 1,422,330 | | | $ | (54 | ) |
| | | | | | |
| | ICE Brent Crude Oil Futures Contract | | | Long | | | | September 2013 | | | | 3 | | | | 324,960 | | | | 4,718 | |
| | | | | | |
| | NYMEX Crude Oil Futures Contract | | | Long | | | | July 2013 | | | | 12 | | | | 1,171,680 | | | | 36,661 | |
| | | | | | |
| | NYMEX Crude Oil Futures Contract | | | Long | | | | September 2013 | | | | 6 | | | | 583,800 | | | | 14,811 | |
| | Total Crude Oil | | | | | | | | | | | | | | | 3,502,770 | | | | 56,136 | |
| | Gas Oil | | | | | | | | | | | | | | | | | | | | |
| | | | | | |
| | ICE Gas Oil Futures Contract | | | Long | | | | May 2013 | | | | 2 | | | | 183,650 | | | | (4,480 | ) |
| | Unleaded Gas | | | | | | | | | | | | | | | | | | | | |
| | | | | | |
| | NYMEX Gasoline RBOB Futures Contract | | | Long | | | | May 2013 | | | | 3 | | | | 391,936 | | | | (4,207 | ) |
| | | | | | |
| | NYMEX Gasoline RBOB Futures Contract | | | Long | | | | July 2013 | | | | 2 | | | | 255,998 | | | | (1,499 | ) |
| | Total Unleaded Gas | | | | | | | | | | | | | | | 647,934 | | | | (5,706 | ) |
| | Heating Oil | | | | | | | | | | | | | | | | | | | | |
| | | | | | |
| | NYMEX Heating Oil Futures Contract | | | Long | | | | May 2013 | | | | 1 | | | | 127,974 | | | | (6,127 | ) |
| | | | | | |
| | NYMEX Heating Oil Futures Contract | | | Long | | | | July 2013 | | | | 3 | | | | 381,528 | | | | (13,171 | ) |
| | | | | | |
| | NYMEX Heating Oil Futures Contract | | | Long | | | | September 2013 | | | | 1 | | | | 127,121 | | | | (5,599 | ) |
| | Total Heating Oil | | | | | | | | | | | | | | | 636,623 | | | | (24,897 | ) |
Investments in Derivatives as of March 31, 2013 (continued)
Futures Contracts outstanding (continued):
| | | | | | | | | | | | | | | | | | | | | | |
| Commodity Group | | Contract | | Contract
Position (3) | | | Contract
Expiration | | | Number of Contracts | | | Notional
Amount
at Value | | | Unrealized
Appreciation
(Depreciation) | |
Energy
(continued) | | Natural Gas | | | | | | | | | | | | | | | | | | | | |
| | NYMEX Natural Gas Futures Contract | | | Long | | | | May 2013 | | | | 6 | | | $ | 241,440 | | | $ | 36,004 | |
| | | | | | |
| | NYMEX Natural Gas Futures Contract | | | Long | | | | July 2013 | | | | 15 | | | | 616,950 | | | | 17,244 | |
| | | | | | |
| | NYMEX Natural Gas Futures Contract | | | Long | | | | September 2013 | | | | 11 | | | | 452,870 | | | | 15,131 | |
| | Total Natural Gas | | | | | | | | | | | | | | | 1,311,260 | | | | 68,379 | |
| | Total Energy | | | | | | | | | | | | | | | 6,282,237 | | | | 89,432 | |
| Industrial Metals | | Aluminum | | | | | | | | | | | | | | | | | | | | |
| | | | | | |
| | LME Aluminum High Grade Futures Contract | | | Long | | | | May 2013 | | | | 11 | | | | 521,675 | | | | (60,208 | ) |
| | | | | | |
| | LME Aluminum High Grade Futures Contract | | | Short | | | | May 2013 | | | | (11 | ) | | | (521,675 | ) | | | 40,600 | |
| | | | | | |
| | LME Aluminum High Grade Futures Contract | | | Long | | | | July 2013 | | | | 16 | | | | 761,000 | | | | (52,548 | ) |
| | Total Aluminum | | | | | | | | | | | | | | | 761,000 | | | | (72,156 | ) |
| | Copper | | | | | | | | | | | | | | | | | | | | |
| | | | | | |
| | CEC Copper High Grade Futures Contract | | | Long | | | | May 2013 | | | | 9 | | | | 765,450 | | | | (63,275 | ) |
| | | | | | |
| | LME Copper Futures Contract | | | Long | | | | April 2013 | | | | 3 | | | | 563,869 | | | | (53,416 | ) |
| | | | | | |
| | LME Copper Futures Contract | | | Short | | | | April 2013 | | | | (3 | ) | | | (563,869 | ) | | | 19,881 | |
| | | | | | |
| | LME Copper Futures Contract | | | Long | | | | May 2013 | | | | 4 | | | | 752,725 | | | | (26,312 | ) |
| | Total Copper | | | | | | | | | | | | | | | 1,518,175 | | | | (123,122 | ) |
| | Lead | | | | | | | | | | | | | | | | | | | | |
| | | | | | |
| | LME Lead Futures Contract | | | Long | | | | April 2013 | | | | 2 | | | | 104,837 | | | | (14,562 | ) |
| | | | | | |
| | LME Lead Futures Contract | | | Short | | | | April 2013 | | | | (2 | ) | | | (104,837 | ) | | | 5,037 | |
| | | | | | |
| | LME Lead Futures Contract | | | Long | | | | May 2013 | | | | 3 | | | | 157,762 | | | | (8,444 | ) |
| | Total Lead | | | | | | | | | | | | | | | 157,762 | | | | (17,969 | ) |
| | Nickel | | | | | | | | | | | | | | | | | | | | |
| | | | | | |
| | LME Nickel Futures Contract | | | Long | | | | May 2013 | | | | 2 | | | | 199,512 | | | | (10,086 | ) |
| | | | | | |
| | LME Nickel Futures Contract | | | Short | | | | May 2013 | | | | (2 | ) | | | (199,512 | ) | | | 3,618 | |
| | | | | | |
| | LME Nickel Futures Contract | | | Long | | | | July 2013 | | | | 2 | | | | 200,100 | | | | (3,558 | ) |
| | Total Nickel | | | | | | | | | | | | | | | 200,100 | | | | (10,026 | ) |
| | Zinc | | | | | | | | | | | | | | | | | | | | |
| | | | | | |
| | LME Zinc Futures Contract | | | Long | | | | May 2013 | | | | 3 | | | | 141,281 | | | | (15,323 | ) |
| | | | | | |
| | LME Zinc Futures Contract | | | Short | | | | May 2013 | | | | (3 | ) | | | (141,281 | ) | | | 10,794 | |
| | | | | | |
| | LME Zinc Futures Contract | | | Long | | | | July 2013 | | | | 5 | | | | 237,844 | | | | (14,106 | ) |
| | Total Zinc | | | | | | | | | | | | | | | 237,844 | | | | (18,635 | ) |
| | Total Industrial Metals | | | | | | | | | | | | | | | 2,874,881 | | | | (241,908 | ) |
| Agriculturals | | Corn | | | | | | | | | | | | | | | | | | | | |
| | | | | | |
| | CBOT Corn Futures Contract | | | Long | | | | May 2013 | | | | 3 | | | | 104,287 | | | | 340 | |
| | | | | | |
| | CBOT Corn Futures Contract | | | Long | | | | July 2013 | | | | 16 | | | | 540,800 | | | | (13,045 | ) |
| | | | | | |
| | CBOT Corn Futures Contract | | | Long | | | | September 2013 | | | | 10 | | | | 281,500 | | | | (9,009 | ) |
| | Total Corn | | | | | | | | | | | | | | | 926,587 | | | | (21,714 | ) |
| | Soybean Meal | | | | | | | | | | | | | | | | | | | | |
| | | | | | |
| | CBOT Soybean Meal Futures Contract | | | Long | | | | May 2013 | | | | 1 | | | | 40,460 | | | | 40 | |
| | | | | | |
| | CBOT Soybean Meal Futures Contract | | | Long | | | | July 2013 | | | | 8 | | | | 320,400 | | | | (15,186 | ) |
| | | | | | |
| | CBOT Soybean Meal Futures Contract | | | Long | | | | December 2013 | | | | 1 | | | | 34,670 | | | | (643 | ) |
| | Total Soybean Meal | | | | | | | | | | | | | | | 395,530 | | | | (15,789 | ) |
Consolidated Portfolio of Investments (Unaudited)
Nuveen Gresham Diversified Commodity Strategy Fund (continued)
March 31, 2013
Investments in Derivatives as of March 31, 2013 (continued)
Futures Contracts outstanding (continued):
| | | | | | | | | | | | | | | | | | | | | | |
| Commodity Group | | Contract | | Contract
Position (3) | | | Contract
Expiration | | | Number of Contracts | | | Notional
Amount
at Value | | | Unrealized
Appreciation
(Depreciation) | |
Agriculturals
(continued) | | Soybean Oil | | | | | | | | | | | | | | | | | | | | |
| | CBOT Soybean Oil Futures Contract | | | Long | | | | July 2013 | | | | 4 | | | $ | 120,840 | | | $ | (6,276 | ) |
| | | | | | |
| | CBOT Soybean Oil Futures Contract | | | Long | | | | December 2013 | | | | 5 | | | | 149,220 | | | | (1,845 | ) |
| | Total Soybean Oil | | | | | | | | | | | | | | | 270,060 | | | | (8,121 | ) |
| | Soybeans | | | | | | | | | | | | | | | | | | | | |
| | | | | | |
| | CBOT Soybean Futures Contract | | | Long | | | | May 2013 | | | | 3 | | | | 210,712 | | | | 335 | |
| | | | | | |
| | CBOT Soybean Futures Contract | | | Long | | | | July 2013 | | | | 9 | | | | 623,475 | | | | (21,972 | ) |
| | | | | | |
| | CBOT Soybean Futures Contract | | | Long | | | | November 2013 | | | | 3 | | | | 187,725 | | | | (2,242 | ) |
| | Total Soybeans | | | | | | | | | | | | | | | 1,021,912 | | | | (23,879 | ) |
| | Wheat | | | | | | | | | | | | | | | | | | | | |
| | | | | | |
| | CBOT Wheat Futures Contract | | | Long | | | | July 2013 | | | | 8 | | | | 276,400 | | | | (12,892 | ) |
| | | | | | |
| | CBOT Wheat Futures Contract | | | Long | | | | September 2013 | | | | 2 | | | | 69,925 | | | | (1,167 | ) |
| | | | | | |
| | KCBT Wheat Futures Contract | | | Long | | | | May 2013 | | | | 2 | | | | 72,675 | | | | (8,164 | ) |
| | | | | | |
| | KCBT Wheat Futures Contract | | | Long | | | | July 2013 | | | | 3 | | | | 109,838 | | | | (5,392 | ) |
| | | | | | |
| | MGEX Red Spring Wheat Futures Contract | | | Long | | | | May 2013 | | | | 1 | | | | 39,013 | | | | (2,594 | ) |
| | | | | | |
| | MGEX Red Spring Wheat Futures Contract | | | Long | | | | July 2013 | | | | 4 | | | | 156,100 | | | | (4,949 | ) |
| | Total Wheat | | | | | | | | | | | | | | | 723,951 | | | | (35,158 | ) |
| | Total Agriculturals | | | | | | | | | | | | | | | 3,338,040 | | | | (104,661 | ) |
| Precious Metals | | Gold | | | | | | | | | | | | | | | | | | | | |
| | | | | | |
| | CEC Gold Futures Contract | | | Long | | | | June 2013 | | | | 12 | | | | 1,914,840 | | | | 15,671 | |
| | Palladium | | | | | | | | | | | | | | | | | | | | |
| | | | | | |
| | NYMEX Palladium Futures Contract | | | Long | | | | June 2013 | | | | 1 | | | | 76,825 | | | | 1,715 | |
| | Platinum | | | | | | | | | | | | | | | | | | | | |
| | | | | | |
| | NYMEX Platinum Futures Contract | | | Long | | | | July 2013 | | | | 2 | | | | 157,460 | | | | (2,620 | ) |
| | Silver | | | | | | | | | | | | | | | | | | | | |
| | | | | | |
| | CEC Silver Futures Contract | | | Long | | | | May 2013 | | | | 4 | | | | 566,460 | | | | (40,353 | ) |
| | Total Precious Metals | | | | | | | | | | | | | | | 2,715,585 | | | | (25,587 | ) |
| Foods & Fibers | | Cocoa | | | | | | | | | | | | | | | | | | | | |
| | | | | | |
| | ICE Cocoa Futures Contract | | | Long | | | | May 2013 | | | | 3 | | | | 65,100 | | | | (161 | ) |
| | Coffee | | | | | | | | | | | | | | | | | | | | |
| | | | | | |
| | ICE Coffee C Futures Contract | | | Long | | | | May 2013 | | | | 3 | | | | 154,294 | | | | (4,907 | ) |
| | | | | | |
| | LIFFE Coffee Robusta Futures Contract | | | Long | | | | May 2013 | | | | 4 | | | | 82,040 | | | | (4,056 | ) |
| | Total Coffee | | | | | | | | | | | | | | | 236,334 | | | | (8,963 | ) |
| | Cotton | | | | | | | | | | | | | | | | | | | | |
| | | | | | |
| | ICE Cotton Futures Contract | | | Long | | | | May 2013 | | | | 2 | | | | 88,460 | | | | 8,672 | |
| | | | | | |
| | ICE Cotton Futures Contract | | | Long | | | | July 2013 | | | | 2 | | | | 89,810 | | | | (3,630 | ) |
| | | | | | |
| | ICE Cotton Futures Contract | | | Long | | | | December 2013 | | | | 1 | | | | 43,685 | | | | 859 | |
| | Total Cotton | | | | | | | | | | | | | | | 221,955 | | | | 5,901 | |
| | Sugar | | | | | | | | | | | | | | | | | | | | |
| | | | | | |
| | ICE Sugar Futures Contract | | | Long | | | | May 2013 | | | | 3 | | | | 59,338 | | | | (4,830 | ) |
| | | | | | |
| | ICE Sugar Futures Contract | | | Long | | | | July 2013 | | | | 14 | | | | 277,536 | | | | (13,544 | ) |
| | Total Sugar | | | | | | | | | | | | | | | 336,874 | | | | (18,374 | ) |
| | Total Foods & Fibers | | | | | | | | | | | | | | | 860,263 | | | | (21,597 | ) |
Investments in Derivatives as of March 31, 2013 (continued)
Futures Contracts outstanding (continued):
| | | | | | | | | | | | | | | | | | | | | | |
| Commodity Group | | Contract | | Contract
Position (3) | | | Contract
Expiration | | | Number of Contracts | | | Notional
Amount
at Value | | | Unrealized
Appreciation
(Depreciation) | |
| Livestock | | Feeder Cattle | | | | | | | | | | | | | | | | | | | | |
| | | | | | |
| | CME Feeder Cattle Futures Contract | | | Long | | | | May 2013 | | | | 3 | | | | 217,613 | | | | 2,266 | |
| | Lean Hogs | | | | | | | | | | | | | | | | | | | | |
| | | | | | |
| | CME Lean Hogs Futures Contract | | | Long | | | | June 2013 | | | | 9 | | | $ | 327,870 | | | $ | (2,821 | ) |
| | Live Cattle | | | | | | | | | | | | | | | | | | | | |
| | | | | | |
| | CME Live Cattle Futures Contract | | | Long | | | | June 2013 | | | | 14 | | | | 696,500 | | | | 5,010 | |
| | | | | | |
| | CME Live Cattle Futures Contract | | | Long | | | | August 2013 | | | | 3 | | | | 150,240 | | | | 101 | |
| | Total Live Cattle | | | | | | | | | | | | | | | 846,740 | | | | 5,111 | |
| | Total Livestock | | | | | | | | | | | | | | | 1,392,223 | | | | 4,556 | |
| | Total Futures Contracts outstanding | | | | | | | | | | | | | | $ | 17,463,229 | | | $ | (299,765 | ) |
| | | | For Fund portfolio compliance purposes, the Fund’s industry classifications refer to any one or more of the industry subclassifications used by one or more widely recognized market indexes or ratings group indexes, and/or as defined by Fund management. This definition may not apply for purposes of this report which may combine industry sub-classifications into sectors for reporting ease. |
| | (1) | | All percentages shown in the Portfolio of Investments are based on net assets. |
| | (2) | | Ratings: Using the highest of Standard & Poor’s Group, Moody’s Investors Service, Inc. or Fitch, Inc. rating. |
| | (3) | | The Fund expects to invest only in long futures contracts. Some short futures positions arise in futures contracts traded on the London Metal Exchange (“LME”) solely as the result of closing existing long LME futures positions. For every short LME futures contract outstanding, the Fund had previously entered into a long LME futures contract. The London Clearing House is the counterparty for both the long and short position. |
| | CBOT | | Chicago Board of Trade |
| | CEC | | Commodities Exchange Center |
| | CME | | Chicago Mercantile Exchange |
| | ICE | | Intercontinental Exchange |
| | KCBT | | Kansas City Board of Trade |
| | LIFFE | | London International Financial Futures Exchange |
| | LME | | London Metal Exchange |
| | MGEX | | Minneapolis Grain Exchange |
| | NYMEX | | New York Mercantile Exchange |
| | RBOB | | Reformulated Gasoline Blendstock for Oxygen Blending |
See accompanying notes to financial statements.
Consolidated Portfolio of Investments (Unaudited)
Nuveen Gresham Long/Short Commodity Strategy Fund
March 31, 2013
| | | | | | | | | | | | | | | | | | | | |
Principal
Amount (000) | | | Description (1) | | Coupon | | | Maturity | | | Ratings (2) | | | Value | |
| | | | SHORT-TERM INVESTMENTS – 93.7% | | | | | | | | | | | | | | | | |
| | | | | |
| | | | U.S. Government and Agency Obligations – 82.7% | | | | | | | | | | | | | | | | |
| | | | | |
| $ | 1,500 | | | Fannie Mae Notes | | | 0.000% | | | | 6/03/13 | | | | AA+ | | | $ | 1,499,868 | |
| | | | | |
| | 1,475 | | | U.S. Treasury Bills | | | 0.000% | | | | 5/02/13 | | | | Aaa | | | | 1,474,936 | |
| | | | | |
| | 1,600 | | | U.S. Treasury Bills | | | 0.000% | | | | 5/30/13 | | | | Aaa | | | | 1,599,837 | |
| | | | | |
| | 1,050 | | | U.S. Treasury Bills | | | 0.000% | | | | 9/19/13 | | | | Aaa | | | | 1,049,489 | |
| | | | | |
| | 165 | | | U.S. Treasury Bills | | | 0.000% | | | | 1/09/14 | | | | Aaa | | | | 164,851 | |
| | | | | |
| | 225 | | | U.S. Treasury Bills | | | 0.000% | | | | 3/06/14 | | | | Aaa | | | | 224,730 | |
| | 6,015 | | | Total U.S. Government and Agency Obligations | | | | | | | | | | | | | | | 6,013,711 | |
| | | | Repurchase Agreements – 11.0% | | | | | | | | | | | | | | | | |
| | | | | |
| $ | 804 | | | Repurchase Agreement with State Street Bank, dated 3/28/13, repurchase price $803,722, collateralized by $820,000 Federal National Mortgage Association Notes, 2.140%, due 11/07/22, value $820,384 | | | 0.010% | | | | 4/01/13 | | | | N/A | | | | 803,721 | |
| | | | Total Short-Term Investments (cost $6,816,756) – 93.7% | | | | | | | | | | | | | | | 6,817,432 | |
| | | | Other Assets Less Liabilities – 6.3% | | | | | | | | | | | | | | | 455,548 | |
| | | | Net Assets – 100% | | | | | | | | | | | | | | $ | 7,272,980 | |
Investments in Derivatives as of March 31, 2013
Futures Contracts outstanding:
| | | | | | | | | | | | | | | | | | | | | | |
| Commodity Group | | Contract | | Contract
Position (3) | | | Contract
Expiration | | | Number of Contracts | | | Notional
Amount
at Value* | | | Unrealized
Appreciation
(Depreciation) | |
| Energy | | Crude Oil | | | | | | | | | | | | | | | | | | | | |
| | | | | | |
| | ICE Brent Crude Oil Futures Contract | | | Long | | | | July 2013 | | | | 6 | | | $ | 656,460 | | | $ | 10,385 | |
| | | | | | |
| | NYMEX Crude Oil Futures Contract | | | Long | | | | June 2013 | | | | 7 | | | | 682,430 | | | | 29,073 | |
| | Total Crude Oil | | | | | | | | | | | | | | | 1,338,890 | | | | 39,458 | |
| | Unleaded Gas | | | | | | | | | | | | | | | | | | | | |
| | | | | | |
| | NYMEX Gasoline RBOB Futures Contract | | | Long | | | | June 2013 | | | | 2 | | | | 259,022 | | | | 4,895 | |
| | Natural Gas | | | | | | | | | | | | | | | | | | | | |
| | | | | | |
| | NYMEX Natural Gas Futures Contract | | | Long | | | | June 2013 | | | | 14 | | | | 569,240 | | | | 43,774 | |
| | Total Energy | | | | | | | | | | | | | | | 2,167,152 | | | | 88,127 | |
| Industrial Metals | | Aluminum | | | | | | | | | | | | | | | | | | | | |
| | | | | | |
| | LME Aluminum High Grade Futures Contract | | | Long | | | | April 2013 | | | | 6 | | | | 282,375 | | | | (40,331 | ) |
| | | | | | |
| | LME Aluminum High Grade Futures Contract | | | Short | | | | April 2013 | | | | (6 | ) | | | (282,375 | ) | | | 33,606 | |
| | | | | | |
| | LME Aluminum High Grade Futures Contract | | | Long | | | | May 2013 | | | | 12 | | | | 569,100 | | | | (44,950 | ) |
| | | | | | |
| | LME Aluminum High Grade Futures Contract | | | Short | | | | May 2013 | | | | (12 | ) | | | (569,100 | ) | | | 46,050 | |
| | | | | | |
| | LME Aluminum High Grade Futures Contract | | | Short | | | | June 2013 | | | | (7 | ) | | | (334,863 | ) | | | 11,931 | |
| | Total Aluminum | | | | | | | | | | | | | | | (334,863 | ) | | | 6,306 | |
| | Copper | | | | | | | | | | | | | | | | | | | | |
| | | | | | |
| | CEC Copper High Grade Futures Contract | | | Short | | | | July 2013 | | | | (4 | ) | | | (342,200 | ) | | | 10,371 | |
| | | | | | |
| | LME Copper Futures Contract | | | Long | | | | April 2013 | | | | 2 | | | | 375,913 | | | | (34,738 | ) |
| | | | | | |
| | LME Copper Futures Contract | | | Short | | | | April 2013 | | | | (2 | ) | | | (375,913 | ) | | | 33,313 | |
| | | | | | |
| | LME Copper Futures Contract | | | Long | | | | May 2013 | | | | 2 | | | | 376,363 | | | | (23,494 | ) |
| | | | | | |
| | LME Copper Futures Contract | | | Short | | | | May 2013 | | | | (2 | ) | | | (376,363 | ) | | | 21,388 | |
| | | | | | |
| | LME Copper Futures Contract | | | Short | | | | June 2013 | | | | (1 | ) | | | (188,450 | ) | | | 4,256 | |
| | Total Copper | | | | | | | | | | | | | | | (530,650 | ) | | | 11,096 | |
Investments in Derivatives as of March 31, 2013 (continued)
Futures Contracts outstanding (continued):
| | | | | | | | | | | | | | | | | | | | | | |
| Commodity Group | | Contract | | Contract
Position (3) | | | Contract
Expiration | | | Number of Contracts | | | Notional
Amount
at Value* | | | Unrealized
Appreciation
(Depreciation) | |
Industrial Metals
(continued) | | Lead | | | | | | | | | | | | | | | | | | | | |
| | LME Lead Futures Contract | | | Long | | | | April 2013 | | | | 1 | | | $ | 52,419 | | | $ | (8,419 | ) |
| | | | | | |
| | LME Lead Futures Contract | | | Short | | | | April 2013 | | | | (1 | ) | | | (52,419 | ) | | | 8,881 | |
| | | | | | |
| | LME Lead Futures Contract | | | Long | | | | May 2013 | | | | 1 | | | | 52,587 | | | | (8,775 | ) |
| | | | | | |
| | LME Lead Futures Contract | | | Short | | | | May 2013 | | | | (1 | ) | | | (52,587 | ) | | | 3,425 | |
| | | | | | |
| | LME Lead Futures Contract | | | Short | | | | June 2013 | | | | (1 | ) | | | (52,781 | ) | | | 3,431 | |
| | Total Lead | | | | | | | | | | | | | | | (52,781 | ) | | | (1,457 | ) |
| | Nickel | | | | | | | | | | | | | | | | | | | | |
| | | | | | |
| | LME Nickel Futures Contract | | | Long | | | | April 2013 | | | | 1 | | | | 99,615 | | | | (6,693 | ) |
| | | | | | |
| | LME Nickel Futures Contract | | | Short | | | | April 2013 | | | | (1 | ) | | | (99,615 | ) | | | 12,093 | |
| | | | | | |
| | LME Nickel Futures Contract | | | Long | | | | May 2013 | | | | 2 | �� | | | 199,512 | | | | (11,880 | ) |
| | | | | | |
| | LME Nickel Futures Contract | | | Short | | | | May 2013 | | | | (2 | ) | | | (199,512 | ) | | | 4,308 | |
| | | | | | |
| | LME Nickel Futures Contract | | | Short | | | | June 2013 | | | | (1 | ) | | | (99,912 | ) | | | (204 | ) |
| | Total Nickel | | | | | | | | | | | | | | | (99,912 | ) | | | (2,376 | ) |
| | Zinc | | | | | | | | | | | | | | | | | | | | |
| | | | | | |
| | LME Zinc Futures Contract | | | Long | | | | April 2013 | | | | 2 | | | | 93,562 | | | | (13,737 | ) |
| | | | | | |
| | LME Zinc Futures Contract | | | Short | | | | April 2013 | | | | (2 | ) | | | (93,562 | ) | | | 15,338 | |
| | | | | | |
| | LME Zinc Futures Contract | | | Long | | | | May 2013 | | | | 2 | | | | 94,187 | | | | (14,838 | ) |
| | | | | | |
| | LME Zinc Futures Contract | | | Short | | | | May 2013 | | | | (2 | ) | | | (94,187 | ) | | | 6,625 | |
| | | | | | |
| | LME Zinc Futures Contract | | | Short | | | | June 2013 | | | | (2 | ) | | | (94,712 | ) | | | 6,538 | |
| | Total Zinc | | | | | | | | | | | | | | | (94,712 | ) | | | (74 | ) |
| | Total Industrial Metals | | | | | | | | | | | | | | | (1,112,918 | ) | | | 13,495 | |
| Agriculturals | | Corn | | | | | | | | | | | | | | | | | | | | |
| | | | | | |
| | CBOT Corn Futures Contract | | | Short | | | | July 2013 | | | | (11 | ) | | | (371,800 | ) | | | 14,025 | |
| | Soybean Meal | | | | | | | | | | | | | | | | | | | | |
| | | | | | |
| | CBOT Soybean Meal Futures Contract | | | Short | | | | July 2013 | | | | (4 | ) | | | (160,200 | ) | | | 8,098 | |
| | Soybean Oil | | | | | | | | | | | | | | | | | | | | |
| | | | | | |
| | CBOT Soybean Oil Futures Contract | | | Short | | | | July 2013 | | | | (4 | ) | | | (120,840 | ) | | | (1,152 | ) |
| | Soybeans | | | | | | | | | | | | | | | | | | | | |
| | | | | | |
| | CBOT Soybean Futures Contract | | | Short | | | | July 2013 | | | | (6 | ) | | | (415,650 | ) | | | 13,425 | |
| | Wheat | | | | | | | | | | | | | | | | | | | | |
| | | | | | |
| | CBOT Wheat Futures Contract | | | Short | | | | July 2013 | | | | (4 | ) | | | (138,200 | ) | | | 6,300 | |
| | | | | | |
| | KCBT Wheat Futures Contract | | | Short | | | | July 2013 | | | | (2 | ) | | | (73,225 | ) | | | 2,925 | |
| | | | | | |
| | MGEX Red Spring Wheat Futures Contract | | | Short | | | | July 2013 | | | | (2 | ) | | | (78,050 | ) | | | 2,950 | |
| | Total Wheat | | | | | | | | | | | | | | | (289,475 | ) | | | 12,175 | |
| | Total Agriculturals | | | | | | | | | | | | | | | (1,357,965 | ) | | | 46,571 | |
| Precious Metals | | Gold | | | | | | | | | | | | | | | | | | | | |
| | | | | | |
| | CEC Gold Futures Contract | | | Short | | | | June 2013 | | | | (5 | ) | | | (797,850 | ) | | | 32,060 | |
| | Platinum | | | | | | | | | | | | | | | | | | | | |
| | | | | | |
| | NYMEX Platinum Futures Contract | | | Short | | | | July 2013 | | | | (1 | ) | | | (78,730 | ) | | | 1,755 | |
| | Silver | | | | | | | | | | | | | | | | | | | | |
| | | | | | |
| | CEC Silver Futures Contract | | | Short | | | | July 2013 | | | | (2 | ) | | | (283,820 | ) | | | 3,655 | |
| | Total Precious Metals | | | | | | | | | | | | | | | (1,160,400 | ) | | | 37,470 | |
Consolidated Portfolio of Investments (Unaudited)
Nuveen Gresham Long/Short Commodity Strategy Fund (continued)
March 31, 2013
Investments in Derivatives as of March 31, 2013 (continued)
Futures Contracts outstanding (continued):
| | | | | | | | | | | | | | | | | | | | | | |
| Commodity Group | | Contract | | Contract
Position (3) | | | Contract
Expiration | | | Number of Contracts | | | Notional
Amount
at Value* | | | Unrealized
Appreciation
(Depreciation) | |
| Foods & Fibers | | Cocoa | | | | | | | | | | | | | | | | | | | | |
| | | | | | |
| | ICE Cocoa Futures Contract | | | Short | | | | July 2013 | | | | (1 | ) | | $ | (21,850 | ) | | $ | (895 | ) |
| | Coffee | | | | | | | | | | | | | | | | | | | | |
| | | | | | |
| | ICE Coffee C Futures Contract | | | Short | | | | July 2013 | | | | (1 | ) | | | (52,369 | ) | | | 2,334 | |
| | | | | | |
| | LIFFE Coffee Robusta Futures Contract | | | Long | | | | July 2013 | | | | 2 | | | | 41,480 | | | | (1,615 | ) |
| | Total Coffee | | | | | | | | | | | | | | | (10,889 | ) | | | 719 | |
| | Cotton | | | | | | | | | | | | | | | | | | | | |
| | | | | | |
| | ICE Cotton Futures Contract | | | Long | | | | July 2013 | | | | 2 | | | | 89,810 | | | | 3,733 | |
| | Sugar | | | | | | | | | | | | | | | | | | | | |
| | | | | | |
| | ICE Sugar Futures Contract | | | Short | | | | July 2013 | | | | (7 | ) | | | (138,768 | ) | | | 2,503 | |
| | Total Foods & Fibers | | | | | | | | | | | | | | | (81,697 | ) | | | 6,060 | |
| Livestock | | Feeder Cattle | | | | | | | | | | | | | | | | | | | | |
| | | | | | |
| | CME Feeder Cattle Futures Contract | | | Short | | | | August 2013 | | | | (1 | ) | | | (76,125 | ) | | | 981 | |
| | Lean Hogs | | | | | | | | | | | | | | | | | | | | |
| | | | | | |
| | CME Lean Hogs Futures Contract | | | Short | | | | June 2013 | | | | (4 | ) | | | (145,720 | ) | | | 8,617 | |
| | Live Cattle | | | | | | | | | | | | | | | | | | | | |
| | | | | | |
| | CME Live Cattle Futures Contract | | | Short | | | | June 2013 | | | | (7 | ) | | | (348,250 | ) | | | 7,340 | |
| | Total Livestock | | | | | | | | | | | | | | | (570,095 | ) | | | 16,938 | |
| | Total Futures Contracts outstanding | | | | | | | | | | | | | | $ | (2,115,923 | ) | | $ | 208,661 | |
| | * | | The aggregate Notional Amount at Value for long and short positions is $4,494,075 and $(6,609,998), respectively. |
| | | | For Fund portfolio compliance purposes, the Fund’s industry classifications refer to any one or more of the industry sub-classifications used by one or more widely recognized market indexes or ratings group indexes, and/or as defined by Fund management. This definition may not apply for purposes of this report which may combine industry sub-classifications into sectors for reporting ease. |
| | (1) | | All percentages shown in the Portfolio of Investments are based on net assets. |
| | (2) | | Ratings: Using the highest of Standard & Poor’s Group, Moody’s Investors Service, Inc. or Fitch, Inc. rating. |
| | (3) | | Some short futures positions arise in futures contracts traded on the London Metal Exchange (“LME”) solely as the result of closing existing long LME futures positions. The London Clearing House is the counterparty for both the long and short position. |
| | CBOT | | Chicago Board of Trade |
| | CEC | | Commodities Exchange Center |
| | CME | | Chicago Mercantile Exchange |
| | ICE | | Intercontinental Exchange |
| | KCBT | | Kansas City Board of Trade |
| | LIFFE | | London International Financial Futures Exchange |
| | LME | | London Metal Exchange |
| | MGEX | | Minneapolis Grain Exchange |
| | NYMEX | | New York Mercantile Exchange |
| | RBOB | | Reformulated Gasoline Blendstock for Oxygen Blending |
See accompanying notes to financial statements.
Consolidated Statement of Assets and Liabilities (Unaudited)
March 31, 2013
| | | | | | | | |
| | | Gresham
Diversified
Commodity
Strategy | | | Gresham
Long/Short
Commodity
Strategy | |
Assets | | | | | | | | |
Short-term investments, at value (cost $16,543,643 and 6,816,756, respectively) | | $ | 16,544,980 | | | $ | 6,817,432 | |
Cash | | | 33,163 | | | | 60,459 | |
Deposits with brokers | | | 752,136 | | | | 382,459 | |
Receivables: | | | | | | | | |
From Adviser | | | 25,487 | | | | 33,945 | |
Shares sold | | | 2,262,315 | | | | 20,550 | |
Variation margin on futures contracts | | | 224,815 | | | | 82,932 | |
Total assets | | | 19,842,896 | | | | 7,397,777 | |
Liabilities | | | | | | | | |
Payable for variation margin on futures contracts | | | 49,040 | | | | 51,056 | |
Accrued expenses: | | | | | | | | |
Trustees fees | | | 59 | | | | 38 | |
12b-1 distribution and service fees | | | 82 | | | | 94 | |
Other | | | 59,824 | | | | 73,609 | |
Total liabilities | | | 109,005 | | | | 124,797 | |
Net assets | | $ | 19,733,891 | | | $ | 7,272,980 | |
Class A Shares | | | | | | | | |
Net assets | | $ | 138,893 | | | $ | 556,464 | |
Shares outstanding | | | 7,339 | | | | 29,882 | |
Net asset value per share | | $ | 18.92 | | | $ | 18.62 | |
Offering price per share (net asset value per share plus maximum sales charge of 5.75% of offering price) | | $ | 20.07 | | | $ | 19.76 | |
Class C Shares | | | | | | | | |
Net assets | | $ | 73,591 | | | $ | 52,546 | |
Shares outstanding | | | 3,895 | | | | 2,827 | |
Net asset value and offering price per share | | $ | 18.89 | | | $ | 18.59 | |
Class I Shares | | | | | | | | |
Net assets | | $ | 19,521,407 | | | $ | 6,663,970 | |
Shares outstanding | | | 1,030,755 | | | | 357,727 | |
Net asset value and offering price per share | | $ | 18.94 | | | $ | 18.63 | |
Net assets consist of: | | | | | | | | |
Capital paid-in | | $ | 20,474,388 | | | $ | 7,735,741 | |
Undistributed (Over-distribution of) net investment income | | | (176,572 | ) | | | (192,607 | ) |
Accumulated net realized gain (loss) | | | (86,809 | ) | | | (343,064 | ) |
Net unrealized appreciation (depreciation) | | | (477,116 | ) | | | 72,910 | |
Net assets | | $ | 19,733,891 | | | $ | 7,272,980 | |
Authorized shares – per class | | | Unlimited | | | | Unlimited | |
Par value per share | | $ | 0.01 | | | $ | 0.01 | |
See accompanying notes to financial statements.
Consolidated Statement of Operations (Unaudited)
Six Months Ended March 31, 2013
| | | | | | | | |
| | | Gresham
Diversified
Commodity
Strategy | | | Gresham
Long/Short
Commodity
Strategy | |
Investment Income | | $ | 5,613 | | | $ | 4,464 | |
Expenses | | | | | | | | |
Management fees | | | 48,731 | | | | 38,808 | |
12b-1 service fees – Class A | | | 79 | | | | 106 | |
12b-1 distribution and service fees – Class C | | | 321 | | | | 234 | |
Shareholder servicing agent fees and expenses | | | 403 | | | | 291 | |
Custodian fees and expenses | | | 14,848 | | | | 25,593 | |
Trustees fees and expenses | | | 6,119 | | | | 6,074 | |
Professional fees | | | 51,852 | | | | 51,825 | |
Shareholder reporting expenses | | | 9,272 | | | | 9,272 | |
Federal and state registration fees | | | 2,487 | | | | 900 | |
Other expenses | | | 1,449 | | | | 1,447 | |
Total expenses before fee waiver/expense reimbursement | | | 135,561 | | | | 134,550 | |
Fee waiver/expense reimbursement | | | (81,372 | ) | | | (85,427 | ) |
Net expenses | | | 54,189 | | | | 49,123 | |
Net investment income (loss) | | | (48,576 | ) | | | (44,659 | ) |
Realized and Unrealized Gain (Loss) | | | | | | | | |
Net realized gain (loss) from: | | | | | | | | |
Investments | | | 38 | | | | 4 | |
Futures contracts | | | (86,990 | ) | | | (343,070 | ) |
Change in net unrealized appreciation (depreciation) of: | | | | | | | | |
Investments | | | 763 | | | | (227 | ) |
Futures contracts | | | (477,879 | ) | | | 73,137 | |
Net realized and unrealized gain (loss) | | | (564,068 | ) | | | (270,156 | ) |
Net increase (decrease) in net assets from operations | | $ | (612,644 | ) | | $ | (314,815 | ) |
See accompanying notes to financial statements.
Consolidated Statement of Changes in Net Assets (Unaudited)
| | | | | | | | | | | | | | | | |
| | | Gresham Diversified Commodity Strategy | | | Gresham Long/Short Commodity Strategy | |
| | | Six Months Ended
3/31/13 | | | For the Period 7/30/12
(Commencement
of Operations)
through 9/30/12 | | | Six Months Ended
3/31/13 | | | For the Period 7/30/12
(Commencement
of Operations)
through 9/30/12 | |
Operations | | | | | | | | | | | | | | | | |
Net investment income (loss) | | $ | (48,576 | ) | | $ | (11,787 | ) | | $ | (44,659 | ) | | $ | (16,578 | ) |
Net realized gain (loss) from: | | | | | | | | | | | | | | | | |
Investments | | | 38 | | | | (5 | ) | | | 4 | | | | 1 | |
Futures contracts | | | (86,990 | ) | | | 83,845 | | | | (343,070 | ) | | | (243,757 | ) |
Change in net unrealized appreciation (depreciation) of: | | | | | | | | | | | | | | | | |
Investments | | | 763 | | | | 574 | | | | (227 | ) | | | 903 | |
Futures contracts | | | (477,879 | ) | | | 178,114 | | | | 73,137 | | | | 135,524 | |
Net increase (decrease) in net assets from operations | | | (612,644 | ) | | | 250,741 | | | | (314,815 | ) | | | (123,907 | ) |
Distributions to Shareholders | | | | | | | | | | | | | | | | |
From net investment income: | | | | | | | | | | | | | | | | |
Class A | | | (954 | ) | | | — | | | | (222 | ) | | | — | |
Class C | | | (925 | ) | | | — | | | | (48 | ) | | | — | |
Class I | | | (198,136 | ) | | | — | | | | (34,742 | ) | | | — | |
Decrease in net assets from distributions to shareholders | | | (200,015 | ) | | | — | | | | (35,012 | ) | | | — | |
Fund Share Transactions | | | | | | | | | | | | | | | | |
Proceeds from sale of shares | | | 13,163,567 | | | | 7,000,000 | | | | 732,595 | | | | 7,000,000 | |
Proceeds from shares issued to shareholders due to reinvestment of distributions | | | 132,242 | | | | — | | | | 14,119 | | | | — | |
| | | 13,295,809 | | | | 7,000,000 | | | | 746,714 | | | | 7,000,000 | |
Cost of shares redeemed | | | — | | | | — | | | | — | | | | — | |
Net increase (decrease) in net assets from Fund share transactions | | | 13,295,809 | | | | 7,000,000 | | | | 746,714 | | | | 7,000,000 | |
Net increase (decrease) in net assets | | | 12,483,150 | | | | 7,250,741 | | | | 396,887 | | | | 6,876,093 | |
Net assets at the beginning of period | | | 7,250,741 | | | | — | | | | 6,876,093 | | | | — | |
Net assets at the end of period | | $ | 19,733,891 | | | $ | 7,250,741 | | | $ | 7,272,980 | | | $ | 6,876,093 | |
Undistributed (Over-distribution of) net investment income at the end of period | | $ | (176,572 | ) | | $ | 72,019 | | | $ | (192,607 | ) | | $ | (112,936 | ) |
See accompanying notes to financial statements.
Financial Highlights (Unaudited)
| | | | | | | | | | | | | | | | | | | | | | | | | | | | | | | | |
| Selected data for a share outstanding throughout each period: | |
| | | | | | | |
| Class (Commencement Date) | | | | | | | | | | | | | | | | | | | | | | |
| | | | | | Investment Operations | | | Less Distributions | | | | |
| | | | | | |
| GRESHAM DIVERSIFIED COMMODITY STRATEGY | | | | | | | | | | | | | | | | | | | |
Year Ended September 30, | | Beginning
Net Asset
Value | | | Net Invest-
ment
Income
(Loss)(a) | | | Net Realized/ Unrealized Gain
(Loss) | | | Total | | | From
Net Invest-
ment
Income | | | From
Accum-
ulated
Net
Realized
Gains | | | Total | | | Ending
Net
Asset
Value | |
Class A (7/12) | | | | | | | | | | | | | | | | | | | | | | | | | | | | | |
2013(f) | | $ | 20.71 | | | $ | (.12 | ) | | $ | (1.37 | ) | | $ | (1.49 | ) | | $ | (.30 | ) | | $ | — | | | $ | (.30 | ) | | $ | 18.92 | |
2012(d) | | | 20.00 | | | | (.04 | ) | | | .75 | | | | .71 | | | | — | | | | — | | | | — | | | | 20.71 | |
Class C (7/12) | | | | | | | | | | | | | | | | | | | | | | | | | | | | | |
2013(f) | | | 20.68 | | | | (.19 | ) | | | (1.36 | ) | | | (1.55 | ) | | | (.24 | ) | | | — | | | | (.24 | ) | | | 18.89 | |
2012(d) | | | 20.00 | | | | (.07 | ) | | | .75 | | | | .68 | | | | — | | | | — | | | | — | | | | 20.68 | |
Class I (7/12) | | | | | | | | | | | | | | | | | | | | | | | | | | | | | |
2013(f) | | | 20.72 | | | | (.09 | ) | | | (1.37 | ) | | | (1.46 | ) | | | (.32 | ) | | | — | | | | (.32 | ) | | | 18.94 | |
2012(d) | | | 20.00 | | | | (.03 | ) | | | .75 | | | | .72 | | | | — | | | | — | | | | — | | | | 20.72 | |
| | | | | | | | | | | | | | | | | | | | | | | | | | |
| | | | | | | | | | | | | | |
| | | |
| | | | | | | | | | | |
| | | | Ratios/Supplemental Data | |
| | | | |
| | | | | | |
Ratios to Average
Net Assets Before
Waiver/Reimbursement | | | Ratios to Average
Net Assets After
Waiver/Reimbursement(c) | | | | |
Total
Return(b) | | |
Ending
Net
Assets
(000) | | | Expenses | | | Net
Invest-
ment
Income
(Loss) | | | Expenses | | | Net
Invest-
ment
Income
(Loss) | | | Portfolio
Turnover
Rate(e) | |
| | | | | | | | | | | | | | | | | | | | | | | | | | |
| | (7.20 | )% | | $ | 139 | | | | 3.04 | %* | | | (2.93 | )%* | | | 1.32 | %* | | | (1.20 | )%* | | | 0 | % |
| | 3.55 | | | | 52 | | | | 8.75 | * | | | (8.63 | )* | | | 1.32 | * | | | (1.20 | )* | | | 0 | |
| | | | | | | | | | | | | | | | | | | | | | | | | | |
| | (7.52 | ) | | | 74 | | | | 3.56 | * | | | (3.45 | )* | | | 2.07 | * | | | (1.95 | )* | | | 0 | |
| | 3.40 | | | | 52 | | | | 9.51 | * | | | (9.40 | )* | | | 2.07 | * | | | (1.95 | )* | | | 0 | |
| | | | | | | | | | | | | | | | | | | | | | | | | | |
| | (7.05 | ) | | | 19,521 | | | | 2.68 | * | | | (2.57 | )* | | | 1.07 | * | | | (.96 | )* | | | 0 | |
| | 3.60 | | | | 7,147 | | | | 8.52 | * | | | (8.40 | )* | | | 1.07 | * | | | (.95 | )* | | | 0 | |
| (a) | Per share Net Investment Income (Loss) is calculated using the average daily shares method. |
| (b) | Total return is the combination of changes in net asset value without any sales charge, reinvested dividend income at net asset value and reinvested capital gains distributions at net asset value, if any. Total returns are not annualized. |
| (c) | After fee waiver and/or expense reimbursement from the Adviser, where applicable. |
| (d) | For the period July 30, 2012 (commencement of operations) through September 30, 2012. |
| (e) | Portfolio Turnover Rate is calculated based on the lesser of long-term purchases or sales divided by the average long-term market value during the period. The Fund did not invest in any long-term securities during the reporting period. |
| (f) | For the six months ended March 31, 2013. |
See accompanying notes to financial statements.
Financial Highlights (Unaudited) (continued)
| | | | | | | | | | | | | | | | | | | | | | | | | | | | | | | | |
| Selected data for a share outstanding throughout each period: | |
| | | | | | | |
| Class (Commencement Date) | | | | | | | | | | | | | | | | | | | | | | |
| | | | | | Investment Operations | | | Less Distributions | | | | |
| | | | | | |
| GRESHAM LONG/SHORT COMMODITY STRATEGY | | | | | | | | | | | | | | | | | | | |
Year Ended September 30, | | Beginning
Net Asset
Value | | | Net Invest-
ment
Income
(Loss)(a) | | | Net Realized/ Unrealized Gain
(Loss) | | | Total | | | From
Net Invest-
ment
Income | | | From
Accum-
ulated
Net
Realized
Gains | | | Total | | | Ending
Net
Asset
Value | |
Class A (7/12) | | | | | | | | | | | | | | | | | | | | | | | | | | | | | |
2013(f) | | $ | 19.64 | | | $ | (.15 | ) | | $ | (.79 | ) | | $ | (.94 | ) | | $ | (.08 | ) | | $ | — | | | $ | (.08 | ) | | $ | 18.62 | |
2012(d) | | | 20.00 | | | | (.06 | ) | | | (.30 | ) | | | (.36 | ) | | | — | | | | — | | | | — | | | | 19.64 | |
Class C (7/12) | | | | | | | | | | | | | | | | | | | | | | | | | | | | | |
2013(f) | | | 19.61 | | | | (.22 | ) | | | (.78 | ) | | | (1.00 | ) | | | (.02 | ) | | | — | | | | (.02 | ) | | | 18.59 | |
2012(d) | | | 20.00 | | | | (.08 | ) | | | (.31 | ) | | | (.39 | ) | | | — | | | | — | | | | — | | | | 19.61 | |
Class I (7/12) | | | | | | | | | | | | | | | | | | | | | | | | | | | | | |
2013(f) | | | 19.65 | | | | (.12 | ) | | | (.80 | ) | | | (.92 | ) | | | (.10 | ) | | | — | | | | (.10 | ) | | | 18.63 | |
2012(d) | | | 20.00 | | | | (.05 | ) | | | (.30 | ) | | | (.35 | ) | | | — | | | | — | | | | — | | | | 19.65 | |
| | | | | | | | | | | | | | | | | | | | | | | | | | |
| | | | | | | | | | | | | | |
| | | |
| | | | | | | | | | | |
| | | | Ratios/Supplemental Data | |
| | | | | | |
Ratios to Average
Net Assets Before
Waiver/Reimbursement | | | Ratios to Average
Net Assets After
Waiver/Reimbursement(c) | | | | |
Total
Return(b) | | |
Ending
Net
Assets
(000) | | | Expenses | | | Net
Invest-
ment
Income
(Loss) | | | Expenses | | | Net
Invest-
ment
Income
(Loss) | | | Portfolio
Turnover
Rate(e) | |
| | | | | | | | | | | | | | | | | | | | | | | | | | |
| | (4.99 | )% | | $ | 556 | | | | 8.53 | %* | | | (8.40 | )%* | | | 1.72 | %* | | | (1.59 | )%* | | | 0 | % |
| | (1.80 | ) | | | 49 | | | | 9.16 | * | | | (9.07 | )* | | | 1.72 | * | | | (1.63 | )* | | | 0 | |
| | | | | | | | | | | | | | | | | | | | | | | | | | |
| | (5.36 | ) | | | 53 | | | | 5.05 | * | | | (4.91 | )* | | | 2.47 | * | | | (2.34 | )* | | | 0 | |
| | (1.95 | ) | | | 49 | | | | 9.90 | * | | | (9.81 | )* | | | 2.47 | * | | | (2.38 | )* | | | 0 | |
| | | | | | | | | | | | | | | | | | | | | | | | | | |
| | (4.93 | ) | | | 6,664 | | | | 3.98 | * | | | (3.85 | )* | | | 1.47 | * | | | (1.33 | )* | | | 0 | |
| | (1.75 | ) | | | 6,778 | | | | 8.91 | * | | | (8.82 | )* | | | 1.47 | * | | | (1.38 | )* | | | 0 | |
| (a) | Per share Net Investment Income (Loss) is calculated using the average daily shares method. |
| (b) | Total return is the combination of changes in net asset value without any sales charge, reinvested dividend income at net asset value and reinvested capital gains distributions at net asset value, if any. Total returns are not annualized. |
| (c) | After fee waiver and/or expense reimbursement from the Adviser, where applicable. |
| (d) | For the period July 30, 2012 (commencement of operations) through September 30, 2012. |
| (e) | Portfolio Turnover Rate is calculated based on the lesser of long-term purchases or sales divided by the average long-term market value during the period. The Fund did not invest in any long-term securities during the reporting period. |
| (f) | For the six months ended March 31, 2013. |
See accompanying notes to financial statements.
Notes to Financial Statements (Unaudited)
1. General Information and Significant Accounting Policies
General Information
The Nuveen Investment Trust V (the “Trust”) is an open-end investment company registered under the Investment Company Act of 1940, as amended. The Trust is comprised of Nuveen Gresham Diversified Commodity Strategy Fund (“Gresham Diversified Commodity Strategy”) and Nuveen Gresham Long/Short Commodity Strategy Fund (“Gresham Long/Short Commodity Strategy”) (each a “Fund” and collectively, the “Funds”), as diversified Funds, among others. The Trust was organized as a Massachusetts business trust on September 27, 2006. The Funds commenced operations on July 30, 2012.
On December 31, 2012, the Funds’ investment adviser converted from a Delaware corporation to a Delaware limited liability company. As a result, Nuveen Fund Advisers, Inc., a wholly-owned subsidiary of Nuveen Investments, Inc. (“Nuveen”), changed its name to Nuveen Fund Advisers, LLC (the “Adviser”). There were no changes to the identities or roles of any personnel as a result of the change.
The Adviser has selected its affiliate, Gresham Investment Management LLC, acting through its Near Term Active division (in that capacity “Gresham”), to manage each Fund’s commodity investment strategy. The Adviser has selected its affiliate, Nuveen Asset Management, LLC (“Nuveen Asset Management”), to manage each Fund’s fixed income investments.
Gresham Diversified Commodity Strategy’s investment objective is to seek attractive total return. Under normal market conditions, the Fund invests primarily in a diversified portfolio of commodity futures contracts and fixed income investments. The Fund’s investment strategy has two elements:
| | • | | A portfolio of exchange-traded commodity futures contracts providing long-only exposure to all principal groups in the global commodity markets which is actively managed by Gresham, pursuant to its proprietary Tangible Asset Program® ( “TAP®”), a fully collateralized, long-only rules-based commodity investment strategy; and |
| | • | | A portfolio of cash equivalents, U.S. government securities and other high-quality short-term debt securities which is actively managed by Nuveen Asset Management. |
Gresham Long/Short Commodity Strategy’s investment objective is to seek attractive total return. Under normal market conditions, the Fund invests primarily in a diversified portfolio of commodity futures contracts and fixed income investments. The Fund’s investment strategy has two elements:
| | • | | A portfolio of long and/or short exchange-traded commodity futures contracts providing long and/or short exposure to all principal groups in the global commodity markets which is actively managed by Gresham, pursuant to its proprietary Long/Short Strategy, a fully collateralized, long/short rules-based commodity investment strategy; and |
| | • | | A portfolio of cash equivalents, U.S. government securities and other high-quality short-term debt securities which is actively managed by Nuveen Asset Management. |
Each Fund invests in a diversified portfolio of exchange-traded commodity futures contracts with an aggregate notional value substantially equal to the Funds’ net assets. The Funds invest in futures contracts in the six principal commodity groups in the global commodities markets: energy; industrial metals; agriculture; precious metals; foods and fibers; and livestock. The Funds may also invest in commodity-linked forward contracts, notes, swap agreements and other derivative instruments that provide investment exposure to commodities.
Although the Funds may make investments in commodity-linked derivative instruments directly, the Funds expect to primarily gain exposure to these investments by investing in the Gresham Diversified Commodity Fund Ltd. and Gresham Long/Short Commodity Fund Ltd. (each a “Subsidiary” and collectively the “Subsidiaries”), respectively, wholly-owned subsidiaries of the Funds organized under the laws of the Cayman Islands. The Subsidiaries are advised by the Adviser and sub-advised by Gresham. Each Fund’s investment in its Subsidiary is intended to provide the Fund with exposure to commodity markets within the limits of current federal income tax laws applicable to investment companies such as the Funds, which limit the ability of investment companies to invest directly in commodity-linked derivative instruments. The Subsidiaries have the same investment objective as each of their respective Funds, but unlike the Funds, they may invest without limitation in commodity-linked derivative instruments. The Subsidiaries are otherwise subject to the same fundamental and non-fundamental investment restrictions as the Funds. Except as otherwise noted, for purposes of this report, references to the Funds’ investments may also be deemed to include each Fund’s indirect investments through its Subsidiary.
Each Fund intends to invest up to 25% of its net assets in its Subsidiary, which in turn invests in a diversified portfolio of exchange-traded commodity futures contracts. Because commodity futures contracts provide notional exposure that greatly exceeds the margin requirements for such positions, the Subsidiary will be able to use this small portion of each Fund’s net assets to gain exposure to commodity futures contracts with an aggregate notional value substantially equal to 100% of each Fund’s net assets.
Assets not invested by the Funds in the Subsidiaries or directly in commodity-linked derivative instruments are invested by Nuveen Asset Management in cash equivalents, U.S. government securities and other high-quality short-term debt securities with final terms
not exceeding one year at the time of investment. The Funds’ fixed income investments consist primarily of direct and guaranteed obligations of the U.S. government and senior obligations of U.S. government agencies as well as money market securities. The Funds’ investments in cash equivalents and short-term debt securities (other than U.S. government securities) will be rated at all times at the applicable highest short-term or long-term debt or deposit rating or money market fund rating as determined by at least one nationally recognized statistical rating organization or, if unrated, judged by Nuveen Asset Management to be of comparable quality.
The Funds’ most recent prospectus provides further description of each Fund’s investment objective, principal investment strategies and principal risks.
Significant Accounting Policies
The following is a summary of significant accounting policies followed by the Funds in the preparation of their financial statements in accordance with accounting principles generally accepted in the United States (“U.S. GAAP”).
Investment Valuation
Commodity futures contracts traded on an exchange will be valued at the final settlement price or official closing price as determined by the principal exchange on which the instruments are traded as supplied by independent pricing services. These investments are generally classified as Level 1 for fair value measurement purposes. Over-the-counter commodity futures contracts not traded on an exchange will be valued, in order of hierarchy, by independent pricing services, price quotations obtained from counterparty broker-dealers, or through fair valuation methodologies as determined by the Adviser. These investments are generally classified as Level 2. Additionally, events may occur after the close of the market, but prior to the determination of each Fund’s net asset value, that may affect the values of each Fund’s investments. In such circumstances, the Adviser will determine a fair valuation for such investments that in its opinion is reflective of fair market value. These investments are generally classified as Level 2 or Level 3 depending on the priority of the significant inputs.
Prices of fixed-income securities, including, but not limited to, highly rated zero coupon fixed-income securities and U.S. Treasury bills, issued with maturities of one year or less, are provided by a pricing service approved by the Adviser. These securities are generally classified as Level 2. The pricing service establishes a security’s fair value using methods that may include consideration of the following: yields or prices of investments of comparable quality, type of issue, coupon, maturity and rating, market quotes or indications of value from security dealers, evaluations of anticipated cash flows or collateral, general market conditions and other information and analysis, including the obligor’s credit characteristics considered relevant. These securities are generally classified as Level 2 or Level 3 depending on the priority of the significant inputs.
Repurchase agreements are valued at contract amount plus accrued interest, which approximates market value. These securities are generally classified as Level 2.
Refer to Footnote 2 – Fair Value Measurements for further details on the leveling of securities held by the Funds as of the end of the reporting period.
Investment Transactions
Investment transactions are recorded on a trade date basis. Realized gains and losses from investment transactions are determined on the specific identification method, which is the same for federal income tax purposes.
Investment Income
Interest income, which reflects the amortization of premiums and includes accretion of discount for financial reporting purposes, is recorded on an accrual basis.
Income Taxes
Each Fund intends to distribute substantially all of its net investment income and net capital gains to shareholders and to otherwise comply with the requirements of Subchapter M of the Internal Revenue Code (“Code”) applicable to regulated investment companies (“RICs”). Therefore, no federal income tax provision is required.
Each Fund’s ability to make direct and indirect investments in commodities and certain related investments is limited by the Fund’s intention to qualify as a RIC under the Code. If a Fund does not appropriately limit such investments or if such investments are recharacterized for U.S. tax purposes, the Fund’s status as a RIC may be jeopardized. Each Fund’s investment in its Subsidiary is intended to provide additional exposure to commodities while allowing the Fund to satisfy the requirements applicable to RICs. In the past, the IRS had issued private letter rulings to RICs to the effect that income deemed to be received from their wholly-owned subsidiaries meets the requirements of RIC qualification without regard to whether it is currently paid to the parent mutual fund in the form of a cash dividend (“repatriated”). The IRS recently suspended the issuance of such rulings while it considers the release of published guidance on the issue. It is unclear whether such guidance will be favorable to RICs or would eliminate the need for newly organized funds to seek their own rulings. The Funds have not received a private letter ruling. In the absence of a private letter ruling or guidance to the same or similar effect, the Funds will rely upon an opinion of counsel to the effect that, consistent with Section 851(b) of the Code, income received from a controlled foreign corporation (“CFC”) by a RIC will be considered qualifying income if it is distributed from the CFC in the year earned, and the Subsidiaries will be operated consistent with this statutory provision. However, if a Fund were to fail to qualify as a RIC in any taxable year, and were ineligible to or otherwise did not cure such failure, the Fund would be subject to tax on its taxable income at corporate rates, and all distributions from earnings and profits, including any distributions of net long-term capital gains, would be taxable to shareholders as dividend income.
Notes to Financial Statements (Unaudited) (continued)
If the Subsidiaries do not make the distributions, or do not make the distributions in the year earned, the Funds may still be required to recognize the Subsidiaries’ commodities income for the purposes of calculating the Funds’ own taxable income. It is anticipated that for federal income tax purposes, income and capital gain earned by the Subsidiaries and distributed to the Funds and their shareholders will be considered a distribution of net investment income generally taxable to shareholders as ordinary income. Net losses earned by the Subsidiaries may not be netted with income or gain earned within the Funds and may not be carried forward for use in future years.
For all open tax years and all major taxing jurisdictions, the management of the Funds has concluded that there are no significant uncertain tax positions that would require recognition in the consolidated financial statements. Open tax years are those that are open for examination by taxing authorities (i.e., generally the last four tax year ends and the interim tax period since then). Furthermore, management of the Funds is also not aware of any tax positions for which it is reasonably possible that the total amounts of unrecognized tax benefits will significantly change in the next twelve months.
Dividends and Distributions to Shareholders
Dividends from net investment income and net realized capital gains from investment transactions, if any, are declared and distributed to shareholders at least annually. Furthermore, capital gains are distributed only to the extent they exceed available capital loss carryforwards.
Distributions to shareholders are recorded on the ex-dividend date. The amount and timing of distributions are determined in accordance with federal income tax regulations, which may differ from U.S. GAAP.
Share Classes and Sales Charges
Class A Shares are generally sold with an up-front sales charge and incur a .25% annual 12b-1 service fee. Class A Share purchases of $1 million or more are sold at net asset value without an up-front sales charge but may be subject to a contingent deferred sales charge (“CDSC”) if redeemed within twelve months of purchase. Class C Shares are sold without an up-front sales charge but incur a .75% annual 12b-1 distribution fee and a .25% annual 12b-1 service fee. Class C Shares are subject to a CDSC of 1% if redeemed within twelve months of purchase. Class I Shares are not subject to any sales charge or 12b-1 distribution or service fees.
Futures Contracts
Each Fund invests in commodity futures contracts. Upon entering into a futures contract, each Fund is required to deposit with the broker an amount of cash or liquid securities equal to a specified dollar amount per contract. This is known as the “initial margin.” Cash held by the broker to cover initial margin requirements on open futures contracts, if any, is recognized as “Deposits with brokers” on the Consolidated Statement of Assets and Liabilities. Subsequent payments (“variation margin”) are made or received by the Funds each day, depending on the daily fluctuation of the value of the contract. Variation margin is recognized as a receivable and/or payable for “Variation margin on futures contracts” on the Consolidated Statement of Assets and Liabilities, when applicable.
During the period the futures contract is open, changes in the value of the contract are recognized as an unrealized gain or loss by “marking-to-market” on a daily basis to reflect the changes in market value of the contract, which is recognized as a component of “Change in net unrealized appreciation (depreciation) of futures contracts” on the Consolidated Statement of Operations. When the contract is closed, the Fund records a realized gain or loss equal to the difference between the value of the contract on the closing date and value of the contract when originally entered into, which is recognized as a component of “Net realized gain (loss) from futures contracts” on the Consolidated Statement of Operations.
Gresham Diversified Commodity Strategy expects to invest only in long futures contracts. Some short futures positions may arise in futures contracts traded on the London Metal Exchange (“LME”) solely as the result of closing existing long LME futures positions. For every short LME futures contract outstanding, the Fund had previously entered into a long futures contract. The LME Clearing House is the counterparty for both the long and short positions.
Risks of investments in commodity futures contracts include possible adverse movement in the price of the commodities underlying the contracts, the possibility that there may not be a liquid secondary market for the contracts and the possibility that a change in the value of the contract may not correlate with a change in the value of the underlying commodities.
The average notional amount of futures contracts outstanding during the six months ended March 31, 2013, was as follows:
| | | | | | | | |
| | | Gresham Diversified
Commodity Strategy | | | Gresham Long/Short
Commodity Strategy | |
Average notional amount of futures contracts outstanding* | | | 13,429,770 | | | | 6,220,083 | |
| * | The average notional amount of contracts is calculated based on the absolute aggregate value of outstanding notional amount at the beginning of the fiscal year and at the end of each quarter within the current fiscal year. |
Refer to Footnote 3 – Derivative Instruments and Hedging Activities for further details on futures contract activity.
Financial Instrument Risk
The financial instruments used by the Funds are commodity futures, whose values are based upon an underlying asset and generally represent future commitments that have a reasonable possibility of being settled in cash or through physical delivery. As of March 31, 2013, the financial instruments held by the Funds are traded on an exchange and are standardized contracts.
Market risk is the potential for changes in the value of the financial instruments traded by the Funds due to market changes, including fluctuations in commodity prices. Investing in commodity futures contracts involves the Funds entering into contractual commitments to purchase or sell a particular commodity at a specified date and price. The market risk associated with each Fund’s commitments to purchase commodities will be limited to the gross or face amount of the contracts held. Each Fund’s exposure to market risk may be influenced by a number of factors, including changes in international balances of payments and trade, currency devaluations and revaluations, changes in interest and foreign currency exchange rates, price volatility of commodity futures contracts and market liquidity, weather, geopolitical events and other factors.
Credit risk is the possibility that a loss may occur due to the failure of a counterparty performing according to the terms of the futures and option contracts. A Fund may be exposed to credit risk from its investments in commodity futures contracts and options on commodity futures contracts resulting from the clearing house associated with a particular exchange failing to meet its obligations to the Fund. In general, clearing houses are backed by their corporate members who may be required to share in the financial burden resulting from the nonperformance of one of their members, which should significantly reduce this credit risk. In cases where the clearing house is not backed by the clearing members (i.e., as in some foreign exchanges), it may be backed by a consortium of banks or other financial institutions. There can be no assurance that any counterparty, clearing member or clearing house will meet its obligations to the Fund. Gresham Long/Short Commodity Strategy is subject to short exposure when it sells short a futures contract. Short sales are transactions in which the Fund initiates a position by selling a futures contract short. A short futures position allows the short seller to profit from declines in the price of the underlying commodity to the extent such declines exceed the transaction costs. In a short sale transaction, the Fund must deliver the underlying commodity at the contract price to a buyer of the contract who stands for delivery under the rules of the exchange that lists the contract or must offset the contract by entering into an opposite and offsetting transaction in the market.
A short sale creates the risk of an unlimited loss since the price of the underlying commodity in a futures contract could theoretically increase without limit, thus increasing the cost of covering the short positions. In circumstances where a market has reached its maximum price limits imposed by the exchange, the short seller may be unable to offset its short position until the next trading day, when prices could increase again in rapid trading.
Each Fund’s risk of loss in the event of counterparty default is typically limited to the amounts recognized on the Consolidated Statement of Assets and Liabilities and not represented by the contract or notional amounts of the instruments.
The commodity markets have volatility risk. The commodity markets have experienced periods of extreme volatility. General market uncertainty and consequent repricing risk have led to market imbalances of sellers and buyers, which in turn have resulted in significant reductions in values of a variety of commodities. Similar future market conditions may result in rapid and substantial valuation increases or decreases in the Fund’s holdings. In addition, volatility in the commodity and securities markets may directly and adversely affect the setting of distribution rates on the Funds’ shares.
Repurchase Agreements
In connection with transactions in repurchase agreements, it is each Fund’s policy that its custodian take possession of the underlying collateral securities, the fair value of which exceeds the principal amount of the repurchase transaction, including accrued interest, at all times. If the counterparty defaults, and the fair value of the collateral declines, realization of the collateral may be delayed or limited.
Zero Coupon Securities
Each Fund is authorized to invest in zero coupon securities. A zero coupon security does not pay a regular interest coupon to its holders during the life of the security. Income to the holder of the security comes from accretion of the difference between the original purchase price of the security at issuance and the par value of the security at maturity and is effectively paid at maturity. The market prices of zero coupon securities generally are more volatile than the market prices of securities that pay interest periodically.
Multiclass Operations and Allocations
Income and expenses of the Funds that are not directly attributable to a specific class of shares are prorated among the classes based on the relative net assets of each class. Expenses directly attributable to a class of shares, which presently only include 12b-1 distribution fees and shareholder service fees, are recorded to the specific class.
Realized and unrealized capital gains and losses of the Funds are prorated among the classes based on the relative net assets of each class.
Indemnifications
Under the Trust’s organizational documents, its officers and trustees are indemnified against certain liabilities arising out of the performance of their duties to the Trust. In addition, in the normal course of business, the Trust enters into contracts that provide
Notes to Financial Statements (Unaudited) (continued)
general indemnifications to other parties. The Trust’s maximum exposure under these arrangements is unknown as this would involve future claims that may be made against the Trust that have not yet occurred. However, the Trust has not had prior claims or losses pursuant to these contracts and expects the risk of loss to be remote.
Use of Estimates
The preparation of financial statements in conformity with U.S. GAAP requires management to make estimates and assumptions that affect the reported amounts of assets and liabilities at the date of the financial statements and the reported amounts of increases and decreases in net assets from operations during the reporting period. Actual results may differ from those estimates.
2. Fair Value Measurements
Fair value is defined as the price that the Funds would receive upon selling an investment or transferring a liability in an orderly transaction to an independent buyer in the principal or most advantageous market for the investment. A three-tier hierarchy is used to maximize the use of observable market data and minimize the use of unobservable inputs and to establish classification of fair value measurements for disclosure purposes. Observable inputs reflect the assumptions market participants would use in pricing the asset or liability. Observable inputs are based on market data obtained from sources independent of the reporting entity. Unobservable inputs reflect the reporting entity’s own assumptions about the assumptions market participants would use in pricing the asset or liability. Unobservable inputs are based on the best information available in the circumstances. The following is a summary of the three-tiered hierarchy of valuation input levels.
| | |
| Level 1 – | | Inputs are unadjusted and prices are determined using quoted prices in active markets for identical securities. |
| Level 2 – | | Prices are determined using other significant observable inputs (including quoted prices for similar securities, interest rates, prepayment speeds, credit risk, etc.). |
| Level 3 – | | Prices are determined using significant unobservable inputs (including management’s assumptions in determining the fair value of investments). |
The inputs or methodologies used for valuing securities are not an indication of the risks associated with investing in those securities. The following is a summary of each Fund’s fair value measurements as of the end of the reporting period:
| | | | | | | | | | | | | | | | |
| Gresham Diversified Commodity Strategy | | Level 1 | | | Level 2 | | | Level 3 | | | Total | |
Short-Term Investments: | | | | | | | | | | | | | | | | |
U.S. Government and Agency Obligations | | $ | — | | | $ | 14,827,229 | | | $ | — | | | $ | 14,827,229 | |
Repurchase Agreements | | | — | | | | 1,717,751 | | | | — | | | | 1,717,751 | |
Derivatives: | | | | | | | | | | | | | | | | |
Futures Contracts* | | | (299,765 | ) | | | — | | | | — | | | | (299,765 | ) |
Total | | $ | (299,765 | ) | | $ | 16,544,980 | | | $ | — | | | $ | 16,245,215 | |
| Gresham Long/Short Commodity Strategy | | Level 1 | | | Level 2 | | | Level 3 | | | Total | |
Short-Term Investments: | | | | | | | | | | | | | | | | |
U.S. Government and Agency Obligations | | $ | — | | | $ | 6,013,711 | | | $ | — | | | $ | 6,013,711 | |
Repurchase Agreements | | | — | | | | 803,721 | | | | — | | | | 803,721 | |
Derivatives: | | | | | | | | | | | | | | | | |
Futures Contracts* | | | 208,661 | | | | — | | | | — | | | | 208,661 | |
Total | | $ | 208,661 | | | $ | 6,817,432 | | | $ | — | | | $ | 7,026,093 | |
| * | Represents net unrealized appreciation (depreciation) as reported in the Fund’s Consolidated Portfolio of Investments. |
The Nuveen funds’ Board of Directors/Trustees is responsible for the valuation process and has delegated the oversight of the daily valuation process to the Adviser’s Valuation Committee. The Valuation Committee, pursuant to the valuation policies and procedures adopted by the Board of Directors/Trustees, is responsible for making fair value determinations, evaluating the effectiveness of the funds’ pricing policies, and reporting to the Board of Directors/Trustees. The Valuation Committee is aided in its efforts by the Adviser’s dedicated Securities Valuation Team, which is responsible for administering the daily valuation process and applying fair value methodologies as approved by the Valuation Committee. When determining the reliability of independent pricing services for investments owned by the funds, the Valuation Committee, among other things, conducts due diligence reviews of the pricing services and monitors the quality of security prices received through various testing reports conducted by the Securities Valuation Team.
The Valuation Committee will consider pricing methodologies it deems relevant and appropriate when making fair value determinations. Examples of possible methodologies include, but are not limited to, multiple of earnings; discount from market of a similar freely traded security; discounted cash-flow analysis; book value or a multiple thereof; risk premium/yield analysis; yield to maturity; and/or fundamental investment analysis. The Valuation Committee will also consider factors it deems relevant and appropriate in light of the facts and circumstances. Examples of possible factors include, but are not limited to, the type of security; the issuer’s consolidated financial statements; the purchase price of the security; the discount from market value of unrestricted securities of the same class at the time of purchase; analysts’ research and observations from financial institutions; information regarding any transactions or offers with respect to the security; the existence of merger proposals or tender offers affecting the security; the price and extent of public trading in similar securities of the issuer or comparable companies; and the existence of a shelf registration for restricted securities.
For each portfolio security that has been fair valued pursuant to the policies adopted by the Board of Directors/Trustees, the fair value price is compared against the last available and next available market quotations. The Valuation Committee reviews the results of such testing and fair valuation occurrences are reported to the Board of Directors/Trustees.
3. Derivative Instruments and Hedging Activities
The Funds record derivative instruments at fair value, with changes in fair value recognized on the Consolidated Statement of Operations. For additional information on the derivative instruments in which the Funds were invested during and at the end of the reporting period, refer to the Consolidated Portfolio of Investments and Footnote 1 – General Information and Significant Accounting Policies.
The following tables present the fair value of all derivative instruments held by the Funds as of March 31, 2013, the location of these instruments on the Consolidated Statement of Assets and Liabilities, and the primary underlying risk exposure.
| | | | | | | | | | | | | | |
| Gresham Diversified Commodity Strategy | |
| | | | | Location on the Consolidated Statement of Assets and Liabilities | |
Underlying
Risk Exposure | | Derivative
Instrument | | Asset Derivatives | | | Liability Derivatives | |
| | | Location | | Value | | | Location | | Value | |
Commodity | | Futures
Contracts | | Deposits with brokers and Receivable for variation margin on futures contracts* | | $ | 239,508 | | | Deposits with brokers and Payable for variation margin on futures contracts* | | $ | (539,273 | ) |
| | | | | | | | | | | | | | |
| Gresham Long/Short Commodity Strategy | |
| | | | | Location on the Consolidated Statement of Assets and Liabilities | |
Underlying Risk Exposure | | Derivative Instrument | | Asset Derivatives | | | Liability Derivatives | |
| | | Location | | Value | | | Location | | Value | |
Commodity | | Futures
Contracts | | Deposits with brokers and
Receivable for variation
margin on futures
contracts* | | $ | 420,382 | | | Deposits with brokers and Payable for variation margin on futures contracts* | | $ | (211,721 | ) |
| * | Value represents cumulative gross unrealized appreciation (depreciation) of futures contracts as reported in the Fund’s Consolidated Portfolio of Investments and not the deposits with brokers, if any, or the receivable or payable for variation margin presented on the Consolidated Statement of Assets and Liabilities. |
The following tables present the amount of net realized gain (loss) and change in net unrealized appreciation (depreciation) recognized for the six months ended March 31, 2013, on derivative instruments, as well as the primary risk exposure with each.
| | | | | | | | |
| Net Realized Gain (Loss) from Futures Contracts | | Gresham Diversified
Commodity Strategy | | | Gresham Long/Short
Commodity Strategy | |
Risk Exposure | | | | | | | | |
Commodity | | $ | (86,990 | ) | | $ | (343,070 | ) |
| | | | | | | | |
| Change in Net Unrealized Appreciation (Depreciation) of Futures Contracts | | Gresham Diversified
Commodity Strategy | | | Gresham Long/Short
Commodity Strategy | |
Risk Exposure | | | | | | | | |
Commodity | | $ | (477,879 | ) | | $ | 73,137 | |
4. Fund Shares
Transactions in Fund shares were as follows:
| | | | | | | | | | | | | | | | |
| | | Gresham Diversified
Commodity Strategy | |
| | | Six Months Ended
3/31/13 | | | For the period 7/30/12
(commencement of operations)
through 9/30/12 | |
| | | Shares | | | Amount | | | Shares | | | Amount | |
Shares sold: | | | | | | | | | | | | | | | | |
Class A | | | 4,829 | | | $ | 92,582 | | | | 2,500 | | | $ | 50,000 | |
Class C | | | 1,378 | | | | 26,993 | | | | 2,500 | | | | 50,000 | |
Class I | | | 678,894 | | | | 13,043,992 | | | | 345,000 | | | | 6,900,000 | |
Notes to Financial Statements (Unaudited) (continued)
| | | | | | | | | | | | | | | | |
| | | Gresham Diversified
Commodity Strategy | |
| | | Six Months Ended
3/31/13 | | | For the period 7/30/12
(commencement of operations)
through 9/30/12 | |
| | | Shares | | | Amount | | | Shares | | | Amount | |
Shares issued to shareholders due to reinvestment of distributions: | | | | | | | | | | | | | | | | |
Class A | | | 10 | | | | 197 | | | | — | | | | — | |
Class C | | | 17 | | | | 329 | | | | — | | | | — | |
Class I | | | 6,861 | | | | 131,716 | | | | — | | | | — | |
Net increase (decrease) | | | 691,989 | | | $ | 13,295,809 | | | | 350,000 | | | $ | 7,000,000 | |
| | | Gresham Long/Short
Commodity Strategy | |
| | | Six Months Ended
3/31/13 | | | For the period 7/30/12
(commencement of operations)
through 9/30/12 | |
| | | Shares | | | Amount | | | Shares | | | Amount | |
Shares sold: | | | | | | | | | | | | | | | | |
Class A | | | 27,381 | | | $ | 504,151 | | | | 2,500 | | | $ | 50,000 | |
Class C | | | 327 | | | | 6,000 | | | | 2,500 | | | | 50,000 | |
Class I | | | 11,965 | | | | 222,444 | | | | 345,000 | | | | 6,900,000 | |
Shares issued to shareholders due to reinvestment of distributions: | | | | | | | | | | | | | | | | |
Class A | | | 1 | | | | 21 | | | | — | | | | — | |
Class C | | | — | | | | — | | | | — | | | | — | |
Class I | | | 762 | | | | 14,098 | | | | — | | | | — | |
Net increase (decrease) | | | 40,436 | | | $ | 746,714 | | | | 350,000 | | | $ | 7,000,000 | |
5. Investment Transactions
The Funds did not have any purchases or sales of long-term investments during the six months ended March 31, 2013.
6. Income Tax Information
The following information is presented on an income tax basis. Differences between amounts for financial statement and federal income tax purposes are primarily due to timing differences in recognizing certain gains and losses on investment transactions. To the extent that differences arise that are permanent in nature, such amounts are reclassified within the capital accounts as detailed below. Temporary differences do not require reclassification. Temporary and permanent differences do not impact the net asset values of the Funds.
As of March 31, 2013, the cost and unrealized appreciation (depreciation) of investments (excluding investments in derivatives), as determined on a federal income tax basis, were as follows:
| | | | | | | | |
| | | Gresham Diversified
Commodity Strategy | | | Gresham Long/Short
Commodity Strategy | |
Cost of investments | | $ | 16,543,643 | | | $ | 6,816,756 | |
Gross unrealized: | | | | | | | | |
Appreciation | | $ | 1,337 | | | $ | 685 | |
Depreciation | | | — | | | | (9 | ) |
Net unrealized appreciation (depreciation) of investments | | $ | 1,337 | | | $ | 676 | |
Permanent differences, primarily due to calculation of taxable income from the Subsidiaries and nondeductible stock issuance costs resulted in reclassifications among the Funds’ components of net assets as of September 30, 2012, the Funds’ last tax year end, as follows:
| | | | | | | | |
| | | Gresham Diversified
Commodity Strategy | | | Gresham Long/Short
Commodity Strategy | |
Capital paid-in | | $ | (109 | ) | | $ | (147,400 | ) |
Undistributed (Over-distribution of) net investment income | | | 83,806 | | | | (96,358 | ) |
Accumulated net realized gain (loss) | | | (83,697 | ) | | | 243,758 | |
The tax components of undistributed net ordinary income and net long-term capital gains as of September 30, 2012, the Funds’ last tax year end, were as follows:
| | | | | | | | |
| | | Gresham Diversified
Commodity Strategy | | | Gresham Long/Short
Commodity Strategy | |
Undistributed net ordinary income* | | $ | 199,757 | | | $ | 31,186 | |
Undistributed net long-term capital gains | | | — | | | | — | |
| * | Net ordinary income consists of net taxable income derived from dividends, interest, and net short-term capital gains, if any. |
The Funds did not declare any distributions during the period July 30, 2012 (commencement of operations) through September 30, 2012, the Funds’ last tax year end.
| | | | | | | | |
| For the period July 30, 2012 (commencement of operations) through September 30, 2012 | | Gresham Diversified
Commodity Strategy | | | Gresham Long/Short
Commodity Strategy | |
Distributions from net ordinary income | | $ | — | | | $ | — | |
Distributions from net long-term capital gains | | | — | | | | — | |
During the Funds’ last tax year ended September 30, 2012, there were no capital losses generated.
7. Management Fees and Other Transactions with Affiliates
Each Fund’s management fee consists of two components – a fund-level fee, based only on the amount of assets within each individual Fund, and a complex-level fee, based on the aggregate amount of all eligible fund assets managed by the Adviser. This pricing structure enables each Fund’s shareholders to benefit from growth in the assets within their respective Fund as well as from growth in the amount of complex-wide assets managed by the Adviser.
The annual fund-level fee for each Fund, payable monthly, is calculated according to the following schedule:
| | | | | | | | |
| Average Daily Net Assets | | Gresham Diversified
Commodity Strategy
Fund-level Fee Rate | | | Gresham Long/Short
Commodity Strategy
Fund-level Fee Rate | |
For the first $125 million | | | .8000 | % | | | 1.0000 | % |
For the next $125 million | | | .7875 | | | | .9875 | |
For the next $250 million | | | .7750 | | | | .9750 | |
For the next $500 million | | | .7625 | | | | .9625 | |
For the next $1 billion | | | .7500 | | | | .9500 | |
For net assets over $2 billion | | | .7250 | | | | .9250 | |
The annual complex-level fee for each Fund, payable monthly, is calculated according to the following schedule:
| | | | |
| Complex-Level Asset Breakpoint Level* | | Effective Rate at Breakpoint Level | |
$55 billion | | | .2000 | % |
$56 billion | | | .1996 | |
$57 billion | | | .1989 | |
$60 billion | | | .1961 | |
$63 billion | | | .1931 | |
$66 billion | | | .1900 | |
$71 billion | | | .1851 | |
$76 billion | | | .1806 | |
$80 billion | | | .1773 | |
$91 billion | | | .1691 | |
$125 billion | | | .1599 | |
$200 billion | | | .1505 | |
$250 billion | | | .1469 | |
$300 billion | | | .1445 | |
| * | The complex-level fee is calculated based upon the aggregate daily “eligible assets” of all Nuveen Funds. Eligible assets do not include assets attributable to investments in other Nuveen Funds or assets in excess of $2 billion added to the Nuveen Fund complex in connection with the Adviser’s assumption of the management of the former First American Funds effective January 1, 2011. Eligible assets include closed-end fund assets managed by the Adviser that are attributable to financial leverage. For these purposes, financial leverage includes the closed-end funds’ use of preferred stock and borrowings and certain investments in the residual interest certificates (also called inverse floating rate securities) in tender option bond (TOB) trusts, including the portion of assets held by a TOB trust that has been effectively financed by the trust’s issuance of floating rate securities, subject to an agreement by the Adviser as to certain funds to limit the amount of such assets for determining eligible assets in certain circumstances. As of March 31, 2013, the complex-level fee rate for the Funds was .1668%. |
The management fee compensates the Adviser for overall investment advisory and administrative services and general office facilities. The Adviser is responsible for each Fund’s overall investment strategy and asset allocation decisions. The Adviser has entered into sub-advisory agreements with Gresham and Nuveen Asset Management. Gresham manages the Funds’ commodity investment strategies. Nuveen Asset Management manages the Funds’ fixed income investments. Gresham and Nuveen Asset Management are compensated for their services to the Funds from the management fees paid to the Adviser.
Notes to Financial Statements (Unaudited) (continued)
The Adviser serves as the investment adviser of the Subsidiaries. Gresham manages the Subsidiaries’ commodity investments on a discretionary basis, subject to the supervision of the Adviser. The Subsidiaries do not pay the Adviser or Gresham a management fee for their services. The Subsidiaries have also entered into separate contracts for the provision of custody and transfer agency services and pay custody, transfer agency, trustees and legal expenses. Each Fund, as the sole shareholder of its Subsidiary, will bear the costs of these services, which will ultimately be borne by shareholders of the Funds.
The Adviser has agreed to waive fees and/or reimburse expenses of the Funds so that total annual Fund operating expenses (excluding 12b-1 distribution and/or service fees, interest expenses, taxes, fees incurred in acquiring and disposing of portfolio securities, acquired Fund fees and expenses and extraordinary expenses) do not exceed the average daily net assets of any class of Fund shares in the amounts and for the time periods stated in the following table.
| | | | | | | | |
| Fund | | Expense Cap | | | Expense Cap
Expiration Date | |
Gresham Diversified Commodity Strategy | | | 1.10 | % | | | January 31, 2015 | |
Gresham Long/Short Commodity Strategy | | | 1.50 | | | | January 31, 2015 | |
The Adviser may also voluntarily reimburse additional expenses from time to time in either Fund. Voluntary reimbursements may be terminated at any time at the Adviser’s discretion.
The Trust pays no compensation directly to those of its trustees who are affiliated with the Adviser or to its officers, all of whom receive remuneration for their services to the Trust from the Adviser or its affiliates. The Board of Trustees has adopted a deferred compensation plan for independent trustees that enables trustees to elect to defer receipt of all or a portion of the annual compensation they are entitled to receive from certain Nuveen-advised funds. Under the plan, deferred amounts are treated as though equal dollar amounts had been invested in shares of select Nuveen-advised funds.
During the six months ended March 31, 2013, Nuveen Securities, LLC (the “Distributor”), a wholly-owned subsidiary of Nuveen, collected charges on purchases of A Shares, the majority of which were paid out as concessions to financial intermediaries as follows:
| | | | | | | | |
| | | Gresham Diversified
Commodity Strategy | | | Gresham Long/Short
Commodity Strategy | |
Sales charges collected | | $ | 330 | | | $ | — | |
Paid to financial intermediaries | | | 288 | | | | — | |
The Distributor also received 12b-1 service fees on Class A Shares, substantially all of which were paid to compensate financial intermediaries for providing services to shareholders relating to their investments.
During the six months ended March 31, 2013, the Distributor compensated financial intermediaries directly with commission advances at the time of purchase as follows:
| | | | | | | | |
| | | Gresham Diversified
Commodity Strategy | | | Gresham Long/Short
Commodity Strategy | |
Commission advances | | $ | — | | | $ | 60 | |
To compensate for commissions advanced to financial intermediaries, all 12b-1 service fees collected on Class C Shares during the first year following a purchase are retained by the Distributor. During the six months ended March 31, 2013, the Distributor retained such 12b-1 fees as follows:
| | | | | | | | |
| | | Gresham Diversified
Commodity Strategy | | | Gresham Long/Short
Commodity Strategy | |
12b-1 fees retained | | $ | 316 | | | $ | 234 | |
The remaining 12b-1 fees charged to the Funds were paid to compensate financial intermediaries for providing services to the shareholders relating to their investments.
The Distributor also collected and retained CDSC on share redemptions during the six months ended March 31, 2013, as follows:
| | | | | | | | |
| | | Gresham Diversified
Commodity Strategy | | | Gresham Long/Short
Commodity Strategy | |
CDSC retained | | $ | — | | | $ | — | |
As of March 31, 2013, Nuveen and Gresham, owned shares of the Funds as follows:
| | | | | | | | |
| | | Gresham Diversified
Commodity Strategy | | | Gresham Long/Short
Commodity Strategy | |
Class A Shares | | | 2,500 | | | | 2,500 | |
Class C Shares | | | 2,500 | | | | 2,500 | |
Class I Shares | | | 345,000 | | | | 345,000 | |
8. Basis for Consolidation of the Funds
Gresham Diversified Commodity Fund Ltd. and Gresham Long/Short Commodity Fund Ltd. were incorporated as wholly-owned subsidiaries acting as investment vehicles of Gresham Diversified Commodity Strategy and Gresham Long/Short Commodity Strategy, respectively, in order to effect certain investments for the Funds consistent with the Funds’ investment objectives and policies as specified in their prospectus and statement of additional information. The Funds’ investment portfolios have been consolidated and include the portfolio holdings of the Funds and the Subsidiaries. The consolidated financial statements include the accounts of the Funds and the Subsidiaries. All inter-company transactions and balances have been eliminated. Under the Articles of Association, shares issued by the Subsidiaries confer upon a shareholder the right to receive notice of, to attend and to vote at general meetings of the Subsidiaries and shall confer upon the shareholder rights in a winding-up or repayment of capital and the right to participate in the profits or assets of the Subsidiaries. See the table below for details regarding the structure, incorporation and relationship as of March 31, 2013, of the Subsidiaries.
| | | | | | | | | | | | | | | | |
| Subsidiary | | Date of
Incorporation | | | Fund
Net Assets | | | Subsidiary
Net Assets | | | % of Fund
Net Assets | |
Gresham Diversified Commodity Strategy Fund, Ltd. | | | April 10, 2012 | | | $ | 19,733,891 | | | $ | 2,619,436 | | | | 13.27 | % |
Gresham Long/Short Commodity Strategy Fund, Ltd. | | | April 10, 2012 | | | | 7,272,980 | | | | 1,186,655 | | | | 16.32 | |
9. New Accounting Pronouncements
Financial Accounting Standards Board (“FASB”) Balance Sheet (Topic 210): Disclosures about Offsetting Assets and Liabilities
In January 2013, Accounting Standards Update (“ASU”) 2013-01, Clarifying the Scope of Disclosures about Offsetting Assets and Liabilities, replaced ASU 2011-11, Disclosures about Offsetting Assets and Liabilities. ASU 2013-01 is effective for fiscal years beginning on or after January 1, 2013. ASU 2011-11 was intended to enhance disclosure requirements on the offsetting of financial assets and liabilities. ASU 2013-01 limits the scope of the new balance sheet offsetting disclosures to derivatives, repurchase agreements and securities lending transactions to the extent that they are (1) offset in the financial statements or (2) subject to an enforceable master netting arrangement or similar agreement. Management is currently evaluating the application of ASU 2013-01 and its impact to the financial statements and footnote disclosures, if any.
Glossary of Terms Used in this Report
Average Annual Total Return: This is a commonly used method to express an investment’s performance over a particular, usually multi-year time period. It expresses the return that would have been necessary each year to equal the investment’s actual cumulative performance (including change in NAV or offer price and reinvested dividends and capital gains distributions, if any) over the time period being considered.
Barclay BTOP50 Index: An index that seeks to replicate the overall composition of the managed futures industry with regard to trading style and overall market exposure. Index returns assume reinvestment of distributions, but do not reflect any applicable sales charges or management fees.
Commodity: A physical good, such as an agricultural product or metal, that is interchangeable with other goods of the same type. Commodity futures (contracts for the future delivery of a standardized amount of the commodity) are traded on exchanges such as the Chicago Board of Trade.
Dow Jones-UBS Commodity Index: An unmanaged index that seeks to provide broadly diversified representation of commodity markets as an asset class. The index is made up of exchange-traded futures on physical commodities and currently represents 20 commodities. Commodity weightings are based on production and liquidity, subject to weighting restrictions applied annually such that no related group of commodities constitutes more than 33% of the index and no single commodity constitutes more than 15% or less than 2% of the index. Index returns assume reinvestment of distributions, but do not reflect any applicable sales charges or management fees.
Gross Domestic Product (GDP): The total market value of all final goods and services produced in a country/region in a given year, equal to total consumer, investment and government spending, plus the value of exports, minus the value of imports.
Lipper Commodities General Funds Classification Average: Represents the average annualized total return for all reporting funds in the Lipper Commodities General Funds Classification Average. Lipper returns account for the effects of management fees and assume reinvestment of distributions, but do not reflect applicable sales charges.
Net Asset Value (NAV): The net market value of all securities held in a portfolio.
Net Asset Value (NAV) Per Share: The market value of one share of a mutual fund or closed-end fund. For a Fund, the NAV is calculated daily by taking the Fund’s total assets (securities, cash, and accrued earnings), subtracting the Fund’s liabilities, and dividing by the number of shares outstanding.
Short Position: A security a Fund does not own, but has sold through the delivery of a borrowed security.
Long Position: A security a Fund owns in its portfolio.
Additional Fund Information
Fund Manager
Nuveen Fund Advisors, LLC
333 West Wacker Drive
Chicago, IL 60606
Sub-Advisers
Nuveen Asset Management, LLC
333 West Wacker Drive
Chicago, IL 60606
Gresham Investment Management LLC
Near Term Active division
67 Irving Place
New York, NY 10003
Legal Counsel
Chapman and Cutler LLP
Chicago, IL
Independent Registered Public Accounting Firm
PricewaterhouseCoopers LLP
Chicago, IL
Custodian
State Street Bank & Trust Company
Boston, MA
Transfer Agent and Shareholder Services
Boston Financial
Data Services, Inc.
Nuveen Investor Services
P.O. Box 8530
Boston, MA 02266-8530
(800)257-8787
Quarterly Form N-Q Portfolio of Investments Information Each Fund is required to file its complete schedule of portfolio holdings with the Securities and Exchange Commission (SEC) for the first and third quarters of each fiscal year on Form N-Q. You may obtain this information directly from the SEC. Visit the SEC on-line at http://www.sec.gov or in person at the SEC’s Public Reference Room in Washington, D.C. Call the SEC toll-free at (800) SEC -0330 for room hours and operation.
Nuveen Funds’ Proxy Voting Information You may obtain (i) information regarding how each Fund voted proxies relating to portfolio securities held during the most recent twelve-month period ended June 30, and (ii) a description of the policies and procedures that each Fund used to determine how to vote proxies relating to portfolio securities without charge, upon request, by calling Nuveen Investments toll-free at (800) 257-8787 or on Nuveen’s website at www.nuveen.com. You may also obtain this information directly from the SEC. Visit the SEC on-line at http://www.sec.gov.
The Financial Industry Regulatory Authority (FINRA) provides a Public Disclosure Program which supplies certain information regarding the disciplinary history of FINRA members and their associated persons in response to either telephone inquiries at (800) 289-9999 or written inquiries at www.finra.org. FINRA also provides an investor brochure that includes information describing the Public Disclosure Program.
Nuveen Investments:
Serving Investors for Generations
Since 1898, financial advisors and their clients have relied on Nuveen Investments to provide dependable investment solutions through continued adherence to proven, long-term investing principles. Today, we offer a range of high quality equity and fixed-income solutions designed to be integral components of a well-diversified core portfolio.
Focused on meeting investor needs.
Nuveen Investments provides high-quality investment services designed to help secure the longterm goals of institutional and individual investors as well as the consultants and financial advisors who serve them. Nuveen Investments markets a wide range of specialized investment solutions which provide investors access to capabilities of its high-quality boutique investment affiliates–Nuveen Asset Management, Symphony Asset Management, NWQ Investment Management Company, Santa Barbara Asset Management, Tradewinds Global Investors, Winslow Capital Management, and Gresham Investment Management. In total, Nuveen Investments managed $224 billion as of March 31, 2013.
Find out how we can help you.
To learn more about how the products and services of Nuveen Investments may be able to help you meet your financial goals, talk to your financial advisor, or call us at (800) 257-8787. Please read the information provided carefully before you invest. Investors should consider the investment objective and policies, risk considerations, charges and expenses of any investment carefully. Where applicable, be sure to obtain a prospectus, which contains this and other relevant information. To obtain a prospectus, please contact your securities representative or Nuveen Investments, 333 W. Wacker Dr., Chicago, IL 60606. Please read the prospectus carefully before you invest or send money.
Learn more about Nuveen Funds at: www.nuveen.com/mf
| | |
Distributed by Nuveen Securities, LLC 333 West Wacker Drive Chicago, IL 60606 www.nuveen.com | | |
MSA-GRESH-0313P
Item 2. Code of Ethics.
Not applicable to this filing.
Item 3. Audit Committee Financial Expert.
Not applicable to this filing.
Item 4. Principal Accountant Fees and Services.
Not applicable to this filing.
Item 5. Audit Committee of Listed Registrants.
Not applicable to this registrant.
Item 6. Schedule of Investments.
(a) See Portfolio of Investments in Item 1.
(b) Not applicable.
Item 7. Disclosure of Proxy Voting Policies and Procedures for Closed-End Management Investment Companies.
Not applicable to this registrant.
Item 8. Portfolio Managers of Closed-End Management Investment Companies.
Not applicable to this registrant.
Item 9. Purchases of Equity Securities by Closed-End Management Investment Company and Affiliated Purchasers.
Not applicable to this registrant.
Item 10. Submission of Matters to a Vote of Security Holders.
There have been no material changes to the procedures by which shareholders may recommend nominees to the registrant’s Board implemented after the registrant last provided disclosure in response to this Item.
Item 11. Controls and Procedures.
| (a) | The registrant’s principal executive and principal financial officers, or persons performing similar functions, have concluded that the registrant’s disclosure controls and procedures (as defined in Rule 30a-3(c) under the Investment Company Act of 1940, as amended (the “1940 Act”) (17 CFR 270.30a-3(c))) are effective, as of a date within 90 days of the filing date of this report that includes the disclosure required by this paragraph, based on their evaluation of the controls and procedures required by Rule 30a-3(b) under the 1940 Act (17 CFR 270.30a-3(b)) and Rules 13a-15(b) or 15d-15(b) under the Securities Exchange Act of 1934, as amended (the “Exchange Act”) (17 CFR 240.13a-15(b) or 240.15d-15(b)). |
| (b) | There were no changes in the registrant’s internal control over financial reporting (as defined in Rule 30a-3(d) under the 1940 Act (17 CFR 270.30a-3(d)) that occurred during the second fiscal quarter of the period covered by this report that has materially affected, or is reasonably likely to materially affect, the registrant’s internal control over financial reporting. |
Item 12. Exhibits.
File the exhibits listed below as part of this Form.
(a)(1) Any code of ethics, or amendment thereto, that is the subject of the disclosure required by Item 2, to the extent that the registrant intends to satisfy the Item 2 requirements through filing of an exhibit: Not applicable to this filing.
(a)(2) A separate certification for each principal executive officer and principal financial officer of the registrant as required by Rule 30a-2(a) under the 1940 Act (17 CFR 270.30a-2(a)) in the exact form set forth below: See EX-99.CERT attached hereto.
(a)(3) Any written solicitation to purchase securities under Rule 23c-1 under the 1940 Act (17 CFR 270.23c-1) sent or given during the period covered by the report by or on behalf of the registrant to 10 or more persons: Not applicable to this registrant.
(b) If the report is filed under Section 13(a) or 15(d) of the Exchange Act, provide the certifications required by Rule 30a-2(b) under the 1940 Act (17 CFR 270.30a-2(b)), Rule 13a-14(b) or Rule 15d-14(b) under the Exchange Act (17 CFR 240.13a-14(b) or 240.15d-14(b)), and Section 1350 of Chapter 63 of Title 18 of the United States Code (18 U.S.C. 1350) as an Exhibit. A certification furnished pursuant to this paragraph will not be deemed “filed” for purposes of Section 18 of the Exchange Act (15 U.S.C. 78r), or otherwise subject to the liability of that section. Such certification will not be deemed to be incorporated by reference into any filing under the Securities Act of 1933 or the Exchange Act, except to the extent that the registration specifically incorporates it by reference: See EX-99.906 CERT attached hereto.
SIGNATURES
Pursuant to the requirements of the Securities Exchange Act of 1934 and the Investment Company Act of 1940, the registrant has duly caused this report to be signed on its behalf by the undersigned, thereunto duly authorized.
(Registrant) Nuveen Investment Trust V
| | | | | | |
| By | | (Signature and Title) | | /s/ Kevin J. McCarthy | | |
| | | | Kevin J. McCarthy Vice President and Secretary | | |
Date: June 7, 2013
Pursuant to the requirements of the Securities Exchange Act of 1934 and the Investment Company Act of 1940, this report has been signed below by the following persons on behalf of the registrant and in the capacities and on the dates indicated.
| | | | | | |
| By | | (Signature and Title) | | /s/ Gifford R. Zimmerman | | |
| | | | Gifford R. Zimmerman Chief Administrative Officer (principal executive officer) | | |
Date: June 7, 2013
| | | | | | |
| By | | (Signature and Title) | | /s/ Stephen D. Foy | | |
| | | | Stephen D. Foy Vice President and Controller (principal financial officer) | | |
Date: June 7, 2013