UNITED STATES
SECURITIES AND EXCHANGE COMMISSION
Washington, D.C. 20549
FORM N-CSR
CERTIFIED SHAREHOLDER REPORT OF REGISTERED MANAGEMENT
INVESTMENT COMPANIES
Investment Company Act file number 811-021979
Nuveen Investment Trust V
(Exact name of registrant as specified in charter)
Nuveen Investments
333 West Wacker Drive Chicago, IL 60606
(Address of principal executive offices) (Zip code)
Kevin J. McCarthy
Nuveen Investments
333 West Wacker Drive Chicago, IL 60606
(Name and address of agent for service)
Registrant’s telephone number, including area code: (312) 917-7700
Date of fiscal year end: September 30
Date of reporting period: March 31, 2011
Form N-CSR is to be used by management investment companies to file reports with the Commission not later than 10 days after the transmission to stockholders of any report that is required to be transmitted to stockholders under Rule 30e-1 under the Investment Company Act of 1940 (17 CFR 270.30e-1). The Commission may use the information provided on Form N-CSR in its regulatory, disclosure review, inspection, and policy making roles.
A registrant is required to disclose the information specified by Form N-CSR, and the Commission will make this information public. A registrant is not required to respond to the collection of information contained in Form N-CSR unless the Form displays a currently valid Office of Management and Budget (“OMB”) control number. Please direct comments concerning the accuracy of the information collection burden estimate and any suggestions for reducing the burden to Secretary, Securities and Exchange Commission, 450 Fifth Street, NW, Washington, DC 20549-0609. The OMB has reviewed this collection of information under the clearance requirements of 44 U.S.C. ss.3507.
Item 1. Reports to Stockholders.

Mutual Funds
Nuveen Taxable Fixed Income Funds
For investors seeking a high level of current income and total return.
Semi-Annual Report
March 31, 2011
| | | | | | | | | | | | |
| | | Share Class / Ticker Symbol |
| | | | |
| | | Class A | | Class C | | Class R3 | | Class I |
Nuveen Preferred Securities Fund | | NPSAX | | NPSCX | | NPSTX | | NPSRX |
INVESTMENT ADVISER NAME CHANGE
Effective January 1, 2011, Nuveen Asset Management, the Fund’s investment adviser, changed its name to Nuveen Fund Advisors, Inc. (“Nuveen Fund Advisors”). Concurrently, Nuveen Fund Advisors formed a wholly-owned subsidiary, Nuveen Asset Management, LLC, to house its portfolio management capabilities.
NUVEEN INVESTMENTS COMPLETES STRATEGIC COMBINATION WITH FAF ADVISORS
On December 31, 2010, Nuveen Investments completed the strategic combination between Nuveen Asset Management, LLC, the largest investment affiliate of Nuveen Investments, and FAF Advisors. As part of this transaction, U.S. Bancorp — the parent of FAF Advisors — received cash consideration and a 9.5% stake in Nuveen Investments in exchange for the long term investment business of FAF Advisors, including investment-management responsibilities for the non-money market mutual funds of the First American Funds family.
The approximately $27 billion of mutual fund and institutional assets managed by FAF Advisors, along with the investment professionals managing these assets and other key personnel, have become part of Nuveen Asset Management, LLC. With these additions to Nuveen Asset Management, LLC, this affiliate now manages more than $100 billion of assets across a broad range of strategies from municipal and taxable fixed income to traditional and specialized equity investments.
This combination does not affect the investment objectives or strategies of this Fund. Over time, Nuveen Investments expects that the combination will provide even more ways to meet the needs of investors who work with financial advisors and consultants by enhancing the multi-boutique model of Nuveen Investments, which also includes highly respected investment teams at HydePark, NWQ Investment Management, Santa Barbara Asset Management, Symphony Asset Management, Tradewinds Global Investors and Winslow Capital. Nuveen Investments managed approximately $206 billion of assets as of March 31, 2011.
| | | | | | |
| Must be preceded by or accompanied by a prospectus. | | NOT FDIC INSURED | | MAY LOSE VALUE | | NO BANK GUARANTEE |
Table of Contents
Chairman’s
Letter to Shareholders

Dear Shareholders,
In 2010, the global economy recorded another year of recovery from the financial and economic crises of 2008, but many of the factors that caused the downturn still weigh on the prospects for continued improvement. In the U.S., ongoing weakness in housing values has put pressure on homeowners and mortgage lenders. Similarly, the strong earnings recovery for corporations and banks is only slowly being translated into increased hiring or more active lending. Globally, deleveraging by private and public borrowers has inhibited economic growth and that process is far from complete.
Encouragingly, constructive actions are being taken by governments around the world to deal with economic issues. In the U.S., the recent passage of a stimulatory tax bill relieved some of the pressure on the Federal Reserve to promote economic expansion through quantitative easing and offers the promise of sustained economic growth. A number of European governments are undertaking programs that could significantly reduce their budget deficits. Governments across the emerging markets are implementing various steps to deal with global capital flows without undermining international trade and investment.
The success of these government actions could determine whether 2011 brings further economic recovery and financial market progress. One risk associated with the extraordinary efforts to strengthen U.S. economic growth is that the debt of the U.S. government will continue to grow to unprecedented levels. Another risk is that over time there could be inflationary pressures on asset values in the U.S. and abroad, because what happens in the U.S. impacts the rest of the world economy. Also, these various actions are being taken in a setting of heightened global economic uncertainty, primarily about the supplies of energy and other critical commodities. In this challenging environment, your Nuveen investment team continues to seek sustainable investment opportunities and to remain alert to potential risks in a recovery still facing many headwinds. On your behalf, we monitor their activities to assure they maintain their investment disciplines.
As you will note elsewhere in this report, on December 31, 2010, Nuveen Investments completed a strategic combination with FAF Advisors, Inc., the manager of the First American Funds. The combination adds highly respected and distinct investment teams to meet the needs of investors and their advisors and is designed to benefit all fund shareholders by creating a fund organization with the potential for further economies of scale and the ability to draw from even greater talent and expertise to meet those investor needs.
As always, I encourage you to contact your financial consultant if you have any questions about your investment in a Nuveen Fund. On behalf of the other members of your Fund Board, we look forward to continuing to earn your trust in the months and years ahead.
Sincerely,

Robert P. Bremner
Chairman of the Board
May 19, 2011
Portfolio Manager’s Comments
Certain statements in this report are forward-looking statements. Discussions of specific investments are for illustration only and are not intended as recommendations of individual investments. The forward-looking statements and other views expressed herein are those of the portfolio manager as of the date of this report. Actual future results or occurrences may differ significantly from those anticipated in any forward-looking statements and the views expressed herein are subject to change at any time, due to numerous market and other factors. The Fund disclaims any obligation to update publicly or revise any forward-looking statements or views expressed herein.
Any reference to credit ratings for portfolio holdings denotes the highest rating assigned by a Nationally Recognized Statistical Rating Organization (NRSRO) such as Standard & Poor’s (S&P), Moody’s or Fitch. AAA, AA, A and BBB ratings are investment grade; BB, B, CCC, CC, C and D ratings are below investment grade. Holdings and ratings may change over time.
The Nuveen Preferred Securities Fund features management by Nuveen Asset Management, LLC. Douglas Baker, CFA, has served as the Fund’s portfolio manager since its inception in 2006, and has 13 years of investment industry experience. Here Doug discusses the Fund’s performance and its investment strategy for six-month period ended March 31, 2011.
How did the Fund perform during the six-month period ended March 31, 2011?
The table in the Fund Performance section of this report provides total return performance information for the six-month, one-year and since inception periods March 31, 2011. The Fund’s Class A Shares at net asset value (NAV) outperformed the Merrill Lynch Preferred Stock Hybrid Securities Index, the Market Benchmark Index, and the Lipper Corporate Debt Funds BBB-Rated Category Average during the period.
What strategies were used to manage the Fund during the reporting period?
As has been the case for the past several quarters, the Fund continued to receive meaningful inflows during the six-month period ended March 31, 2011. Consistent with our investment process, the cash was invested in securities issued by firms that we deemed to have stable and/or improving credit profiles. These cash flows, coupled with active portfolio management, allowed us to implement strategies that helped the Fund meaningfully outperform its benchmark, such as a continued overweight to BBB-rated and BB-rated securities. Please keep in mind that these ratings are at the security level. Preferred securities are typically rated between three and five notches below the senior unsecured debt ratings of any particular issuer. As of March 31, 2011, the Fund had a 7.5% allocation to BB-rated securities, while the Blended Index has no exposure to securities rated below BBB. In general, during the reporting period lower rated investment grade and below investment grade securities outperformed higher rated investment grade securities.
During the six-month period ended March 31, 2011, the Fund held a meaningful overweight to the financial services sector versus the Market Benchmark Index, and within that overweight was another overweight to insurance companies versus banks. We believe that during this period of time, uncertainty regarding the impact of new bank regulations likely weighed on preferred/hybrid valuations for the bank sector. While the insurance sector experienced some material natural catastrophe exposure in the fourth quarter of 2010 and the first quarter of 2011, the market appeared to feel comfortable that the sector was adequately capitalized to digest these events. In addition, a few insurance companies proposed and/or executed lucrative tenders for some existing preferred/hybrid securities.
As a result, many investors thought it increasingly likely that a growing number of insurance companies would attempt to tender additional preferred/hybrid securities, especially the high coupon structures issued in 2008 and 2009.
In an effort to capitalize on the inefficiencies between the retail and institutional preferred/hybrid markets, we continued to toggle between the $25 par retail sector and the $1000 par institutional sector. Periods of market volatility often drive valuations between retail structures and institutional structures to become meaningfully bifurcated. This dynamic is primarily due to institutional investors’ ability to price risk more efficiently during periods of stress compared to retail investors. In addition, technical factors may also influence the relative valuations between $25 par retail structures and $1000 par institutional structures. For example, aggressive buying of $25 par securities by preferred security ETFs and individual retail investors drove $25 par valuations meaningfully higher compared to $1000 par structures. We used these periods of price discrepancy to rotate between $25 par and $1000 par in an attempt to improve the structure and/or yield of securities held by the Fund.
In addition to toggling between the $25 par retail structures and $1000 par institutional structures, the Fund benefited from an overweight to high equity content, non-cumulative preferred securities that materially outperformed their high debt content, cumulative counterparts. During late 2008 and early 2009, high equity content, non-cumulative security structures meaningfully underperformed high debt content, cumulative structures. Investor demand had spiked for high debt content, cumulative securities in response to menacing headlines coming from the financial services sector. We used this period of time as an opportunity to tactically increase the Fund’s allocation to high equity content, non-cumulative structures. As the severity of headlines abated, and the economy continued to demonstrate signs of stabilization, investor appetite returned for the higher-equity content preferred/hybrid securities. For the six-month period ended March 31, 2011, the Fund remained overweight to high equity content structures relative to the Market Benchmark Index. However, consistent with the past few quarterly measurement periods, we have gradually pared back the Fund’s overweight to these high equity content, non-cumulative structures in response to their increasingly richer valuations.
During the current period, we also entered into forward interest rate swap transactions to reduce the duration of the preferred stock portfolio.
Risk Considerations
Mutual fund investing involves risk; principal loss is possible. Debt or fixed income securities are subject to credit risk and interest rate risk. The value of, and income generated by debt securities will decrease or increase based on changes in market interest rates. As interest rates rise, bond prices fall. Credit risk refers to an issuer’s ability to make interest and principal payments when due. High yield or lower rated securities carry heightened credit risk and potential for default. The potential use of derivative instruments involves a high degree of financial risk, including the risk that the loss on a derivative may be greater than the principal amount invested. Foreign investments involve additional risks, including currency fluctuation, political and economic instability, lack of liquidity and differing legal and accounting standards.
Fund Performance (Unaudited)
Returns quoted represent past performance, which is no guarantee of future results. Current performance may be higher or lower than the performance shown. Investment returns and principal value will fluctuate so that when shares are redeemed, they may be worth more or less than their original cost. Returns without sales charges would be lower if the sales charge were included. Returns do not reflect the deduction of taxes that a shareholder would pay on Fund distributions or the redemption of Fund shares.
Returns may reflect a contractual agreement between the Fund and the investment adviser to waive certain fees and expenses; see Notes to Financial Statements, Footnote 7 — Management Fees and Other Transactions with Affiliates for more information. In addition, returns may reflect a voluntary expense limitation by the Fund’s investment adviser that may be modified or discontinued at any time without notice. For the most recent month-end performance visit www.nuveen.com or call (800) 257-8787.
Returns reflect differences in sales charges and expenses, which are primarily differences in distribution and service fees. Fund returns assume reinvestment of dividends and capital gains.
Comparative index and benchmark return information is provided for the Fund’s Class A Shares at net asset value (NAV) only.
Average Annual Total Returns as of March 31, 2011*
| | | | | | | | | | | | |
| | |
| | | Cumulative | | | Average Annual | |
| | | 6-Month | | | 1-Year | | | Since
Inception** | |
Class A Shares at NAV | | | 5.33% | | | | 15.10% | | | | 4.26% | |
Class A Shares at Offer | | | 0.31% | | | | 9.64% | | | | 3.07% | |
Merrill Lynch Preferred Stock Hybrid Securities Index*** | | | 3.22% | | | | 11.79% | | | | 1.59% | |
Market Benchmark Index*** | | | 2.81% | | | | — | | | | 3.08% | |
Lipper Corporate Debt Funds BBB-Rated Category Average*** | | | 0.80% | | | | 8.15% | | | | 5.64% | |
| | | | | | | | | | | | |
Class C Shares | | | 4.94% | | | | 14.24% | | | | 3.50% | |
Class R3 Shares | | | 5.25% | | | | 14.83% | | | | 4.01% | |
Class I Shares | | | 5.46% | | | | 15.38% | | | | 4.52% | |
Class A Shares have a maximum 4.75% sales charge. Class A Share purchases of $1 million or more are sold at net asset value without an up-front sales charge but may be subject to a contingent deferred sales charge (CDSC), also known as a back-end sales charge, if redeemed within twelve months of purchase. Class B Shares have a CDSC that begins at 5% for redemptions during the first year and declines periodically until after six years when the charge becomes 0%. Class B Shares automatically convert to Class A Shares eight years after purchase. Class C Shares have a 1% CDSC for redemptions within less than one year, which is not reflected in the one-year total return. Class R3 Shares have no sales charge and are available to only certain retirement plans. Class I Shares have no sales charge and may be purchased under limited circumstances or by specified classes of investors.
| * | Six-month returns are cumulative; all other returns are annualized. |
| ** | Since inception returns for Class A, C and I Shares are from 12/19/06; since inception return for Class R3 Shares is from 9/29/09. |
| *** | Refer to the Glossary of Terms Used in this Report for definitions. |
Yields (Unaudited) as of March 31, 2011
Dividend Yield is the most recent dividend per share (annualized) divided by the offering price per share.
The SEC 30-Day Yield is a standardized measure of the Fund’s yield that accounts for the future amortization of premiums or discounts of bonds held in the Fund’s portfolio. The SEC 30-Day Yield is computed under an SEC standardized formula and is based on the maximum offer price per share. The 30-Day Yield is computed under the same formula but is based on the net asset value (NAV) per share. Dividend Yield may differ from the SEC 30-Day Yield because the Fund may be paying out more or less than it is earning and it may not include the effect of amortization of bond premium.
The 30-Day Yield on A Shares at NAV applies only to A Shares purchased at no-load pursuant to the Fund’s policy permitting waiver of the A Share load in certain specified circumstances.
| | | | | | | | | | | | |
| | | |
| | | Dividend
Yield | | | 30-Day
Yield | | | SEC 30-Day
Yield | |
Class A Shares at NAV | | | 6.39% | | | | 5.72% | | | | — | |
Class A Shares at Offer | | | 6.08% | | | | — | | | | 5.44% | |
Class C Shares | | | 5.64% | | | | 4.95% | | | | — | |
Class R3 Shares | | | 6.13% | | | | 5.43% | | | | — | |
Class I Shares | | | 6.64% | | | | 5.95% | | | | — | |
Holding Summaries (Unaudited) as of March 31, 2011
This data relates to the securities held in the Fund’s portfolio of investments. It should not be construed as a measure of performance for the Fund itself.
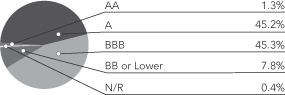
Ratings shown are the highest of Standard & Poor’s Group, Moody’s Investor Service, Inc. or Fitch, Inc. AAA includes bonds with an implied AAA rating since they are backed by U.S. Government or agency securities. AAA, AA, A and BBB ratings are investment grade; BB, B, CCC, CC, C and D ratings are below-investment grade. Holdings designated N/R are not rated by any of these national rating agencies.
Portfolio Allocation1
| | | | |
| Top Five Issuers1 | | | |
| JP Morgan Chase & Company | | | 4.8% | |
| Wells Fargo and Company | | | 4.5% | |
| ING Groep NV | | | 4.4% | |
| CoBank Agricultural Credit Bank | | | 4.2% | |
| Aegon NV | | | 4.1% | |
Bond Credit Quality2
| | | | |
| Portfolio Composition1 | | | |
| Insurance | | | 35.7% | |
| Commercial Banks | | | 22.0% | |
| Diversified Financial Services | | | 15.5% | |
| Capital Markets | | | 9.7% | |
| U.S. Agency | | | 7.0% | |
| Short Term Investments | | | 0.6% | |
| Other | | | 9.5% | |
| 1 | As a percentage of total investments (excluding investments in derivatives) as of March 31, 2011. Holdings are subject to change. |
| 2 | As a percentage of total investments (excluding short-term investments and investments in derivatives) as of March 31, 2011. Holdings are subject to change. |
Expense Ratios (Unaudited)
The expense ratios below reflect the Fund’s total operating expenses (before fee waivers or expense reimbursements if any) as shown in the Fund’s most recent prospectus. The expense ratios include management fees and other fees and expenses.
| | | | | | | | |
| Share Class | | Gross
Expense
Ratios | | | Net
Expense
Ratios | |
| Class A | | | 1.16% | | | | 1.12% | |
| Class C | | | 1.91% | | | | 1.87% | |
| Class R3 | | | 1.42% | | | | 1.37% | |
| Class I | | | 0.91% | | | | 0.87% | |
The expense ratios shown factor in Total Annual Fund Operating Expenses including management fees and other fees and expenses. The Net Expense Ratios reflect a contractual commitment by the Fund’s investment adviser to waive fees and reimburse expenses through January 31, 2012.
Expense Examples (Unaudited)
As a shareholder of the Fund, you incur two types of costs: (1) transaction costs, including up-front and back-end sales charges (loads) or redemption fees, where applicable; and (2) ongoing costs, including management fees; distribution and service (12b-1) fees, where applicable; and other Fund expenses. This Example is intended to help you understand your ongoing costs (in dollars) of investing in the Fund and to compare these costs with the ongoing costs of investing in other mutual funds.
The Example below is based on an investment of $1,000 invested at the beginning of the period and held for the period.
The information under “Actual Performance,” together with the amount you invested, allows you to estimate actual expenses incurred over the reporting period. Simply divide your account value by $1,000 (for example, an $8,600 account value divided by $1,000 = 8.60) and multiply the result by the cost shown for your share class, in the row entitled “Expenses Incurred During Period” to estimate the expenses incurred on your account during this period.
The information under “Hypothetical Performance,” provides information about hypothetical account values and hypothetical expenses based on the Fund’s actual expense ratio and an assumed rate of return of 5% per year before expenses, which is not the Fund’s actual return. The hypothetical account values and expenses may not be used to estimate the actual ending account balance or expense you incurred for the period. You may use this information to compare the ongoing costs of investing in the Fund and other Funds. To do so, compare this 5% hypothetical example with the 5% hypothetical examples that appear in the shareholder reports of the other funds.
Please note that the expenses shown in the table are meant to highlight your ongoing costs only and do not reflect any transaction costs. Therefore, the hypothetical information is useful in comparing ongoing costs only, and will not help you determine the relative total costs of owning different funds or share classes. In addition, if these transaction costs were included, your costs would have been higher.
| | | | | | | | | | | | | | | | | | | | | | | | | | | | | | | | |
| | | | | | | | | | | | | | | Hypothetical Performance | |
| | | Actual Performance | | | (5% annualized return before expenses) | |
| | | A Shares | | | C Shares | | | Class R3 | | | I Shares | | | A Shares | | | C1 Shares | | | Class R3 | | | I Shares | |
| Beginning Account Value (10/01/10) | | $ | 1,000.00 | | | $ | 1,000.00 | | | $ | 1,000.00 | | | $ | 1,000.00 | | | $ | 1,000.00 | | | $ | 1,000.00 | | | $ | 1,000.00 | | | $ | 1,000.00 | |
| Ending Account Value (3/31/11) | | $ | 1,053.30 | | | $ | 1,049.40 | | | $ | 1,052.50 | | | $ | 1,054.60 | | | $ | 1,020.04 | | | $ | 1,016.31 | | | $ | 1,018.80 | | | $ | 1,021.29 | |
| Expenses Incurred During Period | | $ | 5.02 | | | $ | 8.84 | | | $ | 6.29 | | | $ | 3.74 | | | $ | 4.94 | | | $ | 8.70 | | | $ | 6.19 | | | $ | 3.68 | |
For each class of the Fund, expenses are equal to the Fund’s annualized net expense ratio of .98%, 1.73%, 1.23% and .73% for Classes A, C, R3 and I, respectively, multiplied by the average account value over the period, multiplied by 182/365 (to reflect the six month period).
Portfolio of Investments (Unaudited)
Nuveen Preferred Securities Fund
March 31, 2011
| | | | | | | | | | | | | | | | |
| | | | |
| Shares | | | Description (1) | | Coupon | | | Ratings (2) | | | Value | |
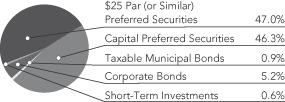
| | | | $25 PAR (OR SIMILAR) PREFERRED SECURITIES – 46.3% | | | | | | | | | | | | |
| | | | |
| | | | Capital Markets – 7.7% | | | | | | | | | | | | |
| | | | |
| | 52,752 | | | Ameriprise Financial, Inc. | | | 7.750% | | | | A | | | $ | 1,463,868 | |
| | | | |
| | 1,008 | | | BNY Capital Trust IV, Series E | | | 6.875% | | | | A1 | | | | 26,178 | |
| | | | |
| | 27,520 | | | BNY Capital Trust V, Series F | | | 5.950% | | | | A1 | | | | 693,229 | |
| | | | |
| | 1,318 | | | Credit Suisse | | | 7.900% | | | | A | | | | 35,481 | |
| | | | |
| | 75,432 | | | Deutsche Bank Capital Funding Trust I | | | 7.350% | | | | A | | | | 1,905,412 | |
| | | | |
| | 57,664 | | | Deutsche Bank Capital Funding Trust II | | | 6.550% | | | | A | | | | 1,421,994 | |
| | | | |
| | 574,651 | | | Deutsche Bank Capital Funding Trust V | | | 8.050% | | | | A | | | | 15,389,154 | |
| | | | |
| | 4,100 | | | Deutsche Bank Capital Funding Trust VIII | | | 6.375% | | | | A | | | | 98,318 | |
| | | | |
| | 325,627 | | | Deutsche Bank Contingent Capital Trust III | | | 7.600% | | | | A | | | | 8,537,940 | |
| | | | |
| | 14,100 | | | Goldman Sachs Group Inc., Series 2004–04 (SATURNS) | | | 6.000% | | | | A2 | | | | 329,517 | |
| | | | |
| | 2,179 | | | Goldman Sachs Group Inc. | | | 6.200% | | | | A– | | | | 54,279 | |
| | | | |
| | 75,000 | | | Goldman Sachs Group Inc. | | | 6.125% | | | | A1 | | | | 1,826,250 | |
| | | | |
| | 46,801 | | | Morgan Stanley Capital Trust III | | | 6.250% | | | | BBB+ | | | | 1,111,524 | |
| | | | |
| | 179,600 | | | Morgan Stanley Capital Trust IV | | | 6.250% | | | | BBB+ | | | | 4,283,460 | |
| | | | |
| | 1,900 | | | Morgan Stanley Capital Trust V | | | 5.750% | | | | BBB+ | | | | 44,099 | |
| | | | |
| | 270,010 | | | Morgan Stanley Capital Trust VI | | | 6.600% | | | | BBB+ | | | | 6,601,745 | |
| | | | |
| | 287,440 | | | Morgan Stanley Capital Trust VII | | | 6.600% | | | | BBB+ | | | | 6,979,043 | |
| | | | |
| | 126,621 | | | Morgan Stanley Capital Trust VIII | | | 6.450% | | | | BBB+ | | | | 3,065,494 | |
| | | | Total Capital Markets | | | | | | | | | | | 53,866,985 | |
| | | | Commercial Banks – 9.3% | | | | | | | | | | | | |
| | | | |
| | 195,958 | | | Banco Santander Finance | | | 10.500% | | | | A | | | | 5,575,005 | |
| | | | |
| | 4,571 | | | Banco Santander Finance | | | 6.800% | | | | A– | | | | 111,624 | |
| | | | |
| | 169,704 | | | Barclays Bank PLC | | | 8.125% | | | | A | | | | 4,461,518 | |
| | | | |
| | 71,669 | | | Barclays Bank PLC | | | 7.750% | | | | A | | | | 1,843,327 | |
| | | | |
| | 195,967 | | | Fifth Third Capital Trust V | | | 7.250% | | | | BBB | | | | 4,967,763 | |
| | | | |
| | 439,614 | | | Fifth Third Capital Trust VI | | | 7.250% | | | | BBB | | | | 11,148,611 | |
| | | | |
| | 220,819 | | | Fifth Third Capital Trust VII | | | 8.875% | | | | BBB | | | | 5,825,205 | |
| | | | |
| | 1,632 | | | Fleet Capital Trust IX | | | 6.000% | | | | BBB | | | | 38,058 | |
| | | | |
| | 500 | | | HSBC Finance Corporation | | | 6.000% | | | | A | | | | 12,575 | |
| | | | |
| | 17,633 | | | HSBC Holdings PLC | | | 8.125% | | | | A+ | | | | 481,734 | |
| | | | |
| | 222,364 | | | HSBC Holdings PLC | | | 8.000% | | | | A+ | | | | 6,066,090 | |
| | | | |
| | 60,000 | | | HSBC Holdings PLC | | | 6.200% | | | | A+ | | | | 1,449,000 | |
| | | | |
| | 6,625 | | | HSBC USA Inc. | | | 4.500% | | | | A+ | | | | 170,793 | |
| | | | |
| | 6,899 | | | KeyCorp Capital Trust V | | | 5.875% | | | | Baa3 | | | | 165,507 | |
| | | | |
| | 95,813 | | | KeyCorp Capital Trust IX | | | 6.750% | | | | BBB | | | | 2,400,116 | |
| | | | |
| | 311,531 | | | KeyCorp Capital Trust X | | | 8.000% | | | | BBB | | | | 8,137,190 | |
| | | | |
| | 170,293 | | | KeyCorp Capital VIII | | | 7.000% | | | | BBB | | | | 4,342,472 | |
| | | | |
| | 172,300 | | | National City Capital Trust II | | | 6.625% | | | | A– | | | | 4,360,913 | |
| | | | |
| | 64,863 | | | National City Capital Trust III | | | 6.625% | | | | A– | | | | 1,635,845 | |
| | | | |
| | 6,360 | | | USB Capital Trust XI | | | 6.600% | | | | A | | | | 162,434 | |
| | | | |
| | 26,547 | | | USB Capital XII | | | 6.300% | | | | A | | | | 676,949 | |
| | | | |
| | 50,000 | | | Wachovia Capital Trust IV | | | 6.375% | | | | A | | | | 1,249,000 | |
| | | | |
| | 13,031 | | | Wachovia Capital Trust IX | | | 6.375% | | | | A | | | | 326,427 | |
Portfolio of Investments (Unaudited)
Nuveen Preferred Securities Fund (continued)
March 31, 2011
| | | | | | | | | | | | | | | | |
| | | | |
| Shares | | | Description (1) | | Coupon | | | Ratings (2) | | | Value | |
| | | | Commercial Banks (continued) | | | | | | | | | | | | |
| | | | |
| | 3,392 | | | Wachovia Capital Trust X | | | 7.850% | | | | A | | | $ | 88,328 | |
| | | | |
| | 845 | | | Wells Fargo & Company | | | 8.000% | | | | A | | | | 23,728 | |
| | | | Total Commercial Banks | | | | | | | | | | | 65,720,212 | |
| | | | Consumer Finance — 1.7% | | | | | | | | | | | | |
| | | | |
| | 50,000 | | | Heller Financial Inc. | | | 6.950% | | | | A+ | | | | 5,048,440 | |
| | | | |
| | 29,250 | | | Heller Financial Inc. | | | 6.687% | | | | A+ | | | | 2,841,822 | |
| | | | |
| | 105,602 | | | HSBC Finance Corporation | | | 6.360% | | | | A | | | | 2,487,983 | |
| | | | |
| | 70,272 | | | HSBC USA Inc., Series H | | | 6.500% | | | | A+ | | | | 1,756,800 | |
| | | | Total Consumer Finance | | | | | | | | | | | 12,135,045 | |
| | | | Diversified Financial Services – 11.6% | | | | | | | | | | | | |
| | | | |
| | 29 | | | BAC Capital Trust X | | | 6.250% | | | | BBB | | | | 679 | |
| | | | |
| | 194,260 | | | Citigroup Capital Trust VII | | | 7.125% | | | | BBB | | | | 4,852,615 | |
| | | | |
| | 45,655 | | | Citigroup Capital Trust VIII | | | 6.950% | | | | BBB | | | | 1,129,505 | |
| | | | |
| | 7,847 | | | Citigroup Capital Trust XII | | | 8.500% | | | | BBB | | | | 206,612 | |
| | | | |
| | 475,000 | | | Citigroup Capital XIII | | | 7.875% | | | | BBB | | | | 13,015,000 | |
| | | | |
| | 6,165 | | | Citigroup Capital XV | | | 6.500% | | | | BBB | | | | 147,220 | |
| | | | |
| | 14,002 | | | Citigroup Capital XVI | | | 6.450% | | | | BBB | | | | 334,088 | |
| | | | |
| | 2,577 | | | Citigroup Capital XVII | | | 6.350% | | | | BBB | | | | 60,869 | |
| | | | |
| | 33,500 | | | Citigroup Capital XIX | | | 7.250% | | | | BBB | | | | 839,510 | |
| | | | |
| | 5,400 | | | Citigroup Capital XX | | | 7.875% | | | | BBB | | | | 138,672 | |
| | | | |
| | 577,524 | | | Countrywide Capital Trust III | | | 7.000% | | | | BBB | | | | 14,443,875 | |
| | | | |
| | 13,877 | | | Countrywide Capital Trust IV | | | 6.750% | | | | BBB | | | | 343,733 | |
| | | | |
| | 139,147 | | | Fleet Capital Trust VIII | | | 7.200% | | | | BBB | | | | 3,475,892 | |
| | | | |
| | 517,868 | | | ING Groep N.V. | | | 8.500% | | | | Ba1 | | | | 13,293,672 | |
| | | | |
| | 259,748 | | | ING Groep N.V. | | | 7.375% | | | | Ba1 | | | | 6,241,744 | |
| | | | |
| | 175,018 | | | ING Groep N.V. | | | 7.200% | | | | Ba1 | | | | 4,151,427 | |
| | | | |
| | 58,482 | | | ING Groep N.V. | | | 7.050% | | | | Ba1 | | | | 1,363,800 | |
| | | | |
| | 134,010 | | | ING Groep N.V. | | | 6.375% | | | | Ba1 | | | | 2,893,276 | |
| | | | |
| | 108,031 | | | ING Groep N.V. | | | 6.200% | | | | Ba1 | | | | 2,316,185 | |
| | | | |
| | 6,281 | | | ING Groep N.V. | | | 6.125% | | | | Ba1 | | | | 133,408 | |
| | | | |
| | 3,573 | | | JP Morgan Chase Capital Trust XI | | | 5.875% | | | | A2 | | | | 88,467 | |
| | | | |
| | 376 | | | JP Morgan Chase Capital Trust XIX, Series S | | | 6.625% | | | | A2 | | | | 9,532 | |
| | | | |
| | 714 | | | JP Morgan Chase Capital Trust XXIV | | | 6.875% | | | | A2 | | | | 18,478 | |
| | | | |
| | 309,016 | | | JP Morgan Chase Capital Trust XXIX | | | 6.700% | | | | A2 | | | | 7,873,728 | |
| | | | |
| | 82,803 | | | MBNA Corporation, Capital Trust D | | | 8.125% | | | | BBB | | | | 2,098,228 | |
| | | | |
| | 66,168 | | | MBNA Capital E | | | 8.100% | | | | BBB | | | | 1,697,209 | |
| | | | |
| | 3,823 | | | Merrill Lynch Capital Trust III | | | 7.375% | | | | BBB | | | | 97,066 | |
| | | | Total Diversified Financial Services | | | | | | | | | | | 81,264,490 | |
| | | | Electric Utilities – 1.4% | | | | | | | | | | | | |
| | | | |
| | 895 | | | American Electric Power | | | 8.750% | | | | Baa3 | | | | 24,720 | |
| | | | |
| | 6,228 | | | DTE Energy Trust I | | | 7.800% | | | | BBB– | | | | 164,544 | |
| | | | |
| | 100 | | | DTE Energy Trust II | | | 7.500% | | | | BBB– | | | | 2,608 | |
| | | | |
| | 25,783 | | | Entergy Texas Inc. | | | 7.875% | | | | BBB+ | | | | 723,471 | |
| | | | |
| | 8,000 | | | Georgia Power Company | | | 6.500% | | | | BBB+ | | | | 828,000 | |
| | | | | | | | | | | | | | | | |
| | | | |
| Shares | | | Description (1) | | Coupon | | | Ratings (2) | | | Value | |
| | | | Electric Utilities (continued) | | | | | | | | | | | | |
| | | | |
| | 1,200 | | | NextEra Energy Inc. | | | 7.450% | | | | BBB | | | $ | 32,580 | |
| | | | |
| | 9,700 | | | NextEra Energy Inc. | | | 6.600% | | | | BBB | | | | 251,521 | |
| | | | |
| | 56,136 | | | PPL Capital Funding, Inc. | | | 6.850% | | | | BBB | | | | 1,439,888 | |
| | | | |
| | 53,000 | | | PPL Electric Utilities Corporation | | | 6.250% | | | | BB+ | | | | 1,321,688 | |
| | | | |
| | 49,000 | | | Southern California Edison Company | | | 6.500% | | | | Baa2 | | | | 4,867,846 | |
| | | | Total Electric Utilities | | | | | | | | | | | 9,656,866 | |
| | | | Insurance – 9.2% | | | | | | | | | | | | |
| | | | |
| | 48,366 | | | Aegon N.V. | | | 6.875% | | | | BBB | | | | 1,148,209 | |
| | | | |
| | 73,646 | | | Aegon N.V. | | | 6.500% | | | | BBB | | | | 1,674,710 | |
| | | | |
| | 505,699 | | | Aegon N.V. | | | 6.375% | | | | BBB | | | | 11,514,766 | |
| | | | |
| | 560,642 | | | Aegon N.V. | | | 7.250% | | | | BBB | | | | 13,870,283 | |
| | | | |
| | 845,522 | | | Allianz SE | | | 8.375% | | | | A+ | | | | 22,591,327 | |
| | | | |
| | 111,492 | | | American International Group | | | 7.700% | | | | BBB | | | | 2,779,496 | |
| | | | |
| | 12,437 | | | Arch Capital Group Limited, Series B | | | 7.875% | | | | BBB | | | | 315,651 | |
| | | | |
| | 291,912 | | | Assured Guaranty Municipal Holdings | | | 6.875% | | | | A+ | | | | 6,889,123 | |
| | | | |
| | 2,712 | | | Assured Guaranty Municipal Holdings | | | 6.250% | | | | A+ | | | | 59,257 | |
| | | | |
| | 35,588 | | | Assured Guaranty Municipal Holdings | | | 5.600% | | | | A+ | | | | 711,760 | |
| | | | |
| | 5,000 | | | Endurance Specialty Holdings Limited | | | 7.750% | | | | BBB– | | | | 127,950 | |
| | | | |
| | 2,100 | | | MetLife Inc., Series B | | | 6.500% | | | | Baa2 | | | | 52,206 | |
| | | | |
| | 1,700 | | | PLC Capital Trust III | | | 7.500% | | | | BBB | | | | 43,010 | |
| | | | |
| | 17,475 | | | PLC Capital Trust IV | | | 7.250% | | | | BBB | | | | 435,827 | |
| | | | |
| | 3,319 | | | Principal Financial Group | | | 6.518% | | | | BBB | | | | 80,486 | |
| | | | |
| | 1,250 | | | Principal Financial Group | | | 5.563% | | | | BBB | | | | 117,305 | |
| | | | |
| | 8,947 | | | Protective Life Corporation | | | 7.250% | | | | BBB | | | | 223,496 | |
| | | | |
| | 199 | | | Prudential Financial Inc. | | | 9.000% | | | | BBB+ | | | | 5,474 | |
| | | | |
| | 820 | | | Prudential PLC | | | 6.750% | | | | A– | | | | 20,533 | |
| | | | |
| | 18,187 | | | RenaissanceRe Holdings Limited, Series C | | | 6.080% | | | | BBB+ | | | | 417,392 | |
| | | | |
| | 51,390 | | | RenaissanceRe Holdings Limited, Series D | | | 6.600% | | | | BBB+ | | | | 1,262,138 | |
| | | | |
| | 14,123 | | | Selective Insurance Group | | | 7.500% | | | | Baa3 | | | | 354,487 | |
| | | | Total Insurance | | | | | | | | | | | 64,694,886 | |
| | | | Multi-Utilities – 0.3% | | | | | | | | | | | | |
| | | | |
| | 59,165 | | | Dominion Resources Inc. | | | 8.375% | | | | BBB | | | | 1,679,694 | |
| | | | |
| | 13,300 | | | Xcel Energy Inc. | | | 7.600% | | | | BBB | | | | 370,671 | |
| | | | Total Multi-Utilities | | | | | | | | | | | 2,050,365 | |
| | | | Real Estate Investment Trust – 0.9% | | | | | | | | | | | | |
| | | | |
| | 1,131 | | | Duke Realty Corporation, Series L | | | 6.600% | | | | Baa3 | | | | 26,420 | |
| | | | |
| | 220 | | | Duke Realty Corporation, Series O | | | 8.375% | | | | Baa3 | | | | 5,885 | |
| | | | |
| | 6,700 | | | Duke-Weeks Realty Corporation | | | 6.625% | | | | Baa3 | | | | 155,708 | |
| | | | |
| | 78,821 | | | Harris Preferred Capital Corporation, Series A | | | 7.375% | | | | A– | | | | 1,981,560 | |
| | | | |
| | 539 | | | Kimco Realty Corporation, Series G | | | 7.750% | | | | Baa2 | | | | 13,939 | |
| | | | |
| | 5,000 | | | PS Business Parks, Inc. | | | 7.000% | | | | BBB | | | | 124,700 | |
| | | | |
| | 63,943 | | | PS Business Parks, Inc. | | | 6.700% | | | | BBB | | | | 1,560,209 | |
| | | | |
| | 8,680 | | | Public Storage, Inc., Series K | | | 7.250% | | | | A– | | | | 221,427 | |
| | | | |
| | 30,390 | | | Public Storage, Inc., Series W | | | 6.500% | | | | BBB+ | | | | 754,888 | |
Portfolio of Investments (Unaudited)
Nuveen Preferred Securities Fund (continued)
March 31, 2011
| | | | | | | | | | | | | | | | |
| | | | |
| Shares | | | Description (1) | | Coupon | | | Ratings (2) | | | Value | |
| | | | Real Estate Investment Trust (continued) | | | | | | | | | | | | |
| | | | |
| | 9,388 | | | Vornado Realty LP | | | 7.875% | | | | BBB | | | $ | 254,321 | |
| | | | |
| | 8,930 | | | Vornado Realty Trust | | | 6.750% | | | | BBB- | | | | 218,696 | |
| | | | |
| | 32,600 | | | Wachovia Preferred Funding Corporation | | | 7.250% | | | | A– | | | | 832,930 | |
| | | | Total Real Estate Investment Trust | | | | | | | | | | | 6,150,683 | |
| | | | Thrifts & Mortgage Finance – 0.0% | | | | | | | | | | | | |
| | | | |
| | 3,623 | | | Sovereign Capital Trust V | | | 7.750% | | | | A | | | | 92,024 | |
| | | | U.S. Agency – 4.2% | | | | | | | | | | | | |
| | | | |
| | 35,000 | | | Cobank Agricultural Credit Bank, 144A | | | 7.814% | | | | A | | | | 1,650,471 | |
| | | | |
| | 465,250 | | | Cobank Agricultural Credit Bank, 144A | | | 7.000% | | | | A | | | | 21,794,078 | |
| | | | |
| | 107,000 | | | Cobank Agricultural Credit Bank, 144A | | | 11.000% | | | | A | | | | 5,965,250 | |
| | | | Total U.S. Agency | | | | | | | | | | | 29,409,799 | |
| | | | Total $25 Par (or similar) Preferred Securities (cost $281,539,571) | | | | | | | | | | | 325,041,355 | |
| | | | | | | | | | | | | | | | | | | | |
| | | | | |
Principal
Amount (000) | | | Description (1) | | | | | Optional Call
Provisions (3) | | | Ratings (2) | | | Value | |
| | | | TAXABLE MUNICIPAL BONDS – 0.9% | | | | | | | | | | | | | | | | |
| | | | | |
| | | | California – 0.2% | | | | | | | | | | | | | | | | |
| | | | | |
| $ | 385 | | | California Municipal Finance Authority, Educational Facilities Revenue Bonds, OCEAA Project, Series 2008B, 11.000%, 10/01/14 | | | | | | | No Opt. Call | | | | N/R | | | $ | 373,904 | |
| | | | | |
| | 200 | | | California Statewide Community Development Authority, Lancer Educational Student Housing Revenue Bonds, California Baptist University, Series 2007, 9.125%, 6/01/13 | | | | | | | No Opt. Call | | | | N/R | | | | 201,354 | |
| | | | | |
| | 200 | | | Long Beach, California, Senior Airport Revenue Bonds, Federally Taxable – Build America Bonds, Series 2009C, 7.765%, 6/01/39 | | | | | | | 12/19 at 100.00 | | | | A2 | | | | 194,280 | |
| | | | | |
| | 200 | | | Southwestern Community College District, San Diego County, California, General Obligation Bonds, Election of 2008, Build America Bonds Series 2009, 7.230%, 8/01/39 | | | | | | | 8/19 at 100.00 | | | | Aa2 | | | | 201,586 | |
| | 985 | | | Total California | | | | | | | | | | | | | | | 971,124 | |
| | | | Florida – 0.3% | | | | | | | | | | | | | | | | |
| | | | | |
| | 255 | | | Miami-Dade County, Florida, Transit System Sales Surtax Revenue Bonds, Build America Bond Series 2009B, 6.910%, 7/01/39 | | | | | | | 7/19 at 100.00 | | | | AA | | | | 246,679 | |
| | | | | |
| | 190 | | | Northern Palm Beach County Improvement District, Florida, Water Control and Improvement Bonds, Development Unit 46, Series 2007B, 8.250%, 8/01/21 | | | | | | | 8/14 at 100.00 | | | | N/R | | | | 178,807 | |
| | | | | |
| | 200 | | | Orlando, Florida, Capital Improvement Special Revenue Bonds, Build America Taxable Bond Series 200C, 7.100%, 10/01/39 | | | | | | | 10/19 at 100.00 | | | | AA+ | | | | 206,034 | |
| | | | | |
| | 250 | | | Pasco County, Florida, Water and Sewer Revenue Bonds, Build America Bonds Series 2009B, 6.760%, 10/01/39 | | | | | | | No Opt. Call | | | | AA | | | | 255,995 | |
| | | | | |
| | 200 | | | Seacoast Utility Authority, Florida, Water and Sewer Utility System Revenue Bonds, Taxable Build America, Series 2009B, 6.680%, 3/01/39 | | | | | | | 3/20 at 100.00 | | | | Aa3 | | | | 201,452 | |
| | | | | |
| | 445 | | | Seminole Tribe of Florida, Special Obligation Bonds, Series 2007B, 7.804%, 10/01/20 | | | | | | | No Opt. Call | | | | BBB- | | | | 439,736 | |
| | | | | |
| | 200 | | | South Broward Hospital District, Florida, Revenue Bonds, Build America Taxable Bonds, Series 2009B, 7.278%, 5/01/44 | | | | | | | 5/19 at 100.00 | | | | AA- | | | | 203,988 | |
| | 1,740 | | | Total Florida | | | | | | | | | | | | | | | 1,732,691 | |
| | | | Hawaii – 0.0% | | | | | | | | | | | | | | | | |
| | | | | |
| | 200 | | | Honolulu City and County, Hawaii, General Obligation Bonds, Build America Bonds, Series 2009E, 6.300%, 9/01/34 | | | | | | | 9/19 at 100.00 | | | | Aa1 | | | | 201,152 | |
| | | | | | | | | | | | | | | | | | | | |
Principal
Amount (000) | | | Description (1) | | | | | Optional Call
Provisions (3) | | | Ratings (2) | | | Value | |
| | | | Idaho – 0.0% | | | | | | | | | | | | | | | | |
| | | | | |
| $ | 75 | | | Idaho Housing and Finance Association NonProfit Facilities Revenue Bonds, Liberty Charter School, Inc, Series 2008B, 7.500%, 6/01/12 | | | | | | | No Opt. Call | | | | BBB | | | $ | 74,103 | |
| | | | Louisiana – 0.0% | | | | | | | | | | | | | | | | |
| | | | | |
| | 195 | | | Carter Plantation Land Louisiana, Revenue Bonds, 9.000%, 7/01/17, 144A (4),(5) | | | | | | | 4/11 at 100.00 | | | | N/R | | | | 19,500 | |
| | | | Michigan – 0.1% | | | | | | | | | | | | | | | | |
| | | | | |
| | 200 | | | Croswell & Lexington Community Schools, Michigan, General Obligation Bonds, School Building & Site Series 2009, 6.050%, 5/01/29 | | | | | | | 5/19 at 100.00 | | | | AA– | | | | 189,276 | |
| | | | | |
| | 1,500 | | | Lansing Tax Increment Finance Authority, Michigan, Tax Increment Bonds, Capital Appreciation Refunding Series 2009, 0.000%, 5/01/31 | | | | | | | 5/19 at 38.12 | | | | AA | | | | 324,330 | |
| | 1,700 | | | Total Michigan | | | | | | | | | | | | | | | 513,606 | |
| | | | Missouri – 0.0% | | | | | | | | | | | | | | | | |
| | | | | |
| | 200 | | | Missouri Joint Municipal Electric Utility Commission, Prairie State Power Project Revenue Bond, Federally Taxable Build America Bonds – Direct Pay, Series 2009A, 6.890%, 1/01/42 | | | | | | | 1/19 at 100.00 | | | | A3 | | | | 196,488 | |
| | | | Nevada – 0.0% | | | | | | | | | | | | | | | | |
| | | | | |
| | 200 | | | Clark County, Nevada, Airport Revenue Bonds, Senior Lien Series 2009B, 6.881%, 7/01/42 | | | | | | | 7/19 at 100.00 | | | | Aa2 | | | | 199,996 | |
| | | | New Jersey – 0.1% | | | | | | | | | | | | | | | | |
| | | | | |
| | 200 | | | South Jersey Transportation Authority, New Jersey, Transportation System Revenue Bonds, Build America Bond Series 2009A-5, 7.000%, 11/01/38 | | | | | | | No Opt. Call | | | | A– | | | | 203,180 | |
| | | | Ohio – 0.1% | | | | | | | | | | | | | | | | |
| | | | | |
| | 200 | | | American Municipal Power Ohio Inc., Prairie State Energy Campus Project Revenue Bnods, Federally Taxable Issuer Subsidy Build America Bonds, Series 2009C, 6.553%, 2/15/39 | | | | | | | 2/19 at 100.00 | | | | A1 | | | | 190,728 | |
| | | | | |
| | 200 | | | Berea City School District, County, Ohio, Certificates of Participartion, Build America Bonds, Series 2009B, 7.250%, 10/01/39 | | | | | | | 10/19 at 100.00 | | | | A1 | | | | 199,522 | |
| | | | | |
| | 200 | | | Edgewood City School District, Counties of Butler and Preble, Ohio, School Improvement General Obligation Bonds, Build America Bonds, Series 2009, 7.500%, 12/01/37 | | | | | | | No Opt. Call | | | | Aa3 | | | | 206,650 | |
| | | | | |
| | 200 | | | Hamilton, Ohio, Electric System Revenue Bonds, Build America Bonds Series 2009B, 6.600%, 10/01/39 – AGC Insured | | | | | | | 10/19 at 100.00 | | | | Aa3 | | | | 195,238 | |
| | 800 | | | Total Ohio | | | | | | | | | | | | | | | 792,138 | |
| | | | Texas – 0.1% | | | | | | | | | | | | | | | | |
| | | | | |
| | 600 | | | Danbury Higher Education Authority Inc., Texas, Golden Rule Charter School Revenue Bonds, Series 2008B, 10.000%, 8/15/18 | | | | | | | No Opt. Call | | | | BB+ | | | | 561,228 | |
| | | | | |
| | 100 | | | La Vernia Education Financing Corporation, Texas, Charter School Revenue Bonds, Riverwalk Education Foundation, Series 2007B, 8.750%, 8/15/12 | | | | | | | 8/11 at 100.00 | | | | N/R | | | | 100,173 | |
| | | | | |
| | 200 | | | North Texas Tollway Authority, System Revenue Bonds, Taxble Build America Bond Series 2009B, 6.718%, 1/01/49 | | | | | | | No Opt. Call | | | | A2 | | | | 199,428 | |
| | 900 | | | Total Texas | | | | | | | | | | | | | | | 860,829 | |
| | | | Virginia – 0.0% | | | | | | | | | | | | | | | | |
| | | | | |
| | 200 | | | Metropolitan Washington DC Airports Authority, Virginia, Dulles Toll Raod Revenue Bonds, Series 2009D, 7.462%, 10/01/46 – AGC Insured | | | | | | | No Opt. Call | | | | BBB+ | | | | 196,456 | |
| | | | Washington – 0.0% | | | | | | | | | | | | | | | | |
| | | | | |
| | 520 | | | Washington State Economic Development Finance Authority, Revenue Bonds, Coeur D’Alene Fiber Fuels Inc., Series 2007H, 10.000%, 12/01/11 (4),(5) | | | | | | | No Opt. Call | | | | N/R | | | | 130,000 | |
| $ | 7,915 | | | Total Taxable Municipal Bonds (cost $6,751,890) | | | | | | | | | | | | | | | 6,091,263 | |
Portfolio of Investments (Unaudited)
Nuveen Preferred Securities Fund (continued)
March 31, 2011
| | | | | | | | | | | | | | | | | | | | |
Principal
Amount (000) | | | Description (1) | | Coupon | | | Maturity | | | Ratings (2) | | | Value | |
| | | | CORPORATE BONDS – 5.1% | | | | | | | | | | | | | | | | |
| | | | | |
| | | | Electric Utilities – 0.4% | | | | | | | | | | | | | | | | |
| | | | | |
| $ | 3,000 | | | FPL Group Capital Inc. | | | 6.650% | | | | 6/15/17 | | | | BBB | | | $ | 2,996,250 | |
| | | | Insurance – 4.7% | | | | | | | | | | | | | | | | |
| | | | | |
| | 9,310 | | | American International Group, Inc. | | | 8.175% | | | | 5/15/58 | | | | BBB | | | | 10,019,888 | |
| | | | | |
| | 2,000 | | | Nationwide Mutual Insurance Company, 144A | | | 8.250% | | | | 12/01/31 | | | | A– | | | | 2,164,818 | |
| | | | | |
| | 1,500 | | | Nationwide Mutual Insurance Company, 144A | | | 7.875% | | | | 4/01/33 | | | | A– | | | | 1,592,003 | |
| | | | | |
| | 15,210 | | | Nationwide Mutual Insurance Company, 144A | | | 9.375% | | | | 8/15/39 | | | | A– | | | | 18,496,925 | |
| | | | | |
| | 700 | | | QBE Insurance Group Limited, 144A | | | 9.750% | | | | 3/14/14 | | | | A | | | | 809,553 | |
| | 28,720 | | | Total Insurance | | | | | | | | | | | | | | | 33,083,187 | |
| $ | 31,720 | | | Total Corporate Bonds (cost $34,512,193) | | | | | | | | | | | | | | | 36,079,437 | |
Principal
Amount
(000)/Shares | | | Description (1) | | Coupon | | | Maturity | | | Ratings (2) | | | Value | |
| | | | CAPITAL PREFERRED SECURITIES – 45.6% | | | | | | | | | | | | | | | | |
| | | | | |
| | | | Capital Markets – 1.9% | | | | | | | | | | | | | | | | |
| | | | | |
| | 250 | | | BNY Institutional Capital, 144A | | | 7.780% | | | | 12/01/26 | | | | A1 | | | $ | 255,938 | |
| | | | | |
| | 6,500 | | | Goldman Sachs Group, Inc. | | | 6.345% | | | | 2/15/34 | | | | A3 | | | | 6,245,928 | |
| | | | | |
| | 6,569 | | | Schwab Capital Trust I | | | 7.500% | | | | 11/15/37 | | | | BBB+ | | | | 6,785,251 | |
| | 13,319 | | | Total Capital Markets | | | | | | | | | | | | | | | 13,287,117 | |
| | | | Commercial Banks – 12.3% | | | | | | | | | | | | | | | | |
| | | | | |
| | 3,000 | | | Abbey National Capital Trust I | | | 8.963% | | | | 6/30/30 | | | | A | | | | 3,285,000 | |
| | | | | |
| | 2,062 | | | Bank of America Corporation | | | 8.000% | | | | 1/30/18 | | | | BBB | | | | 2,217,413 | |
| | | | | |
| | 12,935 | | | Barclays Bank PLC | | | 6.278% | | | | 12/15/34 | | | | A | | | | 11,253,450 | |
| | | | | |
| | 3,135 | | | BB&T Capital Trust IV | | | 6.820% | | | | 6/12/37 | | | | Baa1 | | | | 3,119,325 | |
| | | | | |
| | 900 | | | BBVA Bancomer Texas | | | 7.250% | | | | 4/22/20 | | | | A3 | | | | 908,612 | |
| | | | | |
| | 11,705 | | | BNP Paribas, 144A | | | 7.195% | | | | 12/25/37 | | | | A | | | | 11,236,800 | |
| | | | | |
| | 950 | | | Credit Agricole, S.A | | | 9.750% | | | | 12/26/54 | | | | A | | | | 1,033,125 | |
| | | | | |
| | 5,500 | | | First Empire Capital Trust I | | | 8.234% | | | | 2/01/27 | | | | Baa2 | | | | 5,569,938 | |
| | | | | |
| | 3,000 | | | First Empire Capital Trust II | | | 8.277% | | | | 6/01/27 | | | | Baa2 | | | | 3,036,585 | |
| | | | | |
| | 3,380 | | | HVB Funding Trust III, 144A | | | 9.000% | | | | 10/22/31 | | | | BBB | | | | 3,295,500 | |
| | | | | |
| | 4,750 | | | Rabobank Nederland, 144A | | | 11.000% | | | | 6/30/19 | | | | AA– | | | | 6,186,875 | |
| | | | | |
| | 1,000 | | | Societe Generale | | | 8.750% | | | | 10/07/49 | | | | BBB+ | | | | 1,057,500 | |
| | | | | |
| | 3,500 | | | Standard Chartered PLC, 144A | | | 7.014% | | | | 7/30/37 | | | | A | | | | 3,403,855 | |
| | | | | |
| | 2,000 | | | Union State Capital Trust I | | | 9.580% | | | | 2/01/27 | | | | N/R | | | | 2,042,100 | |
| | | | | |
| | 24,619 | | | Wells Fargo & Company, Series K | | | 7.980% | | | | 9/15/99 | | | | A | | | | 26,957,804 | |
| | | | | |
| | 1,833 | | | Wells Fargo Capital Trust XIII | | | 7.700% | | | | 3/26/13 | | | | A | | | | 1,887,990 | |
| | 84,269 | | | Total Commercial Banks | | | | | | | | | | | | | | | 86,491,872 | |
| | | | Consumer Finance – 1.0% | | | | | | | | | | | | | | | | |
| | | | | |
| | 6,895 | | | Capital One Capital III Corporation | | | 7.686% | | | | 8/15/36 | | | | BBB | | | | 7,093,231 | |
| | | | Diversified Financial Services – 3.7% | | | | | | | | | | | | | | | | |
| | | | | |
| | 22,811 | | | JPMorgan Chase & Company | | | 7.900% | | | | 4/30/18 | | | | A | | | | 24,957,743 | |
| | | | | |
| | 1,000 | | | Republic New York Capital I | | | 7.750% | | | | 11/15/26 | | | | A+ | | | | 1,020,000 | |
| | 23,811 | | | Total Diversified Financial Services | | | | | | | | | | | | | | | 25,977,743 | |
| | | | Electric Utilities – 1.0% | | | | | | | | | | | | | | | | |
| | | | | |
| | 500 | | | FPL Group Capital Inc. | | | 6.350% | | | | 10/01/16 | | | | BBB | | | | 493,125 | |
| | | | | |
| | 825 | | | FPL Group Capital Inc. | | | 7.300% | | | | 9/01/17 | | | | BBB | | | | 861,094 | |
| | | | | |
| | 5,959 | | | PPL Capital Funding, Inc. | | | 6.700% | | | | 3/30/17 | | | | BB+ | | | | 5,877,064 | |
| | 7,284 | | | Total Electric Utilities | | | | | | | | | | | | | | | 7,231,283 | |
| | | | | | | | | | | | | | | | | | | | |
Principal
Amount (000)/Shares | | | Description (1) | | Coupon | | | Maturity | | | Ratings (2) | | | Value | |
| | | | Insurance – 21.2% | | | | | | | | | | | | | | | | |
| | | | | |
| | 1,300 | | | Ace Capital Trust II | | | 9.700% | | | | 4/01/30 | | | | BBB+ | | | $ | 1,638,000 | |
| | | | | |
| | 7,010 | | | AXA SA, 144A | | | 6.379% | | | | 12/14/36 | | | | Baa1 | | | | 6,203,850 | |
| | | | | |
| | 84 | | | Axis Capital Holdings Limited | | | 7.500% | | | | 12/01/15 | | | | BBB | | | | 8,326,317 | |
| | | | | |
| | 22,154 | | | Catlin Insurance Company Limited | | | 7.249% | | | | 1/19/17 | | | | BBB+ | | | | 20,880,145 | |
| | | | | |
| | 1,900 | | | Dai-Ichi Mutual Life, 144A | | | 7.250% | | | | 7/25/61 | | | | A3 | | | | 1,878,253 | |
| | | | | |
| | 6,195 | | | Everest Reinsurance Holdings, Inc. | | | 6.600% | | | | 5/15/37 | | | | Baa1 | | | | 5,885,250 | |
| | | | | |
| | 8,000 | | | Financial Security Assurance Holdings, 144A | | | 6.400% | | | | 12/15/36 | | | | A– | | | | 5,240,000 | |
| | | | | |
| | 14,500 | | | Glen Meadows Pass Through Trust, 144A | | | 6.505% | | | | 2/15/17 | | | | BB+ | | | | 12,796,250 | |
| | | | | |
| | 2,400 | | | Hartford Financial Services Group Inc. | | | 8.125% | | | | 6/15/18 | | | | BB+ | | | | 2,628,000 | |
| | | | | |
| | 12,172 | | | Liberty Mutual Group Inc., 144A | | | 10.750% | | | | 6/15/58 | | | | Baa3 | | | | 15,823,600 | |
| | | | | |
| | 4,150 | | | Lincoln National Corporation | | | 7.000% | | | | 5/17/16 | | | | BBB | | | | 4,118,875 | |
| | | | | |
| | 3,000 | | | Lincoln National Corporation | | | 6.050% | | | | 4/20/17 | | | | BBB | | | | 2,805,000 | |
| | | | | |
| | 15,711 | | | MetLife Capital Trust X, 144A | | | 9.250% | | | | 4/08/68 | | | | BBB | | | | 18,971,033 | |
| | | | | |
| | 3,847 | | | National Financial Services Inc. | | | 6.750% | | | | 5/15/37 | | | | Baa2 | | | | 3,568,093 | |
| | | | | |
| | 5,090 | | | Prudential Financial Inc. | | | 8.875% | | | | 6/15/18 | | | | BBB+ | | | | 6,006,200 | |
| | | | | |
| | 3,000 | | | Prudential PLC | | | 7.750% | | | | 3/23/49 | | | | A– | | | | 3,037,500 | |
| | | | | |
| | 2,000 | | | Reinsurance Group of America Inc. | | | 6.750% | | | | 12/15/15 | | | | BBB– | | | | 1,954,252 | |
| | | | | |
| | 5,000 | | | StanCorp Financial Group Inc. | | | 6.900% | | | | 6/01/17 | | | | BBB | | | | 4,800,000 | |
| | | | | |
| | 9,455 | | | Swiss Re Capital I, 144A | | | 6.854% | | | | 5/25/16 | | | | A– | | | | 9,252,096 | |
| | | | | |
| | 7,900 | | | Symetra Financial Corporation, 144A | | | 8.300% | | | | 10/15/37 | | | | BBB– | | | | 7,959,250 | |
| | | | | |
| | 5,851 | | | XL Capital Ltd | | | 6.500% | | | | 10/15/57 | | | | BBB– | | | | 5,368,293 | |
| | 140,719 | | | Total Insurance | | | | | | | | | | | | | | | 149,140,257 | |
| | | | Real Estate Investment Trust – 1.7% | | | | | | | | | | | | | | | | |
| | | | | |
| | 11 | | | Sovereign Real Estate Investment Trust, 144A | | | 12.000% | | | | 10/31/50 | | | | A | | | | 12,302,960 | |
| | | | U.S. Agency – 2.8% | | | | | | | | | | | | | | | | |
| | | | | |
| | 1,650 | | | AgFirst Farm Credit Bank | | | 7.300% | | | | 12/15/53 | | | | A | | | | 1,456,010 | |
| | | | | |
| | 16 | | | Farm Credit Bank of Texas | | | 10.000% | | | | 12/15/60 | | | | A | | | | 17,930,000 | |
| | 1,666 | | | Total U.S. Agency | | | | | | | | | | | | | | | 19,386,010 | |
| | | | Total Capital Preferred Securities (cost $294,587,421) | | | | | | | | | | | | | | | 320,910,473 | |
| | | | | |
Principal
Amount (000) | | | Description (1) | | | | | Coupon | | | Maturity | | | Value | |
| | | | SHORT-TERM INVESTMENTS – 0.6% | | | | | | | | | | | | | | | | |
| | | | | |
| $ | 4,083 | | | Repurchase Agreement with State Street Bank, dated 3/31/11, repurchase price $4,083,232, collateralized by $4,120,000 U.S. Treasury Notes, 1.000%, due 4/30/12, value 4,165,993 | | | | | | | 0.010% | | | | 4/01/11 | | | $ | 4,083,231 | |
| | | | Total Short-Term Investments (cost $4,083,231) | | | | | | | | | | | | | | | 4,083,231 | |
| | | | Total Investments (cost $621,474,306) – 98.5% | | | | | | | | | | | | | | | 692,205,759 | |
| | | | Other Assets Less Liabilities – 1.5% (7) | | | | | | | | | | | | | | | 10,402,249 | |
| | | | Net Assets – 100% | | | | | | | | | | | | | | $ | 702,608,008 | |
Investments in Derivatives
Forward Swaps outstanding at March 31, 2011:
| | | | | | | | | | | | | | | | | | | | | | | | |
| Counterparty | | Notional
Amount | | | Fund
Pay/Receive
Floating Rate | | Floating
Rate Index | | Fixed Rate
(Annualized) | | Fixed Rate
Payment
Frequency | | | Effective
Date (6) | | Termination
Date | | | Unrealized
Appreciation
(Depreciation) | |
Morgan Stanley | | $ | 28,000,000 | | | Receive | | 3-Month USD-LIBOR | | 2.970% | | | Semi-Annually | | | 11/10/11 | | | 11/10/21 | | | $ | 2,120,439 | |
Morgan Stanley | | | 12,000,000 | | | Receive | | 3-Month USD-LIBOR | | 3.488% | | | Semi-Annually | | | 10/14/11 | | | 10/14/40 | | | | 1,833,356 | |
| | | | | | | | | | | | | | | | | | | | | | | $ | 3,953,795 | |
Portfolio of Investments (Unaudited)
Nuveen Preferred Securities Fund (continued)
March 31, 2011
| | (1) | | All percentages shown in the Portfolio of Investments are based on net assets. |
| | (2) | | Ratings: Using the highest of Standard & Poor’s Group (“Standard & Poor’s”), Moody’s Investor Service, Inc. (“Moody’s”) or Fitch, Inc. (“Fitch”) rating. Ratings below BBB by Standard & Poor’s, Baa by Moody’s or BBB by Fitch are considered to be below investment grade. Holdings designated N/R are not rated by any of these national rating agencies. |
| | (3) | | Optional Call Provisions: Dates (month and year) and prices of the earliest optional call or redemption. There may be other call provisions at varying prices at later dates. Certain mortgage-backed securities may be subject to periodic principal paydowns. |
| | (4) | | For fair value measurement disclosure purposes, investment categorized as Level 3. See Notes to Financial Statements, Footnote 1 – General Information and Significant Accounting Policies, Investment Valuation for more information. |
| | (5) | | The Fund’s Adviser has concluded this issue is not likely to meet its future interest payment obligations and has directed the Fund’s custodian to cease accruing additional income on the Fund’s records. |
| | (6) | | Effective date represents the date on which both the Fund and Counterparty commence interest payment accruals on each forward swap contract. |
| | (7) | | Other Assets Less Liabilities includes Value and/or Net Unrealized Appreciation (Depreciation) of derivative instruments as listed within Investments in Derivatives. |
| | 144A | | Investment is exempt from registration under Rule 144A of the Securities Act of 1933, as amended. These investments may only be resold in transactions exempt from registration, which are normally those transactions with qualified institutional buyers. |
| | SATURNS | | Structured Asset Trust Unit Repackaging. |
| | USD-LIBOR | | United States Dollar-London Inter-Bank Offered Rate. |
See accompanying notes to financial statements.
Statement of Assets and Liabilities (Unaudited)
March 31, 2011
| | | | |
Assets | | | | |
Investments, at value (cost $621,474,306) | | $ | 692,205,759 | |
Unrealized appreciation on forward swaps | | | 3,953,795 | |
Receivables: | | | | |
Dividends | | | 1,293,151 | |
Interest | | | 6,590,476 | |
Investments sold | | | 4,636,996 | |
Shares sold | | | 3,396,556 | |
Other assets | | | 6,951 | |
Total assets | | | 712,083,684 | |
Liabilities | | | | |
Payables: | | | | |
Dividends | | | 1,818,072 | |
Investments purchased | | | 5,539,206 | |
Shares redeemed | | | 1,349,681 | |
Accrued expenses: | | | | |
Management fees | | | 329,945 | |
12b-1 distribution and service fees | | | 128,227 | |
Other | | | 310,545 | |
Total liabilities | | | 9,475,676 | |
Net assets | | $ | 702,608,008 | |
Class A Shares | | | | |
Net assets | | $ | 189,779,153 | |
Shares outstanding | | | 11,225,263 | |
Net asset value per share | | $ | 16.91 | |
Offering price per share (net asset value per share plus
maximum sales charge of 4.75% of offering price) | | $ | 17.75 | |
Class C Shares | | | | |
Net assets | | $ | 106,925,686 | |
Shares outstanding | | | 6,321,718 | |
Net asset value and offering price per share | | $ | 16.91 | |
Class R3 Shares | | | | |
Net assets | | $ | 105,516 | |
Shares outstanding | | | 6,200 | |
Net asset value and offering price per share | | $ | 17.02 | |
Class I Shares | | | | |
Net assets | | $ | 405,797,653 | |
Shares outstanding | | | 23,999,866 | |
Net asset value and offering price per share | | $ | 16.91 | |
Net Assets Consist of: | | | | |
Capital paid-in | | $ | 611,704,988 | |
Undistributed (Over-distribution of) net investment income | | | (1,258,126 | ) |
Accumulated net realized gain (loss) | | | 17,475,898 | |
Net unrealized appreciation (depreciation) | | | 74,685,248 | |
Net assets | | $ | 702,608,008 | |
Authorized shares | | | Unlimited | |
Par value per share | | $ | 0.01 | |
See accompanying notes to financial statements.
Statement of Operations (Unaudited)
Six Months Ended March 31, 2011
| | | | |
Investment Income | | | | |
Dividends | | $ | 12,391,067 | |
Interest | | | 11,791,175 | |
Total investment income | | | 24,182,242 | |
Expenses | | | | |
Management fees | | | 2,347,466 | |
12b-1 service fees – Class A | | | 222,270 | |
12b-1 distribution and service fees – Class C | | | 504,752 | |
12b-1 distribution and service fees – Class R3 | | | 196 | |
Shareholders’ servicing agent fees and expenses | | | 197,370 | |
Custodian’s fees and expenses | | | 75,809 | |
Trustees’ fees and expenses | | | 8,004 | |
Professional fees | | | 28,673 | |
Shareholders’ reports – printing and mailing expenses | | | 55,540 | |
Federal and state registration fees | | | 85,126 | |
Other expenses | | | 11,008 | |
Total expenses before custodian fee credit and expense reimbursement | | | 3,536,214 | |
Custodian fee credit | | | (157 | ) |
Expense reimbursement | | | (389,684 | ) |
Net expenses | | | 3,146,373 | |
Net investment income (loss) | | | 21,035,869 | |
Realized and Unrealized Gain (Loss): | | | | |
Net realized gain (loss) from investments | | | 18,886,257 | |
Change in net unrealized appreciation (depreciation) of: | | | | |
Investments | | | (9,598,821 | ) |
Forward swaps | | | 3,921,321 | |
Net realized and unrealized gain (loss) | | | 13,208,757 | |
Net increase (decrease) in net assets from operations | | $ | 34,244,626 | |
See accompanying notes to financial statements.
Statement of Changes in Net Assets (Unaudited)
| | | | | | | | |
| | | Six Months Ended
3/31/2011 | | | Year Ended
9/30/10 | |
Operations | | | | | | | | |
Net investment income (loss) | | $ | 21,035,869 | | | $ | 30,309,314 | |
Net realized gain (loss) from: | | | | | | | | |
Investments | | | 18,886,257 | | | | 27,616,437 | |
Futures | | | — | | | | (44,310 | ) |
Change in net unrealized appreciation (depreciation) of: | | | | | | | | |
Investments | | | (9,598,821 | ) | | | 35,553,087 | |
Forward swaps | | | 3,921,321 | | | | 32,474 | |
Futures | | | — | | | | (101,585 | ) |
Net increase (decrease) in net assets from operations | | | 34,244,626 | | | | 93,365,417 | |
Distributions to Shareholders | | | | | | | | |
From net investment income: | | | | | | | | |
Class A | | | (5,755,859 | ) | | | (8,823,737 | ) |
Class C | | | (2,889,825 | ) | | | (4,793,553 | ) |
Class R3 | | | (2,453 | ) | | | (3,823 | ) |
Class I | | | (12,817,647 | ) | | | (17,275,636 | ) |
From accumulated net realized gains: | | | | | | | | |
Class A | | | (4,508,870 | ) | | | — | |
Class C | | | (2,475,555 | ) | | | — | |
Class R3 | | | (1,530 | ) | | | — | |
Class I | | | (9,927,935 | ) | | | — | |
Decrease in net assets from distributions to shareholders | | | (38,379,674 | ) | | | (30,896,749 | ) |
Fund Share Transactions | | | | | | | | |
Proceeds from sale of shares | | | 254,541,005 | | | | 487,260,177 | |
Proceeds from shares issued to shareholders due to reinvestment of distributions | | | 19,698,958 | | | | 15,884,319 | |
| | | 274,239,963 | | | | 503,144,496 | |
Cost of shares redeemed | | | (209,217,111 | ) | | | (183,288,380 | ) |
Net increase (decrease) in net assets from Fund share transactions | | | 65,022,852 | | | | 319,856,116 | |
Net increase (decrease) in net assets | | | 60,887,804 | | | | 382,324,784 | |
Net assets at the beginning of period | | | 641,720,204 | | | | 259,395,420 | |
Net assets at the end of period | | $ | 702,608,008 | | | $ | 641,720,204 | |
Undistributed (Over-distribution of) net investment income at the end of period | | $ | (1,258,126 | ) | | $ | (828,211 | ) |
See accompanying notes to financial statements.
Financial Highlights (Unaudited)
| | | | | | | | | | | | | | | | | | | | | | | | | | | | | | | | | | | | | | | | |
| Selected data for a share outstanding throughout each period: | |
| | | | | | | | |
| Class (Commencement Date) | | | | | | | | | | | | | | | | | | | | | | | | | |
| | | | | | Investment Operations | | | Less Distributions | | | | | | | |
| | | | | | | | | | | | | | | | | | | | | | | | | | | | | |
| | | | | | | | | | |
| | | Beginning
Net
Asset
Value | | | Net
Invest-
ment
Income
(Loss)(a) | | |
Net
Realized/
Unrealized
Gain
(Loss) | | | Total | | | Net
Invest-
ment
Income | | | Capital
Gains(b) | | | Return
of
Capital | | | Total | | | Ending
Net
Asset
Value | | | Total
Return(c) | |
Class A (12/06) | | | | | | | | | | | | | | | | | | | | | | | | | | | | | | | | | | | | | |
Year Ended 9/30: | | | | | | | | | | | | | | | | | | | | | | | | | | | | | | | | | | | | | | | | |
2011(i) | | $ | 16.99 | | | $ | .53 | | | $ | .35 | | | $ | .88 | | | $ | (.54 | ) | | $ | (.42 | ) | | $ | — | | | $ | (.96 | ) | | $ | 16.91 | | | | 5.33 | % |
2010 | | | 14.73 | | | | 1.11 | | | | 2.28 | | | | 3.39 | | | | (1.13 | ) | | | — | | | | — | | | | (1.13 | ) | | | 16.99 | | | | 23.84 | |
2009(e) | | | 11.76 | | | | .84 | | | | 3.00 | | | | 3.84 | | | | (.87 | ) | | | — | | | | — | | | | (.87 | ) | | | 14.73 | | | | 35.29 | |
Year Ended 12/31: | | | | | | | | | | | | | | | | | | | | | | | | | | | | | | | | | | | | | | | | |
2008 | | | 16.98 | | | | 1.31 | | | | (5.30 | ) | | | (3.99 | ) | | | (1.08 | ) | | | — | | | | (.15 | ) | | | (1.23 | ) | | | 11.76 | | | | (24.67 | ) |
2007 | | | 20.01 | | | | 1.08 | | | | (3.03 | ) | | | (1.95 | ) | | | (1.08 | ) | | | — | | | | — | | | | (1.08 | ) | | | 16.98 | | | | (10.12 | ) |
2006(f) | | | 20.00 | | | | .03 | | | | (.02 | ) | | | .01 | | | | — | | | | — | | | | — | | | | — | | | | 20.01 | | | | .05 | |
Class C (12/06) | | | | | | | | | | | | | | | | | | | | | | | | | | | | | | | | | | | | | |
Year Ended 9/30: | | | | | | | | | | | | | | | | | | | | | | | | | | | | | | | | | | | | | | | | |
2011(i) | | | 17.00 | | | | .47 | | | | .34 | | | | .81 | | | | (.48 | ) | | | (.42 | ) | | | — | | | | (.90 | ) | | | 16.91 | | | | 4.94 | |
2010 | | | 14.74 | | | | 1.00 | | | | 2.28 | | | | 3.28 | | | | (1.02 | ) | | | — | | | | — | | | | (1.02 | ) | | | 17.00 | | | | 22.94 | |
2009(e) | | | 11.77 | | | | .78 | | | | 3.00 | | | | 3.78 | | | | (.81 | ) | | | — | | | | — | | | | (.81 | ) | | | 14.74 | | | | 34.48 | |
Year Ended 12/31: | | | | | | | | | | | | | | | | | | | | | | | | | | | | | | | | | | | | | | | | |
2008 | | | 16.96 | | | | 1.16 | | | | (5.24 | ) | | | (4.08 | ) | | | (.97 | ) | | | — | | | | (.14 | ) | | | (1.11 | ) | | | 11.77 | | | | (25.13 | ) |
2007 | | | 20.01 | | | | .93 | | | | (3.03 | ) | | | (2.10 | ) | | | (.95 | ) | | | — | | | | — | | | | (.95 | ) | | | 16.96 | | | | (10.85 | ) |
2006(f) | | | 20.00 | | | | .03 | | | | (.02 | ) | | | .01 | | | | — | | | | — | | | | — | | | | — | | | | 20.01 | | | | .05 | |
Class R3 (9/09) | | | | | | | | | | | | | | | | | | | | | | | | | | | | | | | | | | | | | |
Year Ended 9/30: | | | | | | | | | | | | | | | | | | | | | | | | | | | | | | | | | | | | | | | | |
2011(i) | | | 17.10 | | | | .52 | | | | .35 | | | | .87 | | | | (.53 | ) | | | (.42 | ) | | | — | | | | (.95 | ) | | | 17.02 | | | | 5.25 | |
2010 | | | 14.82 | | | | 1.08 | | | | 2.30 | | | | 3.38 | | | | (1.10 | ) | | | — | | | | — | | | | (1.10 | ) | | | 17.10 | | | | 23.59 | |
2009(h) | | | 14.88 | | | | .01 | | | | (.07 | ) | | | (.06 | ) | | | — | | | | — | | | | — | | | | — | | | | 14.82 | | | | (.40 | ) |
Class I (12/06)(g) | | | | | | | | | | | | | | | | | | | | | | | | | | | | | | | | | | | | | |
Year Ended 9/30: | | | | | | | | | | | | | | | | | | | | | | | | | | | | | | | | | | | | | | | | |
2011(i) | | | 16.99 | | | | .55 | | | | .36 | | | | .91 | | | | (.57 | ) | | | (.42 | ) | | | — | | | | (.99 | ) | | | 16.91 | | | | 5.46 | |
2010 | | | 14.72 | | | | 1.16 | | | | 2.28 | | | | 3.44 | | | | (1.17 | ) | | | — | | | | — | | | | (1.17 | ) | | | 16.99 | | | | 24.23 | |
2009(e) | | | 11.76 | | | | .86 | | | | 3.00 | | | | 3.86 | | | | (.90 | ) | | | — | | | | — | | | | (.90 | ) | | | 14.72 | | | | 35.48 | |
Year Ended 12/31: | | | | | | | | | | | | | | | | | | | | | | | | | | | | | | | | | | | | | | | | |
2008 | | | 16.98 | | | | 1.19 | | | | (5.14 | ) | | | (3.95 | ) | | | (1.14 | ) | | | — | | | | (.13 | ) | | | (1.27 | ) | | | 11.76 | | | | (24.45 | ) |
2007 | | | 20.01 | | | | 1.18 | | | | (3.08 | ) | | | (1.90 | ) | | | (1.13 | ) | | | — | | | | — | | | | (1.13 | ) | | | 16.98 | | | | (9.91 | ) |
2006(f) | | | 20.00 | | | | .04 | | | | (.03 | ) | | | .01 | | | | — | | | | — | | | | — | | | | — | | | | 20.01 | | | | .05 | |
| | | | | | | | | | | | | | | | | | | | | | |
| | | | | | | | | | | |
| | | |
| | | | | | | | | | | |
| Ratios/Supplemental Data | |
| | | | Ratios to Average
Net Assets Before
Reimbursement | | | Ratios to Average
Net Assets After
Reimbursement(d) | | | | |
Ending
Net
Assets
(000) | | | Expenses | | | Net
Invest-
ment
Income
(Loss) | | | Expenses | | | Net
Invest-
ment
Income
(Loss) | | | Portfolio
Turnover
Rate | |
| | | | | | | | | | | | | | | | | | | | | | |
| | | | | | | | | | | | | | | | | | | | | | |
| $ | 189,779 | | | | 1.10 | * | | | 6.18 | * | | | .98 | * | | | 6.30 | * | | | 29 | |
| | 185,972 | | | | 1.16 | | | | 6.87 | | | | .95 | | | | 7.07 | | | | 72 | |
| | 93,983 | | | | 1.47 | * | | | 8.58 | * | | | .94 | * | | | 9.11 | * | | | 30 | |
| | | | | | | | | | | | | | | | | | | | | | |
| | 22,420 | | | | 1.64 | | | | 10.32 | | | | .95 | | | | 11.02 | | | | 99 | |
| | 321 | | | | 2.50 | | | | 4.23 | | | | 1.13 | | | | 5.60 | | | | 179 | |
| | 275 | | | | 18.18 | * | | | (12.06 | )* | | | 1.23 | * | | | 4.88 | * | | | 0 | |
| | | | | | | | | | | | | | | | | | | | | | |
| | | | | | | | | | | | | | | | | | | | | | |
| | 106,926 | | | | 1.85 | * | | | 5.45 | * | | | 1.73 | * | | | 5.57 | * | | | 29 | |
| | 97,316 | | | | 1.91 | | | | 6.13 | | | | 1.70 | | | | 6.34 | | | | 72 | |
| | 48,720 | | | | 2.23 | * | | | 7.82 | * | | | 1.69 | * | | | 8.36 | * | | | 30 | |
| | | | | | | | | | | | | | | | | | | | | | |
| | 6,429 | | | | 2.32 | | | | 8.90 | | | | 1.70 | | | | 9.52 | | | | 99 | |
| | 245 | | | | 3.29 | | | | 3.39 | | | | 1.89 | | | | 4.79 | | | | 179 | |
| | 275 | | | | 18.93 | * | | | (12.82 | )* | | | 1.99 | * | | | 4.12 | * | | | 0 | |
| | | | | | | | | | | | | | | | | | | | | | |
| | | | | | | | | | | | | | | | | | | | | | |
| | 106 | | | | 1.36 | * | | | 6.04 | * | | | 1.23 | * | | | 6.16 | * | | | 29 | |
| | 62 | | | | 1.42 | | | | 6.59 | | | | 1.20 | | | | 6.81 | | | | 72 | |
| | 50 | | | | 1.37 | * | | | 11.62 | * | | | 1.20 | * | | | 11.79 | * | | | 30 | |
| | | | | | | | | | | | | | | | | | | | | | |
| | | | | | | | | | | | | | | | | | | | | | |
| | 405,798 | | | | .85 | * | | | 6.48 | * | | | .73 | * | | | 6.60 | * | | | 29 | |
| | 358,371 | | | | .91 | | | | 7.16 | | | | .70 | | | | 7.37 | | | | 72 | |
| | 116,643 | | | | 1.21 | * | | | 9.12 | * | | | .69 | * | | | 9.64 | * | | | 30 | |
| | | | | | | | | | | | | | | | | | | | | | |
| | 38,697 | | | | 1.26 | | | | 7.57 | | | | .69 | | | | 8.14 | | | | 99 | |
| | 19,769 | | | | 1.80 | | | | 5.28 | | | | .78 | | | | 6.30 | | | | 179 | |
| | 4,178 | | | | 17.92 | * | | | (11.81 | )* | | | .98 | * | | | 5.13 | * | | | 0 | |
| (a) | Per share Net Investment Income (Loss) is calculated using the average daily shares method. |
| (b) | Distributions from Capital Gains include short-term capital gains, if any. |
| (c) | Total return is the combination of changes in net asset value without any sales charge, reinvested dividend income at net asset value and reinvested capital gains distributions at net asset value, if any. Total returns are not annualized. |
| (d) | After expense reimbursement from the Adviser, where applicable. Ratios do not reflect the effect of custodian fee credits earned on the Fund’s net cash on deposit with the custodian bank, where applicable. |
| (e) | For the nine months ended September 30, 2009. |
| (f) | For the period December 19, 2006 (commencement of operations) through December 31, 2006. |
| (g) | Effective May 1, 2008, Class R Shares were renamed Class I Shares. |
| (h) | For the period September 29, 2009 (commencement of operations) through September 30, 2009. |
| (i) | For the six months ended March 31, 2011. |
See accompanying notes to financial statements.
Notes to Financial Statements (Unaudited)
1. General Information and Significant Accounting Policies
General Information
The Nuveen Investment Trust V (the “Trust”) is an open-end investment company registered under the Investment Company Act of 1940, as amended. The Trust is comprised of the Nuveen Preferred Securities Fund (the “Fund”), among others. The Trust was organized as a Massachusetts business trust on September 27, 2006.
Effective January 1, 2011, the Fund’s adviser, Nuveen Asset Management, a wholly-owned subsidiary of Nuveen Investments, Inc. (“Nuveen”), changed its name to Nuveen Fund Advisors, Inc. (the “Adviser”). Concurrently, the Adviser formed a wholly-owned subsidiary, Nuveen Asset Management, LLC (the “Sub-Adviser”) to house its portfolio management capabilities and to serve as the Fund’s sub-adviser, and the Fund’s portfolio manager became an employee of the Sub-Adviser. The Adviser will compensate the Sub-Adviser for the portfolio management services it provides to the Fund from the Fund’s management fee.
The Fund seeks to provide a high level of current income and total return. Under normal market conditions, the Fund invests at least 80% of its net assets in preferred securities. Preferred securities generally pay fixed or adjustable rate distributions to investors and have preference over common stock in the payment of distributions and the liquidation of a company’s assets, but are junior to all forms of the company’s debt, including both senior and subordinated debt; therefore, the risks and potential rewards of investing in the Fund may at times be similar to the risks and potential rewards of investing in both equity funds and bond funds. The Fund invests primarily in fully taxable preferred securities (i.e., securities that do not qualify for the dividends received deduction). The Fund normally invests at least 60% of its net assets in securities rated investment grade (BBB/Baa or higher) at the time of purchase by at least one independent rating agency and unrated securities judged to be of comparable quality by the Sub-Adviser. The Fund may invest up to 40% of its net assets in securities rated below investment grade (BB/Ba or lower) at the time of purchase, which are commonly referred to as “high yield,” or “junk” securities. Although the Fund invests primarily in securities issued by U.S. companies, the Fund may invest up to 35% of its net assets in U.S. dollar-denominated securities issued by non-U.S. companies. The Fund seeks to meet its investment objective by investing primarily in preferred securities, but it may also invest up to 20% of its net assets in other types of securities, including corporate debt securities, U.S. government and agency debt, taxable municipal securities and convertible preferred securities. The Fund may invest up to 15% of its net assets in securities and other instruments that, at the time of investment, are illiquid (i.e., securities that are not readily marketable). The Fund may also invest in forwards, futures, options and swap contracts, or other derivative financial instruments including credit default swaps.
Significant Accounting Policies
The following is a summary of significant accounting policies followed by the Fund in the preparation of its financial statements in accordance with U.S. generally accepted accounting principles (“U.S. GAAP”).
Investment Valuation
Equity-type securities are valued at the last sales price on the securities exchange on which such securities are primarily traded. Securities primarily traded on the NASDAQ National Market (“NASDAQ”) are valued, except as indicated below, at the NASDAQ Official Closing Price. However, securities traded on a securities exchange or NASDAQ for which there were no transactions on a given day or securities not listed on a securities exchange or NASDAQ are valued at the last quoted bid price. These Securities are generally classified as Level 1 for fair value measurement purposes.
Prices of fixed-income securities and forward swap contracts are provided by a pricing service approved by the Fund’s Board of Trustees. These securities are generally classified as Level 2. When price quotes are not readily available the pricing service establishes a security’s fair value using methods that may include consideration of the following: yields or prices of investments of comparable quality, type of issue, coupon, maturity and rating, market quotes or indications of value from security dealers, evaluations of anticipated cash flows or collateral, general market conditions and other information and analysis, including the obligor’s credit characteristics considered relevant. In pricing certain securities, particularly less liquid and lower quality securities, the pricing service may consider information about a security, its issuer, or market activity provided by the Adviser. These securities are generally classified as Level 2 or Level 3 depending on the priority of the significant inputs.
Futures contracts are valued using the closing settlement price or, in the absence of such a price, at the last traded price. Futures contracts are generally classified as Level 2.
Repurchase agreements are valued at contract amount plus accrued interest, which approximates market value. These securities are generally classified as Level 2.
Certain securities may not be able to be priced by the pre-established pricing methods as described above. Such securities may be valued by the Fund’s Board of Trustees or its designee at fair value. These securities generally include, but are not limited to, restricted securities (securities which may not be publicly sold without registration under the Securities Act of 1933, as amended) for which a pricing service is unable to provide a market price; securities whose trading has been formally suspended; debt securities that have gone into default and for which there is no current market quotation; a security whose market price is not available from a pre-established pricing source; a security with respect to which an event has occurred that is likely to materially affect the value of the security after the market has closed but before the calculation of the Fund’s net asset value (as may be the case in non-U.S. markets on
which the security is primarily traded) or make it difficult or impossible to obtain a reliable market quotation; and a security whose price, as provided by the pricing service, is not deemed to reflect the security’s fair value. As a general principle, the fair value of a security would appear to be the amount that the owner might reasonably expect to receive for it in a current sale. A variety of factors may be considered in determining the fair value of such securities, which may include consideration of the following: yields or prices of investments of comparable quality, type of issue, coupon, maturity and rating, market quotes or indications of value from security dealers, evaluations of anticipated cash flows or collateral, general market conditions and other information and analysis, including the obligor’s credit characteristics considered relevant. These securities are generally classified as Level 2 or Level 3 depending on the priority of the significant inputs. Regardless of the method employed to value a particular security, all valuations are subject to review by the Fund’s Board of Trustees or its designee.
Refer to Footnote 2 – Fair Value Measurements for further details on the leveling of securities held by the Fund as of the end of the reporting period.
Investment Transactions
Investment transactions are recorded on a trade date basis. Realized gains and losses from investment transactions are determined on the specific identification method, which is the same basis used for federal income tax purposes. Investments purchased on a when-issued/delayed delivery basis may have extended settlement periods. Any investments so purchased are subject to market fluctuation during this period. The Fund has instructed the custodian to segregate assets with a current value at least equal to the amount of the when-issued/delayed delivery purchase commitments. At March 31, 2011, the Fund had no such outstanding purchase commitments.
Investment Income
Dividend income is recorded on the ex-dividend date or, for foreign securities, when information is available. Interest income, which reflects the amortization of premiums and includes accretion of discounts for financial reporting purposes, is recorded on an accrual basis. Interest income also reflects paydown gains and losses, if any.
Income Taxes
The Fund intends to distribute substantially all of its net investment income and net capital gains to shareholders and to otherwise comply with the requirements of Subchapter M of the Internal Revenue Code applicable to regulated investment companies. Therefore, no federal income tax provision is required.
For all open tax years and all major taxing jurisdictions, management of the Fund has concluded that there are no significant uncertain tax positions that would require recognition in the financial statements. Open tax years are those that are open for examination by taxing authorities (i.e., generally the last four tax year ends and the interim tax period since then). Furthermore, management of the Fund is also not aware of any tax positions for which it is reasonably possible that the total amounts of unrecognized tax benefits will significantly change in the next twelve months.
Dividends and Distributions to Shareholders
The Fund declares dividends from its net investment income daily and pays shareholders monthly. Fund shares begin to accrue dividends on the business day after the day when the monies used to purchase Fund shares are collected by the Fund’s transfer agent.
Net realized capital gains from investment transactions, if any, are declared and distributed to shareholders at least annually. Furthermore, capital gains are distributed only to the extent they exceed available capital loss carryforwards.
Distributions to shareholders are recorded on the ex-dividend date. The amount and timing of distributions are determined in accordance with federal income tax regulations, which may differ from U.S. GAAP.
Flexible Sales Charge Program
Class A Shares are generally sold with an up-front sales charge and incur a .25% annual 12b-1 service fee. Class A Share purchases of $1 million or more are sold at net asset value without an up-front sales charge but may be subject to a contingent deferred sales charge (“CDSC”) if redeemed within twelve months of purchase. Class C Shares are sold without an up-front sales charge but incur a .75% annual 12b-1 distribution fee and a .25% annual 12b-1 service fee. Class C Shares are subject to a CDSC of 1% if redeemed within one year of purchase. Class R3 Shares are sold without an up-front sales charge but incur a .25% annual 12b-1 distribution fee and a .25% annual 12b-1 service fee. Class I Shares are not subject to any sales charge or 12b-1 distribution or service fees.
Forward Swap Contracts
The Fund is authorized to enter into forward interest rate swap contracts consistent with its investment objectives and policies to reduce, increase or otherwise alter its risk profile or to alter its portfolio characteristics (i.e. duration, yield curve positioning and credit quality).
The Fund’s use of forward interest rate swap transactions is intended to help the Fund manage its overall interest rate sensitivity, either shorter or longer, generally to more closely align the Fund’s interest rate sensitivity with that of the broader market. Forward interest rate swap transactions involve the Fund’s agreement with a counterparty to pay, in the future, a fixed or variable rate payment in exchange for the counterparty paying the Fund a variable or fixed rate payment, the accruals for which would begin at a specified date in the future (the “effective date”). The amount of the payment obligation is based on the notional amount of the swap contract
Notes to Financial Statements (Unaudited) (continued)
and the termination date of the swap (which is akin to a bond’s maturity). The value of the Fund’s swap commitment would increase or decrease based primarily on the extent to which long-term interest rates for bonds having a maturity of the swap’s termination date increase or decrease. Forward interest rate swap contracts are valued daily. The net amount recorded on these transactions for each counterparty is recognized on the Statement of Assets and Liabilities as a component of “Unrealized appreciation or depreciation on forward swaps” with the change during the fiscal period recognized on the Statement of Operations as a component of “Change in net unrealized appreciation (depreciation) of forward swaps.”
The Fund may terminate a swap contract prior to the effective date, at which point a realized gain or loss is recognized. When a forward swap is terminated, it ordinarily does not involve the delivery of securities or other underlying assets or principal, but rather is settled in cash on a net basis. Net realized gains and losses during the fiscal period are recognized on the Statement of Operations as a component of “Net realized gain (loss) from forward swaps.” The Fund intends, but is not obligated, to terminate its forward swaps before the effective date. Accordingly, the risk of loss with respect to the swap counterparty on such transactions is limited to the credit risk associated with a counterparty failing to honor its commitment to pay any realized gain to the Fund upon termination.
During the six months ended March 31, 2011, the Fund entered into forward interest rate swap contracts to reduce the duration of the preferred stock portfolio. The average notional amount of forward interest rate swap contracts outstanding during the six months ended March 31, 2011, was 30,666,667. The average notional amount is calculated based on the outstanding notional at the beginning of the fiscal year and at the end of each fiscal quarter within the fiscal year. Refer to Footnote 3 – Derivative Instruments and Hedging Activities for further details on forward interest rate swap contract activity.
Futures Contracts
The Fund is subject to interest rate risk in the normal course of pursuing its investment objectives and is authorized to invest in futures contracts in an attempt to manage such risk. Upon entering into a futures contract, the Fund is required to deposit with the broker an amount of cash or liquid securities equal to a specified percentage of the contract amount. This is known as the “initial margin.” Cash held by the broker to cover initial margin requirements on open futures contracts, if any, is recognized as “Deposits with brokers for open futures contracts” on the Statement of Assets and Liabilities. Subsequent payments (“variation margin”) are made or received by the Fund each day, depending on the daily fluctuation of the value of the contract. Variation margin is recognized as a receivable or payable for “Variation margin on futures contracts” on the Statement of Assets and Liabilities, when applicable.
During the period the futures contract is open, changes in the value of the contract are recorded as an unrealized gain or loss by “marking-to-market” on a daily basis to reflect the changes in market value of the contract and is recognized as “Change in net unrealized appreciation (depreciation) of futures contracts” on the Statement of Operations. When the contract is closed or expired, the Fund records a realized gain or loss equal to the difference between the value of the contract on the closing date and value of the contract when originally entered into which is recognized as “Net realized gain (loss) from futures contracts” on the Statement of Operations.
Risks of investments in futures contracts include the possible adverse movement in the price of the securities or indices underlying the contracts, the possibility that there may not be a liquid secondary market for the contracts and/or that a change in the value of the contract may not correlate with a change in the value of the underlying securities or indices. The Fund did not enter into futures contracts during the six months ended March 31, 2011.
Market and Counterparty Credit Risk
In the normal course of business the Fund may invest in financial instruments and enter into financial transactions where risk of potential loss exists due to changes in the market (market risk) or failure of the other party to the transaction to perform (counterparty credit risk). The potential loss could exceed the value of the financial assets recorded on the financial statements. Financial assets, which potentially expose the Fund to counterparty credit risk, consist principally of cash due from counterparties on forward, option and swap transactions, when applicable. The extent of the Fund’s exposure to counterparty credit risk in respect to these financial assets approximates their carrying value as recorded on the Statement of Assets and Liabilities. Futures contracts, when applicable, expose the Fund to minimal counterparty credit risk as they are exchange traded and the exchange’s clearinghouse, which is counterparty to all exchange traded futures, guarantees the futures contracts against default.
The Fund helps manage counterparty credit risk by entering into agreements only with counterparties the Adviser believes have the financial resources to honor their obligations and by having the Adviser monitor the financial stability of the counterparties. Additionally, counterparties may be required to pledge collateral daily (based on the daily valuation of the financial asset) on behalf of the Fund with a value approximately equal to the amount of any unrealized gain above a pre-determined threshold. Reciprocally, when the Fund has an unrealized loss, the Fund has instructed the custodian to pledge assets of the Fund as collateral with a value approximately equal to the amount of the unrealized loss above a pre-determined threshold. Collateral pledges are monitored and subsequently adjusted if and when the valuations fluctuate, either up or down, by at least the pre-determined threshold amount.
Repurchase Agreements
In connection with transactions in repurchase agreements, it is the Fund’s policy that its custodian take possession of the underlying collateral securities, the fair value of which exceeds the principal amount of the repurchase transaction, including accrued interest, at all times. If the counterparty defaults, and the fair value of the collateral declines, realization of the collateral may be delayed or limited.
Zero Coupon Securities
The Fund is authorized to invest in zero coupon securities. A zero coupon security does not pay a regular interest coupon to its holders during the life of the security. Tax-exempt income to the holder of the security comes from accretion of the difference between the original purchase price of the security at issuance and the par value of the security at maturity and is effectively paid at maturity. The market prices of zero coupon securities generally are more volatile than the market prices of securities that pay interest periodically.
Multiclass Operations and Allocations
Income and expenses of the Fund that are not directly attributable to a specific class of shares are prorated among the classes based on the relative settled shares of each class. Expenses directly attributable to a class of shares, which presently only include 12b-1 distribution and service fees, are recorded to the specific class.
Realized and unrealized capital gains and losses of the Fund are prorated among the classes based on the relative net assets of each class.
Custodian Fee Credit
The Fund has an arrangement with the custodian bank whereby certain custodian fees and expenses are reduced by net credits earned on the Fund’s cash on deposit with the bank. Such deposit arrangements are an alternative to overnight investments. Credits for cash balances may be offset by charges for any days on which the Fund overdraws its account at the custodian bank.
Indemnifications
Under the Trust’s organizational documents, its officers and trustees are indemnified against certain liabilities arising out of the performance of their duties to the Trust. In addition, in the normal course of business, the Trust enters into contracts that provide general indemnifications to other parties. The Trust’s maximum exposure under these arrangements is unknown as this would involve future claims that may be made against the Trust that have not yet occurred. However, the Trust has not had prior claims or losses pursuant to these contracts and expects the risk of loss to be remote.
Use of Estimates
The preparation of financial statements in conformity with U.S. GAAP requires management to make estimates and assumptions that affect the reported amounts of assets and liabilities at the date of the financial statements and the reported amounts of increases and decreases in net assets from operations during the reporting period. Actual results may differ from those estimates.
2. Fair Value Measurements
Fair value is defined as the price that the Fund would receive upon selling an investment or transferring a liability in an orderly transaction to an independent buyer in the principal or most advantageous market of the investment. A three-tier hierarchy is used to maximize the use of observable market data and minimize the use of unobservable inputs and to establish classification of fair value measurements for disclosure purposes. Observable inputs reflect the assumptions market participants would use in pricing the asset or liability. Observable inputs are based on market data obtained from sources independent of the reporting entity. Unobservable inputs reflect the reporting entity’s own assumptions about the assumptions market participants would use in pricing the asset or liability. Unobservable inputs are based on the best information available in the circumstances. The three-tier hierarchy of inputs is summarized in the three broad levels listed below:
| | |
| Level 1 – | | Quoted prices in active markets for identical securities. |
| Level 2 – | | Other significant observable inputs (including quoted prices for similar securities, interest rates, prepayment speeds, credit risk, etc.). |
| Level 3 – | | Significant unobservable inputs (including management’s assumptions in determining the fair value of investments). |
The inputs or methodologies used for valuing securities are not an indication of the risk associated with investing in those securities.
The following is a summary of the Fund’s fair value measurements as of March 31, 2011:
| | | | | | | | | | | | | | | | |
| | | Level 1 | | | Level 2 | | | Level 3 | | | Total | |
Investments: | | | | | | | | | | | | | | | | |
$25 Par (or similar) Preferred Securities | | $ | 245,000,123 | | | $ | 80,041,232 | | | $ | — | | | $ | 325,041,355 | |
Taxable Municipal Bonds | | | — | | | | 5,941,763 | | | | 149,500 | | | | 6,091,263 | |
Corporate Bonds | | | — | | | | 36,079,437 | | | | — | | | | 36,079,437 | |
Capital Preferred Securities | | | — | | | | 320,910,473 | | | | — | | | | 320,910,473 | |
Short-Term Investments | | | — | | | | 4,083,231 | | | | — | | | | 4,083,231 | |
Derivatives: | | | | | | | | | | | | | | | | |
Forward Swaps* | | | — | | | | 3,953,795 | | | | — | | | | 3,953,795 | |
Total | | $ | 245,000,123 | | | $ | 451,009,931 | | | $ | 149,500 | | | $ | 696,159,554 | |
| * | Represents net unrealized appreciation (depreciation). |
Notes to Financial Statements (Unaudited) (continued)
The following is a reconciliation of the Fund’s Level 3 investments held at the beginning and end of the measurement period:
| | | | |
| | | Level 3
Taxable Municipal Bonds | |
Balance at the beginning of period | | $ | 98,259 | |
Gains (losses): | | | | |
Net realized gains (losses) | | | — | |
Net change in unrealized appreciation (depreciation) | | | (78,759 | ) |
Purchases at cost | | | — | |
Sales at proceeds | | | — | |
Net discounts (premiums) | | | — | |
Transfers in to | | | 130,000 | |
Transfers out of | | | — | |
Balance at the end of period | | $ | 149,500 | |
Net change in unrealized appreciation (depreciation) during the period of Level 3 securities held as of March 31, 2011 | | $ | (431,256 | ) |
During the six months ended March 31, 2011, the Fund recognized no significant transfers to/from Level 1 or Level 2. Transfers in and/or out of Level 3 are shown using end of period values.
3. Derivative Instruments and Hedging Activities
The Fund records derivative instruments at fair value, with changes in fair value recognized on the Statement of Operations, when applicable. Even though the Fund’s investments in derivatives may represent economic hedges, they are not considered to be hedge transactions for financial reporting purposes. For additional information on the derivative instruments in which the Fund was invested during and at the end of the reporting period, refer to the Portfolio of Investments, Financial Statements and Footnote 1 – General Information and Significant Accounting Policies.
The following table presents the fair value of all derivative instruments held by the Fund as of March 31, 2011, the location of these instruments on the Statement of Assets and Liabilities, and the primary underlying risk exposure.
| | | | | | | | | | | | | | |
| | | | | Location on the Statement of Assets and Liabilities | |
Underlying Risk Exposure | | Derivative Instrument | | Asset Derivatives | | | Liability Derivatives | |
| | | Location | | Value | | | Location | | Value | |
Interest Rate | | Forward Swaps | | Unrealized appreciation
on forward swaps* | | $ | 3,953,795 | | | Unrealized depreciation
on forward swaps* | | $ | — | |
| * | Represents cumulative gross unrealized appreciation (depreciation) of forward swap contracts as reported in the Portfolio of Investments. |
The following table presents the amount of change in net unrealized appreciation (depreciation) recognized for the six months ended March 31, 2011, on derivative instruments, as well as the primary risk exposure.
| | | | |
| Change in Net Unrealized Appreciation (Depreciation) of Forward Swaps | | | |
Risk Exposure | | | | |
Interest Rate | | $ | 3,921,321 | |
4. Fund Shares
Transactions in Fund shares were as follows:
| | | | | | | | | | | | | | | | |
| | | Six Months Ended
3/31/11 | | | Year Ended
9/30/10 | |
| | | Shares | | | Amount | | | Shares | | | Amount | |
Shares sold: | | | | | | | | | | | | | | | | |
Class A | | | 3,842,204 | | | $ | 64,466,960 | | | | 8,305,157 | | | $ | 132,367,999 | |
Class C | | | 1,171,492 | | | | 19,703,750 | | | | 3,332,052 | | | | 52,491,909 | |
Class R3 | | | 2,395 | | | | 40,000 | | | | — | | | | — | |
Class I | | | 10,119,793 | | | | 170,330,295 | | | | 19,206,089 | | | | 302,400,269 | |
Shares issued to shareholders due to reinvestment of distributions: | | | | | | | | | | | | | | | | |
Class A | | | 329,832 | | | | 5,517,464 | | | | 309,962 | | | | 4,904,360 | |
Class C | | | 182,774 | | | | 3,056,504 | | | | 173,117 | | | | 2,735,880 | |
Class R3 | | | 237 | | | | 3,983 | | | | 241 | | | | 3,823 | |
Class I | | | 665,364 | | | | 11,121,007 | | | | 521,058 | | | | 8,240,256 | |
| | | | 16,314,091 | | | | 274,239,963 | | | | 31,847,676 | | | | 503,144,496 | |
Shares redeemed: | | | | | | | | | | | | | | | | |
Class A | | | (3,892,472 | ) | | $ | (65,228,440 | ) | | | (4,051,685 | ) | | $ | (63,314,298 | ) |
Class C | | | (757,669 | ) | | | (12,748,016 | ) | | | (1,086,344 | ) | | | (17,236,285 | ) |
Class R3 | | | (33 | ) | | | (560 | ) | | | — | | | | — | |
Class I | | | (7,875,760 | ) | | | (131,240,095 | ) | | | (6,558,162 | ) | | | (102,737,797 | ) |
| | | | (12,525,934 | ) | | | (209,217,111 | ) | | | (11,696,191 | ) | | | (183,288,380 | ) |
Net increase (decrease) | | | 3,788,157 | | | $ | 65,022,852 | | | | 20,151,485 | | | $ | 319,856,116 | |
5. Investment Transactions
Purchases and sales (including maturities but excluding short-term investments and derivative transactions, when applicable) during the six months ended March 31, 2011, aggregated $233,681,012 and $191,749,577, respectively.
6. Income Tax Information
The following information is presented on an income tax basis. Differences between amounts for financial statement and federal income tax purposes are primarily due to timing differences in recognizing certain gains and losses on investment transactions. To the extent that differences arise that are permanent in nature, such amounts are reclassified within the capital accounts as detailed below. Temporary differences do not require reclassification. Temporary and permanent differences do not impact the net asset values of the Fund.
At March 31, 2011, the cost and unrealized appreciation (depreciation) of investments (excluding investments in derivatives, when applicable), as determined on a federal income tax basis, were as follows:
| | | | |
Cost of investments | | $ | 622,291,550 | |
Gross unrealized: | | | | |
Appreciation | | $ | 71,922,069 | |
Depreciation | | | (2,007,860 | ) |
Net unrealized appreciation (depreciation) of investments | | $ | 69,914,209 | |
Permanent differences, primarily due to federal taxes paid and complex securities character adjustments resulted in reclassifications among the Fund’s components of net assets at September 30, 2010, the Fund’s last tax year-end, as follows:
| | | | |
| | |
| Capital paid in | | $(4,001) | |
Undistributed (Over-distribution of) net investment income | | | 533,826 | |
Accumulated net realized gain (loss) | | | (529,825 | ) |
The tax components of undistributed net ordinary income and net long-term capital gains at September 30, 2010, the Fund’s last tax year end, were as follows:
| | | | |
Undistributed net ordinary income* | | $ | 13,398,169 | |
Undistributed net long-term capital gains | | | 5,048,494 | |
| * | Undistributed net ordinary income (on a tax basis) has not been reduced for the dividend declared during the period September 1, 2010 through September 30, 2010 and paid on October 1, 2010. Net ordinary income consists of net taxable income derived from dividends, interest, and net short-term capital gains, if any. |
Notes to Financial Statements (Unaudited) (continued)
The tax character of distributions paid during the Fund’s last tax year ended September 30, 2010, was designated for purposes of the dividends paid deduction as follows:
| | | | |
Distributions from net ordinary income* | | $ | 29,805,489 | |
Distributions from net long-term capital gains | | | — | |
| * | Net ordinary income consists of net taxable income derived from dividends, interest, and net short-term capital gains, if any. |
During the Fund’s last tax year ended September 30, 2010, the Fund utilized $5,427,054 of its capital loss carryforwards.
7. Management Fees and Other Transactions with Affiliates
The Fund’s management fee consists of two components – a fund-level fee, based only on the amounts of assets within the Fund, and a complex-level fee, based on the aggregate amount of all eligible fund assets managed by the Adviser. This pricing structure enables Fund shareholders to benefit from growth in the assets within the Fund as well as from growth in the amount of complex-wide assets managed by the Adviser.
The annual fund-level fee, payable monthly, is calculated according to the following schedule:
| | | | |
| Average Daily Net Assets | | Fund-Level Fee Rate | |
For the first $125 million | | | .5500 | % |
For the next $125 million | | | .5375 | |
For the next $250 million | | | .5250 | |
For the next $500 million | | | .5125 | |
For the next $1 billion | | | .5000 | |
For net assets over $2 billion | | | .4750 | |
The annual complex-level fee, payable monthly, is calculated according to the following schedule:
| | | | |
| Complex-Level Asset Breakpoint Level* | | Effective Rate at Breakpoint Level | |
$55 billion | | | .2000 | % |
$56 billion | | | .1996 | |
$57 billion | | | .1989 | |
$60 billion | | | .1961 | |
$63 billion | | | .1931 | |
$66 billion | | | .1900 | |
$71 billion | | | .1851 | |
$76 billion | | | .1806 | |
$80 billion | | | .1773 | |
$91 billion | | | .1691 | |
$125 billion | | | .1599 | |
$200 billion | | | .1505 | |
$250 billion | | | .1469 | |
$300 billion | | | .1445 | |
| * | The complex-level fee is calculated based upon the aggregate daily “eligible assets” of all Nuveen Funds. Eligible assets do not include assets attributable to investments in other Nuveen Funds and assets in excess of $2 billion added to the Nuveen Fund complex in connection with the Adviser’s assumption of the management of the former First American Funds effective January 1, 2011. Eligible assets include closed-end fund assets managed by the Adviser that are attributable to financial leverage. For these purposes, financial leverage includes the closed-end funds’ use of preferred stock and borrowings and certain investments in the residual interest certificates (also called inverse floating rate securities) in tender option bond (TOB) trusts, including the portion of assets held by a TOB trust that has been effectively financed by the trust’s issuance of floating rate securities, subject to an agreement by the Adviser as to certain funds to limit the amount of such assets for determining eligible assets in certain circumstances. As of March 31, 2011, the complex-level fee rate for the Fund was .1800%. |
The management fee compensates the Adviser for overall investment advisory and administrative services and general office facilities. The Adviser has entered into Sub-Advisory Agreements with the Sub-Adviser under which the Sub-Adviser manages the investment portfolios of the Funds. The Sub-Adviser is compensated for its services to the Funds from the management fees paid to the Adviser.
The Adviser has agreed to waive fees and reimburse expenses, so that total annual fund operating expenses (excluding 12b-1 distribution and service fees, interest expenses, taxes, fees incurred in acquiring and disposing of portfolio securities, and extraordinary expenses) do not exceed .75% through May 31, 2011 and 0.90% until January 31, 2012, of the average daily net assets of any class of Fund shares. The Adviser may also voluntarily reimburse additional expenses from time to time. Voluntary reimbursements may be terminated at any time at the Adviser’s discretion.
The Trust pays no compensation directly to those of its trustees who are affiliated with the Adviser or to its officers, all of whom receive remuneration for their services to the Trust from the Adviser or its affiliates. The Board of Trustees has adopted a deferred compensation plan for independent trustees that enables trustees to elect to defer receipt of all or a portion of the annual compensation they are entitled to receive from certain Nuveen-advised funds. Under the plan, deferred amounts are treated as though equal dollar amounts had been invested in shares of select Nuveen-advised funds.
During the six months ended March 31, 2011, Nuveen Investments, LLC (the “Distributor”), a wholly-owned subsidiary of Nuveen, collected sales charges on purchases of Class A shares, the majority of which were paid out as concessions to financial intermediaries as follows:
| | | | |
Sales charges collected | | $ | 376,031 | |
Paid to financial intermediaries | | | 338,900 | |
The Distributor also received 12b-1 service fees on Class A Shares, substantially all of which were paid to compensate financial intermediaries for providing services to shareholders relating to their investments.
During the six months ended March 31, 2011, the Distributor compensated financial intermediaries directly with commission advances at the time of purchase as follows:
| | | | |
Commission advances | | $ | 204,914 | |
To compensate for commissions advanced to financial intermediaries and all 12b-1 service and distribution fees collected on Class C Shares during the first year following a purchase are retained by the Distributor. During the six months ended March 31, 2011, the Distributor retained such 12b-1 fees as follows:
| | | | |
12b-1 fees retained | | $ | 221,718 | |
The remaining 12b-1 fees charged to the Fund were paid to compensate financial intermediaries for providing services to shareholders relating to their investments.
The Distributor also collected and retained $34,206 CDSC on share redemptions during the six months ended March 31, 2011.
At March 31, 2011, the Adviser owned 3,808 shares of Class R3.
8. New Accounting Pronouncement
Financial Accounting Standards Board (“FASB”) Transfers and Servicing (Topic 860): Reconsideration of Effective Control for Repurchase Agreements.
On April 15, 2011, the FASB issued Accounting Standards Update No. 2011-03, (the “ASU”). The guidance in the ASU is intended to improve the accounting for repurchase and other similar agreements. Specifically, the ASU modifies the criteria for determining when these agreements would be accounted for as financings transactions (secured borrowings/lending agreements) as opposed to sale (purchase) transactions with commitments to repurchase (resell). At this time, management is evaluating the implications of this guidance and the impact it will have to the financial statement amounts or footnote disclosures, if any.
9. Subsequent Events
On April 30, 2011, the Distributor changed its name from Nuveen Investments, LLC to Nuveen Securities, LLC.
Board Approval of Sub-Advisory Arrangement (Unaudited)
At a meeting held on May 25-26, 2010 (the “May Meeting”), the Board of Trustees (the “Board,” and each Trustee, a “Board Member”) of the Fund, including a majority of the Board Members who are not parties to the advisory agreement or “interested persons” of any parties (the “Independent Board Members”), considered and approved the advisory agreement (the “Advisory Agreement”) between the Fund and Nuveen Asset Management (the “Adviser”). Since the May Meeting, Nuveen has engaged in an internal restructuring (the “Restructuring”) pursuant to which the portfolio management services provided by the Adviser to the Fund were transferred to Nuveen Asset Management, LLC (“NAM LLC”), a newly-organized wholly-owned subsidiary of the Adviser and the Adviser changed its name to Nuveen Fund Advisors, Inc. (“NFA”). The Adviser, under its new name NFA, continues to serve as investment adviser to the Fund and, in that capacity, will continue to provide various oversight, administrative, compliance and other services. To effectuate the foregoing, NFA entered into a sub-advisory agreement with NAM LLC on behalf of the Fund (the “Sub-Advisory Agreement”). Under the Sub-Advisory Agreement, NAM LLC, subject to the oversight of NFA and the Board, will furnish an investment program, make investment decisions for, and place all orders for the purchase and sale of securities for the portion of the Fund’s investment portfolio allocated to it by NFA. There have been no changes to the advisory fees paid by the Fund; rather, NFA will pay a portion of the investment advisory fee it receives to NAM LLC for its sub-advisory services. The Independent Board Members reviewed the allocation of fees between NFA and NAM LLC. NFA and NAM LLC do not anticipate any reduction in the nature or level of services provided to the Fund following the Restructuring. The personnel of NFA who engaged in portfolio management activities prior to the spinoff of NAM LLC are not expected to materially change as a result of the spinoff. In light of the foregoing, at a meeting held on November 16-18, 2010, the Board Members, including a majority of the Independent Board Members, approved the Sub-Advisory Agreement on behalf of the Fund. Given that the Restructuring was not expected to reduce the level or nature of services provided and the advisory fees paid by the Fund were the same, the factors considered and determinations made at the May Meeting in approving the Advisory Agreement were equally applicable to the approval of the Sub-Advisory Agreement. For a discussion of these considerations, please see the shareholder report of the Fund that was first issued after the May Meeting for the period including May 2010.
Notes
Glossary of Terms Used in this Report
Average Annual Total Return: This is a commonly used method to express an investment’s performance over a particular, usually multi-year time period. It expresses the return that would have been necessary each year to equal the investment’s actual cumulative performance (including change in NAV or offer price and reinvested dividends and capital gains distributions, if any) over the time period being considered.
Average Duration: Duration is a measure of the expected period over which a bond’s principal and interest will be paid, and consequently is a measure of the sensitivity of a bond’s (or bond fund’s) value to changes when market interest rates change. Generally, the longer a bond or Fund’s duration, the more the price of the bond or Fund will change as interest rates change.
Hybrid Security: A hybrid security combines two or more different financial instruments. A hybrid security generally combines both debt and equity characteristics.
Lipper Corporate Debt Funds BBB-Rated Category Average: Represents the average annualized total return for all reporting funds in the Lipper Corporate Debt Funds BBB Rated Category.
Market Benchmark Index: An index that is comprised of a 60% weighting in the Merrill Lynch Preferred Stock Hybrid Securities Index, a 35% weighting in the Barclays Capital USD Capital Securities Index and a 5% weighting in the Merrill Lynch REIT Preferred Stock Index. The Merrill Lynch Preferred Stock Hybrid Securities Index is an unmanaged index consisting of a set of investment grade exchange-traded preferred stocks with outstanding market values of at least $50 million that are covered by Merrill Lynch Fixed Income Research. The index includes certain publicly issued, $25- and $1,000-par securities with at least one year to maturity. The Barclays Capital USD Capital Securities Index contains securities generally viewed as hybrid fixed income securities that either receive regulatory capital treatment or a degree of “equity credit” from the rating agencies. This generally includes Tier 2/Lower Tier 2 bonds, perpetual step-up debt, step-up preferred securities, and term preferred securities. The Merrill Lynch REIT Preferred Stock Index is an unmanaged index of investment grade REIT preferred shares with a deal size in excess of $100 million, weighted by capitalization and considered representative of investment grade preferred real estate stock performance.
Merrill Lynch Preferred Stock Hybrid Securities Index: An unmanaged index consisting of a set of investment grade exchange-traded preferred stocks with outstanding market values of at least $50 million that are covered by Merrill Lynch Fixed Income Research. The index includes certain publicly issued, $25- and $1,000-par securities with at least one year to maturity.
Net Asset Value (NAV): A Fund’s NAV is the dollar value of one share in the Fund. It is calculated by subtracting the liabilities of the Fund from its total assets and then dividing the remainder by the number of shares outstanding. Fund NAVs are calculated at the end of each business day.
Fund Information
Fund Manager
Nuveen Fund Advisors, Inc.
333 West Wacker Drive
Chicago, IL 60606
Sub-Adviser
Nuveen Asset Management, LLC
333 West Wacker Drive
Chicago, IL 60606
Legal Counsel
Chapman and Cutler LLP
Chicago, IL
Independent Registered
Public Accounting Firm
Ernst & Young LLP
Chicago, IL
Custodian
State Street Bank & Trust Company
Boston, MA
Transfer Agent and Shareholder Services
Boston Financial
Data Services, Inc.
Nuveen Investor Services
P.O. Box 8530
Boston, MA 02266-8530
(800) 257-8787
Quarterly Portfolio of Investments and Proxy Voting Information: You may obtain (i) the Fund’s quarterly portfolio of investments, (ii) information regarding how the Fund voted proxies relating to portfolio securities held during the most recent twelve-month period ended June 30, and (iii) a description of the policies and procedures that the Fund used to determine how to vote proxies relating to portfolio securities without charge, upon request, by calling Nuveen Investments at (800) 257-8787 or on Nuveen’s website at www.nuveen.com.
You may also obtain this and other Fund information directly from the Securities and Exchange Commission (SEC). The SEC may charge a copying fee for this information. Visit the SEC on-line at http://www.sec.gov or in person at the SEC’s Public Reference Room in Washington, D.C. Call the SEC at (202) 942-8090 for room hours and operation. You may also request Fund information by sending an e-mail request to publicinfo@sec.gov or by writing to the SEC’s Public Reference Section at 100 F Street NE, Washington, D.C. 20549.
The Financial Industry Regulatory Authority (FINRA) provides a Public Disclosure Program which supplies certain information regarding the disciplinary history of FINRA members and their associated persons in response to either telephone inquiries at (800) 289-9999 or written inquiries at www.finra.org. FINRA also provides an investor brochure that includes information describing the Public Disclosure Program.
Nuveen Investments:
Serving Investors for Generations
Since 1898, financial advisors and their clients have relied on Nuveen Investments to provide dependable investment solutions through continued adherence to proven, long-term investing principles. Today, we offer a range of high quality equity and fixed-income solutions designed to be integral components of a well-diversified core portfolio.
Focused on meeting investor needs.
Nuveen Investments is a global investment management firm that seeks to help secure the long-term goals of institutions and high net worth investors as well as the consultants and financial advisors who serve them. We market our growing range of specialized investment solutions under the high-quality brands of HydePark, NWQ, Nuveen Asset Management, Santa Barbara, Symphony, Tradewinds and Winslow Capital. In total, Nuveen Investments managed approximately $206 billion of assets as of March 31, 2011.
Find out how we can help you.
To learn more about how the products and services of Nuveen Investments may be able to help you meet your financial goals, talk to your financial advisor, or call us at (800) 257-8787. Please read the information provided carefully before you invest. Investors should consider the investment objective and policies, risk considerations, charges and expenses of any investment carefully. Where applicable, be sure to obtain a prospectus, which contains this and other relevant information. To obtain a prospectus, please contact your securities representative or Nuveen Investments, 333 W. Wacker Dr., Chicago, IL 60606. Please read the prospectus carefully before you invest or send money.
Learn more about Nuveen Funds at: www.nuveen.com/mf
Nuveen makes things e-simple.
It only takes a minute to sign up for e-Reports. Once enrolled, you’ll receive an e-mail as soon as your Nuveen Fund information is ready — no more waiting for delivery by regular mail. Just click on the link within the e-mail to see the report and save it on your computer if you wish.
Free e-Reports right to your e-mail!
www.investordelivery.com
If you receive your Nuveen Fund distributions and statements from your financial advisor or brokerage account.
OR
www.nuveen.com/accountaccess
If you receive your Nuveen Fund distributions and statements directly from Nuveen.
| | |
Distributed by Nuveen Securities, LLC 333 West Wacker Drive Chicago, IL 60606 www.nuveen.com | | |
MSA-INV5-0311P

Mutual Funds
Nuveen Taxable Fixed Income Funds
For investors seeking current income and capital appreciation.
Semi-Annual Report
March 31, 2011
| | | | | | | | | | | | | | | | |
Nuveen NWQ Preferred Securities Fund | | | | | | | | | | | | | | | | |
| | | | | | | | | | | | | | | | |
INVESTMENT ADVISER NAME CHANGE
Effective January 1, 2011, Nuveen Asset Management, the Fund’s investment adviser, changed its name to Nuveen Fund Advisors, Inc. (“Nuveen Fund Advisors”). Concurrently, Nuveen Fund Advisors formed a wholly-owned subsidiary, Nuveen Asset Management, LLC, to house its portfolio management capabilities.
NUVEEN INVESTMENTS COMPLETES STRATEGIC COMBINATION WITH FAF ADVISORS
On December 31, 2010, Nuveen Investments completed the strategic combination between Nuveen Asset Management, LLC, the largest investment affiliate of Nuveen Investments, and FAF Advisors. As part of this transaction, U.S. Bancorp — the parent of FAF Advisors — received cash consideration and a 9.5% stake in Nuveen Investments in exchange for the long term investment business of FAF Advisors, including investment-management responsibilities for the non-money market mutual funds of the First American Funds family.
The approximately $27 billion of mutual fund and institutional assets managed by FAF Advisors, along with the investment professionals managing these assets and other key personnel, have become part of Nuveen Asset Management, LLC. With these additions to Nuveen Asset Management, LLC, this affiliate now manages more than $100 billion of assets across a broad range of strategies from municipal and taxable fixed income to traditional and specialized equity investments.
This combination does not affect the investment objectives or strategies of this Fund. Over time, Nuveen Investments expects that the combination will provide even more ways to meet the needs of investors who work with financial advisors and consultants by enhancing the multi-boutique model of Nuveen Investments, which also includes highly respected investment teams at HydePark, NWQ Investment Management, Santa Barbara Asset Management, Symphony Asset Management, Tradewinds Global Investors and Winslow Capital. Nuveen Investments managed approximately $206 billion of assets as of March 31, 2011.
| | | | | | |
| Must be preceded by or accompanied by a prospectus. | | NOT FDIC INSURED | | MAY LOSE VALUE | | NO BANK GUARANTEE |
Table of Contents
Chairman’s
Letter to Shareholders

Dear Shareholders,
In 2010, the global economy recorded another year of recovery from the financial and economic crises of 2008, but many of the factors that caused the downturn still weigh on the prospects for continued improvement. In the U.S., ongoing weakness in housing values has put pressure on homeowners and mortgage lenders. Similarly, the strong earnings recovery for corporations and banks is only slowly being translated into increased hiring or more active lending. Globally, deleveraging by private and public borrowers has inhibited economic growth and that process is far from complete.
Encouragingly, constructive actions are being taken by governments around the world to deal with economic issues. In the U.S., the recent passage of a stimulatory tax bill relieved some of the pressure on the Federal Reserve to promote economic expansion through quantitative easing and offers the promise of sustained economic growth. A number of European governments are undertaking programs that could significantly reduce their budget deficits. Governments across the emerging markets are implementing various steps to deal with global capital flows without undermining international trade and investment.
The success of these government actions could determine whether 2011 brings further economic recovery and financial market progress. One risk associated with the extraordinary efforts to strengthen U.S. economic growth is that the debt of the U.S. government will continue to grow to unprecedented levels. Another risk is that over time there could be inflationary pressures on asset values in the U.S. and abroad, because what happens in the U.S. impacts the rest of the world economy. Also, these various actions are being taken in a setting of heightened global economic uncertainty, primarily about the supplies of energy and other critical commodities. In this challenging environment, your Nuveen investment team continues to seek sustainable investment opportunities and to remain alert to potential risks in a recovery still facing many headwinds. On your behalf, we monitor their activities to assure they maintain their investment disciplines.
As you will note elsewhere in this report, on December 31, 2010, Nuveen Investments completed a strategic combination with FAF Advisors, Inc., the manager of the First American Funds. The combination adds highly respected and distinct investment teams to meet the needs of investors and their advisors and is designed to benefit all fund shareholders by creating a fund organization with the potential for further economies of scale and the ability to draw from even greater talent and expertise to meet those investor needs.
As always, I encourage you to contact your financial consultant if you have any questions about your investment in a Nuveen Fund. On behalf of the other members of your Fund Board, we look forward to continuing to earn your trust in the months and years ahead.
Sincerely,

Robert P. Bremner
Chairman of the Board
May 19, 2011
Portfolio Manager’s Comments
Certain statements in this report are forward-looking statements. Discussions of specific investments are for illustration only and are not intended as recommendations of individual investments. The forward-looking statements and other views expressed herein are those of the portfolio manager as of the date of this report. Actual future results or occurrences may differ significantly from those anticipated in any forward-looking statements and the views expressed herein are subject to change at any time, due to numerous market and other factors. The Fund disclaims any obligation to update publicly or revise any forward-looking statements or views expressed herein.
Any reference to credit ratings for portfolio holdings denotes the highest rating assigned by a Nationally Recognized Statistical Rating Organization (NRSRO) such as Standard & Poor’s (S&P), Moody’s or Fitch. AAA, AA, A and BBB ratings are investment grade; BB, B, CCC, CC, C and D ratings are below investment grade. Holdings and ratings may change over time.
The Nuveen NWQ Preferred Securities Fund features management by NWQ Investment Management Company, LLC, an affiliate of Nuveen Investments. The team is led by Michael Carne, CFA. Michael has 23 years of investment experience and joined NWQ in 2002. Here Michael discusses the Fund’s performance and its investment strategy for the period for the six-month period ending March 31, 2011.
How did the Fund perform during the six-month period ending March 31, 2011?
The table in the Fund Performance section of this report provides total return performance information for the six-month, one-year and since inception periods ending March 31, 2011. The Fund’s Class A Shares at net asset value (NAV) outperformed both the Merrill Lynch Fixed Rate Preferred Stock Index and the Lipper Corporate Debt Funds BBB-Rated Category Average over the period.
What strategies were used to manage the Fund during the reporting period, and how did this affect performance?
Our investment strategy is both bottom-up and fundamentally driven. Security selection incorporates elements of both fixed-income and equity analysis. We utilize NWQ’s equity research team to identify companies we like that seem to offer good downside protection, an attractive valuation and an improving outlook (catalyst). We also use option-adjusted spread analysis, and review a potential investment’s total return characteristics versus a set of market scenarios, such as higher/lower rates or wider/tighter spreads. We believe this forward-looking approach helps us to avoid sectors and companies that have deteriorating fundamentals.
Once a company has been identified with suitable investment characteristics, we then engage in the work of deciding the best investment choices. While we primarily make investments in preferred securities, we also have the latitude to invest in other types of income securities such as senior debt and even equities. We look at the specific characteristics of the fixed-income securities available for investment and evaluate the effect on the Fund of holding such an investment. These characteristics might include price, yield, issuer, location in the capital structure, rating, liquidity premium/discount and any other potential issues that can affect the value of the position. Additionally, because the preferred market is very concentrated both by issuer and industry, we pay particular attention to the diversification of the Fund.
The Fund‘s performance exceeded the Merrill Lynch Fixed Rate Preferred Stock Index for the reporting period primarily due to outperformance across five of its six sectors,
including Real Estate Investment Trusts (REITs), banking, utilities, insurance and industrials. The one exception was the finance sector. Additionally, our equity weighting produced very solid performance during the fourth quarter of 2010 as investor sentiment on growth and profits became more positive.
Standout performers for the period ending March 31, 2011, included Pfizer and Motorola Solutions common stock. Top performing preferreds in the portfolio were Axis Capital Holdings and Principal Financial.
Several holdings detracted from performance. Our Motorola Mobility and General Motors common stock holdings negatively impacted returns. Both stocks fell victim to an abrupt change in the economic outlook from growth to stagflation. Additionally, Motorola Mobility faces challenges in both the handset and tablet market from Apple and other android-based platforms.
During the period, we added a number of new preferred securities including Citigroup perpetual preferred, ALLY perpetual preferred, American Financial Group trust preferred, Dupont Fabros perpetual preferred, Popular perpetual preferred, and Principal Financial perpetual preferred. These purchases were made due to their attractive yield and positive fundamental outlook.
We continued to reduce our European exposure by selling our position in Santander perpetual preferred as its price did not reflect the ongoing risks of disruption in the European markets due to sovereign debt levels.
During the current period, we also wrote covered call options on individual stocks to enhance returns while foregoing some upside potential.
Risk Considerations
Mutual fund investing involves risk; principal loss is possible. Debt or fixed income securities are subject to credit risk and interest rate risk. The value of, and income generated by debt securities will decrease or increase based on changes in market interest rates. As interest rates rise, bond prices fall. Credit risk refers to an issuer’s ability to make interest and principal payments when due. High yield or lower rated securities carry heightened credit risk and potential for default. The potential use of derivative instruments involves a high degree of financial risk, including the risk that the loss on a derivative may be greater than the principal amount invested. Foreign investments involve additional risks, including currency fluctuation, political and economic instability, lack of liquidity and differing legal and accounting standards.
Fund Performance (Unaudited)
Returns quoted represent past performance, which is no guarantee of future results. Current performance may be higher or lower than the performance shown. Investment returns and principal value will fluctuate so that when shares are redeemed, they may be worth more or less than their original cost. Returns without sales charges would be lower if the sales charge were included. Returns do not reflect the deduction of taxes that a shareholder would pay on Fund distributions or the redemption of Fund shares.
Returns may reflect a contractual agreement between the Fund and the investment adviser to waive certain fees and expenses; see Notes to Financial Statements, Footnote 7 — Management Fees and Other Transactions with Affiliates for more information. In addition, returns may reflect a voluntary expense limitation by the Fund’s investment adviser that may be modified or discontinued at any time without notice. For the most recent month-end performance visit www.nuveen.com or call (800) 257-8787.
Returns reflect differences in sales charges and expenses, which are primarily differences in distribution and service fees. Fund returns assume reinvestment of dividends and capital gains.
Comparative index and benchmark return information is provided for the Fund’s Class A Shares at net asset value (NAV) only.
Average Annual Total Returns as of March 31, 2011*
| | | | | | | | | | | | |
| | |
| | | Cumulative | | | Average Annual | |
| | | 6-Month | | | 1-Year | | | Since
Inception** | |
Class A Shares at NAV | | | 6.04% | | | | 12.61% | | | | 18.26% | |
Class A Shares at Offer | | | 1.00% | | | | 7.26% | | | | 13.94% | |
Merrill Lynch Fixed Rate Preferred Stock Index*** | | | 3.39% | | | | 11.49% | | | | 14.87% | |
Lipper Corporate Debt Funds BBB-Rated Category Average*** | | | 0.80% | | | | 8.15% | | | | 8.78% | |
| | | | | | | | | | | | |
Class C Shares | | | 5.65% | | | | 11.73% | | | | 17.37% | |
Class R3 Shares | | | 5.92% | | | | 12.29% | | | | 17.94% | |
Class I Shares | | | 6.18% | | | | 12.83% | | | | 18.54% | |
Class A Shares have a maximum 4.75% sales charge. Class A Share purchases of $1 million or more are sold at net asset value without an up-front sales charge but may be subject to a contingent deferred sales charge (CDSC), also known as a back-end sales charge, if redeemed within twelve months of purchase. Class C Shares have a 1% CDSC for redemptions within less than one year, which is not reflected in the one-year total return. Class R3 Shares have no sales charge and are available to only certain retirement plans. Class I Shares have no sales charge and may be purchased under limited circumstances or by specified classes of investors.
| * | Six-month returns are cumulative; all other returns are annualized. |
| ** | Since inception returns for Class A, C, I and R3 are from 12/9/09. |
| *** | Refer to the Glossary of Terms Used in this Report for definitions. |
Yields (Unaudited) as of March 31, 2011
Dividend Yield is the most recent dividend per share (annualized) divided by the offering price per share.
The SEC 30-Day Yield is a standardized measure of a Fund’s yield that accounts for the future amortization of premiums or discounts of bonds held in the Fund’s portfolio. The SEC 30-Day Yield is computed under an SEC standardized formula and is based on the maximum offer price per share. The 30-Day Yield is computed under the same formula but is based on the net asset value (NAV) per share. Dividend Yield may differ from the SEC 30-Day Yield because the Fund may be paying out more or less than it is earning and it may not include the effect of amortization of bond premium.
The SEC 30-Day Yield on A Shares at NAV applies only to A Shares purchased at no-load pursuant to the Fund’s policy permitting waiver of the A Share load in certain specified circumstances.
| | | | | | | | | | | | |
| | | |
| | | Dividend
Yield | | | 30-Day
Yield | | | SEC 30-Day
Yield | |
Class A Shares at NAV | | | 6.57% | | | | 3.92% | | | | — | |
Class A Shares at Offer | | | 6.26% | | | | — | | | | 3.73% | |
Class C Shares | | | 5.83% | | | | 3.17% | | | | — | |
Class R3 Shares | | | 6.34% | | | | 3.66% | | | | — | |
Class I Shares | | | 6.84% | | | | 4.17% | | �� | | — | |
Holding Summary (Unaudited) as of March 31, 2011
This data relates to the securities held in the Fund’s portfolio of investments. It should not be construed as a measure of performance for the Fund itself.
Portfolio Allocation1
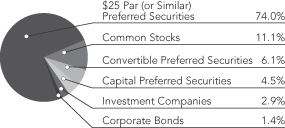
| | | | |
| Portfolio Composition1 | | | |
| Insurance | | | 29.9% | |
| Commercial Banks | | | 15.7% | |
| Real Estate Investment Trust | | | 13.5% | |
| Consumer Finance | | | 6.7% | |
| Diversified Financial Services | | | 6.4% | |
| Commercial Services & Supplies | | | 4.5% | |
| Wireless Telecommunication Services | | | 3.7% | |
| Other | | | 19.6% | |
| 1 | As a percentage of total investments (excluding investments in derivatives) as of March 31, 2011. Holdings are subject to change. |
Expense Ratios (Unaudited)
The expense ratios below reflect the Fund’s total operating expenses (before fee waivers or expense reimbursements if any) as shown in the Fund’s most recent prospectus. The expense ratios include management fees and other fees and expenses.
| | | | | | | | |
| Share Class | | Gross
Expense
Ratios | | | Net
Expense
Ratios | |
| Class A | | | 3.61% | | | | 0.99% | |
| Class C | | | 4.36% | | | | 1.74% | |
| Class R3 | | | 3.85% | | | | 1.24% | |
| Class I | | | 3.36% | | | | 0.74% | |
The expense ratios shown factor in Total Annual Fund Operating Expenses including management fees and other fees and expenses. The
Net Expense Ratios reflect a contractual commitment by the Fund’s investment adviser to waive fees and reimburse expenses through
January 31, 2013.
Expense Example (Unaudited)
As a shareholder of the Fund, you incur two types of costs: (1) transaction costs, including up-front and back-end sales charges (loads) or redemption fees, where applicable; and (2) ongoing costs, including management fees; distribution and service (12b-1) fees, where applicable; and other Fund expenses. This Example is intended to help you understand your ongoing costs (in dollars) of investing in the Fund and to compare these costs with the ongoing costs of investing in other mutual funds.
The Example below is based on an investment of $1,000 invested at the beginning of the period and held for the period.
The information under “Actual Performance,” together with the amount you invested, allows you to estimate actual expenses incurred over the reporting period. Simply divide your account value by $1,000 (for example, an $8,600 account value divided by $1,000 = 8.60) and multiply the result by the cost shown for your share class, in the row entitled “Expenses Incurred During Period” to estimate the expenses incurred on your account during this period.
The information under “Hypothetical Performance,” provides information about hypothetical account values and hypothetical expenses based on the Fund’s actual expense ratio and an assumed rate of return of 5% per year before expenses, which is not the Fund’s actual return. The hypothetical account values and expenses may not be used to estimate the actual ending account balance or expense you incurred for the period. You may use this information to compare the ongoing costs of investing in the Fund and other Funds. To do so, compare this 5% hypothetical example with the 5% hypothetical examples that appear in the shareholder reports of the other funds.
Please note that the expenses shown in the table are meant to highlight your ongoing costs only and do not reflect any transaction costs. Therefore, the hypothetical information is useful in comparing ongoing costs only, and will not help you determine the relative total costs of owning different funds or share classes. In addition, if these transaction costs were included, your costs would have been higher.
| | | | | | | | | | | | | | | | | | | | | | | | | | | | | | | | | | | | |
| | | | | | | | | | | | | | | | | | Hypothetical Performance | |
| | | Actual Performance | | | | | | (5% annualized return before expenses) | |
| | | A Shares | | | C Shares | | | R3 Shares | | | I Shares | | | | | | A Shares | | | C Shares | | | R3 Shares | | | I Shares | |
| Beginning Account Value (10/01/10) | | $ | 1,000.00 | | | $ | 1,000.00 | | | $ | 1,000.00 | | | $ | 1,000.00 | | | | | | | $ | 1,000.00 | | | $ | 1,000.00 | | | $ | 1,000.00 | | | $ | 1,000.00 | |
| Ending Account Value (3/31/11) | | $ | 1,060.40 | | | $ | 1,056.50 | | | $ | 1,059.20 | | | $ | 1,061.80 | | | | | | | $ | 1,020.04 | | | $ | 1,016.31 | | | $ | 1,018.80 | | | $ | 1,021.29 | |
| Expenses Incurred During Period | | $ | 5.03 | | | $ | 8.87 | | | $ | 6.31 | | | $ | 3.75 | | | | | | | $ | 4.94 | | | $ | 8.70 | | | $ | 6.19 | | | $ | 3.68 | |
For each class of the Fund, expenses are equal to the Fund’s annualized net expense ratio of .98%, 1.73%, 1.23% and .73% for Classes A, C, R3 and I, respectively, multiplied by the average account value over the period, multiplied by 182/365 (to reflect the one-half year period).
Portfolio of Investments (Unaudited)
Nuveen NWQ Preferred Securities Fund
March 31, 2011
| | | | | | | | | | | | | | | | | | | | |
| Shares | | | Description (1) | | | | | | | | | | | Value | |
| | | | | | | | | | | | | | | | | | | | |
| | | | COMMON STOCKS – 10.8% | | | | | | | | | | | | | | | | |
| | | | | |
| | | | Automobiles – 0.8% | | | | | | | | | | | | | | | | |
| | | | | |
| | 600 | | | General Motors Company, (3) | | | | | | | | | | | | | | $ | 18,618 | |
| | | | Communications Equipment – 2.5% | | | | | | | | | | | | | | | | |
| | | | | |
| | 1,500 | | | Motorola Mobility Holdings Inc., (2), (3) | | | | | | | | | | | | | | | 36,600 | |
| | | | | |
| | 428 | | | Motorola Solutions Inc. | | | | | | | | | | | | | | | 19,127 | |
| | | | Total Communications Equipment | | | | | | | | | | | | | | | 55,727 | |
| | | | Computers & Peripherals – 1.1% | | | | | | | | | | | | | | | | |
| | | | | |
| | 600 | | | Hewlett-Packard Company | | | | | | | | | | | | | | | 24,582 | |
| | | | Diversified Financial Services – 1.1% | | | | | | | | | | | | | | | | |
| | | | | |
| | 5,500 | | | Citigroup Inc., (3) | | | | | | | | | | | | | | | 24,310 | |
| | | | Insurance – 1.2% | | | | | | | | | | | | | | | | |
| | | | | |
| | 2,000 | | | Genworth Financial Inc., Class A, (3) | | | | | | | | | | | | | | | 26,920 | |
| | | | Media – 1.1% | | | | | | | | | | | | | | | | |
| | | | | |
| | 700 | | | Time Warner Inc. | | | | | | | | | | | | | | | 24,990 | |
| | | | Metals & Mining – 1.6% | | | | | | | | | | | | | | | | |
| | | | | |
| | 700 | | | Barrick Gold Corporation, (2) | | | | | | | | | | | | | | | 36,337 | |
| | | | Pharmaceuticals – 1.4% | | | | | | | | | | | | | | | | |
| | | | | |
| | 1,500 | | | Pfizer Inc. | | | | | | | | | | | | | | | 30,465 | |
| | | | Total Common Stocks (cost $221,842) | | | | | | | | | | | | | | | 241,949 | |
| | | | | |
| Shares | | | Description (1) | | Coupon | | | | | | Ratings (4) | | | Value | |
| | | | CONVERTIBLE PREFERRED SECURITIES – 5.9% | | | | | | | | | | | | | | | | |
| | | | | |
| | | | Commercial Banks – 4.6% | | | | | | | | | | | | | | | | |
| | | | | |
| | 100 | | | Wells Fargo & Company, Convertible Bond | | | 7.500% | | | | | | | | A | | | $ | 103,520 | |
| | | | Professional Services – 1.3% | | | | | | | | | | | | | | | | |
| | | | | |
| | 500 | | | Nielsen Holdings BV Convertible Preferred | | | 6.250% | | | | | | | | B | | | | 28,438 | |
| | | | Total Convertible Preferred Securities (cost $119,359) | | | | | | | | | | | | | | | 131,958 | |
| | | | | |
| Shares | | | Description (1) | | Coupon | | | | | | Ratings (4) | | | Value | |
| | | | $25 PAR (OR SIMILAR) PREFERRED SECURITIES – 72.1% | | | | | | | | | | | | | | | | |
| | | | | |
| | | | Commercial Banks ��� 10.7% | | | | | | | | | | | | | | | | |
| | | | | |
| | 3,000 | | | HSBC Holdings PLC | | | 8.000% | | | | | | | | A+ | | | $ | 81,840 | |
| | | | | |
| | 490 | | | Popular Inc. | | | 8.250% | | | | | | | | B2 | | | | 10,780 | |
| | | | | |
| | 80 | | | U.S. Bancorp. | | | 7.189% | | | | | | | | A | | | | 68,001 | |
| | | | | |
| | 3,000 | | | Zions Bancorporation | | | 9.500% | | | | | | | | BB | | | | 78,600 | |
| | | | Total Commercial Banks | | | | | | | | | | | | | | | 239,221 | |
| | | | Commercial Services & Supplies – 4.4% | | | | | | | | | | | | | | | | |
| | | | | |
| | 100 | | | Pitney Bowes Interntational Holdings, 144A | | | 6.125% | | | | | | | | Baa1 | | | | 97,531 | |
| | | | Consumer Finance – 6.6% | | | | | | | | | | | | | | | | |
| | | | | |
| | 2,000 | | | Ally Financial Inc. | | | 8.500% | | | | | | | | B | | | | 49,740 | |
| | | | | |
| | 1,000 | | | Heller Financial Inc. | | | 6.687% | | | | | | | | A+ | | | | 97,156 | |
| | | | Total Consumer Finance | | | | | | | | | | | | | | | 146,896 | |
| | | | Diversified Financial Services – 5.1% | | | | | | | | | | | | | | | | |
| | | | | |
| | 2,400 | | | Citigroup Capital Trust XII | | | 8.500% | | | | | | | | BBB | | | | 63,192 | |
| | | | | |
| | 2,000 | | | Citigroup Inc., Series F | | | 8.500% | | | | | | | | BBB | | | | 52,100 | |
| | | | Total Diversified Financial Services | | | | | | | | | | | | | | | 115,292 | |
| | | | | | | | | | | | | | | | | | | | |
| Shares | | | Description (1) | | Coupon | | | | | | Ratings (3) | | | Value | |
| | | | | | | | | | | | | | | | | | | | |
| | | | Electric Utilities – 3.4% | | | | | | | | | | | | | | | | |
| | | | | |
| | 3,000 | | | BGE Capital Trust II | | | 6.200% | | | | | | | | BBB– | | | $ | 74,940 | |
| | | | Insurance – 22.1% | | | | | | | | | | | | | | | | |
| | | | | |
| | 2,500 | | | Allianz SE | | | 8.375% | | | | | | | | A+ | | | | 66,797 | |
| | | | | |
| | 3,000 | | | American Financial Group | | | 7.000% | | | | | | | | BBB+ | | | | 75,300 | |
| | | | | |
| | 3,000 | | | Aspen Insurance Holdings Limited | | | 7.401% | | | | | | | | BBB– | | | | 73,080 | |
| | | | | |
| | 3,000 | | | Endurance Specialty Holdings Limited | | | 7.750% | | | | | | | | BBB– | | | | 76,770 | |
| | | | | |
| | 2,000 | | | PLC Capital Trust III | | | 7.500% | | | | | | | | BBB | | | | 50,600 | |
| | | | | |
| | 1,900 | | | Principal Financial Group | | | 6.518% | | | | | | | | BBB | | | | 46,075 | |
| | | | | |
| | 400 | | | Principal Financial Group | | | 5.563% | | | | | | | | BBB | | | | 37,538 | |
| | | | | |
| | 2,500 | | | Prudential Financial Inc. | | | 9.000% | | | | | | | | BBB+ | | | | 68,775 | |
| | | | Total Insurance | | | | | | | | | | | | | | | 494,935 | |
| | | | Multi-Utilities – 3.1% | | | | | | | | | | | | | | | | |
| | | | | |
| | 2,500 | | | Scana Corporation | | | 7.700% | | | | | | | | BBB– | | | | 69,700 | |
| | | | Real Estate Investment Trust – 13.1% | | | | | | | | | | | | | | | | |
| | | | | |
| | 2,000 | | | Apartment Investment & Management Company, Series U | | | 7.750% | | | | | | | | Ba3 | | | | 49,940 | |
| | | | | |
| | 2,000 | | | Ashford Hospitality Trust Inc., Series D | | | 8.450% | | | | | | | | N/A | | | | 48,760 | |
| | | | | |
| | 2,500 | | | Dupont Fabros Technology | | | 7.875% | | | | | | | | Ba3 | | | | 62,625 | |
| | | | | |
| | 2,500 | | | Kimco Realty Corporation, Series G | | | 7.750% | | | | | | | | Baa2 | | | | 64,650 | |
| | | | | |
| | 2,500 | | | Vornado Realty LP | | | 7.875% | | | | | | | | BBB | | | | 67,725 | |
| | | | Total Real Estate Investment Trust | | | | | | | | | | | | | | | 293,700 | |
| | | | Wireless Telecommunication Services – 3.6% | | | | | | | | | | | | | | | | |
| | | | | |
| | 1,695 | | | Telephone and Data Systems Inc. | | | 7.600% | | | | | | | | Baa2 | | | | 42,595 | |
| | | | | |
| | 1,500 | | | Telephone and Data Systems Inc. | | | 7.000% | | | | | | | | Baa2 | | | | 37,470 | |
| | | | Total Wireless Telecommunication Services | | | | | | | | | | | | | | | 80,065 | |
| | | | Total $25 Par (or similar) Preferred Securities (cost $1,526,670) | | | | | | | | | | | | | | | 1,612,280 | |
| | | | | |
Principal
Amount (000)/
Shares | | | Description (1) | | Coupon | | | Maturity | | | Ratings (4) | | | Value | |
| | | | CAPITAL PREFERRED SECURITIES – 4.4% | | | | | | | | | | | | | | | | |
| | | | | |
| | | | Insurance – 4.4% | | | | | | | | | | | | | | | | |
| | | | | |
| | 1 | | | Axis Capital Holdings Limited | | | 7.500% | | | | 12/01/15 | | | | BBB | | | $ | 98,625 | |
| | | | Total Capital Preferred Securities (cost $87,722) | | | | | | | | | | | | | | | 98,625 | |
| | | | | |
Principal
Amount (000) | | | Description (1) | | Coupon | | | Maturity | | | Ratings (4) | | | Value | |
| | | | CORPORATE BONDS – 1.4% | | | | | | | | | | | | | | | | |
| | | | | |
| | | | Insurance – 1.4% | | | | | | | | | | | | | | | | |
| | | | | |
| $ | 31 | | | Genworth Financial Inc. | | | 7.625% | | | | 9/24/21 | | | | BBB | | | $ | 31,099 | |
| $ | 31 | | | Total Corporate Bonds (cost $31,000) | | | | | | | | | | | | | | | 31,099 | |
| | | | | |
| Shares | | | Description (1) | | | | | | | | | | | Value | |
| | | | INVESTMENT COMPANIES – 2.9% | | | | | | | | | | | | | | | | |
| | | | | |
| | 3,700 | | | Flaherty and Crumrine/Claymore Preferred Securities Income Fund Inc. | | | | | | | | | | | | | | $ | 63,196 | |
| | | | Total Investment Companies (cost $47,972) | | | | | | | | | | | | | | | 63,196 | |
| | | | Total Investments (cost $2,034,565) – 97.5% | | | | | | | | | | | | | | | 2,179,107 | |
| | | | Other Assets Less Liabilities – 2.5% (5) | | | | | | | | | | | | | | | 56,778 | |
| | | | Net Assets – 100% | | | | | | | | | | | | | | $ | 2,235,885 | |
Portfolio of Investments (Unaudited)
Nuveen NWQ Preferred Securities Fund (continued)
March 31, 2011
Investments in Derivatives
Call Options Written outstanding as of March 31, 2011:
| | | | | | | | | | | | | | | | | | | | |
Number of
Contracts | | | Type | | Notional
Amount (6) | | | Expiration
Date | | | Strike
Price | | | Value | |
| | | | | |
| | (5) | | | Barrick Gold Corporation | | $ | (25,000) | | | | 7/16/11 | | | $ | 50.0 | | | $ | (2,050) | |
| | | | | |
| | (2) | | | Barrick Gold Corporation | | | (11,000) | | | | 10/22/11 | | | | 55.0 | | | | (660) | |
| | | | | |
| | (8) | | | Motorola Mobility Holdings Inc. | | | (24,000) | | | | 7/16/11 | | | | 30.0 | | | | (480) | |
| | (15) | | | Total Call Options Written (premiums received $4,837) | | $ | (60,000) | | | | | | | | | | | $ | (3,190) | |
| | | | For Fund portfolio compliance purposes, the Fund’s industry classifications refer to any one or more of the industry sub-classifications used by one or more widely recognized market indexes or ratings group indexes, and/or as defined by Fund management. This definition may not apply for purposes of this report, which may combine industry sub-classifications into sectors for reporting ease. |
| | (1) | | All percentages shown in the Portfolio of Investments are based on net assets. |
| | (2) | | Investment, or portion of investment, has been pledged as collateral for investments in derivatives. |
| | (3) | | Non-income producing; issuer has not declared a dividend within the past twelve months. |
| | (4) | | Ratings: Using the highest of Standard & Poor’s Group (“Standard & Poor’s”), Moody’s Investor Service, Inc. (“Moody’s”) or Fitch, Inc. (“Fitch”) rating. Ratings below BBB by Standard & Poor’s, Baa by Moody’s or BBB by Fitch are considered to be below investment grade. |
| | (5) | | Other Assets Less Liabilities includes Value and/or Net Unrealized Appreciation (Depreciation) of derivative instruments as noted within Investments in Derivatives. |
| | (6) | | For disclosure purposes, Notional Amount is calculated by multiplying the Number of Contracts by the Strike Price by 100. |
| | 144A | | Investment is exempt from registration under Rule 144A of the Securities Act of 1933, as amended. These investments may only be resold in transactions exempt from registration, which are normally those transactions with qualified institutional buyers. |
See accompanying notes to financial statements.
Statement of Assets and Liabilities (Unaudited)
March 31, 2011
| | | | |
Assets | | | | |
Investments, at value (cost $2,034,565) | | $ | 2,179,107 | |
Cash | | | 36,037 | |
Receivables: | | | | |
Dividends | | | 10,813 | |
From Adviser | | | 10,465 | |
Interest | | | 39 | |
Investments sold | | | 50,941 | |
Total assets | | | 2,287,402 | |
Liabilities | | | | |
Call options written, at value (premiums received $4,837) | | | 3,190 | |
Payables: | | | | |
Dividends | | | 11,912 | |
Investments purchased | | | 4,041 | |
Accrued expenses: | | | | |
12b-1 distribution and service fees | | | 828 | |
Other | | | 31,546 | |
Total liabilities | | | 51,517 | |
Net assets | | $ | 2,235,885 | |
Class A Shares | | | | |
Net assets | | $ | 559,228 | |
Shares outstanding | | | 25,000 | |
Net asset value per share | | $ | 22.37 | |
Offering price per share (net asset value per share plus
maximum sales charge of 4.75% of offering price) | | $ | 23.49 | |
Class C Shares | | | | |
Net assets | | $ | 558,263 | |
Shares outstanding | | | 25,000 | |
Net asset value and offering price per share | | $ | 22.33 | |
Class R3 Shares | | | | |
Net assets | | $ | 558,847 | |
Shares outstanding | | | 25,000 | |
Net asset value and offering price per share | | $ | 22.35 | |
Class I Shares | | | | |
Net assets | | $ | 559,547 | |
Shares outstanding | | | 25,000 | |
Net asset value and offering price per share | | $ | 22.38 | |
Net Assets Consist of: | | | | |
Capital paid-in | | $ | 1,997,482 | |
Undistributed (Over-distribution of) net investment income | | | 13,587 | |
Accumulated net realized gain (loss) | | | 78,627 | |
Net unrealized appreciation (depreciation) | | | 146,189 | |
Net assets | | $ | 2,235,885 | |
Authorized shares | | | Unlimited | |
Par value per share | | $ | 0.01 | |
See accompanying notes to financial statements.
Statement of Operations (Unaudited)
Six Months Ended March 31, 2011
| | | | |
Dividend and Interest Income | | $ | 78,765 | |
Expenses | | | | |
Management fees | | | 8,142 | |
12b-1 service fees – Class A | | | 696 | |
12b-1 distribution and service fees – Class C | | | 2,779 | |
12b-1 distribution and service fees – Class R3 | | | 1,391 | |
Shareholders’ servicing agent fees and expenses | | | 121 | |
Custodian’s fees and expenses | | | 2,409 | |
Professional fees | | | 11,618 | |
Shareholders’ reports – printing and mailing expenses | | | 8,164 | |
Other expenses | | | 549 | |
Total expenses before custodian fee credit and expense reimbursement | | | 35,869 | |
Custodian fee credit | | | (23 | ) |
Expense reimbursement | | | (22,855 | ) |
Net expenses | | | 12,991 | |
Net investment income (loss) | | | 65,774 | |
Realized and Unrealized Gain (Loss): | | | | |
Net realized gain (loss) from: | | | | |
Investments | | | 69,950 | |
Call options written | | | 9,107 | |
Change in net unrealized appreciation (depreciation) of: | | | | |
Investments | | | (13,865 | ) |
Call options written | | | (2,360 | ) |
Net realized and unrealized gain (loss) | | | 62,832 | |
Net increase (decrease) in net assets from operations | | $ | 128,606 | |
See accompanying notes to financial statements.
Statement of Changes in Net Assets (Unaudited)
| | | | | | | | |
| | | Six Months Ended
3/31/11 | | | Period Ended
9/30/10* | |
Operations | | | | | | | | |
Net investment income (loss) | | $ | 65,774 | | | $ | 103,819 | |
Net realized gain (loss) from: | | | | | | | | |
Investments | | | 69,950 | | | | 65,457 | |
Call options written | | | 9,107 | | | | 9,351 | |
Change in net unrealized appreciation (depreciation) of: | | | | | | | | |
Investments | | | (13,865 | ) | | | 158,407 | |
Call options written | | | (2,360 | ) | | | 4,007 | |
Net increase (decrease) in net assets from operations | | | 128,606 | | | | 341,041 | |
Distributions to Shareholders | | | | | | | | |
From net investment income: | | | | | | | | |
Class A | | | (18,375 | ) | | | (21,437 | ) |
Class C | | | (16,275 | ) | | | (18,988 | ) |
Class R3 | | | (17,700 | ) | | | (20,650 | ) |
Class I | | | (19,112 | ) | | | (22,225 | ) |
From accumulated net realized gains: | | | | | | | | |
Class A | | | (19,750 | ) | | | — | |
Class C | | | (19,750 | ) | | | — | |
Class R3 | | | (19,750 | ) | | | — | |
Class I | | | (19,750 | ) | | | — | |
Decrease in net assets from distributions to shareholders | | | (150,462 | ) | | | (83,300 | ) |
Fund Share Transactions | | | | | | | | |
Proceeds from sale of shares | | | — | | | | 2,000,000 | |
Net increase (decrease) in net assets from Fund share transactions | | | — | | | | 2,000,000 | |
Net increase (decrease) in net assets | | | (21,856 | ) | | | 2,257,741 | |
Net assets at the beginning of period | | | 2,257,741 | | | | — | |
Net assets at the end of period | | $ | 2,235,885 | | | $ | 2,257,741 | |
Undistributed (Over-distribution of) net investment income at the end of period | | $ | 13,587 | | | $ | 19,275 | |
| * | For the period December 9, 2009 (commencement of operations) through September 30, 2010 |
See accompanying notes to financial statements.
Financial Highlights (Unaudited)
| | | | | | | | | | | | | | | | | | | | | | | | | | | | | | | | | | | | |
| Selected data for a share outstanding throughout the period: | |
| | | | | | | |
| Class (Commencement Date) | | | | | | | | | | | | | | | | | | | | | | |
| | | | | | Investment Operations | | | Less Distributions | | | | | | | |
| | | | | | | | |
| | | | | | | | | | | | | | | | | | | | | | | | | | |
Year Ended
September 30, | | Beginning
Net
Asset
Value | | | Net
Invest-
ment
Income
(Loss)(a) | | |
Net
Realized/
Unrealized
Gain
(Loss) | | | Total | | | Net
Invest-
ment
Income | | | Capital
Gains(f) | | | Total | | | Ending
Net
Asset
Value | | | Total
Return(b) | |
Class A (12/09) | | | | | | | | | | | | | | | | | | | | | | | | | | | | | | | | | |
2011(e) | | $ | 22.59 | | | $ | .68 | | | $ | .63 | | | $ | 1.31 | | | $ | (.74 | ) | | $ | (.79 | ) | | $ | (1.53 | ) | | $ | 22.37 | | | | 6.04 | % |
2010(d) | | | 20.00 | | | | 1.07 | | | | 2.38 | | | | 3.45 | | | | (.86 | ) | | | — | | | | (.86 | ) | | | 22.59 | | | | 17.46 | |
Class C (12/09) | | | | | | | | | | | | | | | | | | | | | | | | | | | | | | | | | |
2011(e) | | | 22.55 | | | | .59 | | | | .63 | | | | 1.22 | | | | (.65 | ) | | | (.79 | ) | | | (1.44 | ) | | | 22.33 | | | | 5.65 | |
2010(d) | | | 20.00 | | | | .94 | | | | 2.37 | | | | 3.31 | | | | (.76 | ) | | | — | | | | (.76 | ) | | | 22.55 | | | | 16.74 | |
Class R3 (12/09) | | | | | | | | | | | | | | | | | | | | | | | | | | | | | | | | | |
2011(e) | | | 22.57 | | | | .65 | | | | .63 | | | | 1.28 | | | | (.71 | ) | | | (.79 | ) | | | (1.50 | ) | | | 22.35 | | | | 5.92 | |
2010(d) | | | 20.00 | | | | 1.03 | | | | 2.37 | | | | 3.40 | | | | (.83 | ) | | | — | | | | (.83 | ) | | | 22.57 | | | | 17.19 | |
Class I (12/09) | | | | | | | | | | | | | | | | | | | | | | | | | | | | | | | | | |
2011(e) | | | 22.60 | | | | .71 | | | | .62 | | | | 1.33 | | | | (.76 | ) | | | (.79 | ) | | | (1.55 | ) | | | 22.38 | | | | 6.18 | |
2010(d) | | | 20.00 | | | | 1.12 | | | | 2.37 | | | | 3.49 | | | | (.89 | ) | | | — | | | | (.89 | ) | | | 22.60 | | | | 17.68 | |
| | | | | | | | | | | | | | | | | | | | | | |
| | | | | | | | | | | |
| | | |
| | | | | | | | | | | |
| Ratios/Supplemental Data | |
| | | |
| | | | Ratios to Average
Net Assets Before
Reimbursement | | | Ratios to Average
Net Assets After
Reimbursement(c) | | | | |
Ending
Net
Assets
(000) | | | Expenses | | | Net
Invest-
ment
Income
(Loss) | | | Expenses | | | Net
Invest-
ment
Income
(Loss) | | | Portfolio
Turnover
Rate | |
| | | | | | | | | | | | | | | | | | | | | | |
| $ | 559 | | | | 3.04 | %* | | | 4.04 | %* | | | .98 | %* | | | 6.09 | %* | | | 35 | % |
| | 565 | | | | 3.61 | * | | | 3.55 | * | | | .99 | * | | | 6.17 | * | | | 53 | |
| | | | | | | | | | | | | | | | | | | | | | |
| | 558 | | | | 3.79 | * | | | 3.29 | * | | | 1.73 | * | | | 5.34 | * | | | 35 | |
| | 564 | | | | 4.36 | * | | | 2.80 | * | | | 1.74 | * | | | 5.41 | * | | | 53 | |
| | | | | | | | | | | | | | | | | | | | | | |
| | 559 | | | | 3.28 | * | | | 3.79 | * | | | 1.23 | * | | | 5.84 | * | | | 35 | |
| | 564 | | | | 3.85 | * | | | 3.30 | * | | | 1.24 | * | | | 5.91 | * | | | 53 | |
| | | | | | | | | | | | | | | | | | | | | | |
| | 560 | | | | 2.79 | * | | | 4.29 | * | | | .73 | * | | | 6.34 | * | | | 35 | |
| | 565 | | | | 3.36 | * | | | 3.80 | * | | | .74 | * | | | 6.42 | * | | | 53 | |
| (a) | Per share Net Investment Income (Loss) is calculated using the average daily shares method. |
| (b) | Total return is the combination of changes in net asset value without any sales charge, reinvested dividend income at net asset value and reinvested capital gains distributions at net asset value, if any. Total returns are not annualized. |
| (c) | After expense reimbursement from the Adviser, where applicable. Ratios do not reflect the effect of custodian fee credits earned on the Fund’s net cash on deposit with the custodian bank, where applicable. |
| (d) | For the period December 9, 2009 (commencement of operations) through September 30, 2010. |
| (e) | For the six months ended March 31, 2011. |
| (f) | Distributions from Capital Gains include short-term capital gains, if any. |
See accompanying notes to financial statements.
Notes to Financial Statements (Unaudited)
1. General Information and Significant Accounting Policies
General Information
The Nuveen Investment Trust V (the “Trust”) is an open-end investment company registered under the Investment Company Act of 1940, as amended. The Trust is comprised of the Nuveen NWQ Preferred Securities Fund (the “Fund”), among others. The Trust was organized as a Massachusetts business trust on September 27, 2006. The Fund commenced operations on December 9, 2009.
Effective January 1, 2011, the Funds’ adviser, Nuveen Asset Management, a wholly-owned subsidiary of Nuveen Investments, Inc. (“Nuveen”) changed its name to Nuveen Fund Advisors, Inc. (the “Adviser”).
The Fund seeks to provide current income and capital appreciation. Under normal market conditions, the Fund invests at least 80% of its net assets in preferred securities. Preferred securities, which generally pay fixed or adjustable rate dividends to investors, have preference over common stock in the payment of dividends and the liquidation of a company’s assets, which means that a company must pay dividends on its preferred securities before paying any dividends on its common stock. The Fund seeks to meet its investment objective by investing primarily in preferred securities, but it may also invest up to 20% of its net assets in non-preferred securities, including common stock, convertible debt securities, corporate debt securities, mortgage-backed securities and U.S. Government and agency debt securities. The Fund may also write covered call options on securities in which the Fund holds a long position. The Fund may invest up to 50% of its net assets in below investment-grade securities, commonly referred to as “high yield,” “high risk” or “junk” securities. Although the Fund invests primarily in securities issued by U.S. companies, it may invest up to 40% of its net assets in dollar-denominated securities issued by non-U.S. companies.
Significant Accounting Policies
The following is a summary of significant accounting policies followed by the Fund in the preparation of its financial statements in accordance with U.S. generally accepted accounting principles (“U.S. GAAP”).
Investment Valuation
Common stocks and other equity-type securities are valued at the last sales price on the securities exchange on which such securities are primarily traded. Securities primarily traded on the NASDAQ National Market (“NASDAQ”) are valued, except as indicated below, at the NASDAQ Official Closing Price and are generally classified as Level 1. However, securities traded on a securities exchange or NASDAQ for which there were no transactions on a given day or securities not listed on a securities exchange or NASDAQ are valued at the last quoted bid price. These securities are generally classified as Level 1 for fair value measurement purposes.
Prices of fixed-income securities are provided by a pricing service approved by the Fund’s Board of Trustees. These securities are generally classified as Level 2. When price quotes are not readily available the pricing service establishes a security’s fair value using methods that may include consideration of the following: yields or prices of investments of comparable quality, type of issue, coupon, maturity and rating, market quotes or indications of value from security dealers, evaluations of anticipated cash flows or collateral, general market conditions and other information and analysis, including the obligor’s credit characteristics considered relevant. In pricing certain securities, particularly less liquid and lower quality securities, the pricing service may consider information about a security, its issuer, or market activity provided by the Adviser. These securities are generally classified as Level 2 or Level 3 depending on the priority of the significant inputs.
The value of exchange-traded options are based on the mean of the bid and ask prices. Exchange-traded options are generally classified as Level 1. Options traded in the over-the-counter market are valued using market implied volatilities and are generally classified as Level 2.
Repurchase agreements are valued at contract amount plus accrued interest, which approximates market value. These securities are generally classified as Level 2.
Certain securities may not be able to be priced by the pre-established pricing methods as described above. Such securities may be valued by the Fund’s Board of Trustees or its designee at fair value. These securities generally include, but are not limited to, restricted securities (securities which may not be publicly sold without registration under the Securities Act of 1933, as amended) for which a pricing service is unable to provide a market price; securities whose trading has been formally suspended; debt securities that have gone into default and for which there is no current market quotation; a security whose market price is not available from a pre-established pricing source; a security with respect to which an event has occurred that is likely to materially affect the value of the security after the market has closed but before the calculation of a Fund’s net asset value (as may be the case in non-U.S. markets on which the security is primarily traded) or make it difficult or impossible to obtain a reliable market quotation; and a security whose price, as provided by the pricing service, is not deemed to reflect the security’s fair value. As a general principle, the fair value of a security would appear to be the amount that the owner might reasonably expect to receive for it in a current sale. A variety of factors may be considered in determining the fair value of such securities, which may include consideration of the following: yields or prices of investments of comparable quality, type of issue, coupon, maturity and rating, market quotes or indications of value from security dealers, evaluations of anticipated cash flows or collateral, general market conditions and other information and analysis, including the obligor’s credit characteristics considered relevant. These securities are generally classified as Level 2 or Level 3 depending on the priority of the significant inputs. Regardless of the method employed to value a particular security, all valuations are subject to review by the Fund’s Board of Trustees or its designee.
Refer to Footnote 2 – Fair Value Measurements for further details on the leveling of securities held by the Fund as of the end of the reporting period.
Investment Transactions
Investment transactions are recorded on a trade date basis. Realized gains and losses from investment transactions are determined on the specific identification method, which is the same basis used for federal income tax purposes. Investments purchased on a when-issued/delayed delivery basis may have extended settlement periods. Any investments so purchased are subject to market fluctuation during this period. The Fund has instructed the custodian to segregate assets with a current value at least equal to the amount of the when-issued/delayed delivery purchase commitments. At March 31, 2011, the Fund had no outstanding when-issued/delayed purchase commitments.
Investment Income
Dividend income is recorded on the ex-dividend date or, for foreign securities, when information is available. Interest income, which reflects the amortization of premiums and includes accretion of discounts for financial reporting purposes, is recorded on an accrual basis. Interest income also reflects paydown gains and losses, if any.
Income Taxes
The Fund intends to distribute substantially all of its net investment income and net capital gains to shareholders and to otherwise comply with the requirements of Subchapter M of the Internal Revenue Code applicable to regulated investment companies. Therefore, no federal income tax provision is required.
For all open tax years and all major taxing jurisdictions, management of the Fund has concluded that there are no significant uncertain tax positions that would require recognition in the financial statements. Open tax years are those that are open for examination by taxing authorities (i.e., generally the last four tax year ends and the interim tax period since then). Furthermore, management of the Fund is also not aware of any tax positions for which it is reasonably possible that the total amounts of unrecognized tax benefits will significantly change in the next twelve months.
Dividends and Distributions to Shareholders
The Fund declares dividends from its net investment income daily and pays shareholders monthly. Fund shares begin to accrue dividends on the business day after the day when the monies used to purchase Fund shares are collected by the Fund’s transfer agent.
Net realized capital gains from investment transactions, if any, are declared and distributed to shareholders at least annually. Furthermore, capital gains are distributed only to the extent they exceed available capital loss carryforwards.
Distributions to shareholders are recorded on the ex-dividend date. The amount and timing of distributions are determined in accordance with federal income tax regulations, which may differ from U.S. GAAP.
Flexible Sales Charge Program
Class A Shares are generally sold with an up-front sales charge and incur a .25% annual 12b-1 service fee. Class A Share purchases of $1 million or more are sold at net asset value without an up-front sales charge but may be subject to a contingent deferred sales charge (“CDSC”) if redeemed within twelve months of purchase. Class C Shares are sold without an up-front sales charge but incur a .75% annual 12b-1 distribution fee and a .25% annual 12b-1 service fee. Class C Shares are subject to a CDSC of 1% if redeemed within one year of purchase. Class R3 Shares are sold without an up-front sales charge but incur a .25% annual 12b-1 distribution fee and a .25% annual 12b-1 service fee. Class I Shares are not subject to any sales charge or 12b-1 distribution or service fees.
Options Transactions
The Fund is subject to equity price risk in the normal course of pursuing its investment objectives and is authorized to write (sell) call options, in an attempt to manage such risk. When the Fund writes an option, an amount equal to the net premium received (the premium less commission) is recognized as a component of “Call options written, at value” on the Statement of Assets and Liabilities and is subsequently adjusted to reflect the current value of the written option until the option is exercised or expires or the Fund enters into a closing purchase transaction. The changes in the value of options written during the fiscal period are recognized as a component of “Change in net unrealized appreciation (depreciation) of call options written” on the Statement of Operations. When an option is exercised or expires or a Fund enters into a closing purchase transaction, the difference between the net premium received and any amount paid at expiration or on executing a closing purchase transaction, including commission, is recognized as a component of “Net realized gain (loss) from call options written“ on the Statement of Operations. The Fund, as a writer of an option, has no control over whether the underlying instrument may be sold (called) and as a result bears the risk of an unfavorable change in the market value of the instrument underlying the written option. There is also the risk the Fund may not be able to enter into a closing transaction because of an illiquid market.
During the six months ended March 31, 2011, the Fund wrote call options on individual stocks to enhance returns while foregoing some upside potential. The average notional amount of call options written during the six months ended March 31, 2011 was $(100,000). The average notional amount is calculated based on the outstanding amount at the beginning of the fiscal year and at the end of each fiscal quarter within the current fiscal year. Refer to Footnote 3 – Derivative Instruments and Hedging Activities and Footnote 5 – Investment Transactions for further details on call options written.
Notes to Financial Statements (Unaudited) (continued)
Market and Counterparty Credit Risk
In the normal course of business the Fund may invest in financial instruments and enter into financial transactions where risk of potential loss exists due to changes in the market (market risk) or failure of the other party to the transaction to perform (counterparty credit risk). The potential loss could exceed the value of the financial assets recorded on the financial statements. Financial assets, which potentially expose the Fund to counterparty credit risk, consist principally of cash due from counterparties on forward, option and swap transactions, when applicable. The extent of the Fund’s exposure to counterparty credit risk in respect to these financial assets approximates their carrying value as recorded on the Statement of Assets and Liabilities. Futures contracts, when applicable, expose the Fund to minimal counterparty credit risk as they are exchange traded and the exchange’s clearinghouse, which is counterparty to all exchange traded futures, guarantees the futures contracts against default.
The Fund helps manage counterparty credit risk by entering into agreements only with counterparties the Adviser believes have the financial resources to honor their obligations and by having the Adviser monitor the financial stability of the counterparties. Additionally, counterparties may be required to pledge collateral daily (based on the daily valuation of the financial asset) on behalf of the Fund with a value approximately equal to the amount of any unrealized gain above a pre-determined threshold. Reciprocally, when the Fund has an unrealized loss, the Fund has instructed the custodian to pledge assets of the Fund as collateral with a value approximately equal to the amount of the unrealized loss above a pre-determined threshold. Collateral pledges are monitored and subsequently adjusted if and when the valuations fluctuate, either up or down, by at least the pre-determined threshold amount.
Repurchase Agreements
In connection with transactions in repurchase agreements, it is the Fund’s policy that its custodian take possession of the underlying collateral securities, the fair value of which exceeds the principal amount of the repurchase transaction, including accrued interest, at all times. If the counterparty defaults, and the fair value of the collateral declines, realization of the collateral may be delayed or limited.
Multiclass Operations and Allocations
Income and expenses of the Fund that are not directly attributable to a specific class of shares are prorated among the classes based on the relative settled shares of each class. Expenses directly attributable to a class of shares, which presently only include 12b-1 distribution and service fees, are recorded to the specific class.
Realized and unrealized capital gains and losses of the Fund are prorated among the classes based on the relative net assets of each class.
Custodian Fee Credit
The Fund has an arrangement with the custodian bank whereby certain custodian fees and expenses are reduced by net credits earned on the Fund’s cash on deposit with the bank. Such deposit arrangements are an alternative to overnight investments. Credits for cash balances may be offset by charges for any days on which the Fund overdraws its account at the custodian bank.
Indemnifications
Under the Trust’s organizational documents, its officers and trustees are indemnified against certain liabilities arising out of the performance of their duties to the Trust. In addition, in the normal course of business, the Trust enters into contracts that provide general indemnifications to other parties. The Trust’s maximum exposure under these arrangements is unknown as this would involve future claims that may be made against the Trust that have not yet occurred. However, the Trust has not had prior claims or losses pursuant to these contracts and expects the risk of loss to be remote.
Use of Estimates
The preparation of financial statements in conformity with U.S. GAAP requires management to make estimates and assumptions that affect the reported amounts of assets and liabilities at the date of the financial statements and the reported amounts of increases and decreases in net assets from operations during the reporting period. Actual results may differ from those estimates.
2. Fair Value Measurements
Fair value is defined as the price that the Fund would receive upon selling an investment or transferring a liability in an orderly transaction to an independent buyer in the principal or most advantageous market of the investment. A three-tier hierarchy is used to maximize the use of observable market data and minimize the use of unobservable inputs and to establish classification of fair value measurements for disclosure purposes. Observable inputs reflect the assumptions market participants would use in pricing the asset or liability. Observable inputs are based on market data obtained from sources independent of the reporting entity. Unobservable inputs reflect the reporting entity’s own assumptions about the assumptions market participants would use in pricing the asset or liability. Unobservable inputs are based on the best information available in the circumstances. The three-tier hierarchy of inputs is summarized in the three broad levels listed below:
| | |
| Level 1 – | | Quoted prices in active markets for identical securities. |
| Level 2 – | | Other significant observable inputs (including quoted prices for similar securities, interest rates, prepayment speeds, credit risk, etc.). |
| Level 3 – | | Significant unobservable inputs (including management’s assumptions in determining the fair value of investments). |
The inputs or methodologies used for valuing securities are not an indication of the risk associated with investing in those securities. The following is a summary of the Fund’s fair value measurements as of March 31, 2011:
| | | | | | | | | | | | | | | | |
| | | Level 1 | | | Level 2 | | | Level 3 | | | Total | |
Investments: | | | | | | | | | | | | | | | | |
Common Stocks | | $ | 241,949 | | | $ | — | | | $ | — | | | $ | 241,949 | |
Convertible Preferred Securities | | | 103,520 | | | | 28,438 | | | | — | | | | 131,958 | |
$25 Par (or similar) Preferred Securities | | | 1,302,478 | | | | 309,802 | | | | — | | | | 1,612,280 | |
Capital Preferred Securities | | | — | | | | 98,625 | | | | — | | | | 98,625 | |
Corporate Bonds | | | — | | | | 31,099 | | | | — | | | | 31,099 | |
Investment Companies | | | 63,196 | | | | — | | | | — | | | | 63,196 | |
Derivatives: | | | | | | | | | | | | | | | | |
Call Options Written | | | (3,190 | ) | | | — | | | | — | | | | (3,190 | ) |
Total | | $ | 1,707,953 | | | $ | 467,964 | | | $ | — | | | $ | 2,175,917 | |
During the six months ended March 31, 2011, the Fund recognized no significant transfers to/from Level 1, Level 2 or Level 3.
3. Derivative Instruments and Hedging Activities
The Fund records derivative instruments at fair value, with changes in fair value recognized on the Statement of Operations, when applicable. Even though the Fund’s investments in derivatives may represent economic hedges, they are not considered to be hedge transactions for financial reporting purposes. For additional information on the derivative instruments in which the Fund was invested during and at the end of the reporting period refer to the Portfolio of Investments, Financial Statements and Footnote 1 – General Information and Significant Accounting Policies.
The following table presents the fair value of all derivative instruments held by the Fund as of March 31, 2011, the location of these instruments on the Statement of Assets and Liabilities, and the primary underlying risk exposure.
| | | | | | | | | | | | | | | | | | |
| | | | | Location on the Statement of Assets and Liabilities | |
| | | Derivative
Instrument | | Asset Derivatives | | | | | Liability Derivatives | |
Underlying Risk Exposure | | | Location | | | Value | | | | | | Location | | | | Value | |
Equity Price | | Options | | — | | $ | — | | | | | | Call options written, at value | | | $ | 3,190 | |
The following tables present the amount of net realized gain (loss) and change in net unrealized appreciation (depreciation) recognized for the six months ended March 31, 2011, on derivative instruments, as well as the primary risk exposure associated with each.
| | | | |
| Net Realized Gain (Loss) from Call Options Written | | | |
Risk Exposure | | | | |
Equity Price | | $ | 9,107 | |
| | | | |
| Change in Net Unrealized Appreciation (Depreciation) of Call Options Written | | | |
Risk Exposure | | | | |
Equity Price | | $ | (2,360 | ) |
4. Fund Shares
Transactions in Fund shares were as follows:
| | | | | | | | | | | | | | | | |
| | | Six Months Ended
3/31/11 | | | For the Period 12/09/09
(commencement of operations)
through 9/30/10 | |
| | | Shares | | | Amount | | | Shares | | | Amount | |
Shares sold: | | | | | | | | | | | | | | | | |
Class A | | | — | | | $ | — | | | | 25,000 | | | $ | 500,000 | |
Class C | | | — | | | | — | | | | 25,000 | | | | 500,000 | |
Class R3 | | | — | | | | — | | | | 25,000 | | | | 500,000 | |
Class I | | | — | | | | — | | | | 25,000 | | | | 500,000 | |
Net increase (decrease) | | | — | | | $ | — | | | | 100,000 | | | $ | 2,000,000 | |
5. Investment Transactions
Purchases and sales (including maturities but excluding short-term investments and derivative transactions, when applicable) during the six months March 31, 2011, aggregated $783,077 and $951,495, respectively.
Notes to Financial Statements (Unaudited) (continued)
Transactions in call options written during the six months ended March 31, 2011, were as follows:
| | | | | | | | |
| | | Number of
Contracts | | | Premiums
Received | |
Options outstanding, beginning of period | | | 197 | | | $ | 15,005 | |
Options written | | | 74 | | | | 10,528 | |
Options terminated in closing purchase transactions | | | (207 | ) | | | (15,417 | ) |
Options exercised | | | (19 | ) | | | (3,989 | ) |
Options expired | | | (30 | ) | | | (1,290 | ) |
Options outstanding, end of period | | | 15 | | | $ | 4,837 | |
6. Income Tax Information
The following information is presented on an income tax basis. Differences between amounts for financial statement and federal income tax purposes are primarily due to timing differences in recognizing certain gains and losses on investment transactions. To the extent that differences arise that are permanent in nature, such amounts are reclassified within the capital accounts as detailed below. Temporary differences do not require reclassification. Temporary and permanent differences do not impact the net asset values of the Fund.
At March 31, 2011, the cost and unrealized appreciation (depreciation) of investments (excluding investments in derivatives), as determined on a federal income tax basis, were as follows:
| | | | |
Cost of investments | | $ | 2,033,106 | |
Gross unrealized: | | | | |
Appreciation | | $ | 162,295 | |
Depreciation | | | (16,294 | ) |
Net unrealized appreciation (depreciation) of investments | | $ | 146,001 | |
Permanent differences, primarily due to federal taxes paid, complex securities character adjustments and nondeductible stock issuance costs resulted in reclassifications among the Fund’s components of net assets at September 30, 2010, the Fund’s last tax year-end, as follows:
| | | | |
| | |
| Capital paid in | | $(2,518) | |
Undistributed (Over-distribution of) net investment income | | | (1,244 | ) |
Accumulated net realized gain (loss) | | | 3,762 | |
The tax components of undistributed net ordinary income and net long-term capital gains at September 30, 2010, the Fund’s last tax year end, were as follows:
| | | | |
| | |
| Undistributed net ordinary income* | | $111,864 | |
Undistributed net long-term capital gains | | | — | |
| * | Net ordinary income consists of net taxable income derived from dividends, interest, and net short-term capital gains, if any. |
The tax character of distributions paid during the Fund’s last tax year ended September 30, 2010, was designated for purposes of the dividends paid deduction as follows:
| | | | |
| For the period December 9, 2009 (commencement of operations) through September 30, 2010 | | | |
Distributions from net ordinary income* | | $ | 71,400 | |
Distributions from net long-term capital gains | | | — | |
| * | Net ordinary income consists of net taxable income derived from dividends, interest, and short net short-term capital gains, if any. |
7. Management Fees and Other Transactions with Affiliates
The Fund’s management fee consists of two components – a fund-level fee, based only on the amounts of assets within the Fund, and a complex-level fee, based on the aggregate amount of all eligible fund assets managed by the Adviser. This pricing structure enables Fund shareholders to benefit from growth in the assets within the Fund as well as from growth in the amount of complex-wide assets managed by the Adviser.
The annual fund-level fee, payable monthly, is calculated according to the following schedule:
| | | | |
| Average Daily Net Assets | | Fund-Level Fee Rate | |
For the first $125 million | | | .5500 | % |
For the next $125 million | | | .5375 | |
For the next $250 million | | | .5250 | |
For the next $500 million | | | .5125 | |
For the next $1 billion | | | .5000 | |
For net assets over $2 billion | | | .4750 | |
The annual complex-level fee, payable monthly, is calculated according to the following schedule:
| | | | |
| Complex-Level Asset Breakpoint Level* | | Effective Rate at Breakpoint Level | |
$55 billion | | | .2000 | % |
$56 billion | | | .1996 | |
$57 billion | | | .1989 | |
$60 billion | | | .1961 | |
$63 billion | | | .1931 | |
$66 billion | | | .1900 | |
$71 billion | | | .1851 | |
$76 billion | | | .1806 | |
$80 billion | | | .1773 | |
$91 billion | | | .1691 | |
$125 billion | | | .1599 | |
$200 billion | | | .1505 | |
$250 billion | | | .1469 | |
$300 billion | | | .1445 | |
| * | The complex-level fee is calculated based upon the aggregate daily “eligible assets” of all Nuveen Funds. Eligible assets do not include assets attributable to investments in other Nuveen Funds or assets in excess of $2 billion added to the Nuveen Fund complex in connection with the Adviser’s assumption of the management of the former First American Funds effective January 1, 2011. Eligible assets include closed-end fund assets managed by the Adviser that are attributable to financial leverage. For these purposes, financial leverage includes the closed-end funds’ use of preferred stock and borrowings and certain investments in the residual interest certificates (also called inverse floating rate securities) in tender option bond (TOB) trusts, including the portion of assets held by a TOB trust that has been effectively financed by the trust’s issuance of floating rate securities, subject to an agreement by the Adviser as to certain funds to limit the amount of such assets for determining eligible assets in certain circumstances. As of March 31, 2011, the complex-level fee rate for the Fund was .1800%. |
The management fee compensates the Adviser for overall investment advisory and administrative services and general office facilities. The Adviser has entered into a Sub-Advisory Agreement with NWQ Investment Management Company, LLC (“NWQ”), a subsidiary of Nuveen, under which NWQ manages the investment portfolio of the Fund. NWQ is compensated for its services to the Fund from the management fee paid to the Adviser.
The Adviser has agreed to waive fees and reimburse expenses, so that total annual fund operating expenses (excluding 12b-1 distribution and service fees, interest expenses, taxes, fees incurred in acquiring and disposing of portfolio securities, and extraordinary expenses) do not exceed .75% through January 31, 2013 (1.25% after January 31, 2013), of the average daily net assets of any class of Fund shares. The Adviser may also voluntarily reimburse additional expenses from time to time. Voluntary reimbursements may be terminated at any time at the Adviser’s discretion.
The Trust pays no compensation directly to those of its trustees who are affiliated with the Adviser or to its officers, all of whom receive remuneration for their services to the Trust from the Adviser or its affiliates. The Board of Trustees has adopted a deferred compensation plan for independent trustees that enables trustees to elect to defer receipt of all or a portion of the annual compensation they are entitled to receive from certain Nuveen-advised funds. Under the plan, deferred amounts are treated as though equal dollar amounts had been invested in shares of select Nuveen-advised funds.
At March 31, 2011 Nuveen owned all 25,000 shares of each Class A, C, R3 and I.
During the six months ended March 31, 2011, Nuveen Investments, LLC (the “Distributor”), a wholly-owned subsidiary of Nuveen, retained all 12b-1 fees.
8. New Accounting Pronouncement
Financial Accounting Standards Board (“FASB”) Transfers and Servicing (Topic 860): Reconsideration of Effective Control for Repurchase Agreements.
On April 15, 2011, the FASB issued Accounting Standards Update No. 2011-03, (the “ASU”). The guidance in the ASU is intended to improve the accounting for repurchase and other similar agreements. Specifically, the ASU modifies the criteria for determining when these agreements would be accounted for as financing transactions (secured borrowings/lending agreements) as opposed to sale (purchase) transactions with commitments to repurchase (resell). At this time, management is evaluating the implications of this guidance and the impact it will have to the financial statement amounts or footnote disclosures, if any.
9. Subsequent Events
On April 30, 2011, the Distributor changed its name from Nuveen Investments, LLC to Nuveen Securities, LLC.
Notes
Glossary of Terms Used in this Report
Lipper Corporate Debt Funds BBB-Rated Category Average: Represents the average annualized total return for all reporting funds in the Lipper Corporate Debt Funds BBB Rated category.
The Merrill Lynch Fixed Rate Preferred Stock Index: An index that tracks the performance of fixed rate U.S. dollar denominated preferred securities issued in the U.S. domestic market. Qualifying securities must be rated investment grade (based on an average of Moody’s, S&P, and Fitch) and must have an investment grade rated country of risk (based on an average of Moody’s, S&P, and Fitch foreign currency long-term sovereign debt ratings). In addition, qualifying securities must be issued as public securities or through a 144a filing, must be issued in $25, $50, or $100 par/liquidation preference increments, must have a fixed coupon or dividend schedule, and must have a minimum amount outstanding of $100 million.
Net Asset Value (NAV): A Fund’s NAV is the dollar value of one share in the Fund. It is calculated by subtracting the liabilities of the Fund from its total assets and then dividing the remainder by the number of shares outstanding. Fund NAVs are calculated at the end of each business day.
Fund Information
Fund Manager
Nuveen Fund Advisors, Inc.
333 West Wacker Drive
Chicago, IL 60606
Sub-Adviser
NWQ Investment Management Company, LLC
2049 Century Park East
Los Angeles, CA 90097
Legal Counsel
Chapman and Cutler LLP
Chicago, IL
Independent Registered
Public Accounting Firm
Ernst & Young LLP
Chicago, IL
Custodian
State Street Bank & Trust Company
Boston, MA
Transfer Agent and Shareholder Services
Boston Financial
Data Services, Inc.
Nuveen Investor Services
P.O. Box 8530
Boston, MA 02266-8530
(800) 257-8787
Quarterly Portfolio of Investments and Proxy Voting Information: You may obtain (i) the Fund’s quarterly portfolio of investments, (ii) information regarding how the Fund voted proxies relating to portfolio securities held during the most recent twelve-month period ended June 30, and (iii) a description of the policies and procedures that the Fund used to determine how to vote proxies relating to portfolio securities without charge, upon request, by calling Nuveen Investments at (800) 257-8787 or on Nuveen’s website at www.nuveen.com.
You may also obtain this and other Fund information directly from the Securities and Exchange Commission (SEC). The SEC may charge a copying fee for this information. Visit the SEC on-line at http://www.sec.gov or in person at the SEC’s Public Reference Room in Washington, D.C. Call the SEC at (202) 942-8090 for room hours and operation. You may also request Fund information by sending an e-mail request to publicinfo@sec.gov or by writing to the SEC’s Public Reference Section at 100 F Street NE, Washington, D.C. 20549.
The Financial Industry Regulatory Authority (FINRA) provides a Public Disclosure Program which supplies certain information regarding the disciplinary history of FINRA members and their associated persons in response to either telephone inquiries at (800) 289-9999 or written inquiries at www.finra.org. FINRA also provides an investor brochure that includes information describing the Public Disclosure Program.
Nuveen Investments:
Serving Investors for Generations
Since 1898, financial advisors and their clients have relied on Nuveen Investments to provide dependable investment solutions through continued adherence to proven, long-term investing principles. Today, we offer a range of high quality equity and fixed-income solutions designed to be integral components of a well-diversified core portfolio.
Focused on meeting investor needs.
Nuveen Investments is a global investment management firm that seeks to help secure the long-term goals of institutions and high net worth investors as well as the consultants and financial advisors who serve them. We market our growing range of specialized investment solutions under the high-quality brands of HydePark, NWQ, Nuveen Asset Management, Santa Barbara, Symphony, Tradewinds and Winslow Capital. In total, Nuveen Investments managed approximately $206 billion of assets as of March 31, 2011.
Find out how we can help you.
To learn more about how the products and services of Nuveen Investments may be able to help you meet your financial goals, talk to your financial advisor, or call us at (800) 257-8787. Please read the information provided carefully before you invest. Investors should consider the investment objective and policies, risk considerations, charges and expenses of any investment carefully. Where applicable, be sure to obtain a prospectus, which contains this and other relevant information. To obtain a prospectus, please contact your securities representative or Nuveen Investments, 333 W. Wacker Dr., Chicago, IL 60606. Please read the prospectus carefully before you invest or send money.
Learn more about Nuveen Funds at: www.nuveen.com/mf
Nuveen makes things e-simple.
It only takes a minute to sign up for e-Reports. Once enrolled, you’ll receive an e-mail as soon as your Nuveen Fund information is ready — no more waiting for delivery by regular mail. Just click on the link within the e-mail to see the report and save it on your computer if you wish.
Free e-Reports right to your e-mail!
www.investordelivery.com
If you receive your Nuveen Fund distributions and statements from your financial advisor or brokerage account.
OR
www.nuveen.com/accountaccess
If you receive your Nuveen Fund distributions and statements directly from Nuveen.
| | |
Distributed by Nuveen Securities, LLC 333 West Wacker Drive Chicago, IL 60606 www.nuveen.com | | |
MSA-NPREF-0311P
Item 2. Code of Ethics.
Not applicable to this filing.
Item 3. Audit Committee Financial Expert.
Not applicable to this filing.
Item 4. Principal Accountant Fees and Services.
Not applicable to this filing.
Item 5. Audit Committee of Listed Registrants.
Not applicable to this registrant.
Item 6. Schedule of Investments.
(a) See Portfolio of Investments in Item 1.
(b) Not applicable.
Item 7. Disclosure of Proxy Voting Policies and Procedures for Closed-End Management Investment Companies.
Not applicable to this registrant.
Item 8. Portfolio Managers of Closed-End Management Investment Companies.
Not applicable to this registrant.
Item 9. Purchases of Equity Securities by Closed-End Management Investment Company and Affiliated Purchasers.
Not applicable to this registrant.
Item 10. Submission of Matters to a Vote of Security Holders.
There have been no material changes to the procedures by which shareholders may recommend nominees to the registrant’s Board implemented after the registrant last provided disclosure in response to this item.
Item 11. Controls and Procedures.
| (a) | The registrant’s principal executive and principal financial officers, or persons performing similar functions, have concluded that the registrant’s disclosure controls and procedures (as defined in Rule 30a-3(c) under the Investment Company Act of 1940, as amended (the “1940 Act”) (17 CFR 270.30a-3(c))) are effective, as of a date within 90 days of the filing date of this report that includes the disclosure required by this paragraph, based on their evaluation of the controls and procedures required by Rule 30a-3(b) under the 1940 Act (17 CFR 270.30a-3(b)) and Rules 13a-15(b) or 15d-15(b) under the Securities Exchange Act of 1934, as amended (the “Exchange Act”) (17 CFR 240.13a-15(b) or 240.15d-15(b)). |
| (b) | There were no changes in the registrant’s internal control over financial reporting (as defined in Rule 30a-3(d) under the 1940 Act (17 CFR 270.30a-3(d)) that occurred during the second fiscal quarter of the period covered by this report that has materially affected, or is reasonably likely to materially affect, the registrant’s internal control over financial reporting. |
Item 12. Exhibits.
File the exhibits listed below as part of this Form.
(a)(1) Any code of ethics, or amendment thereto, that is the subject of the disclosure required by Item 2, to the extent that the registrant intends to satisfy the Item 2 requirements through filing of an exhibit: Not applicable to this filing.
(a)(2) A separate certification for each principal executive officer and principal financial officer of the registrant as required by Rule 30a-2(a) under the 1940 Act (17 CFR 270.30a-2(a)) in the exact form set forth below: See EX-99.CERT attached hereto.
(a)(3) Any written solicitation to purchase securities under Rule 23c-1 under the 1940 Act (17 CFR 270.23c-1) sent or given during the period covered by the report by or on behalf of the registrant to 10 or more persons: Not applicable to this registrant.
(b) If the report is filed under Section 13(a) or 15(d) of the Exchange Act, provide the certifications required by Rule 30a-2(b) under the 1940 Act (17 CFR 270.30a-2(b)), Rule 13a-14(b) or Rule 15d-14(b) under the Exchange Act (17 CFR 240.13a-14(b) or 240.15d-14(b)), and Section 1350 of Chapter 63 of Title 18 of the United States Code (18 U.S.C. 1350) as an Exhibit. A certification furnished pursuant to this paragraph will not be deemed “filed” for purposes of Section 18 of the Exchange Act (15 U.S.C. 78r), or otherwise subject to the liability of that section. Such certification will not be deemed to be incorporated by reference into any filing under the Securities Act of 1933 or the Exchange Act, except to the extent that the registration specifically incorporates it by reference: See EX-99.906 CERT attached hereto.
SIGNATURES
Pursuant to the requirements of the Securities Exchange Act of 1934 and the Investment Company Act of 1940, the registrant has duly caused this report to be signed on its behalf by the undersigned, thereunto duly authorized.
(Registrant) Nuveen Investment Trust V
| | | | | | |
| By | | (Signature and Title) | | /s/ Kevin J. McCarthy | | |
| | | | Kevin J. McCarthy Vice President and Secretary | | |
Date June 6, 2011
Pursuant to the requirements of the Securities Exchange Act of 1934 and the Investment Company Act of 1940, this report has been signed below by the following persons on behalf of the registrant and in the capacities and on the dates indicated.
| | | | | | |
| By | | (Signature and Title) | | /s/ Gifford R. Zimmerman | | |
| | | | Gifford R. Zimmerman Chief Administrative Officer (principal executive officer) | | |
Date June 6, 2011
| | | | | | |
| By | | (Signature and Title) | | /s/ Stephen D. Foy | | |
| | | | Stephen D. Foy Vice President and Controller (principal financial officer) | | |
Date June 6, 2011