| UNITED STATES | |||
| SECURITIES AND EXCHANGE COMMISSION | |||
| Washington, D.C. 20549 | |||
| FORM N-CSR | |||
| CERTIFIED SHAREHOLDER REPORT OF REGISTERED | |||
| MANAGEMENT INVESTMENT COMPANIES | |||
| Investment Company Act file number 811- 1677 | |||
| John Hancock Capital Series | |||
| (Exact name of registrant as specified in charter) | |||
| 601 Congress Street, Boston, Massachusetts 02210 | |||
| (Address of principal executive offices) (Zip code) | |||
| Alfred P. Ouellette | |||
| Senior Counsel and Assistant Secretary | |||
| 601 Congress Street | |||
| Boston, Massachusetts 02210 | |||
| (Name and address of agent for service) | |||
| Registrant's telephone number, including area code: | 617-663-4324 | ||
| Date of fiscal year end: | December 31 | ||
| Date of reporting period: | December 31, 2008 | ||
ITEM 1. REPORT TO SHAREHOLDERS.
Discussion of Fund performance
By Shay Assets Management, Inc.
Stock prices around the globe tumbled during the 12-month period ended December 31, 2008, hurt by the deepening credit crisis and the slowing global economy. For the 12 months ended December 31, 2008, John Hancock Large Cap Select Fund’s Class A shares posted a total return of –29.71% . That beat the –37.79% return of Morningstar, Inc.’s average large blend fund and the –37.00% return of the Standard & Poor’s 500 Index.
“Stock prices around the globe
tumbled during the 12-month
period ended December 31, 2008 ...”
Although it produced negative results, the Fund’s outperformance of the S&P 500 Index stemmed in large measure from advantageous sector allocations. The Fund had a signifi-cant underweighting in energy and materials stocks, which proved beneficial in the second half of the period when oil and commodity prices collapsed. In addition, our substantial overweighted exposure to consumer staples companies aided the Fund’s performance relative to the index in the second half because the group was one of the market’s best performers, even though it suffered losses for the year. Finally, we were helped by our below-index exposure to the beleaguered financial sector. In terms of individual stocks, aiding the Fund’s returns relative to the index was our comparatively large stake in Wal-Mart Stores, Inc. Among our limited holdings in the financials sector, Wells Fargo & Co., which acquired aili ng Wachovia Corp., held up comparatively well. Two more recent purchases made at very attractive valuations — Becton, Dickinson & Co. and United Technologies Corp. — also were among our best performers for the year.
Detracting most from performance were companies with significant exposure to the problems in the credit markets. We lost considerable ground by owning American International Group, Inc. (AIG), which we ultimately sold, and General Electric (GE). Elsewhere, UnitedHealth Group suffered early in the period in response to an increase in claims, a reduction in the number of participants it covered, a pullback in benefits coverage by its corporate customers and price competition. Microsoft’s stock price also came under pressure due to concerns regarding its potential acquisition of Yahoo and a growing competitive threat from Google.
This commentary reflects the views of the portfolio management team through the end of the Fund’s period discussed in this report. The managers’ statements reflect their own opinions. As such, they are in no way guarantees of future events and are not intended to be used as investment advice or a recommendation regarding any specific security. They are also subject to change at any time as market and other conditions warrant.
Sector investing is subject to greater risks than the market as a whole. Because the Fund may focus on particular sectors of the economy, its performance may depend on the performance of those sectors.
| 6 | Large Cap Select Fund | Annual report |
A look at performance
For the period ended December 31, 2008
| Average annual returns (%) | Cumulative total returns (%) | |||||||||
| with maximum sales charge (POP) | with maximum sales charge (POP) | |||||||||
| Inception | Since | Since | ||||||||
| Class | date | 1-year | 5-year | 10-year | inception | 1-year | 5-year | 10-year | inception | |
| A1 | 12-31-64 | –33.24 | –4.33 | –1.52 | — | –33.24 | –19.86 | –14.16 | — | |
| B | 8-25-03 | –33.68 | –4.40 | — | –2.30 | –33.68 | –20.13 | — | –11.72 | |
| C | 8-25-03 | –30.82 | –4.03 | — | –2.12 | –30.82 | –18.61 | — | –10.82 | |
| I2 | 8-25-03 | –29.42 | –2.95 | — | –1.02 | –29.42 | –13.92 | — | –5.32 | |
| R12 | 11-3-03 | –30.07 | –3.84 | — | –2.89 | –30.07 | –17.78 | — | –14.03 | |
Performance figures assume all distributions are reinvested. Public offering price (POP) figures reflect maximum sales charges on Class A shares of 5% and the applicable contingent deferred sales charge (CDSC) on Class B and Class C shares. The returns for Class C shares have been adjusted to reflect the elimination of the front-end sales charge effective July 15, 2004. The Class B shares’ CDSC declines annually between years 1 to 6 according to the following schedule: 5, 4, 3, 3, 2, 1%. No sales charge will be assessed after the sixth year. Class C shares held for less than one year are subject to a 1% CDSC. Sales charge is not applicable for Class I and Class R1 shares.
The expense ratios of the Fund, both net (including any fee waivers or expense limitations) and gross (excluding any fee waivers or expense limitations), are set forth according to the most recent publicly available prospectuses for the Fund and may differ from the expense ratios disclosed in the Financial Highlights tables in this report. The gross expenses are as follows: Class A — 1.45%, Class B — 2.20%, Class C — 2.20%, Class I — 1.06%, Class R1 — 2.05% .
The returns reflect past results and should not be considered indicative of future performance. The return and principal value of an investment will fluctuate so that shares, when redeemed, may be worth more or less than their original cost. Due to market volatility, the Fund’s current performance may be higher or lower than the performance shown. For current to the most recent month end performance data, please call 1-800-225-5291 or visit the Fund’s Web site at www.jhfunds.com.
The performance table above and the chart on the next page do not reflect the deduction of taxes that a shareholder would pay on fund distributions or the redemption of fund shares.
The Fund’s performance results reflect any applicable expense reductions, without which the expenses would increase and results would have been less favorable.
1 Effective August 22, 2003, shareholders of the former M.S.B. Fund, Inc. became owners of that number of full and fractional shares of Class A shares of John Hancock Large Cap Select Fund. Additionally, the accounting and performance history of the former M.S.B. Fund, Inc. was redesignated as that of Class A of John Hancock Large Cap Select Fund.
2 For certain types of investors as described in the Fund’s Class I and Class R1 share prospectuses.
| Annual report | Large Cap Select Fund | 7 |
A look at performance
Growth of $10,000
This chart shows what happened to a hypothetical $10,000 investment in Large Cap Select Fund Class A shares for the period indicated. For comparison, we’ve shown the same investment in the Standard & Poor’s 500 Index.

| With maximum | ||||
| Class | Period beginning | Without sales charge | sales charge | Index |
| B | 8-25-03 | $8,904 | $8,828 | $10,082 |
| C2 | 8-25-03 | 8,918 | 8,918 | 10,082 |
| I3 | 8-25-03 | 9,468 | 9,468 | 10,082 |
| R13 | 11-3-03 | 8,597 | 8,597 | 9,431 |
Assuming all distributions were reinvested for the period indicated, the table above shows the value of a $10,000 investment in the Fund’s Class B, Class C, Class I and Class R1 shares, respectively, as of December 31, 2008. The Class C shares investment with maximum sales charge has been adjusted to reflect the elimination of the front-end sales charge effective July 15, 2004. Performance of the classes will vary based on the difference in sales charges paid by shareholders investing in the different classes and the fee structure of those classes.
Standard & Poor’s 500 Index is an unmanaged index that includes 500 widely traded common stocks.
It is not possible to invest directly in an index. Index figures do not reflect sales charges, which would have resulted in lower values if they did.
1 NAV represents net asset value, and POP represents public offering price.
2 No contingent deferred sales charge applicable.
3 For certain types of investors as described in the Fund’s Class I and Class R1 share prospectuses.
| 8 | Large Cap Select Fund | Annual report |
Your expenses
These examples are intended to help you understand your ongoing operating expenses.
Understanding fund expenses
As a shareholder of the Fund, you incur two types of costs:
▪ Transaction costs which include sales charges (loads) on purchases or redemptions (varies by share class), minimum account fee charge, etc.
▪ Ongoing operating expenses including management fees, distribution and service fees (if applicable), and other fund expenses.
We are going to present only your ongoing operating expenses here.
Actual expenses/actual returns
This example is intended to provide information about your fund’s actual ongoing operating expenses, and is based on your fund’s actual return. It assumes an account value of $1,000.00 on July 1, 2008 with the same investment held until December 31, 2008.
| Account value | Ending value | Expenses paid during | |
| on 7-1-08 | on 12-31-08 | period ended 12-31-081 | |
| Class A | $1,000.00 | $815.10 | $8.94 |
| Class B | 1,000.00 | 811.60 | 12.34 |
| Class C | 1,000.00 | 812.40 | 12.30 |
| Class I | 1,000.00 | 816.70 | 7.08 |
| Class R1 | 1,000.00 | 812.60 | 11.12 |
Together with the value of your account, you may use this information to estimate the operating expenses that you paid over the period. Simply divide your account value at December 31, 2008, by $1,000.00, then multiply it by the “expenses paid” for your share class from the table above. For example, for an account value of $8,600.00, the operating expenses should be calculated as follows:

| Annual report | Large Cap Select Fund | 9 |
Your expenses
Hypothetical example for comparison purposes
This table allows you to compare your fund’s ongoing operating expenses with those of any other fund. It provides an example of the Fund’s hypothetical account values and hypothetical expenses based on each class’s actual expense ratio and an assumed 5% annualized return before expenses (which is not your fund’s actual return). It assumes an account value of $1,000.00 on July 1, 2008, with the same investment held until December 31, 2008. Look in any other fund shareholder report to find its hypothetical example and you will be able to compare these expenses.
| Account value | Ending value | Expenses paid during | |
| on 7-1-08 | on 12-31-08 | period ended 12-31-081 | |
| Class A | $1,000.00 | $1,015.30 | $9.93 |
| Class B | 1,000.00 | 1,011.50 | 13.70 |
| Class C | 1,000.00 | 1,011.60 | 13.65 |
| Class I | 1,000.00 | 1,017.30 | 7.86 |
| Class R1 | 1,000.00 | 1,012.90 | 12.35 |
Remember, these examples do not include any transaction costs, such as sales charges; therefore, these examples will not help you to determine the relative total costs of owning different funds. If transaction costs were included, your expenses would have been higher. See the prospectus for details regarding transaction costs.
1 Expenses are equal to the Fund’s annualized expense ratio of 1.96%, 2.71%, 2.70%, 1.55% and 2.44% for Class A, Class B, Class C, Class I and Class R1, respectively, multiplied by the average account value over the period, multiplied by 184/366 (to reflect the one-half year period).
| 10 | Large Cap Select Fund | Annual report |
Portfolio summary
| Top 10 holdings1 | ||||
| Johnson & Johnson | 4.9% | Automatic Data Processing, Inc. | 4.4% | |
| Wal-Mart Stores, Inc. | 4.9% | Wells Fargo & Co. | 4.3% | |
| Coca-Cola Co. | 4.6% | PepsiCo, Inc. | 4.2% | |
| Procter & Gamble Co. | 4.5% | International Business Machines Corp. | 4.1% | |
| Berkshire Hathaway, Inc. (Class A) | 4.4% | Exxon Mobil Corp. | 4.1% | |
| Sector distribution1,2 | ||||
| Consumer staples | 21% | Financials | 11% | |
| Information technology | 17% | Consumer discretionary | 10% | |
| Health care | 16% | Energy | 4% | |
| Industrials | 15% | Short-term investments & other | 6% | |
1 As a percentage of net assets on December 31, 2008.
2 Sector investing is subject to greater risks than the market as a whole. Because the Fund may focus on particular sectors of the economy, its performance may depend on the performance of those sectors.
| Annual report | Large Cap Select Fund | 11 |
F I N A N C I A L S T A T E M E N T S
Fund’s investments
Securities owned by the Fund on 12-31-08
| Issuer | Shares | Value |
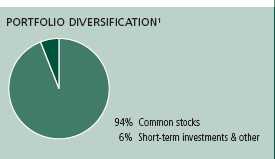
| Common stocks 94.24% | $38,992,990 | |
| (Cost $38,560,554) | ||
| Advertising 2.28% | 942,200 | |
| Omnicom Group, Inc. | 35,000 | 942,200 |
| Aerospace & Defense 3.24% | 1,340,000 | |
| United Technologies Corp. | 25,000 | 1,340,000 |
| Air Freight & Logistics 2.93% | 1,213,520 | |
| United Parcel Service, Inc. (Class B) | 22,000 | 1,213,520 |
| Communications Equipment 2.95% | 1,222,500 | |
| Cisco Systems, Inc. (I) | 75,000 | 1,222,500 |
| Computer Hardware 5.68% | 2,348,800 | |
| Dell, Inc. (I) | 65,000 | 665,600 |
| International Business Machines Corp. | 20,000 | 1,683,200 |
| Consumer Finance 2.24% | 927,500 | |
| American Express Co. | 50,000 | 927,500 |
| Data Processing & Outsourced Services 4.37% | 1,809,640 | |
| Automatic Data Processing, Inc. | 46,000 | 1,809,640 |
| Diversified Banks 4.27% | 1,768,800 | |
| Wells Fargo & Co. | 60,000 | 1,768,800 |
| Food Distributors 3.05% | 1,261,700 | |
| SYSCO Corp. | 55,000 | 1,261,700 |
| Health Care Equipment 4.57% | 1,888,960 | |
| Becton, Dickinson & Co. | 12,000 | 820,680 |
| Medtronic, Inc. | 34,000 | 1,068,280 |
| Home Improvement Retail 3.12% | 1,289,120 | |
| Home Depot, Inc. | 56,000 | 1,289,120 |
| Household Products 4.48% | 1,854,600 | |
| Procter & Gamble Co. | 30,000 | 1,854,600 |
| Hypermarkets & Super Centers 4.88% | 2,018,160 | |
| Wal-Mart Stores, Inc. | 36,000 | 2,018,160 |
| Industrial Conglomerates 6.92% | 2,864,100 | |
| 3M Co. | 25,000 | 1,438,500 |
| General Electric Co. | 88,000 | 1,425,600 |
| Industrial Machinery 2.71% | 1,121,600 | |
| Illinois Tool Works, Inc. | 32,000 | 1,121,600 |
| Integrated Oil & Gas 4.05% | 1,676,430 | |
| Exxon Mobil Corp. | 21,000 | 1,676,430 |
See notes to financial statements
| 12 | Large Cap Select Fund | Annual report |
F I N A N C I A L S T A T E M E N T S
| Issuer | Shares | Value | ||
| Managed Health Care 2.96% | $1,223,600 | |||
| UnitedHealth Group, Inc. | 46,000 | 1,223,600 | ||
| Motorcycle Manufacturers 1.60% | 661,830 | |||
| Harley-Davidson, Inc. | 39,000 | 661,830 | ||
| Pharmaceuticals 8.14% | 3,368,470 | |||
| Abbott Laboratories | 25,000 | 1,334,250 | ||
| Johnson & Johnson | 34,000 | 2,034,220 | ||
| Property & Casualty Insurance 4.44% | 1,835,400 | |||
| Berkshire Hathaway, Inc. (Class A) | 19 | 1,835,400 | ||
| Soft Drinks 8.83% | 3,653,980 | |||
| Coca-Cola Co. | 42,000 | 1,901,340 | ||
| PepsiCo, Inc. | 32,000 | 1,752,640 | ||
| Specialty Stores 2.77% | 1,146,880 | |||
| Staples, Inc. | 64,000 | 1,146,880 | ||
| Systems Software 3.76% | 1,555,200 | |||
| Microsoft Corp. | 80,000 | 1,555,200 | ||
| Interest | Maturity | Par value | ||
| Issuer, description | rate | date | (000) | Value |
| Short-term investments 3.24% | $1,339,213 | |||
| (Cost $1,338,892) | ||||
| U.S. Government Agency 3.24% | 1,339,213 | |||
| U.S. Treasury Bill, | ||||
| Discount Note | Zero | 06-11-09 | $1,340 | 1,339,213 |
| Total investments (Cost $39,899,446)† 97.48% | $40,332,203 | |||
| Other assets and liabilities, net 2.52% | $1,044,334 | |||
| Total net assets 100.00% | $41,376,537 | |||
The percentage shown for each investment category is the total value of that category as a percentage of the net assets of the Fund.
(I) Non-income producing security.
† At December 31, 2008, the aggregate cost of investment securities for federal income tax purposes was $39,899,446. Net unrealized appreciation aggregated $432,757, of which $8,335,185 related to appreciated investment securities and $7,902,428 related to depreciated investment securities.
See notes to financial statements
| Annual report | Large Cap Select Fund | 13 |
F I N A N C I A L S T A T E M E N T S
Financial statements
Statement of assets and liabilities 12-31-08
This Statement of Assets and Liabilities is the Fund’s balance sheet. It shows the value of what the Fund owns, is due and owes. You’ll also find the net asset value and the maximum offering price per share.
| Assets | |
| Investments at value (Cost $39,899,446) | $40,332,203 |
| Cash | 1,034,280 |
| Receivable for shares sold | 210,762 |
| Dividends receivable | 103,315 |
| Receivable from affiliates | 1,480 |
| Total assets | 41,682,040 |
| Liabilities | |
| Payable for shares repurchased | 149,756 |
| Payable to affiliates | |
| Management fees | 25,660 |
| Distribution and service fees | 10,862 |
| Other | 27,195 |
| Other payables and accrued expenses | 92,030 |
| Total liabilities | 305,503 |
| Net assets | |
| Capital paid-in | 41,730,275 |
| Accumulated net realized loss on investments | (784,948) |
| Net unrealized appreciation of investments | 432,757 |
| Distribution in excess of net investment income | (1,547) |
| Net assets | $41,376,537 |
| Net asset value per share | |
| Based on net asset values and shares outstanding — the Fund has an | |
| unlimited number of shares authorized with no par value | |
| Class A ($33,433,795 ÷ 2,649,661 shares) | $12.62 |
| Class B ($2,338,171 ÷ 188,727 shares)1 | $12.39 |
| Class C ($2,756,453 ÷ 222,197 shares)1 | $12.41 |
| Class I ($2,707,183 ÷ 214,591 shares) | $12.62 |
| Class R1 ($140,935 ÷ 11,248 shares) | $12.53 |
| Maximum offering price per share | |
| Class A ($12.62 ÷ 95.0%)2 | $13.28 |
1 Redemption price is equal to net asset value less any applicable contingent deferred sales charge.
2 On single retail sales of less than $50,000. On sales of $50,000 or more and on group sales the offering price is reduced.
See notes to financial statements
| 14 | Large Cap Select Fund | Annual report |
F I N A N C I A L S T A T E M E N T S
Statement of operations For the year ended 12-31-08
This Statement of Operations summarizes the Fund’s investment income earned and expenses incurred in operating the Fund. It also shows net gains (losses) for the period stated.
| Investment income | |
| Dividends | $1,063,905 |
| Interest | 28,581 |
| Securities lending | 3,354 |
| Income from affiliated issuers | 2,123 |
| Total investment income | 1,097,963 |
| Expenses | |
| Investment management fees (Note 5) | 369,067 |
| Distribution and service fees (Note 5) | 153,885 |
| Transfer agent fees (Note 5) | 100,140 |
| Accounting and legal services fees (Note 5) | 6,145 |
| Registration fees | 92,677 |
| Printing fees | 51,086 |
| Professional fees | 44,399 |
| Custodian fees | 27,164 |
| Trustees’ fees | 6,692 |
| Miscellaneous | 26,341 |
| Total expenses | 877,596 |
| Less expense reductions (Note 5) | (28,459) |
| Net expenses | 849,137 |
| Net investment income | 248,826 |
| Realized and unrealized gain (loss) | |
| Net realized loss on investments | (784,948) |
| Change in net unrealized depreciation of investments | (16,219,165) |
| Net realized and unrealized loss | (17,004,113) |
| Decrease in net assets from operations | ($16,755,287) |
See notes to financial statements
| Annual report | Large Cap Select Fund | 15 |
F I N A N C I A L S T A T E M E N T S
Statements of changes in net assets
These Statements of Changes in Net Assets show how the value of the Fund’s net assets has changed during the last two periods. The difference reflects earnings less expenses, any investment gains and losses, distributions, if any, paid to shareholders and the net of Fund share transactions.
| Year | Year | |
| ended | ended | |
| 12-31-07 | 12-31-08 | |
| Increase (decrease) in net assets | ||
| From operations | ||
| Net investment income | $275,430 | $248,826 |
| Net realized gain (loss) | 4,309,028 | (784,948) |
| Change in net unrealized appreciation (depreciation) | (3,083,140) | (16,219,165) |
| Increase (decrease) in net assets resulting from operations | 1,501,318 | (16,755,287) |
| Distributions to shareholders | ||
| From net investment income | ||
| Class A | (246,296) | (228,601) |
| Class B | — | (1,765) |
| Class C | — | (1,855) |
| Class I | (25,100) | (28,427) |
| Class R1 | — | (381) |
| From net realized gain | ||
| Class A | (3,149,359) | (392,566) |
| Class B | (198,731) | (28,703) |
| Class C | (127,251) | (30,170) |
| Class I | (176,085) | (31,768) |
| Class R1 | (13,024) | (1,723) |
| From tax return of capital | ||
| Class A | — | (117,487) |
| Class B | — | (907) |
| Class C | — | (953) |
| Class I | — | (14,610) |
| Class R1 | — | (196) |
| (3,935,846) | (880,112) | |
| From Fund share transactions (Note 6) | (7,128,043) | (1,507,911) |
| Total decrease | (9,562,571) | (19,143,310) |
| Net assets | ||
| Beginning of year | 70,082,418 | 60,519,847 |
| End of year1 | $60,519,847 | $41,376,537 |
1 Includes accumulated (distribution in excess of) net investment income of $10,678 and ($1,547), respectively.
See notes to financial statements
| 16 | Large Cap Select Fund | Annual report |
F I N A N C I A L S T A T E M E N T S
Financial highlights
The Financial Highlights show how the Fund’s net asset value for a share has changed since the end of the previous period.
| CLASS A SHARES | |||||
| Period ended | 12-31-04 | 12-31-05 | 12-31-06 | 12-31-07 | 12-31-08 |
| Per share operating performance | |||||
| Net asset value, beginning of year | $17.80 | $18.44 | $17.60 | $19.20 | $18.38 |
| Net investment income1 | 0.08 | 0.05 | 0.08 | 0.09 | 0.09 |
| Net realized and unrealized gain | |||||
| (loss) on investments | 0.84 | (0.48) | 2.46 | 0.36 | (5.56) |
| Total from investment operations | 0.92 | (0.43) | 2.54 | 0.45 | (5.47) |
| Less distributions | |||||
| From net investment income | (0.07) | (0.04) | (0.08) | (0.09) | (0.09) |
| From net realized gain | (0.21) | (0.37) | (0.86) | (1.18) | (0.15) |
| From tax return of capital | — | — | — | — | (0.05) |
| Total distributions | (0.28) | (0.41) | (0.94) | (1.27) | (0.29) |
| Net asset value, end of year | $18.44 | $17.60 | $19.20 | $18.38 | $12.62 |
| Total return (%)2,3 | 5.17 | (2.38) | 14.37 | 2.24 | (29.71) |
| Ratios and supplemental data | |||||
| Net assets, end of year (in millions) | $65 | $58 | $60 | $52 | $33 |
| Ratios (as a percentage | |||||
| of average net assets): | |||||
| Expenses before reductions | 1.44 | 1.47 | 1.48 | 1.45 | 1.73 |
| Expenses net of all fee waivers | 1.34 | 1.36 | 1.35 | 1.34 | 1.67 |
| Expenses net of all fee waivers | |||||
| and credits | 1.34 | 1.36 | 1.35 | 1.34 | 1.67 |
| Net investment income | 0.45 | 0.26 | 0.46 | 0.48 | 0.56 |
| Portfolio turnover (%) | 13 | 23 | 12 | 12 | 17 |
1 Based on the average of the shares outstanding.
2 Assumes dividend reinvestment and does not reflect the effect of sales charges.
3 Total returns would have been lower had certain expenses not been reduced during the periods shown.
See notes to financial statements
| Annual report | Large Cap Select Fund | 17 |
F I N A N C I A L S T A T E M E N T S
Financial highlights
| CLASS B SHARES | |||||
| Period ended | 12-31-04 | 12-31-05 | 12-31-06 | 12-31-07 | 12-31-08 |
| Per share operating performance | |||||
| Net asset value, beginning of year | $17.76 | $18.33 | $17.39 | $18.89 | $18.01 |
| Net investment loss1 | (0.03) | (0.09) | (0.05) | (0.05) | (0.03) |
| Net realized and unrealized gain | |||||
| (loss) on investments | 0.81 | (0.48) | 2.41 | 0.35 | (5.43) |
| Total from investment operations | 0.78 | (0.57) | 2.36 | 0.30 | (5.46) |
| Less distributions | |||||
| From net investment income | — | — | — | — | (0.01) |
| From net realized gain | (0.21) | (0.37) | (0.86) | (1.18) | (0.15) |
| From tax return of capital | — | — | — | — | (0.00)2 |
| Total distributions | (0.21) | (0.37) | (0.86) | (1.18) | (0.16) |
| Net asset value, end of year | $18.33 | $17.39 | $18.89 | $18.01 | $12.39 |
| Total return (%)3,4 | 4.40 | (3.14) | 13.52 | 1.48 | (30.24) |
| Ratios and supplemental data | |||||
| Net assets, end of year (in millions) | $6 | $5 | $4 | $3 | $2 |
| Ratios (as a percentage | |||||
| of average net assets): | |||||
| Expenses before reductions | 2.19 | 2.22 | 2.23 | 2.20 | 2.48 |
| Expenses net of all fee waivers | 2.09 | 2.11 | 2.10 | 2.09 | 2.43 |
| Expenses net of all fee waivers | |||||
| and credits | 2.09 | 2.11 | 2.10 | 2.09 | 2.42 |
| Net investment loss | (0.18) | (0.50) | (0.29) | (0.27) | (0.19) |
| Portfolio turnover (%) | 13 | 23 | 12 | 12 | 17 |
1 Based on the average of the shares outstanding.
2 Less than $0.01 per share.
3 Assumes dividend reinvestment and does not reflect the effect of sales charges.
4 Total returns would have been lower had certain expenses not been reduced during the periods shown.
See notes to financial statements
| 18 | Large Cap Select Fund | Annual report |
F I N A N C I A L S T A T E M E N T S
Financial highlights
| CLASS C SHARES | |||||
| Period ended | 12-31-04 | 12-31-05 | 12-31-06 | 12-31-07 | 12-31-08 |
| Per share operating performance | |||||
| Net asset value, beginning of year | $17.76 | $17.76 | $17.39 | $18.89 | $18.01 |
| Net investment income (loss)1 | —2 | (0.09) | (0.05) | (0.05) | (0.02) |
| Net realized and unrealized gain | |||||
| (loss) on investments | 0.78 | (0.48) | 2.41 | 0.35 | (5.42) |
| Total from investment operations | 0.78 | (0.57) | 2.36 | 0.30 | (5.44) |
| Less distributions | |||||
| From net investment income | — | — | — | — | (0.01) |
| From net realized gain | (0.21) | (0.37) | (0.86) | (1.18) | (0.15) |
| From tax return of capital | — | — | — | — | (0.00)2 |
| Total distributions | (0.21) | (0.37) | (0.86) | (1.18) | (0.16) |
| Net asset value, end of year | $18.33 | $17.39 | $18.89 | $18.01 | $12.41 |
| Total return (%)3,4 | 4.40 | (3.14) | 13.52 | 1.48 | (30.13) |
| Ratios and supplemental data | |||||
| Net assets, end of year (in millions) | $6 | $7 | $3 | $2 | $3 |
| Ratios (as a percentage | |||||
| of average net assets): | |||||
| Expenses before reductions | 2.19 | 2.22 | 2.23 | 2.20 | 2.48 |
| Expenses net of all fee waivers | 2.09 | 2.11 | 2.10 | 2.09 | 2.46 |
| Expenses net of all fee waivers | |||||
| and credits | 2.09 | 2.11 | 2.10 | 2.09 | 2.46 |
| Net investment loss | (0.01) | (0.49) | (0.30) | (0.27) | (0.16) |
| Portfolio turnover (%) | 13 | 23 | 12 | 12 | 17 |
1 Based on the average of the shares outstanding.
2 Less than $0.01 per share.
3 Assumes dividend reinvestment and does not reflect the effect of sales charges.
4 Total returns would have been lower had certain expenses not been reduced during the periods shown.
See notes to financial statements
| Annual report | Large Cap Select Fund | 19 |
F I N A N C I A L S T A T E M E N T S
Financial highlights
| CLASS I SHARES | |||||
| Period ended | 12-31-04 | 12-31-05 | 12-31-06 | 12-31-07 | 12-31-08 |
| Per share operating performance | |||||
| Net asset value, beginning of year | $17.83 | $18.46 | $17.62 | $19.23 | $18.41 |
| Net investment income1 | 0.15 | 0.12 | 0.16 | 0.17 | 0.16 |
| Net realized and unrealized gain | |||||
| (loss) on investments | 0.84 | (0.48) | 2.47 | 0.36 | (5.59) |
| Total from investment operations | 0.99 | (0.36) | 2.63 | 0.53 | (5.43) |
| Less distributions | |||||
| From net investment income | (0.15) | (0.11) | (0.16) | (0.17) | (0.14) |
| From net realized gain | (0.21) | (0.37) | (0.86) | (1.18) | (0.15) |
| From tax return of capital | — | — | — | — | (0.07) |
| Total distributions | (0.36) | (0.48) | (1.02) | (1.35) | (0.36) |
| Net asset value, end of year | $18.46 | $17.62 | $19.23 | $18.41 | $12.62 |
| Total return (%)2,3 | 5.54 | (1.98) | 14.87 | 2.63 | (29.42) |
| Ratios and supplemental data | |||||
| Net assets, end of year (in millions) | $3 | $3 | $3 | $3 | $3 |
| Ratios (as a percentage | |||||
| of average net assets): | |||||
| Expenses before reductions | 1.05 | 1.06 | 1.08 | 1.06 | 1.32 |
| Expenses net of all fee waivers | 0.95 | 0.95 | 0.95 | 0.95 | 1.27 |
| Expenses net of all fee waivers | |||||
| and credits | 0.95 | 0.95 | 0.95 | 0.95 | 1.27 |
| Net investment income | 0.83 | 0.67 | 0.85 | 0.86 | 1.00 |
| Portfolio turnover (%) | 13 | 23 | 12 | 12 | 17 |
1 Based on the average of the shares outstanding.
2 Assumes dividend reinvestment and does not reflect the effect of sales charges.
3 Total returns would have been lower had certain expenses not been reduced during the periods shown.
See notes to financial statements
| 20 | Large Cap Select Fund | Annual report |
F I N A N C I A L S T A T E M E N T S
Financial highlights
| CLASS R1 SHARES | |||||
| Period ended | 12-31-04 | 12-31-05 | 12-31-06 | 12-31-07 | 12-31-08 |
| Per share operating performance | |||||
| Net asset value, beginning of year | $17.79 | $18.45 | $17.54 | $19.07 | $18.22 |
| Net investment income (loss)1 | 0.07 | (0.06) | (0.05) | (0.03) | 0.01 |
| Net realized and unrealized gain | |||||
| (loss) on investments | 0.81 | (0.48) | 2.44 | 0.36 | (5.50) |
| Total from investment operations | 0.88 | (0.54) | 2.39 | 0.33 | (5.49) |
| Less distributions | |||||
| From net investment income | (0.01) | — | — | — | (0.03) |
| From net realized gain | (0.21) | (0.37) | (0.86) | (1.18) | (0.15) |
| From tax return of capital | — | — | — | — | (0.02) |
| Total distributions | (0.22) | (0.37) | (0.86) | (1.18) | (0.20) |
| Net asset value, end of year | $18.45 | $17.54 | $19.07 | $18.22 | $12.53 |
| Total return (%)2,3 | 4.98 | (2.96) | 13.58 | 1.61 | (30.07) |
| Ratios and supplemental data | |||||
| Net assets, end of year (in millions)4 | — | — | — | — | — |
| Ratios (as a percentage | |||||
| of average net assets): | |||||
| Expenses before reductions | 1.54 | 2.09 | 2.22 | 2.05 | 2.24 |
| Expenses net of all fee waivers | 1.44 | 1.98 | 2.09 | 1.94 | 2.09 |
| Expenses net of all fee waivers | |||||
| and credits | 1.44 | 1.98 | 2.09 | 1.94 | 2.09 |
| Net investment income | 0.40 | (0.36) | (0.28) | (0.13) | 0.06 |
| Portfolio turnover (%) | 13 | 23 | 12 | 12 | 17 |
1 Based on the average of the shares outstanding.
2 Assumes dividend reinvestment and does not reflect the effect of sales charges.
3 Total returns would have been lower had certain expenses not been reduced during the periods shown.
4 Less than $500,000.
See notes to financial statements
| Annual report | Large Cap Select Fund | 21 |
Notes to financial statements
Note 1
Organization
John Hancock Large Cap Select Fund (the Fund) is a diversified series of John Hancock Capital Series (the Trust), an open-end management investment company registered under the Investment Company Act of 1940, as amended (the 1940 Act). The investment objective of the Fund is to seek long-term capital appreciation.
The Trustees have authorized the issuance of multiple classes of shares of the Fund, designated as Class A, Class B, Class C, Class I and Class R1 shares. The shares of each class represent an interest in the same portfolio of investments of the Fund and have equal rights as to voting, redemptions, dividends and liquidation, except that certain expenses, subject to the approval of the Trustees, may be applied differently to each class of shares in accordance with current regulations of the Securities and Exchange Commission (SEC) and the Internal Revenue Service. Shareholders of a class that bears distribution and service expenses under the terms of a distribution plan have exclusive voting rights to that distribution plan. Class B shares will convert to Class A shares eight years after purchase.
Note 2
Significant accounting policies
The financial statements have been prepared in conformity with accounting principles generally accepted in the United States of America, which require management to make certain estimates and assumptions at the date of the financial statements. Actual results could differ from those estimates. The following summarizes the significant accounting policies of the Fund:
Security valuation
Investments are stated at value as of the close of the regular trading on New York Stock Exchange (NYSE), normally at 4:00 P.M., Eastern Time. Equity securities held by the Fund are valued at the last sale price or official closing price (closing bid price or last evaluated price if no sale has occurred) as of the close of business on the principal securities exchange (domestic or foreign) on which they trade. Debt obligations are valued based on the evaluated prices provided by an independent pricing service, which utilizes both dealer-supplied and electronic data processing techniques, which take into account factors such as institutional-size trading in similar groups of securities, yield, quality, coupon rate, maturity, type of issue, trading characteristics and other market data. Foreign securities and currencies are valued in U.S. dollars, based on foreign currency exchange rates supplied by an independent pricing service. Securities traded only in the over-the-counter market are valued at the last bid price quoted by brokers making markets in the securities at the close of trading. Equity and debt obligations, for which there are no prices available from an independent pricing service, are value based on broker quotes or fair valued as described below. Short-term debt investments that have a remaining maturity of 60 days or less are valued at amortized cost, and thereafter assume a constant amortization to maturity of any discount or premium, which approximates market value. Investments in John Hancock Cash Investment Trust (JHCIT), an affiliate of John Hancock Advisers, LLC (the Adviser), a wholly owned subsidiary of John Hancock Financial Services, Inc., a subsidiary of Manulife Financial Corporation (MFC), are valued at their net asset value each business day.
Other assets and securities for which no such quotations are readily available are valued at fair value as determined in good faith under consistently applied procedures established by and under the general supervision of the Board of Trustees. Generally, trading in non-U.S. securities is substantially completed each day at various times prior to the close
| 22 | Large Cap Select Fund | Annual report |
of trading on the NYSE. The values of such securities used in computing the net asset value of the Fund’s shares are generally determined as of such times. Occasionally, significant events that affect the values of such securities may occur between the times at which such values are generally determined and the close of the NYSE. Upon such an occurrence, these securities will be valued at fair value as determined in good faith under consistently applied procedures established by and under the general supervision of the Board of Trustees.
Valuations change in response to many factors including the historical and prospective earnings of the issuer, the value of the issuer’s assets, general economic conditions, interest rates, investor perceptions and market liquidity.
The Fund adopted Statement of Financial Accounting Standards No. 157 (FAS 157), Fair Value Measurements, effective with the beginning of the Fund’s fiscal year. FAS 157 established a three-tier hierarchy to prioritize the assumptions, referred to as inputs, used in valuation techniques to measure fair value. The three-tier hierarchy of inputs is summarized in the three broad levels listed below:
Level 1 — Quoted prices in active markets for identical securities.
Level 2 — Prices determined using other significant observable inputs. Observable inputs are inputs that other market participants would use in pricing a security. These may include quoted prices for similar securities, interest rates, prepayment speeds, credit risk and others.
Level 3 — Prices determined using significant unobservable inputs. In situations where quoted prices or observable inputs are unavailable, such as when there is little or no market activity for an investment, unobservable inputs may be used. Unobservable inputs reflect the Fund’s own assumptions about the factors that market participants would use in pricing an investment and would be based on the best information available.
The inputs or methodology used for valuing securities are not necessarily an indication of the risk associated with investing in those securities.
The following is a summary of the inputs used to value the Fund’s net assets as of December 31, 2008:
| INVESTMENTS IN | OTHER FINANCIAL | |
| VALUATION INPUTS | SECURITIES | INSTRUMENTS* |
| Level 1 — Quoted Prices | $38,992,990 | — |
| Level 2 — Other Significant Observable Inputs | 1,339,213 | — |
| Level 3 — Significant Unobservable Inputs | — | — |
| Total | $40,332,203 | — |
| *Other financial instruments are derivative instruments not reflected in the Portfolio of Investments, such as futures, forwards and swap contracts, which are valued at the unrealized appreciation/depreciation | ||
| on the instrument. | ||
Joint repurchase agreement
Pursuant to an exemptive order issued by the SEC, the Fund, along with other registered investment companies having a management contract with John Hancock Advisers, LLC (the Adviser), a wholly owned subsidiary of John Hancock Financial Services, Inc., a subsidiary of Manulife Financial Corporation (MFC, may participate in a joint repurchase agreement transaction. Aggregate cash balances are invested in one or more large repurchase agreements, whose underlying securities are obligations of the U.S. government and/or its agencies. The Fund’s custodian bank receives delivery of the underlying securities for the joint account on the Fund’s behalf. When a Fund enters into a repurchase agreement, it receives delivery of collateral, the amount of which at the time of purchase and each subsequent business day is required to be maintained at such a level that the value is generally 102% of the repurchase amount.
| Annual report | Large Cap Select Fund | 23 |
Security transactions and related
investment income
Investment security transactions are accounted for on a trade date plus one basis for daily net asset value calculations. However, for financial reporting purposes, investment transactions are reported on trade date. Interest income is accrued as earned. Dividend income and distributions to shareholders are recorded on the ex-dividend date. Foreign dividends are recorded on the ex-date or when the Portfolio becomes aware of the dividends from cash collections. Discounts/premiums are accreted/ amortized for financial reporting purposes. Non-cash dividends are recorded at the fair market value of the securities received. Debt obligations may be placed in a non-accrual status and related interest income may be reduced by ceasing current accruals and writing off interest receivables when the collection of all or a portion of interest has become doubtful, based upon consistently applied procedures. The Portfolios use identified cost method for determining realized gain or los s on investments for both financial statement and federal income tax reporting purposes.
Securities lending
The Fund may lend portfolio securities from time to time in order to earn additional income. The Fund retains beneficial ownership of the securities it has loaned and continues to receive interest and dividends paid by the issuer of securities and to participate in any changes in their value. On the settlement date of the loan, the Fund receives cash collateral against the loaned securities and maintains the cash collateral in an amount not less than 100% of the market value of the loaned securities during the period of the loan. The market value of the loaned securities is determined at the close of business of the Fund and any additional required cash collateral is delivered to the Fund on the next business day or returned to the borrower if overcollateralized. Cash collateral received is invested in the JHCIT. If the borrower is unable to return the securities loaned upon sale of security or other fund instructions because of insolvency or other reasons, a fund could experience delays and costs in recovering the securities loaned or in gaining access to the collateral and could prevent the Fund from voting on proxy statements. The Fund receives compensation for lending its securities either in the form of fees, guarantees, and/or by retaining a portion of interest on the investment of any cash received as collateral.
The Fund has entered into an agreement with Morgan Stanley & Co., Inc. and MS Securities Services, Inc. (collectively, Morgan Stanley) which permits the Fund to lend securities to Morgan Stanley on a principal basis. Morgan Stanley is the primary borrower of securities of the Fund. The risk of having one primary borrower of Fund securities (as opposed to several borrowers in an agency relationship) is that should Morgan Stanley fail financially, all securities lent may be affected by the failure and by any delays in recovery of the securities (or loss of rights in the collateral).
Bank borrowings
The Fund is permitted to have bank borrowings for temporary or emergency purposes, including the meeting of redemption requests that otherwise might require the untimely disposition of securities. The Fund has entered into a line of credit agreement with The Bank of New York Mellon (BNYM), the Swing Line Lender and Administrative Agent. This agreement enables the Fund to participate, with other funds managed by the Adviser, in an unsecured line of credit with BNYM, which permits borrowings of up to $150 million, collectively. Interest is charged to each fund based on its borrowing. In addition, a commitment fee is charged to each fund based on the average daily unused portion of the line of credit and is allocated among the participating funds. The Fund had no outstanding borrowings under the line of credit for the year ended December 31, 2008.
Pursuant to the custodian agreement, the Custodian may, in its discretion, advance funds to the Fund to make properly authorized payments. When such payments result in an overdraft, the Fund is obligated to repay the Custodian for any overdraft together with interest due thereon. The Custodian has a lien, security interest or security entitlement in any Fund property, that is not segregated, to the maximum extent permitted by law to the extent of any overdraft.
| 24 | Large Cap Select Fund | Annual report |
Expenses
The majority of expenses are directly identifiable to an individual fund. Trust expenses that are not readily identifiable to a specific fund are allocated in such a manner as deemed equitable, taking into consideration, among other things, the nature and type of expense and the relative size of the funds. Expense estimates are accrued in the period to which they relate and adjustments are made when actual amounts are known.
Class allocations
Income, common expenses and realized and unrealized gains (losses) are determined at the fund level and allocated daily to each class of shares based on the appropriate net asset value of the respective classes. Distribution and service fees, if any, and transfer agent fees for Class A, Class B, Class C, Class I and Class R1 shares are calculated daily at the class level based on the appropriate net asset value of each class and the specific expense rate(s) applicable to each class.
Federal income taxes
The Fund qualifies as a regulated investment company by complying with the applicable provisions of the Internal Revenue Code and will not be subject to federal income tax on taxable income that is distributed to shareholders. Therefore, no federal income tax provision is required.
For federal income tax purposes, the Fund has $784,948 of a capital loss carryforward available, to the extent provided by regulations, to offset future net realized capital gains. To the extent that such carryforward is used by the Fund, no capital gain distributions will be made. The loss carryforwards expire as follows: December 31, 2016 — $784,948.
As of December 31, 2008, the Fund had no uncertain tax positions that would require financial statement recognition, de-recognition, or disclosure. Each of the Fund’s federal tax returns filed in the 3-year period ended December 31, 2008 remains subject to examination by the Internal Revenue Service.
Distribution of income and gains
The Fund records distributions to shareholders from net investment income and net realized gains, if any, on the ex-dividend date. The Fund generally declares and pays dividends and capital gains distributions, if any, annually. During the year ended December 31, 2007, the tax character of distributions paid was as follows: ordinary income $329,203 and long-term capital gain $3,606,643. During the year ended December 31, 2008, the tax character of distributions paid was as follows: ordinary income $261,051, long-term capital gain $484,908 and tax return of capital $134,153. Distributions paid by the Fund with respect to each class of shares are calculated in the same manner, at the same time and are in the same amount, except for the effect of expenses that may be applied differently to each class.
Such distributions and distributable earnings, on a tax basis, are determined in conformity with income tax regulations, which may differ from accounting principles generally accepted in the United States of America. Distributions in excess of tax basis earnings and profits, if any, are reported in the Fund’s financial statements as a return of capital.
Capital accounts within financial statements are adjusted for permanent book-tax differences. These adjustments have no impact on net assets or the results of operations. Temporary book-tax differences will reverse in a subsequent period. During the year ended December 31, 2008, there were no permanent book-tax differences.
New accounting pronouncement
In March 2008, FASB No. 161 (FAS 161), Disclosures about Derivative Instruments and Hedging Activities, an amendment of FASB Statement No. 133 (FAS 133), was issued and is effective for fiscal years and interim periods beginning after November 15, 2008. FAS 161 amends and expands the disclosure requirements of FAS 133 in order to provide financial statement users an understanding of a company’s use of derivative instruments, how derivative instruments are accounted for under FAS 133 and related interpretations and how these instruments affect a company’s financial position, performance, and cash flows.
| Annual report | Large Cap Select Fund | 25 |
FAS 161 requires companies to disclose information detailing the objectives and strategies for using derivative instruments, the level of derivative activity entered into by the company, and any credit risk-related contingent features of the agreements. Management is currently evaluating the adoption of FAS 161 on the Fund’s financial statement disclosures.
Note 3
Risk and uncertainties
Concentration risk
The Fund may concentrate investments in a particular industry, sector of the economy or invest in a limited number of companies. Accordingly, the concentration may make the Fund’s value more volatile and investment values may rise and fall more rapidly. In addition, a fund with a concentration is particularly susceptible to the impact of market, economic, regulatory and other factors affecting the specific concentration.
Note 4
Guarantees and indemnifications
Under the Fund’s organizational documents, its Officers and Trustees are indemnified against certain liability arising out of the performance of their duties to the Fund. Additionally, in the normal course of business, the Fund enters into contracts with service providers that contain general indemnification clauses. The Fund’s maximum exposure under these arrangements is unknown, as this would involve future claims that may be made against the Fund that have not yet occurred.
Note 5
Management fee and transactions with
affiliates and others
The Fund has an investment management contract with the Adviser. Under the investment management contract, the Fund pays a monthly management fee to the Adviser equivalent, on an annual basis, to the sum of: (a) 0.75% of the first $2,700,000,000 of the Fund’s average daily net asset value and (b) 0.70% of the Fund’s average daily net asset value in excess of $2,700,000,000. The effective rate for the year ended December 31, 2008 is 0.75% of the Fund’s average daily net asset value. The Adviser has a subadvisory agreement with Shay Assets Management, Inc. The Fund is not responsible for payment of the subadvisory fees.
The Adviser has agreed to limit the Fund’s total expenses, excluding the distribution and service fees and transfer agent fees, to 0.90% of the Fund’s average daily net asset value, on an annual basis, and total expenses on Class A shares to 1.38% of Class A average daily net asset value, on an annual basis, at least until April 30, 2008. These caps expired on April 30, 2008. Accordingly, the expense reductions, related to limitation of Fund’s total expenses, amounted to $27,557 for the year ended December 31, 2008.
The Fund has a Distribution Agreement with John Hancock Funds, LLC (JH Funds), a wholly owned subsidiary of the Adviser. The Fund has adopted Distribution Plans with respect to Class A, Class B and Class C and Class R1, pursuant to Rule 12b-1 under the 1940 Act, to pay JH Funds for the services it provides as distributor of shares of the Fund. Accordingly, the Fund makes monthly payments to JH Funds at an annual rate not to exceed 0.25%, 1.00% and 1.00% and 0.50% of average daily net asset value of Class A, Class B, Class C and Class R1, respectively. A maximum of 0.25% of such payments may be service fees, as defined by the Conduct Rules of the Financial Industry Regulatory Authority (formerly the National Association of Securities Dealers). Under the Conduct Rules, curtailment of a portion of the Fund’s 12b-1 payments could occur under certain circumstances. In addition, under a Service Plan for Class R1 shares, the Fund pays up to 0.25% of Class R1 average daily net asset value for certain other services.
Class A shares are assessed up-front sales charges. During the year ended December 31, 2008, JH Funds received net up-front sales charges of $14,773 with regard to sales of Class A shares. Of this amount, $2,219 was retained and used for printing prospectuses, advertising, sales literature and other purposes, $10,184 was paid as sales commissions to unrelated broker-dealers and $2,370 was paid as sales commissions to sales personnel of Signator Investors, Inc. (Signator Investors), a related broker-dealer. The Adviser’s indirect parent, John Hancock Life Insurance Company
| 26 | Large Cap Select Fund | Annual report |
(JHLICO), is the indirect sole shareholder of Signator Investors.
Class B shares that are redeemed within six years of purchase are subject to a contingent deferred sales charge (CDSC) at declining rates, beginning at 5.00% of the lesser of the current market value at the time of redemption or the original purchase cost of the shares being redeemed. Class C shares that are redeemed within one year of purchase are subject to a CDSC at a rate of 1.00% of the lesser of the current market value at the time of redemption or the original purchase cost of the shares being redeemed. Proceeds from the CDSCs are paid to JH Funds and are used in whole or in part to defray its expenses for providing distribution-related services to the Fund in connection with the sale of Class B and Class C shares. During the year ended December 31, 2008, CDSCs received by JH Funds amounted to $2,667 for Class B shares and $899 for Class C shares.
The Fund has a transfer agent agreement with John Hancock Signature Services, Inc. (Signature Services), an indirect subsidiary of JHLICO. The transfer agent fees are made up of three components:
• The Fund pays a monthly transfer agent fee at an annual rate of 0.05%, 0.05%, 0.05%, 0.04% and 0.05% for Classes A, B, C, I and R1, respectively, of each class’s average daily net assets.
• For the period of January 1, 2008 to May 31, 2008, the Fund paid a monthly fee which is based on an annual rate of $15.00, $17.50, $16.50, $15.00 and $15.00 for each shareholder account for Class A, B, C, I and R1, respectively. Effective June 1, 2008, all classes paid a monthly fee based on an annual rate of $16.50 per shareholder account.
• In addition, Signature Services is reimbursed for certain out-of-pocket expenses.
Signature Services agreed to limit transfer agency fees on Class A, Class B, Class C shares to 0.23% of the average daily net assets of such share classes at least until April 20, 2008, upon which date the expense limit expired. There were no expense reductions under this plan during the year ended December 31, 2008.
The Fund receives earnings credits from its transfer agent as a result of uninvested cash balances. These credits are used to reduce a portion of the Fund’s transfer agent fees and out-of-pocket expenses. During the year ended December 31, 2008, the Fund’s transfer agent fees and out-of-pocket expenses were reduced by $902 for transfer agent credits earned.
Class level expenses for the year ended December 31, 2008 were as follows:
| Distribution and | Transfer | ||
| Share class | service fees | agent fees | |
| Class A | $102,954 | $87,455 | |
| Class B | 27,080 | 5,819 | |
| Class C | 22,031 | 4,748 | |
| Class I | — | 1,430 | |
| Class R1 | 1,820 | 688 | |
| Total | $153,885 | $100,140 | |
The Fund has an agreement with the Adviser and affiliates to perform necessary tax, accounting, compliance, legal and other administrative services for the Fund. The compensation for the year amounted to $6,145 with an effective rate of 0.01% of the Fund’s average daily net asset value.
Mr. James R. Boyle is Chairman of the Adviser, as well as affiliated Trustee of the Fund, and is compensated by the Adviser and/or its affiliates. The compensation of unaffiliated Trustees is borne by the Fund. The unaffiliated Trustees may elect to defer, for tax purposes, their receipt of this compensation under the John Hancock Group of Funds Deferred Compensation Plan. The Fund makes investments into other John Hancock funds, as applicable, to cover its liability for the deferred compensation. Investments to cover the Fund’s deferred compensation liability are recorded on the Fund’s books as an other asset. The deferred compensation liability and the related other asset are always equal and are marked to market on a periodic basis to reflect any income earned by the investments, as well as any unrealized gains or losses. The Deferred Compensation Plan investments had no impact on the operations of the Fund.
| Annual report | Large Cap Select Fund | 27 |
Note 6
Fund share transactions
This listing illustrates the number of Fund shares sold, reinvested and repurchased during the years ended December 31, 2007, and December 31, 2008, along with the corresponding dollar value.
| Year ended 12-31-07 | Year ended 12-31-08 | |||
| Shares | Amount | Shares | Amount | |
| Class A shares | ||||
| Sold | 147,812 | $2,859,921 | 466,302 | $6,637,393 |
| Distributions reinvested | 158,317 | 2,957,363 | 53,033 | 649,654 |
| Repurchased | (607,432) | (11,859,063) | (690,171) | (10,992,049) |
| Net decrease | (301,303) | ($6,041,779) | (170,836) | ($3,705,002) |
| Class B shares | ||||
| Sold | 35,051 | $662,157 | 66,384 | $956,700 |
| Distributions reinvested | 9,919 | 181,613 | 2,453 | 29,509 |
| Repurchased | (57,988) | (1,100,727) | (64,323) | (1,003,143) |
| Net increase (decrease) | (13,018) | ($256,957) | 4,514 | ($16,934) |
| Class C shares | ||||
| Sold | 40,101 | $760,140 | 212,728 | $3,105,155 |
| Distributions reinvested | 5,733 | 104,963 | 2,441 | 29,414 |
| Repurchased | (68,845) | (1,313,530) | (111,212) | (1,653,211) |
| Net increase (decrease) | (23,011) | ($448,427) | 103,957 | $1,481,358 |
| Class I shares | ||||
| Sold | 17,264 | $334,763 | 82,030 | $1,227,828 |
| Distributions reinvested | 10,649 | 199,241 | 4,844 | 59,341 |
| Repurchased | (44,853) | (869,009) | (34,852) | (547,612) |
| Net increase (decrease) | (16,940) | ($335,005) | 52,022 | $739,557 |
| Class R1 shares | ||||
| Sold | 3,470 | $65,663 | 15,348 | $253,826 |
| Distributions reinvested | 701 | 13,023 | 90 | 1,090 |
| Repurchased | (6,429) | (124,561) | (16,998) | (261,806) |
| Net decrease | (2,258) | ($45,875) | (1,560) | ($6,890) |
| Net decrease | (356,530) | ($7,128,043) | (11,903) | ($1,507,911) |
Note 7
Purchase and sale of securities
Purchases and proceeds from sales or maturities of securities, other than short-term securities and obligations of the U.S. government, during the year ended December 31, 2008, aggregated $8,036,451 and $10,855,909, respectively.
Note 8
Subsequent event
On September 9, 2008, the Trustees of the Fund voted to recommend that the shareholders of the Fund approve a tax-free reorganization and adoption of the Fund into the AMF Large Cap Equity Fund (AMF Fund), which is managed by Shay Assets Management, Inc.
As part of the proposed fund adoption, Class A, B, C and R1 shares of the Fund will merge into the AMF Fund’s Class A shares, while the Fund’s Class I shares will merge into AMF Fund’s newly created Class I shares. Shareholders of the Fund will not be subject to any sales charges as a result of the reorganization and should not experience any adverse tax consequences. A special shareholder meeting will be held on February 18, 2009 to vote on this proposed merger.
| 28 | Large Cap Select Fund | Annual report |
Auditors’ report
Report of Independent Registered Public Accounting Firm
To the Board of Trustees of John Hancock Capital Series and Shareholders of
John Hancock Large Cap Select Fund:
In our opinion, the accompanying statement of assets and liabilities, including the schedule of investments, and the related statements of operations and of changes in net assets and the financial highlights present fairly, in all material respects, the financial position of John Hancock Large Cap Select Fund (the Fund) at December 31, 2008, and the results of its operations, the changes in its net assets and the financial highlights for the periods indicated, in conformity with accounting principles generally accepted in the United States of America. These financial statements and financial highlights (hereafter referred to as “financial statements”) are the responsibility of the Fund’s management; our responsibility is to express an opinion on these financial statements based on our audits. We conducted our audits of these financial statements in accordance with the standards of the Public Company Accounting Oversight Board (United States). Those standar ds require that we plan and perform the audit to obtain reasonable assurance about whether the financial statements are free of material misstatement. An audit includes examining, on a test basis, evidence supporting the amounts and disclosures in the financial statements, assessing the accounting principles used and significant estimates made by management, and evaluating the overall financial statement presentation. We believe that our audits, which included confirmation of securities at December 31, 2008 by correspondence with the custodian and brokers, provide a reasonable basis for our opinion.
PricewaterhouseCoopers LLP
Boston, Massachusetts
February 17, 2009
| Annual report | Large Cap Select Fund | 29 |
Tax information
Unaudited
For federal income tax purposes, the following information is furnished with respect to the distributions of the Fund, if any, paid during its taxable year ended December 31, 2008.
The Fund has designated distributions to shareholders of $484,908 as a long-term capital gain dividend.
With respect to the ordinary dividends paid by the Fund for the fiscal year ended December 31, 2008, 100.00% of the dividends qualifies for the corporate dividends-received deduction.
The Fund hereby designates the maximum amount allowable of its net taxable income as qualified dividend income as provided in the Jobs and Growth Tax Relief Reconciliation Act of 2003. This amount will be reflected on Form 1099-DIV for the calendar year 2008.
Shareholders will be mailed a 2008 U.S. Treasury Department Form 1099-DIV in January 2009. This will reflect the total of all distributions that are taxable for calendar year 2008.
| 30 | Large Cap Select Fund | Annual report |
Board Consideration of and
Continuation of Investment Advisory
Agreement and Subadvisory
Agreement: John Hancock
Large Cap Select Fund
The Investment Company Act of 1940 (the 1940 Act) requires the Board of Trustees (the Board) of John Hancock Capital Series (the Trust), including a majority of the Trustees who have no direct or indirect interest in the investment advisory agreement and are not “interested persons” of the Trust, as defined in the 1940 Act (the Independent Trustees), annually to meet in person to review and consider the continuation of: (i) the investment advisory agreement (the Advisory Agreement) with John Hancock Advisers, LLC (the Adviser) and (ii) the investment subadvisory agreement (the Subadvisory Agreement) with Shay Assets Management, Inc. (the Subadviser) for the John Hancock Large Cap Select Fund (the Fund). The Advisory Agreement and the Subadvisory Agreement are collectively referred to as the Advisory Agreements.
At meetings held on May 5–6 and June 9–10, 2008, the Board considered the factors and reached the conclusions described below relating to the selection of the Adviser and Subadviser and the continuation of the Advisory Agreements. During such meetings, the Board’s Contracts/Operations Committee and the Independent Trustees also met in executive sessions with their independent legal counsel.
In evaluating the Advisory Agreements, the Board, including the Contracts/Operations Committee and its Independent Trustees, reviewed a broad range of information requested for this purpose. This information included:
(i) the investment performance of the Fund relative to a category of relevant funds (the Category) and a peer group of comparable funds (the Peer Group). The funds within each Category and Peer Group were selected by Morningstar Inc. (Morningstar), an independent provider of investment company data. Data covered a range of periods ended December 31, 2007,
(ii) advisory and other fees incurred by, and the expense ratios of, the Fund relative to a Category and a Peer Group,
(iii) the advisory fees of comparable portfolios of other clients of the Adviser and the Subadviser,
(iv) the Adviser’s financial results and condition, including its and certain of its affiliates’ profitability from services performed for the Fund,
(v) breakpoints in the Fund’s and the Peer Group’s fees, and information about economies of scale,
(vi) the Adviser’s and Subadviser’s record of compliance with applicable laws and regulations, with the Fund’s investment policies and restrictions, and with the applicable Code of Ethics, and the structure and responsibilities of the Adviser’s and Subadviser’s compliance department,
(vii) the background and experience of senior management and investment professionals, and
(viii) the nature, cost and character of advisory and non-investment management services provided by the Adviser and its affiliates and by the Subadviser.
The Independent Trustees considered the legal advice of independent legal counsel and relied on their own business judgment in determining the factors to be considered in evaluating the materials that were presented to them and the weight to be given to each such factor. The Board’s review and conclusions were based on a comprehensive consideration of all information presented to the Board and not the result of any single controlling factor. The Board principally considered data on performance and other information provided by Morningstar as of December 31, 2007. The Board also considered updated performance information provided to it by the Adviser or Subadviser at its May and June 2008 meetings. Performance and other information may be quite different as of the date of this shareholders report. The key factors considered by the Board and the conclusions reached are described below.
| Annual report | Large Cap Select Fund | 31 |
Nature, extent and quality of services
The Board considered the ability of the Adviser and the Subadviser, based on their resources, reputation and other attributes, to attract and retain qualified investment professionals, including research, advisory, and supervisory personnel. The Board considered the investment philosophy, research and investment decision-making processes of the Adviser and Subadviser. The Board considered the Adviser’s execution of its oversight responsibilities. The Board further considered the culture of compliance, resources dedicated to compliance, compliance programs and compliance records of the Adviser and Subadviser. In addition, the Board took into account the administrative and other non-advisory services provided to the Fund by the Adviser and its affiliates.
Based on the above factors, together with those referenced below, the Board concluded that, within the context of its full deliberations, the nature, extent and quality of the investment advisory services provided to the Fund by the Adviser and Subadviser supported renewal of the Advisory Agreements.
Fund performance
The Board considered the performance results for the Fund over various time periods ended December 31, 2007. The Board also considered these results in comparison to the performance of the Category, as well as the Fund’s benchmark index. The Board reviewed with representatives of Morningstar the methodology used by Morningstar to select the funds in the Category and the Peer Group.
The Board noted that the Fund’s performance during the 10-year period was generally in line with the performance of the Peer Group and Category medians, and its benchmark index, the Standard & Poor’s 500 Index. The Board noted that, for the 1-, 3- and 5-year periods under review, the Fund’s performance was lower than the performance of the Peer Group and Category medians and its benchmark index. The Adviser discussed new proposals designed to address the Fund’s under-performance.
Investment advisory fee and subadvisory fee
rates and expenses
The Board reviewed and considered the contractual investment advisory fee rate payable by the Fund to the Adviser for investment advisory services (the Advisory Agreement Rate). The Board received and considered information comparing the Advisory Agreement Rate with the advisory fees for the Peer Group. The Board noted that the Advisory Agreement Rate was in line with the median rate of the Peer Group and equal to the median rate of the Category.
The Board received and considered expense information regarding the Fund’s various components, including advisory fees, distribution and fees other than advisory and distribution fees, including transfer agent fees, custodian fees, and other miscellaneous fees (e.g., fees for accounting and legal services). The Board considered comparisons of these expenses to the Peer Group median. The Board also received and considered expense information regarding the Fund’s total operating expense ratio (Gross Expense Ratio) and total operating expense ratio after taking the fee waiver arrangement applicable to the Advisory Agreement Rate into account (Net Expense Ratio). The Board received and considered information comparing the Gross Expense Ratio and Net Expense Ratio of the Fund to that of the Peer Group and Category medians. The Board noted that the Fund’s Gross and Net Expense Ratios were highe r than the median of the Category but lower than median of the Peer Group.
The Adviser also discussed the Morningstar data and rankings, and other relevant information, for the Fund. Based on the above-referenced considerations and other factors, the Board concluded that the Fund’s overall performance and expenses supported the re-approval of the Advisory Agreements.
The Board also received information about the investment subadvisory fee rate (the Subadvisory Agreement Rate) payable by the Adviser to the Subadviser for investment sub-advisory services. The Board concluded that the Subadvisory Agreement Rate was fair and equitable, based on its consideration of the factors described here.
| 32 | Large Cap Select Fund | Annual report |
Profitability
The Board received and considered a detailed profitability analysis of the Adviser based on the Advisory Agreements, as well as on other relationships between the Fund and the Adviser and its affiliates. The Board also considered a comparison of the Adviser’s profitability to that of other similar investment advisers whose profitability information is publicly available. The Board concluded that, in light of the costs of providing investment management and other services to the Fund, the profits and other ancillary benefits reported by the Adviser were not unreasonable.
The Board did not consider profitability information with respect to the Subadviser, which is not affiliated with the Adviser. The Board considered that the Subadvisory Agreement Rate paid to the Subadviser had been negotiated by the Adviser on an arm’s length basis and that the Subadviser’s separate profitability from its relationship with the Fund was not a material factor in determining whether to renew the agreement.
Economies of scale
The Board received and considered general information regarding economies of scale with respect to the management of the Fund, including the Fund’s ability to appropriately benefit from economies of scale under the Fund’s fee structure. The Board recognized the inherent limitations of any analysis of economies of scale, stemming largely from the Board’s understanding that most of the Adviser’s costs are not specific to individual Funds, but rather are incurred across a variety of products and services.
To the extent the Board and the Adviser were able to identify actual or potential economies of scale from Fund-specific or allocated expenses, in order to ensure that any such economies continue to be reasonably shared with the Fund as its assets increase, the Adviser and the Board agreed to continue existing breakpoints to the Advisory Agreement Rate.
Information about services to other clients
The Board also received information about the nature, extent and quality of services and fee rates offered by the Adviser and Subadviser to their other clients, including other registered investment companies, institutional investors and separate accounts. The Board concluded that the Advisory Agreement Rate and the Subadvisory Agreement Rate were not unreasonable, taking into account fee rates offered to others by the Adviser and Subadviser, respectively, after giving effect to differences in services.
Other benefits to the Adviser
The Board received information regarding potential “fall-out” or ancillary benefits received by the Adviser and its affiliates and the Subadviser as a result of their relationship with the Fund. Such benefits could include, among others, benefits directly attributable to the relationship of the Adviser and Subadviser with the Fund and benefits potentially derived from an increase in business as a result of their relationship with the Fund (such as the ability to market to shareholders other financial products offered by the Adviser and its affiliates).
The Board also considered the effectiveness of the Adviser’s, Subadviser’s and Fund’s policies and procedures for complying with the requirements of the federal securities laws, including those relating to best execution of portfolio transactions and brokerage allocation.
Other factors and broader review
As discussed above, the Board reviewed detailed materials received from the Adviser and Subadviser as part of the annual re-approval process. The Board also regularly reviews and assesses the quality of the services that the Fund receives throughout the year. In this regard, the Board reviews reports of the Adviser at least quarterly, which include, among other things, a detailed portfolio review, detailed fund performance reports and compliance reports. In addition, the Board meets with portfolio managers and senior investment officers at various times throughout the year.
After considering the above-described factors and based on its deliberations and its evaluation of the information described above, the Board concluded that approval of the continuation of the Advisory Agreements for the Fund was in the best interest of the Fund and its shareholders. Accordingly, the Board unanimously approved the continuation of the Advisory Agreements.
| Annual report | Large Cap Select Fund | 33 |
Trustees and Officers
This chart provides information about the Trustees and Officers who oversee your John Hancock fund. Officers elected by the Trustees manage the day-to-day operations of the Fund and execute policies formulated by the Trustees.
| Independent Trustees | ||
| Name, Year of Birth | Number of | |
| Position(s) held with Fund | Trustee | John Hancock |
| Principal occupation(s) and other | of Fund | funds overseen |
| directorships during past 5 years | since1 | by Trustee |
| Patti McGill Peterson, Born: 1943 | 2003 | 51 |
| Chairperson (since December 2008); Principal, PMP Globalinc (consulting) (since 2007); Senior Associate, | ||
| Institute for Higher Education Policy (since 2007); Executive Director, CIES (international education | ||
| agency) (until 2007); Vice President, Institute of International Education (until 2007); Senior Fellow, | ||
| Cornell University Institute of Public Affairs, Cornell University (until 1998); Former President Wells | ||
| College, St. Lawrence University and the Association of Colleges and Universities of the State of New | ||
| York. Director of the following: Niagara Mohawk Power Corporation (until 2003); Security Mutual Life | ||
| (insurance) (until 1997); ONBANK (until 1993). Trustee of the following: Board of Visitors, The University | ||
| of Wisconsin, Madison (since 2007); Ford Foundation, International Fellowships Program (until 2007); | ||
| UNCF, International Development Partnerships (until 2005); Roth Endowment (since 2002); Council for | ||
| International Educational Exchange (since 2003). | ||
| James F. Carlin, Born: 1940 | 2005 | 51 |
| Director and Treasurer, Alpha Analytical Laboratories, Inc. (chemical analysis) (since 1985); Part Owner | ||
| and Treasurer, Lawrence Carlin Insurance Agency, Inc. (since 1995); Part Owner and Vice President, | ||
| Mone Lawrence Carlin Insurance Agency, Inc. (until 2005); Chairman and Chief Executive Officer, | ||
| Carlin Consolidated, Inc. (management/investments) (since 1987); Trustee, Massachusetts Health and | ||
| Education Tax Exempt Trust (1993–2003). | ||
| William H. Cunningham,2 Born: 1944 | 2005 | 51 |
| Professor, University of Texas at Austin (since 1971); former Chancellor, University of Texas System and | ||
| former President, University of Texas at Austin (until 2001); Chairman and Chief Executive Officer, IBT | ||
| Technologies (until 2001); Director of the following: Hicks Acquisition Company I, Inc. (since 2007); | ||
| Hire.com (until 2004), STC Broadcasting, Inc. and Sunrise Television Corp. (until 2001), Symtx, Inc. | ||
| (electronic manufacturing) (since 2001), Adorno/Rogers Technology, Inc. (until 2004), Pinnacle Foods | ||
| Corporation (until 2003), rateGenius (until 2003), Lincoln National Corporation (insurance) (since | ||
| 2006), Jefferson-Pilot Corporation (diversified life insurance company) (until 2006), New Century | ||
| Equity Holdings (formerly Billing Concepts) (until 2001), eCertain (until 2001), ClassMap.com (until | ||
| 2001), Agile Ventures (until 2001), AskRed.com (until 2001), Southwest Airlines (since 2000), Introgen | ||
| (manufacturer of biopharmaceuticals) (since 2000) and Viasystems Group, Inc. (electronic manufacturer) | ||
| (until 2003); Advisory Director, Interactive Bridge, Inc. (college fundraising) (until 2001); Advisory | ||
| Director, Q Investments (until 2003); Advisory Director, JPMorgan Chase Bank (formerly Texas Commerce | ||
| Bank–Austin), LIN Television (until 2008), WilTel Communications (until 2003) and Hayes Lemmerz | ||
| International, Inc. (diversified automotive parts supply company) (since 2003). | ||
| Deborah C. Jackson,2,4 Born: 1952 | 2008 | 51 |
| Chief Executive Officer, American Red Cross of Massachusetts Bay (since 2002); Board of Directors of | ||
| Eastern Bank Corporation (since 2001); Board of Directors of Eastern Bank Charitable Foundation (since | ||
| 2001); Board of Directors of American Student Association Corp. (since 1996); Board of Directors of | ||
| Boston Stock Exchange (2002–2008); Board of Directors of Harvard Pilgrim Healthcare (since 2007). | ||
| 34 | Large Cap Select Fund | Annual report |
| Independent Trustees (continued) | ||
| Name, Year of Birth | Number of | |
| Position(s) held with Fund | Trustee | John Hancock |
| Principal occupation(s) and other | of Fund | funds overseen |
| directorships during past 5 years | since1 | by Trustee |
| Charles L. Ladner, Born: 1938 | 2004 | 51 |
| Chairman and Trustee, Dunwoody Village, Inc. (retirement services); Senior Vice President and Chief | ||
| Financial Officer, UGI Corporation (public utility holding company) (retired 1998); Vice President and | ||
| Director, AmeriGas, Inc. (retired 1998); Director, AmeriGas Partners, L.P. (gas distribution) (until 1997); | ||
| Director, EnergyNorth, Inc. (until 1997); Director, Parks and History Association (until 2005). | ||
| Stanley Martin,2,4 Born: 1947 | 2008 | 51 |
| Senior Vice President/Audit Executive, Federal Home Loan Mortgage Corporation (2004–2006); | ||
| Executive Vice President/Consultant, HSBC Bank USA (2000–2003); Chief Financial Officer/Executive | ||
| Vice President, Republic New York Corporation and Republic National Bank of New York (1998–2000); | ||
| Partner, KPMG LLP (1971–1998). | ||
| Dr. John A. Moore, Born: 1939 | 2003 | 51 |
| President and Chief Executive Officer, Institute for Evaluating Health Risks (nonprofit institution) | ||
| (until 2001); Senior Scientist, Sciences International (health research) (until 2003); Former Assistant | ||
| Administrator and Deputy Administrator, Environmental Protection Agency; Principal, Hollyhouse | ||
| (consulting) (since 2000); Director, CIIT Center for Health Science Research (nonprofit research) (until | ||
| 2007). | ||
| Steven R. Pruchansky, Born: 1944 | 2005 | 51 |
| Chairman and Chief Executive Officer, Greenscapes of Southwest Florida, Inc. (since 2000); Director | ||
| and President, Greenscapes of Southwest Florida, Inc. (until 2000); Member, Board of Advisors, First | ||
| American Bank (since 2008); Managing Director, JonJames, LLC (real estate) (since 2000); Director, First | ||
| Signature Bank & Trust Company (until 1991); Director, Mast Realty Trust (until 1994); President, Maxwell | ||
| Building Corp. (until 1991). | ||
| Non-Independent Trustees3 | ||
| Name, Year of Birth | Number of | |
| Position(s) held with Fund | Trustee | John Hancock |
| Principal occupation(s) and other | of Fund | funds overseen |
| directorships during past 5 years | since1 | by Trustee |
| James R. Boyle, Born: 1959 | 2005 | 269 |
| Executive Vice President, Manulife Financial Corporation (since 1999); Director and President, John | ||
| Hancock Variable Life Insurance Company (since 2007); Director and Executive Vice President, John | ||
| Hancock Life Insurance Company (since 2004); Chairman and Director, John Hancock Advisers, LLC | ||
| (the Adviser), John Hancock Funds, LLC (John Hancock Funds) and The Berkeley Financial Group, LLC | ||
| (The Berkeley Group) (holding company) (since 2005); Chairman and Director, John Hancock Investment | ||
| Management Services, LLC (since 2006); Senior Vice President, The Manufacturers Life Insurance | ||
| Company (U.S.A.) (until 2004). | ||
| Annual report | Large Cap Select Fund | 35 |
| Principal officers who are not Trustees | |
| Name, Year of Birth | |
| Position(s) held with Fund | Officer |
| Principal occupation(s) and other | of Fund |
| directorships during past 5 years | since |
| Keith F. Hartstein, Born: 1956 | 2005 |
| President and Chief Executive Officer | |
| Senior Vice President, Manulife Financial Corporation (since 2004); Director, President and Chief | |
| Executive Officer, the Adviser, The Berkeley Group and John Hancock Funds, LLC (since 2005); Director, | |
| MFC Global Investment Management (U.S.), LLC (MFC Global (U.S.)) (since 2005); Chairman and | |
| Director, John Hancock Signature Services, Inc. (since 2005); Director, President and Chief Executive | |
| Officer, John Hancock Investment Management Services, LLC (since 2006); President and Chief Executive | |
| Officer, John Hancock Funds, John Hancock Funds II, John Hancock Funds III and John Hancock Trust | |
| (since 2005); Director, Chairman and President, NM Capital Management, Inc. (since 2005); Member | |
| and former Chairman, Investment Company Institute Sales Force Marketing Committee (since 2003); | |
| Director, President and Chief Executive Officer, MFC Global (U.S.) (2005–2006); Executive Vice President, | |
| John Hancock Funds, LLC (until 2005). | |
| Thomas M. Kinzler, Born: 1955 | 2006 |
| Secretary and Chief Legal Officer | |
| Vice President and Counsel, John Hancock Life Insurance Company (U.S.A.) (since 2006); Secretary and | |
| Chief Legal Officer, John Hancock Funds, John Hancock Funds II and John Hancock Trust (since 2006); | |
| Vice President and Associate General Counsel, Massachusetts Mutual Life Insurance Company (1999– | |
| 2006); Secretary and Chief Legal Counsel, MML Series Investment Fund (2000–2006); Secretary and | |
| Chief Legal Counsel, MassMutual Institutional Funds (2000–2004); Secretary and Chief Legal Counsel, | |
| MassMutual Select Funds and MassMutual Premier Funds (2004–2006). | |
| Francis V. Knox, Jr., Born: 1947 | 2005 |
| Chief Compliance Officer | |
| Vice President and Chief Compliance Officer, John Hancock Investment Management Services, LLC, | |
| the Adviser and MFC Global (U.S.) (since 2005); Chief Compliance Officer, John Hancock Funds, John | |
| Hancock Funds II, John Hancock Funds III and John Hancock Trust (since 2005); Vice President and | |
| Assistant Treasurer, Fidelity Group of Funds (until 2004); Vice President and Ethics & Compliance Officer, | |
| Fidelity Investments (until 2001). | |
| Charles A. Rizzo, Born: 1957 | 2007 |
| Chief Financial Officer | |
| Chief Financial Officer, John Hancock Funds, John Hancock Funds II, John Hancock Funds III and John | |
| Hancock Trust (since 2007); Assistant Treasurer, Goldman Sachs Mutual Fund Complex (registered | |
| investment companies) (2005–2007); Vice President, Goldman Sachs (2005–2007); Managing Director | |
| and Treasurer of Scudder Funds, Deutsche Asset Management (2003–2005); Director, Tax and Financial | |
| Reporting, Deutsche Asset Management (2002–2003); Vice President and Treasurer, Deutsche Global | |
| Fund Services (1999–2002). | |
| Gordon M. Shone, Born: 1956 | 2006 |
| Treasurer | |
| Senior Vice President, John Hancock Life Insurance Company (U.S.A.) (since 2001); Treasurer, John | |
| Hancock Funds (since 2006), John Hancock Funds II, John Hancock Funds III and John Hancock Trust | |
| (since 2005); Vice President and Chief Financial Officer, John Hancock Trust (2003–2005); Vice President, | |
| John Hancock Investment Management Services, LLC, John Hancock Advisers, LLC (since 2006) and The | |
| Manufacturers Life Insurance Company (U.S.A.) (1998–2000). | |
| 36 | Large Cap Select Fund | Annual report |
| Principal officers who are not Trustees (continued) | |
| Name, Year of Birth | |
| Position(s) held with Fund | Officer |
| Principal occupation(s) and other | of Fund |
| directorships during past 5 years | since |
| John G. Vrysen, Born: 1955 | 2005 |
| Chief Operating Officer | |
| Senior Vice President, Manulife Financial Corporation (since 2006); Director, Executive Vice President | |
| and Chief Operating Officer, the Adviser, The Berkeley Group, John Hancock Investment Management | |
| Services, LLC and John Hancock Funds, LLC (since 2007); Chief Operating Officer, John Hancock Funds, | |
| John Hancock Funds II, John Hancock Funds III and John Hancock Trust (since 2007); Director, John | |
| Hancock Signature Services, Inc. (since 2005); Chief Financial Officer, the Adviser, The Berkeley Group, | |
| Manulife Financial Corporation Global Investment Management (U.S.), LLC, John Hancock Investment | |
| Management Services, LLC, John Hancock Funds, LLC, John Hancock Funds, John Hancock Funds II, John | |
| Hancock Funds III and John Hancock Trust (2005–2007); Vice President, Manulife Financial Corporation | |
| (until 2006). | |
The business address for all Trustees and Officers is 601 Congress Street, Boston, Massachusetts 02210-2805.
The Statement of Additional Information of the Fund includes additional information about members of the Board of Trustees of the Fund and is available without charge, upon request, by calling 1-800-225-5291.
1 Each Trustee serves until resignation, retirement age or until his or her successor is elected.
2 Member of Audit Committee.
3 Non-Independent Trustee holds positions with the Fund’s investment adviser, underwriter and certain other affiliates.
4 Mr. Martin was appointed by the Board as Trustee on September 8, 2008 and Ms. Jackson was appointed effective October 1, 2008.
| Annual report | Large Cap Select Fund | 37 |
More information
| Trustees | Investment adviser |
| Patti McGill Peterson, Chairperson | John Hancock Advisers, LLC |
| James R. Boyle† | |
| James F. Carlin | Subadviser |
| William H. Cunningham* | Shay Assets Management, Inc. |
| Deborah C. Jackson* | Principal distributor |
| Charles L. Ladner | John Hancock Funds, LLC |
| Stanley Martin* | |
| Dr. John A. Moore | Custodian |
| Steven R. Pruchansky | The Bank of New York Mellon |
| *Members of the Audit Committee | |
| †Non-Independent Trustee | Transfer agent |
| John Hancock Signature Services, Inc. | |
| Officers | Legal counsel |
| Keith F. Hartstein | K&L Gates LLP |
| President and Chief Executive Officer | |
| Independent registered | |
| Thomas M. Kinzler | public accounting firm |
| Secretary and Chief Legal Officer | PricewaterhouseCoopers LLP |
| Francis V. Knox, Jr. | |
| Chief Compliance Officer | |
| Charles A. Rizzo | |
| Chief Financial Officer | |
| Gordon M. Shone | |
| Treasurer | |
| John G. Vrysen | |
| Chief Operating Officer |
Additional information about your fund is available without charge in several ways. As required by the SEC, you can access proxy voting information and quarterly portfolio information on your fund. The proxy voting information includes a description of proxy voting policies, procedures and information regarding how the fund voted proxies relating to portfolio securities during the most recent twelve-month period ended June 30. The quarterly portfolio information that includes a complete list of the fund’s holdings for the first and third quarters of the fund’s fiscal period is filed on Form N-Q. You have access to this information:
| By phone | On the fund’s Web site | At the SEC | |
| 1-800-225-5291 | www.jhfunds.com | www.sec.gov | |
| 1-800-SEC-0330 | |||
| SEC Public Reference Room | |||
| You can also contact us: | |||
| Regular mail: | Express mail: | ||
| John Hancock Signature Services, Inc. | John Hancock Signature Services, Inc. | ||
| P.O. Box 9510 | Mutual Fund Image Operations | ||
| Portsmouth, NH 03802-9510 | 164 Corporate Drive | ||
| Portsmouth, NH 03801 | |||
Month-end portfolio holdings are available at www.jhfunds.com.
| 38 | Large Cap Select Fund | Annual report |

1-800-225-5291
1-800-554-6713 TDD
1-800-338-8080 EASI-Line
www.jhfunds.com
Now available: electronic delivery
www.jhfunds.com/edelivery
| This report is for the information of the shareholders of John Hancock Large Cap Select Fund. | 4900A 12/08 |
| It is not authorized for distribution to prospective investors unless preceded or accompanied by a prospectus. | 2/09 |
ITEM 2. CODE OF ETHICS.
As of the end of the period, December 31, 2008, the registrant has adopted a code of ethics, as defined in Item 2 of Form N-CSR, that applies to its Chief Executive Officer and Chief Financial Officer (respectively, the principal executive officer, the principal financial officer, the “Covered Officers”). A copy of the code of ethics is filed as an exhibit to this Form N-CSR.
ITEM 3. AUDIT COMMITTEE FINANCIAL EXPERT.
Stanley Martin is the audit committee financial expert and is “independent”, pursuant to general instructions on Form N-CSR Item 3.
ITEM 4. PRINCIPAL ACCOUNTANT FEES AND SERVICES.
(a) Audit Fees
The aggregate fees billed for professional services rendered by the principal accountant(s) for the audit of the registrant’s annual financial statements or services that are normally provided by the accountant(s) in connection with statutory and regulatory filings or engagements amounted to $27,917 for the fiscal year ended December 31, 2008 (John Hancock Large Cap Select Fund) and $19,050 for the fiscal year ended December 31, 2007 (John Hancock Large Cap Select Fund). These fees were billed to the registrant and were approved by the registrant’s audit committee.
(b) Audit-Related Services
There were no audit-related fees during the fiscal year ended December 31, 2008 and fiscal year ended December 31, 2007 billed to the registrant or to the registrant's investment adviser (not including any sub-adviser whose role is primarily portfolio management and is subcontracted with or overseen by another investment adviser), and any entity controlling, controlled by, or under common control with the adviser that provides ongoing services to the registrant ("control affiliates").
(c) Tax Fees
The aggregate fees billed for professional services rendered by the principal accountant(s) for the tax compliance, tax advice and tax planning (“tax fees”) amounted to $2,250 for the fiscal year ended December 31, 2008 (John Hancock Large Cap Select Fund) and $2,250 for the fiscal year ended December 31, 2007 (John Hancock Large Cap Select Fund). The nature of the services comprising the tax fees was the review of the registrant’s income tax returns and tax distribution requirements. These fees were billed to the registrant and were approved by the registrant’s audit committee. There were no tax fees billed to the control affiliates.
(d) All Other Fees
Other fees amounted to $3,500 for the fiscal year ended December 31, 2008 and $0 for the fiscal year ended December 31, 2007 billed to the registrant or to the control affiliates.
(e)(1) Audit Committee Pre-Approval Policies and Procedures:
The trust’s Audit Committee must pre-approve all audit and non-audit services provided by the independent registered public accounting firm (the “Auditor”) relating to the operations or financial reporting of the funds. Prior to the commencement of any audit or non-audit services to a fund, the Audit Committee reviews the services to determine whether they are appropriate and permissible under applicable law.
The trust’s Audit Committee has adopted policies and procedures to, among other purposes, provide a framework for the Committee’s consideration of audit-related and non-audit services by the Auditor. The policies and procedures require that any audit-related and non-audit service provided by the Auditor and any non-audit service provided by the Auditor to a fund service provider that relates directly to the operations and financial reporting of a fund are subject to approval by the Audit Committee before such service is provided. Audit-related services provided by the Auditor that are expected to exceed $25,000 per instance/per fund are subject to specific pre-approval by the Audit Committee. Tax services provided by the Auditor that are expected to exceed $30,000 per instance/per fund are subject to specific pre-approval by the Audit Committee.
All audit services, as well as the audit-related and non-audit services that are expected to exceed the amounts stated above, must be approved in advance of provision of the service by formal resolution of the Audit Committee. At the regularly scheduled Audit Committee meetings, the Committee reviews a report summarizing the services, including fees, provided by the Auditor.
(e)(2) Services approved pursuant to paragraph (c)(7)(i)(C) of Rule 2-01 of Regulation S-X:
Audit-Related Fees, Tax Fees and All Other Fees:
There were no amounts that were approved by the Audit Committee pursuant to the de minimis exception under Rule 2-01 of Regulation S-X.
(f) According to the registrant’s principal accountant, for the fiscal year ended December 31, 2008, the percentage of hours spent on the audit of the registrant's financial statements for the most recent fiscal year that were attributed to work performed by persons who were not full-time, permanent employees of principal accountant was less than 50%.
(g) The aggregate non-audit fees billed by the registrant's accountant(s) for services rendered to the registrant and rendered to the registrant's control affiliates for each of the last two fiscal years of the registrant were $7,774,383 for the fiscal year ended December 31, 2008, and $1,565,823 for the fiscal year ended December 31, 2007.
(h) The audit committee of the registrant has considered the non-audit services provided by the registrant’s principal accountant(s) to the control affiliates and has determined that the services that were not pre-approved are compatible with maintaining the principal accountant(s)' independence.
ITEM 5. AUDIT COMMITTEE OF LISTED REGISTRANTS.
The registrant has a separately-designated standing audit committee comprised of independent trustees. The members of the audit committee are as follows:
Stanley Martin - Chairman
William H. Cunningham
Deborah C. Jackson
ITEM 6. SCHEDULE OF INVESTMENTS.
(a) Not applicable.
(b) Not applicable.
ITEM 7. DISCLOSURE OF PROXY VOTING POLICIES AND PROCEDURES FOR CLOSED-END MANAGEMENT INVESTMENT COMPANIES.
Not applicable.
ITEM 8. PORTFOLIO MANAGERS OF CLOSED-END MANAGEMENT INVESTMENT COMPANIES.
Not applicable.
ITEM 9. PURCHASES OF EQUITY SECURITIES BY CLOSED-END MANAGEMENT INVESTMENT COMPANY AND AFFILIATED PURCHASERS.
Not applicable.
ITEM 10. SUBMISSION OF MATTERS TO A VOTE OF SECURITY HOLDERS.
There were no material changes to previously disclosed John Hancock Funds – Governance Committee Charter.
ITEM 11. CONTROLS AND PROCEDURES.
(a) Based upon their evaluation of the registrant's disclosure controls and procedures as conducted within 90 days of the filing date of this Form N-CSR, the registrant's principal executive officer and principal financial officer have concluded that those disclosure controls and procedures provide reasonable assurance that the material information required to be disclosed by the registrant on this report is recorded, processed, summarized and reported within the time periods specified in the Securities and Exchange Commission's rules and forms.
(b) There were no changes in the registrant's internal control over financial reporting that occurred during the registrant's most recent fiscal half-year (the registrant's second fiscal half-year in the case of an annual report) that have materially affected, or are reasonably likely to materially affect, the registrant's internal control over financial reporting.
ITEM 12. EXHIBITS.
(a)(1) Code of Ethics for Senior Financial Officers is attached.
(a)(2) Separate certifications for the registrant's principal executive officer and principal financial officer, as required by Section 302 of the Sarbanes-Oxley Act of 2002 and Rule 30a-2(a) under the Investment Company Act of 1940, are attached.
(b) Separate certifications for the registrant's principal executive officer and principal financial officer, as required by 18 U.S.C. Section 1350, as adopted pursuant to Section 906 of the Sarbanes-Oxley Act of 2002, and Rule 30a-2(b) under the Investment Company Act of 1940, are attached. The certifications furnished pursuant to this paragraph are not deemed to be "filed" for purposes of Section 18 of the Securities Exchange Act of 1934, or otherwise subject to the liability of that section. Such certifications are not deemed to be incorporated by reference into any filing under the Securities Act of 1933 or the Securities Exchange Act of 1934, except to the extent that the Registrant specifically incorporates them by reference.
(c)(1) Submission of Matters to a Vote of Security Holders is attached. See attached “John Hancock Funds – Governance Committee Charter”.
(c)(2) Contact person at the registrant.
SIGNATURES
Pursuant to the requirements of the Securities Exchange Act of 1934 and the Investment Company Act of 1940, the registrant has duly caused this report to be signed on its behalf by the undersigned, thereunto duly authorized.
John Hancock Capital Series
By: /s/ Keith F. Hartstein
-------------------------------------
Keith F. Hartstein
President and Chief Executive Officer
Date: February 26, 2009
Pursuant to the requirements of the Securities Exchange Act of 1934 and the Investment Company Act of 1940, this report has been signed below by the following persons on behalf of the registrant and in the capacities and on the dates indicated.
By: /s/ Keith F. Hartstein
-------------------------------------
Keith F. Hartstein
President and Chief Executive Officer
Date: February 26, 2009
By: /s/ Charles A. Rizzo
-------------------------------------
Charles A. Rizzo
Chief Financial Officer
Date: February 26, 2009