Operating Systems
Fred Ehlers
Vice President Customer Service

Agenda
Systems used to support a Scheduled
Railroad
Advanced Transportation Systems currently
under Development
I will be covering two topics this afternoon related to operating systems at Norfolk Southern –
The systems we use to support a scheduled railroad and other advanced transportation systems currently under development.

The Network
Before we get into a discussion about the technology, let’s first talk about the Norfolk Southern network.
While some trains move directly from origin to destination, more often than not, railcars get switched from one train to another, normally multiple times, as they move through the NS network and the larger North American rail network.
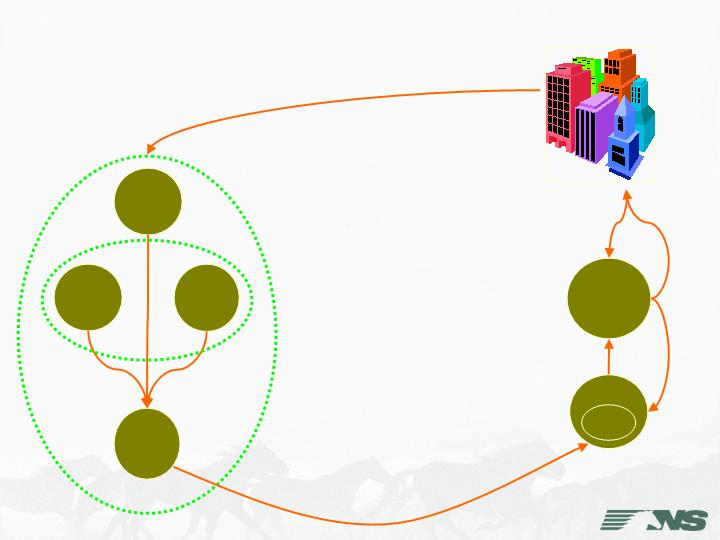
Similar to the UPS package network, our rail network operates off a series of hub and spokes – with our large classification yards being equivalent to the UPS sorting facilities and our trains being analogous to the trailer transportation system between those facilities.
On average, cars moving in our General Merchandise network will normally get switched at 2 or 3 classification yards during their journey from origin to destination.

Major Classification Yards
The Norfolk Southern system employs 13 large, high production, gravity flow, classification yards across the network. Supporting these yards are a larger group of regional and industrial yards where groups of cars are further broken down and assembled as part of the process of moving freight through the network.
Eastern roads, in comparison to Western roads, generally operate shorter distances in more heavily populated and industrialized areas of the country. Despite its size, our network is extremely complex due to the fact that we handle shipments between 40,000 origin-destination point pairs.

Thoroughbred Operating Plan
Two Parts
The Plan
Execution
The Plan
Tools to develop and manage the plan –
Operating Plan Developer (OPD)
A highly detailed, digitized plan
Communication pathways, highly integrated
systems
Underlying systems to easily support changes to
the plan (train schedules & car routing)
Now that I have reviewed the network basics, let me turn to the Thoroughbred Operating Plan and in particular how we employ systems to help us run to plan.
Of course, the Thoroughbred Operating Plan, or TOP, is composed of two parts – the plan and, the execution of the plan.
Let's start with the plan.
From a system perspective, the list of important components start with the tool we use to develop and manage the plan – at Norfolk Southern it is an internally developed application called Operating Plan Developer or OPD. OPD is a great system that allows us to develop, test, and analyze a complete operating plan in an off-line, planning environment. It is an extremely powerful tool and unique in the rail industry.
The plan is highly detailed, and of course, digital
For a plan to be effective, it has to be communicated. At NS the plan is communicated through highly integrated systems, that in turn, present the plan to a variety of users through an easily understood user interface.
And finally, supporting the plan, are powerful production systems that facilitate changes in a easy and efficient manner.

Thoroughbred Operating Plan
Execution
Communication Platform (TYES)
Early Warning – Service Failure Alerts
Documentation of Failures
Focused Metrics
Timely Performance Feedback
Equally important, is the execution of the operating plan, and we employ a series of systems to support that aspect as well.
TYES, or Thoroughbred Yard Enterprise System, serves as our main communication platform to users of transportation data.
Within TYES, we provide early warnings to notify employees of impending service failures.
TYES also documents service failures to aid in root cause analysis and remediation.
Employing our data warehouse, we provide a battery of metrics on all aspects of the transportation cycle.
And just as important, we provide those metrics on a very timely basis.
CYO
DTSR
ABC
ITMS
Shipment Details - Waybills
(EDI, Internet BOL, etc)
Customer
Requests
Routing Instructions, Trip Plans, ETAs,
Inventory Mgmt Codes, Releases
Train Reporting,
Shipment Reporting
NS Waybill
System
Trip Plan Creation
ABC – Algorithmic Blocking & Classification
DTSR – Dynamic Train Service Register
ITMS – Integrated Transportation Management System
TYES – Thoroughbred Yard Enterprise System
ETAs, Shipment
Tracking, and
Notification
TYES
For the rest of this section we are going to focus on plan execution, but before I get into that, let me very quickly walk you through the backbone of the process - the trip plan.
The trip plan starts with the tendering of a bill of lading by the customer, which triggers the creation of a waybill. From the waybill, we dynamically create a trip plan based on the current car routing instructions provided by ABC, or Algorithmic Blocking and Classification, and current set of train schedules from DTSR, or Dynamic Train Service Register. The trip plan is then passed to TYES to be utilized by our field forces, employees in our Central Yard Office in Atlanta, and customers.
The Trip Plan
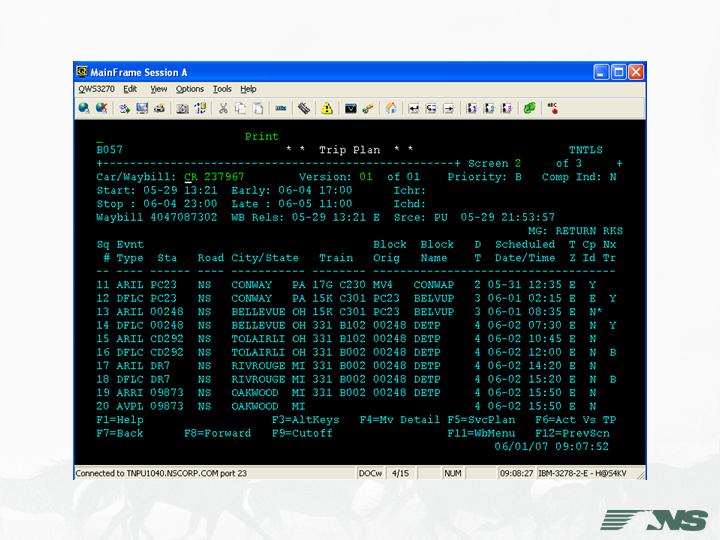
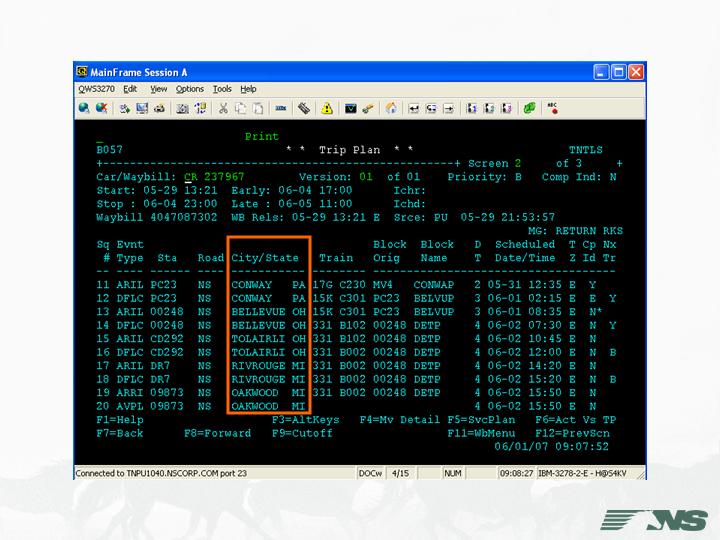
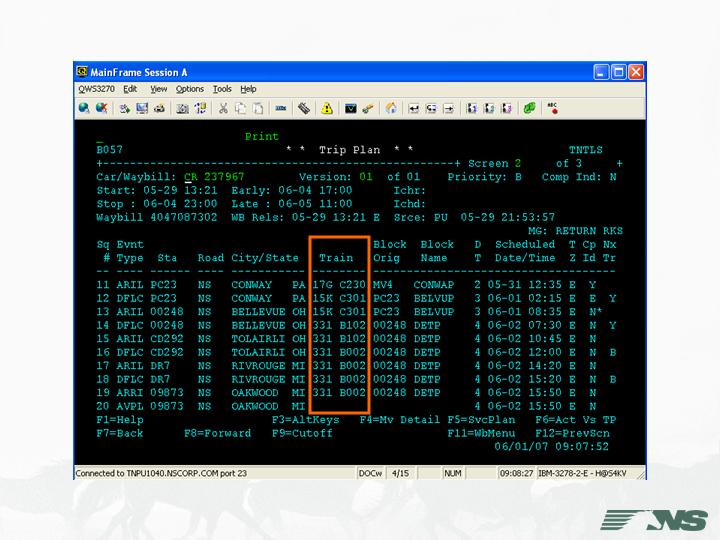
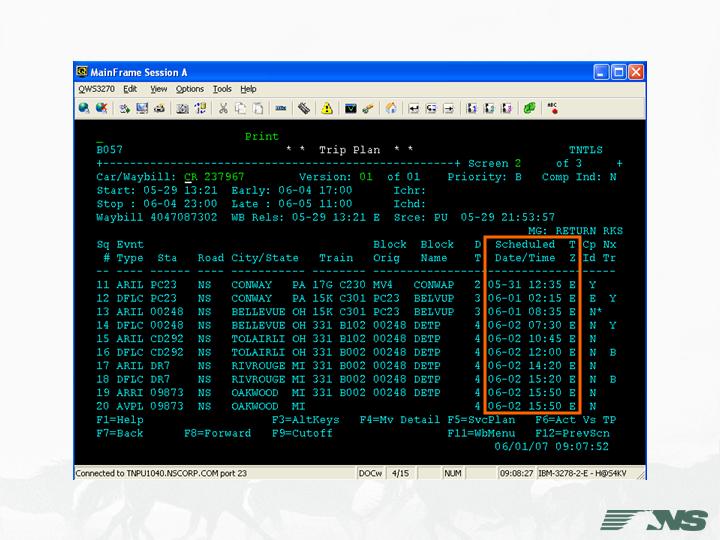
And, this is the outcome of the process. In its raw form - this is the trip plan that we use route the car, supply ETAs to our customers and partners, and to measure the overall shipment performance and the constituent transportation components.
This is the second page of a three page plan to move a car between Morrisville, PA an Detroit, Michigan.
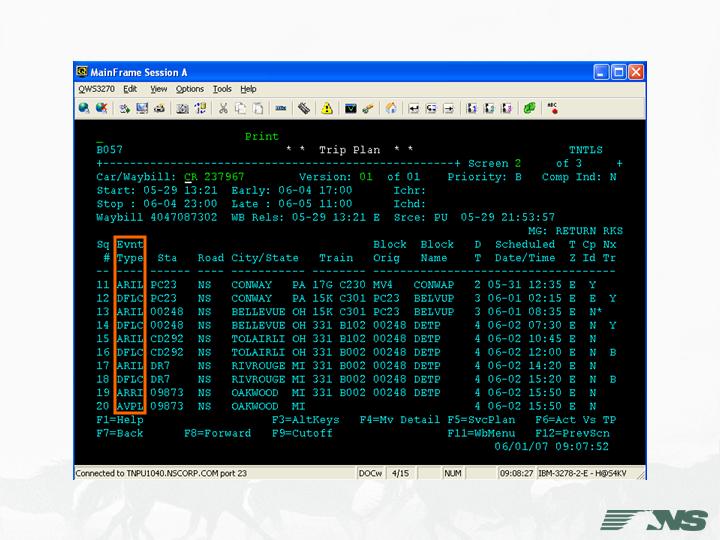
Within this plan, we specifically identify:
The Trip Plan
arrival and departure events;
The Trip Plan
event locations;
The Trip Plan
trains; and
The Trip Plan
event date and times.

Two Measurement Levels
Shipment performance and consistency are the high
level, customer view of transportation performance.
Shipment performance must be decomposed into
actionable measures aligned with transportation
operations
Train Performance
Connection Performance
Transportation Metrics
Of course, the most important measurement aspect is overall shipment performance, which is the high level, customer view of our transportation performance.
But to support shipment performance, we must decompose the transportation process into the base components – train performance and connection performance.
Train Performance
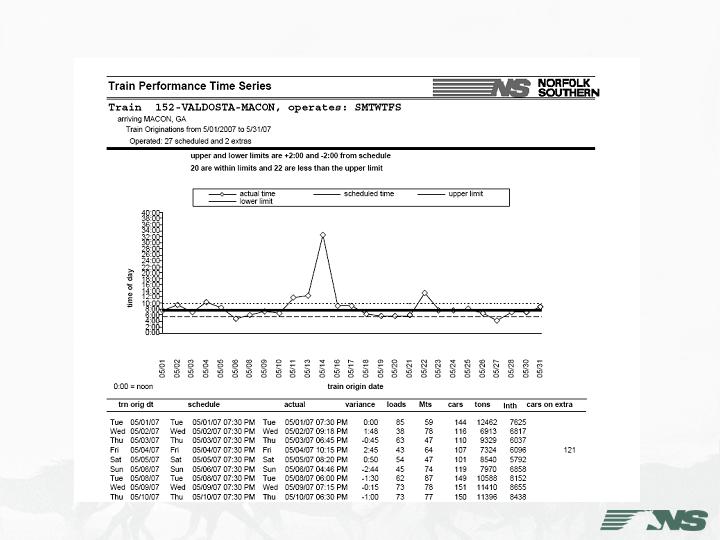
For train performance, we monitor schedule adherence with a variety of metrics. This graph shows time-of-day on the vertical access and days on the horizontal axis. The heavy horizontal line indicates the scheduled time, the dashed lines above and below indicate the upper and lower “on-time” limits, while the plotted points indicate actual performance.
This is the performance of train 152, which runs from Valdosta to Macon, GA, into Macon for the month of May.
Train Performance
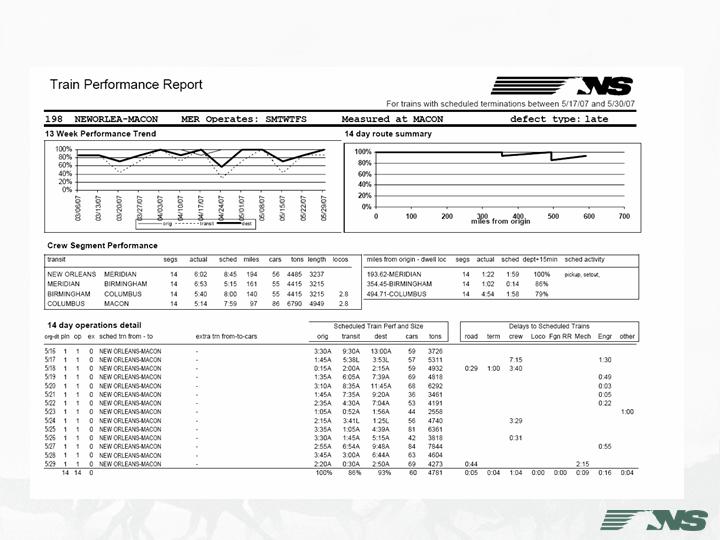
Here is another train performance metric, but with more information on schedule deviation and delay factors.
The train under review is train 198, which runs from New Orleans to Macon. On the bottom half of the screen, you see the performance data of train 198 for the last 14 days.
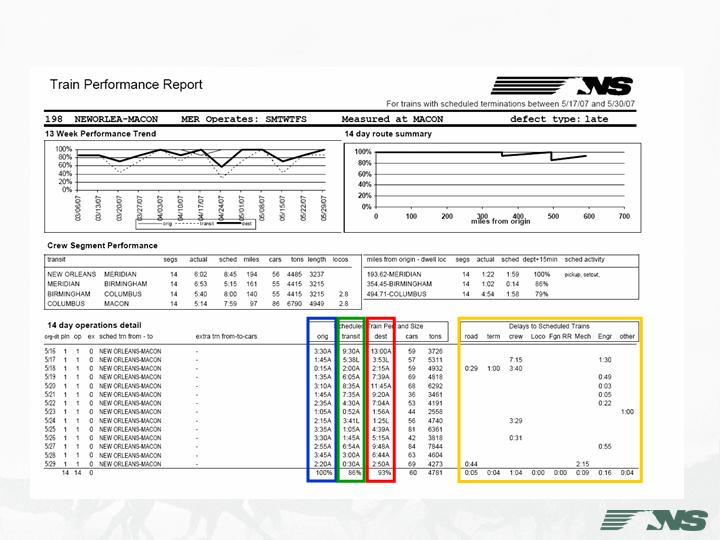
Train Performance
On this report, departure performance from origin (New Orleans) is displayed in the column outlined in blue, over the road transit performance is outlined in green, and performance at destination (Macon) is outlined in red. Delay information is outlined in yellow.
As you may or may not be able to see, this train is getting out of New Orleans on-time 100% of the time, but it is only making it over the road on-time 86% of the time, for an average on-time arrival into Macon of 93%. This clearly points to line-of-road delays as the problem. If you look in the yellow box, you can see the different delay categories and the impact on each day. Crew delay on line-of-road is the culprit here.
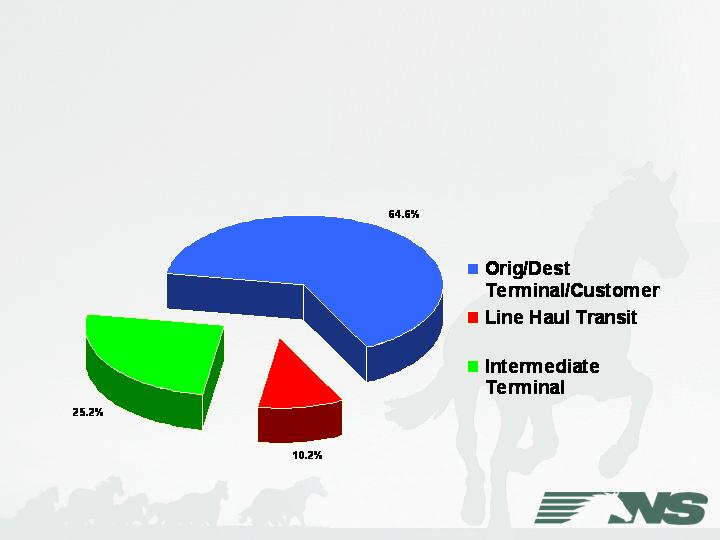
Where do cars spend their time?
As important as train performance is – more important, from the perspective of overall shipment performance, is connection performance. In fact, connection performance is highly correlated to shipment performance.
This pie chart breaks down the entire loaded car cycle into 3 components –
Customer time, including origin and destination terminal time, in blue,
Intermediate terminal time in green, and
Line Haul Transit Time in red - the time it is moving on a train.
As you can see, a car spends 250% more time at intermediate yards awaiting connection than it does on a road train – that it why it is so important to get the connection right.

Connection Performance
There are currently 284 yards monitored
and measured for connection performance
Because of this, there are currently 284 yards that are monitored and measured for connection performance on Norfolk Southern.

Connection Planning Tools
Allows Yardmasters to scan trains or yards for
cars that are scheduled to make a specific
outbound train.
Cars are color coded by connection status:
RED - Cars that have already missed their scheduled
connection
GREEN - Cars that are scheduled to the train in
question
ORANGE - Cars that are in jeopardy of missing their
scheduled connection due to a late inbound train
BLUE - Cars that will advance ahead of schedule if
they are moved on the train in question
Within TYES, we provide yard personnel a variety of views to allow yard personnel to scan trains and yards for cars that are scheduled to make a specific outbound connection.
We are about to get into some example of this, but before we move on to the next slides, let’s first review the color coding scheme.
Red – Cars that have already missed their scheduled connection and have been rescheduled – these are the hot cars.
Green – Cars that are scheduled to the train in question. We just need to keep these on-plan.
Orange – Cars that are in jeopardy of missing their scheduled connection due to a late inbound train. These may require special action.
Blue – Cars that will advance ahead of schedule if they are moved on the train in question.
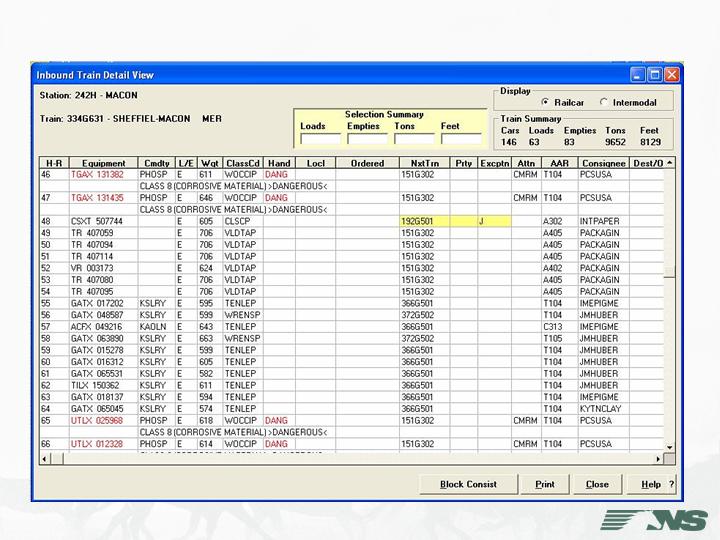
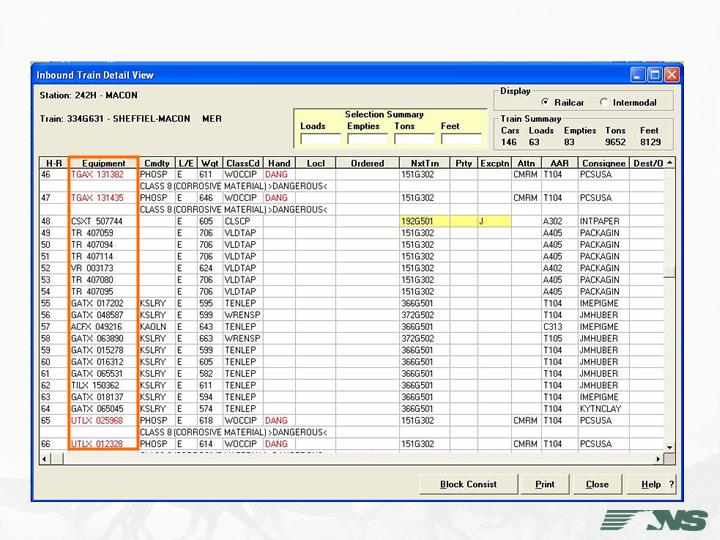
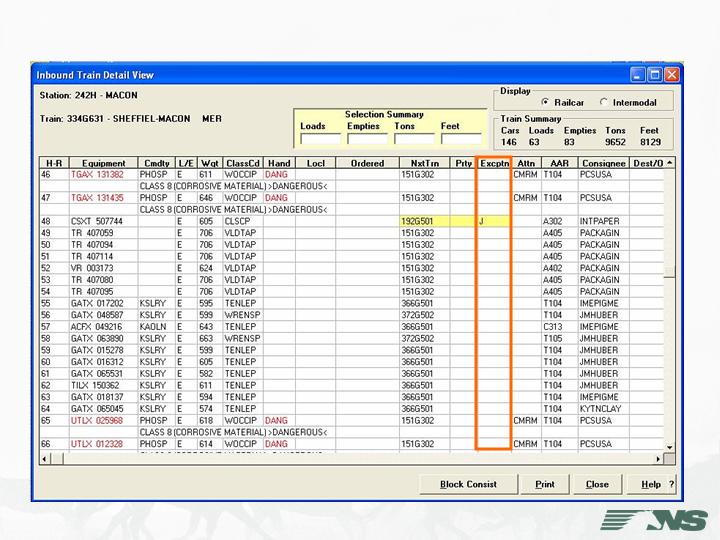
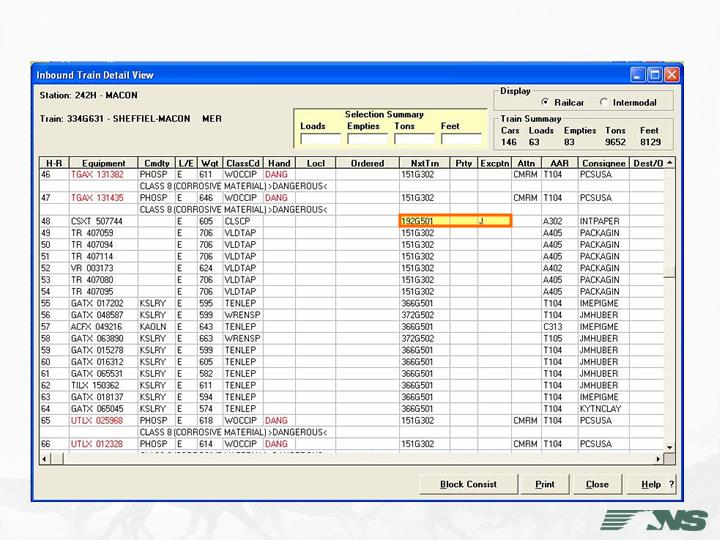
Connection Planning
This is the inbound train consist for train 336 from Sheffield, AL to Macon, GA at Macon. There are 146 cars on this train and we are looking at lines 46 through 66.
Note the:
Connection Planning
car initial and number,

Connection Planning
next scheduled train, and
Connection Planning
exception column.
Connection Planning
This train is arriving late into Macon and the system has determined that this car may be in jeopardy of missing its outbound connection on train 192 if special action isn’t taken.
It is important to remember that this view is available prior to the train’s arrival into Macon, thus giving the yardmaster ample to take the appropriate action.

Connection Planning
As opposed to the inbound train consist we just saw, this tool is used to plan outbound trains. In this example, we are planning the cars that will make up train 118 from Macon, GA to Linwood, NC.
The same color scheme applies.
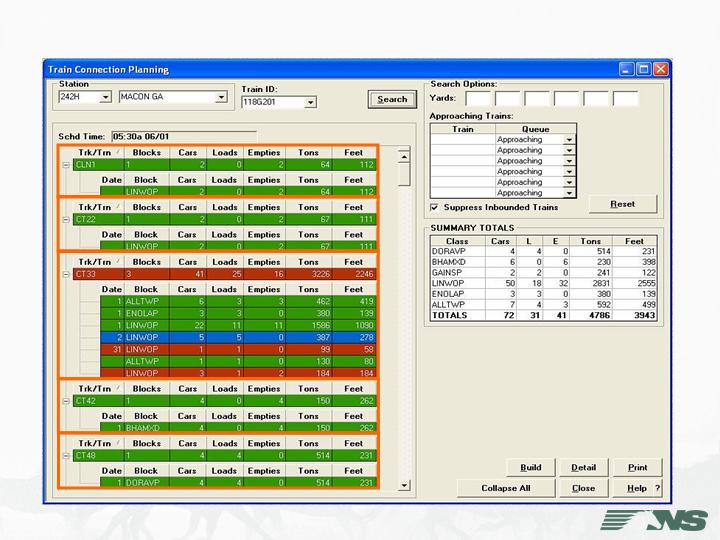
Connection Planning
Each section represents a different classification track in the Macon yard.
Based on the color coding, the yardmaster would prioritize the cars on train starting with the red cars, followed by the green, and then the blue.

Connection Performance
This is an after-the-fact, connection performance metric for Macon.
Before we get into this – I’ll tell you this isn’t a particularly good day at Macon, but it makes for a more interesting example.

Connection Performance
What this table is telling us, is that on May 30th we out-bounded 1099 cars from Macon.

Connection Performance
717 of the 1099 cars were entitled to make connections at Macon. The others were moving on bulk commodity, unit trains or trains that were not handled in the yard.
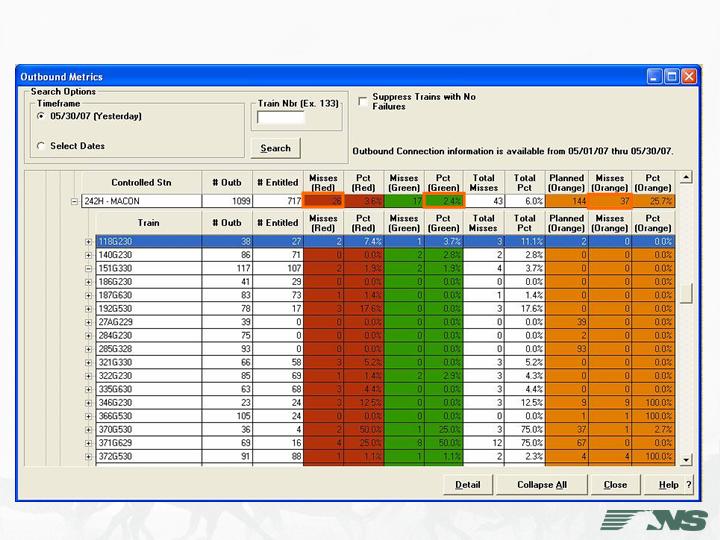
Connection Performance
Of the 717 cars that were entitled to be switched at Macon, 80 cars failed.
26 cars in the red category that failed to make connection for a second time.
17 cars in the green category that failed to make their original connection.
And 37 cars in the orange category that failed to make their original connection, but were on a late inbound train. That distinction isn’t an excuse – it’s still a failure, but it just helps us to better understand the cause.
If we drill down to a specific train – train 118 highlighted in blue.
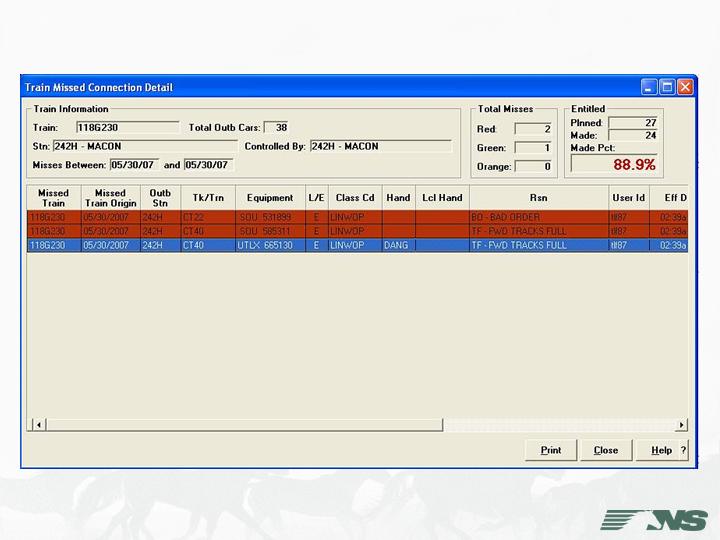
Connection Performance
We can see that the three failures were due to one car that needed to be repaired and two delayed by forwarding yard tracks full (or said another way, heavy outbound volume).
If we see this on a consistent basis, it may indicate that we may need to add on another train or tweak the network routing algorithm.
Here is Macon’s connection performance for the last 15 months. Same color scheme - the yellow line indicates the number of cars handled.
Actually, the biggest ongoing issue at Macon is that we are advancing too many cars ahead of schedule.
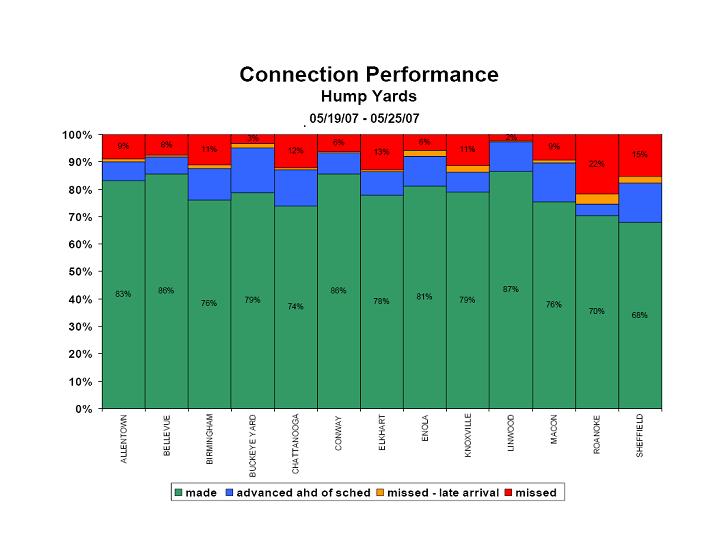
Just to give you a flavor for the rest of the system – here is the performance for the week ending May 25 th for our 13 large production yards.

Agenda
Systems used to support a Scheduled
Railroad
Advanced Transportation Systems currently
under Development
OK, let’s move on to the next topic of discussion – advanced transportation systems currently under development at Norfolk Southern.
Advanced Transportation
Systems
Train Management
Unified Train Control System (UTCS)
Optimized Train Control (OTC)
Locomotive Engineer Assist & Data
Recorder (LEADER)
Shipment Routing & Planning
ABC Next Generation (ABC NG)
I’d like to tell you about four systems that represent large, cutting-edge development initiatives that also have a large capacity utilization and efficiency component to them.
Under Train Management we have Unified Train Control System or UTCS, Optimized Train Control or OTC, and Locomotive Engineer Assist & Data Recorder or LEADER.
Under the Shipment Routing & Planning area we have ABC Next Generation.
Unified Train Control System
UTCS Coordinates
Train Movement
Track Maintenance
Analogous to Air Traffic Control
Installed on the Georgia & Piedmont Divisions
To be installed on the Alabama, Central, and Virginia
Divisions in 2007
Features
Exceptional Disaster Recovery
Dispatching System/Function Integration
Advanced Movement Planning
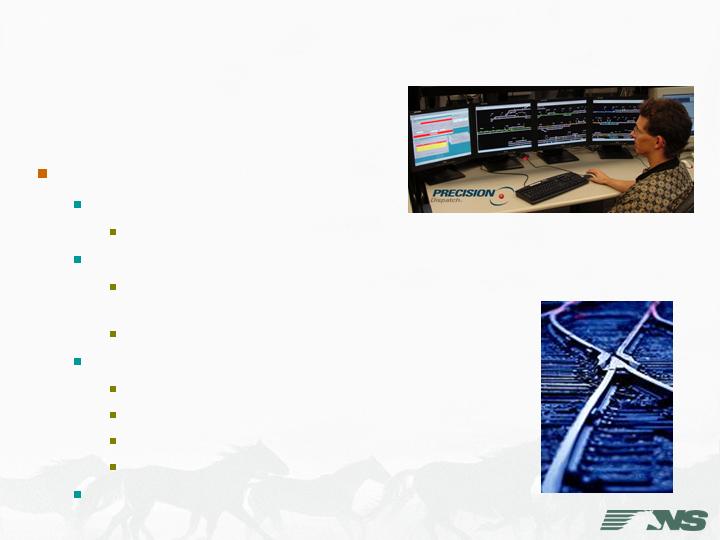
The Unified Train Control System, or UTCS, is our new dispatching system that we are working with General Electric in development and implementation.
UTCS coordinates train movement and track maintenance in real-time over the network. It is analogous to air traffic control. We have already installed UTCS on the Georgia and Piedmont Divisions and in 2007 we will install it on three more of our 11 divisions. UTCS features exceptional disaster recovery, dispatching system/function integration, and advanced movement planning.
Let me talk a bit more about the movement planner.
Movement Planner
Today
Train Sequencing developed by dispatcher
Future
System computes optimal moves based on network level
information
Lengthened Planning Horizon
Decision Factors
Infrastructure & Resource Constraints
Track Topology and “Laws of Physics”
Train Priority
Train Performance against Schedule
Signaling and Routing executed automatically
Unified Train Control System
Today, while we have dispatching systems currently in place, each dispatcher must mentally develop a movement plan over his territory with less than full visibility to the territories adjacent to him.
Quite simply, while we believe we have world class dispatchers, we also believe that we need to move beyond human capability in coordinating train movements across the network. We need a movement planner that coordinates train movements on a network level with a planning horizon many hours into the future.
While this is a daunting development project, in the last several years we have made huge strides in system integration and data quality in order to make this project successful.
As you would expect, the decision factors used in planning are -
Infrastructure & resource constraints, which include tracks, sidings, switches, and yard capacity,
Track topology & laws of physics, such as speed restrictions and train acceleration and braking capability,
Train priority, and
Train performance against schedule, which means trains running behind schedule get priority over trains running ahead of schedule.
Service, Operations, and Capacity Enhanced
Shipment Consistency
Utilization of Existing Infrastructure
More Consistent Train Speeds
More Consistent Crew On-Duty Times
Maintenance Scheduling
Exception Handling & Recovery
Coordination of Yard and Mainline Activity
Unified Train Control System
Service, operations, and capacity are all enhanced with regard to shipment consistency
Utilization of existing infrastructure
More consistent train speeds
More consistent crew on-duty times
Maintenance scheduling
Exception handling & recovery
And, coordination of yard and mainline activity.
Optimized Train Control
OTC Enforces
Movement Authority Limits
Speed Limits
Features
Virtual Signaling System
Satellite Tracking
Improves
Accident & Collision Avoidance
Train & Switch Position Visibility
Throughput and Capacity of Existing Infrastructure
Efficiency of Personnel
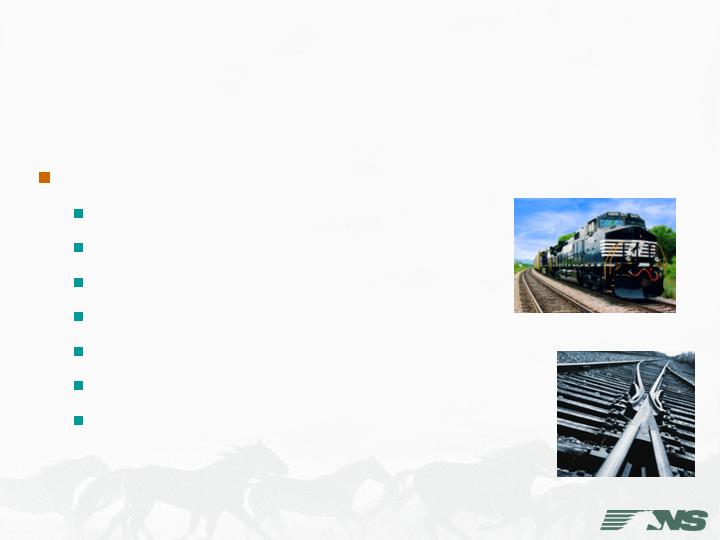
The next system – Optimized Train Control, or OTC, is Norfolk Southern's development of positive train control. OTC will work in conjunction with UTCS to facilitate the safe and efficient movement of trains across the network.
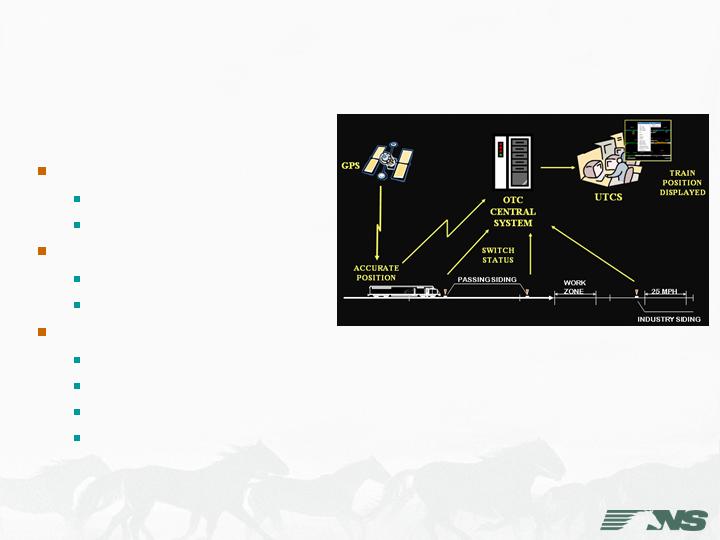
OTC enforces train movement authority limits (in other words – the section of track a train has permission to occupy) and speed limits.
OTC features a virtual signaling system, where movement authorities are electronically delivered to the locomotive cab and satellites are utilized for precise locomotive tracking.
The system improves -
Accident & collision avoidance,
Train & switch position visibility,
Throughput and capacity of existing infrastructure, and
The efficiency of personnel.
Optimized Train Control
Development Location
Columbia to Charleston, SC
Non-Signaled, 114 miles
52 switches
18 trains per day
Phase 1 – Completed
Train Tracking
Switch Awareness
Phase 2 – In Process
Electronic delivery of
Movement Authorities
Crew Alerts
Automated Braking
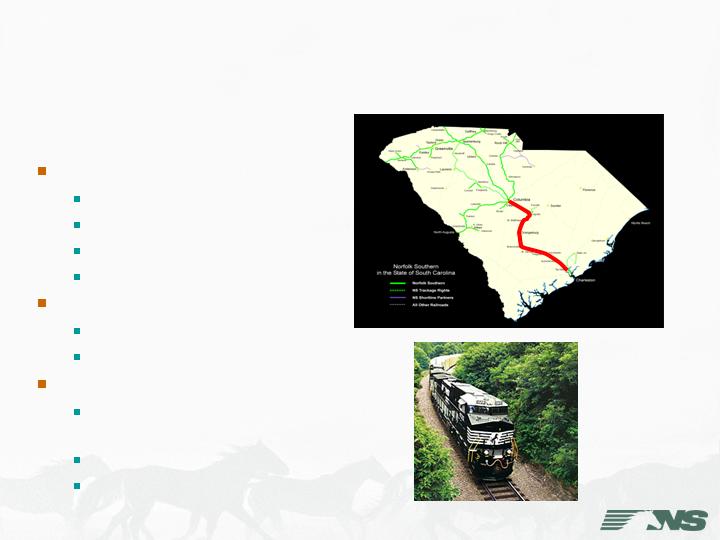
OTC is being developed on the corridor between Columbia and Charleston, SC on 114 miles of non-signaled territory. We have 52 switches and run 18 trains per day over all or parts of the line.
Phase 1 was completed in early 2007 and included train tracking and switch position awareness.
Phase 2 is scheduled to be completed and ready to install in mid to late 2009 and include:
electronic delivery of movement authorities
crew alerts, and
automated braking.
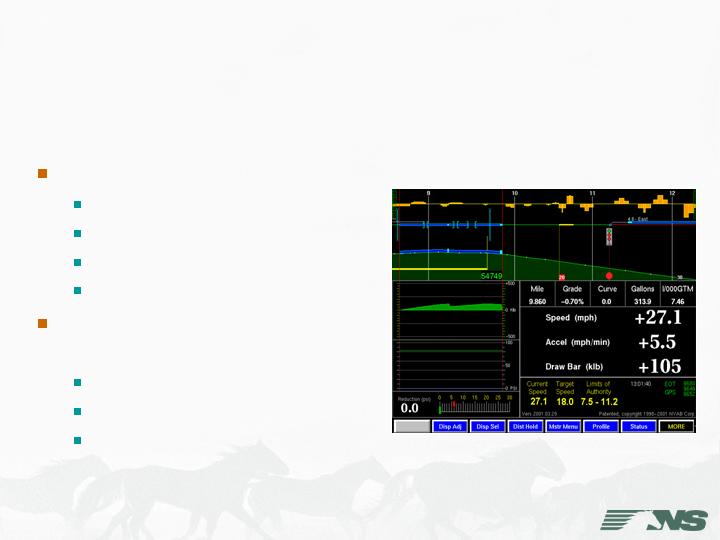
Locomotive Engineer Assist &
Data Event Recorder
Monitors train state in real-time
Location
Track Topology
Speed and Acceleration
In Train Forces
Recommends Optimal
Operations
Throttling
Braking
Minimum and Maximum Speeds
Next, Locomotive Engineer Assist & Event Data Recorder, or LEADER, shares the locomotive cab with OTC and further enhances safety and efficiency.
It has a long name, but it is really a simple concept… LEADER monitors the trains location, track topology (is it going up a grade, descending a grade, about to go into a curve), speed and acceleration, and in train forces and recommends optimal operations for throttling, braking, and minimum and maximum speeds.
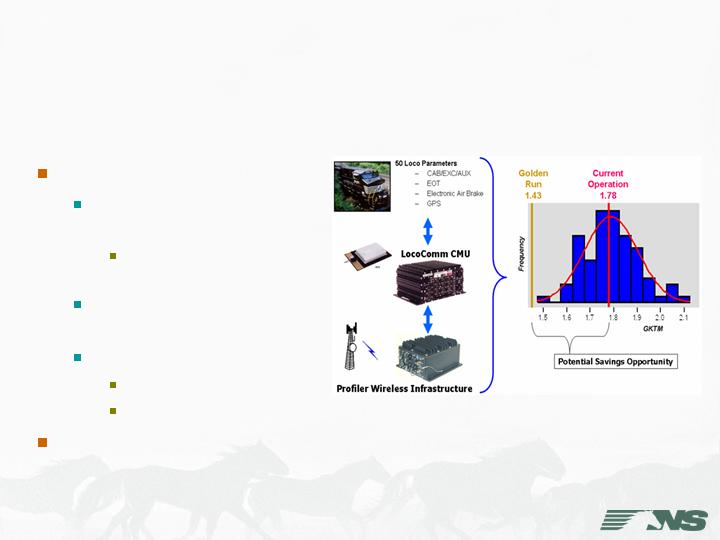
Locomotive Engineer Assist &
Data Event Recorder
Benefits
Shortened learning curve
for new engineers
Engineer feedback via
wireless downloads
Reduced Fuel
Consumption
Improved Train Handling
Train separations
Derailments
Implementation starting in
2007
The benefits include –
A shortened learning curve for new engineers due to the fact they have essentially an expert on-board. In addition, the data event recorder part of the system allows for after the fact review and feedback of train handling.
Reduced fuel consumption through more prudent acceleration and braking.
Improved train handling with resulting reductions in train separations and derailments.
Implementation starts in 2007.

Algorithmic Blocking and Classification
Unique system that routes shipments efficiently through
the network
Mileage
Handlings
Facilitates easy changes to the operating plan
Allows for quick, temporary “in and out” alterations in
traffic flows with simple logic adjustments
Derailments
Disasters
Major Events
ABC Next Generation
Before I tell you about ABC Next Generation, let me tell you a little more about ABC. If you recall from earlier in the session, ABC or Algorithmic Blocking and Classification is our car routing algorithm.
It is a sophisticated system, unique within the rail industry, that routes cars efficiently through the network minimizing car mileage and handling.
It allows for easy changes to the operating plan as well as quick, temporary, “in and out” alternations in traffic flows that are needed during derailments, natural disasters, and major public events.

ABC Next Generation
Next Generation Enhancements
Time Dimension
Train and Yard Capacity – Reservation System
Allows
Better use of capacity on trains and at terminals – avoiding
congestion and providing more consistent service
Better utilization of locomotives and cars
Control of cars flowing into and through the network
Smoothing of demand at yards
Consistency of arrivals at destination
Implementation in 2008 and 2009
Under ABC Next Generation, we will add the time dimension to the algorithm followed by a train and yard capacity component which is essentially a train reservation system. ABC NG will then route around oversubscribed trains and yards – dynamically changing traffic flows to avoid potential bottlenecks in the network.
This will allow us to make better use of capacity on trains and at yards, avoiding congestion and providing more consistent service.
As a result, we will get better utilization of out locomotives and cars and better control of cars flowing into and through the network due to the smoothing of demand at yards and consistency of arrivals at destination.
Implementation for the time dimension phase is scheduled for 2008 and 2009 for the train and yard capacity phase.
Thank you for your time and attention.