
NS Coal Business
Daniel D. Smith
Senior Vice President Energy and Properties
Thank you and I am glad to be with you today. Let’s look into what is going on in the energy markets this year and what we are doing to grow our coal business and enhance our services.
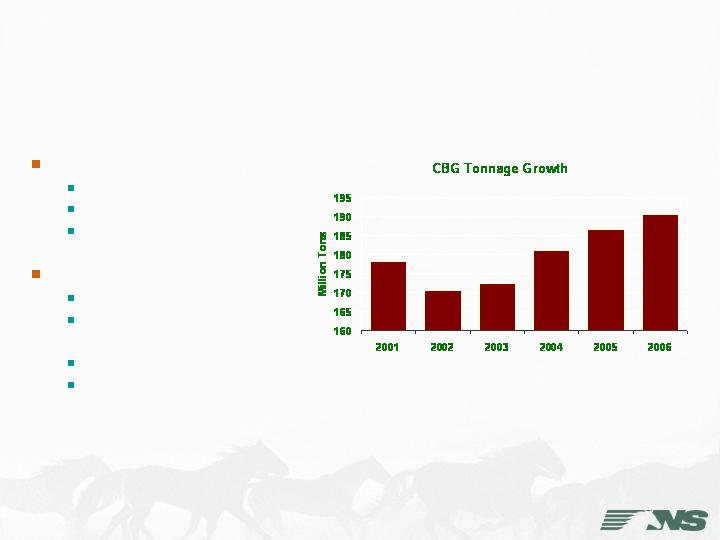
Coal Business Group
2006 record volume year
190.6 million tons
2.1% increase over 2005
$2.3 billon
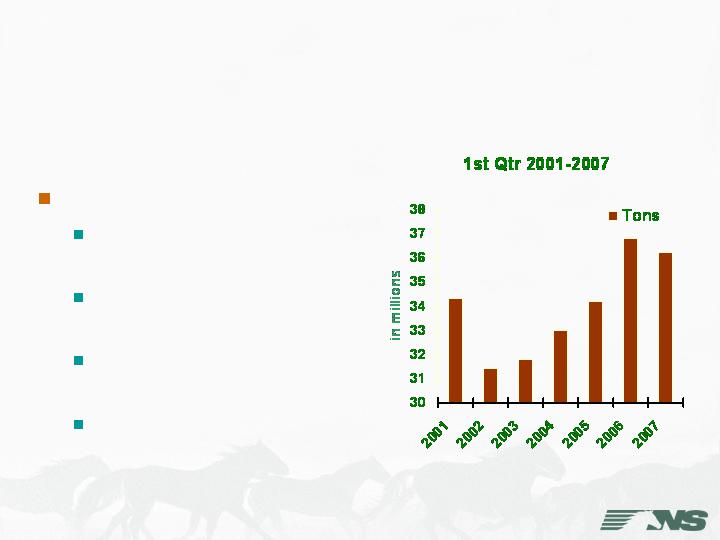
1st Q 2007
45.8 million tons
-2.5% YOY
$557.2 million
-0.2% YOY
First, a quick look back. 2006 was a record year in many ways for our coal franchise.
It was a record revenue year with revenues of $2.3 billion, which was a 10.2% increase over 2005.
2006 was also a record volume year with 190.6 million tons, which was a 2.1% increase over 2005 and 7% over 2001.
In the first quarter of this year, volume slowed but revenues held relatively steady. Several contracts have been re-priced this year and the longer haul, higher revenue per car, export volumes have been strong, offsetting declines in domestic metallurgical coal.

Coal Business Group:
2006 Tonnage By Market
With respect to the individual market segments within the Coal Business Group, the utility sector represents our biggest, making up almost 78% by volume. While the other sectors are vital, the steady growth in our business has occurred in the utility segment. We think this makes our coal business more ratable as electricity use in this country has increased in all but three out of the last 50 years.
The Coal Group serves 140 different mine locations and delivers coal to many different markets, including utilities, industrial customers and export terminals. This coal network, unlike the Powder River Basin, adds complexity to the operation but, as I will discuss later, we manage it with scheduling and technology.
NS Coal Markets
1st Quarter and Beyond
Utility Markets Mixed
Electric generation is
strong
Utility stockpiles are
leveling off
Serious cooling demand
has yet to arrive
NWS predicts hotter
temperatures
Coal burn for electric generation has been high in comparison to historical demand growth in the first quarter; however stockpiles have remained at or slightly above target levels. According to our information, the coal burn by electric generators in the Mid-Atlantic and South Atlantic regions (covering most of the NS utility franchise) is up 5.1% and 4.9% respectively through mid-May. These are significant increases when compared against total historical electric demand growth which usually is in the range of 1.5 to 2.5% per year, which indicates stockpiles are moderating from 2006 levels.
Serious cooling demand has yet to arrive but the National Weather Service is forecasting a hotter and dryer than normal summer for the southeastern United States, which could lead to higher electricity demand.

NS Coal Markets
1st Qtr and Beyond
Exports Strong
Vessel delays at
Australian ports
Capacity issues in
Canada
Pricing improvements
Looking at exports for first quarter 2007, foreign receivers increased shipments to meet coal supply volume requirements in contracts that expired March 31, 2007. In addition, demand for U.S. coals has been strengthened by long vessel loading delays at Australian and Canadian ports due to capacity issues. Australian coal continues to be impacted by rising energy costs and vessel backups at ports, which is making U. S. metallurgical coals more attractive, especially in a weak dollar environment.
The export contracts are re-priced on April 1 of each year and therefore, we are pricing to the market each year.

NS Coal Markets
1st Quarter and Beyond
Metallurgical challenges
Raw steel production
down 7.2% thru May 26
Coke furnace outages
reduce inbound coal &
outbound coke
Met. Coal, Coke & Iron ore
Without question, the domestic metallurgical coal, coke and iron ore markets have been our greatest challenge this year even though many contracts have been re-priced to the market. Blast furnace outages and a shift in sourcing have weakened NS volumes. A decline in iron ore movements is primarily due to the consolidation of the steel industry. The automotive industry’s market decline is reflected in the reduction of steel production by 7.2% this year and that has reduced both inbound coal to blast furnaces and also outbound coke movements from coke producers.
NS Coal Markets
1st Quarter and Beyond
Industrial strong
New business in 2007
Strong pricing
Tied to GDP growth
Our comparatively small industrial coal market includes coal shipments to industries like Eastman Chemical and corn processors like ADM. Volume growth from 2005 to 2007 is a reflection of new business and growth in GDP, which has increased moderately this year.

NS Coal Yields
Pricing
Still strong environment
Tons/Car
New cars accelerate
Mix of business
More short haul
Overall +3.4%
Effect on
$$ Yield
Year-to-date, we have seen strong pricing and improvements in the tons loaded per car, which have raised yields. At the same time, changes in mix favoring lower than average yields have reduced yields such that we have seen a RPU increase of about 3.4% through the 1st Quarter.
We continue to re-price expiring contracts to reflect current market conditions and we are finding that the environment remains strong.
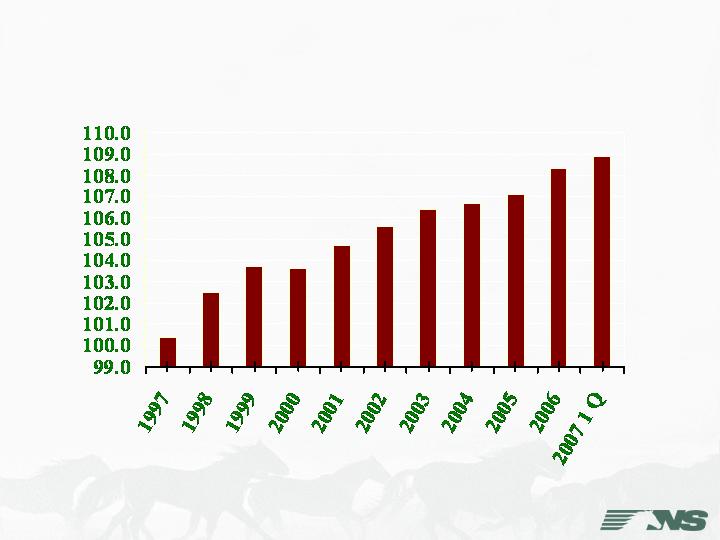
Average Lading Weights
All Cars
Tons/Car
Average total lading weights for our coal business have grown by 4.2% since 2001 and almost 9% over the last 10 years.
Raising coal payloads delivers significant efficiencies, which in turn adds capacity to the rail network. Higher payloads can also significantly reduce the number of trains required to move the same amount of coal tonnage.

Customer Service
Argus Survey
Customer service ranked 1st or 2nd place in last eight
quarters
15% improvement 1st qtr 2007 over 1st qtr 2006
Tied closely to shipment performance
Customer service continues to be important to us. Argus Rail Business publishes a quarterly customer service survey of BNSF, UP, CSXT and NS coal customers. The 1st Qtr 2007 results show NS ratings for customer service continue to compare well to the rest of the industry. For the eighth quarter in a row, NS ranked 1st or 2nd in customer service, with 1 st quarter 2007 showing a 15% improvement over 1st quarter 2006.
Customer Service-
NS Loaded Transit Times
Data through May 31, 2007 vs. same period last year
Utility
South: 24.3%
improvement
North: 14.2% poorer
Industrial
38.8% improvement
Domestic Metallurgical
13.1% improvement
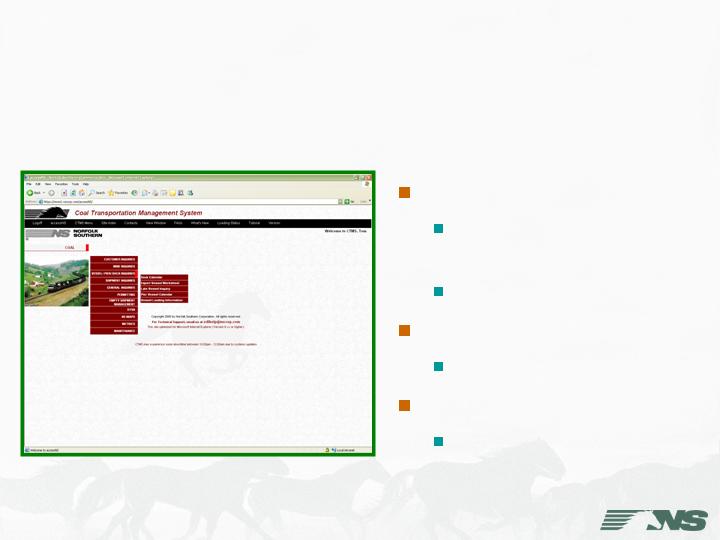
CTMS on accessNS
Using the tools available in our web-based Coal Transportation Management System, we manage all shipments within the coal network. Our customers have the same visibility and access to performance data for the loaded and empty shipments that we utilize on a daily basis.
As an initiative to improve customer service and asset utilization, we monitor the loaded transit times for our largest customers in each of our market segments. As you can see here we have made impressive improvements this year. Loaded transit times for trains have improved with the exception of Utility North, which was negatively impacted by harsh weather in February and March.
Customer Service-
Scheduled Coal Trains
Scheduled coal train service
Five scheduled trains from Central
Appalachia
Various Southeastern customers
began scheduled service
Plans to expand service
Benefits
Improved locomotive and crew
availability
Quicker transit times
More reliable and predictable
service
NS has been implementing scheduled train service for some of our bulk coal shipments.
As you can see, our transportation team has already begun implementing schedules for many coal customers with good results. By scheduling these trains, we can improve locomotive and crew availability, cut transit times and produce a more reliable and predictable product. A benefit to the improvement in transit times will be reduction in car requirements and associated capital purchases.
We are constantly looking for opportunities to expand applications of the scheduled coal trains, improving our profits on existing traffic.
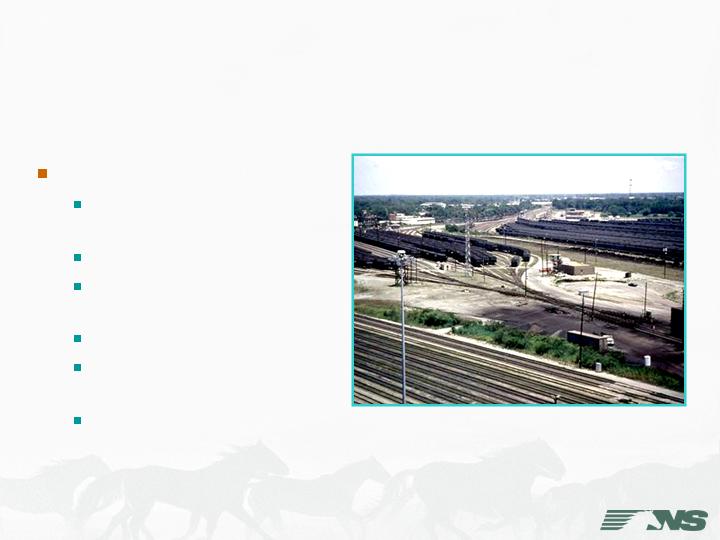
Customer Service-
Coal Handling Terminals
B.R.I.M. Technology
Software + Readers Track
Inventories
Ease of Use/Efficient
Improves Demurrage
Accuracy
Provides Coal Car Visibility
Helps Manage Vessel &
Barge Loading
Standardizes Terminal
Handling
We are also implementing a new Bulk Rail Inventory Management system (BRIM) that will become the main platform for managing coal moving through our coal unloading terminals at Sandusky, Ashtabula, Wheelersburg and Lamberts Point.
BRIM will, among other benefits, help customers manage coal stocks within the terminals, help with blending, and sharpen demurrage applications by simplifying the process and standardizing calculations.
We expect to improve coal car utilization with this new system.
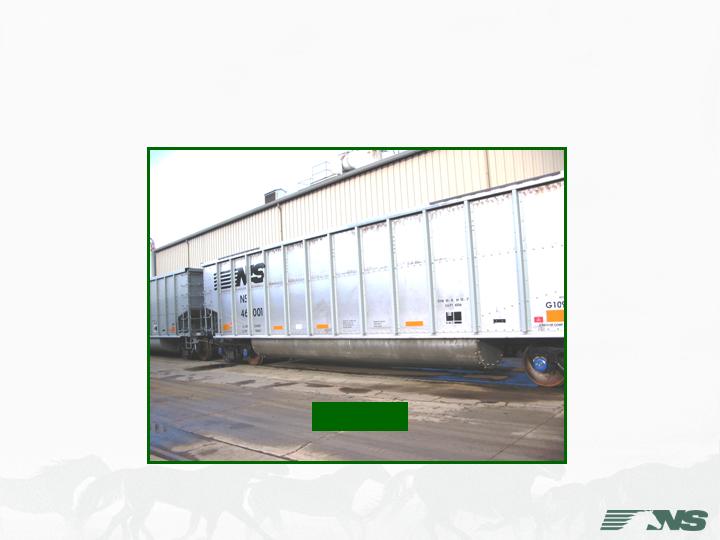
Customer Service-
New Coal Car Technology
118 TPC
We have an aging coal car fleet and have made significant and detailed plans to replace over 27,000 coal cars in an orderly fashion over the next decade. In working with car builders, we have developed replacement coal cars that will significantly increase the carrying capacity therefore reducing the amount of cars needed in replacement. Further operating benefits include a reduction in crews, locomotives, and congestion to handle the same volumes. Currently, our car fleet has an average lading of 102 tons per car. This fleet handles roughly 50% of the volume we move with the other half in private cars. The new replacement gondola car will have a carrying capacity of 118 tons per car.

Customer Service-
Coal Car Fleet Investment
Private cars
Lowers revenue
Drastically reduces car distribution flexibility
Move to specific customer
Haul specific qualities
System cars
High return on investment
Better serve complex coal network
Flexibility to meet customer car demands
We’ve decided to maintain the current ratio of NS owned cars, rather than encourage more private cars. The private cars are all owned by certain utilities, which effectively lower those customers' contract rates to compensate for the cost of the cars. While those contracts have served us well, increasing the amount of private cars in our system would have a negative effect in supplying our customer needs. Many of the mines we serve in Central Appalachia, produce coal that moves in the export, domestic metallurgical, industrial and utility markets, which moves through the same load outs. Having NS owned cars gives the mines and NS flexibility to ship coal of varying qualities to many different customers without delay. Private cars, on the other hand, have to move to a specific customer and haul specific qualities of coal.
As to whether NS owns or leases coal cars, we believe we are best served by investing the capital as it maximizes the return over the long term. Given the profit requirements of the leasing companies, the expected growth of coal over the coming decades which drives the need for these cars well into the future and our current private car mix, we have concluded that we should own the coal car replacements as the fleet is replaced over the next decade.
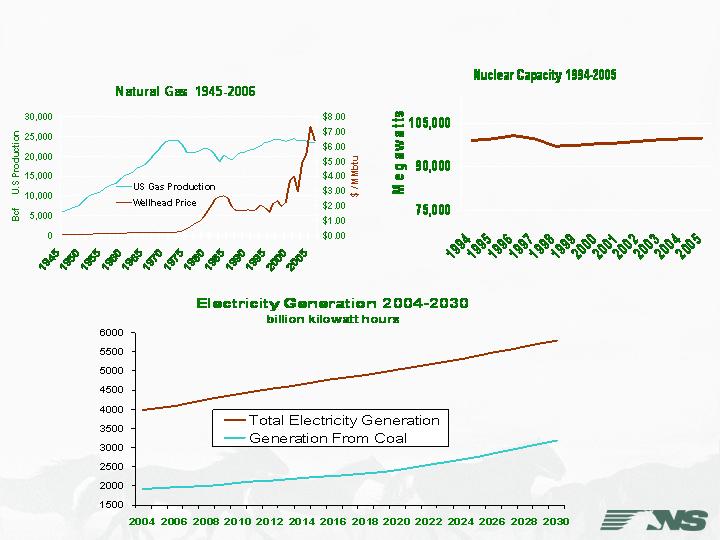
Energy Markets
COAL: +63%
Looking forward, the energy markets indicate a promising future for coal.
First, in the utility market, we anticipate continued high natural gas prices, mostly at levels that remain uncompetitive with coal on a strictly long-term economic basis. We know that capacity at the current nuclear generation facilities has peaked and that there is very little room for growth there.
The EIA supports our contention that we are in for some longer-term coal fired generation growth. EIA right now is projecting electricity demand to increase each year through 2030, raising coal demand by 63% or 2% per year.
However, we understand that some form of carbon constraints will likely be placed on the coal fired generation industry in future years. We think that technology for capturing and sequestering CO2 can be proven. There are also many opportunities for using coal to make liquid transportation fuels and even hydrogen for an anticipated hydrogen economy. In support of these new technologies, NS is looking at opportunities to rail in and/or out coal and other by- products or supplies.
We are seeing the beginning results of this coal growth, as we work with utilities on plans to build new coal fired power plants.

New Coal-Fired Construction:
35.75 million tons/year
NS/CSX
Rail-CIRR
2011
3.5
GA
Hilton
LS Power
NS
Rail-NS
2012
2.0
VA
St Paul
Dominion Pwr
Seminole Elec
Fla. Mun.Pwr.
Fla. Pwr & L
NRG Energy
PPL
LS Power
NRG Energy
Corona, LLC
WE Energies
WE Energies
Power Producer
Palatka
Perry
Glade Cty
Huntley Unit
Montour 3
W. Deptford
Indian River
Sunbury 5
Elm Road 2
Elm Road 1
Plant
FL
FL
FL
NY
PA
NJ
DE
PA
WI
WI
State
6.5
2.75
6.0
3.0
2.5
1.5
3.0
2.0
1.5
1.5
Tonnage
(Millions)
2012
2012
2012
2013
2012
2012
2012
2011
2009
2008
Target Date
Rail
Rail-NS/CSX
Rail-SCXF
CSX-Lake
Rail-NS
Rail-CR
Rail-NS
Rail-NS
Rail-UP
Rail-UP
Delivery
CSX/NS
NS/CSX
NS/CSX
NS/CSX
NS
NS/CSX
NS
NS
NS/CSX/UP
NS/CSX/UP
Carriers
We anticipate about 36 million tons/year of new coal-consumption facilities over the next 5 or 6 years to come on line in our service territory. On the near term, we will be looking at four major projects.
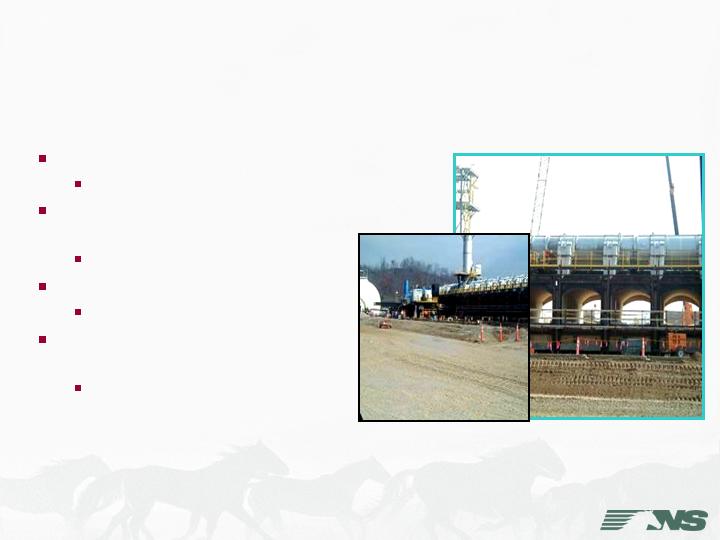
Coal Opportunities
Sun Coke – Haverhill, OH
1.3 M tons coal & coke
WE Energies – Oak
Creek, WI
3.0 M tons coal
L. S. Power - Hilton, GA
1.5 M tons coal
Florida Municipal Power
Agency - Foley, FL
2.75 M tons coal
We will begin to see the start of this projected tonnage June 2008 at the Haverhill coke plant, which is expected to add 1.3 million tons to the NS coal and coke network. The current plant has already begun construction to double the coke making capacity.
New utility coal plants are planned at Oak Creek, WI, Hilton, GA and Foley, FL. These new facilities, coupled with Haverhill, would give us access to over 8 million tons if completed over the next few years.

Western Coal
2001 = 15.6 M
2006 = 38.5 M
N. App/CenPa/Oh
2001 = 33.4 M
2006 = 43.6 M
Central Appalachia
2001 = 96.6 M
2006 = 78.7 M
Imports
2001 = 134K
2006 = 2.3 M
Coal Sourcing Changes Continue
Illinois/Indiana
2001 =10.6 M
2006 =10.6 M
1/11/07
Coal sourcing has certainly changed over the last several years and will continue to do so as utilities add scrubbers and other technologies, and as mining costs rise in certain areas, particularly Central Appalachia. We maintain contact with producers from all mining regions as well as receivers to determine where future coal sourcing will be. We have seen dramatic shifts from Central Appalachia to PRB and Northern Appalachia. We helped bring on-line an expanded import facility in Charleston, SC to serve customer needs in the southeast, and we continue to talk to producers in the Illinois Basin to see how we might move more of that coal.

In response to expanding markets for coal,
NS will
Implement technology to improve customer
service
Improve reliability and efficiency with coal car
replacement
Study new coal train scheduling to realize
improvements
Summary
We are confident the expanding demand for electricity, coupled with our focus on productivity gains, is a great combination for delivering improved performance. Policies such as CO2 regulations could moderate the growth of coal usage; however, over 50% of the electricity produced in this country comes from coal and it remains a vital domestic resource.
We expect to combine technology, capital investment and coal train schedules to realize improvements in customer service and pricing opportunities.

Thank You
Thank you.