Safety and Operations Overview
Mark D. Manion
EVP Operations
Thank you.
In Operations we serve the customers. We also maintain all the assets in this capital intensive business, including repairing locomotives, freight cars and track. Our customers demand reliable transportation service within the North American network, a complex system where we connect with 5 Class I railroads and scores of short lines. Serving our customers requires:
| Consistent maintenance and construction of track, bridges and tunnels; |
| The purchase, renewal and maintenance of rail equipment and locomotives; and |
| A constant 24/7 operating plan that keeps all these elements in continuous and methodic motion. |
It takes significant investment in people, equipment and material, to keep the trains running. Execution is the name of the game. Our team pays attention to the details and has a well defined plan that is focused on minimizing assets and producing safe and efficient service.
Safety and service are the key drives of our success. Safety is a fundamental value at NS. Before we go further, let me review our safety process.
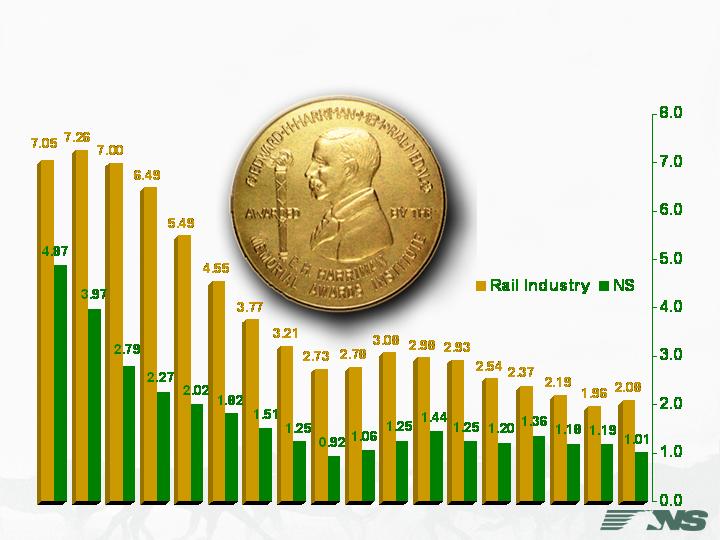
Norfolk Southern’s Injury Ratios
We work hard to prevent injuries and accidents on Norfolk Southern, and one way we chart progress is by an industry standard for measuring the number of injuries per 200,000 man hours worked. The rail industry, then, benchmarks its safety progress through the annual Harriman Award program. We were pleased to have received our 18th consecutive Harriman Gold Medal Award last month. The Harriman Gold Medal Award is given to the Class I railroad with the lowest frequency ratio of reportable injuries.
In 2006, our ratio was 1.01, a 15.1% improvement over 2005.
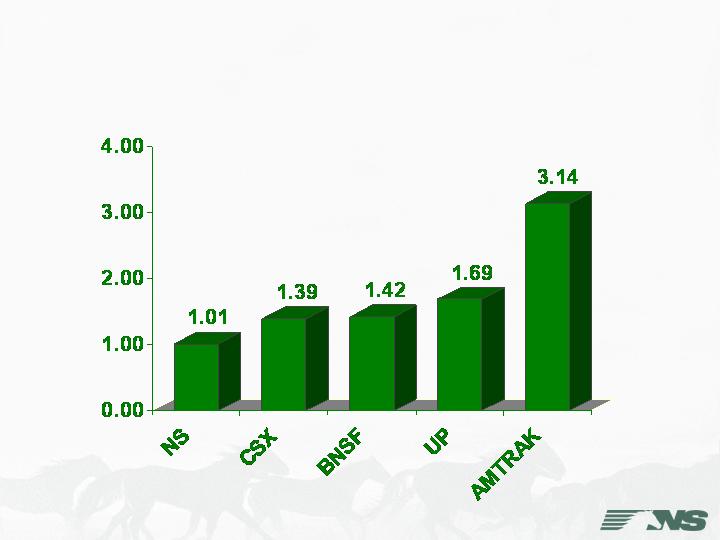
2006 FRA Injury Rates
Our safety record leads the industry, and more importantly, all railroads are making steady progress in reducing injuries.
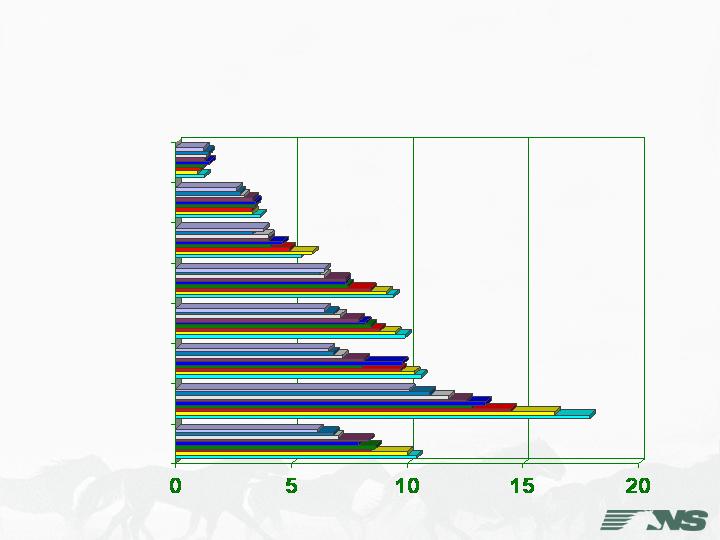
Injury Rates – U.S. Industries
Injury rates per 200,000 employee hours, 1996 through 2004
NS
All Mining
All Railroads
Agriculture
Construction
Manufacturing
Trucking
Transp. by Air
And the rail industry as a whole – and in particular Norfolk Southern – compares favorably with other U.S. industries when it comes to safety.
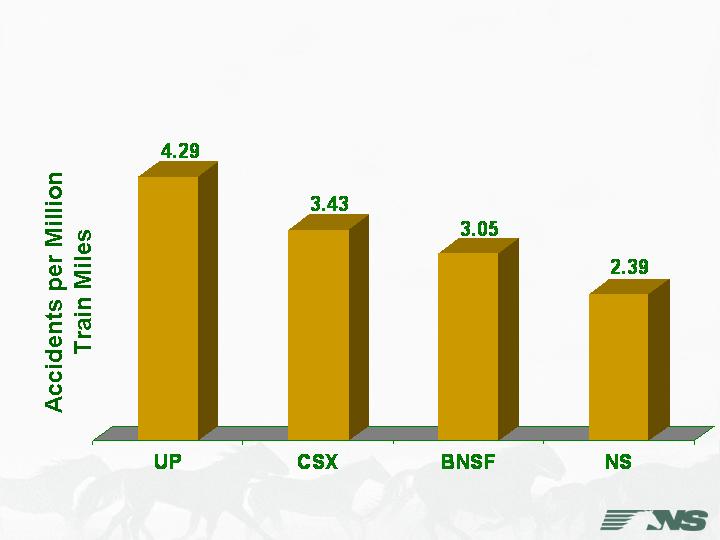
Class I Train Accident Rate
for 2006*
* All train accidents (excluding grade crossing accidents)
All types of track (main, yard, industry, siding)
Similarly, we work hard to prevent derailments and other train accidents. We compare favorably with the major Class I railroads, but we are by no means satisfied and will continue to make progress in reducing accidents.
Class I main track train accident rate for 2006:
UP = 1.28
CSX = 1.22
BNSF = 1.15
NS = 0.87
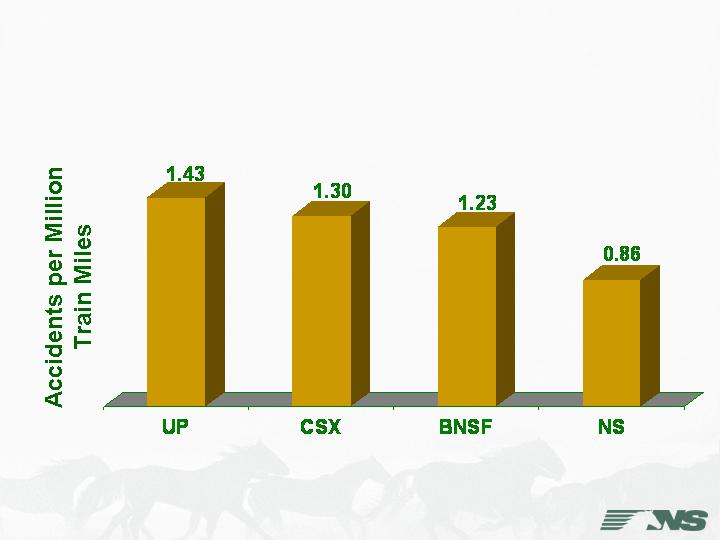
Class I Human Factor
Train Accident Rate for 2006*
* Human factor train accidents only (excluding grade crossing accidents)
All types of track (main, yard, industry, siding)
We divide accidents into four different categories. Here you can see our performance regarding human factor accidents.

Class I Equipment-Related
Train Accident Rate for 2006*
* Equip-related train accidents only (excluding grade crossing accidents)
All types of track (main, yard, industry, siding)
Equipment-related accidents.

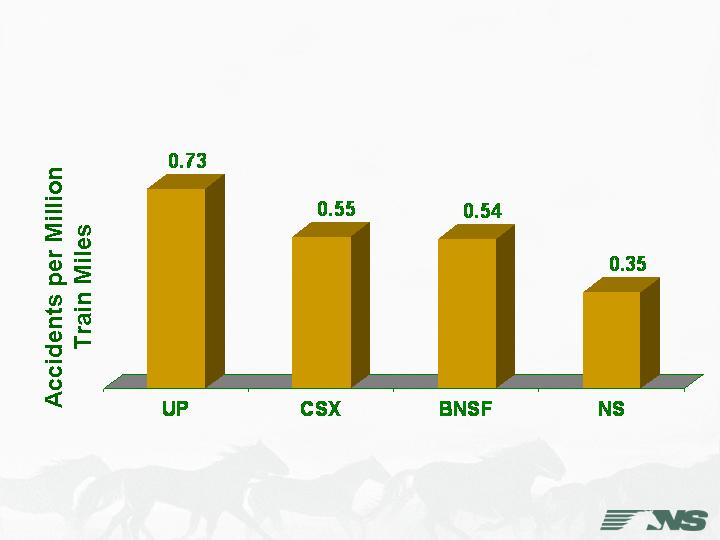
Class I Track-Related
Train Accident Rate for 2006*
* Track-related train accidents only (excluding grade crossing accidents)
All types of track (main, yard, industry, siding)
Track-related accidents.
NS top 3 causes for all train accidents for 2006:
Broken rail/transverse fissure = 0.24
Wide gage/defective-missing ties = 0.23
Switch improperly lined = 0.21
Class I Miscellaneous-Related
Train Accident Rate for 2006*
* Misc.-related train accidents only (excluding grade crossing accidents)
All types of track (main, yard, industry, siding)
And a miscellaneous category that includes such things as weather and outside interferences.
We all know there are many good reasons for preventing injuries and accidents. The most important reason is to ensure our employees return home safely at the end of the work day. We know safety makes good business sense. Investment in equipment, track and technology pays dividends in both safety and service.
Let's now turn to the second driver of our success...service. There are a lot of people involved in this effort and today we have presentations from three of our operating department leaders.
First, Tim Heilig, Vice-President-Mechanical, will give you an overview of the state of our locomotives and rail equipment.
Next, Tim Drake, Vice-President-Engineering, will present information about our physical infrastructure and along with Tim Heilig will introduce you to some of the things we have in place to reduce costs and improve reliability.
Third, Fred Ehlers, Vice-President-Customer Service, will explain the processes and systems we use to move railcars through our network. He'll touch on current technology and give you some information about technology yet to come.