
Infrastructure Planning &
Long Term Capital Investment
Deborah Butler
Executive Vice President
Planning & CIO
Good afternoon. My name is Deb Butler, Executive Vice President Planning, and my role today is to provide an overview of Norfolk Southern’s infrastructure and capital planning process.

Sustainability of Growth
Economic Outlook
Price of Fuel
Highway Capacity
Driver Shortages
Public Funding of Rail Infrastructure
Service Levels
Because our capital investments are long-term, we have to consider them in the context of our estimates of the opportunities for future business growth.
You have heard from our Marketing group that we remain optimistic about the sustainability of rail traffic growth. The drivers of the fundamental change in the competitive relationship between rail and truck continue to create a positive environment for long term rail volume growth.
Public investment in rail capacity, like the Heartland Corridor Project, will also result in volume growth on Norfolk Southern.
And Norfolk Southern’s superior service quality and performance will remain key drivers of growth.
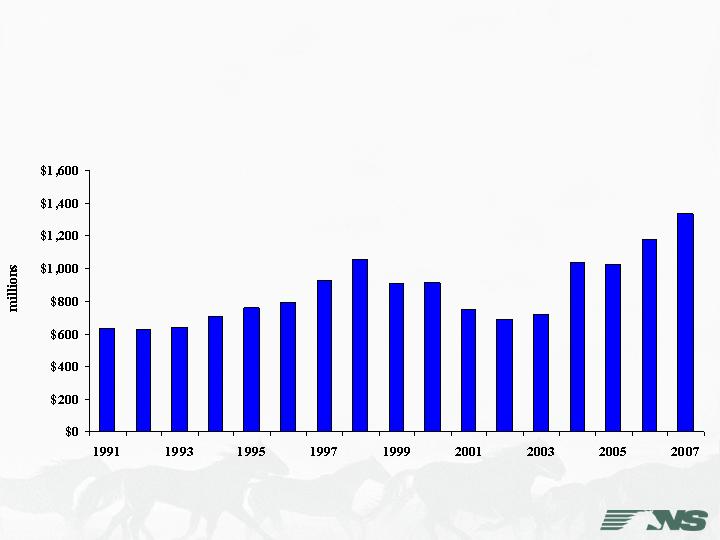
Capital Spending Historically
Historically, Norfolk Southern’s capital expenditures have closely tracked its business environment. Capital investments increased as we prepared for new traffic flows prior to the Conrail transaction, and continued at higher levels as we addressed potential bottlenecks in our expanded network in 1999 and 2000.
When the economy worsened in 2001, we responded to traffic downturns by reducing capital expenditures accordingly. As it became evident in the latter part of 2003 that the stars were aligning in favor of rail traffic growth, we increased our investments in our physical plant and rolling stock to insure that we would have the capacity to accommodate higher levels of business.

Major Capital Drivers
Maintenance of our Track Network
Locomotive Fleet
Freight Cars
Intermodal Terminals
Infrastructure Capacity
Maintenance of our track network has been and will remain the largest component of our capital plan.
As Tim Heilig noted, aggressive investment in our locomotive fleet over the past several years should allow us to reduce investment in this area for the next few years. However by 2013, we anticipate that we will need to ramp up spending on locomotives again.
Investment in freight cars will increase over the next 10 years, primarily due to the need to replace a large percentage of our coal car fleet.
Investment in Intermodal terminals will also increase as we build new terminals and expand others to capture volume growth .
And in order to avoid capacity constraints, we expect to continue to sustain increased levels of capital spending for additional infrastructure capacity.
I will discuss each of these major components of our capital plan in more detail in the next few slides.

Maintenance of Way
Continue to maintain track network to
operate trains safely and efficiently to meet
customer service standards
Normalized annual rail replacement should
be about 325 to 350 miles
Tie & Surfacing should be about 16% of
track miles annually
2.6 million Crossties
2.9 million Tons of Ballast
As I mentioned, and as was demonstrated in Tim Drake’s presentation, maintenance of our track network is the largest component of our capital plan. Our Engineering Department develops an annual maintenance budget through a process that involves rigorous analysis and the best science available. Our goal is to optimize the level of investment required to meet two major objectives: to operate trains over our track infrastructure safely and efficiently, and to meet our customer’s standards for speed and reliability.
On a normalized basis, rail replacement should be between 325 and 350 miles annually, although I should note that we have not yet reached normalized levels. In addition, our plan is to tie & surface about 3,000 track miles per year, surface another 2,000 track miles per year, and install about 2.5 million crossties per year.

Infrastructure
Increased Infrastructure spending
Short term: Focused investment in the
Southeast
Long term: Investment on core network
east of Chicago
Infrastructure projects typically include
Second and Third Mainlines
Sidings
Crossovers
To support volume growth, we plan to increase spending on track infrastructure.
Over the next three years, this investment will be focused on the high growth corridors in the southeast portion of our network.
Tim Heilig mentioned the important role that Norfolk Southern’s inter-departmental teams play in analyzing investments in locomotives and freight cars. The same approach serves us well in analyzing investments in track infrastructure. Norfolk Southern’s Infrastructure Team uses a number of simulation models, extensive field transportation review, and other analytical tools to develop the best bang for our capital buck. Let me give you a closer look at the process.
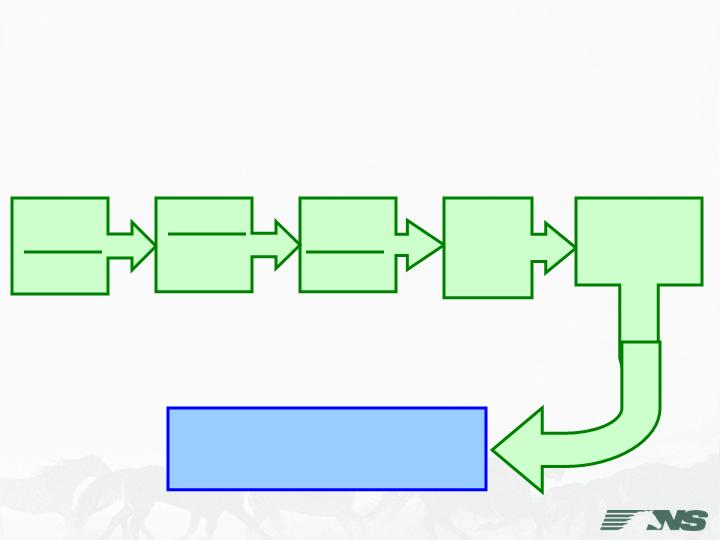
Infrastructure Planning
Process
Build Additional
Infrastructure
Traffic
Forecast
Delphi
Rail Traffic
Controller
Network
Simulation
Identify
System
Constraints
Operating
Plan
Developer
Train Plan
Recommend
Improvements
This is a simple schematic of our Infrastructure planning process.
-We start with a traffic forecast from Delphi, our marketing forecasting system.
-With that information, we assemble projected car movements into an operating plan (trains, terminals, and schedules) using the Operating Plan Developer that Fred Ehlers described.
-Once the operating plan is designed, we use the Rail Traffic Controller model to identify potential bottlenecks and delays in the network.
-And from that information, we determine where infrastructure investment may be required.

Simulation Results: Savannah District
The RTC model has proven to be a valuable tool, and one that occasionally surprises us with its findings. I’ll give you a couple of examples.
This is our line from Macon, Georgia, to Savannah, Georgia, where we anticipate volume growth. Conventional wisdom, and the collective experience of our field operations workforce, tells us that sidings should be equally spaced for optimal train operations. But in this particular case, the RTC simulation results proved that an 11,000-foot siding at McIntyre, Georgia, which is only about 4 ½ miles from the longest siding on the district, gave us the best train delay reduction under the operating conditions on that line.
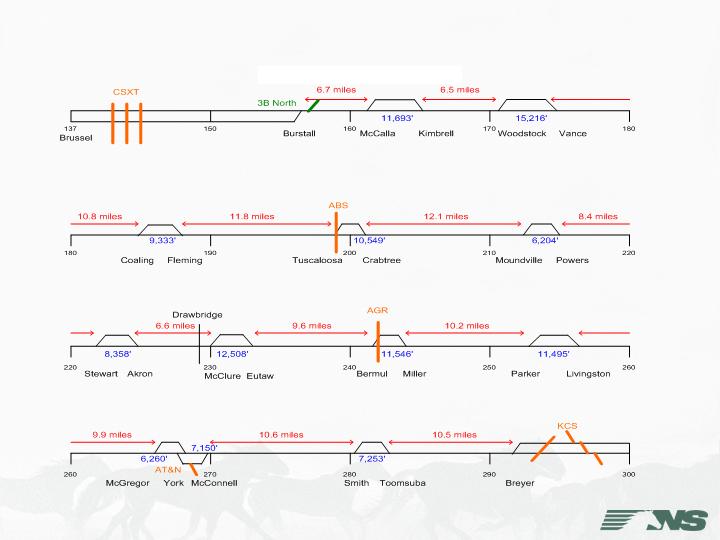
Simulation Results: Meridian to Birmingham
This is our line from Birmingham, Alabama to Meridian, Mississippi. Additional traffic is forecasted on this line as a result of the Meridian Speedway project, so we initiated an RTC study because we believed that significant infrastructure expansion would be needed. But the RTC analysis showed us that due to evenly spaced sidings that were already on the line, we could handle the increased volumes with only a few minor operational changes. No infrastructure improvements were necessary.
The proposed projects that result from our use of RTC and other analytical tools are evaluated and prioritized by the Infrastructure Team to ensure that our infrastructure investments are targeted toward the best projects to support future growth.

N
e
w
O
r
l
e
a
n
s
M
o
b
i
l
e
M
a
c
o
n
A
t
l
a
n
t
a
R
o
a
n
o
k
e
B
u
f
f
a
l
o
D
e
t
r
o
i
t
C
h
i
c
a
g
o
F
t
.
W
a
y
n
e
C
i
n
c
i
n
n
a
t
i
M
e
m
p
h
i
s
K
a
n
s
a
s
C
i
t
y
S
t
.
L
o
u
i
s
C
h
a
r
l
o
t
t
e
C
l
e
v
e
l
a
n
d
C
h
a
t
t
a
n
o
o
g
a
B
i
r
m
i
n
g
h
a
m
C
o
l
u
m
b
i
a
D
e
s
M
o
i
n
e
s
C
h
a
r
l
e
s
t
o
n
S
a
v
a
n
n
a
h
J
a
c
k
s
o
n
v
i
l
l
e
M
o
r
e
h
e
a
d
C
i
t
y
N
o
r
f
o
l
k
M
e
r
i
d
i
a
n
P
h
i
l
a
d
e
l
p
h
i
a
/
S
o
u
t
h
J
e
r
s
e
y
N
e
w
a
r
k
/
N
o
r
t
h
J
e
r
s
e
y
B
a
l
t
i
m
o
r
e
L
o
u
i
s
v
i
l
l
e
K
n
o
x
v
i
l
l
e
B
r
u
n
s
w
i
c
k
D
a
l
l
a
s
P
a
l
a
t
k
a
R
a
l
e
i
g
h
B
l
u
e
f
i
e
l
d
G
r
e
e
n
v
i
l
l
e
D
e
c
a
t
u
r
W
i
l
m
i
n
g
t
o
n
D
e
a
r
b
o
r
n
A
s
h
e
v
i
l
l
e
W
i
n
s
t
o
n
-
S
a
l
e
m
R
i
c
h
m
o
n
d
B
i
n
g
h
a
m
t
o
n
P
i
t
t
s
b
u
r
g
h
H
a
r
r
i
s
b
u
r
g
A
l
t
o
o
n
a
I
n
d
i
a
n
a
p
o
l
i
s
A
l
b
a
n
y
C
A
N
A
D
A
C
o
l
u
m
b
u
s
T
o
l
e
d
o
A
y
e
r
C
a
p
a
c
i
t
y
I
m
p
r
o
v
e
m
e
n
t
s
2
0
0
0
t
o
P
r
e
s
e
n
t
$
1
3
6
m
Capacity Improvements
2000-2007
$277.4m
Columbus
to
Sandusky:
$31.6M
Ft. Wayne
to Decatur:
$11.1M
Memphis to
Chattanooga
$24.4M
North
Georgia:
$79.2M
Norfolk Southern’s infrastructure investments have been extensive and ongoing over the last decade. During that period we have invested a total of $277.4 million in new construction.
Although we know that certain areas of our network are still challenged, it is also important to recognize that some previously congested segments of the network are no longer experiencing capacity constraints. These segments are benefiting from past investments in infrastructure.
Previous projects have included new and expanded terminals; more sidings, longer sidings, double track and even a few clearances.
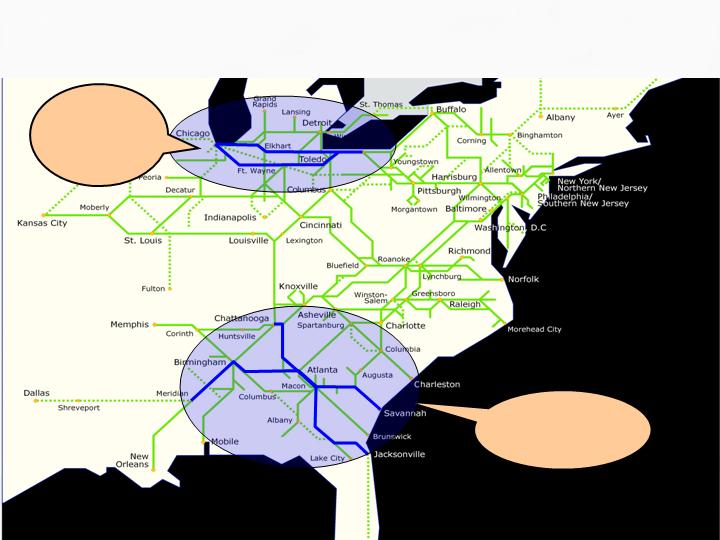
2007 -2010 Infrastructure Focus
Support traffic
growth in the
Southeast
Cleveland
Intermodal
growth
to/from
Chicago
Infrastructure investment over the next 3 years will be focused on the corridor between Chattanooga, TN and Jacksonville, FL, including significant investment in track capacity through the Atlanta Terminal area.
We also plan to invest in the corridor between Meridian, MS and Atlanta, GA to support traffic growth from the Meridian Speedway.
Investment will be needed on the line between Atlanta and Savannah, GA to support traffic growth.
And on the northern portion of our network, we will continue to monitor the volume growth on the Penn Route between Chicago and Cleveland, because we may ultimately need to add capacity there as volumes grow.
I should add that as we further refine our plans for the I-81 Crescent Corridor, we will be using the process I have just described to determine where infrastructure investment will be needed.

Locomotives
Road
Annual purchases of 20–35 new Road units are
required to meet growth needs
Locomotive purchases should be lower for the next
5 years due to recent acquisitions
Yard & Local
With an average age of 27.4 years, the yard and
local fleet will require sustained annual investment
Environmental Impact
Planning for new locomotive purchases will be
impacted as emission requirements tighten in 2012
In the next 5 years, we anticipate reducing the level of investment in our locomotive fleet as compared with the past few years. This is due to aggressive investment in the fleet during the past 5 years, when we purchased an average of 110 units/year.
Our locomotive team calculates that we will need between 20 and 35 new locomotives per year just to support volume growth on the network. To that, we have to add additional locomotives each year to replace units that have reached the end of their economic lives. Factors such as higher-than-expected volume growth, or alternatively, greater than anticipated productivity improvements, also impact our plans for future locomotive acquisitions. For example, our plans today do not yet include any additional locomotive requirements for significant new initiatives such as the I-81 Crescent Corridor.
Starting in 2013, we anticipate returning to something closer to prior levels of expenditures on locomotives, although again, business conditions, productivity improvements, and a new wrinkle – more stringent emissions requirements expected in 2012 – will determine exactly what those numbers will be.
An expected increase in investment in our 1350-unit yard and local fleet is due mainly to the high average age of the fleet. As Tim Heilig mentioned, part of this investment will be directed to more fuel efficient and environmentally friendly GenSet locomotives.

Freight Cars - Coal
Next 10 years will require significant
investment in coal cars to replace aging fleet
New cars will carry 112 tons vs. our current
102-ton capacity per car
Higher carrying capacity reduces car
replacement purchases by almost 10%
Other productivity initiatives may further
reduce investment
Danny Smith has already mentioned that over the next 10 years, we will need to replace over 33,000 coal hoppers and gons as these cars reach the end of their economic lives. But as Danny and Tim Heilig both mentioned, that does not mean that we will have to purchase 33,000 new coal cars.
Because they have a higher carrying capacity, we will be able to handle the same volume of coal with about 3,000 fewer of the new composite cars than with our existing fleet. And of course we will be able to move the traffic with fewer train starts, crews, and locomotives.
Danny mentioned some of the productivity initiatives we have underway for our coal traffic. We anticipate that successful implementation of the scheduled coal network may further reduce our car requirements.

Freight Cars - Merchandise
Maintain current investment levels
Primarily upgrades or shop rebuilds
Some money will be spent on critical lease
buyouts
Our near-term investments in freight cars other than coal are expected to be primarily in the form of upgrades or rebuilds of the existing fleet, with minimal purchases of new cars over the next few years. We do plan to buy out the leases of certain key car types that are in high demand.

New & Expanded Intermodal Terminals
Memphis
Cincinnati
Chicago
Atlanta
Charlotte
Harrisburg
New Jersey
Intermodal continues to be a high growth market on our network. As a result, and as Mike McClellan described, we anticipate continued investment in new and expanded terminal capacity over the next several years.

Other Spending
Computers and Technology
Spending will increase as automation increases
Train Control Systems
Communications Enhancements
All Else
NS Contribution to Heartland Corridor Project
Development projects for revenue growth and future
industrial development
Projects excluded from the plan
Alliance and Partnership Agreements
Large Public Private Partnerships
I-81 Crescent Corridor
As you have heard in several of the presentations today, technology is a key driver of improved service and efficiency. We have a heavy pipeline of technology applications that will require funding. Increased investments are anticipated in future years to support positive train control, new dispatching systems, new transportation and on-board locomotive systems, and other technology to improve customer service.
Capital for the "All Else or Other" category is expected to increase, primarily due to Norfolk Southern’s contribution to the Heartland Corridor Project.
There will also be expenditures for development projects tied to specific revenue growth opportunities and industrial development.
Expenditures for high profile alliance and partnership agreements are not included in the capital plan due to uncertainty as to the timing and magnitude of those projects.
For the same reasons, we also exclude large public/private partnership projects like the I-81 Crescent Corridor.

Summary
Invest capital necessary to handle traffic growth
Continue high quality track maintenance
Locomotive acquisitions
Investment in freight cars
New Intermodal terminals and expansions
Additional infrastructure capacity
Technology investment to improve efficiency and
quality of service
As Wick stated at our April earnings meeting, Norfolk Southern’s capital expenditures over a long period of time have averaged around 15 percent of our total revenue, excluding fuel surcharges. Our goal is to maintain that trend going forward, although year-to-year variations are likely as a result of some of the issues I’ve already discussed.
My message today is that Norfolk Southern’s capital investment decisions reflect the careful study and analysis of many cross-functional teams and subject-matter experts throughout the company. Each has the same set of objectives – to maintain and improve safety, service, and efficiency, and to position Norfolk Southern to capture future business growth.