
Finance Overview
James A. Squires
Executive Vice President
Finance
Good afternoon. I’m Jim Squires, and I will be giving you a Finance overview. Norfolk Southern has a strong track-record of delivering returns to its owners. Our financial strategy is based on reinvestment and distribution of surplus capital. To support that strategy, our capital structure should be flexible and adaptive. That way we’ll be able to seize the many opportunities you’ve heard about today.

Fundamental Financial Focus
Free Cash Flow Generation
Return on Invested Capital
Total Return to Shareholders
Capital Structure Supportive of Business and Strategy
I’ll set the stage by describing a few fundamentals. First, our overarching goal is to maximize the present value of future free cash flows. We define free cash flow as cash from operations less capital expenditures. After setting aside enough cash for liquidity, our policy is to pay out what is left or invest it. We may also use free cash to pay down debt, or conversely, add debt to supplement free cash.
Second, we seek to provide a return on invested capital that exceeds our cost of capital, recognizing that this is how economic value is created.
If we generate free cash flow, invest in projects with high returns, and distribute surplus capital, solid returns to shareholders should follow, and that is our third goal. Indeed, a significant portion of management’s compensation is tied to return on invested capital and our stock’s comparative total shareholder return.
Lastly, we seek to manage Norfolk Southern’s capital structure to support our strategy. That means neither too little debt, which could shortchange funds currently available for distribution, nor too much debt, which could reduce or even curtail long-term free cash flow.

Free Cash Flow* (FCF)
Norfolk Southern ($ Millions)
* Free Cash Flow : cash flow from operations less capital expenditures – see reconciliation posted on website
The growth in free cash flow you see here reflects the outstanding business environment of the last few years. It also demonstrates the potential of Norfolk Southern, the most efficient U.S. railroad, to make the most of a rising tide of freight and strong demand for rail services.
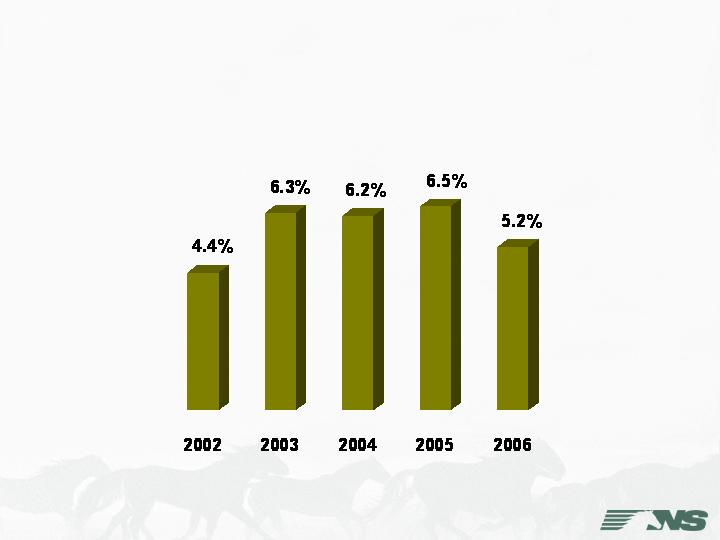
FCF Yield*
Norfolk Southern
* FCF Yield: FCF per share divided by average of beginning and year-end stock prices
This free cash flow yield chart shows NS’ free cash flow per share as a percentage of our stock’s average beginning-of-year and end-of-year stock prices over the last five years.
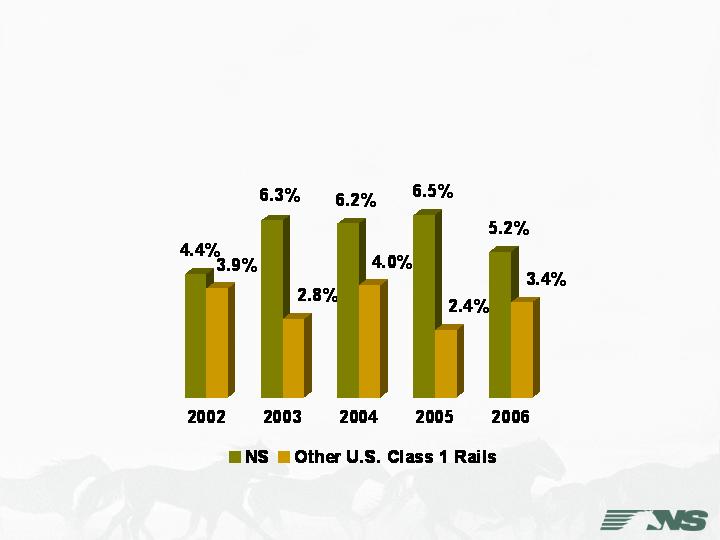
Comparative FCF Yield
Norfolk Southern versus Industry Average*
* Industry Average: market capitalization-weighted FCF yields of BNSF, CSX and UP
Our free cash flow yield compares very favorably to the U.S. rail industry’s average FCF yield, underscoring NS’ superior free cash flow and the attractiveness of our stock in comparison to our peers.
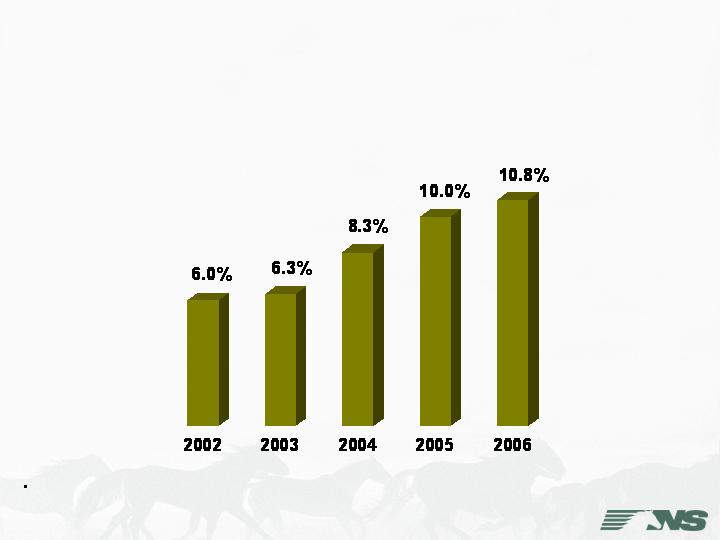
Return on Invested Capital
Norfolk Southern
Return on Invested Capital: (net income plus after tax interest expense) / (average long-term debt plus stockholders’ equity);
adjusted for operating leases
Earning a return on invested capital that exceeds the cost of capital is obviously critical. When ROIC exceeds cost of capital, value is created for shareholders. Again, NS’ ROIC trend is positive over the last several years.
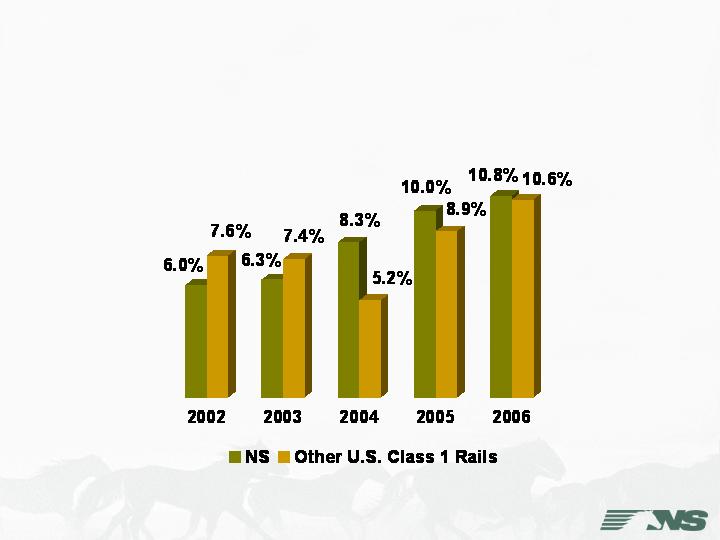
Return on Invested Capital
Norfolk Southern versus Industry Composite*
* Industry Composite: combined ROIC of BNSF, CSX and UP
Here’s how NS’ ROIC compares to a U.S. rail industry composite. Once again, we’ve done well.
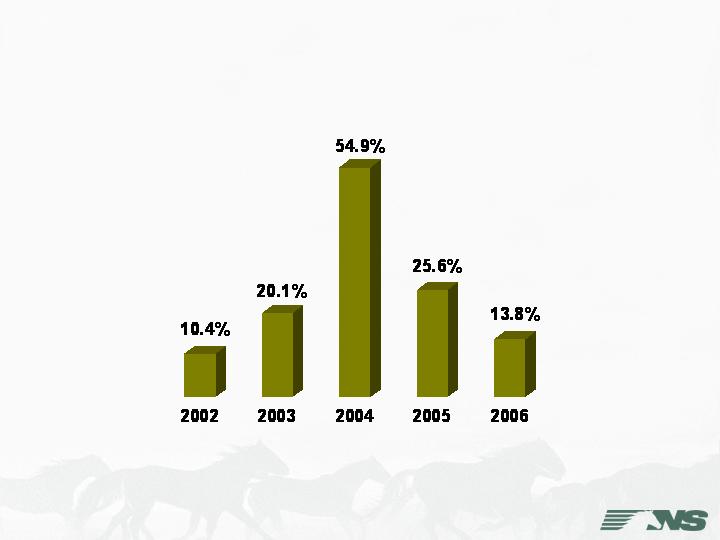
Total Shareholder Return*
Norfolk Southern
* Assumes gross dividends are reinvested in the stock.
Total shareholder return is the annual change in stock price, plus dividends paid and reinvested during the year, divided by beginning stock price.
We’ve been steadily increasing our dividend over the last few years, recognizing that this aspect of total shareholder return is in our hands. Stock price appreciation may be harder to influence in the short run. But over time – and this has certainly been the case in the last five years – the market should reward sound investment decisions, superior returns and strong free cash flow generation.

Total Shareholder Return*
U.S. Class 1 Railroads and S&P 500
December 31, 2001-May 31, 2007
* Assumes gross dividends are reinvested in the respective stocks or index
This chart shows cumulative total shareholder returns from 2002 through May for the major U.S. railroads and the S&P 500. We are not at the head of the pack, but NS has posted very respectable total shareholder returns during this five-year period.

Capital Structure
Philosophy
Support Business Strategy
Grow and protect profitable rail franchise
Increase return on invested capital
Improve total return to shareholders
Our philosophy is to conform capital structure to strategy, in other words to seek a capital structure that is driven by, and consistent with, our business strategy.
That strategy, first and foremost, requires investing in our company, and today you’ve seen many examples of the exciting investment possibilities in the railroad business. To the extent we have surplus capital, we intend to distribute it, and we will augment free cash flow with incremental debt for this purpose when appropriate. That too is part of our strategy.
All aspects of our structure and strategy are intended to maximize returns to our shareholders.

Capital Structure
Process
Project Future Cash Flows
Stress-test cash flow projections under varying
business and credit conditions
Ensure reinvestment capital will be available for
maintenance and growth
Assess remaining capital in view of debt
maturities and capacity for additional borrowing
Formulate plans for distributing surplus capital
through dividends and share repurchases
We evaluate capital structure using detailed, multi-year business plans that include cash flow forecasts. We test these plans and forecasts under varying business and credit conditions, to ensure we will have reinvestment capital in a variety of scenarios.
We then assess how much capital will be left over after taking into account future debt maturities and the capacity for additional borrowing.
Lastly, we formulate plans for distributing surplus capital over time using dividends and share repurchases, in a manner that seeks to maximize shareholder value.

Capital Structure
Capital Spending - 2007
Maintenance (~78%)
Right-of-way
Equipment
Safety and regulatory
Growth (~22%)
Capacity-enhancing infrastructure and terminals
Strategic opportunities
Technology and efficiency projects
As should be obvious by now, we must devote very substantial resources to maintaining our franchise. Today you’ve heard a lot about the investments in maintenance of way, locomotives, freight cars, and other assets that are essential to keep our system safe and efficient. In total about 78% of our 2007 capital expenditures will go toward maintenance.
Then there are the investments that drive growth. You’ve heard a lot about these today as well, about opportunities like ThyssenKrupp, Heartland, Rickenbacker, the Meridian Speedway and the I-81 Crescent Corridor. You’ve also heard about technology aimed at increasing efficiency and productivity, like LEADER and optimized train control. We estimate these types of projects account for 22% of our planned 2007 capital spending.
From all of these investments we think we can deliver the outstanding returns you expect, so long as we commit the capital.

Capital Structure
Debt
Plan to Refinance Maturing Debt (~$1.18 Billion over Next
Three Years)
Will Increase Debt to Enhance Shareholder Returns while
Retaining Solid Investment Grade Credit Ratings
Overall Goal to Maintain Appropriate Leverage to Support
Business Strategy and Provide Flexibility through
Business Cycles
Since Conrail, we have generally been paying off maturing debt with internally generated cash. For the next few years at least, we plan to refinance debt as it comes due, and this will amount to about $1.2 billion.
We expect to use the proceeds from re-financings and new debt to enhance shareholder returns. We think we can do this while maintaining our current solid investment grade credit ratings. This approach should permit meaningful additional leverage. It should also protect our ability to adjust strategy through changing business cycles.

Capital Structure
Shareholder Distributions
Dividends
23% compound annual growth rate in dividends per share from 2001-2006
Targeting a one-third payout ratio
Share Repurchases
75 million share authority
Repurchased 28.2 million shares through May 2007 at a cost of $1.28
billion since program inception; 46.9 million authorized shares remaining
Average repurchase price from program inception to date is $45.41 per
share
Future repurchases will be based on market conditions
May seek additional repurchase authority if 75 million share authority is
exhausted prior to 2010
Over the last several years, we have increased our annual dividends at a 23% compound annual growth rate. As we have said before, our goal is about a one-third payout ratio, which would entail significant additional dividend increases.
Our current authority for share repurchases is 75 million shares. Through May we have bought about 28 million shares at a cost of $1.28 billion and an average price of around $45 per share since we began the program. Since the beginning of this year, repurchases have been partially offset by share issuances due to option exercises this quarter. Future repurchases will be based on market conditions. If we exhaust the 75 million share authority prior to 2010, our board of directors may elect to furnish additional authority.

Capital Structure
Flexible Structure Is Optimal
Flexibility One Hallmark of Sound Capital Structure for
Railroads
Mitigate Risks from Capital Intensity, High Fixed Operating
Costs, and Cyclicality
Modulate Capital Structure over Time
Preserve Ability to Seize Secular Growth Opportunities
One of the hallmarks of a sound capital structure is flexibility. A flexible capital structure is prudent in our case because railroading is inherently capital-intensive, has high fixed operating costs, and remains subject to cyclicality. Modulating capital structure over time, if it proves appropriate to do so, will help mitigate the risks from these industry characteristics, and will preserve our ability to seize secular growth opportunities.
In conclusion, as I started out by saying, Norfolk Southern has a strong track-record of making money for its owners and a financial strategy based on reinvestment and distribution of surplus capital. Our goal is to ensure that strategy maximizes the present value of future free cash flows and delivers solid returns on invested capital and total shareholder returns for you, the owners of Norfolk Southern.