Searchable text section of graphics shown above
[LOGO]
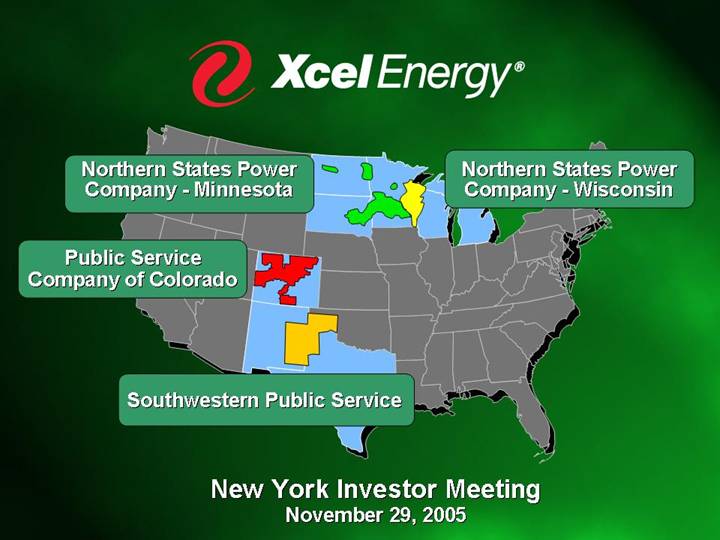
New York Investor Meeting
November 29, 2005
[LOGO]
[GRAPHIC]
New York Investor Meeting
November 29, 2005
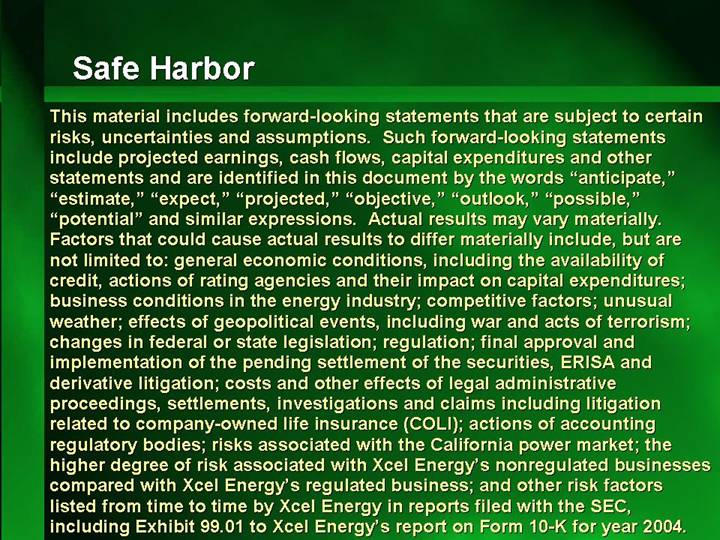
Safe Harbor
This material includes forward-looking statements that are subject to certain risks, uncertainties and assumptions. Such forward-looking statements include projected earnings, cash flows, capital expenditures and other statements and are identified in this document by the words “anticipate,” “estimate,” “expect,” “projected,” “objective,” “outlook,” “possible,” “potential” and similar expressions. Actual results may vary materially. Factors that could cause actual results to differ materially include, but are not limited to: general economic conditions, including the availability of credit, actions of rating agencies and their impact on capital expenditures; business conditions in the energy industry; competitive factors; unusual weather; effects of geopolitical events, including war and acts of terrorism; changes in federal or state legislation; regulation; final approval and implementation of the pending settlement of the securities, ERISA and derivative litigation; costs and other effects of legal administrative proceedings, settlements, investigations and claims including litigation related to company-owned life insurance (COLI); actions of accounting regulatory bodies; risks associated with the California power market; the higher degree of risk associated with Xcel Energy’s nonregulated businesses compared with Xcel Energy’s regulated business; and other risk factors listed from time to time by Xcel Energy in reports filed with the SEC, including Exhibit 99.01 to Xcel Energy’s report on Form 10-K for year 2004.
[LOGO]
Executing the Plan
Achieving
the Potential
Dick Kelly
President and Chief Executive Officer
Strategy — Building the Core
Invest in utility assets
AND
Earn our allowed return on equity
[GRAPHIC]
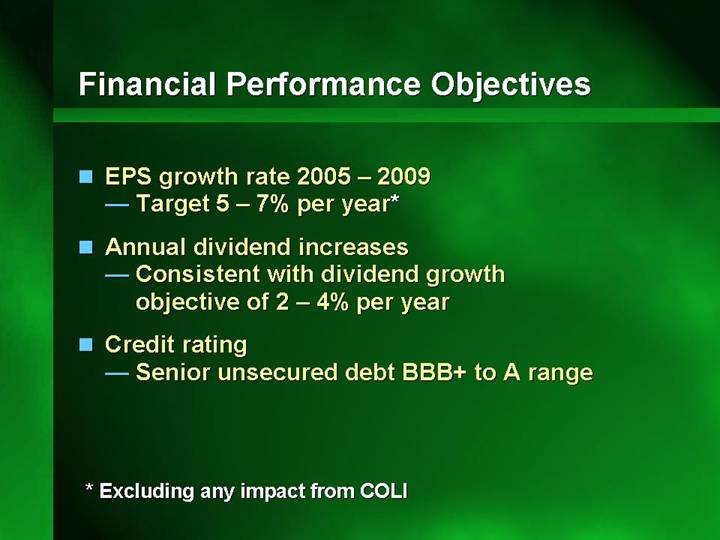
Financial Performance Objectives
• EPS growth rate 2005 – 2009
• Target 5 – 7% per year*
• Annual dividend increases
• Consistent with dividend growth objective of 2 – 4% per year
• Credit rating
• Senior unsecured debt BBB+ to A range
* Excluding any impact from COLI
[LOGO]
| Financial
Performance | |
| | | |
| Regulators/
Legislators | |
| | |
| Value to
Customers | Environmental
Stewardship | |
| | | |
| Invest in Regulated Utility Business | |
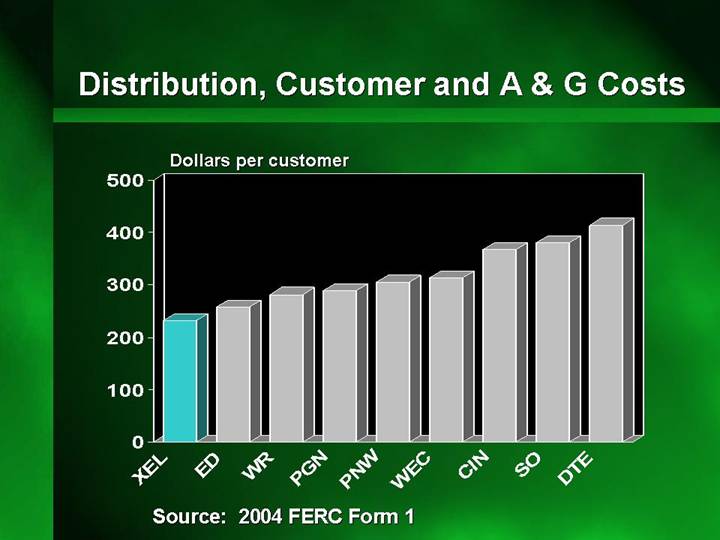
Distribution, Customer and A & G Costs
Dollars per customer
[CHART]
Source: 2004 FERC Form 1
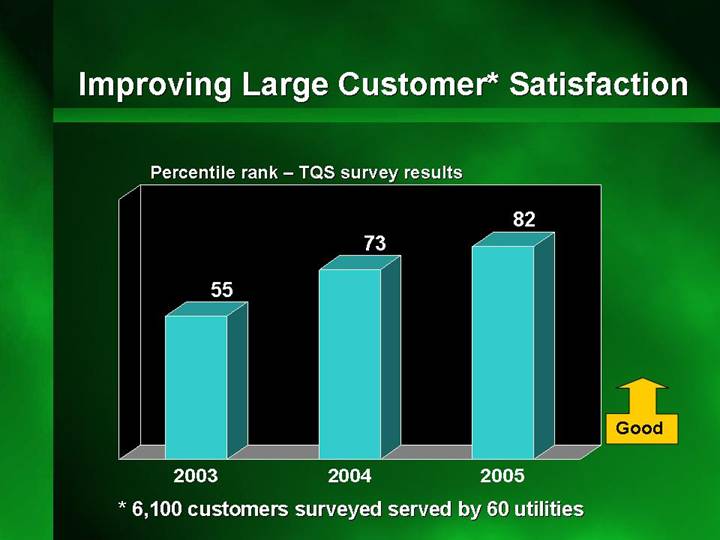
Improving Large Customer* Satisfaction
Percentile rank – TQS survey results
[CHART]
* 6,100 customers surveyed served by 60 utilities
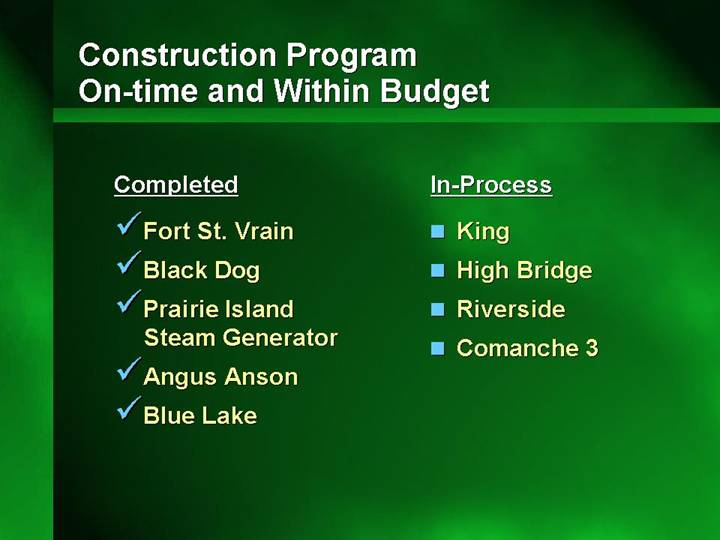
Construction Program
On-time and Within Budget
| Completed | In-Process |
| | |
| • | Fort St. Vrain | • | King |
| | | | |
| • | Black Dog | • | High Bridge |
| | | | |
| • | Prairie Island Steam Generator | • | Riverside |
| | | | |
| • | Angus Anson | • | Comanche 3 |
| | | | |
| • | Blue Lake | | |
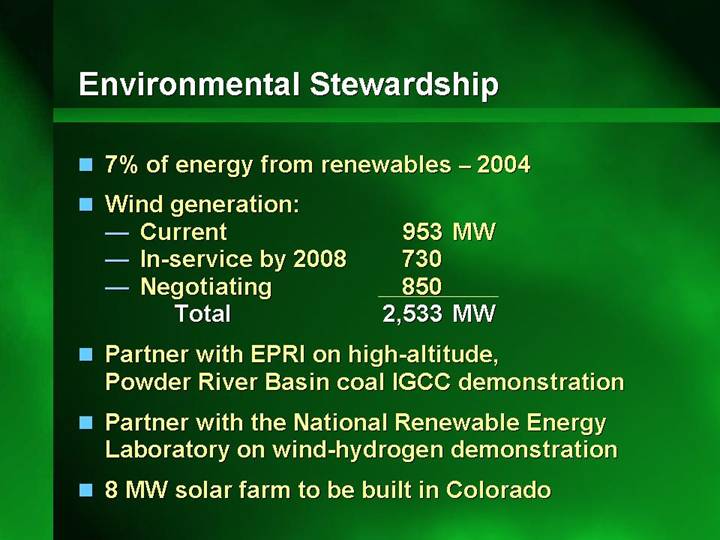
Environmental Stewardship
• 7% of energy from renewables – 2004
• Wind generation:
• | Current | | 953 | MW | |
• | In-service by 2008 | | 730 | | |
• | Negotiating | | 850 | | |
| Total | | 2,533 | MW | |
• Partner with EPRI on high-altitude, Powder River Basin coal IGCC demonstration
• Partner with the National Renewable Energy Laboratory on wind-hydrogen demonstration
• 8 MW solar farm to be built in Colorado
Supportive Regulatory Treatment
• MERP
• Transmission riders in Minnesota and Texas
• Capacity cost rider in Colorado
• Comanche 3 CWIP in rate base
• Public Service of Colorado equity ratio up to 60%
Financial Strength
• Regulatory support for major investments
• File rate cases
• Manage to allowed cost
• Invest in jurisdictions which provide a fair return
• Maintain solid balance sheet to support growth and achieve credit rating objectives
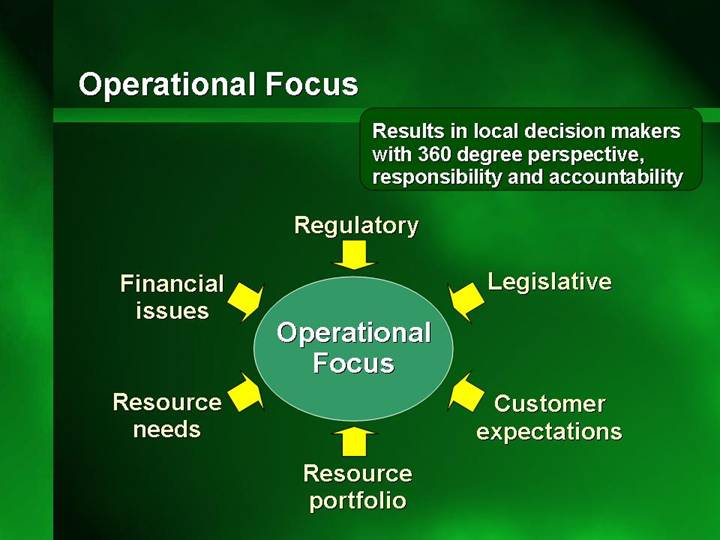
Operational Focus
Results in local decision makers
with 360 degree perspective,
responsibility and accountability
Regulatory |
Financial
issues | Legislative |
Operational
Focus |
Resource
needs | Customer
expectations |
Resource
portfolio |
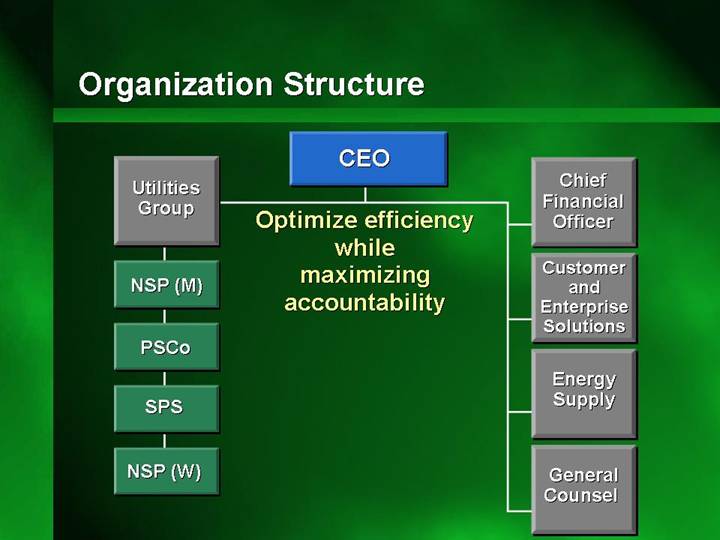
Organization Structure
| CEO | |
Utilities | | | Chief |
Group
NSP (M) | Optimize efficiency
while
maximizing
accountability | Financial
Officer
Customer |
PSCo | | | and |
| | | Enterprise |
SPS | | | Solutions |
| | | |
NSP (W) | | | Energy |
| | | Supply |
| | | |
| | | General |
| | | Counsel |
[LOGO]
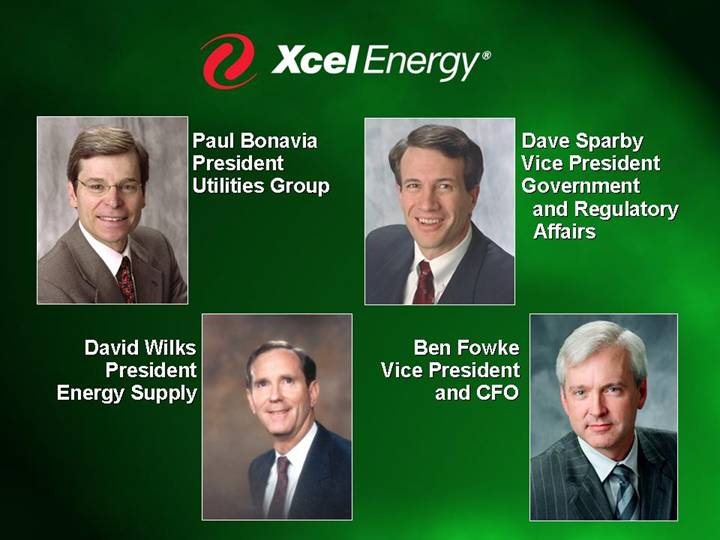
[GRAPHIC] | | Paul Bonavia | [GRAPHIC] | | Dave Sparby |
| | President | | | Vice President |
| | Utilities Group | | | Government |
| | | | | and Regulatory |
| | | | | Affairs |
| | | | | |
David Wilks | | [GRAPHIC] | Ben Fowke | | [GRAPHIC] |
President | | | Vice President | | |
Energy Supply | | | and CFO | | |