Searchable text section of graphics shown above
[LOGO]
Executing
The Operating Company Plans
| Financial
Performance | |
| | | |
| Regulators/
Legislators | |
| | | |
| Value to
Customers | Environmental
Stewardship | |
| | | |
| Invest in Regulated Utility Business | |
Paul Bonavia President – Utilities Group
Safe Harbor
This material includes forward-looking statements that are subject to certain risks, uncertainties and assumptions. Such forward-looking statements include projected earnings, cash flows, capital expenditures and other statements and are identified in this document by the words “anticipate,” “estimate,” “expect,” “projected,” “objective,” “outlook,” “possible,” “potential” and similar expressions. Actual results may vary materially. Factors that could cause actual results to differ materially include, but are not limited to: general economic conditions, including the availability of credit, actions of rating agencies and their impact on capital expenditures; business conditions in the energy industry; competitive factors; unusual weather; effects of geopolitical events, including war and acts of terrorism; changes in federal or state legislation; regulation; final approval and implementation of the pending settlement of the securities, ERISA and derivative litigation; costs and other effects of legal administrative proceedings, settlements, investigations and claims including litigation related to company-owned life insurance (COLI); actions of accounting regulatory bodies; risks associated with the California power market; the higher degree of risk associated with Xcel Energy’s nonregulated businesses compared with Xcel Energy’s regulated business; and other risk factors listed from time to time by Xcel Energy in reports filed with the SEC, including Exhibit 99.01 to Xcel Energy’s report on Form 10-K for year 2004.
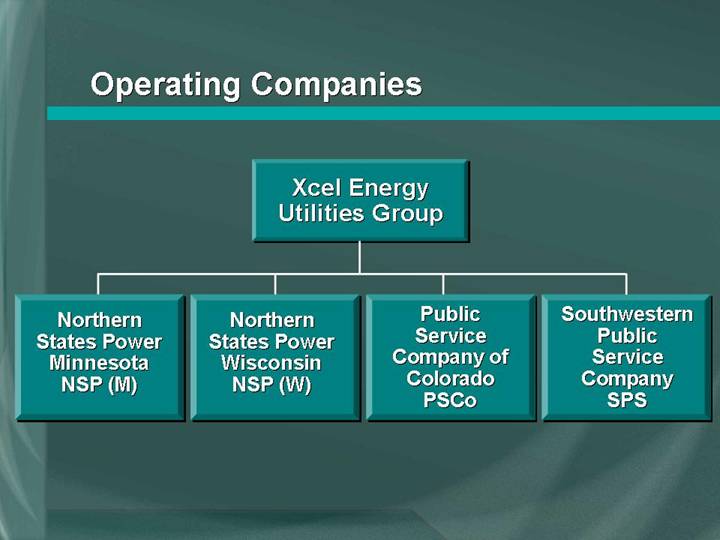
Operating Companies
Xcel Energy
Utilities Group |
| |
Northern
States Power
Minnesota
NSP (M) | Northern
States Power
Wisconsin
NSP (W) | Public
Service
Company of
Colorado
PSCo | Southwestern
Public
Service
Company
SPS |
| | | |
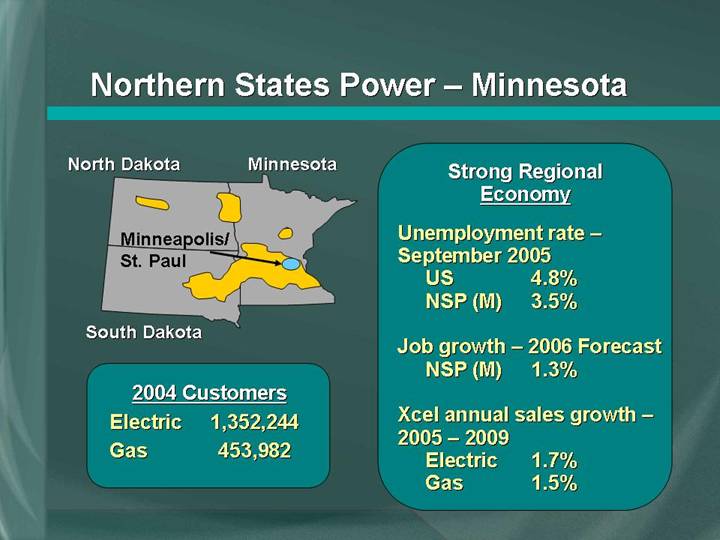
Northern States Power – Minnesota
[GRAPHIC]
2004 Customers |
| | | |
Electric | | 1,352,244 | |
Gas | | 453,982 | |
Strong Regional
Economy |
| | | |
Unemployment rate – September 2005 | | | |
US | | 4.8 | % |
NSP (M) | | 3.5 | % |
| | | |
Job growth – 2006 Forecast | | | |
NSP (M) | | 1.3 | % |
| | | |
Xcel annual sales growth – 2005 – 2009 | | | |
Electric | | 1.7 | % |
Gas | | 1.5 | % |
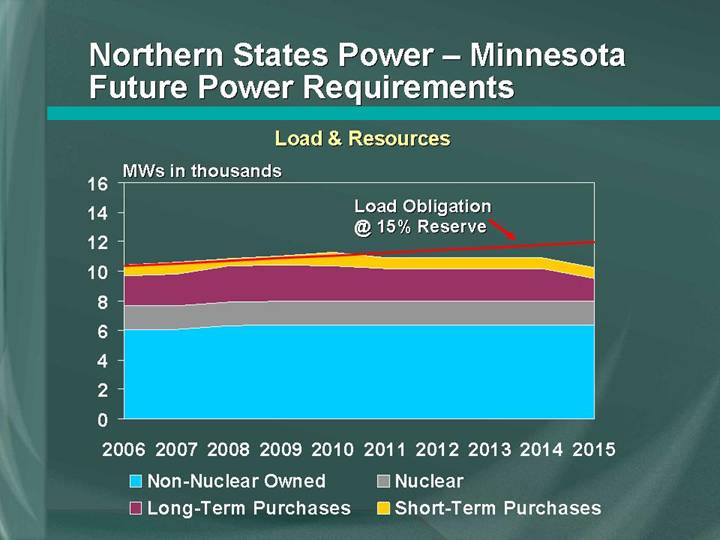
Future Power Requirements
Load & Resources
[CHART]
��
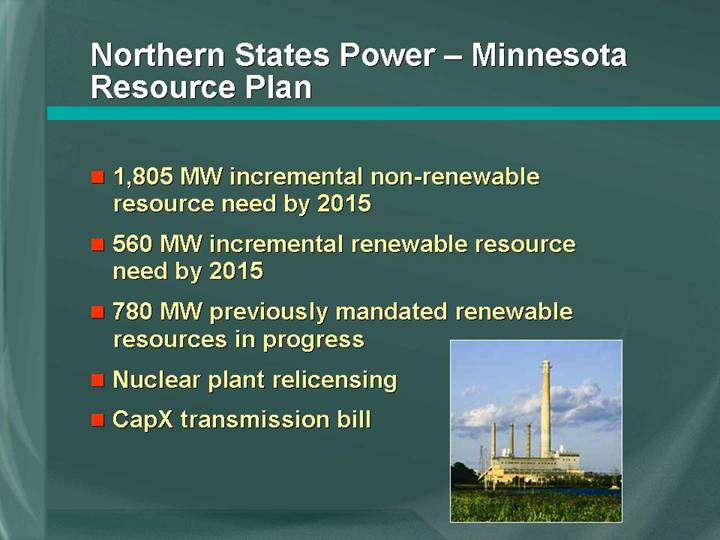
Resource Plan
• 1,805 MW incremental non-renewable resource need by 2015
• 560 MW incremental renewable resource need by 2015
• 780 MW previously mandated renewable resources in progress
• Nuclear plant relicensing
• CapX transmission bill
[GRAPHIC]
Customer Relations
• Top quartile reliability
• Top quartile customer satisfaction
• Public support for environmental initiatives
• Fuel cost mitigation plan
Regulatory Climate
• Multiple electric rate cases
• Minnesota and North Dakota gas rate cases in 2005
• Multiple cost recovery riders
• Conservation incentive plan and MERP allow premium returns
Priorities
• Sustain strong operating performance
• Execute rate cases
• Advocate environmental and cost recovery policy initiatives
• Increase capital and O&M flexibility
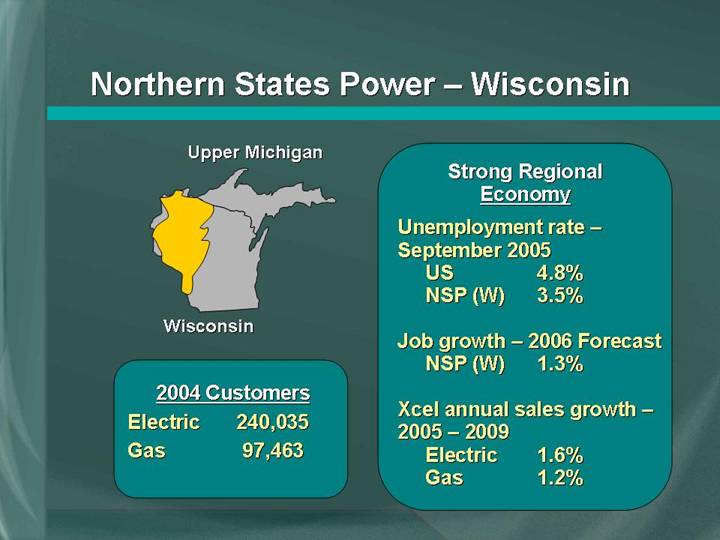
Northern States Power – Wisconsin
[GRAPHIC]
2004 Customers |
| | | |
Electric | | 240,035 | |
Gas | | 97,463 | |
Strong Regional
Economy |
| | | |
Unemployment rate – September 2005 | | | |
US | | 4.8 | % |
NSP (W) | | 3.5 | % |
| | | |
Job growth – 2006 Forecast | | | |
NSP (W) | | 1.3 | % |
| | | |
Xcel annual sales growth – 2005 – 2009 | | | |
Electric | | 1.6 | % |
Gas | | 1.2 | % |
Profile
• Resource planning and energy supply coordinated with Northern States Power Minnesota through Interchange Agreement
• Lowest retail rates in Wisconsin
• Rate case every two years
• Best Xcel Energy delivery system performance
• Best Xcel Energy financial performance
Priorities
• Keep it up
• Execute rate cases
• Advance environmental initiatives
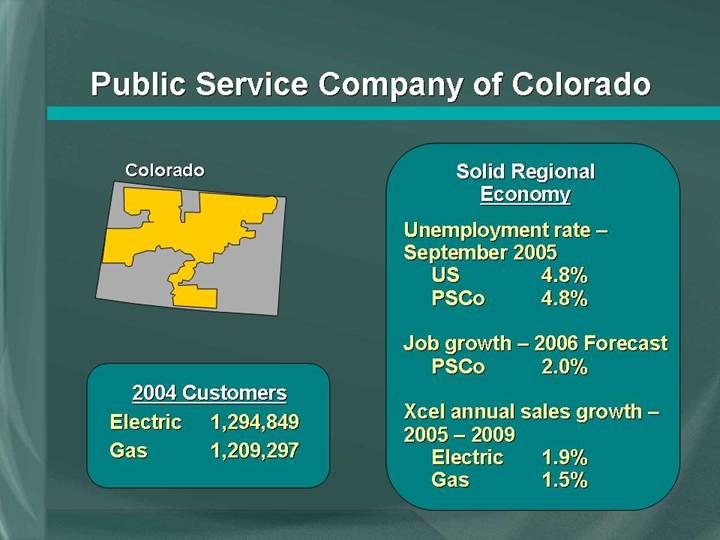
Public Service Company of Colorado
[GRAPHIC]
2004 Customers |
| | | |
Electric | | 1,294,849 | |
Gas | | 1,209,297 | |
Solid Regional
Economy |
| | | |
Unemployment rate – September 2005 | | | |
US | | 4.8 | % |
PSCo | | 4.8 | % |
| | | |
Job growth – 2006 Forecast | | | |
PSCo | | 2.0 | % |
| | | |
Xcel annual sales growth – 2005 – 2009 | | | |
Electric | | 1.9 | % |
Gas | | 1.5 | % |
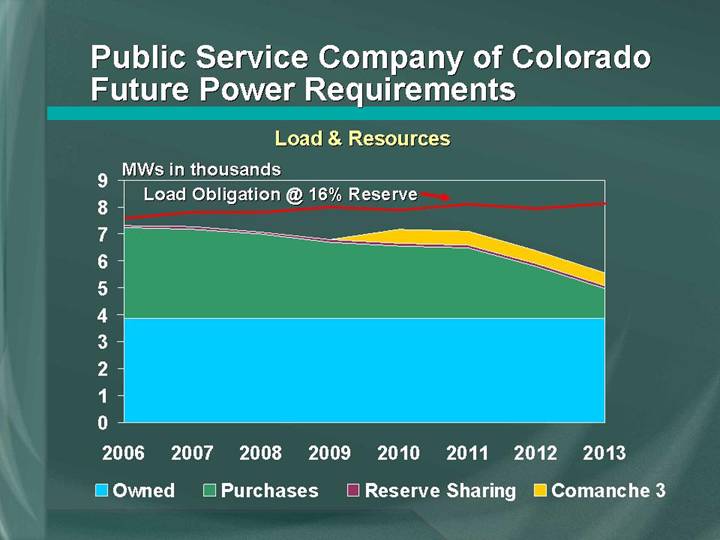
Future Power Requirements
Load & Resources
[CHART]
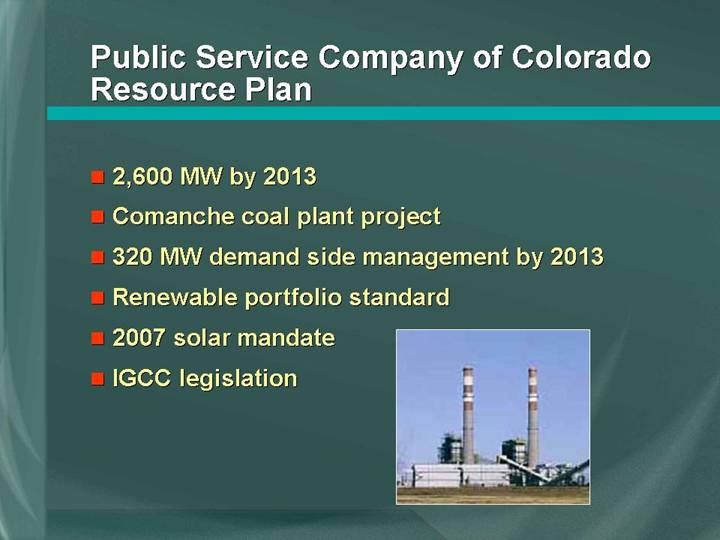
Resource Plan
• 2,600 MW by 2013
• Comanche coal plant project
• 320 MW demand side management by 2013
• Renewable portfolio standard
• 2007 solar mandate
• IGCC legislation
[GRAPHIC]
Customer Relations
• High exposure to natural gas volatility
• Quality of Service Plan reform
• Customer satisfaction trails other operating companies
• Major franchise renewals
• Fuel cost mitigation plan
Rates
• 2005 gas rate case
• 2006 electric rate case
• Multiple cost recovery clauses expire 12-31-06
[GRAPHIC]
Priorities
• Improve customer satisfaction
• Continue reliability initiatives
• Prepare 2006 electric rate case
• Conclude least-cost resource plan
• Increase capital and O&M flexibility
[GRAPHIC]
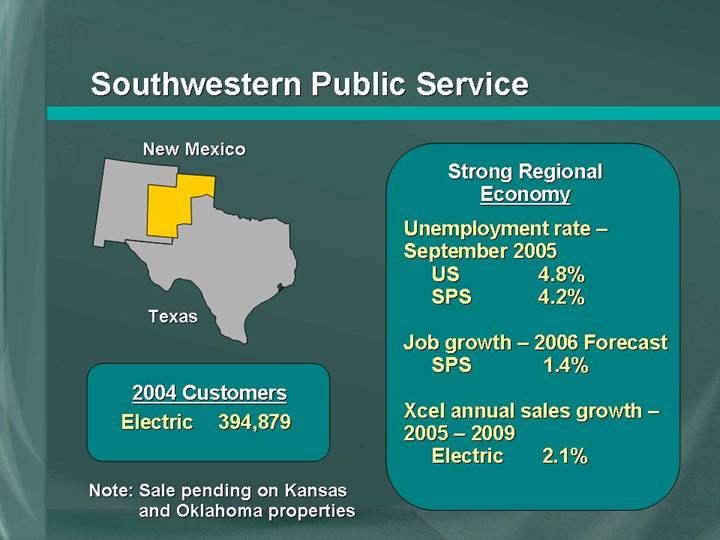
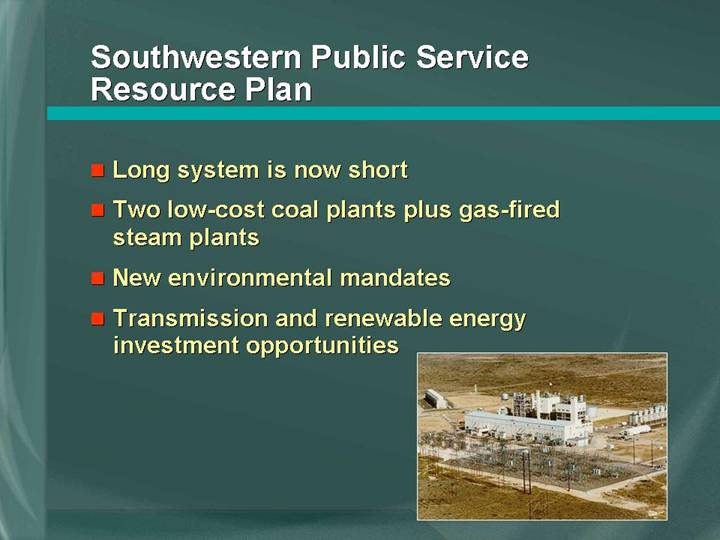
Southwestern Public Service
[GRAPHIC]
2004 Customers |
| | | |
Electric | | 394,879 | |
Strong Regional |
Economy |
| | | |
Unemployment rate – September 2005 | | | |
US | | 4.8 | % |
SPS | | 4.2 | % |
| | | |
Job growth – 2006 Forecast | | | |
SPS | | 1.4 | % |
| | | |
Xcel annual sales growth – 2005 – 2009 | | | |
Electric | | 2.1 | % |
Note: Sale pending on Kansas and Oklahoma properties
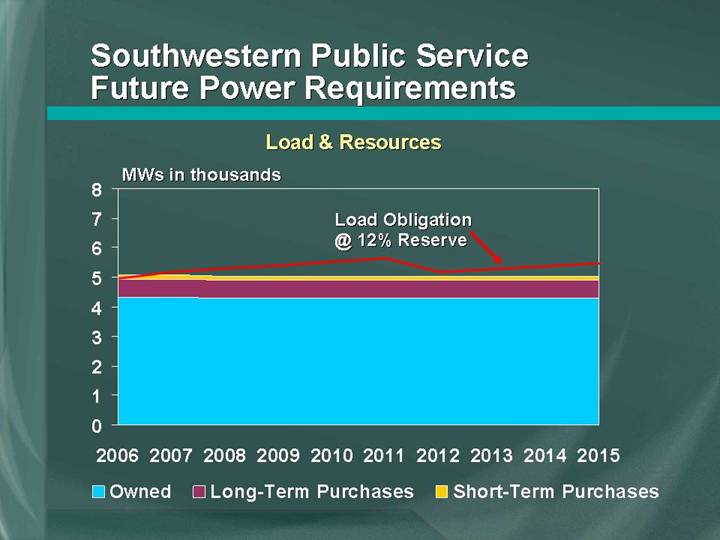
Future Power Requirements
Load & Resources
[CHART]
Resource Plan
• Long system is now short
• Two low-cost coal plants plus gas-fired steam plants
• New environmental mandates
• Transmission and renewable energy investment opportunities
[GRAPHIC]
Priorities
• Gain support for resource plan and cost recovery
• Prepare 2006 rate case
• Improve large customer relations
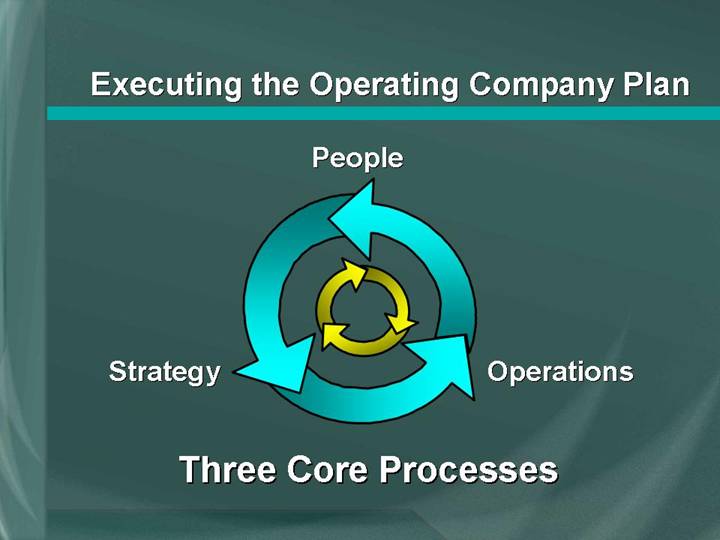
Executing the Operating Company Plan
| | People | | |
| | | | |
| | | | |
Strategy | | [GRAPHIC] | | Operations |
| | | | |
| | | | |
| | Three Core Processes | | |
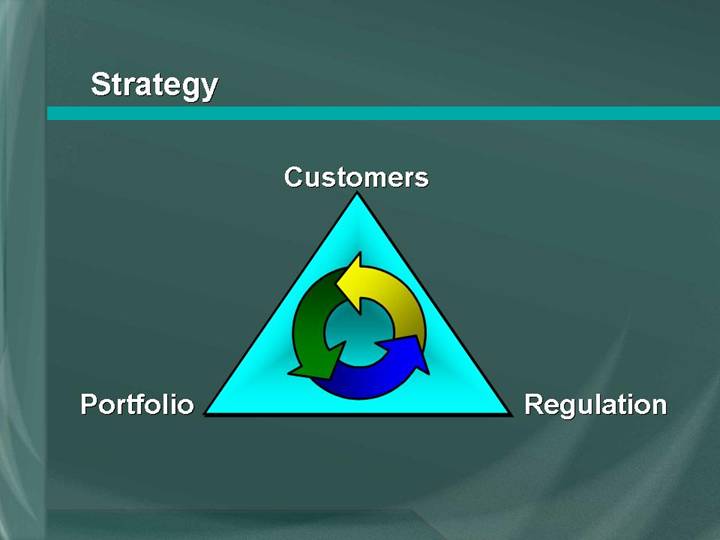
Strategy
| | Customers | | |
| | | | |
| | | | |
Portfolio | | [GRAPHIC] | | Regulation |
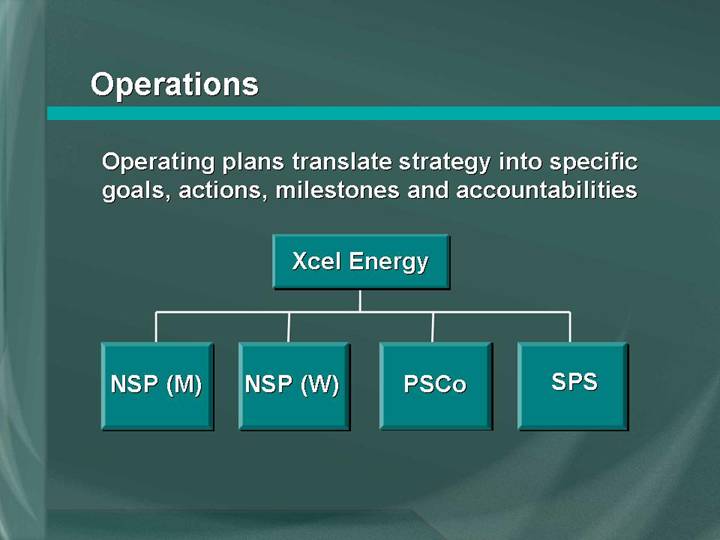
Operations
Operating plans translate strategy into specific goals, actions, milestones and accountabilities
Xcel Energy |
| | | | | | |
NSP (M) | | NSP (W) | | PSCo | | SPS |
Executing
The Operating Company Plans
Strategy
Make building generation, purchasing power and conservation financially equivalent
• Enables better decisions by considering all costs and benefits
• Compensates utility shareholders for lost margins and imputed debt
Execution
Resource plan decisions, rate proposals and legislation
• Comanche 3 settlement
• Minnesota rate case financial equivalency proposal
• Transmission riders
• Manage to authorized returns
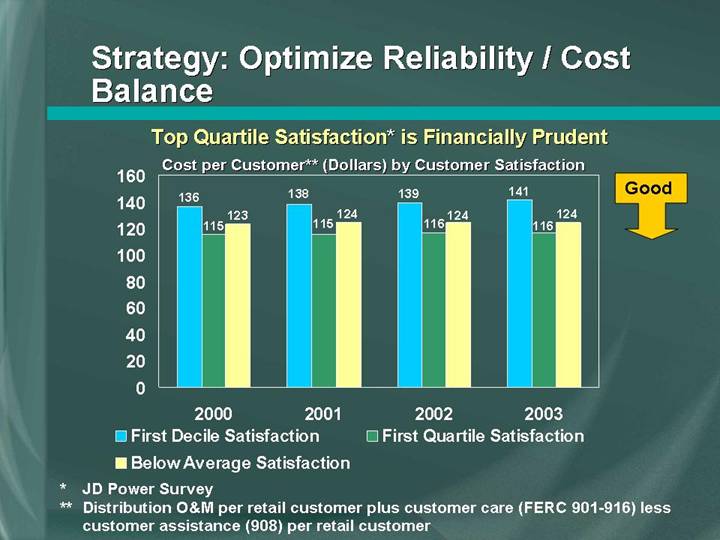
Strategy: Optimize Reliability / Cost Balance
Top Quartile Satisfaction* is Financially Prudent
Cost per Customer** (Dollars) by Customer Satisfaction
[CHART]
* JD Power Survey
** Distribution O&M per retail customer plus customer care (FERC 901-916) less customer assistance (908) per retail customer
Capital Investment per New Customer
[CHART]
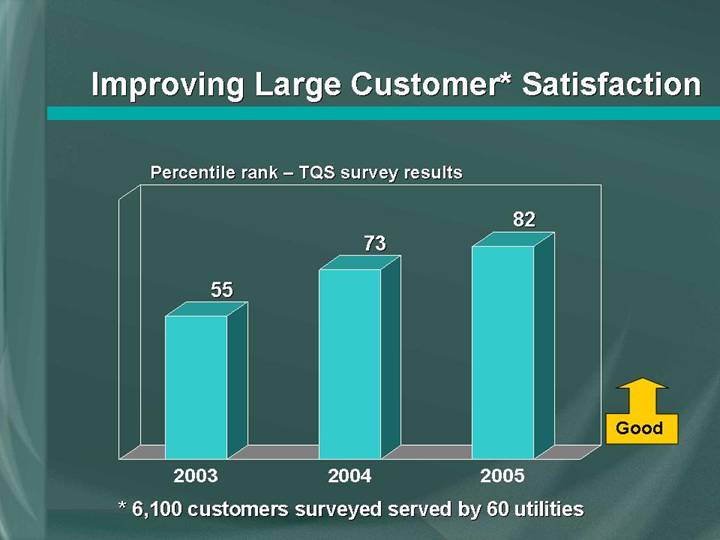
Improving Large Customer* Satisfaction
Percentile rank – TQS survey results
[CHART]
* 6,100 customers surveyed served by 60 utilities
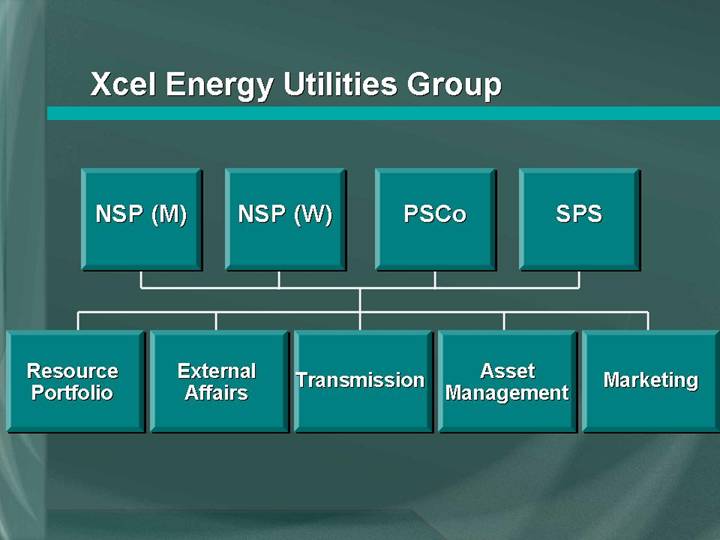
Xcel Energy Utilities Group
| NSP (M) | NSP (W) | PSCo | SPS | |
| | | | | | | | |
Resource
Portfolio | | External
Affairs | | Transmission | | Asset
Management | | Marketing |
| | | | | | | | | | | | | |
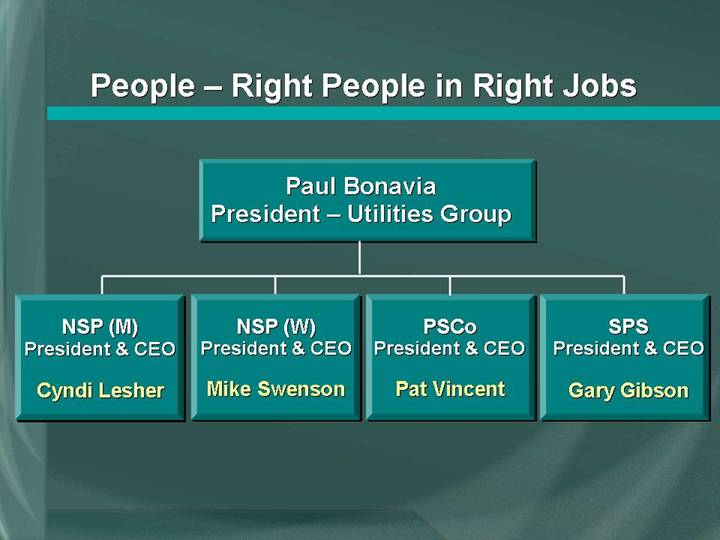
People – Right People in Right Jobs
Paul Bonavia |
President – Utilities Group |
| | | | | | |
NSP (M) | | NSP (W) | | PSCo | | SPS |
President & CEO | | President & CEO | | President & CEO | | President & CEO |
| | | | | | |
Cyndi Lesher | | Mike Swenson | | Pat Vincent | | Gary Gibson |
Executing
The Operating Company Plans
Financial |
Performance |
| | |
Regulators/ |
Legislators |
| | |
Value to | | Environmental |
Customers | | Stewardship |
| | |
Invest in Regulated Utility Business |