Searchable text section of graphics shown above
Safe Harbor
This material includes forward-looking statements that are subject to certain risks, uncertainties and assumptions. Such forward-looking statements include projected earnings, cash flows, capital expenditures and other statements and are identified in this document by the words “anticipate,” “estimate,” “expect,” “projected,” “objective,” “outlook,” “possible,” “potential” and similar expressions. Actual results may vary materially. Factors that could cause actual results to differ materially include, but are not limited to: general economic conditions, including the availability of credit, actions of rating agencies and their impact on capital expenditures; business conditions in the energy industry; competitive factors; unusual weather; effects of geopolitical events, including war and acts of terrorism; changes in federal or state legislation; regulation; final approval and implementation of the pending settlement of the securities, ERISA and derivative litigation; costs and other effects of legal administrative proceedings, settlements, investigations and claims including litigation related to company-owned life insurance (COLI); actions of accounting regulatory bodies; risks associated with the California power market; the higher degree of risk associated with Xcel Energy’s nonregulated businesses compared with Xcel Energy’s regulated business; and other risk factors listed from time to time by Xcel Energy in reports filed with the SEC, including Exhibit 99.01 to Xcel Energy’s report on Form 10-K for year 2004.
[LOGO]
[GRAPHIC]
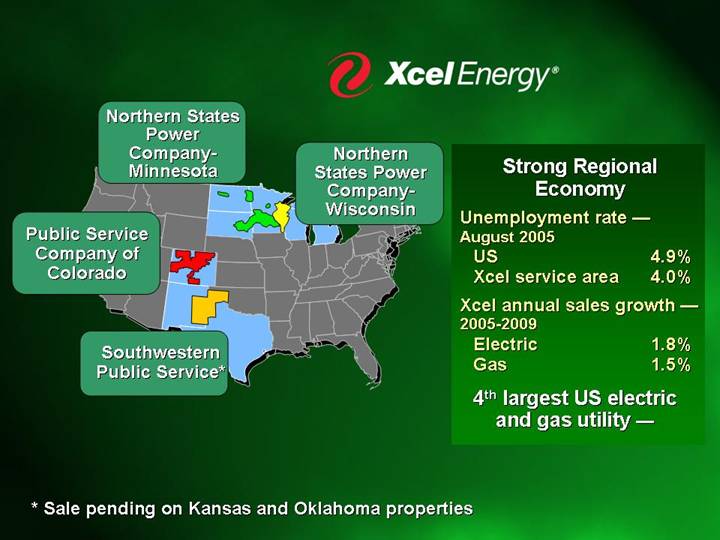
Strong Regional
Economy
Unemployment rate — August 2005 | | | |
US | | 4.9 | % |
Xcel service area | | 4.0 | % |
| | | |
Xcel annual sales growth — 2005-2009 | | | |
Electric | | 1.8 | % |
Gas | | 1.5 | % |
4th largest US electric
and gas utility —
* Sale pending on Kansas and Oklahoma properties
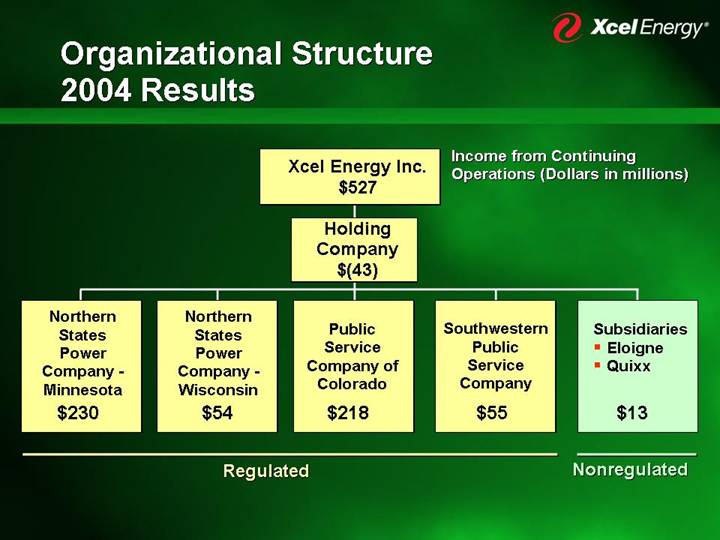
Organizational Structure
2004 Results
| | | | Xcel Energy Inc. | | Income from Continuing | |
| | | | $527 | | Operations (Dollars in millions) | |
| | | | | | | | | |
| | | | Holding | | | | | |
| | | | Company | | | | | |
| | | | $(43) | | | | | |
| | | | | | | | | |
Northern | | Northern | | | | | | | |
States | | States | | Public | | Southwestern | | Subsidiaries | |
Power | | Power | | Service | | Public | | • Eloigne | |
Company - | | Company - | | Company of | | Service | | • Quixx | |
Minnesota | | Wisconsin | | Colorado | | Company | | | |
$230 | | $54 | | $218 | | $55 | | $13 | |
| | | | | | | | | |
Regulated | | Nonregulated | |
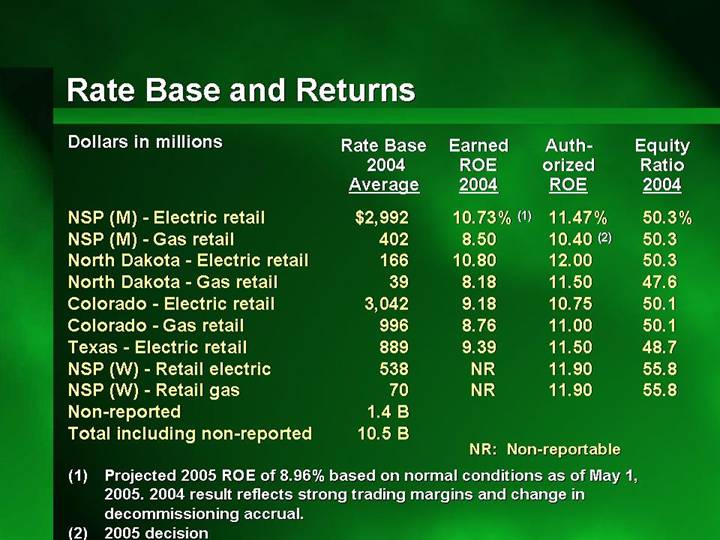
Rate Base and Returns
Dollars in millions
| | Rate Base | | Earned | | | | Equity | |
| | 2004 | | ROE | | Authorized | | Ratio | |
| | Average | | 2004 | | ROE | | 2004 | |
| | | | | | | | | |
NSP (M) - Electric retail | | $ | 2,992 | | 10.73 | %(1) | 11.47 | % | 50.3 | % |
NSP (M) - Gas retail | | 402 | | 8.50 | | 10.40 | (2) | 50.3 | |
North Dakota - Electric retail | | 166 | | 10.80 | | 12.00 | | 50.3 | |
North Dakota - Gas retail | | 39 | | 8.18 | | 11.50 | | 47.6 | |
Colorado - Electric retail | | 3,042 | | 9.18 | | 10.75 | | 50.1 | |
Colorado - Gas retail | | 996 | | 8.76 | | 11.00 | | 50.1 | |
Texas - Electric retail | | 889 | | 9.39 | | 11.50 | | 48.7 | |
NSP (W) - Retail electric | | 538 | | NR | | 11.90 | | 55.8 | |
NSP (W) - Retail gas | | 70 | | NR | | 11.90 | | 55.8 | |
Non-reported | | 1.4 B | | | | | | | |
Total including non-reported | | 10.5 B | | | | | | | |
| | | | | | | | | | |
(1) Projected 2005 ROE of 8.96% based on normal conditions as of May 2005. 2004 result reflects strong trading margins and change in decommissioning accrual.
(2) 2005 decision
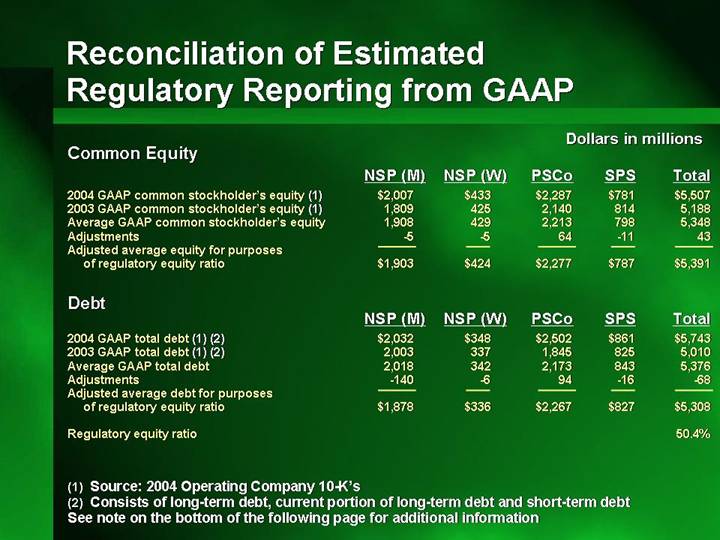
Reconciliation of Estimated Regulatory Reporting from GAAP
Dollars in millions
Common Equity
| | NSP (M) | | NSP (W) | | PSCo | | SPS | | Total | |
2004 GAAP common stockholder’s equity (1) | | $ | 2,007 | | $ | 433 | | $ | 2,287 | | $ | 781 | | $ | 5,507 | |
2003 GAAP common stockholder’s equity (1) | | 1,809 | | 425 | | 2,140 | | 814 | | 5,188 | |
Average GAAP common stockholder’s equity | | 1,908 | | 429 | | 2,213 | | 798 | | 5,348 | |
Adjustments | | -5 | | -5 | | 64 | | -11 | | 43 | |
Adjusted average equity for purposes of regulatory equity ratio | | $ | 1,903 | | $ | 424 | | $ | 2,277 | | $ | 787 | | $ | 5,391 | |
| | | | | | | | | | | |
Debt | | | | | | | | | | | |
| | | | | | | | | | | |
| | NSP (M) | | NSP (W) | | PSCo | | SPS | | Total | |
| | | | | | | | | | | |
2004 GAAP total debt (1) (2) | | $ | 2,032 | | $ | 348 | | $ | 2,502 | | $ | 861 | | $ | 5,743 | |
2003 GAAP total debt (1) (2) | | 2,003 | | 337 | | 1,845 | | 825 | | 5,010 | |
Average GAAP total debt | | 2,018 | | 342 | | 2,173 | | 843 | | 5,376 | |
Adjustments | | -140 | | -6 | | 94 | | -16 | | -68 | |
Adjusted average debt for purposes of regulatory equity ratio | | $ | 1,878 | | $ | 336 | | $ | 2,267 | | $ | 827 | | $ | 5,308 | |
| | | | | | | | | | | |
Regulatory equity ratio | | | | | | | | | | 50.4 | % |
(1) Source: 2004 Operating Company 10-K’s
(2) Consists of long-term debt, current portion of long-term debt and short-term debt
See note on the bottom of the following page for additional information
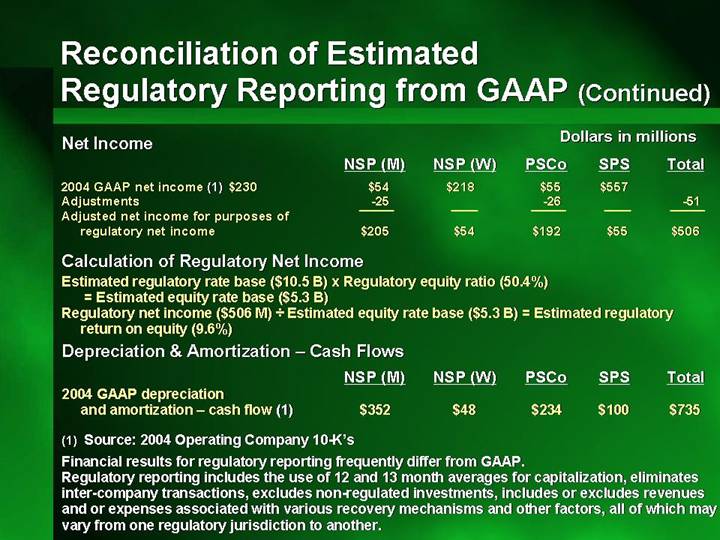
Net Income | | Dollars in millions |
| | NSP (M) | | NSP (W) | | PSCo | | SPS | | Total | |
2004 GAAP net income (1) $230 | | $ | 54 | | $ | 218 | | $ | 55 | | $ | 557 | | | |
Adjustments | | -25 | | | | -26 | | | | -51 | |
Adjusted net income for purposes of regulatory net income | | $ | 205 | | $ | 54 | | $ | 192 | | $ | 55 | | $ | 506 | |
| | | | | | | | | | | | | | | | |
Calculation of Regulatory Net Income
Estimated regulatory rate base ($10.5 B) x Regulatory equity ratio (50.4%) = Estimated equity rate base ($5.3 B)
Regulatory net income ($506 M) ÷ Estimated equity rate base ($5.3 B) = Estimated regulatory return on equity (9.6%)
Depreciation & Amortization – Cash Flows
| | NSP (M) | | NSP (W) | | PSCo | | SPS | | Total | |
2004 GAAP depreciation and amortization – cash flow (1) | | $ | 352 | | $ | 48 | | $ | 234 | | $ | 100 | | $ | 735 | |
| | | | | | | | | | | | | | | | |
(1) Source: 2004 Operating Company 10-K’s
Financial results for regulatory reporting frequently differ from GAAP.
Regulatory reporting includes the use of 12 and 13 month averages for capitalization, eliminates inter-company transactions, excludes non-regulated investments, includes or excludes revenues and or expenses associated with various recovery mechanisms and other factors, all of which may vary from one regulatory jurisdiction to another.
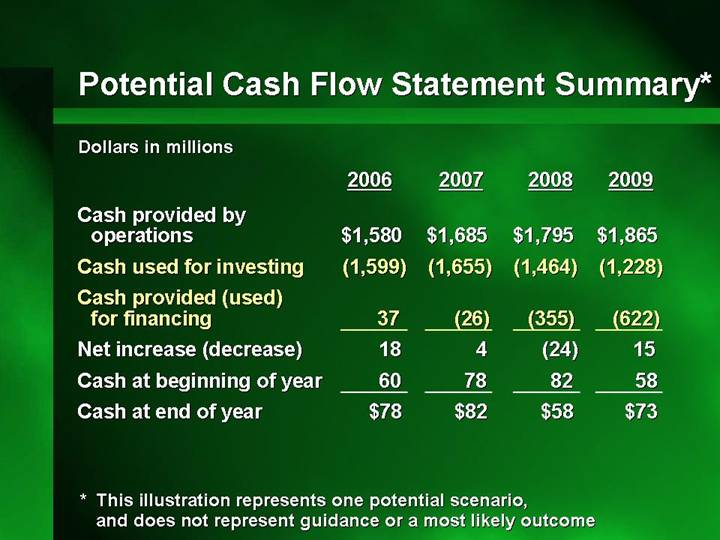
Potential Cash Flow Statement Summary*
Dollars in millions
| | 2006 | | 2007 | | 2008 | | 2009 | |
Cash provided by operations | | $ | 1,580 | | $ | 1,685 | | $ | 1,795 | | $ | 1,865 | |
Cash used for investing | | (1,599 | ) | (1,655 | ) | (1,464 | ) | (1,228 | ) |
Cash provided (used) for financing | | 37 | | (26 | ) | (355 | ) | (622 | ) |
Net increase (decrease) | | 18 | | 4 | | (24 | ) | 15 | |
Cash at beginning of year | | 60 | | 78 | | 82 | | 58 | |
Cash at end of year | | $ | 78 | | $ | 82 | | $ | 58 | | $ | 73 | |
* This illustration represents one potential scenario, and does not represent guidance or a most likely outcome
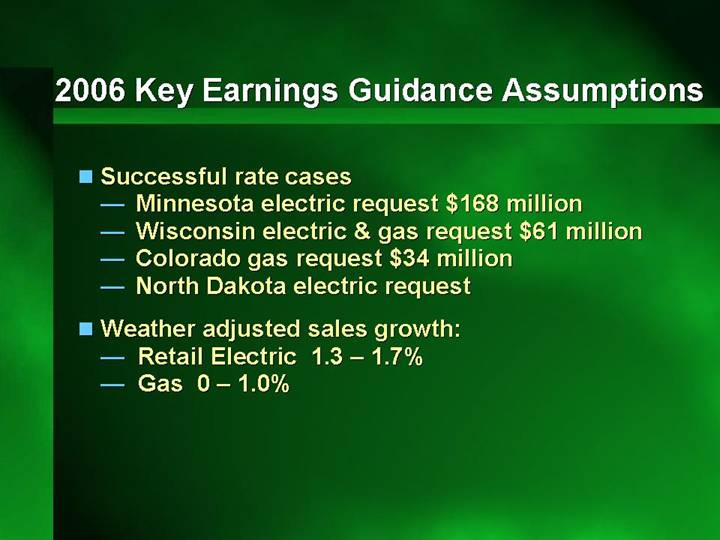
2006 Key Earnings Guidance Assumptions
• Successful rate cases
• Minnesota electric request $168 million
• Wisconsin electric & gas request $61 million
• Colorado gas request $34 million
• North Dakota electric request
• Weather adjusted sales growth:
• Retail Electric 1.3 – 1.7%
• Gas 0 – 1.0%
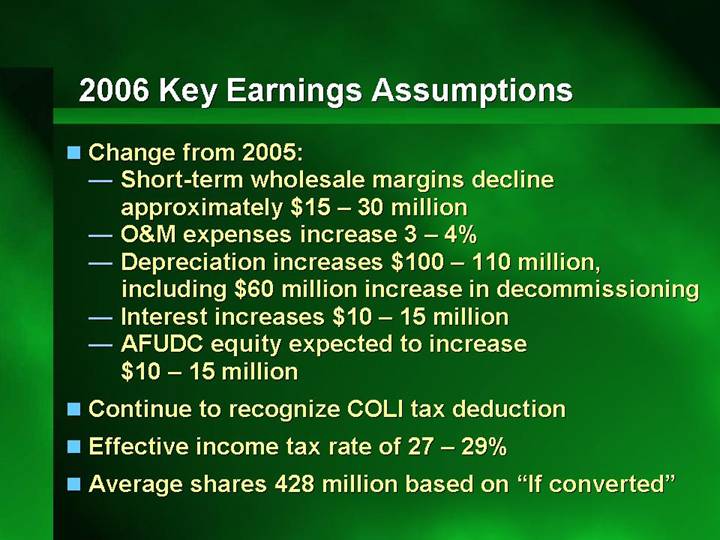
2006 Key Earnings Assumptions
• Change from 2005:
• Short-term wholesale margins decline approximately $15 – 30 million
• O&M expenses increase 3 – 4%
• Depreciation increases $100 – 110 million, including $60 million increase in decommissioning
• Interest increases $10 – 15 million
• AFUDC equity expected to increase $10 – 15 million
• Continue to recognize COLI tax deduction
• Effective income tax rate of 27 – 29%
• Average shares 428 million based on “If converted”
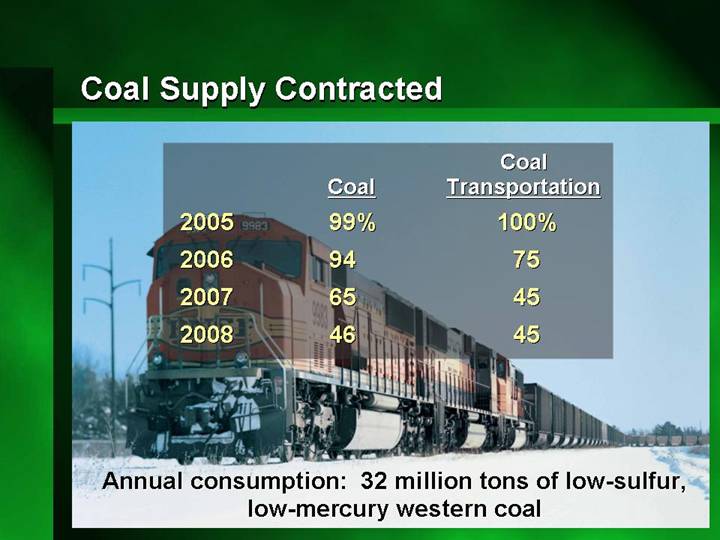
Coal Supply Contracted
[GRAPHIC]
| | | | Coal | |
| | Coal | | Transportation | |
2005 | | 99 | % | 100 | % |
2006 | | 94 | | 75 | |
2007 | | 65 | | 45 | |
2008 | | 46 | | 45 | |
Annual consumption: 32 million tons of low-sulfur, low-mercury western coal
Electric Fuel and Purchased Energy Cost Recovery Mechanisms
Minnesota: | | Monthly recovery of prospective costs |
| | |
Colorado: | | Recovery of costs with sharing of deviations up to + $11.25 million from benchmark |
| | |
Texas: | | File for semi-annual adjustments – required if + 4% annually |
| | |
Wisconsin: | | Biennial rate case – file for interim adjustment if costs fall outside + 2% annually |
| | |
New Mexico: | | Recovery of costs with 2 month lag |
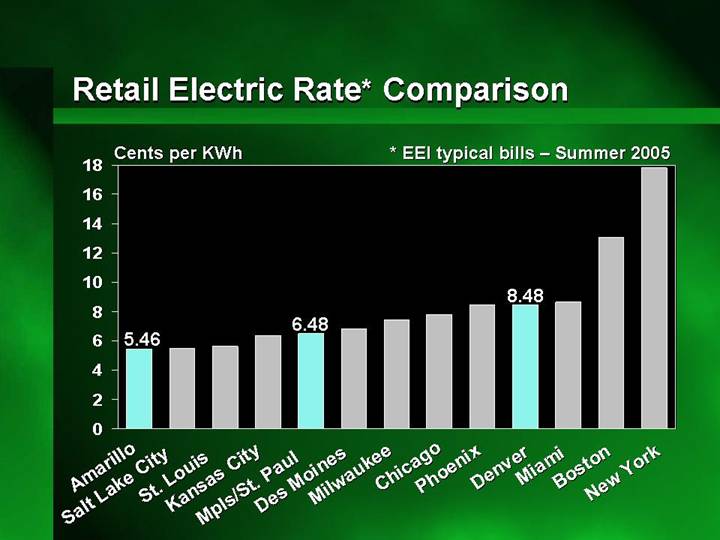
Retail Electric Rate* Comparison
[CHART]
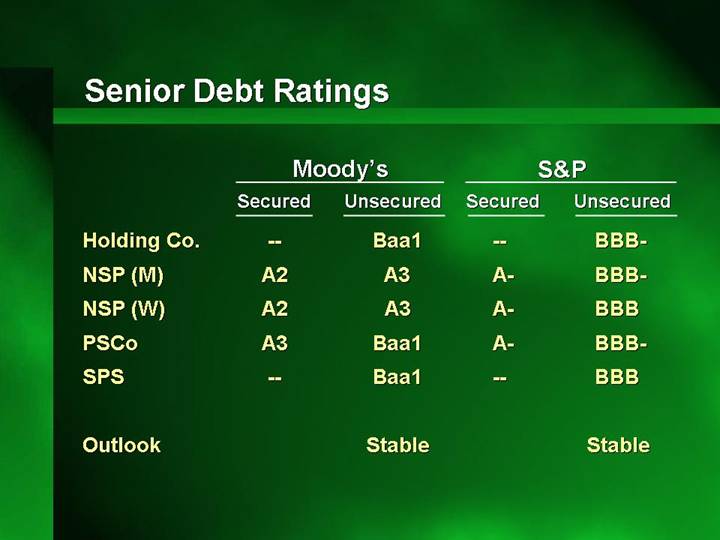
Senior Debt Ratings
| | Moody’s | | S&P | |
| | Secured | | Unsecured | | Secured | | Unsecured | |
| | | | | | | | | |
Holding Co. | | — | | Baa1 | | — | | BBB- | |
NSP (M) | | A2 | | A3 | | A- | | BBB- | |
NSP (W) | | A2 | | A3 | | A- | | BBB | |
PSCo | | A3 | | Baa1 | | A- | | BBB- | |
SPS | | — | | Baa1 | | — | | BBB | |
| | | | | | | | | |
Outlook | | | | Stable | | | | Stable | |
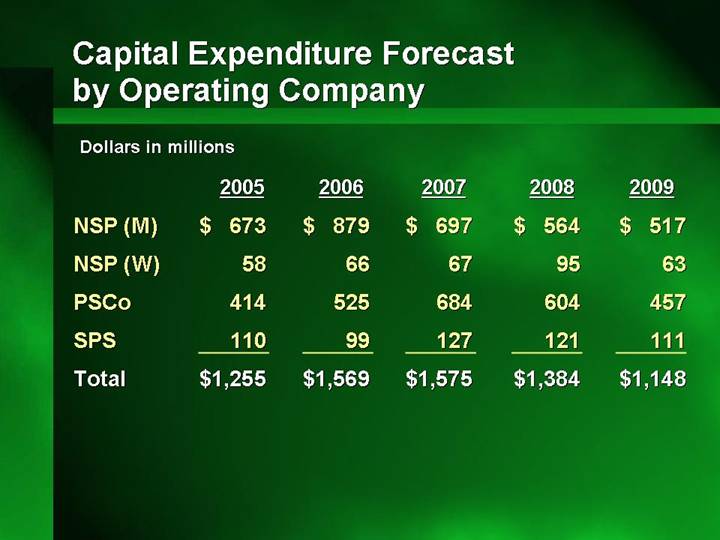
Capital Expenditure Forecast by Operating Company
Dollars in millions
| | 2005 | | 2006 | | 2007 | | 2008 | | 2009 | |
| | | | | | | | | | | |
NSP (M) | | $ | 673 | | $ | 879 | | $ | 697 | | $ | 564 | | $ | 517 | |
NSP (W) | | 58 | | 66 | | 67 | | 95 | | 63 | |
PSCo | | 414 | | 525 | | 684 | | 604 | | 457 | |
SPS | | 110 | | 99 | | 127 | | 121 | | 111 | |
Total | | $ | 1,255 | | $ | 1,569 | | $ | 1,575 | | $ | 1,384 | | $ | 1,148 | |
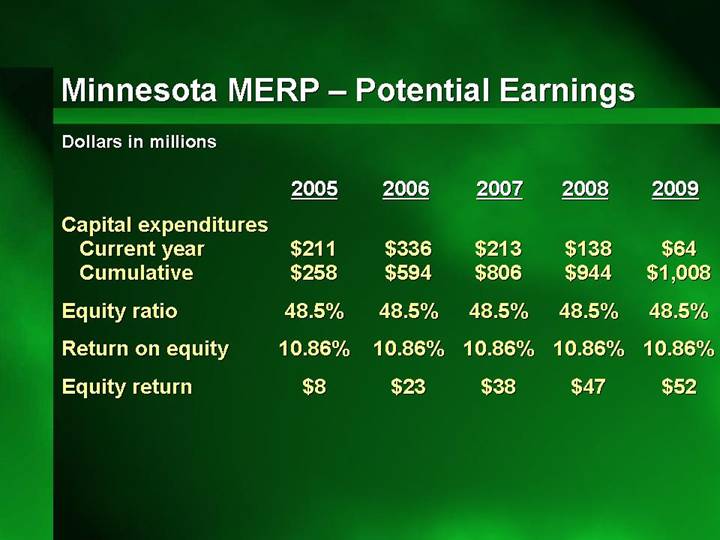
Minnesota MERP – Potential Earnings
Dollars in millions
| | 2005 | | 2006 | | 2007 | | 2008 | | 2009 | |
| | | | | | | | | | | |
Capital expenditures | | | | | | | | | | | |
Current year | | $ | 211 | | $ | 336 | | $ | 213 | | $ | 138 | | $ | 64 | |
Cumulative | | $ | 258 | | $ | 594 | | $ | 806 | | $ | 944 | | $ | 1,008 | |
| | | | | | | | | | | |
Equity ratio | | 48.5 | % | 48.5 | % | 48.5 | % | 48.5 | % | 48.5 | % |
| | | | | | | | | | | |
Return on equity | | 10.86 | % | 10.86 | % | 10.86 | % | 10.86 | % | 10.86 | % |
| | | | | | | | | | | |
Equity return | | $ | 8 | | $ | 23 | | $ | 38 | | $ | 47 | | $ | 52 | |
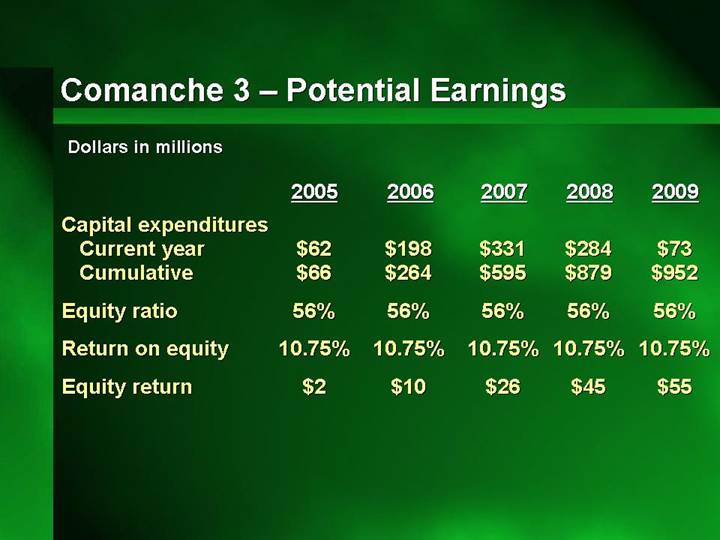
Comanche 3 – Potential Earnings
Dollars in millions
| | 2005 | | 2006 | | 2007 | | 2008 | | 2009 | |
| | | | | | | | | | | |
Capital expenditures | | | | | | | | | | | |
Current year | | $ | 62 | | $ | 198 | | $ | 331 | | $ | 284 | | $ | 73 | |
Cumulative | | $ | 66 | | $ | 264 | | $ | 595 | | $ | 879 | | $ | 952 | |
| | | | | | | | | | | |
Equity ratio | | 56 | % | 56 | % | 56 | % | 56 | % | 56 | % |
| | | | | | | | | | | |
Return on equity | | 10.75 | % | 10.75 | % | 10.75 | % | 10.75 | % | 10.75 | % |
| | | | | | | | | | | |
Equity return | | $ | 2 | | $ | 10 | | $ | 26 | | $ | 45 | | $ | 55 | |