Searchable text section of graphics shown above
[LOGO]
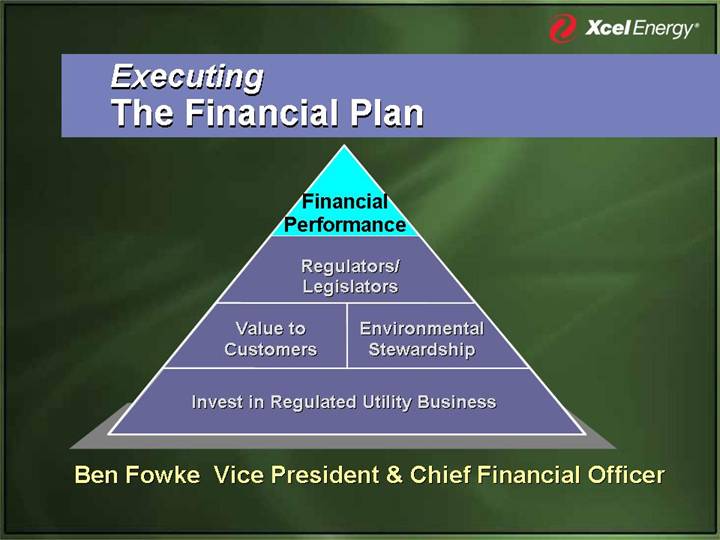
Executing
The Financial Plan
Financial |
Performance |
| | |
Regulators/ |
Legislators |
| | |
Value to | | Environmental |
Customers | | Stewardship |
| | |
Invest in Regulated Utility Business |
Ben Fowke Vice President & Chief Financial Officer
Safe Harbor
This material includes forward-looking statements that are subject to certain risks, uncertainties and assumptions. Such forward-looking statements include projected earnings, cash flows, capital expenditures and other statements and are identified in this document by the words “anticipate,” “estimate,” “expect,” “projected,” “objective,” “outlook,” “possible,” “potential” and similar expressions. Actual results may vary materially. Factors that could cause actual results to differ materially include, but are not limited to: general economic conditions, including the availability of credit, actions of rating agencies and their impact on capital expenditures; business conditions in the energy industry; competitive factors; unusual weather; effects of geopolitical events, including war and acts of terrorism; changes in federal or state legislation; regulation; final approval and implementation of the pending settlement of the securities, ERISA and derivative litigation; costs and other effects of legal administrative proceedings, settlements, investigations and claims including litigation related to company-owned life insurance (COLI); actions of accounting regulatory bodies; risks associated with the California power market; the higher degree of risk associated with Xcel Energy’s nonregulated businesses compared with Xcel Energy’s regulated business; and other risk factors listed from time to time by Xcel Energy in reports filed with the SEC, including Exhibit 99.01 to Xcel Energy’s report on Form 10-K for year 2004.
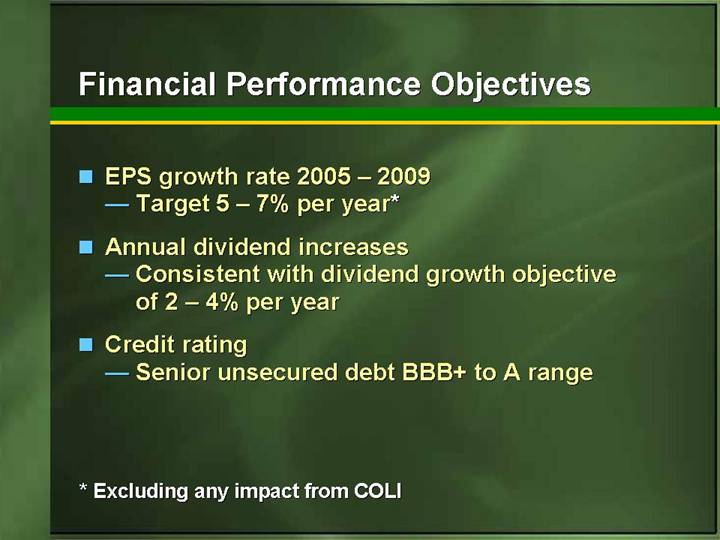
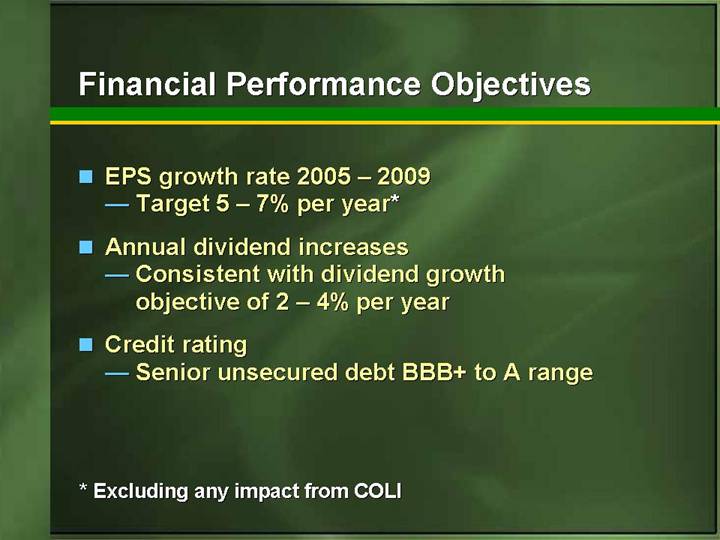
Financial Performance Objectives
• EPS growth rate 2005 – 2009
• Target 5 – 7% per year*
• Annual dividend increases
• Consistent with dividend growth objective of 2 – 4% per year
• Credit rating
• Senior unsecured debt BBB+ to A range
* Excluding any impact from COLI
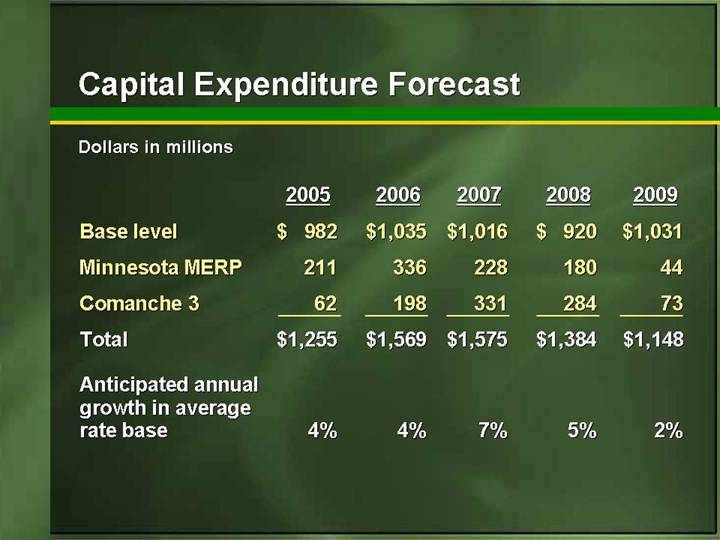
Capital Expenditure Forecast
Dollars in millions
| | 2005 | | 2006 | | 2007 | | 2008 | | 2009 | |
| | | | | | | | | | | |
Base level | | $ | 982 | | $ | 1,035 | | $ | 1,016 | | $ | 920 | | $ | 1,031 | |
| | | | | | | | | | | |
Minnesota MERP | | 211 | | 336 | | 228 | | 180 | | 44 | |
| | | | | | | | | | | |
Comanche 3 | | 62 | | 198 | | 331 | | 284 | | 73 | |
| | | | | | | | | | | |
Total | | $ | 1,255 | | $ | 1,569 | | $ | 1,575 | | $ | 1,384 | | $ | 1,148 | |
| | | | | | | | | | | |
Anticipated annual growth in average rate base | | 4 | % | 4 | % | 7 | % | 5 | % | 2 | % |
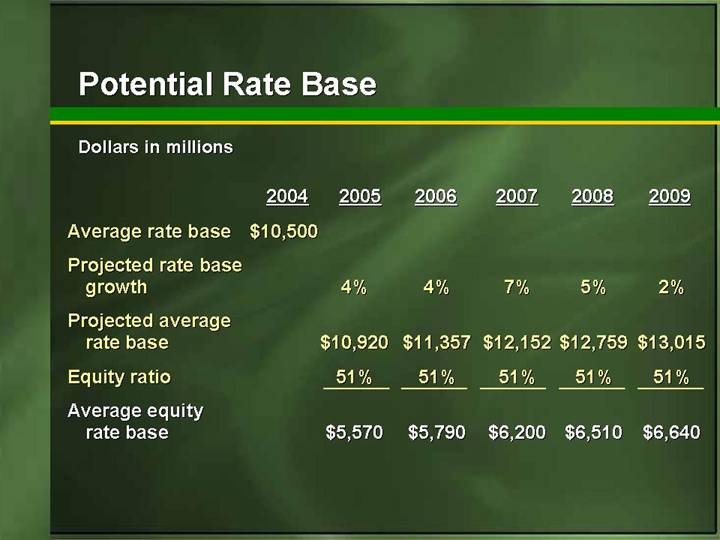
Potential Rate Base
Dollars in millions
| | 2004 | | 2005 | | 2006 | | 2007 | | 2008 | | 2009 | |
| | | | | | | | | | | | | |
Average rate base | | $ | 10,500 | | | | | | | | | | | |
| | | | | | | | | | | | | |
Projected rate base growth | | | | 4 | % | 4 | % | 7 | % | 5 | % | 2 | % |
| | | | | | | | | | | | | |
Projected average rate base | | | | $ | 10,920 | | $ | 11,357 | | $ | 12,152 | | $ | 12,759 | | $ | 13,015 | |
| | | | | | | | | | | | | |
Equity ratio | | | | 51 | % | 51 | % | 51 | % | 51 | % | 51 | % |
| | | | | | | | | | | | | |
Average equity rate base | | | | $ | 5,570 | | $ | 5,790 | | $ | 6,200 | | $ | 6,510 | | $ | 6,640 | |
| | | | | | | | | | | | | | | | | | | |
Potential Regulatory Net Income
Dollars in millions
| | 2006 | | 2007 | | 2008 | | 2009 | |
| | | | | | | | | |
Equity rate base | | $ | 5,790 | | $ | 6,200 | | $ | 6,510 | | $ | 6,640 | |
| | | | | | | | | |
ROE | | | | | | | | | |
9.2% | | $ | 530 | * | $ | 570 | | $ | 600 | | $ | 610 | |
9.5% | | $ | 550 | * | $ | 590 | * | $ | 620 | | $ | 630 | |
10.0% | | $ | 580 | * | $ | 620 | * | $ | 650 | * | $ | 660 | |
10.5% | | $ | 610 | | $ | 650 | * | $ | 680 | * | $ | 700 | * |
11.0% | | | | $ | 680 | | $ | 720 | * | $ | 730 | * |
* Potential trajectory
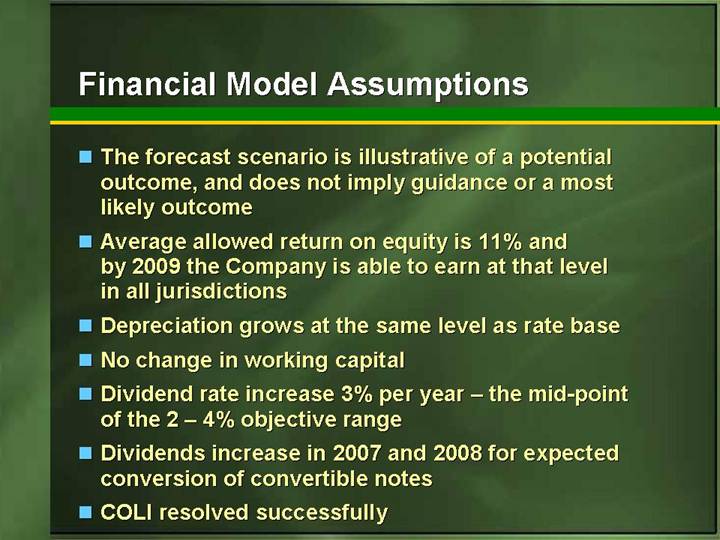
Financial Model Assumptions
• The forecast scenario is illustrative of a potential outcome, and does not imply guidance or a most likely outcome
• Average allowed return on equity is 11% and by 2009 the Company is able to earn at that level in all jurisdictions
• Depreciation grows at the same level as rate base
• No change in working capital
• Dividend rate increase 3% per year – the mid-point of the 2 – 4% objective range
• Dividends increase in 2007 and 2008 for expected conversion of convertible notes
• COLI resolved successfully
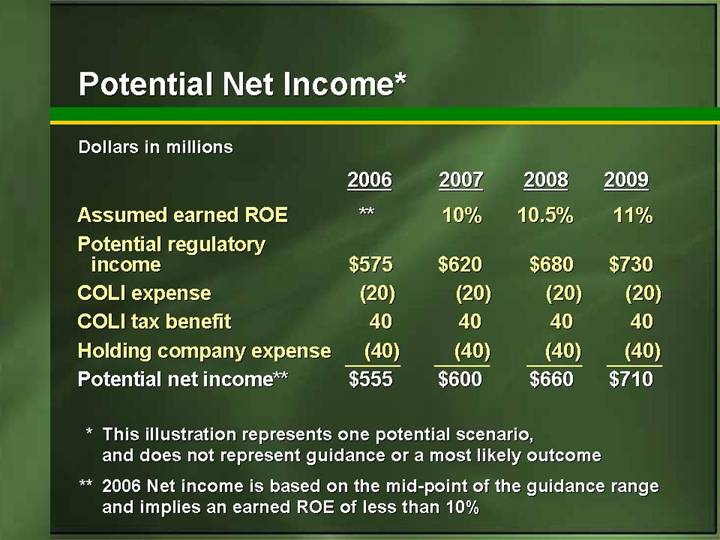
Potential Net Income*
Dollars in millions
| | 2006 | | 2007 | | 2008 | | 2009 | |
| | | | | | | | | |
Assumed earned ROE | | | ** | 10 | % | 10.5 | % | 11 | % |
| | | | | | | | | |
Potential regulatory income | | $ | 575 | | $ | 620 | | $ | 680 | | $ | 730 | |
| | | | | | | | | |
COLI expense | | (20 | ) | (20 | ) | (20 | ) | (20 | ) |
| | | | | | | | | |
COLI tax benefit | | 40 | | 40 | | 40 | | 40 | |
| | | | | | | | | |
Holding company expense | | (40 | ) | (40 | ) | (40 | ) | (40 | ) |
| | | | | | | | | |
Potential net income** | | $ | 555 | | $ | 600 | | $ | 660 | | $ | 710 | |
* This illustration represents one potential scenario, and does not represent guidance or a most likely outcome
** 2006 Net income is based on the mid-point of the guidance range and implies an earned ROE of less than 10%
Potential Cash Provided by Operations*
Dollars in millions
| | 2006 | | 2007 | | 2008 | | 2009 | |
| | | | | | | | | |
Potential net income | | $ | 555 | | $ | 600 | | $ | 660 | | $ | 710 | |
| | | | | | | | | |
Depreciation & amortization | | 900 | | 960 | | 1,010 | | 1,030 | |
| | | | | | | | | |
NOL tax benefit | | 125 | | 125 | | 125 | | 125 | |
| | | | | | | | | |
Potential cash provided by operations | | $ | 1,580 | | $ | 1,685 | | $ | 1,795 | | $ | 1,865 | |
* This illustration represents one potential scenario, and does not represent guidance or a most likely outcome
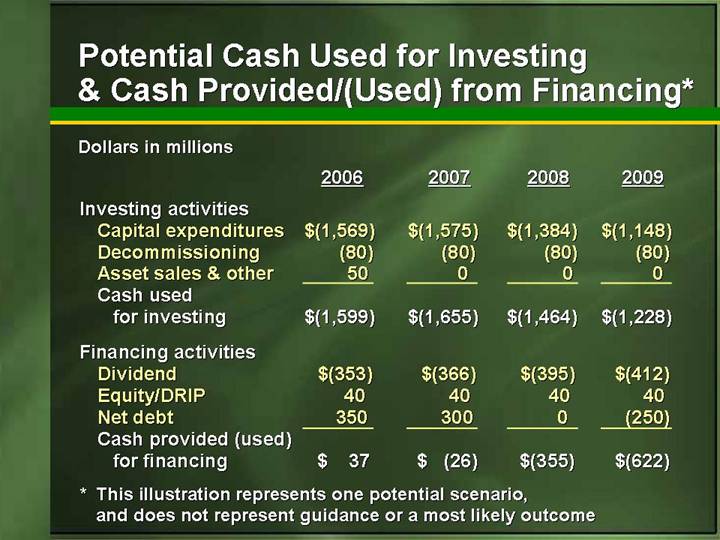
Potential Cash Used for Investing & Cash Provided/(Used) from Financing*
Dollars in millions
| | 2006 | | 2007 | | 2008 | | 2009 | |
| | | | | | | | | |
Investing activities | | | | | | | | | |
Capital expenditures | | $ | (1,569 | ) | $ | (1,575 | ) | $ | (1,384 | ) | $ | (1,148 | ) |
Decommissioning | | (80 | ) | (80 | ) | (80 | ) | (80 | ) |
Asset sales & other | | 50 | | 0 | | 0 | | 0 | |
Cash used for investing | | $ | (1,599 | ) | $ | (1,655 | ) | $ | (1,464 | ) | $ | (1,228 | ) |
| | | | | | | | | |
Financing activities | | | | | | | | | |
Dividend | | $ | (353 | ) | $ | (366 | ) | $ | (395 | ) | $ | (412 | ) |
Equity/DRIP | | 40 | | 40 | | 40 | | 40 | |
Net debt | | 350 | | 300 | | 0 | | (250 | ) |
Cash provided (used) for financing | | $ | 37 | | $ | (26 | ) | $ | (355 | ) | $ | (622 | ) |
* This illustration represents one potential scenario, and does not represent guidance or a most likely outcome
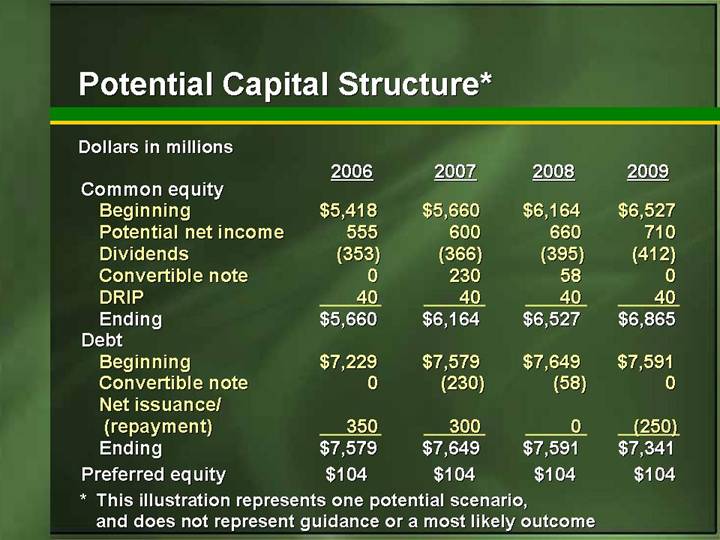
Potential Capital Structure*
Dollars in millions
| | 2006 | | 2007 | | 2008 | | 2009 | |
| | | | | | | | | |
Common equity | | | | | | | | | |
Beginning | | $ | 5,418 | | $ | 5,660 | | $ | 6,164 | | $ | 6,527 | |
Potential net income | | 555 | | 600 | | 660 | | 710 | |
Dividends | | (353 | ) | (366 | ) | (395 | ) | (412 | ) |
Convertible note | | 0 | | 230 | | 58 | | 0 | |
DRIP | | 40 | | 40 | | 40 | | 40 | |
Ending | | $ | 5,660 | | $ | 6,164 | | $ | 6,527 | | $ | 6,865 | |
| | | | | | | | | |
Debt | | | | | | | | | |
Beginning | | $ | 7,229 | | $ | 7,579 | | $ | 7,649 | | $ | 7,591 | |
Convertible note | | 0 | | (230 | ) | (58 | ) | 0 | |
Net issuance/(repayment) | | 350 | | 300 | | 0 | | (250 | ) |
Ending | | $ | 7,579 | | $ | 7,649 | | $ | 7,591 | | $ | 7,341 | |
| | | | | | | | | | | | | |
Preferred equity | | $ | 104 | | $ | 104 | | $ | 104 | | $ | 104 | |
* This illustration represents one potential scenario, and does not represent guidance or a most likely outcome
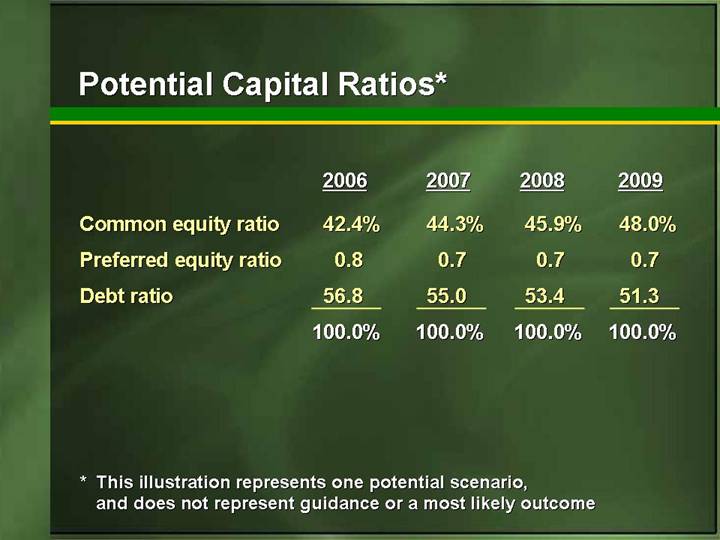
Potential Capital Ratios*
| | 2006 | | 2007 | | 2008 | | 2009 | |
| | | | | | | | | |
Common equity ratio | | 42.4 | % | 44.3 | % | 45.9 | % | 48.0 | % |
| | | | | | | | | |
Preferred equity ratio | | 0.8 | | 0.7 | | 0.7 | | 0.7 | |
| | | | | | | | | |
Debt ratio | | 56.8 | | 55.0 | | 53.4 | | 51.3 | |
| | | | | | | | | |
| | 100.0 | % | 100.0 | % | 100.0 | % | 100.0 | % |
* This illustration represents one potential scenario, and does not represent guidance or a most likely outcome
Potential Consolidated Net Income*
Dollars in millions
| | | | | | | | | | Growth | |
| | | | | | | | | | rate from | |
| | | | | | | | | | 2005 | |
| | 2006 | | 2007 | | 2008 | | 2009 | | guidance* | |
| | | | | | | | | | | |
Regulatory ROE | | | | | | | | | | | |
9.5% | | $ | 530 | ^ | $ | 570 | | $ | 600 | | $ | 610 | | 4.3 | % |
10.0% | | $ | 560 | ^ | $ | 600 | ^ | $ | 630 | ^ | $ | 640 | | 5.6 | % |
10.5% | | $ | 590 | | $ | 630 | ^ | $ | 660 | ^ | $ | 680 | ^ | 7.2 | % |
11.0% | | | | $ | 660 | | $ | 700 | ^ | $ | 710 | ^ | 8.4 | % |
* The growth rate uses an estimate of 2005 net income of $515 million, which is based on the mid-point of the lower half of the $1.18 – $1.28 guidance range
^ Potential trajectory
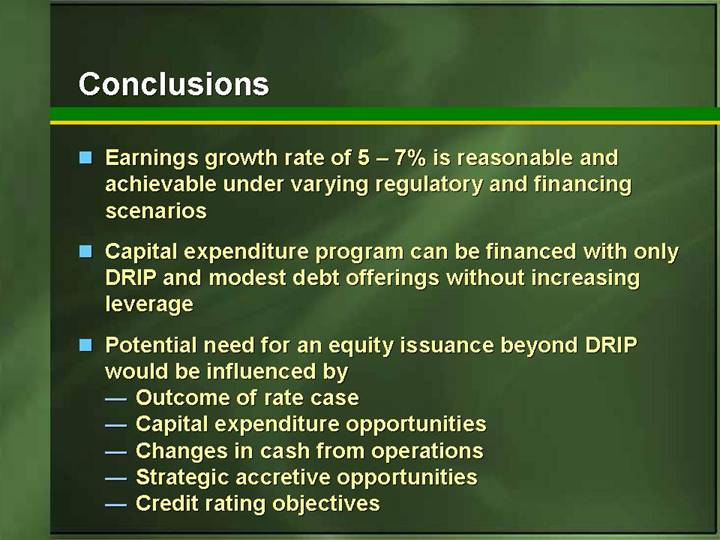
Conclusions
• Earnings growth rate of 5 – 7% is reasonable and achievable under varying regulatory and financing scenarios
• Capital expenditure program can be financed with only DRIP and modest debt offerings without increasing leverage
• Potential need for an equity issuance beyond DRIP would be influenced by
• Outcome of rate case
• Capital expenditure opportunities
• Changes in cash from operations
• Strategic accretive opportunities
• Credit rating objectives
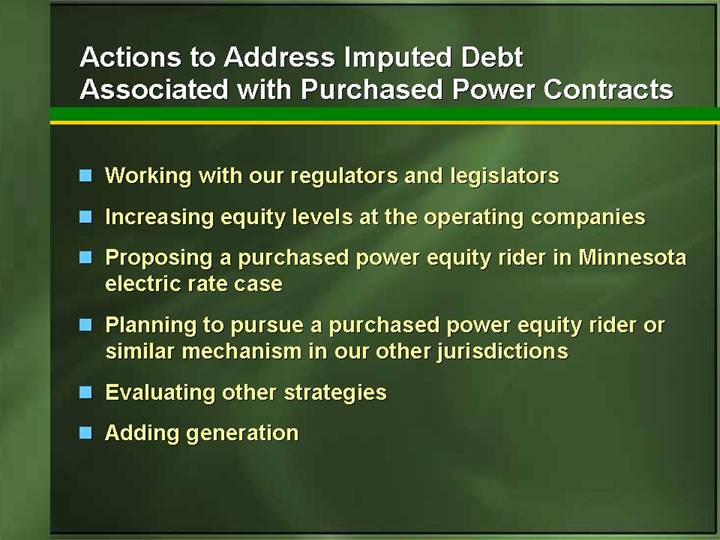
Actions to Address Imputed Debt Associated with Purchased Power Contracts
• Working with our regulators and legislators
• Increasing equity levels at the operating companies
• Proposing a purchased power equity rider in Minnesota electric rate case
• Planning to pursue a purchased power equity rider or similar mechanism in our other jurisdictions
• Evaluating other strategies
• Adding generation
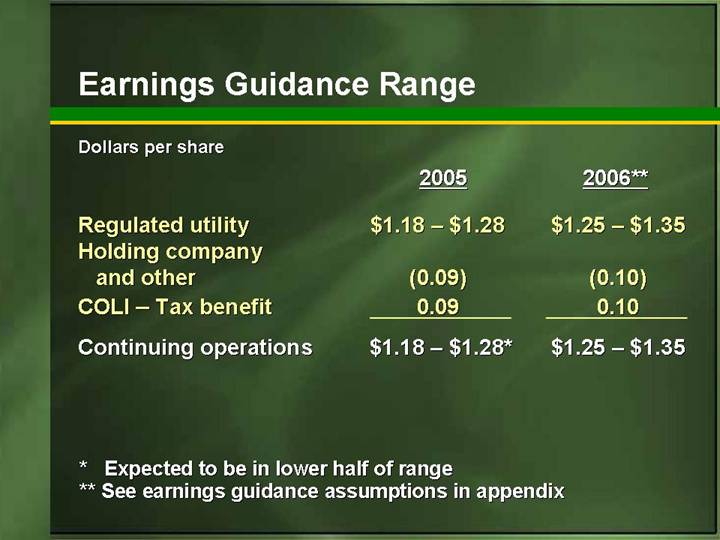
Earnings Guidance Range
Dollars per share
| | 2005 | | 2006** | |
| | | | | |
Regulated utility | | $1.18 – $1.28 | | $1.25 – $1.35 | |
Holding company and other | | (0.09 | ) | (0.10 | ) |
COLI – Tax benefit | | 0.09 | | 0.10 | |
| | | | | |
Continuing operations | | $1.18 – $1.28 | * | $1.25 – $1.35 | |
* Expected to be in lower half of range
** See earnings guidance assumptions in appendix
Financial Performance Objectives
• EPS growth rate 2005 – 2009
• Target 5 – 7% per year*
• Annual dividend increases
• Consistent with dividend growth objective of 2 – 4% per year
• Credit rating
• Senior unsecured debt BBB+ to A range
* Excluding any impact from COLI