UNITED STATES
SECURITIES AND EXCHANGE COMMISSION
Washington, D.C. 20549
FORM N-CSR
CERTIFIED SHAREHOLDER REPORT OF REGISTERED
MANAGEMENT INVESTMENT COMPANIES
Investment Company Act file number | 811-04367 |
|
Columbia Funds Series Trust I |
(Exact name of registrant as specified in charter) |
|
225 Franklin Street, Boston, Massachusetts | | 02110 |
(Address of principal executive offices) | | (Zip code) |
|
Scott R. Plummer 5228 Ameriprise Financial Center Minneapolis, MN 55474 |
(Name and address of agent for service) |
|
Registrant’s telephone number, including area code: | 1-612-671-1947 | |
|
Date of fiscal year end: | October 31 | |
|
Date of reporting period: | October 31, 2011 | |
| | | | | | | | |
Form N-CSR is to be used by management investment companies to file reports with the Commission not later than 10 days after the transmission to stockholders of any report that is required to be transmitted to stockholders under Rule 30e-1 under the Investment Company Act of 1940 (17 CFR 270.30e-1). The Commission may use the information provided on Form N-CSR in its regulatory, disclosure review, inspection, and policymaking roles.
A registrant is required to disclose the information specified by Form N-CSR, and the Commission will make this information public. A registrant is not required to respond to the collection of information contained in Form N-CSR unless the Form displays a currently valid Office of Management and Budget (“OMB”) control number. Please direct comments concerning the accuracy of the information collection burden estimate and any suggestions for reducing the burden to Secretary, Securities and Exchange Commission, 450 Fifth Street, NW, Washington, DC 20549-0609. The OMB has reviewed this collection of information under the clearance requirements of 44 U.S.C. § 3507.
Item 1. Reports to Stockholders.

Columbia California Tax-Exempt Fund
Annual Report for the Period Ended October 31, 2011
Not FDIC insured • No bank guarantee • May lose value
Table of Contents
| Fund Profile | | | 1 | | |
|
| Performance Information | | | 2 | | |
|
| Understanding Your Expenses | | | 3 | | |
|
| Portfolio Manager's Report | | | 4 | | |
|
| Portfolio of Investments | | | 6 | | |
|
Statement of Assets and
Liabilities | | | 16 | | |
|
| Statement of Operations | | | 18 | | |
|
Statement of Changes in
Net Assets | | | 19 | | |
|
| Financial Highlights | | | 21 | | |
|
| Notes to Financial Statements | | | 25 | | |
|
Report of Independent Registered
Public Accounting Firm | | | 35 | | |
|
| Federal Income Tax Information | | | 36 | | |
|
| Fund Governance | | | 37 | | |
|
Important Information About
This Report | | | 45 | | |
|
The views expressed in this report reflect the current views of the respective parties. These views are not guarantees of future performance and involve certain risks, uncertainties and assumptions that are difficult to predict, so actual outcomes and results may differ significantly from the views expressed. These views are subject to change at any time based upon economic, market or other conditions and the respective parties disclaim any responsibility to update such views. These views may not be relied on as investment advice and, because investment decisions for a Columbia Fund are based on numerous factors, may not be relied on as an indication of trading intent on behalf of any particular Columbia Fund. References to specific securities should not be construed as a recommendation or investment advice.
President's Message

Dear Shareholders,
Economic momentum slowed in the third quarter of 2011, raising the odds of recession and making the U.S. economy more susceptible to financial shocks. The unemployment rate remained stalled as growing uncertainty continued to weigh on prospective employers. Monthly indicators for the manufacturing and service sectors also showed signs of slowing. Equity and high-yield bond markets fell sharply as investor confidence was shaken by Europe's lingering debt crisis, a heated debate in Washington over fiscal deficits (which eventually led to a downgrade of U.S. government debt) and tepid economic growth. The U.S. stock market experienced its worst quarter in two years during the third quarter of 2011, with volatility and selling pressure reminiscent of the market selloff in 2008, as macro-economic concerns continued to mount.
During its September meeting, the Federal Reserve Board announced that it was prepared to purchase longer term securities and sell shorter term securities in an effort to keep long-term interest rates down. Their hope is that lower long-term borrowing rates will stimulate business investment and hiring. However, the question remains as to whether monetary policy alone will be enough to resuscitate growth in the current environment.
Despite this challenging and volatile economic backdrop, I believe Columbia Management remains strong and steadfast. Columbia Management is the eighth largest manager of long-term mutual fund assets with $325 billion under management as of September 30, 2011. The past year has been one of considerable change for the organization as we worked diligently to align products, services and resources in the integration of Columbia Management with RiverSource Investments. The incredible line-up of talent, resources and capabilities that has resulted is highlighted by the success of our products. As of September 30, 2011, Columbia Management offers 54 funds rated 4 and 5 stars by Morningstar. Additionally, The Wall Street Journal has named two Columbia funds "Category Kings" in its "Investing in Funds: A Quarterly Analysis" issue dated October 5, 2011 in recognition for their one-year performance as of September 30, 2011.
For more information about these and other funds offered by Columbia Management, including detailed, up-to-date fund performance and portfolio information, please visit us online at columbiamanagement.com. Other information and resources available on our website include:
g timely economic analysis and market commentary
g quarterly fund commentaries
g Columbia Management Investor, a quarterly newsletter for shareholders
Thank you for your continued support of the Columbia Funds. We look forward to serving your investment needs for many years to come.
Best Regards,

J. Kevin Connaughton
President, Columbia Funds
All ratings are Class Z as of 9/30/2011. Out of 118 Z-share Columbia funds rated by Morningstar, 8 funds received a 5-star Overall Rating and 46 funds received a 4-star Overall Rating. The Overall Morningstar Rating for a retail mutual fund is derived from a weighted average of the performance figures associated with its 3-, 5- and 10-year (if applicable) Morningstar Rating metrics. For share classes that do not have a 3-, 5-, or 10-year actual performance history, the fund's independent Morningstar Rating metric is then compared against the retail mutual fund universe breakpoints to determine its hypothetical rating.
For each fund with at least a three-year history, Morningstar calculates a Morningstar RatingTM based on a Morningstar Risk-Adjusted Return measure that accounts for variation in a fund's monthly performance (including the effects of sales charges, loads, and redemption fees), placing more emphasis on downward variations and rewarding consistent performance. The top 10% of funds in each category receive 5 stars, the next 22.5% receive 4 stars, the next 35% receive 3 stars, the next 22.5% receive 2 stars and the bottom 10% receive 1 star. (Each share class is counted as a fraction of one fund within this scale and rated separately, which may cause slight variations in the distribution percentages.)
The Morningstar RatingTM is for Class Z shares only; other classes may have different performance characteristics and may have different ratings. © 2011 Morningstar, Inc. All Rights Reserved. The Morningstar information contained herein: (1) is proprietary to Morningstar and/or its content providers; (2) may not be copied or distributed; and (3) is not warranted to be accurate, complete or timely. Neither Morningstar nor its content providers are responsible for any damages or losses arising from any use of this information.
The Wall Street Journal "Category Kings" methodology: Top-performing funds in each category ranked by one-year total returns (changes in net asset values and reinvested distributions) for the period ended September 30, 2011.
Investors should consider the investment objectives, risks, charges and expenses of a mutual fund carefully before investing. For a free prospectus, which contains this and other important information about the funds, visit www.columbiamanagement.com. The prospectus should be read carefully before investing.
Columbia Funds are distributed by Columbia Management Investment Distributors, Inc., member FINRA, and managed by Columbia Management Investment Advisers, LLC.
© 2011 Columbia Management Investment Advisers, LLC. All rights reserved.
Fund Profile – Columbia California Tax-Exempt Fund
Summary
g For the 12-month period that ended October 31, 2011, the fund's Class A shares returned 2.84% without sales charge.
g The fund lagged its benchmarks, the Barclays Capital California Municipal Bond Index1 and the broader Barclays Capital Municipal Bond Index2 and beat its peer group average the Lipper California Municipal Debt Funds Classification.3
g Security selection hurt performance relative to the Barclays Capital California benchmark in several sectors, while the fund's longer maturity and credit quality were helpful to returns.
Portfolio Management
Catherine Stienstra has managed the fund since October 2010 and has been associated with Columbia Management Investment Advisers, LLC or its predecessors since 2007.
1The Barclays Capital California Municipal Bond Index is a subset of the Barclays Capital Municipal Bond Index consisting solely of bonds issued by obligors located in the state of California.
2The Barclays Capital Municipal Bond Index is considered representative of the broad market for investment-grade, tax-exempt bonds with maturity of at least one year.
3Lipper Inc., a widely respected data provider in the industry, calculates an average total return (assuming reinvestment of distributions) for mutual funds with investment objectives similar to those of the fund. Lipper makes no adjustment for the effect of sales loads.
Indices are not available for investment, are not professionally managed and do not reflect sales charges, fees, brokerage commissions, taxes or other expenses of investing. Securities in the fund may not match those in an index.
Performance data quoted represents past performance and current performance may be lower or higher. Past performance is no guarantee of future results. The investment return and principal value will fluctuate so that shares, when redeemed, may be worth more or less than the original cost. Please visit www.columbiamanagement.com for daily and most recent month-end performance updates.
Summary
1-year return as of 10/31/11
| | | | +2.84% | |
|
|  | | | Class A shares
(without sales charge) | |
|
| | | | +3.78% | |
|
|  | | | Barclays Capital
Municipal Bond Index | |
|
| | | | +3.87% | |
|
|  | | | Barclays Capital
California Municipal
Bond Index | |
|
1
Performance Information – Columbia California Tax-Exempt Fund
Performance data quoted represents past performance and current performance may be lower or higher. Past performance is no guarantee of future results. The investment return and principal value will fluctuate so that shares, when redeemed, may be worth more or less than the original cost. Please visit www.columbiamanagement.com for daily and most recent month-end performance updates.
Performance of a $10,000 investment 11/01/01 – 10/31/11

The chart above shows the change in value of a hypothetical $10,000 investment in Class A shares of Columbia California Tax-Exempt Fund during the stated time period, and does not reflect the deduction of taxes that a shareholder may pay on fund distributions or on the redemption of fund shares.
Performance of a $10,000 investment 11/01/01 – 10/31/11 ($)
| Sales charge | | without | | with | |
| Class A | | | 15,328 | | | | 14,604 | | |
| Class B | | | 14,225 | | | | 14,225 | | |
| Class C | | | 14,652 | | | | 14,652 | | |
| Class Z | | | 15,547 | | | | n/a | | |
Average annual total return as of 10/31/11 (%)
| Share class | | A | | B | | C | | Z | |
| Inception | | 06/16/86 | | 08/04/92 | | 08/01/97 | | 09/19/05 | |
| Sales charge | | without | | with | | without | | with | | without | | with | | without | |
| 1-year | | | 2.84 | | | | –2.04 | | | | 2.06 | | | | –2.77 | | | | 2.37 | | | | 1.40 | | | | 3.05 | | |
| 5-year | | | 3.99 | | | | 2.98 | | | | 3.22 | | | | 2.88 | | | | 3.52 | | | | 3.52 | | | | 4.24 | | |
| 10-year | | | 4.36 | | | | 3.86 | | | | 3.59 | | | | 3.59 | | | | 3.89 | | | | 3.89 | | | | 4.51 | | |
The "with sales charge" returns include the maximum initial sales charge of 4.75% for Class A shares and the applicable contingent deferred sales charge of 5.00% in the first year, declining to 1.00% in the sixth year, and eliminated thereafter for Class B shares and 1.00% for Class C shares for the first year only. The "without sales charge" returns do not include the effect of sales charges. If they had, returns would be lower.
Performance results reflect any fee waivers or reimbursements of fund expenses by the Investment Manager and/or any of its affiliates. Absent these fee waivers or expense reimbursement arrangements, performance results would have been lower.
All results shown assume reinvestment of distributions. Class Z shares are sold at net asset value with no distribution and service (Rule 12b-1) fees. Class Z shares have limited eligibility and the investment minimum requirements may vary. Please see the fund's prospectuses for details. Performance for different share classes will vary based on differences in sales charges and fees associated with each class.
The tables do not reflect the deduction of taxes that a shareholder may pay on fund distributions or on the redemption of fund shares.
The returns shown for the fund's Class Z shares include the returns of the fund's Class A shares for periods prior to September 19, 2005, the date on which the fund's Class Z shares were first offered. The returns shown have been adjusted to reflect the fact that Class Z shares are sold without sales charges. The returns shown have not been adjusted to reflect any differences in expenses such as distribution and service (Rule 12b-1) fees between Class Z and Class A shares of the fund.
2
Understanding Your Expenses – Columbia California Tax-Exempt Fund
As a shareholder, you incur two types of costs. There are transaction costs, which generally include sales charges on purchases and may include redemption fees. There are also ongoing costs, which generally include management fees, distribution and service (Rule 12b-1) fees, and other fund expenses. The following information is intended to help you understand your ongoing costs (in dollars) of investing in the Fund and to compare these costs with the ongoing costs of investing in other mutual funds.
Analyzing your fund's expenses
To illustrate these ongoing costs, we provided examples and calculated the expenses paid by investors in each share class of the Fund during the period. The information in the table is based on an initial investment of $1,000 at the beginning of the period indicated and held for the entire period. Expense information is calculated two ways and each method provides you with different information. The amount listed in the "Actual" column is calculated using the Fund's actual operating expenses and total return for the period. You may use the Actual information, together with the amount invested, to estimate the expenses that you paid over the period. Simply divide your account value by $1,000 (for example, an $8,600 account value divided by $1,000 = 8.6), then multiply the results by the expenses paid during the period under the Actual column. The amount listed in the "Hypothetical" column assumes a 5% annual rate of return before expenses (which is not the Fund's actual return) and then applies the Fund's actual expense ratio for the period to the hypothetical return. You should not use the hypothetical account values and expenses to estimate either your actual account balance at the end of the period or the expenses you paid during the period. See the "Compare with other funds" information with details on using the hypothetical data.
Compare with other funds
Since all mutual funds are required to include the same hypothetical calculations about expenses in shareholder reports, you can use this information to compare the ongoing cost of investing in the Fund with other funds. To do so, compare the hypothetical example with the 5% hypothetical examples that appear in the shareholder reports of other funds. As you compare hypothetical examples of other funds, it is important to note that hypothetical examples are meant to highlight the ongoing costs of investing in a fund only and do not reflect any transaction costs, such as sales charges, or redemption or exchange fees. Therefore, the hypothetical calculations are useful in comparing ongoing costs only, and will not help you determine the relative total costs of owning different funds. If transaction costs were included in these calculations, your costs would have been higher.
05/01/11 – 10/31/11
| | | Account value at the
beginning of the period ($) | | Account value at the
end of the period ($) | | Expenses paid
during the period ($) | | Fund's annualized
expense ratio (%) | |
| | | Actual | | Hypothetical | | Actual | | Hypothetical | | Actual | | Hypothetical | | Actual | |
| Class A | | | 1,000.00 | | | | 1,000.00 | | | | 1,080.10 | | | | 1,021.32 | | | | 4.04 | | | | 3.92 | | | | 0.77 | | |
| Class B | | | 1,000.00 | | | | 1,000.00 | | | | 1,075.90 | | | | 1,017.44 | | | | 8.06 | | | | 7.83 | | | | 1.54 | | |
| Class C | | | 1,000.00 | | | | 1,000.00 | | | | 1,077.50 | | | | 1,019.00 | | | | 6.44 | | | | 6.26 | | | | 1.23 | | |
| Class Z | | | 1,000.00 | | | | 1,000.00 | | | | 1,081.00 | | | | 1,022.48 | | | | 2.83 | | | | 2.75 | | | | 0.54 | | |
Expenses paid during the period are equal to the annualized expense ratio for each class as indicated above, multiplied by the average account value over the period and then multiplied by the number of days in the Fund's most recent fiscal half year and divided by 365.
Expenses do not include fees and expenses incurred indirectly by the Fund from the underlying funds in which the Fund may invest (also referred to as "acquired funds"), including affiliated and non-affiliated pooled investments vehicles (including mutual funds and exchange traded funds).
Had Columbia Management Investment Advisers, LLC and/or certain of its affiliates not waived/reimbursed certain fees and expenses, account value at the end of the period would have been reduced.
3
Portfolio Manager's Report – Columbia California Tax-Exempt Fund
Performance data quoted represents past performance and current performance may be lower or higher. Past performance is no guarantee of future results. The investment return and principal value will fluctuate so that shares, when redeemed, may be worth more or less than the original cost. Please visit www.columbiamanagement.com for daily and most recent month-end performance updates.
Net asset value per share
as of 10/31/11 ($)
| Class A | | | 7.38 | | |
| Class B | | | 7.38 | | |
| Class C | | | 7.38 | | |
| Class Z | | | 7.38 | | |
Distributions declared per share
11/01/10 – 10/31/11 ($)
| Class A | | | 0.45 | | |
| Class B | | | 0.39 | | |
| Class C | | | 0.41 | | |
| Class Z | | | 0.46 | | |
A portion of the fund's income may be subject to the alternative minimum tax. The fund may at times purchase tax-exempt securities at a discount. Some, or all, of this discount may be included in the fund's ordinary income, and is taxable when distributed. Distributions include $0.14 per share of taxable realized gains.
30-day SEC yields
as of 10/31/11 (%)
| Class A | | | 3.45 | | |
| Class B | | | 2.67 | | |
| Class C | | | 3.20 | | |
| Class Z | | | 4.09 | | |
The 30-day SEC yields reflect the fund's earning power, net of expenses, expressed as an annualized percentage of the public offering price per share at the end of the period. Had the investment advisor and/or any of its affiliates not waived fees or reimbursed a portion of expenses, the 30-day SEC yields would have been lower.
For the 12-month period that ended October 31, 2011, the fund's Class A shares returned 2.84% without sales charge. The fund trailed the 3.87% gain of the Barclays Capital California Municipal Bond Index as well as the 3.78% advance of the broader Barclays Capital Municipal Bond Index. The fund however, beat the 2.69% average return of its peer group, the Lipper California Municipal Debt Funds Classification.
After a weak start, municipal bond market conditions improved
The municipal bond market got off to a difficult start in the fourth quarter of 2010 after a well-publicized but so-far erroneous prediction that the municipal bond market was ripe for massive defaults led many investors to sell municipal securities. At the same time that demand was falling, supply was increasing leading up to the 2010 year end. Yields rose, bond prices fell and the yield curve steepened into March 2011. However, market conditions began to improve later in the spring, as credit fears eased and outflows slowed. State and local tax revenues have grown for six consecutive quarters, and new issuance slowed as many states implemented sharp budget cuts and delayed capital expenditures. As such, defaults remained scarce. The year-to-date total is just over $1 billion, mostly in non-rated sectors. Against this backdrop, municipal bond yields began to look attractive relative to Treasury yields, and investors eventually began buying municipal securities again. Over the last seven months of the period, municipal bond yields fell across all maturities, but especially on longer-term issues. Credit spreads—the difference between the yields on lower and higher quality bonds—also narrowed. As both yield and credit spreads narrowed, municipal bond returns got a boost for the year.
Positive contribution from longer-maturity and credit quality positioning
The fund benefited from having a longer duration than its Barclays Capital California benchmark. Investments in longer-maturity bonds experienced the biggest price gains as yields fell and offered a yield advantage over shorter-maturity issues. (Duration is a measure of interest-rate sensitivity.) The fund also picked up ground with an underweight in higher quality (AAA and AA rated4) bonds and an overweight in hospital bonds, which were strong performers. Security selection among state and local general obligation (GO) sector with varied coupon structures and within the hospital sector detracted from performance.
Changes to positioning
During the selloff that began in late 2010, we added longer-maturity bonds because we believed they were being unfairly pressured by an unfavorable supply/demand situation in the municipal market rather than by fundamental problems. We also boosted the fund's stake in lower quality securities, adding to bonds with A and BBB ratings, as well as to state GOs and bonds backed by revenues from special property taxes. To fund these purchases, we reduced exposure to higher quality (primarily AAA and AA) bonds and to local GOs, which we thought would remain under pressure as property
4Ratings are relative and subjective and are not absolute standards of quality. The credit ratings typically range from AAA (highest) to D (lowest), and are subject to change. The credit quality of the fund's investments does not remove market risk.
4
Portfolio Manager's Report (continued) – Columbia California Tax-Exempt Fund
values and related tax revenues declined. In addition, we eliminated a small position in tobacco bonds, which are bonds issued by the state and backed by revenues from a financial settlement it has with tobacco companies, and trimmed pre-refunded bonds, which are high quality issues. Pre-refunding occurs when an issuer sells a new bond at a lower rate to pay off the old bonds. The proceeds from the new issue are invested into an escrow account (typically short-term government securities) and the interest earned is used to pay the interest on the bonds outstanding. On the call date or maturity date, the money in the escrow account is used to pay off the bonds outstanding.
Next steps
Going forward, we plan to monitor the federal government's deficit reduction proposals to determine their potential impact on the tax-exempt status of municipal bonds. At the state level, we expect to keep a close eye on California's recovery, which has been hurt by cutbacks in defense and in state and local governments, above-average unemployment and a weak housing market. Longer term, we expect the state's strengths, particularly in technology and higher-education, to help it weather these challenging economic times and maintain its A1 credit rating from Moody's. Given expectations that short-term interest rates and inflation will remain low into 2013, we plan to continue to favor longer-maturity and lower quality issues. We will continue to emphasize individual security selection, relying heavily upon our proprietary credit research team. We will carefully monitor a number of potential variables and will not hesitate to adjust the fund's duration, credit quality and/or sector positioning accordingly.
Portfolio characteristics and holdings are subject to change and may not be representative of current characteristics and holdings. The outlook for the fund may differ from that presented for other Columbia Funds.
Tax-exempt investing offers current tax-exempt income, but it also involves certain risks. The value of the fund will be affected by the interest rate changes and the creditworthiness of issues held in the fund. When interest rates go up, bond prices generally drop and vice versa. Interest income from certain tax-exempt bonds may be subject to certain state and local taxes and, if applicable, the alternative minimum tax. Any capital gains distributed are taxable to the investor.
The fund is non-diversified, which generally means that it may invest a greater percentage of its total assets in the securities of fewer issuers than a "diversified" fund. This increases the risk that a change in the value of any one investment held by the Fund could affect the overall value of the Fund more than it would affect that of a diversified fund holding a greater number of investments. Accordingly, the fund's value will likely be more volatile than the value of more diversified funds.
Single-state municipal bond funds pose additional risks due to limited geographical diversification.
Taxable-equivalent SEC yields
as of 10/31/11 (%)
| Class A | | | 5.31 | | |
| Class B | | | 4.11 | | |
| Class C | | | 4.92 | | |
| Class Z | | | 6.29 | | |
Taxable-equivalent SEC yields are calculated assuming a federal tax rate of 35.0%. These tax rates do not reflect the phase out of exemptions or the reduction of the otherwise allowable deductions that occur when adjusted gross income exceeds certain levels. Your taxable-equivalent yield may be different depending on your tax bracket.
Quality breakdown
as of 10/31/11 (%)
| AAA | | | 4.6 | | |
| AA | | | 21.9 | | |
| A | | | 53.8 | | |
| BBB | | | 12.4 | | |
| BB | | | 1.6 | | |
| Non-Rated | | | 5.7 | | |
Maturity breakdown
as of 10/31/11 (%)
| 0-1 year | | | 0.1 | | |
| 1-3 years | | | 3.0 | | |
| 3-5 years | | | 1.5 | | |
| 5-7 years | | | 3.8 | | |
| 7-10 years | | | 6.3 | | |
| 10-15 years | | | 10.2 | | |
| 15-20 years | | | 23.0 | | |
| 20-25 years | | | 22.8 | | |
| 25 years and over | | | 27.7 | | |
| Cash Equivalents | | | 1.6 | | |
Ratings shown in the quality breakdown are assigned to individual bonds by taking the lower of the ratings available from one of the following nationally recognized rating agencies: Standard & Poor's or Moody's Investor Services. If a security is rated by only one of the two agencies, that rating is used. If a security is not rated by either of the two agencies, it is designated as Non-Rated. Ratings are relative and subjective and are not absolute standards of quality. The fund's credit quality does not remove market risk.
The fund is actively managed and the composition of its portfolio will change over time. Maturity breakdown, top sectors and quality breakdown are calculated as a percentage of net assets.
5
Portfolio of Investments – Columbia California Tax-Exempt Fund
October 31, 2011
(Percentages represent value of investments compared to net assets)
Issue
Description | | Coupon
Rate | | Principal
Amount | | Value | |
| Municipal Bonds 96.8% | |
| Advanced Refunded 2.9% | |
California Health Facilities Financing Authority
Prerefunded 10/01/18 Revenue Bonds
Providence Health
Series 2008 | |
| 10/01/38 | | | 6.500 | % | | $ | 30,000 | | | $ | 38,972 | | |
City of Pomona
Refunding Revenue Bonds
Series 1990B Escrowed to Maturity (GNMA/FHLMC) | |
| 08/01/23 | | | 7.500 | % | | | 950,000 | | | | 1,263,348 | | |
City of Redding
Revenue Bonds
Series 1992 Escrowed to Maturity (NPFGC)(a) | |
| 07/01/22 | | | 11.990 | % | | | 455,000 | | | | 658,631 | | |
County of Riverside
Revenue Bonds
Series 1989A Escrowed to Maturity (GNMA) AMT(b) | |
| 05/01/21 | | | 7.800 | % | | | 2,500,000 | | | | 3,467,750 | | |
San Joaquin Hills Transportation Corridor Agency
Revenue Bonds
Senior Lien
Series 1993 Escrowed to Maturity(c) | |
| 01/01/20 | | | 0.000 | % | | | 12,000,000 | | | | 9,741,120 | | |
| Total | | | 15,169,821 | | |
| Airport 3.7% | |
City of Los Angeles Department of Airports
Revenue Bonds
Series 2009A | |
| 05/15/34 | | | 5.000 | % | | | 1,000,000 | | | | 1,051,880 | | |
Subordinated Revenue Bonds
Los Angeles International
Series 2010B | |
| 05/15/35 | | | 5.000 | % | | | 3,665,000 | | | | 3,785,798 | | |
County of Orange
Revenue Bonds
Series 2009A | |
| 07/01/39 | | | 5.250 | % | | | 2,500,000 | | | | 2,638,525 | | |
County of Sacramento
Revenue Bonds
Senior Series 2009B | |
| 07/01/39 | | | 5.750 | % | | | 3,000,000 | | | | 3,176,520 | | |
County of Sacramento(b)
Revenue Bonds
Senior Series 2008B (AGM) AMT | |
| 07/01/39 | | | 5.250 | % | | | 1,000,000 | | | | 1,008,310 | | |
San Diego County Regional Airport Authority
Refunding Revenue Bonds
Series 2005 (AMBAC) AMT(b) | |
| 07/01/20 | | | 5.250 | % | | | 750,000 | | | | 830,205 | | |
San Francisco City & County Airports Commission(b)
Refunding Revenue Bonds
2nd Series 2008-34E (AGM) AMT | |
| 05/01/25 | | | 5.750 | % | | | 1,500,000 | | | | 1,621,320 | | |
| 2nd Series 2011F AMT | |
| 05/01/29 | | | 5.000 | % | | | 5,210,000 | | | | 5,253,139 | | |
| Total | | | 19,365,697 | | |
Issue
Description | | Coupon
Rate | | Principal
Amount | | Value | |
| Municipal Bonds (continued) | |
| College 6.3% | |
California Educational Facilities Authority
Revenue Bonds
California College of the Arts
Series 2005 | |
| 06/01/26 | | | 5.000 | % | | $ | 1,000,000 | | | $ | 912,740 | | |
| 06/01/35 | | | 5.000 | % | | | 1,500,000 | | | | 1,265,310 | | |
California Lutheran University
Series 2008 | |
| 10/01/21 | | | 5.250 | % | | | 665,000 | | | | 696,754 | | |
| 10/01/38 | | | 5.750 | % | | | 3,000,000 | | | | 3,030,480 | | |
Chapman University
Series 2011 | |
| 04/01/31 | | | 5.000 | % | | | 4,375,000 | | | | 4,453,750 | | |
Loyola Marymount University
Series 2010A | |
| 10/01/40 | | | 5.125 | % | | | 1,250,000 | | | | 1,279,750 | | |
Scripps College
Series 2001 | |
| 08/01/31 | | | 5.000 | % | | | 1,500,000 | | | | 1,500,270 | | |
Woodbury University
Series 2006 | |
| 01/01/25 | | | 5.000 | % | | | 1,830,000 | | | | 1,649,434 | | |
California Municipal Finance Authority
Revenue Bonds
Biola University
Series 2008 | |
| 10/01/28 | | | 5.800 | % | | | 2,000,000 | | | | 2,076,800 | | |
Loma Linda University
Series 2007 | |
| 04/01/32 | | | 4.750 | % | | | 2,300,000 | | | | 2,224,008 | | |
California State University
Revenue Bonds
Systemwide
Series 2007A (AGM) | |
| 11/01/27 | | | 5.000 | % | | | 1,250,000 | | | | 1,341,463 | | |
| Series 2009A | |
| 11/01/40 | | | 6.000 | % | | | 2,000,000 | | | | 2,225,480 | | |
| Series 2010A | |
| 11/01/30 | | | 5.000 | % | | | 2,995,000 | | | | 3,182,397 | | |
California Statewide Communities Development Authority(d)(e)
Revenue Bonds
San Francisco Art Institute
Series 2002 | |
| 04/01/32 | | | 7.375 | % | | | 1,750,000 | | | | 1,590,277 | | |
California Statewide Communities Development Authority(e)
Revenue Bonds
Thomas Jefferson School of Law
Series 2008A | |
| 10/01/38 | | | 7.250 | % | | | 3,900,000 | | | | 3,947,073 | | |
University of California
Revenue Bonds
Series 2008D | |
| 05/15/27 | | | 5.000 | % | | | 1,500,000 | | | | 1,563,990 | | |
| Total | | | 32,939,976 | | |
The Accompanying Notes to Financial Statements are an integral part of this statement.
6
Columbia California Tax-Exempt Fund
October 31, 2011
(Percentages represent value of investments compared to net assets)
Issue
Description | | Coupon
Rate | | Principal
Amount | | Value | |
| Municipal Bonds (continued) | |
| Electric 6.8% | |
Anaheim Public Financing Authority
Revenue Bonds
Anaheim Electric Systems Distribution
Series 2009 | |
| 10/01/25 | | | 5.000 | % | | $ | 1,000,000 | | | $ | 1,083,410 | | |
California Infrastructure & Economic Development Bank
Revenue Bonds
California Independent System Operator
Series 2009A | |
| 02/01/39 | | | 6.250 | % | | | 2,000,000 | | | | 2,148,340 | | |
California State Department of Water Resources
Revenue Bonds
Series 2010M | |
| 05/01/15 | | | 5.000 | % | | | 4,500,000 | | | | 5,097,150 | | |
City of Chula Vista
Revenue Bonds
San Diego Gas & Electric Co.
Series 2004D | |
| 01/01/34 | | | 5.875 | % | | | 1,000,000 | | | | 1,103,680 | | |
City of Chula Vista(b)
Revenue Bonds
San Diego Gas & Electric Co.
Series 2005D AMT | |
| 12/01/27 | | | 5.000 | % | | | 3,500,000 | | | | 3,605,245 | | |
City of Redding
Certificate of Participation
Series 2008A (AGM) | |
| 06/01/27 | | | 5.000 | % | | | 865,000 | | | | 906,944 | | |
City of Riverside Electric
Revenue Bonds
Series 2008D (AGM) | |
| 10/01/28 | | | 5.000 | % | | | 1,325,000 | | | | 1,396,139 | | |
City of Vernon
Revenue Bonds
Series 2009A | |
| 08/01/21 | | | 5.125 | % | | | 2,000,000 | | | | 1,982,440 | | |
Imperial Irrigation District
Refunding Revenue Bonds
System
Series 2011A | |
| 11/01/31 | | | 6.250 | % | | | 1,000,000 | | | | 1,145,870 | | |
Los Angeles Department of Water & Power
Revenue Bonds
Power System
Subordinated Series 2008A-1 | |
| 07/01/38 | | | 5.250 | % | | | 1,750,000 | | | | 1,869,420 | | |
Modesto Irrigation District
Certificate of Participation
Series 2004B | |
| 07/01/35 | | | 5.500 | % | | | 2,000,000 | | | | 2,066,260 | | |
Refunding Revenue Bonds
Series 2011C
10/05/2011 | |
| 07/01/31 | | | 5.000 | % | | | 6,060,000 | | | | 6,204,289 | | |
Puerto Rico Electric Power Authority(f)
Revenue Bonds
Series 2008WW | |
| 07/01/28 | | | 5.000 | % | | | 1,500,000 | | | | 1,512,585 | | |
Issue
Description | | Coupon
Rate | | Principal
Amount | | Value | |
| Municipal Bonds (continued) | |
| Electric (cont.) | |
Sacramento Municipal Utility District
Revenue Bonds
Series 1997K (AMBAC) | |
| 07/01/24 | | | 5.250 | % | | $ | 2,220,000 | | | $ | 2,519,966 | | |
Southern California Public Power Authority
Revenue Bonds
Milford Wind Corridor Project
Series 2010-1 | |
| 07/01/30 | | | 5.000 | % | | | 500,000 | | | | 530,225 | | |
Walnut Energy Center Authority
Revenue Bonds
Series 2004A (AMBAC) | |
| 01/01/29 | | | 5.000 | % | | | 2,500,000 | | | | 2,522,800 | | |
| Total | | | 35,694,763 | | |
| Health Care - Hospital 14.4% | |
California Health Facilities Financing Authority
Refunding Revenue Bonds
Cedars Sinai Medical Center
Series 2005 | |
| 11/15/34 | | | 5.000 | % | | | 4,025,000 | | | | 3,970,703 | | |
Revenue Bonds
Adventist Health System West
Series 2009A | |
| 09/01/39 | | | 5.750 | % | | | 5,000,000 | | | | 5,200,800 | | |
Catholic Healthcare West
Series 2009A | |
| 07/01/39 | | | 6.000 | % | | | 1,000,000 | | | | 1,070,180 | | |
| Series 2009E | |
| 07/01/25 | | | 5.625 | % | | | 1,125,000 | | | | 1,202,456 | | |
Cedars Sinai Medical Center
Series 2009 | |
| 08/15/39 | | | 5.000 | % | | | 8,150,000 | | | | 8,005,256 | | |
Kaiser Permanente
Series 2006A | |
| 04/01/39 | | | 5.250 | % | | | 3,350,000 | | | | 3,355,058 | | |
Providence Health & Services
Series 2008C | |
| 10/01/28 | | | 6.250 | % | | | 500,000 | | | | 566,080 | | |
Scripps Health
Series 2010A | |
| 11/15/36 | | | 5.000 | % | | | 750,000 | | | | 753,435 | | |
St. Joseph Health System
Series 2009A | |
| 07/01/29 | | | 5.500 | % | | | 1,500,000 | | | | 1,564,620 | | |
Sutter Health
Series 2008A | |
| 08/15/30 | | | 5.000 | % | | | 2,500,000 | | | | 2,509,800 | | |
| Series 2011B | |
| 08/15/31 | | | 5.875 | % | | | 1,815,000 | | | | 1,960,164 | | |
Unrefunded Revenue Bonds
Providence Health
Series 2008 | |
| 10/01/38 | | | 6.500 | % | | | 1,470,000 | | | | 1,658,836 | | |
California Health Facilities Financing Authority(g)
Revenue Bonds
Catholic Healthcare
Series 2011A | |
| 03/01/41 | | | 5.250 | % | | | 3,000,000 | | | | 2,968,770 | | |
The Accompanying Notes to Financial Statements are an integral part of this statement.
7
Columbia California Tax-Exempt Fund
October 31, 2011
(Percentages represent value of investments compared to net assets)
Issue
Description | | Coupon
Rate | | Principal
Amount | | Value | |
| Municipal Bonds (continued) | |
| Health Care - Hospital (cont.) | |
Children's Hospital
Series 2011A | |
| 11/01/41 | | | 5.250 | % | | $ | 5,000,000 | | | $ | 4,911,050 | | |
California Municipal Finance Authority
Certificate of Participation
Community Hospital of Central California
Series 2007 | |
| 02/01/37 | | | 5.250 | % | | | 2,500,000 | | | | 2,164,450 | | |
Revenue Bonds
Community Hospitals of Central California
Series 2009 | |
| 02/01/39 | | | 5.500 | % | | | 4,000,000 | | | | 3,565,880 | | |
California Statewide Communities Development Authority
Revenue Bonds
Catholic Healthcare West
Series 2008B | |
| 07/01/30 | | | 5.500 | % | | | 1,965,000 | | | | 2,032,400 | | |
John Muir Health
Series 2006A | |
| 08/15/32 | | | 5.000 | % | | | 3,000,000 | | | | 2,972,970 | | |
| Series 2009 | |
| 07/01/39 | | | 5.125 | % | | | 500,000 | | | | 490,895 | | |
Kaiser Permanente
Series 2002A | |
| 11/01/32 | | | 5.500 | % | | | 1,000,000 | | | | 1,004,920 | | |
| Series 2006B | |
| 03/01/45 | | | 5.250 | % | | | 1,000,000 | | | | 1,001,840 | | |
Sutter Health
Series 2002B | |
| 08/15/42 | | | 5.625 | % | | | 500,000 | | | | 502,040 | | |
| Series 2011A | |
| 08/15/42 | | | 6.000 | % | | | 2,000,000 | | | | 2,180,760 | | |
Various Kaiser
Series 2001C | |
| 08/01/31 | | | 5.250 | % | | | 1,100,000 | | | | 1,117,446 | | |
City of Newport Beach
Revenue Bonds
Hoag Memorial Presbyterian Hospital
Series 2011 | |
| 12/01/40 | | | 6.000 | % | | | 1,000,000 | | | | 1,120,470 | | |
City of Torrance
Revenue Bonds
Torrance Memorial Medical Center
Series 2010A | |
| 09/01/30 | | | 5.000 | % | | | 3,000,000 | | | | 3,008,310 | | |
| 09/01/40 | | | 5.000 | % | | | 1,000,000 | | | | 977,530 | | |
City of Turlock
Certificate of Participation
Emanuel Medical Center, Inc.
Series 2004 | |
| 10/15/13 | | | 5.000 | % | | | 940,000 | | | | 971,452 | | |
| Series 2007A | |
| 10/15/22 | | | 5.000 | % | | | 2,780,000 | | | | 2,612,171 | | |
Grossmont Healthcare District
Unlimited General Obligation Bonds
2006 Election
Series 2011B | |
| 07/15/34 | | | 6.000 | % | | | 2,000,000 | | | | 2,245,380 | | |
Issue
Description | | Coupon
Rate | | Principal
Amount | | Value | |
| Municipal Bonds (continued) | |
| Health Care - Hospital (cont.) | |
Kaweah Delta Health Care District
Refunding Revenue Bonds
Series 2006 | |
| 06/01/34 | | | 4.500 | % | | $ | 3,500,000 | | | $ | 2,962,225 | | |
Palomar Pomerado Health
Certificate of Participation
Series 2009 | |
| 11/01/39 | | | 6.750 | % | | | 350,000 | | | | 357,620 | | |
Sierra View Local Health Care District
Revenue Bonds
Series 2007 | |
| 07/01/37 | | | 5.250 | % | | | 3,500,000 | | | | 3,297,665 | | |
Washington Township Health Care District
Revenue Bonds
Series 1999 | |
| 07/01/29 | | | 5.250 | % | | | 1,500,000 | | | | 1,489,650 | | |
| Total | | | 75,773,282 | | |
| Health Care - Life Care Center 1.1% | |
ABAG Finance Authority for Nonprofit Corps.
Refunding Revenue Bonds
Episcopal Senior Communities
Series 2011 | |
| 07/01/31 | | | 6.000 | % | | | 2,200,000 | | | | 2,182,246 | | |
California Health Facilities Financing Authority
Revenue Bonds
Insured Episcopal Home
Series 2010B | |
| 02/01/32 | | | 6.000 | % | | | 2,000,000 | | | | 2,050,740 | | |
California Statewide Communities Development Authority
Revenue Bonds
American Baptist Homes West
Series 2010 | |
| 10/01/39 | | | 6.250 | % | | | 1,500,000 | | | | 1,502,685 | | |
| Total | | | 5,735,671 | | |
| Housing - Multi-Family 1.0% | |
California Housing Finance Agency
Revenue Bonds
Multifamily Housing III
Series 1999A AMT(b) | |
| 02/01/36 | | | 5.375 | % | | | 2,280,000 | | | | 2,279,886 | | |
California Statewide Communities Development Authority
Refunding Revenue Bonds
Quail Ridge Apartments
Senior Series 2002E-1 | |
| 07/01/32 | | | 5.375 | % | | | 2,000,000 | | | | 1,517,540 | | |
Revenue Bonds
Irvine LLC-UCI East Campus
Series 2008 | |
| 05/15/32 | | | 5.750 | % | | | 1,500,000 | | | | 1,500,765 | | |
| Total | | | 5,298,191 | | |
| Housing - Single Family 0.7% | |
CRHMFA Homebuyers Fund(b)
Revenue Bonds
Mortgage-Backed Securities Program
Series 1998B-5 (GNMA/FNMA/FHLMC) AMT | |
| 12/01/29 | | | 6.350 | % | | | 15,000 | | | | 15,399 | | |
The Accompanying Notes to Financial Statements are an integral part of this statement.
8
Columbia California Tax-Exempt Fund
October 31, 2011
(Percentages represent value of investments compared to net assets)
Issue
Description | | Coupon
Rate | | Principal
Amount | | Value | |
| Municipal Bonds (continued) | |
| Housing - Single Family (cont.) | |
| Series 2000B (GNMA/FNMA) AMT | |
| 06/01/31 | | | 7.300 | % | | $ | 25,000 | | | $ | 25,682 | | |
| Series 2000D (GNMA/FNMA) AMT | |
| 06/01/31 | | | 7.100 | % | | | 20,000 | | | | 20,703 | | |
California Housing Finance Agency(b)
Revenue Bonds
Home Mortgage
Series 2006H (FGIC) AMT | |
| 08/01/30 | | | 5.750 | % | | | 960,000 | | | | 958,761 | | |
| Series 2006K AMT | |
| 08/01/26 | | | 4.625 | % | | | 2,500,000 | | | | 2,231,800 | | |
| 02/01/42 | | | 5.500 | % | | | 500,000 | | | | 497,505 | | |
| Total | | | 3,749,850 | | |
| Industrial-Pollution - IDR 0.7% | |
M-S-R Energy Authority
Revenue Bonds
Series 2009B | |
| 11/01/34 | | | 7.000 | % | | | 1,000,000 | | | | 1,187,120 | | |
Southern California Public Power Authority
Revenue Bonds
Project No. 1
Series 2007A | |
| 11/01/33 | | | 5.000 | % | | | 2,385,000 | | | | 2,277,818 | | |
| Total | | | 3,464,938 | | |
| Lease 8.0% | |
Anaheim Public Financing Authority
Subordinated Revenue Bonds
Public Improvements Project
Series 1997C (AGM) | |
| 09/01/14 | | | 6.000 | % | | | 2,000,000 | | | | 2,240,820 | | |
California State Public Works Board
Refunding Revenue Bonds
Department of Corrections State Prisons
Series 1993A (AMBAC) | |
| 12/01/19 | | | 5.000 | % | | | 6,000,000 | | | | 6,345,060 | | |
Revenue Bonds
Department of Mental Health Coaling
Series 2004A-A | |
| 06/01/19 | | | 5.500 | % | | | 1,500,000 | | | | 1,611,975 | | |
State University Projects
Series 2011B | |
| 10/01/31 | | | 5.000 | % | | | 1,200,000 | | | | 1,182,096 | | |
Various Capital Projects
Series 2011A | |
| 10/01/31 | | | 5.125 | % | | | 5,000,000 | | | | 5,021,000 | | |
| Subordinated Series 2009I-1 | |
| 11/01/29 | | | 6.125 | % | | | 5,000,000 | | | | 5,463,600 | | |
| Subordinated Series 2010A-1 | |
| 03/01/35 | | | 6.000 | % | | | 2,750,000 | | | | 2,958,615 | | |
California Statewide Communities Development Authority
Revenue Bonds
Proposition 1A Receivables Program
Series 2009 | |
| 06/15/13 | | | 5.000 | % | | | 2,475,000 | | | | 2,634,885 | | |
Issue
Description | | Coupon
Rate | | Principal
Amount | | Value | |
| Municipal Bonds (continued) | |
| Lease (cont.) | |
City of Modesto
Certificate of Participation
Community Center Refinancing Project
Series 1993A (AMBAC) | |
| 11/01/23 | | | 5.000 | % | | $ | 2,235,000 | | | $ | 2,069,185 | | |
County of San Joaquin
Certificate of Participation
Capital Facilities Project
Series 1993 (NPFGC) | |
| 11/15/13 | | | 5.500 | % | | | 1,205,000 | | | | 1,231,149 | | |
Los Angeles Municipal Improvement Corp.
Revenue Bonds
Capital Equipment
Series 2008A | |
| 09/01/24 | | | 5.000 | % | | | 1,000,000 | | | | 1,051,650 | | |
| Series 2008B | |
| 09/01/38 | | | 5.000 | % | | | 3,000,000 | | | | 2,930,460 | | |
Pico Rivera Public Financing Authority
Revenue Bonds
Series 2009 | |
| 09/01/31 | | | 5.500 | % | | | 1,500,000 | | | | 1,571,775 | | |
San Mateo County Board of Education
Refunding Certificate of Participation
Series 2009 | |
| 06/01/35 | | | 5.250 | % | | | 2,000,000 | | | | 2,128,420 | | |
Victor Elementary School District
Certificate of Participation
School Construction Refinancing
Series 1996 (NPFGC) | |
| 05/01/18 | | | 6.450 | % | | | 3,345,000 | | | | 3,578,581 | | |
| Total | | | 42,019,271 | | |
| Miscellaneous 1.5% | |
California Infrastructure & Economic Development Bank
Revenue Bonds
California Infrastructure & Economic Development
Series 2008 | |
| 02/01/38 | | | 5.250 | % | | | 3,050,000 | | | | 3,100,081 | | |
| Series 2008 | |
| 02/01/33 | | | 5.250 | % | | | 3,000,000 | | | | 3,086,610 | | |
Munimae TE Bond Subsidiary LLC
Series 2004A-2(d)(e) | |
| 06/29/49 | | | 4.900 | % | | | 2,000,000 | | | | 1,640,020 | | |
| Total | | | 7,826,711 | | |
| Port District 1.1% | |
Los Angeles Harbor Department
Revenue Bonds
Series 1988 Escrowed to Maturity | |
| 10/01/18 | | | 7.600 | % | | | 600,000 | | | | 729,036 | | |
Port Commission of the City & County of San Francisco
Revenue Bonds
Series 2010A | |
| 03/01/40 | | | 5.125 | % | | | 5,000,000 | | | | 5,141,350 | | |
| Total | | | 5,870,386 | | |
The Accompanying Notes to Financial Statements are an integral part of this statement.
9
Columbia California Tax-Exempt Fund
October 31, 2011
(Percentages represent value of investments compared to net assets)
Issue
Description | | Coupon
Rate | | Principal
Amount | | Value | |
| Municipal Bonds (continued) | |
| Resource Recovery 0.4% | |
California Pollution Control Financing Authority
Refunding Revenue Bonds
Waste Management
Series 2002A AMT(b) | |
| 01/01/22 | | | 5.000 | % | | $ | 2,000,000 | | | $ | 2,045,740 | | |
| Sales or Use Tax 1.4% | |
Puerto Rico Highway & Transportation Authority(f)
Revenue Bonds
Series 1998A (NPFGC) | |
| 07/01/38 | | | 4.750 | % | | | 2,250,000 | | | | 2,035,598 | | |
Riverside County Transportation Commission
Revenue Bonds
Limited Tax
Series 2010A | |
| 06/01/32 | | | 5.000 | % | | | 5,000,000 | | | | 5,237,850 | | |
| Total | | | 7,273,448 | | |
| School 2.4% | |
California Statewide Communities Development Authority
Revenue Bonds
Aspire Public Schools
Series 2010 | |
| 07/01/30 | | | 6.000 | % | | | 2,000,000 | | | | 2,003,260 | | |
California Statewide Communities Development Authority
Revenue Bonds
Polytechnic School
Series 2009 | |
| 12/01/34 | | | 5.000 | % | | | 1,235,000 | | | | 1,266,307 | | |
Lakeside Union School District San Diego County
Unlimited General Obligation Bonds
Series 2009 | |
| 08/01/33 | | | 5.000 | % | | | 3,340,000 | | | | 3,562,778 | | |
Los Angeles Unified School District
Unlimited General Obligation Bonds
Series 2009D | |
| 01/01/34 | | | 5.000 | % | | | 750,000 | | | | 792,465 | | |
Menifee Union School District
Unlimited General Obligation Bonds
Election of 2008
Series 2008A | |
| 08/01/33 | | | 5.500 | % | | | 3,125,000 | | | | 3,308,688 | | |
Simi Valley School Financing Authority
Refunding Revenue Bonds
Simi Valley Unified School District
Series 2007 (AGM) | |
| 08/01/23 | | | 5.000 | % | | | 1,500,000 | | | | 1,666,365 | | |
| Total | | | 12,599,863 | | |
| Special District - Assessment 4.1% | |
Anaheim Community Facilities District No. 06-2
Special Tax Bonds
Stadium Lofts
Series 2007 | |
| 09/01/37 | | | 5.000 | % | | | 1,000,000 | | | | 837,350 | | |
City of Carson
Special Assessment Bonds
District No. 92-1
Series 1992 | |
| 09/02/22 | | | 7.375 | % | | | 110,000 | | | | 110,285 | | |
Issue
Description | | Coupon
Rate | | Principal
Amount | | Value | |
| Municipal Bonds (continued) | |
| Special District - Assessment (cont.) | |
City of Redwood
Special Tax Bonds
Community Facilities District 1
Series 2003B | |
| 09/01/28 | | | 5.950 | % | | $ | 750,000 | | | $ | 750,315 | | |
Eastern Municipal Water District
Special Tax Bonds
District No. 2004-27 Cottonwood
Series 2006 | |
| 09/01/27 | | | 5.000 | % | | | 200,000 | | | | 185,510 | | |
| 09/01/36 | | | 5.000 | % | | | 500,000 | | | | 437,570 | | |
Elk Grove Unified School District
Refunding Special Tax Bonds
Community Facilities District No. 1
Series 1995 (AMBAC) | |
| 12/01/24 | | | 6.500 | % | | | 3,000,000 | | | | 3,190,500 | | |
Elk Grove Unified School District(c)
Refunding Special Tax Bonds
Capital Appreciation-Community Facilities No. 1
Series 1995 (AMBAC) | |
| 12/01/18 | | | 0.000 | % | | | 2,720,000 | | | | 1,870,163 | | |
Lammersville School District Community Facilities District No. 2002
Special Tax Bonds
Mountain House
Series 2006 | |
| 09/01/35 | | | 5.125 | % | | | 1,000,000 | | | | 859,230 | | |
Los Angeles County Public Works Financing Authority
Refunding Revenue Bonds
Senior Lien
Series 1996A (AGM) | |
| 10/01/18 | | | 5.500 | % | | | 2,030,000 | | | | 2,296,153 | | |
Oceanside Community Facilities District
Special Tax Bonds
Ocean Ranch Corp.
Series 2004 | |
| 09/01/34 | | | 5.875 | % | | | 1,000,000 | | | | 868,500 | | |
Orange County Community Facilities District
Special Tax Bonds
Ladera Ranch
Series 2004A | |
| 08/15/34 | | | 5.625 | % | | | 850,000 | | | | 850,204 | | |
Orange Unified School District Community Facilities District No. 2005-2
Special Tax Bonds
Del Rio School Facilities
Series 2007 | |
| 09/01/37 | | | 5.000 | % | | | 1,000,000 | | | | 787,310 | | |
Riverside Public Financing Authority
Unrefunded Revenue Bonds
Multiple Loans
Series 1991A | |
| 02/01/18 | | | 8.000 | % | | | 15,000 | | | | 15,084 | | |
San Bernardino Joint Powers Financing Authority
Refunding Tax Allocation Bonds
Central City Merged Project
Series 1998A (AMBAC) | |
| 07/01/14 | | | 5.750 | % | | | 985,000 | | | | 1,011,812 | | |
| Series 2005A (AGM) | |
| 10/01/24 | | | 5.750 | % | | | 2,420,000 | | | | 2,702,947 | | |
The Accompanying Notes to Financial Statements are an integral part of this statement.
10
Columbia California Tax-Exempt Fund
October 31, 2011
(Percentages represent value of investments compared to net assets)
Issue
Description | | Coupon
Rate | | Principal
Amount | | Value | |
| Municipal Bonds (continued) | |
| Special District - Assessment (cont.) | |
Sulphur Springs Union School District
Special Tax Bonds
Community Facilities District
Series 2002-1A | |
| 09/01/33 | | | 6.000 | % | | $ | 1,500,000 | | | $ | 1,330,200 | | |
West Covina Community Development Commission
Refunding Special Tax Bonds
Fashion Plaza
Series 1996 | |
| 09/01/17 | | | 6.000 | % | | | 3,305,000 | | | | 3,648,092 | | |
| Total | | | 21,751,225 | | |
| Special District - Tax Allocation 12.4% | |
Bakersfield Redevelopment Agency
Tax Allocation Bonds
Old Town Kern Pioneer
Series 2009A | |
| 08/01/29 | | | 7.500 | % | | | 1,895,000 | | | | 1,938,718 | | |
Southeast Bakersfield
Series 2009B | |
| 08/01/29 | | | 7.250 | % | | | 890,000 | | | | 924,149 | | |
Carson Redevelopment Agency
Tax Allocation Bonds
Housing
Series 2010A | |
| 10/01/30 | | | 5.000 | % | | | 5,000,000 | | | | 4,764,550 | | |
Cerritos Public Financing Authority
Tax Allocation Bonds
Los Coyotes Redevelopment Project Loan
Series 1993A (AMBAC) | |
| 11/01/23 | | | 6.500 | % | | | 2,000,000 | | | | 2,134,120 | | |
Folsom Redevelopment Agency
Tax Allocation Bonds
Central Folsom Redevelopment Project
Series 2009 | |
| 08/01/29 | | | 5.125 | % | | | 1,000,000 | | | | 984,460 | | |
| 08/01/36 | | | 5.500 | % | | | 1,000,000 | | | | 999,910 | | |
Inglewood Redevelopment Agency
Refunding Tax Allocation Bonds
Merged Redevelopment Project
Series 1998A (AMBAC) | |
| 05/01/23 | | | 5.250 | % | | | 2,100,000 | | | | 2,098,215 | | |
Lancaster Financing Authority
Subordinated Tax Allocation Bonds
No. 5 & 6 Redevelopment Projects
Series 2003 (NPFGC) | |
| 02/01/17 | | | 5.125 | % | | | 1,270,000 | | | | 1,270,762 | | |
Long Beach Bond Finance Authority
Tax Allocation Bonds
Series 2006C (AMBAC) | |
| 08/01/31 | | | 5.500 | % | | | 3,250,000 | | | | 2,904,265 | | |
Los Angeles Community Redevelopment Agency
Tax Allocation Bonds
Hollywood Redevelopment Project
Series 1998C (NPFGC) | |
| 07/01/18 | | | 5.375 | % | | | 1,665,000 | | | | 1,732,432 | | |
Issue
Description | | Coupon
Rate | | Principal
Amount | | Value | |
| Municipal Bonds (continued) | |
| Special District - Tax Allocation (cont.) | |
Mountain View Shoreline Regional Park Community
Tax Allocation Bonds
Series 2011A | |
| 08/01/35 | | | 5.625 | % | | $ | 1,300,000 | | | $ | 1,338,714 | | |
| 08/01/40 | | | 5.750 | % | | | 2,000,000 | | | | 2,067,660 | | |
Oakdale Public Financing Authority
Tax Allocation Bonds
Central City Redevelopment Project
Series 2004 | |
| 06/01/33 | | | 5.375 | % | | | 1,500,000 | | | | 1,270,275 | | |
Oakland Redevelopment Agency
Refunding Senior Tax Allocation Bonds
Central District Redevelopment
Series 1992 (AMBAC) | |
| 02/01/14 | | | 5.500 | % | | | 4,425,000 | | | | 4,557,529 | | |
Palmdale Civic Authority
Refunding Revenue Bonds
Redevelopment Project No. 1
Series 2009A | |
| 07/01/27 | | | 6.000 | % | | | 4,780,000 | | | | 5,096,579 | | |
Pittsburg Redevelopment Agency
Tax Allocation Bonds
Los Medanos Community Development Project
Series 1999 (AMBAC)(c) | |
| 08/01/24 | | | 0.000 | % | | | 2,100,000 | | | | 920,451 | | |
Rancho Cucamonga Redevelopment Agency
Tax Allocation Bonds
Housing Set Aside
Series 2007A (NPFGC) | |
| 09/01/34 | | | 5.000 | % | | | 3,200,000 | | | | 2,874,272 | | |
Riverside County Economic Development Agency
Tax Allocation Bonds
Housing
Series 2010A | |
| 10/01/39 | | | 6.000 | % | | | 2,000,000 | | | | 2,019,120 | | |
San Diego Redevelopment Agency
Tax Allocation Bonds
Capital Appreciation
Series 2001 (AGM)(c) | |
| 09/01/20 | | | 0.000 | % | | | 3,630,000 | | | | 2,405,274 | | |
San Francisco City & County Redevelopment Agency
Tax Allocation Bonds
Mission Bay North Redevelopment
Series 2009C | |
| 08/01/29 | | | 6.000 | % | | | 1,035,000 | | | | 1,040,610 | | |
| 08/01/39 | | | 6.500 | % | | | 2,625,000 | | | | 2,785,151 | | |
Mission Bay South Redevelopment
Series 2009D | |
| 08/01/29 | | | 6.375 | % | | | 1,000,000 | | | | 1,011,740 | | |
Redevelopment Projects
Series 2009B | |
| 08/01/32 | | | 6.500 | % | | | 500,000 | | | | 529,535 | | |
Redevelopment Projects
Series 2011B | |
| 08/01/26 | | | 6.125 | % | | | 500,000 | | | | 530,855 | | |
| 08/01/41 | | | 6.625 | % | | | 1,600,000 | | | | 1,731,376 | | |
The Accompanying Notes to Financial Statements are an integral part of this statement.
11
Columbia California Tax-Exempt Fund
October 31, 2011
(Percentages represent value of investments compared to net assets)
Issue
Description | | Coupon
Rate | | Principal
Amount | | Value | |
| Municipal Bonds (continued) | |
| Special District - Tax Allocation (cont.) | |
San Francisco Redevelopment Projects
Series 2011B | |
| 08/01/31 | | | 6.250 | % | | $ | 2,600,000 | | | $ | 2,747,342 | | |
San Francisco Redevelopment Projects
Series 2009B | |
| 08/01/28 | | | 6.125 | % | | | 1,010,000 | | | | 1,036,351 | | |
Santa Monica Redevelopment Agency
Tax Allocation Bonds
Earthquake Recovery Redevelopment
Series 2011 | |
| 07/01/36 | | | 5.875 | % | | | 1,250,000 | | | | 1,371,113 | | |
Santee Community Development Commission
Tax Allocation Bonds
Santee Community Redevelopment Project
Series 2011A | |
| 08/01/31 | | | 7.000 | % | | | 1,000,000 | | | | 1,090,840 | | |
Temecula Redevelopment Agency
Tax Allocation Bonds
Housing Redevelopment Project No. 1
Series 2011A | |
| 08/01/31 | | | 6.750 | % | | | 1,000,000 | | | | 1,076,050 | | |
Housing Redevelopment Project No. 1
Series 2011A | |
| 08/01/39 | | | 7.000 | % | | | 2,100,000 | | | | 2,305,107 | | |
Union City Community Redevelopment Agency
Tax Allocation Bonds
Sub Lien- Community Redevelopment Project
Series 2011 | |
| 12/01/12 | | | 3.000 | % | | | 1,000,000 | | | | 1,017,540 | | |
Tax Allocation Bonds
Subordinated Lien-Community Redevelopment Project
Series 2011 | |
| 12/01/33 | | | 6.875 | % | | | 1,500,000 | | | | 1,620,525 | | |
Yorba Linda Redevelopment Agency
Tax Allocation Bonds
Subordinated Lien-Redevelopment Project
Series 2011A | |
| 09/01/32 | | | 6.500 | % | | | 2,000,000 | | | | 2,094,440 | | |
Subordinated Lien-Redevelopment Project
Series 2011A | |
| 09/01/26 | | | 6.000 | % | | | 1,000,000 | | | | 1,046,780 | | |
| Total | | | 65,336,810 | | |
| Special Purpose Certificates - General Obligations 3.2% | |
Central Valley Schools Financing Authority
Refunding Revenue Bonds
School District General Obligation Bond Program
Series 1998A (NPFGC) | |
| 02/01/18 | | | 6.450 | % | | | 1,000,000 | | | | 1,118,460 | | |
Culver City School Facilities Financing Authority
Revenue Bonds
Culver City United School District
Series 2005 (AGM) | |
| 08/01/26 | | | 5.500 | % | | | 1,750,000 | | | | 2,066,032 | | |
Issue
Description | | Coupon
Rate | | Principal
Amount | | Value | |
| Municipal Bonds (continued) | |
| Special Purpose Certificates - General Obligations (cont.) | |
East Side Union High School District
Unlimited General Obligation Refunding Bonds
Series 2003B (NPFGC) | |
| 08/01/26 | | | 5.250 | % | | $ | 2,010,000 | | | $ | 2,113,374 | | |
Jefferson Union High School District
Unlimited General Obligation Refunding Bonds
Series 2000A (NPFGC) | |
| 08/01/25 | | | 6.450 | % | | | 1,000,000 | | | | 1,202,820 | | |
Manteca Unified School District
Unlimited General Obligation Bonds
Capital Appreciation-Election of 2004
Series 2006 (NPFGC)(c) | |
| 08/01/32 | | | 0.000 | % | | | 5,440,000 | | | | 1,364,298 | | |
New Haven Unified School District
Unlimited General Obligation Refunding Bonds
Series 2002 (AGM) | |
| 08/01/17 | | | 12.000 | % | | | 1,565,000 | | | | 2,406,986 | | |
Rocklin Unified School District
Unlimited General Obligation Bonds
Capital Appreciation
Series 1995C (NPFGC)(c) | |
| 07/01/20 | | | 0.000 | % | | | 3,460,000 | | | | 2,397,988 | | |
San Bernardino Community College District
Unlimited General Obligation Bonds
Election of 2002
Series 2008A | |
| 08/01/33 | | | 6.250 | % | | | 1,000,000 | | | | 1,145,870 | | |
San Marino Unified School District
Unlimited General Obligation Bonds
Series 1998B | |
| 06/01/23 | | | 5.000 | % | | | 1,000,000 | | | | 1,199,990 | | |
San Mateo County Community College District
Unlimited General Obligation Bonds
Election of 2001
Series 2002A (NPFGC/FGIC) | |
| 09/01/18 | | | 5.375 | % | | | 1,000,000 | | | | 1,034,950 | | |
Simi Valley Unified School District
Refunding Certificate of Participation
Capital Improvement Projects
Series 1998 (AMBAC) | |
| 08/01/22 | | | 5.250 | % | | | 925,000 | | | | 927,941 | | |
| Total | | | 16,978,709 | | |
| State 19.0% | |
Commonwealth of Puerto Rico(f)
Unlimited General Obligation Public Improvement Bonds
Series 2004A | |
| 07/01/22 | | | 5.250 | % | | | 2,000,000 | | | | 2,078,700 | | |
State of California
Refunding Unlimited General Obligation Bonds
Series 2007 | |
| 08/01/14 | | | 5.000 | % | | | 1,465,000 | | | | 1,613,536 | | |
Unlimited General Obligation Bonds
Series 2010 | |
| 11/01/29 | | | 5.200 | % | | | 1,000,000 | | | | 1,048,320 | | |
Unlimited General Obligation Bonds
Series 2003 | |
| 02/01/20 | | | 5.250 | % | | | 1,250,000 | | | | 1,423,950 | | |
The Accompanying Notes to Financial Statements are an integral part of this statement.
12
Columbia California Tax-Exempt Fund
October 31, 2011
(Percentages represent value of investments compared to net assets)
Issue
Description | | Coupon
Rate | | Principal
Amount | | Value | |
| Municipal Bonds (continued) | |
| State (cont.) | |
| Series 2003 (AMBAC) | |
| 02/01/27 | | | 5.000 | % | | $ | 1,140,000 | | | $ | 1,229,832 | | |
| Series 2004 | |
| 02/01/22 | | | 5.000 | % | | | 1,000,000 | | | | 1,054,920 | | |
| Series 2006 | |
| 10/01/36 | | | 4.500 | % | | | 2,500,000 | | | | 2,322,950 | | |
| Series 2008 | |
| 08/01/34 | | | 5.000 | % | | | 3,000,000 | | | | 3,015,120 | | |
Various Purpose
Series 2003 | |
| 11/01/24 | | | 5.125 | % | | | 2,000,000 | | | | 2,126,000 | | |
| Series 2005 | |
| 03/01/32 | | | 5.000 | % | | | 1,000,000 | | | | 1,009,230 | | |
| Series 2006 | |
| 03/01/16 | | | 5.000 | % | | | 1,245,000 | | | | 1,397,176 | | |
| Series 2007 | |
| 12/01/28 | | | 5.000 | % | | | 1,000,000 | | | | 1,032,220 | | |
| 12/01/31 | | | 5.000 | % | | | 3,500,000 | | | | 3,554,845 | | |
| 12/01/32 | | | 5.000 | % | | | 5,000,000 | | | | 5,062,550 | | |
| Series 2009 | |
| 04/01/25 | | | 5.625 | % | | | 500,000 | | | | 562,260 | | |
| 10/01/29 | | | 5.000 | % | | | 4,500,000 | | | | 4,636,215 | | |
| 04/01/31 | | | 5.750 | % | | | 2,750,000 | | | | 2,997,170 | | |
| 04/01/35 | | | 6.000 | % | | | 4,000,000 | | | | 4,435,800 | | |
| 04/01/38 | | | 6.000 | % | | | 10,500,000 | | | | 11,622,870 | | |
| 11/01/39 | | | 5.500 | % | | | 4,965,000 | | | | 5,193,638 | | |
| Series 2010 | |
| 03/01/24 | | | 5.250 | % | | | 1,000,000 | | | | 1,089,490 | | |
| 03/01/27 | | | 5.000 | % | | | 5,000,000 | | | | 5,246,250 | | |
| 03/01/30 | | | 5.250 | % | | | 1,000,000 | | | | 1,041,700 | | |
| 03/01/33 | | | 6.000 | % | | | 4,000,000 | | | | 4,501,600 | | |
| 03/01/40 | | | 5.500 | % | | | 4,800,000 | | | | 5,024,832 | | |
Unlimited General Obligation Refunding Bonds
Series 2005 | |
| 05/01/29 | | | 4.625 | % | | | 2,000,000 | | | | 1,976,140 | | |
| Series 2007 | |
| 08/01/26 | | | 4.500 | % | | | 2,500,000 | | | | 2,512,625 | | |
| 08/01/30 | | | 4.500 | % | | | 3,340,000 | | | | 3,244,977 | | |
Various Purpose
Series 2008 | |
| 04/01/18 | | | 5.000 | % | | | 1,735,000 | | | | 1,960,446 | | |
| 04/01/33 | | | 5.125 | % | | | 3,500,000 | | | | 3,556,245 | | |
| 04/01/38 | | | 5.000 | % | | | 12,110,000 | | | | 12,116,055 | | |
Unrefunded Unlimited General Obligation Bonds
Series 2000 | |
| 05/01/26 | | | 5.625 | % | | | 160,000 | | | | 160,442 | | |
| Series 2004 | |
| 04/01/29 | | | 5.300 | % | | | 2,000 | | | | 2,061 | | |
| Total | | | 99,850,165 | | |
| Toll Road 2.0% | |
Bay Area Toll Authority
Revenue Bonds
San Francisco Bay Area
Series 2008F1 | |
| 04/01/47 | | | 5.125 | % | | | 2,500,000 | | | | 2,578,700 | | |
Issue
Description | | Coupon
Rate | | Principal
Amount | | Value | |
| Municipal Bonds (continued) | |
| Toll Road (cont.) | |
Foothill-Eastern Transportation Corridor Agency
Refunding Revenue Bonds
Series 1999 | |
| 01/15/40 | | | 5.750 | % | | $ | 5,500,000 | | | $ | 4,952,915 | | |
Revenue Bonds
Senior Lien
Series 1995A (NPFGC) | |
| 01/01/35 | | | 5.000 | % | | | 2,000,000 | | | | 1,647,500 | | |
San Joaquin Hills Transportation Corridor Agency
Revenue Bonds
Senior Lien
Series 1993 | |
| 01/01/33 | | | 5.000 | % | | | 1,700,000 | | | | 1,294,958 | | |
| Total | | | 10,474,073 | | |
| Water & Sewer 3.7% | |
Anaheim Public Financing Authority
Revenue Bonds
Series 2007 (NPFGC) | |
| 02/01/33 | | | 4.750 | % | | | 2,795,000 | | | | 2,807,689 | | |
City of Big Bear Lake Water
Refunding Revenue Bonds
Series 1996 (NPFGC) | |
| 04/01/15 | | | 6.000 | % | | | 1,350,000 | | | | 1,427,679 | | |
City of Lodi
Certificate of Participation
Series 2007A (AGM) | |
| 10/01/37 | | | 5.000 | % | | | 1,250,000 | | | | 1,283,413 | | |
Eastern Municipal Water District
Certificate of Participation
Series 1991 (NPFGC/FGIC) | |
| 07/01/12 | | | 6.750 | % | | | 685,000 | | | | 706,646 | | |
| Series 2008H | |
| 07/01/33 | | | 5.000 | % | | | 1,000,000 | | | | 1,038,970 | | |
Manteca Financing Authority
Revenue Bonds
Series 2003B (NPFGC) | |
| 12/01/33 | | | 5.000 | % | | | 430,000 | | | | 427,583 | | |
Pico Rivera Water Authority
Revenue Bonds
Water System Project
Series 1999A (NPFGC) | |
| 05/01/29 | | | 5.500 | % | | | 2,000,000 | | | | 2,078,840 | | |
Rowland Water District
Certificate of Participation
Recycled Water Project
Series 2008 | |
| 12/01/39 | | | 6.250 | % | | | 2,235,000 | | | | 2,448,599 | | |
San Diego Public Facilities Financing Authority
Revenue Bonds
Senior Series 2009A | |
| 05/15/34 | | | 5.250 | % | | | 1,500,000 | | | | 1,596,855 | | |
| 05/15/39 | | | 5.250 | % | | | 3,000,000 | | | | 3,175,860 | | |
| Series 2009B | |
| 08/01/34 | | | 5.375 | % | | | 2,000,000 | | | | 2,174,640 | | |
| Total | | | 19,166,774 | | |
Total Municipal Bonds
(Cost: $490,793,797) | | $ | 508,385,364 | | |
The Accompanying Notes to Financial Statements are an integral part of this statement.
13
Columbia California Tax-Exempt Fund
October 31, 2011
(Percentages represent value of investments compared to net assets)
Issue
Description | | Coupon
Rate | | Principal
Amount | | Value | |
| Floating Rate Notes 0.7% | |
| Health Care - Nursing Home 0.3% | |
ABAG Finance Authority for Nonprofit Corps.
Revenue Bonds
Hebrew Home Aged Disabled
VRDN Series 2005 (Wells Fargo Bank)(a) | |
| 11/15/35 | | | 0.060 | % | | $ | 1,475,000 | | | $ | 1,475,000 | | |
| Industrial-Pollution - IDR 0.4% | |
California Pollution Control Financing Authority
Refunding Revenue Bonds
Pacific Gas & Electric Co.
VRDN Series 1996C (JP Morgan Chase Bank)(a) | |
| 11/01/26 | | | 0.070 | % | | | 2,500,000 | | | | 2,500,000 | | |
Total Floating Rate Notes
(Cost: $3,975,000) | | $ | 3,975,000 | | |
Issuer
Description | | Shares | | Value | |
| Money Market Funds 1.6% | |
Dreyfus General California
Municipal Money Market Fund,
0.000%(h) | | | 4,711,899 | | | $ | 4,711,899 | | |
JPMorgan Tax-Free Money Market
Fund, 0.010%(h) | | | 3,491,069 | | | | 3,491,069 | | |
Total Money Market Funds
(Cost: $8,202,968) | | $ | 8,202,968 | | |
Total Investments
(Cost: $502,971,765) | | | | $ | 520,563,332 | | |
| Other Assets & Liabilities, Net | | | | | 4,513,716 | | |
| Total Net Assets | | | | $ | 525,077,048 | | |
| Notes to Portfolio of Investments | |
(a) Variable rate security. The interest rate shown reflects the rate as of October 31, 2011.
(b) At October 31, 2011, the value of securities subject to alternative minimum tax represented 4.54% of net assets.
(c) Zero coupon bond.
(d) Identifies issues considered to be illiquid as to their marketability. The aggregate value of such securities at October 31, 2011 was $3,230,297, representing 0.62% of net assets. Information concerning such security holdings at October 31, 2011 was as follows:
| Security Description | | Acquisition
Dates | | Cost | |
California Statewide Communities Development Authority
Revenue Bonds
San Francisco Art Institute
Series 2002
7.375% 04/01/32 | | 07/05/02 | | $ | 1,750,000 | | |
Munimae TE Bond Subsidiary LLC
Series 2004A-2
4.900% 06/29/49 | | 10/15/04 | | | 2,000,000 | | |
(e) Security exempt from registration pursuant to Rule 144A under the Securities Act of 1933. This security may be resold in transactions exempt from registration, normally to qualified institutional buyers. At October 31, 2011, the value of these securities amounted to $7,177,370 or 1.37% of net assets.
(f) Municipal obligations include debt obligations issued by or on behalf of territories, or sovereign nations within the territorial boundaries of the United States. At October 31, 2011, the value of these securities amounted to $5,626,883 or 1.07% of the net assets.
(g) Represents a security purchased on a when-issued or delayed delivery basis.
(h) The rate shown is the seven-day current annualized yield at October 31, 2011.
AGM Assured Guaranty Municipal Corporation
AMBAC Ambac Assurance Corporation
AMT Alternative Minimum Tax
FGIC Financial Guaranty Insurance Company
FHLMC Federal Home Loan Mortgage Corporation
FNMA Federal National Mortgage Association
GNMA Government National Mortgage Association
NPFGC National Public Finance Guarantee Corporation
VRDN Variable Rate Demand Note
The Accompanying Notes to Financial Statements are an integral part of this statement.
14
Columbia California Tax-Exempt Fund
October 31, 2011
Generally accepted accounting principles (GAAP) require disclosure regarding the inputs and valuation techniques used to measure fair value and any changes in valuation inputs or techniques. In addition, investments shall be disclosed by major category.
The Fund categorizes its fair value measurements according to a three-level hierarchy that maximizes the use of observable inputs and minimizes the use of unobservable inputs by prioritizing that the most observable input be used when available. Observable inputs are those that market participants would use in pricing an investment based on market data obtained from sources independent of the reporting entity. Unobservable inputs are those that reflect the Fund's assumptions about the information market participants would use in pricing an investment. An investment's level within the fair value hierarchy is based on the lowest level of any input that is deemed significant to the asset or liability's fair value measurement. The input levels are not necessarily an indication of the risk or liquidity associated with investments at that level. For example, certain U.S. government securities are generally high quality and liquid, however, they are reflected as Level 2 because the inputs used to determine fair value may not always be quoted prices in an active market.
Fair value inputs are summarized in the three broad levels listed below:
• Level 1 — Valuations based on quoted prices for investments in active markets that the Fund has the ability to access at the measurement date (including NAV for open-end mutual funds). Valuation adjustments are not applied to Level 1 investments.
• Level 2 — Valuations based on other significant observable inputs (including quoted prices for similar securities, interest rates, prepayment speeds, credit risks, etc.).
• Level 3 — Valuations based on significant unobservable inputs (including the Fund's own assumptions and judgment in determining the fair value of investments).
Inputs that are used in determining fair value of an investment may include price information, credit data, volatility statistics, and other factors. These inputs can be either observable or unobservable. The availability of observable inputs can vary between investments, and is affected by various factors such as the type of investment, and the volume and level of activity for that investment or similar investments in the marketplace. The inputs will be considered by the Investment Manager, along with any other relevant factors in the calculation of an investment's fair value. The Fund uses prices and inputs that are current as of the measurement date, which may include periods of market dislocations. During these periods, the availability of prices and inputs may be reduced for many investments. This condition could cause an investment to be reclassified between the various levels within the hierarchy.
Investments falling into the Level 3 category are primarily supported by quoted prices from brokers and dealers participating in the market for those investments. However, these may be classified as Level 3 investments due to lack of market transparency and corroboration to support these quoted prices. Additionally, valuation models may be used as the pricing source for any remaining investments classified as Level 3. These models rely on one or more significant unobservable inputs and/or significant assumptions by the Investment Manager. Inputs used in valuations may include, but are not limited to, financial statement analysis, capital account balances, discount rates and estimated cash flows, and comparable company data.
The following table is a summary of the inputs used to value the Fund's investments as of October 31, 2011:
| | | Fair Value at October 31, 2011 | |
| Description(a) | | Level 1
Quoted Prices
in Active
Markets for
Identical Assets | | Level 2
Other
Significant
Observable
Inputs(b) | |
Level 3
Significant
Unobservable
Inputs | |
Total | |
| Bonds | |
| Municipal Bonds | | $ | — | | | $ | 508,385,364 | | | $ | — | | | $ | 508,385,364 | | |
| Total Bonds | | | — | | | | 508,385,364 | | | | — | | | | 508,385,364 | | |
| Short-Term Securities | |
| Floating Rate Notes | | | — | | | | 3,975,000 | | | | — | | | �� | 3,975,000 | | |
| Total Short-Term Securities | | | — | | | | 3,975,000 | | | | — | | | | 3,975,000 | | |
| Other | |
| Money Market Funds | | | 8,202,968 | | | | — | | | | — | | | | 8,202,968 | | |
| Total Other | | | 8,202,968 | | | | — | | | | — | | | | 8,202,968 | | |
| Total | | $ | 8,202,968 | | | $ | 512,360,364 | | | $ | — | | | $ | 520,563,332 | | |
The Fund's assets assigned to the Level 2 input category are generally valued using the market approach, in which a security's value is determined through reference to prices and information from market transactions for similar or identical assets.
(a) See the Portfolio of Investments for all investment classifications not indicated in the table.
(b) There were no significant transfers between Levels 1 and 2 during the period.
The Accompanying Notes to Financial Statements are an integral part of this statement.
15
Statement of Assets and Liabilities – Columbia California Tax-Exempt Fund
October 31, 2011
| Assets | |
| Investments, at value | |
| (identified cost $502,971,765) | | $ | 520,563,332 | | |
| Receivable for: | |
| Investments sold | | | 6,992,253 | | |
| Capital shares sold | | | 1,259,309 | | |
| Interest | | | 6,693,358 | | |
| Expense reimbursement due from Investment Manager | | | 6,184 | | |
| Prepaid expense | | | 501 | | |
| Trustees' deferred compensation plan | | | 44,932 | | |
| Total assets | | | 535,559,869 | | |
| Liabilities | |
| Disbursements in excess of cash | | | 260 | | |
| Payable for: | |
| Investments purchased on a delayed delivery basis | | | 7,844,750 | | |
| Capital shares purchased | | | 496,965 | | |
| Dividend distributions to shareholders | | | 1,771,676 | | |
| Investment management fees | | | 17,101 | | |
| Distribution and service fees | | | 10,731 | | |
| Transfer agent fees | | | 51,995 | | |
| Administration fees | | | 2,897 | | |
| Chief compliance officer expenses | | | 522 | | |
| Other expenses | | | 240,992 | | |
| Trustees' deferred compensation plan | | | 44,932 | | |
| Total liabilities | | | 10,482,821 | | |
| Net assets applicable to outstanding capital stock | | $ | 525,077,048 | | |
The Accompanying Notes to Financial Statements are an integral part of this statement.
16
Statement of Assets and Liabilities (continued) – Columbia California Tax-Exempt Fund
October 31, 2011
| Represented by | |
| Paid-in capital | | $ | 509,893,653 | | |
| Undistributed net investment income | | | 88,279 | | |
| Accumulated net realized loss | | | (2,496,451 | ) | |
| Unrealized appreciation (depreciation) on: | |
| Investments | | | 17,591,567 | | |
| Total — representing net assets applicable to outstanding capital stock | | $ | 525,077,048 | | |
| Net assets applicable to outstanding shares | |
| Class A | | $ | 407,479,468 | | |
| Class B | | $ | 1,989,378 | | |
| Class C | | $ | 39,040,086 | | |
| Class Z | | $ | 76,568,116 | | |
| Shares outstanding | |
| Class A | | | 55,219,757 | | |
| Class B | | | 269,639 | | |
| Class C | | | 5,289,888 | | |
| Class Z | | | 10,373,037 | | |
| Net asset value per share | |
| Class A(a) | | $ | 7.38 | | |
| Class B | | $ | 7.38 | | |
| Class C | | $ | 7.38 | | |
| Class Z | | $ | 7.38 | | |
(a) The maximum offering price per share for Class A is $7.75. The offering price is calculated by dividing the net asset value by 1.0 minus the maximum sales charge of 4.75%.
The Accompanying Notes to Financial Statements are an integral part of this statement.
17
Statement of Operations – Columbia California Tax-Exempt Fund
Year ended October 31, 2011
| Net investment income | |
| Income: | |
| Dividends | | $ | 2,908 | | |
| Interest | | | 21,414,806 | | |
| Total income | | | 21,417,714 | | |
| Expenses: | |
| Investment management fees | | | 1,781,596 | | |
| Distribution fees | |
| Class B | | | 13,580 | | |
| Class C | | | 244,231 | | |
| Service fees | |
| Class A | | | 748,205 | | |
| Class B | | | 4,444 | | |
| Class C | | | 79,917 | | |
| Transfer agent fees | |
| Class A | | | 343,845 | | |
| Class B | | | 2,112 | | |
| Class C | | | 39,743 | | |
| Class Z | | | 93,287 | | |
| Administration fees | | | 204,533 | | |
| Compensation of board members | | | 28,939 | | |
| Pricing and bookkeeping fees | | | 61,310 | | |
| Custodian fees | | | 10,047 | | |
| Printing and postage fees | | | 51,480 | | |
| Registration fees | | | 54,049 | | |
| Professional fees | | | 61,059 | | |
| Chief compliance officer expenses | | | 1,174 | | |
| Other | | | 120,062 | | |
| Total expenses | | | 3,943,613 | | |
| Fees waived or expenses reimbursed by Investment Manager and its affiliates | | | (455,210 | ) | |
| Fees waived by distributor — Class C | | | (97,657 | ) | |
| Expense reductions | | | (991 | ) | |
| Total net expenses | | | 3,389,755 | | |
| Net investment income | | | 18,027,959 | | |
| Realized and unrealized gain (loss) — net | |
| Net realized gain (loss) on: | |
| Investments | | | 875,625 | | |
| Net realized gain | | | 875,625 | | |
| Net change in unrealized appreciation (depreciation) on: | |
| Investments | | | (3,925,815 | ) | |
| Net change in unrealized depreciation | | | (3,925,815 | ) | |
| Net realized and unrealized loss | | | (3,050,190 | ) | |
| Net increase in net assets resulting from operations | | $ | 14,977,769 | | |
The Accompanying Notes to Financial Statements are an integral part of this statement.
18
Statement of Changes in Net Assets – Columbia California Tax-Exempt Fund
| Year ended October 31, | | 2011 | | 2010 | |
| Operations | |
| Net investment income | | $ | 18,027,959 | | | $ | 16,772,916 | | |
| Net realized gain | | | 875,625 | | | | 6,876,102 | | |
| Net change in unrealized appreciation (depreciation) | | | (3,925,815 | ) | | | 12,436,214 | | |
| Net increase in net assets resulting from operations | | | 14,977,769 | | | | 36,085,232 | | |
| Distributions to shareholders from: | |
| Net investment income | |
| Class A | | | (13,137,447 | ) | | | (11,166,443 | ) | |
| Class B | | | (64,464 | ) | | | (126,799 | ) | |
| Class C | | | (1,260,024 | ) | | | (1,142,842 | ) | |
| Class Z | | | (3,601,746 | ) | | | (4,333,792 | ) | |
| Net realized gains | |
| Class A | | | (4,568,049 | ) | | | (826,388 | ) | |
| Class B | | | (32,807 | ) | | | (15,401 | ) | |
| Class C | | | (571,585 | ) | | | (91,505 | ) | |
| Class Z | | | (1,657,571 | ) | | | (316,727 | ) | |
| Total distributions to shareholders | | | (24,893,693 | ) | | | (18,019,897 | ) | |
| Increase (decrease) in net assets from share transactions | | | 146,724,185 | | | | (36,941,425 | ) | |
| Total increase (decrease) in net assets | | | 136,808,261 | | | | (18,876,090 | ) | |
| Net assets at beginning of year | | | 388,268,787 | | | | 407,144,877 | | |
| Net assets at end of year | | $ | 525,077,048 | | | $ | 388,268,787 | | |
| Undistributed net investment income | | $ | 88,279 | | | $ | 248,466 | | |
The Accompanying Notes to Financial Statements are an integral part of this statement.
19
Statement of Changes in Net Assets (continued) – Columbia California Tax-Exempt Fund
| Year ended October 31, | | 2011 | | 2010 | |
| | | Shares | | Dollars ($) | | Shares | | Dollars ($) | |
| Capital stock activity | |
| Class A shares | |
| Subscriptions | | | 1,774,807 | | | | 12,875,405 | | | | 1,392,238 | | | | 10,378,058 | | |
| Fund merger | | | 25,092,629 | | | | 179,929,484 | | | | — | | | | — | | |
| Distributions reinvested | | | 1,493,775 | | | | 10,669,224 | | | | 1,040,628 | | | | 7,728,471 | | |
| Redemptions | | | (7,099,287 | ) | | | (50,748,811 | ) | | | (4,865,004 | ) | | | (36,310,861 | ) | |
| Net increase | | | 21,261,924 | | | | 152,725,302 | | | | (2,432,138 | ) | | | (18,204,332 | ) | |
| Class B shares | |
| Subscriptions | | | 16,002 | | | | 115,287 | | | | 22,274 | | | | 163,983 | | |
| Fund merger | | | 218,017 | | | | 1,562,262 | | | | — | | | | — | | |
| Distributions reinvested | | | 8,201 | | | | 58,471 | | | | 11,349 | | | | 84,002 | | |
| Redemptions | | | (246,679 | ) | | | (1,770,621 | ) | | | (496,255 | ) | | | (3,678,684 | ) | |
| Net decrease | | | (4,459 | ) | | | (34,601 | ) | | | (462,632 | ) | | | (3,430,699 | ) | |
| Class C shares | |
| Subscriptions | | | 729,676 | | | | 5,240,068 | | | | 920,606 | | | | 6,878,960 | | |
| Fund merger | | | 1,427,288 | | | | 10,231,939 | | | | — | | | | — | | |
| Distributions reinvested | | | 77,748 | | | | 554,405 | | | | 67,717 | | | | 501,874 | | |
| Redemptions | | | (1,141,948 | ) | | | (8,086,535 | ) | | | (754,660 | ) | | | (5,611,874 | ) | |
| Net increase | | | 1,092,764 | | | | 7,939,877 | | | | 233,663 | | | | 1,768,960 | | |
| Class Z shares | |
| Subscriptions | | | 1,491,393 | | | | 10,704,560 | | | | 1,776,504 | | | | 13,286,453 | | |
| Distributions reinvested | | | 83,244 | | | | 587,566 | | | | 43,356 | | | | 320,208 | | |
| Redemptions | | | (3,570,650 | ) | | | (25,198,519 | ) | | | (4,144,983 | ) | | | (30,682,015 | ) | |
| Net decrease | | | (1,996,013 | ) | | | (13,906,393 | ) | | | (2,325,123 | ) | | | (17,075,354 | ) | |
| Total net increase | | | 20,354,216 | | | | 146,724,185 | | | | (4,986,230 | ) | | | (36,941,425 | ) | |
The Accompanying Notes to Financial Statements are an integral part of this statement.
20
Financial Highlights – Columbia California Tax-Exempt Fund
The following tables are intended to help you understand the Fund's financial performance. Certain information reflects financial results for a single share of a class held for the periods shown. Per share net investment income (loss) amounts are calculated based on average shares outstanding during the period. Total returns assume reinvestment of all dividends and distributions. Total returns do not reflect payment of sales charges, if any, and are not annualized for periods of less than one year.
| | | Year ended Oct. 31, | |
| | | 2011 | | 2010 | | 2009 | | 2008 | | 2007 | |
| Class A | |
| Per share data | |
| Net asset value, beginning of period | | $ | 7.64 | | | $ | 7.30 | | | $ | 6.71 | | | $ | 7.55 | | | $ | 7.74 | | |
| Income from investment operations: | |
| Net investment income | | | 0.31 | | | | 0.32 | | | | 0.31 | | | | 0.30 | | | | 0.30 | | |
| Net realized and unrealized gain (loss) | | | (0.12 | ) | | | 0.36 | | | | 0.59 | | | | (0.79 | ) | | | (0.16 | ) | |
| Total from investment operations | | | 0.19 | | | | 0.68 | | | | 0.90 | | | | (0.49 | ) | | | 0.14 | | |
| Less distributions to shareholders from: | |
| Net investment income | | | (0.31 | ) | | | (0.32 | ) | | | (0.30 | ) | | | (0.31 | ) | | | (0.30 | ) | |
| Net realized gains | | | (0.14 | ) | | | (0.02 | ) | | | (0.01 | ) | | | (0.04 | ) | | | (0.03 | ) | |
| Total distributions to shareholders | | | (0.45 | ) | | | (0.34 | ) | | | (0.31 | ) | | | (0.35 | ) | | | (0.33 | ) | |
| Proceeds from regulatory settlement | | | — | | | | — | | | | 0.00 | (a) | | | — | | | | — | | |
| Net asset value, end of period | | $ | 7.38 | | | $ | 7.64 | | | $ | 7.30 | | | $ | 6.71 | | | $ | 7.55 | | |
| Total return | | | 2.84 | % | | | 9.52 | % | | | 13.76 | % | | | (6.80 | %) | | | 1.86 | % | |
| Ratios to average net assets(b) | |
| Expenses prior to fees waived or expenses reimbursed | | | 0.92 | % | | | 0.87 | % | | | 0.86 | % | | | 0.85 | % | | | 0.86 | % | |
| Net expenses after fees waived or expenses reimbursed(c) | | | 0.81 | %(d) | | | 0.84 | %(d) | | | 0.84 | %(d) | | | 0.84 | %(d) | | | 0.83 | %(d) | |
| Net investment income | | | 4.30 | %(d) | | | 4.25 | %(d) | | | 4.38 | %(d) | | | 4.14 | %(d) | | | 3.99 | %(d) | |
| Supplemental data | |
| Net assets, end of period (in thousands) | | $ | 407,479 | | | $ | 259,552 | | | $ | 265,594 | | | $ | 263,220 | | | $ | 281,254 | | |
| Portfolio turnover | | | 28 | % | | | 12 | % | | | 14 | % | | | 12 | % | | | 12 | % | |
| Notes to Financial Highlights | |
(a) Rounds to less than $0.01.
(b) In addition to the fees and expenses which the Fund bears directly, the Fund indirectly bears a pro rata share of the fees and expenses of the acquired funds in which it invests. Such indirect expenses are not included in the reported expense ratios.
(c) The Investment Manager and certain of its affiliates agreed to waive/reimburse certain fees and expenses, if applicable.
(d) The benefits derived from expense reductions had an impact of less than 0.01%.
The Accompanying Notes to Financial Statements are an integral part of this statement.
21
Financial Highlights (continued) – Columbia California Tax-Exempt Fund
| | | Year ended Oct. 31, | |
| | | 2011 | | 2010 | | 2009 | | 2008 | | 2007 | |
| Class B | |
| Per share data | |
| Net asset value, beginning of period | | $ | 7.64 | | | $ | 7.30 | | | $ | 6.71 | | | $ | 7.55 | | | $ | 7.74 | | |
| Income from investment operations: | |
| Net investment income | | | 0.25 | | | | 0.26 | | | | 0.26 | | | | 0.25 | | | | 0.25 | | |
| Net realized and unrealized gain (loss) | | | (0.12 | ) | | | 0.36 | | | | 0.59 | | | | (0.80 | ) | | | (0.17 | ) | |
| Total from investment operations | | | 0.13 | | | | 0.62 | | | | 0.85 | | | | (0.55 | ) | | | 0.08 | | |
| Less distributions to shareholders from: | |
| Net investment income | | | (0.25 | ) | | | (0.26 | ) | | | (0.25 | ) | | | (0.25 | ) | | | (0.24 | ) | |
| Net realized gains | | | (0.14 | ) | | | (0.02 | ) | | | (0.01 | ) | | | (0.04 | ) | | | (0.03 | ) | |
| Total distributions to shareholders | | | (0.39 | ) | | | (0.28 | ) | | | (0.26 | ) | | | (0.29 | ) | | | (0.27 | ) | |
| Proceeds from regulatory settlement | | | — | | | | — | | | | 0.00 | (a) | | | — | | | | — | | |
| Net asset value, end of period | | $ | 7.38 | | | $ | 7.64 | | | $ | 7.30 | | | $ | 6.71 | | | $ | 7.55 | | |
| Total return | | | 2.06 | % | | | 8.71 | % | | | 12.92 | % | | | (7.49 | %) | | | 1.10 | % | |
| Ratios to average net assets(b) | |
| Expenses prior to fees waived or expenses reimbursed | | | 1.68 | % | | | 1.62 | % | | | 1.61 | % | | | 1.60 | % | | | 1.61 | % | |
| Net expenses after fees waived or expenses reimbursed(c) | | | 1.58 | %(d) | | | 1.59 | %(d) | | | 1.59 | %(d) | | | 1.59 | %(d) | | | 1.58 | %(d) | |
| Net investment income | | | 3.53 | %(d) | | | 3.52 | %(d) | | | 3.65 | %(d) | | | 3.38 | %(d) | | | 3.25 | %(d) | |
| Supplemental data | |
| Net assets, end of period (in thousands) | | $ | 1,989 | | | $ | 2,095 | | | $ | 5,377 | | | $ | 9,740 | | | $ | 16,123 | | |
| Portfolio turnover | | | 28 | % | | | 12 | % | | | 14 | % | | | 12 | % | | | 12 | % | |
| Notes to Financial Highlights | |
(a) Rounds to less than $0.01.
(b) In addition to the fees and expenses which the Fund bears directly, the Fund indirectly bears a pro rata share of the fees and expenses of the acquired funds in which it invests. Such indirect expenses are not included in the reported expense ratios.
(c) The Investment Manager and certain of its affiliates agreed to waive/reimburse certain fees and expenses, if applicable.
(d) The benefits derived from expense reductions had an impact of less than 0.01%.
The Accompanying Notes to Financial Statements are an integral part of this statement.
22
Financial Highlights (continued) – Columbia California Tax-Exempt Fund
| | | Year ended Oct. 31, | |
| | | 2011 | | 2010 | | 2009 | | 2008 | | 2007 | |
| Class C | |
| Per share data | |
| Net asset value, beginning of period | | $ | 7.64 | | | $ | 7.30 | | | $ | 6.71 | | | $ | 7.55 | | | $ | 7.74 | | |
| Income from investment operations: | |
| Net investment income | | | 0.28 | | | | 0.28 | | | | 0.28 | | | | 0.27 | | | | 0.27 | | |
| Net realized and unrealized gain (loss) | | | (0.13 | ) | | | 0.37 | | | | 0.59 | | | | (0.80 | ) | | | (0.16 | ) | |
| Total from investment operations | | | 0.15 | | | | 0.65 | | | | 0.87 | | | | (0.53 | ) | | | 0.11 | | |
| Less distributions to shareholders from: | |
| Net investment income | | | (0.27 | ) | | | (0.29 | ) | | | (0.27 | ) | | | (0.27 | ) | | | (0.27 | ) | |
| Net realized gains | | | (0.14 | ) | | | (0.02 | ) | | | (0.01 | ) | | | (0.04 | ) | | | (0.03 | ) | |
| Total distributions to shareholders | | | (0.41 | ) | | | (0.31 | ) | | | (0.28 | ) | | | (0.31 | ) | | | (0.30 | ) | |
| Proceeds from regulatory settlement | | | — | | | | — | | | | 0.00 | (a) | | | — | | | | — | | |
| Net asset value, end of period | | $ | 7.38 | | | $ | 7.64 | | | $ | 7.30 | | | $ | 6.71 | | | $ | 7.55 | | |
| Total return | | | 2.37 | % | | | 9.03 | % | | | 13.25 | % | | | (7.22 | %) | | | 1.40 | % | |
| Ratios to average net assets(b) | |
| Expenses prior to fees waived or expenses reimbursed | | | 1.69 | % | | | 1.62 | % | | | 1.61 | % | | | 1.60 | % | | | 1.61 | % | |
| Net expenses after fees waived or expenses reimbursed(c) | | | 1.27 | %(d) | | | 1.29 | %(d) | | | 1.29 | %(d) | | | 1.29 | %(d) | | | 1.28 | %(d) | |
| Net investment income | | | 3.86 | %(d) | | | 3.79 | %(d) | | | 3.91 | %(d) | | | 3.69 | %(d) | | | 3.54 | %(d) | |
| Supplemental data | |
| Net assets, end of period (in thousands) | | $ | 39,040 | | | $ | 32,080 | | | $ | 28,928 | | | $ | 21,899 | | | $ | 16,765 | | |
| Portfolio turnover | | | 28 | % | | | 12 | % | | | 14 | % | | | 12 | % | | | 12 | % | |
| Notes to Financial Highlights | |
(a) Rounds to less than $0.01.
(b) In addition to the fees and expenses which the Fund bears directly, the Fund indirectly bears a pro rata share of the fees and expenses of the acquired funds in which it invests. Such indirect expenses are not included in the reported expense ratios.
(c) The Investment Manager and certain of its affiliates agreed to waive/reimburse certain fees and expenses, if applicable.
(d) The benefits derived from expense reductions had an impact of less than 0.01%.
The Accompanying Notes to Financial Statements are an integral part of this statement.
23
Financial Highlights (continued) – Columbia California Tax-Exempt Fund
| | | Year ended Oct. 31, | |
| | | 2011 | | 2010 | | 2009 | | 2008 | | 2007 | |
| Class Z | |
| Per share data | |
| Net asset value, beginning of period | | $ | 7.64 | | | $ | 7.30 | | | $ | 6.71 | | | $ | 7.55 | | | $ | 7.74 | | |
| Income from investment operations: | |
| Net investment income | | | 0.33 | | | | 0.33 | | | | 0.32 | | | | 0.32 | | | | 0.32 | | |
| Net realized and unrealized gain (loss) | | | (0.13 | ) | | | 0.37 | | | | 0.60 | | | | (0.80 | ) | | | (0.16 | ) | |
| Total from investment operations | | | 0.20 | | | | 0.70 | | | | 0.92 | | | | (0.48 | ) | | | 0.16 | | |
| Less distributions to shareholders from: | |
| Net investment income | | | (0.32 | ) | | | (0.34 | ) | | | (0.32 | ) | | | (0.32 | ) | | | (0.32 | ) | |
| Net realized gains | | | (0.14 | ) | | | (0.02 | ) | | | (0.01 | ) | | | (0.04 | ) | | | (0.03 | ) | |
| Total distributions to shareholders | | | (0.46 | ) | | | (0.36 | ) | | | (0.33 | ) | | | (0.36 | ) | | | (0.35 | ) | |
| Proceeds from regulatory settlement | | | — | | | | — | | | | 0.00 | (a) | | | — | | | | — | | |
| Net asset value, end of period | | $ | 7.38 | | | $ | 7.64 | | | $ | 7.30 | | | $ | 6.71 | | | $ | 7.55 | | |
| Total return | | | 3.05 | % | | | 9.78 | % | | | 14.03 | % | | | (6.57 | %) | | | 2.09 | % | |
| Ratios to average net assets(b) | |
| Expenses prior to fees waived or expenses reimbursed | | | 0.70 | % | | | 0.63 | % | | | 0.62 | % | | | 0.61 | % | | | 0.63 | % | |
| Net expenses after fees waived or expenses reimbursed(c) | | | 0.59 | %(d) | | | 0.60 | %(d) | | | 0.60 | %(d) | | | 0.60 | %(d) | | | 0.60 | %(d) | |
| Net investment income | | | 4.57 | %(d) | | | 4.49 | %(d) | | | 4.61 | %(d) | | | 4.38 | %(d) | | | 4.23 | %(d) | |
| Supplemental data | |
| Net assets, end of period (in thousands) | | $ | 76,568 | | | $ | 94,541 | | | $ | 107,246 | | | $ | 107,591 | | | $ | 122,941 | | |
| Portfolio turnover | | | 28 | % | | | 12 | % | | | 14 | % | | | 12 | % | | | 12 | % | |
| Notes to Financial Highlights | |
(a) Rounds to less than $0.01.
(b) In addition to the fees and expenses which the Fund bears directly, the Fund indirectly bears a pro rata share of the fees and expenses of the acquired funds in which it invests. Such indirect expenses are not included in the reported expense ratios.
(c) The Investment Manager and certain of its affiliates agreed to waive/reimburse certain fees and expenses, if applicable.
(d) The benefits derived from expense reductions had an impact of less than 0.01%.
The Accompanying Notes to Financial Statements are an integral part of this statement.
24
Notes to Financial Statements – Columbia California Tax-Exempt Fund
October 31, 2011
Note 1. Organization
Columbia California Tax-Exempt Fund (the Fund), a series of Columbia Funds Series Trust I (the Trust), is a non-diversified fund. The Trust is registered under the Investment Company Act of 1940, as amended (the 1940 Act), as an open-end management investment company organized as a Massachusetts business trust.
The Fund's shareholders approved a change in the classification of the Fund from a diversified fund to a non-diversified fund at a meeting held on February 15, 2011.
Fund Shares
The Trust may issue an unlimited number of shares (without par value). The Fund offers Class A, Class B, Class C and Class Z shares. All share classes have identical voting, dividend and liquidation rights. Each share class has its own expense structure and sales charges, as applicable.
Class A shares are subject to a maximum front-end sales charge of 4.75% based on the initial investment amount. Class A shares purchased without an initial sales charge in accounts aggregating $1 million to $50 million at the time of purchase are subject to a contingent deferred sales charge (CDSC) if the shares are sold within 18 months of purchase, charged as follows: 1.00% CDSC if redeemed within 12 months of purchase, and 0.50% CDSC if redeemed more than 12, but less than 18, months after purchase.
Class B shares may be subject to a maximum CDSC of 5.00% based upon the holding period after purchase. Class B shares will generally convert to Class A shares eight years after purchase. The Fund no longer accepts investments by new or existing investors in the Fund's Class B shares, except in connection with the reinvestment of any dividend and/or capital gain distributions in Class B shares of the Fund and exchanges by existing Class B shareholders of certain other funds within the Columbia Family of Funds.
Class C shares are subject to a 1.00% CDSC on shares redeemed within one year of purchase.
Class Z shares are not subject to sales charges, and are only available to certain investors, as described in the Fund's prospectus.
Note 2. Summary of Significant Accounting Policies
Use of Estimates
The preparation of financial statements in accordance with U.S. generally accepted accounting principles (GAAP) requires management to make certain estimates and assumptions that affect the reported amounts of assets and liabilities, the disclosure of contingent assets and liabilities at the date of the financial statements and the reported amounts of revenue and expenses during the reporting period. Actual results could differ from those estimates.
The following is a summary of significant accounting policies consistently followed by the Fund in the preparation of its financial statements.
Security Valuation
Debt securities generally are valued by pricing services approved by the Board of Trustees (the Board) based upon market transactions for normal, institutional-size trading units of similar securities. The services may use various pricing techniques which take into account appropriate factors such as yield, quality, coupon rate, maturity, type of issue, trading characteristics and other data, as well as broker quotes. Debt securities for which quotations are readily available may also be valued based upon an over-the-counter or exchange bid quotation.
Investments in other open-end investment companies, including money market funds, are valued at net asset value.
Short-term securities purchased within 60 days to maturity are valued at amortized cost, which approximates market value. The value of short-term securities originally purchased with maturities greater than 60 days is determined based on an amortized value to par upon reaching 60 days to maturity. Short-term securities maturing in more than 60 days from the valuation date are valued at the market price or approximate market value based on current interest rates.
Investments for which market quotations are not readily available, or that have quotations which management believes are not reliable, are valued at fair value as determined in good faith under consistently applied procedures established by and under the general supervision of the Board. If a security or class of securities (such as foreign securities) is valued at fair
25
Columbia California Tax-Exempt Fund, October 31, 2011
value, such value is likely to be different from the last quoted market price for the security. The determination of fair value often requires significant judgment. To determine fair value, management may use assumptions including but not limited to future cash flows and estimated risk premiums. Multiple inputs from various sources may be used to determine value.
Delayed Delivery Securities
The Fund may trade securities on other than normal settlement terms, including securities purchased or sold on a "when-issued" basis. This may increase the risk if the other party to the transaction fails to deliver and causes the Fund to subsequently invest at less advantageous prices. The Fund identifies within its Portfolio of Investments cash or liquid securities in an amount equal to the delayed delivery commitment.
Restricted Securities
Restricted securities are securities that may only be resold upon registration under federal securities laws or in transactions exempt from registration. In some cases, the issuer of restricted securities has agreed to register such securities for resale at the issuer's expense either upon demand by the Fund or in connection with another registered offering of the securities. Many restricted securities may be resold in the secondary market in transactions exempt from registration. Such restricted securities may be determined to be liquid under criteria established by the Board. The Fund will not incur any registration costs upon such resale.
Security Transactions
Security transactions are accounted for on the trade date. Cost is determined and gains (losses) are based upon the specific identification method for both financial statement and federal income tax purposes.
Income Recognition
Interest income is recorded on the accrual basis. Market premium and discount are amortized and accreted, respectively, on all debt securities, unless otherwise noted. Original issue discount is accreted to interest income over the life of the security with a corresponding increase in the cost basis, if any.
Dividend income is recorded on the ex-date.
Expenses
General expenses of the Trust are allocated to the Fund and other funds of the Trust based upon relative net assets or other expense allocation methodologies determined by the nature of the expense. Expenses directly attributable to the Fund are charged to the Fund. Expenses directly attributable to a specific class of shares are charged to that share class.
Determination of Class Net Asset Value
All income, expenses (other than class-specific expenses, which are charged to that share class, as shown in the Statement of Operations) and realized and unrealized gains (losses) are allocated to each class of the Fund on a daily basis for purposes of determining the net asset value of each class. Income and expenses are allocated to each class based on the settled shares method, while realized and unrealized gains (losses) are allocated based on the relative net assets of each class.
Federal Income Tax Status
The Fund intends to qualify each year as a regulated investment company under Subchapter M of the Internal Revenue Code, as amended, and will distribute substantially all of its tax exempt or taxable income (including net short-term capital gains), if any, for its tax year, and as such will not be subject to federal income taxes. In addition, the Fund intends to distribute in each calendar year substantially all of its net investment income, capital gains and certain other amounts, if any, such that the Fund should not be subject to federal excise tax. Therefore, no federal income or excise tax provision is recorded.
Distributions to Shareholders
Distributions from net investment income are declared daily and paid monthly. Net realized capital gains, if any, are distributed at least annually. Income distributions and capital gain distributions are determined in accordance with federal income tax regulations which may differ from GAAP.
Guarantees and Indemnifications
Under the Trust's organizational documents and, in some cases, by contract, its officers and trustees are indemnified against certain liabilities arising out of the performance of their duties to the Trust or its funds. In addition, certain of the
26
Columbia California Tax-Exempt Fund, October 31, 2011
Fund's contracts with its service providers contain general indemnification clauses. The Fund's maximum exposure under these arrangements is unknown since the amount of any future claims that may be made against the Fund cannot be determined, and the Fund has no historical basis for predicting the likelihood of any such claims.
Recent Accounting Pronouncement
Fair Value Measurements and Disclosures
In May 2011, the Financial Accounting and Standards Board issued ASU No. 2011-04 modifying Topic 820, Fair Value Measurements and Disclosures. At the same time, the International Accounting Standards Board issued International Financial Reporting Standard 13, Fair Value Measurement. The objective of the FASB and IASB is convergence of their guidance on fair value measurements and disclosures.
Specifically, ASU No. 2011-04 requires reporting entities to disclose i) the amounts of any transfers between Level 1 and Level 2, and the reasons for the transfers, ii) for Level 3 fair value measurements, a) quantitative information about significant unobservable inputs used, b) a description of the valuation processes used by the reporting entity and c) a narrative description of the sensitivity of the fair value measurement to changes in unobservable inputs if a change in those inputs might result in a significantly higher or lower fair value measurement. The effective date of ASU No. 2011-04 is for interim and annual periods beginning after December 15, 2011. At this time, management is evaluating the implications of this guidance and the impact it will have on the financial statement amounts and footnote disclosures, if any.
Note 3. Fees and Compensation Paid to Affiliates
Investment Management Fees
Under an Investment Management Services Agreement, Columbia Management Investment Advisers, LLC (the Investment Manager), a wholly-owned subsidiary of Ameriprise Financial, Inc. (Ameriprise Financial), determines which securities will be purchased, held or sold. Effective March 1, 2011, the management fee is an annual fee that is equal to a percentage of the Fund's average daily net assets that declines from 0.40% to 0.27% as the Fund's net assets increase. Prior to March 1, 2011, the annual management fee was equal to a percentage of the Fund's pro-rata portion of the combined average daily net assets of the Fund, Columbia Connecticut Tax-Exempt Fund, Columbia Massachusetts Tax-Exempt Fund and Columbia New York Tax-Exempt Fund (collectively, combined daily net assets) at a rate that declined from 0.50% to 0.40% as the combined daily net assets increased. The effective management fee rate for the year ended October 31, 2011 was 0.43% of the Fund's average daily net assets.
Administration Fees
Under an Administrative Services Agreement, the Investment Manager serves as the Fund Administrator. Effective March 1, 2011, the Fund pays the Fund Administrator an annual fee for administration and accounting services equal to a percentage of the Fund's average daily net assets that declines from 0.07% to 0.04% as the Fund's net assets increase. Prior to March 1, 2011, the Investment Manager did not receive a fee for its services under the Administration Services Agreement. The effective administration fee rate for the year ended October 31, 2011 was 0.05% of the Fund's average daily net assets.
Pricing and Bookkeeping Fees
Prior to May 16, 2011, the Fund had entered into a Financial Reporting Services Agreement (the Financial Reporting Services Agreement) with State Street Bank and Trust Company (State Street) and the Investment Manager pursuant to which State Street provided financial reporting services to the Fund. The Fund also entered into an Accounting Services Agreement (collectively with the Financial Reporting Services Agreement, the State Street Agreements) with State Street and the Investment Manager pursuant to which State Street provided accounting services to the Fund. Under the State Street Agreements, the Fund paid State Street an annual fee of $38,000 paid monthly plus an additional monthly fee based on an annualized percentage rate of average daily net assets of the Fund for the month. The aggregate fee did not exceed $140,000 per year (exclusive of out-of-pocket expenses and charges). The Fund also reimbursed State Street for certain out-of-pocket expenses and charges. Effective May 16, 2011, these services are now provided under the Administrative Services Agreement discussed above.
27
Columbia California Tax-Exempt Fund, October 31, 2011
Compensation of Board Members
Board members are compensated for their services to the Fund as disclosed in the Statement of Operations. The Trust's eligible Trustees may participate in a Deferred Compensation Plan (the Plan) which may be terminated at any time. Obligation of the Plan will be paid solely out of the Fund's assets.
Compensation of Chief Compliance Officer
The Board has appointed a Chief Compliance Officer to the Fund in accordance with federal securities regulations. The Fund, along with other affiliated funds, pays its pro-rata share of the expenses associated with the Chief Compliance Officer. The Fund's expenses for the Chief Compliance Officer will not exceed $15,000 per year.
Transfer Agent Fees
Under a Transfer and Dividend Disbursing Agent Agreement, Columbia Management Investment Services Corp. (the Transfer Agent), an affiliate of the Investment Manager and a wholly-owned subsidiary of Ameriprise Financial, is responsible for providing transfer agency services to the Fund. The Transfer Agent has contracted with Boston Financial Data Services (BFDS) to serve as sub-transfer agent.
The Transfer Agent receives monthly account-based service fees based on the number of open accounts and is reimbursed by the Fund for the fees and expenses the Transfer Agent pays to financial intermediaries that maintain omnibus accounts with the Fund that is a percentage of the average aggregate value of the Fund's shares maintained in each such omnibus account (other than omnibus accounts for which American Enterprise Investment Services Inc. is the broker of record or accounts where the beneficial shareholder is a customer of Ameriprise Financial Services, Inc., which are paid a per account fee). The Transfer Agent pays the fees of BFDS for services as sub-transfer agent and is not entitled to reimbursement for such fees from the Fund (with the exception of out-of-pocket fees).
The Transfer Agent also receives compensation from fees for various shareholder services and reimbursements for certain out-of -pocket expenses.
For the year ended October 31, 2011, the Fund's effective transfer agent fee rates as a percentage of average daily net assets of each class were as follows:
| Class A | | | 0.11 | % | |
| Class B | | | 0.12 | | |
| Class C | | | 0.12 | | |
| Class Z | | | 0.12 | | |
An annual minimum account balance fee of $20 may apply to certain accounts with a value below the Fund's initial minimum investment requirements to reduce the impact of small accounts on transfer agent fees. These minimum account balance fees are recorded as part of expense reductions in the Statement of Operations. For the year ended October 31, 2011, these minimum account balance fees reduced total expenses by $980.
In connection with the acquisition of Seligman California Municipal High-Yield Fund and Seligman California Municipal Quality Fund (see Note 10), the Fund assumed the assets and obligations of Seligman California Municipal High-Yield Fund and Seligman California Municipal Quality Fund, which together with certain other associated investment companies (together, the Guarantors), have severally, but not jointly, guaranteed the performance and observance of all the terms and conditions of a lease entered into by Seligman Data Corp. (SDC), the former transfer agent, including the payment of rent by SDC (the Guaranty). The lease and the Guaranty expire in January 2019. At October 31, 2011, the Fund's total potential future obligation over the life of the Guaranty is $88,972. The liability remaining at October 31, 2011 for non-recurring charges associated with the lease amounted to $58,407 and is included within other accrued expenses in the Statement of Assets and Liabilities.
Distribution and Service Fees
The Fund has an agreement with Columbia Management Investment Distributors, Inc. (the Distributor), an affiliate of the Investment Manager and a wholly-owned subsidiary of Ameriprise Financial, for distribution and shareholder services. Pursuant to Rule 12b-1 under the 1940 Act, the Board has approved, and the Fund has adopted, distribution and shareholder service plans (the Plans) which set the distribution and service fees for the Fund. These fees are
28
Columbia California Tax-Exempt Fund, October 31, 2011
calculated daily and are intended to compensate the Distributor and/or eligible selling and/or servicing agents for selling shares of the Fund and providing services to investors.
Effective July 1, 2011, the Plans require the payment of a monthly service fee to the Distributor at the maximum annual rate of 0.25% of the average daily net assets attributable to Class A, Class B and Class C shares of the Fund. Prior to July 1, 2011, the Fund paid a monthly service fee to the Distributor which was equal to 0.10% annually of the net assets attributable to shares of the Fund issued prior to December 1, 1994 and 0.25% annually of the net assets attributable to shares issued thereafter. The arrangement resulted in an annual rate of service fee for all shares that was a blend between the 0.10% and 0.25% rates. For the period November 1, 2010 through October 31, 2011, the Fund's annualized effective service fee rate was 0.25% of the Fund's average daily net assets attributable to Class A, Class B and Class C shares.
The Plans also require the payment of a monthly distribution fee to the Distributor at the maximum annual rate of 0.75% of the average daily net assets attributable to Class B and Class C shares only.
The Distributor has voluntarily agreed to waive a portion of the distribution fee for Class C shares so that the combined distribution and service fee does not exceed 0.45% annually of the average daily net assets attributable to Class C shares. This arrangement may be modified or terminated by the Distributor at any time.
Sales Charges
Sales charges, including front-end charges and CDSCs, received by the Distributor for distributing Fund shares were $102,429 for Class A, $379 for Class B and $1,501 for Class C shares for the year ended October 31, 2011.
Expenses Waived/Reimbursed by the Investment Manager and its Affiliates
Effective March 1, 2011, the Investment Manager and certain of its affiliates have contractually agreed to waive fees and/or reimburse expenses (excluding certain fees and expenses described below as well as any reorganization costs allocated to the Fund), through February 29, 2012, unless sooner terminated at the sole discretion of the Board, so that the Fund's net operating expenses, after giving effect to fees waived/expenses reimbursed and any balance credits and/or overdraft charges from the Fund's custodian, do not exceed the following annual rates as a percentage of the class' average daily net assets:
| Class A | | | 0.79 | % | |
| Class B | | | 1.54 | | |
| Class C | | | 1.54 | | |
| Class Z | | | 0.55 | | |
Under the agreement, the following fees and expenses are excluded from the waiver/reimbursement commitment, and therefore will be paid by the Fund, if applicable: taxes (including foreign transaction taxes), expenses associated with investments in affiliated and non-affiliated pooled investment vehicles (including mutual funds and exchange traded funds), transaction costs and brokerage commissions, costs related to any securities lending program, dividend expenses associated with securities sold short, inverse floater program fees and expenses, transaction charges and interest on borrowed money, interest, extraordinary expenses and any other expenses the exclusion of which is specifically approved by the Board. This agreement may be modified or amended only with approval from all parties. Class C distribution fees waived by the Distributor, as discussed above, are in addition to the waiver/reimbursement commitment under the agreement. Reorganization (see Note 10) costs were allocated to the Fund only to the extent they are expected to be offset by the anticipated reduction in expenses borne by the Fund's shareholders during the first year following the Reorganization.
Prior to March 1, 2011, the Investment Manager voluntarily agreed to reimburse a portion of the Fund's expenses (excluding certain expenses, such as distribution and services fees, brokerage commissions, interest, taxes and extraordinary expenses, but including custodian charges relating to overdrafts, if any) so that the Fund's ordinary net operating expenses, after giving effect to fees waived/expenses reimbursed and any balance credits and/or overdraft charges from the Fund's custodian, did not exceed 0.60% of the Fund's average daily net assets on an annualized basis.
29
Columbia California Tax-Exempt Fund, October 31, 2011
Note 4. Federal Tax Information
The timing and character of income and capital gain distributions are determined in accordance with income tax regulations, which may differ from GAAP because of temporary or permanent book to tax differences.
For the year ended October 31, 2011, permanent differences are primarily due to differing treatments for market discount accretion/premium amortization on debt securities and distributions. To the extent these differences are permanent; reclassifications are made among the components of the Fund's net assets in the Statement of Assets and Liabilities. Temporary differences do not require reclassifications. In the Statement of Assets and Liabilities the following reclassifications were made:
| Undistributed net investment income | | $ | (186,872 | ) | |
| Accumulated net realized loss | | | 303,556 | | |
| Paid-in capital | | | (116,684 | ) | |
Net investment income and net realized gains (losses), as disclosed in the Statement of Operations, and net assets were not affected by this reclassification.
The tax character of distributions paid during the years indicated was as follows:
| Year ended October 31, | | 2011 | | 2010 | |
| Tax Exempt Income | | $ | 18,108,130 | | | $ | 16,683,892 | | |
| Ordinary Income | | | 202,635 | | | | 85,984 | | |
| Long Term Capital Gains | | | 6,582,928 | | | | 1,250,021 | | |
Short-term capital gain distributions, if any, are considered ordinary income distributions for tax purposes.
At October 31, 2011, the components of distributable earnings on a tax basis were as follows:
| Undistributed tax-exempt income | | $ | 1,912,209 | | |
| Unrealized appreciation | | | 17,608,834 | | |
At October 31, 2011, the cost of investments for federal income tax purposes was $502,954,498 and the aggregate gross unrealized appreciation and depreciation based on that cost was:
| Unrealized appreciation | | $ | 25,026,331 | | |
| Unrealized depreciation | | $ | (7,417,497 | ) | |
| Net unrealized appreciation | | $ | 17,608,834 | | |
The following capital loss carryforward, determined at October 31, 2011, may be available to reduce taxable income arising from future net realized gains on investments, if any, to the extent permitted by the Internal Revenue Code:
| Year of Expiration | | Amount | |
| 2015 | | $ | 44,686 | | |
| 2016 | | | 1,247,347 | | |
| 2017 | | | 421,820 | | |
| 2019 | | | 60,084 | | |
| Total | | $ | 1,773,937 | | |
On December 22, 2010, the Regulated Investment Company Modernization Act of 2010 (the Act) was enacted, which changed various technical rules governing the tax treatment of regulated investment companies. The changes are generally effective for taxable years beginning after the date of enactment. Under the Act, the Fund will be permitted to carry forward capital losses incurred in taxable years beginning after the date of enactment for an unlimited period. However, any losses incurred during those future taxable years will be required to be utilized prior to the losses incurred in pre-enactment taxable years, which carry an expiration date. As a result of this ordering rule, pre-enactment capital loss carryforwards may be more likely to expire unused.
Management of the Fund has concluded that there are no significant uncertain tax positions that would require recognition in the financial statements. However, management's conclusion may be subject to review and adjustment at a later date based on factors including, but not limited to, new tax laws, regulations, and administrative interpretations (including relevant court decisions). Generally, the Fund's federal tax returns for the prior three fiscal years remain subject to examination by the Internal Revenue Service.
30
Columbia California Tax-Exempt Fund, October 31, 2011
Note 5. Portfolio Information
The cost of purchases and proceeds from sales of securities, excluding short-term obligations, aggregated to $114,422,566 and $160,498,511, respectively, for the year ended October 31, 2011.
Note 6. Lending of Portfolio Securities
Effective May 16, 2011, the Fund has entered into a Master Securities Lending Agreement (the Agreement) with JPMorgan Chase Bank, N.A. (JPMorgan). The Agreement, which replaces the previous security lending arrangement with State Street, authorizes JPMorgan as lending agent to lend securities to authorized borrowers in order to generate additional income on behalf of the Fund. Pursuant to the Agreement, the securities loaned are secured by cash or U.S. government securities equal to at least 100% of the market value of the loaned securities. Any additional collateral required to maintain those levels due to market fluctuations of the loaned securities is delivered the following business day. Cash collateral received is invested by the lending agent on behalf of the Fund into authorized investments pursuant to the Agreement. The investments made with the cash collateral are listed in the Portfolio of Investments. The values of such investments and any uninvested cash collateral are disclosed in the Statement of Assets and Liabilities along with the related obligation to return the collateral upon the return of the securities loaned. At October 31, 2011, the Fund did not participate in securities lending activity.
Risks of delay in recovery of securities or even loss of rights in the securities may occur should the borrower of the securities fail financially. Risks may also arise to the extent that the value of the securities loaned increases above the value of the collateral received. JPMorgan will indemnify the Fund from losses resulting from a borrower's failure to return a loaned security when due. Such indemnification does not extend to losses associated with declines in the value of cash collateral investments. The Investment Manager is not responsible for any losses incurred by the Fund in connection with the securities lending program. Loans are subject to termination by the Fund or the borrower at any time, and are, therefore, not considered to be illiquid investments.
Pursuant to the Agreement, the Fund receives income for lending its securities either in the form of fees or by earning interest on invested cash collateral, net of negotiated rebates paid to borrowers and fees paid to the lending agent for services provided and any other securities lending expenses. The Fund continues to earn and accrue interest and dividends on the securities loaned.
Prior to May 16, 2011, the Fund participated in a securities lending arrangement with State Street. Each security on loan was collateralized in an amount at least equal to the market value of the securities loaned plus accrued income from the investment of collateral. The income generated by the investment of the collateral, net of any fees remitted to State Street as the lending agent and borrower rebates, was paid to the Fund.
Note 7. Custody Credits
Prior to May 16, 2011, the Fund had an agreement with its custodian bank under which custody fees may have been reduced by balance credits. These credits are recorded as part of expense reductions on the Statement of Operations. The Fund could have invested a portion of the assets utilized in connection with the expense offset arrangement in an income-producing asset if they had not entered into such an agreement. For the period November 1, 2010 through May 16, 2011, these credits reduced total expenses by $11.
Note 8. Shareholder Concentration
At October 31, 2011, one shareholder account owned 26.8% of the outstanding shares of the Fund. Subscription and redemption activity of this account may have a significant effect on the operations of the Fund.
Note 9. Line of Credit
The Fund has entered into a revolving credit facility with a syndicate of banks led by JPMorgan Chase Bank, N.A. (the Administrative Agent), whereby the Fund may borrow for the temporary funding of shareholder redemptions or for other temporary or emergency purposes. The credit facility became effective on May 16, 2011, replacing a prior credit facility. The credit facility agreement which is a collective agreement between the Fund and certain other funds managed by the Investment Manager, severally and not jointly, permits collective borrowings up to $500,000,000.
Interest is charged to each participating fund based on its borrowings at a rate equal to the sum of the federal funds rate plus (i) 1.25% per annum plus (ii) if one-month LIBOR exceeds the federal funds rate, the amount of such excess.
31
Columbia California Tax-Exempt Fund, October 31, 2011
Each borrowing under the credit facility matures no later than 60 days after the date of borrowing. The Fund also pays a commitment fee equal to its pro rata share of the amount of the credit facility at a rate of 0.10% per annum.
For the period March 28, 2011 through May 15, 2011, the Fund and certain other funds managed by the Investment Manager participated in a $225,000,000 committed, unsecured revolving credit facility provided by State Street. Prior to March 28, 2011, the collective borrowing amount of the credit facility was $280,000,000. Interest was charged to each fund based on its borrowings at a rate equal to the greater of the (i) federal funds rate plus 1.25% per annum or (ii) the overnight LIBOR rate plus 1.25% per annum. The Fund also paid a commitment fee equal to its pro rata share of the amount of the credit facility at a rate of 0.125% per annum.
Effective December 13, 2011, the Fund extended its revolving credit facility with the Administrative Agent. The credit facility agreement, as amended, permits collective borrowings up to $500 million. Effective December 13, 2011, interest is charged to each participating fund based on its borrowings at a rate equal to the higher of (i) the overnight federal funds rate plus 1.00% or (i) the one-month LIBOR rate plus 1.00%. Each borrowing under the credit facility matures no later than 60 days after the date of borrowing. The Fund also pays a commitment fee equal to its pro rata share of the amount of the credit facility at a rate of 0.08% per annum.
The Fund had no borrowings during the year ended October 31, 2011.
Note 10. Fund Merger
At the close of business on June 3, 2011, the Fund acquired the assets and assumed the identified liabilities of RiverSource California Tax-Exempt Fund, a series of RiverSource California Tax-Exempt Trust, Seligman California Municipal High-Yield Fund, a series of Seligman Municipal Series Trust, and Seligman California Municipal Quality Fund, a series of Seligman Municipal Series Trust. The mergers were completed after shareholders of the acquired funds approved the plan on February 15, 2011.
The aggregate net assets of the Fund immediately before the acquisitions were $332,108,133 and the combined net assets immediately after the acquisitions were $523,831,818.
The acquisitions were accomplished by a tax-free exchange of 27,173,603 shares of RiverSource California Tax-Exempt Fund valued at $131,803,028 (including unrealized depreciation of $1,951,895); 4,558,463 shares of Seligman California Municipal High-Yield Fund valued at $28,374,254 (including unrealized depreciation of $309,020) and 5,050,016 shares of Seligman California Municipal Quality Fund valued at $31,546,403 (including unrealized appreciation of $335,251).
In exchange for shares of RiverSource California Tax-Exempt Fund, Seligman California Municipal High-Yield Fund and Seligman California Municipal Quality Fund, the Fund issued the following number of shares:
| | | RiverSource
California
Tax-Exempt
Fund | | Seligman
California
Municipal
High-Yield
Fund | | Seligman
California
Municipal
Quality
Fund | |
| Class A | | | 17,755,478 | | | | 3,261,658 | | | | 4,075,493 | | |
| Class B | | | 218,017 | | | | — | | | | — | | |
| Class C | | | 408,374 | | | | 693,938 | | | | 324,976 | | |
For financial reporting purposes, net assets received and shares issued by the Fund were recorded at fair value; however, RiverSource California Tax-Exempt Fund, Seligman California Municipal High-Yield Fund, and Seligman California Municipal Quality Fund's cost of investments were carried forward to align ongoing reporting of the Fund's realized and unrealized gains and losses with amounts distributable to shareholders for tax purposes.
The financial statements reflect the operations of the Fund for the period prior to the mergers and the combined fund for the period subsequent to the mergers. Because the combined investment portfolios have been managed as a single integrated portfolio since the mergers were completed, it is not practicable to separate the amounts of revenue and earnings of RiverSource California Tax-Exempt Fund, Seligman California Municipal High-Yield Fund and Seligman California Municipal Quality Fund that have been included in the combined Fund's Statement of Operations since the mergers were completed.
Assuming the mergers had been completed on November 1, 2010, the Fund's pro-forma net investment income (loss), net
32
Columbia California Tax-Exempt Fund, October 31, 2011
gain (loss) on investments, net change in unrealized appreciation (depreciation) and net increase in net assets from operations for the year ended October 31, 2011 would have been approximately $23.2 million, $0.3 million, $(15.0) million and $8.5 million, respectively.
Note 11. Significant Risks
Non-Diversification Risk
A non-diversified fund is permitted to invest a greater percentage of its total assets in fewer companies than a diversified fund. The Fund may, therefore, have a greater risk of loss from a few issuers than a similar fund that invests more broadly.
Geographic Concentration Risk
Because state-specific tax-exempt funds invest primarily in the municipal securities issued by the state and political sub-divisions of the state, the Fund will be particularly affected by political and economic conditions and developments in the state in which it invests. The Fund may, therefore, have a greater risk than that of a municipal bond fund which is more geographically diversified. The value of the municipal securities owned by the Fund also may be adversely affected by future changes in federal or state income tax laws.
Tax Development Risk
The Fund purchases municipal securities whose interest, in the opinion of bond counsel, is free from federal income tax. There is no assurance that the Internal Revenue Service (IRS) will agree with this opinion. In the event the IRS determines that an issuer does not comply with relevant tax requirements, interest payments from a security could become federally taxable, possibly retroactively to the date the security was issued. As a shareholder of the Fund, you may be required to file an amended tax return as a result.
Sector Focus Risk
The Fund may focus its investments in certain sectors, subjecting it to greater risk than a fund that that invests in a wider range of industries.
Note 12. Subsequent Events
Management has evaluated the events and transactions that have occurred through the date the financial statements were issued. Other than as noted in Note 9 above, there were no items requiring adjustment of the financial statements or additional disclosure.
Note 13. Information Regarding Pending and Settled Legal Proceedings
In June 2004, an action captioned John E. Gallus et al. v. American Express Financial Corp. and American Express Financial Advisors Inc. was filed in the United States District Court for the District of Arizona. The plaintiffs allege that they are investors in several American Express Company mutual funds (branded as Columbia) and they purport to bring the action derivatively on behalf of those funds under the Investment Company Act of 1940. The plaintiffs allege that fees allegedly paid to the defendants by the funds for investment advisory and administrative services are excessive. The plaintiffs seek remedies including restitution and rescission of investment advisory and distribution agreements. The plaintiffs voluntarily agreed to transfer this case to the United States District Court for the District of Minnesota (the District Court). In response to defendants' motion to dismiss the complaint, the District Court dismissed one of plaintiffs' four claims and granted plaintiffs limited discovery. Defendants moved for summary judgment in April 2007. Summary judgment was granted in the defendants' favor on July 9, 2007. The plaintiffs filed a notice of appeal with the Eighth Circuit Court of Appeals (the Eighth Circuit) on August 8, 2007. On April 8, 2009, the Eighth Circuit reversed summary judgment and remanded to the District Court for further proceedings. On August 6, 2009, defendants filed a writ of certiorari with the U.S. Supreme Court (the Supreme Court), asking the Supreme Court to stay the District Court proceedings while the Supreme Court considers and rules in a case captioned Jones v. Harris Associates, which involves issues of law similar to those presented in the Gallus case. On March 30, 2010, the Supreme Court issued its ruling in Jones v. Harris Associates, and on April 5, 2010, the Supreme Court vacated the Eighth Circuit's decision in the Gallus case and remanded the case to the Eighth Circuit for further consideration in light of the Supreme Court's decision in Jones v. Harris Associates. On June 4, 2010, the Eighth
33
Columbia California Tax-Exempt Fund, October 31, 2011
Circuit remanded the Gallus case to the District Court for further consideration in light of the Supreme Court's decision in Jones v. Harris Associates. On December 9, 2010, the District Court reinstated its July 9, 2007 summary judgment order in favor of the defendants. On January 10, 2011, plaintiffs filed a notice of appeal with the Eighth Circuit. In response to the plaintiffs' opening appellate brief filed on March 18, 2011, the defendants filed a response brief on May 4, 2011 with the Eighth Circuit. The plaintiffs filed a reply brief on May 26, 2011 and oral arguments took place on November 17, 2011.
In December 2005, without admitting or denying the allegations, American Express Financial Corporation (AEFC, which is now known as Ameriprise Financial, Inc. (Ameriprise Financial)), entered into settlement agreements with the Securities and Exchange Commission (SEC) and Minnesota Department of Commerce (MDOC) related to market timing activities. As a result, AEFC was censured and ordered to cease and desist from committing or causing any violations of certain provisions of the Investment Advisers Act of 1940, the Investment Company Act of 1940, and various Minnesota laws. AEFC agreed to pay disgorgement of $10 million and civil money penalties of $7 million. AEFC also agreed to retain an independent distribution consultant to assist in developing a plan for distribution of all disgorgement and civil penalties ordered by the SEC in accordance with various undertakings detailed at www.sec.gov/litigation/admin/ia-2451.pdf. Ameriprise Financial and its affiliates have cooperated with the SEC and the MDOC in these legal proceedings, and have made regular reports to the funds' Boards of Trustees.
Ameriprise Financial and certain of its affiliates have historically been involved in a number of legal, arbitration and regulatory proceedings, including routine litigation, class actions, and governmental actions, concerning matters arising in connection with the conduct of their business activities. Ameriprise Financial believes that the Funds are not currently the subject of, and that neither Ameriprise Financial nor any of its affiliates are the subject of, any pending legal, arbitration or regulatory proceedings that are likely to have a material adverse effect on the Funds or the ability of Ameriprise Financial or its affiliates to perform under their contracts with the Funds. Ameriprise Financial is required to make 10-Q, 10-K and, as necessary, 8-K filings with the Securities and Exchange Commission on legal and regulatory matters that relate to Ameriprise Financial and its affiliates. Copies of these filings may be obtained by accessing the SEC website at www.sec.gov.
There can be no assurance that these matters, or the adverse publicity associated with them, will not result in increased fund redemptions, reduced sale of fund shares or other adverse consequences to the Funds. Further, although we believe proceedings are not likely to have a material adverse effect on the Funds or the ability of Ameriprise Financial or its affiliates to perform under their contracts with the Funds, these proceedings are subject to uncertainties and, as such, we are unable to estimate the possible loss or range of loss that may result. An adverse outcome in one or more of these proceedings could result in adverse judgments, settlements, fines, penalties or other relief that could have a material adverse effect on the consolidated financial condition or results of operations of Ameriprise Financial.
34
Report of Independent Registered Public Accounting Firm
To the Trustees of Columbia Funds Series Trust I and the Shareholders of Columbia California Tax-Exempt Fund
In our opinion, the accompanying statement of assets and liabilities, including the investment portfolio, and the related statements of operations and of changes in net assets and the financial highlights present fairly, in all material respects, the financial position of Columbia California Tax-Exempt Fund (the "Fund") (a series of Columbia Funds Series Trust I) at October 31, 2011, and the results of its operations for the year then ended, the changes in its net assets for each of the two years in the period then ended and the financial highlights for each of the periods indicated, in conformity with accounting principles generally accepted in the United States of America. These financial statements and financial highlights (hereafter referred to as "financial statements") are the responsibility of the Fund's management. Our responsibility is to express an opinion on these financial statements based on our audits. We conducted our audits of these financial statements in accordance with the standards of the Public Company Accounting Oversight Board (United States). Those standards require that we plan and perform the audit to obtain reasonable assurance about whether the financial statements are free of material misstatement. An audit includes examining, on a test basis, evidence supporting the amounts and disclosures in the financial statements, assessing the accounting principles used and significant estimates made by management, and evaluating the overall financial statement presentation. We believe that our audits, which included confirmation of securities at October 31, 2011 by correspondence with the custodian and brokers, provide a reasonable basis for our opinion.
PricewaterhouseCoopers LLP
Minneapolis, Minnesota
December 22, 2011
35
Federal Income Tax Information (Unaudited) – Columbia California Tax-Exempt Fund
For the fiscal year ended October 31, 2011, 98.90% of the distributions from net investment income of the Fund qualifies as exempt interest dividends for federal income tax purposes. A portion of the income may be subject to federal alternative minimum tax.
The Fund will notify shareholders in January 2012 of amounts for use in preparing 2011 income tax returns.
36
Fund Governance
The Trustees serve terms of indefinite duration. The names, addresses and birth years of the Trustees and Officers of the Funds in Columbia Funds Series Trust I, the year each was first elected or appointed to office, their principal business occupations during at least the last five years, the number of Funds overseen by each Trustee and other directorships they hold are shown below. Each officer listed below serves as an officer of each Fund in Columbia Funds Series Trust I.
Independent Trustees
Name, Address and Year of Birth,
Position with Funds, Year First
Elected or Appointed to Office | | Principal Occupation(s) During Past Five Years, Number of Funds in Columbia
Funds Complex Overseen by Trustee, Other Directorships Held
| |
| Rodman L. Drake (Born 1943) | |
|
c/o Columbia Management
Investment Advisers, LLC
225 Franklin Street
Boston, MA 02110
Trustee (since 1994) and Chairman of the Board (since 2009) | | Independent consultant since 2010; Co-Founder of Baringo Capital LLC (private equity) from 1997 to 2008; CEO of Crystal River Capital, Inc. (real estate investment trust) from 2003 to 2010; Oversees 43; Jackson Hewitt Tax Service Inc. (tax preparation services from 2004 to 2011); Celgene Corporation (global biotechnology company); Student Loan Corporation (student loan provider from 2008 to 2010); Celgene Corporation (global biotechnology company); The Helios Funds and Brookfield Funds (closed-end funds); Crystal River Capital, Inc. from 2005 to 2010; Parson Brinckerhoff from 1995 to 2008; and Apex Silver Mines Ltd. from 2007 to 2009 | |
|
| Douglas A. Hacker (Born 1955) | |
|
c/o Columbia Management
Investment Advisers, LLC
225 Franklin Street
Boston, MA 02110
Trustee (since 1996) | | Independent business executive since May 2006; Executive Vice President—Strategy of United Airlines from December 2002 to May 2006; President of UAL Loyalty Services (airline marketing company) from September 2001 to December 2002; Executive Vice President and Chief Financial Officer of United Airlines from July 1999 to September 2001. Oversees 43; Nash Finch Company (food distributor); Aircastle Limited (aircraft leasing); and SeaCube Container Leasing Ltd (container leasing) | |
|
| Janet Langford Kelly (Born 1957) | |
|
c/o Columbia Management
Investment Advisers, LLC
225 Franklin Street
Boston, MA 02110
Trustee (since 1996) | | Senior Vice President, General Counsel and Corporate Secretary, ConocoPhillips (integrated energy company) since September 2007; Deputy General Counsel—Corporate Legal Services, ConocoPhillips from August 2006 to August 2007; Partner, Zelle, Hofmann, Voelbel, Mason & Gette LLP (law firm) from March 2005 to July 2006; Adjunct Professor of Law, Northwestern University, from September 2004 to June 2006; Director, UAL Corporation (airline) from February 2006 to July 2006; Oversees 43; None | |
|
| Nancy T. Lukitsh (Born 1956) | |
|
c/o Columbia Management
Investment Advisers, LLC
225 Franklin Street
Boston, MA 02110
Trustee (since 2011) | | Senior Vice President, Partner and Director, Marketing of Wellington Management Company, LLP (investment adviser) from 1997 to 2010; Chair, Wellington Management Investment Portfolios (commingled non-U.S. investment pools) from 2007 to 2010; Director, Wellington Trust Company, NA and other Wellington affiliates from 1997 to 2010. Oversees 43; None | |
|
37
Fund Governance (continued)
Independent Trustees (continued)
Name, Address and Year of Birth,
Position with Funds, Year First
Elected or Appointed to Office | | Principal Occupation(s) During Past Five Years, Number of Funds in Columbia
Funds Complex Overseen by Trustee, Other Directorships Held
| |
| William E. Mayer (Born 1940) | |
|
c/o Columbia Management
Investment Advisers, LLC
225 Franklin Street
Boston, MA 02110
Trustee (since 1994) | | Partner, Park Avenue Equity Partners (private equity) since February 1999; Dean and Professor, College of Business and Management, University of Maryland from 1992 to 1996. Oversees 43; DynaVox Inc. (speech creation); Lee Enterprises (print media); WR Hambrecht + Co. (financial service provider); BlackRock Kelso Capital Corporation (investment company) | |
|
| David M. Moffett (Born 1952) | |
|
c/o Columbia Management
Investment Advisers, LLC
225 Franklin Street
Boston, MA 02110
Trustee (since 2011) | | Retired. Chief Executive Officer, Federal Home Loan Mortgage Corporation, from 2008 to 2009; Senior Adviser, Global Financial Services Group, Carlyle Group, Inc., from 2007 to 2008; Vice Chairman and Chief Financial Officer, U.S. Bancorp, from 1993 to 2007. Oversees 43; CIT Group Inc. (commercial and consumer finance), eBay Inc. (online trading community), MBIA Corp (financial service provider), E.W. Scripps Co. (print and television media), Building Materials Holding Corp. (building materials and construction services), and University of Oklahoma Foundation. | |
|
| Charles R. Nelson (Born 1942) | |
|
c/o Columbia Management
Investment Advisers, LLC
225 Franklin Street
Boston, MA 02110
Trustee (since 1981) | | Retired Professor Emeritus, University of Washington, since 2011; Professor of Economics, University of Washington, from January 1976 to 2011; Ford and Louisa Van Voorhis Professor of Political Economy, University of Washington, from 1993 to 2011; Adjunct Professor of Statistics, University of Washington, from 1980 to 2011; Associate Editor, Journal of Money Credit and Banking from 1993 to 2008; consultant on econometric and statistical matters. Oversees 43; None | |
|
| John J. Neuhauser (Born 1943) | |
|
c/o Columbia Management
Investment Advisers, LLC
225 Franklin Street
Boston, MA 02110
Trustee (since 1984) | | President, Saint Michael's College, since August 2007; Director or Trustee of several non-profit organizations, including Fletcher Allen Health Care, Inc.; University Professor, Boston College from November 2005 to August 2007; Academic Vice President and Dean of Faculties, Boston College from August 1999 to October 2005. Oversees 43; Liberty All-Star Equity Fund and Liberty All-Star Growth Fund (closed-end funds) | |
|
| Patrick J. Simpson (Born 1944) | |
|
c/o Columbia Management
Investment Advisers, LLC
225 Franklin Street
Boston, MA 02110
Trustee (since 2000) | | Partner, Perkins Coie LLP (law firm). Oversees 43; None | |
|
| Anne-Lee Verville (Born 1945) | |
|
c/o Columbia Management
Investment Advisers, LLC
225 Franklin Street
Boston, MA 02110
Trustee (since 1998) | | Retired since 1997 (formerly General Manager–Global Education Industry from 1994 to 1997, President–Application Systems Division from 1991 to 1994, Chief Financial Officer–US Marketing & Services from 1988 to 1991, and Chief Information Officer from 1987 to 1988, IBM Corporation (computer and technology)). Oversees 43; Enesco Group, Inc. (producer of giftware and home and garden decor products) from 2001 to 2006 | |
|
38
Fund Governance (continued)
Interested Trustee
Name, Address and Year of Birth,
Position with Funds, Year First
Elected or Appointed to Office | | Principal Occupation(s) During Past Five Years, Number of Funds in Columbia
Funds Complex Overseen by Trustee, Other Directorships Held
| |
| Michael A. Jones (born 1959) | |
|
c/o Columbia Management
Investment Advisers, LLC
225 Franklin Street
Boston, MA 02110
Trustee (since 2011)
Senior Vice President (since 2011) | | President and Director, Columbia Management Investment Advisers, LLC since May 2010; President and Director, Columbia Management Investment Distributors, Inc. since May 2010; Manager, Chairman, Chief Executive Officer and President, Columbia Management Advisors, LLC from 2007 to April 2010; Chief Executive Officer, President and Director, Columbia Management Distributors, Inc. from November 2006 to April 2010; previously, co-president and senior managing director at Robeco Investment Management. Oversees 43; None | |
|
The Statement of Additional Information includes additional information about the Trustees of the Funds and is available, without charge, upon request by calling 1-800-345-6611.
Officers
| Name, Year of Birth and Address | | Principal Occupation(s) During the Past Five Years | |
| J. Kevin Connaughton (Born 1964) | |
|
225 Franklin Street
Boston, MA 02110
President (since 2009) | | Senior Vice President and General Manager–Mutual Fund Products, Columbia Management Investment Advisers, LLC since May 2010; President, Columbia Funds, since 2009, and RiverSource Funds, since May 2010 (previously Senior Vice President and Chief Financial Officer, Columbia Funds, from June 2008 to January 2009, Treasurer, Columbia Funds, from October 2003 to May 2008, and senior officer of various other affiliated funds since 2000); Managing Director, Columbia Management Advisors, LLC from December 2004 to April 2010. | |
|
| Michael G. Clarke (Born 1969) | |
|
225 Franklin Street
Boston, MA 02110
Treasurer (since 2011) and Chief
Financial Officer (since 2009) | | Vice President, Columbia Management Investment Advisers, LLC since May 2010; Managing Director of Fund Administration, Columbia Management Advisors, LLC, from September 2004 to April 2010; senior officer of Columbia Funds and affiliated funds since 2002. | |
|
| Scott R. Plummer (Born 1959) | |
|
5228 Ameriprise Financial Center
Minneapolis, MN 55474
Senior Vice President, Assistant Secretary
and Chief Legal Officer (since 2010) | | Chief Legal Officer and Assistant Secretary, Columbia Management Investment Advisers, LLC since June 2005; Vice President and Lead Chief Counsel–Asset Management, Ameriprise Financial, Inc. since May 2010 (previously Vice President and Chief Counsel–Asset Management, from 2005 to April 2010, and Vice President–Asset Management Compliance from 2004 to 2005); Vice President, Chief Counsel and Assistant Secretary, Columbia Management Investment Distributors, Inc. since 2008; Vice President, General Counsel and Secretary, Ameriprise Certificate Company since 2005; Chief Counsel, RiverSource Distributors, Inc. since 2006; Vice President, General Counsel and Secretary, RiverSource Funds, since December 2006; Senior Vice President, Secretary and Chief Legal Officer, Columbia Funds, since May 2010. | |
|
39
Fund Governance (continued)
Officers (continued)
| Name, Year of Birth and Address | | Principal Occupation(s) During the Past Five Years | |
| Linda J. Wondrack (Born 1964) | |
|
225 Franklin Street
Boston, MA 02110
Senior Vice President and Chief
Compliance Officer (since 2007) | | Vice President and Chief Compliance Officer, Columbia Management Investment Advisers, LLC since May 2010; Chief Compliance Officer, Columbia Funds, since 2007, and RiverSource Funds, since May 2010; Director (Columbia Management Group, LLC and Investment Product Group Compliance), Bank of America, from June 2005 to April 2010; Director of Corporate Compliance and Conflicts Officer of MFS Investment Management (investment management) from August 2004 to May 2005. | |
|
| William F. Truscott (Born 1960) | |
|
53600 Ameriprise Financial Center
Minneapolis, MN 55474
Senior Vice President (since 2010) | | Chairman of the Board, Columbia Management Investment Advisers, LLC since May 2010 (previously President, Chairman of the Board and Chief Investment Officer, from 2001 to April 2010); Chief Executive Officer, U.S. Asset Management & President, Annuities, Ameriprise Financial, Inc. since May 2010 (previously President–U.S. Asset Management and Chief Investment Officer from 2005 to April 2010, and Senior Vice President—Chief Investment Officer, from 2001 to 2005); Director, President and Chief Executive Officer, Ameriprise Certificate Company since 2006; Director, Columbia Management Investment Distributors, Inc. since May 2010 (previously Chairman of the Board and Chief Executive Officer from 2008 to April 2010); Chairman of the Board and Chief Executive Officer, RiverSource Distributors, Inc. since 2006. | |
|
| Colin Moore (Born 1958) | |
|
225 Franklin Street
Boston, MA 02110
Senior Vice President (since 2010) | | Director and Chief Investment Officer, Columbia Management Investment Advisers, LLC since May 2010; Manager, Managing Director and Chief Investment Officer of Columbia Management Advisors, LLC from 2007 to April 2010; Head of Equities, Columbia Management Advisors, LLC from 2002 to 2007. | |
|
| Amy Johnson (Born 1965) | |
|
5228 Ameriprise Financial Center
Minneapolis, MN 55474
Vice President (since 2010) | | Senior Vice President and Chief Operating Officer, Columbia Management Investment Advisers, LLC since May 2010 (previously Chief Administrative Officer, from 2009 until April 2010, Vice President—Asset Management and Trust Company Services, from 2006 to 2009, and Vice President—Operations and Compliance from 2004 to 2006). | |
|
| Joseph F. DiMaria (Born 1968) | |
|
225 Franklin Street
Boston, MA 02110
Vice President (since 2011) and
Chief Accounting Officer (since 2008) | | Vice President, Mutual Fund Administration, Columbia Management Investment Advisers, LLC, since May 2010; Director of Fund Administration, Columbia Management Advisors, LLC from January 2006 to April 2010; Head of Tax/Compliance and Assistant Treasurer, Columbia Management Advisors, LLC, from November 2004 to December 2005. | |
|
| Stephen T. Welsh (born 1957) | |
|
225 Franklin Street
Boston, MA 02110
Vice President (since 2006) | | President and Director, Columbia Management Investment Services Corp. since May 2010; President and Director, Columbia Management Services, Inc. from July 2004 to April 2010; Managing Director, Columbia Management Distributors, Inc. from August 2007 to April 2010. | |
|
40
Fund Governance (continued)
Officers (continued)
| Name, Year of Birth and Address | | Principal Occupation(s) During the Past Five Years | |
| Paul D. Pearson (born 1956) | |
|
5228 Ameriprise Financial Center
Minneapolis, MN 55474
Vice President and Assistant
Treasurer (since 2011) | | Vice President, Investment Accounting, Columbia Management Investment Advisers, LLC, since May 2010; Vice President, Managed Assets, Investment Accounting, Ameriprise Financial Corporation. | |
|
| Paul B. Goucher (born 1968) | |
|
5228 Ameriprise Financial Center
Minneapolis, MN 55474
Vice President and Assistant
Secretary (since 2010) | | Vice President and Chief Counsel of Ameriprise Financial since January 2010 (formerly Vice President and Group Counsel from November 2008 to January 2010); Director, Managing Director and General Counsel of J. & W. Seligman & Co. Incorporated (Seligman) from July 2008 to November 2008 and Managing Director and Associate General Counsel of Seligman from January 2005 to July 2008. | |
|
| Christopher O. Petersen (born 1970) | |
|
5228 Ameriprise Financial Center
Minneapolis, MN 55474
Vice President (since 2010) and
Secretary (since 2011) | | Vice President and Chief Counsel, Ameriprise Financial since January 2010 (formerly Vice President and Group Counsel or Counsel from April 2004 to January 2010); Assistant Secretary of RiverSource Funds since January 2007. | |
|
| Michael E. DeFao (born 1968) | |
|
5228 Ameriprise Financial Center
Minneapolis, MN 55474
Vice President and Assistant
Secretary (since 2011) | | Vice President and Chief Counsel, Ameriprise Financial since May 2010; Associate General Counsel Bank of America from June 2005 to April 2010 | |
|
41
This page intentionally left blank.
This page intentionally left blank.
This page intentionally left blank.
Important Information About This Report
The fund mails one shareholder report to each shareholder address. If you would like more than one report, please call shareholder services at 1-800-345-6611 and additional reports will be sent to you. This report has been prepared for shareholders of Columbia California Tax-Exempt Fund.
A description of the policies and procedures that the fund uses to determine how to vote proxies and a copy of the fund's voting records are available (i) at www.columbiamanagement.com, (ii) on the Securities and Exchange Commission's website at www.sec.gov, and (iii) without charge, upon request, by calling 1-800-368-0346. Information regarding how the fund voted proxies relating to portfolio securities during the 12-month period ended June 30 is available from the SEC's website. Information regarding how the fund voted proxies relating to portfolio securities is also available from the fund's website, www.columbiamanagement.com.
The fund files a complete schedule of portfolio holdings with the SEC for the first and third quarters of each fiscal year on Form N-Q. The fund's Form N-Q is available on the SEC's website at www.sec.gov and may be reviewed and copied at the SEC's Public Reference Room in Washington, D.C. Information on the operation of the Public Reference Room may be obtained by calling 1-800-SEC-0330.
Transfer Agent
Columbia Management Investment
Services Corp.
P.O. Box 8081
Boston, MA 02266-8081
1-800-345-6611
Distributor
Columbia Management Investment
Distributors, Inc.
225 Franklin Street
Boston, MA 02110
Investment Manager
Columbia Management Investment Advisers, LLC
225 Franklin Street
Boston, MA 02110
45

Columbia California Tax-Exempt Fund
P. O. Box 8081
Boston, MA 02266-8081
columbiamanagement.com
This information is for use with concurrent or prior delivery of a fund prospectus. Investors should consider the investment objectives, risks, charges and expenses of a mutual fund carefully before investing. For a free prospectus, which contains this and other important information about the funds, visit columbiamanagement.com. Read the prospectus carefully before investing. The Fund is distributed by Columbia Management Investment Distributors, Inc., member FINRA, and managed by Columbia Management Investment Advisers, LLC.
© 2011 Columbia Management Investment Advisers, LLC. All rights reserved.
C-1006 C (12/11)

Columbia Connecticut Tax-Exempt Fund
Annual Report for the Period Ended October 31, 2011
Not FDIC insured • No bank guarantee • May lose value
Table of Contents
| Fund Profile | | | 1 | | |
|
| Performance Information | | | 2 | | |
|
| Understanding Your Expenses | | | 3 | | |
|
| Portfolio Manager's Report | | | 4 | | |
|
| Portfolio of Investments | | | 6 | | |
|
Statement of Assets and
Liabilities | | | 11 | | |
|
| Statement of Operations | | | 13 | | |
|
Statement of Changes in
Net Assets | | | 14 | | |
|
| Financial Highlights | | | 16 | | |
|
| Notes to Financial Statements | | | 20 | | |
|
Report of Independent Registered
Public Accounting Firm | | | 29 | | |
|
| Federal Income Tax Information | | | 30 | | |
|
| Fund Governance | | | 31 | | |
|
Important Information About
This Report | | | 37 | | |
|
The views expressed in this report reflect the current views of the respective parties. These views are not guarantees of future performance and involve certain risks, uncertainties and assumptions that are difficult to predict, so actual outcomes and results may differ significantly from the views expressed. These views are subject to change at any time based upon economic, market or other conditions and the respective parties disclaim any responsibility to update such views. These views may not be relied on as investment advice and, because investment decisions for a Columbia Fund are based on numerous factors, may not be relied on as an indication of trading intent on behalf of any particular Columbia Fund. References to specific securities should not be construed as a recommendation or investment advice.
President's Message

Dear Shareholders,
Economic momentum slowed in the third quarter of 2011, raising the odds of recession and making the U.S. economy more susceptible to financial shocks. The unemployment rate remained stalled as growing uncertainty continued to weigh on prospective employers. Monthly indicators for the manufacturing and service sectors also showed signs of slowing. Equity and high-yield bond markets fell sharply as investor confidence was shaken by Europe's lingering debt crisis, a heated debate in Washington over fiscal deficits (which eventually led to a downgrade of U.S. government debt) and tepid economic growth. The U.S. stock market experienced its worst quarter in two years during the third quarter of 2011, with volatility and selling pressure reminiscent of the market selloff in 2008, as macro-economic concerns continued to mount.
During its September meeting, the Federal Reserve Board announced that it was prepared to purchase longer term securities and sell shorter term securities in an effort to keep long-term interest rates down. Their hope is that lower long-term borrowing rates will stimulate business investment and hiring. However, the question remains as to whether monetary policy alone will be enough to resuscitate growth in the current environment.
Despite this challenging and volatile economic backdrop, I believe Columbia Management remains strong and steadfast. Columbia Management is the eighth largest manager of long-term mutual fund assets with $325 billion under management as of September 30, 2011. The past year has been one of considerable change for the organization as we worked diligently to align products, services and resources in the integration of Columbia Management with RiverSource Investments. The incredible line-up of talent, resources and capabilities that has resulted is highlighted by the success of our products. As of September 30, 2011, Columbia Management offers 54 funds rated 4 and 5 stars by Morningstar. Additionally, The Wall Street Journal has named two Columbia funds "Category Kings" in its "Investing in Funds: A Quarterly Analysis" issue dated October 5, 2011 in recognition for their one-year performance as of September 30, 2011.
For more information about these and other funds offered by Columbia Management, including detailed, up-to-date fund performance and portfolio information, please visit us online at columbiamanagement.com. Other information and resources available on our website include:
g timely economic analysis and market commentary
g quarterly fund commentaries
g Columbia Management Investor, a quarterly newsletter for shareholders
Thank you for your continued support of the Columbia Funds. We look forward to serving your investment needs for many years to come.
Best Regards,

J. Kevin Connaughton
President, Columbia Funds
All ratings are Class Z as of 9/30/2011. Out of 118 Z-share Columbia funds rated by Morningstar, 8 funds received a 5-star Overall Rating and 46 funds received a 4-star Overall Rating. The Overall Morningstar Rating for a retail mutual fund is derived from a weighted average of the performance figures associated with its 3-, 5- and 10-year (if applicable) Morningstar Rating metrics. For share classes that do not have a 3-, 5-, or 10-year actual performance history, the fund's independent Morningstar Rating metric is then compared against the retail mutual fund universe breakpoints to determine its hypothetical rating.
For each fund with at least a three-year history, Morningstar calculates a Morningstar RatingTM based on a Morningstar Risk-Adjusted Return measure that accounts for variation in a fund's monthly performance (including the effects of sales charges, loads, and redemption fees), placing more emphasis on downward variations and rewarding consistent performance. The top 10% of funds in each category receive 5 stars, the next 22.5% receive 4 stars, the next 35% receive 3 stars, the next 22.5% receive 2 stars and the bottom 10% receive 1 star. (Each share class is counted as a fraction of one fund within this scale and rated separately, which may cause slight variations in the distribution percentages.)
The Morningstar RatingTM is for Class Z shares only; other classes may have different performance characteristics and may have different ratings. © 2011 Morningstar, Inc. All Rights Reserved. The Morningstar information contained herein: (1) is proprietary to Morningstar and/or its content providers; (2) may not be copied or distributed; and (3) is not warranted to be accurate, complete or timely. Neither Morningstar nor its content providers are responsible for any damages or losses arising from any use of this information.
The Wall Street Journal "Category Kings" methodology: Top-performing funds in each category ranked by one-year total returns (changes in net asset values and reinvested distributions) for the period ended September 30, 2011.
Investors should consider the investment objectives, risks, charges and expenses of a mutual fund carefully before investing. For a free prospectus, which contains this and other important information about the funds, visit www.columbiamanagement.com. The prospectus should be read carefully before investing.
Columbia Funds are distributed by Columbia Management Investment Distributors, Inc., member FINRA, and managed by Columbia Management Investment Advisers, LLC.
© 2011 Columbia Management Investment Advisers, LLC. All rights reserved.
Fund Profile – Columbia Connecticut Tax-Exempt Fund
Summary
g For the 12-month period that ended October 31, 2011, the fund's Class A shares returned 3.85% without sales charge.
g The fund outperformed its benchmarks, the Barclays Capital Connecticut Municipal Bond Index1 and the broader Barclays Capital Municipal Bond Index2 and the average of funds in its peer group, the Lipper Connecticut Municipal Debt Funds Classification3.
g Credit quality and interest-rate positioning aided relative performance.
Portfolio Management
Catherine Stienstra has managed the fund since October 2010 and has been associated with Columbia Management Investment Advisers, LLC or its predecessors since 2007.
1The Barclays Capital Connecticut Municipal Bond Index is a subset of the Barclays Capital Municipal Bond Index consisting solely of bonds issued by obligors located in the state of Connecticut.
2The Barclays Capital Municipal Bond Index is considered representative of the broad market for investment-grade, tax-exempt bonds with maturity of at least one year.
3Lipper Inc., a widely respected data provider in the industry, calculates an average total return (assuming reinvestment of distributions) for mutual funds with investment objectives similar to those of the fund. Lipper makes no adjustment for the effect of sales loads.
Indices are not available for investment, are not professionally managed and do not reflect sales charges, fees, brokerage commissions, taxes or other expenses of investing. Securities in the fund may not match those in an index.
Performance data quoted represents past performance and current performance may be lower or higher. Past performance is no guarantee of future results. The investment return and principal value will fluctuate so that shares, when redeemed, may be worth more or less than the original cost. Please visit www.columbiamanagement.com for daily and most recent month-end performance updates.
Summary
1-year return as of 10/31/11
| | | | +3.85% | |
|
|  | | | Class A shares
(without sales charge) | |
|
| | | | +3.78% | |
|
|  | | | Barclays Capital
Municipal Bond Index | |
|
| | | | +3.48% | |
|
|  | | | Barclays Capital Connecticut
Municipal Bond Index | |
|
1
Performance Information – Columbia Connecticut Tax-Exempt Fund
Performance data quoted represents past performance and current performance may be lower or higher. Past performance is no guarantee of future results. The investment return and principal value will fluctuate so that shares, when redeemed, may be worth more or less than the original cost. Please visit www.columbiamanagement.com for daily and most recent month-end performance updates.
Performance of a $10,000 investment 11/01/01 – 10/31/11
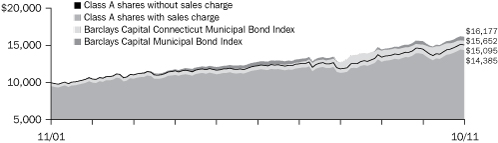
The chart above shows the change in value of a hypothetical $10,000 investment in Class A shares of Columbia Connecticut Tax-Exempt Fund during the stated time period, and does not reflect the deduction of taxes that a shareholder may pay on fund distributions or on the redemption of fund shares.
Performance of a $10,000 investment 11/01/01 – 10/31/11 ($)
| Sales charge | | without | | with | |
| Class A | | | 15,095 | | | | 14,385 | | |
| Class B | | | 14,010 | | | | 14,010 | | |
| Class C | | | 14,432 | | | | 14,432 | | |
| Class Z | | | n/a | | | | n/a | | |
Average annual total return as of 10/31/11 (%)
| Share class | | A | | B | | C | | Z | |
| Inception | | 11/01/91 | | 06/08/92 | | 08/01/97 | | 09/27/10 | |
| Sales charge | | without | | with | | without | | with | | without | | with | | without | |
| 1-year | | | 3.85 | | | | –1.04 | | | | 3.07 | | | | –1.89 | | | | 3.37 | | | | 2.38 | | | | 3.94 | | |
| 5-year | | | 4.18 | | | | 3.18 | | | | 3.41 | | | | 3.06 | | | | 3.71 | | | | 3.71 | | | | n/a | | |
| 10-year/Life | | | 4.20 | | | | 3.70 | | | | 3.43 | | | | 3.43 | | | | 3.74 | | | | 3.74 | | | | 2.84 | | |
The "with sales charge" returns include the maximum initial sales charge of 4.75% for Class A shares, and the applicable contingent deferred sales charge of 5.00% in the first year, declining to 1.00% in the sixth year and eliminated thereafter for Class B shares and 1.00% for Class C shares for the first year only. The "without sales charge" returns do not include the effect of sales charges. If they had, returns would be lower.
Performance results reflect any fee waivers or reimbursements of fund expenses by the Investment Manager and/or any of its affiliates. Absent these fee waivers or expense reimbursement arrangements, performance results would have been lower.
All results shown assume reinvestment of distributions. Class Z shares are sold at net asset value with no distribution and service (Rule 12b-1) fees. Class Z shares have limited eligibility and the investment minimum requirements may vary. Performance for different share classes will vary based on differences in sales charges and fees associated with each class. Please see the fund's prospectuses for details.
Class Z shares were initially offered by the fund on September 27, 2010.
The tables do not reflect the deduction of taxes that a shareholder may pay on fund distributions or on the redemption of fund shares.
2
Understanding Your Expenses – Columbia Connecticut Tax-Exempt Fund
As a shareholder, you incur two types of costs. There are transaction costs, which generally include sales charges on purchases and may include redemption fees. There are also ongoing costs, which generally include management fees, distribution and service (Rule 12b-1) fees, and other fund expenses. The following information is intended to help you understand your ongoing costs (in dollars) of investing in the Fund and to compare these costs with the ongoing costs of investing in other mutual funds.
Analyzing your fund's expenses
To illustrate these ongoing costs, we provided examples and calculated the expenses paid by investors in each share class of the Fund during the period. The information in the table is based on an initial investment of $1,000 at the beginning of the period indicated and held for the entire period. Expense information is calculated two ways and each method provides you with different information. The amount listed in the "Actual" column is calculated using the Fund's actual operating expenses and total return for the period. You may use the Actual information, together with the amount invested, to estimate the expenses that you paid over the period. Simply divide your account value by $1,000 (for example, an $8,600 account value divided by $1,000 = 8.6), then multiply the results by the expenses paid during the period under the Actual column. The amount listed in the "Hypothetical" column assumes a 5% annual rate of return before expenses (which is not the Fund's actual return) and then applies the Fund's actual expense ratio for the period to the hypothetical return. You should not use the hypothetical account values and expenses to estimate either your actual account balance at the end of the period or the expenses you paid during the period. See the "Compare with other funds" information with details on using the hypothetical data.
Compare with other funds
Since all mutual funds are required to include the same hypothetical calculations about expenses in shareholder reports, you can use this information to compare the ongoing cost of investing in the Fund with other funds. To do so, compare the hypothetical example with the 5% hypothetical examples that appear in the shareholder reports of other funds. As you compare hypothetical examples of other funds, it is important to note that hypothetical examples are meant to highlight the ongoing costs of investing in a fund only and do not reflect any transaction costs, such as sales charges, or redemption or exchange fees. Therefore, the hypothetical calculations are useful in comparing ongoing costs only, and will not help you determine the relative total costs of owning different funds. If transaction costs were included in these calculations, your costs would have been higher.
05/01/11 – 10/31/11
| | | Account value at the
beginning of the period ($) | | Account value at the
end of the period ($) | | Expenses paid
during the period ($) | | Fund's annualized
expense ratio (%) | |
| | | Actual | | Hypothetical | | Actual | | Hypothetical | | Actual | | Hypothetical | | Actual | |
| Class A | | | 1,000.00 | | | | 1,000.00 | | | | 1,067.40 | | | | 1,021.22 | | | | 4.12 | | | | 4.02 | | | | 0.79 | | |
| Class B | | | 1,000.00 | | | | 1,000.00 | | | | 1,063.40 | | | | 1,017.44 | | | | 8.01 | | | | 7.83 | | | | 1.54 | | |
| Class C | | | 1,000.00 | | | | 1,000.00 | | | | 1,064.90 | | | | 1,018.95 | | | | 6.45 | | | | 6.31 | | | | 1.24 | | |
| Class Z | | | 1,000.00 | | | | 1,000.00 | | | | 1,066.90 | | | | 1,022.48 | | | | 2.81 | | | | 2.75 | | | | 0.54 | | |
Expenses paid during the period are equal to the annualized expense ratio for each class as indicated above, multiplied by the average account value over the period and then multiplied by the number of days in the Fund's most recent fiscal half year and divided by 365.
Expenses do not include fees and expenses incurred indirectly by the Fund from the underlying funds in which the Fund may invest (also referred to as "acquired funds"), including affiliated and non-affiliated pooled investments vehicles (including mutual funds and exchange traded funds).
Had Columbia Management Investment Advisers, LLC and/or certain of its affiliates not waived/reimbursed certain fees and expenses, account value at the end of the period would have been reduced.
3
Portfolio Manager's Report – Columbia Connecticut Tax-Exempt Fund
Performance data quoted represents past performance and current performance may be lower or higher. Past performance is no guarantee of future results. The investment return and principal value will fluctuate so that shares, when redeemed, may be worth more or less than the original cost. Please visit www.columbiamanagement.com for daily and most recent month-end performance updates.
Net asset value per share
as of 10/31/11 ($)
| Class A | | | 7.83 | | |
| Class B | | | 7.83 | | |
| Class C | | | 7.83 | | |
| Class Z | | | 7.82 | | |
Distributions declared per share
11/01/10 – 10/31/11 ($)
| Class A | | | 0.34 | | |
| Class B | | | 0.29 | | |
| Class C | | | 0.31 | | |
| Class Z | | | 0.36 | | |
A portion of the fund's income may be subject to the alternative minimum tax. The fund may at times purchase tax-exempt securities at a discount. Some, or all, of this discount may be included in the fund's ordinary income, and is taxable when distributed. Distributions include $0.06 per share of taxable realized gains.
30-day SEC yields
as of 10/31/11 (%)
| Class A | | | 2.88 | | |
| Class B | | | 2.27 | | |
| Class C | | | 2.57 | | |
| Class Z | | | 3.24 | | |
The 30-day SEC yields reflect the fund's earning power, net of expenses, expressed as an annualized percentage of the public offering price at the end of the period. Had the investment advisor and/or any of its affiliates not waived fees or reimbursed a portion of expenses, the 30-day SEC yields would have been lower.
For the 12-month period that ended October 31, 2011, the fund's Class A shares returned 3.85% without sales charge. The fund outperformed its benchmarks, the Barclays Capital Connecticut Municipal Bond Index and the Barclays Capital Municipal Bond Index, which returned 3.48% and 3.78%, respectively. It also did better than the average fund in its peer group, the Lipper Connecticut Municipal Debt Funds Classification, which returned 3.20%. The fund benefited relative to the Barclays Capital Municipal Bond Index from its exposure to longer-maturity and lower quality securities, which outperformed shorter-maturity and higher quality issues over the past year.
After a weak start, municipal bond market conditions improved
The municipal bond market got off to a difficult start in the fourth quarter of 2010 after a well-publicized but erroneous prediction that the municipal bond market was ripe for massive defaults led many investors to sell municipal securities. At the same time that demand was falling, supply was increasing leading up to the 2010 year end. Yields rose, bond prices fell and the yield curve steepened into March 2011. However, market conditions began to improve later in the spring, as credit fears eased and outflows slowed. State and local tax revenues have grown for six consecutive quarters, and new issuance slowed as many states implemented sharp budget cuts and delayed capital expenditures. As such, defaults remained scarce. The year-to-date total is just over $1 billion, mostly in non-rated sectors. Municipal bond yields began to look attractive relative to Treasury yields, and investors eventually began buying municipal securities again. Over the last seven months of the period, municipal bond yields fell across all maturities, but especially on longer-term issues. Credit spreads—the difference between the yields on lower and higher quality bonds—also narrowed. As both yield and credit spreads narrowed, municipal bond returns got a boost for the year.
Positive contribution from long maturity and credit quality positioning
The fund benefited from holding more longer-duration securities than its benchmarks. Longer-maturity, more interest-rate sensitive bonds experienced the biggest price gains as yields fell and this segment of the market also offered a yield advantage over shorter-maturity bonds. The fund picked up added ground relative to the Barclays Capital Municipal Bond Index from having an underweight in high quality (AAA and AA) securities and an overweight and good security selection among lower quality (A) and non-rated issues.4 The fund benefited from a lack of exposure to industrial development/pollution control revenue bonds, a sector that performed poorly. Security selection in the hospital and education sectors, both of which did well, was positive.
Changes to positioning
During the sell off that began in late 2010, we added longer-maturity bonds because we believed they were being unfairly pressured by an unfavorable supply/demand situation in the municipal market rather than by any fundamental problems. We also
4Ratings are relative and subjective and are not absolute standards of quality. The credit ratings typically range from AAA (highest) to D (lowest), and are subject to change. The credit quality of the fund's investments does not remove market risk.
4
Portfolio Manager's Report (continued) – Columbia Connecticut Tax-Exempt Fund
boosted the fund's stake in lower quality securities, particularly A rated issues and hospital and education bonds. To fund these purchases, we reduced exposure to higher quality bonds, including AAA, AA and pre-refunded issues. Pre-refunding occurs when an issuer sells a new bond at a lower rate to pay off the old bonds. The proceeds from the new issue are invested into an escrow account (typically short-term government securities) and the interest earned is used to pay the interest on the bonds outstanding. On the call date or maturity date, the money in the escrow account is used to pay off the bonds outstanding. We also sold bonds with credit concerns, including local general obligation sector, which could be hurt by reduced property tax revenues.
Next steps
Going forward, we plan to monitor closely the federal government's deficit reduction proposals to determine their potential impact on the tax-exempt status of municipal bonds. At the state level, we expect to keep a close eye on the economy, which has been hurt by recent job losses in the insurance and banking industries as well as in state and local government. While we expect health care and higher education to continue to be strong sources of employment, we think a full economic recovery could take some time. However, we do not currently foresee any changes to Connecticut's Aa2 credit rating from Moody's. With expectations that short-term interest rates and inflation will stay low into 2013, we plan to continue to favor longer-maturity and lower quality issues whose added yields can help boost total return. In addition, we will continue to emphasize individual security selection, relying heavily upon our proprietary credit research team. We will carefully monitor a number of potential variables and will not hesitate to adjust the fund's duration—a measure of interest rate sensitivity, credit quality and/or sector positioning—accordingly.
Portfolio characteristics and holdings are subject to change periodically and may not be representative of current characteristics and holdings. The outlook for the fund may differ from that presented for other Columbia Funds.
Tax-exempt investing offers current tax-exempt income, but it also involves certain risks. The value of the fund will be affected by interest rate changes and the creditworthiness of issues held in the fund. When interest rates go up, bond prices generally drop and vice versa. Interest income from certain tax-exempt bonds may be subject to certain state and local taxes and, if applicable, the alternative minimum tax. Any capital gains distributed are taxable to the investor.
The fund is non-diversified, which generally means that it may invest a greater percentage of its total assets in the securities of fewer issuers than a "diversified" fund. This increases the risk that a change in the value of any one investment held by the fund could affect the overall value of the fund more than it would affect that of a diversified fund holding a greater number of investments. Accordingly, the fund's value will likely be more volatile than the value of more diversified funds.
Single-state municipal bond funds pose additional risks due to limited geographical diversification.
Taxable-equivalent SEC yields
as of 10/31/11 (%)
| Class A | | | 4.43 | | |
| Class B | | | 3.49 | | |
| Class C | | | 3.95 | | |
| Class Z | | | 4.98 | | |
Taxable-equivalent SEC yields are calculated assuming a federal income tax rate of 35.0%. This tax rate does not reflect the phase out of exemptions or the reduction of the otherwise allowable deductions that occur when adjusted gross income exceeds certain levels. Your taxable-equivalent yield may be different depending on your tax bracket.
Quality breakdown
as of 10/31/11 (%)
| AAA | | | 10.4 | | |
| AA | | | 33.6 | | |
| A | | | 43.0 | | |
| BBB | | | 5.7 | | |
| BB | | | 1.6 | | |
| Non-Rated | | | 5.7 | | |
Maturity breakdown
as of 10/31/11 (%)
| 0-1 year | | | 0.6 | | |
| 1-3 years | | | 2.1 | | |
| 3-5 years | | | 7.2 | | |
| 5-7 years | | | 3.7 | | |
| 7-10 years | | | 8.3 | | |
| 10-15 years | | | 22.0 | | |
| 15-20 years | | | 23.8 | | |
| 20-25 years | | | 10.6 | | |
| 25 years and over | | | 20.0 | | |
| Cash Equivalents | | | 1.7 | | |
Ratings shown in the quality breakdown are assigned to individual bonds by taking the lower of the ratings available from one of the following nationally recognized rating agencies: Standard & Poor's or Moody's Investor Services. If a security is rated by only one of the two agencies, that rating is used. If a security is not rated by either of the two agencies, it is designated as Non-Rated. Ratings are relative and subjective and are not absolute standards of quality. The fund's credit quality does not remove market risk.
The fund is actively managed and the composition of its portfolio will change over time. Maturity breakdown, top sectors and quality breakdown are calculated as a percentage of net assets.
5
Portfolio of Investments – Columbia Connecticut Tax-Exempt Fund
October 31, 2011
(Percentages represent value of investments compared to net assets)
Issue
Description | | Coupon
Rate | | Principal
Amount | | Value | |
| Municipal Bonds 97.2% | |
| Advanced Refunded 2.0% | |
City of New Haven
Unlimited General Obligation Bonds
Series 2002C Escrowed to Maturity (NPFGC) | |
| 11/01/20 | | | 5.000 | % | | $ | 10,000 | | | $ | 10,551 | | |
Puerto Rico Public Finance Corp.(a)
Revenue Bonds
Commonwealth Appropriation
Series 2002E Escrowed to Maturity (AMBAC) | |
| 08/01/27 | | | 5.500 | % | | | 450,000 | | | | 568,908 | | |
Unrefunded Revenue Bonds
Commonwealth Appropriation
Series 2002E Escrowed to Maturity (AMBAC) | |
| 08/01/27 | | | 5.500 | % | | | 1,050,000 | | | | 1,327,452 | | |
| Total | | | 1,906,911 | | |
| City 3.0% | |
City of Bridgeport
Unlimited General Obligation Refunding Bonds
Series 2004C (NPFGC) | |
| 08/15/19 | | | 5.500 | % | | | 1,500,000 | | | | 1,757,190 | | |
City of New Haven
Unrefunded Unlimited General Obligation Bonds
Series 2002B (NPFGC/FGIC) | |
| 11/01/16 | | | 5.000 | % | | | 1,000,000 | | | | 1,051,640 | | |
| Total | | | 2,808,830 | | |
| College 15.3% | |
Connecticut State Health & Educational Facility Authority
Revenue Bonds
Connecticut College
Series 2011H-1 | |
| 07/01/41 | | | 5.000 | % | | | 1,625,000 | | | | 1,706,234 | | |
Connecticut College Issue
Series 2002E (NPFGC) | |
| 07/01/22 | | | 5.250 | % | | | 400,000 | | | | 412,640 | | |
Fairfield University
Series 2008N | |
| 07/01/27 | | | 4.750 | % | | | 1,000,000 | | | | 1,033,400 | | |
| Series 2010O | |
| 07/01/40 | | | 5.000 | % | | | 1,000,000 | | | | 1,039,130 | | |
Quinnipiac University
Series 2007I (NPFGC) | |
| 07/01/28 | | | 4.375 | % | | | 1,015,000 | | | | 1,017,984 | | |
Sacred Heart University
Series 2011G | |
| 07/01/31 | | | 5.375 | % | | | 500,000 | | | | 511,120 | | |
Trinity College
Series 1998F (NPFGC) | |
| 07/01/21 | | | 5.500 | % | | | 2,000,000 | | | | 2,354,600 | | |
| Series 2007J (NPFGC) | |
| 07/01/37 | | | 4.500 | % | | | 1,500,000 | | | | 1,518,630 | | |
Wesleyan University
Series 2010 | |
| 07/01/26 | | | 5.000 | % | | | 2,440,000 | | | | 2,740,559 | | |
Yale University
Series 2003X-1 | |
| 07/01/42 | | | 5.000 | % | | | 2,000,000 | | | | 2,063,740 | | |
| Total | | | 14,398,037 | | |
Issue
Description | | Coupon
Rate | | Principal
Amount | | Value | |
| Municipal Bonds (continued) | |
| Electric 3.3% | |
Connecticut State Development Authority
Refunding Revenue Bonds
Connecticut Light & Power Co. Project
Series 2011 | |
| 09/01/28 | | | 4.375 | % | | $ | 1,500,000 | | | $ | 1,501,110 | | |
Puerto Rico Electric Power Authority(a)
Refunding Revenue Bonds
Series 2002KK (NPFGC) | |
| 07/01/15 | | | 5.500 | % | | | 500,000 | | | | 551,780 | | |
Revenue Bonds
Series 2010XX | |
| 07/01/40 | | | 5.250 | % | | | 1,000,000 | | | | 1,008,240 | | |
| Total | | | 3,061,130 | | |
| Health Care - Hospital 15.7% | |
Connecticut State Health & Educational Facility Authority
Revenue Bonds
Ascension Health Senior Center
Series 2010 | |
| 11/15/40 | | | 5.000 | % | | | 2,500,000 | | | | 2,568,200 | | |
Danbury Hospital
Series 2006H (AMBAC) | |
| 07/01/33 | | | 4.500 | % | | | 2,000,000 | | | | 1,640,840 | | |
Hartford Healthcare Corp.
Series 2011A | |
| 07/01/41 | | | 5.000 | % | | | 1,500,000 | | | | 1,483,875 | | |
Lawrence & Memorial Hospital
Series 2011S | |
| 07/01/22 | | | 5.000 | % | | | 2,510,000 | | | | 2,726,236 | | |
| 07/01/31 | | | 5.000 | % | | | 1,425,000 | | | | 1,446,746 | | |
Middlesex Hospital
Series 2006L (AGM) | |
| 07/01/36 | | | 4.250 | % | | | 1,000,000 | | | | 893,260 | | |
| Series 2011N | |
| 07/01/24 | | | 5.000 | % | | | 425,000 | | | | 443,007 | | |
| 07/01/26 | | | 5.000 | % | | | 900,000 | | | | 927,783 | | |
Western Connecticut Health
Series 2011M | |
| 07/01/41 | | | 5.375 | % | | | 1,500,000 | | | | 1,549,560 | | |
Yale-New Haven Hospital
Series 2010M | |
| 07/01/40 | | | 5.500 | % | | | 1,000,000 | | | | 1,064,400 | | |
| Total | | | 14,743,907 | | |
| Health Care - Nursing Home 3.2% | |
Connecticut State Development Authority
Revenue Bonds
Alzheimer's Resource Center Project
Series 2007 | |
| 08/15/21 | | | 5.400 | % | | | 500,000 | | | | 494,275 | | |
| 08/15/27 | | | 5.500 | % | | | 2,375,000 | | | | 2,308,904 | | |
Town of Hamden
Revenue Bonds
Whitney Center Project
Series 2009A | |
| 01/01/30 | | | 7.625 | % | | | 225,000 | | | | 235,309 | | |
| Total | | | 3,038,488 | | |
The Accompanying Notes to Financial Statements are an integral part of this statement.
6
Columbia Connecticut Tax-Exempt Fund
October 31, 2011
(Percentages represent value of investments compared to net assets)
Issue
Description | | Coupon
Rate | | Principal
Amount | | Value | |
| Municipal Bonds (continued) | |
| Health Care - Other 0.3% | |
Connecticut State Health & Educational Facility Authority
Revenue Bonds
Village Families & Children
Series 2002A (AMBAC) | |
| 07/01/23 | | | 5.000 | % | | $ | 255,000 | | | $ | 255,265 | | |
| Housing - Multi-Family 1.9% | |
Bridgeport Housing Authority
Revenue Bonds
Custodial Receipts Energy Performance
Series 2009 | |
| 06/01/30 | | | 5.600 | % | | | 1,000,000 | | | | 1,053,740 | | |
Greenwich Housing Authority
Revenue Bonds
Housing-Greenwich Close
Series 1997A | |
| 09/01/27 | | | 6.350 | % | | | 750,000 | | | | 712,905 | | |
| Total | | | 1,766,645 | | |
| Housing - Single Family 1.9% | |
Connecticut Housing Finance Authority
Revenue Bonds
Housing Mortgage Finance Program
Series 2003C-1 | |
| 11/15/23 | | | 4.850 | % | | | 1,000,000 | | | | 1,017,680 | | |
Connecticut Housing Finance Authority(b)
Revenue Bonds
Housing Mortgage Finance Program
Subordinated Series 2006A-1 AMT | |
| 11/15/36 | | | 4.875 | % | | | 760,000 | | | | 749,383 | | |
| Total | | | 1,767,063 | | |
| Lease 8.3% | |
Connecticut State Health & Educational Facility Authority
Revenue Bonds
State Supported Child Care
Series 2011 | |
| 07/01/28 | | | 5.000 | % | | | 1,030,000 | | | | 1,079,832 | | |
| 07/01/29 | | | 5.000 | % | | | 860,000 | | | | 895,406 | | |
State of Connecticut
Certificate of Participation
Juvenile Training School
Series 2001 | |
| 12/15/25 | | | 4.750 | % | | | 2,500,000 | | | | 2,528,300 | | |
University of Connecticut
Revenue Bonds
Series 2009A | |
| 02/15/28 | | | 5.000 | % | | | 500,000 | | | | 548,530 | | |
| Series 2010A | |
| 02/15/27 | | | 5.000 | % | | | 1,500,000 | | | | 1,675,470 | | |
| 02/15/29 | | | 5.000 | % | | | 1,000,000 | | | | 1,099,510 | | |
| Total | | | 7,827,048 | | |
| Miscellaneous 0.6% | |
City of New Haven
Refunding Revenue Bonds
Series 2002 (AMBAC) | |
| 12/01/15 | | | 5.375 | % | | | 500,000 | | | | 531,650 | | |
Issue
Description | | Coupon
Rate | | Principal
Amount | | Value | |
| Municipal Bonds (continued) | |
| Resource Recovery 3.6% | |
Connecticut Resources Recovery Authority
Refunding Revenue Bonds
American Fuel Co.
Series 2001A-II AMT(b) | |
| 11/15/15 | | | 5.500 | % | | $ | 1,500,000 | | | $ | 1,504,575 | | |
New Haven Solid Waste Authority
Revenue Bonds
Series 2008 | |
| 06/01/28 | | | 5.375 | % | | | 1,750,000 | | | | 1,842,452 | | |
| Total | | | 3,347,027 | | |
| Sales or Use Tax 6.4% | |
Puerto Rico Highway & Transportation Authority(a)
Refunding Revenue Bonds
Series 2003AA-2 | |
| 07/01/35 | | | 5.300 | % | | | 3,000,000 | | | | 2,956,020 | | |
| Series 2005L (AMBAC) | |
| 07/01/38 | | | 5.250 | % | | | 1,000,000 | | | | 974,720 | | |
Puerto Rico Sales Tax Financing Corp.(a)
1st Subordinated Revenue Bonds
Series 2010C | |
| 08/01/41 | | | 5.250 | % | | | 500,000 | | | | 506,610 | | |
Revenue Bonds
1st Subordinated
Series 2009A | |
| 08/01/37 | | | 5.750 | % | | | 1,500,000 | | | | 1,572,405 | | |
| Total | | | 6,009,755 | | |
| School 5.9% | |
Connecticut State Health & Educational Facility Authority
Revenue Bonds
Brunswick School
Series 2003B (NPFGC) | |
| 07/01/33 | | | 5.000 | % | | | 670,000 | | | | 675,816 | | |
Loomis Chaffe School
Series 2005F (AMBAC) | |
| 07/01/25 | | | 5.250 | % | | | 2,035,000 | | | | 2,469,859 | | |
| 07/01/26 | | | 5.250 | % | | | 1,045,000 | | | | 1,266,770 | | |
Miss Porters School Issue
Series 2006B (AMBAC) | |
| 07/01/36 | | | 5.000 | % | | | 1,075,000 | | | | 1,098,693 | | |
| Total | | | 5,511,138 | | |
| Special District - Assessment 0.8% | |
Harbor Point Infrastructure Improvement District
Tax Allocation Bonds
Harbor Point Project
Series 2010A | |
| 04/01/39 | | | 7.875 | % | | | 750,000 | | | | 795,690 | | |
| Special District - Special Tax 4.9% | |
State of Connecticut
Refunding Special Tax Bonds
Transportation Infrastructure
Series 2004B (AMBAC) | |
| 07/01/18 | | | 5.250 | % | | | 2,000,000 | | | | 2,403,740 | | |
Territory of Guam
Revenue Bonds
Section 30
Series 2009A(a) | |
| 12/01/34 | | | 5.750 | % | | | 2,150,000 | | | | 2,185,991 | | |
| Total | | | 4,589,731 | | |
The Accompanying Notes to Financial Statements are an integral part of this statement.
7
Columbia Connecticut Tax-Exempt Fund
October 31, 2011
(Percentages represent value of investments compared to net assets)
Issue
Description | | Coupon
Rate | | Principal
Amount | | Value | |
| Municipal Bonds (continued) | |
| Special Purpose Certificates - General Obligations 10.5% | |
City of New Britain
Unlimited General Obligation Bonds
Series 1993A (NPFGC) | |
| 10/01/12 | | | 6.000 | % | | $ | 500,000 | | | $ | 514,480 | | |
| Series 2006 (AMBAC) | |
| 04/15/21 | | | 5.000 | % | | | 1,160,000 | | | | 1,366,584 | | |
City of Stamford
Unlimited General Obligation Refunding Bonds
Series 2003B | |
| 08/15/16 | | | 5.250 | % | | | 1,000,000 | | | | 1,182,800 | | |
Town of Cheshire
Unlimited General Obligation Refunding Bonds
Series 2001B | |
| 08/01/14 | | | 5.000 | % | | | 1,720,000 | | | | 1,922,685 | | |
Town of East Hartford
Unlimited General Obligation Refunding Bonds
Series 2003 (NPFGC/FGIC) | |
| 05/01/15 | | | 5.250 | % | | | 1,000,000 | | | | 1,135,460 | | |
Town of Granby
Unlimited General Obligation Bonds
Series 2006 | |
| 02/15/26 | | | 5.000 | % | | | 540,000 | | | | 684,207 | | |
Town of North Haven
Unlimited General Obligation Bonds
Series 2007 | |
| 07/15/26 | | | 4.750 | % | | | 1,150,000 | | | | 1,377,206 | | |
Town of Suffield
Unlimited General Obligation Refunding Bonds
Series 2005 | |
| 06/15/20 | | | 5.000 | % | | | 1,400,000 | | | | 1,695,904 | | |
| Total | | | 9,879,326 | | |
| State 2.7% | |
Connecticut Housing Finance Authority
Revenue Bonds
State Supported Special Obligation
Series 2009-10 | |
| 06/15/28 | | | 5.000 | % | | | 750,000 | | | | 801,870 | | |
State of Connecticut
Unlimited General Obligation Bonds
Series 2001C (AGM) | |
| 12/15/15 | | | 5.500 | % | | | 1,500,000 | | | | 1,767,645 | | |
| Total | | | 2,569,515 | | |
Issue
Description | | Coupon
Rate | | Principal
Amount | | Value | |
| Municipal Bonds (continued) | |
| Water & Sewer 6.9% | |
Greater New Haven Water Pollution Control Authority
Revenue Bonds
Series 2008A (AGM) | |
| 11/15/28 | | | 4.750 | % | | $ | 600,000 | | | $ | 626,238 | | |
Puerto Rico Infrastructure Financing Authority
Revenue Bonds
Capital Appreciation
Series 2005A (AMBAC)(a)(c) | |
| 07/01/35 | | | 0.000 | % | | | 2,000,000 | | | | 401,400 | | |
South Central Connecticut Regional Water Authority
Refunding Revenue Bonds
20th Series 2007A (NPFGC) | |
| 08/01/23 | | | 5.250 | % | | | 1,000,000 | | | | 1,201,910 | | |
| 20th Series 2007A (NPFGC) | |
| 08/01/24 | | | 5.250 | % | | | 1,000,000 | | | | 1,200,290 | | |
Revenue Bonds
20th Series 2005 (NPFGC) | |
| 08/01/30 | | | 5.000 | % | | | 1,870,000 | | | | 1,938,367 | | |
State of Connecticut Clean Water Fund
Revenue Bonds
Revolving Fund
Series 2009A | |
| 06/01/26 | | | 5.000 | % | | | 1,000,000 | | | | 1,153,780 | | |
| Total | | | 6,521,985 | | |
Total Municipal Bonds
(Cost: $87,913,403) | | $ | 91,329,141 | | |
| | | | | Shares | | Value | |
| Money Market Funds 1.6% | |
Dreyfus Connecticut Municipal
Money Market Fund, Inc., 0.000%(d) | | | | | 803,157 | | | $ | 803,157 | | |
JPMorgan Tax-Free Money
Market Fund, 0.010%(d) | | | | | | | 747,495 | | | | 747,495 | | |
Total Money Market Funds
(Cost: $1,550,652) | | $ | 1,550,652 | | |
Total Investments
(Cost: $89,464,055) | | | | | | $ | 92,879,793 | | |
| Other Assets & Liabilities, Net | | | | | | | 1,101,034 | | |
| Total Net Assets | | $ | 93,980,827 | | |
| Notes to Portfolio of Investments | |
(a) Municipal obligations include debt obligations issued by or on behalf of territories, possessions, or sovereign nations within the territorial boundaries of the United States. At October 31, 2011, the value of these securities amounted to $12,053,526 or 12.83% of net assets.
(b) At October 31, 2011, the value of securities subject to alternative minimum tax represented 2.40% of net assets.
(c) Zero coupon bond.
(d) The rate shown is the seven-day current annualized yield at October 31, 2011.
The Accompanying Notes to Financial Statements are an integral part of this statement.
8
Columbia Connecticut Tax-Exempt Fund
October 31, 2011
AGM Assured Guaranty Municipal Corporation
AMBAC Ambac Assurance Corporation
AMT Alternative Minimum Tax
FGIC Financial Guaranty Insurance Company
NPFGC National Public Finance Guarantee Corporation
Generally accepted accounting principles (GAAP) require disclosure regarding the inputs and valuation techniques used to measure fair value and any changes in valuation inputs or techniques. In addition, investments shall be disclosed by major category.
The Fund categorizes its fair value measurements according to a three-level hierarchy that maximizes the use of observable inputs and minimizes the use of unobservable inputs by prioritizing that the most observable input be used when available. Observable inputs are those that market participants would use in pricing an investment based on market data obtained from sources independent of the reporting entity. Unobservable inputs are those that reflect the Fund's assumptions about the information market participants would use in pricing an investment. An investment's level within the fair value hierarchy is based on the lowest level of any input that is deemed significant to the asset or liability's fair value measurement. The input levels are not necessarily an indication of the risk or liquidity associated with investments at that level. For example, certain U.S. government securities are generally high quality and liquid, however, they are reflected as Level 2 because the inputs used to determine fair value may not always be quoted prices in an active market.
Fair value inputs are summarized in the three broad levels listed below:
• Level 1 — Valuations based on quoted prices for investments in active markets that the Fund has the ability to access at the measurement date (including NAV for open-end mutual funds). Valuation adjustments are not applied to Level 1 investments.
• Level 2 — Valuations based on other significant observable inputs (including quoted prices for similar securities, interest rates, prepayment speeds, credit risks, etc.).
• Level 3 — Valuations based on significant unobservable inputs (including the Fund's own assumptions and judgment in determining the fair value of investments).
Inputs that are used in determining fair value of an investment may include price information, credit data, volatility statistics, and other factors. These inputs can be either observable or unobservable. The availability of observable inputs can vary between investments, and is affected by various factors such as the type of investment, and the volume and level of activity for that investment or similar investments in the marketplace. The inputs will be considered by the Investment Manager, along with any other relevant factors in the calculation of an investment's fair value. The Fund uses prices and inputs that are current as of the measurement date, which may include periods of market dislocations. During these periods, the availability of prices and inputs may be reduced for many investments. This condition could cause an investment to be reclassified between the various levels within the hierarchy.
Investments falling into the Level 3 category are primarily supported by quoted prices from brokers and dealers participating in the market for those investments. However, these may be classified as Level 3 investments due to lack of market transparency and corroboration to support these quoted prices. Additionally, valuation models may be used as the pricing source for any remaining investments classified as Level 3. These models rely on one or more significant unobservable inputs and/or significant assumptions by the Investment Manager. Inputs used in valuations may include, but are not limited to, financial statement analysis, capital account balances, discount rates and estimated cash flows, and comparable company data.
The following table is a summary of the inputs used to value the Fund's investments as of October 31, 2011:
| | | Fair value at October 31, 2011 | |
| Description(a) | | Level 1
Quoted Prices
in Active
Markets for
Identical Assets | | Level 2
Other
Significant
Observable
Inputs(b) | | Level 3
Significant
Unobservable
Inputs | | Total | |
| Bonds | |
| Municipal Bonds | | $ | — | | | $ | 91,329,141 | | | $ | — | | | $ | 91,329,141 | | |
| Total Bonds | | | — | | | | 91,329,141 | | | | — | | | | 91,329,141 | | |
| Other | |
| Money Market Funds | | | 1,550,652 | | | | — | | | | — | | | | 1,550,652 | | |
| Total Other | | | 1,550,652 | | | | — | | | | — | | | | 1,550,652 | | |
| Total | | $ | 1,550,652 | | | $ | 91,329,141 | | | $ | — | | | $ | 92,879,793 | | |
The Accompanying Notes to Financial Statements are an integral part of this statement.
9
Columbia Connecticut Tax-Exempt Fund
October 31, 2011
| Fair Value Measurements (continued) | |
The Fund's assets assigned to the Level 2 input category are generally valued using the market approach, in which a security's value is determined through reference to prices and information from market transactions for similar or identical assets.
(a) See the Portfolio of Investments for all investment classifications not indicated in the table.
(b) There were no significant transfers between Levels 1 and 2 during the period.
The Accompanying Notes to Financial Statements are an integral part of this statement.
10
Statement of Assets and Liabilities – Columbia Connecticut Tax-Exempt Fund
October 31, 2011
| Assets | |
| Investments, at value | |
| (identified cost $89,464,055) | | $ | 92,879,793 | | |
| Receivable for: | |
| Capital shares sold | | | 215,906 | | |
| Interest | | | 1,324,671 | | |
| Expense reimbursement due from Investment Manager | | | 2,263 | | |
| Prepaid expense | | | 960 | | |
| Trustees' deferred compensation plan | | | 28,402 | | |
| Total assets | | | 94,451,995 | | |
| Liabilities | |
| Payable for: | |
| Capital shares purchased | | | 61,913 | | |
| Dividend distributions to shareholders | | | 282,586 | | |
| Investment management fees | | | 3,075 | | |
| Distribution and service fees | | | 2,212 | | |
| Transfer agent fees | | | 8,992 | | |
| Administration fees | | | 538 | | |
| Chief compliance officer expenses | | | 412 | | |
| Other expenses | | | 83,038 | | |
| Trustees' deferred compensation plan | | | 28,402 | | |
| Total liabilities | | | 471,168 | | |
| Net assets applicable to outstanding capital stock | | $ | 93,980,827 | | |
The Accompanying Notes to Financial Statements are an integral part of this statement.
11
Statement of Assets and Liabilities (continued) – Columbia Connecticut Tax-Exempt Fund
October 31, 2011
| Represented by | |
| Paid-in capital | | $ | 89,681,261 | | |
| Undistributed net investment income | | | 256,661 | | |
| Accumulated net realized gain | | | 627,167 | | |
| Unrealized appreciation (depreciation) on: | |
| Investments | | | 3,415,738 | | |
| Total — representing net assets applicable to outstanding capital stock | | $ | 93,980,827 | | |
| Net assets applicable to outstanding shares | |
| Class A | | $ | 72,272,181 | | |
| Class B | | $ | 984,400 | | |
| Class C | | $ | 11,413,126 | | |
| Class Z | | $ | 9,311,120 | | |
| Shares outstanding | |
| Class A | | | 9,234,860 | | |
| Class B | | | 125,775 | | |
| Class C | | | 1,458,194 | | |
| Class Z | | | 1,190,810 | | |
| Net asset value per share | |
| Class A(a) | | $ | 7.83 | | |
| Class B | | $ | 7.83 | | |
| Class C | | $ | 7.83 | | |
| Class Z | | $ | 7.82 | | |
(a) The maximum offering price per share for Class A is $8.22. The offering price is calculated by dividing the net asset value by 1.0 minus the maximum sales charge of 4.75%.
The Accompanying Notes to Financial Statements are an integral part of this statement.
12
Statement of Operations – Columbia Connecticut Tax-Exempt Fund
Year ended October 31, 2011
| Net investment income | |
| Income: | |
| Interest | | $ | 3,944,959 | | |
| Dividends | | | 638 | | |
| Total income | | | 3,945,597 | | |
| Expenses: | |
| Investment management fees | | | 376,066 | | |
| Distribution fees | |
| Class B | | | 12,557 | | |
| Class C | | | 84,582 | | |
| Service fees | |
| Class A | | | 175,878 | | |
| Class B | | | 4,093 | | |
| Class C | | | 27,643 | | |
| Transfer agent fees | |
| Class A | | | 69,340 | | |
| Class B | | | 1,734 | | |
| Class C | | | 10,734 | | |
| Class Z | | | 1,192 | | |
| Administration fees | | | 40,619 | | |
| Compensation of board members | | | 22,474 | | |
| Pricing and bookkeeping fees | | | 32,812 | | |
| Custodian fees | | | 7,463 | | |
| Printing and postage fees | | | 49,500 | | |
| Registration fees | | | 48,425 | | |
| Professional fees | | | 48,589 | | |
| Chief compliance officer expenses | | | 915 | | |
| Other | | | 9,343 | | |
| Total expenses | | | 1,023,959 | | |
| Fees waived or expenses reimbursed by Investment Manager and its affiliates | | | (230,450 | ) | |
| Fees waived by distributor—Class C | | | (33,829 | ) | |
| Expense reductions | | | (186 | ) | |
| Total net expenses | | | 759,494 | | |
| Net investment income | | | 3,186,103 | | |
| Realized and unrealized gain (loss) — net | |
| Net realized gain (loss) on: | |
| Investments | | | 698,124 | | |
| Net realized gain | | | 698,124 | | |
| Net change in unrealized appreciation (depreciation) on: | |
| Investments | | | (1,238,343 | ) | |
| Net change in unrealized depreciation | | | (1,238,343 | ) | |
| Net realized and unrealized loss | | | (540,219 | ) | |
| Net increase in net assets resulting from operations | | $ | 2,645,884 | | |
The Accompanying Notes to Financial Statements are an integral part of this statement.
13
Statement of Changes in Net Assets – Columbia Connecticut Tax-Exempt Fund
| Year ended October 31, | | 2011 | | 2010 | |
| Operations | |
| Net investment income | | $ | 3,186,103 | | | $ | 3,308,362 | | |
| Net realized gain | | | 698,124 | | | | 1,036,161 | | |
| Net change in unrealized appreciation (depreciation) | | | (1,238,343 | ) | | | 3,026,239 | | |
| Net increase in net assets resulting from operations | | | 2,645,884 | | | | 7,370,762 | | |
| Distributions to shareholders from: | |
| Net investment income | |
| Class A | | | (2,683,637 | ) | | | (2,776,559 | ) | |
| Class B | | | (50,316 | ) | | | (132,812 | ) | |
| Class C | | | (369,894 | ) | | | (390,366 | ) | |
| Class Z | | | (83,208 | ) | | | (8 | ) | |
| Net realized gains | |
| Class A | | | (594,077 | ) | | | — | | |
| Class B | | | (19,492 | ) | | | — | | |
| Class C | | | (98,272 | ) | | | — | | |
| Class Z | | | (19 | ) | | | — | | |
| Total distributions to shareholders | | | (3,898,915 | ) | | | (3,299,745 | ) | |
| Decrease in net assets from share transactions | | | (210,877 | ) | | | (3,272,801 | ) | |
| Total increase (decrease) in net assets | | | (1,463,908 | ) | | | 798,216 | | |
| Net assets at beginning of year | | | 95,444,735 | | | | 94,646,519 | | |
| Net assets at end of year | | $ | 93,980,827 | | | $ | 95,444,735 | | |
| Undistributed net investment income | | $ | 256,661 | | | $ | 264,184 | | |
The Accompanying Notes to Financial Statements are an integral part of this statement.
14
Statement of Changes in Net Assets (continued) – Columbia Connecticut Tax-Exempt Fund
| Year ended October 31, | | 2011 | | 2010 | |
| | | Shares | | Dollars ($) | | Shares | | Dollars ($) | |
| Capital stock activity | |
| Class A shares | |
| Subscriptions | | | 585,007 | | | | 4,472,771 | | | | 928,429 | | | | 7,200,812 | | |
| Distributions reinvested | | | 270,923 | | | | 2,047,754 | | | | 217,692 | | | | 1,688,970 | | |
| Redemptions | | | (1,740,760 | ) | | | (13,109,732 | ) | | | (1,005,564 | ) | | | (7,813,492 | ) | |
| Net increase (decrease) | | | (884,830 | ) | | | (6,589,207 | ) | | | 140,557 | | | | 1,076,290 | | |
| Class B shares | |
| Subscriptions | | | 3,716 | | | | 28,135 | | | | 1,185 | | | | 9,158 | | |
| Distributions reinvested | | | 4,841 | | | | 36,420 | | | | 9,815 | | | | 75,849 | | |
| Redemptions | | | (241,989 | ) | | | (1,820,736 | ) | | | (560,373 | ) | | | (4,330,376 | ) | |
| Net decrease | | | (233,432 | ) | | | (1,756,181 | ) | | | (549,373 | ) | | | (4,245,369 | ) | |
| Class C shares | |
| Subscriptions | | | 145,694 | | | | 1,105,102 | | | | 195,027 | | | | 1,521,650 | | |
| Distributions reinvested | | | 36,914 | | | | 279,090 | | | | 25,057 | | | | 194,364 | | |
| Redemptions | | | (337,484 | ) | | | (2,515,782 | ) | | | (234,963 | ) | | | (1,822,244 | ) | |
| Net decrease | | | (154,876 | ) | | | (1,131,590 | ) | | | (14,879 | ) | | | (106,230 | ) | |
| Class Z shares | |
| Subscriptions | | | 1,422,522 | | | | 11,074,956 | | | | 313 | | | | 2,500 | | |
| Distributions reinvested | | | 10,643 | | | | 83,045 | | | | 1 | | | | 8 | | |
| Redemptions | | | (242,669 | ) | | | (1,891,900 | ) | | | — | | | | — | | |
| Net increase | | | 1,190,496 | | | | 9,266,101 | | | | 314 | | | | 2,508 | | |
| Total net decrease | | | (82,642 | ) | | | (210,877 | ) | | | (423,381 | ) | | | (3,272,801 | ) | |
The Accompanying Notes to Financial Statements are an integral part of this statement.
15
Financial Highlights – Columbia Connecticut Tax-Exempt Fund
The following tables are intended to help you understand the Fund's financial performance. Certain information reflects financial results for a single share of a class held for the periods shown. Per share net investment income (loss) amounts are calculated based on average shares outstanding during the period. Total returns assume reinvestment of all dividends and distributions. Total returns do not reflect payment of sales charges, if any, and are not annualized for periods of less than one year.
| | | Year ended Oct. 31, | |
| | | 2011 | | 2010 | | 2009 | | 2008 | | 2007 | |
| Class A | |
| Per share data | |
| Net asset value, beginning of period | | $ | 7.89 | | | $ | 7.56 | | | $ | 6.95 | | | $ | 7.71 | | | $ | 7.92 | | |
| Income from investment operations: | |
| Net investment income | | | 0.28 | | | | 0.28 | | | | 0.27 | | | | 0.28 | | | | 0.28 | | |
| Net realized and unrealized gain (loss) | | | (0.00 | )(a) | | | 0.33 | | | | 0.63 | | | | (0.68 | ) | | | (0.12 | ) | |
| Total from investment operations | | | 0.28 | | | | 0.61 | | | | 0.90 | | | | (0.40 | ) | | | 0.16 | | |
| Less distributions to shareholders from: | |
| Net investment income | | | (0.28 | ) | | | (0.28 | ) | | | (0.27 | ) | | | (0.27 | ) | | | (0.28 | ) | |
| Net realized gains | | | (0.06 | ) | | | — | | | | (0.02 | ) | | | (0.09 | ) | | | (0.09 | ) | |
| Total distributions to shareholders | | | (0.34 | ) | | | (0.28 | ) | | | (0.29 | ) | | | (0.36 | ) | | | (0.37 | ) | |
| Net asset value, end of period | | $ | 7.83 | | | $ | 7.89 | | | $ | 7.56 | | | $ | 6.95 | | | $ | 7.71 | | |
| Total return | | | 3.85 | % | | | 8.14 | % | | | 13.18 | % | | | (5.36 | %) | | | 2.03 | % | |
| Ratios to average net assets(b) | |
| Expenses prior to fees waived or expenses reimbursed | | | 1.07 | % | | | 1.05 | % | | | 1.01 | % | | | 0.99 | % | | | 0.97 | % | |
| Net expenses after fees waived or expenses reimbursed(c) | | | 0.81 | %(d) | | | 0.84 | %(d) | | | 0.84 | %(d) | | | 0.84 | %(d) | | | 0.84 | %(d) | |
| Net investment income | | | 3.74 | %(d) | | | 3.57 | %(d) | | | 3.67 | %(d) | | | 3.73 | %(d) | | | 3.61 | %(d) | |
| Supplemental data | |
| Net assets, end of period (in thousands) | | $ | 72,272 | | | $ | 79,875 | | | $ | 75,465 | | | $ | 67,265 | | | $ | 84,351 | | |
| Portfolio turnover | | | 24 | % | | | 17 | % | | | 7 | % | | | 10 | % | | | 14 | % | |
| Notes to Financial Highlights | |
(a) Rounds to less than $0.01.
(b) In addition to the fees and expenses which the Fund bears directly, the Fund indirectly bears a pro rata share of the fees and expenses of the acquired funds in which it invests. Such indirect expenses are not included in the reported expense ratios.
(c) The Investment Manager and certain of its affiliates agreed to waive/reimburse certain fees and expenses, if applicable.
(d) The benefits derived from expense reductions had an impact of less than 0.01%.
The Accompanying Notes to Financial Statements are an integral part of this statement.
16
Financial Highlights (continued) – Columbia Connecticut Tax-Exempt Fund
| | | Year ended Oct. 31, | |
| | | 2011 | | 2010 | | 2009 | | 2008 | | 2007 | |
| Class B | |
| Per share data | |
| Net asset value, beginning of period | | $ | 7.89 | | | $ | 7.56 | | | $ | 6.95 | | | $ | 7.71 | | | $ | 7.92 | | |
| Income from investment operations: | |
| Net investment income | | | 0.23 | | | | 0.22 | | | | 0.21 | | | | 0.22 | | | | 0.22 | | |
| Net realized and unrealized gain (loss) | | | (0.00 | )(a) | | | 0.33 | | | | 0.63 | | | | (0.67 | ) | | | (0.12 | ) | |
| Total from investment operations | | | 0.23 | | | | 0.55 | | | | 0.84 | | | | (0.45 | ) | | | 0.10 | | |
| Less distributions to shareholders from: | |
| Net investment income | | | (0.23 | ) | | | (0.22 | ) | | | (0.21 | ) | | | (0.22 | ) | | | (0.22 | ) | |
| Net realized gains | | | (0.06 | ) | | | — | | | | (0.02 | ) | | | (0.09 | ) | | | (0.09 | ) | |
| Total distributions to shareholders | | | (0.29 | ) | | | (0.22 | ) | | | (0.23 | ) | | | (0.31 | ) | | | (0.31 | ) | |
| Net asset value, end of period | | $ | 7.83 | | | $ | 7.89 | | | $ | 7.56 | | | $ | 6.95 | | | $ | 7.71 | | |
| Total return | | | 3.07 | % | | | 7.34 | % | | | 12.34 | % | | | (6.07 | %) | | | 1.27 | % | |
| Ratios to average net assets(b) | |
| Expenses prior to fees waived or expenses reimbursed | | | 1.83 | % | | | 1.80 | % | | | 1.76 | % | | | 1.74 | % | | | 1.72 | % | |
| Net expenses after fees waived or expenses reimbursed(c) | | | 1.57 | %(d) | | | 1.59 | %(d) | | | 1.59 | %(d) | | | 1.59 | %(d) | | | 1.59 | %(d) | |
| Net investment income | | | 3.00 | %(d) | | | 2.85 | %(d) | | | 2.94 | %(d) | | | 2.98 | %(d) | | | 2.86 | %(d) | |
| Supplemental data | |
| Net assets, end of period (in thousands) | | $ | 984 | | | $ | 2,835 | | | $ | 6,871 | | | $ | 10,860 | | | $ | 17,026 | | |
| Portfolio turnover | | | 24 | % | | | 17 | % | | | 7 | % | | | 10 | % | | | 14 | % | |
| Notes to Financial Highlights | |
(a) Rounds to less than $0.01.
(b) In addition to the fees and expenses which the Fund bears directly, the Fund indirectly bears a pro rata share of the fees and expenses of the acquired funds in which it invests. Such indirect expenses are not included in the reported expense ratios.
(c) The Investment Manager and certain of its affiliates agreed to waive/reimburse certain fees and expenses, if applicable.
(d) The benefits derived from expense reductions had an impact of less than 0.01%.
The Accompanying Notes to Financial Statements are an integral part of this statement.
17
Financial Highlights (continued) – Columbia Connecticut Tax-Exempt Fund
| | | Year ended Oct. 31, | |
| | | 2011 | | 2010 | | 2009 | | 2008 | | 2007 | |
| Class C | |
| Per share data | |
| Net asset value, beginning of period | | $ | 7.89 | | | $ | 7.56 | | | $ | 6.95 | | | $ | 7.71 | | | $ | 7.92 | | |
| Income from investment operations: | |
| Net investment income | | | 0.25 | | | | 0.24 | | | | 0.24 | | | | 0.25 | | | | 0.24 | | |
| Net realized and unrealized gain (loss) | | | (0.00 | )(a) | | | 0.33 | | | | 0.63 | | | | (0.68 | ) | | | (0.12 | ) | |
| Total from investment operations | | | 0.25 | | | | 0.57 | | | | 0.87 | | | | (0.43 | ) | | | 0.12 | | |
| Less distributions to shareholders from: | |
| Net investment income | | | (0.25 | ) | | | (0.24 | ) | | | (0.24 | ) | | | (0.24 | ) | | | (0.24 | ) | |
| Net realized gains | | | (0.06 | ) | | | — | | | | (0.02 | ) | | | (0.09 | ) | | | (0.09 | ) | |
| Total distributions to shareholders | | | (0.31 | ) | | | (0.24 | ) | | | (0.26 | ) | | | (0.33 | ) | | | (0.33 | ) | |
| Net asset value, end of period | | $ | 7.83 | | | $ | 7.89 | | | $ | 7.56 | | | $ | 6.95 | | | $ | 7.71 | | |
| Total return | | | 3.37 | % | | | 7.66 | % | | | 12.67 | % | | | (5.79 | %) | | | 1.57 | % | |
| Ratios to average net assets(b) | |
| Expenses prior to fees waived or expenses reimbursed | | | 1.82 | % | | | 1.80 | % | | | 1.76 | % | | | 1.74 | % | | | 1.72 | % | |
| Net expenses after fees waived or expenses reimbursed(c) | | | 1.26 | %(d) | | | 1.29 | %(d) | | | 1.29 | %(d) | | | 1.29 | %(d) | | | 1.29 | %(d) | |
| Net investment income | | | 3.29 | %(d) | | | 3.12 | %(d) | | | 3.22 | %(d) | | | 3.28 | %(d) | | | 3.16 | %(d) | |
| Supplemental data | |
| Net assets, end of period (in thousands) | | $ | 11,413 | | | $ | 12,732 | | | $ | 12,311 | | | $ | 11,565 | | | $ | 12,890 | | |
| Portfolio turnover | | | 24 | % | | | 17 | % | | | 7 | % | | | 10 | % | | | 14 | % | |
| Notes to Financial Highlights | |
(a) Rounds to less than $0.01.
(b) In addition to the fees and expenses which the Fund bears directly, the Fund indirectly bears a pro rata share of the fees and expenses of the acquired funds in which it invests. Such indirect expenses are not included in the reported expense ratios.
(c) The Investment Manager and certain of its affiliates agreed to waive/reimburse certain fees and expenses, if applicable.
(d) The benefits derived from expense reductions had an impact of less than 0.01%.
The Accompanying Notes to Financial Statements are an integral part of this statement.
18
Financial Highlights (continued) – Columbia Connecticut Tax-Exempt Fund
| | | Year ended Oct. 31, | |
| | | 2011 | | 2010(a) | |
| Class Z | |
| Per share data | |
| Net asset value, beginning of period | | $ | 7.89 | | | $ | 7.98 | | |
| Income from investment operations: | |
| Net investment income | | | 0.30 | | | | 0.03 | | |
| Net realized and unrealized loss | | | (0.01 | ) | | | (0.09 | ) | |
| Total from investment operations | | | 0.29 | | | | (0.06 | ) | |
| Less distributions to shareholders from: | |
| Net investment income | | | (0.30 | ) | | | (0.03 | ) | |
| Net realized gains | | | (0.06 | ) | | | — | | |
| Total distributions to shareholders | | | (0.36 | ) | | | (0.03 | ) | |
| Net asset value, end of period | | $ | 7.82 | | | $ | 7.89 | | |
| Total return | | | 3.94 | % | | | (0.79 | %) | |
| Ratios to average net assets(b) | |
| Expenses prior to fees waived or expenses reimbursed | | | 0.82 | % | | | 0.81 | %(c) | |
| Net expenses after fees waived or expenses reimbursed(d) | | | 0.54 | %(e) | | | 0.60 | %(c)(e) | |
| Net investment income (loss) | | | 3.90 | %(e) | | | 3.70 | %(c)(e) | |
| Supplemental data | |
| Net assets, end of period (in thousands) | | $ | 9,311 | | | $ | 2 | | |
| Portfolio turnover | | | 24 | % | | | 17 | % | |
| Notes to Financial Highlights | |
(a) For the period from September 27, 2010 (commencement of operations) to October 31, 2010.
(b) In addition to the fees and expenses which the Fund bears directly, the Fund indirectly bears a pro rata share of the fees and expenses of the acquired funds in which it invests. Such indirect expenses are not included in the reported expense ratios.
(c) Annualized.
(d) The Investment Manager and certain of its affiliates agreed to waive/reimburse certain fees and expenses, if applicable.
(e) The benefits derived from expense reductions had an impact of less than 0.01%.
The Accompanying Notes to Financial Statements are an integral part of this statement.
19
Notes to Financial Statements – Columbia Connecticut Tax-Exempt Fund
October 31, 2011
Note 1. Organization
Columbia Connecticut Tax-Exempt Fund (the Fund), a series of Columbia Funds Series Trust I (the Trust), is a non-diversified fund. The Trust is registered under the Investment Company Act of 1940, as amended (the 1940 Act), as an open-end management investment company organized as a Massachusetts business trust.
The Fund's shareholders approved a change in the classification of the Fund from a diversified fund to a non-diversified fund at a meeting held on Feburary 15, 2011.
Fund Shares
The Trust may issue an unlimited number of shares (without par value). The Fund offers Class A, Class B, Class C and Class Z shares. All share classes have identical voting, dividend and liquidation rights. Each share class has its own expense structure and sales charges, as applicable.
Class A shares are subject to a maximum front-end sales charge of 4.75% based on the initial investment amount. Class A shares purchased without an initial sales charge in accounts aggregating $1 million to $50 million at the time of purchase are subject to a contingent deferred sales charge (CDSC) if the shares are sold within 18 months of purchase, charged as follows: 1.00% CDSC if redeemed within 12 months of purchase, and 0.50% CDSC if redeemed more than 12, but less than 18, months after purchase.
Class B shares may be subject to a maximum CDSC of 5.00% based upon the holding period after purchase. Class B shares will generally convert to Class A shares eight years after purchase. The Fund no longer accepts investments by new or existing investors in the Fund's Class B shares, except in connection with the reinvestment of any dividend and/or capital gain distributions in Class B shares of the Fund and exchanges by existing Class B shareholders of certain other funds within the Columbia Family of Funds.
Class C shares are subject to a 1.00% CDSC on shares redeemed within one year of purchase.
Class Z shares are not subject to sales charges, and are only available to certain investors, as described in the Fund's prospectus.
Note 2. Summary of Significant Accounting Policies
Use of Estimates
The preparation of financial statements in accordance with U.S. generally accepted accounting principles (GAAP) requires management to make certain estimates and assumptions that affect the reported amounts of assets and liabilities, the disclosure of contingent assets and liabilities at the date of the financial statements and the reported amounts of revenue and expenses during the reporting period. Actual results could differ from those estimates.
The following is a summary of significant accounting policies consistently followed by the Fund in the preparation of its financial statements.
Security Valuation
Debt securities generally are valued by pricing services approved by the Board of Trustees (the Board) based upon market transactions for normal, institutional-size trading units of similar securities. The services may use various pricing techniques which take into account appropriate factors such as yield, quality, coupon rate, maturity, type of issue, trading characteristics and other data, as well as broker quotes. Debt securities for which quotations are readily available may also be valued based upon an over-the-counter or exchange bid quotation.
Investments in other open-end investment companies, including money market funds, are valued at net asset value.
Short-term securities purchased within 60 days to maturity are valued at amortized cost, which approximates market value. The value of short-term securities originally purchased with maturities greater than 60 days is determined based on an amortized value to par upon reaching 60 days to maturity. Short-term securities maturing in more than 60 days from the valuation date are valued at the market price or approximate market value based on current interest rates.
Investments for which market quotations are not readily available, or that have quotations which management believes are not reliable, are valued at fair value as determined in good faith under consistently applied procedures established by and
20
Columbia Connecticut Tax-Exempt Fund, October 31, 2011
under the general supervision of the Board. If a security or class of securities (such as foreign securities) is valued at fair value, such value is likely to be different from the last quoted market price for the security. The determination of fair value often requires significant judgment. To determine fair value, management may use assumptions including but not limited to future cash flows and estimated risk premiums. Multiple inputs from various sources may be used to determine value.
Security Transactions
Security transactions are accounted for on the trade date. Cost is determined and gains (losses) are based upon the specific identification method for both financial statement and federal income tax purposes.
Income Recognition
Interest income is recorded on the accrual basis. Market premium and discount are amortized and accreted, respectively, on all debt securities, unless otherwise noted. Original issue discount is accreted to interest income over the life of the security with a corresponding increase in the cost basis, if any.
Dividend income is recorded on the ex-dividend date.
Expenses
General expenses of the Trust are allocated to the Fund and other funds of the Trust based upon relative net assets or other expense allocation methodologies determined by the nature of the expense. Expenses directly attributable to the Fund are charged to the Fund. Expenses directly attributable to a specific class of shares are charged to that share class.
Determination of Class Net Asset Value
All income, expenses (other than class-specific expenses, which are charged to that share class, as shown in the Statement of Operations) and realized and unrealized gains (losses) are allocated to each class of the Fund on a daily basis for purposes of determining the net asset value of each class. Income and expenses are allocated to each class based on the settled shares method, while realized and unrealized gains (losses) are allocated based on the relative net assets of each class.
Federal Income Tax Status
The Fund intends to qualify each year as a regulated investment company under Subchapter M of the Internal Revenue Code, as amended, and will distribute substantially all of its tax exempt or taxable income (including net short-term capital gains), if any, for its tax year, and as such will not be subject to federal income taxes. In addition, the Fund intends to distribute in each calendar year substantially all of its net investment income, capital gains and certain other amounts, if any, such that the Fund should not be subject to federal excise tax. Therefore, no federal income or excise tax provision is recorded.
Distributions to Shareholders
Distributions from net investment income are declared daily and paid monthly. Net realized capital gains, if any, are distributed at least annually. Income distributions and capital gain distributions are determined in accordance with federal income tax regulations which may differ from GAAP.
Guarantees and Indemnifications
Under the Trust's organizational documents and, in some cases, by contract, its officers and trustees are indemnified against certain liabilities arising out of the performance of their duties to the Trust or its funds. In addition, certain of the Fund's contracts with its service providers contain general indemnification clauses. The Fund's maximum exposure under these arrangements is unknown since the amount of any future claims that may be made against the Fund cannot be determined, and the Fund has no historical basis for predicting the likelihood of any such claims.
Recent Accounting Pronouncement
Fair Value Measurements and Disclosures
In May 2011, the Financial Accounting and Standards Board issued ASU No. 2011-04 modifying Topic 820, Fair Value Measurements and Disclosures. At the same time, the International Accounting Standards Board issued International Financial Reporting Standard 13, Fair Value Measurement. The objective of the FASB and IASB is convergence of their guidance on fair value measurements and disclosures.
21
Columbia Connecticut Tax-Exempt Fund, October 31, 2011
Specifically, ASU No. 2011-04 requires reporting entities to disclose i) the amounts of any transfers between Level 1 and Level 2, and the reasons for the transfers, ii) for Level 3 fair value measurements, a) quantitative information about significant unobservable inputs used, b) a description of the valuation processes used by the reporting entity and c) a narrative description of the sensitivity of the fair value measurement to changes in unobservable inputs if a change in those inputs might result in a significantly higher or lower fair value measurement. The effective date of ASU No. 2011-04 is for interim and annual periods beginning after December 15, 2011. At this time, management is evaluating the implications of this guidance and the impact it will have on the financial statement amounts and footnote disclosures, if any.
Note 3. Fees and Compensation Paid to Affiliates
Investment Management Fees
Under an Investment Management Services Agreement (IMSA), Columbia Management Investment Advisers, LLC (the Investment Manager), a wholly-owned subsidiary of Ameriprise Financial, Inc. (Ameriprise Financial), determines which securities will be purchased, held or sold. Effective March 1, 2011, the management fee is an annual fee that is equal to a percentage of the Fund's average daily net assets that declines from 0.40% to 0.27% as the Fund's net assets increase. Prior to March 1, 2011, the annual management fee was equal to a percentage of the Fund's pro-rata portion of the combined average daily net assets of the Fund, Columbia California Tax-Exempt Fund, Columbia Massachusetts Tax-Exempt Fund and Columbia New York Tax-Exempt Fund (collectively, combined daily net assets) at a rate that declined from 0.50% to 0.40% as the combined daily net assets increased. The effective management fee rate for the year ended October 31, 2011 was 0.43% of the Fund's average daily net assets.
Administration Fees
Under an Administrative Services Agreement, the Investment Manager serves as the Fund Administrator. Effective March 1, 2011, the Fund pays the Fund Administrator an annual fee for administration and accounting services equal to a percentage of the Fund's average daily net assets that declines from 0.07% to 0.04% as the Fund's net assets increase. Prior to March 1, 2011, the Investment Manager did not receive a fee for its services under the Administration Services Agreement. The effective administration fee rate for the year ended October 31, 2011 was 0.05% of the Fund's average daily net assets.
Pricing and Bookkeeping Fees
Prior to May 16, 2011, the Fund had entered into a Financial Reporting Services Agreement (the Financial Reporting Services Agreement) with State Street Bank and Trust Company (State Street) and the Investment Manager pursuant to which State Street provided financial reporting services to the Fund. The Fund also entered into an Accounting Services Agreement (collectively with the Financial Reporting Services Agreement, the State Street Agreements) with State Street and the Investment Manager pursuant to which State Street provided accounting services to the Fund. Under the State Street Agreements, the Fund paid State Street an annual fee of $38,000 paid monthly plus an additional monthly fee based on an annualized percentage rate of average daily net assets of the Fund for the month. The aggregate fee did not exceed $140,000 per year (exclusive of out-of-pocket expenses and charges). The Fund also reimbursed State Street for certain out-of-pocket expenses and charges. Effective May 16, 2011, these services are now provided under the Administrative Services Agreement discussed above.
Compensation of Board Members
Board members are compensated for their services to the Fund as disclosed in the Statement of Operations. The Trust's eligible Trustees may participate in a Deferred Compensation Plan (the Plan) which may be terminated at any time. Obligation of the Plan will be paid solely out of the Fund's assets.
Compensation of Chief Compliance Officer
The Board has appointed a Chief Compliance Officer to the Fund in accordance with federal securities regulations. The Fund, along with other affiliated funds, pays its pro-rata share of the expenses associated with the Chief Compliance Officer. The Fund's expenses for the Chief Compliance Officer will not exceed $15,000 per year.
22
Columbia Connecticut Tax-Exempt Fund, October 31, 2011
Transfer Agent Fees
Under a Transfer and Dividend Disbursing Agent Agreement, Columbia Management Investment Services Corp. (the Transfer Agent), an affiliate of the Investment Manager and a wholly-owned subsidiary of Ameriprise Financial, is responsible for providing transfer agency services to the Fund. The Transfer Agent has contracted with Boston Financial Data Services (BFDS) to serve as sub-transfer agent.
The Transfer Agent receives monthly account-based service fees based on the number of open accounts and is reimbursed by the Fund for the fees and expenses the Transfer Agent pays to financial intermediaries that maintain omnibus accounts with the Fund that is a percentage of the average aggregate value of the Fund's shares maintained in each such omnibus account (other than omnibus accounts for which American Enterprise Investment Services Inc. is the broker of record or accounts where the beneficial shareholder is a customer of Ameriprise Financial Services, Inc., which are paid a per account fee). The Transfer Agent pays the fees of BFDS for services as sub-transfer agent and is not entitled to reimbursement for such fees from the Fund (with the exception of out-of-pocket fees).
The Transfer Agent also receives compensation from fees for various shareholder services and reimbursements for certain out-of-pocket expenses.
For the year ended October 31, 2011, the Fund's effective transfer agent fee rates as a percentage of average daily net assets of each class were as follows:
| Class A | | | 0.10 | % | |
| Class B | | | 0.10 | | |
| Class C | | | 0.10 | | |
| Class Z | | | 0.06 | | |
An annual minimum account balance fee of $20 may apply to certain accounts with a value below the Fund's initial minimum investment requirements to reduce the impact of small accounts on transfer agent fees. These minimum account balance fees are recorded as part of expense reductions in the Statement of Operations. For the year ended October 31, 2011, these minimum account balance fees reduced total expenses by $180.
Distribution and Service Fees
The Fund has an agreement with Columbia Management Investment Distributors, Inc. (the Distributor), an affiliate of the Investment Manager and a wholly-owned subsidiary of Ameriprise Financial, for distribution and shareholder services. Pursuant to Rule 12b-1 under the 1940 Act, the Board has approved, and the Fund has adopted, distribution and shareholder service plans (the Plans) which set the distribution and service fees for the Fund. These fees are calculated daily and are intended to compensate the Distributor and/or eligible selling and/or servicing agents for selling shares of the Fund and providing services to investors.
Effective July 1, 2011, the Plans require the payment of a monthly service fee to the Distributor at the maximum annual rate of 0.25% of the average daily net assets attributable to Class A, Class B and Class C shares of the Fund. Prior to July 1, 2011, the Fund paid a montly service fee to the Distributor which was equal to 0.10% annually of the net assets atributable to shares of the Fund issued prior to December 1, 1994 and 0.25% annually of the net assets attributable to shares issued thereafter. The arrangement resulted in an annual rate of service fee for all shares that was a blend between the 0.10% and 0.25% rates. For the period November 1, 2010 through October 31, 2011, the Fund's annualized effective service fee rate was 0.25%, 0.24% and 0.25% of the Fund's average daily net assets attributable to Class A, Class B and Class C shares, respectively.
The Plans also require the payment of a monthly distribution fee to the Distributor at the maximum annual rate of 0.75% of the average daily net assets attributable to Class B and Class C shares only.
The Distributor has voluntarily agreed to waive a portion of the distribution fee for Class C shares so that the combined distribution and service fee does not exceed 0.45% annually of the average daily net assets attributable to Class C shares. This arrangement may be modified or terminated by the Distributor at any time.
Sales Charges
Sales charges, including front-end charges and CDSCs, received by the Distributor for distributing Fund shares were $56,626 for Class A, $1,768 for Class B and $204 for Class C shares for the year ended October 31, 2011.
23
Columbia Connecticut Tax-Exempt Fund, October 31, 2011
Expenses Waived/Reimbursed by the Investment Manager and its Affiliates
Effective March 1, 2011, the Investment Manager and certain of its affiliates have contractually agreed to waive fees and/or reimburse expenses (excluding certain fees and expenses described below), through February 29, 2012, unless sooner terminated at the sole discretion of the Board, so that the Fund's net operating expenses, after giving effect to fees waived/expenses reimbursed and any balance credits and/or overdraft charges from the Fund's custodian, do not exceed the following annual rates as a percentage of the class' average daily net assets:
| Class A | | | 0.79 | % | |
| Class B | | | 1.54 | | |
| Class C | | | 1.54 | | |
| Class Z | | | 0.55 | | |
Under the agreement, the following fees and expenses are excluded from the waiver/reimbursement commitment, and therefore will be paid by the Fund, if applicable: taxes (including foreign transaction taxes), expenses associated with investments in affiliated and non-affiliated pooled investment vehicles (including mutual funds and exchange traded funds), transaction costs and brokerage commissions, costs related to any securities lending program, dividend expenses associated with securities sold short, inverse floater program fees and expenses, transaction charges and interest on borrowed money, interest, extraordinary expenses and any other expenses the exclusion of which is specifically approved by the Board. This agreement may be modified or amended only with approval from all parties. Class C distribution fees waived by the Distributor, as discussed above, are in addition to the waiver/reimbursement commitment under the agreement.
Prior to March 1, 2011, the Investment Manager voluntarily agreed to reimburse a portion of the Fund's expenses (excluding certain expenses, such as brokerage commissions, interest, taxes and extraordinary expenses, but including custodian charges relating to overdrafts, if any) so that the Fund's ordinary net operating expenses, after giving effect to fees waived/expenses reimbursed and any balance credits and/or overdraft charges from the Fund's custodian, did not exceed the following annual rates as a percentage of the class' average daily net assets:
| Class A | | | 0.84 | % | |
| Class B | | | 1.59 | | |
| Class C | | | 1.59 | | |
| Class Z | | | 0.60 | | |
Note 4. Federal Tax Information
The timing and character of income and capital gain distributions are determined in accordance with income tax regulations, which may differ from GAAP because of temporary or permanent book to tax differences.
For the year ended October 31, 2011, permanent differences are primarily due to market discount/premium. In the Statement of Assets and Liabilities the following reclassifications were made among the components of the Fund's net assets due to permanent differences:
| Undistributed net investment income | | $ | (6,571 | ) | |
| Accumulated net realized gain | | | (7,195 | ) | |
| Paid-in capital | | | 13,766 | | |
Net investment income and net realized gains (losses), as disclosed in the Statement of Operations, and net assets were not affected by this reclassification.
The tax character of distributions paid during the years indicated was as follows:
| Year ended October 31, | | 2011 | | 2010 | |
| Ordinary Income | | $ | 5,921 | | | $ | — | | |
| Long-Term Capital Gains | | | 711,860 | | | | — | | |
| Tax-Exempt Income | | | 3,181,134 | | | | 3,299,745 | | |
Short-term capital gain distributions, if any, are considered ordinary income distributions for tax purposes.
24
Columbia Connecticut Tax-Exempt Fund, October 31, 2011
At October 31, 2011, the components of distributable earnings on a tax basis were as follows:
| Undistributed tax-exempt income | | $ | 540,445 | | |
| Undistributed accumulated long-term gain | | | 646,655 | | |
| Unrealized appreciation | | | 3,442,941 | | |
At October 31, 2011, the cost of investments for federal income tax purposes was $89,436,853 and the aggregate gross unrealized appreciation and depreciation based on that cost was:
| Unrealized appreciation | | $ | 4,463,685 | | |
| Unrealized depreciation | | $ | (1,020,745 | ) | |
| Net unrealized appreciation | | $ | 3,442,940 | | |
Note 5. Portfolio Information
The cost of purchases and proceeds from sales of securities, excluding short-term obligations, aggregated to $20,536,278 and $21,525,484, respectively, for the year ended October 31, 2011.
Note 6. Lending of Portfolio Securities
Effective May 16, 2011, the Fund has entered into a Master Securities Lending Agreement (the Agreement) with JPMorgan Chase Bank, N.A. (JPMorgan). The Agreement, which replaces the previous security lending arrangement with State Street, authorizes JPMorgan as lending agent to lend securities to authorized borrowers in order to generate additional income on behalf of the Fund. Pursuant to the Agreement, the securities loaned are secured by cash or U.S. government securities equal to at least 100% of the market value of the loaned securities. Any additional collateral required to maintain those levels due to market fluctuations of the loaned securities is delivered the following business day. Cash collateral received is invested by the lending agent on behalf of the Fund into authorized investments pursuant to the Agreement. The investments made with the cash collateral are listed in the Portfolio of Investments. The values of such investments and any uninvested cash collateral are disclosed in the Statement of Assets and Liabilities along with the related obligation to return the collateral upon the return of the securities loaned. For the year ended October 31, 2011, the Fund did not participate in securities lending activity.
Risks of delay in recovery of securities or even loss of rights in the securities may occur should the borrower of the securities fail financially. Risks may also arise to the extent that the value of the securities loaned increases above the value of the collateral received. JPMorgan will indemnify the Fund from losses resulting from a borrower's failure to return a loaned security when due. Such indemnification does not extend to losses associated with declines in the value of cash collateral investments. The Investment Manager is not responsible for any losses incurred by the Fund in connection with the securities lending program. Loans are subject to termination by the Fund or the borrower at any time, and are, therefore, not considered to be illiquid investments.
Pursuant to the Agreement, the Fund receives income for lending its securities either in the form of fees or by earning interest on invested cash collateral, net of negotiated rebates paid to borrowers and fees paid to the lending agent for services provided and any other securities lending expenses. The Fund continues to earn and accrue interest and dividends on the securities loaned.
Prior to May 16, 2011, the Fund participated in a securities lending arrangement with State Street. Each security on loan was collateralized in an amount at least equal to the market value of the securities loaned plus accrued income from the investment of collateral. The income generated by the investment of the collateral, net of any fees remitted to State Street as the lending agent and borrower rebates, was paid to the Fund.
Note 7. Custody Credits
Prior to May 16, 2011, the Fund had an agreement with its custodian bank under which custody fees may have been reduced by balance credits. These credits are recorded as part of expense reductions on the Statement of Operations. The Fund could have invested a portion of the assets utilized in connection with the expense offset arrangement in an income-producing asset if they had not entered into such an agreement. Subsequent to this date, the Fund may invest its daily balance in an affiliated money market fund as detailed below. For the period November 1, 2010 through May 16, 2011, credits reduced total expenses by $6.
25
Columbia Connecticut Tax-Exempt Fund, October 31, 2011
Note 8. Shareholder Concentration
At October 31, 2011, two shareholder accounts owned 32.9% of the outstanding shares of the Fund. Subscription and redemption activity of these accounts may have a significant effect on the operations of the Fund.
Note 9. Line of Credit
The Fund has entered into a revolving credit facility with a syndicate of banks led by JPMorgan Chase Bank, N.A. (the Administrative Agent), whereby the Fund may borrow for the temporary funding of shareholder redemptions or for other temporary or emergency purposes. The credit facility became effective on May 16, 2011, replacing a prior credit facility. The credit facility agreement which is a collective agreement between the Fund and certain other funds managed by the Investment Manager, severally and not jointly, permits collective borrowings up to $500,000,000.
Interest is charged to each participating fund based on its borrowings at a rate equal to the sum of the federal funds rate plus (i) 1.25% per annum plus (ii) if one-month LIBOR exceeds the federal funds rate, the amount of such excess. Each borrowing under the credit facility matures no later than 60 days after the date of borrowing. The Fund also pays a commitment fee equal to its pro rata share of the amount of the credit facility at a rate of 0.10% per annum.
For the period March 28, 2011 through May 15, 2011, the Fund and certain other funds managed by the Investment Manager participated in a $225,000,000 committed, unsecured revolving credit facility provided by State Street. Prior to March 28, 2011, the collective borrowing amount of the credit facility was $280,000,000. Interest was charged to each fund based on its borrowings at a rate equal to the greater of the (i) federal funds rate plus 1.25% per annum or (ii) the overnight LIBOR rate plus 1.25% per annum. The Fund also paid a commitment fee equal to its pro rata share of the amount of the credit facility at a rate of 0.125% per annum.
Effective December 13, 2011, the Fund extended its revolving credit facility with the Administrative Agent. The credit facility agreement, as amended, permits collective borrowings up to $500 million. Effective December 13, 2011, interest is charged to each participating fund based on its borrowings at a rate equal to the higher of (i) the overnight federal funds rate plus 1.00% or (i) the one-month LIBOR rate plus 1.00%. Each borrowing under the credit facility matures no later than 60 days after the date of borrowing. The Fund also pays a commitment fee equal to its pro rata share of the amount of the credit facility at a rate of 0.08% per annum.
The Fund had no borrowings during the year ended October 31, 2011.
Note 10. Significant Risks
Non-Diversification Risk
A non-diversified fund is permitted to invest a greater percentage of its total assets in fewer companies than a diversified fund. The Fund may, therefore, have a greater risk of loss from a few issuers than a similar fund that invests more broadly.
Geographic Concentration Risk
Because state-specific tax-exempt funds invest primarily in the municipal securities issued by the state and political sub-divisions of the state, the Fund will be particularly affected by political and economic conditions and developments in the state in which it invests. The Fund may, therefore, have a greater risk than that of a municipal bond fund which is more geographically diversified. The value of the municipal securities owned by the Fund also may be adversely affected by future changes in federal or state income tax laws.
Tax Development Risk
The Fund purchases municipal securities whose interest, in the opinion of bond counsel, is free from federal income tax. There is no assurance that the Internal Revenue Service (IRS) will agree with this opinion. In the event the IRS determines that an issuer does not comply with relevant tax requirements, interest payments from a security could become federally taxable, possibly retroactively to the date the security was issued. As a shareholder of the Fund, you may be required to file an amended tax return as a result.
Sector Focus Risk
The Fund may focus its investments in certain sectors, subjecting it to greater risk than a fund that that invests in a wider range of industries.
26
Columbia Connecticut Tax-Exempt Fund, October 31, 2011
Note 11. Subsequent Events
Management has evaluated the events and transactions that have occurred through the date the financial statements were issued. Other than as noted in Note 9 above, there were no items requiring adjustment of the financial statements or additional disclosure.
Note 12. Information Regarding Pending and Settled Legal Proceedings
In June 2004, an action captioned John E. Gallus et al. v. American Express Financial Corp. and American Express Financial Advisors Inc. was filed in the United States District Court for the District of Arizona. The plaintiffs allege that they are investors in several American Express Company mutual funds (branded as Columbia) and they purport to bring the action derivatively on behalf of those funds under the Investment Company Act of 1940. The plaintiffs allege that fees allegedly paid to the defendants by the funds for investment advisory and administrative services are excessive. The plaintiffs seek remedies including restitution and rescission of investment advisory and distribution agreements. The plaintiffs voluntarily agreed to transfer this case to the United States District Court for the District of Minnesota (the District Court). In response to defendants' motion to dismiss the complaint, the District Court dismissed one of plaintiffs' four claims and granted plaintiffs limited discovery. Defendants moved for summary judgment in April 2007. Summary judgment was granted in the defendants' favor on July 9, 2007. The plaintiffs filed a notice of appeal with the Eighth Circuit Court of Appeals (the Eighth Circuit) on August 8, 2007. On April 8, 2009, the Eighth Circuit reversed summary judgment and remanded to the District Court for further proceedings. On August 6, 2009, defendants filed a writ of certiorari with the U.S. Supreme Court (the Supreme Court), asking the Supreme Court to stay the District Court proceedings while the Supreme Court considers and rules in a case captioned Jones v. Harris Associates, which involves issues of law similar to those presented in the Gallus case. On March 30, 2010, the Supreme Court issued its ruling in Jones v. Harris Associates, and on April 5, 2010, the Supreme Court vacated the Eighth Circuit's decision in the Gallus case and remanded the case to the Eighth Circuit for further consideration in light of the Supreme Court's decision in Jones v. Harris Associates. On June 4, 2010, the Eighth Circuit remanded the Gallus case to the District Court for further consideration in light of the Supreme Court's decision in Jones v. Harris Associates. On December 9, 2010, the District Court reinstated its July 9, 2007 summary judgment order in favor of the defendants. On January 10, 2011, plaintiffs filed a notice of appeal with the Eighth Circuit. In response to the plaintiffs' opening appellate brief filed on March 18, 2011, the defendants filed a response brief on May 4, 2011 with the Eighth Circuit. The plaintiffs filed a reply brief on May 26, 2011 and oral arguments took place on November 17, 2011.
In December 2005, without admitting or denying the allegations, American Express Financial Corporation (AEFC, which is now known as Ameriprise Financial, Inc. (Ameriprise Financial)), entered into settlement agreements with the Securities and Exchange Commission (SEC) and Minnesota Department of Commerce (MDOC) related to market timing activities. As a result, AEFC was censured and ordered to cease and desist from committing or causing any violations of certain provisions of the Investment Advisers Act of 1940, the Investment Company Act of 1940, and various Minnesota laws. AEFC agreed to pay disgorgement of $10 million and civil money penalties of $7 million. AEFC also agreed to retain an independent distribution consultant to assist in developing a plan for distribution of all disgorgement and civil penalties ordered by the SEC in accordance with various undertakings detailed at www.sec.gov/litigation/admin/ia-2451.pdf. Ameriprise Financial and its affiliates have cooperated with the SEC and the MDOC in these legal proceedings, and have made regular reports to the funds' Boards of Trustees.
Ameriprise Financial and certain of its affiliates have historically been involved in a number of legal, arbitration and regulatory proceedings, including routine litigation, class actions, and governmental actions, concerning matters arising in connection with the conduct of their business activities. Ameriprise Financial believes that the Funds are not currently the subject of, and that neither Ameriprise Financial nor any of its affiliates are the subject of, any pending legal, arbitration or regulatory proceedings that are likely to have a material adverse effect on the Funds or the ability of Ameriprise Financial or its affiliates to perform under their contracts with the Funds. Ameriprise Financial is required to make 10-Q, 10-K and, as necessary, 8-K filings with the Securities and Exchange Commission on legal and regulatory
27
Columbia Connecticut Tax-Exempt Fund, October 31, 2011
matters that relate to Ameriprise Financial and its affiliates. Copies of these filings may be obtained by accessing the SEC website at www.sec.gov.
There can be no assurance that these matters, or the adverse publicity associated with them, will not result in increased fund redemptions, reduced sale of fund shares or other adverse consequences to the Funds. Further, although we believe proceedings are not likely to have a material adverse effect on the Funds or the ability of Ameriprise Financial or its affiliates to perform under their contracts with the Funds, these proceedings are subject to uncertainties and, as such, we are unable to estimate the possible loss or range of loss that may result. An adverse outcome in one or more of these proceedings could result in adverse judgments, settlements, fines, penalties or other relief that could have a material adverse effect on the consolidated financial condition or results of operations of Ameriprise Financial.
28
Report of Independent Registered Public Accounting Firm
To the Trustees of Columbia Funds Series Trust I and the Shareholders of Columbia Connecticut Tax-Exempt Fund
In our opinion, the accompanying statement of assets and liabilities, including the investment portfolio, and the related statements of operations and of changes in net assets and the financial highlights present fairly, in all material respects, the financial position of Columbia Connecticut Tax-Exempt Fund (the "Fund") (a series of Columbia Funds Series Trust I) at October 31, 2011, and the results of its operations for the year then ended, the changes in its net assets for each of the two years in the period then ended and the financial highlights for each of the periods indicated, in conformity with accounting principles generally accepted in the United States of America. These financial statements and financial highlights (hereafter referred to as "financial statements") are the responsibility of the Fund's management. Our responsibility is to express an opinion on these financial statements based on our audits. We conducted our audits of these financial statements in accordance with the standards of the Public Company Accounting Oversight Board (United States). Those standards require that we plan and perform the audit to obtain reasonable assurance about whether the financial statements are free of material misstatement. An audit includes examining, on a test basis, evidence supporting the amounts and disclosures in the financial statements, assessing the accounting principles used and significant estimates made by management, and evaluating the overall financial statement presentation. We believe that our audits, which included confirmation of securities at October 31, 2011 by correspondence with the custodian and brokers, provide a reasonable basis for our opinion.
PricewaterhouseCoopers LLP
Minneapolis, Minnesota
December 22, 2011
29
Federal Income Tax Information (Unaudited) – Columbia Connecticut Tax-Exempt Fund
The Fund hereby designates as a capital gain dividend with respect to the fiscal year ended October 31, 2011, $704,830, or, if subsequently determined to be different, the net capital gain of such year.
For the fiscal year ended October 31, 2011, 99.81% of the distributions from net investment income of the Fund qualifies as exempt interest dividends for federal income tax purposes. A portion of the income may be subject to federal alternative minimum tax.
The Fund will notify shareholders in January 2012 of amounts for use in preparing 2011 income tax returns.
30
Fund Governance
The Trustees serve terms of indefinite duration. The names, addresses and birth years of the Trustees and Officers of the Funds in Columbia Funds Series Trust I, the year each was first elected or appointed to office, their principal business occupations during at least the last five years, the number of Funds overseen by each Trustee and other directorships they hold are shown below. Each officer listed below serves as an officer of each Fund in Columbia Funds Series Trust I.
Independent Trustees
Name, Address and Year of Birth,
Position with Funds, Year First
Elected or Appointed to Office | | Principal Occupation(s) During Past Five Years, Number of Funds in Columbia
Funds Complex Overseen by Trustee, Other Directorships Held
| |
| Rodman L. Drake (Born 1943) | |
|
c/o Columbia Management
Investment Advisers, LLC
225 Franklin Street
Boston, MA 02110
Trustee (since 1994) and Chairman of the Board (since 2009) | | Independent consultant since 2010; Co-Founder of Baringo Capital LLC (private equity) from 1997 to 2008; CEO of Crystal River Capital, Inc. (real estate investment trust) from 2003 to 2010; Oversees 43; Jackson Hewitt Tax Service Inc. (tax preparation services from 2004 to 2011); Celgene Corporation (global biotechnology company); Student Loan Corporation (student loan provider from 2008 to 2010); Celgene Corporation (global biotechnology company); The Helios Funds and Brookfield Funds (closed-end funds); Crystal River Capital, Inc. from 2005 to 2010; Parson Brinckerhoff from 1995 to 2008; and Apex Silver Mines Ltd. from 2007 to 2009 | |
|
| Douglas A. Hacker (Born 1955) | |
|
c/o Columbia Management
Investment Advisers, LLC
225 Franklin Street
Boston, MA 02110
Trustee (since 1996) | | Independent business executive since May 2006; Executive Vice President—Strategy of United Airlines from December 2002 to May 2006; President of UAL Loyalty Services (airline marketing company) from September 2001 to December 2002; Executive Vice President and Chief Financial Officer of United Airlines from July 1999 to September 2001. Oversees 43; Nash Finch Company (food distributor); Aircastle Limited (aircraft leasing); and SeaCube Container Leasing Ltd (container leasing) | |
|
| Janet Langford Kelly (Born 1957) | |
|
c/o Columbia Management
Investment Advisers, LLC
225 Franklin Street
Boston, MA 02110
Trustee (since 1996) | | Senior Vice President, General Counsel and Corporate Secretary, ConocoPhillips (integrated energy company) since September 2007; Deputy General Counsel—Corporate Legal Services, ConocoPhillips from August 2006 to August 2007; Partner, Zelle, Hofmann, Voelbel, Mason & Gette LLP (law firm) from March 2005 to July 2006; Adjunct Professor of Law, Northwestern University, from September 2004 to June 2006; Director, UAL Corporation (airline) from February 2006 to July 2006; Oversees 43; None | |
|
| Nancy T. Lukitsh (Born 1956) | |
|
c/o Columbia Management
Investment Advisers, LLC
225 Franklin Street
Boston, MA 02110
Trustee (since 2011) | | Senior Vice President, Partner and Director, Marketing of Wellington Management Company, LLP (investment adviser) from 1997 to 2010; Chair, Wellington Management Investment Portfolios (commingled non-U.S. investment pools) from 2007 to 2010; Director, Wellington Trust Company, NA and other Wellington affiliates from 1997 to 2010. Oversees 43; None | |
|
31
Fund Governance (continued)
Independent Trustees (continued)
Name, Address and Year of Birth,
Position with Funds, Year First
Elected or Appointed to Office | | Principal Occupation(s) During Past Five Years, Number of Funds in Columbia
Funds Complex Overseen by Trustee, Other Directorships Held
| |
| William E. Mayer (Born 1940) | |
|
c/o Columbia Management
Investment Advisers, LLC
225 Franklin Street
Boston, MA 02110
Trustee (since 1994) | | Partner, Park Avenue Equity Partners (private equity) since February 1999; Dean and Professor, College of Business and Management, University of Maryland from 1992 to 1996. Oversees 43; DynaVox Inc. (speech creation); Lee Enterprises (print media); WR Hambrecht + Co. (financial service provider); BlackRock Kelso Capital Corporation (investment company) | |
|
| David M. Moffett (Born 1952) | |
|
c/o Columbia Management
Investment Advisers, LLC
225 Franklin Street
Boston, MA 02110
Trustee (since 2011) | | Retired. Chief Executive Officer, Federal Home Loan Mortgage Corporation, from 2008 to 2009; Senior Adviser, Global Financial Services Group, Carlyle Group, Inc., from 2007 to 2008; Vice Chairman and Chief Financial Officer, U.S. Bancorp, from 1993 to 2007. Oversees 43; CIT Group Inc. (commercial and consumer finance), eBay Inc. (online trading community), MBIA Corp (financial service provider), E.W. Scripps Co. (print and television media), Building Materials Holding Corp. (building materials and construction services), and University of Oklahoma Foundation. | |
|
| Charles R. Nelson (Born 1942) | |
|
c/o Columbia Management
Investment Advisers, LLC
225 Franklin Street
Boston, MA 02110
Trustee (since 1981) | | Retired Professor Emeritus, University of Washington, since 2011; Professor of Economics, University of Washington, from January 1976 to 2011; Ford and Louisa Van Voorhis Professor of Political Economy, University of Washington, from 1993 to 2011; Adjunct Professor of Statistics, University of Washington, from 1980 to 2011; Associate Editor, Journal of Money Credit and Banking from 1993 to 2008; consultant on econometric and statistical matters. Oversees 43; None | |
|
| John J. Neuhauser (Born 1943) | |
|
c/o Columbia Management
Investment Advisers, LLC
225 Franklin Street
Boston, MA 02110
Trustee (since 1984) | | President, Saint Michael's College, since August 2007; Director or Trustee of several non-profit organizations, including Fletcher Allen Health Care, Inc.; University Professor, Boston College from November 2005 to August 2007; Academic Vice President and Dean of Faculties, Boston College from August 1999 to October 2005. Oversees 43; Liberty All-Star Equity Fund and Liberty All-Star Growth Fund (closed-end funds) | |
|
| Patrick J. Simpson (Born 1944) | |
|
c/o Columbia Management
Investment Advisers, LLC
225 Franklin Street
Boston, MA 02110
Trustee (since 2000) | | Partner, Perkins Coie LLP (law firm). Oversees 43; None | |
|
| Anne-Lee Verville (Born 1945) | |
|
c/o Columbia Management
Investment Advisers, LLC
225 Franklin Street
Boston, MA 02110
Trustee (since 1998) | | Retired since 1997 (formerly General Manager–Global Education Industry from 1994 to 1997, President–Application Systems Division from 1991 to 1994, Chief Financial Officer–US Marketing & Services from 1988 to 1991, and Chief Information Officer from 1987 to 1988, IBM Corporation (computer and technology)). Oversees 43; Enesco Group, Inc. (producer of giftware and home and garden decor products) from 2001 to 2006 | |
|
32
Fund Governance (continued)
Interested Trustee
Name, Address and Year of Birth,
Position with Funds, Year First
Elected or Appointed to Office | | Principal Occupation(s) During Past Five Years, Number of Funds in Columbia
Funds Complex Overseen by Trustee, Other Directorships Held
| |
| Michael A. Jones (born 1959) | |
|
c/o Columbia Management
Investment Advisers, LLC
225 Franklin Street
Boston, MA 02110
Trustee (since 2011)
Senior Vice President (since 2011) | | President and Director, Columbia Management Investment Advisers, LLC since May 2010; President and Director, Columbia Management Investment Distributors, Inc. since May 2010; Manager, Chairman, Chief Executive Officer and President, Columbia Management Advisors, LLC from 2007 to April 2010; Chief Executive Officer, President and Director, Columbia Management Distributors, Inc. from November 2006 to April 2010; previously, co-president and senior managing director at Robeco Investment Management. Oversees 43; None | |
|
The Statement of Additional Information includes additional information about the Trustees of the Funds and is available, without charge, upon request by calling 1-800-345-6611.
Officers
| Name, Year of Birth and Address | | Principal Occupation(s) During the Past Five Years | |
| J. Kevin Connaughton (Born 1964) | |
|
225 Franklin Street
Boston, MA 02110
President (since 2009) | | Senior Vice President and General Manager–Mutual Fund Products, Columbia Management Investment Advisers, LLC since May 2010; President, Columbia Funds, since 2009, and RiverSource Funds, since May 2010 (previously Senior Vice President and Chief Financial Officer, Columbia Funds, from June 2008 to January 2009, Treasurer, Columbia Funds, from October 2003 to May 2008, and senior officer of various other affiliated funds since 2000); Managing Director, Columbia Management Advisors, LLC from December 2004 to April 2010. | |
|
| Michael G. Clarke (Born 1969) | |
|
225 Franklin Street
Boston, MA 02110
Treasurer (since 2011) and Chief
Financial Officer (since 2009) | | Vice President, Columbia Management Investment Advisers, LLC since May 2010; Managing Director of Fund Administration, Columbia Management Advisors, LLC, from September 2004 to April 2010; senior officer of Columbia Funds and affiliated funds since 2002. | |
|
| Scott R. Plummer (Born 1959) | |
|
5228 Ameriprise Financial Center
Minneapolis, MN 55474
Senior Vice President, Assistant Secretary
and Chief Legal Officer (since 2010) | | Chief Legal Officer and Assistant Secretary, Columbia Management Investment Advisers, LLC since June 2005; Vice President and Lead Chief Counsel–Asset Management, Ameriprise Financial, Inc. since May 2010 (previously Vice President and Chief Counsel–Asset Management, from 2005 to April 2010, and Vice President–Asset Management Compliance from 2004 to 2005); Vice President, Chief Counsel and Assistant Secretary, Columbia Management Investment Distributors, Inc. since 2008; Vice President, General Counsel and Secretary, Ameriprise Certificate Company since 2005; Chief Counsel, RiverSource Distributors, Inc. since 2006; Vice President, General Counsel and Secretary, RiverSource Funds, since December 2006; Senior Vice President, Secretary and Chief Legal Officer, Columbia Funds, since May 2010. | |
|
33
Fund Governance (continued)
Officers (continued)
| Name, Year of Birth and Address | | Principal Occupation(s) During the Past Five Years | |
| Linda J. Wondrack (Born 1964) | |
|
225 Franklin Street
Boston, MA 02110
Senior Vice President and Chief
Compliance Officer (since 2007) | | Vice President and Chief Compliance Officer, Columbia Management Investment Advisers, LLC since May 2010; Chief Compliance Officer, Columbia Funds, since 2007, and RiverSource Funds, since May 2010; Director (Columbia Management Group, LLC and Investment Product Group Compliance), Bank of America, from June 2005 to April 2010; Director of Corporate Compliance and Conflicts Officer of MFS Investment Management (investment management) from August 2004 to May 2005. | |
|
| William F. Truscott (Born 1960) | |
|
53600 Ameriprise Financial Center
Minneapolis, MN 55474
Senior Vice President (since 2010) | | Chairman of the Board, Columbia Management Investment Advisers, LLC since May 2010 (previously President, Chairman of the Board and Chief Investment Officer, from 2001 to April 2010); Chief Executive Officer, U.S. Asset Management & President, Annuities, Ameriprise Financial, Inc. since May 2010 (previously President–U.S. Asset Management and Chief Investment Officer from 2005 to April 2010, and Senior Vice President—Chief Investment Officer, from 2001 to 2005); Director, President and Chief Executive Officer, Ameriprise Certificate Company since 2006; Director, Columbia Management Investment Distributors, Inc. since May 2010 (previously Chairman of the Board and Chief Executive Officer from 2008 to April 2010); Chairman of the Board and Chief Executive Officer, RiverSource Distributors, Inc. since 2006. | |
|
| Colin Moore (Born 1958) | |
|
225 Franklin Street
Boston, MA 02110
Senior Vice President (since 2010) | | Director and Chief Investment Officer, Columbia Management Investment Advisers, LLC since May 2010; Manager, Managing Director and Chief Investment Officer of Columbia Management Advisors, LLC from 2007 to April 2010; Head of Equities, Columbia Management Advisors, LLC from 2002 to 2007. | |
|
| Amy Johnson (Born 1965) | |
|
5228 Ameriprise Financial Center
Minneapolis, MN 55474
Vice President (since 2010) | | Senior Vice President and Chief Operating Officer, Columbia Management Investment Advisers, LLC since May 2010 (previously Chief Administrative Officer, from 2009 until April 2010, Vice President—Asset Management and Trust Company Services, from 2006 to 2009, and Vice President—Operations and Compliance from 2004 to 2006). | |
|
| Joseph F. DiMaria (Born 1968) | |
|
225 Franklin Street
Boston, MA 02110
Vice President (since 2011) and
Chief Accounting Officer (since 2008) | | Vice President, Mutual Fund Administration, Columbia Management Investment Advisers, LLC, since May 2010; Director of Fund Administration, Columbia Management Advisors, LLC from January 2006 to April 2010; Head of Tax/Compliance and Assistant Treasurer, Columbia Management Advisors, LLC, from November 2004 to December 2005. | |
|
| Stephen T. Welsh (born 1957) | |
|
225 Franklin Street
Boston, MA 02110
Vice President (since 2006) | | President and Director, Columbia Management Investment Services Corp. since May 2010; President and Director, Columbia Management Services, Inc. from July 2004 to April 2010; Managing Director, Columbia Management Distributors, Inc. from August 2007 to April 2010. | |
|
34
Fund Governance (continued)
Officers (continued)
| Name, Year of Birth and Address | | Principal Occupation(s) During the Past Five Years | |
| Paul D. Pearson (born 1956) | |
|
5228 Ameriprise Financial Center
Minneapolis, MN 55474
Vice President and Assistant
Treasurer (since 2011) | | Vice President, Investment Accounting, Columbia Management Investment Advisers, LLC, since May 2010; Vice President, Managed Assets, Investment Accounting, Ameriprise Financial Corporation. | |
|
| Paul B. Goucher (born 1968) | |
|
5228 Ameriprise Financial Center
Minneapolis, MN 55474
Vice President and Assistant
Secretary (since 2010) | | Vice President and Chief Counsel of Ameriprise Financial since January 2010 (formerly Vice President and Group Counsel from November 2008 to January 2010); Director, Managing Director and General Counsel of J. & W. Seligman & Co. Incorporated (Seligman) from July 2008 to November 2008 and Managing Director and Associate General Counsel of Seligman from January 2005 to July 2008. | |
|
| Christopher O. Petersen (born 1970) | |
|
5228 Ameriprise Financial Center
Minneapolis, MN 55474
Vice President (since 2010) and
Secretary (since 2011) | | Vice President and Chief Counsel, Ameriprise Financial since January 2010 (formerly Vice President and Group Counsel or Counsel from April 2004 to January 2010); Assistant Secretary of RiverSource Funds since January 2007. | |
|
| Michael E. DeFao (born 1968) | |
|
5228 Ameriprise Financial Center
Minneapolis, MN 55474
Vice President and Assistant
Secretary (since 2011) | | Vice President and Chief Counsel, Ameriprise Financial since May 2010; Associate General Counsel Bank of America from June 2005 to April 2010 | |
|
35
This page intentionally left blank.
Important Information About This Report
The fund mails one shareholder report to each shareholder address. If you would like more than one report, please call shareholder services at 1-800-345-6611 and additional reports will be sent to you. This report has been prepared for shareholders of Columbia Connecticut Tax-Exempt Fund.
A description of the policies and procedures that the fund uses to determine how to vote proxies and a copy of the fund's voting records are available (i) at www.columbiamanagement.com, (ii) on the Securities and Exchange Commission's website at www.sec.gov, and (iii) without charge, upon request, by calling 1-800-368-0346. Information regarding how the fund voted proxies relating to portfolio securities during the 12-month period ended June 30 is available from the SEC's website. Information regarding how the fund voted proxies relating to portfolio securities is also available from the fund's website, www.columbiamanagement.com.
The fund files a complete schedule of portfolio holdings with the SEC for the first and third quarters of each fiscal year on Form N-Q. The fund's Form N-Q is available on the SEC's website at www.sec.gov and may be reviewed and copied at the SEC's Public Reference Room in Washington, D.C. Information on the operation of the Public Reference Room may be obtained by calling 1-800-SEC-0330.
Transfer Agent
Columbia Management Investment
Services Corp.
P.O. Box 8081
Boston, MA 02266-8081
1-800-345-6611
Distributor
Columbia Management Investment
Distributors, Inc.
225 Franklin Street
Boston, MA 02110
Investment Manager
Columbia Management Investment Advisers, LLC
225 Franklin Street
Boston, MA 02110
37

Columbia Connecticut Tax-Exempt Fund
P. O. Box 8081
Boston, MA 02266-8081
columbiamanagement.com
This information is for use with concurrent or prior delivery of a fund prospectus. Investors should consider the investment objectives, risks, charges and expenses of a mutual fund carefully before investing. For a free prospectus, which contains this and other important information about the funds, visit columbiamanagement.com. Read the prospectus carefully before investing. The Fund is distributed by Columbia Management Investment Distributors, Inc., member FINRA, and managed by Columbia Management Investment Advisers, LLC.
© 2011 Columbia Management Investment Advisers, LLC. All rights reserved.
C-1011 C (12/11)

Columbia Massachusetts Tax-Exempt Fund
Annual Report for the Period Ended October 31, 2011
Not FDIC insured • No bank guarantee • May lose value
Table of Contents
| Fund Profile | | | 1 | | |
|
| Performance Information | | | 2 | | |
|
| Understanding Your Expenses | | | 3 | | |
|
| Portfolio Manager's Report | | | 4 | | |
|
| Portfolio of Investments | | | 6 | | |
|
Statement of Assets and
Liabilities | | | 11 | | |
|
| Statement of Operations | | | 13 | | |
|
Statement of Changes in
Net Assets | | | 14 | | |
|
| Financial Highlights | | | 16 | | |
|
| Notes to Financial Statements | | | 20 | | |
|
Report of Independent Registered
Public Accounting Firm | | | 28 | | |
|
| Federal Income Tax Information | | | 29 | | |
|
| Fund Governance | | | 30 | | |
|
Important Information About
This Report | | | 37 | | |
|
The views expressed in this report reflect the current views of the respective parties. These views are not guarantees of future performance and involve certain risks, uncertainties and assumptions that are difficult to predict, so actual outcomes and results may differ significantly from the views expressed. These views are subject to change at any time based upon economic, market or other conditions and the respective parties disclaim any responsibility to update such views. These views may not be relied on as investment advice and, because investment decisions for a Columbia Fund are based on numerous factors, may not be relied on as an indication of trading intent on behalf of any particular Columbia Fund. References to specific securities should not be construed as a recommendation or investment advice.
President's Message

Dear Shareholders,
Economic momentum slowed in the third quarter of 2011, raising the odds of recession and making the U.S. economy more susceptible to financial shocks. The unemployment rate remained stalled as growing uncertainty continued to weigh on prospective employers. Monthly indicators for the manufacturing and service sectors also showed signs of slowing. Equity and high-yield bond markets fell sharply as investor confidence was shaken by Europe's lingering debt crisis, a heated debate in Washington over fiscal deficits (which eventually led to a downgrade of U.S. government debt) and tepid economic growth. The U.S. stock market experienced its worst quarter in two years during the third quarter of 2011, with volatility and selling pressure reminiscent of the market selloff in 2008, as macro-economic concerns continued to mount.
During its September meeting, the Federal Reserve Board announced that it was prepared to purchase longer term securities and sell shorter term securities in an effort to keep long-term interest rates down. Their hope is that lower long-term borrowing rates will stimulate business investment and hiring. However, the question remains as to whether monetary policy alone will be enough to resuscitate growth in the current environment.
Despite this challenging and volatile economic backdrop, I believe Columbia Management remains strong and steadfast. Columbia Management is the eighth largest manager of long-term mutual fund assets with $325 billion under management as of September 30, 2011. The past year has been one of considerable change for the organization as we worked diligently to align products, services and resources in the integration of Columbia Management with RiverSource Investments. The incredible line-up of talent, resources and capabilities that has resulted is highlighted by the success of our products. As of September 30, 2011, Columbia Management offers 54 funds rated 4 and 5 stars by Morningstar. Additionally, The Wall Street Journal has named two Columbia funds "Category Kings" in its "Investing in Funds: A Quarterly Analysis" issue dated October 5, 2011 in recognition for their one-year performance as of September 30, 2011.
For more information about these and other funds offered by Columbia Management, including detailed, up-to-date fund performance and portfolio information, please visit us online at columbiamanagement.com. Other information and resources available on our website include:
g timely economic analysis and market commentary
g quarterly fund commentaries
g Columbia Management Investor, a quarterly newsletter for shareholders
Thank you for your continued support of the Columbia Funds. We look forward to serving your investment needs for many years to come.
Best Regards,

J. Kevin Connaughton
President, Columbia Funds
All ratings are Class Z as of 9/30/2011. Out of 118 Z-share Columbia funds rated by Morningstar, 8 funds received a 5-star Overall Rating and 46 funds received a 4-star Overall Rating. The Overall Morningstar Rating for a retail mutual fund is derived from a weighted average of the performance figures associated with its 3-, 5- and 10-year (if applicable) Morningstar Rating metrics. For share classes that do not have a 3-, 5-, or 10-year actual performance history, the fund's independent Morningstar Rating metric is then compared against the retail mutual fund universe breakpoints to determine its hypothetical rating.
For each fund with at least a three-year history, Morningstar calculates a Morningstar RatingTM based on a Morningstar Risk-Adjusted Return measure that accounts for variation in a fund's monthly performance (including the effects of sales charges, loads, and redemption fees), placing more emphasis on downward variations and rewarding consistent performance. The top 10% of funds in each category receive 5 stars, the next 22.5% receive 4 stars, the next 35% receive 3 stars, the next 22.5% receive 2 stars and the bottom 10% receive 1 star. (Each share class is counted as a fraction of one fund within this scale and rated separately, which may cause slight variations in the distribution percentages.)
The Morningstar RatingTM is for Class Z shares only; other classes may have different performance characteristics and may have different ratings. © 2011 Morningstar, Inc. All Rights Reserved. The Morningstar information contained herein: (1) is proprietary to Morningstar and/or its content providers; (2) may not be copied or distributed; and (3) is not warranted to be accurate, complete or timely. Neither Morningstar nor its content providers are responsible for any damages or losses arising from any use of this information.
The Wall Street Journal "Category Kings" methodology: Top-performing funds in each category ranked by one-year total returns (changes in net asset values and reinvested distributions) for the period ended September 30, 2011.
Investors should consider the investment objectives, risks, charges and expenses of a mutual fund carefully before investing. For a free prospectus, which contains this and other important information about the funds, visit www.columbiamanagement.com. The prospectus should be read carefully before investing.
Columbia Funds are distributed by Columbia Management Investment Distributors, Inc., member FINRA, and managed by Columbia Management Investment Advisers, LLC.
© 2011 Columbia Management Investment Advisers, LLC. All rights reserved.
Fund Profile – Columbia Massachusetts Tax-Exempt Fund
Summary
g For the 12-month period that ended October 31, 2011, the fund's Class A shares returned 3.37% without sales charge.
g The fund trailed its benchmarks, the Barclays Capital Massachusetts Municipal Bond Index1 and the broader Barclays Capital Municipal Bond Index2, and beat the average return of the funds in its peer group, the Lipper Massachusetts Municipal Debt Funds Classification.3
g The fund benefited from its credit quality and longer maturity positioning but was hindered by issue selection in the health care and education sectors.
Portfolio Management
Catherine Stienstra has managed the fund since October 2010 and has been associated with Columbia Management Investment Advisers, LLC or its predecessors since 2007.
1The Barclays Capital Massachusetts Municipal Bond Index is a subset of the Barclays Capital Municipal Bond Index consisting solely of bonds issued by obligors located in the commonwealth of Massachusetts.
2The Barclays Capital Municipal Bond Index is considered representative of the broad market for investment-grade, tax-exempt bonds with maturity of at least one year.
3Lipper Inc., a widely respected data provider in the industry, calculates an average total return (assuming reinvestment of distributions) for mutual funds with investment objectives similar to those of the fund. Lipper makes no adjustment for the effect of sales loads.
Indices are not available for investment, are not professionally managed and do not reflect sales charges, fees, brokerage commissions, taxes or other expenses of investing. Securities in the fund may not match those in an index.
Performance data quoted represents past performance and current performance may be lower or higher. Past performance is no guarantee of future results. The investment return and principal value will fluctuate so that shares, when redeemed, may be worth more or less than the original cost. Please visit www.columbiamanagement.com for daily and most recent month-end performance updates.
Summary
1-year return as of 10/31/11
| | | | +3.37% | |
|
|  | | | Class A shares
(without sales charge) | |
|
| | | | +3.91% | |
|
|  | | | Barclays Capital Massachusetts
Municipal Bond Index | |
|
| | | | +3.78% | |
|
|  | | | Barclays Capital
Municipal Bond Index | |
|
1
Performance Information – Columbia Massachusetts Tax-Exempt Fund
Performance data quoted represents past performance and current performance may be lower or higher. Past performance is no guarantee of future results. The investment return and principal value will fluctuate so that shares, when redeemed, may be worth more or less than the original cost. Please visit www.columbiamanagement.com for daily and most recent month-end performance updates.
Performance of a $10,000 investment 11/01/01 – 10/31/11
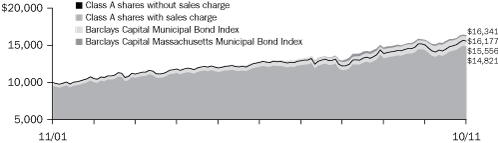
The chart above shows the change in value of a hypothetical $10,000 investment in Class A shares of Columbia Massachusetts Tax-Exempt Fund during the stated time period, and does not reflect the deduction of taxes that a shareholder may pay on fund distributions or on the redemption of fund shares.
Performance of a $10,000 investment 11/01/01 – 10/31/11 ($)
| Sales charge | | without | | with | |
| Class A | | | 15,556 | | | | 14,821 | | |
| Class B | | | 14,437 | | | | 14,437 | | |
| Class C | | | 14,875 | | | | 14,875 | | |
| Class Z | | | n/a | | | | n/a | | |
Average annual total return as of 10/31/11 (%)
| Share class | | A | | B | | C | | Z | |
| Inception | | 04/10/87 | | 06/08/92 | | 08/01/97 | | 09/01/11 | |
| Sales charge | | without | | with | | without | | with | | without | | with | | without | |
| 1-year | | | 3.37 | | | | –1.53 | | | | 2.60 | | | | –2.32 | | | | 2.92 | | | | 1.94 | | | | n/a | | |
| 5-year | | | 4.14 | | | | 3.12 | | | | 3.36 | | | | 3.02 | | | | 3.67 | | | | 3.67 | | | | n/a | | |
| 10-year/Life | | | 4.52 | | | | 4.01 | | | | 3.74 | | | | 3.74 | | | | 4.05 | | | | 4.05 | | | | 0.93 | | |
The "with sales charge" returns include the maximum initial sales charge of 4.75% for Class A shares and the applicable contingent deferred sales charge of 5.00% in the first year, declining to 1.00% in the sixth year and eliminated thereafter for Class B shares and 1.00% for Class C shares for the first year only. The "without sales charge" returns do not include the effect of sales charges. If they had, returns would be lower.
Performance results reflect any fee waivers or reimbursements of fund expenses by the Investment Manager and/or any of its affiliates. Absent these fee waivers or expense reimbursement arrangements, performance results would have been lower.
All results shown assume reinvestment of distributions. Performance for different share classes will vary based on differences in sales charges and the fees associated with each class. Please see the fund's prospectuses for details.
The tables do not reflect the deduction of taxes a shareholder may pay on fund distributions or on the redemption of fund shares.
2
Understanding Your Expenses – Columbia Massachusetts Tax-Exempt Fund
As a shareholder, you incur two types of costs. There are transaction costs, which generally include sales charges on purchases and may include redemption fees. There are also ongoing costs, which generally include management fees, distribution and service (Rule 12b-1) fees, and other fund expenses. The following information is intended to help you understand your ongoing costs (in dollars) of investing in the Fund and to compare these costs with the ongoing costs of investing in other mutual funds.
Analyzing your fund's expenses
To illustrate these ongoing costs, we provided examples and calculated the expenses paid by investors in each share class of the Fund during the period. The information in the table is based on an initial investment of $1,000 at the beginning of the period indicated and held for the entire period. Expense information is calculated two ways and each method provides you with different information. The amount listed in the "Actual" column is calculated using the Fund's actual operating expenses and total return for the period. You may use the Actual information, together with the amount invested, to estimate the expenses that you paid over the period. Simply divide your account value by $1,000 (for example, an $8,600 account value divided by $1,000 = 8.6), then multiply the results by the expenses paid during the period under the Actual column. The amount listed in the "Hypothetical" column assumes a 5% annual rate of return before expenses (which is not the Fund's actual return) and then applies the Fund's actual expense ratio for the period to the hypothetical return. You should not use the hypothetical account values and expenses to estimate either your actual account balance at the end of the period or the expenses you paid during the period. See the "Compare with other funds" information with details on using the hypothetical data.
Compare with other funds
Since all mutual funds are required to include the same hypothetical calculations about expenses in shareholder reports, you can use this information to compare the ongoing cost of investing in the Fund with other funds. To do so, compare the hypothetical example with the 5% hypothetical examples that appear in the shareholder reports of other funds. As you compare hypothetical examples of other funds, it is important to note that hypothetical examples are meant to highlight the ongoing costs of investing in a fund only and do not reflect any transaction costs, such as sales charges, or redemption or exchange fees. Therefore, the hypothetical calculations are useful in comparing ongoing costs only, and will not help you determine the relative total costs of owning different funds. If transaction costs were included in these calculations, your costs would have been higher.
05/01/11 – 10/31/11
| | | Account value at the
beginning of the period ($) | | Account value at the
end of the period ($) | | Expenses paid
during the period ($) | | Fund's annualized
expense ratio (%) | |
| | | Actual | | Hypothetical | | Actual | | Hypothetical | | Actual | | Hypothetical | | Actual | |
| Class A | | | 1,000.00 | | | | 1,000.00 | | | | 1,073.50 | | | | 1,021.22 | | | | 4.13 | | | | 4.02 | | | | 0.79 | | |
| Class B | | | 1,000.00 | | | | 1,000.00 | | | | 1,069.40 | | | | 1,017.44 | | | | 8.03 | | | | 7.83 | | | | 1.54 | | |
| Class C | | | 1,000.00 | | | | 1,000.00 | | | | 1,071.20 | | | | 1,018.95 | | | | 6.47 | | | | 6.31 | | | | 1.24 | | |
| Class Z | | | 1,000.00 | | | | 1,000.00 | | | | 1,009.30 | | | | 1,022.58 | | | | 0.84 | * | | | 2.65 | | | | 0.52 | | |
Expenses paid during the period are equal to the annualized expense ratio for each class as indicated above, multiplied by the average account value over the period and then multiplied by the number of days in the Fund's most recent fiscal half year and divided by 365.
Expenses do not include fees and expenses incurred indirectly by the Fund from the underlying funds in which the Fund may invest (also referred to as "acquired funds"), including affiliated and non-affiliated pooled investments vehicles (including mutual funds and exchange traded funds).
Had Columbia Management Investment Advisers, LLC and/or certain of its affiliates not waived/reimbursed certain fees and expenses, account value at the end of the period would have been reduced.
*For the period September 1, 2011 through October 31, 2011, Class Z shares commenced operations on September 1, 2011.
3
Portfolio Manager's Report – Columbia Massachusetts Tax-Exempt Fund
Performance data quoted represents past performance and current performance may be lower or higher. Past performance is no guarantee of future results. The investment return and principal value will fluctuate so that shares, when redeemed, may be worth more or less than the original cost. Please visit www.columbiamanagement.com for daily and most recent month-end performance updates.
Net asset value per share
as of 10/31/11 ($)
| Class A | | | 7.71 | | |
| Class B | | | 7.71 | | |
| Class C | | | 7.71 | | |
| Class Z | | | 7.71 | | |
Distributions declared per share
11/01/10 – 10/31/11 ($)
| Class A | | | 0.37 | | |
| Class B | | | 0.32 | | |
| Class C | | | 0.34 | | |
| Class Z | | | 0.05 | | |
A portion of the fund's income may be subject to the alternative minimum tax. The fund may at times purchase tax-exempt securities at a discount. Some, or all, of this discount may be included in the fund's ordinary income, and is taxable when distributed. Distributions include $0.06 per share of taxable realized gains for Class A, Class B and Class C shares.
30-day SEC yields
as of 10/31/11 (%)
| Class A | | | 3.19 | | |
| Class B | | | 2.60 | | |
| Class C | | | 2.89 | | |
| Class Z | | | 3.60 | | |
The 30-day SEC yields reflect the fund's earning power, net of expenses, expressed as an annualized percentage of the public offering price per share at the end of the period. Had the Investment Manager not waived fees or reimbursed a portion of expenses, the 30-day SEC yields would have been reduced.
For the 12-month period that ended October 31, 2011, the fund's Class A shares returned 3.37% without sales charge. The fund trailed its benchmarks, the Barclays Capital Massachusetts Municipal Bond Index and the Barclays Capital Municipal Bond Index, which returned 3.91% and 3.78%, respectively, and beat the average return of its peer group, the Lipper Massachusetts Municipal Debt Funds Classification, which was 2.80%. The fund benefited from its exposure to longer-maturity issues, which beat shorter-maturity bonds for the year, and from investments in lower quality bonds, which outperformed higher quality securities.
After a weak start, municipal bond market conditions improved
The municipal bond market got off to a difficult start in the fourth quarter of 2010 after a well-publicized but so-far erroneous prediction that the municipal bond market was ripe for massive defaults led many investors to sell municipal securities. At the same time that demand was falling, supply was increasing leading up to the 2010 year end. Yields rose, bond prices fell and the yield curve steepened into March 2011. However, market conditions, began to improve later in the spring, as credit fears eased and outflows slowed. State and local tax revenues have grown for six consecutive quarters, and new issuance slowed as many states implemented sharp budget cuts and delayed capital expenditures. As such, defaults remained scarce. The year-to-date total is just over $1 billion, mostly in non-rated sectors. Against this backdrop, municipal bond yields began to look attractive relative to Treasury yields, and investors eventually began buying municipal securities again. Over the last seven months of the period, municipal bond yields fell across all maturities, but especially on longer-term issues. Credit spreads—the difference between the yields on lower and higher quality bonds—also narrowed. As both yield and credit spreads narrowed, municipal bond returns got a boost for the year.
Positive contribution from longer maturity and credit-quality positioning
The fund's duration was longer than the duration of the Barclays Capital Municipal Bond Index, which benefited performance. (Duration is a measure of interest rate sensitivity.) Investments in longer-maturity bonds experienced the biggest price gains as yields fell. Longer-maturity bonds also offered a yield advantage over shorter-maturity issues. The fund picked up added ground from its lower quality investments, with particularly helpful issue selection in the segments rated A and lower.4 The fund did well to have no exposure to industrial development/pollution control revenue bonds, as the sector performed poorly. On the downside, security selection in the health care and education sectors detracted from performance.
Changes to positioning
During the selloff that began in late 2010, we added longer-maturity bonds because we believed they were being unfairly pressured by an unfavorable supply/demand situation in the municipal market rather than by any fundamental problems. We also significantly boosted the fund's stake in A rated securities. To fund these purchases,
4Ratings are relative and subjective and are not absolute standards of quality. The credit ratings typically range from AAA (highest) to D (lowest), and are subject to change. The credit quality of the fund's investments does not remove market risk.
4
Portfolio Manager's Report (continued) – Columbia Massachusetts Tax-Exempt Fund
we reduced exposure to high quality bonds, including AAA and pre-refunded issues. Pre-refunding occurs when an issuer sells a new bond at a lower rate to pay off the old bonds. The proceeds from the new issue are invested into an escrow account (typically short-term government securities) and the interest earned is used to pay the interest on the bonds outstanding. On the call date or maturity date, the money in the escrow account is used to pay off the bonds outstanding. We also sold bonds with potential credit concerns, including some bonds issued by continuing care retirement communities that have been hurt by the slowdown in the economy.
Next steps
Going forward, we plan to monitor closely any federal government deficit reduction proposals to determine their potential impact on the tax-exempt status of municipal bonds. At the state level, we expect the local municipal market to benefit from Massachusetts relative strengths. The Massachusetts recovery, for example, has been ahead of other states, thanks especially to the health, education and technology industries. Massachusetts benefits from a highly educated workforce with high incomes and a housing downturn that has not been as severe as in many other states. Massachusetts also maintains a very high Aa1 credit rating from Moody's. With expectations that interest rates and inflation will stay low in the coming year, we plan to continue to favor longer-maturity and lower quality issues, which offer added yields that can help boost total return. In addition, we will continue to emphasize individual security selection, relying heavily upon our proprietary credit research team. We will carefully monitor a number of potential variables and will not hesitate to adjust the fund's duration, credit quality and/or sector positioning accordingly.
Portfolio characteristics and holdings are subject to change periodically and may not be representative of current characteristics and holdings. The outlook for the fund may differ from that presented for other Columbia Funds.
Tax-exempt investing offers current tax-exempt income, but it also involves certain risks. The value of the fund will be affected by interest rate changes and the creditworthiness of issues held in the fund. When interest rates go up, bond prices generally drop and vice versa. Interest income from certain tax-exempt bonds may be subject to certain state and local taxes and, if applicable, the alternative minimum tax. Any capital gains distributed are taxable to the investor.
The fund is non-diversified, which generally means that it may invest a greater percentage of its total assets in the securities of fewer issuers than a "diversified" fund. This increases the risk that a change in the value of any one investment held by the fund could affect the overall value of the fund more than it would affect that of a diversified fund holding a greater number of investments. Accordingly, the fund's value will likely be more volatile than the value of more diversified funds.
Single-state municipal bond funds pose additional risks due to limited geographical diversification.
Taxable-equivalent SEC yields
as of 10/31/11 (%)
| Class A | | | 4.91 | | |
| Class B | | | 4.00 | | |
| Class C | | | 4.45 | | |
| Class Z | | | 5.54 | | |
Taxable-equivalent SEC yields are calculated assuming a federal tax rate of 35.0%. This tax rate does not reflect the phase out of exemptions or the reduction of the otherwise allowable deductions that occur when adjusted gross income exceeds certain levels. Your taxable-equivalent yield may be different depending on your tax bracket.
Quality breakdown
as of 10/31/11 (%)
| AAA | | | 18.1 | | |
| AA | | | 44.8 | | |
| A | | | 22.6 | | |
| BBB | | | 3.9 | | |
| BB | | | 1.9 | | |
| CCC | | | 1.3 | | |
| Non-Rated | | | 7.4 | | |
Maturity breakdown
as of 10/31/11 (%)
| 1-3 years | | | 4.2 | | |
| 3-5 years | | | 3.7 | | |
| 5-7 years | | | 6.2 | | |
| 7-10 years | | | 13.7 | | |
| 10-15 years | | | 4.4 | | |
| 15-20 years | | | 20.5 | | |
| 20-25 years | | | 19.4 | | |
| 25 years and over | | | 26.0 | | |
| Cash Equivalents | | | 1.9 | | |
Ratings shown in the quality breakdown are assigned to individual bonds by taking the lower of the ratings available from one of the following nationally recognized rating agencies: Standard & Poor's or Moody's Investor Services. If a security is rated by only one of the two agencies, that rating is used. If a security is not rated by either of the two agencies, it is designated as Non-Rated. Ratings are relative and subjective and are not absolute standards of quality. The credit quality of the fund's investments does not remove market risk.
The fund is actively managed and the composition of its portfolio will change over time. Information provided is calculated as a percentage of net assets.
5
Portfolio of Investments – Columbia Massachusetts Tax-Exempt Fund
October 31, 2011
(Percentages represent value of investments compared to net assets)
Issue
Description | | Coupon
Rate | | Principal
Amount | | Value | |
| Municipal Bonds 97.1% | |
| Advanced Refunded 7.3% | |
Massachusetts State College Building Authority(a)
Revenue Bonds
Capital Appreciation
Senior Series 1999A Escrowed to Maturity (NPFGC) | |
| 05/01/18 | | | 0.000 | % | | $ | 4,000,000 | | | $ | 3,483,360 | | |
| 05/01/23 | | | 0.000 | % | | | 3,000,000 | | | | 2,081,700 | | |
Puerto Rico Highway & Transportation Authority
Prerefunded Revenue Bonds
Series 2005BB (AGM) Escrowed to Maturity(b) | |
| 07/01/22 | | | 5.250 | % | | | 535,000 | | | | 665,182 | | |
Puerto Rico Public Finance Corp.
Revenue Bonds
Commonwealth Appropriation
Series 1998A (AMBAC)(b) | |
| 06/01/19 | | | 5.375 | % | | | 2,190,000 | | | | 2,734,171 | | |
| Total | | | 8,964,413 | | |
| Airport 4.1% | |
Massachusetts Port Authority
Revenue Bonds
Conrac Project
Series 2011A | |
| 07/01/41 | | | 5.125 | % | | | 3,000,000 | | | | 3,093,240 | | |
Massachusetts Port Authority(c)
Revenue Bonds
Bosfuel Project
Series 2007 (NPFGC/FGIC) AMT | |
| 07/01/32 | | | 5.000 | % | | | 2,000,000 | | | | 1,977,020 | | |
| Total | | | 5,070,260 | | |
| College 19.6% | |
Massachusetts Development Finance Agency
Revenue Bonds
Berklee College of Music
Series 2011 | |
| 10/01/31 | | | 5.000 | % | | | 1,160,000 | | | | 1,192,851 | | |
Boston University
Series 1999P | |
| 05/15/59 | | | 6.000 | % | | | 1,000,000 | | | | 1,124,350 | | |
| Series 2005T-1 (AMBAC) | |
| 10/01/39 | | | 5.000 | % | | | 2,000,000 | | | | 2,009,080 | | |
Holy Cross
Series 2002 (AMBAC) | |
| 09/01/32 | | | 5.250 | % | | | 1,500,000 | | | | 1,782,165 | | |
Smith College
Series 2005 | |
| 07/01/35 | | | 5.000 | % | | | 2,999,999 | | | | 3,100,170 | | |
Massachusetts Health & Educational Facilities Authority
Revenue Bonds
Boston College
Series 2008M-2 | |
| 06/01/35 | | | 5.500 | % | | | 2,500,000 | | | | 3,021,500 | | |
Harvard University
Series 1991N | |
| 04/01/20 | | | 6.250 | % | | | 2,675,000 | | | | 3,512,810 | | |
| Series 2009A | |
| 11/15/36 | | | 5.500 | % | | | 1,000,000 | | | | 1,129,760 | | |
Issue
Description | | Coupon
Rate | | Principal
Amount | | Value | |
| Municipal Bonds (continued) | |
| College (cont.) | |
Suffolk University
Series 2009A | |
| 07/01/30 | | | 6.250 | % | | $ | 1,000,000 | | | $ | 1,072,140 | | |
Tufts University
Series 2008 | |
| 08/15/38 | | | 5.375 | % | | | 1,000,000 | | | | 1,095,700 | | |
Massachusetts State College Building Authority
Refunding Revenue Bonds
Senior Series 1994A | |
| 05/01/14 | | | 7.500 | % | | | 1,825,000 | | | | 1,988,976 | | |
Revenue Bonds
Series 2008A (AGM) | |
| 05/01/38 | | | 5.000 | % | | | 3,000,000 | | | | 3,111,090 | | |
| Total | | | 24,140,592 | | |
| Electric 2.3% | |
Berkshire Wind Power Cooperative Corp.
Revenue Bonds
Series 2010-1 | |
| 07/01/30 | | | 5.250 | % | | | 1,000,000 | | | | 1,052,820 | | |
Massachusetts Development Finance Agency
Revenue Bonds
Devens Electric System
Series 2001 | |
| 12/01/30 | | | 6.000 | % | | | 1,000,000 | | | | 1,016,980 | | |
Puerto Rico Electric Power Authority
Refunding Revenue Bonds
Series 2007VV (NPFGC)(b) | |
| 07/01/29 | | | 5.250 | % | | | 750,000 | | | | 770,887 | | |
| Total | | | 2,840,687 | | |
| Health Care - Hospital 4.3% | |
Massachusetts Development Finance Agency
Revenue Bonds
UMASS Memorial Issue
Series 2011H | |
| 07/01/31 | | | 5.500 | % | | | 2,000,000 | | | | 2,023,760 | | |
Massachusetts Health & Educational Facilities Authority
Revenue Bonds
Massachusetts Eye & Ear Infirmary
Series 2010C | |
| 07/01/35 | | | 5.375 | % | | | 1,000,000 | | | | 977,020 | | |
Partners Healthcare
Series 2010J-1 | |
| 07/01/34 | | | 5.000 | % | | | 1,500,000 | | | | 1,543,185 | | |
Unrefunded Revenue Bonds
Healthcare System-Covenant
Series 2002 | |
| 07/01/31 | | | 6.000 | % | | | 790,000 | | | | 798,500 | | |
| Total | | | 5,342,465 | | |
| Health Care - Life Care Center 2.3% | |
Massachusetts Development Finance Agency
Refunding Revenue Bonds
1st Mortgage-VOA Concord
Series 2007 | |
| 11/01/41 | | | 5.200 | % | | | 1,145,000 | | | | 825,316 | | |
The Accompanying Notes to Financial Statements are an integral part of this statement.
6
Columbia Massachusetts Tax-Exempt Fund
October 31, 2011
(Percentages represent value of investments compared to net assets)
Issue
Description | | Coupon
Rate | | Principal
Amount | | Value | |
| Municipal Bonds (continued) | |
| Health Care - Life Care Center (cont.) | |
Revenue Bonds
1st Mortgage-Loomis Communities Project
Series 2002A | |
| 03/01/32 | | | 6.900 | % | | $ | 1,000,000 | | | $ | 1,013,840 | | |
Groves-Lincoln
Series 2009A | |
| 06/01/29 | | | 7.500 | % | | | 1,000,000 | | | | 1,014,350 | | |
| Total | | | 2,853,506 | | |
| Health Care - Nursing Home 1.9% | |
Massachusetts Development Finance Agency
Revenue Bonds
Linden Ponds, Inc. Facility
Series 2011A-1 | |
| 11/15/46 | | | 6.250 | % | | | 2,127,125 | | | | 1,506,792 | | |
| Series 2011A-2 | |
| 11/15/46 | | | 5.500 | % | | | 112,921 | | | | 68,310 | | |
Massachusetts Development Finance Agency(a)
Revenue Bonds
Linden Ponds, Inc. Facility
Series 2011B | |
| 11/15/56 | | | 0.000 | % | | | 561,650 | | | | 2,730 | | |
Massachusetts Industrial Finance Agency
Refunding Revenue Bonds
Chelsea Jewish
Series 1997A (FHA) | |
| 08/01/37 | | | 6.500 | % | | | 710,000 | | | | 717,987 | | |
| Total | | | 2,295,819 | | |
| Health Care - Other 1.2% | |
Massachusetts Development Finance Agency
Revenue Bonds
Boston Biomedical Research
Series 1999 | |
| 02/01/29 | | | 5.750 | % | | | 825,000 | | | | 749,372 | | |
Evergreen Center, Inc.
Series 2005 | |
| 01/01/35 | | | 5.500 | % | | | 750,000 | | | | 673,125 | | |
| Total | | | 1,422,497 | | |
| Housing - Multi-Family 2.8% | |
Massachusetts Housing Finance Agency(c)
Revenue Bonds
Series 2010C AMT | |
| 12/01/42 | | | 5.350 | % | | | 1,500,000 | | | | 1,511,220 | | |
Massachusetts Housing Finance Agency(c)(d)
Revenue Bonds
Housing
Series 2011A AMT | |
| 12/01/36 | | | 5.250 | % | | | 2,000,000 | | | | 1,994,380 | | |
| Total | | | 3,505,600 | | |
| Housing - Single Family 1.3% | |
Massachusetts Housing Finance Agency
Revenue Bonds
Series 2009-147 | |
| 06/01/28 | | | 4.800 | % | | | 1,000,000 | | | | 1,022,670 | | |
Issue
Description | | Coupon
Rate | | Principal
Amount | | Value | |
| Municipal Bonds (continued) | |
| Housing - Single Family (cont.) | |
Massachusetts Housing Finance Agency(c)
Revenue Bonds
Single Family
Series 2010-153 AMT | |
| 12/01/27 | | | 4.750 | % | | $ | 535,000 | | | $ | 521,470 | | |
| Total | | | 1,544,140 | | |
| Industrial-Pollution - IDR 1.3% | |
Boston Industrial Development Financing Authority
Revenue Bonds
Crosstown Center Project
Senior Series 2002 AMT(c)(e) | |
| 09/01/35 | | | 6.500 | % | | | 2,185,000 | | | | 1,555,807 | | |
| Miscellaneous Revenue 14.2% | |
Massachusetts Development Finance Agency
Revenue Bonds
Broad Institute
Series 2011A | |
| 04/01/37 | | | 5.250 | % | | | 3,000,000 | | | | 3,145,200 | | |
WGBH Educational Foundation
Series 2002A (AMBAC) | |
| 01/01/42 | | | 5.750 | % | | | 2,000,000 | | | | 2,205,540 | | |
| Series 2008A (AGM) | |
| 01/01/39 | | | 4.500 | % | | | 2,000,000 | | | | 1,906,420 | | |
Whitehead Institute for Biomedical Research
Series 2011 | |
| 06/01/31 | | | 5.000 | % | | | 1,365,000 | | | | 1,441,549 | | |
Massachusetts State Water Pollution Abatement
Refunding Revenue Bonds
Pool Program
Series 2006 | |
| 08/01/30 | | | 5.250 | % | | | 1,000,000 | | | | 1,215,820 | | |
Revenue Bonds
MWRA Program
Subordinated Series 1999A | |
| 08/01/17 | | | 6.000 | % | | | 2,445,000 | | | | 3,018,671 | | |
State Revolving Fund
Series 2009-14 | |
| 08/01/38 | | | 5.000 | % | | | 1,200,000 | | | | 1,306,740 | | |
Metropolitan Boston Transit Parking Corp.
Revenue Bonds
Series 2011 | |
| 07/01/36 | | | 5.250 | % | | | 3,000,000 | | | | 3,169,800 | | |
| Total | | | 17,409,740 | | |
| Sales or Use Tax 9.6% | |
Commonwealth of Massachusetts
Refunding Revenue Bonds
Series 2005 (NPFGC/FGIC) | |
| 01/01/30 | | | 5.500 | % | | | 2,500,000 | | | | 2,771,600 | | |
Massachusetts Bay Transportation Authority
Revenue Bonds
Senior Series 2006A | |
| 07/01/31 | | | 5.250 | % | | | 2,880,000 | | | | 3,423,571 | | |
| Senior Series 2008B | |
| 07/01/27 | | | 5.250 | % | | | 710,000 | | | | 861,713 | | |
The Accompanying Notes to Financial Statements are an integral part of this statement.
7
Columbia Massachusetts Tax-Exempt Fund
October 31, 2011
(Percentages represent value of investments compared to net assets)
Issue
Description | | Coupon
Rate | | Principal
Amount | | Value | |
| Municipal Bonds (continued) | |
| Sales or Use Tax (cont.) | |
Massachusetts School Building Authority
Senior Revenue Bonds
Series 2011B(d) | |
| 10/15/35 | | | 5.000 | % | | $ | 1,000,000 | | | $ | 1,074,640 | | |
Puerto Rico Sales Tax Financing Corp.(b)
Revenue Bonds
1st Subordinated
Series 2009A | |
| 08/01/37 | | | 5.750 | % | | | 2,500,000 | | | | 2,620,675 | | |
| Series 2007 | |
| 08/01/57 | | | 5.250 | % | | | 1,000,000 | | | | 1,027,050 | | |
| Total | | | 11,779,249 | | |
| School 3.5% | |
Massachusetts Development Finance Agency
Revenue Bonds
Education-Dexter School Project
Series 2007 | |
| 05/01/26 | | | 4.500 | % | | | 1,600,000 | | | | 1,617,088 | | |
Foxborough Regional Charter School
Series 2010A | |
| 07/01/42 | | | 7.000 | % | | | 1,000,000 | | | | 1,063,930 | | |
New England Center for Children
Series 1998 | |
| 11/01/18 | | | 5.875 | % | | | 630,000 | | | | 611,423 | | |
Massachusetts Industrial Finance Agency
Revenue Bonds
Cambridge Friends School
Series 1998 | |
| 09/01/18 | | | 5.750 | % | | | 1,000,000 | | | | 1,000,120 | | |
| Total | | | 4,292,561 | | |
| State 4.5% | |
Massachusetts Bay Transportation Authority
Refunding Revenue Bonds
General Transportation System
Series 1994A (FGIC) | |
| 03/01/14 | | | 7.000 | % | | | 1,250,000 | | | | 1,380,700 | | |
| Series 1992B (NPFGC) | |
| 03/01/16 | | | 6.200 | % | | | 2,025,000 | | | | 2,259,900 | | |
Revenue Bonds
General Transportation System
Series 1991 (NPFGC) | |
| 03/01/21 | | | 7.000 | % | | | 1,500,000 | | | | 1,864,905 | | |
| Total | | | 5,505,505 | | |
| Student Loan 5.2% | |
Massachusetts Educational Financing Authority
Revenue Bonds
Series 2009I | |
| 01/01/28 | | | 6.000 | % | | | 910,000 | | | | 993,911 | | |
Massachusetts Educational Financing Authority(c)
Refunding Revenue Bonds
Senior Series 2002E (AMBAC) AMT | |
| 01/01/13 | | | 5.000 | % | | | 1,340,000 | | | | 1,345,722 | | |
Revenue Bonds
Issue I
Series 2010B AMT | |
| 01/01/31 | | | 5.700 | % | | | 910,000 | | | | 926,562 | | |
Issue
Description | | Coupon
Rate | | Principal
Amount | | Value | |
| Municipal Bonds (continued) | |
| Student Loan (cont.) | |
| Series 2008H (AGM) AMT | |
| 01/01/30 | | | 6.350 | % | | $ | 680,000 | | | $ | 723,697 | | |
| Series 2011J AMT | |
| 07/01/33 | | | 5.625 | % | | | 2,360,000 | | | | 2,371,139 | | |
| Total | | | 6,361,031 | | |
| Toll Road 0.8% | |
Puerto Rico Highway & Transportation Authority
Refunding Revenue Bonds
Series 2005BB (AGM)(b) | |
| 07/01/22 | | | 5.250 | % | | | 965,000 | | | | 1,040,994 | | |
| Water & Sewer 10.9% | |
Boston Water & Sewer Commission
Refunding Revenue Bonds
Senior Series 2009A | |
| 11/01/28 | | | 5.000 | % | | | 1,250,000 | | | | 1,390,163 | | |
Revenue Bonds
Senior Series 1992A | |
| 11/01/13 | | | 5.750 | % | | | 370,000 | | | | 394,635 | | |
| Senior Series 1993A | |
| 11/01/19 | | | 5.250 | % | | | 4,750,000 | | | | 5,417,470 | | |
Massachusetts Water Resources Authority
Refunding Revenue Bonds
General
Series 2007B (AGM/TCRS) | |
| 08/01/32 | | | 5.250 | % | | | 1,150,000 | | | | 1,369,397 | | |
Revenue Bonds
General
Series 1993C Escrowed to Maturity (AMBAC/TCRS) | |
| 12/01/15 | | | 5.250 | % | | | 610,000 | | | | 674,373 | | |
| Series 1992A Escrowed to Maturity | |
| 07/15/19 | | | 6.500 | % | | | 2,100,000 | | | | 2,555,385 | | |
Unrefunded Revenue Bonds
General
Series 1993C (AMBAC/TCRS) | |
| 12/01/15 | | | 5.250 | % | | | 390,000 | | | | 430,080 | | |
| Series 1993C (TCRS) | |
| 12/01/15 | | | 5.250 | % | | | 1,070,000 | | | | 1,179,964 | | |
| Total | | | 13,411,467 | | |
Total Municipal Bonds
(Cost: $112,264,416) | | $ | 119,336,333 | | |
| | | | | Shares | | Value | |
| Money Market Funds 2.8% | |
Dreyfus Massachusetts Municipal
Money Market Fund, 0.000%(f) | | | | | 1,501,727 | | | $ | 1,501,727 | | |
JP Morgan Municipal Money
Market Fund, 0.000%(f) | | | | | 1,986,639 | | | | 1,986,639 | | |
Total Money Market Funds
(Cost: $3,488,366) | | $ | 3,488,366 | | |
Total Investments
(Cost: $115,752,782) | | | | | | $ | 122,824,699 | | |
| Other Assets & Liabilities, Net | | | | | | | 18,483 | | |
| Total Net Assets | | $ | 122,843,182 | | |
The Accompanying Notes to Financial Statements are an integral part of this statement.
8
Columbia Massachusetts Tax-Exempt Fund
October 31, 2011
| Notes to Portfolio of Investments | |
(a) Zero coupon bond.
(b) Municipal obligations include debt obligations issued by or on behalf of territories, possessions, or sovereign nations within the territorial boundaries of the United States. At October 31, 2011, the value of these securities amounted to $8,858,959 or 7.21% of net assets.
(c) At October 31, 2011, the value of securities subject to alternative minimum tax represented 10.5% of net assets.
(d) Represents a security purchased on a when-issued or delayed delivery basis.
(e) Identifies issues considered to be illiquid as to their marketability. The aggregate value of such securities at October 31, 2011 was $1,555,807, representing 1.27% of net assets. Information concerning such security holdings at October 31, 2011 was as follows:
| Security Description | | Acquisition
Dates | | Cost | |
Boston Industrial Development Financing Authority
Revenue Bonds
Crosstown Center Project
Senior Series 2002 AMT
6.500% 09/01/35 | | 09/20/02 — 04/07/08 | | $ | 2,140,853 | | |
(f) The rate shown is the seven-day current annualized yield at October 31, 2011.
AGM Assured Guaranty Municipal Corporation
AMBAC Ambac Assurance Corporation
AMT Alternative Minimum Tax
FGIC Financial Guaranty Insurance Company
FHA Federal Housing Authority
NPFGC National Public Finance Guarantee Corporation
TCRS Transferable Custodial Receipts
Generally accepted accounting principles (GAAP) require disclosure regarding the inputs and valuation techniques used to measure fair value and any changes in valuation inputs or techniques. In addition, investments shall be disclosed by major category.
The Fund categorizes its fair value measurements according to a three-level hierarchy that maximizes the use of observable inputs and minimizes the use of unobservable inputs by prioritizing that the most observable input be used when available. Observable inputs are those that market participants would use in pricing an investment based on market data obtained from sources independent of the reporting entity. Unobservable inputs are those that reflect the Fund's assumptions about the information market participants would use in pricing an investment. An investment's level within the fair value hierarchy is based on the lowest level of any input that is deemed significant to the asset or liability's fair value measurement. The input levels are not necessarily an indication of the risk or liquidity associated with investments at that level. For example, certain U.S. government securities are generally high quality and liquid, however, they are reflected as Level 2 because the inputs used to determine fair value may not always be quoted prices in an active market.
Fair value inputs are summarized in the three broad levels listed below:
• Level 1 — Valuations based on quoted prices for investments in active markets that the Fund has the ability to access at the measurement date (including NAV for open-end mutual funds). Valuation adjustments are not applied to Level 1 investments.
• Level 2 — Valuations based on other significant observable inputs (including quoted prices for similar securities, interest rates, prepayment speeds, credit risks, etc.).
• Level 3 — Valuations based on significant unobservable inputs (including the Fund's own assumptions and judgment in determining the fair value of investments).
Inputs that are used in determining fair value of an investment may include price information, credit data, volatility statistics, and other factors. These inputs can be either observable or unobservable. The availability of observable inputs can vary between investments, and is affected by various factors such as the type of investment, and the volume and level of activity for that investment or similar investments in the marketplace. The inputs will be considered by the Investment Manager, along with any other relevant factors in the calculation of an investment's fair value. The Fund uses prices and inputs that are current as of the measurement date, which may include periods of market dislocations. During these periods, the availability of prices and inputs may be reduced for many investments. This condition could cause an investment to be reclassified between the various levels within the hierarchy.
The Accompanying Notes to Financial Statements are an integral part of this statement.
9
Columbia Massachusetts Tax-Exempt Fund
October 31, 2011
| Fair Value Measurements (continued) | |
Investments falling into the Level 3 category are primarily supported by quoted prices from brokers and dealers participating in the market for those investments. However, these may be classified as Level 3 investments due to lack of market transparency and corroboration to support these quoted prices. Additionally, valuation models may be used as the pricing source for any remaining investments classified as Level 3. These models rely on one or more significant unobservable inputs and/or significant assumptions by the Investment Manager. Inputs used in valuations may include, but are not limited to, financial statement analysis, capital account balances, discount rates and estimated cash flows, and comparable company data.
The following table is a summary of the inputs used to value the Fund's investments as of October 31, 2011:
| | | Fair value at October 31, 2011 | |
| Description(a) | | Level 1
quoted prices
in active
markets for
identical assets | | Level 2
other
significant
observable
inputs(b) | | Level 3
significant
unobservable
inputs | | Total | |
| Bonds | |
| Municipal Bonds | | $ | — | | | $ | 119,336,333 | | | $ | — | | | $ | 119,336,333 | | |
| Total Bonds | | | — | | | | 119,336,333 | | | | — | | | | 119,336,333 | | |
| Other | |
| Money Market Funds | | | 3,488,366 | | | | — | | | | — | | | | 3,488,366 | | |
| Total Other | | | 3,488,366 | | | | — | | | | — | | | | 3,488,366 | | |
| Total | | $ | 3,488,366 | | | $ | 119,336,333 | | | $ | — | | | $ | 122,824,699 | | |
The Fund's assets assigned to the Level 2 input category are generally valued using the market approach, in which a security's value is determined through reference to prices and information from market transactions for similar or identical assets.
(a) See the Portfolio of Investments for all investment classifications not indicated in the table.
(b) There were no significant transfers between Levels 1 and 2 during the period.
The following table is a reconciliation of Level 3 assets for which significant unobservable inputs were used to determine fair value.
| | | Municipal Bonds | |
| Balance as of October 31, 2010 | | $ | 928,476 | | |
| Accrued discounts/premiums | | | — | | |
| Realized gain (loss) | | | (1,094,302 | ) | |
| Change in unrealized appreciation (depreciation)* | | | 881,524 | | |
| Sales | | | (715,698 | ) | |
| Purchases | | | — | | |
| Transfers into Level 3 | | | — | | |
| Transfers out of Level 3 | | | — | | |
| Balanced as of October 31, 2011 | | $ | — | | |
* Change in appreciation (depreciation) relating to securities held at October 31, 2011 was $0.
Transfers in and/or out of Level 3 are determined based on the fair value at the beginning of the period for security positions held throughout the period.
The Accompanying Notes to Financial Statements are an integral part of this statement.
10
Statement of Assets and Liabilities – Columbia Massachusetts Tax-Exempt Fund
October 31, 2011
| Assets | |
| Investments, at value | |
| (identified cost $115,752,782) | | $ | 122,824,699 | | |
| Receivable for: | |
| Investments sold | | | 1,468,050 | | |
| Capital shares sold | | | 435,941 | | |
| Interest | | | 1,823,883 | | |
| Expense reimbursement due from Investment Manager | | | 1,960 | | |
| Prepaid expense | | | 1,373 | | |
| Trustees' deferred compensation plan | | | 30,642 | | |
| Total assets | | | 126,586,548 | | |
| Liabilities | |
| Payable for: | |
| Investments purchased on a delayed delivery basis | | | 3,060,370 | | |
| Capital shares purchased | | | 141,691 | | |
| Dividend distributions to shareholders | | | 413,704 | | |
| Investment management fees | | | 4,018 | | |
| Distribution and service fees | | | 2,966 | | |
| Transfer agent fees | | | 12,658 | | |
| Administration fees | | | 703 | | |
| Chief compliance officer expenses | | | 303 | | |
| Other expenses | | | 76,311 | | |
| Trustees' deferred compensation plan | | | 30,642 | | |
| Total liabilities | | | 3,743,366 | | |
| Net assets applicable to outstanding capital stock | | $ | 122,843,182 | | |
The Accompanying Notes to Financial Statements are an integral part of this statement.
11
Statement of Assets and Liabilities (continued) – Columbia Massachusetts Tax-Exempt Fund
October 31, 2011
| Represented by | |
| Paid-in capital | | $ | 114,969,364 | | |
| Undistributed net investment income | | | 284,095 | | |
| Accumulated net realized gain | | | 517,806 | | |
| Unrealized appreciation (depreciation) on: | |
| Investments | | | 7,071,917 | | |
| Total — representing net assets applicable to outstanding capital stock | | $ | 122,843,182 | | |
| Net assets applicable to outstanding shares | |
| Class A | | $ | 111,134,178 | | |
| Class B | | $ | 1,089,470 | | |
| Class C | | $ | 10,614,487 | | |
| Class Z | | $ | 5,047 | | |
| Shares outstanding | |
| Class A | | | 14,416,213 | | |
| Class B | | | 141,324 | | |
| Class C | | | 1,376,996 | | |
| Class Z | | | 655 | | |
| Net asset value per share | |
| Class A(a) | | $ | 7.71 | | |
| Class B | | $ | 7.71 | | |
| Class C | | $ | 7.71 | | |
| Class Z | | $ | 7.71 | | |
(a) The maximum offering price per share for Class A is $8.09. The offering price is calculated by dividing the net asset value by 1.0 minus the maximum sales charge of 4.75%.
The Accompanying Notes to Financial Statements are an integral part of this statement.
12
Statement of Operations – Columbia Massachusetts Tax-Exempt Fund
Year ended October 31, 2011
| Net investment income | |
| Income: | |
| Dividends | | $ | 1,138 | | |
| Interest | | | 5,994,036 | | |
| Total income | | | 5,995,174 | | |
| Expenses: | |
| Investment management fees | | | 526,866 | | |
| Distribution fees | |
| Class B | | | 14,143 | | |
| Class C | | | 73,478 | | |
| Service fees | |
| Class A | | | 262,547 | | |
| Class B | | | 4,468 | | |
| Class C | | | 23,422 | | |
| Transfer agent fees | |
| Class A | | | 105,179 | | |
| Class B | | | 2,022 | | |
| Class C | | | 9,978 | | |
| Administration fees | | | 56,372 | | |
| Compensation of board members | | | 20,388 | | |
| Pricing and bookkeeping fees | | | 36,635 | | |
| Custodian fees | | | 8,068 | | |
| Printing and postage fees | | | 40,048 | | |
| Registration fees | | | 57,449 | | |
| Professional fees | | | 49,290 | | |
| Chief compliance officer expenses | | | 836 | | |
| Other | | | 10,630 | | |
| Total expenses | | | 1,301,819 | | |
| Fees waived or expenses reimbursed by Investment Manager and its affiliates | | | (235,695 | ) | |
| Fees waived by distributor — Class C | | | (29,383 | ) | |
| Expense reductions | | | (529 | ) | |
| Total net expenses | | | 1,036,212 | | |
| Net investment income | | | 4,958,962 | | |
| Realized and unrealized gain (loss) — net | |
| Net realized gain (loss) on: | |
| Investments | | | 838,199 | | |
| Net realized gain | | | 838,199 | | |
| Net change in unrealized appreciation (depreciation) on: | |
| Investments | | | (2,500,654 | ) | |
| Net change in unrealized depreciation | | | (2,500,654 | ) | |
| Net realized and unrealized loss | | | (1,662,455 | ) | |
| Net increase in net assets resulting from operations | | $ | 3,296,507 | | |
The Accompanying Notes to Financial Statements are an integral part of this statement.
13
Statement of Changes in Net Assets – Columbia Massachusetts Tax-Exempt Fund
| Year ended October 31, | | 2011(a) | | 2010 | |
| Operations | |
| Net investment income | | $ | 4,958,962 | | | $ | 5,340,914 | | |
| Net realized gain | | | 838,199 | | | | 1,028,757 | | |
| Net change in unrealized appreciation (depreciation) | | | (2,500,654 | ) | | | 4,154,883 | | |
| Net increase in net assets resulting from operations | | | 3,296,507 | | | | 10,524,554 | | |
| Distributions to shareholders from: | |
| Net investment income | |
| Class A | | | (4,578,207 | ) | | | (4,766,590 | ) | |
| Class B | | | (64,887 | ) | | | (159,350 | ) | |
| Class C | | | (365,495 | ) | | | (368,067 | ) | |
| Class Z | | | (33 | ) | | | — | | |
| Net realized gains | |
| Class A | | | (929,002 | ) | | | (582,482 | ) | |
| Class B | | | (26,156 | ) | | | (29,937 | ) | |
| Class C | | | (84,365 | ) | | | (50,822 | ) | |
| Total distributions to shareholders | | | (6,048,145 | ) | | | (5,957,248 | ) | |
| Decrease in net assets from share transactions | | | (9,823,746 | ) | | | (3,333,181 | ) | |
| Proceeds from regulatory settlements (Note 6) | | | — | | | | 11,587 | | |
| Total increase (decrease) in net assets | | | (12,575,384 | ) | | | 1,245,712 | | |
| Net assets at beginning of year | | | 135,418,566 | | | | 134,172,854 | | |
| Net assets at end of year | | $ | 122,843,182 | | | $ | 135,418,566 | | |
| Undistributed net investment income | | $ | 284,095 | | | $ | 440,428 | | |
(a) Class Z shares are for the period from September 1, 2011 (commencement of operations) to October 31, 2011.
The Accompanying Notes to Financial Statements are an integral part of this statement.
14
Statement of Changes in Net Assets (continued) – Columbia Massachusetts Tax-Exempt Fund
| Year ended October 31, | | 2011(a) | | 2010 | |
| | | Shares | | Dollars ($) | | Shares | | Dollars ($) | |
| Capital stock activity | |
| Class A shares | |
| Subscriptions | | | 886,416 | | | | 6,632,031 | | | | 1,435,298 | | | | 11,037,009 | | |
| Distributions reinvested | | | 464,714 | | | | 3,459,200 | | | | 428,888 | | | | 3,303,824 | | |
| Redemptions | | | (2,366,879 | ) | | | (17,515,906 | ) | | | (1,907,213 | ) | | | (14,672,411 | ) | |
| Net decrease | | | (1,015,749 | ) | | | (7,424,675 | ) | | | (43,027 | ) | | | (331,578 | ) | |
| Class B shares | |
| Subscriptions | | | 3,108 | | | | 23,001 | | | | 2,859 | | | | 22,083 | | |
| Distributions reinvested | | | 6,390 | | | | 47,325 | | | | 16,127 | | | | 123,900 | | |
| Redemptions | | | (326,007 | ) | | | (2,390,477 | ) | | | (438,033 | ) | | | (3,372,247 | ) | |
| Net decrease | | | (316,509 | ) | | | (2,320,151 | ) | | | (419,047 | ) | | | (3,226,264 | ) | |
| Class C shares | |
| Subscriptions | | | 205,048 | | | | 1,563,155 | | | | 201,910 | | | | 1,552,755 | | |
| Distributions reinvested | | | 33,545 | | | | 249,745 | | | | 32,227 | | | | 248,214 | | |
| Redemptions | | | (255,533 | ) | | | (1,896,853 | ) | | | (205,447 | ) | | | (1,576,308 | ) | |
| Net increase (decrease) | | | (16,940 | ) | | | (83,953 | ) | | | 28,690 | | | | 224,661 | | |
| Class Z shares | |
| Subscriptions | | | 651 | | | | 5,000 | | | | — | | | | — | | |
| Distributions reinvested | | | 4 | | | | 33 | | | | — | | | | — | | |
| Net increase | | | 655 | | | | 5,033 | | | | — | | | | — | | |
| Total net increase (decrease) | | | (1,348,543 | ) | | | (9,823,746 | ) | | | (433,384 | ) | | | (3,333,181 | ) | |
(a) Class Z shares are for the period from September 1, 2011 (commencement of operations) to October 31, 2011.
The Accompanying Notes to Financial Statements are an integral part of this statement.
15
Financial Highlights – Columbia Massachusetts Tax-Exempt Fund
The following tables are intended to help you understand the Fund's financial performance. Certain information reflects financial results for a single share of a class held for the periods shown. Per share net investment income (loss) amounts are calculated based on average shares outstanding during the period. Total returns assume reinvestment of all dividends and distributions. Total returns do not reflect payment of sales charges, if any, and are not annualized for periods of less than one year.
| | | Year ended Oct. 31, | |
| | | 2011 | | 2010 | | 2009 | | 2008 | | 2007 | |
| Class A | |
| Per share data | |
| Net asset value, beginning of period | | $ | 7.84 | | | $ | 7.57 | | | $ | 6.98 | | | $ | 7.69 | | | $ | 7.94 | | |
| Income from investment operations: | |
| Net investment income | | | 0.31 | | | | 0.31 | | | | 0.31 | | | | 0.31 | | | | 0.31 | | |
| Net realized and unrealized gain (loss) | | | (0.07 | ) | | | 0.30 | | | | 0.63 | | | | (0.71 | ) | | | (0.18 | ) | |
| Total from investment operations | | | 0.24 | | | | 0.61 | | | | 0.94 | | | | (0.40 | ) | | | 0.13 | | |
| Less distributions to shareholders from: | |
| Net investment income | | | (0.31 | ) | | | (0.30 | ) | | | (0.30 | ) | | | (0.31 | ) | | | (0.31 | ) | |
| Net realized gains | | | (0.06 | ) | | | (0.04 | ) | | | (0.05 | ) | | | — | | | | (0.07 | ) | |
| Total distributions to shareholders | | | (0.37 | ) | | | (0.34 | ) | | | (0.35 | ) | | | (0.31 | ) | | | (0.38 | ) | |
| Proceeds from regulatory settlement | | | — | | | | 0.00 | (a) | | | — | | | | — | | | | — | | |
| Net asset value, end of period | | $ | 7.71 | | | $ | 7.84 | | | $ | 7.57 | | | $ | 6.98 | | | $ | 7.69 | | |
| Total return | | | 3.37 | % | | | 8.30 | % | | | 13.82 | % | | | (5.46 | %) | | | 1.65 | % | |
| Ratios to average net assets(b) | |
| Expenses prior to fees waived or expenses reimbursed (including interest expense) | | | 1.00 | % | | | 0.96 | % | | | 0.94 | % | | | 0.96 | %(c) | | | 1.01 | %(c) | |
| Net expenses after fees waived or expenses reimbursed (including interest expense)(d) | | | 0.80 | %(e) | | | 0.83 | %(e) | | | 0.85 | %(e) | | | 0.96 | %(c)(e) | | | 1.01 | %(c)(e) | |
| Expenses prior to fees waived or expenses reimbursed (excluding interest expense) | | | 1.00 | % | | | 0.96 | % | | | 0.94 | % | | | 0.93 | % | | | 0.94 | % | |
| Net expenses after fees waived or expenses reimbursed (excluding interest expense)(d) | | | 0.80 | %(e) | | | 0.83 | %(e) | | | 0.85 | %(e) | | | 0.93 | %(e) | | | 0.94 | %(e) | |
| Net investment income | | | 4.13 | %(e) | | | 4.02 | %(e) | | | 4.18 | %(e) | | | 4.08 | %(e) | | | 3.96 | %(e) | |
| Supplemental data | |
| Net assets, end of period (in thousands) | | $ | 111,134 | | | $ | 120,910 | | | $ | 117,193 | | | $ | 108,149 | | | $ | 128,833 | | |
| Portfolio turnover | | | 26 | % | | | 8 | % | | | 15 | % | | | 16 | % | | | 14 | % | |
| Notes to Financial Highlights | |
(a) Rounds to less than $0.01.
(b) In addition to the fees and expenses which the Fund bears directly, the Fund indirectly bears a pro rata share of the fees and expenses of the acquired funds in which it invests. Such indirect expenses are not included in the reported expense ratios.
(c) Interest expense and fees related to the liability for floating-rate notes issued in conjunction with inverse floater securities transactions.
(d) The Investment Manager and certain of its affiliates agreed to waive/reimburse certain fees and expenses, if applicable.
(e) The benefits derived from expense reductions had an impact of less than 0.01%.
The Accompanying Notes to Financial Statements are an integral part of this statement.
16
Financial Highlights (continued) – Columbia Massachusetts Tax-Exempt Fund
| | | Year ended Oct. 31, | |
| | | 2011 | | 2010 | | 2009 | | 2008 | | 2007 | |
| Class B | |
| Per share data | |
| Net asset value, beginning of period | | $ | 7.84 | | | $ | 7.57 | | | $ | 6.98 | | | $ | 7.69 | | | $ | 7.94 | | |
| Income from investment operations: | |
| Net investment income | | | 0.25 | | | | 0.25 | | | | 0.25 | | | | 0.25 | | | | 0.25 | | |
| Net realized and unrealized gain (loss) | | | (0.06 | ) | | | 0.31 | | | | 0.64 | | | | (0.71 | ) | | | (0.18 | ) | |
| Total from investment operations | | | 0.19 | | | | 0.56 | | | | 0.89 | | | | (0.46 | ) | | | 0.07 | | |
| Less distributions to shareholders from: | |
| Net investment income | | | (0.26 | ) | | | (0.25 | ) | | | (0.25 | ) | | | (0.25 | ) | | | (0.25 | ) | |
| Net realized gains | | | (0.06 | ) | | | (0.04 | ) | | | (0.05 | ) | | | — | | | | (0.07 | ) | |
| Total distributions to shareholders | | | (0.32 | ) | | | (0.29 | ) | | | (0.30 | ) | | | (0.25 | ) | | | (0.32 | ) | |
| Proceeds from regulatory settlement | | | — | | | | 0.00 | (a) | | | — | | | | — | | | | — | | |
| Net asset value, end of period | | $ | 7.71 | | | $ | 7.84 | | | $ | 7.57 | | | $ | 6.98 | | | $ | 7.69 | | |
| Total return | | | 2.60 | % | | | 7.50 | % | | | 12.98 | % | | | (6.16 | %) | | | 0.90 | % | |
| Ratios to average net assets(b) | |
| Expenses prior to fees waived or expenses reimbursed (including interest expense) | | | 1.76 | % | | | 1.71 | % | | | 1.69 | % | | | 1.71 | %(c) | | | 1.76 | %(c) | |
| Net expenses after fees waived or expenses reimbursed (including interest expense)(d) | | | 1.56 | %(e) | | | 1.58 | %(e) | | | 1.60 | %(e) | | | 1.71 | %(c)(e) | | | 1.76 | %(c)(e) | |
| Expenses prior to fees waived or expenses reimbursed (excluding interest expense) | | | 1.76 | % | | | 1.71 | % | | | 1.69 | % | | | 1.68 | % | | | 1.69 | % | |
| Net expenses after fees waived or expenses reimbursed (excluding interest expense)(d) | | | 1.56 | %(e) | | | 1.58 | %(e) | | | 1.60 | %(e) | | | 1.68 | %(e) | | | 1.69 | %(e) | |
| Net investment income | | | 3.40 | %(e) | | | 3.29 | %(e) | | | 3.46 | %(e) | | | 3.32 | %(e) | | | 3.21 | %(e) | |
| Supplemental data | |
| Net assets, end of period (in thousands) | | $ | 1,089 | | | $ | 3,587 | | | $ | 6,641 | | | $ | 10,518 | | | $ | 14,941 | | |
| Portfolio turnover | | | 26 | % | | | 8 | % | | | 15 | % | | | 16 | % | | | 14 | % | |
| Notes to Financial Highlights | |
(a) Rounds to less than $0.01.
(b) In addition to the fees and expenses which the Fund bears directly, the Fund indirectly bears a pro rata share of the fees and expenses of the acquired funds in which it invests. Such indirect expenses are not included in the reported expense ratios.
(c) Interest expense and fees related to the liability for floating-rate notes issued in conjunction with inverse floater securities transactions.
(d) The Investment Manager and certain of its affiliates agreed to waive/reimburse certain fees and expenses, if applicable.
(e) The benefits derived from expense reductions had an impact of less than 0.01%.
The Accompanying Notes to Financial Statements are an integral part of this statement.
17
Financial Highlights (continued) – Columbia Massachusetts Tax-Exempt Fund
| | | Year ended Oct. 31, | |
| | | 2011 | | 2010 | | 2009 | | 2008 | | 2007 | |
| Class C | |
| Per share data | |
| Net asset value, beginning of period | | $ | 7.84 | | | $ | 7.57 | | | $ | 6.98 | | | $ | 7.69 | | | $ | 7.94 | | |
| Income from investment operations: | |
| Net investment income | | | 0.27 | | | | 0.28 | | | | 0.27 | | | | 0.27 | | | | 0.27 | | |
| Net realized and unrealized gain (loss) | | | (0.06 | ) | | | 0.30 | | | | 0.64 | | | | (0.71 | ) | | | (0.18 | ) | |
| Total from investment operations | | | 0.21 | | | | 0.58 | | | | 0.91 | | | | (0.44 | ) | | | 0.09 | | |
| Less distributions to shareholders from: | |
| Net investment income | | | (0.28 | ) | | | (0.27 | ) | | | (0.27 | ) | | | (0.27 | ) | | | (0.27 | ) | |
| Net realized gains | | | (0.06 | ) | | | (0.04 | ) | | | (0.05 | ) | | | — | | | | (0.07 | ) | |
| Total distributions to shareholders | | | (0.34 | ) | | | (0.31 | ) | | | (0.32 | ) | | | (0.27 | ) | | | (0.34 | ) | |
| Proceeds from regulatory settlement | | | — | | | | 0.00 | (a) | | | — | | | | — | | | | — | | |
| Net asset value, end of period | | $ | 7.71 | | | $ | 7.84 | | | $ | 7.57 | | | $ | 6.98 | | | $ | 7.69 | | |
| Total return | | | 2.92 | % | | | 7.81 | % | | | 13.31 | % | | | (5.88 | %) | | | 1.20 | % | |
| Ratios to average net assets(b) | |
| Expenses prior to fees waived or expenses reimbursed (including interest expense) | | | 1.76 | % | | | 1.71 | % | | | 1.69 | % | | | 1.71 | %(c) | | | 1.76 | %(c) | |
| Net expenses after fees waived or expenses reimbursed (including interest expense)(d) | | | 1.26 | %(e) | | | 1.28 | %(e) | | | 1.30 | %(e) | | | 1.41 | %(c)(e) | | | 1.46 | %(c)(e) | |
| Expenses prior to fees waived or expenses reimbursed (excluding interest expense) | | | 1.76 | % | | | 1.71 | % | | | 1.69 | % | | | 1.68 | % | | | 1.69 | % | |
| Net expenses after fees waived or expenses reimbursed (excluding interest expense)(d) | | | 1.26 | %(e) | | | 1.28 | %(e) | | | 1.30 | %(e) | | | 1.38 | %(e) | | | 1.39 | %(e) | |
| Net investment income | | | 3.68 | %(e) | | | 3.57 | %(e) | | | 3.73 | %(e) | | | 3.63 | %(e) | | | 3.51 | %(e) | |
| Supplemental data | |
| Net assets, end of period (in thousands) | | $ | 10,614 | | | $ | 10,922 | | | $ | 10,339 | | | $ | 8,670 | | | $ | 10,683 | | |
| Portfolio turnover | | | 26 | % | | | 8 | % | | | 15 | % | | | 16 | % | | | 14 | % | |
| Notes to Financial Highlights | |
(a) Rounds to less than $0.01.
(b) In addition to the fees and expenses which the Fund bears directly, the Fund indirectly bears a pro rata share of the fees and expenses of the acquired funds in which it invests. Such indirect expenses are not included in the reported expense ratios.
(c) Interest expense and fees related to the liability for floating-rate notes issued in conjunction with inverse floater securities transactions.
(d) The Investment Manager and certain of its affiliates agreed to waive/reimburse certain fees and expenses, if applicable.
(e) The benefits derived from expense reductions had an impact of less than 0.01%.
The Accompanying Notes to Financial Statements are an integral part of this statement.
18
Financial Highlights (continued) – Columbia Massachusetts Tax-Exempt Fund
| | | Year ended
Oct. 31, 2011(a) | |
| Class Z | |
| Per share data | |
| Net asset value, beginning of period | | $ | 7.69 | | |
| Income from investment operations: | |
| Net investment income | | | 0.05 | | |
| Net realized and unrealized gain | | | 0.02 | (b) | |
| Total from investment operations | | | 0.07 | | |
| Less distributions to shareholders from: | |
| Net investment income | | | (0.05 | ) | |
| Total distributions to shareholders | | | (0.05 | ) | |
| Net asset value, end of period | | $ | 7.71 | | |
| Total return | | | 0.93 | % | |
| Ratios to average net assets(c) | |
| Expenses prior to fees waived or expenses reimbursed (including interest expense) | | | 0.71 | %(d) | |
| Net expenses after fees waived or expenses reimbursed (including interest expense)(e) | | | 0.52 | %(d) | |
| Expenses prior to fees waived or expenses reimbursed (excluding interest expense) | | | 0.71 | %(d) | |
| Net expenses after fees waived or expenses reimbursed (excluding interest expense)(e) | | | 0.52 | %(d) | |
| Net investment income | | | 4.20 | %(d) | |
| Supplemental data | |
| Net assets, end of period (in thousands) | | $ | 5 | | |
| Portfolio turnover | | | 26 | % | |
| Notes to Financial Highlights | |
(a) For the period from September 1, 2011 (commencement of operations) to October 31, 2011.
(b) Calculation of the net gain per share (both realized and unrealized) does not correlate to the aggregate realized and unrealized loss presented in the Statement of Operations due to the timing of sales and repurchases of Fund shares in relation to fluctuating market values of the investments of the Fund.
(c) In addition to the fees and expenses which the Fund bears directly, the Fund indirectly bears a pro rata share of the fees and expenses of the acquired funds in which it invests. Such indirect expenses are not included in the reported expense ratios.
(d) Annualized.
(e) The Investment Manager and certain of its affiliates agreed to waive/reimburse certain fees and expenses, if applicable.
The Accompanying Notes to Financial Statements are an integral part of this statement.
19
Notes to Financial Statements – Columbia Massachusetts Tax-Exempt Fund
October 31, 2011
Note 1. Organization
Columbia Massachusetts Tax-Exempt Fund (the Fund), a series of Columbia Funds Series Trust I (the Trust), is a non-diversified fund. The Trust is registered under the Investment Company Act of 1940, as amended (the 1940 Act), as an open-end management investment company organized as a Massachusetts business trust.
Fund Shares
The Trust may issue an unlimited number of shares (without par value). The Fund offers Class A, Class B, Class C and Class Z shares. All share classes have identical voting, dividend and liquidation rights. Each share class has its own expense structure and sales charges, as applicable.
Class A shares are subject to a maximum front-end sales charge of 4.75% based on the initial investment amount. Class A shares purchased without an initial sales charge in accounts aggregating $1 million to $50 million at the time of purchase are subject to a contingent deferred sales charge (CDSC) if the shares are sold within 18 months of purchase, charged as follows: 1.00% CDSC if redeemed within 12 months of purchase, and 0.50% CDSC if redeemed more than 12, but less than 18, months after purchase.
Class B shares may be subject to a maximum CDSC of 5.00% based upon the holding period after purchase. Class B shares will generally convert to Class A shares eight years after purchase. The Fund no longer accepts investments by new or existing investors in the Fund's Class B shares, except in connection with the reinvestment of any dividend and/or capital gain distributions in Class B shares of the Fund and exchanges by existing Class B shareholders of certain other funds within the Columbia Family of Funds.
Class C shares are subject to a 1.00% CDSC on shares redeemed within one year of purchase.
Class Z shares are not subject to sales charges, and are only available to certain investors, as described in the Fund's prospectus.
Note 2. Summary of Significant Accounting Policies
Use of Estimates
The preparation of financial statements in accordance with U.S. generally accepted accounting principles (GAAP) requires management to make certain estimates and assumptions that affect the reported amounts of assets and liabilities, the disclosure of contingent assets and liabilities at the date of the financial statements and the reported amounts of revenue and expenses during the reporting period. Actual results could differ from those estimates.
The following is a summary of significant accounting policies consistently followed by the Fund in the preparation of its financial statements.
Security Valuation
Debt securities generally are valued by pricing services approved by the Board of Trustees (the Board) based upon market transactions for normal, institutional-size trading units of similar securities. The services may use various pricing techniques which take into account appropriate factors such as yield, quality, coupon rate, maturity, type of issue, trading characteristics and other data, as well as broker quotes. Debt securities for which quotations are readily available may also be valued based upon an over-the-counter or exchange bid quotation.
Investments in other open-end investment companies, including money market funds, are valued at net asset value.
Investments for which market quotations are not readily available, or that have quotations which management believes are not reliable, are valued at fair value as determined in good faith under consistently applied procedures established by and under the general supervision of the Board. If a security or class of securities (such as foreign securities) is valued at fair value, such value is likely to be different from the last quoted market price for the security. The determination of fair value often requires significant judgment. To determine fair value, management may use assumptions including but not limited to future cash flows and estimated risk premiums. Multiple inputs from various sources may be used to determine value.
Delayed Delivery Securities
The Fund may trade securities on other than normal settlement terms, including securities purchased or sold on a "when-issued" basis. This may increase the risk if the other party to the transaction fails to deliver and causes the Fund to subsequently invest at less advantageous prices. The Fund identifies within its Portfolio of Investments cash or liquid securities in an amount equal to the delayed delivery commitment.
20
Columbia Massachusetts Tax-Exempt Fund, October 31, 2011
Security Transactions
Security transactions are accounted for on the trade date. Cost is determined and gains (losses) are based upon the specific identification method for both financial statement and federal income tax purposes.
Income Recognition
Interest income is recorded on the accrual basis. Market premium and discount are amortized and accreted, respectively, on all debt securities, unless otherwise noted. Original issue discount is accreted to interest income over the life of the security with a corresponding increase in the cost basis, if any.
Dividend income is recorded on the ex-date.
Expenses
General expenses of the Trust are allocated to the Fund and other funds of the Trust based upon relative net assets or other expense allocation methodologies determined by the nature of the expense. Expenses directly attributable to the Fund are charged to the Fund. Expenses directly attributable to a specific class of shares are charged to that share class.
Determination of Class Net Asset Value
All income, expenses (other than class-specific expenses, which are charged to that share class, as shown in the Statement of Operations) and realized and unrealized gains (losses) are allocated to each class of the Fund on a daily basis for purposes of determining the net asset value of each class. Income and expenses are allocated to each class based on the settled shares method, while realized and unrealized gains (losses) are allocated based on the relative net assets of each class.
Federal Income Tax Status
The Fund intends to qualify each year as a regulated investment company under Subchapter M of the Internal Revenue Code, as amended, and will distribute substantially all of its tax exempt or taxable income (including net short-term capital gains), if any, for its tax year, and as such will not be subject to federal income taxes. In addition, the Fund intends to distribute in each calendar year substantially all of its net investment income, capital gains and certain other amounts, if any, such that the Fund should not be subject to federal excise tax. Therefore, no federal income or excise tax provision is recorded.
Distributions to Shareholders
Distributions from net investment income are declared daily and paid monthly. Net realized capital gains, if any, are distributed at least annually. Income distributions and capital gain distributions are determined in accordance with federal income tax regulations which may differ from GAAP.
Guarantees and Indemnifications
Under the Trust's organizational documents and, in some cases, by contract, its officers and trustees are indemnified against certain liabilities arising out of the performance of their duties to the Trust or its funds. In addition, certain of the Fund's contracts with its service providers contain general indemnification clauses. The Fund's maximum exposure under these arrangements is unknown since the amount of any future claims that may be made against the Fund cannot be determined, and the Fund has no historical basis for predicting the likelihood of any such claims.
Recent Accounting Pronouncement
Fair Value Measurements and Disclosures
In May 2011, the Financial Accounting and Standards Board issued ASU No. 2011-04 modifying Topic 820, Fair Value Measurements and Disclosures. At the same time, the International Accounting Standards Board issued International Financial Reporting Standard 13, Fair Value Measurement. The objective of the FASB and IASB is convergence of their guidance on fair value measurements and disclosures.
Specifically, ASU No. 2011-04 requires reporting entities to disclose i) the amounts of any transfers between Level 1 and Level 2, and the reasons for the transfers, ii) for Level 3 fair value measurements, a) quantitative information about significant unobservable inputs used, b) a description of the valuation processes used by the reporting entity and c) a narrative description of the sensitivity of the fair value measurement to changes in unobservable inputs if a change in those inputs might result in a significantly higher or lower fair value measurement. The effective date of ASU No. 2011-04 is for interim and annual periods beginning after December 15, 2011. At this time, management is evaluating the implications
21
Columbia Massachusetts Tax-Exempt Fund, October 31, 2011
of this guidance and the impact it will have on the financial statement amounts and footnote disclosures, if any.
Note 3. Fees and Compensation Paid to Affiliates
Investment Management Fees
Under an Investment Management Services Agreement (IMSA), Columbia Management Investment Advisers, LLC (the Investment Manager), a wholly-owned subsidiary of Ameriprise Financial, Inc. (Ameriprise Financial), determines which securities will be purchased, held or sold. Effective March 1, 2011, the management fee is an annual fee that is equal to a percentage of the Fund's average daily net assets that declines from 0.40% to 0.27% as the Fund's net assets increase. Prior to March 1, 2011, the annual management fee was equal to a percentage of the Fund's pro-rata portion of the combined average daily net assets of the Fund, Columbia California Tax-Exempt Fund, Columbia Connecticut Tax-Exempt Fund and Columbia New York Tax-Exempt Fund (collectively, combined daily net assets) at a rate that declined from 0.50% to 0.40% as the combined daily net assets increased. The effective management fee rate for the year ended October 31, 2011 was 0.43% of the Fund's average daily net assets.
Administration Fees
Under an Administrative Services Agreement, the Investment Manager serves as the Fund Administrator. Effective March 1, 2011, the Fund pays the Fund Administrator an annual fee for administration and accounting services equal to a percentage of the Fund's average daily net assets that declines from 0.07% to 0.04% as the Fund's net assets increase. Prior to March 1, 2011, the Investment Manager did not receive a fee for its services under the Administration Services Agreement. The effective administration fee rate for the year ended October 31, 2011 was 0.05% of the Fund's average daily net assets.
Pricing and Bookkeeping Fees
Prior to May 16, 2011, the Fund had entered into a Financial Reporting Services Agreement (the Financial Reporting Services Agreement) with State Street Bank and Trust Company (State Street) and the Investment Manager pursuant to which State Street provided financial reporting services to the Fund. The Fund also entered into an Accounting Services Agreement (collectively with the Financial Reporting Services Agreement, the State Street Agreements) with State Street and the Investment Manager pursuant to which State Street provided accounting services to the Fund. Under the State Street Agreements, the Fund paid State Street an annual fee of $38,000 paid monthly plus an additional monthly fee based on an annualized percentage rate of average daily net assets of the Fund for the month. The aggregate fee did not exceed $140,000 per year (exclusive of out-of-pocket expenses and charges). The Fund also reimbursed State Street for certain out-of-pocket expenses and charges. Effective May 16, 2011, these services are now provided under the Administrative Services Agreement discussed above.
Compensation of Board Members
Board members are compensated for their services to the Fund as disclosed in the Statement of Operations. The Trust's eligible Trustees may participate in a Deferred Compensation Plan (the Plan) which may be terminated at any time. Obligation of the Plan will be paid solely out of the Fund's assets.
Compensation of Chief Compliance Officer
The Board has appointed a Chief Compliance Officer to the Fund in accordance with federal securities regulations. The Fund, along with other affiliated funds, pays its pro-rata share of the expenses associated with the Chief Compliance Officer. The Fund's expenses for the Chief Compliance Officer will not exceed $15,000 per year.
Transfer Agent Fees
Under a Transfer and Dividend Disbursing Agent Agreement, Columbia Management Investment Services Corp. (the Transfer Agent), an affiliate of the Investment Manager and a wholly-owned subsidiary of Ameriprise Financial, is responsible for providing transfer agency services to the Fund. The Transfer Agent has contracted with Boston Financial Data Services (BFDS) to serve as sub-transfer agent.
The Transfer Agent receives monthly account-based service fees based on the number of open accounts and is reimbursed by the Fund for the fees and expenses the Transfer Agent pays to financial intermediaries that maintain omnibus accounts with the Fund that is a percentage of the average aggregate value of the Fund's shares maintained in each such omnibus account (other than omnibus accounts for which American Enterprise Investment Services Inc. is the broker of record or accounts where the beneficial shareholder is a customer of
22
Columbia Massachusetts Tax-Exempt Fund, October 31, 2011
Ameriprise Financial Services, Inc., which are paid a per account fee). The Transfer Agent pays the fees of BFDS for services as sub-transfer agent and is not entitled to reimbursement for such fees from the Fund (with the exception of out-of-pocket fees).
The Transfer Agent also receives compensation from fees for various shareholder services and reimbursements for certain out-of -pocket expenses.
For the year ended October 31, 2011, the Fund's effective transfer agent fee rates as a percentage of average daily net assets of each class were as follows:
| Class A | | | 0.10 | % | |
| Class B | | | 0.11 | | |
| Class C | | | 0.10 | | |
| Class Z | | | 0.00 | | |
An annual minimum account balance fee of $20 may apply to certain accounts with a value below the Fund's initial minimum investment requirements to reduce the impact of small accounts on transfer agent fees. These minimum account balance fees are recorded as part of expense reductions in the Statement of Operations. For the year ended October 31, 2011, these minimum account balance fees reduced total expenses by $526.
Distribution and Service Fees
The Fund has an agreement with Columbia Management Investment Distributors, Inc. (the Distributor), an affiliate of the Investment Manager and a wholly-owned subsidiary of Ameriprise Financial, for distribution and shareholder services. Pursuant to Rule 12b-1 under the 1940 Act, the Board has approved, and the Fund has adopted, distribution and shareholder service plans (the Plans) which set the distribution and service fees for the Fund. These fees are calculated daily and are intended to compensate the Distributor and/or eligible selling and/or servicing agents for selling shares of the Fund and providing services to investors.
Effective July 1, 2011, the Plans require the payment of a monthly service fee to the Distributor at the maximum annual rate of 0.25% of the average daily net assets attributable to Class A, Class B and Class C shares of the Fund. Prior to July 1, 2011, the Fund paid a monthly service fee to the Distributor which was equal to 0.10% annually of the net assets attributable to shares of the Fund issued prior to December 1, 1994 and 0.25% annually of the net assets attributable to shares issued thereafter. The arrangement resulted in an annual rate of service fee for all shares that was a blend between the 0.10% and 0.25% rates. For the period November 1, 2010 through October 31, 2011, the Fund's annualized effective service fee rate was 0.24% of the Fund's average daily net assets attributable to Class A, Class B and Class C shares.
The Plans also require the payment of a monthly distribution fee to the Distributor at the maximum annual rate of 0.75% of the average daily net assets attributable to Class B and Class C shares only.
The Distributor has voluntarily agreed to waive a portion of the distribution fee for Class C shares so that the combined distribution and service fee does not exceed 0.45% annually of the average daily net assets attributable to Class C shares. This arrangement may be modified or terminated by the Distributor at any time.
Sales Charges
Sales charges, including front-end charges and CDSCs, received by the Distributor for distributing Fund shares were $59,801 for Class A, $109 for Class B and $433 for Class C shares for the year ended October 31, 2011.
Expenses Waived/Reimbursed by the Investment Manager and its Affiliates
Effective March 1, 2011, the Investment Manager and certain of its affiliates have contractually agreed to waive fees and/or reimburse expenses (excluding certain fees and expenses described below), through February 29, 2012, unless sooner terminated at the sole discretion of the Board, so that the Fund's net operating expenses, after giving effect to fees waived/expenses reimbursed and any balance credits and/or overdraft charges from the Fund's custodian, do not exceed the following annual rates as a percentage of the class' average daily net assets:
| Class A | | | 0.79 | % | |
| Class B | | | 1.54 | | |
| Class C | | | 1.54 | | |
| Class Z | | | 0.54 | | |
23
Columbia Massachusetts Tax-Exempt Fund, October 31, 2011
Under the agreement, the following fees and expenses are excluded from the waiver/reimbursement commitment, and therefore will be paid by the Fund, if applicable: taxes (including foreign transaction taxes), expenses associated with investments in affiliated and non-affiliated pooled investment vehicles (including mutual funds and exchange traded funds), transaction costs and brokerage commissions, costs related to any securities lending program, dividend expenses associated with securities sold short, inverse floater program fees and expenses, transaction charges and interest on borrowed money, interest, extraordinary expenses and any other expenses the exclusion of which is specifically approved by the Board. This agreement may be modified or amended only with approval from all parties. Class C distribution fees waived by the Distributor, as discussed above, are in addition to the waiver/reimbursement committment under the agreement.
Prior to March 1, 2011, the Investment Manager voluntarily agreed to reimburse a portion of the Fund's expenses (excluding certain expenses, such as distribution and services fees, brokerage commissions, interest, taxes and extraordinary expenses, but including custodian charges relating to overdrafts, if any) so that the Fund's ordinary net operating expenses, after giving effect to fees waived/expenses reimbursed and any balance credits and/or overdraft charges from the Fund's custodian, did not exceed 0.60% of the Fund's average daily net assets on an annualized basis.
Note 4. Federal Tax Information
The timing and character of income and capital gain distributions are determined in accordance with income tax regulations, which may differ from GAAP because of temporary or permanent book to tax differences.
For the year ended October 31, 2011, permanent differences are primarily due to differing treatments for discount accretion/premium amortization on debt securities. In the Statement of Assets and Liabilities the following reclassifications were made among the components of the Fund's net assets due to permanent differences:
| Undistributed net investment income | | $ | (106,673 | ) | |
| Accumulated net realized gain | | | 32,123 | | |
| Paid-in capital | | | 74,550 | | |
Net investment income and net realized gains (losses), as disclosed in the Statement of Operations, and net assets were not affected by this reclassification.
The tax character of distributions paid during the years indicated was as follows:
| Year ended October 31, | | 2011 | | 2010 | |
| Tax-Exempt Income | | $ | 5,008,622 | | | $ | 5,284,471 | | |
| Ordinary Income | | | — | | | | 9,536 | | |
| Long-Term Capital Gains | | | 1,039,523 | | | | 663,241 | | |
Short-term capital gain distributions, if any, are considered ordinary income distributions for tax purposes.
At October 31, 2011, the components of distributable earnings on a tax basis were as follows:
| Undistributed tax-exempt income | | $ | 449,375 | | |
| Undistributed accumulated long-term gain | | | 764,949 | | |
| Unrealized appreciation | | | 7,328,105 | | |
At October 31, 2011, the cost of investments for federal income tax purposes was $115,496,595 and the aggregate gross unrealized appreciation and depreciation based on that cost was:
| Unrealized appreciation | | $ | 9,181,218 | | |
| Unrealized depreciation | | $ | (1,853,114 | ) | |
| Net unrealized appreciation | | $ | 7,328,104 | | |
Management of the Fund has concluded that there are no significant uncertain tax positions that would require recognition in the financial statements. However, management's conclusion may be subject to review and adjustment at a later date based on factors including, but not limited to, new tax laws, regulations, and administrative interpretations (including relevant court decisions). Generally, the Fund's federal tax returns for the prior three fiscal years remain subject to examination by the Internal Revenue Service.
24
Columbia Massachusetts Tax-Exempt Fund, October 31, 2011
Note 5. Portfolio Information
The cost of purchases and proceeds from sales of securities, excluding short-term obligations, aggregated to $30,715,003 and $42,265,013, respectively, for the year ended October 31, 2011.
Note 6. Regulatory Settlements
During the year ended October 31, 2010, the Fund received payments of $11,587 resulting from certain regulatory settlements with third parties in which the Fund had participated. The payments have been included in "Proceeds from regulatory settlements" in the Statement of Changes in Net Assets.
Note 7. Lending of Portfolio Securities
Effective May 16, 2011, the Fund has entered into a Master Securities Lending Agreement (the Agreement) with JPMorgan Chase Bank, N.A. (JPMorgan). The Agreement, which replaces the previous security lending arrangement with State Street, authorizes JPMorgan as lending agent to lend securities to authorized borrowers in order to generate additional income on behalf of the Fund. Pursuant to the Agreement, the securities loaned are secured by cash or U.S. government securities equal to at least 100% of the market value of the loaned securities. Any additional collateral required to maintain those levels due to market fluctuations of the loaned securities is delivered the following business day. Cash collateral received is invested by the lending agent on behalf of the Fund into authorized investments pursuant to the Agreement. The investments made with the cash collateral are listed in the Portfolio of Investments. The values of such investments and any uninvested cash collateral are disclosed in the Statement of Assets and Liabilities along with the related obligation to return the collateral upon the return of the securities loaned. For the year ended October 31, 2011, the Fund did not participate in securities lending activity.
Risks of delay in recovery of securities or even loss of rights in the securities may occur should the borrower of the securities fail financially. Risks may also arise to the extent that the value of the securities loaned increases above the value of the collateral received. JPMorgan will indemnify the Fund from losses resulting from a borrower's failure to return a loaned security when due. Such indemnification does not extend to losses associated with declines in the value of cash collateral investments. The Investment Manager is not responsible for any losses incurred by the Fund in connection with the securities lending program. Loans are subject to termination by the Fund or the borrower at any time, and are, therefore, not considered to be illiquid investments.
Pursuant to the Agreement, the Fund receives income for lending its securities either in the form of fees or by earning interest on invested cash collateral, net of negotiated rebates paid to borrowers and fees paid to the lending agent for services provided and any other securities lending expenses. The Fund continues to earn and accrue interest and dividends on the securities loaned.
Prior to May 16, 2011, the Fund participated in a securities lending arrangement with State Street. Each security on loan was collateralized in an amount at least equal to the market value of the securities loaned plus accrued income from the investment of collateral. The income generated by the investment of the collateral, net of any fees remitted to State Street as the lending agent and borrower rebates, was paid to the Fund.
Note 8. Custody Credits
Prior to May 16, 2011, the Fund had an agreement with its custodian bank under which custody fees may have been reduced by balance credits. These credits are recorded as part of expense reductions on the Statement of Operations. The Fund could have invested a portion of the assets utilized in connection with the expense offset arrangement in an income-producing asset if they had not entered into such an agreement. For the period November 1, 2010 through May 16, 2011, these credits reduced total expenses by $3.
Note 9. Shareholder Concentration
At October 31, 2011, two shareholder accounts owned 30% of the outstanding shares of the Fund. Subscription and redemption activity of these accounts may have a significant effect on the operations of the Fund.
Note 10. Line of Credit
The Fund has entered into a revolving credit facility with a syndicate of banks led by JPMorgan Chase Bank, N.A. (the Administrative Agent), whereby the Fund may borrow for the temporary funding of shareholder redemptions or for other temporary or emergency purposes. The credit facility became effective on May 16, 2011, replacing a prior credit facility. The credit facility agreement which is a collective agreement
25
Columbia Massachusetts Tax-Exempt Fund, October 31, 2011
between the Fund and certain other funds managed by the Investment Manager, severally and not jointly, permits collective borrowings up to $500,000,000.
Interest is charged to each participating fund based on its borrowings at a rate equal to the sum of the federal funds rate plus (i) 1.25% per annum plus (ii) if one-month LIBOR exceeds the federal funds rate, the amount of such excess. Each borrowing under the credit facility matures no later than 60 days after the date of borrowing. The Fund also pays a commitment fee equal to its pro rata share of the amount of the credit facility at a rate of 0.10% per annum.
For the period March 28, 2011 through May 15, 2011, the Fund and certain other funds managed by the Investment Manager participated in a $225,000,000 committed, unsecured revolving credit facility provided by State Street. Prior to March 28, 2011, the collective borrowing amount of the credit facility was $280,000,000. Interest was charged to each fund based on its borrowings at a rate equal to the greater of the (i) federal funds rate plus 1.25% per annum or (ii) the overnight LIBOR rate plus 1.25% per annum. The Fund also paid a commitment fee equal to its pro rata share of the amount of the credit facility at a rate of 0.125% per annum.
Effective December 13, 2011, the Fund extended its revolving credit facility with the Administrative Agent. The credit facility agreement, as amended, permits collective borrowings up to $500 million. Effective December 13, 2011, interest is charged to each participating fund based on its borrowings at a rate equal to the higher of (i) the overnight federal funds rate plus 1.00% or (i) the one-month LIBOR rate plus 1.00%. Each borrowing under the credit facility matures no later than 60 days after the date of borrowing. The Fund also pays a commitment fee equal to its pro rata share of the amount of the credit facility at a rate of 0.08% per annum.
The Fund had no borrowings during the year ended October 31, 2011.
Note 11. Significant Risks
Non-Diversification Risk
A non-diversified fund is permitted to invest a greater percentage of its total assets in fewer companies than a diversified fund. The Fund may, therefore, have a greater risk of loss from a few issuers than a similar fund that invests more broadly.
Geographic Concentration Risk
Because state-specific tax-exempt funds invest primarily in the municipal securities issued by the state and political sub-divisions of the state, the Fund will be particularly affected by political and economic conditions and developments in the state in which it invests. The Fund may, therefore, have a greater risk than that of a municipal bond fund which is more geographically diversified. The value of the municipal securities owned by the Fund also may be adversely affected by future changes in federal or state income tax laws.
Tax Development Risk
The Fund purchases municipal securities whose interest, in the opinion of bond counsel, is free from federal income tax. There is no assurance that the Internal Revenue Service (IRS) will agree with this opinion. In the event the IRS determines that an issuer does not comply with relevant tax requirements, interest payments from a security could become federally taxable, possibly retroactively to the date the security was issued. As a shareholder of the Fund, you may be required to file an amended tax return as a result.
Note 12. Subsequent Events
Management has evaluated the events and transactions that have occurred through the date the financial statements were issued. Other than as noted in Note 10 above, there were no items requiring adjustment of the financial statements or additional disclosure.
Note 13. Information Regarding Pending and Settled Legal Proceedings
In June 2004, an action captioned John E. Gallus et al. v. American Express Financial Corp. and American Express Financial Advisors Inc. was filed in the United States District Court for the District of Arizona. The plaintiffs allege that they are investors in several American Express Company mutual funds (branded as Columbia) and they purport to bring the action derivatively on behalf of those funds under the Investment Company Act of 1940. The plaintiffs allege that fees allegedly paid to the defendants by the funds for investment advisory and administrative services are excessive. The plaintiffs seek remedies including restitution and rescission of investment advisory and distribution agreements. The plaintiffs voluntarily agreed to transfer this case to the United States District Court for the District of Minnesota (the District
26
Columbia Massachusetts Tax-Exempt Fund, October 31, 2011
Court). In response to defendants' motion to dismiss the complaint, the District Court dismissed one of plaintiffs' four claims and granted plaintiffs limited discovery. Defendants moved for summary judgment in April 2007. Summary judgment was granted in the defendants' favor on July 9, 2007. The plaintiffs filed a notice of appeal with the Eighth Circuit Court of Appeals (the Eighth Circuit) on August 8, 2007. On April 8, 2009, the Eighth Circuit reversed summary judgment and remanded to the District Court for further proceedings. On August 6, 2009, defendants filed a writ of certiorari with the U.S. Supreme Court (the Supreme Court), asking the Supreme Court to stay the District Court proceedings while the Supreme Court considers and rules in a case captioned Jones v. Harris Associates, which involves issues of law similar to those presented in the Gallus case. On March 30, 2010, the Supreme Court issued its ruling in Jones v. Harris Associates, and on April 5, 2010, the Supreme Court vacated the Eighth Circuit's decision in the Gallus case and remanded the case to the Eighth Circuit for further consideration in light of the Supreme Court's decision in Jones v. Harris Associates. On June 4, 2010, the Eighth Circuit remanded the Gallus case to the District Court for further consideration in light of the Supreme Court's decision in Jones v. Harris Associates. On December 9, 2010, the District Court reinstated its July 9, 2007 summary judgment order in favor of the defendants. On January 10, 2011, plaintiffs filed a notice of appeal with the Eighth Circuit. In response to the plaintiffs' opening appellate brief filed on March 18, 2011, the defendants filed a response brief on May 4, 2011 with the Eighth Circuit. The plaintiffs filed a reply brief on May 26, 2011 and oral arguments took place on November 17, 2011.
In December 2005, without admitting or denying the allegations, American Express Financial Corporation (AEFC, which is now known as Ameriprise Financial, Inc. (Ameriprise Financial)), entered into settlement agreements with the Securities and Exchange Commission (SEC) and Minnesota Department of Commerce (MDOC) related to market timing activities. As a result, AEFC was censured and ordered to cease and desist from committing or causing any violations of certain provisions of the Investment Advisers Act of 1940, the Investment Company Act of 1940, and various Minnesota laws. AEFC agreed to pay disgorgement of $10 million and civil money penalties of $7 million. AEFC also agreed to retain an independent distribution consultant to assist in developing a plan for distribution of all disgorgement and civil penalties ordered by the SEC in accordance with various undertakings detailed at www.sec.gov/litigation/admin/ia-2451.pdf. Ameriprise Financial and its affiliates have cooperated with the SEC and the MDOC in these legal proceedings, and have made regular reports to the funds' Boards of Trustees.
Ameriprise Financial and certain of its affiliates have historically been involved in a number of legal, arbitration and regulatory proceedings, including routine litigation, class actions, and governmental actions, concerning matters arising in connection with the conduct of their business activities. Ameriprise Financial believes that the Funds are not currently the subject of, and that neither Ameriprise Financial nor any of its affiliates are the subject of, any pending legal, arbitration or regulatory proceedings that are likely to have a material adverse effect on the Funds or the ability of Ameriprise Financial or its affiliates to perform under their contracts with the Funds. Ameriprise Financial is required to make 10-Q, 10-K and, as necessary, 8-K filings with the Securities and Exchange Commission on legal and regulatory matters that relate to Ameriprise Financial and its affiliates. Copies of these filings may be obtained by accessing the SEC website at www.sec.gov.
There can be no assurance that these matters, or the adverse publicity associated with them, will not result in increased fund redemptions, reduced sale of fund shares or other adverse consequences to the Funds. Further, although we believe proceedings are not likely to have a material adverse effect on the Funds or the ability of Ameriprise Financial or its affiliates to perform under their contracts with the Funds, these proceedings are subject to uncertainties and, as such, we are unable to estimate the possible loss or range of loss that may result. An adverse outcome in one or more of these proceedings could result in adverse judgments, settlements, fines, penalties or other relief that could have a material adverse effect on the consolidated financial condition or results of operations of Ameriprise Financial.
27
Report of Independent Registered Public Accounting Firm
To the Trustees of Columbia Funds Series Trust I and the Shareholders of Columbia Massachusetts Tax-Exempt Fund
In our opinion, the accompanying statement of assets and liabilities, including the investment portfolio, and the related statements of operations and of changes in net assets and the financial highlights present fairly, in all material respects, the financial position of Columbia Massachusetts Tax-Exempt Fund (the "Fund") (a series of Columbia Funds Series Trust I) at October 31, 2011, and the results of its operations for the year then ended, the changes in its net assets for each of the two years in the period then ended and the financial highlights for each of the periods indicated, in conformity with accounting principles generally accepted in the United States of America. These financial statements and financial highlights (hereafter referred to as "financial statements") are the responsibility of the Fund's management. Our responsibility is to express an opinion on these financial statements based on our audits. We conducted our audits of these financial statements in accordance with the standards of the Public Company Accounting Oversight Board (United States). Those standards require that we plan and perform the audit to obtain reasonable assurance about whether the financial statements are free of material misstatement. An audit includes examining, on a test basis, evidence supporting the amounts and disclosures in the financial statements, assessing the accounting principles used and significant estimates made by management, and evaluating the overall financial statement presentation. We believe that our audits, which included confirmation of securities at October 31, 2011 by correspondence with the custodian and brokers, provide a reasonable basis for our opinion.
PricewaterhouseCoopers LLP
Minneapolis, Minnesota
December 22, 2011
28
Federal Income Tax Information (Unaudited) – Columbia Massachusetts Tax-Exempt Fund
The Fund hereby designates as a capital gain dividend with respect to the fiscal year ended October 31, 2011, $865,543 or, if subsequently determined to be different, the net capital gain of such year.
For the fiscal year ended October 31, 2011, 100% of the distributions from net investment income of the Fund qualifies as exempt interest dividends for federal income tax purposes. A portion of the income may be subject to federal alternative minimum tax.
The Fund will notify shareholders in January 2012 of amounts for use in preparing 2011 income tax returns.
29
Fund Governance
The Trustees serve terms of indefinite duration. The names, addresses and birth years of the Trustees and Officers of the Funds in Columbia Funds Series Trust I, the year each was first elected or appointed to office, their principal business occupations during at least the last five years, the number of Funds overseen by each Trustee and other directorships they hold are shown below. Each officer listed below serves as an officer of each Fund in Columbia Funds Series Trust I.
Independent Trustees
Name, Address and Year of Birth,
Position with Funds, Year First
Elected or Appointed to Office | | Principal Occupation(s) During Past Five Years, Number of Funds in Columbia
Funds Complex Overseen by Trustee, Other Directorships Held
| |
| Rodman L. Drake (Born 1943) | |
|
c/o Columbia Management
Investment Advisers, LLC
225 Franklin Street
Boston, MA 02110
Trustee (since 1994) and Chairman of the Board (since 2009) | | Independent consultant since 2010; Co-Founder of Baringo Capital LLC (private equity) from 1997 to 2008; CEO of Crystal River Capital, Inc. (real estate investment trust) from 2003 to 2010; Oversees 43; Jackson Hewitt Tax Service Inc. (tax preparation services from 2004 to 2011); Celgene Corporation (global biotechnology company); Student Loan Corporation (student loan provider from 2008 to 2010); Celgene Corporation (global biotechnology company); The Helios Funds and Brookfield Funds (closed-end funds); Crystal River Capital, Inc. from 2005 to 2010; Parson Brinckerhoff from 1995 to 2008; and Apex Silver Mines Ltd. from 2007 to 2009 | |
|
| Douglas A. Hacker (Born 1955) | |
|
c/o Columbia Management
Investment Advisers, LLC
225 Franklin Street
Boston, MA 02110
Trustee (since 1996) | | Independent business executive since May 2006; Executive Vice President—Strategy of United Airlines from December 2002 to May 2006; President of UAL Loyalty Services (airline marketing company) from September 2001 to December 2002; Executive Vice President and Chief Financial Officer of United Airlines from July 1999 to September 2001. Oversees 43; Nash Finch Company (food distributor); Aircastle Limited (aircraft leasing); and SeaCube Container Leasing Ltd (container leasing) | |
|
| Janet Langford Kelly (Born 1957) | |
|
c/o Columbia Management
Investment Advisers, LLC
225 Franklin Street
Boston, MA 02110
Trustee (since 1996) | | Senior Vice President, General Counsel and Corporate Secretary, ConocoPhillips (integrated energy company) since September 2007; Deputy General Counsel—Corporate Legal Services, ConocoPhillips from August 2006 to August 2007; Partner, Zelle, Hofmann, Voelbel, Mason & Gette LLP (law firm) from March 2005 to July 2006; Adjunct Professor of Law, Northwestern University, from September 2004 to June 2006; Director, UAL Corporation (airline) from February 2006 to July 2006; Oversees 43; None | |
|
| Nancy T. Lukitsh (Born 1956) | |
|
c/o Columbia Management
Investment Advisers, LLC
225 Franklin Street
Boston, MA 02110
Trustee (since 2011) | | Senior Vice President, Partner and Director, Marketing of Wellington Management Company, LLP (investment adviser) from 1997 to 2010; Chair, Wellington Management Investment Portfolios (commingled non-U.S. investment pools) from 2007 to 2010; Director, Wellington Trust Company, NA and other Wellington affiliates from 1997 to 2010. Oversees 43; None | |
|
30
Fund Governance (continued)
Independent Trustees (continued)
Name, Address and Year of Birth,
Position with Funds, Year First
Elected or Appointed to Office | | Principal Occupation(s) During Past Five Years, Number of Funds in Columbia
Funds Complex Overseen by Trustee, Other Directorships Held
| |
| William E. Mayer (Born 1940) | |
|
c/o Columbia Management
Investment Advisers, LLC
225 Franklin Street
Boston, MA 02110
Trustee (since 1994) | | Partner, Park Avenue Equity Partners (private equity) since February 1999; Dean and Professor, College of Business and Management, University of Maryland from 1992 to 1996. Oversees 43; DynaVox Inc. (speech creation); Lee Enterprises (print media); WR Hambrecht + Co. (financial service provider); BlackRock Kelso Capital Corporation (investment company) | |
|
| David M. Moffett (Born 1952) | |
|
c/o Columbia Management
Investment Advisers, LLC
225 Franklin Street
Boston, MA 02110
Trustee (since 2011) | | Retired. Chief Executive Officer, Federal Home Loan Mortgage Corporation, from 2008 to 2009; Senior Adviser, Global Financial Services Group, Carlyle Group, Inc., from 2007 to 2008; Vice Chairman and Chief Financial Officer, U.S. Bancorp, from 1993 to 2007. Oversees 43; CIT Group Inc. (commercial and consumer finance), eBay Inc. (online trading community), MBIA Corp (financial service provider), E.W. Scripps Co. (print and television media), Building Materials Holding Corp. (building materials and construction services), and University of Oklahoma Foundation. | |
|
| Charles R. Nelson (Born 1942) | |
|
c/o Columbia Management
Investment Advisers, LLC
225 Franklin Street
Boston, MA 02110
Trustee (since 1981) | | Retired Professor Emeritus, University of Washington, since 2011; Professor of Economics, University of Washington, from January 1976 to 2011; Ford and Louisa Van Voorhis Professor of Political Economy, University of Washington, from 1993 to 2011; Adjunct Professor of Statistics, University of Washington, from 1980 to 2011; Associate Editor, Journal of Money Credit and Banking from 1993 to 2008; consultant on econometric and statistical matters. Oversees 43; None | |
|
| John J. Neuhauser (Born 1943) | |
|
c/o Columbia Management
Investment Advisers, LLC
225 Franklin Street
Boston, MA 02110
Trustee (since 1984) | | President, Saint Michael's College, since August 2007; Director or Trustee of several non-profit organizations, including Fletcher Allen Health Care, Inc.; University Professor, Boston College from November 2005 to August 2007; Academic Vice President and Dean of Faculties, Boston College from August 1999 to October 2005. Oversees 43; Liberty All-Star Equity Fund and Liberty All-Star Growth Fund (closed-end funds) | |
|
| Patrick J. Simpson (Born 1944) | |
|
c/o Columbia Management
Investment Advisers, LLC
225 Franklin Street
Boston, MA 02110
Trustee (since 2000) | | Partner, Perkins Coie LLP (law firm). Oversees 43; None | |
|
| Anne-Lee Verville (Born 1945) | |
|
c/o Columbia Management
Investment Advisers, LLC
225 Franklin Street
Boston, MA 02110
Trustee (since 1998) | | Retired since 1997 (formerly General Manager–Global Education Industry from 1994 to 1997, President–Application Systems Division from 1991 to 1994, Chief Financial Officer–US Marketing & Services from 1988 to 1991, and Chief Information Officer from 1987 to 1988, IBM Corporation (computer and technology)). Oversees 43; Enesco Group, Inc. (producer of giftware and home and garden decor products) from 2001 to 2006 | |
|
31
Fund Governance (continued)
Interested Trustee
Name, Address and Year of Birth,
Position with Funds, Year First
Elected or Appointed to Office | | Principal Occupation(s) During Past Five Years, Number of Funds in Columbia
Funds Complex Overseen by Trustee, Other Directorships Held
| |
| Michael A. Jones (born 1959) | |
|
c/o Columbia Management
Investment Advisers, LLC
225 Franklin Street
Boston, MA 02110
Trustee (since 2011)
Senior Vice President (since 2011) | | President and Director, Columbia Management Investment Advisers, LLC since May 2010; President and Director, Columbia Management Investment Distributors, Inc. since May 2010; Manager, Chairman, Chief Executive Officer and President, Columbia Management Advisors, LLC from 2007 to April 2010; Chief Executive Officer, President and Director, Columbia Management Distributors, Inc. from November 2006 to April 2010; previously, co-president and senior managing director at Robeco Investment Management. Oversees 43; None | |
|
The Statement of Additional Information includes additional information about the Trustees of the Funds and is available, without charge, upon request by calling 1-800-345-6611.
Officers
| Name, Year of Birth and Address | | Principal Occupation(s) During the Past Five Years | |
| J. Kevin Connaughton (Born 1964) | |
|
225 Franklin Street
Boston, MA 02110
President (since 2009) | | Senior Vice President and General Manager–Mutual Fund Products, Columbia Management Investment Advisers, LLC since May 2010; President, Columbia Funds, since 2009, and RiverSource Funds, since May 2010 (previously Senior Vice President and Chief Financial Officer, Columbia Funds, from June 2008 to January 2009, Treasurer, Columbia Funds, from October 2003 to May 2008, and senior officer of various other affiliated funds since 2000); Managing Director, Columbia Management Advisors, LLC from December 2004 to April 2010. | |
|
| Michael G. Clarke (Born 1969) | |
|
225 Franklin Street
Boston, MA 02110
Treasurer (since 2011) and Chief
Financial Officer (since 2009) | | Vice President, Columbia Management Investment Advisers, LLC since May 2010; Managing Director of Fund Administration, Columbia Management Advisors, LLC, from September 2004 to April 2010; senior officer of Columbia Funds and affiliated funds since 2002. | |
|
| Scott R. Plummer (Born 1959) | |
|
5228 Ameriprise Financial Center
Minneapolis, MN 55474
Senior Vice President, Assistant Secretary
and Chief Legal Officer (since 2010) | | Chief Legal Officer and Assistant Secretary, Columbia Management Investment Advisers, LLC since June 2005; Vice President and Lead Chief Counsel–Asset Management, Ameriprise Financial, Inc. since May 2010 (previously Vice President and Chief Counsel–Asset Management, from 2005 to April 2010, and Vice President–Asset Management Compliance from 2004 to 2005); Vice President, Chief Counsel and Assistant Secretary, Columbia Management Investment Distributors, Inc. since 2008; Vice President, General Counsel and Secretary, Ameriprise Certificate Company since 2005; Chief Counsel, RiverSource Distributors, Inc. since 2006; Vice President, General Counsel and Secretary, RiverSource Funds, since December 2006; Senior Vice President, Secretary and Chief Legal Officer, Columbia Funds, since May 2010. | |
|
32
Fund Governance (continued)
Officers (continued)
| Name, Year of Birth and Address | | Principal Occupation(s) During the Past Five Years | |
| Linda J. Wondrack (Born 1964) | |
|
225 Franklin Street
Boston, MA 02110
Senior Vice President and Chief
Compliance Officer (since 2007) | | Vice President and Chief Compliance Officer, Columbia Management Investment Advisers, LLC since May 2010; Chief Compliance Officer, Columbia Funds, since 2007, and RiverSource Funds, since May 2010; Director (Columbia Management Group, LLC and Investment Product Group Compliance), Bank of America, from June 2005 to April 2010; Director of Corporate Compliance and Conflicts Officer of MFS Investment Management (investment management) from August 2004 to May 2005. | |
|
| William F. Truscott (Born 1960) | |
|
53600 Ameriprise Financial Center
Minneapolis, MN 55474
Senior Vice President (since 2010) | | Chairman of the Board, Columbia Management Investment Advisers, LLC since May 2010 (previously President, Chairman of the Board and Chief Investment Officer, from 2001 to April 2010); Chief Executive Officer, U.S. Asset Management & President, Annuities, Ameriprise Financial, Inc. since May 2010 (previously President–U.S. Asset Management and Chief Investment Officer from 2005 to April 2010, and Senior Vice President—Chief Investment Officer, from 2001 to 2005); Director, President and Chief Executive Officer, Ameriprise Certificate Company since 2006; Director, Columbia Management Investment Distributors, Inc. since May 2010 (previously Chairman of the Board and Chief Executive Officer from 2008 to April 2010); Chairman of the Board and Chief Executive Officer, RiverSource Distributors, Inc. since 2006. | |
|
| Colin Moore (Born 1958) | |
|
225 Franklin Street
Boston, MA 02110
Senior Vice President (since 2010) | | Director and Chief Investment Officer, Columbia Management Investment Advisers, LLC since May 2010; Manager, Managing Director and Chief Investment Officer of Columbia Management Advisors, LLC from 2007 to April 2010; Head of Equities, Columbia Management Advisors, LLC from 2002 to 2007. | |
|
| Amy Johnson (Born 1965) | |
|
5228 Ameriprise Financial Center
Minneapolis, MN 55474
Vice President (since 2010) | | Senior Vice President and Chief Operating Officer, Columbia Management Investment Advisers, LLC since May 2010 (previously Chief Administrative Officer, from 2009 until April 2010, Vice President—Asset Management and Trust Company Services, from 2006 to 2009, and Vice President—Operations and Compliance from 2004 to 2006). | |
|
| Joseph F. DiMaria (Born 1968) | |
|
225 Franklin Street
Boston, MA 02110
Vice President (since 2011) and
Chief Accounting Officer (since 2008) | | Vice President, Mutual Fund Administration, Columbia Management Investment Advisers, LLC, since May 2010; Director of Fund Administration, Columbia Management Advisors, LLC from January 2006 to April 2010; Head of Tax/Compliance and Assistant Treasurer, Columbia Management Advisors, LLC, from November 2004 to December 2005. | |
|
| Stephen T. Welsh (born 1957) | |
|
225 Franklin Street
Boston, MA 02110
Vice President (since 2006) | | President and Director, Columbia Management Investment Services Corp. since May 2010; President and Director, Columbia Management Services, Inc. from July 2004 to April 2010; Managing Director, Columbia Management Distributors, Inc. from August 2007 to April 2010. | |
|
33
Fund Governance (continued)
Officers (continued)
| Name, Year of Birth and Address | | Principal Occupation(s) During the Past Five Years | |
| Paul D. Pearson (born 1956) | |
|
5228 Ameriprise Financial Center
Minneapolis, MN 55474
Vice President and Assistant
Treasurer (since 2011) | | Vice President, Investment Accounting, Columbia Management Investment Advisers, LLC, since May 2010; Vice President, Managed Assets, Investment Accounting, Ameriprise Financial Corporation. | |
|
| Paul B. Goucher (born 1968) | |
|
5228 Ameriprise Financial Center
Minneapolis, MN 55474
Vice President and Assistant
Secretary (since 2010) | | Vice President and Chief Counsel of Ameriprise Financial since January 2010 (formerly Vice President and Group Counsel from November 2008 to January 2010); Director, Managing Director and General Counsel of J. & W. Seligman & Co. Incorporated (Seligman) from July 2008 to November 2008 and Managing Director and Associate General Counsel of Seligman from January 2005 to July 2008. | |
|
| Christopher O. Petersen (born 1970) | |
|
5228 Ameriprise Financial Center
Minneapolis, MN 55474
Vice President (since 2010) and
Secretary (since 2011) | | Vice President and Chief Counsel, Ameriprise Financial since January 2010 (formerly Vice President and Group Counsel or Counsel from April 2004 to January 2010); Assistant Secretary of RiverSource Funds since January 2007. | |
|
| Michael E. DeFao (born 1968) | |
|
5228 Ameriprise Financial Center
Minneapolis, MN 55474
Vice President and Assistant
Secretary (since 2011) | | Vice President and Chief Counsel, Ameriprise Financial since May 2010; Associate General Counsel Bank of America from June 2005 to April 2010 | |
|
34
This page intentionally left blank.
This page intentionally left blank.
Important Information About This Report
The fund mails one shareholder report to each shareholder address. If you would like more than one report, please call shareholder services at 1-800-345-6611 and additional reports will be sent to you. This report has been prepared for shareholders of Columbia Massachusetts Tax-Exempt Fund.
A description of the policies and procedures that the fund uses to determine how to vote proxies and a copy of the fund's voting records are available (i) at www.columbiamanagement.com, (ii) on the Securities and Exchange Commission's website at www.sec.gov, and (iii) without charge, upon request, by calling 1-800-368-0346. Information regarding how the fund voted proxies relating to portfolio securities during the 12-month period ended June 30 is available from the SEC's website. Information regarding how the fund voted proxies relating to portfolio securities is also available from the fund's website, www.columbiamanagement.com.
The fund files a complete schedule of portfolio holdings with the SEC for the first and third quarters of each fiscal year on Form N-Q. The fund's Form N-Q is available on the SEC's website at www.sec.gov and may be reviewed and copied at the SEC's Public Reference Room in Washington, D.C. Information on the operation of the Public Reference Room may be obtained by calling 1-800-SEC-0330.
Transfer Agent
Columbia Management Investment
Services Corp.
P.O. Box 8081
Boston, MA 02266-8081
1-800-345-6611
Distributor
Columbia Management Investment
Distributors, Inc.
225 Franklin Street
Boston, MA 02110
Investment Manager
Columbia Management Investment Advisers, LLC
225 Franklin Street
Boston, MA 02110
37

Columbia Massachusetts Tax-Exempt Fund
P. O. Box 8081
Boston, MA 02266-8081
columbiamanagement.com
This information is for use with concurrent or prior delivery of a fund prospectus. Investors should consider the investment objectives, risks, charges and expenses of a mutual fund carefully before investing. For a free prospectus, which contains this and other important information about the funds, visit columbiamanagement.com. Read the prospectus carefully before investing. The Fund is distributed by Columbia Management Investment Distributors, Inc., member FINRA, and managed by Columbia Management Investment Advisers, LLC.
© 2011 Columbia Management Investment Advisers, LLC. All rights reserved.
C-1016 C (12/11)

Columbia New York Tax-Exempt Fund
Annual Report for the Period Ended October 31, 2011
Not FDIC insured • No bank guarantee • May lose value
Table of Contents
| Fund Profile | | | 1 | | |
|
| Performance Information | | | 2 | | |
|
| Understanding Your Expenses | | | 3 | | |
|
| Portfolio Manager's Report | | | 4 | | |
|
| Portfolio of Investments | | | 6 | | |
|
Statement of Assets and
Liabilities | | | 13 | | |
|
| Statement of Operations | | | 15 | | |
|
Statement of Changes in
Net Assets | | | 16 | | |
|
| Financial Highlights | | | 18 | | |
|
| Notes to Financial Statements | | | 22 | | |
|
Report of Independent Registered
Public Accounting Firm | | | 31 | | |
|
| Federal Income Tax Information | | | 32 | | |
|
| Fund Governance | | | 33 | | |
|
Important Information About
This Report | | | 41 | | |
|
The views expressed in this report reflect the current views of the respective parties. These views are not guarantees of future performance and involve certain risks, uncertainties and assumptions that are difficult to predict, so actual outcomes and results may differ significantly from the views expressed. These views are subject to change at any time based upon economic, market or other conditions and the respective parties disclaim any responsibility to update such views. These views may not be relied on as investment advice and, because investment decisions for a Columbia Fund are based on numerous factors, may not be relied on as an indication of trading intent on behalf of any particular Columbia Fund. References to specific securities should not be construed as a recommendation or investment advice.
President's Message

Dear Shareholders,
Economic momentum slowed in the third quarter of 2011, raising the odds of recession and making the U.S. economy more susceptible to financial shocks. The unemployment rate remained stalled as growing uncertainty continued to weigh on prospective employers. Monthly indicators for the manufacturing and service sectors also showed signs of slowing. Equity and high-yield bond markets fell sharply as investor confidence was shaken by Europe's lingering debt crisis, a heated debate in Washington over fiscal deficits (which eventually led to a downgrade of U.S. government debt) and tepid economic growth. The U.S. stock market experienced its worst quarter in two years during the third quarter of 2011, with volatility and selling pressure reminiscent of the market selloff in 2008, as macro-economic concerns continued to mount.
During its September meeting, the Federal Reserve Board announced that it was prepared to purchase longer term securities and sell shorter term securities in an effort to keep long-term interest rates down. Their hope is that lower long-term borrowing rates will stimulate business investment and hiring. However, the question remains as to whether monetary policy alone will be enough to resuscitate growth in the current environment.
Despite this challenging and volatile economic backdrop, I believe Columbia Management remains strong and steadfast. Columbia Management is the eighth largest manager of long-term mutual fund assets with $325 billion under management as of September 30, 2011. The past year has been one of considerable change for the organization as we worked diligently to align products, services and resources in the integration of Columbia Management with RiverSource Investments. The incredible line-up of talent, resources and capabilities that has resulted is highlighted by the success of our products. As of September 30, 2011, Columbia Management offers 54 funds rated 4 and 5 stars by Morningstar. Additionally, The Wall Street Journal has named two Columbia funds "Category Kings" in its "Investing in Funds: A Quarterly Analysis" issue dated October 5, 2011 in recognition for their one-year performance as of September 30, 2011.
For more information about these and other funds offered by Columbia Management, including detailed, up-to-date fund performance and portfolio information, please visit us online at columbiamanagement.com. Other information and resources available on our website include:
g timely economic analysis and market commentary
g quarterly fund commentaries
g Columbia Management Investor, a quarterly newsletter for shareholders
Thank you for your continued support of the Columbia Funds. We look forward to serving your investment needs for many years to come.
Best Regards,

J. Kevin Connaughton
President, Columbia Funds
All ratings are Class Z as of 9/30/2011. Out of 118 Z-share Columbia funds rated by Morningstar, 8 funds received a 5-star Overall Rating and 46 funds received a 4-star Overall Rating. The Overall Morningstar Rating for a retail mutual fund is derived from a weighted average of the performance figures associated with its 3-, 5- and 10-year (if applicable) Morningstar Rating metrics. For share classes that do not have a 3-, 5-, or 10-year actual performance history, the fund's independent Morningstar Rating metric is then compared against the retail mutual fund universe breakpoints to determine its hypothetical rating.
For each fund with at least a three-year history, Morningstar calculates a Morningstar RatingTM based on a Morningstar Risk-Adjusted Return measure that accounts for variation in a fund's monthly performance (including the effects of sales charges, loads, and redemption fees), placing more emphasis on downward variations and rewarding consistent performance. The top 10% of funds in each category receive 5 stars, the next 22.5% receive 4 stars, the next 35% receive 3 stars, the next 22.5% receive 2 stars and the bottom 10% receive 1 star. (Each share class is counted as a fraction of one fund within this scale and rated separately, which may cause slight variations in the distribution percentages.)
The Morningstar RatingTM is for Class Z shares only; other classes may have different performance characteristics and may have different ratings. © 2011 Morningstar, Inc. All Rights Reserved. The Morningstar information contained herein: (1) is proprietary to Morningstar and/or its content providers; (2) may not be copied or distributed; and (3) is not warranted to be accurate, complete or timely. Neither Morningstar nor its content providers are responsible for any damages or losses arising from any use of this information.
The Wall Street Journal "Category Kings" methodology: Top-performing funds in each category ranked by one-year total returns (changes in net asset values and reinvested distributions) for the period ended September 30, 2011.
Investors should consider the investment objectives, risks, charges and expenses of a mutual fund carefully before investing. For a free prospectus, which contains this and other important information about the funds, visit www.columbiamanagement.com. The prospectus should be read carefully before investing.
Columbia Funds are distributed by Columbia Management Investment Distributors, Inc., member FINRA, and managed by Columbia Management Investment Advisers, LLC.
© 2011 Columbia Management Investment Advisers, LLC. All rights reserved.
Fund Profile – Columbia New York Tax-Exempt Fund
Summary
g For the 12-month period that ended October 31, 2011, the fund's Class A shares returned 3.40% without sales charge.
g The fund came out behind its benchmarks, the Barclays Capital New York Municipal Bond Index1 and the broader Barclays Capital Municipal Bond Index2, but ahead of the average fund in its peer group, the Lipper New York Municipal Debt Funds Classification.3
g Security selection within certain sectors hampered results, while credit quality and interest-rate positioning helped.
Portfolio Management
Catherine Stienstra has managed the fund since October 2010 and has been associated with Columbia Management Investment Advisers, LLC or its predecessors since 2007.
1The Barclays Capital New York Municipal Bond Index is a market capitalization-weighted index of New York investment-grade bonds with maturity of one year or more.
2The Barclays Capital Municipal Bond Index is considered representative of the broad market for investment-grade, tax-exempt bonds with maturity of at least one year.
3Lipper Inc., a widely respected data provider in the industry, calculates an average total return (assuming reinvestment of distributions) for mutual funds with investment objectives similar to those of the fund. Lipper makes no adjustment for the effect of sales loads.
Indices are not available for investment, are not professionally managed and do not reflect sales charges, fees, brokerage commissions, taxes or other expenses of investing. Securities in the fund may not match those in an index.
Performance data quoted represents past performance and current performance may be lower or higher. Past performance is no guarantee of future results. The investment return and principal value will fluctuate so that shares, when redeemed, may be worth more or less than the original cost. Please visit www.columbiamanagement.com for daily and most recent month-end performance updates.
Summary
1-year return as of 10/31/11
| | | | +3.40% | |
|
|  | | | Class A shares
(without sales charge) | |
|
| | | | +3.54% | |
|
|  | | | Barclays Capital New York Municipal Bond Index | |
|
| | | | +3.78% | |
|
|  | | | Barclays Capital Municipal Bond Index | |
|
1
Performance Information – Columbia New York Tax-Exempt Fund
Performance data quoted represents past performance and current performance may be lower or higher. Past performance is no guarantee of future results. The investment return and principal value will fluctuate so that shares, when redeemed, may be worth more or less than the original cost. Please visit www.columbiamanagement.com for daily and most recent month-end performance updates.
Performance of a $10,000 investment 11/01/01 – 10/31/11
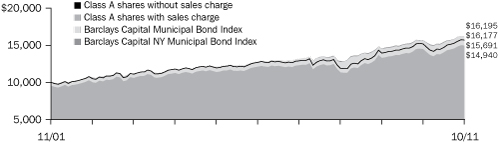
The chart above shows the change in value of a hypothetical $10,000 investment in Class A shares of Columbia New York Tax-Exempt Fund during the stated time period, and does not reflect the deduction of taxes that a shareholder may pay on fund distributions or on the redemption of fund shares.
Performance of a $10,000 investment 11/01/01 – 10/31/11 ($)
| Sales charge | | without | | with | |
| Class A | | | 15,691 | | | | 14,940 | | |
| Class B | | | 14,562 | | | | 14,562 | | |
| Class C | | | 15,007 | | | | 15,007 | | |
| Class Z | | | n/a | | | | n/a | | |
Average annual total return as of 10/31/11 (%)
| Share class | | A | | B | | C | | Z | |
| Inception | | 09/26/86 | | 08/04/92 | | 08/01/97 | | 09/01/11 | |
| Sales charge | | without | | with | | without | | with | | without | | with | | without | |
| 1-year | | | 3.40 | | | | –1.56 | | | | 2.62 | | | | –2.33 | | | | 2.95 | | | | 1.96 | | | | n/a | | |
| 5-year | | | 4.32 | | | | 3.32 | | | | 3.54 | | | | 3.21 | | | | 3.85 | | | | 3.85 | | | | n/a | | |
| 10-year/Life | | | 4.61 | | | | 4.10 | | | | 3.83 | | | | 3.83 | | | | 4.14 | | | | 4.14 | | | | 0.96 | | |
The "with sales charge" returns include the maximum initial sales charge of 4.75% for Class A shares and the applicable contingent deferred sales charge of 5.00% in the first year, declining to 1.00% in the sixth year and eliminated thereafter for Class B shares and 1.00% for Class C shares for the first year only. The "without sales charge" returns do not include the effect of sales charges. If they had, returns would be lower.
Performance results reflect any fee waivers or reimbursements of fund expenses by the Investment Manager and/or any of its affiliates. Absent these fee waivers or expense reimbursement arrangements, performance results would have been lower.
All results shown assume reinvestment of distributions. Performance for different share classes will vary based on differences in sales charges and the fees associated with each class. Please see the fund's prospectuses for details.
The tables do not reflect the deduction of taxes that a shareholder may pay on fund distributions or on the redemption of fund shares.
2
Understanding Your Expenses – Columbia New York Tax-Exempt Fund
As a shareholder, you incur two types of costs. There are transaction costs, which generally include sales charges on purchases and may include redemption fees. There are also ongoing costs, which generally include management fees, distribution and service (Rule 12b-1) fees, and other fund expenses. The following information is intended to help you understand your ongoing costs (in dollars) of investing in the Fund and to compare these costs with the ongoing costs of investing in other mutual funds.
Analyzing your fund's expenses
To illustrate these ongoing costs, we provided examples and calculated the expenses paid by investors in each share class of the Fund during the period. The information in the table is based on an initial investment of $1,000 at the beginning of the period indicated and held for the entire period. Expense information is calculated two ways and each method provides you with different information. The amount listed in the "Actual" column is calculated using the Fund's actual operating expenses and total return for the period. You may use the Actual information, together with the amount invested, to estimate the expenses that you paid over the period. Simply divide your account value by $1,000 (for example, an $8,600 account value divided by $1,000 = 8.6), then multiply the results by the expenses paid during the period under the Actual column. The amount listed in the "Hypothetical" column assumes a 5% annual rate of return before expenses (which is not the Fund's actual return) and then applies the Fund's actual expense ratio for the period to the hypothetical return. You should not use the hypothetical account values and expenses to estimate either your actual account balance at the end of the period or the expenses you paid during the period. See the "Compare with other funds" information with details on using the hypothetical data.
Compare with other funds
Since all mutual funds are required to include the same hypothetical calculations about expenses in shareholder reports, you can use this information to compare the ongoing cost of investing in the Fund with other funds. To do so, compare the hypothetical example with the 5% hypothetical examples that appear in the shareholder reports of other funds. As you compare hypothetical examples of other funds, it is important to note that hypothetical examples are meant to highlight the ongoing costs of investing in a fund only and do not reflect any transaction costs, such as sales charges, or redemption or exchange fees. Therefore, the hypothetical calculations are useful in comparing ongoing costs only, and will not help you determine the relative total costs of owning different funds. If transaction costs were included in these calculations, your costs would have been higher.
05/01/11 – 10/31/11
| | | Account value at the
beginning of the period ($) | | Account value at the
end of the period ($) | | Expenses paid
during the period ($) | | Fund's annualized
expense ratio (%) | |
| | | Actual | | Hypothetical | | Actual | | Hypothetical | | Actual | | Hypothetical | | Actual | |
| Class A | | | 1,000.00 | | | | 1,000.00 | | | | 1,067.30 | | | | 1,021.22 | | | | 4.12 | | | | 4.02 | | | | 0.79 | | |
| Class B | | | 1,000.00 | | | | 1,000.00 | | | | 1,063.30 | | | | 1,017.44 | | | | 8.01 | | | | 7.83 | | | | 1.54 | | |
| Class C | | | 1,000.00 | | | | 1,000.00 | | | | 1,065.00 | | | | 1,019.00 | | | | 6.40 | | | | 6.26 | | | | 1.23 | | |
| Class Z | | | 1,000.00 | | | | 1,000.00 | | | | 1,009.60 | | | | 1,022.58 | | | | 0.84 | * | | | 2.65 | | | | 0.52 | | |
Expenses paid during the period are equal to the annualized expense ratio for each class as indicated above, multiplied by the average account value over the period and then multiplied by the number of days in the Fund's most recent fiscal half year and divided by 365.
Expenses do not include fees and expenses incurred indirectly by the Fund from the underlying funds in which the Fund may invest (also referred to as "acquired funds"), including affiliated and non-affiliated pooled investments vehicles (including mutual funds and exchange traded funds).
Had Columbia Management Investment Advisers, LLC and/or certain of its affiliates not waived/reimbursed certain fees and expenses, account value at the end of the period would have been reduced.
*For the period September 1, 2011 through October 31, 2011. Class Z shares commenced operations on September 1, 2011.
3
Portfolio Manager's Report – Columbia New York Tax-Exempt Fund
Performance data quoted represents past performance and current performance may be lower or higher. Past performance is no guarantee of future results. The investment return and principal value will fluctuate so that shares, when redeemed, may be worth more or less than the original cost. Please visit www.columbiamanagement.com for daily and most recent month-end performance updates.
Net asset value per share
as of 10/31/11 ($)
| Class A | | | 7.27 | | |
| Class B | | | 7.27 | | |
| Class C | | | 7.27 | | |
| Class Z | | | 7.27 | | |
Distributions declared per share
11/01/10 – 10/31/11 ($)
| Class A | | | 0.30 | | |
| Class B | | | 0.25 | | |
| Class C | | | 0.27 | | |
| Class Z | | | 0.05 | | |
A portion of the fund's income may be subject to the alternative minimum tax. The fund may at times purchase tax-exempt securities at a discount. Some, or all, of this discount may be included in the fund's ordinary income, and is taxable when distributed. Distributions include $0.01 per share of taxable realized gains for Class A, Class B and Class C shares.
30-day SEC yields
as of 10/31/11 (%)
| Class A | | | 3.23 | | |
| Class B | | | 2.65 | | |
| Class C | | | 2.94 | | |
| Class Z | | | 3.68 | | |
The 30-day SEC yields reflect the fund's earning power, net of expenses, expressed as an annualized percentage of the public offering price per share at the end of the period. Had the Investment Manager and/or any of its affiliates not waived fees or reimbursed a portion of expenses, the 30-day SEC yields would have been lower.
For the 12-month period that ended October 31, 2011, the fund's Class A shares returned 3.40% without sales charge. The fund's benchmarks, the Barclays Capital New York Municipal Bond Index, returned 3.54%, and the broader Barclays Capital Municipal Bond Index, gained 3.78%. The average return of the funds in its peer group, the Lipper New York Municipal Debt Funds Classification was 2.27%.
After a weak start, municipal bond market conditions improved
The municipal bond market got off to a difficult start in the fourth quarter of 2010 after a well-publicized but so-far erroneous prediction that the municipal bond market was ripe for massive defaults led many investors to sell municipal securities. At the same time that demand was falling, supply was increasing leading up to the 2010 year end. Yields rose, bond prices fell and the yield curve steepened into March 2011. However, market conditions began to improve later in the spring, as credit fears eased and outflows slowed. State and local tax revenues have been growing for six consecutive quarters, and new issuance slowed as many states implemented sharp budget cuts and delayed capital expenditures. As such, defaults remained scarce. The year-to-date total is just over $1 billion, mostly in non-rated sectors. Against this backdrop, municipal bond yields began to look attractive relative to Treasury yields, and investors eventually began buying municipal securities again. Over the last seven months of the period, municipal bond yields fell across all maturities, but especially on longer-term issues. Credit spreads—the difference between the yields on lower and higher quality bonds—also narrowed. As both yield and credit spreads narrowed, municipal bond returns got a boost for the year.
Positive contribution from longer maturity and credit quality positioning
The fund's duration was longer than the duration of its Barclays Capital New York benchmark, which benefited performance. (Duration is a measure of interest rate sensitivity.) Longer-maturity bonds experienced the biggest price gains as yields fell and offered a yield advantage over shorter-maturity issues. In addition, security selection was strong in lower quality segments, particularly among bonds rated A or lower. Certain allocations further aided performance, including overweights in the leasing and hospital sectors, where returns were strong, and an underweight in industrial development/pollution control revenue bonds, which were poor performers. On the downside, security selection in the AA rated segment, as well as in the hospital and education sectors, detracted from performance.
Changes to positioning
During the selloff that began late in 2010, we added longer-maturity bonds because we believed they were being unfairly pressured by an unfavorable supply/demand situation in the municipal market rather than by any fundamental problems. We also boosted the fund's stake in lower rated securities, particularly A and BBB bonds. To fund these purchases, we reduced exposure to higher quality AAA bonds, as well as
4Ratings are relative and subjective and are not absolute standards of quality. The credit ratings typically range from AAA (highest) to D (lowest), and are subject to change. The credit quality of the fund's investments does not remove market risk.
4
Portfolio Manager's Report (continued) – Columbia New York Tax-Exempt Fund
special non-property bonds. These are typically very high quality issues because they're backed by dedicated tax revenues, such as sales or special use taxes.
Next steps
Going forward, we plan to monitor closely any federal government deficit reduction proposals that could affect the tax-exempt status of municipal bonds. At the state level, we expect the local municipal market to benefit from the state's relative strengths. New York's economic recovery, for example, has outpaced that of many other states, thanks to steady job numbers in many industries as well as in state and local government. On the downside, many banks and financial companies remain under pressure, as do manufacturers in upstate New York. Leading banks in New York City have already laid off workers to reduce costs. We believe all of these factors, both positive and negative, are already reflected by the state's Aa2 credit rating from Moody's. With expectations that interest rates and inflation will stay low in the coming year, we plan to continue to favor longer-maturity and lower quality issues, which offer added yields that can help boost total return. In addition, we will continue to emphasize individual security selection, relying heavily upon our proprietary credit research team. We will carefully monitor a number of potential variables and will not hesitate to adjust the fund's duration, credit quality and/or sector positioning accordingly.
Portfolio characteristics and holdings are subject to change periodically and may not be representative of current characteristics and holdings. The outlook for the fund may differ from that presented for other Columbia Funds.
Tax-exempt investing offers current tax-exempt income, but it also involves certain risks. The value of the fund will be affected by interest rate changes and the creditworthiness of issues held in the fund. When interest rates go up, bond prices generally drop and vice versa. Interest income from certain tax-exempt bonds may be subject to certain state and local taxes and, if applicable, the alternative minimum tax. Any capital gains distributed are taxable to the investor.
The fund is non-diversified, which generally means that it may invest a greater percentage of its total assets in the securities of fewer issuers than a "diversified" fund. This increases the risk that a change in the value of any one investment held by the Fund could affect the overall value of the Fund more than it would affect that of a diversified fund holding a greater number of investments. Accordingly, the fund's value will likely be more volatile than the value of more diversified funds.
Single-state municipal bond funds pose additional risks due to limited geographical diversification.
Taxable-equivalent SEC yields
as of 10/31/11 (%)
| Class A | | | 4.97 | | |
| Class B | | | 4.08 | | |
| Class C | | | 4.52 | | |
| Class Z | | | 5.66 | | |
Taxable-equivalent SEC yields are calculated assuming a federal tax rate of 35.0%. This tax rate does not reflect the phase out of exemptions or the reduction of the otherwise allowable deductions that occur when adjusted gross income exceeds certain levels. Your taxable-equivalent yield may be different depending on your tax bracket.
Quality breakdown
as of 10/31/11 (%)
| AAA | | | 9.9 | | |
| AA | | | 44.7 | | |
| A | | | 26.8 | | |
| BBB | | | 11.7 | | |
| BB | | | 2.2 | | |
| B | | | 0.5 | | |
| Non-Rated | | | 4.2 | | |
Maturity breakdown
as of 10/31/11 (%)
| 0-1 year | | | 0.2 | | |
| 1-3 years | | | 1.3 | | |
| 3-5 years | | | 3.0 | | |
| 5-7 years | | | 2.4 | | |
| 7-10 years | | | 8.6 | | |
| 10-15 years | | | 16.0 | | |
| 15-20 years | | | 23.5 | | |
| 20-25 years | | | 21.3 | | |
| 25 years and over | | | 21.5 | | |
| Cash Equivalents | | | 2.2 | | |
Ratings shown in the quality breakdown are assigned to individual bonds by taking the lower of the ratings available from one of the following nationally recognized rating agencies: Standard & Poor's or Moody's Investor Services. If a security is rated by only one of the two agencies, that rating is used. If a security is not rated by either of the two agencies, it is designated as Non-Rated. Ratings are relative and subjective and are not absolute standards of quality. The credit quality of the fund's investments does not remove market risk.
The fund is actively managed and the composition of its portfolio will change over time. Information provided is calculated as a percentage of net assets.
5
Portfolio of Investments – Columbia New York Tax-Exempt Fund
October 31, 2011
(Percentages represent value of investments compared to net assets)
Issue
Description | | Coupon
Rate | | Principal
Amount | | Value | |
| Municipal Bonds 97.5% | |
| Advanced Refunded 3.5% | |
Greece Central School District
Unlimited General Obligation Bonds
Series 1992 (FGIC) | |
| 06/15/16 | | | 6.000 | % | | $ | 500,000 | | | $ | 609,200 | | |
New York City Transitional Finance Authority
Prerefunded 11/01/11 Revenue Bonds
Future Tax Secured
Series 2001B | |
| 05/01/30 | | | 5.000 | % | | | 1,465,000 | | | | 1,479,650 | | |
New York State Dormitory Authority
Revenue Bonds
Capital Appreciation-Memorial Sloan Center
Series 2003-1 Escrowed to Maturity (NPFGC)(a) | |
| 07/01/25 | | | 0.000 | % | | | 3,000,000 | | | | 1,967,670 | | |
Triborough Bridge & Tunnel Authority
Prerefunded 01/01/22 Revenue Bonds
General Purpose
Series 1999B | |
| 01/01/30 | | | 5.500 | % | | | 1,800,000 | | | | 2,282,076 | | |
| Total | | | 6,338,596 | | |
| Airport 3.7% | |
New York City Industrial Development Agency(b)
Revenue Bonds
Terminal One Group Association Project
Series 2005 AMT | |
| 01/01/15 | | | 5.500 | % | | | 1,500,000 | | | | 1,618,065 | | |
New York City Industrial Development Agency(b)(c)
Revenue Bonds
Terminal One Group Association Project
Series 2005 AMT | |
| 01/01/24 | | | 5.500 | % | | | 2,000,000 | | | | 2,061,300 | | |
New York City Industrial Development Agency(b)(c)(f)
Revenue Bonds
American Airlines-JFK International Airport
Series 2005 AMT | |
| 08/01/31 | | | 7.750 | % | | | 1,000,000 | | | | 925,030 | | |
Port Authority of New York & New Jersey
Revenue Bonds
JFK International Air Terminal
Series 2010 | |
| 12/01/42 | | | 6.000 | % | | | 2,000,000 | | | | 2,091,440 | | |
| Total | | | 6,695,835 | | |
| City 1.8% | |
City of New York
Unlimited General Obligation Bonds
Series 2010B | |
| 08/01/21 | | | 5.000 | % | | | 500,000 | | | | 585,200 | | |
| Series 2011A-1 | |
| 08/01/28 | | | 5.000 | % | | | 1,000,000 | | | | 1,102,960 | | |
| Subordinated Series 2009I-1 | |
| 04/01/27 | | | 5.125 | % | | | 1,500,000 | | | | 1,641,555 | | |
Unlimited General Obligation Unrefunded Bonds
Series 1995C | |
| 08/15/24 | | | 7.250 | % | | | 5,000 | | | | 5,026 | | |
| Total | | | 3,334,741 | | |
Issue
Description | | Coupon
Rate | | Principal
Amount | | Value | |
| Municipal Bonds (continued) | |
| College 18.0% | |
City of Troy
Revenue Bonds
Rensselaer Polytechnic
Series 2010A | |
| 09/01/40 | | | 5.125 | % | | $ | 2,000,000 | | | $ | 2,021,800 | | |
Dutchess County Industrial Development Agency
Refunding Revenue Bonds
Bard College Civic Facilities
Series 2007A-1 | |
| 08/01/22 | | | 5.000 | % | | | 500,000 | | | | 518,225 | | |
Revenue Bonds
Bard College Civic Facility
Series 2007A-2 | |
| 08/01/36 | | | 4.500 | % | | | 500,000 | | | | 453,485 | | |
Nassau County Industrial Development Agency
Refunding Revenue Bonds
New York Institute of Technology Project
Series 2000A | |
| 03/01/26 | | | 4.750 | % | | | 1,210,000 | | | | 1,237,515 | | |
New York City Trust for Cultural Resources
Revenue Bonds | |
| 01/01/34 | | | 5.000 | % | | | 375,000 | | | | 400,313 | | |
Revenue Bonds
Juilliard School
Series 2009A | |
| 01/01/39 | | | 5.000 | % | | | 500,000 | | | | 528,625 | | |
New York State Dormitory Authority
Revenue Bonds
Brooklyn Law School
Series 2003B (XLCA) | |
| 07/01/30 | | | 5.125 | % | | | 2,000,000 | | | | 2,080,940 | | |
Consolidated City University System
Series 1993A | |
| 07/01/13 | | | 5.750 | % | | | 1,695,000 | | | | 1,772,445 | | |
Consolidated City University System 5th General Resolution
Series 2008B | |
| 07/01/27 | | | 5.000 | % | | | 1,000,000 | | | | 1,063,980 | | |
Cornell University
Series 2006A | |
| 07/01/31 | | | 5.000 | % | | | 1,000,000 | | | | 1,051,700 | | |
| Series 2009A | |
| 07/01/27 | | | 5.000 | % | | | 1,000,000 | | | | 1,115,000 | | |
| 07/01/39 | | | 5.000 | % | | | 500,000 | | | | 534,070 | | |
Manhattan Marymount College
Series 2009 | |
| 07/01/29 | | | 5.250 | % | | | 1,500,000 | | | | 1,494,750 | | |
Mount Sinai School of Medicine
Series 2009 | |
| 07/01/39 | | | 5.125 | % | | | 1,000,000 | | | | 1,019,930 | | |
New York University-Independent School District
Series 2001-1 (AMBAC) | |
| 07/01/40 | | | 5.500 | % | | | 1,000,000 | | | | 1,219,560 | | |
Pratt Institute
Series 2009C | |
| 07/01/39 | | | 5.125 | % | | | 1,000,000 | | | | 1,033,530 | | |
The Accompanying Notes to Financial Statements are an integral part of this statement.
6
Columbia New York Tax-Exempt Fund
October 31, 2011
(Percentages represent value of investments compared to net assets)
Issue
Description | | Coupon
Rate | | Principal
Amount | | Value | |
| Municipal Bonds (continued) | |
| College (cont.) | |
Rochester Institute of Technology
Series 2008A | |
| 07/01/33 | | | 6.000 | % | | $ | 1,000,000 | | | $ | 1,101,820 | | |
St. John's University
Series 2007A (NPFGC) | |
| 07/01/32 | | | 5.250 | % | | | 1,000,000 | | | | 1,033,550 | | |
| Series 2007C (NPFGC) | |
| 07/01/26 | | | 5.250 | % | | | 1,205,000 | | | | 1,366,530 | | |
State University Dormitory Facilities
Series 2011A | |
| 07/01/31 | | | 5.000 | % | | | 3,000,001 | | | | 3,208,590 | | |
Teacher's College
Series 2009 | |
| 03/01/39 | | | 5.500 | % | | | 500,000 | | | | 534,125 | | |
The New School
Series 2010 | |
| 07/01/40 | | | 5.500 | % | | | 1,500,000 | | | | 1,588,890 | | |
University of Rochester
Series 2009A | |
| 07/01/39 | | | 5.125 | % | | | 2,250,000 | | | | 2,368,507 | | |
Yeshiva University
Series 2001 (AMBAC) | |
| 07/01/30 | | | 5.000 | % | | | 75,000 | | | | 75,043 | | |
Seneca County Industrial Development Agency
Revenue Bonds
New York Chiropractic College
Series 2007 | |
| 10/01/27 | | | 5.000 | % | | | 750,000 | | | | 750,345 | | |
St. Lawrence County Industrial Development Agency
Revenue Bonds
Clarkson University Project
Series 2007 | |
| 07/01/31 | | | 5.000 | % | | | 1,000,000 | | | | 1,024,200 | | |
Town of Hempstead Local Development Corp.
Revenue Bonds
Molloy College Project
Series 2009 | |
| 07/01/39 | | | 5.750 | % | | | 1,000,000 | | | | 1,040,100 | | |
Yonkers Industrial Development Agency
Revenue Bonds
Sarah Lawrence College Project
Series 2001A | |
| 06/01/29 | | | 6.000 | % | | | 1,000,000 | | | | 1,078,110 | | |
| Total | | | 32,715,678 | | |
| County 0.8% | |
County of Monroe
Unlimited General Obligation Refunding & Public
Improvement Bonds
Series 1996 (NPFGC) | |
| 03/01/15 | | | 6.000 | % | | | 1,250,000 | | | | 1,393,538 | | |
| Electric 2.4% | |
Long Island Power Authority
Revenue Bonds
Series 2008A | |
| 05/01/33 | | | 6.000 | % | | | 1,000,000 | | | | 1,124,360 | | |
| Series 2009A | |
| 04/01/23 | | | 5.000 | % | | | 750,000 | | | | 826,507 | | |
Issue
Description | | Coupon
Rate | | Principal
Amount | | Value | |
| Municipal Bonds (continued) | |
| Electric (cont.) | |
New York State Energy Research & Development Authority
Revenue Bonds
Series 1993(c) | |
| 04/01/20 | | | 11.448 | % | | $ | 1,500,000 | | | $ | 1,513,500 | | |
Suffolk County Industrial Development Agency
Revenue Bonds
Nissequogue Cogen Partners Facility
Series 1998 AMT(b) | |
| 01/01/23 | | | 5.500 | % | | | 1,000,000 | | | | 970,870 | | |
| Total | | | 4,435,237 | | |
| Health Care - Hospital 14.3% | |
Albany Industrial Development Agency
Revenue Bonds
St. Peters Hospital Project
Series 2008A | |
| 11/15/27 | | | 5.250 | % | | | 2,000,000 | | | | 1,974,360 | | |
Monroe County Industrial Development Corp.
Revenue Bonds
Unity Hospital-Rochester Project
Series 2010 (FHA) | |
| 08/15/35 | | | 5.750 | % | | | 2,000,000 | | | | 2,213,560 | | |
New York State Dormitory Authority
Revenue Bonds
Kaleida Health
Series 2006 (FHA) | |
| 02/15/35 | | | 4.700 | % | | | 1,000,000 | | | | 1,000,780 | | |
Mount Sinai Hospital
Series 2010A | |
| 07/01/26 | | | 5.000 | % | | | 2,275,000 | | | | 2,339,291 | | |
| Series 2011A | |
| 07/01/41 | | | 5.000 | % | | | 2,000,000 | | | | 1,993,720 | | |
NYU Hospital Center
Series 2007B | |
| 07/01/37 | | | 5.625 | % | | | 1,000,000 | | | | 1,016,140 | | |
New York Hospital Medical Center
Series 2007 (FHA) | |
| 02/15/37 | | | 4.750 | % | | | 975,000 | | | | 977,194 | | |
New York University Hospital Center
Series 2006A | |
| 07/01/20 | | | 5.000 | % | | | 500,000 | | | | 527,380 | | |
| Series 2007B | |
| 07/01/24 | | | 5.250 | % | | | 640,000 | | | | 664,544 | | |
| Series 2011A | |
| 07/01/31 | | | 5.750 | % | | | 800,000 | | | | 833,152 | | |
North Shore Long Island Jewish
Series 2009A | |
| 05/01/37 | | | 5.500 | % | | | 2,000,000 | | | | 2,058,120 | | |
North Shore-Long Island Jewish
Series 2011A | |
| 05/01/41 | | | 5.000 | % | | | 1,500,000 | | | | 1,484,025 | | |
North Shore-Long Island Jewish Obligation Group
Series 2007A | |
| 05/01/32 | | | 5.000 | % | | | 1,000,000 | | | | 998,730 | | |
Orange Regional Medical Center
Series 2008 | |
| 12/01/29 | | | 6.125 | % | | | 1,900,000 | | | | 1,907,657 | | |
Sloan-Kettering Memorial Center
Series 2006-1 | |
| 07/01/35 | | | 5.000 | % | | | 1,000,000 | | | | 1,031,820 | | |
The Accompanying Notes to Financial Statements are an integral part of this statement.
7
Columbia New York Tax-Exempt Fund
October 31, 2011
(Percentages represent value of investments compared to net assets)
Issue
Description | | Coupon
Rate | | Principal
Amount | | Value | |
| Municipal Bonds (continued) | |
| Health Care - Hospital (cont.) | |
University of Rochester
Series 2007B | |
| 07/01/27 | | | 5.000 | % | | $ | 1,000,000 | | | $ | 1,047,630 | | |
Vassar Brothers Hospital
Series 1997 (AGM) | |
| 07/01/25 | | | 5.375 | % | | | 1,500,000 | | | | 1,505,070 | | |
Saratoga County Industrial Development Agency
Revenue Bonds
Saratoga Hospital Project
Series 2007B | |
| 12/01/32 | | | 5.250 | % | | | 500,000 | | | | 499,975 | | |
Westchester County Healthcare Corp.
Revenue Bonds
Senior Lien
Series 2010C-2 | |
| 11/01/37 | | | 6.125 | % | | | 1,850,000 | | | | 1,903,447 | | |
| Total | | | 25,976,595 | | |
| Health Care - Life Care Center 3.6% | |
Broome County Industrial Development Agency
Revenue Bonds
Good Shepard Village
Series 2008A | |
| 07/01/28 | | | 6.750 | % | | | 500,000 | | | | 487,270 | | |
| 07/01/40 | | | 6.875 | % | | | 250,000 | | | | 239,933 | | |
Huntington Housing Authority
Revenue Bonds
Gurwin Jewish Senior Residences
Series 1999A | |
| 05/01/19 | | | 5.875 | % | | | 1,265,000 | | | | 1,264,949 | | |
Mount Vernon Industrial Development Agency
Revenue Bonds
Wartburg Senior Housing, Inc. - Meadowview
Series 1999 | |
| 06/01/19 | | | 6.150 | % | | | 795,000 | | | | 774,330 | | |
| 06/01/29 | | | 6.200 | % | | | 615,000 | | | | 558,137 | | |
Suffolk County Economic Development Corp.
Refunding Revenue Bonds
Peconic Landing Southold
Series 2010 | |
| 12/01/40 | | | 6.000 | % | | | 1,225,000 | | | | 1,231,737 | | |
Suffolk County Industrial Development Agency
Refunding Revenue Bonds
Jeffersons Ferry Project
Series 2006 | |
| 11/01/28 | | | 5.000 | % | | | 1,335,000 | | | | 1,252,070 | | |
Ulster County Industrial Development Agency
Revenue Bonds
Series 2007A | |
| 09/15/42 | | | 6.000 | % | | | 1,000,000 | | | | 715,950 | | |
| Total | | | 6,524,376 | | |
| Health Care - Nursing Home 0.3% | |
Amherst Industrial Development Agency
Revenue Bonds
Beechwood Health Care Center, Inc.
Series 2007 | |
| 01/01/40 | | | 5.200 | % | | | 750,000 | | | | 576,015 | | |
Issue
Description | | Coupon
Rate | | Principal
Amount | | Value | |
| Municipal Bonds (continued) | |
| Health Care - Other 0.5% | |
Dutchess County Local Development Corp.
Revenue Bonds
Anderson Center Services, Inc. Project
Series 2010 | |
| 10/01/30 | | | 6.000 | % | | $ | 1,000,000 | | | $ | 973,500 | | |
| Housing - Multi-Family 2.2% | |
Housing Development Corp.
Revenue Bonds
Gateway Apartments
Series 2009A | |
| 09/15/25 | | | 4.500 | % | | | 165,000 | | | | 168,838 | | |
| Series 2009C-1 | |
| 11/01/34 | | | 5.500 | % | | | 500,000 | | | | 521,030 | | |
| Series 2009M | |
| 11/01/45 | | | 5.150 | % | | | 1,250,000 | | | | 1,268,475 | | |
New York State Housing Finance Agency
Revenue Bonds
Phillips Village Housing Project
Series 1994A (FHA) AMT(b) | |
| 08/15/17 | | | 7.750 | % | | | 1,935,000 | | | | 1,955,724 | | |
| Total | | | 3,914,067 | | |
| Housing - Single Family 1.8% | |
New York Mortgage Agency(b)
Revenue Bonds
Homeowner Mortgage
Series 1998-69 AMT | |
| 10/01/28 | | | 5.500 | % | | | 390,000 | | | | 390,156 | | |
| Series 1999-82 AMT | |
| 04/01/30 | | | 5.650 | % | | | 210,000 | | | | 210,103 | | |
| Series 2002-101 AMT | |
| 04/01/32 | | | 5.400 | % | | | 1,095,000 | | | | 1,095,252 | | |
| Series 2007-140 AMT | |
| 10/01/21 | | | 4.600 | % | | | 500,000 | | | | 506,540 | | |
| Series 2007-148 AMT | |
| 10/01/32 | | | 5.200 | % | | | 1,000,000 | | | | 1,013,670 | | |
| Total | | | 3,215,721 | | |
| Industrial-Pollution - IDR 1.1% | |
New York State Energy Research & Development Authority
Revenue Bonds
Brooklyn Union Gas Co. Project
Series 1996 (NPFGC) | |
| 01/01/21 | | | 5.500 | % | | | 2,000,000 | | | | 2,006,980 | | |
| Industrial-Pollution - PCR 1.3% | |
Onondaga County Industrial Development Agency
Revenue Bonds
Bristol-Meyers Squibb Co. Project
Series 1994 AMT(b) | |
| 03/01/24 | | | 5.750 | % | | | 2,000,000 | | | | 2,319,360 | | |
| Lease 7.6% | |
Erie County Industrial Development Agency (The)
Revenue Bonds
School District Buffalo Project
Series 2011A | |
| 05/01/32 | | | 5.250 | % | | | 1,000,000 | | | | 1,075,880 | | |
Hudson Yards Infrastructure Corp.
Revenue Bonds
Series 2011A
10/26/2011 | |
| 02/15/47 | | | 5.750 | % | | | 2,000,000 | | | | 2,117,820 | | |
The Accompanying Notes to Financial Statements are an integral part of this statement.
8
Columbia New York Tax-Exempt Fund
October 31, 2011
(Percentages represent value of investments compared to net assets)
Issue
Description | | Coupon
Rate | | Principal
Amount | | Value | |
| Municipal Bonds (continued) | |
| Lease (cont.) | |
New York Local Government Assistance Corp.
Refunding Revenue Bonds
Senior Lien
Series 2007A | |
| 04/01/19 | | | 5.000 | % | | $ | 1,000,000 | | | $ | 1,147,340 | | |
New York State Dormitory Authority
Revenue Bonds
Consolidated City University Systems 2nd Generation
Series 1993A | |
| 07/01/20 | | | 6.000 | % | | | 2,000,000 | | | | 2,371,500 | | |
Mental Health Services Facilities Improvements
Series 2007C (AGM) | |
| 08/15/26 | | | 5.000 | % | | | 2,000,000 | | | | 2,120,780 | | |
School Districts Financing Program
Series 2009C | |
| 10/01/36 | | | 5.125 | % | | | 1,000,000 | | | | 1,055,510 | | |
State University Educational Facilities
Series 2000C (AGM) | |
| 05/15/17 | | | 5.750 | % | | | 1,000,000 | | | | 1,190,310 | | |
New York State Dormitory Authority(a)
Revenue Bonds
Capital Appreciation-Court Facilities
Series 1998 | |
| 08/01/19 | | | 0.000 | % | | | 1,200,000 | | | | 984,912 | | |
New York State Urban Development Corp.
Refunding Revenue Bonds
Service Contract
Series 2010A-1 | |
| 01/01/16 | | | 5.000 | % | | | 1,500,000 | | | | 1,704,750 | | |
| Total | | | 13,768,802 | | |
| Miscellaneous 10.3% | |
Metropolitan Transportation Authority
Refunding Revenue Bonds
Series 2002A | |
| 01/01/29 | | | 5.125 | % | | | 2,950,000 | | | | 3,013,248 | | |
Revenue Bonds
Series 2005B (AMBAC) | |
| 11/15/23 | | | 5.250 | % | | | 1,250,000 | | | | 1,445,800 | | |
| Series 2005F | |
| 11/15/35 | | | 5.000 | % | | | 500,000 | | | | 508,390 | | |
| Series 2006A | |
| 11/15/22 | | | 5.000 | % | | | 750,000 | | | | 804,450 | | |
| Series 2010D | |
| 11/15/34 | | | 5.000 | % | | | 1,350,000 | | | | 1,398,640 | | |
New York City Industrial Development Agency
Revenue Bonds
Queens Baseball Stadium Pilot
Series 2006 (AMBAC) | |
| 01/01/24 | | | 5.000 | % | | | 500,000 | | | | 495,475 | | |
Yankee Stadium Pilot
Series 2009 | |
| 03/01/49 | | | 7.000 | % | | | 250,000 | | | | 284,635 | | |
New York City Trust for Cultural Resources
Refunding Revenue Bonds
Museum of Modern Art
Series 2008-1A | |
| 04/01/31 | | | 5.000 | % | | | 750,000 | | | | 803,325 | | |
Issue
Description | | Coupon
Rate | | Principal
Amount | | Value | |
| Municipal Bonds (continued) | |
| Miscellaneous (cont.) | |
Revenue Bonds
Lincoln Center
Series 2008C | |
| 12/01/18 | | | 5.250 | % | | $ | 750,000 | | | $ | 874,852 | | |
Museum of Modern Art
Series 2001D (AMBAC) | |
| 07/01/31 | | | 5.125 | % | | | 1,000,000 | | | | 1,021,440 | | |
New York State Environmental Facilities Corp.
Revenue Bonds
Revolving Funds New York City Municipal Water Project
Series 2002B | |
| 06/15/31 | | | 5.000 | % | | | 1,000,000 | | | | 1,009,240 | | |
| Series 2002K | |
| 06/15/28 | | | 5.000 | % | | | 1,000,000 | | | | 1,022,420 | | |
Revolving Funds-Pooled Financing
Series 2005B | |
| 04/15/35 | | | 5.500 | % | | | 1,000,000 | | | | 1,255,130 | | |
| Series 2009A | |
| 06/15/34 | | | 5.000 | % | | | 4,000,000 | | | | 4,273,960 | | |
Westchester County Industrial Development Agency
Revenue Bonds
Guiding Eyes for the Blind
Series 2004 | |
| 08/01/24 | | | 5.375 | % | | | 550,000 | | | | 560,676 | | |
| Total | | | 18,771,681 | | |
| Port District 3.6% | |
Port Authority of New York & New Jersey
Revenue Bonds
Consolidated 85th
Series 1993 | |
| 03/01/28 | | | 5.375 | % | | | 2,000,000 | | | | 2,313,160 | | |
Consolidated 93rd
Series 1994 | |
| 06/01/94 | | | 6.125 | % | | | 2,250,000 | | | | 2,643,345 | | |
Port Authority of New York & New Jersey(b)
Revenue Bonds
Consolidated 143rd
Series 2006 (AGM) AMT | |
| 10/01/21 | | | 5.000 | % | | | 1,000,000 | | | | 1,056,880 | | |
Consolidated 147th
Series 2007 (NPFGC/FGIC) AMT | |
| 10/15/26 | | | 5.000 | % | | | 500,000 | | | | 520,795 | | |
| Total | | | 6,534,180 | | |
| Resource Recovery 0.3% | |
Seneca County Industrial Development Agency
Revenue Bonds
Seneca Meadows, Inc. Project
Series 2005 AMT(b)(c)(d) | |
| 10/01/35 | | | 6.625 | % | | | 500,000 | | | | 502,135 | | |
| Sales or Use Tax 9.8% | |
Metropolitan Transportation Authority
Revenue Bonds
Series 2009A | |
| 11/15/26 | | | 5.300 | % | | | 700,000 | | | | 772,947 | | |
| Series 2009B | |
| 11/15/34 | | | 5.000 | % | | | 4,500,000 | | | | 4,743,360 | | |
The Accompanying Notes to Financial Statements are an integral part of this statement.
9
Columbia New York Tax-Exempt Fund
October 31, 2011
(Percentages represent value of investments compared to net assets)
Issue
Description | | Coupon
Rate | | Principal
Amount | | Value | |
| Municipal Bonds (continued) | |
| Sales or Use Tax (cont.) | |
Nassau County Interim Finance Authority
Revenue Bonds
Secured Sales Tax
Series 2009A | |
| 11/15/24 | | | 5.000 | % | | $ | 250,000 | | | $ | 281,230 | | |
New York City Transitional Finance Authority
Revenue Bonds
Fiscal 2009
Series 2009S-3 | |
| 01/15/22 | | | 5.000 | % | | | 1,000,000 | | | | 1,117,420 | | |
| Series 2009S-5 | |
| 01/15/32 | | | 5.000 | % | | | 1,000,000 | | | | 1,053,050 | | |
Subordinated Revenue Bonds
Future Tax Secured
Series 2007B | |
| 11/01/26 | | | 5.000 | % | | | 1,035,000 | | | | 1,128,823 | | |
Unrefunded Revenue Bonds
Future Tax Secured
Series 2001B | |
| 05/01/30 | | | 5.000 | % | | | 35,000 | | | | 35,490 | | |
New York State Dormitory Authority
Revenue Bonds
Education
Series 2008B | |
| 03/15/36 | | | 5.750 | % | | | 500,000 | | | | 565,240 | | |
| Series 2009A | |
| 03/15/28 | | | 5.000 | % | | | 1,545,000 | | | | 1,676,603 | | |
| Series 2009A | |
| 02/15/34 | | | 5.000 | % | | | 1,400,000 | | | | 1,497,720 | | |
New York State Thruway Authority
Revenue Bonds
Series 2005A (NPFGC) | |
| 04/01/25 | | | 5.000 | % | | | 500,000 | | | | 542,300 | | |
| Series 2009A-1 | |
| 04/01/29 | | | 5.000 | % | | | 1,000,000 | | | | 1,075,560 | | |
New York State Urban Development Corp.
Revenue Bonds
State Personal Income Tax
Series 2009B-1 | |
| 03/15/36 | | | 5.000 | % | | | 1,500,000 | | | | 1,596,855 | | |
Puerto Rico Sales Tax Financing Corp.
1st Subordinated Revenue Bonds
Series 2010C(e) | |
| 08/01/41 | | | 5.250 | % | | | 1,750,000 | | | | 1,773,135 | | |
| Total | | | 17,859,733 | | |
| School 0.8% | |
New York City Industrial Development Agency
Revenue Bonds
Marymont School of New York Project
Series 2001 (ACA) | |
| 09/01/21 | | | 5.125 | % | | | 625,000 | | | | 638,163 | | |
New York State Dormitory Authority
Revenue Bonds
Convent-Sacred Heart
Series 2011 (AGM) | |
| 11/01/35 | | | 5.625 | % | | | 750,000 | | | | 811,627 | | |
| Total | | | 1,449,790 | | |
Issue
Description | | Coupon
Rate | | Principal
Amount | | Value | |
| Municipal Bonds (continued) | |
| Special Purpose Certificates - General Obligations 1.3% | |
City of New York
Unlimited General Obligation Bonds
Subordinated Series 2006I-1 | |
| 04/01/17 | | | 5.000 | % | | $ | 1,000,000 | | | $ | 1,137,310 | | |
Mount Sinai Union Free School District
Unlimited General Obligation Refunding Bonds
Series 1992 (AMBAC) | |
| 02/15/19 | | | 6.200 | % | | | 1,005,000 | | | | 1,267,446 | | |
| Total | | | 2,404,756 | | |
| Student Loan 0.1% | |
New York Mortgage Agency
Revenue Bonds
New York State Higher Education Finance
Series 2009 | |
| 11/01/26 | | | 4.750 | % | | | 115,000 | | | | 118,550 | | |
| Toll Road 2.8% | |
New York State Thruway Authority
Revenue Bonds
Series 2005F (AMBAC) | |
| 01/01/25 | | | 5.000 | % | | | 2,000,000 | | | | 2,124,880 | | |
| Series 2007H (NPFGC/FGIC) | |
| 01/01/23 | | | 5.000 | % | | | 500,000 | | | | 548,515 | | |
| 01/01/27 | | | 5.000 | % | | | 1,000,000 | | | | 1,066,500 | | |
Triborough Bridge & Tunnel Authority
Prerefunded 01/01/12 Revenue Bonds
General Purpose
Series 2001A | |
| 01/01/32 | | | 5.000 | % | | | 380,000 | | | | 383,036 | | |
Refunding Revenue Bonds
Series 2002B | |
| 11/15/29 | | | 5.125 | % | | | 1,000,000 | | | | 1,033,800 | | |
| Total | | | 5,156,731 | | |
| Water & Sewer 5.6% | |
Great Neck North Water Authority
Revenue Bonds
Series 2008 | |
| 01/01/33 | | | 5.000 | % | | | 690,000 | | | | 733,932 | | |
New York City Municipal Water Finance Authority
Refunding Revenue Bonds
Series 2006C | |
| 06/15/33 | | | 4.750 | % | | | 1,440,000 | | | | 1,477,152 | | |
Revenue Bonds
Fiscal 2009
Series 2008A | |
| 06/15/40 | | | 5.750 | % | | | 1,000,000 | | | | 1,126,890 | | |
| Series 2008CC | |
| 06/15/34 | | | 5.000 | % | | | 3,500,000 | | | | 3,710,070 | | |
| Series 2008DD | |
| 06/15/38 | | | 4.500 | % | | | 500,000 | | | | 504,825 | | |
| Series 2009EE | |
| 06/15/40 | | | 5.250 | % | | | 500,000 | | | | 539,330 | | |
| Series 2009FF-2 | |
| 06/15/40 | | | 5.500 | % | | | 1,000,000 | | | | 1,101,810 | | |
The Accompanying Notes to Financial Statements are an integral part of this statement.
10
Columbia Columbia New York Tax-Exempt Fund
October 31, 2011
(Percentages represent value of investments compared to net assets)
Issue
Description | | Coupon
Rate | | Principal
Amount | | Value | |
| Municipal Bonds (continued) | |
| Water & Sewer (cont.) | |
Rensselaer County Water Service & Sewer Authority
Revenue Bonds
Water Service
Series 2008 | |
| 09/01/38 | | | 5.250 | % | | $ | 1,000,000 | | | $ | 1,034,720 | | |
| Total | | | 10,228,729 | | |
Total Municipal Bonds
(Cost: $167,494,185) | | $ | 177,215,326 | | |
Issue
Description
| |
Shares | | Value | |
| Money Market Funds 0.5% | |
Dreyfus New York AMT-Free Municipal
Money Market, 0.010%(g) | | | 604,748 | | | $ | 604,748 | | |
JPMorgan Tax-Free Money
Market Fund, 0.010%(g) | | | 234,141 | | | | 234,141 | | |
Total Money Market Funds
(Cost: $838,889) | | | | $ | 838,889 | | |
Total Investments
(Cost: $168,333,074) | | | | $ | 178,054,215 | | |
| Other Assets & Liabilities, Net | | | | | 3,722,425 | | |
| Total Net Assets | | | | $ | 181,776,640 | | |
| Notes to Portfolio of Investments | |
(a) Zero coupon bond.
(b) At October 31, 2011, the value of securities subject to alternative minimum tax represented 8.33% of net assets.
(c) Variable rate security. The interest rate shown reflects the rate as of October 31, 2011.
(d) Security exempt from registration pursuant to Rule 144A under the Securities Act of 1933. This security may be resold in transactions exempt from registration, normally to qualified institutional buyers. At October 31, 2011, the value of these securities amounted to $502,135 or 0.28% of net assets.
(e) Municipal obligations include debt obligations issued by or on behalf of territories, possessions, or sovereign nations within the territorial boundaries of the United States. At October 31, 2011, the value of these securities amounted to $1,773,135 or 0.98% of net assets.
(f) Subsequent to year end, the issuer filed for bankruptcy protection under Chapter 11. The Fund has stopped accruing interest on this security. At November 30, 2011, the value of this security amounted to $925,030, which represents 0.51% of net assets.
(g) The rate shown is the seven-day current annualized yield at October 31, 2011.
ACA ACA Financial Guaranty Corporation
AGM Assured Guaranty Municipal Corporation
AMBAC Ambac Assurance Corporation
AMT Alternative Minimum Tax
FGIC Financial Guaranty Insurance Company
FHA Federal Housing Authority
NPFGC National Public Finance Guarantee Corporation
XLCA XL Capital Assurance
Generally accepted accounting principles (GAAP) require disclosure regarding the inputs and valuation techniques used to measure fair value and any changes in valuation inputs or techniques. In addition, investments shall be disclosed by major category.
The Fund categorizes its fair value measurements according to a three-level hierarchy that maximizes the use of observable inputs and minimizes the use of unobservable inputs by prioritizing that the most observable input be used when available. Observable inputs are those that market participants would use in pricing an investment based on market data obtained from sources independent of the reporting entity. Unobservable inputs are those that reflect the Fund's assumptions about the information market participants would use in pricing an investment. An investment's level withinthe fair value hierarchy is based on the lowest level of any input that is deemed significant to the asset or liability's fair value measurement. The input levels are not necessarily an indication of the risk or liquidity associated with investments at that level. For example, certain U.S. government securities are generally high quality and liquid, however, they are reflected as Level 2 because the inputs used to determine fair value may not always be quoted prices in an active market.
Fair value inputs are summarized in the three broad levels listed below:
• Level 1 — Valuations based on quoted prices for investments in active markets that the Fund has the ability to access at the measurement date (including NAV for open-end mutual funds). Valuation adjustments are not applied to Level 1 investments.
• Level 2 — Valuations based on other significant observable inputs (including quoted prices for similar securities, interest rates, prepayment speeds, credit risks, etc.).
The Accompanying Notes to Financial Statements are an integral part of this statement.
11
Columbia Columbia New York Tax-Exempt Fund
October 31, 2011
| Fair Value Measurements (continued) | |
• Level 3 — Valuations based on significant unobservable inputs (including the Fund's own assumptions and judgment in determining the fair value of investments).
Inputs that are used in determining fair value of an investment may include price information, credit data, volatility statistics, and other factors. These inputs can be either observable or unobservable. The availability of observable inputs can vary between investments, and is affected by various factors such as the type of investment, and the volume and level of activity for that investment or similar investments in the marketplace. The inputs will be considered by the Investment Manager, along with any other relevant factors in the calculation of an investment's fair value. The Fund uses prices and inputs that are current as of the measurement date, which may include periods of market dislocations. During these periods, the availability of prices and inputs may be reduced for many investments. This condition could cause an investment to be reclassified between the various levels within the hierarchy.
Investments falling into the Level 3 category are primarily supported by quoted prices from brokers and dealers participating in the market for those investments. However, these may be classified as Level 3 investments due to lack of market transparency and corroboration to support these quoted prices. Additionally, valuation models may be used as the pricing source for any remaining investments classified as Level 3. These models rely on one or more significant unobservable inputs and/or significant assumptions by the Investment Manager. Inputs used in valuations may include, but are not limited to, financial statement analysis, capital account balances, discount rates and estimated cash flows, and comparable company data.
The following table is a summary of the inputs used to value the Fund's investments as of October 31, 2011:
| | | Fair value at October 31, 2011 | |
| Description(a) | | Level 1
quoted prices
in active
markets for
identical assets | | Level 2
other
significant
observable
inputs(b) | | Level 3
significant
unobservable
inputs | | Total | |
| Bonds | |
| Municipal Bonds | | $ | — | | | $ | 177,215,326 | | | $ | — | | | $ | 177,215,326 | | |
| Total Bonds | | | — | | | | 177,215,326 | | | | — | | | | 177,215,326 | | |
| Other | |
| Money Market Funds | | | 838,889 | | | | — | | | | — | | | | 838,889 | | |
| Total Other | | | 838,889 | | | | — | | | | — | | | | 838,889 | | |
| Total | | $ | 838,889 | | | $ | 177,215,326 | | | $ | — | | | $ | 178,054,215 | | |
The Fund's assets assigned to the Level 2 input category are generally valued using the market approach, in which a security's value is determined through reference to prices and information from market transactions for similar or identical assets.
(a) See the Portfolio of Investments for all investment classifications not indicated in the table.
(b) There were no significant transfers between Levels 1 and 2 during the period.
The Accompanying Notes to Financial Statements are an integral part of this statement.
12
Statement of Assets and Liabilities – Columbia New York Tax-Exempt Fund
October 31, 2011
| Assets | |
| Investments, at value | |
| (identified cost $168,333,074) | | $ | 178,054,215 | | |
| Receivable for: | |
| Investments sold | | | 1,194,747 | | |
| Capital shares sold | | | 679,929 | | |
| Interest | | | 2,689,170 | | |
| Expense reimbursement due from Investment Manager | | | 33,069 | | |
| Trustees' deferred compensation plan | | | 23,612 | | |
| Total assets | | | 182,674,742 | | |
| Liabilities | |
| Payable for: | |
| Dividend distributions to shareholders | | | 604,382 | | |
| Capital shares purchased | | | 108,187 | | |
| Investment management fees | | | 5,945 | | |
| Distribution and service fees | | | 4,445 | | |
| Transfer agent fees | | | 8,861 | | |
| Administration fees | | | 1,040 | | |
| Chief compliance officer expenses | | | 419 | | |
| Other expenses | | | 141,211 | | |
| Trustees' deferred compensation plan | | | 23,612 | | |
| Total liabilities | | | 898,102 | | |
| Net assets applicable to outstanding capital stock | | $ | 181,776,640 | | |
The Accompanying Notes to Financial Statements are an integral part of this statement.
13
Statement of Assets and Liabilities (continued) – Columbia New York Tax-Exempt Fund
October 31, 2011
| Represented by | |
| Paid-in capital | | $ | 172,252,508 | | |
| Undistributed net investment income | | | 322,679 | | |
| Accumulated net realized loss | | | (519,688 | ) | |
| Unrealized appreciation (depreciation) on: | |
| Investments | | | 9,721,141 | | |
| Total — representing net assets applicable to outstanding capital stock | | $ | 181,776,640 | | |
| Net assets applicable to outstanding shares | |
| Class A | | $ | 163,405,497 | | |
| Class B | | $ | 2,202,089 | | |
| Class C | | $ | 16,164,006 | | |
| Class Z | | $ | 5,048 | | |
| Shares outstanding | |
| Class A | | | 22,483,732 | | |
| Class B | | | 303,108 | | |
| Class C | | | 2,224,732 | | |
| Class Z | | | 694 | | |
| Net asset value per share | |
| Class A(a) | | $ | 7.27 | | |
| Class B | | $ | 7.27 | | |
| Class C | | $ | 7.27 | | |
| Class Z | | $ | 7.27 | | |
(a) The maximum offering price per share for Class A is $7.63. The offering price is calculated by dividing the net asset value by 1.0 minus the maximum sales charge of 4.75%.
The Accompanying Notes to Financial Statements are an integral part of this statement.
14
Statement of Operations – Columbia New York Tax-Exempt Fund
Year ended October 31, 2011
| Net investment income | |
| Income: | |
| Dividends | | $ | 664 | | |
| Interest | | | 5,452,746 | | |
| Total income | | | 5,453,410 | | |
| Expenses: | |
| Investment management fees | | | 468,778 | | |
| Distribution fees | |
| Class B | | | 22,600 | | |
| Class C | | | 87,107 | | |
| Service fees | |
| Class A | | | 240,347 | | |
| Class B | | | 7,428 | | |
| Class C | | | 28,616 | | |
| Transfer agent fees | |
| Class A | | | 89,052 | | |
| Class B | | | 3,362 | | |
| Class C | | | 11,672 | | |
| Administration fees | | | 63,589 | | |
| Compensation of board members | | | 16,794 | | |
| Pricing and bookkeeping fees | | | 30,397 | | |
| Custodian fees | | | 6,501 | | |
| Printing and postage fees | | | 40,000 | | |
| Registration fees | | | 60,963 | | |
| Professional fees | | | 44,130 | | |
| Merger expense | | | 26,990 | | |
| Chief compliance officer expenses | | | 924 | | |
| Other | | | 12,768 | | |
| Total expenses | | | 1,262,018 | | |
| Fees waived or expenses reimbursed by Investment Manager and its affiliates | | | (229,929 | ) | |
| Fees waived by distributor — Class C | | | (34,835 | ) | |
| Expense reductions | | | (400 | ) | |
| Total net expenses | | | 996,854 | | |
| Net investment income | | | 4,456,556 | | |
| Realized and unrealized gain (loss) — net | |
| Net realized gain (loss) on: | |
| Investments | | | 557,401 | | |
| Net realized gain | | | 557,401 | | |
| Net change in unrealized appreciation (depreciation) on: | |
| Investments | | | 1,031,575 | | |
| Net change in unrealized appreciation | | | 1,031,575 | | |
| Net realized and unrealized gain | | | 1,588,976 | | |
| Net increase in net assets resulting from operations | | $ | 6,045,532 | | |
The Accompanying Notes to Financial Statements are an integral part of this statement.
15
Statement of Changes in Net Assets – Columbia New York Tax-Exempt Fund
| Year ended October 31, | | 2011(a) | | 2010 | |
| Operations | |
| Net investment income | | $ | 4,456,556 | | | $ | 2,689,735 | | |
| Net realized gain | | | 557,401 | | | | 61,008 | | |
| Net change in unrealized appreciation | | | 1,031,575 | | | | 2,911,595 | | |
| Net increase in net assets resulting from operations | | | 6,045,532 | | | | 5,662,338 | | |
| Distributions to shareholders from: | |
| Net investment income | |
| Class A | | | (3,955,675 | ) | | | (2,451,881 | ) | |
| Class B | | | (103,319 | ) | | | (262,303 | ) | |
| Class C | | | (425,671 | ) | | | (392,165 | ) | |
| Class Z | | | (34 | ) | | | — | | |
| Net realized gains | |
| Class A | | | (80,083 | ) | | | (1,269,783 | ) | |
| Class B | | | (5,958 | ) | | | (192,557 | ) | |
| Class C | | | (13,363 | ) | | | (229,910 | ) | |
| Total distributions to shareholders | | | (4,584,103 | ) | | | (4,798,599 | ) | |
| Increase in net assets from share transactions | | | 111,487,203 | | | | 247,149 | | |
| Total increase in net assets | | | 112,948,632 | | | | 1,110,888 | | |
| Net assets at beginning of year | | | 68,828,008 | | | | 67,717,120 | | |
| Net assets at end of year | | $ | 181,776,640 | | | $ | 68,828,008 | | |
| Undistributed net investment income | | $ | 322,679 | | | $ | 328,866 | | |
(a) Class Z shares are for the period from September 1, 2011 (commencement of operations) to October 31, 2011.
The Accompanying Notes to Financial Statements are an integral part of this statement.
16
Statement of Changes in Net Assets (continued) – Columbia New York Tax-Exempt Fund
| Year ended October 31, | | 2011(a) | | 2010 | |
| | | Shares | | Dollars ($) | | Shares | | Dollars ($) | |
| Capital stock activity | |
| Class A shares | |
| Subscriptions | | | 1,416,525 | | | | 10,057,117 | | | | 1,266,935 | | | | 9,122,725 | | |
| Fund merger | | | 15,425,984 | | | | 109,863,826 | | | | — | | | | — | | |
| Distributions reinvested | | | 373,324 | | | | 2,661,888 | | | | 329,961 | | | | 2,360,076 | | |
| Redemptions | | | (2,207,714 | ) | | | (15,646,941 | ) | | | (1,080,401 | ) | | | (7,777,154 | ) | |
| Net increase | | | 15,008,119 | | | | 106,935,890 | | | | 516,495 | | | | 3,705,647 | | |
| Class B shares | |
| Subscriptions | | | 2,638 | | | | 18,448 | | | | 17,767 | | | | 127,384 | | |
| Fund merger | | | 153,991 | | | | 1,096,096 | | | | — | | | | — | | |
| Distributions reinvested | | | 8,764 | | | | 61,562 | | | | 43,301 | | | | 308,913 | | |
| Redemptions | | | (480,574 | ) | | | (3,366,812 | ) | | | (575,800 | ) | | | (4,152,575 | ) | |
| Net decrease | | | (315,181 | ) | | | (2,190,706 | ) | | | (514,732 | ) | | | (3,716,278 | ) | |
| Class C shares | |
| Subscriptions | | | 150,723 | | | | 1,073,119 | | | | 211,427 | | | | 1,527,981 | | |
| Fund merger | | | 1,033,183 | | | | 7,354,989 | | | | — | | | | — | | |
| Distributions reinvested | | | 32,912 | | | | 233,321 | | | | 47,535 | | | | 339,652 | | |
| Redemptions | | | (272,441 | ) | | | (1,924,444 | ) | | | (223,871 | ) | | | (1,609,853 | ) | |
| Net increase | | | 944,377 | | | | 6,736,985 | | | | 35,091 | | | | 257,780 | | |
| Class Z shares | |
| Subscriptions | | | 689 | | | | 5,000 | | | | — | | | | — | | |
| Distributions reinvested | | | 5 | | | | 34 | | | | — | | | | — | | |
| Net increase | | | 694 | | | | 5,034 | | | | — | | | | — | | |
| Total net increase | | | 15,638,009 | | | | 111,487,203 | | | | 36,854 | | | | 247,149 | | |
(a) Class Z shares are for the period from September 1, 2011 (commencement of operations) to October 31, 2011.
The Accompanying Notes to Financial Statements are an integral part of this statement.
17
Financial Highlights – Columbia New York Tax-Exempt Fund
The following tables are intended to help you understand the Fund's financial performance. Certain information reflects financial results for a single share of a class held for the periods shown. Per share net investment income (loss) amounts are calculated based on average shares outstanding during the period. Total returns assume reinvestment of all dividends and distributions. Total returns do not reflect payment of sales charges, if any, and are not annualized for periods of less than one year.
| | | Year ended Oct. 31, | |
| | | 2011 | | 2010 | | 2009 | | 2008 | | 2007 | |
| Class A | |
| Per share data | |
| Net asset value, beginning of period | | $ | 7.34 | | | $ | 7.25 | | | $ | 6.55 | | | $ | 7.49 | | | $ | 7.70 | | |
| Income from investment operations: | |
| Net investment income | | | 0.29 | | | | 0.30 | | | | 0.31 | | | | 0.31 | | | | 0.31 | | |
| Net realized and unrealized gain (loss) | | | (0.06 | )(a) | | | 0.31 | | | | 0.78 | | | | (0.87 | ) | | | (0.19 | ) | |
| Total from investment operations | | | 0.23 | | | | 0.61 | | | | 1.09 | | | | (0.56 | ) | | | 0.12 | | |
| Less distributions to shareholders from: | |
| Net investment income | | | (0.29 | ) | | | (0.34 | ) | | | (0.30 | ) | | | (0.30 | ) | | | (0.31 | ) | |
| Net realized gains | | | (0.01 | ) | | | (0.18 | ) | | | (0.09 | ) | | | (0.08 | ) | | | (0.02 | ) | |
| Total distributions to shareholders | | | (0.30 | ) | | | (0.52 | ) | | | (0.39 | ) | | | (0.38 | ) | | | (0.33 | ) | |
| Net asset value, end of period | | $ | 7.27 | | | $ | 7.34 | | | $ | 7.25 | | | $ | 6.55 | | | $ | 7.49 | | |
| Total return | | | 3.40 | % | | | 8.86 | % | | | 17.24 | % | | | (7.86 | %) | | | 1.59 | % | |
| Ratios to average net assets(b) | |
| Expenses prior to fees waived or expenses reimbursed | | | 1.02 | % | | | 1.12 | % | | | 1.09 | % | | | 1.08 | % | | | 1.05 | % | |
| Net expenses after fees waived or expenses reimbursed(c) | | | 0.82 | %(d) | | | 0.84 | %(d) | | | 0.84 | %(d) | | | 0.84 | %(d) | | | 0.84 | %(d) | |
| Net investment income | | | 4.04 | %(d) | | | 4.11 | %(d) | | | 4.47 | %(d) | | | 4.29 | %(d) | | | 4.16 | %(d) | |
| Supplemental data | |
| Net assets, end of period (in thousands) | | $ | 163,405 | | | $ | 54,888 | | | $ | 50,469 | | | $ | 42,819 | | | $ | 49,751 | | |
| Portfolio turnover | | | 22 | % | | | 9 | % | | | 20 | % | | | 17 | % | | | 15 | % | |
| Notes to Financial Highlights | |
(a) Calculation of the net loss per share (both realized and unrealized) does not correlate to the aggregate realized and unrealized gains presented in the Statement of Operations due to the timing of sales and repurchases of Fund shares in relation to fluctuations in the market value of the portfolio.
(b) In addition to the fees and expenses which the Fund bears directly, the Fund indirectly bears a pro rata share of the fees and expenses of the acquired funds in which it invests. Such indirect expenses are not included in the reported expense ratios.
(c) The Investment Manager and certain of its affiliates agreed to waive/reimburse certain fees and expenses, if applicable.
(d) The benefits derived from expense reductions had an impact of less than 0.01%.
The Accompanying Notes to Financial Statements are an integral part of this statement.
18
Financial Highlights (continued) – Columbia New York Tax-Exempt Fund
| | | Year ended Oct. 31, | |
| | | 2011 | | 2010 | | 2009 | | 2008 | | 2007 | |
| Class B | |
| Per share data | |
| Net asset value, beginning of period | | $ | 7.34 | | | $ | 7.25 | | | $ | 6.55 | | | $ | 7.49 | | | $ | 7.70 | | |
| Income from investment operations: | |
| Net investment income | | | 0.24 | | | | 0.24 | | | | 0.25 | | | | 0.26 | | | | 0.26 | | |
| Net realized and unrealized gain (loss) | | | (0.06 | )(a) | | | 0.32 | | | | 0.78 | | | | (0.88 | ) | | | (0.20 | ) | |
| Total from investment operations | | | 0.18 | | | | 0.56 | | | | 1.03 | | | | (0.62 | ) | | | 0.06 | | |
| Less distributions to shareholders from: | |
| Net investment income | | | (0.24 | ) | | | (0.29 | ) | | | (0.24 | ) | | | (0.24 | ) | | | (0.25 | ) | |
| Net realized gains | | | (0.01 | ) | | | (0.18 | ) | | | (0.09 | ) | | | (0.08 | ) | | | (0.02 | ) | |
| Total distributions to shareholders | | | (0.25 | ) | | | (0.47 | ) | | | (0.33 | ) | | | (0.32 | ) | | | (0.27 | ) | |
| Net asset value, end of period | | $ | 7.27 | | | $ | 7.34 | | | $ | 7.25 | | | $ | 6.55 | | | $ | 7.49 | | |
| Total return | | | 2.62 | % | | | 8.05 | % | | | 16.38 | % | | | (8.54 | %) | | | 0.83 | % | |
| Ratios to average net assets(b) | |
| Expenses prior to fees waived or expenses reimbursed | | | 1.87 | % | | | 1.87 | % | | | 1.84 | % | | | 1.83 | % | | | 1.80 | % | |
| Net expenses after fees waived or expenses reimbursed(c) | | | 1.60 | %(d) | | | 1.59 | %(d) | | | 1.59 | %(d) | | | 1.59 | %(d) | | | 1.59 | %(d) | |
| Net investment income | | | 3.38 | %(d) | | | 3.38 | %(d) | | | 3.73 | %(d) | | | 3.54 | %(d) | | | 3.40 | %(d) | |
| Supplemental data | |
| Net assets, end of period (in thousands) | | $ | 2,202 | | | $ | 4,540 | | | $ | 8,217 | | | $ | 10,084 | | | $ | 16,192 | | |
| Portfolio turnover | | | 22 | % | | | 9 | % | | | 20 | % | | | 17 | % | | | 15 | % | |
| Notes to Financial Highlights | |
(a) Calculation of the net loss per share (both realized and unrealized) does not correlate to the aggregate realized and unrealized gains presented in the Statement of Operations due to the timing of sales and repurchases of Fund shares in relation to fluctuations in the market value of the portfolio.
(b) In addition to the fees and expenses which the Fund bears directly, the Fund indirectly bears a pro rata share of the fees and expenses of the acquired funds in which it invests. Such indirect expenses are not included in the reported expense ratios.
(c) The Investment Manager and certain of its affiliates agreed to waive/reimburse certain fees and expenses, if applicable.
(d) The benefits derived from expense reductions had an impact of less than 0.01%.
The Accompanying Notes to Financial Statements are an integral part of this statement.
19
Financial Highlights (continued) – Columbia New York Tax-Exempt Fund
| | | Year ended Oct. 31, | |
| | | 2011 | | 2010 | | 2009 | | 2008 | | 2007 | |
| Class C | |
| Per share data | |
| Net asset value, beginning of period | | $ | 7.34 | | | $ | 7.25 | | | $ | 6.55 | | | $ | 7.49 | | | $ | 7.70 | | |
| Income from investment operations: | |
| Net investment income | | | 0.26 | | | | 0.26 | | | | 0.28 | | | | 0.28 | | | | 0.28 | | |
| Net realized and unrealized gain (loss) | | | (0.06 | )(a) | | | 0.32 | | | | 0.78 | | | | (0.87 | ) | | | (0.19 | ) | |
| Total from investment operations | | | 0.20 | | | | 0.58 | | | | 1.06 | | | | (0.59 | ) | | | 0.09 | | |
| Less distributions to shareholders from: | |
| Net investment income | | | (0.26 | ) | | | (0.31 | ) | | | (0.27 | ) | | | (0.27 | ) | | | (0.28 | ) | |
| Net realized gains | | | (0.01 | ) | | | (0.18 | ) | | | (0.09 | ) | | | (0.08 | ) | | | (0.02 | ) | |
| Total distributions to shareholders | | | (0.27 | ) | | | (0.49 | ) | | | (0.36 | ) | | | (0.35 | ) | | | (0.30 | ) | |
| Net asset value, end of period | | $ | 7.27 | | | $ | 7.34 | | | $ | 7.25 | | | $ | 6.55 | | | $ | 7.49 | | |
| Total return | | | 2.95 | % | | | 8.37 | % | | | 16.72 | % | | | (8.27 | %) | | | 1.14 | % | |
| Ratios to average net assets(b) | |
| Expenses prior to fees waived or expenses reimbursed | | | 1.82 | % | | | 1.87 | % | | | 1.84 | % | | | 1.83 | % | | | 1.80 | % | |
| Net expenses after fees waived or expenses reimbursed(c) | | | 1.28 | %(d) | | | 1.29 | %(d) | | | 1.29 | %(d) | | | 1.29 | %(d) | | | 1.29 | %(d) | |
| Net investment income | | | 3.64 | %(d) | | | 3.66 | %(d) | | | 4.02 | %(d) | | | 3.84 | %(d) | | | 3.69 | %(d) | |
| Supplemental data | |
| Net assets, end of period (in thousands) | | $ | 16,164 | | | $ | 9,401 | | | $ | 9,031 | | | $ | 8,319 | | | $ | 9,729 | | |
| Portfolio turnover | | | 22 | % | | | 9 | % | | | 20 | % | | | 17 | % | | | 15 | % | |
| Notes to Financial Highlights | |
(a) Calculation of the net loss per share (both realized and unrealized) does not correlate to the aggregate realized and unrealized gains presented in the Statement of Operations due to the timing of sales and repurchases of Fund shares in relation to fluctuations in the market value of the portfolio.
(b) In addition to the fees and expenses which the Fund bears directly, the Fund indirectly bears a pro rata share of the fees and expenses of the acquired funds in which it invests. Such indirect expenses are not included in the reported expense ratios.
(c) The Investment Manager and certain of its affiliates agreed to waive/reimburse certain fees and expenses, if applicable.
(d) The benefits derived from expense reductions had an impact of less than 0.01%.
The Accompanying Notes to Financial Statements are an integral part of this statement.
20
Financial Highlights (continued) – Columbia New York Tax-Exempt Fund
| | | Year ended
Oct. 31, 2011(a) | |
| Class Z | |
| Per share data | |
| Net asset value, beginning of period | | $ | 7.25 | | |
| Income from investment operations: | |
| Net investment income | | | 0.05 | | |
| Net realized and unrealized gain | | | 0.02 | (b) | |
| Total from investment operations | | | 0.07 | | |
| Less distributions to shareholders from: | |
| Net investment income | | | (0.05 | ) | |
| Total distributions to shareholders | | | (0.05 | ) | |
| Net asset value, end of period | | $ | 7.27 | | |
| Total return | | | 0.96 | % | |
| Ratios to average net assets(c) | |
| Expenses prior to fees waived or expenses reimbursed | | | 0.61 | %(d) | |
| Net expenses after fees waived or expenses reimbursed(e) | | | 0.52 | %(d) | |
| Net investment income | | | 4.19 | %(d) | |
| Supplemental data | |
| Net assets, end of period (in thousands) | | $ | 5 | | |
| Portfolio turnover | | | 22 | % | |
| Notes to Financial Highlights | |
(a) For the period from September 1, 2011 (commencement of operations) to October 31, 2011.
(b) Calculation of the net loss per share (both realized and unrealized) does not correlate to the aggregate realized and unrealized gains presented in the Statement of Operations due to the timing of sales and repurchases of Fund shares in relation to fluctuating market values of the investments of the Fund.
(c) In addition to the fees and expenses which the Fund bears directly, the Fund indirectly bears a pro rata share of the fees and expenses of the acquired funds in which it invests. Such indirect expenses are not included in the reported expense ratios.
(d) Annualized.
(e) The Investment Manager and certain of its affiliates agreed to waive/reimburse certain fees and expenses, if applicable.
The Accompanying Notes to Financial Statements are an integral part of this statement.
21
Notes to Financial Statements – Columbia New York Tax-Exempt Fund
October 31, 2011
Note 1. Organization
Columbia New York Tax-Exempt Fund (the Fund), a series of Columbia Funds Series Trust I (the Trust), is a non-diversified fund. The Trust is registered under the Investment Company Act of 1940, as amended (the 1940 Act), as an open-end management investment company organized as a Massachusetts business trust.
Fund Shares
The Trust may issue an unlimited number of shares (without par value). The Fund offers Class A, Class B, Class C and Class Z shares. All share classes have identical voting, dividend and liquidation rights. Each share class has its own expense structure and sales charges, as applicable.
Class A shares are subject to a maximum front-end sales charge of 4.75% based on the initial investment amount. Class A shares purchased without an initial sales charge in accounts aggregating $1 million to $50 million at the time of purchase are subject to a contingent deferred sales charge (CDSC) if the shares are sold within 18 months of purchase, charged as follows: 1.00% CDSC if redeemed within 12 months of purchase, and 0.50% CDSC if redeemed more than 12, but less than 18, months after purchase.
Class B shares may be subject to a maximum CDSC of 5.00% based upon the holding period after purchase. Class B shares will generally convert to Class A shares eight years after purchase. The Fund no longer accepts investments by new or existing investors in the Fund's Class B shares, except in connection with the reinvestment of any dividend and/or capital gain distributions in Class B shares of the Fund and exchanges by existing Class B shareholders of certain other funds within the Columbia Family of Funds.
Class C shares are subject to a 1.00% CDSC on shares redeemed within one year of purchase.
Class Z shares are not subject to sales charges, and are only available to certain investors, as described in the Fund's prospectus.
Note 2. Summary of Significant Accounting Policies
Use of Estimates
The preparation of financial statements in accordance with U.S. generally accepted accounting principles (GAAP) requires management to make certain estimates and assumptions that affect the reported amounts of assets and liabilities, the disclosure of contingent assets and liabilities at the date of the financial statements and the reported amounts of revenue and expenses during the reporting period. Actual results could differ from those estimates.
The following is a summary of significant accounting policies consistently followed by the Fund in the preparation of its financial statements.
Security Valuation
Debt securities generally are valued by pricing services approved by the Board of Trustees (the Board) based upon market transactions for normal, institutional-size trading units of similar securities. The services may use various pricing techniques which take into account appropriate factors such as yield, quality, coupon rate, maturity, type of issue, trading characteristics and other data, as well as broker quotes. Debt securities for which quotations are readily available may also be valued based upon an over-the-counter or exchange bid quotation.
Investments in other open-end investment companies, including money market funds, are valued at net asset value.
Investments for which market quotations are not readily available, or that have quotations which management believes are not reliable, are valued at fair value as determined in good faith under consistently applied procedures established by and under the general supervision of the Board. If a security or class of securities (such as foreign securities) is valued at fair value, such value is likely to be different from the last quoted market price for the security. The determination of fair value often requires significant judgment. To determine fair value, management may use assumptions including but not limited to future cash flows and estimated risk premiums. Multiple inputs from various sources may be used to determine value.
Security Transactions
Security transactions are accounted for on the trade date. Cost is determined and gains (losses) are based upon the specific identification method for both financial statement and federal income tax purposes.
22
Columbia New York Tax-Exempt Fund, October 31, 2011
Income Recognition
Interest income is recorded on the accrual basis. Market premium and discount are amortized and accreted, respectively, on all debt securities, unless otherwise noted. Original issue discount is accreted to interest income over the life of the security with a corresponding increase in the cost basis, if any.
Dividend income is recorded on the ex-dividend date.
Expenses
General expenses of the Trust are allocated to the Fund and other funds of the Trust based upon relative net assets or other expense allocation methodologies determined by the nature of the expense. Expenses directly attributable to the Fund are charged to the Fund. Expenses directly attributable to a specific class of shares are charged to that share class.
Determination of Class Net Asset Value
All income, expenses (other than class-specific expenses, which are charged to that share class, as shown in the Statement of Operations) and realized and unrealized gains (losses) are allocated to each class of the Fund on a daily basis for purposes of determining the net asset value of each class. Income and expenses are allocated to each class based on the settled shares method, while realized and unrealized gains (losses) are allocated based on the relative net assets of each class.
Federal Income Tax Status
The Fund intends to qualify each year as a regulated investment company under Subchapter M of the Internal Revenue Code, as amended, and will distribute substantially all of its tax exempt or taxable income (including net short-term capital gains), if any, for its tax year, and as such will not be subject to federal income taxes. In addition, the Fund intends to distribute in each calendar year substantially all of its net investment income, capital gains and certain other amounts, if any, such that the Fund should not be subject to federal excise tax. Therefore, no federal income or excise tax provision is recorded.
Distributions to Shareholders
Distributions from net investment income are declared daily and paid monthly. Net realized capital gains, if any, are distributed at least annually. Income distributions and capital gain distributions are determined in accordance with federal income tax regulations which may differ from GAAP.
Guarantees and Indemnifications
Under the Trust's organizational documents and, in some cases, by contract, its officers and trustees are indemnified against certain liabilities arising out of the performance of their duties to the Trust or its funds. In addition, certain of the Fund's contracts with its service providers contain general indemnification clauses. The Fund's maximum exposure under these arrangements is unknown since the amount of any future claims that may be made against the Fund cannot be determined, and the Fund has no historical basis for predicting the likelihood of any such claims.
Recent Accounting Pronouncement
Fair Value Measurements and Disclosures
In May 2011, the Financial Accounting and Standards Board issued ASU No. 2011-04 modifying Topic 820, Fair Value Measurements and Disclosures. At the same time, the International Accounting Standards Board issued International Financial Reporting Standard 13, Fair Value Measurement. The objective of the FASB and IASB is convergence of their guidance on fair value measurements and disclosures.
Specifically, ASU No. 2011-04 requires reporting entities to disclose i) the amounts of any transfers between Level 1 and Level 2, and the reasons for the transfers, ii) for Level 3 fair value measurements, a) quantitative information about significant unobservable inputs used, b) a description of the valuation processes used by the reporting entity and c) a narrative description of the sensitivity of the fair value measurement to changes in unobservable inputs if a change in those inputs might result in a significantly higher or lower fair value measurement. The effective date of ASU No. 2011-04 is for interim and annual periods beginning after December 15, 2011. At this time, management is evaluating the implications of this guidance and the impact it will have on the financial statement amounts and footnote disclosures, if any.
23
Columbia New York Tax-Exempt Fund, October 31, 2011
Note 3. Fees and Compensation Paid to Affiliates
Investment Management Fees
Under an Investment Management Services Agreement (IMSA), Columbia Management Investment Advisers, LLC (the Investment Manager), a wholly-owned subsidiary of Ameriprise Financial, Inc. (Ameriprise Financial), determines which securities will be purchased, held or sold. Effective March 1, 2011, the management fee is an annual fee that is equal to a percentage of the Fund's average daily net assets that declines from 0.40% to 0.27% as the Fund's net assets increase. Prior to March 1, 2011, the annual management fee was equal to a percentage of the Fund's pro-rata portion of the combined average daily net assets of the Fund, Columbia California Tax-Exempt Fund, Columbia Connecticut Tax-Exempt Fund and Columbia Massachusetts Tax-Exempt Fund (collectively, combined daily net assets) at a rate that declined from 0.50% to 0.40% as the combined daily net assets increased. The effective management fee rate for the year ended October 31, 2011 was 0.42% of the Fund's average daily net assets.
Administration Fees
Under an Administrative Services Agreement, the Investment Manager serves as the Fund Administrator. Effective March 1, 2011, the Fund pays the Fund Administrator an annual fee for administration and accounting services equal to a percentage of the Fund's average daily net assets that declines from 0.07% to 0.04% as the Fund's net assets increase. Prior to March 1, 2011, the Investment Manager did not receive a fee for its services under the Administration Services Agreement. The effective administration fee rate for the year ended October 31, 2011 was 0.06% of the Fund's average daily net assets.
Pricing and Bookkeeping Fees
Prior to May 16, 2011, the Fund had entered into a Financial Reporting Services Agreement (the Financial Reporting Services Agreement) with State Street Bank and Trust Company (State Street) and the Investment Manager pursuant to which State Street provided financial reporting services to the Fund. The Fund also entered into an Accounting Services Agreement (collectively with the Financial Reporting Services Agreement, the State Street Agreements) with State Street and the Investment Manager pursuant to which State Street provided accounting services to the Fund. Under the State Street Agreements, the Fund paid State Street an annual fee of $38,000 paid monthly plus an additional monthly fee based on an annualized percentage rate of average daily net assets of the Fund for the month. The aggregate fee did not exceed $140,000 per year (exclusive of out-of-pocket expenses and charges). The Fund also reimbursed State Street for certain out-of-pocket expenses and charges. Effective May 16, 2011, these services are now provided under the Administrative Services Agreement discussed above.
Compensation of Board Members
Board members are compensated for their services to the Fund as disclosed in the Statement of Operations. The Trust's eligible Trustees may participate in a Deferred Compensation Plan (the Plan) which may be terminated at any time. Obligation of the Plan will be paid solely out of the Fund's assets.
Compensation of Chief Compliance Officer
The Board has appointed a Chief Compliance Officer to the Fund in accordance with federal securities regulations. The Fund, along with other affiliated funds, pays its pro-rata share of the expenses associated with the Chief Compliance Officer. The Fund's expenses for the Chief Compliance Officer will not exceed $15,000 per year.
Transfer Agent Fees
Under a Transfer and Dividend Disbursing Agent Agreement, Columbia Management Investment Services Corp. (the Transfer Agent), an affiliate of the Investment Manager and a wholly-owned subsidiary of Ameriprise Financial, is responsible for providing transfer agency services to the Fund. The Transfer Agent has contracted with Boston Financial Data Services (BFDS) to serve as sub-transfer agent.
The Transfer Agent receives monthly account-based service fees based on the number of open accounts and is reimbursed by the Fund for the fees and expenses the Transfer Agent pays to financial intermediaries that maintain omnibus accounts with the Fund that is a percentage of the average aggregate value of the Fund's shares maintained in each such omnibus account (other than omnibus accounts for which American Enterprise Investment Services Inc. is the broker of record or accounts where the beneficial shareholder is a customer of Ameriprise Financial Services, Inc., which are paid a per account fee). The Transfer Agent pays the fees of BFDS for services as sub-transfer agent and is not entitled to
24
Columbia New York Tax-Exempt Fund, October 31, 2011
reimbursement for such fees from the Fund (with the exception of out-of-pocket fees).
The Transfer Agent also receives compensation from fees for various shareholder services and reimbursements for certain out-of -pocket expenses.
For the year ended October 31, 2011, the Fund's effective transfer agent fee rates as a percentage of average daily net assets of each class were as follows:
| Class A | | | 0.09 | % | |
| Class B | | | 0.11 | | |
| Class C | | | 0.10 | | |
| Class Z | | | 0.01 | | |
An annual minimum account balance fee of $20 may apply to certain accounts with a value below the Fund's initial minimum investment requirements to reduce the impact of small accounts on transfer agent fees. These minimum account balance fees are recorded as part of expense reductions in the Statement of Operations. For the year ended October 31, 2011, these minimum account balance fees reduced total expenses by $400.
The Fund and certain other associated investment companies (together, the Guarantors), have severally, but not jointly, guaranteed the performance and observance of all the terms and conditions of a lease entered into by Seligman Data Corp. (SDC), the former transfer agent, including the payment of rent by SDC (the Guaranty). The lease and the Guaranty expire in January 2019. At October 31, 2011, the Fund's total potential future obligation over the life of the Guaranty is $94,633. The liability remaining at October 31, 2011 for non-recurring charges associated with the lease amounted to $62,563 and is included within other accrued expenses in the Statement of Assets and Liabilities.
Distribution and Service Fees
The Fund has an agreement with Columbia Management Investment Distributors, Inc. (the Distributor), an affiliate of the Investment Manager and a wholly-owned subsidiary of Ameriprise Financial, for distribution and shareholder services. Pursuant to Rule 12b-1 under the 1940 Act, the Board has approved, and the Fund has adopted, distribution and shareholder service plans (the Plans) which set the distribution and service fees for the Fund. These fees are calculated daily and are intended to compensate the Distributor and/or eligible selling and/or servicing agents for selling shares of the Fund and providing services to investors.
Effective July 1, 2011, the Plans require the payment of a monthly service fee to the Distributor at the maximum annual rate of 0.25% of the average daily net assets attributable to Class A, Class B and Class C shares of the Fund. Prior to July 1, 2011, the Fund paid a monthly service fee to the Distributor which was equal to 0.10% annually of the net assets attributable to shares of the Fund issued prior to December 1, 1994 and 0.25% annually of the net assets attributable to shares issued thereafter. The arrangement resulted in an annual rate of service fee for all shares that was a blend between the 0.10% and 0.25% rates. For the period November 1, 2010 through October 31, 2011, the Fund's annualized effective service fee rate was 0.25% of the Fund's average daily net assets attributable to Class A, Class B and Class C shares.
The Plans also require the payment of a monthly distribution fee to the Distributor at the maximum annual rate of 0.75% of the average daily net assets attributable to Class B and Class C shares only.
The Distributor has voluntarily agreed to waive a portion of the distribution fee for Class C shares so that the combined distribution and service fee does not exceed 0.45% annually of the average daily net assets attributable to Class C shares. This arrangement may be modified or terminated by the Distributor at any time.
Sales Charges
Sales charges, including front-end charges and CDSCs, received by the Distributor for distributing Fund shares were $83,061 for Class A, $1,002 for Class B and $946 for Class C shares for the year ended October 31, 2011.
Expenses Waived/Reimbursed by the Investment Manager and its Affiliates
Effective March 1, 2011, the Investment Manager and certain of its affiliates have contractually agreed to waive fees and/or reimburse expenses (excluding certain fees and expenses described below), through August 31, 2012, unless sooner terminated at the sole discretion of the Board, so that the
25
Columbia New York Tax-Exempt Fund, October 31, 2011
Fund's net operating expenses, after giving effect to fees waived/expenses reimbursed and any balance credits and/or overdraft charges from the Fund's custodian, do not exceed the following annual rates as a percentage of the class' average daily net assets:
| Class A | | | 0.79 | % | |
| Class B | | | 1.54 | | |
| Class C | | | 1.54 | | |
| Class Z | | | 0.54 | | |
Under the agreement, the following fees and expenses are excluded from the waiver/reimbursement commitment, and therefore will be paid by the Fund, if applicable: taxes (including foreign transaction taxes), expenses associated with investments in affiliated and non-affiliated pooled investment vehicles (including mutual funds and exchange traded funds), transaction costs and brokerage commissions, costs related to any securities lending program, dividend expenses associated with securities sold short, inverse floater program fees and expenses, transaction charges and interest on borrowed money, interest, extraordinary expenses and any other expenses the exclusion of which is specifically approved by the Board. This agreement may be modified or amended only with approval from all parties. Class C distribution fees waived by the Distributor, as discussed above, are in addition to the waiver/reimbursement commitment under the agreement.
Prior to March 1, 2011, the Investment Manager voluntarily agreed to reimburse a portion of the Fund's expenses (excluding certain expenses, such as distribution and services fees, brokerage commissions, interest, taxes and extraordinary expenses, but including custodian charges relating to overdrafts, if any) so that the Fund's ordinary net operating expenses, after giving effect to fees waived/expenses reimbursed and any balance credits and/or overdraft charges from the Fund's custodian, did not exceed 0.60% of the Fund's average daily net assets on an annualized basis.
Note 4. Federal Tax Information
The timing and character of income and capital gain distributions are determined in accordance with income tax regulations, which may differ from GAAP because of temporary or permanent book to tax differences.
For the year ended October 31, 2011, permanent differences are primarily due to amortization/accretion adjustments and non-deductible merger expenses. In the Statement of Assets and Liabilities the following reclassification were made among the components of the Fund's net assets due to permanent differences:
| Undistributed Net Investment Income | | $ | 21,852 | | |
| Accumulated Net Realized Loss | | | 49,784 | | |
| Paid-In Capital | | | (71,636 | ) | |
Net investment income and net realized gains (losses), as disclosed in the Statement of Operations, and net assets were not affected by this reclassification.
The tax character of distributions paid during the years indicated was as follows:
| Year ended October 31, | | 2011 | | 2010 | |
| Tax-Exempt Income | | $ | 4,484,699 | | | $ | 2,650,565 | | |
| Ordinary Income | | | 53,528 | | | | 455,784 | | |
| Long-Term Capital Gains | | | 45,876 | | | | 1,692,250 | | |
Short-term capital gain distributions, if any, are considered ordinary income distributions for tax purposes.
At October 31, 2011, the components of distributable earnings on a tax basis were as follows:
| Undistributed Tax-Exempt Income | | $ | 703,383 | | |
Undistributed Accumulated Long-Term
Capital Gains | | | 283,025 | | |
| Unrealized Appreciation | | | 9,957,195 | | |
At October 31, 2011, the cost of investments for federal income tax purposes was $168,097,019 and the aggregate gross unrealized appreciation and depreciation based on that cost was:
| Unrealized Appreciation | | $ | 10,817,772 | | |
| Unrealized Depreciation | | | (860,576 | ) | |
| Net Unrealized Appreciation | | $ | 9,957,196 | | |
26
Columbia New York Tax-Exempt Fund, October 31, 2011
The following capital loss carryforward, determined at October 31, 2011, may be available to reduce taxable income arising from future net realized gains on investments, if any, to the extent permitted by the Internal Revenue Code:
| Year of Expiration | | Amount | |
| 2017 | | $ | 174,547 | | |
On December 22, 2010, the Regulated Investment Company Modernization Act of 2010 (the Act) was enacted, which changed various technical rules governing the tax treatment of regulated investment companies. The changes are generally effective for taxable years beginning after the date of enactment. Under the Act, the Fund will be permitted to carry forward capital losses incurred in taxable years beginning after the date of enactment for an unlimited period. However, any losses incurred during those future taxable years will be required to be utilized prior to the losses incurred in pre-enactment taxable years, which carry an expiration date. As a result of this ordering rule, pre-enactment capital loss carryforwards may be more likely to expire unused.
The fund acquired $371,078 of capital loss carry forward in connection with the RiverSource New York Tax Exempt Fund. Of the capital loss acquired 196,531 was utilized in the current year and the remainder may be limited by the Internal Revenue Code.
Management of the Fund has concluded that there are no significant uncertain tax positions that would require recognition in the financial statements. However, management's conclusion may be subject to review and adjustment at a later date based on factors including, but not limited to, new tax laws, regulations, and administrative interpretations (including relevant court decisions). Generally, the Fund's federal tax returns for the prior three fiscal years remain subject to examination by the Internal Revenue Service.
Note 5. Portfolio Information
The cost of purchases and proceeds from sales of securities, excluding short-term obligations, aggregated to $127,268,782 and $23,536,356, respectively, for the year ended October 31, 2011.
Note 6. Lending of Portfolio Securities
Effective May 16, 2011, the Fund has entered into a Master Securities Lending Agreement (the Agreement) with JPMorgan Chase Bank, N.A. (JPMorgan). The Agreement, which replaces the previous security lending arrangement with State Street, authorizes JPMorgan as lending agent to lend securities to authorized borrowers in order to generate additional income on behalf of the Fund. Pursuant to the Agreement, the securities loaned are secured by cash or U.S. government securities equal to at least 100% of the market value of the loaned securities. Any additional collateral required to maintain those levels due to market fluctuations of the loaned securities is delivered the following business day. Cash collateral received is invested by the lending agent on behalf of the Fund into authorized investments pursuant to the Agreement. The investments made with the cash collateral are listed in the Portfolio of Investments. The values of such investments and any uninvested cash collateral are disclosed in the Statement of Assets and Liabilities along with the related obligation to return the collateral upon the return of the securities loaned. For the year ended October 31, 2011, the Fund did not participate in securities lending activity.
Risks of delay in recovery of securities or even loss of rights in the securities may occur should the borrower of the securities fail financially. Risks may also arise to the extent that the value of the securities loaned increases above the value of the collateral received. JPMorgan will indemnify the Fund from losses resulting from a borrower's failure to return a loaned security when due. Such indemnification does not extend to losses associated with declines in the value of cash collateral investments. The Investment Manager is not responsible for any losses incurred by the Fund in connection with the securities lending program. Loans are subject to termination by the Fund or the borrower at any time, and are, therefore, not considered to be illiquid investments.
Pursuant to the Agreement, the Fund receives income for lending its securities either in the form of fees or by earning interest on invested cash collateral, net of negotiated rebates paid to borrowers and fees paid to the lending agent for services provided and any other securities lending expenses.
Prior to May 16, 2011, the Fund participated in a securities lending arrangement with State Street. Each security on loan was collateralized in an amount at least equal to the market value of the securities loaned plus accrued income from the
27
Columbia New York Tax-Exempt Fund, October 31, 2011
investment of collateral. The income generated by the investment of the collateral, net of any fees remitted to State Street as the lending agent and borrower rebates, was paid to the Fund.
Note 7. Custody Credits
Prior to May 16, 2011, the Fund had an agreement with its custodian bank under which custody fees may have been reduced by balance credits. These credits are recorded as part of expense reductions on the Statement of Operations. The Fund could have invested a portion of the assets utilized in connection with the expense offset arrangement in an income-producing asset if they had not entered into such an agreement. For the period November 1, 2010 through May 16, 2011, there were no custody credits.
Note 8. Shareholder Concentration
At October 31, 2011, two shareholder accounts owned 14.94% of the outstanding shares of the Fund. Subscription and redemption activity of these accounts may have a significant effect on the operations of the Fund.
Note 9. Line of Credit
The Fund has entered into a revolving credit facility with a syndicate of banks led by JPMorgan Chase Bank, N.A. (the Administrative Agent), whereby the Fund may borrow for the temporary funding of shareholder redemptions or for other temporary or emergency purposes. The credit facility became effective on May 16, 2011, replacing a prior credit facility. The credit facility agreement which is a collective agreement between the Fund and certain other funds managed by the Investment Manager, severally and not jointly, permits collective borrowings up to $500,000,000.
Interest is charged to each participating fund based on its borrowings at a rate equal to the sum of the federal funds rate plus (i) 1.25% per annum plus (ii) if one-month LIBOR exceeds the federal funds rate, the amount of such excess. Each borrowing under the credit facility matures no later than 60 days after the date of borrowing. The Fund also pays a commitment fee equal to its pro rata share of the amount of the credit facility at a rate of 0.10% per annum.
For the period March 28, 2011 through May 15, 2011, the Fund and certain other funds managed by the Investment Manager participated in a $225,000,000 committed, unsecured revolving credit facility provided by State Street. Prior to March 28, 2011, the collective borrowing amount of the credit facility was $280,000,000. Interest was charged to each fund based on its borrowings at a rate equal to the greater of the (i) federal funds rate plus 1.25% per annum or (ii) the overnight LIBOR rate plus 1.25% per annum. The Fund also paid a commitment fee equal to its pro rata share of the amount of the credit facility at a rate of 0.125% per annum.
Effective December 13, 2011, the Fund extended its revolving credit facility with the Administrative Agent. The credit facility agreement, as amended, permits collective borrowings up to $500 million. Effective December 13, 2011, interest is charged to each participating fund based on its borrowings at a rate equal to the higher of (i) the overnight federal funds rate plus 1.00% or (i) the one-month LIBOR rate plus 1.00%. Each borrowing under the credit facility matures no later than 60 days after the date of borrowing. The Fund also pays a commitment fee equal to its pro rata share of the amount of the credit facility at a rate of 0.08% per annum.
The Fund had no borrowings during the year ended October 31, 2011.
Note 10. Fund Merger
At the close of business on June 3, 2011, Columbia New York Tax-Exempt Fund acquired the assets and assumed the identified liabilities of RiverSource New York Tax-Exempt Fund, a series of RiverSource Special Tax-Exempt Series Trust and Seligman New York Municipal Fund, a series of Seligman Municipal Series, Inc. The mergers were completed after shareholders of the acquired funds approved the plan on February 15, 2011.
The aggregate net assets of Columbia New York Tax-Exempt Fund immediately before the acquisitions were $62,703,788 and the combined net assets immediately after the acquisitions were $181,018,699.
The acquisitions were accomplished by a tax-free exchange of 9,512,113 shares of RiverSource New York Tax-Exempt Fund valued at $46,900,979 (including unrealized appreciation of $1,132,099) and 9,034,756 shares of Seligman New York Municipal Fund valued at $71,413,932 (including unrealized appreciation of $2,655,052).
In exchange for shares of RiverSource New York Tax-Exempt Fund and Seligman New York Municipal Fund Columbia
28
Columbia New York Tax-Exempt Fund, October 31, 2011
New York Tax-Exempt Fund issued the following number of shares:
| | | RiverSource
New York
Tax-Exempt Fund | | Seligman
New York
Municipal Fund | |
| Class A | | | 6,311,058 | | | | 9,114,926 | | |
| Class B | | | 153,991 | | | | — | | |
| Class C | | | 121,288 | | | | 911,895 | | |
For financial reporting purposes, net assets received and shares issued by Columbia New York Tax-Exempt Fund were recorded at fair value; however, RiverSource New York Tax-Exempt Fund and Seligman New York Municipal Fund's cost of investments were carried forward to align ongoing reporting of Columbia New York Tax-Exempt Fund's realized and unrealized gains and losses with amounts distributable to shareholders for tax purposes.
The financial statements reflect the operations of Columbia New York Tax-Exempt Fund for the period prior to the mergers and the combined fund for the period subsequent to the mergers. Because the combined investment portfolios have been managed as a single integrated portfolio since the mergers were completed, it is not practicable to separate the amounts of revenue and earnings of RiverSource New York Tax-Exempt Fund and Seligman New York Municipal Fund that have been included in the combined Fund's Statement of Operations since the mergers were completed.
Assuming the mergers had been completed on November 1, 2010, Columbia New York Tax-Exempt Fund's pro-forma net investment income, net gain on investments, net change in unrealized depreciation and net increase in net assets from operations for the year ended October 31, 2011 would have been approximately $7.4 million, $1.1 million, $(3.5) million and $5.0 million, respectively.
Note 11. Significant Risks
Non-Diversification Risk
A non-diversified fund is permitted to invest a greater percentage of its total assets in fewer companies than a diversified fund. The Fund may, therefore, have a greater risk of loss from a few issuers than a similar fund that invests more broadly.
Geographic Concentration Risk
Because state-specific tax-exempt funds invest primarily in the municipal securities issued by the state and political sub-divisions of the state, the Fund will be particularly affected by political and economic conditions and developments in the state in which it invests. The Fund may, therefore, have a greater risk than that of a municipal bond fund which is more geographically diversified. The value of the municipal securities owned by the Fund also may be adversely affected by future changes in federal or state income tax laws.
Tax Development Risk
The Fund purchases municipal securities whose interest, in the opinion of bond counsel, is free from federal income tax. There is no assurance that the Internal Revenue Service (IRS) will agree with this opinion. In the event the IRS determines that an issuer does not comply with relevant tax requirements, interest payments from a security could become federally taxable, possibly retroactively to the date the security was issued. As a shareholder of the Fund, you may be required to file an amended tax return as a result.
Sector Focus Risk
The Fund may focus its investments in certain sectors, subjecting it to greater risk than a fund that that invests in a wider range of industries.
Note 12. Subsequent Events
Management has evaluated the events and transactions that have occurred through the date the financial statements were issued. Other than as noted in Note 9 above, there were no items requiring adjustment of the financial statements or additional disclosure.
Note 13. Information Regarding Pending and Settled Legal Proceedings
In June 2004, an action captioned John E. Gallus et al. v. American Express Financial Corp. and American Express Financial Advisors Inc. was filed in the United States District Court for the District of Arizona. The plaintiffs allege that they are investors in several American Express Company mutual funds (branded as Columbia) and they purport to bring the action derivatively on behalf of those funds under the Investment Company Act of 1940. The plaintiffs allege
29
Columbia New York Tax-Exempt Fund, October 31, 2011
that fees allegedly paid to the defendants by the funds for investment advisory and administrative services are excessive. The plaintiffs seek remedies including restitution and rescission of investment advisory and distribution agreements. The plaintiffs voluntarily agreed to transfer this case to the United States District Court for the District of Minnesota (the District Court). In response to defendants' motion to dismiss the complaint, the District Court dismissed one of plaintiffs' four claims and granted plaintiffs limited discovery. Defendants moved for summary judgment in April 2007. Summary judgment was granted in the defendants' favor on July 9, 2007. The plaintiffs filed a notice of appeal with the Eighth Circuit Court of Appeals (the Eighth Circuit) on August 8, 2007. On April 8, 2009, the Eighth Circuit reversed summary judgment and remanded to the District Court for further proceedings. On August 6, 2009, defendants filed a writ of certiorari with the U.S. Supreme Court (the Supreme Court), asking the Supreme Court to stay the District Court proceedings while the Supreme Court considers and rules in a case captioned Jones v. Harris Associates, which involves issues of law similar to those presented in the Gallus case. On March 30, 2010, the Supreme Court issued its ruling in Jones v. Harris Associates, and on April 5, 2010, the Supreme Court vacated the Eighth Circuit's decision in the Gallus case and remanded the case to the Eighth Circuit for further consideration in light of the Supreme Court's decision in Jones v. Harris Associates. On June 4, 2010, the Eighth Circuit remanded the Gallus case to the District Court for further consideration in light of the Supreme Court's decision in Jones v. Harris Associates. On December 9, 2010, the District Court reinstated its July 9, 2007 summary judgment order in favor of the defendants. On January 10, 2011, plaintiffs filed a notice of appeal with the Eighth Circuit. In response to the plaintiffs' opening appellate brief filed on March 18, 2011, the defendants filed a response brief on May 4, 2011 with the Eighth Circuit. The plaintiffs filed a reply brief on May 26, 2011, and oral arguments took place on November 7, 2011.
In December 2005, without admitting or denying the allegations, American Express Financial Corporation (AEFC, which is now known as Ameriprise Financial, Inc. (Ameriprise Financial)), entered into settlement agreements with the Securities and Exchange Commission (SEC) and Minnesota Department of Commerce (MDOC) related to market timing activities. As a result, AEFC was censured and ordered to cease and desist from committing or causing any violations of certain provisions of the Investment Advisers Act of 1940, the Investment Company Act of 1940, and various Minnesota laws. AEFC agreed to pay disgorgement of $10 million and civil money penalties of $7 million. AEFC also agreed to retain an independent distribution consultant to assist in developing a plan for distribution of all disgorgement and civil penalties ordered by the SEC in accordance with various undertakings detailed at www.sec.gov/litigation/admin/ia-2451.pdf. Ameriprise Financial and its affiliates have cooperated with the SEC and the MDOC in these legal proceedings, and have made regular reports to the funds' Boards of Trustees.
Ameriprise Financial and certain of its affiliates have historically been involved in a number of legal, arbitration and regulatory proceedings, including routine litigation, class actions, and governmental actions, concerning matters arising in connection with the conduct of their business activities. Ameriprise Financial believes that the Funds are not currently the subject of, and that neither Ameriprise Financial nor any of its affiliates are the subject of, any pending legal, arbitration or regulatory proceedings that are likely to have a material adverse effect on the Funds or the ability of Ameriprise Financial or its affiliates to perform under their contracts with the Funds. Ameriprise Financial is required to make 10-Q, 10-K and, as necessary, 8-K filings with the Securities and Exchange Commission on legal and regulatory matters that relate to Ameriprise Financial and its affiliates. Copies of these filings may be obtained by accessing the SEC website at www.sec.gov.
There can be no assurance that these matters, or the adverse publicity associated with them, will not result in increased fund redemptions, reduced sale of fund shares or other adverse consequences to the Funds. Further, although we believe proceedings are not likely to have a material adverse effect on the Funds or the ability of Ameriprise Financial or its affiliates to perform under their contracts with the Funds, these proceedings are subject to uncertainties and, as such, we are unable to estimate the possible loss or range of loss that may result. An adverse outcome in one or more of these proceedings could result in adverse judgments, settlements, fines, penalties or other relief that could have a material adverse effect on the consolidated financial condition or results of operations of Ameriprise Financial.
30
Report of Independent Registered Public Accounting Firm
To the Trustees of Columbia Funds Series Trust I and the Shareholders of Columbia New York Tax-Exempt Fund
In our opinion, the accompanying statement of assets and liabilities, including the investment portfolio, and the related statements of operations and of changes in net assets and the financial highlights present fairly, in all material respects, the financial position of Columbia New York Tax-Exempt Fund (the "Fund") (a series of Columbia Funds Series Trust I) at October 31, 2011, and the results of its operations for the year then ended, the changes in its net assets for each of the two years in the period then ended and the financial highlights for each of the periods indicated, in conformity with accounting principles generally accepted in the United States of America. These financial statements and financial highlights (hereafter referred to as "financial statements") are the responsibility of the Fund's management. Our responsibility is to express an opinion on these financial statements based on our audits. We conducted our audits of these financial statements in accordance with the standards of the Public Company Accounting Oversight Board (United States). Those standards require that we plan and perform the audit to obtain reasonable assurance about whether the financial statements are free of material misstatement. An audit includes examining, on a test basis, evidence supporting the amounts and disclosures in the financial statements, assessing the accounting principles used and significant estimates made by management, and evaluating the overall financial statement presentation. We believe that our audits, which included confirmation of securities at October 31, 2011 by correspondence with the custodian and brokers, provide a reasonable basis for our opinion.
PricewaterhouseCoopers LLP
Minneapolis, Minnesota
December 22, 2011
31
Federal Income Tax Information (Unaudited) – Columbia New York Tax-Exempt Fund
The Fund hereby designates as a capital gain dividend with respect to the fiscal year ended October 31, 2011, $306,027, or, if subsequently determined to be different, the net capital gain of such year.
For the fiscal year ended October 31, 2011, 100% of the distributions from net investment income of the Fund qualifies as exempt interest dividends for federal income tax purposes. A portion of the income may be subject to federal alternative minimum tax.
The Fund will notify shareholders in January 2012 of amounts for use in preparing 2011 income tax returns.
32
Fund Governance
The Trustees serve terms of indefinite duration. The names, addresses and birth years of the Trustees and Officers of the Funds in Columbia Funds Series Trust I, the year each was first elected or appointed to office, their principal business occupations during at least the last five years, the number of Funds overseen by each Trustee and other directorships they hold are shown below. Each officer listed below serves as an officer of each Fund in Columbia Funds Series Trust I.
Independent Trustees
Name, Address and Year of Birth,
Position with Funds, Year First
Elected or Appointed to Office | | Principal Occupation(s) During Past Five Years, Number of Funds in Columbia
Funds Complex Overseen by Trustee, Other Directorships Held
| |
| Rodman L. Drake (Born 1943) | |
|
c/o Columbia Management
Investment Advisers, LLC
225 Franklin Street
Boston, MA 02110
Trustee (since 1994) and Chairman of the Board (since 2009) | | Independent consultant since 2010; Co-Founder of Baringo Capital LLC (private equity) from 1997 to 2008; CEO of Crystal River Capital, Inc. (real estate investment trust) from 2003 to 2010; Oversees 43; Jackson Hewitt Tax Service Inc. (tax preparation services from 2004 to 2011); Celgene Corporation (global biotechnology company); Student Loan Corporation (student loan provider from 2008 to 2010); Celgene Corporation (global biotechnology company); The Helios Funds and Brookfield Funds (closed-end funds); Crystal River Capital, Inc. from 2005 to 2010; Parson Brinckerhoff from 1995 to 2008; and Apex Silver Mines Ltd. from 2007 to 2009 | |
|
| Douglas A. Hacker (Born 1955) | |
|
c/o Columbia Management
Investment Advisers, LLC
225 Franklin Street
Boston, MA 02110
Trustee (since 1996) | | Independent business executive since May 2006; Executive Vice President—Strategy of United Airlines from December 2002 to May 2006; President of UAL Loyalty Services (airline marketing company) from September 2001 to December 2002; Executive Vice President and Chief Financial Officer of United Airlines from July 1999 to September 2001. Oversees 43; Nash Finch Company (food distributor); Aircastle Limited (aircraft leasing); and SeaCube Container Leasing Ltd (container leasing) | |
|
| Janet Langford Kelly (Born 1957) | |
|
c/o Columbia Management
Investment Advisers, LLC
225 Franklin Street
Boston, MA 02110
Trustee (since 1996) | | Senior Vice President, General Counsel and Corporate Secretary, ConocoPhillips (integrated energy company) since September 2007; Deputy General Counsel—Corporate Legal Services, ConocoPhillips from August 2006 to August 2007; Partner, Zelle, Hofmann, Voelbel, Mason & Gette LLP (law firm) from March 2005 to July 2006; Adjunct Professor of Law, Northwestern University, from September 2004 to June 2006; Director, UAL Corporation (airline) from February 2006 to July 2006; Oversees 43; None | |
|
| Nancy T. Lukitsh (Born 1956) | |
|
c/o Columbia Management
Investment Advisers, LLC
225 Franklin Street
Boston, MA 02110
Trustee (since 2011) | | Senior Vice President, Partner and Director, Marketing of Wellington Management Company, LLP (investment adviser) from 1997 to 2010; Chair, Wellington Management Investment Portfolios (commingled non-U.S. investment pools) from 2007 to 2010; Director, Wellington Trust Company, NA and other Wellington affiliates from 1997 to 2010. Oversees 43; None | |
|
33
Fund Governance (continued)
Independent Trustees (continued)
Name, Address and Year of Birth,
Position with Funds, Year First
Elected or Appointed to Office | | Principal Occupation(s) During Past Five Years, Number of Funds in Columbia
Funds Complex Overseen by Trustee, Other Directorships Held
| |
| William E. Mayer (Born 1940) | |
|
c/o Columbia Management
Investment Advisers, LLC
225 Franklin Street
Boston, MA 02110
Trustee (since 1994) | | Partner, Park Avenue Equity Partners (private equity) since February 1999; Dean and Professor, College of Business and Management, University of Maryland from 1992 to 1996. Oversees 43; DynaVox Inc. (speech creation); Lee Enterprises (print media); WR Hambrecht + Co. (financial service provider); BlackRock Kelso Capital Corporation (investment company) | |
|
| David M. Moffett (Born 1952) | |
|
c/o Columbia Management
Investment Advisers, LLC
225 Franklin Street
Boston, MA 02110
Trustee (since 2011) | | Retired. Chief Executive Officer, Federal Home Loan Mortgage Corporation, from 2008 to 2009; Senior Adviser, Global Financial Services Group, Carlyle Group, Inc., from 2007 to 2008; Vice Chairman and Chief Financial Officer, U.S. Bancorp, from 1993 to 2007. Oversees 43; CIT Group Inc. (commercial and consumer finance), eBay Inc. (online trading community), MBIA Corp (financial service provider), E.W. Scripps Co. (print and television media), Building Materials Holding Corp. (building materials and construction services), and University of Oklahoma Foundation. | |
|
| Charles R. Nelson (Born 1942) | |
|
c/o Columbia Management
Investment Advisers, LLC
225 Franklin Street
Boston, MA 02110
Trustee (since 1981) | | Retired Professor Emeritus, University of Washington, since 2011; Professor of Economics, University of Washington, from January 1976 to 2011; Ford and Louisa Van Voorhis Professor of Political Economy, University of Washington, from 1993 to 2011; Adjunct Professor of Statistics, University of Washington, from 1980 to 2011; Associate Editor, Journal of Money Credit and Banking from 1993 to 2008; consultant on econometric and statistical matters. Oversees 43; None | |
|
| John J. Neuhauser (Born 1943) | |
|
c/o Columbia Management
Investment Advisers, LLC
225 Franklin Street
Boston, MA 02110
Trustee (since 1984) | | President, Saint Michael's College, since August 2007; Director or Trustee of several non-profit organizations, including Fletcher Allen Health Care, Inc.; University Professor, Boston College from November 2005 to August 2007; Academic Vice President and Dean of Faculties, Boston College from August 1999 to October 2005. Oversees 43; Liberty All-Star Equity Fund and Liberty All-Star Growth Fund (closed-end funds) | |
|
| Patrick J. Simpson (Born 1944) | |
|
c/o Columbia Management
Investment Advisers, LLC
225 Franklin Street
Boston, MA 02110
Trustee (since 2000) | | Partner, Perkins Coie LLP (law firm). Oversees 43; None | |
|
| Anne-Lee Verville (Born 1945) | |
|
c/o Columbia Management
Investment Advisers, LLC
225 Franklin Street
Boston, MA 02110
Trustee (since 1998) | | Retired since 1997 (formerly General Manager–Global Education Industry from 1994 to 1997, President–Application Systems Division from 1991 to 1994, Chief Financial Officer–US Marketing & Services from 1988 to 1991, and Chief Information Officer from 1987 to 1988, IBM Corporation (computer and technology)). Oversees 43; Enesco Group, Inc. (producer of giftware and home and garden decor products) from 2001 to 2006 | |
|
34
Fund Governance (continued)
Interested Trustee
Name, Address and Year of Birth,
Position with Funds, Year First
Elected or Appointed to Office | | Principal Occupation(s) During Past Five Years, Number of Funds in Columbia
Funds Complex Overseen by Trustee, Other Directorships Held
| |
| Michael A. Jones (born 1959) | |
|
c/o Columbia Management
Investment Advisers, LLC
225 Franklin Street
Boston, MA 02110
Trustee (since 2011)
Senior Vice President (since 2011) | | President and Director, Columbia Management Investment Advisers, LLC since May 2010; President and Director, Columbia Management Investment Distributors, Inc. since May 2010; Manager, Chairman, Chief Executive Officer and President, Columbia Management Advisors, LLC from 2007 to April 2010; Chief Executive Officer, President and Director, Columbia Management Distributors, Inc. from November 2006 to April 2010; previously, co-president and senior managing director at Robeco Investment Management. Oversees 43; None | |
|
The Statement of Additional Information includes additional information about the Trustees of the Funds and is available, without charge, upon request by calling 1-800-345-6611.
Officers
| Name, Year of Birth and Address | | Principal Occupation(s) During the Past Five Years | |
| J. Kevin Connaughton (Born 1964) | |
|
225 Franklin Street
Boston, MA 02110
President (since 2009) | | Senior Vice President and General Manager–Mutual Fund Products, Columbia Management Investment Advisers, LLC since May 2010; President, Columbia Funds, since 2009, and RiverSource Funds, since May 2010 (previously Senior Vice President and Chief Financial Officer, Columbia Funds, from June 2008 to January 2009, Treasurer, Columbia Funds, from October 2003 to May 2008, and senior officer of various other affiliated funds since 2000); Managing Director, Columbia Management Advisors, LLC from December 2004 to April 2010. | |
|
| Michael G. Clarke (Born 1969) | |
|
225 Franklin Street
Boston, MA 02110
Treasurer (since 2011) and Chief
Financial Officer (since 2009) | | Vice President, Columbia Management Investment Advisers, LLC since May 2010; Managing Director of Fund Administration, Columbia Management Advisors, LLC, from September 2004 to April 2010; senior officer of Columbia Funds and affiliated funds since 2002. | |
|
| Scott R. Plummer (Born 1959) | |
|
5228 Ameriprise Financial Center
Minneapolis, MN 55474
Senior Vice President, Assistant Secretary
and Chief Legal Officer (since 2010) | | Chief Legal Officer and Assistant Secretary, Columbia Management Investment Advisers, LLC since June 2005; Vice President and Lead Chief Counsel–Asset Management, Ameriprise Financial, Inc. since May 2010 (previously Vice President and Chief Counsel–Asset Management, from 2005 to April 2010, and Vice President–Asset Management Compliance from 2004 to 2005); Vice President, Chief Counsel and Assistant Secretary, Columbia Management Investment Distributors, Inc. since 2008; Vice President, General Counsel and Secretary, Ameriprise Certificate Company since 2005; Chief Counsel, RiverSource Distributors, Inc. since 2006; Vice President, General Counsel and Secretary, RiverSource Funds, since December 2006; Senior Vice President, Secretary and Chief Legal Officer, Columbia Funds, since May 2010. | |
|
35
Fund Governance (continued)
Officers (continued)
| Name, Year of Birth and Address | | Principal Occupation(s) During the Past Five Years | |
| Linda J. Wondrack (Born 1964) | |
|
225 Franklin Street
Boston, MA 02110
Senior Vice President and Chief
Compliance Officer (since 2007) | | Vice President and Chief Compliance Officer, Columbia Management Investment Advisers, LLC since May 2010; Chief Compliance Officer, Columbia Funds, since 2007, and RiverSource Funds, since May 2010; Director (Columbia Management Group, LLC and Investment Product Group Compliance), Bank of America, from June 2005 to April 2010; Director of Corporate Compliance and Conflicts Officer of MFS Investment Management (investment management) from August 2004 to May 2005. | |
|
| William F. Truscott (Born 1960) | |
|
53600 Ameriprise Financial Center
Minneapolis, MN 55474
Senior Vice President (since 2010) | | Chairman of the Board, Columbia Management Investment Advisers, LLC since May 2010 (previously President, Chairman of the Board and Chief Investment Officer, from 2001 to April 2010); Chief Executive Officer, U.S. Asset Management & President, Annuities, Ameriprise Financial, Inc. since May 2010 (previously President–U.S. Asset Management and Chief Investment Officer from 2005 to April 2010, and Senior Vice President—Chief Investment Officer, from 2001 to 2005); Director, President and Chief Executive Officer, Ameriprise Certificate Company since 2006; Director, Columbia Management Investment Distributors, Inc. since May 2010 (previously Chairman of the Board and Chief Executive Officer from 2008 to April 2010); Chairman of the Board and Chief Executive Officer, RiverSource Distributors, Inc. since 2006. | |
|
| Colin Moore (Born 1958) | |
|
225 Franklin Street
Boston, MA 02110
Senior Vice President (since 2010) | | Director and Chief Investment Officer, Columbia Management Investment Advisers, LLC since May 2010; Manager, Managing Director and Chief Investment Officer of Columbia Management Advisors, LLC from 2007 to April 2010; Head of Equities, Columbia Management Advisors, LLC from 2002 to 2007. | |
|
| Amy Johnson (Born 1965) | |
|
5228 Ameriprise Financial Center
Minneapolis, MN 55474
Vice President (since 2010) | | Senior Vice President and Chief Operating Officer, Columbia Management Investment Advisers, LLC since May 2010 (previously Chief Administrative Officer, from 2009 until April 2010, Vice President—Asset Management and Trust Company Services, from 2006 to 2009, and Vice President—Operations and Compliance from 2004 to 2006). | |
|
| Joseph F. DiMaria (Born 1968) | |
|
225 Franklin Street
Boston, MA 02110
Vice President (since 2011) and
Chief Accounting Officer (since 2008) | | Vice President, Mutual Fund Administration, Columbia Management Investment Advisers, LLC, since May 2010; Director of Fund Administration, Columbia Management Advisors, LLC from January 2006 to April 2010; Head of Tax/Compliance and Assistant Treasurer, Columbia Management Advisors, LLC, from November 2004 to December 2005. | |
|
| Stephen T. Welsh (born 1957) | |
|
225 Franklin Street
Boston, MA 02110
Vice President (since 2006) | | President and Director, Columbia Management Investment Services Corp. since May 2010; President and Director, Columbia Management Services, Inc. from July 2004 to April 2010; Managing Director, Columbia Management Distributors, Inc. from August 2007 to April 2010. | |
|
36
Fund Governance (continued)
Officers (continued)
| Name, Year of Birth and Address | | Principal Occupation(s) During the Past Five Years | |
| Paul D. Pearson (born 1956) | |
|
5228 Ameriprise Financial Center
Minneapolis, MN 55474
Vice President and Assistant
Treasurer (since 2011) | | Vice President, Investment Accounting, Columbia Management Investment Advisers, LLC, since May 2010; Vice President, Managed Assets, Investment Accounting, Ameriprise Financial Corporation. | |
|
| Paul B. Goucher (born 1968) | |
|
5228 Ameriprise Financial Center
Minneapolis, MN 55474
Vice President and Assistant
Secretary (since 2010) | | Vice President and Chief Counsel of Ameriprise Financial since January 2010 (formerly Vice President and Group Counsel from November 2008 to January 2010); Director, Managing Director and General Counsel of J. & W. Seligman & Co. Incorporated (Seligman) from July 2008 to November 2008 and Managing Director and Associate General Counsel of Seligman from January 2005 to July 2008. | |
|
| Christopher O. Petersen (born 1970) | |
|
5228 Ameriprise Financial Center
Minneapolis, MN 55474
Vice President (since 2010) and
Secretary (since 2011) | | Vice President and Chief Counsel, Ameriprise Financial since January 2010 (formerly Vice President and Group Counsel or Counsel from April 2004 to January 2010); Assistant Secretary of RiverSource Funds since January 2007. | |
|
| Michael E. DeFao (born 1968) | |
|
5228 Ameriprise Financial Center
Minneapolis, MN 55474
Vice President and Assistant
Secretary (since 2011) | | Vice President and Chief Counsel, Ameriprise Financial since May 2010; Associate General Counsel Bank of America from June 2005 to April 2010 | |
|
37
This page intentionally left blank.
This page intentionally left blank.
This page intentionally left blank.
Important Information About This Report
The fund mails one shareholder report to each shareholder address. If you would like more than one report, please call shareholder services at 1-800-345-6611 and additional reports will be sent to you. This report has been prepared for shareholders of Columbia New York Tax-Exempt Fund.
A description of the policies and procedures that the fund uses to determine how to vote proxies and a copy of the fund's voting records are available (i) at www.columbiamanagement.com, (ii) on the Securities and Exchange Commission's website at www.sec.gov, and (iii) without charge, upon request, by calling 1-800-368-0346. Information regarding how the fund voted proxies relating to portfolio securities during the 12-month period ended June 30 is available from the SEC's website. Information regarding how the fund voted proxies relating to portfolio securities is also available from the fund's website, www.columbiamanagement.com.
The fund files a complete schedule of portfolio holdings with the SEC for the first and third quarters of each fiscal year on Form N-Q. The fund's Form N-Q is available on the SEC's website at www.sec.gov and may be reviewed and copied at the SEC's Public Reference Room in Washington, D.C. Information on the operation of the Public Reference Room may be obtained by calling 1-800-SEC-0330.
Transfer Agent
Columbia Management Investment
Services Corp.
P.O. Box 8081
Boston, MA 02266-8081
1-800-345-6611
Distributor
Columbia Management Investment
Distributors, Inc.
225 Franklin Street
Boston, MA 02110
Investment Manager
Columbia Management Investment Advisers, LLC
225 Franklin Street
Boston, MA 02110
41

Columbia New York Tax-Exempt Fund
P. O. Box 8081
Boston, MA 02266-8081
columbiamanagement.com
This information is for use with concurrent or prior delivery of a fund prospectus. Investors should consider the investment objectives, risks, charges and expenses of a mutual fund carefully before investing. For a free prospectus, which contains this and other important information about the funds, visit columbiamanagement.com. Read the prospectus carefully before investing. The Fund is distributed by Columbia Management Investment Distributors, Inc., member FINRA, and managed by Columbia Management Investment Advisers, LLC.
© 2011 Columbia Management Investment Advisers, LLC. All rights reserved.
C-1021 C (12/11)

Columbia Connecticut Intermediate Municipal Bond Fund
Annual Report for the Period Ended October 31, 2011
Not FDIC insured • No bank guarantee • May lose value
Table of Contents
| Fund Profile | | | 1 | | |
|
| Performance Information | | | 2 | | |
|
| Understanding Your Expenses | | | 3 | | |
|
| Portfolio Manager's Report | | | 4 | | |
|
| Portfolio of Investments | | | 6 | | |
|
Statement of Assets and
Liabilities | | | 12 | | |
|
| Statement of Operations | | | 14 | | |
|
Statement of Changes in
Net Assets | | | 15 | | |
|
| Financial Highlights | | | 17 | | |
|
| Notes to Financial Statements | | | 22 | | |
|
Report of Independent Registered
Public Accounting Firm | | | 31 | | |
|
| Federal Income Tax Information | | | 32 | | |
|
| Fund Governance | | | 33 | | |
|
Important Information About
This Report | | | 41 | | |
|
The views expressed in this report reflect the current views of the respective parties. These views are not guarantees of future performance and involve certain risks, uncertainties and assumptions that are difficult to predict, so actual outcomes and results may differ significantly from the views expressed. These views are subject to change at any time based upon economic, market or other conditions and the respective parties disclaim any responsibility to update such views. These views may not be relied on as investment advice and, because investment decisions for a Columbia Fund are based on numerous factors, may not be relied on as an indication of trading intent on behalf of any particular Columbia Fund. References to specific securities should not be construed as a recommendation or investment advice.
President's Message

Dear Shareholders,
Economic momentum slowed in the third quarter of 2011, raising the odds of recession and making the U.S. economy more susceptible to financial shocks. The unemployment rate remained stalled as growing uncertainty continued to weigh on prospective employers. Monthly indicators for the manufacturing and service sectors also showed signs of slowing. Equity and high-yield bond markets fell sharply as investor confidence was shaken by Europe's lingering debt crisis, a heated debate in Washington over fiscal deficits (which eventually led to a downgrade of U.S. government debt) and tepid economic growth. The U.S. stock market experienced its worst quarter in two years during the third quarter of 2011, with volatility and selling pressure reminiscent of the market selloff in 2008, as macro-economic concerns continued to mount.
During its September meeting, the Federal Reserve Board announced that it was prepared to purchase longer term securities and sell shorter term securities in an effort to keep long-term interest rates down. Their hope is that lower long-term borrowing rates will stimulate business investment and hiring. However, the question remains as to whether monetary policy alone will be enough to resuscitate growth in the current environment.
Despite this challenging and volatile economic backdrop, I believe Columbia Management remains strong and steadfast. Columbia Management is the eighth largest manager of long-term mutual fund assets with $325 billion under management as of September 30, 2011. The past year has been one of considerable change for the organization as we worked diligently to align products, services and resources in the integration of Columbia Management with RiverSource Investments. The incredible line-up of talent, resources and capabilities that has resulted is highlighted by the success of our products. As of September 30, 2011, Columbia Management offers 54 funds rated 4 and 5 stars by Morningstar. Additionally, The Wall Street Journal has named two Columbia funds "Category Kings" in its "Investing in Funds: A Quarterly Analysis" issue dated October 5, 2011 in recognition for their one-year performance as of September 30, 2011.
For more information about these and other funds offered by Columbia Management, including detailed, up-to-date fund performance and portfolio information, please visit us online at columbiamanagement.com. Other information and resources available on our website include:
g timely economic analysis and market commentary
g quarterly fund commentaries
g Columbia Management Investor, a quarterly newsletter for shareholders
Thank you for your continued support of the Columbia Funds. We look forward to serving your investment needs for many years to come.
Best Regards,

J. Kevin Connaughton
President, Columbia Funds
All ratings are Class Z as of 9/30/2011. Out of 118 Z-share Columbia funds rated by Morningstar, 8 funds received a 5-star Overall Rating and 46 funds received a 4-star Overall Rating. The Overall Morningstar Rating for a retail mutual fund is derived from a weighted average of the performance figures associated with its 3-, 5- and 10-year (if applicable) Morningstar Rating metrics. For share classes that do not have a 3-, 5-, or 10-year actual performance history, the fund's independent Morningstar Rating metric is then compared against the retail mutual fund universe breakpoints to determine its hypothetical rating.
For each fund with at least a three-year history, Morningstar calculates a Morningstar RatingTM based on a Morningstar Risk-Adjusted Return measure that accounts for variation in a fund's monthly performance (including the effects of sales charges, loads, and redemption fees), placing more emphasis on downward variations and rewarding consistent performance. The top 10% of funds in each category receive 5 stars, the next 22.5% receive 4 stars, the next 35% receive 3 stars, the next 22.5% receive 2 stars and the bottom 10% receive 1 star. (Each share class is counted as a fraction of one fund within this scale and rated separately, which may cause slight variations in the distribution percentages.)
The Morningstar RatingTM is for Class Z shares only; other classes may have different performance characteristics and may have different ratings. © 2011 Morningstar, Inc. All Rights Reserved. The Morningstar information contained herein: (1) is proprietary to Morningstar and/or its content providers; (2) may not be copied or distributed; and (3) is not warranted to be accurate, complete or timely. Neither Morningstar nor its content providers are responsible for any damages or losses arising from any use of this information.
The Wall Street Journal "Category Kings" methodology: Top-performing funds in each category ranked by one-year total returns (changes in net asset values and reinvested distributions) for the period ended September 30, 2011.
Investors should consider the investment objectives, risks, charges and expenses of a mutual fund carefully before investing. For a free prospectus, which contains this and other important information about the funds, visit www.columbiamanagement.com. The prospectus should be read carefully before investing.
Columbia Funds are distributed by Columbia Management Investment Distributors, Inc., member FINRA, and managed by Columbia Management Investment Advisers, LLC.
© 2011 Columbia Management Investment Advisers, LLC. All rights reserved.
Fund Profile – Columbia Connecticut Intermediate Municipal Bond Fund
Summary
g For the 12-month period that ended October 31, 2011, the fund's Class A shares returned 2.83% without sales charge.
g The fund trailed its benchmark, the Barclays Capital 3-15 Year Blend Municipal Bond Index.1 Its return surpassed the average return of its peer group, the Lipper Other States Intermediate Municipal Debt Funds Classification.2
g The fund's heavier weight in shorter-maturity municipals held back relative results as longer-maturities outperformed. However, performance was helped by the fund's exposure to municipals with A and BBB security ratings,3 which outpaced higher quality debt.
Portfolio Management
Brian M. McGreevy has managed the fund since 2002 and has been associated with the advisor since May 2010. Prior to joining the advisor, Mr. McGreevy was associated with the fund's previous advisor or its predecessors since 1994.
1The Barclays Capital 3-15 Year Blend Municipal Bond Index tracks the performance of municipal bonds issued after December 31, 1990 with remaining maturities between 2 and 17 years and at least $7 million in principal amount outstanding.
2Lipper Inc., a widely respected data provider in the industry, calculates an average total return (assuming reinvestment of distributions) for mutual funds with investment objectives similar to those of the fund. Lipper makes no adjustment for the effect of sales loads.
3Ratings are relative and subjective and are not absolute standards of quality. The credit ratings typically range from AAA (highest) to D (lowest), and are subject to change. The credit quality of the fund's investments does not remove market risk.
Indices are not available for investment, are not professionally managed and do not reflect sales charges, fees, brokerage commissions, taxes or other expenses of investing. Securities in the fund may not match those in an index.
Performance data quoted represents past performance and current performance may be lower or higher. Past performance is no guarantee of future results. The investment return and principal value will fluctuate so that shares, when redeemed, may be worth more or less than the original cost. Please visit www.columbiamanagement.com for daily and most recent month-end performance updates.
Summary
1-year return as of 10/31/11
| | | | +2.83% | |
|
|  | | | Class A shares
(without sales charge) | |
|
| | | | +3.89% | |
|
|  | | | Barclays Capital 3-15 Year
Blend Municipal Bond Index | |
|
1
Performance Information – Columbia Connecticut Intermediate Municipal Bond Fund
Performance data quoted represents past performance and current performance may be lower or higher. Past performance is no guarantee of future results. The investment return and principal value will fluctuate so that shares, when redeemed, may be worth more or less than the original cost. Please visit www.columbiamanagement.com for daily and most recent month-end performance updates.
Performance of a $10,000 investment 11/01/01 – 10/31/11
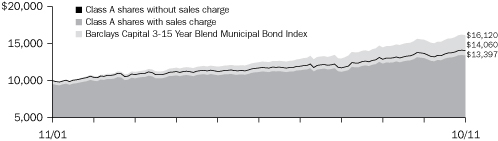
The chart above shows the change in value of a hypothetical $10,000 investment in Class A shares of Columbia Connecticut Intermediate Municipal Bond Fund during the stated time period, and does not reflect the deduction of taxes that a shareholder may pay on fund distributions or on the redemption of fund shares. The performance of a $10,000 investment with sales charge for Class A shares is calculated with an initial sales charge of 4.75%, which was the effective sales charge prior to August 22, 2005.
Performance of a $10,000 investment 11/01/01 – 10/31/11 ($)
| Sales charge | | without | | with | |
| Class A | | | 14,060 | | | | 13,397 | | |
| Class B | | | 13,053 | | | | 13,053 | | |
| Class C | | | 13,469 | | | | 13,469 | | |
| Class T | | | 14,194 | | | | 13,525 | | |
| Class Z | | | 14,411 | | | | n/a | | |
Average annual total return as of 10/31/11 (%)
| Share class | | A | | B | | C | | T | | Z | |
| Inception | | 11/18/02 | | 11/18/02 | | 11/18/02 | | 06/26/00 | | 08/01/94 | |
| Sales charge | | without | | with | | without | | with | | without | | with | | without | | with | | without | |
| 1-year | | | 2.83 | | | | –0.52 | | | | 2.05 | | | | –0.94 | | | | 2.41 | | | | 1.42 | | | | 2.93 | | | | –1.98 | | | | 3.08 | | |
| 5-year | | | 3.73 | | | | 3.05 | | | | 2.96 | | | | 2.96 | | | | 3.32 | | | | 3.32 | | | | 3.84 | | | | 2.83 | | | | 3.99 | | |
| 10-year | | | 3.47 | | | | 2.97 | | | | 2.70 | | | | 2.70 | | | | 3.02 | | | | 3.02 | | | | 3.56 | | | | 3.07 | | | | 3.72 | | |
The "with sales charge" returns include the maximum initial sales charge of 3.25% for Class A shares (for the 1-year and 5-year periods), 4.75% for Class A shares (for the 10-year period) and 4.75% for Class T shares, the applicable contingent deferred sales charge of 3.00% in the first year, declining to 1.00% in the fourth year, and eliminated thereafter for Class B shares and 1.00% for Class C shares for the first year only. The "without sales charge" returns do not include the effect of sales charges. If they had, returns would be lower.
Prior to August 22, 2005, new purchases of Class A shares had a maximum initial sales charge of 4.75%.
Performance results reflect any fee waivers or reimbursements of fund expenses by the Investment Manager and/or any of its affiliates. Absent these fee waivers or expense reimbursement arrangements, performance results would have been lower.
All results shown assume reinvestment of distributions. Class Z shares are sold at net asset value with no distribution and service (Rule 12b-1) fees. Class Z shares have limited eligibility and the investment minimum requirements may vary. Please see the fund's prospectuses for details. Performance for different share classes will vary based on differences in sales charges and fees associated with each class.
The tables do not reflect the deduction of taxes that a shareholder may pay on fund distributions or on the redemption of fund shares.
Class A, Class B, Class C, Class T and Class Z share performance information includes returns of Retail A shares (for Class A and Class T shares), Retail B shares (for Class B and Class C shares) and Trust shares (for Class Z shares) of Galaxy Connecticut Intermediate Municipal Bond Fund, the predecessor to the Fund and a series of The Galaxy Fund (the "Galaxy Connecticut Fund"), for periods prior to November 18, 2002, the date on which Class A, Class B, Class C, Class T and Class Z shares were initially offered by the Fund. The returns shown for all share classes reflect any differences in sales charges, but no returns have been restated to reflect any differences in expenses such as distribution and service (Rule 12b-1) fees between any predecessor share class and the corresponding newer share class. If differences in expenses had been reflected, the returns shown for periods prior to November 18, 2002 would be lower for Class A, Class B, Class C and Class T shares.
2
Understanding Your Expenses – Columbia Connecticut Intermediate Municipal Bond Fund
As a shareholder, you incur two types of costs. There are transaction costs, which generally include sales charges on purchases and may include redemption fees. There are also ongoing costs, which generally include management fees, distribution and service (Rule 12b-1) fees, and other fund expenses. The following information is intended to help you understand your ongoing costs (in dollars) of investing in the Fund and to compare these costs with the ongoing costs of investing in other mutual funds.
Analyzing your fund's expenses
To illustrate these ongoing costs, we provided examples and calculated the expenses paid by investors in each share class of the Fund during the period. The information in the table is based on an initial investment of $1,000 at the beginning of the period indicated and held for the entire period. Expense information is calculated two ways and each method provides you with different information. The amount listed in the "Actual" column is calculated using the Fund's actual operating expenses and total return for the period. You may use the Actual information, together with the amount invested, to estimate the expenses that you paid over the period. Simply divide your account value by $1,000 (for example, an $8,600 account value divided by $1,000 = 8.6), then multiply the results by the expenses paid during the period under the Actual column. The amount listed in the "Hypothetical" column assumes a 5% annual rate of return before expenses (which is not the Fund's actual return) and then applies the Fund's actual expense ratio for the period to the hypothetical return. You should not use the hypothetical account values and expenses to estimate either your actual account balance at the end of the period or the expenses you paid during the period. See the "Compare with other funds" information with details on using the hypothetical data.
Compare with other funds
Since all mutual funds are required to include the same hypothetical calculations about expenses in shareholder reports, you can use this information to compare the ongoing cost of investing in the Fund with other funds. To do so, compare the hypothetical example with the 5% hypothetical examples that appear in the shareholder reports of other funds. As you compare hypothetical examples of other funds, it is important to note that hypothetical examples are meant to highlight the ongoing costs of investing in a fund only and do not reflect any transaction costs, such as sales charges, or redemption or exchange fees. Therefore, the hypothetical calculations are useful in comparing ongoing costs only, and will not help you determine the relative total costs of owning different funds. If transaction costs were included in these calculations, your costs would have been higher.
05/01/11 – 10/31/11
| | | Account value at the
beginning of the period ($) | | Account value at the
end of the period ($) | | Expenses paid
during the period ($) | | Fund's annualized
expense ratio (%) | |
| | | Actual | | Hypothetical | | Actual | | Hypothetical | | Actual | | Hypothetical | | Actual | |
| Class A | | | 1,000.00 | | | | 1,000.00 | | | | 1,035.10 | | | | 1,021.27 | | | | 4.00 | | | | 3.97 | | | | 0.78 | | |
| Class B | | | 1,000.00 | | | | 1,000.00 | | | | 1,031.00 | | | | 1,017.44 | | | | 7.88 | | | | 7.83 | | | | 1.54 | | |
| Class C | | | 1,000.00 | | | | 1,000.00 | | | | 1,032.90 | | | | 1,019.21 | | | | 6.10 | | | | 6.06 | | | | 1.19 | | |
| Class T | | | 1,000.00 | | | | 1,000.00 | | | | 1,035.50 | | | | 1,021.73 | | | | 3.54 | | | | 3.52 | | | | 0.69 | | |
| Class Z | | | 1,000.00 | | | | 1,000.00 | | | | 1,036.30 | | | | 1,022.48 | | | | 2.77 | | | | 2.75 | | | | 0.54 | | |
Expenses paid during the period are equal to the annualized expense ratio for each class as indicated above, multiplied by the average account value over the period and then multiplied by the number of days in the Fund's most recent fiscal half year and divided by 365.
Expenses do not include fees and expenses incurred indirectly by the Fund from the underlying funds in which the Fund may invest (also referred to as "acquired funds"), including affiliated and non-affiliated pooled investments vehicles (including mutual funds and exchange traded funds).
Had Columbia Management Investment Advisers, LLC and/or certain of its affiliates not waived/reimbursed certain fees and expenses, account value at the end of the period would have been reduced.
3
Portfolio Manager's Report – Columbia Connecticut Intermediate Municipal Bond Fund
Performance data quoted represents past performance and current performance may be lower or higher. Past performance is no guarantee of future results. The investment return and principal value will fluctuate so that shares, when redeemed, may be worth more or less than the original cost. Please visit www.columbiamanagement.com for daily and most recent month-end performance updates.
Net asset value per share
as of 10/31/11 ($)
| Class A | | | 10.97 | | |
| Class B | | | 10.97 | | |
| Class C | | | 10.97 | | |
| Class T | | | 10.97 | | |
| Class Z | | | 10.97 | | |
Distributions declared per share
11/01/10 – 10/31/11 ($)
| Class A | | | 0.33 | | |
| Class B | | | 0.25 | | |
| Class C | | | 0.29 | | |
| Class T | | | 0.34 | | |
| Class Z | | | 0.36 | | |
A portion of the fund's income may be subject to the alternative minimum tax. The fund may at times purchase tax-exempt securities at a discount. Some, or all, of this discount may be included in the fund's ordinary income, and is taxable when distributed.
30-day SEC yields
as of 10/31/11 (%)
| Class A | | | 1.76 | | |
| Class B | | | 1.12 | | |
| Class C | | | 1.45 | | |
| Class T | | | 1.85 | | |
| Class Z | | | 2.09 | | |
The 30-day SEC yields reflect the fund's earning power, net of expenses, expressed as an annualized percentage of the public offering price per share at the end of the period. Had the Investment Manager and/or any of its affiliates not waived fees or reimbursed a portion of expenses, the 30-day SEC yields would have been lower.
For the 12-month period that ended October 31, 2011, the fund's Class A shares returned 2.83% without sales charge. By comparison, the fund's benchmark, the Barclays Capital 3-15 Year Blend Municipal Bond Index, which is national in scope, returned 3.89%. The average return of funds in the Lipper Other States Intermediate Municipal Debt Funds Classification was 2.75%. The fund's investments in shorter-maturity municipal debt, which generally trailed the performance of longer-maturity securities, tended to detract from results relative to the Barclays benchmark index. This was especially true with the fund's investments in shorter-maturity pre-refunded municipal bonds. Pre-refunding occurs when an issuer sells a new bond at a lower rate and invests the proceeds in short-term government securities until it can call or pay off the old, higher-rate or pre-refunded bond. Investments in three-to seven-year general obligation bonds, which lagged longer maturities, also held back results relative to the benchmark. Performance received a boost, however, from investments in A rated and BBB rated securities, which outperformed higher quality municipal bonds.
Growth in Connecticut economy slows
The growth of the Connecticut economy appeared to weaken after the first half of 2011, as key industries such as insurance and professional services continued to lay off workers, and construction activities remained moribund. Unemployment in Connecticut remained at about the 9% level, which was higher than the New England region but in line with the national average. The Connecticut municipal bond market was marked by narrower yield spreads between lower-rated and higher-rated securities, reflecting the effects of both strong in-state demand for tax-advantaged securities and the generally higher quality character of the Connecticut's municipal bonds compared to the national market.
Investments in investment-grade debt helped performance
Fund positions in A rated and BBB rated securities helped performance during a period when lower-rated, investment-grade municipals generally outperformed high-rated securities. The fund also has a small holding in a non-rated security, which performed very well. During the period, the fund maintained an overweight position in housing bonds, which added yield and income to the portfolio. Nevertheless, the exposure to the housing sector detracted from total return, as the callability of housing bonds caused them to underperform in the market rally. A notable factor holding back results, relative to the national benchmark, was a 10% overweight in securities with either short maturities or short call dates. The biggest negative was the fund's exposure to shorter-maturity, pre-refunded securities. These securities underperformed when longer maturities rallied as interest rates declined. The fund's large cash position at the beginning of the fiscal year also detracted from return. The fund carried this cash balance in response to negative market news and concerns about municipal finances early in the period.
Looking ahead
Investor demand for tax-advantaged municipal bonds appears to have recovered after slumping early in 2011 amid investor fears that about the credit quality of municipals.
4
Portfolio Manager's Report (continued) – Columbia Connecticut Intermediate Municipal Bond Fund
State and local governments, in general, have taken steps to pay debt service, balance budgets and make fiscally prudent decisions going forward. In Connecticut, the state government has recently stabilized its finances, with public sector labor unions ratifying wage and benefit cuts. Local governments, squeezed by reductions in state aid and lower property and local sales tax revenues, have made significant cuts in their public employee rosters. Against this backdrop, we have added to our investments in the hospital sector and in two new education bonds—two sectors that performed well. We also replaced some high-coupon Connecticut Light and Power bonds that were called away, investing in 16-year securities. In general, we have tried to add to our positions in A rated securities and to extend the maturity profile while reducing exposure to securities with maturities of less than two years.
Portfolio characteristics and holdings are subject to change and may not be representative of current characteristics and holdings. The outlook for this fund may differ from that presented for other Columbia Funds.
Tax-exempt investing offers current tax-exempt income, but it also involves certain risks. The value of the fund will be affected by interest rate changes and the creditworthiness of issues held in the fund. When interest rates go up, bond prices generally drop and vice versa. Interest income from certain tax-exempt bonds may be subject to certain state and local taxes and, if applicable, the alternative minimum tax. Any capital gains distributed are taxable to the investor.
The fund is non-diversified, which generally means that it may invest a greater percentage of its total assets in the securities of fewer issuers than a "diversified" fund. This increases the risk that a change in the value of any one investment held by the fund could affect the overall value of the fund more than it would affect that of a diversified fund holding a greater number of investments. Accordingly, the fund's value will likely be more volatile than the value of more diversified funds.
Single-state municipal bond funds pose additional risks due to limited geographical diversification.
Taxable-equivalent SEC yields
as of 10/31/11 (%)
| Class A | | | 2.71 | | |
| Class B | | | 1.72 | | |
| Class C | | | 2.23 | | |
| Class T | | | 2.85 | | |
| Class Z | | | 3.22 | | |
Taxable-equivalent SEC yields are calculated assuming a federal tax rate of 35.0%. This tax rate does not reflect the phase out of exemptions or the reduction of the otherwise allowable deductions that occur when adjusted gross income exceeds certain levels. Your taxable-equivalent yield may be different depending on your tax bracket.
Maturity breakdown
as of 10/31/11 (%)
| 0-1 year | | | 5.4 | | |
| 1-3 years | | | 8.1 | | |
| 3-5 years | | | 8.8 | | |
| 5-7 years | | | 14.5 | | |
| 7-10 years | | | 17.6 | | |
| 10-15 years | | | 31.6 | | |
| 15-20 years | | | 9.1 | | |
| Cash Equivalents | | | 4.9 | | |
Quality breakdown
as of 10/31/11 (%)
| AAA | | | 23.7 | | |
| AA | | | 47.3 | | |
| A | | | 22.9 | | |
| BBB | | | 3.8 | | |
| Non-Rated | | | 2.3 | | |
Ratings shown in the quality breakdown are assigned to individual bonds by taking the lower of the ratings available from one of the following nationally recognized rating agencies: Standard & Poor's or Moody's Investor Services. If a security is rated by only one of the two agencies, that rating is used. If a security is not rated by either of the two agencies, it is designated as Non-Rated. Ratings are relative and subjective and are not absolute standards of quality. The credit quality of the fund's investments does not remove market risk.
The fund is actively managed and the composition of its portfolio will change over time. Information provided is calculated as a percentage of net assets.
5
Portfolio of Investments – Columbia Connecticut Intermediate Municipal Bond Fund
October 31, 2011
(Percentages represent value of investments compared to net assets)
Issue
Description | | Coupon
Rate | | Principal
Amount | | Value | |
| Municipal Bonds 94.3% | |
| Advanced Refunded 5.3% | |
City of New Haven
Prerefunded 11/01/12 Unlimited General Obligation Bonds
Series 2002C (NPFGC) | |
| 11/01/18 | | | 5.000 | % | | $ | 1,985,000 | | | $ | 2,097,172 | | |
Prerefunded 11/01/13 Unlimited General Obligation Bonds
Series 2003A (FGIC) | |
| 11/01/16 | | | 5.250 | % | | | 170,000 | | | | 187,743 | | |
Hartford County Metropolitan District
Prerefunded 04/01/12 Unlimited General Obligation Bonds
Series 2002 | |
| 04/01/19 | | | 5.000 | % | | | 1,205,000 | | | | 1,241,018 | | |
Puerto Rico Highway & Transportation Authority
Prerefunded Revenue Bonds
Series 2005BB (AGM) Escrowed to Maturity(a) | |
| 07/01/22 | | | 5.250 | % | | | 895,000 | | | | 1,112,780 | | |
State of Connecticut Clean Water Fund
Revenue Bonds
Series 1993 Escrowed to Maturity (FNMA) | |
| 10/01/12 | | | 6.000 | % | | | 405,000 | | | | 418,803 | | |
State of Connecticut
Prerefunded 10/15/13 Unlimited General Obligation Bonds
Series 2003F (NPFGC) | |
| 10/15/20 | | | 5.250 | % | | | 3,670,000 | | | | 4,009,732 | | |
University of Connecticut
Prerefunded 04/01/12 Unlimited General Obligation Bonds
Series 2002A | |
| 04/01/13 | | | 5.375 | % | | | 1,000,000 | | | | 1,021,370 | | |
Prerefunded 05/15/12 Revenue Bonds
Student Fee
Series 2002A | |
| 05/15/14 | | | 5.250 | % | | | 1,185,000 | | | | 1,216,983 | | |
| Total | | | 11,305,601 | | |
| City 5.3% | |
City of Bridgeport
Unlimited General Obligation Refunding Bonds
Series 2004C (NPFGC) | |
| 08/15/17 | | | 5.250 | % | | | 1,500,000 | | | | 1,726,125 | | |
| 08/15/21 | | | 5.500 | % | | | 1,125,000 | | | | 1,316,981 | | |
City of Hartford
Unlimited General Obligation Bonds
Series 2009A (AGM) | |
| 08/15/17 | | | 5.000 | % | | | 695,000 | | | | 818,314 | | |
| Series 2011A | |
| 04/01/22 | | | 5.250 | % | | | 1,325,000 | | | | 1,540,551 | | |
| 04/01/23 | | | 5.250 | % | | | 1,325,000 | | | | 1,524,532 | | |
| 04/01/24 | | | 5.250 | % | | | 1,325,000 | | | | 1,506,538 | | |
City of New Haven
Unrefunded Unlimited General Obligation Bonds
Series 2002B (NPFGC/FGIC) | |
| 11/01/12 | | | 5.375 | % | | | 995,000 | | | | 1,043,636 | | |
Town of Fairfield
Unlimited General Obligation Refunding Bonds
Series 2004 | |
| 01/01/16 | | | 4.500 | % | | | 1,690,000 | | | | 1,812,660 | | |
| Total | | | 11,289,337 | | |
Issue
Description | | Coupon
Rate | | Principal
Amount | | Value | |
| Municipal Bonds (continued) | |
| College 10.1% | |
Connecticut State Health & Educational Facility Authority
Revenue Bonds
Connecticut College Issue
Series 2002E (NPFGC) | |
| 07/01/22 | | | 5.250 | % | | $ | 400,000 | | | $ | 412,640 | | |
Fairfield University
Series 2008N | |
| 07/01/18 | | | 5.000 | % | | | 2,120,000 | | | | 2,412,814 | | |
| 07/01/22 | | | 5.000 | % | | | 2,500,000 | | | | 2,711,075 | | |
Quinnipiac University
Series 2007I (NPFGC) | |
| 07/01/22 | | | 5.000 | % | | | 2,000,000 | | | | 2,145,980 | | |
Quinnipiac University Health & Education
Series 2007 (NPFGC) | |
| 07/01/28 | | | 5.000 | % | | | 2,000,000 | | | | 2,087,360 | | |
Sacred Heart University
Series 2011G | |
| 07/01/20 | | | 5.000 | % | | | 1,190,000 | | | | 1,248,346 | | |
Trinity College
Series 1998F (NPFGC) | |
| 07/01/21 | | | 5.500 | % | | | 500,000 | | | | 588,650 | | |
| Series 2004H (NPFGC) | |
| 07/01/25 | | | 5.000 | % | | | 540,000 | | | | 563,377 | | |
Yale University
Series 1997T-1 | |
| 07/01/29 | | | 4.700 | % | | | 4,800,000 | | | | 5,118,432 | | |
University of Connecticut
Refunding Revenue Bonds
Series 2004A (NPFGC) | |
| 01/15/13 | | | 5.000 | % | | | 2,000,000 | | | | 2,110,420 | | |
Revenue Bonds
Series 2009A | |
| 02/15/23 | | | 5.000 | % | | | 2,000,000 | | | | 2,285,500 | | |
| Total | | | 21,684,594 | | |
| Electric 4.4% | |
Connecticut Municipal Electric Energy Cooperative
Revenue Bonds
Series 2006A (AMBAC) | |
| 01/01/22 | | | 5.000 | % | | | 2,000,000 | | | | 2,182,040 | | |
| Series 2009A (AGM) | |
| 01/01/17 | | | 5.000 | % | | | 1,525,000 | | | | 1,765,508 | | |
Connecticut State Development Authority
Refunding Revenue Bonds
Connecticut Light & Power Co. Project
Series 2011 | |
| 09/01/28 | | | 4.375 | % | | | 4,000,000 | | | | 4,002,960 | | |
Puerto Rico Electric Power Authority
Refunding Revenue Bonds
Series 2010ZZ(a) | |
| 07/01/24 | | | 5.250 | % | | | 1,290,000 | | | | 1,366,794 | | |
| Total | | | 9,317,302 | | |
| Health Care - Hospital 5.4% | |
Connecticut State Health & Educational Facility Authority
Revenue Bonds
Health System Catholic East
Series 2010 | |
| 11/15/29 | | | 4.750 | % | | | 3,420,000 | | | | 3,472,702 | | |
The Accompanying Notes to Financial Statements are an integral part of this statement.
6
Columbia Connecticut Intermediate Municipal Bond Fund
October 31, 2011
(Percentages represent value of investments compared to net assets)
Issue
Description | | Coupon
Rate | | Principal
Amount | | Value | |
| Municipal Bonds (continued) | |
| Health Care - Hospital (cont.) | |
Hospital for Special Care
Series 2007C (RAD) | |
| 07/01/20 | | | 5.250 | % | | $ | 1,235,000 | | | $ | 1,277,052 | | |
| 07/01/27 | | | 5.250 | % | | | 750,000 | | | | 722,040 | | |
Middlesex Hospital
Series 2006M (FSA) | |
| 07/01/27 | | | 4.875 | % | | | 500,000 | | | | 519,125 | | |
| Series 2011N | |
| 07/01/20 | | | 5.000 | % | | | 1,365,000 | | | | 1,475,497 | | |
| 07/01/21 | | | 5.000 | % | | | 1,000,000 | | | | 1,077,390 | | |
William W Backus Hospital
Series 2005G (AGM) | |
| 07/01/24 | | | 5.000 | % | | | 2,060,000 | | | | 2,162,835 | | |
Connecticut State Health & Educational Facility Authority(b)
Revenue Bonds
Ascension Health Credit
Series 1999B | |
| 11/15/29 | | | 3.500 | % | | | 760,000 | | | | 765,981 | | |
| Total | | | 11,472,622 | | |
| Health Care - Life Care Center 0.7% | |
Connecticut State Development Authority
Revenue Bonds
The Elm Park Baptist, Inc. Project
Series 2003 | |
| 12/01/23 | | | 5.750 | % | | | 1,500,000 | | | | 1,520,595 | | |
| Health Care - Nursing Home 0.7% | |
Connecticut State Development Authority
Revenue Bonds
Alzheimer's Resource Center Project
Series 2007 | |
| 08/15/21 | | | 5.400 | % | | | 500,000 | | | | 494,275 | | |
Alzheimers Residence Center, Inc. Project
Series 2007 | |
| 08/15/17 | | | 5.200 | % | | | 970,000 | | | | 981,514 | | |
| Total | | | 1,475,789 | | |
| Health Care - Other 0.1% | |
Connecticut State Health & Educational Facility Authority
Revenue Bonds
Village Families & Children
Series 2002A (AMBAC) | |
| 07/01/23 | | | 5.000 | % | | | 260,000 | | | | 260,270 | | |
| Housing - Multi-Family 0.6% | |
Puerto Rico Housing Finance Authority
Subordinated Revenue Bonds
Capital Fund Modernization
Series 2008(a) | |
| 12/01/13 | | | 5.000 | % | | | 1,300,000 | | | | 1,371,682 | | |
| Housing - Single Family 7.3% | |
Connecticut Housing Finance Authority
Revenue Bonds
Housing Mortgage Finance Program
Series 2003C-1 | |
| 11/15/23 | | | 4.850 | % | | | 4,000,000 | | | | 4,070,720 | | |
| Series 2003D | |
| 11/15/15 | | | 4.400 | % | | | 2,000,000 | | | | 2,026,060 | | |
Issue
Description | | Coupon
Rate | | Principal
Amount | | Value | |
| Municipal Bonds (continued) | |
| Housing - Single Family (cont.) | |
Mortgage Finance
Subordinated Series 2005D-1 | |
| 05/15/17 | | | 4.100 | % | | $ | 2,200,000 | | | $ | 2,304,544 | | |
| Subordinated Series 2008B-1 | |
| 11/15/23 | | | 4.750 | % | | | 3,000,000 | | | | 3,136,530 | | |
| Subordinated Series 2009B-1 | |
| 11/15/24 | | | 4.550 | % | | | 4,000,000 | | | | 4,158,800 | | |
| Total | | | 15,696,654 | | |
| Industrial-Pollution - PCR 0.2% | |
Connecticut State Development Authority
Revenue Bonds
United Illuminating Company Project
Series 2009(b) | |
| 06/01/26 | | | 5.750 | % | | | 500,000 | | | | 505,080 | | |
| Lease 3.7% | |
Bridgeport Housing Authority
Revenue Bonds
Custodial Receipts Energy Performance
Series 2009 | |
| 06/01/22 | | | 5.000 | % | | | 1,035,000 | | | | 1,087,092 | | |
| 06/01/23 | | | 5.000 | % | | | 1,085,000 | | | | 1,133,358 | | |
Connecticut State Health & Educational Facility Authority
Refunding Revenue Bonds
Connecticut State University System
Series 2007I (AGM) | |
| 11/01/17 | | | 5.250 | % | | | 1,000,000 | | | | 1,192,120 | | |
Puerto Rico Public Finance Corp.
Revenue Bonds
Commonwealth Appropriations
Series 2004A(a)(b) | |
| 08/01/27 | | | 5.750 | % | | | 700,000 | | | | 707,196 | | |
State of Connecticut
Certificate of Participation
Juvenile Training School
Series 2001 | |
| 12/15/14 | | | 5.250 | % | | | 1,565,000 | | | | 1,589,664 | | |
University of Connecticut
Revenue Bonds
Series 2007A | |
| 04/01/24 | | | 4.000 | % | | | 2,100,000 | | | | 2,181,312 | | |
| Total | | | 7,890,742 | | |
| Miscellaneous 2.7% | |
State of Connecticut Clean Water Fund
Prerefunded 10/01/13 Revenue Bonds
Revolving Fund
Series 2003A | |
| 10/01/19 | | | 5.000 | % | | | 4,290,000 | | | | 4,620,888 | | |
Refunding Revenue Bonds
Revolving Fund
Series 2009C | |
| 10/01/18 | | | 5.000 | % | | | 1,000,000 | | | | 1,212,510 | | |
| Total | | | 5,833,398 | | |
| Resource Recovery 0.8% | |
New Haven Solid Waste Authority
Revenue Bonds
Series 2008 | |
| 06/01/23 | | | 5.125 | % | | | 1,520,000 | | | | 1,640,597 | | |
The Accompanying Notes to Financial Statements are an integral part of this statement.
7
Columbia Connecticut Intermediate Municipal Bond Fund
October 31, 2011
(Percentages represent value of investments compared to net assets)
Issue
Description | | Coupon
Rate | | Principal
Amount | | Value | |
| Municipal Bonds (continued) | |
| Sales or Use Tax 8.5% | |
State of Connecticut
Refunding Revenue Bonds
Transportation Infrastructure
Series 1992B | |
| 09/01/12 | | | 6.125 | % | | $ | 145,000 | | | $ | 150,438 | | |
| Series 1998A (NPFGC/FGIC) | |
| 10/01/12 | | | 5.500 | % | | | 3,250,000 | | | | 3,398,427 | | |
Refunding Special Tax Bonds
2nd Lien Transportation Infrastructure
Series 2009-1 | |
| 02/01/17 | | | 4.250 | % | | | 3,000,000 | | | | 3,390,000 | | |
| 02/01/19 | | | 5.000 | % | | | 3,450,000 | | | | 4,083,075 | | |
Revenue Bonds
Transportation Infrastructure
Series 2009A | |
| 12/01/19 | | | 4.500 | % | | | 3,765,000 | | | | 4,352,302 | | |
Special Tax Bonds
Transportation Infrastructure
Series 2003B (NPFGC/FGIC) | |
| 01/01/23 | | | 5.000 | % | | | 800,000 | | | | 853,608 | | |
Virgin Islands Public Finance Authority
Revenue Bonds
Senior Lien-Matching Fund Loan Note
Series 2010A(a) | |
| 10/01/25 | | | 5.000 | % | | | 2,020,000 | | | | 2,048,947 | | |
| Total | | | 18,276,797 | | |
| School 2.7% | |
Connecticut State Health & Educational Facility Authority
Revenue Bonds
Greenwich Academy
Series 2007E (AGM) | |
| 03/01/26 | | | 5.250 | % | | | 2,770,000 | | | | 3,213,726 | | |
Loomis Chaffe School
Series 2005F (AMBAC) | |
| 07/01/27 | | | 5.250 | % | | | 1,670,000 | | | | 2,017,811 | | |
Miss Porters School Issue
Series 2006B (AMBAC) | |
| 07/01/29 | | | 4.500 | % | | | 600,000 | | | | 606,510 | | |
| Total | | | 5,838,047 | | |
| Special District - Assessment 1.5% | |
Harbor Point Infrastructure Improvement District
Tax Allocation Bonds
Harbor Point Project
Series 2010A | |
| 04/01/22 | | | 7.000 | % | | | 3,000,000 | | | | 3,169,410 | | |
| Special Purpose Certificates - General Obligations 18.3% | |
City of Bridgeport
Unlimited General Obligation Refunding Bonds
Series 2002A | |
| 08/15/14 | | | 5.375 | % | | | 1,600,000 | | | | 1,650,752 | | |
City of Danbury
Unlimited General Obligation Bonds
Series 1995 | |
| 02/01/13 | | | 5.625 | % | | | 200,000 | | | | 212,596 | | |
Unlimited General Obligation Refunding Bonds
Series 2004 (NPFGC/FGIC) | |
| 08/01/16 | | | 4.750 | % | | | 1,270,000 | | | | 1,400,442 | | |
Issue
Description | | Coupon
Rate | | Principal
Amount | | Value | |
| Municipal Bonds (continued) | |
| Special Purpose Certificates - General Obligations (cont.) | |
City of Hartford
Unlimited General Obligation Bonds
Series 2006 (AMBAC) | |
| 07/15/22 | | | 5.000 | % | | $ | 600,000 | | | $ | 645,228 | | |
Unlimited General Obligation Refunding Bonds
Series 2005C (NPFGC) | |
| 09/01/19 | | | 5.000 | % | | | 2,085,000 | | | | 2,426,273 | | |
City of New Britain
Unlimited General Obligation Bonds
Series 2006 (AMBAC) | |
| 04/15/17 | | | 5.000 | % | | | 1,165,000 | | | | 1,350,852 | | |
City of New Haven
Unlimited General Obligation Refunding Bonds
Series 2008 (AGM) | |
| 11/01/18 | | | 5.000 | % | | | 4,260,000 | | | | 4,847,071 | | |
Unrefunded Unlimited General Obligation Bonds
Series 2003A (NPFGC/FGIC) | |
| 11/01/16 | | | 5.250 | % | | | 1,830,000 | | | | 1,998,616 | | |
City of New London
Unlimited General Obligation Refunding Bonds
Series 2003C (AMBAC) | |
| 02/01/17 | | | 5.000 | % | | | 1,290,000 | | | | 1,354,797 | | |
City of Stamford
Unlimited General Obligation Refunding Bonds
Series 2003B | |
| 08/15/17 | | | 5.250 | % | | | 1,125,000 | | | | 1,355,355 | | |
Regional School District No. 15
Limited General Obligation Refunding Bonds
Series 2003 (NPFGC/FGIC) | |
| 02/01/15 | | | 5.000 | % | | | 1,105,000 | | | | 1,237,114 | | |
| 02/01/16 | | | 5.000 | % | | | 1,025,000 | | | | 1,170,150 | | |
Town of East Haven
Unlimited General Obligation Refunding Bonds
Series 2003 (NPFGC) | |
| 09/01/15 | | | 5.000 | % | | | 640,000 | | | | 710,496 | | |
Town of Fairfield
Unlimited General Obligation Refunding Bonds
Series 2008 | |
| 01/01/20 | | | 5.000 | % | | | 1,000,000 | | | | 1,214,060 | | |
| 01/01/22 | | | 5.000 | % | | | 500,000 | | | | 614,615 | | |
Town of New Milford
Unlimited General Obligation Bonds
Series 2004 (AMBAC) | |
| 01/15/16 | | | 5.000 | % | | | 1,025,000 | | | | 1,185,310 | | |
Town of Newtown
Unlimited General Obligation Refunding Bonds
Series 2010 | |
| 07/01/20 | | | 4.500 | % | | | 1,500,000 | | | | 1,756,635 | | |
Town of North Haven
Unlimited General Obligation Bonds
Series 2007 | |
| 07/15/24 | | | 4.750 | % | | | 1,150,000 | | | | 1,382,035 | | |
| 07/15/25 | | | 4.750 | % | | | 1,150,000 | | | | 1,379,620 | | |
Town of Ridgefield
Unlimited General Obligation Refunding Bonds
Series 2009 | |
| 09/15/20 | | | 5.000 | % | | | 2,130,000 | | | | 2,634,384 | | |
The Accompanying Notes to Financial Statements are an integral part of this statement.
8
Columbia Connecticut Intermediate Municipal Bond Fund
October 31, 2011
(Percentages represent value of investments compared to net assets)
Issue
Description | | Coupon
Rate | | Principal
Amount | | Value | |
| Municipal Bonds (continued) | |
| Special Purpose Certificates - General Obligations (cont.) | |
Town of Trumbull
Unlimited General Obligation Refunding Bonds
Series 2009 | |
| 09/15/20 | | | 4.000 | % | | $ | 575,000 | | | $ | 634,328 | | |
| 09/15/21 | | | 4.000 | % | | | 600,000 | | | | 653,904 | | |
Town of Watertown
Unlimited General Obligation Refunding Bonds
Series 2005 (NPFGC) | |
| 08/01/17 | | | 5.000 | % | | | 1,060,000 | | | | 1,252,793 | | |
| Series 2009B | |
| 07/01/17 | | | 5.000 | % | | | 2,000,000 | | | | 2,362,780 | | |
Town of Weston
Unlimited General Obligation Bonds
Series 2004 | |
| 07/15/15 | | | 5.250 | % | | | 1,300,000 | | | | 1,505,361 | | |
Town of Westport
Unlimited General Obligation Refunding Bonds
Series 2003 | |
| 08/15/18 | | | 5.000 | % | | | 1,200,000 | | | | 1,293,720 | | |
Town of Windham
Unlimited General Obligation Refunding Bonds
Series 2004 (NPFGC) | |
| 06/15/15 | | | 5.000 | % | | | 785,000 | | | | 897,538 | | |
| Total | | | 39,126,825 | | |
| State 11.7% | |
Connecticut Housing Finance Authority
Revenue Bonds
State Supported Special Obligation
Series 2009-10 | |
| 06/15/18 | | | 5.000 | % | | | 1,755,000 | | | | 2,051,297 | | |
| 06/15/19 | | | 5.000 | % | | | 1,840,000 | | | | 2,145,164 | | |
State of Connecticut
Unlimited General Obligation Bonds
Economic Recovery
Series 2009A | |
| 01/01/16 | | | 5.000 | % | | | 2,000,000 | | | | 2,304,420 | | |
| Series 2001 (AGM) | |
| 12/15/14 | | | 5.500 | % | | | 1,500,000 | | | | 1,719,150 | | |
| Series 2003E | |
| 08/15/21 | | | 5.000 | % | | | 1,000,000 | | | | 1,061,530 | | |
| Series 2005D (NPFGC/FGIC) | |
| 11/15/23 | | | 5.000 | % | | | 4,000,000 | | | | 4,484,840 | | |
| Series 2008B | |
| 04/15/22 | | | 5.000 | % | | | 5,415,000 | | | | 6,195,518 | | |
Unlimited General Obligation Refunding Bonds
Series 2005B (AMBAC) | |
| 06/01/20 | | | 5.250 | % | | | 600,000 | | | | 734,526 | | |
| Series 2006E | |
| 12/15/20 | | | 5.000 | % | | | 3,000,000 | | | | 3,457,680 | | |
Unrefunded Unlimited General Obligation Bonds
Series 1993E | |
| 03/15/12 | | | 6.000 | % | | | 975,000 | | | | 995,875 | | |
| Total | | | 25,150,000 | | |
Issue
Description | | Coupon
Rate | | Principal
Amount | | Value | |
| Municipal Bonds (continued) | |
| Toll Road 1.8% | |
Puerto Rico Highway & Transportation Authority(a)
Refunding Revenue Bonds
Series 2005BB (AGM)
10/04/2005 | |
| 07/01/22 | | | 5.250 | % | | $ | 1,605,000 | | | $ | 1,731,394 | | |
Revenue Bonds
Series 2002E (AGM) | |
| 07/01/17 | | | 5.500 | % | | | 1,870,000 | | | | 2,066,200 | | |
| Total | | | 3,797,594 | | |
| Water & Sewer 2.5% | |
South Central Connecticut Regional Water Authority
Refunding Revenue Bonds
20th Series 2007A (NPFGC) | |
| 08/01/22 | | | 5.250 | % | | | 1,370,000 | | | | 1,645,534 | | |
| 08/01/23 | | | 5.250 | % | | | 500,000 | | | | 600,955 | | |
South Central Connecticut Regional Water Authority(b)
Revenue Bonds
18th Series 2003B (NPFGC) | |
| 08/01/29 | | | 5.250 | % | | | 750,000 | | | | 807,405 | | |
State of Connecticut Clean Water Fund
Refunding Revenue Bonds
Revolving Fund
Series 2003B | |
| 10/01/12 | | | 5.000 | % | | | 1,000,000 | | | | 1,043,320 | | |
| 10/01/15 | | | 5.000 | % | | | 1,000,000 | | | | 1,155,130 | | |
| Total | | | 5,252,344 | | |
Total Municipal Bonds
(Cost: $190,989,270) | | $ | 201,875,280 | | |
| | | | | Shares | | Value | |
| Money Market Funds 4.8% | |
Dreyfus Connecticut Municipal
Money Market Fund, Inc., 0.000%(c) | | | | | 5,102,022 | | | $ | 5,102,022 | | |
JPMorgan Tax-Free Money
Market Fund, 0.010%(c) | | | | | 5,099,704 | | | | 5,099,704 | | |
Total Money Market Funds
(Cost: $10,201,726) | | $ | 10,201,726 | | |
Total Investments
(Cost: $201,190,996) | | | | | | $ | 212,077,006 | | |
| Other Assets & Liabilities, Net | | | | | | | 1,978,302 | | |
| Total Net Assets | | $ | 214,055,308 | | |
The Accompanying Notes to Financial Statements are an integral part of this statement.
9
Columbia Connecticut Intermediate Municipal Bond Fund
October 31, 2011
| Notes to Portfolio of Investments | |
(a) Municipal obligations include debt obligations issued by or on behalf of territories, possessions, or sovereign nations within the territorial boundaries of the United States. At October 31, 2011, the value of these securities amounted to $10,404,993 or 4.86% of net assets.
(b) Variable rate security. The interest rate shown reflects the rate as of October 31, 2011.
(c) The rate shown is the seven-day current annualized yield at October 31, 2011.
AGM Assured Guaranty Municipal Corporation
AMBAC Ambac Assurance Corporation
FGIC Financial Guaranty Insurance Company
FNMA Federal National Mortgage Association
NPFGC National Public Finance Guarantee Corporation
RAD Radian Asset Assurance, Inc.
Generally accepted accounting principles (GAAP) require disclosure regarding the inputs and valuation techniques used to measure fair value and any changes in valuation inputs or techniques. In addition, investments shall be disclosed by major category.
The Fund categorizes its fair value measurements according to a three-level hierarchy that maximizes the use of observable inputs and minimizes the use of unobservable inputs by prioritizing that the most observable input be used when available. Observable inputs are those that market participants would use in pricing an investment based on market data obtained from sources independent of the reporting entity. Unobservable inputs are those that reflect the Fund's assumptions about the information market participants would use in pricing an investment. An investment's level within the fair value hierarchy is based on the lowest level of any input that is deemed significant to the asset or liability's fair value measurement. The input levels are not necessarily an indication of the risk or liquidity associated with investments at that level. For example, certain U.S. government securities are generally high quality and liquid, however, they are reflected as Level 2 because the inputs used to determine fair value may not always be quoted prices in an active market.
Fair value inputs are summarized in the three broad levels listed below:
• Level 1 — Valuations based on quoted prices for investments in active markets that the Fund has the ability to access at the measurement date (including NAV for open-end mutual funds). Valuation adjustments are not applied to Level 1 investments.
• Level 2 — Valuations based on other significant observable inputs (including quoted prices for similar securities, interest rates, prepayment speeds, credit risks, etc.).
• Level 3 — Valuations based on significant unobservable inputs (including the Fund's own assumptions and judgment in determining the fair value of investments).
Inputs that are used in determining fair value of an investment may include price information, credit data, volatility statistics, and other factors. These inputs can be either observable or unobservable. The availability of observable inputs can vary between investments, and is affected by various factors such as the type of investment, and the volume and level of activity for that investment or similar investments in the marketplace. The inputs will be considered by the Investment Manager, along with any other relevant factors in the calculation of an investment's fair value. The Fund uses prices and inputs that are current as of the measurement date, which may include periods of market dislocations. During these periods, the availability of prices and inputs may be reduced for many investments. This condition could cause an investment to be reclassified between the various levels within the hierarchy.
Investments falling into the Level 3 category are primarily supported by quoted prices from brokers and dealers participating in the market for those investments. However, these may be classified as Level 3 investments due to lack of market transparency and corroboration to support these quoted prices. Additionally, valuation models may be used as the pricing source for any remaining investments classified as Level 3. These models rely on one or more significant unobservable inputs and/or significant assumptions by the Investment Manager. Inputs used in valuations may include, but are not limited to, financial statement analysis, capital account balances, discount rates and estimated cash flows, and comparable company data.
The Accompanying Notes to Financial Statements are an integral part of this statement.
10
Columbia Connecticut Intermediate Municipal Bond Fund
October 31, 2011
| Fair Value Measurements (continued) | |
The following table is a summary of the inputs used to value the Fund's investments as of October 31, 2011:
| | | Fair Value at October 31, 2011 | |
| Description(a) | | Level 1
Quoted Prices
in Active
Markets for
Identical Assets | | Level 2
Other
Significant
Observable
Inputs(b) | | Level 3
Significant
Unobservable
Inputs | | Total | |
| Bonds | |
| Municipal Bonds | | $ | — | | | $ | 201,875,280 | | | $ | — | | | $ | 201,875,280 | | |
| Total Bonds | | | — | | | | 201,875,280 | | | | — | | | | 201,875,280 | | |
| Other | |
| Money Market Funds | | | 10,201,726 | | | | — | | | | — | | | | 10,201,726 | | |
| Total Other | | | 10,201,726 | | | | — | | | | — | | | | 10,201,726 | | |
| Total | | $ | 10,201,726 | | | $ | 201,875,280 | | | $ | — | | | $ | 212,077,006 | | |
The Fund's assets assigned to the Level 2 input category are generally valued using the market approach, in which a security's value is determined through reference to prices and information from market transactions for similar or identical assets.
(a) See the Portfolio of Investments for all investment classifications not indicated in the table.
(b) There were no significant transfers between Levels 1 and 2 during the period.
The Accompanying Notes to Financial Statements are an integral part of this statement.
11
Statement of Assets and Liabilities – Columbia Connecticut Intermediate Municipal Bond Fund
October 31, 2011
| Assets | |
| Investments, at value | |
| (identified cost $201,190,996) | | $ | 212,077,006 | | |
| Receivable for: | |
| Investments sold | | | 30,525 | | |
| Capital shares sold | | | 110,216 | | |
| Interest | | | 2,596,689 | | |
| Expense reimbursement due from Investment Manager | | | 4,073 | | |
| Prepaid expense | | | 2,499 | | |
| Trustees' deferred compensation plan | | | 25,997 | | |
| Total assets | | | 214,847,005 | | |
| Liabilities | |
| Payable for: | |
| Capital shares purchased | | | 59,513 | | |
| Dividend distributions to shareholders | | | 577,488 | | |
| Investment management fees | | | 7,021 | | |
| Distribution fees | | | 776 | | |
| Transfer agent fees | | | 27,700 | | |
| Administration fees | | | 1,229 | | |
| Chief compliance officer expenses | | | 262 | | |
| Other expenses | | | 91,711 | | |
| Trustees' deferred compensation plan | | | 25,997 | | |
| Total liabilities | | | 791,697 | | |
| Net assets applicable to outstanding capital stock | | $ | 214,055,308 | | |
The Accompanying Notes to Financial Statements are an integral part of this statement.
12
Statement of Assets and Liabilities (continued) – Columbia Connecticut Intermediate Municipal Bond Fund
October 31, 2011
| Represented by | |
| Paid-in capital | | $ | 202,922,495 | | |
| Undistributed net investment income | | | 151,243 | | |
| Accumulated net realized gain | | | 95,560 | | |
| Unrealized appreciation (depreciation) on: | |
| Investments | | | 10,886,010 | | |
| Total — representing net assets applicable to outstanding capital stock | | $ | 214,055,308 | | |
| Net assets applicable to outstanding shares | |
| Class A | | $ | 9,107,914 | | |
| Class B | | $ | 265,211 | | |
| Class C | | $ | 7,172,163 | | |
| Class T | | $ | 15,109,927 | | |
| Class Z | | $ | 182,400,093 | | |
| Shares outstanding | |
| Class A | | | 830,409 | | |
| Class B | | | 24,184 | | |
| Class C | | | 653,922 | | |
| Class T | | | 1,377,727 | | |
| Class Z | | | 16,631,613 | | |
| Net asset value per share | |
| Class A(a) | | $ | 10.97 | | |
| Class B | | $ | 10.97 | | |
| Class C | | $ | 10.97 | | |
| Class T(a) | | $ | 10.97 | | |
| Class Z | | $ | 10.97 | | |
(a) The maximum offering price per share for Class A is $11.34 and Class T is $11.52. The offering price is calculated by dividing the net asset value by 1.0 minus the maximum sales charge of 3.25% for Class A and by dividing the net asset value by 1.0 minus the maximum sales charge of 4.75% for Class T.
The Accompanying Notes to Financial Statements are an integral part of this statement.
13
Statement of Operations – Columbia Connecticut Intermediate Municipal Bond Fund
Year ended October 31, 2011
| Net investment income | |
| Income: | |
| Dividends | | $ | 1,769 | | |
| Interest | | | 8,567,777 | | |
| Total income | | | 8,569,546 | | |
| Expenses: | |
| Investment management fees | | | 945,991 | | |
| Distribution fees | |
| Class B | | | 6,183 | | |
| Class C | | | 54,232 | | |
| Service fees | |
| Class A | | | 26,701 | | |
| Class B | | | 2,061 | | |
| Class C | | | 18,079 | | |
| Shareholder service fee — Class T | | | 22,936 | | |
| Transfer agent fees | |
| Class A | | | 15,696 | | |
| Class B | | | 1,565 | | |
| Class C | | | 11,073 | | |
| Class T | | | 23,757 | | |
| Class Z | | | 288,721 | | |
| Administration fees | | | 152,251 | | |
| Compensation of board members | | | 41,018 | | |
| Pricing and bookkeeping fees | | | 47,163 | | |
| Custodian fees | | | 13,030 | | |
| Printing and postage fees | | | 52,915 | | |
| Registration fees | | | 68,372 | | |
| Professional fees | | | 67,037 | | |
| Chief compliance officer expenses | | | 883 | | |
| Other | | | 13,137 | | |
| Total expenses | | | 1,872,801 | | |
| Fees waived or expenses reimbursed by Investment Manager and its affiliates | | | (540,983 | ) | |
| Fees waived by Distributor — Class C | | | (25,305 | ) | |
| Expense reductions | | | (148 | ) | |
| Total net expenses | | | 1,306,365 | | |
| Net investment income | | | 7,263,181 | | |
| Realized and unrealized gain (loss) — net | |
| Net realized gain (loss) on: | |
| Investments | | | 786,239 | | |
| Net realized gain | | | 786,239 | | |
| Net change in unrealized appreciation (depreciation) on: | |
| Investments | | | (2,490,968 | ) | |
| Net change in unrealized depreciation | | | (2,490,968 | ) | |
| Net realized and unrealized loss | | | (1,704,729 | ) | |
| Net increase in net assets resulting from operations | | $ | 5,558,452 | | |
The Accompanying Notes to Financial Statements are an integral part of this statement.
14
Statement of Changes in Net Assets – Columbia Connecticut Intermediate Municipal Bond Fund
| Year ended October 31, | | 2011 | | 2010 | |
| Operations | |
| Net investment income | | $ | 7,263,181 | | | $ | 8,078,463 | | |
| Net realized gain | | | 786,239 | | | | 291,778 | | |
| Net change in unrealized appreciation (depreciation) | | | (2,490,968 | ) | | | 6,931,679 | | |
| Net increase in net assets resulting from operations | | | 5,558,452 | | | | 15,301,920 | | |
| Distributions to shareholders from: | |
| Net investment income | |
| Class A | | | (328,201 | ) | | | (353,945 | ) | |
| Class B | | | (19,318 | ) | | | (38,882 | ) | |
| Class C | | | (192,487 | ) | | | (214,718 | ) | |
| Class T | | | (483,649 | ) | | | (536,836 | ) | |
| Class Z | | | (6,200,831 | ) | | | (6,921,044 | ) | |
| Total distributions to shareholders | | | (7,224,486 | ) | | | (8,065,425 | ) | |
| Increase (decrease) in net assets from share transactions | | | (31,087,917 | ) | | | 948,570 | | |
| Total increase (decrease) in net assets | | | (32,753,951 | ) | | | 8,185,065 | | |
| Net assets at beginning of year | | | 246,809,259 | | | | 238,624,194 | | |
| Net assets at end of year | | $ | 214,055,308 | | | $ | 246,809,259 | | |
| Undistributed net investment income | | $ | 151,243 | | | $ | 120,404 | | |
The Accompanying Notes to Financial Statements are an integral part of this statement.
15
Statement of Changes in Net Assets (continued) – Columbia Connecticut Intermediate Municipal Bond Fund
| Year ended October 31, | | 2011 | | 2010 | |
| | | Shares | | Dollars ($) | | Shares | | Dollars ($) | |
| Capital stock activity | |
| Class A shares | |
| Subscriptions | | | 408,591 | | | | 4,360,971 | | | | 303,308 | | | | 3,283,354 | | |
| Distributions reinvested | | | 15,452 | | | | 166,781 | | | | 18,009 | | | | 195,913 | | |
| Redemptions | | | (635,052 | ) | | | (6,808,731 | ) | | | (296,407 | ) | | | (3,239,906 | ) | |
| Net increase (decrease) | | | (211,009 | ) | | | (2,280,979 | ) | | | 24,910 | | | | 239,361 | | |
| Class B shares | |
| Subscriptions | | | 1,027 | | | | 11,102 | | | | 515 | | | | 5,604 | | |
| Distributions reinvested | | | 690 | | | | 7,414 | | | | 1,871 | | | | 20,309 | | |
| Redemptions | | | (110,843 | ) | | | (1,197,295 | ) | | | (55,775 | ) | | | (602,226 | ) | |
| Net decrease | | | (109,126 | ) | | | (1,178,779 | ) | | | (53,389 | ) | | | (576,313 | ) | |
| Class C shares | |
| Subscriptions | | | 117,144 | | | | 1,264,707 | | | | 111,049 | | | | 1,208,515 | | |
| Distributions reinvested | | | 8,502 | | | | 91,935 | | | | 10,357 | | | | 112,549 | | |
| Redemptions | | | (189,406 | ) | | | (2,027,550 | ) | | | (156,669 | ) | | | (1,707,837 | ) | |
| Net decrease | | | (63,760 | ) | | | (670,908 | ) | | | (35,263 | ) | | | (386,773 | ) | |
| Class T shares | |
| Subscriptions | | | 5,776 | | | | 62,387 | | | | 1,816 | | | | 19,819 | | |
| Distributions reinvested | | | 23,969 | | | | 258,920 | | | | 31,495 | | | | 342,198 | | |
| Redemptions | | | (160,999 | ) | | | (1,724,529 | ) | | | (104,602 | ) | | | (1,146,463 | ) | |
| Net decrease | | | (131,254 | ) | | | (1,403,222 | ) | | | (71,291 | ) | | | (784,446 | ) | |
| Class Z shares | |
| Subscriptions | | | 1,156,541 | | | | 12,494,637 | | | | 2,775,544 | | | | 30,001,521 | | |
| Distributions reinvested | | | 20,165 | | | | 217,720 | | | | 20,374 | | | | 221,500 | | |
| Redemptions | | | (3,575,202 | ) | | | (38,266,386 | ) | | | (2,557,640 | ) | | | (27,766,280 | ) | |
| Net increase (decrease) | | | (2,398,496 | ) | | | (25,554,029 | ) | | | 238,278 | | | | 2,456,741 | | |
| Total net increase (decrease) | | | (2,913,645 | ) | | | (31,087,917 | ) | | | 103,245 | | | | 948,570 | | |
The Accompanying Notes to Financial Statements are an integral part of this statement.
16
Financial Highlights – Columbia Connecticut Intermediate Municipal Bond Fund
The following tables are intended to help you understand the Fund's financial performance. Certain information reflects financial results for a single share of a class held for the periods shown. Per share net investment income (loss) amounts are calculated based on average shares outstanding during the period. Total returns assume reinvestment of all dividends and distributions. Total returns do not reflect payment of sales charges, if any, and are not annualized for periods of less than one year.
| | | Year ended Oct. 31, | |
| | | 2011 | | 2010 | | 2009 | | 2008 | | 2007 | |
| Class A | |
| Per share data | |
| Net asset value, beginning of period | | $ | 11.00 | | | $ | 10.69 | | | $ | 10.06 | | | $ | 10.62 | | | $ | 10.76 | | |
| Income from investment operations: | |
| Net investment income | | | 0.33 | | | | 0.33 | | | | 0.35 | | | | 0.37 | | | | 0.36 | | |
| Net realized and unrealized gain (loss) | | | (0.03 | ) | | | 0.31 | | | | 0.63 | | | | (0.55 | ) | | | (0.15 | ) | |
| Total from investment operations | | | 0.30 | | | | 0.64 | | | | 0.98 | | | | (0.18 | ) | | | 0.21 | | |
| Less distributions to shareholders from: | |
| Net investment income | | | (0.33 | ) | | | (0.33 | ) | | | (0.35 | ) | | | (0.38 | ) | | | (0.35 | ) | |
| Total distributions to shareholders | | | (0.33 | ) | | | (0.33 | ) | | | (0.35 | ) | | | (0.38 | ) | | | (0.35 | ) | |
| Net asset value, end of period | | $ | 10.97 | | | $ | 11.00 | | | $ | 10.69 | | | $ | 10.06 | | | $ | 10.62 | | |
| Total return | | | 2.83 | % | | | 6.10 | % | | | 9.87 | % | | | (1.80 | %) | | | 2.03 | % | |
| Ratios to average net assets(a) | |
| Expenses prior to fees waived or expenses reimbursed | | | 1.03 | % | | | 0.94 | % | | | 0.94 | % | | | 0.96 | % | | | 1.06 | % | |
| Net expenses after fees waived or expenses reimbursed(b) | | | 0.79 | %(c) | | | 0.80 | %(c) | | | 0.78 | %(c) | | | 0.75 | %(c) | | | 1.06 | %(c) | |
| Net investment income | | | 3.09 | %(c) | | | 3.08 | %(c) | | | 3.35 | %(c) | | | 3.55 | %(c) | | | 3.35 | %(c) | |
| Supplemental data | |
| Net assets, end of period (in thousands) | | $ | 9,108 | | | $ | 11,458 | | | $ | 10,863 | | | $ | 12,115 | | | $ | 2,566 | | |
| Portfolio turnover | | | 6 | % | | | 10 | % | | | 12 | % | | | 4 | % | | | 10 | % | |
| Notes to Financial Highlights | |
(a) In addition to the fees and expenses which the Fund bears directly, the Fund indirectly bears a pro rata share of the fees and expenses of the acquired funds in which it invests. Such indirect expenses are not included in the reported expense ratios.
(b) The Investment Manager and certain of its affiliates agreed to waive/reimburse certain fees and expenses, if applicable.
(c) The benefits derived from expense reductions had an impact of less than 0.01%.
The Accompanying Notes to Financial Statements are an integral part of this statement.
17
Financial Highlights (continued) – Columbia Connecticut Intermediate Municipal Bond Fund
| | | Year ended Oct. 31, | |
| | | 2011 | | 2010 | | 2009 | | 2008 | | 2007 | |
| Class B | |
| Per share data | |
| Net asset value, beginning of period | | $ | 11.00 | | | $ | 10.69 | | | $ | 10.06 | | | $ | 10.62 | | | $ | 10.76 | | |
| Income from investment operations: | |
| Net investment income | | | 0.25 | | | | 0.25 | | | | 0.28 | | | | 0.30 | | | | 0.28 | | |
| Net realized and unrealized gain (loss) | | | (0.03 | ) | | | 0.31 | | | | 0.62 | | | | (0.56 | ) | | | (0.15 | ) | |
| Total from investment operations | | | 0.22 | | | | 0.56 | | | | 0.90 | | | | (0.26 | ) | | | 0.13 | | |
| Less distributions to shareholders from: | |
| Net investment income | | | (0.25 | ) | | | (0.25 | ) | | | (0.27 | ) | | | (0.30 | ) | | | (0.27 | ) | |
| Total distributions to shareholders | | | (0.25 | ) | | | (0.25 | ) | | | (0.27 | ) | | | (0.30 | ) | | | (0.27 | ) | |
| Net asset value, end of period | | $ | 10.97 | | | $ | 11.00 | | | $ | 10.69 | | | $ | 10.06 | | | $ | 10.62 | | |
| Total return | | | 2.05 | % | | | 5.31 | % | | | 9.05 | % | | | (2.52 | %) | | | 1.27 | % | |
| Ratios to average net assets(a) | |
| Expenses prior to fees waived or expenses reimbursed | | | 1.83 | % | | | 1.69 | % | | | 1.69 | % | | | 1.71 | % | | | 1.81 | % | |
| Net expenses after fees waived or expenses reimbursed(b) | | | 1.55 | %(c) | | | 1.55 | %(c) | | | 1.53 | %(c) | | | 1.50 | %(c) | | | 1.81 | %(c) | |
| Net investment income | | | 2.35 | %(c) | | | 2.34 | %(c) | | | 2.62 | %(c) | | | 2.86 | %(c) | | | 2.58 | %(c) | |
| Supplemental data | |
| Net assets, end of period (in thousands) | | $ | 265 | | | $ | 1,467 | | | $ | 1,995 | | | $ | 2,528 | | | $ | 2,767 | | |
| Portfolio turnover | | | 6 | % | | | 10 | % | | | 12 | % | | | 4 | % | | | 10 | % | |
| Notes to Financial Highlights | |
(a) In addition to the fees and expenses which the Fund bears directly, the Fund indirectly bears a pro rata share of the fees and expenses of the acquired funds in which it invests. Such indirect expenses are not included in the reported expense ratios.
(b) The Investment Manager and certain of its affiliates agreed to waive/reimburse certain fees and expenses, if applicable.
(c) The benefits derived from expense reductions had an impact of less than 0.01%.
The Accompanying Notes to Financial Statements are an integral part of this statement.
18
Financial Highlights (continued) – Columbia Connecticut Intermediate Municipal Bond Fund
| | | Year ended Oct. 31, | |
| | | 2011 | | 2010 | | 2009 | | 2008 | | 2007 | |
| Class C | |
| Per share data | |
| Net asset value, beginning of period | | $ | 11.00 | | | $ | 10.69 | | | $ | 10.06 | | | $ | 10.62 | | | $ | 10.76 | | |
| Income from investment operations: | |
| Net investment income | | | 0.29 | | | | 0.29 | | | | 0.31 | | | | 0.34 | | | | 0.31 | | |
| Net realized and unrealized gain (loss) | | | (0.03 | ) | | | 0.31 | | | | 0.63 | | | | (0.56 | ) | | | (0.14 | ) | |
| Total from investment operations | | | 0.26 | | | | 0.60 | | | | 0.94 | | | | (0.22 | ) | | | 0.17 | | |
| Less distributions to shareholders from: | |
| Net investment income | | | (0.29 | ) | | | (0.29 | ) | | | (0.31 | ) | | | (0.34 | ) | | | (0.31 | ) | |
| Total distributions to shareholders | | | (0.29 | ) | | | (0.29 | ) | | | (0.31 | ) | | | (0.34 | ) | | | (0.31 | ) | |
| Net asset value, end of period | | $ | 10.97 | | | $ | 11.00 | | | $ | 10.69 | | | $ | 10.06 | | | $ | 10.62 | | |
| Total return | | | 2.41 | % | | | 5.68 | % | | | 9.43 | % | | | (2.18 | %) | | | 1.63 | % | |
| Ratios to average net assets(a) | |
| Expenses prior to fees waived or expenses reimbursed | | | 1.79 | % | | | 1.69 | % | | | 1.69 | % | | | 1.71 | % | | | 1.81 | % | |
| Net expenses after fees waived or expenses reimbursed(b) | | | 1.19 | %(c) | | | 1.20 | %(c) | | | 1.18 | %(c) | | | 1.15 | %(c) | | | 1.46 | %(c) | |
| Net investment income | | | 2.68 | %(c) | | | 2.68 | %(c) | | | 2.94 | %(c) | | | 3.20 | %(c) | | | 2.93 | %(c) | |
| Supplemental data | |
| Net assets, end of period (in thousands) | | $ | 7,172 | | | $ | 7,897 | | | $ | 8,047 | | | $ | 6,203 | | | $ | 4,993 | | |
| Portfolio turnover | | | 6 | % | | | 10 | % | | | 12 | % | | | 4 | % | | | 10 | % | |
| Notes to Financial Highlights | |
(a) In addition to the fees and expenses which the Fund bears directly, the Fund indirectly bears a pro rata share of the fees and expenses of the acquired funds in which it invests. Such indirect expenses are not included in the reported expense ratios.
(b) The Investment Manager and certain of its affiliates agreed to waive/reimburse certain fees and expenses, if applicable.
(c) The benefits derived from expense reductions had an impact of less than 0.01%.
The Accompanying Notes to Financial Statements are an integral part of this statement.
19
Financial Highlights (continued) – Columbia Connecticut Intermediate Municipal Bond Fund
| | | Year ended Oct. 31, | |
| | | 2011 | | 2010 | | 2009 | | 2008 | | 2007 | |
| Class T | |
| Per share data | |
| Net asset value, beginning of period | | $ | 11.00 | | | $ | 10.69 | | | $ | 10.06 | | | $ | 10.62 | | | $ | 10.76 | | |
| Income from investment operations: | |
| Net investment income | | | 0.34 | | | | 0.35 | | | | 0.36 | | | | 0.39 | | | | 0.37 | | |
| Net realized and unrealized gain (loss) | | | (0.03 | ) | | | 0.30 | | | | 0.63 | | | | (0.56 | ) | | | (0.15 | ) | |
| Total from investment operations | | | 0.31 | | | | 0.65 | | | | 0.99 | | | | (0.17 | ) | | | 0.22 | | |
| Less distributions to shareholders from: | |
| Net investment income | | | (0.34 | ) | | | (0.34 | ) | | | (0.36 | ) | | | (0.39 | ) | | | (0.36 | ) | |
| Total distributions to shareholders | | | (0.34 | ) | | | (0.34 | ) | | | (0.36 | ) | | | (0.39 | ) | | | (0.36 | ) | |
| Net asset value, end of period | | $ | 10.97 | | | $ | 11.00 | | | $ | 10.69 | | | $ | 10.06 | | | $ | 10.62 | | |
| Total return | | | 2.93 | % | | | 6.21 | % | | | 9.98 | % | | | (1.68 | %) | | | 2.14 | % | |
| Ratios to average net assets(a) | |
| Expenses prior to fees waived or expenses reimbursed | | | 0.94 | % | | | 0.84 | % | | | 0.84 | % | | | 0.86 | % | | | 0.96 | % | |
| Net expenses after fees waived or expenses reimbursed(b) | | | 0.69 | %(c) | | | 0.70 | %(c) | | | 0.68 | %(c) | | | 0.65 | %(c) | | | 0.96 | %(c) | |
| Net investment income | | | 3.18 | %(c) | | | 3.18 | %(c) | | | 3.46 | %(c) | | | 3.71 | %(c) | | | 3.43 | %(c) | |
| Supplemental data | |
| Net assets, end of period (in thousands) | | $ | 15,110 | | | $ | 16,603 | | | $ | 16,889 | | | $ | 17,461 | | | $ | 19,753 | | |
| Portfolio turnover | | | 6 | % | | | 10 | % | | | 12 | % | | | 4 | % | | | 10 | % | |
| Notes to Financial Highlights | |
(a) In addition to the fees and expenses which the Fund bears directly, the Fund indirectly bears a pro rata share of the fees and expenses of the acquired funds in which it invests. Such indirect expenses are not included in the reported expense ratios.
(b) The Investment Manager and certain of its affiliates agreed to waive/reimburse certain fees and expenses, if applicable.
(c) The benefits derived from expense reductions had an impact of less than 0.01%.
The Accompanying Notes to Financial Statements are an integral part of this statement.
20
Financial Highlights (continued) – Columbia Connecticut Intermediate Municipal Bond Fund
| | | Year ended Oct. 31, | |
| | | 2011 | | 2010 | | 2009 | | 2008 | | 2007 | |
| Class Z | |
| Per share data | |
| Net asset value, beginning of period | | $ | 11.00 | | | $ | 10.69 | | | $ | 10.06 | | | $ | 10.62 | | | $ | 10.76 | | |
| Income from investment operations: | |
| Net investment income | | | 0.36 | | | | 0.36 | | | | 0.38 | | | | 0.41 | | | | 0.38 | | |
| Net realized and unrealized gain (loss) | | | (0.03 | ) | | | 0.31 | | | | 0.63 | | | | (0.56 | ) | | | (0.14 | ) | |
| Total from investment operations | | | 0.33 | | | | 0.67 | | | | 1.01 | | | | (0.15 | ) | | | 0.24 | | |
| Less distributions to shareholders from: | |
| Net investment income | | | (0.36 | ) | | | (0.36 | ) | | | (0.38 | ) | | | (0.41 | ) | | | (0.38 | ) | |
| Total distributions to shareholders | | | (0.36 | ) | | | (0.36 | ) | | | (0.38 | ) | | | (0.41 | ) | | | (0.38 | ) | |
| Net asset value, end of period | | $ | 10.97 | | | $ | 11.00 | | | $ | 10.69 | | | $ | 10.06 | | | $ | 10.62 | | |
| Total return | | | 3.08 | % | | | 6.37 | % | | | 10.14 | % | | | (1.53 | %) | | | 2.29 | % | |
| Ratios to average net assets(a) | |
| Expenses prior to fees waived or expenses reimbursed | | | 0.79 | % | | | 0.69 | % | | | 0.69 | % | | | 0.71 | % | | | 0.81 | % | |
| Net expenses after fees waived or expenses reimbursed(b) | | | 0.54 | %(c) | | | 0.55 | %(c) | | | 0.53 | %(c) | | | 0.50 | %(c) | | | 0.81 | %(c) | |
| Net investment income | | | 3.33 | %(c) | | | 3.33 | %(c) | | | 3.60 | %(c) | | | 3.86 | %(c) | | | 3.58 | %(c) | |
| Supplemental data | |
| Net assets, end of period (in thousands) | | $ | 182,400 | | | $ | 209,384 | | | $ | 200,830 | | | $ | 169,072 | | | $ | 138,817 | | |
| Portfolio turnover | | | 6 | % | | | 10 | % | | | 12 | % | | | 4 | % | | | 10 | % | |
| Notes to Financial Highlights | |
(a) In addition to the fees and expenses which the Fund bears directly, the Fund indirectly bears a pro rata share of the fees and expenses of the acquired funds in which it invests. Such indirect expenses are not included in the reported expense ratios.
(b) The Investment Manager and certain of its affiliates agreed to waive/reimburse certain fees and expenses, if applicable.
(c) The benefits derived from expense reductions had an impact of less than 0.01%.
The Accompanying Notes to Financial Statements are an integral part of this statement.
21
Notes to Financial Statements – Columbia Connecticut Intermediate Municipal Bond Fund
October 31, 2011
Note 1. Organization
Columbia Connecticut Intermediate Municipal Bond Fund (the Fund), a series of Columbia Funds Series Trust I (the Trust), is a non-diversified fund. The Trust is registered under the Investment Company Act of 1940, as amended (the 1940 Act), as an open-end management investment company organized as a Massachusetts business trust.
Fund Shares
The Trust may issue an unlimited number of shares (without par value). The Fund offers Class A, Class B, Class C, Class T and Class Z shares. All share classes have identical voting, dividend and liquidation rights. Each share class has its own expense structure and sales charges, as applicable.
Class A shares are subject to a maximum front-end sales charge of 3.25% based on the initial investment amount. Class A shares purchased without an initial sales charge in accounts aggregating $1 million to $50 million at the time of purchase are subject to a contingent deferred sales charge (CDSC) if the shares are sold within 18 months of purchase, charged as follows: 1.00% CDSC if redeemed within 12 months of purchase, and 0.50% CDSC if redeemed more than 12, but less than 18, months after purchase.
Class B shares may be subject to a maximum CDSC of 3.00% based upon the holding period after purchase. Class B shares will generally convert to Class A shares eight years after purchase. The Fund no longer accepts investments by new or existing investors in the Fund's Class B shares, except in connection with the reinvestment of any dividend and/or capital gain distributions in Class B shares of the Fund and exchanges by existing Class B shareholders of certain other funds within the Columbia Family of Funds.
Class C shares are subject to a 1.00% CDSC on shares redeemed within one year of purchase.
Class T shares are subject to a maximum front-end sales charge of 4.75% based on the investment amount. Class T shares purchased without an initial sales charge in accounts aggregating $1 million to $50 million at the time of purchase are subject to a contingent deferred sales charge (CDSC) if the shares are sold within 18 months of purchase, charged as follows: 1.00% CDSC if redeemed within 12 months of purchase, and 0.50% CDSC if redeemed more than 12, but less than 18, months after purchase.
Class Z shares are not subject to sales charges, and are only available to certain investors, as described in the Fund's prospectus.
Note 2. Summary of Significant Accounting Policies
Use of Estimates
The preparation of financial statements in accordance with U.S. generally accepted accounting principles (GAAP) requires management to make certain estimates and assumptions that affect the reported amounts of assets and liabilities, the disclosure of contingent assets and liabilities at the date of the financial statements and the reported amounts of revenue and expenses during the reporting period. Actual results could differ from those estimates.
The following is a summary of significant accounting policies consistently followed by the Fund in the preparation of its financial statements.
Security Valuation
Debt securities generally are valued by pricing services approved by the Board of Trustees (the Board) based upon market transactions for normal, institutional-size trading units of similar securities. The services may use various pricing techniques which take into account appropriate factors such as yield, quality, coupon rate, maturity, type of issue, trading characteristics and other data, as well as broker quotes. Debt securities for which quotations are readily available may also be valued based upon an over-the-counter or exchange bid quotation.
Investments in other open-end investment companies, including money market funds, are valued at net asset value.
Short-term securities purchased within 60 days to maturity are valued at amortized cost, which approximates market value. The value of short-term securities originally purchased with maturities greater than 60 days is determined based on an amortized value to par upon reaching 60 days to maturity. Short-term securities maturing in more than 60 days from the valuation date are valued at the market price or approximate market value based on current interest rates.
Investments for which market quotations are not readily available, or that have quotations which management believes
22
Columbia Connecticut Intermediate Municipal Bond Fund, October 31, 2011
are not reliable, are valued at fair value as determined in good faith under consistently applied procedures established by and under the general supervision of the Board. If a security or class of securities (such as foreign securities) is valued at fair value, such value is likely to be different from the last quoted market price for the security. The determination of fair value often requires significant judgment. To determine fair value, management may use assumptions including but not limited to future cash flows and estimated risk premiums. Multiple inputs from various sources may be used to determine value.
Security Transactions
Security transactions are accounted for on the trade date. Cost is determined and gains (losses) are based upon the specific identification method for both financial statement and federal income tax purposes.
Income Recognition
Interest income is recorded on the accrual basis. Market premium and discount are amortized and accreted, respectively, on all debt securities, unless otherwise noted. Original issue discount is accreted to interest income over the life of the security with a corresponding increase in the cost basis, if any.
Dividend income is recorded on the ex-dividend date.
Expenses
General expenses of the Trust are allocated to the Fund and other funds of the Trust based upon relative net assets or other expense allocation methodologies determined by the nature of the expense. Expenses directly attributable to the Fund are charged to the Fund. Expenses directly attributable to a specific class of shares are charged to that share class.
Determination of Class Net Asset Value
All income, expenses (other than class-specific expenses, which are charged to that share class, as shown in the Statement of Operations) and realized and unrealized gains (losses) are allocated to each class of the Fund on a daily basis for purposes of determining the net asset value of each class. Income and expenses are allocated to each class based on the settled shares method, while realized and unrealized gains (losses) are allocated based on the relative net assets of each class.
Federal Income Tax Status
The Fund intends to qualify each year as a regulated investment company under Subchapter M of the Internal Revenue Code, as amended, and will distribute substantially all of its tax exempt or taxable income (including net short-term capital gains), if any, for its tax year, and as such will not be subject to federal income taxes. In addition, the Fund intends to distribute in each calendar year substantially all of its net investment income, capital gains and certain other amounts, if any, such that the Fund should not be subject to federal excise tax. Therefore, no federal income or excise tax provision is recorded.
Distributions to Shareholders
Distributions from net investment income are declared daily and paid monthly. Net realized capital gains, if any, are distributed at least annually. Income distributions and capital gain distributions are determined in accordance with federal income tax regulations which may differ from GAAP.
Guarantees and Indemnifications
Under the Trust's organizational documents and, in some cases, by contract, its officers and trustees are indemnified against certain liabilities arising out of the performance of their duties to the Trust or its funds. In addition, certain of the Fund's contracts with its service providers contain general indemnification clauses. The Fund's maximum exposure under these arrangements is unknown since the amount of any future claims that may be made against the Fund cannot be determined, and the Fund has no historical basis for predicting the likelihood of any such claims.
Recent Accounting Pronouncement
Fair Value Measurements and Disclosures
In May 2011, the Financial Accounting and Standards Board issued ASU No. 2011-04 modifying Topic 820, Fair Value Measurements and Disclosures. At the same time, the International Accounting Standards Board issued International Financial Reporting Standard 13, Fair Value Measurement. The objective of the FASB and IASB is convergence of their guidance on fair value measurements and disclosures.
23
Columbia Connecticut Intermediate Municipal Bond Fund, October 31, 2011
Specifically, ASU No. 2011-04 requires reporting entities to disclose i) the amounts of any transfers between Level 1 and Level 2, and the reasons for the transfers, ii) for Level 3 fair value measurements, a) quantitative information about significant unobservable inputs used, b) a description of the valuation processes used by the reporting entity and c) a narrative description of the sensitivity of the fair value measurement to changes in unobservable inputs if a change in those inputs might result in a significantly higher or lower fair value measurement. The effective date of ASU No. 2011-04 is for interim and annual periods beginning after December 15, 2011. At this time, management is evaluating the implications of this guidance and the impact it will have on the financial statement amounts and footnote disclosures, if any.
Note 3. Fees and Compensation Paid to Affiliates
Investment Management Fees
Under an Investment Management Services Agreement (IMSA), Columbia Management Investment Advisers, LLC (the Investment Manager), a wholly-owned subsidiary of Ameriprise Financial, Inc. (Ameriprise Financial), determines which securities will be purchased, held or sold. Effective March 1, 2011, the management fee is an annual fee that is equal to a percentage of the Fund's average daily net assets that declines from 0.40% to 0.27% as the Fund's net assets increase. Prior to March 1, 2011, the management fee was equal to a percentage of the Fund's average daily net assets that declined from 0.48% to 0.35% as the Fund's net assets increased. The effective management fee rate for the year ended October 31, 2011 was 0.43% of the Fund's average daily net assets.
Administration Fees
Under an Administrative Services Agreement, the Investment Manager serves as the Fund Administrator. Effective March 1, 2011, the Fund pays the Fund Administrator an annual fee for administration and accounting services equal to a percentage of the Fund's average daily net assets that declines from 0.07% to 0.04% as the Fund's net assets increase. Prior to March 1, 2011, the administration fee was equal to the annual rate of 0.067% of the Fund's average daily net assets. The effective administration fee rate for the year ended October 31, 2011 was 0.07% of the Fund's average daily net assets.
Pricing and Bookkeeping Fees
Prior to May 16, 2011, the Fund had entered into a Financial Reporting Services Agreement (the Financial Reporting Services Agreement) with State Street Bank and Trust Company (State Street) and the Investment Manager pursuant to which State Street provided financial reporting services to the Fund. The Fund also entered into an Accounting Services Agreement (collectively with the Financial Reporting Services Agreement, the State Street Agreements) with State Street and the Investment Manager pursuant to which State Street provided accounting services to the Fund. Under the State Street Agreements, the Fund paid State Street an annual fee of $38,000 paid monthly plus an additional monthly fee based on an annualized percentage rate of average daily net assets of the Fund for the month. The aggregate fee did not exceed $140,000 per year (exclusive of out-of-pocket expenses and charges). The Fund also reimbursed State Street for certain out-of-pocket expenses and charges. Effective May 16, 2011, these services are now provided under the Administrative Services Agreement discussed above.
Compensation of Board Members
Board members are compensated for their services to the Fund as disclosed in the Statement of Operations. The Trust's eligible Trustees may participate in a Deferred Compensation Plan (the Plan) which may be terminated at any time. Obligation of the Plan will be paid solely out of the Fund's assets.
Compensation of Chief Compliance Officer
The Board has appointed a Chief Compliance Officer to the Fund in accordance with federal securities regulations. The Fund, along with other affiliated funds, pays its pro-rata share of the expenses associated with the Chief Compliance Officer. The Fund's expenses for the Chief Compliance Officer will not exceed $15,000 per year.
Transfer Agent Fees
Under a Transfer and Dividend Disbursing Agent Agreement, Columbia Management Investment Services Corp. (the Transfer Agent), an affiliate of the Investment Manager and a wholly-owned subsidiary of Ameriprise Financial, is responsible for providing transfer agency services to the Fund. The Transfer Agent has contracted with Boston Financial Data Services (BFDS) to serve as sub-transfer agent.
24
Columbia Connecticut Intermediate Municipal Bond Fund, October 31, 2011
The Transfer Agent receives monthly account-based service fees based on the number of open accounts and is reimbursed by the Fund for the fees and expenses the Transfer Agent pays to financial intermediaries that maintain omnibus accounts with the Fund that is a percentage of the average aggregate value of the Fund's shares maintained in each such omnibus account (other than omnibus accounts for which American Enterprise Investment Services Inc. is the broker of record or accounts where the beneficial shareholder is a customer of Ameriprise Financial Services, Inc., which are paid a per account fee). The Transfer Agent pays the fees of BFDS for services as sub-transfer agent and is not entitled to reimbursement for such fees from the Fund (with the exception of out-of-pocket fees).
The Transfer Agent also receives compensation from fees for various shareholder services and reimbursements for certain out-of-pocket expenses.
For the year ended October 31, 2011, the Fund's effective transfer agent fee rates as a percentage of average daily net assets of each class were as follows:
| Class A | | | 0.15 | % | |
| Class B | | | 0.19 | | |
| Class C | | | 0.15 | | |
| Class T | | | 0.16 | | |
| Class Z | | | 0.15 | | |
An annual minimum account balance fee of $20 may apply to certain accounts with a value below the Fund's initial minimum investment requirements to reduce the impact of small accounts on transfer agent fees. These minimum account balance fees are recorded as part of expense reductions in the Statement of Operations. For the year ended October 31, 2011, these minimum account balance fees reduced total expenses by $100.
Distribution and Service Fees
The Fund has an agreement with Columbia Management Investment Distributors, Inc. (the Distributor), an affiliate of the Investment Manager and a wholly-owned subsidiary of Ameriprise Financial, for distribution and shareholder services. Pursuant to Rule 12b-1 under the 1940 Act, the Board has approved, and the Fund has adopted, distribution and shareholder service plans (the Plans) which set the distribution and service fees for the Fund. These fees are calculated daily and are intended to compensate the Distributor and/or eligible selling and/or servicing agents for selling shares of the Fund and providing services to investors.
The Plans require the payment of a monthly service fee to the Distributor at the maximum annual rate of 0.25% of the average daily net assets attributable to Class A, Class B and Class C shares of the Fund. The Plans also require the payment of a monthly distribution fee to the Distributor at the maximum annual rate of 0.75% of the average daily net assets attributable to Class B and Class C shares only.
The Distributor has voluntarily agreed to waive a portion of the distribution fee for Class C shares so that the combined distribution and service fee does not exceed 0.65% annually of the average daily net assets attributable to Class C shares. This arrangement may be modified or terminated by the Distributor at any time.
Shareholder Services Fees
The Fund has adopted a shareholder services plan that permits it to pay for certain services provided to Class T shareholders by their selling and/or servicing agents. The Fund may pay shareholder servicing fees up to an aggregate annual rate of 0.40% of the Fund's average daily net assets attributable to Class T shares (comprised of up to 0.20% for shareholder liaison services and up to 0.20% for administrative support services). These fees are currently limited to an aggregate annual rate of not more than 0.15% of the Fund's average daily net assets attributable to Class T shares. In addition, the servicing fee for Class T shares will be waived by selling and/or servicing agents to the extent necessary to prevent the net investment income for the Class T shares from falling below 0.00% on a daily basis. The shareholder services fee for the year ended October 31, 2011 was 0.15% of the Fund's average daily net assets attributable to Class T shares.
Sales Charges
Sales charges, including front-end charges and CDSCs, received by the Distributor for distributing Fund shares were $9,598 for Class A and $76 for Class B shares for the year ended October 31, 2011.
25
Columbia Connecticut Intermediate Municipal Bond Fund, October 31, 2011
Expenses Waived/Reimbursed by the Investment Manager and its Affiliates
Effective March 1, 2011, the Investment Manager and certain of its affiliates have contractually agreed to waive fees and/or reimburse expenses (excluding certain fees and expenses described below), through February 29, 2012, unless sooner terminated at the sole discretion of the Board, so that the Fund's net operating expenses, after giving effect to fees waived/expenses reimbursed and any balance credits and/or overdraft charges from the Fund's custodian, do not exceed the following annual rates as a percentage of the class' average daily net assets:
| Class A | | | 0.79 | % | |
| Class B | | | 1.54 | | |
| Class C | | | 1.54 | | |
| Class T | | | 0.69 | | |
| Class Z | | | 0.54 | | |
Under the agreement, the following fees and expenses are excluded from the waiver/reimbursement commitment, and therefore will be paid by the Fund, if applicable: taxes (including foreign transaction taxes), expenses associated with investments in affiliated and non-affiliated pooled investment vehicles (including mutual funds and exchange traded funds), transaction costs and brokerage commissions, costs related to any securities lending program, dividend expenses associated with securities sold short, inverse floater program fees and expenses, transaction charges and interest on borrowed money, interest, extraordinary expenses and any other expenses the exclusion of which is specifically approved by the Fund's Board. This agreement may be modified or amended only with approval from all parties. Class C distribution fees waived by the Distributor, as discussed above, are in addition to the waiver/reimbursement commitment under the agreement.
Prior to March 1, 2011, the Investment Manager voluntarily agreed to reimburse a portion of the Fund's expenses (excluding certain expenses, such as distribution and services fees, brokerage commissions, interest, taxes and extraordinary expenses, but including custodian charges relating to overdrafts, if any) so that the Fund's ordinary net operating expenses, after giving effect to fees waived/expenses reimbursed and any balance credits and/or overdraft charges from the Fund's custodian, did not exceed 0.55% of the Fund's average daily net assets on an annualized basis.
Note 4. Federal Tax Information
The timing and character of income and capital gain distributions are determined in accordance with income tax regulations, which may differ from GAAP because of temporary or permanent book to tax differences.
For the year ended October 31, 2011, permanent differences are primarily due to differing treatments for discount accretion and/or premium amortization on debt securities. In the Statement of Assets and Liabilities the following reclassifications were made among the components of the Fund's net assets due to permanent differences:
| Undistributed net investment income | | $ | (7,856 | ) | |
| Accumulated net realized gain | | | 7,389 | | |
| Paid-in capital | | | 467 | | |
Net investment income and net realized gains (losses), as disclosed in the Statement of Operations, and net assets were not affected by this reclassification.
The tax character of distributions paid during the years indicated was as follows:
| Year ended October 31, | | 2011 | | 2010 | |
| Tax-Exempt Income | | $ | 7,224,486 | | | $ | 8,065,425 | | |
| Ordinary Income* | | | — | | | | — | | |
| Long-Term Capital Gains | | | — | | | | — | | |
* For tax purposes short-term capital gain distributions, if any, are considered ordinary income distributions.
26
Columbia Connecticut Intermediate Municipal Bond Fund, October 31, 2011
At October 31, 2011, the components of distributable earnings on a tax basis were as follows:
| Undistributed Tax-Exempt Income | | $ | 723,521 | | |
| Undistributed Ordinary Income | | | — | | |
| Undistributed Long-Term Capital Gains | | | 122,275 | | |
| Net Unrealized Appreciation* | | | 10,919,807 | | |
* The differences between book-basis and tax-basis net unrealized appreciation are primarily due to discount accretion and/or premium amortization on debt securities.
At October 31, 2011, the cost of investments for federal income tax purposes was $201,157,199 and the aggregate gross unrealized appreciation and depreciation based on that cost was:
| Unrealized appreciation | | $ | 10,960,933 | | |
| Unrealized depreciation | | | (41,126 | ) | |
| Net unrealized appreciation | | | 10,919,807 | | |
On December 22, 2010, the Regulated Investment Company Modernization Act of 2010 (the Act) was enacted, which changed various technical rules governing the tax treatment of regulated investment companies. The changes are generally effective for taxable years beginning after the date of enactment. Under the Act, the Fund will be permitted to carry forward capital losses incurred in taxable years beginning after the date of enactment for an unlimited period. However, any losses incurred during those future taxable years will be required to be utilized prior to the losses incurred in pre-enactment taxable years, which carry an expiration date. As a result of this ordering rule, pre-enactment capital loss carryforwards may be more likely to expire unused.
For the year ended October 31, 2011, $671,353 of capital loss carryforward was utilized.
Management of the Fund has concluded that there are no significant uncertain tax positions that would require recognition in the financial statements. However, management's conclusion may be subject to review and adjustment at a later date based on factors including, but not limited to, new tax laws, regulations, and administrative interpretations (including relevant court decisions). Generally, the Fund's federal tax returns for the prior three fiscal years remain subject to examination by the Internal Revenue Service.
Note 5. Portfolio Information
The cost of purchases and proceeds from sales of securities, excluding short-term obligations, aggregated to $13,899,064 and $52,279,796, respectively, for the year ended October 31, 2011.
Note 6. Lending of Portfolio Securities
Effective May 16, 2011, the Fund has entered into a Master Securities Lending Agreement (the Agreement) with JPMorgan Chase Bank, N.A. (JPMorgan). The Agreement, which replaces the previous security lending arrangement with State Street, authorizes JPMorgan as lending agent to lend securities to authorized borrowers in order to generate additional income on behalf of the Fund. Pursuant to the Agreement, the securities loaned are secured by cash or U.S. government securities equal to at least 100% of the market value of the loaned securities. Any additional collateral required to maintain those levels due to market fluctuations of the loaned securities is delivered the following business day. Cash collateral received is invested by the lending agent on behalf of the Fund into authorized investments pursuant to the Agreement. The investments made with the cash collateral are listed in the Portfolio of Investments. The values of such investments and any uninvested cash collateral are disclosed in the Statement of Assets and Liabilities along with the related obligation to return the collateral upon the return of the securities loaned.
For the year ended October 31, 2011, the Fund did not participate in securities lending activity.
Risks of delay in recovery of securities or even loss of rights in the securities may occur should the borrower of the securities fail financially. Risks may also arise to the extent that the value of the securities loaned increases above the value of the collateral received. JPMorgan will indemnify the Fund from losses resulting from a borrower's failure to return a loaned security when due. Such indemnification does not extend to losses associated with declines in the value of cash collateral investments. The Investment Manager is not responsible for any losses incurred by the Fund in connection with the securities lending program. Loans are subject to
27
Columbia Connecticut Intermediate Municipal Bond Fund, October 31, 2011
termination by the Fund or the borrower at any time, and are, therefore, not considered to be illiquid investments.
Pursuant to the Agreement, the Fund receives income for lending its securities either in the form of fees or by earning interest on invested cash collateral, net of negotiated rebates paid to borrowers and fees paid to the lending agent for services provided and any other securities lending expenses.
Prior to May 16, 2011, the Fund participated in a securities lending arrangement with State Street. Each security on loan was collateralized in an amount at least equal to the market value of the securities loaned plus accrued income from the investment of collateral. The income generated by the investment of the collateral, net of any fees remitted to State Street as the lending agent and borrower rebates, was paid to the Fund.
Note 7. Custody Credits
Prior to May 16, 2011, the Fund had an agreement with its custodian bank under which custody fees may have been reduced by balance credits. These credits are recorded as part of expense reductions on the Statement of Operations. The Fund could have invested a portion of the assets utilized in connection with the expense offset arrangement in an income-producing asset if they had not entered into such an agreement. For the period November 1, 2010 through May 16, 2011, these credits reduced total expenses by $48.
Note 8. Shareholder Concentration
At October 31, 2011, one shareholder account owned 86.0% of the outstanding shares of the Fund. Subscription and redemption activity of this account may have a significant effect on the operations of the Fund.
Note 9. Line of Credit
The Fund has entered into a revolving credit facility with a syndicate of banks led by JPMorgan Chase Bank, N.A. (the Administrative Agent), whereby the Fund may borrow for the temporary funding of shareholder redemptions or for other temporary or emergency purposes. The credit facility became effective on May 16, 2011, replacing a prior credit facility. The credit facility agreement which is a collective agreement between the Fund and certain other funds managed by the Investment Manager, severally and not jointly, permits collective borrowings up to $500,000,000.
Interest is charged to each participating fund based on its borrowings at a rate equal to the sum of the federal funds rate plus (i) 1.25% per annum plus (ii) if one-month LIBOR exceeds the federal funds rate, the amount of such excess. Each borrowing under the credit facility matures no later than 60 days after the date of borrowing. The Fund also pays a commitment fee equal to its pro rata share of the amount of the credit facility at a rate of 0.10% per annum.
For the period March 28, 2011 through May 15, 2011, the Fund and certain other funds managed by the Investment Manager participated in a $225,000,000 committed, unsecured revolving credit facility provided by State Street. Prior to March 28, 2011, the collective borrowing amount of the credit facility was $280,000,000. Interest was charged to each fund based on its borrowings at a rate equal to the greater of the (i) federal funds rate plus 1.25% per annum or (ii) the overnight LIBOR rate plus 1.25% per annum. The Fund also paid a commitment fee equal to its pro rata share of the amount of the credit facility at a rate of 0.125% per annum.
The Fund had no borrowings during the year ended October 31, 2011.
Effective December 13, 2011, the Fund extended its revolving credit facility with the Administrative Agent. The credit facility agreement, as amended, permits collective borrowings up to $500 million. Effective December 13, 2011, interest is charged to each participating fund based on its borrowings at a rate equal to the higher of (i) the overnight federal funds rate plus 1.00% or (i) the one-month LIBOR rate plus 1.00%. Each borrowing under the credit facility matures no later than 60 days after the date of borrowing. The Fund also pays a commitment fee equal to its pro rata share of the amount of the credit facility at a rate of 0.08% per annum.
Note 10. Significant Risks
Non-Diversification Risk
A non-diversified fund is permitted to invest a greater percentage of its total assets in fewer issuers than a diversified fund. The Fund may, therefore, have a greater risk of loss from a few issuers than a similar fund that invests more broadly.
28
Columbia Connecticut Intermediate Municipal Bond Fund, October 31, 2011
Geographic Concentration Risk
Because state-specific tax-exempt funds invest primarily in the municipal securities issued by the state and political sub-divisions of the state, the Fund will be particularly affected by political and economic conditions and developments in the state in which it invests. The Fund may, therefore, have a greater risk than that of a municipal bond fund which is more geographically diversified. The value of the municipal securities owned by the Fund also may be adversely affected by future changes in federal or state income tax laws.
Tax Development Risk
The Fund purchases municipal securities whose interest, in the opinion of bond counsel, is free from federal income tax. There is no assurance that the Internal Revenue Service (IRS) will agree with this opinion. In the event the IRS determines that an issuer does not comply with relevant tax requirements, interest payments from a security could become federally taxable, possibly retroactively to the date the security was issued. As a shareholder of the Fund, you may be required to file an amended tax return as a result.
Note 11. Subsequent Events
Management has evaluated the events and transactions that have occurred through the date the financial statements were issued. Other than as noted in Note 9 above, there were no items requiring adjustment of the financial statements or additional disclosure.
Note 12. Information Regarding Pending and Settled Legal Proceedings
In June 2004, an action captioned John E. Gallus et al. v. American Express Financial Corp. and American Express Financial Advisors Inc. was filed in the United States District Court for the District of Arizona. The plaintiffs allege that they are investors in several American Express Company mutual funds (branded as Columbia) and they purport to bring the action derivatively on behalf of those funds under the Investment Company Act of 1940. The plaintiffs allege that fees allegedly paid to the defendants by the funds for investment advisory and administrative services are excessive. The plaintiffs seek remedies including restitution and rescission of investment advisory and distribution agreements. The plaintiffs voluntarily agreed to transfer this case to the United States District Court for the District of Minnesota (the District Court). In response to defendants' motion to dismiss the complaint, the District Court dismissed one of plaintiffs' four claims and granted plaintiffs limited discovery. Defendants moved for summary judgment in April 2007. Summary judgment was granted in the defendants' favor on July 9, 2007. The plaintiffs filed a notice of appeal with the Eighth Circuit Court of Appeals (the Eighth Circuit) on August 8, 2007. On April 8, 2009, the Eighth Circuit reversed summary judgment and remanded to the District Court for further proceedings. On August 6, 2009, defendants filed a writ of certiorari with the U.S. Supreme Court (the Supreme Court), asking the Supreme Court to stay the District Court proceedings while the Supreme Court considers and rules in a case captioned Jones v. Harris Associates, which involves issues of law similar to those presented in the Gallus case. On March 30, 2010, the Supreme Court issued its ruling in Jones v. Harris Associates, and on April 5, 2010, the Supreme Court vacated the Eighth Circuit's decision in the Gallus case and remanded the case to the Eighth Circuit for further consideration in light of the Supreme Court's decision in Jones v. Harris Associates. On June 4, 2010, the Eighth Circuit remanded the Gallus case to the District Court for further consideration in light of the Supreme Court's decision in Jones v. Harris Associates. On December 9, 2010, the District Court reinstated its July 9, 2007 summary judgment order in favor of the defendants. On January 10, 2011, plaintiffs filed a notice of appeal with the Eighth Circuit. In response to the plaintiffs' opening appellate brief filed on March 18, 2011, the defendants filed a response brief on May 4, 2011 with the Eighth Circuit. The plaintiffs filed a reply brief on May 26, 2011 and oral arguments took place on November 17, 2011.
In December 2005, without admitting or denying the allegations, American Express Financial Corporation (AEFC, which is now known as Ameriprise Financial, Inc. (Ameriprise Financial)), entered into settlement agreements with the Securities and Exchange Commission (SEC) and Minnesota Department of Commerce (MDOC) related to market timing activities. As a result, AEFC was censured and ordered to cease and desist from committing or causing any violations of certain provisions of the Investment Advisers Act of 1940, the Investment Company Act of 1940, and various Minnesota laws. AEFC agreed to pay disgorgement of $10 million and civil money penalties of $7 million. AEFC also agreed to retain an
29
Columbia Connecticut Intermediate Municipal Bond Fund, October 31, 2011
independent distribution consultant to assist in developing a plan for distribution of all disgorgement and civil penalties ordered by the SEC in accordance with various undertakings detailed at www.sec.gov/litigation/admin/ia-2451.pdf. Ameriprise Financial and its affiliates have cooperated with the SEC and the MDOC in these legal proceedings, and have made regular reports to the funds' Boards of Trustees.
Ameriprise Financial and certain of its affiliates have historically been involved in a number of legal, arbitration and regulatory proceedings, including routine litigation, class actions, and governmental actions, concerning matters arising in connection with the conduct of their business activities. Ameriprise Financial believes that the Funds are not currently the subject of, and that neither Ameriprise Financial nor any of its affiliates are the subject of, any pending legal, arbitration or regulatory proceedings that are likely to have a material adverse effect on the Funds or the ability of Ameriprise Financial or its affiliates to perform under their contracts with the Funds. Ameriprise Financial is required to make 10-Q, 10-K and, as necessary, 8-K filings with the Securities and Exchange Commission on legal and regulatory matters that relate to Ameriprise Financial and its affiliates. Copies of these filings may be obtained by accessing the SEC website at www.sec.gov.
There can be no assurance that these matters, or the adverse publicity associated with them, will not result in increased fund redemptions, reduced sale of fund shares or other adverse consequences to the Funds. Further, although we believe proceedings are not likely to have a material adverse effect on the Funds or the ability of Ameriprise Financial or its affiliates to perform under their contracts with the Funds, these proceedings are subject to uncertainties and, as such, we are unable to estimate the possible loss or range of loss that may result. An adverse outcome in one or more of these proceedings could result in adverse judgments, settlements, fines, penalties or other relief that could have a material adverse effect on the consolidated financial condition or results of operations of Ameriprise Financial.
30
Report of Independent Registered Public Accounting Firm
To the Trustees of Columbia Funds Series Trust I and the Shareholders of Columbia Connecticut Intermediate Municipal Bond Fund
In our opinion, the accompanying statement of assets and liabilities, including the investment portfolio, and the related statements of operations and of changes in net assets and the financial highlights present fairly, in all material respects, the financial position of Columbia Connecticut Intermediate Municipal Bond Fund (the "Fund") (a series of Columbia Funds Series Trust I) at October 31, 2011, and the results of its operations for the year then ended, the changes in its net assets for each of the two years in the period then ended and the financial highlights for each of the periods indicated, in conformity with accounting principles generally accepted in the United States of America. These financial statements and financial highlights (hereafter referred to as "financial statements") are the responsibility of the Fund's management. Our responsibility is to express an opinion on these financial statements based on our audits. We conducted our audits of these financial statements in accordance with the standards of the Public Company Accounting Oversight Board (United States). Those standards require that we plan and perform the audit to obtain reasonable assurance about whether the financial statements are free of material misstatement. An audit includes examining, on a test basis, evidence supporting the amounts and disclosures in the financial statements, assessing the accounting principles used and significant estimates made by management, and evaluating the overall financial statement presentation. We believe that our audits, which included confirmation of securities at October 31, 2011 by correspondence with the custodian and brokers, provide a reasonable basis for our opinion.
PricewaterhouseCoopers LLP
Minneapolis, Minnesota
December 22, 2011
31
Federal Income Tax Information (Unaudited) – Columbia Connecticut Intermediate Municipal Bond Fund
The Fund hereby designates as a capital gain dividend with respect to the fiscal year ended October 31, 2011, $128,389, or, if subsequently determined to be different, the net capital gain of such year.
For the fiscal year ended October 31, 2011, 100.0% of the distributions from net investment income of the Fund qualifies as exempt interest dividends for federal income tax purposes. A portion of the income may be subject to federal alternative minimum tax.
The Fund will notify shareholders in January 2012 of amounts for use in preparing 2011 income tax returns.
32
Fund Governance
The Trustees serve terms of indefinite duration. The names, addresses and birth years of the Trustees and Officers of the Funds in Columbia Funds Series Trust I, the year each was first elected or appointed to office, their principal business occupations during at least the last five years, the number of Funds overseen by each Trustee and other directorships they hold are shown below. Each officer listed below serves as an officer of each Fund in Columbia Funds Series Trust I.
Independent Trustees
Name, Address and Year of Birth,
Position with Funds, Year First
Elected or Appointed to Office | | Principal Occupation(s) During Past Five Years, Number of Funds in Columbia
Funds Complex Overseen by Trustee, Other Directorships Held
| |
| Rodman L. Drake (Born 1943) | |
|
c/o Columbia Management
Investment Advisers, LLC
225 Franklin Street
Boston, MA 02110
Trustee (since 1994) and Chairman of the Board (since 2009) | | Independent consultant since 2010; Co-Founder of Baringo Capital LLC (private equity) from 1997 to 2008; CEO of Crystal River Capital, Inc. (real estate investment trust) from 2003 to 2010; Oversees 43; Jackson Hewitt Tax Service Inc. (tax preparation services from 2004 to 2011); Celgene Corporation (global biotechnology company); Student Loan Corporation (student loan provider from 2008 to 2010); Celgene Corporation (global biotechnology company); The Helios Funds and Brookfield Funds (closed-end funds); Crystal River Capital, Inc. from 2005 to 2010; Parson Brinckerhoff from 1995 to 2008; and Apex Silver Mines Ltd. from 2007 to 2009 | |
|
| Douglas A. Hacker (Born 1955) | |
|
c/o Columbia Management
Investment Advisers, LLC
225 Franklin Street
Boston, MA 02110
Trustee (since 1996) | | Independent business executive since May 2006; Executive Vice President—Strategy of United Airlines from December 2002 to May 2006; President of UAL Loyalty Services (airline marketing company) from September 2001 to December 2002; Executive Vice President and Chief Financial Officer of United Airlines from July 1999 to September 2001. Oversees 43; Nash Finch Company (food distributor); Aircastle Limited (aircraft leasing); and SeaCube Container Leasing Ltd (container leasing) | |
|
| Janet Langford Kelly (Born 1957) | |
|
c/o Columbia Management
Investment Advisers, LLC
225 Franklin Street
Boston, MA 02110
Trustee (since 1996) | | Senior Vice President, General Counsel and Corporate Secretary, ConocoPhillips (integrated energy company) since September 2007; Deputy General Counsel—Corporate Legal Services, ConocoPhillips from August 2006 to August 2007; Partner, Zelle, Hofmann, Voelbel, Mason & Gette LLP (law firm) from March 2005 to July 2006; Adjunct Professor of Law, Northwestern University, from September 2004 to June 2006; Director, UAL Corporation (airline) from February 2006 to July 2006; Oversees 43; None | |
|
| Nancy T. Lukitsh (Born 1956) | |
|
c/o Columbia Management
Investment Advisers, LLC
225 Franklin Street
Boston, MA 02110
Trustee (since 2011) | | Senior Vice President, Partner and Director, Marketing of Wellington Management Company, LLP (investment adviser) from 1997 to 2010; Chair, Wellington Management Investment Portfolios (commingled non-U.S. investment pools) from 2007 to 2010; Director, Wellington Trust Company, NA and other Wellington affiliates from 1997 to 2010. Oversees 43; None | |
|
33
Fund Governance (continued)
Independent Trustees (continued)
Name, Address and Year of Birth,
Position with Funds, Year First
Elected or Appointed to Office | | Principal Occupation(s) During Past Five Years, Number of Funds in Columbia
Funds Complex Overseen by Trustee, Other Directorships Held
| |
| William E. Mayer (Born 1940) | |
|
c/o Columbia Management
Investment Advisers, LLC
225 Franklin Street
Boston, MA 02110
Trustee (since 1994) | | Partner, Park Avenue Equity Partners (private equity) since February 1999; Dean and Professor, College of Business and Management, University of Maryland from 1992 to 1996. Oversees 43; DynaVox Inc. (speech creation); Lee Enterprises (print media); WR Hambrecht + Co. (financial service provider); BlackRock Kelso Capital Corporation (investment company) | |
|
| David M. Moffett (Born 1952) | |
|
c/o Columbia Management
Investment Advisers, LLC
225 Franklin Street
Boston, MA 02110
Trustee (since 2011) | | Retired. Chief Executive Officer, Federal Home Loan Mortgage Corporation, from 2008 to 2009; Senior Adviser, Global Financial Services Group, Carlyle Group, Inc., from 2007 to 2008; Vice Chairman and Chief Financial Officer, U.S. Bancorp, from 1993 to 2007. Oversees 43; CIT Group Inc. (commercial and consumer finance), eBay Inc. (online trading community), MBIA Corp (financial service provider), E.W. Scripps Co. (print and television media), Building Materials Holding Corp. (building materials and construction services), and University of Oklahoma Foundation. | |
|
| Charles R. Nelson (Born 1942) | |
|
c/o Columbia Management
Investment Advisers, LLC
225 Franklin Street
Boston, MA 02110
Trustee (since 1981) | | Retired Professor Emeritus, University of Washington, since 2011; Professor of Economics, University of Washington, from January 1976 to 2011; Ford and Louisa Van Voorhis Professor of Political Economy, University of Washington, from 1993 to 2011; Adjunct Professor of Statistics, University of Washington, from 1980 to 2011; Associate Editor, Journal of Money Credit and Banking from 1993 to 2008; consultant on econometric and statistical matters. Oversees 43; None | |
|
| John J. Neuhauser (Born 1943) | |
|
c/o Columbia Management
Investment Advisers, LLC
225 Franklin Street
Boston, MA 02110
Trustee (since 1984) | | President, Saint Michael's College, since August 2007; Director or Trustee of several non-profit organizations, including Fletcher Allen Health Care, Inc.; University Professor, Boston College from November 2005 to August 2007; Academic Vice President and Dean of Faculties, Boston College from August 1999 to October 2005. Oversees 43; Liberty All-Star Equity Fund and Liberty All-Star Growth Fund (closed-end funds) | |
|
| Patrick J. Simpson (Born 1944) | |
|
c/o Columbia Management
Investment Advisers, LLC
225 Franklin Street
Boston, MA 02110
Trustee (since 2000) | | Partner, Perkins Coie LLP (law firm). Oversees 43; None | |
|
| Anne-Lee Verville (Born 1945) | |
|
c/o Columbia Management
Investment Advisers, LLC
225 Franklin Street
Boston, MA 02110
Trustee (since 1998) | | Retired since 1997 (formerly General Manager–Global Education Industry from 1994 to 1997, President–Application Systems Division from 1991 to 1994, Chief Financial Officer–US Marketing & Services from 1988 to 1991, and Chief Information Officer from 1987 to 1988, IBM Corporation (computer and technology)). Oversees 43; Enesco Group, Inc. (producer of giftware and home and garden decor products) from 2001 to 2006 | |
|
34
Fund Governance (continued)
Interested Trustee
Name, Address and Year of Birth,
Position with Funds, Year First
Elected or Appointed to Office | | Principal Occupation(s) During Past Five Years, Number of Funds in Columbia
Funds Complex Overseen by Trustee, Other Directorships Held
| |
| Michael A. Jones (born 1959) | |
|
c/o Columbia Management
Investment Advisers, LLC
225 Franklin Street
Boston, MA 02110
Trustee (since 2011)
Senior Vice President (since 2011) | | President and Director, Columbia Management Investment Advisers, LLC since May 2010; President and Director, Columbia Management Investment Distributors, Inc. since May 2010; Manager, Chairman, Chief Executive Officer and President, Columbia Management Advisors, LLC from 2007 to April 2010; Chief Executive Officer, President and Director, Columbia Management Distributors, Inc. from November 2006 to April 2010; previously, co-president and senior managing director at Robeco Investment Management. Oversees 43; None | |
|
The Statement of Additional Information includes additional information about the Trustees of the Funds and is available, without charge, upon request by calling 1-800-345-6611.
Officers
| Name, Year of Birth and Address | | Principal Occupation(s) During the Past Five Years | |
| J. Kevin Connaughton (Born 1964) | |
|
225 Franklin Street
Boston, MA 02110
President (since 2009) | | Senior Vice President and General Manager–Mutual Fund Products, Columbia Management Investment Advisers, LLC since May 2010; President, Columbia Funds, since 2009, and RiverSource Funds, since May 2010 (previously Senior Vice President and Chief Financial Officer, Columbia Funds, from June 2008 to January 2009, Treasurer, Columbia Funds, from October 2003 to May 2008, and senior officer of various other affiliated funds since 2000); Managing Director, Columbia Management Advisors, LLC from December 2004 to April 2010. | |
|
| Michael G. Clarke (Born 1969) | |
|
225 Franklin Street
Boston, MA 02110
Treasurer (since 2011) and Chief
Financial Officer (since 2009) | | Vice President, Columbia Management Investment Advisers, LLC since May 2010; Managing Director of Fund Administration, Columbia Management Advisors, LLC, from September 2004 to April 2010; senior officer of Columbia Funds and affiliated funds since 2002. | |
|
| Scott R. Plummer (Born 1959) | |
|
5228 Ameriprise Financial Center
Minneapolis, MN 55474
Senior Vice President, Assistant Secretary
and Chief Legal Officer (since 2010) | | Chief Legal Officer and Assistant Secretary, Columbia Management Investment Advisers, LLC since June 2005; Vice President and Lead Chief Counsel–Asset Management, Ameriprise Financial, Inc. since May 2010 (previously Vice President and Chief Counsel–Asset Management, from 2005 to April 2010, and Vice President–Asset Management Compliance from 2004 to 2005); Vice President, Chief Counsel and Assistant Secretary, Columbia Management Investment Distributors, Inc. since 2008; Vice President, General Counsel and Secretary, Ameriprise Certificate Company since 2005; Chief Counsel, RiverSource Distributors, Inc. since 2006; Vice President, General Counsel and Secretary, RiverSource Funds, since December 2006; Senior Vice President, Secretary and Chief Legal Officer, Columbia Funds, since May 2010. | |
|
35
Fund Governance (continued)
Officers (continued)
| Name, Year of Birth and Address | | Principal Occupation(s) During the Past Five Years | |
| Linda J. Wondrack (Born 1964) | |
|
225 Franklin Street
Boston, MA 02110
Senior Vice President and Chief
Compliance Officer (since 2007) | | Vice President and Chief Compliance Officer, Columbia Management Investment Advisers, LLC since May 2010; Chief Compliance Officer, Columbia Funds, since 2007, and RiverSource Funds, since May 2010; Director (Columbia Management Group, LLC and Investment Product Group Compliance), Bank of America, from June 2005 to April 2010; Director of Corporate Compliance and Conflicts Officer of MFS Investment Management (investment management) from August 2004 to May 2005. | |
|
| William F. Truscott (Born 1960) | |
|
53600 Ameriprise Financial Center
Minneapolis, MN 55474
Senior Vice President (since 2010) | | Chairman of the Board, Columbia Management Investment Advisers, LLC since May 2010 (previously President, Chairman of the Board and Chief Investment Officer, from 2001 to April 2010); Chief Executive Officer, U.S. Asset Management & President, Annuities, Ameriprise Financial, Inc. since May 2010 (previously President–U.S. Asset Management and Chief Investment Officer from 2005 to April 2010, and Senior Vice President—Chief Investment Officer, from 2001 to 2005); Director, President and Chief Executive Officer, Ameriprise Certificate Company since 2006; Director, Columbia Management Investment Distributors, Inc. since May 2010 (previously Chairman of the Board and Chief Executive Officer from 2008 to April 2010); Chairman of the Board and Chief Executive Officer, RiverSource Distributors, Inc. since 2006. | |
|
| Colin Moore (Born 1958) | |
|
225 Franklin Street
Boston, MA 02110
Senior Vice President (since 2010) | | Director and Chief Investment Officer, Columbia Management Investment Advisers, LLC since May 2010; Manager, Managing Director and Chief Investment Officer of Columbia Management Advisors, LLC from 2007 to April 2010; Head of Equities, Columbia Management Advisors, LLC from 2002 to 2007. | |
|
| Amy Johnson (Born 1965) | |
|
5228 Ameriprise Financial Center
Minneapolis, MN 55474
Vice President (since 2010) | | Senior Vice President and Chief Operating Officer, Columbia Management Investment Advisers, LLC since May 2010 (previously Chief Administrative Officer, from 2009 until April 2010, Vice President—Asset Management and Trust Company Services, from 2006 to 2009, and Vice President—Operations and Compliance from 2004 to 2006). | |
|
| Joseph F. DiMaria (Born 1968) | |
|
225 Franklin Street
Boston, MA 02110
Vice President (since 2011) and
Chief Accounting Officer (since 2008) | | Vice President, Mutual Fund Administration, Columbia Management Investment Advisers, LLC, since May 2010; Director of Fund Administration, Columbia Management Advisors, LLC from January 2006 to April 2010; Head of Tax/Compliance and Assistant Treasurer, Columbia Management Advisors, LLC, from November 2004 to December 2005. | |
|
| Stephen T. Welsh (born 1957) | |
|
225 Franklin Street
Boston, MA 02110
Vice President (since 2006) | | President and Director, Columbia Management Investment Services Corp. since May 2010; President and Director, Columbia Management Services, Inc. from July 2004 to April 2010; Managing Director, Columbia Management Distributors, Inc. from August 2007 to April 2010. | |
|
36
Fund Governance (continued)
Officers (continued)
| Name, Year of Birth and Address | | Principal Occupation(s) During the Past Five Years | |
| Paul D. Pearson (born 1956) | |
|
5228 Ameriprise Financial Center
Minneapolis, MN 55474
Vice President and Assistant
Treasurer (since 2011) | | Vice President, Investment Accounting, Columbia Management Investment Advisers, LLC, since May 2010; Vice President, Managed Assets, Investment Accounting, Ameriprise Financial Corporation. | |
|
| Paul B. Goucher (born 1968) | |
|
5228 Ameriprise Financial Center
Minneapolis, MN 55474
Vice President and Assistant
Secretary (since 2010) | | Vice President and Chief Counsel of Ameriprise Financial since January 2010 (formerly Vice President and Group Counsel from November 2008 to January 2010); Director, Managing Director and General Counsel of J. & W. Seligman & Co. Incorporated (Seligman) from July 2008 to November 2008 and Managing Director and Associate General Counsel of Seligman from January 2005 to July 2008. | |
|
| Christopher O. Petersen (born 1970) | |
|
5228 Ameriprise Financial Center
Minneapolis, MN 55474
Vice President (since 2010) and
Secretary (since 2011) | | Vice President and Chief Counsel, Ameriprise Financial since January 2010 (formerly Vice President and Group Counsel or Counsel from April 2004 to January 2010); Assistant Secretary of RiverSource Funds since January 2007. | |
|
| Michael E. DeFao (born 1968) | |
|
5228 Ameriprise Financial Center
Minneapolis, MN 55474
Vice President and Assistant
Secretary (since 2011) | | Vice President and Chief Counsel, Ameriprise Financial since May 2010; Associate General Counsel Bank of America from June 2005 to April 2010 | |
|
37
This page intentionally left blank.
This page intentionally left blank.
This page intentionally left blank.
Important Information About This Report
The fund mails one shareholder report to each shareholder address. If you would like more than one report, please call shareholder services at 1-800-345-6611 and additional reports will be sent to you. This report has been prepared for shareholders of Columbia Connecticut Intermediate Municipal Bond Fund.
A description of the policies and procedures that the fund uses to determine how to vote proxies and a copy of the fund's voting records are available (i) at www.columbiamanagement.com, (ii) on the Securities and Exchange Commission's website at www.sec.gov, and (iii) without charge, upon request, by calling 1-800-368-0346. Information regarding how the fund voted proxies relating to portfolio securities during the 12-month period ended June 30 is available from the SEC's website. Information regarding how the fund voted proxies relating to portfolio securities is also available from the fund's website, www.columbiamanagement.com.
The fund files a complete schedule of portfolio holdings with the SEC for the first and third quarters of each fiscal year on Form N-Q. The fund's Form N-Q is available on the SEC's website at www.sec.gov and may be reviewed and copied at the SEC's Public Reference Room in Washington, D.C. Information on the operation of the Public Reference Room may be obtained by calling 1-800-SEC-0330.
Transfer Agent
Columbia Management Investment
Services Corp.
P.O. Box 8081
Boston, MA 02266-8081
1-800-345-6611
Distributor
Columbia Management Investment
Distributors, Inc.
225 Franklin Street
Boston, MA 02110
Investment Manager
Columbia Management Investment Advisers, LLC
225 Franklin Street
Boston, MA 02110
41

Columbia Connecticut Intermediate Municipal Bond Fund
P. O. Box 8081
Boston, MA 02266-8081
columbiamanagement.com
This information is for use with concurrent or prior delivery of a fund prospectus. Investors should consider the investment objectives, risks, charges and expenses of a mutual fund carefully before investing. For a free prospectus, which contains this and other important information about the funds, visit columbiamanagement.com. Read the prospectus carefully before investing. The Fund is distributed by Columbia Management Investment Distributors, Inc., member FINRA, and managed by Columbia Management Investment Advisers, LLC.
© 2011 Columbia Management Investment Advisers, LLC. All rights reserved.
C-1026 C (12/11)

Columbia Intermediate Municipal Bond Fund
Annual Report for the Period Ended October 31, 2011
Not FDIC insured • No bank guarantee • May lose value
Table of Contents
| Fund Profile | | | 1 | | |
|
| Performance Information | | | 2 | | |
|
| Understanding Your Expenses | | | 3 | | |
|
| Portfolio Manager's Report | | | 4 | | |
|
| Portfolio of Investments | | | 6 | | |
|
Statement of Assets and
Liabilities | | | 30 | | |
|
| Statement of Operations | | | 32 | | |
|
Statement of Changes in
Net Assets | | | 33 | | |
|
| Financial Highlights | | | 35 | | |
|
| Notes to Financial Statements | | | 40 | | |
|
Report of Independent Registered
Public Accounting Firm | | | 50 | | |
|
| Federal Income Tax Information | | | 51 | | |
|
| Fund Governance | | | 52 | | |
|
Important Information About
This Report | | | 57 | | |
|
The views expressed in this report reflect the current views of the respective parties. These views are not guarantees of future performance and involve certain risks, uncertainties and assumptions that are difficult to predict, so actual outcomes and results may differ significantly from the views expressed. These views are subject to change at any time based upon economic, market or other conditions and the respective parties disclaim any responsibility to update such views. These views may not be relied on as investment advice and, because investment decisions for a Columbia Fund are based on numerous factors, may not be relied on as an indication of trading intent on behalf of any particular Columbia Fund. References to specific securities should not be construed as a recommendation or investment advice.
President's Message

Dear Shareholders,
Economic momentum slowed in the third quarter of 2011, raising the odds of recession and making the U.S. economy more susceptible to financial shocks. The unemployment rate remained stalled as growing uncertainty continued to weigh on prospective employers. Monthly indicators for the manufacturing and service sectors also showed signs of slowing. Equity and high-yield bond markets fell sharply as investor confidence was shaken by Europe's lingering debt crisis, a heated debate in Washington over fiscal deficits (which eventually led to a downgrade of U.S. government debt) and tepid economic growth. The U.S. stock market experienced its worst quarter in two years during the third quarter of 2011, with volatility and selling pressure reminiscent of the market selloff in 2008, as macro-economic concerns continued to mount.
During its September meeting, the Federal Reserve Board announced that it was prepared to purchase longer term securities and sell shorter term securities in an effort to keep long-term interest rates down. Their hope is that lower long-term borrowing rates will stimulate business investment and hiring. However, the question remains as to whether monetary policy alone will be enough to resuscitate growth in the current environment.
Despite this challenging and volatile economic backdrop, I believe Columbia Management remains strong and steadfast. Columbia Management is the eighth largest manager of long-term mutual fund assets with $325 billion under management as of September 30, 2011. The past year has been one of considerable change for the organization as we worked diligently to align products, services and resources in the integration of Columbia Management with RiverSource Investments. The incredible line-up of talent, resources and capabilities that has resulted is highlighted by the success of our products. As of September 30, 2011, Columbia Management offers 54 funds rated 4 and 5 stars by Morningstar. Additionally, The Wall Street Journal has named two Columbia funds "Category Kings" in its "Investing in Funds: A Quarterly Analysis" issue dated October 5, 2011 in recognition for their one-year performance as of September 30, 2011.
For more information about these and other funds offered by Columbia Management, including detailed, up-to-date fund performance and portfolio information, please visit us online at columbiamanagement.com. Other information and resources available on our website include:
g timely economic analysis and market commentary
g quarterly fund commentaries
g Columbia Management Investor, a quarterly newsletter for shareholders
Thank you for your continued support of the Columbia Funds. We look forward to serving your investment needs for many years to come.
Best Regards,

J. Kevin Connaughton
President, Columbia Funds
All ratings are Class Z as of 9/30/2011. Out of 118 Z-share Columbia funds rated by Morningstar, 8 funds received a 5-star Overall Rating and 46 funds received a 4-star Overall Rating. The Overall Morningstar Rating for a retail mutual fund is derived from a weighted average of the performance figures associated with its 3-, 5- and 10-year (if applicable) Morningstar Rating metrics. For share classes that do not have a 3-, 5-, or 10-year actual performance history, the fund's independent Morningstar Rating metric is then compared against the retail mutual fund universe breakpoints to determine its hypothetical rating.
For each fund with at least a three-year history, Morningstar calculates a Morningstar RatingTM based on a Morningstar Risk-Adjusted Return measure that accounts for variation in a fund's monthly performance (including the effects of sales charges, loads, and redemption fees), placing more emphasis on downward variations and rewarding consistent performance. The top 10% of funds in each category receive 5 stars, the next 22.5% receive 4 stars, the next 35% receive 3 stars, the next 22.5% receive 2 stars and the bottom 10% receive 1 star. (Each share class is counted as a fraction of one fund within this scale and rated separately, which may cause slight variations in the distribution percentages.)
The Morningstar RatingTM is for Class Z shares only; other classes may have different performance characteristics and may have different ratings. © 2011 Morningstar, Inc. All Rights Reserved. The Morningstar information contained herein: (1) is proprietary to Morningstar and/or its content providers; (2) may not be copied or distributed; and (3) is not warranted to be accurate, complete or timely. Neither Morningstar nor its content providers are responsible for any damages or losses arising from any use of this information.
The Wall Street Journal "Category Kings" methodology: Top-performing funds in each category ranked by one-year total returns (changes in net asset values and reinvested distributions) for the period ended September 30, 2011.
Investors should consider the investment objectives, risks, charges and expenses of a mutual fund carefully before investing. For a free prospectus, which contains this and other important information about the funds, visit www.columbiamanagement.com. The prospectus should be read carefully before investing.
Columbia Funds are distributed by Columbia Management Investment Distributors, Inc., member FINRA, and managed by Columbia Management Investment Advisers, LLC.
© 2011 Columbia Management Investment Advisers, LLC. All rights reserved.
Fund Profile – Columbia Intermediate Municipal Bond Fund
Summary
g For the 12-month period that ended October 31, 2011, the fund's Class A shares returned 3.43% without sales charge.
g The fund's return was slightly lower than the return of its benchmark, the Barclays Capital 3-15 Year Blend Municipal Bond Index1 and slightly higher than the average return of its peer group, the Lipper Intermediate Municipal Debt Funds Classification.2
g Cash and short-term holdings held back results. Bonds rated A and BBB3 were strong contributors to the fund's performance as were hospital and corporate-backed municipal issues.
Portfolio Management
Brian M. McGreevy has managed the fund since 2009 and has been associated with the advisor since May 2010. Prior to joining the advisor, Mr. McGreevy was associated with the fund's previous advisor or its predecessors since 1994.
1The Barclays Capital 3-15 Year Blend Municipal Bond Index tracks the performance of municipal bonds issued after December 31, 1990 with remaining maturities between 2 and 17 years and at least $7 million in principal amount outstanding.
2Lipper Inc., a widely respected data provider in the industry, calculates an average total return (assuming reinvestment of distributions) for mutual funds which investment objectives similar to those of the fund. Lipper makes no adjustment for the effect of sales loads.
3Ratings are relative and subjective and are not absolute standards of quality. The credit ratings typically range from AAA (highest) to D (lowest), and are subject to change. The credit quality of the fund's investments does not remove market risk.
Indices are not available for investment, are not professionally managed and do not reflect sales charges, fees, brokerage commissions, taxes or other expenses of investing. Securities in the fund may not match those in an index.
Performance data quoted represents past performance and current performance may be lower or higher. Past performance is no guarantee of future results. The investment return and principal value will fluctuate so that shares, when redeemed, may be worth more or less than the original cost. Please visit www.columbiamanagement.com for daily and most recent month-end performance updates.
Summary
1-year return as of 10/31/11
| | | | +3.43% | |
|
|  | | | Class A shares
(without sales charge) | |
|
| | | | +3.89% | |
|
|  | | | Barclays Capital 3-15 Year Blend Municipal Bond Index | |
|
1
Performance Information – Columbia Intermediate Municipal Bond Fund
Performance data quoted represents past performance and current performance may be lower or higher. Past performance is no guarantee of future results. The investment return and principal value will fluctuate so that shares, when redeemed, may be worth more or less than the original cost. Please visit www.columbiamanagement.com for daily and most recent month-end performance updates.
Performance of a $10,000 investment 11/01/01 – 10/31/11
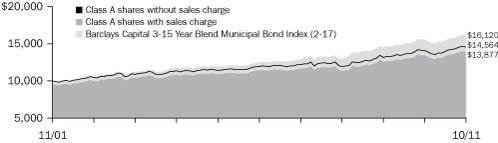
The chart above shows the change in value of a hypothetical $10,000 investment in Class A shares of Columbia Intermediate Municipal Bond Fund during the stated time period, and does not reflect the deduction of taxes that a shareholder may pay on fund distributions or on the redemption of fund shares. The performance of a $10,000 investment with sales charge for Class A shares is calculated with an initial sales charge of 4.75%, which was the effective sales charge prior to August 22, 2005.
Performance of a $10,000 investment 11/01/01 – 10/31/11 ($)
| Sales charge | | without | | with | |
| Class A | | | 14,564 | | | | 13,877 | | |
| Class B | | | 13,633 | | | | 13,633 | | |
| Class C | | | 14,187 | | | | 14,187 | | |
| Class T | | | 14,630 | | | | 13,940 | | |
| Class Z | | | 14,859 | | | | n/a | | |
Average annual total return as of 10/31/11 (%)
| Share class | | A | | B | | C | | T | | Z | |
| Inception | | 11/25/02 | | 11/25/02 | | 11/25/02 | | 06/26/00 | | 06/14/93 | |
| Sales charge | | without | | with | | without | | with | | without | | with | | without | | with | | without | |
| 1-year | | | 3.43 | | | | 0.03 | | | | 2.76 | | | | –0.24 | | | | 3.22 | | | | 2.22 | | | | 3.48 | | | | –1.45 | | | | 3.69 | | |
| 5-year | | | 4.03 | | | | 3.34 | | | | 3.36 | | | | 3.36 | | | | 3.82 | | | | 3.82 | | | | 4.08 | | | | 3.07 | | | | 4.25 | | |
| 10-year | | | 3.83 | | | | 3.33 | | | | 3.15 | | | | 3.15 | | | | 3.56 | | | | 3.56 | | | | 3.88 | | | | 3.38 | | | | 4.04 | | |
The "with sales charge" returns include the maximum initial sales charge of 3.25% for Class A shares (for the 1-year and 5-year periods), 4.75% for Class A shares (for the 10-year period) and 4.75% for Class T shares, the applicable contingent deferred sales charge of 3.00% in the first year, declining to 1.00% in the fourth year and eliminated thereafter for Class B shares and 1.00% for Class C shares for the first year only. The "without sales charge" returns do not include the effect of sales charges. If they had, returns would be lower.
Prior to August 22, 2005, new purchases of Class A shares had a maximum initial sales charge of 4.75%.
Performance results reflect any fee waivers or reimbursements of fund expenses by the Investment Manager and/or any of its affiliates. Absent these fee waivers or expense reimbursement arrangements, performance results would have been lower.
All results shown assume reinvestment of distributions. Class Z shares are sold at net asset value with no distribution and service (Rule 12b-1) fees. Class Z shares have limited eligibility and the investment minimum requirements may vary. Please see the fund's prospectuses for details. Performance for different share classes will vary based on differences in sales charges and fees associated with each class.
The tables do not reflect the deduction of taxes that a shareholder may pay on fund distributions or on the redemption of fund shares.
Class A, Class B, Class C, Class T and Class Z share performance information includes returns of Retail A shares (for Class A and Class T shares), Retail B shares (for Class B and Class C shares) and Trust shares (for Class Z shares) of Galaxy Intermediate Tax-Exempt Bond Fund, the predecessor to the Fund and a series of The Galaxy Fund (the "Galaxy Intermediate Fund"), for periods prior to November 25, 2002, the date on which Class A, Class B, Class C, Class T and Class Z shares were initially offered by the Fund. The returns shown for all share classes reflect any differences in sales charges, but no returns have been restated to reflect any differences in expenses such as distribution and service (Rule 12b-1) fees between any predecessor share class and the corresponding newer share class. If differences in expenses had been reflected, the returns shown for periods prior to November 25, 2002 would be lower for Class A, Class B, Class C and Class T shares.
2
Understanding Your Expenses – Columbia Intermediate Municipal Bond Fund
As a shareholder, you incur two types of costs. There are transaction costs, which generally include sales charges on purchases and may include redemption fees. There are also ongoing costs, which generally include management fees, distribution and service (Rule 12b-1) fees, and other fund expenses. The following information is intended to help you understand your ongoing costs (in dollars) of investing in the Fund and to compare these costs with the ongoing costs of investing in other mutual funds.
Analyzing your fund's expenses
To illustrate these ongoing costs, we provided examples and calculated the expenses paid by investors in each share class of the Fund during the period. The information in the table is based on an initial investment of $1,000 at the beginning of the period indicated and held for the entire period. Expense information is calculated two ways and each method provides you with different information. The amount listed in the "Actual" column is calculated using the Fund's actual operating expenses and total return for the period. You may use the Actual information, together with the amount invested, to estimate the expenses that you paid over the period. Simply divide your account value by $1,000 (for example, an $8,600 account value divided by $1,000 = 8.6), then multiply the results by the expenses paid during the period under the Actual column. The amount listed in the "Hypothetical" column assumes a 5% annual rate of return before expenses (which is not the Fund's actual return) and then applies the Fund's actual expense ratio for the period to the hypothetical return. You should not use the hypothetical account values and expenses to estimate either your actual account balance at the end of the period or the expenses you paid during the period. See the "Compare with other funds" information with details on using the hypothetical data.
Compare with other funds
Since all mutual funds are required to include the same hypothetical calculations about expenses in shareholder reports, you can use this information to compare the ongoing cost of investing in the Fund with other funds. To do so, compare the hypothetical example with the 5% hypothetical examples that appear in the shareholder reports of other funds. As you compare hypothetical examples of other funds, it is important to note that hypothetical examples are meant to highlight the ongoing costs of investing in a fund only and do not reflect any transaction costs, such as sales charges, or redemption or exchange fees. Therefore, the hypothetical calculations are useful in comparing ongoing costs only, and will not help you determine the relative total costs of owning different funds. If transaction costs were included in these calculations, your costs would have been higher.
05/01/11 – 10/31/11
| | | Account value at the
beginning of the period ($) | | Account value at the
end of the period ($) | | Expenses paid
during the period ($) | | Fund's annualized
expense ratio (%) | |
| | | Actual | | Hypothetical | | Actual | | Hypothetical | | Actual | | Hypothetical | | Actual | |
| Class A | | | 1,000.00 | | | | 1,000.00 | | | | 1,042.60 | | | | 1,021.58 | | | | 3.71 | | | | 3.67 | | | | 0.72 | | |
| Class B | | | 1,000.00 | | | | 1,000.00 | | | | 1,039.10 | | | | 1,018.20 | | | | 7.14 | | | | 7.07 | | | | 1.39 | | |
| Class C | | | 1,000.00 | | | | 1,000.00 | | | | 1,041.50 | | | | 1,020.62 | | | | 4.68 | | | | 4.63 | | | | 0.91 | | |
| Class T | | | 1,000.00 | | | | 1,000.00 | | | | 1,042.90 | | | | 1,021.83 | | | | 3.45 | | | | 3.41 | | | | 0.67 | | |
| Class Z | | | 1,000.00 | | | | 1,000.00 | | | | 1,044.10 | | | | 1,022.48 | | | | 2.78 | | | | 2.75 | | | | 0.54 | | |
Expenses paid during the period are equal to the annualized expense ratio for each class as indicated above, multiplied by the average account value over the period and then multiplied by the number of days in the Fund's most recent fiscal half year and divided by 365.
Expenses do not include fees and expenses incurred indirectly by the Fund from the underlying funds in which the Fund may invest (also referred to as "acquired funds"), including affiliated and non-affiliated pooled investments vehicles (including mutual funds and exchange traded funds).
Had Columbia Management Investment Advisers, LLC and/or certain of its affiliates not waived/reimbursed certain fees and expenses, account value at the end of the period would have been reduced.
3
Portfolio Manager's Report – Columbia Intermediate Municipal Bond Fund
Performance data quoted represents past performance and current performance may be lower or higher. Past performance is no guarantee of future results. The investment return and principal value will fluctuate so that shares, when redeemed, may be worth more or less than the original cost. Please visit www.columbiamanagement.com for daily and most recent month-end performance updates.
Net asset value per share
as of 10/31/11 ($)
| Class A | | | 10.56 | | |
| Class B | | | 10.56 | | |
| Class C | | | 10.56 | | |
| Class T | | | 10.56 | | |
| Class Z | | | 10.57 | | |
Distributions declared per share
11/01/10 – 10/31/11 ($)
| Class A | | | 0.37 | | |
| Class B | | | 0.30 | | |
| Class C | | | 0.35 | | |
| Class T | | | 0.38 | | |
| Class Z | | | 0.39 | | |
A portion of the fund's income may be subject to the alternative minimum tax. The fund may at times purchase tax-exempt securities at a discount. Some, or all, of this discount may be included in the fund's ordinary income, and is taxable when distributed.
30-day SEC yields
as of 10/31/11 (%)
| Class A | | | 1.87 | | |
| Class B | | | 1.07 | | |
| Class C | | | 1.82 | | |
| Class T | | | 1.84 | | |
| Class Z | | | 2.49 | | |
The 30-day SEC yields reflect the fund's earning power, net of expenses, expressed as an annualized percentage of the public offering price per share at the end of the period. Had the Investment Manager and/or any of its affiliates not waived fees or reimbursed a portion of expenses, the 30-day SEC yields would have been lower.
For the 12-month period that ended October 31, 2011, the fund's Class A shares returned 3.43% without sales charge. The fund's benchmark, the Barclays Capital 3-15 Year Blend Municipal Bond Index returned 3.89%. The average return of funds in its peer group, the Lipper Intermediate Municipal Debt Funds Classification, was 3.04%. Cash and short-term holdings held back results relative to the benchmark. Bonds rated A and BBB were strong contributors to the fund's performance, as were hospital and corporate-backed tax-exempt issues, helping the fund outperform its peer group.
A volatile year left yields largely unchanged
Early in the period, rising yields pressured prices. Municipal yields followed U.S. Treasury yields higher but retained an advantage on a taxable equivalent basis. Conflicting economic signals, with signs of stronger growth, added to the bearish sentiment. Yields on 10-year AAA municipals rose nearly seven-tenths of a percentage point, and longer-term rates climbed almost a full point. In December 2010, a well-known equity analyst added to the negative market tone by forecasting a wave of municipal defaults, which alarmed bondholders and prompted them to sell municipal bond funds. In fact, the actual number of issues in the investment-grade universe that has defaulted in 2011 has been extremely small. Market observers also anticipated that 2011 would be heavy with new issues supply that would drive prices still lower while yields climbed. But, to the surprise of many, new issuance actually shrank by about 30% from prior year levels.
In the spring of 2011, slowing economic activity combined with the eurozone crisis to spur a flight to quality, particularly to U.S. Treasuries. Redemptions of municipal mutual funds began to abate when attractive yields, ratios and the continued positive revenue turnaround at the state level helped allay investor worries. In the final months of the period, municipal yields declined and prices rose. Individual investors continued to favor municipal bonds with one-to-ten year maturities, and mutual fund flows turned positive. Despite interim volatility, municipal bond yields ended the fund's fiscal year at levels close to where they started one year ago, generating positive returns versus most other asset classes.
Issuers addressed budget shortfalls
State and local governments acted decisively to bring budgets into line through prudent spending decisions that included layoffs, program cuts and postponement of capital outlays. Some states also raised taxes and fees. It is possible that significant changes in public employees' health care contributions and revised pension rules may also reduce the cost to states in the years ahead, relieving some budget pressure.
Lower-rated and corporate-backed issues led fund returns
The fund's performance for the period was solid, exceeding results of its Lipper peer group while slightly lagging the benchmark. Overall, lower-rated, higher-yielding bonds outperformed those of higher quality. Within the fund's benchmark, BBB rated issues delivered higher returns than bonds in the higher rating tiers. Adding to results was heavier exposure to education bonds and hospital issues. An overweight stake compared to the benchmark in A and BBB credits aided performance. Adding some
4
Portfolio Manager's Report (continued) – Columbia Intermediate Municipal Bond Fund
lower-rated California issues in the 15- to 20-year maturity range, notably corporate-backed tax-exempt issues and bonds funding essential transportation services, also helped returns. We maintained a below-benchmark stake in pre-refunded bonds, an underperforming sector, which aided relative results. Pre-refunding occurs when an issuer sells a new bond at a lower rate and invests the proceeds in short-term government securities until it can call or pay off the old, higher-rate or pre-refunded bond.
Short maturity holdings and cash equivalents detracted from results. Early in the year, we raised cash to cover potential outflows, given the negative tone and fear in the market. In fact, the fund did not experience any unusual cash flows, but cash equivalents holdings hurt results as money market yields remained extremely low.
We took tax losses in some cases to offset gains and to mitigate the tax impact of gains on fund shareholders. We also decreased the fund's exposure to short-maturity and shorter-call bonds. Our large credit research team, an essential part of our investment process, identified several attractive opportunities in bonds rated single A or lower.
Slow growth, volatile markets could bring opportunities
At the moment, we see good potential for municipal bonds in the eight- to 12-year maturity range. And with the possibility of generally slow but positive growth in upcoming months, the A rated segment continues to offer an attractive yield advantage. We believe the Federal Reserve Board is likely to maintain short-term interest rates at their current low level, suggesting that short-term issues have the potential to be very stable but offer little yield. We do expect volatility to remain high, as negative rating changes have the potential to continue to occur in 2012. We will aim to take advantage of dislocations and weakness where appropriate.
Portfolio characteristics and holdings are subject to change periodically and may not be representative of current characteristics and holdings. The outlook for this fund may differ from that presented for other Columbia Funds.
Tax-exempt investing offers current tax-exempt income, but it also involves certain risks. The value of the fund will be affected by interest rate changes and the creditworthiness of issues held in the fund. When interest rates go up, bond prices generally drop and vice versa. Interest income from certain tax-exempt bonds may be subject to certain state and local taxes and, if applicable, the alternative minimum tax. Any capital gains distributed are taxable to the investor.
Taxable-equivalent SEC yields
as of 10/31/11 (%)
| Class A | | | 2.88 | | |
| Class B | | | 1.65 | | |
| Class C | | | 2.80 | | |
| Class T | | | 2.83 | | |
| Class Z | | | 3.83 | | |
Taxable-equivalent SEC yields are calculated assuming a federal tax rate of 35.0%. This tax rate does not reflect the phase out of exemptions or the reduction of the otherwise allowable deductions that occur when adjusted gross income exceeds certain levels. Your taxable-equivalent yield may be different depending on your tax bracket.
Quality breakdown
as of 10/31/11 (%)
| AAA | | | 14.0 | | |
| AA | | | 45.9 | | |
| A | | | 28.0 | | |
| BBB | | | 7.9 | | |
| BB | | | 0.4 | | |
| B | | | 0.2 | | |
| Non-Rated | | | 3.6 | | |
Maturity breakdown
as of 10/31/11 (%)
| 0-1 year | | | 1.7 | | |
| 1-3 years | | | 11.4 | | |
| 3-5 years | | | 13.4 | | |
| 5-7 years | | | 16.7 | | |
| 7-10 years | | | 22.9 | | |
| 10-15 years | | | 25.3 | | |
| 15-20 years | | | 7.2 | | |
| 20-25 years | | | 0.4 | | |
| Cash Equivalents | | | 1.0 | | |
Ratings shown in the quality breakdown are assigned to individual bonds by taking the lower of the ratings available from one of the following nationally recognized rating agencies: Standard & Poor's or Moody's Investor Services. If a security is rated by only one of the two agencies, that rating is used. If a security is not rated by either of the two agencies, it is designated as Non-Rated. Ratings are relative and subjective and are not absolute standards of quality. The credit quality of the fund's investments does not remove market risk.
The fund is actively managed and the composition of its portfolio will change over time. Information provided is calculated as a percentage of net assets.
5
Portfolio of Investments – Columbia Intermediate Municipal Bond Fund
October 31, 2011
(Percentages represent value of investments compared to net assets)
Issue
Description | | Coupon
Rate | | Principal
Amount | | Value | |
| Municipal Bonds 98.2% | |
| Alabama 0.5% | |
Alabama Public School & College Authority
Refunding Revenue Bonds
Series 2009A | |
| 05/01/19 | | | 5.000 | % | | $ | 10,000,000 | | | $ | 11,888,900 | | |
| Alaska 0.7% | |
City of Valdez
Refunding Revenue Bonds
BP Pipelines Project
Series 2003B | |
| 01/01/21 | | | 5.000 | % | | | 7,000,000 | | | | 7,863,730 | | |
BP Pipelines, Inc. Project
Series 2001 | |
| 01/01/18 | | | 5.000 | % | | | 8,000,000 | | | | 9,004,640 | | |
| Total | | | 16,868,370 | | |
| Arizona 1.8% | |
Arizona School Facilities Board
Certificate of Participation
Series 2008 | |
| 09/01/15 | | | 5.500 | % | | | 7,500,000 | | | | 8,404,800 | | |
City of Tucson
Unlimited General Obligation Refunding Bonds
Series 1998 | |
| 07/01/18 | | | 5.500 | % | | | 4,760,000 | | | | 5,696,292 | | |
Maricopa County High School District No. 210-Phoenix
Unlimited General Obligation Refunding Bonds
Series 2003 (NPFGC) | |
| 07/01/15 | | | 5.000 | % | | | 6,300,000 | | | | 7,131,915 | | |
Maricopa County Industrial Development Authority
Revenue Bonds
Catholic Healthcare West
Series 2007A | |
| 07/01/18 | | | 5.000 | % | | | 3,500,000 | | | | 3,800,370 | | |
Maricopa County Pollution Control Corp.
Refunding Revenue Bonds
Arizona Public Service Co.
Series 2009D(a) | |
| 05/01/29 | | | 6.000 | % | | | 10,000,000 | | | | 10,949,400 | | |
Queen Creek Improvement District No. 1
Special Assessment Bonds
Series 2006 | |
| 01/01/18 | | | 5.000 | % | | | 500,000 | | | | 500,935 | | |
Salt River Project Agricultural Improvement & Power
District
Revenue Bonds
Series 2009A | |
| 01/01/22 | | | 5.000 | % | | | 1,000,000 | | | | 1,150,330 | | |
State of Arizona
Certificate of Participation
Department of Administration
Series 2010A (AGM) | |
| 10/01/18 | | | 5.000 | % | | | 5,000,000 | | | | 5,702,400 | | |
| Total | | | 43,336,442 | | |
Issue
Description | | Coupon
Rate | | Principal
Amount | | Value | |
| Municipal Bonds (continued) | |
| Arkansas 0.2% | |
County of Independence
Refunding Revenue Bonds
Entergy Mississippi, Inc. Project
Series 1999 (AMBAC) | |
| 07/01/22 | | | 4.900 | % | | $ | 4,600,000 | | | $ | 4,734,550 | | |
| California 11.7% | |
California Health Facilities Financing Authority
Revenue Bonds
St. Joseph Health System
Series 2009B | |
| 07/01/18 | | | 5.000 | % | | | 10,445,000 | | | | 11,641,579 | | |
California Health Facilities Financing Authority(a)
Revenue Bonds
Catholic Healthcare West
Series 2009F | |
| 07/01/27 | | | 5.000 | % | | | 3,000,000 | | | | 3,243,900 | | |
California Municipal Finance Authority
Revenue Bonds
Biola University
Series 2008 | |
| 10/01/23 | | | 5.625 | % | | | 3,000,000 | | | | 3,170,760 | | |
California State Department of Veterans Affairs
Revenue Bonds
Series 2006A | |
| 12/01/23 | | | 4.500 | % | | | 5,000,000 | | | | 5,024,850 | | |
California State Department of Water Resources
Revenue Bonds
Power Supply
Series 2008H | |
| 05/01/21 | | | 5.000 | % | | | 5,000,000 | | | | 5,632,800 | | |
| 05/01/22 | | | 5.000 | % | | | 500,000 | | | | 558,250 | | |
California State Public Works Board
Refunding Revenue Bonds
Department of Corrections and Rehab
Series 2006F (NPFGC/FGIC) | |
| 11/01/18 | | | 5.250 | % | | | 4,000,000 | | | | 4,495,960 | | |
Revenue Bonds
Department of Corrections
Series 2003C | |
| 06/01/18 | | | 5.500 | % | | | 1,500,000 | | | | 1,584,585 | | |
Department of Mental Health Coalinga
Series 2004A-A | |
| 06/01/19 | | | 5.500 | % | | | 2,000,000 | | | | 2,149,300 | | |
Various Capital Projects
Series 2011A | |
| 10/01/22 | | | 5.250 | % | | | 3,395,000 | | | | 3,648,776 | | |
California State University
Revenue Bonds
Systemwide
Series 2008A (AGM) | |
| 11/01/22 | | | 5.000 | % | | | 5,000,000 | | | | 5,463,950 | | |
California Statewide Communities Development Authority
Revenue Bonds
Proposition 1A Receivables Program
Series 2009 | |
| 06/15/13 | | | 5.000 | % | | | 12,500,000 | | | | 13,307,500 | | |
The Accompanying Notes to Financial Statements are an integral part of this statement.
6
Columbia Intermediate Municipal Bond Fund
October 31, 2011
(Percentages represent value of investments compared to net assets)
Issue
Description | | Coupon
Rate | | Principal
Amount | | Value | |
| Municipal Bonds (continued) | |
| California (cont.) | |
City of Fresno Sewer System
Revenue Bonds
Series 1993A-1 (AMBAC) | |
| 09/01/19 | | | 5.250 | % | | $ | 5,000,000 | | | $ | 5,611,800 | | |
City of Vernon
Revenue Bonds
Series 2009A | |
| 08/01/21 | | | 5.125 | % | | | 1,000,000 | | | | 991,220 | | |
County of Sacramento
Revenue Bonds
Series 2009B | |
| 07/01/24 | | | 5.000 | % | | | 1,000,000 | | | | 1,072,770 | | |
County of San Bernardino
Refunding Certificate of Participation
Justice Center/Airport Improvements
Series 2002A (NPFGC) | |
| 07/01/15 | | | 5.000 | % | | | 1,000,000 | | | | 1,049,740 | | |
Los Angeles County Metropolitan Transportation Authority
Refunding Revenue Bonds
Proposition A 1st Tier
Senior Series 2003A (AGM) | |
| 07/01/17 | | | 5.000 | % | | | 6,280,000 | | | | 6,707,040 | | |
| 07/01/18 | | | 5.000 | % | | | 7,700,000 | | | | 8,195,803 | | |
Los Angeles Unified School District
Unlimited General Obligation Bonds
Election of 2005
Series 2007E (AGM) | |
| 07/01/20 | | | 5.000 | % | | | 6,230,000 | | | | 7,023,391 | | |
Manteca Unified School District
Unlimited General Obligation Bonds
Capital Appreciation-Election of 2004
Series 2006 (NPFGC)(b) | |
| 08/01/24 | | | 0.000 | % | | | 5,000,000 | | | | 2,331,250 | | |
Monrovia Unified School District
Unlimited General Obligation Refunding Bonds
Series 2005 (NPFGC) | |
| 08/01/21 | | | 5.250 | % | | | 5,600,000 | | | | 6,510,392 | | |
Oakland Unified School District
Unlimited General Obligation Bonds
Election of 2006
Series 2009A | |
| 08/01/29 | | | 6.125 | % | | | 14,500,000 | | | | 15,536,170 | | |
Orange County Public Financing Authority
Refunding Revenue Bonds
Series 2005 (NPFGC) | |
| 07/01/16 | | | 5.000 | % | | | 10,000,000 | | | | 11,440,400 | | |
Pico Rivera Water Authority
Revenue Bonds
Water System Project
Series 1999A (NPFGC) | |
| 05/01/29 | | | 5.500 | % | | | 3,000,000 | | | | 3,118,260 | | |
Sacramento Municipal Utility District
Refunding Revenue Bonds
Series 2005 (AMBAC) | |
| 07/01/14 | | | 5.250 | % | | | 6,680,000 | | | | 7,171,381 | | |
San Francisco City & County Airports Commission
Revenue Bonds
Series 2010A | |
| 05/01/29 | | | 4.900 | % | | | 5,000,000 | | | | 5,158,200 | | |
Issue
Description | | Coupon
Rate | | Principal
Amount | | Value | |
| Municipal Bonds (continued) | |
| California (cont.) | |
San Joaquin Hills Transportation Corridor Agency(b)
Refunding Revenue Bonds
Capital Appreciation
Series 1997A (NPFGC) | |
| 01/15/12 | | | 0.000 | % | | $ | 7,600,000 | | | $ | 7,524,608 | | |
Revenue Bonds
Senior Lien
Series 1993 Escrowed to Maturity | |
| 01/01/25 | | | 0.000 | % | | | 22,405,000 | | | | 14,541,965 | | |
San Mateo County Community College District
Unlimited General Obligation Bonds
Capital Appreciation Election of 2005
Series 2006A (NPFGC)(b) | |
| 09/01/20 | | | 0.000 | % | | | 9,310,000 | | | | 6,645,199 | | |
Southern California Public Power Authority
Revenue Bonds
Project No. 1
Series 2007A | |
| 11/01/22 | | | 5.250 | % | | | 2,500,000 | | | | 2,558,775 | | |
Windy Point/Flats Project 1
Series 2010 | |
| 07/01/28 | | | 5.000 | % | | | 10,000,000 | | | | 10,756,100 | | |
Windy Point/Windy Flats Project
Series 2010-1 | |
| 07/01/30 | | | 5.000 | % | | | 15,875,000 | | | | 16,883,698 | | |
State of California
Unlimited General Obligation Bonds
Various Purpose
Series 2011 | |
| 10/01/19 | | | 5.000 | % | | | 12,000,000 | | | | 13,566,960 | | |
Unlimited General Obligation Bonds
Series 2002 (AMBAC) | |
| 02/01/18 | | | 6.000 | % | | | 5,000,000 | | | | 5,922,300 | | |
| Series 2004 | |
| 02/01/20 | | | 5.000 | % | | | 750,000 | | | | 801,675 | | |
| Series 2004A (NPFGC) | |
| 07/01/15 | | | 5.000 | % | | | 5,000,000 | | | | 5,535,400 | | |
Various Purpose
Series 2003 | |
| 11/01/18 | | | 5.250 | % | | | 1,000,000 | | | | 1,075,530 | | |
| Series 2009 | |
| 04/01/22 | | | 5.250 | % | | | 1,000,000 | | | | 1,103,660 | | |
| 10/01/22 | | | 5.250 | % | | | 25,000,000 | | | | 27,695,250 | | |
| Series 2010 | |
| 03/01/25 | | | 5.000 | % | | | 1,000,000 | | | | 1,061,480 | | |
Unlimited General Obligation Refunding Bonds
Series 2005 | |
| 03/01/17 | | | 5.000 | % | | | 10,000,000 | | | | 11,066,300 | | |
| Series 2009A | |
| 07/01/20 | | | 5.000 | % | | | 12,500,000 | | | | 14,301,625 | | |
| 07/01/21 | | | 5.250 | % | | | 1,000,000 | | | | 1,153,780 | | |
West Contra Costa Unified School District
Unlimited General Obligation Bonds
Series 2005 (NPFGC/FGIC)(b) | |
| 08/01/20 | | | 0.000 | % | | | 7,285,000 | | | | 4,751,568 | | |
| Total | | | 288,785,900 | | |
The Accompanying Notes to Financial Statements are an integral part of this statement.
7
Columbia Intermediate Municipal Bond Fund
October 31, 2011
(Percentages represent value of investments compared to net assets)
Issue
Description | | Coupon
Rate | | Principal
Amount | | Value | |
| Municipal Bonds (continued) | |
| Colorado 1.9% | |
Baptist Road Rural Transportation Authority
Revenue Bonds
Series 2007 | |
| 12/01/17 | | | 4.800 | % | | $ | 495,000 | | | $ | 429,932 | | |
Colorado Department of Transportation
Refunding Revenue Bonds
Transportation
RAN Series 2002B (NPFGC) | |
| 06/15/14 | | | 5.500 | % | | | 3,000,000 | | | | 3,359,040 | | |
| 06/15/15 | | | 5.500 | % | | | 1,000,000 | | | | 1,153,000 | | |
Colorado Health Facilities Authority
Revenue Bonds
Covenant Retirement Communities, Inc.
Series 2005 | |
| 12/01/18 | | | 5.000 | % | | | 1,000,000 | | | | 1,002,230 | | |
Evangelical Lutheran
Series 2005 | |
| 06/01/23 | | | 5.250 | % | | | 500,000 | | | | 512,960 | | |
Colorado Health Facilities Authority(a)
Revenue Bonds
Catholic Health Initiatives
Series 2008D-3 | |
| 10/01/38 | | | 5.500 | % | | | 5,000,000 | | | | 5,797,850 | | |
County of Adams
Refunding Revenue Bonds
Public Service Co. of Colorado Project
Series 2005A (NPFGC) | |
| 09/01/17 | | | 4.375 | % | | | 11,550,000 | | | | 11,892,342 | | |
E-470 Public Highway Authority(b)
Revenue Bonds
Capital Appreciation
Senior Series 1997B (NPFGC) | |
| 09/01/12 | | | 0.000 | % | | | 5,525,000 | | | | 5,359,637 | | |
| Senior Series 2000B (NPFGC) | |
| 09/01/18 | | | 0.000 | % | | | 1,500,000 | | | | 1,028,460 | | |
North Range Metropolitan District No. 1
Limited General Obligation Refunding Bonds
Series 2007 (ACA) | |
| 12/15/15 | | | 5.000 | % | | | 365,000 | | | | 350,918 | | |
| 12/15/17 | | | 5.000 | % | | | 350,000 | | | | 325,976 | | |
North Range Metropolitan District No. 2
Limited Tax General Obligation Bonds
Series 2007 | |
| 12/15/14 | | | 5.500 | % | | | 555,000 | | | | 553,546 | | |
Northwest Parkway Public Highway Authority
Prerefunded 06/15/16 Revenue Bonds
Capital Appreciation
Series 2001C (AMBAC)(a) | |
| 06/15/21 | | | 5.700 | % | | | 4,000,000 | | | | 4,730,560 | | |
Regional Transportation District
Certificate of Participation
Series 2010A | |
| 06/01/25 | | | 5.000 | % | | | 10,000,000 | | | | 10,600,800 | | |
| Total | | | 47,097,251 | | |
Issue
Description | | Coupon
Rate | | Principal
Amount | | Value | |
| Municipal Bonds (continued) | |
| Connecticut 0.4% | |
Connecticut State Health & Educational Facility Authority
Revenue Bonds
Trinity College
Series 1998F (NPFGC) | |
| 07/01/21 | | | 5.500 | % | | $ | 1,000,000 | | | $ | 1,177,300 | | |
Harbor Point Infrastructure Improvement District
Tax Allocation Bonds
Harbor Point Project
Series 2010A | |
| 04/01/22 | | | 7.000 | % | | | 7,430,000 | | | | 7,849,572 | | |
| Total | | | 9,026,872 | | |
| District of Columbia 1.1% | |
District of Columbia Water & Sewer Authority
Revenue Bonds
Series 2009A | |
| 10/01/24 | | | 5.000 | % | | | 1,000,000 | | | | 1,118,430 | | |
Metropolitan Washington Airports Authority
Revenue Bonds
Series 2009C | |
| 10/01/25 | | | 5.250 | % | | | 8,920,000 | | | | 9,773,733 | | |
Metropolitan Washington Airports Authority(b)
Revenue Bonds
Capital Appreciation-2nd Senior Lien
Series 2009B (AGM) | |
| 10/01/24 | | | 0.000 | % | | | 20,980,000 | | | | 10,749,103 | | |
| 10/01/25 | | | 0.000 | % | | | 7,500,000 | | | | 3,594,750 | | |
| 10/01/26 | | | 0.000 | % | | | 5,000,000 | | | | 2,209,650 | | |
Metropolitan Washington Airports Authority(c)
Refunding Revenue Bonds
Series 2007A (AMBAC) AMT | |
| 10/01/22 | | | 4.750 | % | | | 750,000 | | | | 782,565 | | |
| Total | | | 28,228,231 | | |
| Florida 8.9% | |
Capital Trust Agency
Revenue Bonds
Atlantic Housing Foundation
Subordinated Series 2008B(d) | |
| 07/15/32 | | | 7.000 | % | | | 1,910,000 | | | | 764,000 | | |
City of Cocoa Water & Sewer
Refunding Revenue Bonds
Series 2003 (AMBAC) | |
| 10/01/19 | | | 5.500 | % | | | 1,000,000 | | | | 1,193,480 | | |
City of Gulf Breeze
Revenue Bonds
Local Government Loan Program
Series 1985C (FGIC) | |
| 12/01/15 | | | 5.000 | % | | | 1,000,000 | | | | 1,002,020 | | |
City of Hollywood Water & Sewer
Improvement Refunding Revenue Bonds
Series 2003 (AGM) | |
| 10/01/17 | | | 5.000 | % | | | 1,070,000 | | | | 1,128,850 | | |
City of Jacksonville
Improvement Refunding Revenue Bonds
Local Government
Series 2002 (NPFGC/FGIC) | |
| 10/01/18 | | | 5.375 | % | | | 1,000,000 | | | | 1,035,970 | | |
The Accompanying Notes to Financial Statements are an integral part of this statement.
8
Columbia Intermediate Municipal Bond Fund
October 31, 2011
(Percentages represent value of investments compared to net assets)
Issue
Description | | Coupon
Rate | | Principal
Amount | | Value | |
| Municipal Bonds (continued) | |
| Florida (cont.) | |
| Series 2002 (NPFGC/FGIC) | |
| 10/01/18 | | | 5.375 | % | | $ | 3,450,000 | | | $ | 3,570,888 | | |
| 10/01/19 | | | 5.375 | % | | | 3,720,000 | | | | 3,849,493 | | |
Revenue Bonds
Better Jacksonville
Series 2003 (NPFGC) | |
| 10/01/19 | | | 5.250 | % | | | 1,080,000 | | | | 1,147,597 | | |
City of Lakeland
Refunding Revenue Bonds
1st Mortgage-Carpenters Accident Investor
Series 2008(e) | |
| 01/01/19 | | | 5.875 | % | | | 1,875,000 | | | | 1,945,219 | | |
City of Tallahassee
Refunding Revenue Bonds
Series 2001 (NPFGC/FGIC) | |
| 10/01/14 | | | 5.500 | % | | | 1,330,000 | | | | 1,499,761 | | |
| 10/01/17 | | | 5.500 | % | | | 1,900,000 | | | | 2,270,823 | | |
| 10/01/18 | | | 5.500 | % | | | 1,000,000 | | | | 1,206,720 | | |
City of Tampa
Revenue Bonds
Health System Catholic Health East
Series 1998A (NPFGC) | |
| 11/15/13 | | | 5.500 | % | | | 6,080,000 | | | | 6,544,208 | | |
| 11/15/14 | | | 5.500 | % | | | 6,000,000 | | | | 6,585,000 | | |
County of Brevard
Prerefunded 03/01/12 Revenue Bonds
Series 2002 (NPFGC/FGIC) | |
| 03/01/14 | | | 5.250 | % | | | 2,000,000 | | | | 2,033,540 | | |
County of Broward
Refunding Revenue Bonds
Civic Arena Project
Series 2006A (AMBAC) | |
| 09/01/18 | | | 5.000 | % | | | 2,500,000 | | | | 2,663,025 | | |
County of Escambia
Refunding Revenue Bonds
Series 2003A | |
| 04/01/15 | | | 4.700 | % | | | 500,000 | | | | 527,710 | | |
County of Miami-Dade Water & Sewer System
Refunding Revenue Bonds
System
Series 2008B (AGM) | |
| 10/01/21 | | | 5.250 | % | | | 20,000,000 | | | | 23,618,200 | | |
County of Miami-Dade
Revenue Bonds
Miami International Airport
Series 2010A | |
| 10/01/25 | | | 5.500 | % | | | 6,000,000 | | | | 6,505,260 | | |
| Series 2004 (NPFGC) | |
| 04/01/24 | | | 5.000 | % | | | 2,445,000 | | | | 2,532,800 | | |
| Series 2006 (XLCA) | |
| 07/01/19 | | | 5.000 | % | | | 5,040,000 | | | | 5,497,481 | | |
County of Osceola
Improvement Refunding Revenue Bonds
Osceola Parkway Project
Series 2004 (NPFGC) | |
| 04/01/18 | | | 5.000 | % | | | 1,000,000 | | | | 1,054,280 | | |
Revenue Bonds
Series 2002A (NPFGC/FGIC) | |
| 10/01/14 | | | 5.500 | % | | | 1,555,000 | | | | 1,620,512 | | |
Issue
Description | | Coupon
Rate | | Principal
Amount | | Value | |
| Municipal Bonds (continued) | |
| Florida (cont.) | |
County of Palm Beach
Refunding Revenue Bonds
Series 2004 | |
| 08/01/17 | | | 5.000 | % | | $ | 1,000,000 | | | $ | 1,099,270 | | |
Flagler County School District
Certificate of Participation
Series 2005A (AGM) | |
| 08/01/18 | | | 5.000 | % | | | 2,320,000 | | | | 2,491,657 | | |
Florida Governmental Utility Authority
Revenue Bonds
Lehigh Utility System
Series 2003 (AMBAC) | |
| 10/01/17 | | | 5.000 | % | | | 1,180,000 | | | | 1,231,755 | | |
Florida Hurricane Catastrophe Fund Finance Corp.
Revenue Bonds
Series 2008A | |
| 07/01/14 | | | 5.000 | % | | | 15,000,000 | | | | 16,160,400 | | |
Florida Municipal Loan Council
Revenue Bonds
Series 2005A (NPFGC) | |
| 02/01/19 | | | 5.000 | % | | | 1,015,000 | | | | 1,056,168 | | |
Florida Municipal Power Agency
Refunding Revenue Bonds
Stanton II Project
Series 2002 (AMBAC) | |
| 10/01/21 | | | 5.500 | % | | | 1,850,000 | | | | 1,911,753 | | |
Florida State Department of General Services
Refunding Revenue Bonds
Florida Facilities Pool
Series 2005A (AMBAC) | |
| 09/01/21 | | | 5.000 | % | | | 3,000,000 | | | | 3,358,260 | | |
Hillsborough County Industrial Development Authority
Refunding Revenue Bonds
Tampa General Hospital Project
Series 2003A | |
| 10/01/18 | | | 5.000 | % | | | 1,000,000 | | | | 1,031,260 | | |
Revenue Bonds
H. Lee Moffitt Cancer Project
Series 2002B (AMBAC) | |
| 09/01/15 | | | 5.500 | % | | | 2,335,000 | | | | 2,393,118 | | |
Hillsborough County Industrial Development Authority(a)
Revenue Bonds
Tampa Electric
Series 2007B | |
| 09/01/25 | | | 5.150 | % | | | 2,000,000 | | | | 2,145,300 | | |
Hillsborough County School Board
Certificate of Participation
Master Lease Program
Series 1998A (NPFGC) | |
| 07/01/14 | | | 5.500 | % | | | 2,000,000 | | | | 2,192,320 | | |
JEA
Refunding Revenue Bonds
Issue 2
Series 2005-21 (NPFGC) | |
| 10/01/19 | | | 5.000 | % | | | 1,000,000 | | | | 1,108,120 | | |
Kissimmee Utility Authority
Improvement Refunding Revenue Bonds
Series 2003 (AGM) | |
| 10/01/15 | | | 5.250 | % | | | 2,235,000 | | | | 2,398,244 | | |
The Accompanying Notes to Financial Statements are an integral part of this statement.
9
Columbia Intermediate Municipal Bond Fund
October 31, 2011
(Percentages represent value of investments compared to net assets)
Issue
Description | | Coupon
Rate | | Principal
Amount | | Value | |
| Municipal Bonds (continued) | |
| Florida (cont.) | |
Lake County School Board
Certificate of Participation
Series 2006C (AMBAC) | |
| 06/01/18 | | | 5.250 | % | | $ | 1,500,000 | | | $ | 1,676,850 | | |
Lee County Industrial Development Authority
Refunding Revenue Bonds
Shell Point/Alliance Community Project
Series 2007 | |
| 11/15/22 | | | 5.000 | % | | | 7,650,000 | | | | 6,906,726 | | |
Oakmont Grove Community Development District
Special Assessment Bonds
Series 2007B(d)(f) | |
| 05/01/12 | | | 5.250 | % | | | 2,000,000 | | | | 699,620 | | |
Orange County Health Facilities Authority
Refunding Revenue Bonds
Health Care-Orlando Lutheran
Series 2005 | |
| 07/01/13 | | | 5.000 | % | | | 2,265,000 | | | | 2,250,210 | | |
Revenue Bonds
Series 1996A Escrowed to Maturity (NPFGC) | |
| 10/01/16 | | | 6.250 | % | | | 4,705,000 | | | | 5,618,570 | | |
Unrefunded Revenue Bonds
Series 1996A (NPFGC) | |
| 10/01/16 | | | 6.250 | % | | | 1,700,000 | | | | 1,897,676 | | |
Orange County School Board
Certificate of Participation
Series 2005A (NPFGC) | |
| 08/01/18 | | | 5.000 | % | | | 1,000,000 | | | | 1,075,430 | | |
Orlando Utilities Commission
Refunding Revenue Bonds
Subordinated Series 1989D Escrowed to Maturity | |
| 10/01/17 | | | 6.750 | % | | | 1,590,000 | | | | 1,877,520 | | |
Revenue Bonds
Series 2005B | |
| 10/01/24 | | | 5.000 | % | | | 3,000,000 | | | | 3,278,040 | | |
Parker Road Community Development District
Special Assessment Bonds
Series 2007B(d) | |
| 05/01/15 | | | 5.350 | % | | | 2,000,000 | | | | 1,141,220 | | |
Reedy Creek Improvement District
Limited General Obligation Bonds
Series 2004A (NPFGC) | |
| 06/01/17 | | | 5.000 | % | | | 1,000,000 | | | | 1,060,330 | | |
Sarasota County Health Facilities Authority
Refunding Revenue Bonds
Village on the Isle Project
Series 2007 | |
| 01/01/27 | | | 5.500 | % | | | 4,000,000 | | | | 3,939,080 | | |
Seminole Indian Tribe of Florida
Revenue Bonds
Series 2007A(e)(g) | |
| 10/01/22 | | | 5.750 | % | | | 2,000,000 | | | | 1,985,500 | | |
Six Mile Creek Community Development District(d)
Special Assessment Bonds
Series 2007 | |
| 05/01/17 | | | 5.500 | % | | | 1,465,000 | | | | 476,433 | | |
| 05/01/22 | | | 5.650 | % | | | 3,000,000 | | | | 975,630 | | |
Issue
Description | | Coupon
Rate | | Principal
Amount | | Value | |
| Municipal Bonds (continued) | |
| Florida (cont.) | |
St. Petersburg Health Facilities Authority
Revenue Bonds
All Childrens Hospital
Series 2002 (AMBAC) | |
| 11/15/14 | | | 5.500 | % | | $ | 1,720,000 | | | $ | 1,780,733 | | |
| 11/15/15 | | | 5.500 | % | | | 1,995,000 | | | | 2,058,640 | | |
State of Florida
Refunding Revenue Bonds
Environmental Protection-Preservation 2000
Series 1998A (AGM) | |
| 07/01/13 | | | 6.000 | % | | | 10,000,000 | | | | 10,881,800 | | |
Unlimited General Obligation Refunding Bonds
Public Education
Series 2005C | |
| 06/01/13 | | | 5.000 | % | | | 11,830,000 | | | | 12,675,845 | | |
| Series 2005B | |
| 01/01/14 | | | 5.000 | % | | | 17,395,000 | | | | 19,016,214 | | |
Sterling Hill Community Development District
Special Assessment Bonds
Series 2003B(d)(f) | |
| 11/01/10 | | | 5.500 | % | | | 155,000 | | | | 108,548 | | |
Sweetwater Creek Community Development District(d)
Special Assessment Bonds
Series 2007B-1 | |
| 05/01/17 | | | 5.300 | % | | | 4,405,000 | | | | 1,984,497 | | |
| Series 2007B-2 | |
| 05/01/13 | | | 5.125 | % | | | 2,550,000 | | | | 1,148,801 | | |
Tampa Bay Water
Improvement Refunding Revenue Bonds
Series 2005 (NPFGC/FGIC) | |
| 10/01/19 | | | 5.500 | % | | | 1,500,000 | | | | 1,823,520 | | |
Tampa Sports Authority
Sales Tax Revenue Bonds
Tampa Bay Arena Project
Series 1995 (NPFGC) | |
| 10/01/15 | | | 5.750 | % | | | 2,055,000 | | | | 2,140,652 | | |
| 10/01/20 | | | 5.750 | % | | | 1,000,000 | | | | 1,073,030 | | |
Tolomato Community Development District
Special Assessment Bonds
Series 2007 | |
| 05/01/23 | | | 6.450 | % | | | 7,500,000 | | | | 5,049,150 | | |
Village Center Community Development District
Revenue Bonds
Subordinated Series 2003B | |
| 01/01/18 | | | 6.350 | % | | | 1,000,000 | | | | 1,008,120 | | |
Waterset North Community Development District
Special Assessment Bonds
Series 2007B | |
| 11/01/15 | | | 6.550 | % | | | 10,000,000 | | | | 6,354,800 | | |
| Total | | | 220,337,647 | | |
| Georgia 1.0% | |
City of Atlanta
Revenue Bonds
Series 1999A (NPFGC/FGIC) | |
| 11/01/18 | | | 5.500 | % | | | 15,305,000 | | | | 18,046,279 | | |
The Accompanying Notes to Financial Statements are an integral part of this statement.
10
Columbia Intermediate Municipal Bond Fund
October 31, 2011
(Percentages represent value of investments compared to net assets)
Issue
Description | | Coupon
Rate | | Principal
Amount | | Value | |
| Municipal Bonds (continued) | |
| Georgia (cont.) | |
DeKalb County Hospital Authority
Revenue Bonds
DeKalb Medical Center, Inc. Project
Series 2010 | |
| 09/01/30 | | | 6.000 | % | | $ | 5,000,000 | | | $ | 5,151,450 | | |
Gwinnett County Water & Sewerage Authority
Revenue Bonds
Series 2008 | |
| 08/01/19 | | | 5.000 | % | | | 1,000,000 | | | | 1,189,770 | | |
State of Georgia
Unlimited General Obligation Bonds
Series 2007G | |
| 12/01/17 | | | 5.000 | % | | | 500,000 | | | | 600,830 | | |
| Total | | | 24,988,329 | | |
| Hawaii 0.5% | |
State of Hawaii
Unlimited General Obligation Bonds
Series 2008DK | |
| 05/01/22 | | | 5.000 | % | | | 10,750,000 | | | | 12,265,857 | | |
| Illinois 4.3% | |
Chicago Board of Education
Unlimited General Obligation Bonds
Chicago School Reform
Series 1996 Escrowed to Maturity (NPFGC) | |
| 12/01/12 | | | 6.250 | % | | | 2,100,000 | | | | 2,234,232 | | |
Unlimited General Obligation Refunding Bonds
Dedicated Revenues
Series 2005B (AMBAC) | |
| 12/01/21 | | | 5.000 | % | | | 5,825,000 | | | | 6,186,034 | | |
| Series 2005A (AMBAC) | |
| 12/01/22 | | | 5.500 | % | | | 5,000,000 | | | | 5,631,100 | | |
Chicago Transit Authority
Revenue Bonds
Federal Transit Administration Section 5309
Series 2008A | |
| 06/01/16 | | | 5.000 | % | | | 2,500,000 | | | | 2,744,575 | | |
Chicago Transit Authority(h)
Revenue Bonds
Series 2011 | |
| 12/01/29 | | | 5.250 | % | | | 4,000,000 | | | | 4,207,720 | | |
City of Chicago O'Hare International Airport
Refunding Revenue Bonds
General Airport 3rd Lien
Series 2005B | |
| 01/01/17 | | | 5.250 | % | | | 10,000,000 | | | | 11,273,100 | | |
City of Chicago
Limited General Obligation Refunding Bonds
Emergency Telephone System
Series 1999 (NPFGC/FGIC) | |
| 01/01/18 | | | 5.250 | % | | | 7,540,000 | | | | 8,488,306 | | |
Revenue Bonds
Asphalt Operating Services- Recovery Zone Facility
Series 2010 | |
| 12/01/18 | | | 6.125 | % | | | 3,930,000 | | | | 4,036,935 | | |
County of Cook
Unlimited General Obligation Refunding Bonds
Series 2010A | |
| 11/15/22 | | | 5.250 | % | | | 12,000,000 | | | | 13,110,120 | | |
Issue
Description | | Coupon
Rate | | Principal
Amount | | Value | |
| Municipal Bonds (continued) | |
| Illinois (cont.) | |
Illinois Finance Authority
Refunding Revenue Bonds
DePaul University
Series 2004A | |
| 10/01/17 | | | 5.375 | % | | $ | 1,000,000 | | | $ | 1,144,940 | | |
| 10/01/18 | | | 5.375 | % | | | 2,000,000 | | | | 2,293,580 | | |
Illinois Finance Authority(d)(f)
Revenue Bonds
Monarch Landing, Inc. Facility
Series 2007A | |
| 12/01/13 | | | 5.500 | % | | | 1,855,578 | | | | 19 | | |
| 12/01/17 | | | 6.000 | % | | | 3,027,967 | | | | 30 | | |
Sedgebrook, Inc. Facility
Series 2007A | |
| 11/15/12 | | | 5.500 | % | | | 500,000 | | | | 5 | | |
| 11/15/16 | | | 5.400 | % | | | 1,648,203 | | | | 16 | | |
| 11/15/22 | | | 5.875 | % | | | 6,090,550 | | | | 61 | | |
Illinois State Toll Highway Authority
Revenue Bonds
Senior Priority
Series 2006A-1 (AGM) | |
| 01/01/18 | | | 5.000 | % | | | 2,000,000 | | | | 2,231,960 | | |
Kendall & Kane Counties Community Unit School District No. 115(b)
Unlimited General Obligation Bonds
Capital Appreciation
Series 2002 Escrowed to Maturity (FGIC) | |
| 01/01/17 | | | 0.000 | % | | | 600,000 | | | | 546,102 | | |
Unrefunded Unlimited General Obligation Bonds
Capital Appreciation
Series 2002 (NPFGC/FGIC) | |
| 01/01/17 | | | 0.000 | % | | | 3,050,000 | | | | 2,522,411 | | |
Railsplitter Tobacco Settlement Authority
Revenue Bonds
Series 2010 | |
| 06/01/19 | | | 5.000 | % | | | 5,000,000 | | | | 5,341,000 | | |
| 06/01/21 | | | 5.250 | % | | | 12,000,000 | | | | 12,722,640 | | |
State of Illinois
Revenue Bonds
2nd Series 2002 (NPFGC/FGIC) | |
| 06/15/15 | | | 5.500 | % | | | 1,000,000 | | | | 1,134,730 | | |
Unlimited General Obligation Bonds
Series 2004 (AMBAC) | |
| 11/01/18 | | | 5.000 | % | | | 10,650,000 | | | | 11,493,480 | | |
| Series 2005 (AGM) | |
| 09/01/17 | | | 5.000 | % | | | 5,000,000 | | | | 5,426,000 | | |
State of Illinois(b)
Revenue Bonds
Capital Appreciation-Civic Center
Series 1990B (AMBAC) | |
| 12/15/17 | | | 0.000 | % | | | 5,540,000 | | | | 4,366,794 | | |
| Total | | | 107,135,890 | | |
| Indiana 1.4% | |
Indiana Finance Authority
Refunding Revenue Bonds
Clarian Health Obligation Group
Series 2006B | |
| 02/15/24 | | | 5.000 | % | | | 1,000,000 | | | | 1,025,280 | | |
The Accompanying Notes to Financial Statements are an integral part of this statement.
11
Columbia Intermediate Municipal Bond Fund
October 31, 2011
(Percentages represent value of investments compared to net assets)
Issue
Description | | Coupon
Rate | | Principal
Amount | | Value | |
| Municipal Bonds (continued) | |
| Indiana (cont.) | |
Indiana Power & Light Co.
Series 2009B | |
| 01/01/16 | | | 4.900 | % | | $ | 11,000,000 | | | $ | 11,960,850 | | |
Revenue Bonds
1st Lien-CWA Authority
Series 2011A | |
| 10/01/25 | | | 5.250 | % | | | 1,750,000 | | | | 1,951,845 | | |
2nd Lien-CWA Authority
Series 2011B | |
| 10/01/23 | | | 5.250 | % | | | 7,035,000 | | | | 7,945,540 | | |
Indiana Health & Educational Facilities Financing Authority
Revenue Bonds
Baptist Homes of Indiana
Series 2005 | |
| 11/15/25 | | | 5.250 | % | | | 10,640,000 | | | | 10,593,822 | | |
Indiana Toll Road Commission
Revenue Bonds
Series 1980 Escrowed to Maturity | |
| 01/01/15 | | | 9.000 | % | | | 1,875,000 | | | | 2,141,813 | | |
Purdue University
Revenue Bonds
Student Facilities System
Series 2009A | |
| 07/01/21 | | | 5.000 | % | | | 200,000 | | | | 232,686 | | |
| Total | | | 35,851,836 | | |
| Iowa 0.2% | |
City of Coralville
Tax Allocation Bonds
Tax Increment
Series 2007C | |
| 06/01/17 | | | 5.000 | % | | | 730,000 | | | | 815,622 | | |
Iowa Finance Authority
Refunding Revenue Bonds
Development-Care Initiatives Project
Series 2006A | |
| 07/01/18 | | | 5.250 | % | | | 2,695,000 | | | | 2,520,364 | | |
Revenue Bonds
Iowa State Revolving Fund
Series 2008 | |
| 08/01/20 | | | 5.250 | % | | | 500,000 | | | | 594,120 | | |
| Total | | | 3,930,106 | | |
| Kansas 1.6% | |
City of Lenexa
Improvement Refunding Revenue Bonds
Series 2007 | |
| 05/15/22 | | | 5.250 | % | | | 2,650,000 | | | | 2,381,290 | | |
City of Manhattan
Revenue Bonds
Meadowlark Hills Retirement
Series 2007A | |
| 05/15/24 | | | 5.000 | % | | | 6,000,000 | | | | 5,340,120 | | |
County of Labette
Revenue Bonds
Capital Accumulator Bonds
Series 1982 Escrowed to Maturity(b) | |
| 12/01/14 | | | 0.000 | % | | | 2,175,000 | | | | 2,103,312 | | |
Issue
Description | | Coupon
Rate | | Principal
Amount | | Value | |
| Municipal Bonds (continued) | |
| Kansas (cont.) | |
Kansas Development Finance Authority
Revenue Bonds
Board of Regents-Scientific Research
Series 2003 (AMBAC) | |
| 10/01/19 | | | 5.000 | % | | $ | 2,000,000 | | | $ | 2,137,780 | | |
Kansas State Department of Transportation
Revenue Bonds
Series 2004A | |
| 03/01/18 | | | 5.500 | % | | | 11,775,000 | | | | 14,460,053 | | |
Kansas Turnpike Authority
Revenue Bonds
Series 2002 (AGM) | |
| 09/01/16 | | | 5.250 | % | | | 1,230,000 | | | | 1,454,082 | | |
Leavenworth County Unified School District No. 464
Unlimited General Obligation Improvement Bonds
Series 2005A (NPFGC) | |
| 09/01/19 | | | 5.000 | % | | | 1,030,000 | | | | 1,111,782 | | |
Washburn University
Refunding Revenue Bonds
Living Learning Center Project
Series 2004 (AMBAC) | |
| 07/01/18 | | | 5.000 | % | | | 900,000 | | | | 925,947 | | |
Wyandotte County-Kansas City Unified Government
Refunding Revenue Bonds
Sales Tax-2nd Lien-Area B
Series 2005 | |
| 12/01/20 | | | 5.000 | % | | | 6,225,000 | | | | 6,433,475 | | |
Wyandotte County-Kansas City Unified Government(b)
Revenue Bonds
Capital Appreciation Sales Tax Subordinated Lien
Series 2010 | |
| 06/01/21 | | | 0.000 | % | | | 7,425,000 | | | | 4,448,763 | | |
| Total | | | 40,796,604 | | |
| Kentucky 0.7% | |
Louisville & Jefferson County Metropolitan Sewer District
Revenue Bonds
Series 2009A | |
| 05/15/21 | | | 5.000 | % | | | 7,445,000 | | | | 8,487,598 | | |
| 05/15/22 | | | 5.000 | % | | | 7,825,000 | | | | 8,838,337 | | |
| Total | | | 17,325,935 | | |
| Louisiana 0.8% | |
Louisiana Housing Finance Agency
Refunding Revenue Bonds
Multi-family-Section 8-202 Projects
Series 2006A (FHA) | |
| 12/01/31 | | | 4.750 | % | | | 1,340,000 | | | | 1,384,917 | | |
Louisiana Office Facilities Corp.
Refunding Revenue Bonds
State Capital
Series 2010A | |
| 05/01/20 | | | 5.000 | % | | | 4,290,000 | | | | 4,814,581 | | |
Louisiana State Citizens Property Insurance Corp.
Revenue Bonds
Series 2006B (AMBAC) | |
| 06/01/16 | | | 5.000 | % | | | 500,000 | | | | 532,470 | | |
The Accompanying Notes to Financial Statements are an integral part of this statement.
12
Columbia Intermediate Municipal Bond Fund
October 31, 2011
(Percentages represent value of investments compared to net assets)
Issue
Description | | Coupon
Rate | | Principal
Amount | | Value | |
| Municipal Bonds (continued) | |
| Louisiana (cont.) | |
New Orleans Aviation Board
Revenue Bonds
Consolidated Rental Car
Series 2009A | |
| 01/01/25 | | | 6.000 | % | | $ | 4,250,000 | | | $ | 4,563,862 | | |
Parish of Morehouse
Refunding Revenue Bonds
International Paper Co. Project
Series 2001A | |
| 11/15/13 | | | 5.250 | % | | | 8,525,000 | | | | 9,008,538 | | |
| Total | | | 20,304,368 | | |
| Maryland 0.2% | |
Maryland State Department of Transportation
Revenue Bonds
Series 2002 | |
| 02/01/15 | | | 5.500 | % | | | 3,750,000 | | | | 4,295,513 | | |
| Massachusetts 5.2% | |
Commonwealth of Massachusetts
Limited General Obligation Bonds
Consolidated Loan
Series 2002C (NPFGC/FGIC) | |
| 11/01/14 | | | 5.500 | % | | | 2,000,000 | | | | 2,275,280 | | |
| Series 2002D (AMBAC/TCRS/BNY) | |
| 08/01/18 | | | 5.500 | % | | | 6,500,000 | | | | 7,959,510 | | |
Limited General Obligation Refunding Bonds
Series 2003D | |
| 10/01/17 | | | 5.500 | % | | | 5,000,000 | | | | 6,062,900 | | |
Revenue Bonds
Consolidated Loan
Series 2005A (AGM) | |
| 06/01/16 | | | 5.500 | % | | | 13,615,000 | | | | 16,101,235 | | |
Unlimited General Obligation Bonds
Consolidated Loan
Series 1998C | |
| 08/01/17 | | | 5.250 | % | | | 1,775,000 | | | | 2,122,066 | | |
Unlimited General Obligation Refunding Bonds
Series 2004C (AGM) | |
| 12/01/16 | | | 5.500 | % | | | 10,000,000 | | | | 11,970,100 | | |
Commonwealth of Massachusetts(a)
Limited General Obligation Refunding Bonds
Series 2007A | |
| 11/01/25 | | | 0.799 | % | | | 10,000,000 | | | | 8,154,900 | | |
Unlimited General Obligation Bonds
Series 2010A | |
| 02/01/14 | | | 0.670 | % | | | 2,000,000 | | | | 2,001,740 | | |
Massachusetts Bay Transportation Authority
Revenue Bonds
General Transportation System
Series 1991 (NPFGC) | |
| 03/01/21 | | | 7.000 | % | | | 5,750,000 | | | | 7,148,802 | | |
Massachusetts Development Finance Agency
Revenue Bonds
1st Mortgage-Orchard Cove
Series 2007 | |
| 10/01/17 | | | 5.000 | % | | | 815,000 | | | | 768,667 | | |
Issue
Description | | Coupon
Rate | | Principal
Amount | | Value | |
| Municipal Bonds (continued) | |
| Massachusetts (cont.) | |
Massachusetts Educational Financing Authority
Revenue Bonds
Issue I
Series 2010B AMT(c) | |
| 01/01/23 | | | 5.500 | % | | $ | 460,000 | | | $ | 478,989 | | |
Massachusetts Health & Educational Facilities Authority
Revenue Bonds
Boston College
Series 2008M-1 | |
| 06/01/24 | | | 5.500 | % | | | 2,670,000 | | | | 3,276,384 | | |
Caregroup
Series 2008E-2 | |
| 07/01/20 | | | 5.375 | % | | | 9,720,000 | | | | 10,764,414 | | |
| 07/01/22 | | | 5.375 | % | | | 13,345,000 | | | | 14,506,282 | | |
Harvard University
Series 2009A | |
| 11/15/19 | | | 5.250 | % | | | 1,000,000 | | | | 1,220,320 | | |
Massachusetts Institute of Technology
Series 2009O | |
| 07/01/26 | | | 5.000 | % | | | 500,000 | | | | 561,605 | | |
Massachusetts Port Authority
Refunding Revenue Bonds
Passenger Facility Charge
Series 2007D (AGM) | |
| 07/01/17 | | | 5.000 | % | | | 8,500,000 | | | | 9,756,385 | | |
Revenue Bonds
Series 2010A | |
| 07/01/25 | | | 5.000 | % | | | 1,500,000 | | | | 1,677,585 | | |
Massachusetts State Water Pollution Abatement
Refunding Revenue Bonds
Pool Program
Series 2004A | |
| 08/01/17 | | | 5.250 | % | | | 2,920,000 | | | | 3,515,125 | | |
Revenue Bonds
MWRA Program
Subordinated Series 1999A | |
| 08/01/19 | | | 6.000 | % | | | 2,500,000 | | | | 3,184,250 | | |
State Revolving Fund
Series 2009-14 | |
| 08/01/24 | | | 5.000 | % | | | 12,530,000 | | | | 14,640,428 | | |
| Total | | | 128,146,967 | | |
| Michigan 2.4% | |
City of Detroit Sewage Disposal System
Prerefunded 07/01/13 Revenue Bonds
Senior Lien
Series 2003A (AGM) | |
| 07/01/14 | | | 5.000 | % | | | 7,180,000 | | | | 7,710,530 | | |
Unrefunded Revenue Bonds
Senior Lien
Series 2003A (AGM) | |
| 07/01/14 | | | 5.000 | % | | | 2,820,000 | | | | 2,953,640 | | |
Detroit City School District
Unlimited General Obligation Bonds
School Building & Site Improvement
Series 2002A (FGIC) (Qualified School Bond Loan Fund) | |
| 05/01/19 | | | 6.000 | % | | | 2,000,000 | | | | 2,280,760 | | |
| Series 2003B (FGIC) (Qualified School Bond Loan Fund) | |
| 05/01/14 | | | 5.250 | % | | | 6,335,000 | | | | 6,648,076 | | |
The Accompanying Notes to Financial Statements are an integral part of this statement.
13
Columbia Intermediate Municipal Bond Fund
October 31, 2011
(Percentages represent value of investments compared to net assets)
Issue
Description | | Coupon
Rate | | Principal
Amount | | Value | |
| Municipal Bonds (continued) | |
| Michigan (cont.) | |
Dickinson County Economic Development Corp.
Refunding Revenue Bonds
International Paper Company Projects
Series 2004A | |
| 11/01/18 | | | 4.800 | % | | $ | 6,750,000 | | | $ | 6,992,190 | | |
Michigan Public Power Agency
Refunding Revenue Bonds
Belle River Project
Series 2002A (NPFGC) | |
| 01/01/16 | | | 5.250 | % | | | 1,000,000 | | | | 1,122,040 | | |
Michigan State Building Authority
Refunding Revenue Bonds
Facilities Program
Series 2003I (AGM) | |
| 10/15/14 | | | 5.250 | % | | | 10,000,000 | | | | 10,781,400 | | |
Saginaw Hospital Finance Authority
Refunding Revenue Bonds
Covenant Medical Center
Series 2004G | |
| 07/01/22 | | | 5.125 | % | | | 10,000,000 | | | | 10,107,200 | | |
State of Michigan
Refunding Revenue Bonds
Series 1998A | |
| 11/01/16 | | | 5.500 | % | | | 2,000,000 | | | | 2,342,920 | | |
| Series 2005 (AGM) | |
| 11/01/17 | | | 5.250 | % | | | 5,050,000 | | | | 5,920,620 | | |
Unlimited General Obligation Refunding Bonds
Series 2001 | |
| 12/01/15 | | | 5.500 | % | | | 1,250,000 | | | | 1,442,737 | | |
Wayne County Airport Authority
Revenue Bonds
Detroit Metropolitan Airport
Series 2005 (NPFGC) AMT(c) | |
| 12/01/19 | | | 4.750 | % | | | 750,000 | | | | 771,030 | | |
| Total | | | 59,073,143 | | |
| Minnesota 0.6% | |
City of Becker
Revenue Bonds
Northern States Power
Series 1993A(a) | |
| 09/01/19 | | | 8.500 | % | | | 11,085,000 | | | | 11,846,318 | | |
City of Eveleth
Refunding Revenue Bonds
Arrowhead Senior Living Community
Series 2007 | |
| 10/01/17 | | | 5.000 | % | | | 1,000,000 | | | | 952,670 | | |
City of Minneapolis
Revenue Bonds
Fairview Health Services
Series 2008A | |
| 11/15/18 | | | 6.000 | % | | | 1,000,000 | | | | 1,122,440 | | |
City of St. Louis Park
Revenue Bonds
Park Nicollet Health Services
Series 2008C | |
| 07/01/23 | | | 5.500 | % | | | 750,000 | | | | 793,177 | | |
Issue
Description | | Coupon
Rate | | Principal
Amount | | Value | |
| Municipal Bonds (continued) | |
| Minnesota (cont.) | |
St. Paul Housing & Redevelopment Authority
Revenue Bonds
HealthPartners Obligation Group Project
Series 2006 | |
| 05/15/23 | | | 5.250 | % | | $ | 500,000 | | | $ | 515,775 | | |
State of Minnesota
Unlimited General Obligation Bonds
Series 2008C | |
| 08/01/19 | | | 5.000 | % | | | 500,000 | | | | 606,700 | | |
| Total | | | 15,837,080 | | |
| Missouri 1.2% | |
City of Fenton
Refunding Tax Allocation Bonds
Gravois Bluffs Redevelopment Project
Series 2006 | |
| 04/01/21 | | | 4.500 | % | | | 680,000 | | | | 690,010 | | |
City of Kansas City
Tax Allocation Bonds
Maincor Project
Series 2007A | |
| 03/01/12 | | | 5.000 | % | | | 230,000 | | | | 231,175 | | |
City of St. Louis
Refunding Revenue Bonds
Lambert International Airport
Series 2007A (AGM) | |
| 07/01/21 | | | 5.000 | % | | | 7,000,000 | | | | 7,376,810 | | |
Kirkwood Industrial Development Authority
Revenue Bonds
Aberdeen Heights
Series 2010C-2 | |
| 11/15/15 | | | 7.000 | % | | | 500,000 | | | | 501,255 | | |
Missouri Highway & Transportation Commission
Revenue Bonds
2nd Lien
Series 2007 | |
| 05/01/17 | | | 5.000 | % | | | 1,000,000 | | | | 1,184,520 | | |
Missouri Joint Municipal Electric Utility Commission
Revenue Bonds
IATAN 2 Project
Series 2009A | |
| 01/01/17 | | | 4.500 | % | | | 1,000,000 | | | | 1,100,420 | | |
Missouri State Environmental Improvement & Energy
Resources Authority
Revenue Bonds
State Revolving Funds Program
Series 2004B | |
| 01/01/18 | | | 5.250 | % | | | 7,470,000 | | | | 9,074,631 | | |
Missouri State Health & Educational Facilities Authority
Revenue Bonds
St. Louis University
Series 1998 | |
| 10/01/16 | | | 5.500 | % | | | 1,000,000 | | | | 1,187,850 | | |
Washington University
Series 2001A | |
| 06/15/16 | | | 5.500 | % | | | 1,000,000 | | | | 1,187,760 | | |
| Series 2008A | |
| 03/15/18 | | | 5.250 | % | | | 1,000,000 | | | | 1,211,900 | | |
The Accompanying Notes to Financial Statements are an integral part of this statement.
14
Columbia Intermediate Municipal Bond Fund
October 31, 2011
(Percentages represent value of investments compared to net assets)
Issue
Description | | Coupon
Rate | | Principal
Amount | | Value | |
| Municipal Bonds (continued) | |
| Missouri (cont.) | |
St. Louis County Industrial Development Authority
Revenue Bonds
St. Andrews Residence for Seniors
Series 2007A | |
| 12/01/26 | | | 6.250 | % | | $ | 7,000,000 | | | $ | 6,803,440 | | |
| Total | | | 30,549,771 | | |
| Nebraska 0.1% | |
Elkhorn School District
Unlimited General Obligation Bonds
Series 2009 | |
| 06/15/19 | | | 5.375 | % | | | 500,000 | | | | 530,330 | | |
Municipal Energy Agency of Nebraska
Refunding Revenue Bonds
Series 2009A (BHAC) | |
| 04/01/21 | | | 5.000 | % | | | 750,000 | | | | 860,227 | | |
Nebraska Public Power District
Revenue Bonds
Series 2008B | |
| 01/01/20 | | | 5.000 | % | | | 570,000 | | | | 641,239 | | |
University of Nebraska
Revenue Bonds
Lincoln Student Fees & Facilities
Series 2009A | |
| 07/01/23 | | | 5.000 | % | | | 700,000 | | | | 793,268 | | |
| Total | | | 2,825,064 | | |
| Nevada 1.6% | |
City of Sparks
Revenue Bonds
Senior Sales Tax Anticipation
Series 2008A(e) | |
| 06/15/20 | | | 6.500 | % | | | 4,745,000 | | | | 4,343,573 | | |
Clark County School District
Prerefunded 12/15/13 Limited General Obligation Bonds
Series 2003D (NPFGC) | |
| 06/15/16 | | | 5.000 | % | | | 10,760,000 | | | | 11,775,744 | | |
County of Clark
Limited General Obligation Refunding Bonds
Transportation
Series 2009A | |
| 12/01/28 | | | 5.000 | % | | | 10,740,000 | | | | 11,346,058 | | |
Revenue Bonds
System Subordinated Lien
Series 2009C (AGM) | |
| 07/01/25 | | | 5.000 | % | | | 8,190,000 | | | | 8,664,775 | | |
Las Vegas Redevelopment Agency
Refunding Revenue Bonds
Subordinated Lien-Freemont Street Project
Series 2003A | |
| 06/15/13 | | | 5.000 | % | | | 3,685,000 | | | | 3,828,678 | | |
| Total | | | 39,958,828 | | |
| New Hampshire 1.0% | |
City of Manchester
Refunding Revenue Bonds
Series 2004 (NPFGC) | |
| 06/01/19 | | | 5.500 | % | | | 4,450,000 | | | | 5,490,722 | | |
Issue
Description | | Coupon
Rate | | Principal
Amount | | Value | |
| Municipal Bonds (continued) | |
| New Hampshire (cont.) | |
New Hampshire Business Finance Authority
Revenue Bonds
Public Service Co. Project
Series 2001C (NPFGC) | |
| 05/01/21 | | | 5.450 | % | | $ | 1,500,000 | | | $ | 1,543,740 | | |
New Hampshire Health & Education Facilities Authority
Revenue Bonds
Southern New Hampshire Medical Center
Series 2007A | |
| 10/01/23 | | | 5.250 | % | | | 7,000,000 | | | | 7,297,500 | | |
University System
Series 2009A | |
| 07/01/23 | | | 5.000 | % | | | 8,370,000 | | | | 9,254,876 | | |
| Total | | | 23,586,838 | | |
| New Jersey 5.9% | |
Bergen County Improvement Authority
Revenue Bonds
Bergen County Utilities
Series 2008 | |
| 12/15/26 | | | 5.000 | % | | | 500,000 | | | | 552,680 | | |
Camden County Improvement Authority
Revenue Bonds
County Guaranteed
Series 2006A (AMBAC) | |
| 09/01/21 | | | 4.000 | % | | | 1,140,000 | | | | 1,169,845 | | |
Cape May County Municipal Utilities Authority
Refunding Revenue Bonds
Series 2002A (AGM) | |
| 01/01/16 | | | 5.750 | % | | | 1,000,000 | | | | 1,169,250 | | |
City of Atlantic City
Unlimited General Obligation Bonds
Series 2008A | |
| 02/15/18 | | | 5.500 | % | | | 500,000 | | | | 564,105 | | |
City of Newark
Unlimited General Obligation Refunding Bonds
General Improvement
Series 2010A | |
| 10/01/18 | | | 4.000 | % | | | 1,000,000 | | | | 1,069,640 | | |
City of Summit
Unlimited General Obligation Refunding Bonds
Series 2001 | |
| 06/01/16 | | | 5.250 | % | | | 605,000 | | | | 713,827 | | |
County of Atlantic
Unlimited General Obligation Refunding Bonds
Series 2009 | |
| 02/01/18 | | | 5.000 | % | | | 500,000 | | | | 585,615 | | |
County of Morris
Unlimited General Obligation Bonds
Series 2010 | |
| 02/15/18 | | | 5.000 | % | | | 1,000,000 | | | | 1,198,580 | | |
County of Passaic
Unlimited General Obligation Refunding Bonds
Series 2003 (AGM) | |
| 09/01/16 | | | 5.200 | % | | | 1,500,000 | | | | 1,711,875 | | |
Cumberland County Improvement Authority
Revenue Bonds
Vineland Local Unit Program
Series 2009A | |
| 04/15/19 | | | 4.000 | % | | | 750,000 | | | | 826,402 | | |
The Accompanying Notes to Financial Statements are an integral part of this statement.
15
Columbia Intermediate Municipal Bond Fund
October 31, 2011
(Percentages represent value of investments compared to net assets)
Issue
Description | | Coupon
Rate | | Principal
Amount | | Value | |
| Municipal Bonds (continued) | |
| New Jersey (cont.) | |
East Orange Board of Educatioin
Certificate of Participation
Capital Appreciation
Series 1998 (AGM)(b) | |
| 02/01/18 | | | 0.000 | % | | $ | 1,000,000 | | | $ | 775,340 | | |
Essex County Improvement Authority
Refunding Revenue Bonds
County Guaranteed Project Consolidation
Series 2004 (NPFGC) | |
| 10/01/26 | | | 5.500 | % | | | 750,000 | | | | 881,925 | | |
Essex County Utilities Authority
Refunding Revenue Bonds
Series 2009 (AGM) | |
| 04/01/20 | | | 5.000 | % | | | 1,000,000 | | | | 1,096,180 | | |
Flemington Raritan Regional Board of Education
Unlimited General Obligation Bonds
Series 2000 (NPFGC/FGIC) | |
| 02/01/15 | | | 5.700 | % | | | 400,000 | | | | 456,028 | | |
Freehold Regional High School District
Unlimited General Obligation Refunding Bonds
Series 2001 (NPFGC/FGIC) | |
| 03/01/20 | | | 5.000 | % | | | 1,205,000 | | | | 1,423,756 | | |
Hudson County Improvement Authority
Refunding Revenue Bonds
Hudson County Lease Project
Series 2010 (AGM) | |
| 10/01/24 | | | 5.375 | % | | | 2,000,000 | | | | 2,272,420 | | |
Jersey City Municipal Utilities Authority
Refunding Revenue Bonds
Series 2007 (NPFGC/FGIC) | |
| 01/01/19 | | | 5.250 | % | | | 1,000,000 | | | | 1,110,700 | | |
Manalapan-Englishtown Regional Board Of Education
Unlimited General Obligation Refunding Bonds
Series 2004 (NPFGC/FGIC) | |
| 12/01/20 | | | 5.750 | % | | | 1,325,000 | | | | 1,671,355 | | |
Middlesex County Improvement Authority
Revenue Bonds
Heldrich Center Hotel
Senior Series 2005A | |
| 01/01/20 | | | 5.000 | % | | | 815,000 | | | | 491,950 | | |
Street Student Housing Project
Series 2004A | |
| 08/15/18 | | | 5.000 | % | | | 500,000 | | | | 520,670 | | |
New Jersey Economic Development Authority
Refunding Revenue Bonds
1st Mortgage - Winchester
Series 2004A | |
| 11/01/24 | | | 5.750 | % | | | 400,000 | | | | 397,760 | | |
New Jersey American Water Co.
Series 2010A | |
| 06/01/23 | | | 4.450 | % | | | 1,000,000 | | | | 1,058,470 | | |
School Facilities-Construction
Series 2005K (AMBAC) | |
| 12/15/20 | | | 5.250 | % | | | 16,710,000 | | | | 19,110,893 | | |
| Series 2009AA | |
| 12/15/20 | | | 5.250 | % | | | 1,000,000 | | | | 1,126,550 | | |
Issue
Description | | Coupon
Rate | | Principal
Amount | | Value | |
| Municipal Bonds (continued) | |
| New Jersey (cont.) | |
Revenue Bonds
Cigarette Tax
Series 2004 | |
| 06/15/15 | | | 5.375 | % | | $ | 4,000,000 | | | $ | 4,273,960 | | |
| 06/15/16 | | | 5.500 | % | | | 5,500,000 | | | | 5,928,945 | | |
| 06/15/18 | | | 5.625 | % | | | 350,000 | | | | 350,179 | | |
| 06/15/24 | | | 5.500 | % | | | 750,000 | | | | 737,903 | | |
Liberty State Park Project
Series 2005C (AGM) | |
| 03/01/19 | | | 5.000 | % | | | 2,000,000 | | | | 2,209,660 | | |
MSU Student Housing Project
Series 2010 | |
| 06/01/21 | | | 5.000 | % | | | 1,000,000 | | | | 1,008,990 | | |
Motor Vehicle Surcharges
Series 2004A (NPFGC) | |
| 07/01/17 | | | 5.250 | % | | | 1,000,000 | | | | 1,074,640 | | |
Newark Downtown District Management Corp.
Series 2007 | |
| 06/15/27 | | | 5.125 | % | | | 400,000 | | | | 383,576 | | |
New Jersey Economic Development Authority(a)
Revenue Bonds
School Facilities-Construction
Series 2008T-3 (AGM) | |
| 09/01/20 | | | 5.000 | % | | | 550,000 | | | | 600,787 | | |
New Jersey Economic Development Authority(b)
Revenue Bonds
Capital Appreciation-Motor Vehicle Surcharges
Series 2004 (NPFGC) | |
| 07/01/21 | | | 0.000 | % | | | 1,255,000 | | | | 798,318 | | |
New Jersey Educational Facilities Authority
Refunding Revenue Bonds
Rowan University
Series 2008B (AGM) | |
| 07/01/23 | | | 5.000 | % | | | 750,000 | | | | 823,117 | | |
Revenue Bonds
Drew University
Series 2003C (NPFGC/FGIC) | |
| 07/01/20 | | | 5.250 | % | | | 1,000,000 | | | | 1,154,860 | | |
Montclair State University
Series 2009J | |
| 07/01/19 | | | 5.000 | % | | | 455,000 | | | | 511,497 | | |
New Jersey Health Care Facilities Financing Authority
Revenue Bonds
Children's Specialized Hospital
Series 2005A | |
| 07/01/18 | | | 5.000 | % | | | 575,000 | | | | 590,353 | | |
Greystone Park Psychiatric Hospital
Series 2005 (AMBAC) | |
| 09/15/13 | | | 5.000 | % | | | 970,000 | | | | 1,036,862 | | |
South Jersey Hospital
Series 2006 | |
| 07/01/20 | | | 5.000 | % | | | 1,550,000 | | | | 1,640,334 | | |
St. Josephs Healthcare System
Series 2008 | |
| 07/01/18 | | | 6.000 | % | | | 500,000 | | | | 523,395 | | |
New Jersey Higher Education Assistance Authority
Refunding Revenue Bonds
Series 2010-1A | |
| 12/01/25 | | | 5.000 | % | | | 1,000,000 | | | | 1,032,160 | | |
The Accompanying Notes to Financial Statements are an integral part of this statement.
16
Columbia Intermediate Municipal Bond Fund
October 31, 2011
(Percentages represent value of investments compared to net assets)
Issue
Description | | Coupon
Rate | | Principal
Amount | | Value | |
| Municipal Bonds (continued) | |
| New Jersey (cont.) | |
New Jersey Higher Education Student Assistance Authority
Refunding Revenue Bonds
Series 2010-1A | |
| 12/01/18 | | | 4.300 | % | | $ | 680,000 | | | $ | 729,824 | | |
Revenue Bonds
Series 2010-2 | |
| 12/01/18 | | | 3.750 | % | | | 1,000,000 | | | | 1,035,360 | | |
New Jersey Housing & Mortgage Finance Agency
Revenue Bonds
Series 2008AA | |
| 10/01/28 | | | 6.375 | % | | | 460,000 | | | | 510,591 | | |
New Jersey State Turnpike Authority
Revenue Bonds
Series 1989 Escrowed to Maturity | |
| 01/01/19 | | | 6.000 | % | | | 1,000,000 | | | | 1,238,990 | | |
| Series 2009G | |
| 01/01/18 | | | 5.000 | % | | | 800,000 | | | | 917,552 | | |
| Series 2009H | |
| 01/01/20 | | | 5.000 | % | | | 1,000,000 | | | | 1,130,830 | | |
New Jersey Transit Corp.
Certificate of Participation
Federal Transit Administration Grants
Series 2002A (AMBAC) | |
| 09/15/15 | | | 5.500 | % | | | 7,725,000 | | | | 8,664,283 | | |
| Subordinated Series 2005A (NPFGC/FGIC) | |
| 09/15/17 | | | 5.000 | % | | | 1,000,000 | | | | 1,097,930 | | |
New Jersey Transportation Trust Fund Authority
Revenue Bonds
Transportation System
Series 2001C (AGM) | |
| 12/15/18 | | | 5.500 | % | | | 2,000,000 | | | | 2,346,000 | | |
| Series 2003A (AMBAC) | |
| 12/15/15 | | | 5.500 | % | | | 4,260,000 | | | | 4,888,563 | | |
| Series 2006A | |
| 12/15/20 | | | 5.250 | % | | | 1,000,000 | | | | 1,141,070 | | |
| 12/15/21 | | | 5.500 | % | | | 680,000 | | | | 789,072 | | |
| Series 2006A (AGM) | |
| 12/15/21 | | | 5.500 | % | | | 4,700,000 | | | | 5,501,350 | | |
| 12/15/22 | | | 5.250 | % | | | 4,000,000 | | | | 4,586,120 | | |
| Series 2010D | |
| 12/15/23 | | | 5.250 | % | | | 25,000,000 | | | | 28,374,250 | | |
Newark Housing Authority
Revenue Bonds
South Ward Police Facility
Series 2009 (AGM) | |
| 12/01/18 | | | 4.500 | % | | | 600,000 | | | | 659,970 | | |
North Brunswick Township Board of Education
Unlimited General Obligation Refunding Bonds
Series 2010 | |
| 07/15/18 | | | 4.000 | % | | | 1,000,000 | | | | 1,117,910 | | |
North Hudson Sewerage Authority Sewer Revenue
Refunding Revenue Bonds
Series 2006A (NPFGC) | |
| 08/01/17 | | | 5.125 | % | | | 600,000 | | | | 663,444 | | |
Ocean County Utilities Authority
Refunding Revenue Bonds
Series 2001 | |
| 01/01/18 | | | 5.250 | % | | | 1,000,000 | | | | 1,007,350 | | |
Issue
Description | | Coupon
Rate | | Principal
Amount | | Value | |
| Municipal Bonds (continued) | |
| New Jersey (cont.) | |
| Series 2006 (NPFGC) | |
| 01/01/15 | | | 4.000 | % | | $ | 990,000 | | | $ | 1,077,476 | | |
Robbinsville Board of Education
Unlimited General Obligation Refunding Bonds
Series 2005 (AGM) | |
| 01/01/28 | | | 5.250 | % | | | 500,000 | | | | 598,375 | | |
Scotch Plains-Fanwood School District
Unlimited General Obligation Refunding Bonds
Series 2010 | |
| 07/15/19 | | | 4.000 | % | | | 845,000 | | | | 946,577 | | |
South Jersey Port Corp.
Revenue Bonds
Marine Terminal
Series 2009P-2 | |
| 01/01/16 | | | 4.000 | % | | | 1,150,000 | | | | 1,244,357 | | |
State of New Jersey
Certificate of Participation
Equipment Lease Purchase
Series 2008A | |
| 06/15/17 | | | 5.000 | % | | | 715,000 | | | | 776,576 | | |
| 06/15/21 | | | 5.000 | % | | | 250,000 | | | | 261,668 | | |
| 06/15/23 | | | 5.000 | % | | | 1,000,000 | | | | 1,030,790 | | |
| Series 2009A | |
| 06/15/17 | | | 5.000 | % | | | 1,000,000 | | | | 1,086,120 | | |
Tobacco Settlement Financing Corp.
Prerefunded 06/01/13 Revenue Bonds
Series 2003 | |
| 06/01/39 | | | 6.750 | % | | | 4,000,000 | | | | 4,400,680 | �� | |
Toms River Board of Education
Unlimited General Obligation Refunding Bonds
Regional Schools
Series 2007 (NPFGC) | |
| 01/15/20 | | | 4.500 | % | | | 500,000 | | | | 550,205 | | |
| Total | | | 145,008,635 | | |
| New Mexico 0.2% | |
County of Bernalillo
Refunding Revenue Bonds
Series 1998 | |
| 04/01/27 | | | 5.250 | % | | | 3,000,000 | | | | 3,517,560 | | |
County of Dona Ana
Improvement Refunding Revenue Bonds
Subordinated Series 1998 (AMBAC) | |
| 06/01/16 | | | 5.500 | % | | | 750,000 | | | | 810,412 | | |
| Total | | | 4,327,972 | | |
| New York 12.8% | |
Albany Industrial Development Agency
Revenue Bonds
St. Peters Hospital Project
Series 2008A | |
| 11/15/16 | | | 5.250 | % | | | 1,750,000 | | | | 1,890,752 | | |
| 11/15/17 | | | 5.250 | % | | | 1,250,000 | | | | 1,351,375 | | |
City of New York
Unlimited General Obligation Bonds
Series 2005D | |
| 08/01/13 | | | 5.000 | % | | | 4,000,000 | | | | 4,309,560 | | |
| Series 2005G | |
| 08/01/20 | | | 5.000 | % | | | 10,000,000 | | | | 11,216,200 | | |
The Accompanying Notes to Financial Statements are an integral part of this statement.
17
Columbia Intermediate Municipal Bond Fund
October 31, 2011
(Percentages represent value of investments compared to net assets)
Issue
Description | | Coupon
Rate | | Principal
Amount | | Value | |
| Municipal Bonds (continued) | |
| New York (cont.) | |
| Series 2007D-1 | |
| 12/01/21 | | | 5.000 | % | | $ | 5,900,000 | | | $ | 6,651,483 | | |
| Subordinated Series 2008B-1 | |
| 09/01/22 | | | 5.250 | % | | | 7,200,000 | | | | 8,227,368 | | |
Metropolitan Transportation Authority
Revenue Bonds
Commuter Facilities
Series 1993O Escrowed to Maturity | |
| 07/01/17 | | | 5.500 | % | | | 3,000,000 | | | | 3,559,800 | | |
| Series 2004A (NPFGC/FGIC) | |
| 11/15/16 | | | 5.250 | % | | | 3,000,000 | | | | 3,512,670 | | |
| 11/15/17 | | | 5.250 | % | | | 4,000,000 | | | | 4,747,520 | | |
| Series 2007A (AGM) | |
| 11/15/20 | | | 5.000 | % | | | 5,000,000 | | | | 5,624,350 | | |
| 11/15/21 | | | 5.000 | % | | | 3,000,000 | | | | 3,348,960 | | |
| Series 2009A | |
| 11/15/26 | | | 5.300 | % | | | 710,000 | | | | 783,989 | | |
Monroe County Industrial Development Agency
Refunding Revenue Bonds
Highland Hospital of Rochester
Series 2005 | |
| 08/01/14 | | | 5.000 | % | | | 730,000 | | | | 779,027 | | |
| 08/01/15 | | | 5.000 | % | | | 545,000 | | | | 587,537 | | |
Nassau County Interim Finance Authority
Refunding Revenue Bonds
Sales Tax Secured
Series 2003B (AMBAC) | |
| 11/15/14 | | | 5.000 | % | | | 5,720,000 | | | | 6,213,407 | | |
New York City Industrial Development Agency
Revenue Bonds
Terminal One Group Association Project
Series 2005 AMT(a)(c) | |
| 01/01/21 | | | 5.500 | % | | | 500,000 | | | | 523,995 | | |
New York City Municipal Water Finance Authority
Prerefunded 06/15/12 Revenue Bonds
Series 2002A (AGM) | |
| 06/15/16 | | | 5.375 | % | | | 10,000,000 | | | | 10,318,700 | | |
New York City Transitional Finance Authority
Prerefunded 02/01/14 Revenue Bonds
Future Tax Secured
Series 2004 | |
| 02/01/18 | | | 5.250 | % | | | 1,040,000 | | | | 1,147,838 | | |
Prerefunded 11/15/12 Revenue Bonds
Future Tax Secured
Series 1998A | |
| 11/15/16 | | | 5.500 | % | | | 1,330,000 | | | | 1,401,461 | | |
Revenue Bonds
Future Tax Secured
Series 2009A | |
| 05/01/27 | | | 5.000 | % | | | 10,430,000 | | | | 11,439,728 | | |
| Subordinated Series 2007C-1 | |
| 11/01/20 | | | 5.000 | % | | | 10,300,000 | | | | 11,796,281 | | |
Unrefunded Revenue Bonds
Future Tax Secured
Series 2004 | |
| 02/01/18 | | | 5.250 | % | | | 2,460,000 | | | | 2,678,276 | | |
Issue
Description | | Coupon
Rate | | Principal
Amount | | Value | |
| Municipal Bonds (continued) | |
| New York (cont.) | |
New York State Dormitory Authority
Refunding Revenue Bonds
Consolidated Service Contract
Series 2009A | |
| 07/01/24 | | | 5.000 | % | | $ | 3,500,000 | | | $ | 3,836,630 | | |
Revenue Bonds
City University System
Series 1995A (AMBAC/TCRS) | |
| 07/01/16 | | | 5.625 | % | | | 1,250,000 | | | | 1,351,800 | | |
| Series 1995A (FGIC) | |
| 07/01/16 | | | 5.625 | % | | | 5,000,000 | | | | 5,503,250 | | |
Court Facilities Lease
Series 2005A (AMBAC) | |
| 05/15/18 | | | 5.250 | % | | | 6,000,000 | | | | 7,033,440 | | |
Mount Sinai School of Medicine
Series 2009 | |
| 07/01/26 | | | 5.500 | % | | | 14,635,000 | | | | 15,910,148 | | |
| 07/01/27 | | | 5.500 | % | | | 10,675,000 | | | | 11,525,157 | | |
North Shore-Long Island Jewish Health
Series 2009A | |
| 05/01/30 | | | 5.250 | % | | | 4,750,000 | | | | 4,865,282 | | |
St. Johns University
Series 2007C (NPFGC) | |
| 07/01/23 | | | 5.250 | % | | | 3,245,000 | | | | 3,757,970 | | |
State University Educational Facilities
3rd General Series 2005A (NPFGC/FGIC) | |
| 05/15/17 | | | 5.500 | % | | | 10,000,000 | | | | 11,810,300 | | |
| 05/15/22 | | | 5.500 | % | | | 6,730,000 | | | | 8,177,354 | | |
| Series 1993A | |
| 05/15/15 | | | 5.250 | % | | | 5,850,000 | | | | 6,421,135 | | |
| Series 1993A (AGM) | |
| 05/15/15 | | | 5.250 | % | | | 4,000,000 | | | | 4,432,440 | | |
Upstate Community-State Supported
Series 2005B (NPFGC/FGIC) | |
| 07/01/21 | | | 5.500 | % | | | 6,345,000 | | | | 7,614,127 | | |
New York State Thruway Authority
Revenue Bonds
2nd General Series 2005B (AMBAC) | |
| 04/01/20 | | | 5.500 | % | | | 10,840,000 | | | | 13,145,776 | | |
| 2nd General Series 2007B | |
| 04/01/19 | | | 5.000 | % | | | 5,000,000 | | | | 5,719,800 | | |
Local Highway & Bridge
Series 2002 | |
| 04/01/13 | | | 5.500 | % | | | 4,510,000 | | | | 4,604,124 | | |
| Series 2007H (NPFGC/FGIC) | |
| 01/01/23 | | | 5.000 | % | | | 1,500,000 | | | | 1,645,545 | | |
New York State Urban Development Corp.
Refunding Revenue Bonds
Service Contract
Series 2008B | |
| 01/01/19 | | | 5.000 | % | | | 4,000,000 | | | | 4,607,800 | | |
| 01/01/20 | | | 5.000 | % | | | 10,460,000 | | | | 11,863,837 | | |
Revenue Bonds
State Personal Income Tax-State Facilities
Series 2004A-2 (NPFGC) | |
| 03/15/20 | | | 5.500 | % | | | 29,450,000 | | | | 36,040,910 | | |
The Accompanying Notes to Financial Statements are an integral part of this statement.
18
Columbia Intermediate Municipal Bond Fund
October 31, 2011
(Percentages represent value of investments compared to net assets)
Issue
Description | | Coupon
Rate | | Principal
Amount | | Value | |
| Municipal Bonds (continued) | |
| New York (cont.) | |
Niagara County Industrial Development Agency
Refunding Revenue Bonds
Series 2001B AMT(a)(c) | |
| 11/15/24 | | | 5.550 | % | | $ | 8,000,000 | | | $ | 8,087,840 | | |
Port Authority of New York & New Jersey
Revenue Bonds
Consolidated 154th
Series 2009 | |
| 09/01/26 | | | 4.750 | % | | | 1,000,000 | | | | 1,079,520 | | |
Tobacco Settlement Financing Corp.
Asset-Backed Revenue Bonds
Series 2003A-1 | |
| 06/01/19 | | | 5.500 | % | | | 1,250,000 | | | | 1,333,012 | | |
Triborough Bridge and Tunnel Authority
Revenue Bonds
Subordinated Series 2008D | |
| 11/15/22 | | | 5.000 | % | | | 10,000,000 | | | | 11,093,700 | | |
Triborough Bridge and Tunnel Authority(a)
Revenue Bonds
General
Subordinated Series 2008B-1 | |
| 11/15/25 | | | 5.000 | % | | | 21,500,000 | | | | 23,241,715 | | |
| Total | | | 316,812,889 | | |
| North Carolina 1.5% | |
Albemarle Hospital Authority
Refunding Revenue Bonds
Series 2007 | |
| 10/01/21 | | | 5.250 | % | | | 3,000,000 | | | | 2,846,370 | | |
| 10/01/27 | | | 5.250 | % | | | 3,700,000 | | | | 3,265,398 | | |
Cape Fear Public Utility Authority
Revenue Bonds
Series 2008 | |
| 08/01/20 | | | 5.000 | % | | | 800,000 | | | | 924,024 | | |
City of Charlotte
Revenue Bonds
Water & Sewer
Series 2008 | |
| 07/01/26 | | | 5.000 | % | | | 1,250,000 | | | | 1,396,787 | | |
County of Iredell
Certificate of Participation
Iredell County School Project
Series 2008 (AGM) | |
| 06/01/17 | | | 5.250 | % | | | 1,710,000 | | | | 1,986,969 | | |
North Carolina Eastern Municipal Power Agency
Refunding Revenue Bonds
Series 2008A (AGM) | |
| 01/01/19 | | | 5.250 | % | | | 5,415,000 | | | | 6,177,865 | | |
Revenue Bonds
Series 2009B | |
| 01/01/26 | | | 5.000 | % | | | 17,625,000 | | | | 18,712,815 | | |
North Carolina Medical Care Commission
Revenue Bonds
Health Care Housing-Arc Projects
Series 2004A | |
| 10/01/24 | | | 5.500 | % | | | 1,575,000 | | | | 1,596,483 | | |
State of North Carolina
Unlimited General Obligation Refunding Bonds
Series 2005B | |
| 04/01/17 | | | 5.000 | % | | | 1,000,000 | | | | 1,187,150 | | |
| Total | | | 38,093,861 | | |
Issue
Description | | Coupon
Rate | | Principal
Amount | | Value | |
| Municipal Bonds (continued) | |
| Ohio 2.0% | |
American Municipal Power, Inc.
Revenue Bonds
Prairie State Energy Campus Project
Series 2008A | |
| 02/15/20 | | | 5.250 | % | | $ | 4,060,000 | | | $ | 4,605,461 | | |
| 02/15/22 | | | 5.250 | % | | | 9,810,000 | | | | 10,904,992 | | |
City of Cleveland
Limited General Obligation Refunding Bonds
Series 2005 (AMBAC) | |
| 10/01/16 | | | 5.500 | % | | | 7,710,000 | | | | 8,979,297 | | |
County of Hamilton
Refunding Revenue Bonds
Series 2005A (NPFGC) | |
| 12/01/15 | | | 5.000 | % | | | 5,535,000 | | | | 6,291,192 | | |
County of Miami
Improvement Refunding Revenue Bonds
Upper Valley Medical Center
Series 2006 | |
| 05/15/21 | | | 5.250 | % | | | 500,000 | | | | 523,355 | | |
County of Montgomery
Revenue Bonds
Catholic Health Initiatives
Series 2008D-2(a) | |
| 10/01/38 | | | 5.250 | % | | | 8,000,000 | | | | 8,685,920 | | |
Mason City School District
Unlimited General Obligation Refunding Bonds
Series 2005 (NPFGC/FGIC) | |
| 12/01/19 | | | 5.250 | % | | | 2,250,000 | | | | 2,724,458 | | |
Ohio State Turnpike Commission
Refunding Revenue Bonds
Series 1998A (NPFGC/FGIC) | |
| 02/15/21 | | | 5.500 | % | | | 2,000,000 | | | | 2,435,060 | | |
State of Ohio
Refunding Revenue Bonds
Cleveland Clinic Health System
Series 2011(h) | |
| 01/01/25 | | | 5.000 | % | | | 3,750,000 | | | | 4,005,525 | | |
| Total | | | 49,155,260 | | |
| Oklahoma 0.2% | |
Chickasawa Nation
Revenue Bonds
Health System
Series 2007(e) | |
| 12/01/17 | | | 5.375 | % | | | 3,360,000 | | | | 3,584,818 | | |
Cleveland County Justice Authority
Revenue Bonds
Detention Facility Project
Series 2009A | |
| 03/01/15 | | | 5.000 | % | | | 1,260,000 | | | | 1,366,999 | | |
| Total | | | 4,951,817 | | |
| Oregon 0.2% | |
Oregon State Department of Administrative Services
Revenue Bonds
Series 2009A | |
| 04/01/24 | | | 5.250 | % | | | 1,000,000 | | | | 1,161,220 | | |
The Accompanying Notes to Financial Statements are an integral part of this statement.
19
Columbia Intermediate Municipal Bond Fund
October 31, 2011
(Percentages represent value of investments compared to net assets)
Issue
Description | | Coupon
Rate | | Principal
Amount | | Value | |
| Municipal Bonds (continued) | |
| Oregon (cont.) | |
Yamhill Clackamas & Washington Counties School
District No. 29J Newberg
Unlimited General Obligation Refunding Bonds
Series 2005 (NPFGC/FGIC) | |
| 06/15/17 | | | 5.500 | % | | $ | 2,500,000 | | | $ | 2,989,200 | | |
| Total | | | 4,150,420 | | |
| Pennsylvania 3.1% | |
City of Philadelphia
Unlimited General Obligation Bonds
Series 2011 | |
| 08/01/19 | | | 5.250 | % | | | 3,795,000 | | | | 4,210,363 | | |
Commonwealth of Pennsylvania
Unlimited General Obligation Refunding Bonds
Series 2002 | |
| 02/01/15 | | | 5.500 | % | | | 3,000,000 | | | | 3,438,480 | | |
| Series 2004 (AGM) | |
| 07/01/18 | | | 5.375 | % | | | 12,000,000 | | | | 14,607,600 | | |
| Series 2004 (NPFGC) | |
| 07/01/16 | | | 5.375 | % | | | 10,000,000 | | | | 11,834,200 | | |
County of Westmoreland
Unlimited General Obligation Bonds
Capital Appreciation
Series 1997 Escrowed to Maturity (NPFGC/FGIC)(b) | |
| 12/01/18 | | | 0.000 | % | | | 1,000,000 | | | | 742,490 | | |
Delaware Valley Regioinal Financial Authority
Revenue Bonds
Series 1997B (AMBAC) | |
| 07/01/17 | | | 5.600 | % | | | 2,000,000 | | | | 2,217,880 | | |
| Series 2002 | |
| 07/01/17 | | | 5.750 | % | | | 2,000,000 | | | | 2,233,200 | | |
Elizabeth Forward School District
Unlimited General Obligation Bonds
Capital Appreciation
Series 1994B Escrowed to Maturity (NPFGC)(b) | |
| 09/01/21 | | | 0.000 | % | | | 2,210,000 | | | | 1,658,627 | | |
Northampton County General Purpose Authority
Revenue Bonds
Saint Luke's Hospital Project
Series 2008A | |
| 08/15/20 | | | 5.000 | % | | | 3,480,000 | | | | 3,629,188 | | |
| 08/15/21 | | | 5.125 | % | | | 3,715,000 | | | | 3,871,550 | | |
| 08/15/22 | | | 5.250 | % | | | 1,965,000 | | | | 2,042,441 | | |
Pennsylvania Turnpike Commission
Revenue Bonds
Subordinated Series 2011A | |
| 12/01/31 | | | 5.625 | % | | | 8,150,000 | | | | 8,795,561 | | |
Pennsylvania Turnpike Commission(a)
Revenue Bonds
Capital Appreciation
Subordinated Series 2010B-2 | |
| 12/01/24 | | | 0.000 | % | | | 20,000,000 | | | | 17,348,800 | | |
| Total | | | 76,630,380 | | |
| Puerto Rico 1.4% | |
Commonwealth of Puerto Rico(g)
Unlimited General Obligation Bonds
Series 1997 (NPFGC) | |
| 07/01/15 | | | 6.500 | % | | | 4,190,000 | | | | 4,691,669 | | |
Issue
Description | | Coupon
Rate | | Principal
Amount | | Value | |
| Municipal Bonds (continued) | |
| Puerto Rico (cont.) | |
Unlimited General Obligation Public Improvement Bonds
Series 2006B | |
| 07/01/16 | | | 5.250 | % | | $ | 5,000,000 | | | $ | 5,403,650 | | |
Unlimited General Obligation Refunding Public Improvement Bonds
Series 2001A | |
| 07/01/13 | | | 5.500 | % | | | 6,395,000 | | | | 6,788,228 | | |
Puerto Rico Electric Power Authority(g)
Refunding Revenue Bonds
Series 2002KK (AGM) | |
| 07/01/15 | | | 5.500 | % | | | 10,000,000 | | | | 11,080,000 | | |
Revenue Bonds
Series 1997BB (NPFGC) | |
| 07/01/12 | | | 6.000 | % | | | 3,000,000 | | | | 3,099,060 | | |
Puerto Rico Highway & Transportation Authority
Refunding Revenue Bonds
Series 2005L (CIFG/TCRS/AGM)(g) | |
| 07/01/18 | | | 5.250 | % | | | 2,000,000 | | | | 2,187,120 | | |
Puerto Rico Housing Finance Authority
Subordinated Revenue Bonds
Capital Fund Modernization
Series 2008(g) | |
| 12/01/13 | | | 5.000 | % | | | 1,200,000 | | | | 1,266,168 | | |
| Total | | | 34,515,895 | | |
| Rhode Island 3.5% | |
City of Cranston
Unlimited General Obligation Bonds
Series 2008 (AGM) | |
| 07/01/26 | | | 4.750 | % | | | 900,000 | | | | 949,896 | | |
| 07/01/27 | | | 4.750 | % | | | 945,000 | | | | 991,144 | | |
Unlimited General Obligation Refunding Bonds
Series 2005 (AMBAC) | |
| 07/15/15 | | | 5.000 | % | | | 2,280,000 | | | | 2,578,429 | | |
City of Newport
Unlimited General Obligation Refunding Bonds
Series 2010 | |
| 11/01/19 | | | 5.000 | % | | | 650,000 | | | | 777,836 | | |
City of Providence
Unlimited General Obligation Bonds
Series 2001C (NPFGC/FGIC) | |
| 01/15/13 | | | 5.500 | % | | | 1,890,000 | | | | 1,973,481 | | |
Kent County Water Authority
Revenue Bonds
Series 2002A (NPFGC) | |
| 07/15/15 | | | 5.000 | % | | | 750,000 | | | | 772,643 | | |
| 07/15/16 | | | 5.000 | % | | | 1,265,000 | | | | 1,302,102 | | |
Providence Housing Authority
Revenue Bonds
Capital Fund
Series 2008 | |
| 09/01/24 | | | 5.000 | % | | | 565,000 | | | | 607,200 | | |
| 09/01/26 | | | 5.000 | % | | | 310,000 | | | | 326,216 | | |
| 09/01/27 | | | 5.000 | % | | | 690,000 | | | | 719,918 | | |
Rhode Island Clean Water Finance Agency
Revenue Bonds
Revolving Fund-Pooled Loan
Series 2009A | |
| 10/01/25 | | | 5.000 | % | | | 720,000 | | | | 829,274 | | |
The Accompanying Notes to Financial Statements are an integral part of this statement.
20
Columbia Intermediate Municipal Bond Fund
October 31, 2011
(Percentages represent value of investments compared to net assets)
Issue
Description | | Coupon
Rate | | Principal
Amount | | Value | |
| Municipal Bonds (continued) | |
| Rhode Island (cont.) | |
Revolving Fund-Pooled Loan Association
Series 2004A | |
| 10/01/23 | | | 4.750 | % | | $ | 1,000,000 | | | $ | 1,055,030 | | |
Safe Drinking Water Revolving Fund
Series 2004A | |
| 10/01/18 | | | 5.000 | % | | | 1,000,000 | | | | 1,106,550 | | |
Water Pollution Control Revolving Fund
Series 2007 | |
| 10/01/21 | | | 4.750 | % | | | 1,000,000 | | | | 1,126,120 | | |
Rhode Island Convention Center Authority
Refunding Revenue Bonds
Series 2005A (AGM) | |
| 05/15/21 | | | 5.000 | % | | | 4,500,000 | | | | 4,889,970 | | |
| 05/15/22 | | | 5.000 | % | | | 3,525,000 | | | | 3,857,231 | | |
| 05/15/23 | | | 5.000 | % | | | 5,905,000 | | | | 6,423,636 | | |
Rhode Island Depositors Economic Protection Corp.
Prerefunded 08/01/13 Revenue Bonds
Series 1993A (AGM) | |
| 08/01/14 | | | 5.750 | % | | | 2,105,000 | | | | 2,292,766 | | |
Revenue Bonds
Series 1993A Escrowed to Maturity (AGM) | |
| 08/01/21 | | | 5.750 | % | | | 2,165,000 | | | | 2,733,789 | | |
Rhode Island Economic Development Corp.
Revenue Bonds
Department of Transportation
Series 2006A (AMBAC) | |
| 06/15/22 | | | 5.000 | % | | | 1,000,000 | | | | 1,056,860 | | |
East Greenwich Free Library Association
Series 2004 | |
| 06/15/14 | | | 4.500 | % | | | 170,000 | | | | 170,158 | | |
| 06/15/24 | | | 5.750 | % | | | 415,000 | | | | 411,593 | | |
Grant Anticipation-Department of Transportation
Series 2003A (AGM) | |
| 06/15/14 | | | 5.000 | % | | | 2,225,000 | | | | 2,377,057 | | |
| Series 2009A (AGM) | |
| 06/15/21 | | | 5.250 | % | | | 2,000,000 | | | | 2,302,300 | | |
Providence Place Mall
Series 2000 | |
| 07/01/20 | | | 6.125 | % | | | 1,700,000 | | | | 1,662,362 | | |
| Series 2008C (AGM) | |
| 07/01/17 | | | 5.000 | % | | | 2,245,000 | | | | 2,493,971 | | |
Rhode Island Health & Educational Building Corp.
Refunding Revenue Bonds
Higher Education-Johnson & Wales
Series 2003 (XLCA) | |
| 04/01/15 | | | 5.250 | % | | | 1,500,000 | | | | 1,531,545 | | |
| 04/01/16 | | | 5.250 | % | | | 1,485,000 | | | | 1,508,834 | | |
Hospital Financing-Lifespan Obligation
Series 2006A (AGM) | |
| 05/15/26 | | | 5.000 | % | | | 2,000,000 | | | | 2,071,320 | | |
University of Rhode Island
Series 2008A | |
| 09/15/28 | | | 6.500 | % | | | 3,000,000 | | | | 3,360,510 | | |
Revenue Bonds
Bond Financing Program
Series 2009 | |
| 05/15/25 | | | 5.000 | % | | | 1,515,000 | | | | 1,663,364 | | |
Issue
Description | | Coupon
Rate | | Principal
Amount | | Value | |
| Municipal Bonds (continued) | |
| Rhode Island (cont.) | |
Brown University
Series 2007 | |
| 09/01/18 | | | 5.000 | % | | $ | 1,000,000 | | | $ | 1,172,790 | | |
Higher Education Facility
Series 2003A (AMBAC) | |
| 09/15/13 | | | 5.000 | % | | | 710,000 | | | | 741,290 | | |
| Series 2004A (AMBAC) | |
| 09/15/20 | | | 5.250 | % | | | 1,020,000 | | | | 1,084,433 | | |
| Series 2004D (XLCA) | |
| 08/15/16 | | | 5.500 | % | | | 1,340,000 | | | | 1,451,662 | | |
| 08/15/17 | | | 5.500 | % | | | 1,345,000 | | | | 1,445,418 | | |
Higher Education-Johnson & Wales
Series 1999 (NPFGC) | |
| 04/01/15 | | | 5.500 | % | | | 1,000,000 | | | | 1,100,150 | | |
| 04/01/17 | | | 5.500 | % | | | 1,000,000 | | | | 1,123,460 | | |
| 04/01/18 | | | 5.500 | % | | | 1,420,000 | | | | 1,600,596 | | |
Higher Educational-Providence College
Series 2003A (XLCA) | |
| 11/01/24 | | | 5.000 | % | | | 2,000,000 | | | | 2,048,820 | | |
Hospital Financing-Lifespan Obligation
Series 2009A (AGM) | |
| 05/15/27 | | | 6.125 | % | | | 400,000 | | | | 445,212 | | |
| 05/15/30 | | | 6.250 | % | | | 500,000 | | | | 546,385 | | |
New England Institute of Technology
Series 2010 | |
| 03/01/24 | | | 5.000 | % | | | 1,145,000 | | | | 1,223,730 | | |
Providence Public Schools Financing Program
Series 2006A (AGM) | |
| 05/15/23 | | | 5.000 | % | | | 2,000,000 | | | | 2,071,140 | | |
| Series 2007A (AGM) | |
| 05/15/22 | | | 5.000 | % | | | 2,000,000 | | | | 2,096,120 | | |
| Series 2007C (AGM) | |
| 05/15/21 | | | 5.000 | % | | | 1,500,000 | | | | 1,582,455 | | |
Public Schools Financing Program
Series 2007B (AMBAC) | |
| 05/15/19 | | | 4.250 | % | | | 250,000 | | | | 212,543 | | |
Times2 Academy
Series 2004 | |
| 12/15/24 | | | 5.000 | % | | | 1,500,000 | | | | 1,511,550 | | |
University of Rhode Island
Series 2009A (AGM) | |
| 09/15/24 | | | 4.750 | % | | | 1,000,000 | | | | 1,070,470 | | |
Rhode Island Student Loan Authority
Revenue Bonds
Program
Senior Series 2010A | |
| 12/01/20 | | | 4.600 | % | | | 885,000 | | | | 921,736 | | |
State of Rhode Island
Certificate of Participation
Lease-Training School Project
Series 2005A (NPFGC) | |
| 10/01/19 | | | 5.000 | % | | | 1,200,000 | | | | 1,289,280 | | |
Unlimited General Obligation Bonds
Consolidated Capital Development Loan
Series 2006C (NPFGC) | |
| 11/15/18 | | | 5.000 | % | | | 1,000,000 | | | | 1,132,490 | | |
The Accompanying Notes to Financial Statements are an integral part of this statement.
21
Columbia Intermediate Municipal Bond Fund
October 31, 2011
(Percentages represent value of investments compared to net assets)
Issue
Description | | Coupon
Rate | | Principal
Amount | | Value | |
| Municipal Bonds (continued) | |
| Rhode Island (cont.) | |
Unlimited General Obligation Refunding Bonds
Consolidated Capital Development Loan
Series 2005A (AGM) | |
| 08/01/17 | | | 5.000 | % | | $ | 2,000,000 | | | $ | 2,249,300 | | |
| Series 2006A (AGM) | |
| 08/01/20 | | | 4.500 | % | | | 1,750,000 | | | | 1,882,195 | | |
Town of Coventry
Prerefunded 06/15/12 Unlimited General Obligation Bonds
Series 2002 (AMBAC) | |
| 06/15/22 | | | 5.000 | % | | | 750,000 | | | | 779,595 | | |
Town of Johnston
Unlimited General Obligation Bonds
Various Purpose
Series 2004 (XLCA) | |
| 06/01/20 | | | 5.250 | % | | | 555,000 | | | | 575,185 | | |
| Total | | | 87,281,110 | | |
| South Carolina 1.2% | |
Berkeley County School District
Revenue Bonds
Securing Assets for Education
Series 2003 | |
| 12/01/18 | | | 5.250 | % | | | 1,000,000 | | | | 1,068,180 | | |
| 12/01/28 | | | 5.000 | % | | | 7,205,000 | | | | 7,311,418 | | |
Charleston Educational Excellence Finance Corp.
Revenue Bonds
Charleston County School District
Series 2005 | |
| 12/01/24 | | | 5.250 | % | | | 10,000,000 | | | | 10,817,600 | | |
Dorchester County School District No. 2
Revenue Bonds
Growth Remedy Opportunity Tax Hike
Series 2004 | |
| 12/01/17 | | | 5.250 | % | | | 2,000,000 | | | | 2,154,840 | | |
Greenville County School District
Refunding Revenue Bonds
Building Equity Sooner
Series 2005 | |
| 12/01/18 | | | 5.500 | % | | | 5,000,000 | | | | 6,015,950 | | |
Newberry Investing in Children's Education
Revenue Bonds
Newberry County School District Project
Series 2005 | |
| 12/01/19 | | | 5.250 | % | | | 1,500,000 | | | | 1,593,270 | | |
| Total | | | 28,961,258 | | |
| Tennessee 0.7% | |
Blount County Public Building Authority
Revenue Bonds
Local Government Public Improvement Bonds
Series 2004B-5-A (NPFGC/FGIC) | |
| 06/01/16 | | | 5.000 | % | | | 1,075,000 | | | | 1,135,028 | | |
City of Chattanooga
Unlimited General Obligation Refunding Bonds
Series 2005A (AGM) | |
| 09/01/14 | | | 5.000 | % | | | 4,150,000 | | | | 4,648,830 | | |
Issue
Description | | Coupon
Rate | | Principal
Amount | | Value | |
| Municipal Bonds (continued) | |
| Tennessee (cont.) | |
County of Overton
Unlimited General Obligation Refunding Bonds
School
Series 2004 (NPFGC) | |
| 04/01/16 | | | 5.000 | % | | $ | 1,000,000 | | | $ | 1,092,850 | | |
Memphis-Shelby County Airport Authority
Refunding Revenue Bonds
Federal Express Corp.
Series 1997 | |
| 09/01/12 | | | 5.350 | % | | | 3,530,000 | | | | 3,637,524 | | |
Metropolitan Government Nashville & Davidson County
Health & Educational Facilities Board
Improvement Refunding Revenue Bonds
Meharry Medical College
Series 1996 (AMBAC) | |
| 12/01/16 | | | 6.000 | % | | | 3,800,000 | | | | 4,146,332 | | |
Metropolitan Government of Nashville & Davidson County
Refunding Revenue Bonds
Series 1998B | |
| 05/15/13 | | | 5.500 | % | | | 3,000,000 | | | | 3,230,280 | | |
| Total | | | 17,890,844 | | |
| Texas 9.7% | |
Aldine Independent School District
Unlimited General Obligation Refunding Bonds
Series 2005 (Permanent School Fund Guarantee) | |
| 02/15/15 | | | 5.250 | % | | | 1,655,000 | | | | 1,813,350 | | |
Barbers Hill Independent School District
Unlimited General Obligation Refunding Bonds
Series 2003 (Permanent School Fund Guarantee) | |
| 02/15/22 | | | 5.000 | % | | | 1,030,000 | | | | 1,075,959 | | |
Brownwood Independent School District
Unlimited General Obligation Refunding Bonds
School Building
Series 2005 (NPFGC/FGIC) | |
| 02/15/17 | | | 5.250 | % | | | 1,310,000 | | | | 1,437,974 | | |
Central Texas Regional Mobility Authority
Revenue Bonds
Senior Lien
Series 2010 | |
| 01/01/19 | | | 5.750 | % | | | 750,000 | | | | 806,835 | | |
| 01/01/20 | | | 5.750 | % | | | 1,250,000 | | | | 1,341,575 | | |
| Series 2011 | |
| 01/01/31 | | | 5.750 | % | | | 10,300,000 | | | | 10,379,310 | | |
City of Austin Electric Utility
Refunding Revenue Bonds
Series 2002A (AMBAC) | |
| 11/15/13 | | | 5.500 | % | | | 2,000,000 | | | | 2,189,120 | | |
City of Austin
Refunding Revenue Bonds
Subordinated Lien
Series 1998 (NPFGC) | |
| 05/15/18 | | | 5.250 | % | | | 1,100,000 | | | | 1,280,059 | | |
City of Corpus Christi
Limited General Obligation Bonds
Hotel Occupancy Certificates Obligation
Series 2002 (AGM) | |
| 09/01/15 | | | 5.500 | % | | | 1,655,000 | | | | 1,721,481 | | |
The Accompanying Notes to Financial Statements are an integral part of this statement.
22
Columbia Intermediate Municipal Bond Fund
October 31, 2011
(Percentages represent value of investments compared to net assets)
Issue
Description | | Coupon
Rate | | Principal
Amount | | Value | |
| Municipal Bonds (continued) | |
| Texas (cont.) | |
Refunding Revenue Bonds
Series 2005A (AMBAC) | |
| 07/15/19 | | | 5.000 | % | | $ | 2,000,000 | | | $ | 2,169,180 | | |
City of El Paso
Limited General Obligation Refunding Bonds
Series 2005 (NPFGC/FGIC) | |
| 08/15/14 | | �� | 5.250 | % | | | 2,000,000 | | | | 2,237,580 | | |
City of Houston Utility System
Refunding Revenue Bonds
1st Lien
Series 2004A (NPFGC/FGIC) | |
| 05/15/24 | | | 5.250 | % | | | 5,000,000 | | | | 5,415,800 | | |
City of Houston
Limited General Obligation Bonds
Series 2005E (AMBAC) | |
| 03/01/20 | | | 5.000 | % | | | 2,525,000 | | | | 2,736,544 | | |
Prerefunded 12/01/11 Revenue Bonds
Series 2001A (AGM) | |
| 12/01/17 | | | 5.500 | % | | | 4,720,000 | | | | 4,740,815 | | |
Revenue Bonds
Subordinated Lien
Series 2002 (AGM) | |
| 07/01/27 | | | 5.000 | % | | | 5,000,000 | | | | 5,041,150 | | |
City of Houston(b)
Revenue Bonds
Capital Appreciation-Convention
Series 2001B (AMBAC) | |
| 09/01/17 | | | 0.000 | % | | | 2,000,000 | | | | 1,572,080 | | |
City of Irving
Prerefunded 11/15/15 Limited General Obligation Bonds
Improvement
Series 2005A | |
| 11/15/18 | | | 5.000 | % | | | 1,075,000 | | | | 1,245,162 | | |
Unrefunded Limited General Obligation Bonds
Improvement
Series 2005A | |
| 11/15/18 | | | 5.000 | % | | | 925,000 | | | | 1,038,303 | | |
City of Laredo
Limited General Obligation Refunding Bonds
Series 2005 (AMBAC) | |
| 08/15/20 | | | 5.000 | % | | | 1,065,000 | | | | 1,147,239 | | |
City of McKinney
Limited General Obligation Bonds
Waterworks & Sewer System
Series 2005 (NPFGC/FGIC) | |
| 08/15/17 | | | 5.250 | % | | | 1,125,000 | | | | 1,264,219 | | |
City of San Antonio
Refunding Revenue Bonds
Series 2005 | |
| 02/01/18 | | | 5.000 | % | | | 10,000,000 | | | | 11,076,000 | | |
System
Series 2002 | |
| 02/01/14 | | | 5.375 | % | | | 2,500,000 | | | | 2,761,975 | | |
City of West University Place
Limited General Obligation Refunding Bonds
Permanent Improvement
Series 2002 | |
| 02/01/15 | | | 5.500 | % | | | 645,000 | | | | 652,901 | | |
Issue
Description | | Coupon
Rate | | Principal
Amount | | Value | |
| Municipal Bonds (continued) | |
| Texas (cont.) | |
Conroe Independent School District
Prerefunded 02/15/15 Unlimited General Obligation Bonds
Schoolhouse
Series 2005C (Permanent School Fund Guarantee) | |
| 02/15/19 | | | 5.000 | % | | $ | 1,650,000 | | | $ | 1,871,199 | | |
Unlimited General Obligation Bonds
School Building
Series 2009A | |
| 02/15/25 | | | 5.250 | % | | | 1,135,000 | | | | 1,275,888 | | |
Corpus Christi Business & Job Development Corp.
Improvement Refunding Revenue Bonds
Arena Project
Series 2002 (AMBAC) | |
| 09/01/14 | | | 5.500 | % | | | 2,065,000 | | | | 2,204,181 | | |
| 09/01/18 | | | 5.500 | % | | | 1,250,000 | | | | 1,331,538 | | |
County of Williamson
Unlimited General Obligation Bonds
Series 2005 (NPFGC) | |
| 02/15/16 | | | 5.000 | % | | | 1,985,000 | | | | 2,221,016 | | |
Dallas County Community College District
Limited General Obligation Bonds
Series 2009 | |
| 02/15/20 | | | 5.000 | % | | | 750,000 | | | | 895,425 | | |
Dickinson Independent School District
Unlimited General Obligation Bonds
Series 2006 (Permanent School Fund Guarantee) | |
| 02/15/20 | | | 5.000 | % | | | 2,405,000 | | | | 2,729,747 | | |
Dripping Springs Independent School District
Unlimited General Obligation Bonds
School Building
Series 2008 (Permanent School Fund Guarantee) | |
| 02/15/26 | | | 5.000 | % | | | 1,000,000 | | | | 1,127,850 | | |
Duncanville Independent School District
Unlimited General Obligation Refunding Bonds
Capital Appreciation
Series 2005 (Permanent School Fund Guarantee)(b) | |
| 02/15/22 | | | 0.000 | % | | | 2,000,000 | | | | 1,444,160 | | |
Gulf Coast Waste Disposal Authority(a)
Revenue Bonds
BP Products North America
Series 2007 | |
| 01/01/42 | | | 2.300 | % | | | 3,350,000 | | | | 3,405,141 | | |
Gulf Coast Waste Disposal Authority(c)
Refunding Revenue Bonds
Series 2002A AMT | |
| 08/01/24 | | | 6.100 | % | | | 5,750,000 | | | | 5,910,310 | | |
Harris County Flood Control District
Limited General Obligation Bonds
Improvement
Series 2006 | |
| 10/01/29 | | | 4.750 | % | | | 10,000,000 | | | | 10,426,700 | | |
Harris County Health Facilities Development Corp.
Revenue Bonds
Memorial Hospital System Project
Series 1997A (NPFGC) | |
| 06/01/13 | | | 6.000 | % | | | 2,170,000 | | | | 2,312,591 | | |
The Accompanying Notes to Financial Statements are an integral part of this statement.
23
Columbia Intermediate Municipal Bond Fund
October 31, 2011
(Percentages represent value of investments compared to net assets)
Issue
Description | | Coupon
Rate | | Principal
Amount | | Value | |
| Municipal Bonds (continued) | |
| Texas (cont.) | |
Harris County Industrial Development Corp.
Revenue Bonds
Deer Park Refining Project
Series 2008 | |
| 05/01/18 | | | 4.700 | % | | $ | 12,000,000 | | | $ | 12,918,120 | | |
Houston Area Water Corp.
Prerefunded 03/01/12 Revenue Bonds
Northeast Water Purification Project
Series 2002 (FGIC) | |
| 03/01/18 | | | 5.500 | % | | | 3,000,000 | | | | 3,052,800 | | |
Houston Higher Education Finance Corp.
Revenue Bonds
Cosmos Foundation, Inc.
Series 2011A | |
| 05/15/31 | | | 6.500 | % | | | 1,000,000 | | | | 1,061,990 | | |
Houston Independent School District
Limited General Obligation Refunding Bonds
Limited Tax
Series 2007 (Permanent School Fund Guarantee) | |
| 02/15/25 | | | 4.500 | % | | | 5,000,000 | | | | 5,280,350 | | |
La Joya Independent School District
Unlimited General Obligation Refunding Bonds
Series 2005 (Permanent School Fund Guarantee) | |
| 02/15/20 | | | 5.000 | % | | | 1,000,000 | | | | 1,106,310 | | |
La Marque Independent School District
Unlimited General Obligation Refunding Bonds
Series 2003 (Permanent School Fund Guarantee) | |
| 02/15/21 | | | 5.000 | % | | | 1,740,000 | | | | 1,823,816 | | |
Lewisville Independent School District
Unlimited General Obligation Bonds
School Building
Series 2009 | |
| 08/15/21 | | | 5.000 | % | | | 1,000,000 | | | | 1,185,660 | | |
Lower Colorado River Authority
Refunding Revenue Bonds
5th Supplemental Series 1993 Escrowed to Maturity | |
| 01/01/16 | | | 5.375 | % | | | 2,100,000 | | | | 2,453,388 | | |
LCRA Transmission Services Corp. Project
Series 2011 | |
| 05/15/27 | | | 5.000 | % | | | 11,195,000 | | | | 11,938,124 | | |
North Central Texas Health Facility Development Corp.
Revenue Bonds
Hospital-Presbyterian Healthcare
Series 1996B Escrowed to Maturity (NPFGC) | |
| 06/01/16 | | | 5.500 | % | | | 9,825,000 | | | | 11,145,971 | | |
North Harris County Regional Water Authority
Revenue Bonds
Senior Lien
Series 2008 | |
| 12/15/20 | | | 5.250 | % | | | 4,415,000 | | | | 5,043,343 | | |
North Texas Tollway Authority
Refunding Revenue Bonds
System-1st Tier
Series 2008A | |
| 01/01/22 | | | 6.000 | % | | | 14,000,000 | | | | 15,850,800 | | |
Issue
Description | | Coupon
Rate | | Principal
Amount | | Value | |
| Municipal Bonds (continued) | |
| Texas (cont.) | |
North Texas Tollway Authority(a)
Refunding Revenue Bonds
System-1st Tier
Series 2008E-3 | |
| 01/01/38 | | | 5.750 | % | | $ | 9,350,000 | | | $ | 10,668,350 | | |
SA Energy Acquisition Public Facility Corp.
Revenue Bonds
Gas Supply
Series 2007 | |
| 08/01/16 | | | 5.250 | % | | | 4,450,000 | | | | 4,700,980 | | |
Sam Rayburn Municipal Power Agency
Refunding Revenue Bonds
Series 2002 | |
| 10/01/16 | | | 6.000 | % | | | 3,000,000 | | | | 3,082,890 | | |
| 10/01/21 | | | 6.000 | % | | | 2,725,000 | | | | 2,773,151 | | |
San Juan Higher Education Finance Authority
Revenue Bonds
Idea Public Schools
Series 2010A | |
| 08/15/20 | | | 5.125 | % | | | 2,000,000 | | | | 2,022,420 | | |
| 08/15/24 | | | 5.750 | % | | | 1,590,000 | | | | 1,625,044 | | |
Southwest Higher Education Authority, Inc.
Revenue Bonds
Southern Methodist University Project
Series 2009 | |
| 10/01/26 | | | 5.000 | % | | | 1,000,000 | | | | 1,070,760 | | |
Spring Independent School District
Unlimited General Obligation Bonds
Schoolhouse
Series 2009 (Permanent School Fund Guarantee) | |
| 08/15/21 | | | 5.000 | % | | | 750,000 | | | | 863,048 | | |
Tarrant County Cultural Education Facilities Finance Corp.
Revenue Bonds
Air Force Obligation Group
Series 2007 | |
| 05/15/27 | | | 5.125 | % | | | 3,750,000 | | | | 3,471,262 | | |
Buckner Retirement Services, Inc. Project
Series 2007 | |
| 11/15/11 | | | 5.000 | % | | | 750,000 | | | | 750,955 | | |
Texas City Industrial Development Corp.
Refunding Revenue Bonds
Arco Pipe Line Co. Project
Series 1990 | |
| 10/01/20 | | | 7.375 | % | | | 3,000,000 | | | | 3,781,260 | | |
Texas Municipal Gas Acquisition & Supply Corp.
Revenue Bonds
Senior Lien
Series 2006A | |
| 12/15/12 | | | 5.000 | % | | | 5,500,000 | | | | 5,750,525 | | |
Texas Public Finance Authority
Revenue Bonds
Stephen F. Austin State University Financing
Series 2005 (NPFGC) | |
| 10/15/19 | | | 5.000 | % | | | 2,000,000 | | | | 2,171,620 | | |
The Accompanying Notes to Financial Statements are an integral part of this statement.
24
Columbia Intermediate Municipal Bond Fund
October 31, 2011
(Percentages represent value of investments compared to net assets)
Issue
Description | | Coupon
Rate | | Principal
Amount | | Value | |
| Municipal Bonds (continued) | |
| Texas (cont.) | |
Trinity River Authority
Improvement Refunding Revenue Bonds
Tarrant County Water Project
Series 2005 (NPFGC) | |
| 02/01/17 | | | 5.000 | % | | $ | 1,000,000 | | | $ | 1,116,130 | | |
| 02/01/18 | | | 5.000 | % | | | 1,000,000 | | | | 1,113,430 | | |
University of Houston
Refunding Revenue Bonds
Series 2009 | |
| 02/15/21 | | | 5.000 | % | | | 1,000,000 | | | | 1,144,030 | | |
University of Texas System
Prerefunded 02/15/17 Revenue Bonds
Financing System
Series 2006D | |
| 08/15/18 | | | 5.000 | % | | | 8,455,000 | | | | 9,965,824 | | |
Refunding Revenue Bonds
Financing System
Series 2004A | |
| 08/15/17 | | | 5.250 | % | | | 2,000,000 | | | | 2,398,480 | | |
Unrefunded Revenue Bonds
Financing System
Series 2006D | |
| 08/15/18 | | | 5.000 | % | | | 1,545,000 | | | | 1,796,202 | | |
Uptown Development Authority
Tax Allocation Bonds
Infrastructure Improvement Facilities
Series 2009 | |
| 09/01/22 | | | 5.000 | % | | | 750,000 | | | | 768,015 | | |
West Harris County Regional Water Authority
Revenue Bonds
Series 2009 | |
| 12/15/25 | | | 5.000 | % | | | 1,000,000 | | | | 1,078,790 | | |
White Settlement Independent School District
Unlimited General Obligation Refunding Bonds
Series 2003 (Permanent School Fund Guarantee) | |
| 08/15/19 | | | 5.375 | % | | | 1,910,000 | | | | 2,053,861 | | |
| Total | | | 239,328,056 | | |
| Utah 0.9% | |
Intermountain Power Agency
Refunding Revenue Bonds
Subordinated Series 2007A (AMBAC) | |
| 07/01/17 | | | 5.000 | % | | | 15,000,000 | | | | 17,325,150 | | |
Utah State Building Ownership Authority
Refunding Revenue Bonds
State Facilities Master Lease Program
Series 1998C Escrowed to Maturity (AGM) | |
| 05/15/14 | | | 5.500 | % | | | 5,000,000 | | | | 5,583,550 | | |
| Total | | | 22,908,700 | | |
| Virginia 1.4% | |
Augusta County Industrial Development Authority
Refunding Revenue Bonds
Augusta Health Care, Inc.
Series 2003 | |
| 09/01/18 | | | 5.250 | % | | | 1,500,000 | | | | 1,689,285 | | |
Peninsula Town Center Community Development Authority
Revenue Bonds
Series 2007 | |
| 09/01/24 | | | 6.250 | % | | | 2,363,000 | | | | 2,374,201 | | |
Issue
Description | | Coupon
Rate | | Principal
Amount | | Value | |
| Municipal Bonds (continued) | |
| Virginia (cont.) | |
Virginia College Building Authority
Revenue Bonds
Public Higher Education Financing Program
Series 2009A | |
| 09/01/24 | | | 5.000 | % | | $ | 1,000,000 | | | $ | 1,127,970 | | |
Virginia Public School Authority
Refunding Revenue Bonds
School Financing 1997 Resolution
Series 2005B | |
| 08/01/16 | | | 5.250 | % | | | 13,995,000 | | | | 16,521,097 | | |
Revenue Bonds
School Financing 1997 Resolution
Series 2005C | |
| 08/01/16 | | | 5.000 | % | | | 6,285,000 | | | | 7,147,176 | | |
Virginia Resources Authority
Revenue Bonds
State Revolving Fund
Series 2009 | |
| 10/01/22 | | | 5.000 | % | | | 500,000 | | | | 591,235 | | |
| Subordinated Series 2008 | |
| 10/01/19 | | | 5.000 | % | | | 1,000,000 | | | | 1,189,670 | | |
Subordinated Revenue Bonds
Clean Water State Revolving Fund
Series 2007 | |
| 10/01/17 | | | 5.000 | % | | | 3,760,000 | | | | 4,490,606 | | |
| Total | | | 35,131,240 | | |
| Washington 1.5% | |
Clark County School District No. 37 Vancouver
Unlimited General Obligation Bonds
Series 2001C (NPFGC/FGIC)(b) | |
| 12/01/16 | | | 0.000 | % | | | 1,000,000 | | | | 895,910 | | |
Energy Northwest
Refunding Revenue Bonds
Project No.1
Series 2002A (NPFGC) | |
| 07/01/16 | | | 5.500 | % | | | 4,675,000 | | | | 4,829,369 | | |
Revenue Bonds
Columbia Generating Station
Series 2007D | |
| 07/01/22 | | | 5.000 | % | | | 1,000,000 | | | | 1,115,610 | | |
State of Washington
Prerefunded 01/01/12 Limited General Obligation Bonds
Various Purpose
Series 2002R-03A (NPFGC) | |
| 01/01/18 | | | 5.000 | % | | | 6,485,000 | | | | 6,532,405 | | |
Unlimited General Obligation Bonds
Motor Vehicle Fuel
Series 2010B | |
| 08/01/26 | | | 5.000 | % | | | 18,270,000 | | | | 20,969,758 | | |
| Series 2007A | |
| 07/01/21 | | | 5.000 | % | | | 700,000 | | | | 792,099 | | |
| Series 2008D | |
| 01/01/20 | | | 5.000 | % | | | 1,000,000 | | | | 1,151,270 | | |
| Total | | | 36,286,421 | | |
The Accompanying Notes to Financial Statements are an integral part of this statement.
25
Columbia Intermediate Municipal Bond Fund
October 31, 2011
(Percentages represent value of investments compared to net assets)
Issue
Description | | Coupon
Rate | | Principal
Amount | | Value | |
| Municipal Bonds (continued) | |
| West Virginia 0.5% | |
West Virginia Economic Development Authority
Refunding Revenue Bonds
Appalachian Power Co. Amos
Series 2008C(a) | |
| 05/01/19 | | | 4.850 | % | | $ | 6,500,000 | | | $ | 6,855,420 | | |
West Virginia Hospital Finance Authority
Revenue Bonds
Charleston Area Medical Center, Inc.
Series 1993A Escrowed to Maturity | |
| 09/01/23 | | | 6.500 | % | | | 3,980,000 | | | | 5,168,906 | | |
| Total | | | 12,024,326 | | |
| Wisconsin 1.5% | |
City of Sheboygan
Refunding Revenue Bonds
Wisconsin Power
Series 2006 (FGIC) | |
| 09/01/15 | | | 5.000 | % | | | 5,600,000 | | | | 6,228,432 | | |
State of Wisconsin
Revenue Bonds
Series 2009A | |
| 05/01/22 | | | 5.000 | % | | | 1,000,000 | | | | 1,130,850 | | |
| 05/01/23 | | | 5.125 | % | | | 14,000,000 | | | | 15,821,260 | | |
Wisconsin Health & Educational Facilities Authority
Refunding Revenue Bonds
Wheaton Healthcare
Series 2006B | |
| 08/15/23 | | | 5.125 | % | | | 13,065,000 | | | | 13,068,397 | | |
Revenue Bonds
St. John's Communities, Inc.
Series 2009C-2 | |
| 09/15/14 | | | 5.400 | % | | | 500,000 | | | | 500,185 | | |
| Total | | | 36,749,124 | | |
Total Municipal Bonds
(Cost: $2,301,700,043) | | $ | 2,427,384,500 | | |
Issue
Description | | Effective
Yield | | Amount
Payable at
Maturity | | Value | |
| Floating Rate Notes 0.1% | |
| Colorado 0.1% | |
Colorado Educational & Cultural Facilities Authority
Revenue Bonds
Flying J Ranch LLC
VRDN Series 2006 (U.S. Bank)(a)(i) | |
| 03/01/36 | | | 0.130 | % | | $ | 800,000 | | | $ | 800,000 | | |
| Missouri —% | |
Missouri State Health & Educational Facilities Authority
Revenue Bonds
St. Louis University
VRDN Series 2008A-2 (Wells Fargo Bank)(a)(i) | |
| 10/01/35 | | | 0.090 | % | | | 700,000 | | | | 700,000 | | |
Total Floating Rate Notes
(Cost: $1,500,000) | | $ | 1,500,000 | | |
| | | | | Shares | | Value | |
| Money Market Funds 1.0% | |
Dreyfus Tax-Exempt Cash
Management Fund, 0.000%(j) | | | | | 9,917,590 | | | $ | 9,917,590 | | |
JPMorgan Tax-Free Money
Market Fund, 0.010%(j) | | | | | 15,240,894 | | | | 15,240,894 | | |
Total Money Market Funds
(Cost: $25,158,484) | | | | | | $ | 25,158,484 | | |
Total Investments
(Cost: $2,328,358,527) | | | | | | $ | 2,454,042,984 | | |
| Other Assets & Liabilities, Net | | | | | | | 17,176,318 | | |
| Total Net Assets | | $ | 2,471,219,302 | | |
Notes to Portfolio of Investments
(a) Variable rate security. The interest rate shown reflects the rate as of October 31, 2011.
(b) Zero coupon bond.
(c) At October 31, 2011, the value of securities subject to alternative minimum tax represented 0.67% of net assets.
(d) Identifies issues considered to be illiquid as to their marketability. The aggregate value of such securities at October 31, 2011 was $7,298,880, representing 0.30% of net assets. Information concerning such security holdings at October 31, 2011 was as follows:
| Security Description | | Acquisition
Dates | | Cost | |
Capital Trust Agency
Revenue Bonds
Atlantic Housing Foundation
Subordinated Series 2008B
7.000% 07/15/32 | | 07/23/08 | | $ | 1,910,000 | | |
Illinois Finance Authority
Revenue Bonds
Sedgebrook, Inc. Facility
Series 2007A
5.500% 11/15/12 | | 08/17/07 | | | 356,470 | | |
The Accompanying Notes to Financial Statements are an integral part of this statement.
26
Columbia Intermediate Municipal Bond Fund
October 31, 2011
Notes to Portfolio of Investments (continued)
| Security Description | | Acquisition
Dates | | Cost | |
Illinois Finance Authority
Revenue Bonds
Sedgebrook, Inc. Facility
Series 2007A
5.400% 11/15/16 | | 08/22/07 | | $ | 1,534,079 | | |
Illinois Finance Authority
Revenue Bonds
Sedgebrook, Inc. Facility
Series 2007A
5.875% 11/15/22 | | 08/09/07 | | | 5,854,379 | | |
Illinois Finance Authority
Revenue Bonds
Monarch Landing, Inc. Facility
Series 2007A
5.500% 12/01/13 | | 12/20/07 | | | 1,809,764 | | |
Illinois Finance Authority
Revenue Bonds
Monarch Landing, Inc. Facility
Series 2007A
6.000% 12/01/17 | | 12/10/07 | | | 2,961,472 | | |
Oakmont Grove Community Development District
Special Assessment Bonds
Series 2007B
5.250% 05/01/12 | | 04/19/07 - 04/25/07 | | | 2,007,500 | | |
Parker Road Community Development District
Special Assessment Bonds
Series 2007B
5.350% 05/01/15 | | 05/25/07 | | | 2,000,000 | | |
Six Mile Creek Community Development District
Special Assessment Bonds
Series 2007
5.500% 05/01/17 | | 06/25/07 | | | 1,462,657 | | |
Six Mile Creek Community Development District
Special Assessment Bonds
Series 2007
5.650% 05/01/22 | | 06/25/07 - 05/01/08 | | | 2,746,996 | | |
Sterling Hill Community Development District
Special Assessment Bonds
Series 2003B
5.500% 11/01/10 | | 10/23/03 | | | 154,112 | | |
Sweetwater Creek Community Development District
Special Assessment Bonds
Series 2007B-1
5.300% 05/01/17 | | 04/26/07 - 04/03/08 | | | 4,299,141 | | |
Sweetwater Creek Community Development District
Special Assessment Bonds
Series 2007B-2
5.125% 05/01/13 | | 04/26/07 - 06/25/07 | | | 2,542,218 | | |
(e) Security exempt from registration pursuant to Rule 144A under the Securities Act of 1933. This security may be resold in transactions exempt from registration, normally to qualified institutional buyers. At October 31, 2011, the value of these securities amounted to $11,859,110 or 0.48% of net assets.
(f) Represents securities that have defaulted on payment of interest. The Fund has stopped accruing interest on these securities. At October 31, 2011, the value of these securities amounted to $808,299, which represents 0.03% of net assets.
(g) Municipal obligations include debt obligations issued by or on behalf of territories, possessions, or sovereign nations within the territorial boundaries of the United States. At October 31, 2011, the value of these securities amounted to $36,501,395 or 1.48% of net assets.
The Accompanying Notes to Financial Statements are an integral part of this statement.
27
Columbia Intermediate Municipal Bond Fund
October 31, 2011
Notes to Portfolio of Investments (continued)
(h) Represents a security purchased on a when-issued or delayed delivery basis.
(i) The Fund is entitled to receive principal and interest from the guarantor after a day or a week's notice or upon maturity. The maturity date disclosed represents the final maturity.
(j) The rate shown is the seven-day current annualized yield at October 31, 2011.
Abbreviation Legend
ACA ACA Financial Guaranty Corporation
AGM Assured Guaranty Municipal Corporation
AMBAC Ambac Assurance Corporation
AMT Alternative Minimum Tax
BHAC Berkshire Hathaway Assurance Corporation
BNY Bank of New York
CIFG IXIS Financial Guaranty
FGIC Financial Guaranty Insurance Company
FHA Federal Housing Authority
NPFGC National Public Finance Guarantee Corporation
RAN Revenue Anticipation Note
TCRS Transferable Custodial Receipts
VRDN Variable Rate Demand Note
XLCA XL Capital Assurance
Fair Value Measurements
Generally accepted accounting principles (GAAP) require disclosure regarding the inputs and valuation techniques used to measure fair value and any changes in valuation inputs or techniques. In addition, investments shall be disclosed by major category.
The Fund categorizes its fair value measurements according to a three-level hierarchy that maximizes the use of observable inputs and minimizes the use of unobservable inputs by prioritizing that the most observable input be used when available. Observable inputs are those that market participants would use in pricing an investment based on market data obtained from sources independent of the reporting entity. Unobservable inputs are those that reflect the Fund's assumptions about the information market participants would use in pricing an investment. An investment's level within the fair value hierarchy is based on the lowest level of any input that is deemed significant to the asset or liability's fair value measurement. The input levels are not necessarily an indication of the risk or liquidity associated with investments at that level. For example, certain U.S. government securities are generally high quality and liquid, however, they are reflected as Level 2 because the inputs used to determine fair value may not always be quoted prices in an active market.
Fair value inputs are summarized in the three broad levels listed below:
• Level 1 — Valuations based on quoted prices for investments in active markets that the Fund has the ability to access at the measurement date (including NAV for open-end mutual funds). Valuation adjustments are not applied to Level 1 investments.
• Level 2 — Valuations based on other significant observable inputs (including quoted prices for similar securities, interest rates, prepayment speeds, credit risks, etc.).
• Level 3 — Valuations based on significant unobservable inputs (including the Fund's own assumptions and judgment in determining the fair value of investments).
Inputs that are used in determining fair value of an investment may include price information, credit data, volatility statistics, and other factors. These inputs can be either observable or unobservable. The availability of observable inputs can vary between investments, and is affected by various factors such as the type of investment, and the volume and level of activity for that investment or similar investments in the marketplace. The inputs will be considered by the Investment Manager, along with any other relevant factors in the calculation of an investment's fair value. The Fund uses prices and inputs that are current as of the measurement date, which may include periods of market dislocations. During these periods, the availability of prices and inputs may be reduced for many investments. This condition could cause an investment to be reclassified between the various levels within the hierarchy.
Investments falling into the Level 3 category are primarily supported by quoted prices from brokers and dealers participating in the market for those investments. However, these may be classified as Level 3 investments due to lack of market transparency and corroboration to support these quoted prices. Additionally, valuation models may be used as the pricing source for any remaining investments classified as Level 3. These models rely on one or more significant unobservable inputs and/or significant assumptions by the Investment Manager. Inputs used in valuations may include, but are not limited to, financial statement analysis, capital account balances, discount rates and estimated cash flows, and comparable company data.
The Accompanying Notes to Financial Statements are an integral part of this statement.
28
Columbia Intermediate Municipal Bond Fund
October 31, 2011
Fair Value Measurements (continued)
The following table is a summary of the inputs used to value the Fund's investments as of October 31, 2011:
| | | Fair Value at October 31, 2011 | |
| Description(a) | | Level 1
Quoted Prices
in Active
Markets for
Identical Assets | | Level 2
Other
Significant
Observable
Inputs(b) | | Level 3
Significant
Unobservable
Inputs | | Total | |
| Bonds | |
| Municipal Bonds | | $ | — | | | $ | 2,427,384,500 | | | $ | — | | | $ | 2,427,384,500 | | |
| Total Bonds | | | — | | | | 2,427,384,500 | | | | — | | | | 2,427,384,500 | | |
| Short-Term Securities | |
| Floating Rate Notes | | | — | | | | 1,500,000 | | | | — | | | | 1,500,000 | | |
| Total Short-Term Securities | | | — | | | | 1,500,000 | | | | — | | | | 1,500,000 | | |
| Other | |
| Money Market Funds | | | 25,158,484 | | | | — | | | | — | | | | 25,158,484 | | |
| Total Other | | | 25,158,484 | | | | — | | | | — | | | | 25,158,484 | | |
| Total | | $ | 25,158,484 | | | $ | 2,428,884,500 | | | $ | — | | | $ | 2,454,042,984 | | |
The Fund's assets assigned to the Level 2 input category are generally valued using the market approach, in which a security's value is determined through reference to prices and information from market transactions for similar or identical assets.
(a) See the Portfolio of Investments for all investment classifications not indicated in the table.
(b) There were no significant transfers between Levels 1 and 2 during the period.
The Accompanying Notes to Financial Statements are an integral part of this statement.
29
Statement of Assets and Liabilities – Columbia Intermediate Municipal Bond Fund
October 31, 2011
| Assets | |
| Investments, at value | |
| (identified cost $2,328,358,527) | | $ | 2,454,042,984 | | |
| Receivable for: | |
| Investments sold | | | 97,461 | | |
| Capital shares sold | | | 5,138,683 | | |
| Interest | | | 34,764,449 | | |
| Expense reimbursement due from Investment Manager | | | 35,826 | | |
| Prepaid expense | | | 21,270 | | |
| Trustees' deferred compensation plan | | | 172,625 | | |
| Total assets | | | 2,494,273,298 | | |
| Liabilities | |
| Payable for: | |
| Investments purchased on a delayed delivery basis | | | 8,151,128 | | |
| Capital shares purchased | | | 6,216,417 | | |
| Dividend distributions to shareholders | | | 7,509,982 | | |
| Investment management fees | | | 79,050 | | |
| Distribution and service fees | | | 4,647 | | |
| Transfer agent fees | | | 465,708 | | |
| Administration fees | | | 12,764 | | |
| Chief compliance officer expenses | | | 1,370 | | |
| Other expenses | | | 440,305 | | |
| Trustees' deferred compensation plan | | | 172,625 | | |
| Total liabilities | | | 23,053,996 | | |
| Net assets applicable to outstanding capital stock | | $ | 2,471,219,302 | | |
The Accompanying Notes to Financial Statements are an integral part of this statement.
30
Statement of Assets and Liabilities (continued) – Columbia Intermediate Municipal Bond Fund
October 31, 2011
| Represented by | |
| Paid-in capital | | $ | 2,344,974,192 | | |
| Undistributed net investment income | | | 1,966,067 | | |
| Accumulated net realized loss | | | (1,405,414 | ) | |
| Unrealized appreciation (depreciation) on: | |
| Investments | | | 125,684,457 | | |
| Total — representing net assets applicable to outstanding capital stock | | $ | 2,471,219,302 | | |
| Net assets applicable to outstanding shares | |
| Class A | | $ | 187,354,849 | | |
| Class B | | $ | 2,494,438 | | |
| Class C | | $ | 35,541,124 | | |
| Class T | | $ | 19,779,799 | | |
| Class Z | | $ | 2,226,049,092 | | |
| Shares outstanding | |
| Class A | | | 17,737,608 | | |
| Class B | | | 236,221 | | |
| Class C | | | 3,364,348 | | |
| Class T | | | 1,872,746 | | |
| Class Z | | | 210,664,173 | | |
| Net asset value per share | |
| Class A(a) | | $ | 10.56 | | |
| Class B | | $ | 10.56 | | |
| Class C | | $ | 10.56 | | |
| Class T(a) | | $ | 10.56 | | |
| Class Z | | $ | 10.57 | | |
(a) The maximum offering price per share for Class A and Class T is $10.91 and $11.09, respectively. The offering price is calculated by dividing the net asset value by 1.0 minus the maximum sales charge of 3.25% for Class A and dividing the net asset value by 1.0 minus the maximum sales charge of 4.75% for Class T.
The Accompanying Notes to Financial Statements are an integral part of this statement.
31
Statement of Operations – Columbia Intermediate Municipal Bond Fund
Year ended October 31, 2011
| Net investment income | |
| Income: | |
| Dividends | | $ | 16,125 | | |
| Interest | | | 101,377,285 | | |
| Total income | | | 101,393,410 | | |
| Expenses: | |
| Investment management fees | | | 9,448,247 | | |
| Distribution fees | |
| Class B | | | 16,493 | | |
| Class C | | | 172,675 | | |
| Service fees | |
| Class A | | | 256,275 | | |
| Class B | | | 5,075 | | |
| Class C | | | 53,134 | | |
| Shareholder service fee — Class T | | | 21,004 | | |
| Transfer agent fees | |
| Class A | | | 222,413 | | |
| Class B | | | 4,494 | | |
| Class C | | | 46,841 | | |
| Class T | | | 24,581 | | |
| Class Z | | | 3,787,885 | | |
| Administration fees | | | 1,527,709 | | |
| Compensation of board members | | | 138,938 | | |
| Pricing and bookkeeping fees | | | 107,575 | | |
| Custodian fees | | | 57,812 | | |
| Printing and postage fees | | | 102,594 | | |
| Registration fees | | | 76,808 | | |
| Professional fees | | | 117,636 | | |
| Chief compliance officer expenses | | | 3,097 | | |
| Other | | | 89,604 | | |
| Total expenses | | | 16,280,890 | | |
| Fees waived or expenses reimbursed by Investment Manager and its affiliates | | | (2,892,900 | ) | |
| Fees waived by distributor — Class C | | | (119,542 | ) | |
| Expense reductions | | | (1,106 | ) | |
| Total net expenses | | | 13,267,342 | | |
| Net investment income | | | 88,126,068 | | |
| Realized and unrealized gain (loss) — net | |
| Net realized gain (loss) on: | |
| Investments | | | 1,995,080 | | |
| Net realized gain | | | 1,995,080 | | |
| Net change in unrealized appreciation (depreciation) on: | |
| Investments | | | (10,933,222 | ) | |
| Net change in unrealized depreciation | | | (10,933,222 | ) | |
| Net realized and unrealized loss | | | (8,938,142 | ) | |
| Net increase in net assets resulting from operations | | $ | 79,187,926 | | |
The Accompanying Notes to Financial Statements are an integral part of this statement.
32
Statement of Changes in Net Assets – Columbia Intermediate Municipal Bond Fund
| Year ended October 31, | | 2011 | | 2010 | |
| Operations | |
| Net investment income | | $ | 88,126,068 | | | $ | 90,682,893 | | |
| Net realized gain | | | 1,995,080 | | | | 7,892,345 | | |
| Net change in unrealized appreciation (depreciation) | | | (10,933,222 | ) | | | 78,080,777 | | |
| Net increase in net assets resulting from operations | | | 79,187,926 | | | | 176,656,015 | | |
| Distributions to shareholders from: | |
| Net investment income | |
| Class A | | | (4,560,858 | ) | | | (3,101,683 | ) | |
| Class B | | | (73,388 | ) | | | (121,831 | ) | |
| Class C | | | (890,030 | ) | | | (617,797 | ) | |
| Class T | | | (505,217 | ) | | | (364,131 | ) | |
| Class Z | | | (81,781,568 | ) | | | (86,466,275 | ) | |
| Total distributions to shareholders | | | (87,811,061 | ) | | | (90,671,717 | ) | |
| Decrease in net assets from share transactions | | | (19,514,237 | ) | | | (90,152,111 | ) | |
| Proceeds from regulatory settlements (Note 6) | | | — | | | | 7,268 | | |
| Total decrease in net assets | | | (28,137,372 | ) | | | (4,160,545 | ) | |
| Net assets at beginning of year | | | 2,499,356,674 | | | | 2,503,517,219 | | |
| Net assets at end of year | | $ | 2,471,219,302 | | | $ | 2,499,356,674 | | |
| Undistributed net investment income | | $ | 1,966,067 | | | $ | 1,642,987 | | |
The Accompanying Notes to Financial Statements are an integral part of this statement.
33
Statement of Changes in Net Assets (continued) – Columbia Intermediate Municipal Bond Fund
| Year ended October 31, | | 2011 | | 2010 | |
| | | Shares | | Dollars ($) | | Shares | | Dollars ($) | |
| Capital stock activity | |
| Class A shares | |
| Subscriptions | | | 2,662,745 | | | | 27,758,263 | | | | 1,748,658 | | | | 18,289,596 | | |
| Fund merger | | | 9,094,510 | | | | 95,165,598 | | | | — | | | | — | | |
| Distributions reinvested | | | 229,777 | | | | 2,404,502 | | | | 160,991 | | | | 1,677,504 | | |
| Redemptions | | | (3,535,850 | ) | | | (36,490,331 | ) | | | (1,005,078 | ) | | | (10,457,752 | ) | |
| Net increase | | | 8,451,182 | | | | 88,838,032 | | | | 904,571 | | | | 9,509,348 | | |
| Class B shares | |
| Subscriptions | | | 12,087 | | | | 127,072 | | | | 19,947 | | | | 206,587 | | |
| Fund merger | | | 244,615 | | | | 2,560,189 | | | | — | | | | — | | |
| Distributions reinvested | | | 2,800 | | | | 29,255 | | | | 5,054 | | | | 52,594 | | |
| Redemptions | | | (333,920 | ) | | | (3,462,592 | ) | | | (232,484 | ) | | | (2,423,174 | ) | |
| Net decrease | | | (74,418 | ) | | | (746,076 | ) | | | (207,483 | ) | | | (2,163,993 | ) | |
| Class C shares | |
| Subscriptions | | | 678,139 | | | | 7,048,453 | | | | 716,989 | | | | 7,479,848 | | |
| Fund merger | | | 1,195,348 | | | | 12,501,819 | | | | — | | | | — | | |
| Distributions reinvested | | | 45,066 | | | | 470,347 | | | | 31,273 | | | | 326,545 | | |
| Redemptions | | | (625,338 | ) | | | (6,447,647 | ) | | | (370,715 | ) | | | (3,863,631 | ) | |
| Net increase | | | 1,293,215 | | | | 13,572,972 | | | | 377,547 | | | | 3,942,762 | | |
| Class T shares | |
| Subscriptions | | | 8,651 | | | | 90,290 | | | | 6,897 | | | | 71,604 | | |
| Fund merger | | | 1,084,706 | | | | 11,350,322 | | | | — | | | | — | | |
| Distributions reinvested | | | 32,929 | | | | 343,458 | | | | 27,048 | | | | 282,170 | | |
| Redemptions | | | (222,125 | ) | | | (2,316,090 | ) | | | (89,317 | ) | | | (933,970 | ) | |
| Net increase (decrease) | | | 904,161 | | | | 9,467,980 | | | | (55,372 | ) | | | (580,196 | ) | |
| Class Z shares | |
| Subscriptions | | | 27,836,430 | | | | 288,404,098 | | | | 32,595,193 | | | | 339,577,862 | | |
| Fund merger | | | 11,527,090 | | | | 120,618,060 | | | | — | | | | — | | |
| Distributions reinvested | | | 463,106 | | | | 4,803,397 | | | | 481,137 | | | | 5,023,176 | | |
| Redemptions | | | (52,863,118 | ) | | | (544,472,700 | ) | | | (42,784,437 | ) | | | (445,461,070 | ) | |
| Net decrease | | | (13,036,492 | ) | | | (130,647,145 | ) | | | (9,708,107 | ) | | | (100,860,032 | ) | |
| Total net decrease | | | (2,462,352 | ) | | | (19,514,237 | ) | | | (8,688,844 | ) | | | (90,152,111 | ) | |
The Accompanying Notes to Financial Statements are an integral part of this statement.
34
Financial Highlights – Columbia Intermediate Municipal Bond Fund
The following tables are intended to help you understand the Fund's financial performance. Certain information reflects financial results for a single share of a class held for the periods shown. Per share net investment income (loss) amounts are calculated based on average shares outstanding during the period. Total returns assume reinvestment of all dividends and distributions. Total returns do not reflect payment of sales charges, if any, and are not annualized for periods of less than one year.
| | | Year ended Oct. 31, | |
| | | 2011 | | 2010 | | 2009 | | 2008 | | 2007 | |
| Class A | |
| Per share data | |
| Net asset value, beginning of period | | $ | 10.58 | | | $ | 10.22 | | | $ | 9.62 | | | $ | 10.22 | | | $ | 10.39 | | |
| Income from investment operations: | |
| Net investment income | | | 0.37 | | | | 0.36 | | | | 0.37 | | | | 0.38 | | | | 0.38 | | |
| Net realized and unrealized gain (loss) | | | (0.02 | ) | | | 0.36 | | | | 0.60 | | | | (0.60 | ) | | | (0.17 | ) | |
| Total from investment operations | | | 0.35 | | | | 0.72 | | | | 0.97 | | | | (0.22 | ) | | | 0.21 | | |
| Less distributions to shareholders from: | |
| Net investment income | | | (0.37 | ) | | | (0.36 | ) | | | (0.37 | ) | | | (0.38 | ) | | | (0.38 | ) | |
| Proceeds from regulatory settlement | | | — | | | | 0.00 | (a) | | | 0.00 | (a) | | | — | | | | — | | |
| Net asset value, end of period | | $ | 10.56 | | | $ | 10.58 | | | $ | 10.22 | | | $ | 9.62 | | | $ | 10.22 | | |
| Total return | | | 3.43 | % | | | 7.13 | % | | | 10.19 | % | | | (2.25 | %) | | | 2.08 | % | |
| Ratios to average net assets(b) | |
| Expenses prior to fees waived or expenses reimbursed | | | 0.86 | % | | | 0.75 | % | | | 0.74 | % | | | 0.72 | % | | | 0.72 | % | |
| Net expenses after fees waived or expenses reimbursed(c) | | | 0.73 | %(d) | | | 0.75 | %(d) | | | 0.73 | %(d) | | | 0.70 | %(d) | | | 0.70 | %(d) | |
| Net investment income | | | 3.52 | %(d) | | | 3.43 | %(d) | | | 3.66 | %(d) | | | 3.76 | %(d) | | | 3.72 | %(d) | |
| Supplemental data | |
| Net assets, end of period (in thousands) | | $ | 187,355 | | | $ | 98,208 | | | $ | 85,642 | | | $ | 78,126 | | | $ | 89,905 | | |
| Portfolio turnover | | | 9 | % | | | 13 | % | | | 23 | % | | | 14 | % | | | 25 | % | |
| Notes to Financial Highlights | |
(a) Rounds to less than $0.01.
(b) In addition to the fees and expenses which the Fund bears directly, the Fund indirectly bears a pro rata share of the fees and expenses of the acquired funds in which it invests. Such indirect expenses are not included in the reported expense ratios.
(c) The Investment Manager and certain of its affiliates agreed to waive/reimburse certain fees and expenses, if applicable.
(d) The benefits derived from expense reductions had an impact of less than 0.01%.
The Accompanying Notes to Financial Statements are an integral part of this statement.
35
Financial Highlights (continued) – Columbia Intermediate Municipal Bond Fund
| | | Year ended Oct. 31, | |
| | | 2011 | | 2010 | | 2009 | | 2008 | | 2007 | |
| Class B | |
| Per share data | |
| Net asset value, beginning of period | | $ | 10.58 | | | $ | 10.22 | | | $ | 9.62 | | | $ | 10.22 | | | $ | 10.39 | | |
| Income from investment operations: | |
| Net investment income | | | 0.30 | | | | 0.29 | | | | 0.30 | | | | 0.32 | | | | 0.32 | | |
| Net realized and unrealized gain (loss) | | | (0.02 | ) | | | 0.36 | | | | 0.60 | | | | (0.60 | ) | | | (0.18 | ) | |
| Total from investment operations | | | 0.28 | | | | 0.65 | | | | 0.90 | | | | (0.28 | ) | | | 0.14 | | |
| Less distributions to shareholders from: | |
| Net investment income | | | (0.30 | ) | | | (0.29 | ) | | | (0.30 | ) | | | (0.32 | ) | | | (0.31 | ) | |
| Proceeds from regulatory settlement | | | — | | | | 0.00 | (a) | | | 0.00 | (a) | | | — | | | | — | | |
| Net asset value, end of period | | $ | 10.56 | | | $ | 10.58 | | | $ | 10.22 | | | $ | 9.62 | | | $ | 10.22 | | |
| Total return | | | 2.76 | % | | | 6.44 | % | | | 9.48 | % | | | (2.88 | %) | | | 1.42 | % | |
| Ratios to average net assets(b) | |
| Expenses prior to fees waived or expenses reimbursed | | | 1.52 | % | | | 1.40 | % | | | 1.39 | % | | | 1.37 | % | | | 1.37 | % | |
| Net expenses after fees waived or expenses reimbursed(c) | | | 1.40 | %(d) | | | 1.40 | %(d) | | | 1.38 | %(d) | | | 1.35 | %(d) | | | 1.35 | %(d) | |
| Net investment income | | | 2.85 | %(d) | | | 2.80 | %(d) | | | 3.03 | %(d) | | | 3.11 | %(d) | | | 3.07 | %(d) | |
| Supplemental data | |
| Net assets, end of period (in thousands) | | $ | 2,494 | | | $ | 3,285 | | | $ | 5,294 | | | $ | 5,874 | | | $ | 8,133 | | |
| Portfolio turnover | | | 9 | % | | | 13 | % | | | 23 | % | | | 14 | % | | | 25 | % | |
| Notes to Financial Highlights | |
(a) Rounds to less than $0.01.
(b) In addition to the fees and expenses which the Fund bears directly, the Fund indirectly bears a pro rata share of the fees and expenses of the acquired funds in which it invests. Such indirect expenses are not included in the reported expense ratios.
(c) The Investment Manager and certain of its affiliates agreed to waive/reimburse certain fees and expenses, if applicable.
(d) The benefits derived from expense reductions had an impact of less than 0.01%.
The Accompanying Notes to Financial Statements are an integral part of this statement.
36
Financial Highlights (continued) – Columbia Intermediate Municipal Bond Fund
| | | Year ended Oct. 31, | |
| | | 2011 | | 2010 | | 2009 | | 2008 | | 2007 | |
| Class C | |
| Per share data | |
| Net asset value, beginning of period | | $ | 10.58 | | | $ | 10.22 | | | $ | 9.62 | | | $ | 10.22 | | | $ | 10.39 | | |
| Income from investment operations: | |
| Net investment income | | | 0.35 | | | | 0.34 | | | | 0.35 | | | | 0.36 | | | | 0.36 | | |
| Net realized and unrealized gain (loss) | | | (0.02 | ) | | | 0.36 | | | | 0.60 | | | | (0.60 | ) | | | (0.17 | ) | |
| Total from investment operations | | | 0.33 | | | | 0.70 | | | | 0.95 | | | | (0.24 | ) | | | 0.19 | | |
| Less distributions to shareholders from: | |
| Net investment income | | | (0.35 | ) | | | (0.34 | ) | | | (0.35 | ) | | | (0.36 | ) | | | (0.36 | ) | |
| Proceeds from regulatory settlement | | | — | | | | 0.00 | (a) | | | 0.00 | (a) | | | — | | | | — | | |
| Net asset value, end of period | | $ | 10.56 | | | $ | 10.58 | | | $ | 10.22 | | | $ | 9.62 | | | $ | 10.22 | | |
| Total return | | | 3.22 | % | | | 6.92 | % | | | 9.97 | % | | | (2.45 | %) | | | 1.88 | % | |
| Ratios to average net assets(b) | |
| Expenses prior to fees waived or expenses reimbursed | | | 1.52 | % | | | 1.40 | % | | | 1.39 | % | | | 1.37 | % | | | 1.37 | % | |
| Net expenses after fees waived or expenses reimbursed(c) | | | 0.93 | %(d) | | | 0.95 | %(d) | | | 0.93 | %(d) | | | 0.90 | %(d) | | | 0.90 | %(d) | |
| Net investment income | | | 3.33 | %(d) | | | 3.23 | %(d) | | | 3.45 | %(d) | | | 3.56 | %(d) | | | 3.52 | %(d) | |
| Supplemental data | |
| Net assets, end of period (in thousands) | | $ | 35,541 | | | $ | 21,903 | | | $ | 17,304 | | | $ | 12,625 | | | $ | 10,506 | | |
| Portfolio turnover | | | 9 | % | | | 13 | % | | | 23 | % | | | 14 | % | | | 25 | % | |
| Notes to Financial Highlights | |
(a) Rounds to less than $0.01.
(b) In addition to the fees and expenses which the Fund bears directly, the Fund indirectly bears a pro rata share of the fees and expenses of the acquired funds in which it invests. Such indirect expenses are not included in the reported expense ratios.
(c) The Investment Manager and certain of its affiliates agreed to waive/reimburse certain fees and expenses, if applicable.
(d) The benefits derived from expense reductions had an impact of less than 0.01%.
The Accompanying Notes to Financial Statements are an integral part of this statement.
37
Financial Highlights (continued) – Columbia Intermediate Municipal Bond Fund
| | | Year ended Oct. 31, | |
| | | 2011 | | 2010 | | 2009 | | 2008 | | 2007 | |
| Class T | |
| Per share data | |
| Net asset value, beginning of period | | $ | 10.58 | | | $ | 10.22 | | | $ | 9.62 | | | $ | 10.22 | | | $ | 10.39 | | |
| Income from investment operations: | |
| Net investment income | | | 0.37 | | | | 0.36 | | | | 0.37 | | | | 0.39 | | | | 0.39 | | |
| Net realized and unrealized gain (loss) | | | (0.01 | ) | | | 0.36 | | | | 0.60 | | | | (0.60 | ) | | | (0.17 | ) | |
| Total from investment operations | | | 0.36 | | | | 0.72 | | | | 0.97 | | | | (0.21 | ) | | | 0.22 | | |
| Less distributions to shareholders from: | |
| Net investment income | | | (0.38 | ) | | | (0.36 | ) | | | (0.37 | ) | | | (0.39 | ) | | | (0.39 | ) | |
| Proceeds from regulatory settlement | | | — | | | | 0.00 | (a) | | | 0.00 | (a) | | | — | | | | — | | |
| Net asset value, end of period | | $ | 10.56 | | | $ | 10.58 | | | $ | 10.22 | | | $ | 9.62 | | | $ | 10.22 | | |
| Total return | | | 3.48 | % | | | 7.19 | % | | | 10.25 | % | | �� | (2.20 | %) | | | 2.14 | % | |
| Ratios to average net assets(b) | |
| Expenses prior to fees waived or expenses reimbursed | | | 0.81 | % | | | 0.70 | % | | | 0.69 | % | | | 0.67 | % | | | 0.67 | % | |
| Net expenses after fees waived or expenses reimbursed(c) | | | 0.68 | %(d) | | | 0.70 | %(d) | | | 0.68 | %(d) | | | 0.65 | %(d) | | | 0.65 | %(d) | |
| Net investment income | | | 3.56 | %(d) | | | 3.49 | %(d) | | | 3.72 | %(d) | | | 3.81 | %(d) | | | 3.77 | %(d) | |
| Supplemental data | |
| Net assets, end of period (in thousands) | | $ | 19,780 | | | $ | 10,243 | | | $ | 10,462 | | | $ | 10,786 | | | $ | 13,170 | | |
| Portfolio turnover | | | 9 | % | | | 13 | % | | | 23 | % | | | 14 | % | | | 25 | % | |
| Notes to Financial Highlights | |
(a) Rounds to less than $0.01.
(b) In addition to the fees and expenses which the Fund bears directly, the Fund indirectly bears a pro rata share of the fees and expenses of the acquired funds in which it invests. Such indirect expenses are not included in the reported expense ratios.
(c) The Investment Manager and certain of its affiliates agreed to waive/reimburse certain fees and expenses, if applicable.
(d) The benefits derived from expense reductions had an impact of less than 0.01%.
The Accompanying Notes to Financial Statements are an integral part of this statement.
38
Financial Highlights (continued) – Columbia Intermediate Municipal Bond Fund
| | | Year ended Oct. 31, | |
| | | 2011 | | 2010 | | 2009 | | 2008 | | 2007 | |
| Class Z | |
| Per share data | |
| Net asset value, beginning of period | | $ | 10.58 | | | $ | 10.22 | | | $ | 9.62 | | | $ | 10.22 | | | $ | 10.39 | | |
| Income from investment operations: | |
| Net investment income | | | 0.39 | | | | 0.38 | | | | 0.39 | | | | 0.40 | | | | 0.40 | | |
| Net realized and unrealized gain (loss) | | | (0.01 | ) | | | 0.36 | | | | 0.60 | | | | (0.60 | ) | | | (0.17 | ) | |
| Total from investment operations | | | 0.38 | | | | 0.74 | | | | 0.99 | | | | (0.20 | ) | | | 0.23 | | |
| Less distributions to shareholders from: | |
| Net investment income | | | (0.39 | ) | | | (0.38 | ) | | | (0.39 | ) | | | (0.40 | ) | | | (0.40 | ) | |
| Proceeds from regulatory settlement | | | — | | | | 0.00 | (a) | | | 0.00 | (a) | | | — | | | | — | | |
| Net asset value, end of period | | $ | 10.57 | | | $ | 10.58 | | | $ | 10.22 | | | $ | 9.62 | | | $ | 10.22 | | |
| Total return | | | 3.69 | % | | | 7.35 | % | | | 10.41 | % | | | (2.05 | %) | | | 2.29 | % | |
| Ratios to average net assets(b) | |
| Expenses prior to fees waived or expenses reimbursed | | | 0.66 | % | | | 0.55 | % | | | 0.54 | % | | | 0.52 | % | | | 0.52 | % | |
| Net expenses after fees waived or expenses reimbursed(c) | | | 0.54 | %(d) | | | 0.55 | %(d) | | | 0.53 | %(d) | | | 0.50 | %(d) | | | 0.50 | %(d) | |
| Net investment income | | | 3.74 | %(d) | | | 3.64 | %(d) | | | 3.87 | %(d) | | | 3.96 | %(d) | | | 3.92 | %(d) | |
| Supplemental data | |
| Net assets, end of period (in thousands) | | $ | 2,226,049 | | | $ | 2,365,718 | | | $ | 2,384,815 | | | $ | 2,310,978 | | | $ | 2,207,710 | | |
| Portfolio turnover | | | 9 | % | | | 13 | % | | | 23 | % | | | 14 | % | | | 25 | % | |
| Notes to Financial Highlights | |
(a) Rounds to less than $0.01.
(b) In addition to the fees and expenses which the Fund bears directly, the Fund indirectly bears a pro rata share of the fees and expenses of the acquired funds in which it invests. Such indirect expenses are not included in the reported expense ratios.
(c) The Investment Manager and certain of its affiliates agreed to waive/reimburse certain fees and expenses, if applicable.
(d) The benefits derived from expense reductions had an impact of less than 0.01%.
The Accompanying Notes to Financial Statements are an integral part of this statement.
39
Notes to Financial Statements – Columbia Intermediate Municipal Bond Fund
October 31, 2011
Note 1. Organization
Columbia Intermediate Municipal Bond Fund (the Fund), a series of Columbia Funds Series Trust I (the Trust), is a diversified fund. The Trust is registered under the Investment Company Act of 1940, as amended (the 1940 Act), as an open-end management investment company organized as a Massachusetts business trust.
Fund Shares
The Trust may issue an unlimited number of shares (without par value). The Fund offers Class A, Class B, Class C, Class T and Class Z shares. All share classes have identical voting, dividend and liquidation rights. Each share class has its own expense structure and sales charges, as applicable.
Class A shares are subject to a maximum front-end sales charge of 3.25% based on the initial investment amount. Class A shares purchased without an initial sales charge in accounts aggregating $1 million to $50 million at the time of purchase are subject to a contingent deferred sales charge (CDSC) if the shares are sold within 18 months of purchase, charged as follows: 1.00% CDSC if redeemed within 12 months of purchase, and 0.50% CDSC if redeemed more than 12, but less than 18, months after purchase.
Class B shares may be subject to a maximum CDSC of 3.00% based upon the holding period after purchase. Class B shares will generally convert to Class A shares eight years after purchase. The Fund no longer accepts investments by new or existing investors in the Fund's Class B shares, except in connection with the reinvestment of any dividend and/or capital gain distributions in Class B shares of the Fund and exchanges by existing Class B shareholders of certain other funds within the Columbia Family of Funds.
Class C shares are subject to a 1.00% CDSC on shares redeemed within one year of purchase.
Class T shares are subject to a maximum front-end sales charge of 4.75% based on the investment amount. Class T shares purchased without an initial sales charge in accounts aggregating $1 million to $50 million at the time of purchase are subject to a 1.00% contingent deferred sales charge (CDSC) if the shares are sold within 18 months of purchase, charged as follows: 1.00% CDSC if redeemed within 12 months of purchase, and 0.50% CDSC if redeemed more than 12, but less than 18, months after purchase.
Class Z shares are not subject to sales charges, and are only available to certain investors, as described in the Fund's prospectus.
Note 2. Summary of Significant Accounting Policies
Use of Estimates
The preparation of financial statements in accordance with U.S. generally accepted accounting principles (GAAP) requires management to make certain estimates and assumptions that affect the reported amounts of assets and liabilities, the disclosure of contingent assets and liabilities at the date of the financial statements and the reported amounts of revenue and expenses during the reporting period. Actual results could differ from those estimates.
The following is a summary of significant accounting policies consistently followed by the Fund in the preparation of its financial statements.
Security Valuation
Debt securities generally are valued by pricing services approved by the Board of Trustees (the Board) based upon market transactions for normal, institutional-size trading units of similar securities. The services may use various pricing techniques which take into account appropriate factors such as yield, quality, coupon rate, maturity, type of issue, trading characteristics and other data, as well as broker quotes. Debt securities for which quotations are readily available may also be valued based upon an over-the-counter or exchange bid quotation.
Investments in other open-end investment companies, including money market funds, are valued at net asset value.
Short-term securities purchased within 60 days to maturity are valued at amortized cost, which approximates market value. The value of short-term securities originally purchased with maturities greater than 60 days is determined based on an amortized value to par upon reaching 60 days to maturity. Short-term securities maturing in more than 60 days from the valuation date are valued at the market price or approximate market value based on current interest rates.
Investments for which market quotations are not readily available, or that have quotations which management believes are not reliable, are valued at fair value as determined in good
40
Columbia Intermediate Municipal Bond Fund, October 31, 2011
faith under consistently applied procedures established by and under the general supervision of the Board. If a security or class of securities (such as foreign securities) is valued at fair value, such value is likely to be different from the last quoted market price for the security. The determination of fair value often requires significant judgment. To determine fair value, management may use assumptions including but not limited to future cash flows and estimated risk premiums. Multiple inputs from various sources may be used to determine value.
Delayed Delivery Securities
The Fund may trade securities on other than normal settlement terms, including securities purchased or sold on a "when-issued" basis. This may increase the risk if the other party to the transaction fails to deliver and causes the Fund to subsequently invest at less advantageous prices. The Fund identifies within its Portfolio of Investments cash or liquid securities in an amount equal to the delayed delivery commitment.
Security Transactions
Security transactions are accounted for on the trade date. Cost is determined and gains (losses) are based upon the specific identification method for both financial statement and federal income tax purposes.
Income Recognition
Interest income is recorded on the accrual basis. Market premium and discount are amortized and accreted, respectively, on all debt securities, unless otherwise noted. Original issue discount is accreted to interest income over the life of the security with a corresponding increase in the cost basis, if any.
Dividend income is recorded on the ex-date.
Expenses
General expenses of the Trust are allocated to the Fund and other funds of the Trust based upon relative net assets or other expense allocation methodologies determined by the nature of the expense. Expenses directly attributable to the Fund are charged to the Fund. Expenses directly attributable to a specific class of shares are charged to that share class.
Determination of Class Net Asset Value
All income, expenses (other than class-specific expenses, which are charged to that share class, as shown in the Statement of Operations) and realized and unrealized gains (losses) are allocated to each class of the Fund on a daily basis for purposes of determining the net asset value of each class. Income and expenses are allocated to each class based on the settled shares method, while realized and unrealized gains (losses) are allocated based on the relative net assets of each class.
Federal Income Tax Status
The Fund intends to qualify each year as a regulated investment company under Subchapter M of the Internal Revenue Code, as amended, and will distribute substantially all of its tax exempt or taxable income (including net short-term capital gains), if any, for its tax year, and as such will not be subject to federal income taxes. In addition, the Fund intends to distribute in each calendar year substantially all of its net investment income, capital gains and certain other amounts, if any, such that the Fund should not be subject to federal excise tax. Therefore, no federal income or excise tax provision is recorded.
Distributions to Shareholders
Distributions from net investment income are declared daily and paid monthly. Net realized capital gains, if any, are distributed at least annually. Income distributions and capital gain distributions are determined in accordance with federal income tax regulations which may differ from GAAP.
Guarantees and Indemnifications
Under the Trust's organizational documents and, in some cases, by contract, its officers and trustees are indemnified against certain liabilities arising out of the performance of their duties to the Trust or its funds. In addition, certain of the Fund's contracts with its service providers contain general indemnification clauses. The Fund's maximum exposure under these arrangements is unknown since the amount of any future claims that may be made against the Fund cannot be determined, and the Fund has no historical basis for predicting the likelihood of any such claims.
41
Columbia Intermediate Municipal Bond Fund, October 31, 2011
Recent Accounting Pronouncement
Fair Value Measurements and Disclosures
In May 2011, the Financial Accounting and Standards Board issued ASU No. 2011-04 modifying Topic 820, Fair Value Measurements and Disclosures. At the same time, the International Accounting Standards Board issued International Financial Reporting Standard 13, Fair Value Measurement. The objective of the FASB and IASB is convergence of their guidance on fair value measurements and disclosures.
Specifically, ASU No. 2011-04 requires reporting entities to disclose i) the amounts of any transfers between Level 1 and Level 2, and the reasons for the transfers, ii) for Level 3 fair value measurements, a) quantitative information about significant unobservable inputs used, b) a description of the valuation processes used by the reporting entity and c) a narrative description of the sensitivity of the fair value measurement to changes in unobservable inputs if a change in those inputs might result in a significantly higher or lower fair value measurement. The effective date of ASU No. 2011-04 is for interim and annual periods beginning after December 15, 2011. At this time, management is evaluating the implications of this guidance and the impact it will have on the financial statement amounts and footnote disclosures, if any.
Note 3. Fees and Compensation Paid to Affiliates
Investment Management Fees
Under an Investment Management Services Agreement, Columbia Management Investment Advisers, LLC (the Investment Manager), a wholly-owned subsidiary of Ameriprise Financial, Inc. (Ameriprise Financial), determines which securities will be purchased, held or sold. Effective March 1, 2011, the management fee is an annual fee that is equal to a percentage of the Fund's average daily net assets that declines from 0.41% to 0.25% as the Fund's net assets increase. Prior to March 1, 2011, the management fee was equal to a percentage of the Fund's average daily net assets that declined from 0.48% to 0.35% as the Fund's net assets increased. The effective management fee rate for the year ended October 31, 2011 was 0.40% of the Fund's average daily net assets.
Administration Fees
Under an Administrative Services Agreement, the Investment Manager serves as the Fund Administrator. Effective March 1, 2011, the Fund pays the Fund Administrator an annual fee for administration and accounting services equal to a percentage of the Fund's average daily net assets that declines from 0.07% to 0.04% as the Fund's net assets increase. Prior to March 1, 2011, the administration fee was equal to the annual rate of 0.067% of the Fund's average daily net assets. The effective administration fee rate for the year ended October 31, 2011 was 0.06% of the Fund's average daily net assets.
Pricing and Bookkeeping Fees
Prior to May 16, 2011, the Fund had entered into a Financial Reporting Services Agreement (the Financial Reporting Services Agreement) with State Street Bank and Trust Company (State Street) and the Investment Manager pursuant to which State Street provided financial reporting services to the Fund. The Fund also entered into an Accounting Services Agreement (collectively with the Financial Reporting Services Agreement, the State Street Agreements) with State Street and the Investment Manager pursuant to which State Street provided accounting services to the Fund. Under the State Street Agreements, the Fund paid State Street an annual fee of $38,000 paid monthly plus an additional monthly fee based on an annualized percentage rate of average daily net assets of the Fund for the month. The aggregate fee did not exceed $140,000 per year (exclusive of out-of-pocket expenses and charges). The Fund also reimbursed State Street for certain out-of-pocket expenses and charges. Effective May 16, 2011, these services are now provided under the Administrative Services Agreement discussed above.
Compensation of Board Members
Board members are compensated for their services to the Fund as disclosed in the Statement of Operations. The Trust's eligible Trustees may participate in a Deferred Compensation Plan (the Plan) which may be terminated at any time. Obligation of the Plan will be paid solely out of the Fund's assets.
Compensation of Chief Compliance Officer
The Board has appointed a Chief Compliance Officer to the Fund in accordance with federal securities regulations. The Fund, along with other affiliated funds, pays its pro-rata share of the expenses associated with the Chief Compliance
42
Columbia Intermediate Municipal Bond Fund, October 31, 2011
Officer. The Fund's expenses for the Chief Compliance Officer will not exceed $15,000 per year.
Transfer Agent Fees
Under a Transfer and Dividend Disbursing Agent Agreement, Columbia Management Investment Services Corp. (the Transfer Agent), an affiliate of the Investment Manager and a wholly-owned subsidiary of Ameriprise Financial, is responsible for providing transfer agency services to the Fund. The Transfer Agent has contracted with Boston Financial Data Services (BFDS) to serve as sub-transfer agent.
The Transfer Agent receives monthly account-based service fees based on the number of open accounts and is reimbursed by the Fund for the fees and expenses the Transfer Agent pays to financial intermediaries that maintain omnibus accounts with the Fund that is a percentage of the average aggregate value of the Fund's shares maintained in each such omnibus account (other than omnibus accounts for which American Enterprise Investment Services Inc. is the broker of record or accounts where the beneficial shareholder is a customer of Ameriprise Financial Services, Inc., which are paid a per account fee). The Transfer Agent pays the fees of BFDS for services as sub-transfer agent and is not entitled to reimbursement for such fees from the Fund (with the exception of out-of-pocket fees).
The Transfer Agent also receives compensation from fees for various shareholder services and reimbursements for certain out-of -pocket expenses.
For the year ended October 31, 2011, the Fund's annualized effective transfer agent fee rates as a percentage of average daily net assets of each class were as follows:
| Class A | | | 0.17 | % | |
| Class B | | | 0.18 | | |
| Class C | | | 0.18 | | |
| Class T | | | 0.18 | | |
| Class Z | | | 0.17 | | |
An annual minimum account balance fee of $20 may apply to certain accounts with a value below the Fund's initial minimum investment requirements to reduce the impact of small accounts on transfer agent fees. These minimum account balance fees are recorded as part of expense reductions in the Statement of Operations. For the year ended October 31, 2011, these minimum account balance fees reduced total expenses by $1,020.
Distribution and Service Fees
The Fund has an agreement with Columbia Management Investment Distributors, Inc. (the Distributor), an affiliate of the Investment Manager and a wholly-owned subsidiary of Ameriprise Financial, for distribution and shareholder services. Pursuant to Rule 12b-1 under the 1940 Act, the Board has approved, and the Fund has adopted, distribution and shareholder service plans (the Plans) which set the distribution and service fees for the Fund. These fees are calculated daily and are intended to compensate the Distributor and/or eligible selling and/or servicing agents for selling shares of the Fund and providing services to investors.
The Plans require the payment of a monthly service fee to the Distributor at the maximum annual rate of 0.20% of the average daily net assets attributable to Class A, Class B and Class C shares of the Fund. The Plans also require the payment of a monthly distribution fee to the Distributor at the maximum annual rate of 0.65% of the average daily net assets attributable to Class B and Class C shares only.
The Distributor has voluntarily agreed to waive a portion of the distribution fee for Class C shares so that the combined distribution and service fee does not exceed 0.40% annually of the average daily net assets attributable to Class C shares. This arrangement may be modified or terminated by the Distributor at any time.
Shareholder Services Fees
The Fund has adopted a shareholder services plan that permits it to pay for certain services provided to Class T shareholders by their selling and/or servicing agents. The Fund may pay shareholder servicing fees up to an aggregate annual rate of 0.40% of the Fund's average daily net assets attributable to Class T shares (comprised of up to 0.20% for shareholder liaison services and up to 0.20% for administrative support services). These fees are currently limited to an aggregate annual rate of not more than 0.15% of the Fund's average daily net assets attributable to Class T shares. In addition, the servicing fee for Class T shares will be waived by selling and/or servicing agents to the extent necessary to prevent the net investment income for the Class T shares from falling below 0.00% on a daily basis. The shareholder
43
Columbia Intermediate Municipal Bond Fund, October 31, 2011
services fee for the year ended October 31, 2011 was 0.15% of the Fund's average daily net assets attributable to Class T shares.
Sales Charges
Sales charges, including front-end charges and CDSCs, received by the Distributor for distributing Fund shares were $82,794 for Class A, $1,510 for Class B, $5,457 for Class C and $648 for Class T shares for the year ended October 31, 2011.
Expenses Waived/Reimbursed by the Investment Manager and its Affiliates
Effective March 1, 2011, the Investment Manager and certain of its affiliates have contractually agreed to waive fees and/or reimburse expenses (excluding certain fees and expenses described below), through February 29, 2012, unless sooner terminated at the sole discretion of the Board, so that the Fund's net operating expenses, after giving effect to fees waived/expenses reimbursed and any balance credits and/or overdraft charges from the Fund's custodian, do not exceed the following annual rates as a percentage of the class' average daily net assets:
| Class A | | | 0.74 | % | |
| Class B | | | 1.39 | | |
| Class C | | | 1.39 | | |
| Class T | | | 0.69 | | |
| Class Z | | | 0.54 | | |
Under the agreement, the following fees and expenses are excluded from the waiver/reimbursement commitment, and therefore will be paid by the Fund, if applicable: taxes (including foreign transaction taxes), expenses associated with investments in affiliated and non-affiliated pooled investment vehicles (including mutual funds and exchange traded funds), transaction costs and brokerage commissions, costs related to any securities lending program, dividend expenses associated with securities sold short, inverse floater program fees and expenses, transaction charges and interest on borrowed money, interest, extraordinary expenses and any other expenses the exclusion of which is specifically approved by the Board. This agreement may be modified or amended only with approval from all parties. Class C distribution fees waived by the Distributor, as discussed above, are in addition to the waiver/reimbursement commitment under the agreement.
Prior to March 1, 2011, the Investment Manager voluntarily agreed to reimburse a portion of the Fund's expenses (excluding certain expenses, such as distribution and services fees, brokerage commissions, interest, taxes and extraordinary expenses, but including custodian charges relating to overdrafts, if any) so that the Fund's ordinary net operating expenses, after giving effect to fees waived/expenses reimbursed and any balance credits and/or overdraft charges from the Fund's custodian, did not exceed 0.55% of the Fund's average daily net assets on an annualized basis.
Note 4. Federal Tax Information
The timing and character of income and capital gain distributions are determined in accordance with income tax regulations, which may differ from GAAP because of temporary or permanent book to tax differences.
For the year ended October 31, 2011, permanent differences are primarily due to differing treatments for tax attributes from acquired funds and distributions. In the Statement of Assets and Liabilities the following reclassifications were made among the components of the Fund's net assets due to permanent differences:
| Undistributed net investment income | | $ | 32,730 | | |
| Accumulated net realized loss | | | 71,885 | | |
| Paid-in capital | | | (104,615 | ) | |
Net investment income and net realized gains (losses), as disclosed in the Statement of Operations, and net assets were not affected by this reclassification.
The tax character of distributions paid during the years indicated was as follows:
| Year ended October 31, | | 2011 | | 2010 | |
| Tax-Exempt Income | | $ | 86,516,669 | | | $ | 90,257,672 | | |
| Ordinary Income | | | 1,294,392 | | | | 414,045 | | |
44
Columbia Intermediate Municipal Bond Fund, October 31, 2011
Short-term capital gain distributions, if any, are considered ordinary income distributions for tax purposes.
At October 31, 2011, the components of distributable earnings on a tax basis were as follows:
| Undistributed tax-exempt income | | $ | 11,260,244 | | |
| Unrealized appreciation | | | 125,736,995 | | |
At October 31, 2011, the cost of investments for federal income tax purposes was $2,328,305,989 and the aggregate gross unrealized appreciation and depreciation based on that cost was:
| Unrealized appreciation | | $ | 160,206,149 | | |
| Unrealized depreciation | | $ | (34,469,154 | ) | |
| Net unrealized appreciation | | $ | 125,736,995 | | |
The following capital loss carryforward, determined at October 31, 2011, may be available to reduce taxable income arising from future net realized gains on investments, if any, to the extent permitted by the Internal Revenue Code:
| Year of Expiration | | Amount | |
| 2013 | | $ | 106,525 | | |
| 2015 | | | 361,418 | | |
| 2016 | | | 160,476 | | |
| 2017 | | | 233,374 | | |
| 2018 | | | 62,558 | | |
| Total | | $ | 924,351 | | |
On December 22, 2010, the Regulated Investment Company Modernization Act of 2010 (the Act) was enacted, which changed various technical rules governing the tax treatment of regulated investment companies. The changes are generally effective for taxable years beginning after the date of enactment. Under the Act, the Fund will be permitted to carry forward capital losses incurred in taxable years beginning after the date of enactment for an unlimited period. However, any losses incurred during those future taxable years will be required to be utilized prior to the losses incurred in pre-enactment taxable years, which carry an expiration date. As a result of this ordering rule, pre-enactment capital loss carryforwards may be more likely to expire unused.
The Fund acquired $820,295 of capital loss carryforward in connection with the Columbia New Jersey Intermediate Municipal Bond Fund, Columbia Rhode Island Intermediate Municipal Bond Fund and RiverSource Intermediate Tax-Exempt Fund merger (Note 11). In addition to the acquired capital loss carryforward, the Fund also acquired unrealized capital gains as a result of the merger. The yearly utilization of the acquired capital loss carryforward may be limited by the Internal Revenue Code.
For the year ended October 31, 2011, $1,840,790 of capital loss carryforward was utilized.
Management of the Fund has concluded that there are no significant uncertain tax positions that would require recognition in the financial statements. However, management's conclusion may be subject to review and adjustment at a later date based on factors including, but not limited to, new tax laws, regulations, and administrative interpretations (including relevant court decisions). Generally, the Fund's federal tax returns for the prior three fiscal years remain subject to examination by the Internal Revenue Service.
Note 5. Portfolio Information
The cost of purchases and proceeds from sales of securities, excluding short-term obligations, aggregated to $209,685,343 and $448,407,267, respectively, for the year ended October 31, 2011.
Note 6. Regulatory Settlements
During the year ended October 31, 2010, the Fund received payments of $7,268 resulting from certain regulatory settlements with third parties in which the Fund had participated. The payments have been included in "Proceeds from regulatory settlements" in the Statement of Changes in Net Assets.
Note 7. Lending of Portfolio Securities
Effective May 16, 2011, the Fund has entered into a Master Securities Lending Agreement (the Agreement) with JPMorgan Chase Bank, N.A. (JPMorgan). The Agreement, which replaces the previous security lending arrangement with State Street, authorizes JPMorgan as lending agent to
45
Columbia Intermediate Municipal Bond Fund, October 31, 2011
lend securities to authorized borrowers in order to generate additional income on behalf of the Fund. Pursuant to the Agreement, the securities loaned are secured by cash or U.S. government securities equal to at least 100% of the market value of the loaned securities. Any additional collateral required to maintain those levels due to market fluctuations of the loaned securities is delivered the following business day. Cash collateral received is invested by the lending agent on behalf of the Fund into authorized investments pursuant to the Agreement. The investments made with the cash collateral are listed in the Portfolio of Investments. The values of such investments and any uninvested cash collateral are disclosed in the Statement of Assets and Liabilities along with the related obligation to return the collateral upon the return of the securities loaned. For the year ended October 31, 2011, the Fund did not participate in securities lending activity.
Risks of delay in recovery of securities or even loss of rights in the securities may occur should the borrower of the securities fail financially. Risks may also arise to the extent that the value of the securities loaned increases above the value of the collateral received. JPMorgan will indemnify the Fund from losses resulting from a borrower's failure to return a loaned security when due. Such indemnification does not extend to losses associated with declines in the value of cash collateral investments. The Investment Manager is not responsible for any losses incurred by the Fund in connection with the securities lending program. Loans are subject to termination by the Fund or the borrower at any time, and are, therefore, not considered to be illiquid investments.
Pursuant to the Agreement, the Fund receives income for lending its securities either in the form of fees or by earning interest on invested cash collateral, net of negotiated rebates paid to borrowers and fees paid to the lending agent for services provided and any other securities lending expenses. The Fund continues to earn and accrue interest and dividends on the securities loaned.
Prior to May 16, 2011, the Fund participated in a securities lending arrangement with State Street. Each security on loan was collateralized in an amount at least equal to the market value of the securities loaned plus accrued income from the investment of collateral. The income generated by the investment of the collateral, net of any fees remitted to State Street as the lending agent and borrower rebates, was paid to the Fund.
Note 8. Custody Credits
Prior to May 16, 2011, the Fund had an agreement with its custodian bank under which custody fees may have been reduced by balance credits. These credits are recorded as part of expense reductions on the Statement of Operations. The Fund could have invested a portion of the assets utilized in connection with the expense offset arrangement in an income-producing asset if they had not entered into such an agreement. For the period November 1, 2010 through May 16, 2011, these credits reduced total expenses by $86.
Note 9. Shareholder Concentration
At October 31, 2011, one shareholder account owned 85.3% of the outstanding shares of the Fund. Subscription and redemption activity of this account may have a significant effect on the operations of the Fund.
Note 10. Line of Credit
The Fund has entered into a revolving credit facility with a syndicate of banks led by JPMorgan Chase Bank, N.A. (the Administrative Agent), whereby the Fund may borrow for the temporary funding of shareholder redemptions or for other temporary or emergency purposes. The credit facility became effective on May 16, 2011, replacing a prior credit facility. The credit facility agreement which is a collective agreement between the Fund and certain other funds managed by the Investment Manager, severally and not jointly, permits collective borrowings up to $500,000,000.
Interest is charged to each participating fund based on its borrowings at a rate equal to the sum of the federal funds rate plus (i) 1.25% per annum plus (ii) if one-month LIBOR exceeds the federal funds rate, the amount of such excess. Each borrowing under the credit facility matures no later than 60 days after the date of borrowing. The Fund also pays a commitment fee equal to its pro rata share of the amount of the credit facility at a rate of 0.10% per annum.
For the period March 28, 2011 through May 15, 2011, the Fund and certain other funds managed by the Investment Manager participated in a $225,000,000 committed, unsecured revolving credit facility provided by State Street. Prior to March 28, 2011, the collective borrowing amount of the credit facility was $280,000,000. Interest was charged to each fund based on its borrowings at a rate equal to the greater of the (i) federal funds rate plus 1.25% per annum or
46
Columbia Intermediate Municipal Bond Fund, October 31, 2011
(ii) the overnight LIBOR rate plus 1.25% per annum. The Fund also paid a commitment fee equal to its pro rata share of the amount of the credit facility at a rate of 0.125% per annum.
Effective December 13, 2011, the Fund extended its revolving credit facility with the Administrative Agent. The credit facility agreement, as amended, permits collective borrowings up to $500 million. Effective December 13, 2011, interest is charged to each participating fund based on its borrowings at a rate equal to the higher of (i) the overnight federal funds rate plus 1.00% or (i) the one-month LIBOR rate plus 1.00%. Each borrowing under the credit facility matures no later than 60 days after the date of borrowing. The Fund also pays a commitment fee equal to its pro rata share of the amount of the credit facility at a rate of 0.08% per annum.
The Fund had no borrowings during the year ended October 31, 2011.
Note 11. Fund Merger
At the close of business on June 3, 2011, the Fund acquired the assets and assumed the identified liabilities of Columbia New Jersey Intermediate Municipal Bond Fund and Columbia Rhode Island Intermediate Municipal Bond Fund, two series of the Columbia Funds Series Trust I, and RiverSource Intermediate Tax-Exempt Fund, a series of RiverSource Tax-Exempt Series, Inc. The reorganization was completed after shareholders approved the plan on February 15, 2011. The purpose of the transaction was to combine four funds managed by the Investment Manager with comparable investment objectives and strategies.
The aggregate net assets of the Fund immediately before the acquisitions were $2,227,872,401 and the combined net assets immediately after the acquisitions were $2,470,068,389.
The merger was accomplished by a tax-free exchange of 6,633,086 shares of Columbia New Jersey Intermediate Municipal Bond Fund valued at $67,948,141 (including $2,489,546 of unrealized appreciation), 7,276,496 shares of Columbia Rhode Island Intermediate Municipal Bond Fund valued at $80,645,240 (including $3,430,564 of unrealized appreciation), and 17,556,452 shares of RiverSource Intermediate Tax-Exempt Fund valued at $93,602,607 (including $4,097,605 of unrealized appreciation).
In exchange for shares of Columbia New Jersey Intermediate Municipal Bond Fund, Columbia Rhode Island Intermediate Municipal Bond Fund and RiverSource Intermediate Tax-Exempt Fund, the Fund issued the following number of shares:
| | | Columbia
New Jersey
Intermediate
Municipal
Bond Fund | | Columbia
Rhode Island
Intermediate
Municipal
Bond Fund | | RiverSource
Intermediate
Tax-Exempt
Fund | |
| Class A | | | 797,207 | | | | 143,586 | | | | 8,153,717 | | |
| Class B | | | 45,032 | | | | 19,457 | | | | 180,126 | | |
| Class C | | | 442,856 | | | | 140,604 | | | | 611,888 | | |
| Class T | | | 332,124 | | | | 752,582 | | | | N/A | | |
| Class Z | | | 4,876,357 | | | | 6,650,733 | | | | N/A | | |
For financial reporting purposes, net assets received and shares issued by the Fund were recorded at fair value; however, Columbia New Jersey Intermediate Municipal Bond Fund, Columbia Rhode Island Intermediate Municipal Bond Fund and RiverSource Intermediate Tax-Exempt Fund's cost of investments was carried forward to align ongoing reporting of the Fund's realized and unrealized gains and losses with amounts distributable to shareholders for tax purposes.
The financial statements reflect the operations of the Fund for the period prior to the merger and the combined fund for the period subsequent to the merger. Because the combined investment portfolios have been managed as a single integrated portfolio since the merger was completed, it is not practicable to separate the amounts of revenue and earnings of Columbia New Jersey Intermediate Municipal Bond Fund, Columbia Rhode Island Intermediate Municipal Bond Fund and RiverSource Intermediate Tax-Exempt Fund that have been included in the combined Fund's Statement of Operations since the merger was completed.
Assuming the merger had been completed on November 1, 2010, the Fund's pro-forma net investment income, net gain on investments, net change in unrealized depreciation and net increase in net assets from operations for the year ended October 31, 2011 would have been approximately $93.3 million, $2.3 million, $(15.9) million and $79.6 million, respectively.
47
Columbia Intermediate Municipal Bond Fund, October 31, 2011
Note 12. Significant Risks
Tax Development Risk
The Fund purchases municipal securities whose interest, in the opinion of bond counsel, is free from federal income tax. There is no assurance that the Internal Revenue Service (IRS) will agree with this opinion. In the event the IRS determines that an issuer does not comply with relevant tax requirements, interest payments from a security could become federally taxable, possibly retroactively to the date the security was issued. As a shareholder of the Fund, you may be required to file an amended tax return as a result.
Note 13. Subsequent Events
Management has evaluated the events and transactions that have occurred through the date the financial statements were issued. Other than noted in Note 10 above, there were no items requiring adjustment of the financial statements or additional disclosure.
Note 14. Information Regarding Pending and Settled Legal Proceedings
In June 2004, an action captioned John E. Gallus et al. v. American Express Financial Corp. and American Express Financial Advisors Inc. was filed in the United States District Court for the District of Arizona. The plaintiffs allege that they are investors in several American Express Company mutual funds (branded as Columbia) and they purport to bring the action derivatively on behalf of those funds under the Investment Company Act of 1940. The plaintiffs allege that fees allegedly paid to the defendants by the funds for investment advisory and administrative services are excessive. The plaintiffs seek remedies including restitution and rescission of investment advisory and distribution agreements. The plaintiffs voluntarily agreed to transfer this case to the United States District Court for the District of Minnesota (the District Court). In response to defendants' motion to dismiss the complaint, the District Court dismissed one of plaintiffs' four claims and granted plaintiffs limited discovery. Defendants moved for summary judgment in April 2007. Summary judgment was granted in the defendants' favor on July 9, 2007. The plaintiffs filed a notice of appeal with the Eighth Circuit Court of Appeals (the Eighth Circuit) on August 8, 2007. On April 8, 2009, the Eighth Circuit reversed summary judgment and remanded to the District Court for further proceedings. On August 6, 2009, defendants filed a writ of certiorari with the U.S. Supreme Court (the Supreme Court), asking the Supreme Court to stay the District Court proceedings while the Supreme Court considers and rules in a case captioned Jones v. Harris Associates, which involves issues of law similar to those presented in the Gallus case. On March 30, 2010, the Supreme Court issued its ruling in Jones v. Harris Associates, and on April 5, 2010, the Supreme Court vacated the Eighth Circuit's decision in the Gallus case and remanded the case to the Eighth Circuit for further consideration in light of the Supreme Court's decision in Jones v. Harris Associates. On June 4, 2010, the Eighth Circuit remanded the Gallus case to the District Court for further consideration in light of the Supreme Court's decision in Jones v. Harris Associates. On December 9, 2010, the District Court reinstated its July 9, 2007 summary judgment order in favor of the defendants. On January 10, 2011, plaintiffs filed a notice of appeal with the Eighth Circuit. In response to the plaintiffs' opening appellate brief filed on March 18, 2011, the defendants filed a response brief on May 4, 2011 with the Eighth Circuit. The plaintiffs filed a reply brief on May 26, 2011 and oral arguments took place on November 17, 2011.
In December 2005, without admitting or denying the allegations, American Express Financial Corporation (AEFC, which is now known as Ameriprise Financial, Inc. (Ameriprise Financial)), entered into settlement agreements with the Securities and Exchange Commission (SEC) and Minnesota Department of Commerce (MDOC) related to market timing activities. As a result, AEFC was censured and ordered to cease and desist from committing or causing any violations of certain provisions of the Investment Advisers Act of 1940, the Investment Company Act of 1940, and various Minnesota laws. AEFC agreed to pay disgorgement of $10 million and civil money penalties of $7 million. AEFC also agreed to retain an independent distribution consultant to assist in developing a plan for distribution of all disgorgement and civil penalties ordered by the SEC in accordance with various undertakings detailed at www.sec.gov/litigation/admin/ia-2451.pdf. Ameriprise Financial and its affiliates have cooperated with the SEC and the MDOC in these legal proceedings, and have made regular reports to the funds' Boards of Trustees.
48
Columbia Intermediate Municipal Bond Fund, October 31, 2011
Ameriprise Financial and certain of its affiliates have historically been involved in a number of legal, arbitration and regulatory proceedings, including routine litigation, class actions, and governmental actions, concerning matters arising in connection with the conduct of their business activities. Ameriprise Financial believes that the Funds are not currently the subject of, and that neither Ameriprise Financial nor any of its affiliates are the subject of, any pending legal, arbitration or regulatory proceedings that are likely to have a material adverse effect on the Funds or the ability of Ameriprise Financial or its affiliates to perform under their contracts with the Funds. Ameriprise Financial is required to make 10-Q, 10-K and, as necessary, 8-K filings with the Securities and Exchange Commission on legal and regulatory matters that relate to Ameriprise Financial and its affiliates. Copies of these filings may be obtained by accessing the SEC website at www.sec.gov.
There can be no assurance that these matters, or the adverse publicity associated with them, will not result in increased fund redemptions, reduced sale of fund shares or other adverse consequences to the Funds. Further, although we believe proceedings are not likely to have a material adverse effect on the Funds or the ability of Ameriprise Financial or its affiliates to perform under their contracts with the Funds, these proceedings are subject to uncertainties and, as such, we are unable to estimate the possible loss or range of loss that may result. An adverse outcome in one or more of these proceedings could result in adverse judgments, settlements, fines, penalties or other relief that could have a material adverse effect on the consolidated financial condition or results of operations of Ameriprise Financial.
49
Report of Independent Registered Public Accounting Firm
To the Trustees of Columbia Funds Series Trust I and the Shareholders of Columbia Intermediate Municipal Bond Fund
In our opinion, the accompanying statement of assets and liabilities, including the investment portfolio, and the related statements of operations and of changes in net assets and the financial highlights present fairly, in all material respects, the financial position of Columbia Intermediate Municipal Bond Fund (the "Fund") (a series of Columbia Funds Series Trust I) at October 31, 2011, and the results of its operations for the year then ended, the changes in its net assets for each of the two years in the period then ended and the financial highlights for each of the periods indicated, in conformity with accounting principles generally accepted in the United States of America. These financial statements and financial highlights (hereafter referred to as "financial statements") are the responsibility of the Fund's management. Our responsibility is to express an opinion on these financial statements based on our audits. We conducted our audits of these financial statements in accordance with the standards of the Public Company Accounting Oversight Board (United States). Those standards require that we plan and perform the audit to obtain reasonable assurance about whether the financial statements are free of material misstatement. An audit includes examining, on a test basis, evidence supporting the amounts and disclosures in the financial statements, assessing the accounting principles used and significant estimates made by management, and evaluating the overall financial statement presentation. We believe that our audits, which included confirmation of securities at October 31, 2011 by correspondence with the custodian and brokers, provide a reasonable basis for our opinion.
PricewaterhouseCoopers LLP
Minneapolis, Minnesota
December 22, 2011
50
Federal Income Tax Information (Unaudited) – Columbia Intermediate Municipal Bond Fund
For the fiscal year ended October 31, 2011, 98.53% of the distributions from net investment income of the Fund qualifies as exempt interest dividends for federal income tax purposes. A portion of the income may be subject to federal alternative minimum tax.
The Fund will notify shareholders in January 2012 of amounts for use in preparing 2011 income tax returns.
51
Fund Governance
The Trustees serve terms of indefinite duration. The names, addresses and birth years of the Trustees and Officers of the Funds in Columbia Funds Series Trust I, the year each was first elected or appointed to office, their principal business occupations during at least the last five years, the number of Funds overseen by each Trustee and other directorships they hold are shown below. Each officer listed below serves as an officer of each Fund in Columbia Funds Series Trust I.
Independent Trustees
Name, Address and Year of Birth,
Position with Funds, Year First
Elected or Appointed to Office | | Principal Occupation(s) During Past Five Years, Number of Funds in Columbia
Funds Complex Overseen by Trustee, Other Directorships Held
| |
| Rodman L. Drake (Born 1943) | |
|
c/o Columbia Management
Investment Advisers, LLC
225 Franklin Street
Boston, MA 02110
Trustee (since 1994) and Chairman of the Board (since 2009) | | Independent consultant since 2010; Co-Founder of Baringo Capital LLC (private equity) from 1997 to 2008; CEO of Crystal River Capital, Inc. (real estate investment trust) from 2003 to 2010; Oversees 43; Jackson Hewitt Tax Service Inc. (tax preparation services from 2004 to 2011); Celgene Corporation (global biotechnology company); Student Loan Corporation (student loan provider from 2008 to 2010); Celgene Corporation (global biotechnology company); The Helios Funds and Brookfield Funds (closed-end funds); Crystal River Capital, Inc. from 2005 to 2010; Parson Brinckerhoff from 1995 to 2008; and Apex Silver Mines Ltd. from 2007 to 2009 | |
|
| Douglas A. Hacker (Born 1955) | |
|
c/o Columbia Management
Investment Advisers, LLC
225 Franklin Street
Boston, MA 02110
Trustee (since 1996) | | Independent business executive since May 2006; Executive Vice President—Strategy of United Airlines from December 2002 to May 2006; President of UAL Loyalty Services (airline marketing company) from September 2001 to December 2002; Executive Vice President and Chief Financial Officer of United Airlines from July 1999 to September 2001. Oversees 43; Nash Finch Company (food distributor); Aircastle Limited (aircraft leasing); and SeaCube Container Leasing Ltd (container leasing) | |
|
| Janet Langford Kelly (Born 1957) | |
|
c/o Columbia Management
Investment Advisers, LLC
225 Franklin Street
Boston, MA 02110
Trustee (since 1996) | | Senior Vice President, General Counsel and Corporate Secretary, ConocoPhillips (integrated energy company) since September 2007; Deputy General Counsel—Corporate Legal Services, ConocoPhillips from August 2006 to August 2007; Partner, Zelle, Hofmann, Voelbel, Mason & Gette LLP (law firm) from March 2005 to July 2006; Adjunct Professor of Law, Northwestern University, from September 2004 to June 2006; Director, UAL Corporation (airline) from February 2006 to July 2006; Oversees 43; None | |
|
| Nancy T. Lukitsh (Born 1956) | |
|
c/o Columbia Management
Investment Advisers, LLC
225 Franklin Street
Boston, MA 02110
Trustee (since 2011) | | Senior Vice President, Partner and Director, Marketing of Wellington Management Company, LLP (investment adviser) from 1997 to 2010; Chair, Wellington Management Investment Portfolios (commingled non-U.S. investment pools) from 2007 to 2010; Director, Wellington Trust Company, NA and other Wellington affiliates from 1997 to 2010. Oversees 43; None | |
|
52
Fund Governance (continued)
Independent Trustees (continued)
Name, Address and Year of Birth,
Position with Funds, Year First
Elected or Appointed to Office | | Principal Occupation(s) During Past Five Years, Number of Funds in Columbia
Funds Complex Overseen by Trustee, Other Directorships Held
| |
| William E. Mayer (Born 1940) | |
|
c/o Columbia Management
Investment Advisers, LLC
225 Franklin Street
Boston, MA 02110
Trustee (since 1994) | | Partner, Park Avenue Equity Partners (private equity) since February 1999; Dean and Professor, College of Business and Management, University of Maryland from 1992 to 1996. Oversees 43; DynaVox Inc. (speech creation); Lee Enterprises (print media); WR Hambrecht + Co. (financial service provider); BlackRock Kelso Capital Corporation (investment company) | |
|
| David M. Moffett (Born 1952) | |
|
c/o Columbia Management
Investment Advisers, LLC
225 Franklin Street
Boston, MA 02110
Trustee (since 2011) | | Retired. Chief Executive Officer, Federal Home Loan Mortgage Corporation, from 2008 to 2009; Senior Adviser, Global Financial Services Group, Carlyle Group, Inc., from 2007 to 2008; Vice Chairman and Chief Financial Officer, U.S. Bancorp, from 1993 to 2007. Oversees 43; CIT Group Inc. (commercial and consumer finance), eBay Inc. (online trading community), MBIA Corp (financial service provider), E.W. Scripps Co. (print and television media), Building Materials Holding Corp. (building materials and construction services), and University of Oklahoma Foundation. | |
|
| Charles R. Nelson (Born 1942) | |
|
c/o Columbia Management
Investment Advisers, LLC
225 Franklin Street
Boston, MA 02110
Trustee (since 1981) | | Retired Professor Emeritus, University of Washington, since 2011; Professor of Economics, University of Washington, from January 1976 to 2011; Ford and Louisa Van Voorhis Professor of Political Economy, University of Washington, from 1993 to 2011; Adjunct Professor of Statistics, University of Washington, from 1980 to 2011; Associate Editor, Journal of Money Credit and Banking from 1993 to 2008; consultant on econometric and statistical matters. Oversees 43; None | |
|
| John J. Neuhauser (Born 1943) | |
|
c/o Columbia Management
Investment Advisers, LLC
225 Franklin Street
Boston, MA 02110
Trustee (since 1984) | | President, Saint Michael's College, since August 2007; Director or Trustee of several non-profit organizations, including Fletcher Allen Health Care, Inc.; University Professor, Boston College from November 2005 to August 2007; Academic Vice President and Dean of Faculties, Boston College from August 1999 to October 2005. Oversees 43; Liberty All-Star Equity Fund and Liberty All-Star Growth Fund (closed-end funds) | |
|
| Patrick J. Simpson (Born 1944) | |
|
c/o Columbia Management
Investment Advisers, LLC
225 Franklin Street
Boston, MA 02110
Trustee (since 2000) | | Partner, Perkins Coie LLP (law firm). Oversees 43; None | |
|
| Anne-Lee Verville (Born 1945) | |
|
c/o Columbia Management
Investment Advisers, LLC
225 Franklin Street
Boston, MA 02110
Trustee (since 1998) | | Retired since 1997 (formerly General Manager–Global Education Industry from 1994 to 1997, President–Application Systems Division from 1991 to 1994, Chief Financial Officer–US Marketing & Services from 1988 to 1991, and Chief Information Officer from 1987 to 1988, IBM Corporation (computer and technology)). Oversees 43; Enesco Group, Inc. (producer of giftware and home and garden decor products) from 2001 to 2006 | |
|
53
Fund Governance (continued)
Interested Trustee
Name, Address and Year of Birth,
Position with Funds, Year First
Elected or Appointed to Office | | Principal Occupation(s) During Past Five Years, Number of Funds in Columbia
Funds Complex Overseen by Trustee, Other Directorships Held
| |
| Michael A. Jones (born 1959) | |
|
c/o Columbia Management
Investment Advisers, LLC
225 Franklin Street
Boston, MA 02110
Trustee (since 2011)
Senior Vice President (since 2011) | | President and Director, Columbia Management Investment Advisers, LLC since May 2010; President and Director, Columbia Management Investment Distributors, Inc. since May 2010; Manager, Chairman, Chief Executive Officer and President, Columbia Management Advisors, LLC from 2007 to April 2010; Chief Executive Officer, President and Director, Columbia Management Distributors, Inc. from November 2006 to April 2010; previously, co-president and senior managing director at Robeco Investment Management. Oversees 43; None | |
|
The Statement of Additional Information includes additional information about the Trustees of the Funds and is available, without charge, upon request by calling 1-800-345-6611.
Officers
| Name, Year of Birth and Address | | Principal Occupation(s) During the Past Five Years | |
| J. Kevin Connaughton (Born 1964) | |
|
225 Franklin Street
Boston, MA 02110
President (since 2009) | | Senior Vice President and General Manager–Mutual Fund Products, Columbia Management Investment Advisers, LLC since May 2010; President, Columbia Funds, since 2009, and RiverSource Funds, since May 2010 (previously Senior Vice President and Chief Financial Officer, Columbia Funds, from June 2008 to January 2009, Treasurer, Columbia Funds, from October 2003 to May 2008, and senior officer of various other affiliated funds since 2000); Managing Director, Columbia Management Advisors, LLC from December 2004 to April 2010. | |
|
| Michael G. Clarke (Born 1969) | |
|
225 Franklin Street
Boston, MA 02110
Treasurer (since 2011) and Chief
Financial Officer (since 2009) | | Vice President, Columbia Management Investment Advisers, LLC since May 2010; Managing Director of Fund Administration, Columbia Management Advisors, LLC, from September 2004 to April 2010; senior officer of Columbia Funds and affiliated funds since 2002. | |
|
| Scott R. Plummer (Born 1959) | |
|
5228 Ameriprise Financial Center
Minneapolis, MN 55474
Senior Vice President, Assistant Secretary
and Chief Legal Officer (since 2010) | | Chief Legal Officer and Assistant Secretary, Columbia Management Investment Advisers, LLC since June 2005; Vice President and Lead Chief Counsel–Asset Management, Ameriprise Financial, Inc. since May 2010 (previously Vice President and Chief Counsel–Asset Management, from 2005 to April 2010, and Vice President–Asset Management Compliance from 2004 to 2005); Vice President, Chief Counsel and Assistant Secretary, Columbia Management Investment Distributors, Inc. since 2008; Vice President, General Counsel and Secretary, Ameriprise Certificate Company since 2005; Chief Counsel, RiverSource Distributors, Inc. since 2006; Vice President, General Counsel and Secretary, RiverSource Funds, since December 2006; Senior Vice President, Secretary and Chief Legal Officer, Columbia Funds, since May 2010. | |
|
54
Fund Governance (continued)
Officers (continued)
| Name, Year of Birth and Address | | Principal Occupation(s) During the Past Five Years | |
| Linda J. Wondrack (Born 1964) | |
|
225 Franklin Street
Boston, MA 02110
Senior Vice President and Chief
Compliance Officer (since 2007) | | Vice President and Chief Compliance Officer, Columbia Management Investment Advisers, LLC since May 2010; Chief Compliance Officer, Columbia Funds, since 2007, and RiverSource Funds, since May 2010; Director (Columbia Management Group, LLC and Investment Product Group Compliance), Bank of America, from June 2005 to April 2010; Director of Corporate Compliance and Conflicts Officer of MFS Investment Management (investment management) from August 2004 to May 2005. | |
|
| William F. Truscott (Born 1960) | |
|
53600 Ameriprise Financial Center
Minneapolis, MN 55474
Senior Vice President (since 2010) | | Chairman of the Board, Columbia Management Investment Advisers, LLC since May 2010 (previously President, Chairman of the Board and Chief Investment Officer, from 2001 to April 2010); Chief Executive Officer, U.S. Asset Management & President, Annuities, Ameriprise Financial, Inc. since May 2010 (previously President–U.S. Asset Management and Chief Investment Officer from 2005 to April 2010, and Senior Vice President—Chief Investment Officer, from 2001 to 2005); Director, President and Chief Executive Officer, Ameriprise Certificate Company since 2006; Director, Columbia Management Investment Distributors, Inc. since May 2010 (previously Chairman of the Board and Chief Executive Officer from 2008 to April 2010); Chairman of the Board and Chief Executive Officer, RiverSource Distributors, Inc. since 2006. | |
|
| Colin Moore (Born 1958) | |
|
225 Franklin Street
Boston, MA 02110
Senior Vice President (since 2010) | | Director and Chief Investment Officer, Columbia Management Investment Advisers, LLC since May 2010; Manager, Managing Director and Chief Investment Officer of Columbia Management Advisors, LLC from 2007 to April 2010; Head of Equities, Columbia Management Advisors, LLC from 2002 to 2007. | |
|
| Amy Johnson (Born 1965) | |
|
5228 Ameriprise Financial Center
Minneapolis, MN 55474
Vice President (since 2010) | | Senior Vice President and Chief Operating Officer, Columbia Management Investment Advisers, LLC since May 2010 (previously Chief Administrative Officer, from 2009 until April 2010, Vice President—Asset Management and Trust Company Services, from 2006 to 2009, and Vice President—Operations and Compliance from 2004 to 2006). | |
|
| Joseph F. DiMaria (Born 1968) | |
|
225 Franklin Street
Boston, MA 02110
Vice President (since 2011) and
Chief Accounting Officer (since 2008) | | Vice President, Mutual Fund Administration, Columbia Management Investment Advisers, LLC, since May 2010; Director of Fund Administration, Columbia Management Advisors, LLC from January 2006 to April 2010; Head of Tax/Compliance and Assistant Treasurer, Columbia Management Advisors, LLC, from November 2004 to December 2005. | |
|
| Stephen T. Welsh (born 1957) | |
|
225 Franklin Street
Boston, MA 02110
Vice President (since 2006) | | President and Director, Columbia Management Investment Services Corp. since May 2010; President and Director, Columbia Management Services, Inc. from July 2004 to April 2010; Managing Director, Columbia Management Distributors, Inc. from August 2007 to April 2010. | |
|
55
Fund Governance (continued)
Officers (continued)
| Name, Year of Birth and Address | | Principal Occupation(s) During the Past Five Years | |
| Paul D. Pearson (born 1956) | |
|
5228 Ameriprise Financial Center
Minneapolis, MN 55474
Vice President and Assistant
Treasurer (since 2011) | | Vice President, Investment Accounting, Columbia Management Investment Advisers, LLC, since May 2010; Vice President, Managed Assets, Investment Accounting, Ameriprise Financial Corporation. | |
|
| Paul B. Goucher (born 1968) | |
|
5228 Ameriprise Financial Center
Minneapolis, MN 55474
Vice President and Assistant
Secretary (since 2010) | | Vice President and Chief Counsel of Ameriprise Financial since January 2010 (formerly Vice President and Group Counsel from November 2008 to January 2010); Director, Managing Director and General Counsel of J. & W. Seligman & Co. Incorporated (Seligman) from July 2008 to November 2008 and Managing Director and Associate General Counsel of Seligman from January 2005 to July 2008. | |
|
| Christopher O. Petersen (born 1970) | |
|
5228 Ameriprise Financial Center
Minneapolis, MN 55474
Vice President (since 2010) and
Secretary (since 2011) | | Vice President and Chief Counsel, Ameriprise Financial since January 2010 (formerly Vice President and Group Counsel or Counsel from April 2004 to January 2010); Assistant Secretary of RiverSource Funds since January 2007. | |
|
| Michael E. DeFao (born 1968) | |
|
5228 Ameriprise Financial Center
Minneapolis, MN 55474
Vice President and Assistant
Secretary (since 2011) | | Vice President and Chief Counsel, Ameriprise Financial since May 2010; Associate General Counsel Bank of America from June 2005 to April 2010 | |
|
56
Important Information About This Report
The fund mails one shareholder report to each shareholder address. If you would like more than one report, please call shareholder services at 1-800-345-6611 and additional reports will be sent to you. This report has been prepared for shareholders of Columbia Intermediate Municipal Bond Fund.
A description of the policies and procedures that the fund uses to determine how to vote proxies and a copy of the fund's voting records are available (i) at www.columbiamanagement.com, (ii) on the Securities and Exchange Commission's website at www.sec.gov, and (iii) without charge, upon request, by calling 1-800-368-0346. Information regarding how the fund voted proxies relating to portfolio securities during the 12-month period ended June 30 is available from the SEC's website. Information regarding how the fund voted proxies relating to portfolio securities is also available from the fund's website, www.columbiamanagement.com.
The fund files a complete schedule of portfolio holdings with the SEC for the first and third quarters of each fiscal year on Form N-Q. The fund's Form N-Q is available on the SEC's website at www.sec.gov and may be reviewed and copied at the SEC's Public Reference Room in Washington, D.C. Information on the operation of the Public Reference Room may be obtained by calling 1-800-SEC-0330.
Transfer Agent
Columbia Management Investment
Services Corp.
P.O. Box 8081
Boston, MA 02266-8081
1-800-345-6611
Distributor
Columbia Management Investment
Distributors, Inc.
225 Franklin Street
Boston, MA 02110
Investment Manager
Columbia Management Investment Advisers, LLC
225 Franklin Street
Boston, MA 02110
57

Columbia Intermediate Municipal Bond Fund
P. O. Box 8081
Boston, MA 02266-8081
columbiamanagement.com
This information is for use with concurrent or prior delivery of a fund prospectus. Investors should consider the investment objectives, risks, charges and expenses of a mutual fund carefully before investing. For a free prospectus, which contains this and other important information about the funds, visit columbiamanagement.com. Read the prospectus carefully before investing. The Fund is distributed by Columbia Management Investment Distributors, Inc., member FINRA, and managed by Columbia Management Investment Advisers, LLC.
© 2011 Columbia Management Investment Advisers, LLC. All rights reserved.
C-1726 C (12/11)

Columbia Massachusetts Intermediate Municipal Bond Fund
Annual Report for the Period Ended October 31, 2011
Not FDIC insured • No bank guarantee • May lose value
Table of Contents
| Fund Profile | | | 1 | | |
|
| Performance Information | | | 2 | | |
|
| Understanding Your Expenses | | | 3 | | |
|
| Portfolio Manager's Report | | | 4 | | |
|
| Portfolio of Investments | | | 6 | | |
|
Statement of Assets and
Liabilities | | | 13 | | |
|
| Statement of Operations | | | 15 | | |
|
Statement of Changes in
Net Assets | | | 16 | | |
|
| Financial Highlights | | | 18 | | |
|
| Notes to Financial Statements | | | 23 | | |
|
Report of Independent Registered
Public Accounting Firm | | | 32 | | |
|
| Federal Income Tax Information | | | 33 | | |
|
| Fund Governance | | | 34 | | |
|
Important Information About
This Report | | | 41 | | |
|
The views expressed in this report reflect the current views of the respective parties. These views are not guarantees of future performance and involve certain risks, uncertainties and assumptions that are difficult to predict, so actual outcomes and results may differ significantly from the views expressed. These views are subject to change at any time based upon economic, market or other conditions and the respective parties disclaim any responsibility to update such views. These views may not be relied on as investment advice and, because investment decisions for a Columbia Fund are based on numerous factors, may not be relied on as an indication of trading intent on behalf of any particular Columbia Fund. References to specific securities should not be construed as a recommendation or investment advice.
President's Message

Dear Shareholders,
Economic momentum slowed in the third quarter of 2011, raising the odds of recession and making the U.S. economy more susceptible to financial shocks. The unemployment rate remained stalled as growing uncertainty continued to weigh on prospective employers. Monthly indicators for the manufacturing and service sectors also showed signs of slowing. Equity and high-yield bond markets fell sharply as investor confidence was shaken by Europe's lingering debt crisis, a heated debate in Washington over fiscal deficits (which eventually led to a downgrade of U.S. government debt) and tepid economic growth. The U.S. stock market experienced its worst quarter in two years during the third quarter of 2011, with volatility and selling pressure reminiscent of the market selloff in 2008, as macro-economic concerns continued to mount.
During its September meeting, the Federal Reserve Board announced that it was prepared to purchase longer term securities and sell shorter term securities in an effort to keep long-term interest rates down. Their hope is that lower long-term borrowing rates will stimulate business investment and hiring. However, the question remains as to whether monetary policy alone will be enough to resuscitate growth in the current environment.
Despite this challenging and volatile economic backdrop, I believe Columbia Management remains strong and steadfast. Columbia Management is the eighth largest manager of long-term mutual fund assets with $325 billion under management as of September 30, 2011. The past year has been one of considerable change for the organization as we worked diligently to align products, services and resources in the integration of Columbia Management with RiverSource Investments. The incredible line-up of talent, resources and capabilities that has resulted is highlighted by the success of our products. As of September 30, 2011, Columbia Management offers 54 funds rated 4 and 5 stars by Morningstar. Additionally, The Wall Street Journal has named two Columbia funds "Category Kings" in its "Investing in Funds: A Quarterly Analysis" issue dated October 5, 2011 in recognition for their one-year performance as of September 30, 2011.
For more information about these and other funds offered by Columbia Management, including detailed, up-to-date fund performance and portfolio information, please visit us online at columbiamanagement.com. Other information and resources available on our website include:
g timely economic analysis and market commentary
g quarterly fund commentaries
g Columbia Management Investor, a quarterly newsletter for shareholders
Thank you for your continued support of the Columbia Funds. We look forward to serving your investment needs for many years to come.
Best Regards,

J. Kevin Connaughton
President, Columbia Funds
All ratings are Class Z as of 9/30/2011. Out of 118 Z-share Columbia funds rated by Morningstar, 8 funds received a 5-star Overall Rating and 46 funds received a 4-star Overall Rating. The Overall Morningstar Rating for a retail mutual fund is derived from a weighted average of the performance figures associated with its 3-, 5- and 10-year (if applicable) Morningstar Rating metrics. For share classes that do not have a 3-, 5-, or 10-year actual performance history, the fund's independent Morningstar Rating metric is then compared against the retail mutual fund universe breakpoints to determine its hypothetical rating.
For each fund with at least a three-year history, Morningstar calculates a Morningstar RatingTM based on a Morningstar Risk-Adjusted Return measure that accounts for variation in a fund's monthly performance (including the effects of sales charges, loads, and redemption fees), placing more emphasis on downward variations and rewarding consistent performance. The top 10% of funds in each category receive 5 stars, the next 22.5% receive 4 stars, the next 35% receive 3 stars, the next 22.5% receive 2 stars and the bottom 10% receive 1 star. (Each share class is counted as a fraction of one fund within this scale and rated separately, which may cause slight variations in the distribution percentages.)
The Morningstar RatingTM is for Class Z shares only; other classes may have different performance characteristics and may have different ratings. © 2011 Morningstar, Inc. All Rights Reserved. The Morningstar information contained herein: (1) is proprietary to Morningstar and/or its content providers; (2) may not be copied or distributed; and (3) is not warranted to be accurate, complete or timely. Neither Morningstar nor its content providers are responsible for any damages or losses arising from any use of this information.
The Wall Street Journal "Category Kings" methodology: Top-performing funds in each category ranked by one-year total returns (changes in net asset values and reinvested distributions) for the period ended September 30, 2011.
Investors should consider the investment objectives, risks, charges and expenses of a mutual fund carefully before investing. For a free prospectus, which contains this and other important information about the funds, visit www.columbiamanagement.com. The prospectus should be read carefully before investing.
Columbia Funds are distributed by Columbia Management Investment Distributors, Inc., member FINRA, and managed by Columbia Management Investment Advisers, LLC.
© 2011 Columbia Management Investment Advisers, LLC. All rights reserved.
Fund Profile – Columbia Massachusetts Intermediate Municipal Bond Fund
Summary
g For the 12-month period that ended October 31, 2011, the fund's Class A shares returned 3.24% without sales charge.
g The fund lagged its benchmark, the Barclays Capital 3-15 Year Blend Municipal Bond Index,1 while outpacing the average return of its peer group, the Lipper Other States Intermediate Municipal Debt Funds Classification.2
g The fund's heavier exposure to shorter-maturity securities relative to the Barclays Capital Index detracted from performance during a period in which longer-maturities outperformed in a market rally. Overweighted positions in hospital and education bonds helped performance.
Portfolio Management
Brian M. McGreevy has managed the fund since 2009 and has been associated with the adviser since May 2010. Prior to joining the adviser, Mr. McGreevy was associated with the fund's previous adviser or its predecessors since 1994.
1The Barclays Capital 3-15 Year Blend Municipal Bond Index tracks the performance of municipal bonds issued after December 31, 1990 with remaining maturities between 2 and 17 years and at least $7 million in principal amount outstanding.
2Lipper Inc., a widely respected data provider in the industry, calculates an average total return (assuming reinvestment of distributions) for mutual funds with investment objectives similar to those of the fund. Lipper makes no adjustment for the effect of sales loads.
Indices are not available for investment, are not professionally managed and do not reflect sales charges, fees, brokerage commissions, taxes or other expenses of investing. Securities in the fund may not match those in an index.
Performance data quoted represents past performance and current performance may be lower or higher. Past performance is no guarantee of future results. The investment return and principal value will fluctuate so that shares, when redeemed, may be worth more or less than the original cost. Please visit www.columbiamanagement.com for daily and most recent month-end performance updates.
Summary
1-year return as of 10/31/11
| | | | +3.24% | |
|
|  | | | Class A shares
(without sales charge) | |
|
| | | | +3.89% | |
|
|  | | | Barclays Capital 3-15 Year
Blend Municipal Bond Index | |
|
1
Performance Information – Columbia Massachusetts Intermediate Municipal Bond Fund
Performance data quoted represents past performance and current performance may be lower or higher. Past performance is no guarantee of future results. The investment return and principal value will fluctuate so that shares, when redeemed, may be worth more or less than the original cost. Please visit www.columbiamanagement.com for daily and most recent month-end performance updates.
Performance of a $10,000 investment 11/01/01 – 10/31/11
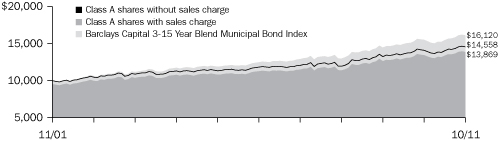
The chart above shows the change in value of a hypothetical $10,000 investment in Class A shares of Columbia Massachusetts Intermediate Municipal Bond Fund during the stated time period, and does not reflect the deduction of taxes that a shareholder may pay on fund distributions or on the redemption of fund shares. The performance of a $10,000 investment with sales charge for Class A shares is calculated with an initial sales charge of 4.75%, which was the effective sales charge prior to August 22, 2005.
Performance of a $10,000 investment 11/01/01 – 10/31/11 ($)
| Sales charge | | without | | with | |
| Class A | | | 14,558 | | | | 13,869 | | |
| Class B | | | 13,522 | | | | 13,522 | | |
| Class C | | | 13,948 | | | | 13,948 | | |
| Class T | | | 14,695 | | | | 13,999 | | |
| Class Z | | | 14,922 | | | | n/a | | |
Average annual total return as of 10/31/11 (%)
| Share class | | A | | B | | C | | T | | Z | |
| Inception | | 12/09/02 | | 12/09/02 | | 12/09/02 | | 06/26/00 | | 06/14/93 | |
| Sales charge | | without | | with | | without | | with | | without | | with | | without | | with | | without | |
| 1-year | | | 3.24 | | | | –0.14 | | | | 2.48 | | | | –0.52 | | | | 2.83 | | | | 1.83 | | | | 3.34 | | | | –1.61 | | | | 3.49 | | |
| 5-year | | | 4.25 | | | | 3.57 | | | | 3.48 | | | | 3.48 | | | | 3.84 | | | | 3.84 | | | | 4.36 | | | | 3.35 | | | | 4.51 | | |
| 10-year | | | 3.83 | | | | 3.32 | | | | 3.06 | | | | 3.06 | | | | 3.38 | | | | 3.38 | | | | 3.92 | | | | 3.42 | | | | 4.08 | | |
The "with sales charge" returns include the maximum initial sales charge of 3.25% for Class A shares (for the 1-year and 5-year periods), 4.75% for Class A shares (for the 10-year period) and 4.75% for Class T shares and the applicable contingent deferred sales charge of 3.00% in the first year, declining to 1.00% in the fourth year and eliminated thereafter for Class B shares and 1.00% for Class C shares for the first year only. The "without sales charge" returns do not include the effect of sales charges. If they had, returns would be lower.
Prior to August 22, 2005, new purchases of Class A shares had a maximum initial sales charge of 4.75%.
Performance results reflect any fee waivers or reimbursements of fund expenses by the Investment Manager and/or any of its affiliates. Absent these fee waivers or expense reimbursement arrangements, performance results would have been lower.
All results shown assume reinvestment of distributions. Class Z shares are sold at net asset value with no distribution and service (Rule 12b-1) fees. Class Z shares have limited eligibility and the investment minimum requirements may vary. Please see the fund's prospectuses for details. Performance for different share classes will vary based on differences in sales charges and fees associated with each class.
The tables do not reflect the deduction of taxes that a shareholder may pay on fund distributions or on the redemption of fund shares.
Class A, Class B, Class C, Class T and Class Z share performance information includes returns of Retail A shares (for Class A and Class T shares), Retail B shares (for Class B and Class C shares) and Trust shares (for Class Z shares) of Galaxy Massachusetts Intermediate Municipal Bond Fund, the predecessor to the Fund and a series of The Galaxy Fund (the "Galaxy Massachusetts Fund"), for periods prior to December 9, 2002, the date on which Class A, Class B, Class C, Class T and Class Z shares were initially offered by the Fund. The returns shown for all share classes reflect any differences in sales charges, but no returns have been restated to reflect any differences in expenses such as distribution and service (Rule 12b-1) fees between any predecessor share class and the corresponding newer share class. If differences in expenses had been reflected, the returns shown for periods prior to December 9, 2002 would be lower for Class A, Class B, Class C and Class T shares.
2
Understanding Your Expenses – Columbia Massachusetts Intermediate Municipal Bond Fund
As a shareholder, you incur two types of costs. There are transaction costs, which generally include sales charges on purchases and may include redemption fees. There are also ongoing costs, which generally include management fees, distribution and service (Rule 12b-1) fees, and other fund expenses. The following information is intended to help you understand your ongoing costs (in dollars) of investing in the Fund and to compare these costs with the ongoing costs of investing in other mutual funds.
Analyzing your fund's expenses
To illustrate these ongoing costs, we provided examples and calculated the expenses paid by investors in each share class of the Fund during the period. The information in the table is based on an initial investment of $1,000 at the beginning of the period indicated and held for the entire period. Expense information is calculated two ways and each method provides you with different information. The amount listed in the "Actual" column is calculated using the Fund's actual operating expenses and total return for the period. You may use the Actual information, together with the amount invested, to estimate the expenses that you paid over the period. Simply divide your account value by $1,000 (for example, an $8,600 account value divided by $1,000 = 8.6), then multiply the results by the expenses paid during the period under the Actual column. The amount listed in the "Hypothetical" column assumes a 5% annual rate of return before expenses (which is not the Fund's actual return) and then applies the Fund's actual expense ratio for the period to the hypothetical return. You should not use the hypothetical account values and expenses to estimate either your actual account balance at the end of the period or the expenses you paid during the period. See the "Compare with other funds" information with details on using the hypothetical data.
Compare with other funds
Since all mutual funds are required to include the same hypothetical calculations about expenses in shareholder reports, you can use this information to compare the ongoing cost of investing in the Fund with other funds. To do so, compare the hypothetical example with the 5% hypothetical examples that appear in the shareholder reports of other funds. As you compare hypothetical examples of other funds, it is important to note that hypothetical examples are meant to highlight the ongoing costs of investing in a fund only and do not reflect any transaction costs, such as sales charges, or redemption or exchange fees. Therefore, the hypothetical calculations are useful in comparing ongoing costs only, and will not help you determine the relative total costs of owning different funds. If transaction costs were included in these calculations, your costs would have been higher.
05/01/11 – 10/31/11
| | | Account value at the
beginning of the period ($) | | Account value at the
end of the period ($) | | Expenses paid
during the period ($) | | Fund's annualized
expense ratio (%) | |
| | | Actual | | Hypothetical | | Actual | | Hypothetical | | Actual | | Hypothetical | | Actual | |
| Class A | | | 1,000.00 | | | | 1,000.00 | | | | 1,036.40 | | | | 1,021.42 | | | | 3.85 | | | | 3.82 | | | | 0.75 | | |
| Class B | | | 1,000.00 | | | | 1,000.00 | | | | 1,032.60 | | | | 1,017.59 | | | | 7.74 | | | | 7.68 | | | | 1.51 | | |
| Class C | | | 1,000.00 | | | | 1,000.00 | | | | 1,034.40 | | | | 1,019.41 | | | | 5.90 | | | | 5.85 | | | | 1.15 | | |
| Class T | | | 1,000.00 | | | | 1,000.00 | | | | 1,036.90 | | | | 1,021.93 | | | | 3.34 | | | | 3.31 | | | | 0.65 | | |
| Class Z | | | 1,000.00 | | | | 1,000.00 | | | | 1,037.70 | | | | 1,022.68 | | | | 2.57 | | | | 2.55 | | | | 0.50 | | |
Expenses paid during the period are equal to the annualized expense ratio for the share class, multiplied by the average account value over the period, then multiplied by the number of days in the fund's most recent fiscal half-year and divided by 365.
Expenses do not include fees and expenses incurred indirectly by the Fund from the underlying funds in which the Fund may invest (also referred to as "acquired funds"), including affiliated and non-affiliated pooled investments vehicles (including mutual funds and exchanged traded funds).
Had Columbia Management Investment Advisers, LLC and/or any of its affiliates not waived fees or reimbursed a portion of expenses, account value at the end of the period would have been reduced.
3
Portfolio Manager's Report – Columbia Massachusetts Intermediate Municipal Bond Fund
Performance data quoted represents past performance and current performance may be lower or higher. Past performance is no guarantee of future results. The investment return and principal value will fluctuate so that shares, when redeemed, may be worth more or less than the original cost. Please visit www.columbiamanagement.com for daily and most recent month-end performance updates.
Net asset value per share
as of 10/31/11 ($)
| Class A | | | 10.95 | | |
| Class B | | | 10.95 | | |
| Class C | | | 10.95 | | |
| Class T | | | 10.95 | | |
| Class Z | | | 10.95 | | |
Distributions declared per share
11/01/10 – 10/31/11 ($)
| Class A | | | 0.34 | | |
| Class B | | | 0.26 | | |
| Class C | | | 0.30 | | |
| Class T | | | 0.35 | | |
| Class Z | | | 0.37 | | |
A portion of the fund's income may be subject to the alternative minimum tax. The fund may at times purchase tax-exempt securities at a discount. Some, or all, of this discount may be included in the fund's ordinary income, and is taxable when distributed. Distributions include less than $0.01 per share of taxable realized gains.
30-day SEC yields
as of 10/31/11 (%)
| Class A | | | 1.62 | | |
| Class B | | | 0.93 | | |
| Class C | | | 1.26 | | |
| Class T | | | 1.68 | | |
| Class Z | | | 1.91 | | |
The 30-day SEC yields reflect the fund's earning power, net of expenses, expressed as an annualized percentage of the public offering price per share at the end of the period. Had the Investment Manager and/or any of its affiliates not waived fees or reimbursed a portion of expenses, the 30-day SEC yields would have been lower.
For the 12-month period that ended October 31, 2011, the fund's Class A shares returned 3.24% without sales charge. By comparison, the fund's benchmark, the Barclays Capital 3-15 Year Blend Municipal Bond Index, which is national in scope, returned 3.89%. The fund's return exceeded the 2.75% average return of funds in its peer group, the Lipper Other States Intermediate Municipal Debt Funds Classification. During a period in which longer-maturity municipals outperformed as interest rates declined, the fund's overweight position in shorter-maturity securities held back results, as did the emphasis on higher quality securities, which lagged lower-rated issues. The fund's overweighted exposure to hospital and education bonds aided performance, as both sectors outperformed.
Massachusetts recovered faster than overall economy
Boosted by solid gains in the Commonwealth's education and health care industries and steady growth in business investment, the Massachusetts economy staged a stronger recovery than the nation as a whole over the fiscal year. The unemployment rate continued to decline as employment gains in Massachusetts exceeded the nation's, with the private service industries recording the most improvement. Housing prices also appeared to recover since in 2011, with home sales picking up. Mortgage delinquency rates have fallen below the national average.
Education, hospital bonds supported results; short duration hurt
The fund maintained overweighted positions in education and hospital bonds during the fiscal year. These positions helped support performance. However, the slightly higher quality composition of the Massachusetts portfolio compared to that of the national benchmark Barclays Capital index tended to detract from the fund's relative return in a period in which lower-quality debt generally outperformed. The main factor holding back relative results, however, was the over-weight position in shorter-maturity securities, including shorter-maturity general obligation bonds. Similarly, the fund's large cash position at the beginning of the fiscal year was a drag on performance. We carried this cash balance in response to negative market news and concerns about municipal finances early in the period. In a market in which lower-rated securities continued to outperform higher-grade names, we found it difficult at times to find lower-rated Massachusetts municipal securities selling at reasonable prices. However, we did add a BBB rated3 charter school bond to the portfolio and increased exposure to electric utility bonds in the 13-to-15 year maturity range.
Outlook and positioning
Going forward, we plan to look for opportunities to add A rated securities with maturities of seven years or longer, while decreasing exposure to securities with very short calls and maturities. The fund's portfolio of investments remains at a higher-rated average quality than the national benchmark, which we think will present an advantage as higher-quality portfolios tend to perform well in volatile markets. While economic growth in Massachusetts has outpaced the national average during the past year, the
3Ratings are relative and subjective and are not absolute standards of quality. The credit ratings typically range from AAA (highest) to D (lowest), and are subject to change. The credit quality of the fund's investments does not remove market risk.
4
Portfolio Manager's Report (continued) – Columbia Massachusetts Intermediate Municipal Bond Fund
Commonwealth's economy does face headwinds because of the effects of slower national growth, weaker exports of technology products and government spending cuts. Longer term, the Massachusetts economy should benefit from its research universities and a highly skilled workforce, but weak population growth and high business costs may pose challenges. Investor demand for tax-advantaged municipal bonds appears to have recovered throughout the nation after the sector slumped early in 2011 amid investor fears about the credit quality of municipals. Both the Commonwealth and its local governments in general have taken steps to pay debt service, balance budgets and make fiscally prudent decisions going forward.
Portfolio characteristics and holdings are subject to change periodically and may not be representative of current characteristics and holdings. The outlook for this fund may differ from that presented for other Columbia Funds.
Tax-exempt investing offers current tax-exempt income, but it also involves certain risks. The value of the fund will be affected by interest rate changes and the creditworthiness of issues held in the fund. When interest rates go up, bond prices generally drop and vice versa. Interest income from certain tax-exempt bonds may be subject to certain state and local taxes and, if applicable, the alternative minimum tax. Any capital gains distributed are taxable to the investor.
The fund is non-diversified, which generally means that it may invest a greater percentage of its total assets in the securities of fewer issuers than a "diversified" fund. This increases the risk that a change in the value of any one investment held by the fund could affect the overall value of the fund more than it would affect that of a diversified fund holding a greater number of investments. Accordingly, the fund's value will likely be more volatile than the value of more diversified funds.
Single-state municipal bond funds pose additional risks due to limited geographical diversification.
Taxable-equivalent SEC yields
as of 10/31/11 (%)
| Class A | | | 2.49 | | |
| Class B | | | 1.43 | | |
| Class C | | | 1.94 | | |
| Class T | | | 2.58 | | |
| Class Z | | | 2.94 | | |
Taxable-equivalent SEC yields are calculated assuming a federal income tax rate of 35.0%. This tax rate does not reflect the phase out of exemptions or the reduction of otherwise allowable deductions that occur when adjusted gross income exceeds certain levels. Your taxable-equivalent yield may be different depending on your tax bracket.
Quality breakdown
as of 10/31/11 (%)
| AAA | | | 16.7 | | |
| AA | | | 57.5 | | |
| A | | | 19.1 | | |
| BBB | | | 5.0 | | |
| Non-Rated | | | 1.7 | | |
Maturity breakdown
as of 10/31/11 (%)
| 0-1 year | | | 5.3 | | |
| 1-3 years | | | 13.5 | | |
| 3-5 years | | | 9.4 | | |
| 5-7 years | | | 17.6 | | |
| 7-10 years | | | 17.8 | | |
| 10-15 years | | | 28.5 | | |
| 15-20 years | | | 3.6 | | |
| 20-25 years | | | 0.7 | | |
| Cash Equivalents | | | 3.6 | | |
Ratings shown in the quality breakdown are assigned to individual bonds by taking the lower of the ratings available from one of the following nationally recognized rating agencies: Standard & Poor's or Moody's Investor Services. If a security is rated by only one of the two agencies, that rating is used. If a security is not rated by either of the two agencies, it is designated as Non-Rated. Ratings are relative and subjective and are not absolute standards of quality. The fund's credit quality does not remove market risk.
The fund is actively managed and the composition of its portfolio will change over time. Information provided is calculated as a percentage of net assets.
5
Portfolio of Investments – Columbia Massachusetts Intermediate Municipal Bond Fund
October 31, 2011
(Percentages represent value of investments compared to net assets)
Issue
Description | | Coupon
Rate | | Principal
Amount | | Value | |
| Municipal Bonds 95.6% | |
| Advanced Refunded 8.5% | |
City of Boston
Prerefunded 05/01/12 Special Obligation Revenue Bonds
Series 2002A (AMBAC) | |
| 05/01/19 | | | 5.000 | % | | $ | 1,500,000 | | | $ | 1,535,580 | | |
City of Lowell
Prerefunded 02/01/12 Limited General Obligation Bonds
State Qualified
Series 2002 (AMBAC) | |
| 02/01/13 | | | 5.000 | % | | | 1,215,000 | | | | 1,241,682 | | |
City of Springfield
Prerefunded 01/15/13 Limited General Obligation Bonds
State Qualified
Series 2003 (NPFGC) | |
| 01/15/15 | | | 5.250 | % | | | 1,500,000 | | | | 1,587,900 | | |
Commonwealth of Massachusetts
Prerefunded 01/01/13 Limited General Obligation Bonds
Consolidated Loan
Series 2002E (AGM) | |
| 01/01/18 | | | 5.250 | % | | | 4,000,000 | | | | 4,217,800 | | |
Prerefunded 06/01/12 Revenue Bonds
Consolidated Loan
Series 2002A (FGIC) | |
| 06/01/19 | | | 5.375 | % | | | 1,125,000 | | | | 1,157,816 | | |
Prerefunded 08/01/14 Limited General Obligation Bonds
Consolidated Loan
Series 2004B (AMBAC) | |
| 08/01/22 | | | 5.000 | % | | | 2,000,000 | | | | 2,222,960 | | |
Prerefunded 12/01/11 Limited General Obligation Bonds
Consolidated Loan
Series 2001C (FHLMC/FNMA) | |
| 12/01/18 | | | 5.375 | % | | | 3,000,000 | | | | 3,012,630 | | |
Commonwealth of Massachusetts(a)
Revenue Bonds
Capital Appreciation-Federal Highway
Series 1998A Escrowed to Maturity | |
| 06/15/15 | | | 0.000 | % | | | 4,000,000 | | | | 3,825,800 | | |
Massachusetts Department of Transportation
Revenue Bonds
Series 1993A Escrowed to Maturity | |
| 01/01/13 | | | 5.000 | % | | | 110,000 | | | | 113,182 | | |
Massachusetts Development Finance Agency
Prerefunded 07/01/13 Revenue Bonds
Pharmacy & Allied Health Sciences
Series 2003 | |
| 07/01/23 | | | 6.375 | % | | | 1,000,000 | | | | 1,107,480 | | |
Prerefunded 09/01/13 Revenue Bonds
Milton Academy
Series 2003A | |
| 09/01/19 | | | 5.000 | % | | | 500,000 | | | | 540,585 | | |
Prerefunded 12/01/12 Revenue Bonds
Western New England College
Series 2002 | |
| 12/01/22 | | | 5.875 | % | | | 540,000 | | | | 572,011 | | |
Issue
Description | | Coupon
Rate | | Principal
Amount | | Value | |
| Municipal Bonds (continued) | |
| Advanced Refunded (cont.) | |
Massachusetts Health & Educational Facilities Authority
Prerefunded 10/01/12 Revenue Bonds
University of Massachusetts Project
Series 2002C (NPFGC) | |
| 10/01/13 | | | 5.250 | % | | $ | 1,475,000 | | | $ | 1,541,921 | | |
Prerefunded 10/01/13 Revenue Bonds
Simmons College
Series 2003F (FGIC) | |
| 10/01/15 | | | 5.000 | % | | | 1,015,000 | | | | 1,099,570 | | |
| 10/01/17 | | | 5.000 | % | | | 510,000 | | | | 552,493 | | |
Massachusetts Port Authority
Revenue Bonds
Series 1973 Escrowed to Maturity | |
| 07/01/12 | | | 5.625 | % | | | 230,000 | | | | 238,197 | | |
Massachusetts State College Building Authority
Revenue Bonds
Capital Appreciation
Senior Series 1999A Escrowed to Maturity (NPFGC)(a) | |
| 05/01/28 | | | 0.000 | % | | | 4,000,000 | | | | 2,152,840 | | |
Massachusetts State Water Pollution Abatement
Revenue Bonds
Series 1993A Escrowed to Maturity | |
| 02/01/13 | | | 5.450 | % | | | 250,000 | | | | 256,935 | | |
Puerto Rico Highway & Transportation Authority
Prerefunded Revenue Bonds
Series 2005BB (AGM) Escrowed to Maturity(b) | |
| 07/01/22 | | | 5.250 | % | | | 1,075,000 | | | | 1,336,580 | | |
University of Massachusetts Building Authority
Prerefunded 11/01/13 Revenue Bonds
Senior Series 2003-1 (AMBAC) | |
| 11/01/15 | | | 5.250 | % | | | 2,000,000 | | | | 2,188,940 | | |
| Total | | | 30,502,902 | | |
| Airport 2.5% | |
Massachusetts Port Authority
Refunding Revenue Bonds
Passenger Facility Charge
Series 2007D (AGM) | |
| 07/01/17 | | | 5.000 | % | | | 3,000,000 | | | | 3,443,430 | | |
Revenue Bonds
Series 2005C (AMBAC) | |
| 07/01/15 | | | 5.000 | % | | | 1,500,000 | | | | 1,703,850 | | |
| 07/01/22 | | | 5.000 | % | | | 3,500,000 | | | | 3,858,260 | | |
| Total | | | 9,005,540 | | |
| College 17.6% | |
Massachusetts Development Finance Agency
Revenue Bonds
Boston College
Series 2007P | |
| 07/01/20 | | | 5.000 | % | | | 3,260,000 | | | | 3,697,231 | | |
Boston University
Series 2009V-2 | |
| 10/01/14 | | | 2.875 | % | | | 3,000,000 | | | | 3,115,950 | | |
Brandeis University
Series 2010O-2 | |
| 10/01/24 | | | 5.000 | % | | | 5,000,000 | | | | 5,416,350 | | |
The Accompanying Notes to Financial Statements are an integral part of this statement.
6
Columbia Massachusetts Intermediate Municipal Bond Fund
October 31, 2011
(Percentages represent value of investments compared to net assets)
Issue
Description | | Coupon
Rate | | Principal
Amount | | Value | |
| Municipal Bonds (continued) | |
| College (cont.) | |
Clark University Issue
Series 1998 | |
| 07/01/16 | | | 5.250 | % | | $ | 1,445,000 | | | $ | 1,448,454 | | |
Emerson College
Series 2006A | |
| 01/01/21 | | | 5.000 | % | | | 2,500,000 | | | | 2,645,425 | | |
| 01/01/23 | | | 5.000 | % | | | 1,000,000 | | | | 1,042,890 | | |
Hampshire College
Series 2004 | |
| 10/01/14 | | | 5.150 | % | | | 130,000 | | | | 134,004 | | |
Mount Holyoke College
Series 2008 | |
| 07/01/23 | | | 5.000 | % | | | 1,285,000 | | | | 1,448,709 | | |
Noble & Greenough School
Series 2011 | |
| 04/01/21 | | | 4.000 | % | | | 1,500,000 | | | | 1,643,895 | | |
Wheelock College
Series 2007C | |
| 10/01/17 | | | 5.000 | % | | | 1,160,000 | | | | 1,231,212 | | |
Worcester Polytechnic Institute
Series 2007 (NPFGC) | |
| 09/01/22 | | | 5.000 | % | | | 1,710,000 | | | | 1,855,470 | | |
Massachusetts Health & Educational Facilities Authority
Revenue Bonds
Berklee College of Music
Series 2007A | |
| 10/01/32 | | | 5.000 | % | | | 2,440,000 | | | | 2,477,332 | | |
Boston College
Series 2003N | |
| 06/01/15 | | | 5.250 | % | | | 1,000,000 | | | | 1,061,160 | | |
| Series 2008M-1 | |
| 06/01/24 | | | 5.500 | % | | | 3,000,000 | | | | 3,681,330 | | |
Massachusetts Institute of Technology
Series 2002K | |
| 07/01/12 | | | 5.250 | % | | | 1,000,000 | | | | 1,033,420 | | |
| 07/01/17 | | | 5.375 | % | | | 2,275,000 | | | | 2,760,417 | | |
| 07/01/22 | | | 5.500 | % | | | 1,000,000 | | | | 1,286,910 | | |
| Series 2004M | |
| 07/01/19 | | | 5.250 | % | | | 610,000 | | | | 753,173 | | |
Northeastern University
Series 1998G (NPFGC) | |
| 10/01/12 | | | 5.500 | % | | | 1,110,000 | | | | 1,155,976 | | |
| Series 2008T-3 | |
| 10/01/37 | | | 2.700 | % | | | 2,500,000 | | | | 2,591,625 | | |
| Series 2010A | |
| 10/01/13 | | | 5.000 | % | | | 1,040,000 | | | | 1,116,502 | | |
Simmons College
Series 2009I | |
| 10/01/18 | | | 6.750 | % | | | 1,365,000 | | | | 1,665,573 | | |
Suffolk University
Series 2009A | |
| 07/01/24 | | | 6.000 | % | | | 2,100,000 | | | | 2,268,273 | | |
Tufts University
Series 2002J | |
| 08/15/16 | | | 5.500 | % | | | 1,500,000 | | | | 1,775,460 | | |
| Series 2008 | |
| 08/15/14 | | | 5.000 | % | | | 1,250,000 | | | | 1,394,425 | | |
| 08/15/17 | | | 5.000 | % | | | 1,145,000 | | | | 1,351,340 | | |
Issue
Description | | Coupon
Rate | | Principal
Amount | | Value | |
| Municipal Bonds (continued) | |
| College (cont.) | |
Wellesley College
Series 2003 | |
| 07/01/15 | | | 5.000 | % | | $ | 610,000 | | | $ | 653,170 | | |
Williams College
Series 2003H | |
| 07/01/16 | | | 5.000 | % | | | 1,740,000 | | | | 1,862,531 | | |
Massachusetts Industrial Finance Agency
Revenue Bonds
Tufts University
Series 1998H (NPFGC) | |
| 02/15/13 | | | 5.500 | % | | | 1,830,000 | | | | 1,947,834 | | |
Massachusetts State College Building Authority
Prerefunded 05/01/14 Revenue Bonds
Series 2004A (NPFGC) | |
| 05/01/16 | | | 5.000 | % | | | 530,000 | | | | 585,406 | | |
University of Massachusetts Building Authority
Refunding Revenue Bonds
Series 2004-04-1 (AMBAC) | |
| 11/01/12 | | | 5.250 | % | | | 650,000 | | | | 678,860 | | |
Revenue Bonds
Senior Series 2008-2 (AGM) | |
| 05/01/21 | | | 5.000 | % | | | 1,510,000 | | | | 1,713,850 | | |
| Senior Series 2009-1 | |
| 05/01/23 | | | 5.000 | % | | | 5,000,000 | | | | 5,662,500 | | |
| Total | | | 63,156,657 | | |
| Electric 5.2% | |
Berkshire Wind Power Cooperative Corp.
Revenue Bonds
Series 2010-1 | |
| 07/01/24 | | | 5.250 | % | | | 3,785,000 | | | | 4,088,367 | | |
| 07/01/25 | | | 5.000 | % | | | 2,000,000 | | | | 2,110,960 | | |
Massachusetts Development Finance Agency
Refunding Revenue Bonds
Dominion Energy Brayton 1
Series 2009 | |
| 12/01/42 | | | 5.750 | % | | | 3,460,000 | | | | 3,914,575 | | |
Massachusetts Municipal Wholesale Electric Co.
Revenue Bonds
Project No. 6
Series 2011 | |
| 07/01/19 | | | 5.000 | % | | | 2,760,000 | | | | 3,104,255 | | |
Puerto Rico Electric Power Authority(b)
Refunding Revenue Bonds
Series 2010ZZ | |
| 07/01/24 | | | 5.250 | % | | | 1,615,000 | | | | 1,711,141 | | |
Revenue Bonds
Series 1997BB (NPFGC) | |
| 07/01/12 | | | 6.000 | % | | | 1,000,000 | | | | 1,033,020 | | |
| Series 2002LL (NPFGC) | |
| 07/01/17 | | | 5.500 | % | | | 2,400,000 | | | | 2,682,048 | | |
| Total | | | 18,644,366 | | |
| Health Care - Hospital 8.0% | |
Massachusetts Development Finance Agency
Revenue Bonds
UMASS Memorial Issue
Series 2011H | |
| 07/01/26 | | | 5.125 | % | | | 2,000,000 | | | | 2,002,120 | | |
The Accompanying Notes to Financial Statements are an integral part of this statement.
7
Columbia Massachusetts Intermediate Municipal Bond Fund
October 31, 2011
(Percentages represent value of investments compared to net assets)
Issue
Description | | Coupon
Rate | | Principal
Amount | | Value | |
| Municipal Bonds (continued) | |
| Health Care - Hospital (cont.) | |
Massachusetts Health & Educational Facilities Authority
Revenue Bonds
Baystate Medical Center
Series 2002F | |
| 07/01/13 | | | 5.750 | % | | $ | 890,000 | | | $ | 911,841 | | |
Boston Medical Center
Series 1998A (NPFGC) | |
| 07/01/15 | | | 5.250 | % | | | 2,500,000 | | | | 2,503,150 | | |
Caregroup
Series 1998B-2 (NPFGC) | |
| 02/01/27 | | | 5.375 | % | | | 1,585,000 | | | | 1,624,958 | | |
| Series 2004D (NPFGC) | |
| 07/01/22 | | | 5.250 | % | | | 1,000,000 | | | | 1,082,800 | | |
| Series 2008E-2 | |
| 07/01/19 | | | 5.375 | % | | | 4,675,000 | | | | 5,214,027 | | |
Milford Regional Medical
Series 2007E | |
| 07/15/17 | | | 5.000 | % | | | 1,050,000 | | | | 1,087,790 | | |
| 07/15/22 | | | 5.000 | % | | | 1,500,000 | | | | 1,489,830 | | |
Partners Healthcare
Series 2003E | |
| 07/01/15 | | | 5.000 | % | | | 1,140,000 | | | | 1,207,545 | | |
| Series 2010J-2 | |
| 07/01/22 | | | 5.000 | % | | | 5,000,000 | | | | 5,502,050 | | |
Partners Healthcare System
Series 2005F | |
| 07/01/17 | | | 5.000 | % | | | 2,000,000 | | | | 2,203,220 | | |
| Series 2007G | |
| 07/01/18 | | | 5.000 | % | | | 2,575,000 | | | | 2,902,205 | | |
UMASS Memorial Issue
Series 1998A (AMBAC) | |
| 07/01/14 | | | 5.250 | % | | | 975,000 | | | | 977,077 | | |
Unrefunded Revenue Bonds
Partners Healthcare
Series 2001 | |
| 07/01/21 | | | 5.750 | % | | | 30,000 | | | | 30,400 | | |
| Total | | | 28,739,013 | | |
| Health Care - Life Care Center 0.9% | |
Massachusetts Development Finance Agency
Refunding Revenue Bonds
1st Mortgage VOA Concord
Series 2007 | |
| 11/01/17 | | | 5.000 | % | | | 635,000 | | | | 595,484 | | |
| 11/01/27 | | | 5.125 | % | | | 1,500,000 | | | | 1,198,605 | | |
Revenue Bonds
1st Mortgage-Orchard Cove
Series 2007 | |
| 10/01/17 | | | 5.000 | % | | | 1,210,000 | | | | 1,141,212 | | |
| 10/01/18 | | | 5.000 | % | | | 515,000 | | | | 477,626 | | |
| Total | | | 3,412,927 | | |
| Health Care - Other 0.4% | |
Massachusetts Development Finance Agency
Revenue Bonds
Evergreen Center, Inc.
Series 2005 | |
| 01/01/20 | | | 5.500 | % | | | 1,355,000 | | | | 1,364,661 | | |
Issue
Description | | Coupon
Rate | | Principal
Amount | | Value | |
| Municipal Bonds (continued) | |
| Housing - Single Family 0.6% | |
Massachusetts Housing Finance Agency
Revenue Bonds
Single Family
Series 2009-143 | |
| 12/01/24 | | | 5.000 | % | | $ | 2,000,000 | | | $ | 2,100,280 | | |
| Lease 2.5% | |
City of Boston
Refunding Revenue Bonds
Boston City Hospital
Series 2002 | |
| 08/01/14 | | | 5.000 | % | | | 5,000,000 | | | | 5,145,650 | | |
Massachusetts Development Finance Agency
Revenue Bonds
Visual & Performing Arts Project
Series 2000 | |
| 08/01/13 | | | 5.750 | % | | | 1,030,000 | | | | 1,111,349 | | |
| 08/01/17 | | | 6.000 | % | | | 540,000 | | | | 641,380 | | |
| 08/01/21 | | | 6.000 | % | | | 1,750,000 | | | | 2,086,262 | | |
| Total | | | 8,984,641 | | |
| Miscellaneous 6.3% | |
Boston Housing Authority
Revenue Bonds
Series 2008 (AGM) | |
| 04/01/20 | | | 5.000 | % | | | 2,135,000 | | | | 2,327,171 | | |
| 04/01/23 | | | 5.000 | % | | | 1,865,000 | | | | 1,983,129 | | |
Massachusetts Development Finance Agency
Revenue Bonds
Jewish Philanthropies
Series 2002A | |
| 02/01/22 | | | 5.250 | % | | | 970,000 | | | | 989,924 | | |
Massachusetts State Water Pollution Abatement
Refunding Revenue Bonds
Pool Program
Series 2004A | |
| 08/01/15 | | | 5.250 | % | | | 3,000,000 | | | | 3,470,250 | | |
| Series 2006 | |
| 08/01/20 | | | 5.250 | % | | | 3,000,000 | | | | 3,695,040 | | |
Revenue Bonds
Pool Program
Series 2005-11 | |
| 08/01/19 | | | 5.250 | % | | | 4,465,000 | | | | 5,490,343 | | |
Unrefunded Revenue Bonds
Pool Program
Series 1999-5 | |
| 08/01/16 | | | 5.750 | % | | | 95,000 | | | | 95,413 | | |
Metropolitan Boston Transit Parking Corp.
Revenue Bonds
Series 2011 | |
| 07/01/25 | | | 5.000 | % | | | 3,210,000 | | | | 3,549,137 | | |
Woods Hole Marthas Vineyard & Nantucket Steamship Authority
Revenue Bonds
Series 2004B | |
| 03/01/18 | | | 5.000 | % | | | 975,000 | | | | 1,083,576 | | |
| Total | | | 22,683,983 | | |
The Accompanying Notes to Financial Statements are an integral part of this statement.
8
Columbia Massachusetts Intermediate Municipal Bond Fund
October 31, 2011
(Percentages represent value of investments compared to net assets)
Issue
Description | | Coupon
Rate | | Principal
Amount | | Value | |
| Municipal Bonds (continued) | |
| Sales or Use Tax 9.1% | |
Commonwealth of Massachusetts
Revenue Bonds
Consolidated Loan
Series 1997A | |
| 06/01/13 | | | 5.500 | % | | $ | 1,000,000 | | | $ | 1,074,250 | | |
| Series 2004 (NPFGC/FGIC) | |
| 01/01/19 | | | 5.250 | % | | | 750,000 | | | | 862,238 | | |
Massachusetts Bay Transportation Authority
Revenue Bonds
Senior Series 2003A | |
| 07/01/17 | | | 5.250 | % | | | 1,000,000 | | | | 1,195,460 | | |
| 07/01/19 | | | 5.250 | % | | | 625,000 | | | | 757,075 | | |
| Senior Series 2004C | |
| 07/01/18 | | | 5.250 | % | | | 1,000,000 | | | | 1,206,720 | | |
| Senior Series 2005B (NPFGC) | |
| 07/01/23 | | | 5.500 | % | | | 2,890,000 | | | | 3,630,736 | | |
| Senior Series 2006A | |
| 07/01/22 | | | 5.250 | % | | | 3,500,000 | | | | 4,285,855 | | |
| Senior Series 2008B | |
| 07/01/23 | | | 5.000 | % | | | 910,000 | | | | 1,098,470 | | |
Massachusetts School Building Authority
Revenue Bonds
Series 2005A (AGM) | |
| 08/15/26 | | | 5.000 | % | | | 5,000,000 | | | | 5,419,750 | | |
| Series 2007A (AMBAC) | |
| 08/15/18 | | | 5.000 | % | | | 5,000,000 | | | | 5,842,150 | | |
Massachusetts School Building Authority(c)
Senior Revenue Bonds
Series 2011B
11/03/2011 | |
| 10/15/27 | | | 5.000 | % | | | 4,000,000 | | | | 4,529,400 | | |
Virgin Islands Public Finance Authority
Revenue Bonds
Senior Lien-Matching Fund Loan Note
Series 2010A(b) | |
| 10/01/25 | | | 5.000 | % | | | 2,755,000 | | | | 2,794,479 | | |
| Total | | | 32,696,583 | | |
| School 0.9% | |
Massachusetts Development Finance Agency
Revenue Bonds
Foxborough Regional Charter School
Series 2010A | |
| 07/01/30 | | | 6.375 | % | | | 3,150,000 | | | | 3,298,995 | | |
| Special Purpose Certificates - General Obligations 6.8% | |
Boston Metropolitan District
Unlimited General Obligation Refunding Bonds
Series 2002A | |
| 12/01/14 | | | 5.250 | % | | | 2,010,000 | | | | 2,112,852 | | |
City of Boston
Unlimited General Obligation Refunding Bonds
Series 2002B (NPFGC/FGIC) | |
| 02/01/12 | | | 5.000 | % | | | 6,000,000 | | | | 6,071,760 | | |
| Series 2004A | |
| 01/01/14 | | | 5.000 | % | | | 1,000,000 | | | | 1,094,110 | | |
Issue
Description | | Coupon
Rate | | Principal
Amount | | Value | |
| Municipal Bonds (continued) | |
| Special Purpose Certificates - General Obligations (cont.) | |
City of Lawrence
Limited General Obligation Refunding Bonds
State Qualified
Series 2006 (AGM) | |
| 02/01/18 | | | 5.000 | % | | $ | 1,500,000 | | | $ | 1,738,170 | | |
City of Springfield
Limited General Obligation Bonds
State Qualified Municipal Purpose Loan
Series 2003 (AGM) | |
| 08/01/21 | | | 4.500 | % | | | 2,000,000 | | | | 2,149,480 | | |
City of Westfield
Limited General Obligation Refunding Bonds
Series 2003 (NPFGC) | |
| 09/01/18 | | | 5.000 | % | | | 500,000 | | | | 518,145 | | |
City of Worcester
Limited General Obligation Bonds
Series 2004A (NPFGC) | |
| 08/15/13 | | | 5.250 | % | | | 2,810,000 | | | | 3,024,768 | | |
Dudley Charlton Regional School District
Unlimited General Obligation Bonds
Series 1999A (NPFGC/FGIC) | |
| 06/15/14 | | | 5.125 | % | | | 2,305,000 | | | | 2,537,644 | | |
Pioneer Valley Regional School District
Unlimited General Obligation Bonds
Series 2002 (AMBAC) | |
| 06/15/12 | | | 5.000 | % | | | 1,000,000 | | | | 1,026,970 | | |
Puerto Rico Municipal Finance Agency
Unrefunded Revenue Bonds
Series 1997A (AGM)(b) | |
| 07/01/17 | | | 5.500 | % | | | 245,000 | | | | 245,666 | | |
Town of Hopedale
Limited General Obligation Refunding Bonds
Series 2004 (AMBAC) | |
| 11/15/17 | | | 5.000 | % | | | 1,000,000 | | | | 1,105,600 | | |
Town of Sandwich
Unlimited General Obligation Refunding Bonds
Series 2005 (NPFGC) | |
| 07/15/18 | | | 5.000 | % | | | 1,575,000 | | | | 1,786,066 | | |
Town of Westborough
Unlimited General Obligation Bonds
Series 2003 | |
| 11/15/16 | | | 5.000 | % | | | 1,000,000 | | | | 1,072,210 | | |
| Total | | | 24,483,441 | | |
| State 15.1% | |
Commonwealth of Massachusetts
Limited General Obligation Bonds
Consolidated Loan
Series 2002C | |
| 11/01/17 | | | 5.500 | % | | | 1,500,000 | | | | 1,821,735 | | |
| Series 2002D (AMBAC/TCRS/BNY) | |
| 08/01/18 | | | 5.500 | % | | | 3,500,000 | | | | 4,285,890 | | |
| Series 2008A | |
| 08/01/16 | | | 5.000 | % | | | 2,000,000 | | | | 2,332,020 | | |
Limited General Obligation Refunding Bonds
Series 2003D | |
| 10/01/17 | | | 5.500 | % | | | 5,000,000 | | | | 6,062,900 | | |
The Accompanying Notes to Financial Statements are an integral part of this statement.
9
Columbia Massachusetts Intermediate Municipal Bond Fund
October 31, 2011
(Percentages represent value of investments compared to net assets)
Issue
Description | | Coupon
Rate | | Principal
Amount | | Value | |
| Municipal Bonds (continued) | |
| State (cont.) | |
| Series 2003D (AMBAC) | |
| 10/01/19 | | | 5.500 | % | | $ | 5,000,000 | | | $ | 6,179,650 | | |
| Series 2003D (NPFGC) | |
| 10/01/20 | | | 5.500 | % | | | 2,500,000 | | | | 3,102,850 | | |
| Series 2004B | |
| 08/01/20 | | | 5.250 | % | | | 3,000,000 | | | | 3,657,840 | | |
| Series 2006B (AGM) | |
| 09/01/22 | | | 5.250 | % | | | 4,000,000 | | | | 4,929,960 | | |
Unlimited General Obligation Refunding Bonds
Series 2003D (AGM) | |
| 10/01/19 | | | 5.500 | % | | | 3,500,000 | | | | 4,325,755 | | |
| Series 2004C (AMBAC) | |
| 12/01/24 | | | 5.500 | % | | | 5,000,000 | | | | 6,289,800 | | |
| Series 2004C (NPFGC) | |
| 12/01/19 | | | 5.500 | % | | | 3,795,000 | | | | 4,699,311 | | |
| Series 2008A | |
| 09/01/15 | | | 5.000 | % | | | 3,000,000 | | | | 3,436,260 | | |
Commonwealth of Massachusetts(d)
Unlimited General Obligation Bonds
Series 2010A | |
| 02/01/14 | | | 0.670 | % | | | 3,000,000 | | | | 3,002,610 | | |
| Total | | | 54,126,581 | | |
| Student Loan 2.2% | |
Massachusetts Educational Financing Authority
Revenue Bonds
Issue I
Series 2010A | |
| 01/01/22 | | | 5.500 | % | | | 3,500,000 | | | | 3,865,050 | | |
| Series 2009I | |
| 01/01/18 | | | 5.125 | % | | | 3,650,000 | | | | 4,096,650 | | |
| Total | | | 7,961,700 | | |
| Toll Road 1.3% | |
Massachusetts State Department of Transportation
Revenue Bonds
Senior Series 2010B | |
| 01/01/22 | | | 5.000 | % | | | 2,180,000 | | | | 2,435,038 | | |
Puerto Rico Highway & Transportation Authority
Refunding Revenue Bonds
Series 2005BB (AGM)
10/04/2005(b) | |
| 07/01/22 | | | 5.250 | % | | | 1,925,000 | | | | 2,076,594 | | |
| Total | | | 4,511,632 | | |
Issue
Description | | Coupon
Rate | | Principal
Amount | | Value | |
| Municipal Bonds (continued) | |
| Water & Sewer 7.7% | |
Massachusetts State Water Pollution Abatement
Revenue Bonds
State Revolving Fund
Series 2009-14 | |
| 08/01/24 | | | 5.000 | % | | $ | 3,100,000 | | | $ | 3,622,133 | | |
Massachusetts Water Resources Authority
Refunding Revenue Bonds
General
Series 1998B Escrowed to Maturity (AGM/TCRS) | |
| 08/01/15 | | | 5.500 | % | | | 1,165,000 | | | | 1,330,500 | | |
| Series 2005A (NPFGC/TCRS) | |
| 08/01/17 | | | 5.250 | % | | | 6,000,000 | | | | 7,162,320 | | |
| Series 2007B (AGM/TCRS) | |
| 08/01/23 | | | 5.250 | % | | | 5,500,000 | | | | 6,674,360 | | |
Revenue Bonds
General
Series 2002J (AGM/TCRS) | |
| 08/01/14 | | | 5.250 | % | | | 2,870,000 | | | | 3,219,336 | | |
| 08/01/15 | | | 5.250 | % | | | 3,000,000 | | | | 3,460,650 | | |
| 08/01/18 | | | 5.250 | % | | | 1,000,000 | | | | 1,205,980 | | |
Puerto Rico Commonwealth Aqueduct & Sewer Authority
Revenue Bonds
Senior Lien
Series 2008A (AGM)(b) | |
| 07/01/16 | | | 5.000 | % | | | 1,000,000 | | | | 1,108,970 | | |
| Total | | | 27,784,249 | | |
Total Municipal Bonds
(Cost: $319,524,305) | | $ | 343,458,151 | | |
| | | | | Shares | | Value | |
| Money Market Funds 4.7% | |
Dreyfus Massachusetts Municipal
Money Market Fund, 0.000%(e) | | | | | 7,827,224 | | | $ | 7,827,224 | | |
JPMorgan Tax-Free Money
Market Fund, 0.010%(e) | | | | | 8,914,890 | | | | 8,914,890 | | |
Total Money Market Funds
(Cost: $16,742,114) | | $ | 16,742,114 | | |
Total Investments
(Cost: $336,266,419) | | | | | | | | | | $ | 360,200,265 | | |
| Other Assets & Liabilities, Net | | | | | | | (1,193,713 | ) | |
| Total Net Assets | | $ | 359,006,552 | | |
Notes to Portfolio of Investments
(a) Zero coupon bond.
(b) Municipal obligations include debt obligations issued by or on behalf of territories, possessions, or sovereign nations within the territorial boundaries of the United States. At October 31, 2011, the value of these securities amounted to $12,988,498 or 3.62% of net assets.
(c) Represents a security purchased on a when-issued or delayed delivery basis.
(d) Variable rate security. The interest rate shown reflects the rate as of October 31, 2011.
(e) The rate shown is the seven-day current annualized yield at October 31, 2011.
The Accompanying Notes to Financial Statements are an integral part of this statement.
10
Columbia Massachusetts Intermediate Municipal Bond Fund
October 31, 2011
Abbreviation Legend
AGM Assured Guaranty Municipal Corporation
AMBAC Ambac Assurance Corporation
BNY Bank of New York
FGIC Financial Guaranty Insurance Company
FHLMC Federal Home Loan Mortgage Corporation
FNMA Federal National Mortgage Association
NPFGC National Public Finance Guarantee Corporation
TCRS Transferable Custodial Receipts
Fair Value Measurements
Generally accepted accounting principles (GAAP) require disclosure regarding the inputs and valuation techniques used to measure fair value and any changes in valuation inputs or techniques. In addition, investments shall be disclosed by major category.
The Fund categorizes its fair value measurements according to a three-level hierarchy that maximizes the use of observable inputs and minimizes the use of unobservable inputs by prioritizing that the most observable input be used when available. Observable inputs are those that market participants would use in pricing an investment based on market data obtained from sources independent of the reporting entity. Unobservable inputs are those that reflect the Fund's assumptions about the information market participants would use in pricing an investment. An investment's level within the fair value hierarchy is based on the lowest level of any input that is deemed significant to the asset or liability's fair value measurement. The input levels are not necessarily an indication of the risk or liquidity associated with investments at that level. For example, certain U.S. government securities are generally high quality and liquid, however, they are reflected as Level 2 because the inputs used to determine fair value may not always be quoted prices in an active market.
Fair value inputs are summarized in the three broad levels listed below:
• Level 1 — Valuations based on quoted prices for investments in active markets that the Fund has the ability to access at the measurement date (including NAV for open-end mutual funds). Valuation adjustments are not applied to Level 1 investments.
• Level 2 — Valuations based on other significant observable inputs (including quoted prices for similar securities, interest rates, prepayment speeds, credit risks, etc.).
• Level 3 — Valuations based on significant unobservable inputs (including the Fund's own assumptions and judgment in determining the fair value of investments).
Inputs that are used in determining fair value of an investment may include price information, credit data, volatility statistics, and other factors. These inputs can be either observable or unobservable. The availability of observable inputs can vary between investments, and is affected by various factors such as the type of investment, and the volume and level of activity for that investment or similar investments in the marketplace. The inputs will be considered by the Investment Manager, along with any other relevant factors in the calculation of an investment's fair value. The Fund uses prices and inputs that are current as of the measurement date, which may include periods of market dislocations. During these periods, the availability of prices and inputs may be reduced for many investments. This condition could cause an investment to be reclassified between the various levels within the hierarchy.
Investments falling into the Level 3 category are primarily supported by quoted prices from brokers and dealers participating in the market for those investments. However, these may be classified as Level 3 investments due to lack of market transparency and corroboration to support these quoted prices. Additionally, valuation models may be used as the pricing source for any remaining investments classified as Level 3. These models rely on one or more significant unobservable inputs and/or significant assumptions by the Investment Manager. Inputs used in valuations may include, but are not limited to, financial statement analysis, capital account balances, discount rates and estimated cash flows, and comparable company data.
The Accompanying Notes to Financial Statements are an integral part of this statement.
11
Columbia Massachusetts Intermediate Municipal Bond Fund
October 31, 2011
Fair Value Measurements (continued)
The following table is a summary of the inputs used to value the Fund's investments as of October 31, 2011:
| | | Fair value at October 31, 2011 | |
| Description(a) | | Level 1
Quoted Prices
in Active
Markets for
Identical Assets | | Level 2
Other
Significant
Observable
Inputs(b) | | Level 3
Significant
Unobservable
Inputs | | Total | |
| Bonds | |
| Municipal Bonds | | $ | — | | | $ | 343,458,151 | | | $ | — | | | $ | 343,458,151 | | |
| Total Bonds | | | — | | | | 343,458,151 | | | | — | | | | 343,458,151 | | |
| Other | |
| Money Market Funds | | | 16,742,114 | | | | — | | | | — | | | | 16,742,114 | | |
| Total Other | | | 16,742,114 | | | | — | | | | — | | | | 16,742,114 | | |
| Total | | $ | 16,742,114 | | | $ | 343,458,151 | | | $ | — | | | $ | 360,200,265 | | |
The Fund's assets assigned to the Level 2 input category are generally valued using the market approach, in which a security's value is determined through reference to prices and information from market transactions for similar or identical assets.
(a) See the Portfolio of Investments for all investment classifications not indicated in the table.
(b) There were no significant transfers between Levels 1 and 2 during the period.
The Accompanying Notes to Financial Statements are an integral part of this statement.
12
Statement of Assets and Liabilities – Columbia Massachusetts Intermediate Municipal Bond Fund
October 31, 2011
| Assets | |
| Investments, at value | |
| (identified cost $336,266,419) | | $ | 360,200,265 | | |
| Receivable for: | |
| Investments sold | | | 92,250 | | |
| Capital shares sold | | | 274,525 | | |
| Interest | | | 4,286,278 | | |
| Expense reimbursement due from Investment Manager | | | 7,501 | | |
| Prepaid expense | | | 4,040 | | |
| Trustees' deferred compensation plan | | | 34,072 | | |
| Total assets | | | 364,898,931 | | |
| Liabilities | |
| Payable for: | |
| Investments purchased on a delayed delivery basis | | | 4,507,560 | | |
| Capital shares purchased | | | 239,987 | | |
| Dividend distributions to shareholders | | | 973,529 | | |
| Investment management fees | | | 11,775 | | |
| Distribution and service fees | | | 1,580 | | |
| Transfer agent fees | | | 52,769 | | |
| Administration fees | | | 2,016 | | |
| Chief compliance officer expenses | | | 309 | | |
| Other expenses | | | 68,782 | | |
| Trustees' deferred compensation plan | | | 34,072 | | |
| Total liabilities | | | 5,892,379 | | |
| Net assets applicable to outstanding capital stock | | $ | 359,006,552 | | |
The Accompanying Notes to Financial Statements are an integral part of this statement.
13
Statement of Assets and Liabilities (continued) – Columbia Massachusetts Intermediate Municipal Bond Fund
October 31, 2011
| Represented by | |
| Paid-in capital | | $ | 334,733,894 | | |
| Excess of distributions over net investment income | | | (15,910 | ) | |
| Accumulated net realized gain | | | 354,722 | | |
| Unrealized appreciation (depreciation) on: | |
| Investments | | | 23,933,846 | | |
| Total — representing net assets applicable to outstanding capital stock | | $ | 359,006,552 | | |
| Net assets applicable to outstanding shares | |
| Class A | | $ | 29,849,410 | | |
| Class B | | $ | 145,460 | | |
| Class C | | $ | 9,930,950 | | |
| Class T | | $ | 34,952,424 | | |
| Class Z | | $ | 284,128,308 | | |
| Shares outstanding | |
| Class A | | | 2,725,126 | | |
| Class B | | | 13,283 | | |
| Class C | | | 906,714 | | |
| Class T | | | 3,191,005 | | |
| Class Z | | | 25,939,749 | | |
| Net asset value per share | |
| Class A(a) | | $ | 10.95 | | |
| Class B | | $ | 10.95 | | |
| Class C | | $ | 10.95 | | |
| Class T(a) | | $ | 10.95 | | |
| Class Z | | $ | 10.95 | | |
(a) The maximum offering price per share for Class A is $11.32 and Class T is $11.50, respectively. The offering price is calculated by dividing the net asset value by 1.0 minus the maximum sales charge of 3.25% for Class A and by dividing the net asset value by 1.0 minus the maximum sales charge of 4.75% for Class T.
The Accompanying Notes to Financial Statements are an integral part of this statement.
14
Statement of Operations – Columbia Massachusetts Intermediate Municipal Bond Fund
Year ended October 31, 2011
| Net investment income | |
| Income: | |
| Dividends | | $ | 2,939 | | |
| Interest | | | 13,887,524 | | |
| Total income | | | 13,890,463 | | |
| Expenses: | |
| Investment management fees | | | 1,512,989 | | |
| Distribution fees | |
| Class B | | | 4,009 | | |
| Class C | | | 75,067 | | |
| Service fees | |
| Class A | | | 73,982 | | |
| Class B | | | 1,337 | | |
| Class C | | | 25,025 | | |
| Shareholder service fee — Class T | | | 55,566 | | |
| Transfer agent fees | |
| Class A | | | 47,297 | | |
| Class B | | | 978 | | |
| Class C | | | 16,388 | | |
| Class T | | | 60,702 | | |
| Class Z | | | 454,515 | | |
| Administration fees | | | 241,327 | | |
| Compensation of board members | | | 29,831 | | |
| Pricing and bookkeeping fees | | | 61,320 | | |
| Custodian fees | | | 14,832 | | |
| Printing and postage fees | | | 46,762 | | |
| Registration fees | | | 69,926 | | |
| Professional fees | | | 57,264 | | |
| Chief compliance officer expenses | | | 1,009 | | |
| Other | | | 16,341 | | |
| Total expenses | | | 2,866,467 | | |
| Fees waived or expenses reimbursed by Investment Manager and its affiliates | | | (799,425 | ) | |
| Fees waived by distributor — Class C | | | (35,026 | ) | |
| Expense reductions | | | (220 | ) | |
| Total net expenses | | | 2,031,796 | | |
| Net investment income | | | 11,858,667 | | |
| Realized and unrealized gain (loss) — net | |
| Net realized gain (loss) on: | |
| Investments | | | 368,477 | | |
| Net realized gain | | | 368,477 | | |
| Net change in unrealized appreciation (depreciation) on: | |
| Investments | | | (504,369 | ) | |
| Net change in unrealized depreciation | | | (504,369 | ) | |
| Net realized and unrealized loss | | | (135,892 | ) | |
| Net increase in net assets resulting from operations | | $ | 11,722,775 | | |
The Accompanying Notes to Financial Statements are an integral part of this statement.
15
Statement of Changes in Net Assets – Columbia Massachusetts Intermediate Municipal Bond Fund
| Year ended October 31, | | 2011 | | 2010 | |
| Operations | |
| Net investment income | | $ | 11,858,667 | | | $ | 12,099,511 | | |
| Net realized gain | | | 368,477 | | | | 674,382 | | |
| Net change in unrealized appreciation (depreciation) | | | (504,369 | ) | | | 10,658,291 | | |
| Net increase in net assets resulting from operations | | | 11,722,775 | | | | 23,432,184 | | |
| Distributions to shareholders from: | |
| Net investment income | |
| Class A | | | (936,724 | ) | | | (738,782 | ) | |
| Class B | | | (13,113 | ) | | | (26,514 | ) | |
| Class C | | | (276,773 | ) | | | (264,676 | ) | |
| Class T | | | (1,207,723 | ) | | | (1,295,640 | ) | |
| Class Z | | | (9,460,100 | ) | | | (9,763,840 | ) | |
| Net realized gains | |
| Class A | | | (8,919 | ) | | | — | | |
| Class B | | | (251 | ) | | | — | | |
| Class C | | | (2,946 | ) | | | — | | |
| Class T | | | (10,766 | ) | | | — | | |
| Class Z | | | (78,146 | ) | | | — | | |
| Total distributions to shareholders | | | (11,995,461 | ) | | | (12,089,452 | ) | |
| Increase (decrease) in net assets from share transactions | | | (8,674,656 | ) | | | 8,790,813 | | |
| Total increase (decrease) in net assets | | | (8,947,342 | ) | | | 20,133,545 | | |
| Net assets at beginning of year | | | 367,953,894 | | | | 347,820,349 | | |
| Net assets at end of year | | $ | 359,006,552 | | | $ | 367,953,894 | | |
| Undistributed (overdistributed) net investment income | | $ | (15,910 | ) | | $ | 40,058 | | |
The Accompanying Notes to Financial Statements are an integral part of this statement.
16
Statement of Changes in Net Assets (continued) – Columbia Massachusetts Intermediate Municipal Bond Fund
| Year ended October 31, | | 2011 | | 2010 | |
| | | Shares | | Dollars ($) | | Shares | | Dollars ($) | |
| Capital stock activity | |
| Class A shares | |
| Subscriptions | | | 857,941 | | | | 9,241,447 | | | | 1,488,866 | | | | 16,105,857 | | |
| Distributions reinvested | | | 27,493 | | | | 296,677 | | | | 47,803 | | | | 517,301 | | |
| Redemptions | | | (991,654 | ) | | | (10,618,232 | ) | | | (218,566 | ) | | | (2,353,796 | ) | |
| Net increase (decrease) | | | (106,220 | ) | | | (1,080,108 | ) | | | 1,318,103 | | | | 14,269,362 | | |
| Class B shares | |
| Subscriptions | | | 445 | | | | 4,765 | | | | 3,269 | | | | 34,954 | | |
| Distributions reinvested | | | 384 | | | | 4,106 | | | | 1,672 | | | | 18,074 | | |
| Redemptions | | | (79,651 | ) | | | (856,228 | ) | | | (28,067 | ) | | | (302,382 | ) | |
| Net decrease | | | (78,822 | ) | | | (847,357 | ) | | | (23,126 | ) | | | (249,354 | ) | |
| Class C shares | |
| Subscriptions | | | 130,008 | | | | 1,401,873 | | | | 196,020 | | | | 2,113,354 | | |
| Distributions reinvested | | | 14,598 | | | | 157,335 | | | | 14,860 | | | | 160,835 | | |
| Redemptions | | | (192,530 | ) | | | (2,070,017 | ) | | | (91,547 | ) | | | (985,273 | ) | |
| Net increase (decrease) | | | (47,924 | ) | | | (510,809 | ) | | | 119,333 | | | | 1,288,916 | | |
| Class T shares | |
| Subscriptions | | | 46,857 | | | | 503,396 | | | | 76,782 | | | | 829,441 | | |
| Distributions reinvested | | | 47,090 | | | | 507,088 | | | | 82,678 | | | | 893,570 | | |
| Redemptions | | | (492,558 | ) | | | (5,311,869 | ) | | | (267,991 | ) | | | (2,905,398 | ) | |
| Net decrease | | | (398,611 | ) | | | (4,301,385 | ) | | | (108,531 | ) | | | (1,182,387 | ) | |
| Class Z shares | |
| Subscriptions | | | 4,041,762 | | | | 43,640,534 | | | | 3,255,986 | | | | 35,121,921 | | |
| Distributions reinvested | | | 22,929 | | | | 246,385 | | | | 36,763 | | | | 397,351 | | |
| Redemptions | | | (4,266,000 | ) | | | (45,821,916 | ) | | | (3,785,462 | ) | | | (40,854,996 | ) | |
| Net decrease | | | (201,309 | ) | | | (1,934,997 | ) | | | (492,713 | ) | | | (5,335,724 | ) | |
| Total net increase (decrease) | | | (832,886 | ) | | | (8,674,656 | ) | | | 813,066 | | | | 8,790,813 | | |
The Accompanying Notes to Financial Statements are an integral part of this statement.
17
Financial Highlights – Columbia Massachusetts Intermediate Municipal Bond Fund
The following tables are intended to help you understand the Fund's financial performance. Certain information reflects financial results for a single share of a class held for the periods shown. Per share net investment income (loss) amounts are calculated based on average shares outstanding during the period. Total returns assume reinvestment of all dividends and distributions. Total returns do not reflect payment of sales charges, if any, and are not annualized for periods of less than one year.
| | | Year ended Oct. 31, | |
| | | 2011 | | 2010 | | 2009 | | 2008 | | 2007 | |
| Class A | |
| Per share data | |
| Net asset value, beginning of period | | $ | 10.95 | | | $ | 10.61 | | | $ | 9.90 | | | $ | 10.35 | | | $ | 10.50 | | |
| Income from investment operations: | |
| Net investment income | | | 0.34 | | | | 0.34 | | | | 0.35 | | | | 0.36 | | | | 0.34 | | |
| Net realized and unrealized gain (loss) | | | 0.00 | (a) | | | 0.34 | | | | 0.71 | | | | (0.44 | ) | | | (0.14 | ) | |
| Total from investment operations | | | 0.34 | | | | 0.68 | | | | 1.06 | | | | (0.08 | ) | | | 0.20 | | |
| Less distributions to shareholders from: | |
| Net investment income | | | (0.34 | ) | | | (0.34 | ) | | | (0.35 | ) | | | (0.37 | ) | | | (0.34 | ) | |
| Net realized gains | | | (0.00 | )(a) | | | — | | | | — | | | | (0.00 | )(a) | | | (0.01 | ) | |
| Total distributions to shareholders | | | (0.34 | ) | | | (0.34 | ) | | | (0.35 | ) | | | (0.37 | ) | | | (0.35 | ) | |
| Net asset value, end of period | | $ | 10.95 | | | $ | 10.95 | | | $ | 10.61 | | | $ | 9.90 | | | $ | 10.35 | | |
| Total return | | | 3.24 | % | | | 6.51 | % | | | 10.78 | % | | | (0.88 | %) | | | 2.00 | % | |
| Ratios to average net assets(b) | |
| Expenses prior to fees waived or expenses reimbursed | | | 0.99 | % | | | 0.91 | % | | | 0.90 | % | | | 0.92 | % | | | 0.99 | % | |
| Net expenses after fees waived or expenses reimbursed(c) | | | 0.77 | %(d) | | | 0.80 | %(d) | | | 0.78 | %(d) | | | 0.75 | %(d) | | | 0.99 | %(d) | |
| Net investment income | | | 3.16 | %(d) | | | 3.12 | %(d) | | | 3.30 | %(d) | | | 3.51 | %(d) | | | 3.29 | %(d) | |
| Supplemental data | |
| Net assets, end of period (in thousands) | | $ | 29,849 | | | $ | 30,998 | | | $ | 16,049 | | | $ | 11,936 | | | $ | 6,914 | | |
| Portfolio turnover | | | 10 | % | | | 9 | % | | | 8 | % | | | 10 | % | | | 15 | % | |
Notes to Financial Highlights
(a) Rounds to less than $0.01.
(b) In addition to the fees and expenses which the Fund bears directly, the Fund indirectly bears a pro rata share of the fees and expenses of the acquired funds in which it invests. Such indirect expenses are not included in the reported expense ratios.
(c) The Investment Manager and certain of its affiliates agreed to waive/reimburse certain fees and expenses, if applicable.
(d) The benefits derived from expense reductions had an impact of less than 0.01%.
The Accompanying Notes to Financial Statements are an integral part of this statement.
18
Financial Highlights (continued) – Columbia Massachusetts Intermediate Municipal Bond Fund
| | | Year ended Oct. 31, | |
| | | 2011 | | 2010 | | 2009 | | 2008 | | 2007 | |
| Class B | |
| Per share data | |
| Net asset value, beginning of period | | $ | 10.95 | | | $ | 10.61 | | | $ | 9.90 | | | $ | 10.35 | | | $ | 10.50 | | |
| Income from investment operations: | |
| Net investment income | | | 0.26 | | | | 0.26 | | | | 0.27 | | | | 0.29 | | | | 0.26 | | |
| Net realized and unrealized gain (loss) | | | 0.00 | (a) | | | 0.34 | | | | 0.71 | | | | (0.45 | ) | | | (0.13 | ) | |
| Total from investment operations | | | 0.26 | | | | 0.60 | | | | 0.98 | | | | (0.16 | ) | | | 0.13 | | |
| Less distributions to shareholders from: | |
| Net investment income | | | (0.26 | ) | | | (0.26 | ) | | | (0.27 | ) | | | (0.29 | ) | | | (0.27 | ) | |
| Net realized gains | | | (0.00 | )(a) | | | — | | | | — | | | | (0.00 | )(a) | | | (0.01 | ) | |
| Total distributions to shareholders | | | (0.26 | ) | | | (0.26 | ) | | | (0.27 | ) | | | (0.29 | ) | | | (0.28 | ) | |
| Net asset value, end of period | | $ | 10.95 | | | $ | 10.95 | | | $ | 10.61 | | | $ | 9.90 | | | $ | 10.35 | | |
| Total return | | | 2.48 | % | | | 5.72 | % | | | 9.96 | % | | | (1.61 | %) | | | 1.24 | % | |
| Ratios to average net assets(b) | |
| Expenses prior to fees waived or expenses reimbursed | | | 1.79 | % | | | 1.66 | % | | | 1.65 | % | | | 1.67 | % | | | 1.74 | % | |
| Net expenses after fees waived or expenses reimbursed(c) | | | 1.53 | %(d) | | | 1.55 | %(d) | | | 1.53 | %(d) | | | 1.50 | %(d) | | | 1.74 | %(d) | |
| Net investment income | | | 2.44 | %(d) | | | 2.42 | %(d) | | | 2.59 | %(d) | | | 2.78 | %(d) | | | 2.55 | %(d) | |
| Supplemental data | |
| Net assets, end of period (in thousands) | | $ | 145 | | | $ | 1,008 | | | $ | 1,222 | | | $ | 1,440 | | | $ | 1,650 | | |
| Portfolio turnover | | | 10 | % | | | 9 | % | | | 8 | % | | | 10 | % | | | 15 | % | |
Notes to Financial Highlights
(a) Rounds to less than $0.01.
(b) In addition to the fees and expenses which the Fund bears directly, the Fund indirectly bears a pro rata share of the fees and expenses of the acquired funds in which it invests. Such indirect expenses are not included in the reported expense ratios.
(c) The Investment Manager and certain of its affiliates agreed to waive/reimburse certain fees and expenses, if applicable.
(d) The benefits derived from expense reductions had an impact of less than 0.01%.
The Accompanying Notes to Financial Statements are an integral part of this statement.
19
Financial Highlights (continued) – Columbia Massachusetts Intermediate Municipal Bond Fund
| | | Year ended Oct. 31, | |
| | | 2011 | | 2010 | | 2009 | | 2008 | | 2007 | |
| Class C | |
| Per share data | |
| Net asset value, beginning of period | | $ | 10.95 | | | $ | 10.61 | | | $ | 9.90 | | | $ | 10.35 | | | $ | 10.50 | | |
| Income from investment operations: | |
| Net investment income | | | 0.30 | | | | 0.30 | | | | 0.30 | | | | 0.32 | | | | 0.30 | | |
| Net realized and unrealized gain (loss) | | | 0.00 | (a) | | | 0.34 | | | | 0.72 | | | | (0.44 | ) | | | (0.14 | ) | |
| Total from investment operations | | | 0.30 | | | | 0.64 | | | | 1.02 | | | | (0.12 | ) | | | 0.16 | | |
| Less distributions to shareholders from: | |
| Net investment income | | | (0.30 | ) | | | (0.30 | ) | | | (0.31 | ) | | | (0.33 | ) | | | (0.30 | ) | |
| Net realized gains | | | (0.00 | )(a) | | | — | | | | — | | | | (0.00 | )(a) | | | (0.01 | ) | |
| Total distributions to shareholders | | | (0.30 | ) | | | (0.30 | ) | | | (0.31 | ) | | | (0.33 | ) | | | (0.31 | ) | |
| Net asset value, end of period | | $ | 10.95 | | | $ | 10.95 | | | $ | 10.61 | | | $ | 9.90 | | | $ | 10.35 | | |
| Total return | | | 2.83 | % | | | 6.09 | % | | | 10.34 | % | | | (1.27 | %) | | | 1.59 | % | |
| Ratios to average net assets(b) | |
| Expenses prior to fees waived or expenses reimbursed | | | 1.74 | % | | | 1.66 | % | | | 1.65 | % | | | 1.67 | % | | | 1.74 | % | |
| Net expenses after fees waived or expenses reimbursed(c) | | | 1.17 | %(d) | | | 1.20 | %(d) | | | 1.18 | %(d) | | | 1.15 | %(d) | | | 1.39 | %(d) | |
| Net investment income | | | 2.75 | %(d) | | | 2.75 | %(d) | | | 2.88 | %(d) | | | 3.13 | %(d) | | | 2.89 | %(d) | |
| Supplemental data | |
| Net assets, end of period (in thousands) | | $ | 9,931 | | | $ | 10,452 | | | $ | 8,859 | | | $ | 4,036 | | | $ | 3,792 | | |
| Portfolio turnover | | | 10 | % | | | 9 | % | | | 8 | % | | | 10 | % | | | 15 | % | |
Notes to Financial Highlights
(a) Rounds to less than $0.01.
(b) In addition to the fees and expenses which the Fund bears directly, the Fund indirectly bears a pro rata share of the fees and expenses of the acquired funds in which it invests. Such indirect expenses are not included in the reported expense ratios.
(c) The Investment Manager and certain of its affiliates agreed to waive/reimburse certain fees and expenses, if applicable.
(d) The benefits derived from expense reductions had an impact of less than 0.01%.
The Accompanying Notes to Financial Statements are an integral part of this statement.
20
Financial Highlights (continued) – Columbia Massachusetts Intermediate Municipal Bond Fund
| | | Year ended Oct. 31, | |
| | | 2011 | | 2010 | | 2009 | | 2008 | | 2007 | |
| Class T | |
| Per share data | |
| Net asset value, beginning of period | | $ | 10.95 | | | $ | 10.61 | | | $ | 9.90 | | | $ | 10.35 | | | $ | 10.50 | | |
| Income from investment operations: | |
| Net investment income | | | 0.35 | | | | 0.35 | | | | 0.36 | | | | 0.38 | | | | 0.35 | | |
| Net realized and unrealized gain (loss) | | | 0.00 | (a) | | | 0.34 | | | | 0.71 | | | | (0.45 | ) | | | (0.13 | ) | |
| Total from investment operations | | | 0.35 | | | | 0.69 | | | | 1.07 | | | | (0.07 | ) | | | 0.22 | | |
| Less distributions to shareholders from: | |
| Net investment income | | | (0.35 | ) | | | (0.35 | ) | | | (0.36 | ) | | | (0.38 | ) | | | (0.36 | ) | |
| Net realized gains | | | (0.00 | )(a) | | | — | | | | — | | | | (0.00 | )(a) | | | (0.01 | ) | |
| Total distributions to shareholders | | | (0.35 | ) | | | (0.35 | ) | | | (0.36 | ) | | | (0.38 | ) | | | (0.37 | ) | |
| Net asset value, end of period | | $ | 10.95 | | | $ | 10.95 | | | $ | 10.61 | | | $ | 9.90 | | | $ | 10.35 | | |
| Total return | | | 3.34 | % | | | 6.62 | % | | | 10.89 | % | | | (0.77 | %) | | | 2.10 | % | |
| Ratios to average net assets(b) | |
| Expenses prior to fees waived or expenses reimbursed | | | 0.89 | % | | | 0.81 | % | | | 0.80 | % | | | 0.82 | % | | | 0.89 | % | |
| Net expenses after fees waived or expenses reimbursed(c) | | | 0.67 | %(d) | | | 0.70 | %(d) | | | 0.68 | %(d) | | | 0.65 | %(d) | | | 0.89 | %(d) | |
| Net investment income | | | 3.25 | %(d) | | | 3.26 | %(d) | | | 3.43 | %(d) | | | 3.63 | %(d) | | | 3.40 | %(d) | |
| Supplemental data | |
| Net assets, end of period (in thousands) | | $ | 34,952 | | | $ | 39,300 | | | $ | 39,221 | | | $ | 37,689 | | | $ | 42,468 | | |
| Portfolio turnover | | | 10 | % | | | 9 | % | | | 8 | % | | | 10 | % | | | 15 | % | |
Notes to Financial Highlights
(a) Rounds to less than $0.01.
(b) In addition to the fees and expenses which the Fund bears directly, the Fund indirectly bears a pro rata share of the fees and expenses of the acquired funds in which it invests. Such indirect expenses are not included in the reported expense ratios.
(c) The Investment Manager and certain of its affiliates agreed to waive/reimburse certain fees and expenses, if applicable.
(d) The benefits derived from expense reductions had an impact of less than 0.01%.
The Accompanying Notes to Financial Statements are an integral part of this statement.
21
Financial Highlights (continued) – Columbia Massachusetts Intermediate Municipal Bond Fund
| | | Year ended Oct. 31, | |
| | | 2011 | | 2010 | | 2009 | | 2008 | | 2007 | |
| Class Z | |
| Per share data | |
| Net asset value, beginning of period | | $ | 10.95 | | | $ | 10.61 | | | $ | 9.90 | | | $ | 10.35 | | | $ | 10.50 | | |
| Income from investment operations: | |
| Net investment income | | | 0.37 | | | | 0.37 | | | | 0.37 | | | | 0.39 | | | | 0.37 | | |
| Net realized and unrealized gain (loss) | | | 0.00 | (a) | | | 0.34 | | | | 0.71 | | | | (0.45 | ) | | | (0.14 | ) | |
| Total from investment operations | | | 0.37 | | | | 0.71 | | | | 1.08 | | | | (0.06 | ) | | | 0.23 | | |
| Less distributions to shareholders from: | |
| Net investment income | | | (0.37 | ) | | | (0.37 | ) | | | (0.37 | ) | | | (0.39 | ) | | | (0.37 | ) | |
| Net realized gains | | | (0.00 | )(a) | | | — | | | | — | | | | (0.00 | )(a) | | | (0.01 | ) | |
| Total distributions to shareholders | | | (0.37 | ) | | | (0.37 | ) | | | (0.37 | ) | | | (0.39 | ) | | | (0.38 | ) | |
| Net asset value, end of period | | $ | 10.95 | | | $ | 10.95 | | | $ | 10.61 | | | $ | 9.90 | | | $ | 10.35 | | |
| Total return | | | 3.49 | % | | | 6.77 | % | | | 11.06 | % | | | (0.62 | %) | | | 2.25 | % | |
| Ratios to average net assets(b) | |
| Expenses prior to fees waived or expenses reimbursed | | | 0.74 | % | | | 0.66 | % | | | 0.65 | % | | | 0.67 | % | | | 0.74 | % | |
| Net expenses after fees waived or expenses reimbursed(c) | | | 0.52 | %(d) | | | 0.55 | %(d) | | | 0.53 | %(d) | | | 0.50 | %(d) | | | 0.74 | %(d) | |
| Net investment income | | | 3.40 | %(d) | | | 3.41 | %(d) | | | 3.58 | %(d) | | | 3.78 | %(d) | | | 3.55 | %(d) | |
| Supplemental data | |
| Net assets, end of period (in thousands) | | $ | 284,128 | | | $ | 286,196 | | | $ | 282,469 | | | $ | 259,753 | | | $ | 254,639 | | |
| Portfolio turnover | | | 10 | % | | | 9 | % | | | 8 | % | | | 10 | % | | | 15 | % | |
Notes to Financial Highlights
(a) Rounds to less than $0.01.
(b) In addition to the fees and expenses which the Fund bears directly, the Fund indirectly bears a pro rata share of the fees and expenses of the acquired funds in which it invests. Such indirect expenses are not included in the reported expense ratios.
(c) The Investment Manager and certain of its affiliates agreed to waive/reimburse certain fees and expenses, if applicable.
(d) The benefits derived from expense reductions had an impact of less than 0.01%.
The Accompanying Notes to Financial Statements are an integral part of this statement.
22
Notes to Financial Statements – Columbia Massachusetts Intermediate Municipal Bond Fund
October 31, 2011
Note 1. Organization
Columbia Massachusetts Intermediate Municipal Bond Fund (the Fund), a series of Columbia Funds Series Trust I (the Trust), is a non-diversified fund. The Trust is registered under the Investment Company Act of 1940, as amended (the 1940 Act), as an open-end management investment company organized as a Massachusetts business trust.
Fund Shares
The Trust may issue an unlimited number of shares (without par value). The Fund offers Class A, Class B, Class C, Class T and Class Z shares. All share classes have identical voting, dividend and liquidation rights. Each share class has its own expense structure and sales charges, as applicable.
Class A shares are subject to a maximum front-end sales charge of 3.25% based on the initial investment amount. Class A shares purchased without an initial sales charge in accounts aggregating $1 million to $50 million at the time of purchase are subject to a contingent deferred sales charge (CDSC) if the shares are sold within 18 months of purchase, charged as follows: 1.00% CDSC if redeemed within 12 months of purchase, and 0.50% CDSC if redeemed more than 12, but less than 18, months after purchase.
Class B shares may be subject to a maximum CDSC of 3.00% based upon the holding period after purchase. Class B shares will generally convert to Class A shares eight years after purchase. The Fund no longer accepts investments by new or existing investors in the Fund's Class B shares, except in connection with the reinvestment of any dividend and/or capital gain distributions in Class B shares of the Fund and exchanges by existing Class B shareholders of certain other funds within the Columbia Family of Funds.
Class C shares are subject to a 1.00% CDSC on shares redeemed within one year of purchase.
Class T shares are subject to a maximum front-end sales charge of 4.75% based on the investment amount. Class T shares purchased without an initial sales charge in accounts aggregating $1 million to $50 million at the time of purchase are subject to a 1.00% CDSC if the shares are sold within 18 months of purchase, charged as follows: 1.00% CDSC if redeemed within 12 months of purchase, and 0.50% CDSC if redeemed more than 12, but less than 18, months after purchase.
Class Z shares are not subject to sales charges, and are only available to certain investors, as described in the Fund's prospectus.
Note 2. Summary of Significant Accounting Policies
Use of Estimates
The preparation of financial statements in accordance with U.S. generally accepted accounting principles (GAAP) requires management to make certain estimates and assumptions that affect the reported amounts of assets and liabilities, the disclosure of contingent assets and liabilities at the date of the financial statements and the reported amounts of revenue and expenses during the reporting period. Actual results could differ from those estimates.
The following is a summary of significant accounting policies consistently followed by the Fund in the preparation of its financial statements.
Security Valuation
Debt securities generally are valued by pricing services approved by the Board of Trustees (the Board) based upon market transactions for normal, institutional-size trading units of similar securities. The services may use various pricing techniques which take into account appropriate factors such as yield, quality, coupon rate, maturity, type of issue, trading characteristics and other data, as well as broker quotes. Debt securities for which quotations are readily available may also be valued based upon an over-the-counter or exchange bid quotation.
Investments in other open-end investment companies, including money market funds, are valued at net asset value.
Short-term securities purchased within 60 days to maturity are valued at amortized cost, which approximates market value. The value of short-term securities originally purchased with maturities greater than 60 days is determined based on an amortized value to par upon reaching 60 days to maturity. Short-term securities maturing in more than 60 days from the valuation date are valued at the market price or approximate market value based on current interest rates.
Investments for which market quotations are not readily available, or that have quotations which management believes
23
Columbia Massachusetts Intermediate Municipal Bond Fund, October 31, 2011
are not reliable, are valued at fair value as determined in good faith under consistently applied procedures established by and under the general supervision of the Board. If a security or class of securities (such as foreign securities) is valued at fair value, such value is likely to be different from the last quoted market price for the security. The determination of fair value often requires significant judgment. To determine fair value, management may use assumptions including but not limited to future cash flows and estimated risk premiums. Multiple inputs from various sources may be used to determine value.
Delayed Delivery Securities
The Fund may trade securities on other than normal settlement terms, including securities purchased or sold on a "when-issued" basis. This may increase the risk if the other party to the transaction fails to deliver and causes the Fund to subsequently invest at less advantageous prices. The Fund identifies within its Portfolio of Investments cash or liquid securities in an amount equal to the delayed delivery commitment.
Security Transactions
Security transactions are accounted for on the trade date. Cost is determined and gains (losses) are based upon the specific identification method for both financial statement and federal income tax purposes.
Income Recognition
Interest income is recorded on the accrual basis. Market premium and discount are amortized and accreted, respectively, on all debt securities, unless otherwise noted. Original issue discount is accreted to interest income over the life of the security with a corresponding increase in the cost basis, if any.
Dividend income is recorded on the ex-date.
Expenses
General expenses of the Trust are allocated to the Fund and other funds of the Trust based upon relative net assets or other expense allocation methodologies determined by the nature of the expense. Expenses directly attributable to the Fund are charged to the Fund. Expenses directly attributable to a specific class of shares are charged to that share class.
Determination of Class Net Asset Value
All income, expenses (other than class-specific expenses, which are charged to that share class, as shown in the Statement of Operations) and realized and unrealized gains (losses) are allocated to each class of the Fund on a daily basis for purposes of determining the net asset value of each class. Income and expenses are allocated to each class based on the settled shares method, while realized and unrealized gains (losses) are allocated based on the relative net assets of each class.
Federal Income Tax Status
The Fund intends to qualify each year as a regulated investment company under Subchapter M of the Internal Revenue Code, as amended, and will distribute substantially all of its tax exempt income (including net short-term capital gains), if any, for its tax year, and as such will not be subject to federal income taxes. In addition, the Fund intends to distribute in each calendar year substantially all of its net investment income, capital gains and certain other amounts, if any, such that the Fund should not be subject to federal excise tax. Therefore, no federal income or excise tax provision is recorded.
Distributions to Shareholders
Distributions from net investment income are declared daily and paid monthly. Net realized capital gains, if any, are distributed at least annually. Income distributions and capital gain distributions are determined in accordance with federal income tax regulations which may differ from GAAP.
Guarantees and Indemnifications
Under the Trust's organizational documents and, in some cases, by contract, its officers and trustees are indemnified against certain liabilities arising out of the performance of their duties to the Trust or its funds. In addition, certain of the Fund's contracts with its service providers contain general indemnification clauses. The Fund's maximum exposure under these arrangements is unknown since the amount of any future claims that may be made against the Fund cannot be determined, and the Fund has no historical basis for predicting the likelihood of any such claims.
24
Columbia Massachusetts Intermediate Municipal Bond Fund, October 31, 2011
Recent Accounting Pronouncement
Fair Value Measurements and Disclosures
In May 2011, the Financial Accounting and Standards Board issued ASU No. 2011-04 modifying Topic 820, Fair Value Measurements and Disclosures. At the same time, the International Accounting Standards Board issued International Financial Reporting Standard 13, Fair Value Measurement. The objective of the FASB and IASB is convergence of their guidance on fair value measurements and disclosures.
Specifically, ASU No. 2011-04 requires reporting entities to disclose i) the amounts of any transfers between Level 1 and Level 2, and the reasons for the transfers, ii) for Level 3 fair value measurements, a) quantitative information about significant unobservable inputs used, b) a description of the valuation processes used by the reporting entity and c) a narrative description of the sensitivity of the fair value measurement to changes in unobservable inputs if a change in those inputs might result in a significantly higher or lower fair value measurement. The effective date of ASU No. 2011-04 is for interim and annual periods beginning after December 15, 2011. At this time, management is evaluating the implications of this guidance and the impact it will have on the financial statement amounts and footnote disclosures, if any.
Note 3. Fees and Compensation Paid to Affiliates
Investment Management Fees
Under an Investment Management Services Agreement (IMSA), Columbia Management Investment Advisers, LLC (the Investment Manager), a wholly-owned subsidiary of Ameriprise Financial, Inc. (Ameriprise Financial), determines which securities will be purchased, held or sold. Effective March 1, 2011, the management fee is an annual fee that is equal to a percentage of the Fund's average daily net assets that declines from 0.40% to 0.27% as the Fund's net assets increase. Prior to March 1, 2011, the management fee was equal to a percentage of the Fund's average daily net assets that declined from 0.48% to 0.35% as the Fund's net assets increased. The effective management fee rate for the year ended October 31, 2011 was 0.43% of the Fund's average daily net assets.
Administration Fees
Under an Administrative Services Agreement, the Investment Manager serves as the Fund Administrator. Effective March 1, 2011, the Fund pays the Fund Administrator an annual fee for administration and accounting services equal to a percentage of the Fund's average daily net assets that declines from 0.07% to 0.04% as the Fund's net assets increase. Prior to March 1, 2011, the administration fee was equal to the annual rate of 0.067% of the Fund's average daily net assets. The effective administration fee rate for the year ended October 31, 2011 was 0.07% of the Fund's average daily net assets.
Pricing and Bookkeeping Fees
Prior to May 16, 2011, the Fund had entered into a Financial Reporting Services Agreement (the Financial Reporting Services Agreement) with State Street Bank and Trust Company (State Street) and the Investment Manager pursuant to which State Street provided financial reporting services to the Fund. The Fund also entered into an Accounting Services Agreement (collectively with the Financial Reporting Services Agreement, the State Street Agreements) with State Street and the Investment Manager pursuant to which State Street provided accounting services to the Fund. Under the State Street Agreements, the Fund paid State Street an annual fee of $38,000 paid monthly plus an additional monthly fee based on an annualized percentage rate of average daily net assets of the Fund for the month. The aggregate fee did not exceed $140,000 per year (exclusive of out-of-pocket expenses and charges). The Fund also reimbursed State Street for certain out-of-pocket expenses and charges. Effective May 16, 2011, these services are now provided under the Administrative Services Agreement discussed above.
Compensation of Board Members
Board members are compensated for their services to the Fund as disclosed in the Statement of Operations. The Trust's eligible Trustees may participate in a Deferred Compensation Plan (the Plan) which may be terminated at any time. Obligation of the Plan will be paid solely out of the Fund's assets.
Compensation of Chief Compliance Officer
The Board has appointed a Chief Compliance Officer to the Fund in accordance with federal securities regulations. The
25
Columbia Massachusetts Intermediate Municipal Bond Fund, October 31, 2011
Fund, along with other affiliated funds, pays its pro-rata share of the expenses associated with the Chief Compliance Officer. The Fund's expenses for the Chief Compliance Officer will not exceed $15,000 per year.
Transfer Agent Fees
Under a Transfer and Dividend Disbursing Agent Agreement, Columbia Management Investment Services Corp. (the Transfer Agent), an affiliate of the Investment Manager and a wholly-owned subsidiary of Ameriprise Financial, is responsible for providing transfer agency services to the Fund. The Transfer Agent has contracted with Boston Financial Data Services (BFDS) to serve as sub-transfer agent.
The Transfer Agent receives monthly account-based service fees based on the number of open accounts and is reimbursed by the Fund for the fees and expenses the Transfer Agent pays to financial intermediaries that maintain omnibus accounts with the Fund that is a percentage of the average aggregate value of the Fund's shares maintained in each such omnibus account (other than omnibus accounts for which American Enterprise Investment Services Inc. is the broker of record or accounts where the beneficial shareholder is a customer of Ameriprise Financial Services, Inc., which are paid a per account fee). The Transfer Agent pays the fees of BFDS for services as sub-transfer agent and is not entitled to reimbursement for such fees from the Fund (with the exception of out-of-pocket fees).
The Transfer Agent also receives compensation from fees for various shareholder services and reimbursements for certain out-of -pocket expenses.
For the year ended October 31, 2011, the Fund's effective transfer agent fee rates as a percentage of average daily net assets of each class were as follows:
| Class A | | | 0.16 | % | |
| Class B | | | 0.18 | | |
| Class C | | | 0.16 | | |
| Class T | | | 0.16 | | |
| Class Z | | | 0.16 | | |
An annual minimum account balance fee of $20 may apply to certain accounts with a value below the Fund's initial minimum investment requirements to reduce the impact of small accounts on transfer agent fees. These minimum account balance fees are recorded as part of expense reductions in the Statement of Operations. For the year ended October 31, 2011, these minimum account balance fees reduced total expenses by $220.
Distribution and Service Fees
The Fund has an agreement with Columbia Management Investment Distributors, Inc. (the Distributor), an affiliate of the Investment Manager and a wholly-owned subsidiary of Ameriprise Financial, for distribution and shareholder services. Pursuant to Rule 12b-1 under the 1940 Act, the Board has approved, and the Fund has adopted, distribution and shareholder service plans (the Plans) which set the distribution and service fees for the Fund. These fees are calculated daily and are intended to compensate the Distributor and/or eligible selling and/or servicing agents for selling shares of the Fund and providing services to investors.
The Plans require the payment of a monthly service fee to the Distributor at the maximum annual rate of 0.25% of the average daily net assets attributable to Class A, Class B and Class C shares of the Fund. The Plans also require the payment of a monthly distribution fee to the Distributor at the maximum annual rate of 0.75% of the average daily net assets attributable to Class B and Class C shares only.
The Distributor has voluntarily agreed to waive a portion of the distribution fee for Class C shares so that the combined distribution and service fee does not exceed 0.65% annually of the average daily net assets attributable to Class C shares. This arrangement may be modified or terminated by the Distributor at any time.
Shareholder Services Fees
The Fund has adopted a shareholder services plan that permits it to pay for certain services provided to Class T shareholders by their selling and/or servicing agents. The Fund may pay shareholder servicing fees up to an aggregate annual rate of 0.40% of the Fund's average daily net assets attributable to Class T shares (comprised of up to 0.20% for
26
Columbia Massachusetts Intermediate Municipal Bond Fund, October 31, 2011
shareholder liaison services and up to 0.20% for administrative support services). These fees are currently limited to an aggregate annual rate of not more than 0.15% of the Fund's average daily net assets attributable to Class T shares. In addition, the servicing fee for Class T shares will be waived by selling and/or servicing agents to the extent necessary to prevent the net investment income for the Class T shares from falling below 0.00% on a daily basis. The shareholder services fee for the year ended October 31, 2011 was 0.15% of the Fund's average daily net assets attributable to Class T shares.
Sales Charges
Sales charges, including front-end charges and CDSCs, received by the Distributor for distributing Fund shares were $25,139 for Class A, $525 for Class B, $742 for Class C and $811 for Class T shares for the year ended October 31, 2011.
Expenses Waived/Reimbursed by the Investment Manager and its Affiliates
Effective March 1, 2011, the Investment Manager and certain of its affiliates have contractually agreed to waive fees and/or reimburse expenses (excluding certain fees and expenses described below), through February 29, 2012, unless sooner terminated at the sole discretion of the Board, so that the Fund's net operating expenses, after giving effect to fees waived/expenses reimbursed and any balance credits and/or overdraft charges from the Fund's custodian, do not exceed the following annual rates as a percentage of the class' average daily net assets:
| Class A | | | 0.75 | % | |
| Class B | | | 1.50 | | |
| Class C | | | 1.50 | | |
| Class T | | | 0.65 | | |
| Class Z | | | 0.50 | | |
Under the agreement, the following fees and expenses are excluded from the waiver/reimbursement commitment, and therefore will be paid by the Fund, if applicable: taxes (including foreign transaction taxes), expenses associated with investments in affiliated and non-affiliated pooled investment vehicles (including mutual funds and exchange traded funds), transaction costs and brokerage commissions, costs related to any securities lending program, dividend expenses associated with securities sold short, inverse floater program fees and expenses, transaction charges and interest on borrowed money, interest, extraordinary expenses and any other expenses the exclusion of which is specifically approved by the Fund's Board. This agreement may be modified or amended only with approval from all parties. Class C distribution fees waived by the Distributor, as discussed above, are in addition to the waiver/reimbursement commitment under the agreement.
Prior to March 1, 2011, the Investment Manager voluntarily agreed to reimburse a portion of the Fund's expenses (excluding certain expenses, such as distribution and services fees, brokerage commissions, interest, taxes and extraordinary expenses, but including custodian charges relating to overdrafts, if any) so that the Fund's ordinary net operating expenses, after giving effect to fees waived/expenses reimbursed and any balance credits and/or overdraft charges from the Fund's custodian, did not exceed 0.55% of the Fund's average daily net assets on an annualized basis.
Note 4. Federal Tax Information
The timing and character of income and capital gain distributions are determined in accordance with income tax regulations, which may differ from GAAP because of temporary or permanent book to tax differences.
For the year ended October 31, 2011, permanent differences are primarily due to amortization/accretion adjustments. In the Statement of Assets and Liabilities the following reclassifications were made among the components of the Fund's net assets due to permanent differences:
| Undistributed Net Investment Income | | $ | (20,202 | ) | |
| Accumulated Net Realized Gain | | | 2,171 | | |
| Paid-In Capital | | | 18,031 | | |
Net investment income and net realized gains (losses), as disclosed in the Statement of Operations, and net assets were not affected by this reclassification.
27
Columbia Massachusetts Intermediate Municipal Bond Fund, October 31, 2011
The tax character of distributions paid during the years indicated was as follows:
| Year ended October 31, | | 2011 | | 2010 | |
| Tax-Exempt Income | | $ | 11,894,433 | | | $ | 12,089,452 | | |
| Long-Term Capital Gains | | | 101,028 | | | | — | | |
Short-term capital gain distributions, if any, are considered ordinary income distributions for tax purposes.
At October 31, 2011, the components of distributable earnings on a tax basis were as follows:
| Undistributed Tax-Exempt Income | | $ | 971,932 | | |
| Undistributed Long-Term Capital Gain | | | 354,722 | | |
| Unrealized Appreciation | | | 23,950,711 | | |
At October 31, 2011, the cost of investments for federal income tax purposes was $336,249,554 and the aggregate gross unrealized appreciation and depreciation based on that cost was:
| Unrealized Appreciation | | $ | 24,431,638 | | |
| Unrealized Depreciation | | $ | (480,927 | ) | |
| Net Unrealized Appreciation | | $ | 23,950,711 | | |
Management of the Fund has concluded that there are no significant uncertain tax positions that would require recognition in the financial statements. However, management's conclusion may be subject to review and adjustment at a later date based on factors including, but not limited to, new tax laws, regulations, and administrative interpretations (including relevant court decisions). Generally, the Fund's federal tax returns for the prior three fiscal years remain subject to examination by the Internal Revenue Service.
Note 5. Portfolio Information
The cost of purchases and proceeds from sales of securities, excluding short-term obligations, aggregated to $34,353,605 and $42,747,651, respectively, for the year ended October 31, 2011.
Note 6. Lending of Portfolio Securities
Effective May 16, 2011, the Fund has entered into a Master Securities Lending Agreement (the Agreement) with JPMorgan Chase Bank, N.A. (JPMorgan). The Agreement, which replaces the previous security lending arrangement with State Street, authorizes JPMorgan as lending agent to lend securities to authorized borrowers in order to generate additional income on behalf of the Fund. Pursuant to the Agreement, the securities loaned are secured by cash or U.S. government securities equal to at least 100% of the market value of the loaned securities. Any additional collateral required to maintain those levels due to market fluctuations of the loaned securities is delivered the following business day. Cash collateral received is invested by the lending agent on behalf of the Fund into authorized investments pursuant to the Agreement. The investments made with the cash collateral are listed in the Portfolio of Investments. The values of such investments and any uninvested cash collateral are disclosed in the Statement of Assets and Liabilities along with the related obligation to return the collateral upon the return of the securities loaned. For the year ended October 31, 2011, the Fund did not participate in securities lending activity.
Risks of delay in recovery of securities or even loss of rights in the securities may occur should the borrower of the securities fail financially. Risks may also arise to the extent that the value of the securities loaned increases above the value of the collateral received. JPMorgan will indemnify the Fund from losses resulting from a borrower's failure to return a loaned security when due. Such indemnification does not extend to losses associated with declines in the value of cash collateral investments. The Investment Manager is not responsible for any losses incurred by the Fund in connection with the securities lending program. Loans are subject to termination by the Fund or the borrower at any time, and are, therefore, not considered to be illiquid investments.
Pursuant to the Agreement, the Fund receives income for lending its securities either in the form of fees or by earning interest on invested cash collateral, net of negotiated rebates paid to borrowers and fees paid to the lending agent for services provided and any other securities lending expenses. The Fund continues to earn and accrue interest and dividends on the securities loaned.
Prior to May 16, 2011, the Fund participated in a securities lending arrangement with State Street. Each security on loan
28
Columbia Massachusetts Intermediate Municipal Bond Fund, October 31, 2011
was collateralized in an amount at least equal to the market value of the securities loaned plus accrued income from the investment of collateral. The income generated by the investment of the collateral, net of any fees remitted to State Street as the lending agent and borrower rebates, was paid to the Fund.
Note 7. Custody Credits
Prior to May 16, 2011, the Fund had an agreement with its custodian bank under which custody fees may have been reduced by balance credits. These credits are recorded as part of expense reductions on the Statement of Operations. The Fund could have invested a portion of the assets utilized in connection with the expense offset arrangement in an income-producing asset if they had not entered into such an agreement. For the period November 1, 2010 through May 16, 2011, there were no custody credits.
Note 8. Shareholder Concentration
At October 31, 2011, one shareholder account owned 86.8% of the outstanding shares of the Fund. Subscription and redemption activity of this account may have a significant effect on the operations of the Fund.
Note 9. Line of Credit
The Fund has entered into a revolving credit facility with a syndicate of banks led by JPMorgan Chase Bank, N.A. (the Administrative Agent), whereby the Fund may borrow for the temporary funding of shareholder redemptions or for other temporary or emergency purposes. The credit facility became effective on May 16, 2011, replacing a prior credit facility. The credit facility agreement which is a collective agreement between the Fund and certain other funds managed by the Investment Manager, severally and not jointly, permits collective borrowings up to $500,000,000.
Interest is charged to each participating fund based on its borrowings at a rate equal to the sum of the federal funds rate plus (i) 1.25% per annum plus (ii) if one-month LIBOR exceeds the federal funds rate, the amount of such excess. Each borrowing under the credit facility matures no later than 60 days after the date of borrowing. The Fund also pays a commitment fee equal to its pro rata share of the amount of the credit facility at a rate of 0.10% per annum.
For the period March 28, 2011 through May 15, 2011, the Fund and certain other funds managed by the Investment Manager participated in a $225,000,000 committed, unsecured revolving credit facility provided by State Street. Prior to March 28, 2011, the collective borrowing amount of the credit facility was $280,000,000. Interest was charged to each fund based on its borrowings at a rate equal to the greater of the (i) federal funds rate plus 1.25% per annum or (ii) the overnight LIBOR rate plus 1.25% per annum. The Fund also paid a commitment fee equal to its pro rata share of the amount of the credit facility at a rate of 0.125% per annum.
The Fund had no borrowings during the year ended October 31, 2011.
Effective December 13, 2011, the Fund extended its revolving credit facility with the Administrative Agent. The credit facility agreement, as amended, permits collective borrowings up to $500 million. Effective December 13, 2011, interest is charged to each participating fund based on its borrowings at a rate equal to the higher of (i) the overnight federal funds rate plus 1.00% or (i) the one-month LIBOR rate plus 1.00%. Each borrowing under the credit facility matures no later than 60 days after the date of borrowing. The Fund also pays a commitment fee equal to its pro rata share of the amount of the credit facility at a rate of 0.08% per annum.
Note 10. Significant Risks
Non-Diversification Risk
A non-diversified fund is permitted to invest a greater percentage of its total assets in fewer companies than a diversified fund. The Fund may, therefore, have a greater risk of loss from a few issuers than a similar fund that invests more broadly.
Geographic Concentration Risk
Because state-specific tax-exempt funds invest primarily in the municipal securities issued by the state and political sub-divisions of the state, the Fund will be particularly affected by political and economic conditions and developments in the state in which it invests. The Fund may, therefore, have a greater risk than that of a municipal bond fund which is more geographically diversified. The value of the municipal
29
Columbia Massachusetts Intermediate Municipal Bond Fund, October 31, 2011
securities owned by the Fund also may be adversely affected by future changes in federal or state income tax laws.
Tax Development Risk
The Fund purchases municipal securities whose interest, in the opinion of bond counsel, is free from federal income tax. There is no assurance that the Internal Revenue Service (IRS) will agree with this opinion. In the event the IRS determines that an issuer does not comply with relevant tax requirements, interest payments from a security could become federally taxable, possibly retroactively to the date the security was issued. As a shareholder of the Fund, you may be required to file an amended tax return as a result.
Note 11. Subsequent Events
Management has evaluated the events and transactions that have occurred through the date the financial statements were issued. Other than as noted in Note 9 above, there were no items requiring adjustment of the financial statements or additional disclosure.
Note 12. Information Regarding Pending and Settled Legal Proceedings
In June 2004, an action captioned John E. Gallus et al. v. American Express Financial Corp. and American Express Financial Advisors Inc. was filed in the United States District Court for the District of Arizona. The plaintiffs allege that they are investors in several American Express Company mutual funds (branded as Columbia) and they purport to bring the action derivatively on behalf of those funds under the Investment Company Act of 1940. The plaintiffs allege that fees allegedly paid to the defendants by the funds for investment advisory and administrative services are excessive. The plaintiffs seek remedies including restitution and rescission of investment advisory and distribution agreements. The plaintiffs voluntarily agreed to transfer this case to the United States District Court for the District of Minnesota (the District Court). In response to defendants' motion to dismiss the complaint, the District Court dismissed one of plaintiffs' four claims and granted plaintiffs limited discovery. Defendants moved for summary judgment in April 2007. Summary judgment was granted in the defendants' favor on July 9, 2007. The plaintiffs filed a notice of appeal with the Eighth Circuit Court of Appeals (the Eighth Circuit) on August 8, 2007. On April 8, 2009, the Eighth Circuit reversed summary judgment and remanded to the District Court for further proceedings. On August 6, 2009, defendants filed a writ of certiorari with the U.S. Supreme Court (the Supreme Court), asking the Supreme Court to stay the District Court proceedings while the Supreme Court considers and rules in a case captioned Jones v. Harris Associates, which involves issues of law similar to those presented in the Gallus case. On March 30, 2010, the Supreme Court issued its ruling in Jones v. Harris Associates, and on April 5, 2010, the Supreme Court vacated the Eighth Circuit's decision in the Gallus case and remanded the case to the Eighth Circuit for further consideration in light of the Supreme Court's decision in Jones v. Harris Associates. On June 4, 2010, the Eighth Circuit remanded the Gallus case to the District Court for further consideration in light of the Supreme Court's decision in Jones v. Harris Associates. On December 9, 2010, the District Court reinstated its July 9, 2007 summary judgment order in favor of the defendants. On January 10, 2011, plaintiffs filed a notice of appeal with the Eighth Circuit. In response to the plaintiffs' opening appellate brief filed on March 18, 2011, the defendants filed a response brief on May 4, 2011 with the Eighth Circuit. The plaintiffs filed a reply brief on May 26, 2011 and oral arguments took place on November 17, 2011.
In December 2005, without admitting or denying the allegations, American Express Financial Corporation (AEFC, which is now known as Ameriprise Financial, Inc. (Ameriprise Financial)), entered into settlement agreements with the Securities and Exchange Commission (SEC) and Minnesota Department of Commerce (MDOC) related to market timing activities. As a result, AEFC was censured and ordered to cease and desist from committing or causing any violations of certain provisions of the Investment Advisers Act of 1940, the Investment Company Act of 1940, and various Minnesota laws. AEFC agreed to pay disgorgement of $10 million and civil money penalties of $7 million. AEFC also agreed to retain an independent distribution consultant to assist in developing a plan for distribution of all disgorgement and civil penalties ordered by the SEC in accordance with various undertakings detailed at www.sec.gov/litigation/admin/ia-2451.pdf. Ameriprise Financial and its affiliates have cooperated with the SEC and the MDOC in these legal proceedings, and have made regular reports to the funds' Boards of Trustees.
Ameriprise Financial and certain of its affiliates have historically been involved in a number of legal, arbitration
30
Columbia Massachusetts Intermediate Municipal Bond Fund, October 31, 2011
and regulatory proceedings, including routine litigation, class actions, and governmental actions, concerning matters arising in connection with the conduct of their business activities. Ameriprise Financial believes that the Funds are not currently the subject of, and that neither Ameriprise Financial nor any of its affiliates are the subject of, any pending legal, arbitration or regulatory proceedings that are likely to have a material adverse effect on the Funds or the ability of Ameriprise Financial or its affiliates to perform under their contracts with the Funds. Ameriprise Financial is required to make 10-Q, 10-K and, as necessary, 8-K filings with the Securities and Exchange Commission on legal and regulatory matters that relate to Ameriprise Financial and its affiliates. Copies of these filings may be obtained by accessing the SEC website at www.sec.gov.
There can be no assurance that these matters, or the adverse publicity associated with them, will not result in increased fund redemptions, reduced sale of fund shares or other adverse consequences to the Funds. Further, although we believe proceedings are not likely to have a material adverse effect on the Funds or the ability of Ameriprise Financial or its affiliates to perform under their contracts with the Funds, these proceedings are subject to uncertainties and, as such, we are unable to estimate the possible loss or range of loss that may result. An adverse outcome in one or more of these proceedings could result in adverse judgments, settlements, fines, penalties or other relief that could have a material adverse effect on the consolidated financial condition or results of operations of Ameriprise Financial.
31
Report of Independent Registered Public Accounting Firm
To the Trustees of Columbia Funds Series Trust I and the Shareholders of Columbia Massachusetts Intermediate Municipal Bond Fund
In our opinion, the accompanying statement of assets and liabilities, including the investment portfolio, and the related statements of operations and of changes in net assets and the financial highlights present fairly, in all material respects, the financial position of Columbia Massachusetts Intermediate Municipal Bond Fund (the "Fund") (a series of Columbia Funds Series Trust I) at October 31, 2011, and the results of its operations for the year then ended, the changes in its net assets for each of the two years in the period then ended and the financial highlights for each of the periods indicated, in conformity with accounting principles generally accepted in the United States of America. These financial statements and financial highlights (hereafter referred to as "financial statements") are the responsibility of the Fund's management. Our responsibility is to express an opinion on these financial statements based on our audits. We conducted our audits of these financial statements in accordance with the standards of the Public Company Accounting Oversight Board (United States). Those standards require that we plan and perform the audit to obtain reasonable assurance about whether the financial statements are free of material misstatement. An audit includes examining, on a test basis, evidence supporting the amounts and disclosures in the financial statements, assessing the accounting principles used and significant estimates made by management, and evaluating the overall financial statement presentation. We believe that our audits, which included confirmation of securities at October 31, 2011 by correspondence with the custodian and brokers, provide a reasonable basis for our opinion.
PricewaterhouseCoopers LLP
Minneapolis, Minnesota
December 22, 2011
32
Federal Income Tax Information (Unaudited) – Columbia Massachusetts Intermediate Municipal Bond Fund
The Fund hereby designates as a capital gain dividend with respect to the fiscal year ended October 31, 2011, $389,179, or, if subsequently determined to be different, the net capital gain of such year.
For the fiscal year ended October 31, 2011, 100% of the distributions from net investment income of the Fund qualifies as exempt interest dividends for federal income tax purposes. A portion of the income may be subject to federal alternative minimum tax.
The Fund will notify shareholders in January 2012 of amounts for use in preparing 2011 income tax returns.
33
Fund Governance
The Trustees serve terms of indefinite duration. The names, addresses and birth years of the Trustees and Officers of the Funds in Columbia Funds Series Trust I, the year each was first elected or appointed to office, their principal business occupations during at least the last five years, the number of Funds overseen by each Trustee and other directorships they hold are shown below. Each officer listed below serves as an officer of each Fund in Columbia Funds Series Trust I.
Independent Trustees
Name, Address and Year of Birth,
Position with Funds, Year First
Elected or Appointed to Office | | Principal Occupation(s) During Past Five Years, Number of Funds in Columbia
Funds Complex Overseen by Trustee, Other Directorships Held
| |
| Rodman L. Drake (Born 1943) | |
|
c/o Columbia Management
Investment Advisers, LLC
225 Franklin Street
Boston, MA 02110
Trustee (since 1994) and Chairman of the Board (since 2009) | | Independent consultant since 2010; Co-Founder of Baringo Capital LLC (private equity) from 1997 to 2008; CEO of Crystal River Capital, Inc. (real estate investment trust) from 2003 to 2010; Oversees 43; Jackson Hewitt Tax Service Inc. (tax preparation services from 2004 to 2011); Celgene Corporation (global biotechnology company); Student Loan Corporation (student loan provider from 2008 to 2010); Celgene Corporation (global biotechnology company); The Helios Funds and Brookfield Funds (closed-end funds); Crystal River Capital, Inc. from 2005 to 2010; Parson Brinckerhoff from 1995 to 2008; and Apex Silver Mines Ltd. from 2007 to 2009 | |
|
| Douglas A. Hacker (Born 1955) | |
|
c/o Columbia Management
Investment Advisers, LLC
225 Franklin Street
Boston, MA 02110
Trustee (since 1996) | | Independent business executive since May 2006; Executive Vice President—Strategy of United Airlines from December 2002 to May 2006; President of UAL Loyalty Services (airline marketing company) from September 2001 to December 2002; Executive Vice President and Chief Financial Officer of United Airlines from July 1999 to September 2001. Oversees 43; Nash Finch Company (food distributor); Aircastle Limited (aircraft leasing); and SeaCube Container Leasing Ltd (container leasing) | |
|
| Janet Langford Kelly (Born 1957) | |
|
c/o Columbia Management
Investment Advisers, LLC
225 Franklin Street
Boston, MA 02110
Trustee (since 1996) | | Senior Vice President, General Counsel and Corporate Secretary, ConocoPhillips (integrated energy company) since September 2007; Deputy General Counsel—Corporate Legal Services, ConocoPhillips from August 2006 to August 2007; Partner, Zelle, Hofmann, Voelbel, Mason & Gette LLP (law firm) from March 2005 to July 2006; Adjunct Professor of Law, Northwestern University, from September 2004 to June 2006; Director, UAL Corporation (airline) from February 2006 to July 2006; Oversees 43; None | |
|
| Nancy T. Lukitsh (Born 1956) | |
|
c/o Columbia Management
Investment Advisers, LLC
225 Franklin Street
Boston, MA 02110
Trustee (since 2011) | | Senior Vice President, Partner and Director, Marketing of Wellington Management Company, LLP (investment adviser) from 1997 to 2010; Chair, Wellington Management Investment Portfolios (commingled non-U.S. investment pools) from 2007 to 2010; Director, Wellington Trust Company, NA and other Wellington affiliates from 1997 to 2010. Oversees 43; None | |
|
34
Fund Governance (continued)
Independent Trustees (continued)
Name, Address and Year of Birth,
Position with Funds, Year First
Elected or Appointed to Office | | Principal Occupation(s) During Past Five Years, Number of Funds in Columbia
Funds Complex Overseen by Trustee, Other Directorships Held
| |
| William E. Mayer (Born 1940) | |
|
c/o Columbia Management
Investment Advisers, LLC
225 Franklin Street
Boston, MA 02110
Trustee (since 1994) | | Partner, Park Avenue Equity Partners (private equity) since February 1999; Dean and Professor, College of Business and Management, University of Maryland from 1992 to 1996. Oversees 43; DynaVox Inc. (speech creation); Lee Enterprises (print media); WR Hambrecht + Co. (financial service provider); BlackRock Kelso Capital Corporation (investment company) | |
|
| David M. Moffett (Born 1952) | |
|
c/o Columbia Management
Investment Advisers, LLC
225 Franklin Street
Boston, MA 02110
Trustee (since 2011) | | Retired. Chief Executive Officer, Federal Home Loan Mortgage Corporation, from 2008 to 2009; Senior Adviser, Global Financial Services Group, Carlyle Group, Inc., from 2007 to 2008; Vice Chairman and Chief Financial Officer, U.S. Bancorp, from 1993 to 2007. Oversees 43; CIT Group Inc. (commercial and consumer finance), eBay Inc. (online trading community), MBIA Corp (financial service provider), E.W. Scripps Co. (print and television media), Building Materials Holding Corp. (building materials and construction services), and University of Oklahoma Foundation. | |
|
| Charles R. Nelson (Born 1942) | |
|
c/o Columbia Management
Investment Advisers, LLC
225 Franklin Street
Boston, MA 02110
Trustee (since 1981) | | Retired Professor Emeritus, University of Washington, since 2011; Professor of Economics, University of Washington, from January 1976 to 2011; Ford and Louisa Van Voorhis Professor of Political Economy, University of Washington, from 1993 to 2011; Adjunct Professor of Statistics, University of Washington, from 1980 to 2011; Associate Editor, Journal of Money Credit and Banking from 1993 to 2008; consultant on econometric and statistical matters. Oversees 43; None | |
|
| John J. Neuhauser (Born 1943) | |
|
c/o Columbia Management
Investment Advisers, LLC
225 Franklin Street
Boston, MA 02110
Trustee (since 1984) | | President, Saint Michael's College, since August 2007; Director or Trustee of several non-profit organizations, including Fletcher Allen Health Care, Inc.; University Professor, Boston College from November 2005 to August 2007; Academic Vice President and Dean of Faculties, Boston College from August 1999 to October 2005. Oversees 43; Liberty All-Star Equity Fund and Liberty All-Star Growth Fund (closed-end funds) | |
|
| Patrick J. Simpson (Born 1944) | |
|
c/o Columbia Management
Investment Advisers, LLC
225 Franklin Street
Boston, MA 02110
Trustee (since 2000) | | Partner, Perkins Coie LLP (law firm). Oversees 43; None | |
|
| Anne-Lee Verville (Born 1945) | |
|
c/o Columbia Management
Investment Advisers, LLC
225 Franklin Street
Boston, MA 02110
Trustee (since 1998) | | Retired since 1997 (formerly General Manager–Global Education Industry from 1994 to 1997, President–Application Systems Division from 1991 to 1994, Chief Financial Officer–US Marketing & Services from 1988 to 1991, and Chief Information Officer from 1987 to 1988, IBM Corporation (computer and technology)). Oversees 43; Enesco Group, Inc. (producer of giftware and home and garden decor products) from 2001 to 2006 | |
|
35
Fund Governance (continued)
Interested Trustee
Name, Address and Year of Birth,
Position with Funds, Year First
Elected or Appointed to Office | | Principal Occupation(s) During Past Five Years, Number of Funds in Columbia
Funds Complex Overseen by Trustee, Other Directorships Held
| |
| Michael A. Jones (born 1959) | |
|
c/o Columbia Management
Investment Advisers, LLC
225 Franklin Street
Boston, MA 02110
Trustee (since 2011)
Senior Vice President (since 2011) | | President and Director, Columbia Management Investment Advisers, LLC since May 2010; President and Director, Columbia Management Investment Distributors, Inc. since May 2010; Manager, Chairman, Chief Executive Officer and President, Columbia Management Advisors, LLC from 2007 to April 2010; Chief Executive Officer, President and Director, Columbia Management Distributors, Inc. from November 2006 to April 2010; previously, co-president and senior managing director at Robeco Investment Management. Oversees 43; None | |
|
The Statement of Additional Information includes additional information about the Trustees of the Funds and is available, without charge, upon request by calling 1-800-345-6611.
Officers
| Name, Year of Birth and Address | | Principal Occupation(s) During the Past Five Years | |
| J. Kevin Connaughton (Born 1964) | |
|
225 Franklin Street
Boston, MA 02110
President (since 2009) | | Senior Vice President and General Manager–Mutual Fund Products, Columbia Management Investment Advisers, LLC since May 2010; President, Columbia Funds, since 2009, and RiverSource Funds, since May 2010 (previously Senior Vice President and Chief Financial Officer, Columbia Funds, from June 2008 to January 2009, Treasurer, Columbia Funds, from October 2003 to May 2008, and senior officer of various other affiliated funds since 2000); Managing Director, Columbia Management Advisors, LLC from December 2004 to April 2010. | |
|
| Michael G. Clarke (Born 1969) | |
|
225 Franklin Street
Boston, MA 02110
Treasurer (since 2011) and Chief
Financial Officer (since 2009) | | Vice President, Columbia Management Investment Advisers, LLC since May 2010; Managing Director of Fund Administration, Columbia Management Advisors, LLC, from September 2004 to April 2010; senior officer of Columbia Funds and affiliated funds since 2002. | |
|
| Scott R. Plummer (Born 1959) | |
|
5228 Ameriprise Financial Center
Minneapolis, MN 55474
Senior Vice President, Assistant Secretary
and Chief Legal Officer (since 2010) | | Chief Legal Officer and Assistant Secretary, Columbia Management Investment Advisers, LLC since June 2005; Vice President and Lead Chief Counsel–Asset Management, Ameriprise Financial, Inc. since May 2010 (previously Vice President and Chief Counsel–Asset Management, from 2005 to April 2010, and Vice President–Asset Management Compliance from 2004 to 2005); Vice President, Chief Counsel and Assistant Secretary, Columbia Management Investment Distributors, Inc. since 2008; Vice President, General Counsel and Secretary, Ameriprise Certificate Company since 2005; Chief Counsel, RiverSource Distributors, Inc. since 2006; Vice President, General Counsel and Secretary, RiverSource Funds, since December 2006; Senior Vice President, Secretary and Chief Legal Officer, Columbia Funds, since May 2010. | |
|
36
Fund Governance (continued)
Officers (continued)
| Name, Year of Birth and Address | | Principal Occupation(s) During the Past Five Years | |
| Linda J. Wondrack (Born 1964) | |
|
225 Franklin Street
Boston, MA 02110
Senior Vice President and Chief
Compliance Officer (since 2007) | | Vice President and Chief Compliance Officer, Columbia Management Investment Advisers, LLC since May 2010; Chief Compliance Officer, Columbia Funds, since 2007, and RiverSource Funds, since May 2010; Director (Columbia Management Group, LLC and Investment Product Group Compliance), Bank of America, from June 2005 to April 2010; Director of Corporate Compliance and Conflicts Officer of MFS Investment Management (investment management) from August 2004 to May 2005. | |
|
| William F. Truscott (Born 1960) | |
|
53600 Ameriprise Financial Center
Minneapolis, MN 55474
Senior Vice President (since 2010) | | Chairman of the Board, Columbia Management Investment Advisers, LLC since May 2010 (previously President, Chairman of the Board and Chief Investment Officer, from 2001 to April 2010); Chief Executive Officer, U.S. Asset Management & President, Annuities, Ameriprise Financial, Inc. since May 2010 (previously President–U.S. Asset Management and Chief Investment Officer from 2005 to April 2010, and Senior Vice President—Chief Investment Officer, from 2001 to 2005); Director, President and Chief Executive Officer, Ameriprise Certificate Company since 2006; Director, Columbia Management Investment Distributors, Inc. since May 2010 (previously Chairman of the Board and Chief Executive Officer from 2008 to April 2010); Chairman of the Board and Chief Executive Officer, RiverSource Distributors, Inc. since 2006. | |
|
| Colin Moore (Born 1958) | |
|
225 Franklin Street
Boston, MA 02110
Senior Vice President (since 2010) | | Director and Chief Investment Officer, Columbia Management Investment Advisers, LLC since May 2010; Manager, Managing Director and Chief Investment Officer of Columbia Management Advisors, LLC from 2007 to April 2010; Head of Equities, Columbia Management Advisors, LLC from 2002 to 2007. | |
|
| Amy Johnson (Born 1965) | |
|
5228 Ameriprise Financial Center
Minneapolis, MN 55474
Vice President (since 2010) | | Senior Vice President and Chief Operating Officer, Columbia Management Investment Advisers, LLC since May 2010 (previously Chief Administrative Officer, from 2009 until April 2010, Vice President—Asset Management and Trust Company Services, from 2006 to 2009, and Vice President—Operations and Compliance from 2004 to 2006). | |
|
| Joseph F. DiMaria (Born 1968) | |
|
225 Franklin Street
Boston, MA 02110
Vice President (since 2011) and
Chief Accounting Officer (since 2008) | | Vice President, Mutual Fund Administration, Columbia Management Investment Advisers, LLC, since May 2010; Director of Fund Administration, Columbia Management Advisors, LLC from January 2006 to April 2010; Head of Tax/Compliance and Assistant Treasurer, Columbia Management Advisors, LLC, from November 2004 to December 2005. | |
|
| Stephen T. Welsh (born 1957) | |
|
225 Franklin Street
Boston, MA 02110
Vice President (since 2006) | | President and Director, Columbia Management Investment Services Corp. since May 2010; President and Director, Columbia Management Services, Inc. from July 2004 to April 2010; Managing Director, Columbia Management Distributors, Inc. from August 2007 to April 2010. | |
|
37
Fund Governance (continued)
Officers (continued)
| Name, Year of Birth and Address | | Principal Occupation(s) During the Past Five Years | |
| Paul D. Pearson (born 1956) | |
|
5228 Ameriprise Financial Center
Minneapolis, MN 55474
Vice President and Assistant
Treasurer (since 2011) | | Vice President, Investment Accounting, Columbia Management Investment Advisers, LLC, since May 2010; Vice President, Managed Assets, Investment Accounting, Ameriprise Financial Corporation. | |
|
| Paul B. Goucher (born 1968) | |
|
5228 Ameriprise Financial Center
Minneapolis, MN 55474
Vice President and Assistant
Secretary (since 2010) | | Vice President and Chief Counsel of Ameriprise Financial since January 2010 (formerly Vice President and Group Counsel from November 2008 to January 2010); Director, Managing Director and General Counsel of J. & W. Seligman & Co. Incorporated (Seligman) from July 2008 to November 2008 and Managing Director and Associate General Counsel of Seligman from January 2005 to July 2008. | |
|
| Christopher O. Petersen (born 1970) | |
|
5228 Ameriprise Financial Center
Minneapolis, MN 55474
Vice President (since 2010) and
Secretary (since 2011) | | Vice President and Chief Counsel, Ameriprise Financial since January 2010 (formerly Vice President and Group Counsel or Counsel from April 2004 to January 2010); Assistant Secretary of RiverSource Funds since January 2007. | |
|
| Michael E. DeFao (born 1968) | |
|
5228 Ameriprise Financial Center
Minneapolis, MN 55474
Vice President and Assistant
Secretary (since 2011) | | Vice President and Chief Counsel, Ameriprise Financial since May 2010; Associate General Counsel Bank of America from June 2005 to April 2010 | |
|
38
This page intentionally left blank.
This page intentionally left blank.
Important Information About This Report
The fund mails one shareholder report to each shareholder address. If you would like more than one report, please call shareholder services at 1-800-345-6611 and additional reports will be sent to you. This report has been prepared for shareholders of Columbia Massachusetts Intermediate Municipal Bond Fund.
A description of the policies and procedures that the fund uses to determine how to vote proxies and a copy of the fund's voting records are available (i) at www.columbiamanagement.com, (ii) on the Securities and Exchange Commission's website at www.sec.gov, and (iii) without charge, upon request, by calling 1-800-368-0346. Information regarding how the fund voted proxies relating to portfolio securities during the 12-month period ended June 30 is available from the SEC's website. Information regarding how the fund voted proxies relating to portfolio securities is also available from the fund's website, www.columbiamanagement.com.
The fund files a complete schedule of portfolio holdings with the SEC for the first and third quarters of each fiscal year on Form N-Q. The fund's Form N-Q is available on the SEC's website at www.sec.gov and may be reviewed and copied at the SEC's Public Reference Room in Washington, D.C. Information on the operation of the Public Reference Room may be obtained by calling 1-800-SEC-0330.
Transfer Agent
Columbia Management Investment
Services Corp.
P.O. Box 8081
Boston, MA 02266-8081
1-800-345-6611
Distributor
Columbia Management Investment
Distributors, Inc.
225 Franklin Street
Boston, MA 02110
Investment Manager
Columbia Management Investment Advisers, LLC
225 Franklin Street
Boston, MA 02110
41

Columbia Massachusetts Intermediate Municipal Bond Fund
P. O. Box 8081
Boston, MA 02266-8081
columbiamanagement.com
This information is for use with concurrent or prior delivery of a fund prospectus. Investors should consider the investment objectives, risks, charges and expenses of a mutual fund carefully before investing. For a free prospectus, which contains this and other important information about the funds, visit columbiamanagement.com. Read the prospectus carefully before investing. The Fund is distributed by Columbia Management Investment Distributors, Inc., member FINRA, and managed by Columbia Management Investment Advisers, LLC.
© 2011 Columbia Management Investment Advisers, LLC. All rights reserved.
C-1028 C (12/11)

Columbia New York Intermediate Municipal Bond Fund
Annual Report for the Period Ended October 31, 2011
Not FDIC insured • No bank guarantee • May lose value
Table of Contents
| Fund Profile | | | 1 | | |
|
| Performance Information | | | 2 | | |
|
| Understanding Your Expenses | | | 3 | | |
|
| Portfolio Manager's Report | | | 4 | | |
|
| Portfolio of Investments | | | 6 | | |
|
Statement of Assets and
Liabilities | | | 13 | | |
|
| Statement of Operations | | | 15 | | |
|
Statement of Changes in
Net Assets | | | 16 | | |
|
| Financial Highlights | | | 18 | | |
|
| Notes to Financial Statements | | | 23 | | |
|
Report of Independent Registered
Public Accounting Firm | | | 32 | | |
|
| Federal Income Tax Information | | | 33 | | |
|
| Fund Governance | | | 34 | | |
|
Important Information About
This Report | | | 41 | | |
|
The views expressed in this report reflect the current views of the respective parties. These views are not guarantees of future performance and involve certain risks, uncertainties and assumptions that are difficult to predict, so actual outcomes and results may differ significantly from the views expressed. These views are subject to change at any time based upon economic, market or other conditions and the respective parties disclaim any responsibility to update such views. These views may not be relied on as investment advice and, because investment decisions for a Columbia Fund are based on numerous factors, may not be relied on as an indication of trading intent on behalf of any particular Columbia Fund. References to specific securities should not be construed as a recommendation or investment advice.
President's Message

Dear Shareholders,
Economic momentum slowed in the third quarter of 2011, raising the odds of recession and making the U.S. economy more susceptible to financial shocks. The unemployment rate remained stalled as growing uncertainty continued to weigh on prospective employers. Monthly indicators for the manufacturing and service sectors also showed signs of slowing. Equity and high-yield bond markets fell sharply as investor confidence was shaken by Europe's lingering debt crisis, a heated debate in Washington over fiscal deficits (which eventually led to a downgrade of U.S. government debt) and tepid economic growth. The U.S. stock market experienced its worst quarter in two years during the third quarter of 2011, with volatility and selling pressure reminiscent of the market selloff in 2008, as macro-economic concerns continued to mount.
During its September meeting, the Federal Reserve Board announced that it was prepared to purchase longer term securities and sell shorter term securities in an effort to keep long-term interest rates down. Their hope is that lower long-term borrowing rates will stimulate business investment and hiring. However, the question remains as to whether monetary policy alone will be enough to resuscitate growth in the current environment.
Despite this challenging and volatile economic backdrop, I believe Columbia Management remains strong and steadfast. Columbia Management is the eighth largest manager of long-term mutual fund assets with $325 billion under management as of September 30, 2011. The past year has been one of considerable change for the organization as we worked diligently to align products, services and resources in the integration of Columbia Management with RiverSource Investments. The incredible line-up of talent, resources and capabilities that has resulted is highlighted by the success of our products. As of September 30, 2011, Columbia Management offers 54 funds rated 4 and 5 stars by Morningstar. Additionally, The Wall Street Journal has named two Columbia funds "Category Kings" in its "Investing in Funds: A Quarterly Analysis" issue dated October 5, 2011 in recognition for their one-year performance as of September 30, 2011.
For more information about these and other funds offered by Columbia Management, including detailed, up-to-date fund performance and portfolio information, please visit us online at columbiamanagement.com. Other information and resources available on our website include:
g timely economic analysis and market commentary
g quarterly fund commentaries
g Columbia Management Investor, a quarterly newsletter for shareholders
Thank you for your continued support of the Columbia Funds. We look forward to serving your investment needs for many years to come.
Best Regards,

J. Kevin Connaughton
President, Columbia Funds
All ratings are Class Z as of 9/30/2011. Out of 118 Z-share Columbia funds rated by Morningstar, 8 funds received a 5-star Overall Rating and 46 funds received a 4-star Overall Rating. The Overall Morningstar Rating for a retail mutual fund is derived from a weighted average of the performance figures associated with its 3-, 5- and 10-year (if applicable) Morningstar Rating metrics. For share classes that do not have a 3-, 5-, or 10-year actual performance history, the fund's independent Morningstar Rating metric is then compared against the retail mutual fund universe breakpoints to determine its hypothetical rating.
For each fund with at least a three-year history, Morningstar calculates a Morningstar RatingTM based on a Morningstar Risk-Adjusted Return measure that accounts for variation in a fund's monthly performance (including the effects of sales charges, loads, and redemption fees), placing more emphasis on downward variations and rewarding consistent performance. The top 10% of funds in each category receive 5 stars, the next 22.5% receive 4 stars, the next 35% receive 3 stars, the next 22.5% receive 2 stars and the bottom 10% receive 1 star. (Each share class is counted as a fraction of one fund within this scale and rated separately, which may cause slight variations in the distribution percentages.)
The Morningstar RatingTM is for Class Z shares only; other classes may have different performance characteristics and may have different ratings. © 2011 Morningstar, Inc. All Rights Reserved. The Morningstar information contained herein: (1) is proprietary to Morningstar and/or its content providers; (2) may not be copied or distributed; and (3) is not warranted to be accurate, complete or timely. Neither Morningstar nor its content providers are responsible for any damages or losses arising from any use of this information.
The Wall Street Journal "Category Kings" methodology: Top-performing funds in each category ranked by one-year total returns (changes in net asset values and reinvested distributions) for the period ended September 30, 2011.
Investors should consider the investment objectives, risks, charges and expenses of a mutual fund carefully before investing. For a free prospectus, which contains this and other important information about the funds, visit www.columbiamanagement.com. The prospectus should be read carefully before investing.
Columbia Funds are distributed by Columbia Management Investment Distributors, Inc., member FINRA, and managed by Columbia Management Investment Advisers, LLC.
© 2011 Columbia Management Investment Advisers, LLC. All rights reserved.
Fund Profile – Columbia New York Intermediate Municipal Bond Fund
Summary
g For the 12-month period that ended October 31, 2011, the fund's Class A shares returned 2.99% without sales charge.
g The fund trailed its benchmarks, the Barclays Capital 3-15 Year Blend Municipal Bond Index1 and the Barclays Capital New York 3-15 Year Blend Municipal Bond Index2 and outperformed the average return of funds in its peer group, the Lipper New York Intermediate Municipal Debt Funds Classification.3
g The fund's maturity positioning detracted from performance relative to the benchmarks. Hospital and transportation bonds helped boost returns.
Portfolio Management
Brian M. McGreevy has managed the fund since 1998 and has been associated with the advisor since May 2010. Prior to joining the advisor, Mr. McGreevy was associated with the fund's previous advisor or its predecessors since 1994.
1The Barclays Capital 3-15 Year Blend Municipal Bond Index tracks the performance of municipal bonds issued after December 31, 1990 with remaining maturities between 2 and 17 years and at least $7 million in principal amount outstanding.
2The Barclays Capital New York 3-15 Year Blend Municipal Bond Index tracks the investment grade bonds issued from the state of New York and its municipalities.
3Lipper Inc., a widely respected data provider in the industry, calculates an average total return (assuming reinvestment of distributions) for mutual funds with investment objectives similar to those of the fund. Lipper makes no adjustment for the effect of sales loads.
Indices are not available for investment, are not professionally managed and do not reflect sales charges, fees, brokerage commissions, taxes or other expenses of investing. Securities in the fund may not match those in an index.
Performance data quoted represents past performance and current performance may be lower or higher. Past performance is no guarantee of future results. The investment return and principal value will fluctuate so that shares, when redeemed, may be worth more or less than the original cost. Please visit www.columbiamanagement.com for daily and most recent month-end performance updates.
Summary
1-year return as of 10/31/11
| | | | +2.99% | |
|
|  | | | Class A shares
(without sales charge) | |
|
| | | | +3.89% | |
|
|  | | | Barclays Capital 3-15 Year
Blend Municipal Bond Index | |
|
| | | | +3.66% | |
|
|  | | | Barclays Capital New York 3-15 Year Blend Municipal Bond Index | |
|
1
Performance Information – Columbia New York Intermediate Municipal Bond Fund
Performance data quoted represents past performance and current performance may be lower or higher. Past performance is no guarantee of future results. The investment return and principal value will fluctuate so that shares, when redeemed, may be worth more or less than the original cost. Please visit www.columbiamanagement.com for daily and most recent month-end performance updates.
Performance of a $10,000 investment 11/01/01 – 10/31/11
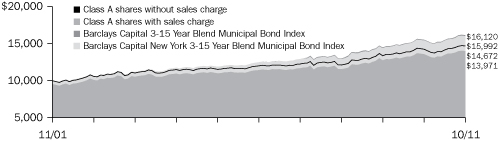
The chart above shows the change in value of a hypothetical $10,000 investment in each Class A shares of Columbia New York Intermediate Municipal Bond Fund during the stated time period, and does not reflect the deduction of taxes that a shareholder may pay on fund distributions or on the redemption of fund shares. The performance of a $10,000 investment with sales charge for Class A shares is calculated with an initial sales charge of 4.75%, which was the effective sales charge prior to August 22, 2005.
Performance of a $10,000 investment 11/01/01 – 10/31/11 ($)
| Sales charge | | without | | with | |
| Class A | | | 14,672 | | | | 13,971 | | |
| Class B | | | 13,620 | | | | 13,620 | | |
| Class C | | | 14,053 | | | | 14,053 | | |
| Class T | | | 14,803 | | | | 14,096 | | |
| Class Z | | | 15,037 | | | | n/a | | |
Average annual total return as of 10/31/11 (%)
| Share class | | A | | B | | C | | T | | Z | |
| Inception | | 11/25/02 | | 11/25/02 | | 11/25/02 | | 12/31/91 | | 12/31/91 | |
| Sales charge | | without | | with | | without | | with | | without | | with | | without | | with | | without | |
| 1-year | | | 2.99 | | | | –0.37 | | | | 2.23 | | | | –0.76 | | | | 2.57 | | | | 1.58 | | | | 3.09 | | | | –1.84 | | | | 3.24 | | |
| 5-year | | | 4.12 | | | | 3.44 | | | | 3.35 | | | | 3.35 | | | | 3.71 | | | | 3.71 | | | | 4.23 | | | | 3.23 | | | | 4.39 | | |
| 10-year | | | 3.91 | | | | 3.40 | | | | 3.14 | | | | 3.14 | | | | 3.46 | | | | 3.46 | | | | 4.00 | | | | 3.49 | | | | 4.16 | | |
The "with sales charge" returns include the maximum initial sales charge of 3.25% for Class A shares (for the 1-year and 5-year periods), 4.75% for Class A shares (for the 10-year period) and 4.75% for Class T shares, respectively and the applicable contingent deferred sales charge of 3.00% in the first year, declining to 1.00% in the fourth year, and eliminated thereafter for Class B shares and 1.00% for Class C shares for the first year only. The "without sales charge" returns do not include the effect of sales charges. If they had, returns would be lower.
Prior to August 22, 2005, new purchases of Class A shares had a maximum initial sales charge of 4.75%.
Performance results reflect any fee waivers or reimbursements of fund expenses by the Investment Manager and/or any of its affiliates. Absent these fee waivers or expense reimbursement arrangements, performance results would have been lower.
All results shown assume reinvestment of distributions. Class Z shares are sold at net asset value with no distribution and service (Rule 12b-1) fees. Class Z shares have limited eligibility and the investment minimum requirements may vary. Please see the fund's prospectuses for details. Performance for different share classes will vary based on differences in sales charges and fees associated with each class.
The tables do not reflect the deduction of taxes that a shareholder may pay on fund distributions or on the redemption of fund shares.
Class A, Class B, Class C, Class T and Class Z share performance information includes returns of Retail A shares (for Class A and Class T shares), Retail B shares (for Class B and Class C shares) and Trust shares (for Class Z shares) of Galaxy New York Municipal Bond Fund, the predecessor to the Fund and a series of The Galaxy Fund (the "Galaxy New York Fund"), for periods prior to November 25, 2002, the date on which Class A, Class B, Class C, Class T and Class Z shares were initially offered by the Fund. The returns shown for Class B and Class C shares also include the returns for Retail A shares for periods prior to March 1, 2001, the date on which Retail B shares were initially offered by the Galaxy New York Fund. The returns shown for all share classes reflect any differences in sales charges, but no returns have been restated to reflect any differences in expenses such as distribution and service (Rule 12b-1) fees between any predecessor share class and the corresponding newer share class. If differences in expenses had been reflected, the returns shown for periods prior to November 25, 2002 would be lower for Class B and Class C shares.
2
Understanding Your Expenses – Columbia New York Intermediate Municipal Bond Fund
As a shareholder, you incur two types of costs. There are transaction costs, which generally include sales charges on purchases and may include redemption fees. There are also ongoing costs, which generally include management fees, distribution and service (Rule 12b-1) fees, and other fund expenses. The following information is intended to help you understand your ongoing costs (in dollars) of investing in the Fund and to compare these costs with the ongoing costs of investing in other mutual funds.
Analyzing your fund's expenses
To illustrate these ongoing costs, we provided examples and calculated the expenses paid by investors in each share class of the Fund during the period. The information in the table is based on an initial investment of $1,000 at the beginning of the period indicated and held for the entire period. Expense information is calculated two ways and each method provides you with different information. The amount listed in the "Actual" column is calculated using the Fund's actual operating expenses and total return for the period. You may use the Actual information, together with the amount invested, to estimate the expenses that you paid over the period. Simply divide your account value by $1,000 (for example, an $8,600 account value divided by $1,000 = 8.6), then multiply the results by the expenses paid during the period under the Actual column. The amount listed in the "Hypothetical" column assumes a 5% annual rate of return before expenses (which is not the Fund's actual return) and then applies the Fund's actual expense ratio for the period to the hypothetical return. You should not use the hypothetical account values and expenses to estimate either your actual account balance at the end of the period or the expenses you paid during the period. See the "Compare with other funds" information with details on using the hypothetical data.
Compare with other funds
Since all mutual funds are required to include the same hypothetical calculations about expenses in shareholder reports, you can use this information to compare the ongoing cost of investing in the Fund with other funds. To do so, compare the hypothetical example with the 5% hypothetical examples that appear in the shareholder reports of other funds. As you compare hypothetical examples of other funds, it is important to note that hypothetical examples are meant to highlight the ongoing costs of investing in a fund only and do not reflect any transaction costs, such as sales charges, or redemption or exchange fees. Therefore, the hypothetical calculations are useful in comparing ongoing costs only, and will not help you determine the relative total costs of owning different funds. If transaction costs were included in these calculations, your costs would have been higher.
05/01/11 – 10/31/11
| | | Account value at the
beginning of the period ($) | | Account value at the
end of the period ($) | | Expenses paid
during the period ($) | | Fund's annualized
expense ratio (%) | |
| | | Actual | | Hypothetical | | Actual | | Hypothetical | | Actual | | Hypothetical | | Actual | |
| Class A | | | 1,000.00 | | | | 1,000.00 | | | | 1,038.60 | | | | 1,021.48 | | | | 3.80 | | | | 3.77 | | | | 0.74 | | |
| Class B | | | 1,000.00 | | | | 1,000.00 | | | | 1,034.80 | | | | 1,017.64 | | | | 7.69 | | | | 7.63 | | | | 1.50 | | |
| Class C | | | 1,000.00 | | | | 1,000.00 | | | | 1,036.40 | | | | 1,019.46 | | | | 5.85 | | | | 5.80 | | | | 1.14 | | |
| Class T | | | 1,000.00 | | | | 1,000.00 | | | | 1,039.10 | | | | 1,021.93 | | | | 3.34 | | | | 3.31 | | | | 0.65 | | |
| Class Z | | | 1,000.00 | | | | 1,000.00 | | | | 1,039.80 | | | | 1,022.68 | | | | 2.57 | | | | 2.55 | | | | 0.50 | | |
Expenses paid during the period are equal to the annualized expense ratio for each class as indicated above, multiplied by the average account value over the period and then multiplied by the number of days in the Fund's most recent fiscal half year and divided by 365.
Expenses do not include fees and expenses incurred indirectly by the Fund from the underlying funds in which the Fund may invest (also referred to as "acquired funds"), including affiliated and non-affiliated pooled investments vehicles (including mutual funds and exchange traded funds).
Had Columbia Management Investment Advisers, LLC and/or certain of its affiliates not waived/reimbursed certain fees and expenses, account value at the end of the period would have been reduced.
3
Portfolio Manager's Report – Columbia New York Intermediate Municipal Bond Fund
Performance data quoted represents past performance and current performance may be lower or higher. Past performance is no guarantee of future results. The investment return and principal value will fluctuate so that shares, when redeemed, may be worth more or less than the original cost. Please visit www.columbiamanagement.com for daily and most recent month-end performance updates.
Net asset value per share
as of 10/31/11 ($)
| Class A | | | 12.10 | | |
| Class B | | | 12.10 | | |
| Class C | | | 12.10 | | |
| Class T | | | 12.10 | | |
| Class Z | | | 12.10 | | |
Distributions declared per share
11/01/10 – 10/31/11 ($)
| Class A | | | 0.39 | | |
| Class B | | | 0.30 | | |
| Class C | | | 0.34 | | |
| Class T | | | 0.40 | | |
| Class Z | | | 0.42 | | |
A portion of the fund's income may be subject to the alternative minimum tax. The fund may at times purchase tax-exempt securities at a discount. Some or all, of this discount may be included in the fund's ordinary income, and is taxable when distributed.
30-day SEC yields
as of 10/31/11 (%)
| Class A | | | 2.00 | | |
| Class B | | | 1.31 | | |
| Class C | | | 1.66 | | |
| Class T | | | 2.05 | | |
| Class Z | | | 2.30 | | |
The 30-day SEC yields reflect the fund's earning power, net of expenses, expressed as an annualized percentage of the public offering price at the end of the period. Had the investment advisor and/or any of its affiliates not waived fees or reimbursed a portion of expenses, the 30-day SEC yields would have been lower.
For the 12-month period that ended October 31, 2011, the fund's Class A shares returned 2.99% without sales charge. The fund's benchmarks, the Barclays Capital 3-15 Year Blend Municipal Bond Index and the Barclays Capital New York 3-15 Year Blend Municipal Bond Index, returned 3.89% and 3.66%, respectively. The average return of funds in its peer group, the Lipper New York Intermediate Municipal Debt Funds Classification was 2.58%. The fund's duration—a measure of interest rate sensitivity—was the most significant detractor from performance. The fund had more exposure to shorter-maturity bonds than the New York index and a larger-than-normal cash equivalent position in the first half of 2011.
States, municipalities combat budget woes
Early in the year, demand for tax-advantaged municipal bonds suffered as credit quality came into question and some market analysts forecast widespread defaults. However, default levels in the investment-grade universe were small, and the outflows from mutual funds abated in the spring of 2011. In addition, prudent steps taken by state and local governments to restrain spending and balance budgets bolstered investor confidence. Tax revenues also strengthened as the economy stabilized.
Fund positioning drove results
The fund's duration, or sensitivity to interest rate changes, was longer than that of its benchmarks, which detracted from performance when rates began to climb. We reduced duration early in 2011 by selling bonds with 10-year maturities but did not benefit from the move as these bonds performed well over the balance of the year. As the 12-month period wound down, the fund's credit profile was similar to that of the national index but somewhat heavier in the A and BBB4 categories compared to its New York benchmark.
As rating agencies downgraded Nassau County and placed it on negative watch, anticipating further budget struggles, the fund's holdings in this county's bonds were a drag on performance. An overweight in pre-refunded bonds relative to the benchmark also hampered performance. Pre-refunding occurs when an issuer sells a new bond at a lower rate and invests the proceeds in short-term government securities until it can call or pay off the old, higher-rate or pre-refunded bond. The shorter maturity and higher quality of these issues, though positive qualities in and of themselves, were out of step with the outperformance of longer-maturity and lower quality bonds during the period. In general, the fund's shorter-term holdings lagged their index counterparts. We also maintained extra cash early in 2011 in the event that skittish markets might lead to cash outflows. However, this tactic did not pay off as outflows fell within normal levels.
By contrast, an overweight and security selection aided performance in the hospital sector, where the fund outdistanced index results. Transportation-related bonds also did well. During the period we bolstered holdings in the hospital sector by adding bonds in the 10- to 15-year range and A rated names in the eight- to 10-year segment. We also increased the fund's exposure to transportation issues.
4Ratings are relative and subjective and are not absolute standards of quality. The credit ratings typically range from AAA (highest) to D (lowest), and are subject to change. The credit quality of the fund's investments does not remove market risk.
4
Portfolio Manager's Report (continued) – Columbia New York Intermediate Municipal Bond Fund
New York's recovery faces challenges
New York's economic recovery has been among the strongest in the Northeast. Statewide employment has rebounded to within two percent of pre-recession levels and job levels in most industries have held up well. Public sector employment has stabilized following large layoffs at the state and local levels. However, jobs in the important financial sector are under pressure due to cost-cutting at major financial institutions. Manufacturing exports to Europe are sluggish, as the Continent faces a series of crises, and tourism from Canada has fallen off due to that country's slowdown. As a result, job growth is likely to be meager for the next several quarters. But longer-term prospects for the state appear more favorable thanks to its highly educated workforce and its central place in the global financial system.
Looking ahead
We plan to decrease the fund's exposure to the very shortest maturities in the intermediate-maturity universe, where we believe that opportunities are limited because the Federal Reserve Board has stated that it will keep short-term rates low for a considerable period of time. In addition, we plan to increase exposure to seven- to 12-year issues, where we see better opportunities, and we will rely on our strong research capability to help us find value in single A and BBB rated bonds.
Portfolio characteristics and holdings are subject to change periodically and may not be representative of current characteristics and holdings. The outlook for this fund may differ from that presented for other Columbia Funds.
Tax-exempt investing offers current tax-exempt income, but it also involves certain risks. The value of the fund will be affected by interest rate changes and the creditworthiness of issues held in the fund. When interest rates go up, bond prices generally drop and vice versa. Interest income from certain tax-exempt bonds may be subject to certain state and local taxes and, if applicable, the alternative minimum tax. Any capital gains distributed are taxable to the investor.
The fund is non-diversified, which generally means that it may invest a greater percentage of its total assets in the securities of fewer issuers than a "diversified" fund. This increases the risk that a change in the value of any one investment held by the fund could affect the overall value of the fund more than it would affect that of a diversified fund holding a greater number of investments. Accordingly, the fund's value will likely be more volatile than the value of more diversified funds.
Single-state municipal bond funds pose additional risks due to limited geographical diversification.
Taxable-equivalent SEC yields
as of 10/31/11 (%)
| Class A | | | 3.08 | | |
| Class B | | | 2.02 | | |
| Class C | | | 2.55 | | |
| Class T | | | 3.15 | | |
| Class Z | | | 3.54 | | |
Taxable-equivalent SEC yields are calculated assuming a federal income tax rate of 35.0%. This tax rate does not reflect the phase out of exemptions or the reduction of the otherwise allowable deductions that occur when adjusted gross income exceeds certain levels. Your taxable-equivalent yield may be different depending on your tax bracket.
Quality breakdown
as of 10/31/11 (%)
| AAA | | | 18.0 | | |
| AA | | | 49.9 | | |
| A | | | 21.1 | | |
| BBB | | | 9.6 | | |
| BB | | | 0.8 | | |
| Non-Rated | | | 0.6 | | |
Maturity breakdown
as of 10/31/11 (%)
| 0-1 year | | | 4.2 | | |
| 1-3 years | | | 7.8 | | |
| 3-5 years | | | 11.3 | | |
| 5-7 years | | | 8.8 | | |
| 7-10 years | | | 20.8 | | |
| 10-15 years | | | 31.4 | | |
| 15-20 years | | | 10.6 | | |
| 20-25 years | | | 0.6 | | |
| Cash Equivalents | | | 4.5 | | |
Ratings shown in the quality breakdown are assigned to individual bonds by taking the lower of the ratings available from one of the following nationally recognized rating agencies: Standard & Poor's or Moody's Investor Services. If a security is rated by only one of the two agencies, that rating is used. If a security is not rated by either of the two agencies, it is designated as Non-Rated. Ratings are relative and subjective and are not absolute standards of quality. The credit quality of the fund's investments does not remove market risk.
The fund is actively managed and the composition of its portfolio will change over time. Information provided is calculated as a percentage of net assets.
5
Portfolio of Investments – Columbia New York Intermediate Municipal Bond Fund
October 31, 2011
(Percentages represent value of investments compared to net assets)
Issue
Description | | Coupon
Rate | | Principal
Amount | | Value | |
| Municipal Bonds 94.6% | |
| Advanced Refunded 11.2% | |
City of New York
Prerefunded 06/01/13 Unlimited General Obligation Bonds
Series 2003J | |
| 06/01/16 | | | 5.500 | % | | $ | 1,250,000 | | | $ | 1,350,988 | | |
Elizabeth Forward School District
Unlimited General Obligation Bonds
Capital Appreciation
Series 1994B Escrowed to Maturity (NPFGC)(a) | |
| 09/01/20 | | | 0.000 | % | | | 2,210,000 | | | | 1,729,612 | | |
Long Island Power Authority
Revenue Bonds
General
Series 1998A Escrowed to Maturity (AGM) | |
| 12/01/13 | | | 5.500 | % | | | 2,000,000 | | | | 2,207,700 | | |
| 12/01/14 | | | 5.250 | % | | | 5,000,000 | | | | 5,692,200 | | |
Metropolitan Transportation Authority
Prerefunded 07/01/13 Revenue Bonds
Service Contract
Series 1997-8 (AGM) | |
| 07/01/21 | | | 5.375 | % | | | 3,000,000 | | | | 3,249,240 | | |
Prerefunded 10/01/15 Revenue Bonds
Series 1998A (FGIC) | |
| 04/01/23 | | | 5.000 | % | | | 2,000,000 | | | | 2,314,440 | | |
New York City Municipal Water Finance Authority
Prerefunded 06/15/12 Revenue Bonds
Series 2002A (AGM) | |
| 06/15/16 | | | 5.375 | % | | | 5,000,000 | | | | 5,159,350 | | |
New York City Transitional Finance Authority
Prerefunded 08/01/13 Revenue Bonds
Future Tax Secured
Series 2003 | |
| 08/01/17 | | | 5.250 | % | | | 2,000,000 | | | | 2,168,980 | | |
New York State Dormitory Authority
Revenue Bonds
Capital Appreciation-Memorial Sloan Center
Series 2003-1 Escrowed to Maturity (NPFGC)(a) | |
| 07/01/25 | | | 0.000 | % | | | 3,750,000 | | | | 2,459,587 | | |
New York State Thruway Authority
Prerefunded 04/01/13 Revenue Bonds
Series 2003A (NPFGC) | |
| 04/01/17 | | | 5.250 | % | | | 1,750,000 | | | | 1,870,803 | | |
Puerto Rico Highway & Transportation Authority
Prerefunded Revenue Bonds
Series 2005BB (AGM) Escrowed to Maturity(b) | |
| 07/01/22 | | | 5.250 | % | | | 355,000 | | | | 441,382 | | |
Triborough Bridge & Tunnel Authority
Prerefunded 01/01/22 Revenue Bonds
General Purpose
Series 1999B | |
| 01/01/30 | | | 5.500 | % | | | 2,000,000 | | | | 2,535,640 | | |
Revenue Bonds
General Purpose
Series 1992Y Escrowed to Maturity | |
| 01/01/17 | | | 5.500 | % | | | 2,000,000 | | | | 2,259,380 | | |
| Total | | | 33,439,302 | | |
Issue
Description | | Coupon
Rate | | Principal
Amount | | Value | |
| Municipal Bonds (continued) | |
| City 1.1% | |
County of Monroe
Unlimited General Obligation Bonds
Series 2009A (AGM) | |
| 06/01/14 | | | 5.000 | % | | $ | 3,000,000 | | | $ | 3,307,440 | | |
| College 9.8% | |
New York State Dormitory Authority
Revenue Bonds
Barnard College
Series 2007A (NPFGC/FGIC) | |
| 07/01/18 | | | 5.000 | % | | | 1,745,000 | | | | 1,990,940 | | |
Cornell University
Series 2006A | |
| 07/01/21 | | | 5.000 | % | | | 2,350,000 | | | | 2,651,270 | | |
| Series 2009A | |
| 07/01/25 | | | 5.000 | % | | | 1,000,000 | | | | 1,136,400 | | |
Mount Sinai School of Medicine
Series 2009 | |
| 07/01/27 | | | 5.500 | % | | | 4,000,000 | | | | 4,318,560 | | |
New York University
Series 1998A (NPFGC) | |
| 07/01/17 | | | 6.000 | % | | | 2,475,000 | | | | 2,994,676 | | |
| 07/01/20 | | | 5.750 | % | | | 2,000,000 | | | | 2,460,660 | | |
| Series 2001-1 (AMBAC) | |
| 07/01/15 | | | 5.500 | % | | | 1,205,000 | | | | 1,381,424 | | |
| Series 2001-2 (AMBAC) | |
| 07/01/21 | | | 5.500 | % | | | 900,000 | | | | 903,357 | | |
| Series 2001A (AMBAC) | |
| 07/01/12 | | | 5.750 | % | | | 2,500,000 | | | | 2,589,975 | | |
Rochester Institute of Technology
Series 2010 | |
| 07/01/21 | | | 5.000 | % | | | 1,000,000 | | | | 1,139,320 | | |
Teachers College
Series 2009 | |
| 03/01/24 | | | 5.000 | % | | | 1,000,000 | | | | 1,094,070 | | |
New York State Dormitory Authority(c)
Revenue Bonds
State University Educational Facilities
Series 2002B (AMBAC) | |
| 11/15/26 | | | 5.250 | % | | | 1,500,000 | | | | 1,537,350 | | |
Oneida County Industrial Development Agency(a)
Revenue Bonds
Hamilton College Project
Series 2007A (NPFGC) | |
| 07/01/18 | | | 0.000 | % | | | 1,000,000 | | | | 839,810 | | |
| 07/01/20 | | | 0.000 | % | | | 1,000,000 | | | | 747,510 | | |
St. Lawrence County Industrial Development Agency
Revenue Bonds
St. Lawrence University
Series 2009A | |
| 10/01/16 | | | 5.000 | % | | | 3,000,000 | | | | 3,384,150 | | |
| Total | | | 29,169,472 | | |
| County 0.4% | |
County of Albany
Unlimited General Obligation Bonds
Series 2006 (XLCA) | |
| 09/15/20 | | | 4.125 | % | | | 1,000,000 | | | | 1,067,830 | | |
The Accompanying Notes to Financial Statements are an integral part of this statement.
6
Columbia New York Intermediate Municipal Bond Fund
October 31, 2011
(Percentages represent value of investments compared to net assets)
Issue
Description | | Coupon
Rate | | Principal
Amount | | Value | |
| Municipal Bonds (continued) | |
| Electric 3.5% | |
Long Island Power Authority
Revenue Bonds
General
Series 2011A | |
| 05/01/21 | | | 5.000 | % | | $ | 1,000,000 | | | $ | 1,142,400 | | |
| Series 2009A | |
| 04/01/21 | | | 5.250 | % | | | 1,000,000 | | | | 1,141,810 | | |
| 04/01/22 | | | 5.500 | % | | | 3,000,000 | | | | 3,445,440 | | |
New York State Energy Research & Development
Authority
Revenue Bonds
Rochester Gas & Electric Corp.
Series 2004A (NPFGC)(c) | |
| 05/15/32 | | | 4.750 | % | | | 2,650,000 | | | | 2,870,268 | | |
Puerto Rico Electric Power Authority
Refunding Revenue Bonds
Series 2010ZZ(b) | |
| 07/01/24 | | | 5.250 | % | | | 1,620,000 | | | | 1,716,439 | | |
| Total | | | 10,316,357 | | |
| Health Care - Hospital 9.0% | |
Albany Industrial Development Agency
Revenue Bonds
St. Peters Hospital Project
Series 2008A | |
| 11/15/22 | | | 5.750 | % | | | 500,000 | | | | 528,065 | | |
| 11/15/27 | | | 5.250 | % | | | 1,000,000 | | | | 987,180 | | |
| Series 2008E | |
| 11/15/22 | | | 5.250 | % | | | 500,000 | | | | 515,045 | | |
Monroe County Industrial Development Agency
Refunding Revenue Bonds
Highland Hospital of Rochester
Series 2005 | |
| 08/01/22 | | | 5.000 | % | | | 700,000 | | | | 718,102 | | |
New York State Dormitory Authority
Revenue Bonds
Long Island Jewish Obligated Group
Series 2006A | |
| 11/01/19 | | | 5.000 | % | | | 1,000,000 | | | | 1,074,810 | | |
Mount Sinai Hospital
Series 2010A | |
| 07/01/26 | | | 5.000 | % | | | 1,725,000 | | | | 1,773,748 | | |
| Series 2011A | |
| 07/01/31 | | | 5.000 | % | | | 2,000,000 | | | | 2,007,480 | | |
Mount Sinai School of Medicine
Series 2010A | |
| 07/01/21 | | | 5.000 | % | | | 1,000,000 | | | | 1,113,630 | | |
New York Methodist Hospital
Series 2004 | |
| 07/01/24 | | | 5.250 | % | | | 1,000,000 | | | | 1,015,700 | | |
New York University Hospital Center
Series 2006A | |
| 07/01/20 | | | 5.000 | % | | | 3,000,000 | | | | 3,164,280 | | |
| Series 2011A | |
| 07/01/23 | | | 5.125 | % | | | 1,000,000 | | | | 1,042,920 | | |
North Shore-Long Island Jewish Health
Series 2009A | |
| 05/01/30 | | | 5.250 | % | | | 4,000,000 | | | | 4,097,080 | | |
Issue
Description | | Coupon
Rate | | Principal
Amount | | Value | |
| Municipal Bonds (continued) | |
| Health Care - Hospital (cont.) | |
Orange Regional Medical Center
Series 2008 | |
| 12/01/29 | | | 6.125 | % | | $ | 1,350,000 | | | $ | 1,355,441 | | |
Presbyterian Hospital
Series 2007 (AGM) | |
| 08/15/23 | | | 5.250 | % | | | 250,000 | | | | 269,380 | | |
United Health Services Hospitals
Series 2009 (FHA) | |
| 08/01/18 | | | 4.500 | % | | | 1,000,000 | | | | 1,077,340 | | |
White Plains Hospital
Series 2004 (FHA) | |
| 02/15/18 | | | 4.625 | % | | | 400,000 | | | | 419,592 | | |
Saratoga County Industrial Development Agency
Revenue Bonds
Saratoga Hospital Project
Series 2004A | |
| 12/01/13 | | | 5.000 | % | | | 485,000 | | | | 513,086 | | |
| Series 2007B | |
| 12/01/22 | | | 5.000 | % | | | 500,000 | | | | 517,055 | | |
| 12/01/27 | | | 5.125 | % | | | 500,000 | | | | 500,105 | | |
Westchester County Healthcare Corp.
Revenue Bonds
Senior Lien
Series 2000A | |
| 11/01/25 | | | 5.875 | % | | | 4,300,000 | | | | 4,301,677 | | |
| Total | | | 26,991,716 | | |
| Health Care - Life Care Center 0.1% | |
Suffolk County Industrial Development Agency
Refunding Revenue Bonds
Jeffersons Ferry Project
Series 2006 | |
| 11/01/28 | | | 5.000 | % | | | 335,000 | | | | 314,190 | | |
| Health Care - Nursing Home 1.4% | |
Amherst Industrial Development Agency
Revenue Bonds
Beechwood Health Care Center, Inc.
Series 2007 | |
| 01/01/13 | | | 4.875 | % | | | 180,000 | | | | 179,539 | | |
Rensselaer Municipal Leasing Corp.
Revenue Bonds
Rensselaer County Nursing Home
Series 2009A | |
| 06/01/19 | | | 5.000 | % | | | 4,000,000 | | | | 4,137,160 | | |
| Total | | | 4,316,699 | | |
| Housing - Multi-Family 1.3% | |
New York State Dormitory Authority
Revenue Bonds
Residential Institution for Children
Series 2008-A1 | |
| 06/01/33 | | | 5.000 | % | | | 1,700,000 | | | | 1,788,434 | | |
Puerto Rico Housing Finance Authority
Subordinated Revenue Bonds
Capital Fund Modernization
Series 2008(b) | |
| 12/01/13 | | | 5.000 | % | | | 2,000,000 | | | | 2,110,280 | | |
| Total | | | 3,898,714 | | |
The Accompanying Notes to Financial Statements are an integral part of this statement.
7
Columbia New York Intermediate Municipal Bond Fund
October 31, 2011
(Percentages represent value of investments compared to net assets)
Issue
Description | | Coupon
Rate | | Principal
Amount | | Value | |
| Municipal Bonds (continued) | |
| Housing - Single Family 0.4% | |
New York Mortgage Agency
Revenue Bonds
Homeowner Mortgage
Series 2000-96 | |
| 10/01/14 | | | 5.200 | % | | $ | 270,000 | | | $ | 272,695 | | |
| Series 2005-128 | |
| 10/01/16 | | | 4.350 | % | | | 1,000,000 | | | | 1,060,040 | | |
| Total | | | 1,332,735 | | |
| Lease 7.9% | |
Erie County Industrial Development Agency (The)
Revenue Bonds
City School District of Buffalo Project
Series 2008A (AGM) | |
| 05/01/18 | | | 5.000 | % | | | 1,000,000 | | | | 1,156,720 | | |
New York State Dormitory Authority
Refunding Revenue Bonds
Consolidated Service Contract
Series 2009A | |
| 07/01/24 | | | 5.000 | % | | | 3,000,000 | | | | 3,288,540 | | |
Revenue Bonds
Municipal Health Facilities
Subordinated Series 2001-2 | |
| 01/15/21 | | | 5.000 | % | | | 2,500,000 | | | | 2,770,025 | | |
Schools Program
Series 2000 | |
| 07/01/20 | | | 6.250 | % | | | 1,685,000 | | | | 1,692,785 | | |
| Series 2009 | |
| 02/15/18 | | | 5.500 | % | | | 1,000,000 | | | | 1,192,790 | | |
State University Educational Facilities
3rd General Series 2005A (NPFGC/FGIC) | |
| 05/15/21 | | | 5.500 | % | | | 1,000,000 | | | | 1,211,860 | | |
| Series 1993A | |
| 05/15/15 | | | 5.250 | % | | | 2,000,000 | | | | 2,195,260 | | |
| 05/15/19 | | | 5.500 | % | | | 2,500,000 | | | | 2,911,225 | | |
| Series 2000C (AGM) | |
| 05/15/17 | | | 5.750 | % | | | 1,250,000 | | | | 1,487,888 | | |
New York State Urban Development Corp.
Refunding Revenue Bonds
Service Contract
Series 2008B | |
| 01/01/26 | | | 5.000 | % | | | 3,125,000 | | | | 3,349,562 | | |
| Series 2008C | |
| 01/01/22 | | | 5.000 | % | | | 2,000,000 | | | | 2,218,300 | | |
| Total | | | 23,474,955 | | |
| Miscellaneous 14.0% | |
Metropolitan Transportation Authority
Revenue Bonds
Series 2005B (AMBAC) | |
| 11/15/24 | | | 5.250 | % | | | 750,000 | | | | 858,825 | | |
| Series 2006 (CIFG/TCRS) | |
| 11/15/22 | | | 5.000 | % | | | 2,280,000 | | | | 2,445,528 | | |
| Series 2006B | |
| 11/15/16 | | | 5.000 | % | | | 1,500,000 | | | | 1,701,030 | | |
| Series 2007B | |
| 11/15/22 | | | 5.000 | % | | | 1,500,000 | | | | 1,628,385 | | |
| Series 2008C | |
| 11/15/23 | | | 6.250 | % | | | 3,570,000 | | | | 4,202,604 | | |
| Series 2010D | |
| 11/15/28 | | | 5.250 | % | | | 3,000,000 | | | | 3,232,500 | | |
Issue
Description | | Coupon
Rate | | Principal
Amount | | Value | |
| Municipal Bonds (continued) | |
| Miscellaneous (cont.) | |
Metropolitan Transportation Authority(c)
Revenue Bonds
Mandatory Tender
Series 2008B | |
| 11/15/30 | | | 5.000 | % | | $ | 1,000,000 | | | $ | 1,108,780 | | |
New York City Industrial Development Agency
Revenue Bonds
Pilot -Yankee Stadium
Series 2006 (NPFGC) | |
| 03/01/15 | | | 5.000 | % | | | 1,150,000 | | | | 1,257,916 | | |
United Jewish Appeal Federal Project
Series 2004A | |
| 07/01/27 | | | 5.000 | % | | | 625,000 | | | | 661,556 | | |
YMCA of Greater New York Project
Series 2006 | |
| 08/01/26 | | | 5.000 | % | | | 1,000,000 | | | | 1,026,260 | | |
New York City Trust for Cultural Resources
Refunding Revenue Bonds
Museum of Modern Art
Series 2008-1A | |
| 04/01/26 | | | 5.000 | % | | | 4,850,000 | | | | 5,305,803 | | |
New York Municipal Bond Bank Agency
Revenue Bonds
Series 2003C | |
| 12/01/21 | | | 5.250 | % | | | 3,330,000 | | | | 3,517,446 | | |
| Subordinated Series 2009C-1 | |
| 02/15/18 | | | 5.000 | % | | | 3,000,000 | | | | 3,435,720 | | |
New York State Dormitory Authority
Revenue Bonds
School District Financing Program
Series 2008A (AGM) | |
| 10/01/23 | | | 5.000 | % | | | 3,000,000 | | | | 3,318,870 | | |
School Districts-Financing Program
Series 2009C (AGM) | |
| 10/01/22 | | | 5.000 | % | | | 3,000,000 | | | | 3,326,670 | | |
New York State Environmental Facilities Corp.
Revenue Bonds
Revolving Funds-Municipal Water
Series 2008B | |
| 06/15/21 | | | 5.000 | % | | | 3,000,000 | | | | 3,418,500 | | |
Suffolk Tobacco Asset Securitization Corp.
Revenue Bonds
Turbo
Series 2008B | |
| 06/01/28 | | | 5.375 | % | | | 1,150,000 | | | | 955,431 | | |
Westchester County Industrial Development Agency
Revenue Bonds
Guiding Eyes for the Blind
Series 2004 | |
| 08/01/24 | | | 5.375 | % | | | 500,000 | | | | 509,705 | | |
| Total | | | 41,911,529 | | |
| Port District 1.7% | |
Port Authority of New York & New Jersey
Revenue Bonds
Consolidated 135th
Series 2004 (XLCA) | |
| 09/15/28 | | | 5.000 | % | | | 1,500,000 | | | | 1,558,275 | | |
The Accompanying Notes to Financial Statements are an integral part of this statement.
8
Columbia New York Intermediate Municipal Bond Fund
October 31, 2011
(Percentages represent value of investments compared to net assets)
Issue
Description | | Coupon
Rate | | Principal
Amount | | Value | |
| Municipal Bonds (continued) | |
| Port District (cont.) | |
Consolidated 161st
Series 2009 | |
| 10/15/31 | | | 5.000 | % | | $ | 3,390,000 | | | $ | 3,652,488 | | |
| Total | | | 5,210,763 | | |
| Resource Recovery 2.0% | |
Babylon Industrial Development Agency
Revenue Bonds
Covanta Babylon, Inc.
Series 2009A | |
| 01/01/18 | | | 5.000 | % | | | 3,500,000 | | | | 3,924,760 | | |
Oneida-Herkimer Solid Waste Management Authority
Revenue Bonds
Series 2011 | |
| 04/01/19 | | | 5.000 | % | | | 830,000 | | | | 930,422 | | |
| 04/01/20 | | | 5.000 | % | | | 870,000 | | | | 965,943 | | |
| Total | | | 5,821,125 | | |
| Sales or Use Tax 15.3% | |
Metropolitan Transportation Authority
Revenue Bonds
Series 2004A (NPFGC/FGIC) | |
| 11/15/18 | | | 5.250 | % | | | 800,000 | | | | 955,424 | | |
Nassau County Interim Finance Authority
Revenue Bonds
Sales Tax Secured
Series 2004H (AMBAC) | |
| 11/15/15 | | | 5.250 | % | | | 5,000,000 | | | | 5,611,250 | | |
New York City Transitional Finance Authority
Refunding Revenue Bonds
Future Tax Secured
Senior Series 2005A-1 | |
| 11/01/19 | | | 5.000 | % | | | 3,000,000 | | | | 3,362,610 | | |
Revenue Bonds
Future Tax Secured
Series 2009A | |
| 05/01/27 | | | 5.000 | % | | | 5,000,000 | | | | 5,484,050 | | |
| Series 2007S-2 (NPFGC/FGIC) | |
| 01/15/21 | | | 5.000 | % | | | 4,300,000 | | | | 4,772,054 | | |
New York Local Government Assistance Corp.
Refunding Revenue Bonds
Series 1993E | |
| 04/01/14 | | | 6.000 | % | | | 3,410,000 | | | | 3,655,452 | | |
Subordinated Lien
Series 2003A-1 (AGM) | |
| 04/01/12 | | | 5.000 | % | | | 3,000,000 | | | | 3,062,370 | | |
New York State Dormitory Authority
Refunding Revenue Bonds
Education
Series 2005B (AMBAC) | |
| 03/15/26 | | | 5.500 | % | | | 1,000,000 | | | | 1,253,010 | | |
New York State Environmental Facilities Corp.
Revenue Bonds
Series 2004A (NPFGC/FGIC) | |
| 12/15/21 | | | 5.000 | % | | | 2,685,000 | | | | 2,961,367 | | |
New York State Housing Finance Agency
Revenue Bonds
Series 2008A | |
| 09/15/19 | | | 5.000 | % | | | 1,400,000 | | | | 1,607,676 | | |
Issue
Description | | Coupon
Rate | | Principal
Amount | | Value | |
| Municipal Bonds (continued) | |
| Sales or Use Tax (cont.) | |
New York State Thruway Authority
Revenue Bonds
2nd General Series 2005B (AMBAC) | |
| 04/01/19 | | | 5.000 | % | | $ | 2,500,000 | | | $ | 2,804,925 | | |
| Series 2005A (NPFGC) | |
| 04/01/22 | | | 5.000 | % | | | 500,000 | | | | 547,145 | | |
| Series 2008A | |
| 04/01/21 | | | 5.000 | % | | | 1,000,000 | | | | 1,127,740 | | |
Transportation
Series 2007A | |
| 03/15/22 | | | 5.000 | % | | | 1,000,000 | | | | 1,128,560 | | |
Sales Tax Asset Receivables Corp.
Revenue Bonds
Series 2004A (NPFGC) | |
| 10/15/22 | | | 5.000 | % | | | 4,000,000 | | | | 4,383,760 | | |
Virgin Islands Public Finance Authority
Revenue Bonds
Senior Lien-Matching Fund Loan Note
Series 2010A(b) | |
| 10/01/25 | | | 5.000 | % | | | 2,755,000 | | | | 2,794,479 | | |
| Total | | | 45,511,872 | | |
| Special District - Assessment 0.3% | |
New York City Industrial Development Agency
Revenue Bonds
Pilot-Queens Baseball Stadium
Series 2006 (AMBAC) | |
| 01/01/19 | | | 5.000 | % | | | 850,000 | | | | 866,600 | | |
| Special Purpose Certificates - General Obligations 8.5% | |
City of New York
Unlimited General Obligation Bonds
Series 2004G | |
| 12/01/19 | | | 5.000 | % | | | 2,430,000 | | | | 2,677,325 | | |
| Series 2005G | |
| 08/01/16 | | | 5.250 | % | | | 500,000 | | | | 583,190 | | |
| Series 2007C | |
| 01/01/15 | | | 5.000 | % | | | 4,000,000 | | | | 4,473,520 | | |
| Series 2007D-1 | |
| 12/01/21 | | | 5.000 | % | | | 2,000,000 | | | | 2,254,740 | | |
| Subordinated Series 2008I-1 | |
| 02/01/23 | | | 5.000 | % | | | 2,000,000 | | | | 2,220,920 | | |
Unlimited General Obligation Refunding Bonds
Series 2007D | |
| 02/01/24 | | | 5.000 | % | | | 2,000,000 | | | | 2,174,220 | | |
City of Yonkers
Unlimited General Obligation Bonds
Series 2005B (NPFGC) | |
| 08/01/21 | | | 5.000 | % | | | 2,425,000 | | | | 2,518,120 | | |
| 08/01/22 | | | 5.000 | % | | | 2,545,000 | | | | 2,630,690 | | |
County of Monroe
Unlimited General Obligation Refunding & Public
Improvement Bonds
Series 1996 (NPFGC) | |
| 03/01/16 | | | 6.000 | % | | | 1,210,000 | | | | 1,372,213 | | |
County of Nassau
Unlimited General Obligation Improvement Bonds
Series 2010A | |
| 04/01/18 | | | 4.000 | % | | | 1,340,000 | | | | 1,457,625 | | |
The Accompanying Notes to Financial Statements are an integral part of this statement.
9
Columbia New York Intermediate Municipal Bond Fund
October 31, 2011
(Percentages represent value of investments compared to net assets)
Issue
Description | | Coupon
Rate | | Principal
Amount | | Value | |
| Municipal Bonds (continued) | |
| Special Purpose Certificates - General Obligations (cont.) | |
Red Hook Central School District
Unlimited General Obligation Refunding Bonds
Series 2002 (AGM) | |
| 06/15/17 | | | 5.125 | % | | $ | 890,000 | | | $ | 914,297 | | |
Sachem Central School District
Unlimited General Obligation Refunding Bonds
Series 2006 (NPFGC/FGIC) | |
| 10/15/24 | | | 4.250 | % | | | 1,000,000 | | | | 1,038,170 | | |
Three Village Central School District
Unlimited General Obligation Refunding Bonds
Series 2005 (NPFGC/FGIC) | |
| 06/01/18 | | | 5.000 | % | | | 1,000,000 | | | | 1,179,110 | | |
| Total | | | 25,494,140 | | |
| State 0.8% | |
Puerto Rico Public Buildings Authority
Refunding Revenue Bonds
Government Facilities
Series 2007M(b) | |
| 07/01/23 | | | 6.250 | % | | | 2,250,000 | | | | 2,511,990 | | |
| Toll Road 4.4% | |
Niagara Falls Bridge Commission
Revenue Bonds
Bridge System
Series 1993A (AGM) | |
| 10/01/19 | | | 4.000 | % | | | 2,000,000 | | | | 2,151,860 | | |
Puerto Rico Highway & Transportation Authority
Refunding Revenue Bonds
Series 2005BB (AGM)
10/04/2005(b) | |
| 07/01/22 | | | 5.250 | % | | | 645,000 | | | | 695,794 | | |
Triborough Bridge & Tunnel Authority
Refunding Revenue Bonds
General
Series 2002B | |
| 11/15/13 | | | 5.250 | % | | | 2,015,000 | | | | 2,211,503 | | |
| Series 2011A | |
| 01/01/25 | | | 5.000 | % | | | 3,000,000 | | | | 3,420,630 | | |
Revenue Bonds
General
Series 2006A | |
| 11/15/19 | | | 5.000 | % | | | 2,000,000 | | | | 2,261,520 | | |
Issue
Description | | Coupon
Rate | | Principal
Amount | | Value | |
| Municipal Bonds (continued) | |
| Toll Road (cont.) | |
General Purpose
Series 2008 | |
| 11/15/21 | | | 5.000 | % | | $ | 2,000,000 | | | $ | 2,288,200 | | |
| Total | | | 13,029,507 | | |
| Water & Sewer 1.5% | |
Onondaga County Water Authority
Revenue Bonds
General
Series 2005A (AMBAC) | |
| 09/15/22 | | | 5.000 | % | | | 895,000 | | | | 988,205 | | |
| 09/15/23 | | | 5.000 | % | | | 940,000 | | | | 1,026,254 | | |
Rensselaer County Water Service & Sewer Authority
Revenue Bonds
Sewer Service
Series 2008 | |
| 09/01/28 | | | 5.100 | % | | | 1,155,000 | | | | 1,223,873 | | |
Water Service
Series 2008 | |
| 09/01/28 | | | 5.100 | % | | | 1,060,000 | | | | 1,114,813 | | |
| Total | | | 4,353,145 | | |
Total Municipal Bonds
(Cost: $264,639,006) | | $ | 282,340,081 | | |
| | | | | Shares | | Value | |
| Money Market Funds 4.3% | |
Dreyfus New York AMT-Free Municipal
Money Market, 0.010%(d) | | | | | 6,508,393 | | | $ | 6,508,393 | | |
JPMorgan Tax-Free Money
Market Fund, 0.010%(d) | | | | | 6,276,021 | | | | 6,276,021 | | |
Total Money Market Funds
(Cost: $12,784,414) | | $ | 12,784,414 | | |
Total Investments
(Cost: $277,423,420) | | | | | | $ | 295,124,495 | | |
| Other Assets & Liabilities, Net | | | | | | | 3,307,298 | | |
| Total Net Assets | | $ | 298,431,793 | | |
Notes to Portfolio of Investments
(a) Zero coupon bond.
(b) Municipal obligations include debt obligations issued by or on behalf of territories, possessions, or sovereign nations within the territorial boundaries of the United States. At October 31, 2011, the value of these securities amounted to $10,270,364 or 3.44% of net assets.
(c) Variable rate security. The interest rate shown reflects the rate as of October 31, 2011.
(d) The rate shown is the seven-day current annualized yield at October 31, 2011.
The Accompanying Notes to Financial Statements are an integral part of this statement.
10
Columbia New York Intermediate Municipal Bond Fund
October 31, 2011
Abbreviation Legend
AGM Assured Guaranty Municipal Corporation
AMBAC Ambac Assurance Corporation
AMT Alternative Minimum Tax
CIFG IXIS Financial Guaranty
FGIC Financial Guaranty Insurance Company
FHA Federal Housing Authority
NPFGC National Public Finance Guarantee Corporation
TCRS Transferable Custodial Receipts
XLCA XL Capital Assurance
Fair Value Measurements
Generally accepted accounting principles (GAAP) require disclosure regarding the inputs and valuation techniques used to measure fair value and any changes in valuation inputs or techniques. In addition, investments shall be disclosed by major category.
The Fund categorizes its fair value measurements according to a three-level hierarchy that maximizes the use of observable inputs and minimizes the use of unobservable inputs by prioritizing that the most observable input be used when available. Observable inputs are those that market participants would use in pricing an investment based on market data obtained from sources independent of the reporting entity. Unobservable inputs are those that reflect the Fund's assumptions about the information market participants would use in pricing an investment. An investment's level within the fair value hierarchy is based on the lowest level of any input that is deemed significant to the asset or liability's fair value measurement. The input levels are not necessarily an indication of the risk or liquidity associated with investments at that level. For example, certain U.S. government securities are generally high quality and liquid, however, they are reflected as Level 2 because the inputs used to determine fair value may not always be quoted prices in an active market.
Fair value inputs are summarized in the three broad levels listed below:
• Level 1 — Valuations based on quoted prices for investments in active markets that the Fund has the ability to access at the measurement date (including NAV for open-end mutual funds). Valuation adjustments are not applied to Level 1 investments.
• Level 2 — Valuations based on other significant observable inputs (including quoted prices for similar securities, interest rates, prepayment speeds, credit risks, etc.).
• Level 3 — Valuations based on significant unobservable inputs (including the Fund's own assumptions and judgment in determining the fair value of investments).
Inputs that are used in determining fair value of an investment may include price information, credit data, volatility statistics, and other factors. These inputs can be either observable or unobservable. The availability of observable inputs can vary between investments, and is affected by various factors such as the type of investment, and the volume and level of activity for that investment or similar investments in the marketplace. The inputs will be considered by the Investment Manager, along with any other relevant factors in the calculation of an investment's fair value. The Fund uses prices and inputs that are current as of the measurement date, which may include periods of market dislocations. During these periods, the availability of prices and inputs may be reduced for many investments. This condition could cause an investment to be reclassified between the various levels within the hierarchy.
Investments falling into the Level 3 category are primarily supported by quoted prices from brokers and dealers participating in the market for those investments. However, these may be classified as Level 3 investments due to lack of market transparency and corroboration to support these quoted prices. Additionally, valuation models may be used as the pricing source for any remaining investments classified as Level 3. These models rely on one or more significant unobservable inputs and/or significant assumptions by the Investment Manager. Inputs used in valuations may include, but are not limited to, financial statement analysis, capital account balances, discount rates and estimated cash flows, and comparable company data.
The Accompanying Notes to Financial Statements are an integral part of this statement.
11
Columbia New York Intermediate Municipal Bond Fund
October 31, 2011
Fair Value Measurements (continued)
The following table is a summary of the inputs used to value the Fund's investments as of October 31, 2011:
| | | Fair value at October 31, 2011 | |
| Description(a) | | Level 1
Quoted Prices
in Active
Markets for
Identical Assets | | Level 2
Other
Significant
Observable
Inputs(b) | | Level 3
Significant
Unobservable
Inputs | | Total | |
| Bonds | |
| Municipal Bonds | | $ | — | | | $ | 282,340,081 | | | $ | — | | | $ | 282,340,081 | | |
| Total Bonds | | | — | | | | 282,340,081 | | | | — | | | | 282,340,081 | | |
| Other | |
| Money Market Funds | | | 12,784,414 | | | | — | | | | — | | | | 12,784,414 | | |
| Total Other | | | 12,784,414 | | | | — | | | | — | | | | 12,784,414 | | |
| Total | | $ | 12,784,414 | | | $ | 282,340,081 | | | $ | — | | | $ | 295,124,495 | | |
The Fund's assets assigned to the Level 2 input category are generally valued using the market approach, in which a security's value is determined through reference to prices and information from market transactions for similar or identical assets.
(a) See the Portfolio of Investments for all investment classifications not indicated in the table.
(b) There were no significant transfers between Levels 1 and 2 during the period.
The Accompanying Notes to Financial Statements are an integral part of this statement.
12
Statement of Assets and Liabilities – Columbia New York Intermediate Municipal Bond Fund
October 31, 2011
| Assets | |
| Investments, at value | |
| (identified cost $277,423,420) | | $ | 295,124,495 | | |
| Receivable for: | |
| Capital shares sold | | | 741,494 | | |
| Interest | | | 3,989,782 | | |
| Expense reimbursement due from Investment Manager | | | 10,390 | | |
| Prepaid expense | | | 6,733 | | |
| Trustees' deferred compensation plan | | | 25,561 | | |
| Total assets | | | 299,898,455 | | |
| Liabilities | |
| Payable for: | |
| Capital shares purchased | | | 513,485 | | |
| Dividend distributions to shareholders | | | 848,428 | | |
| Investment management fees | | | 9,790 | | |
| Distribution and service fees | | | 1,224 | | |
| Transfer agent fees | | | 13,379 | | |
| Administration fees | | | 1,694 | | |
| Chief compliance officer expenses | | | 244 | | |
| Other expenses | | | 52,857 | | |
| Trustees' deferred compensation plan | | | 25,561 | | |
| Total liabilities | | | 1,466,662 | | |
| Net assets applicable to outstanding capital stock | | $ | 298,431,793 | | |
The Accompanying Notes to Financial Statements are an integral part of this statement.
13
Statement of Assets and Liabilities (continued) – Columbia New York Intermediate Municipal Bond Fund
October 31, 2011
| Represented by | |
| Paid-in capital | | $ | 281,579,725 | | |
| Undistributed net investment income | | | 168,191 | | |
| Accumulated net realized loss | | | (1,017,198 | ) | |
| Unrealized appreciation (depreciation) on: | |
| Investments | | | 17,701,075 | | |
| Total — representing net assets applicable to outstanding capital stock | | $ | 298,431,793 | | |
| Net assets applicable to outstanding shares | |
| Class A | | $ | 15,430,747 | | |
| Class B | | $ | 459,304 | | |
| Class C | | $ | 14,355,054 | | |
| Class T | | $ | 9,420,191 | | |
| Class Z | | $ | 258,766,497 | | |
| Shares outstanding | |
| Class A | | | 1,274,944 | | |
| Class B | | | 37,957 | | |
| Class C | | | 1,186,146 | | |
| Class T | | | 778,402 | | |
| Class Z | | | 21,382,214 | | |
| Net asset value per share | |
| Class A(a) | | $ | 12.10 | | |
| Class B | | $ | 12.10 | | |
| Class C | | $ | 12.10 | | |
| Class T(a) | | $ | 12.10 | | |
| Class Z | | $ | 12.10 | | |
(a) The maximum offering price per share for Class A is $12.51 and Class T is $12.70. The offering price is calculated by dividing the net asset value by 1.0 minus the maximum sales charge of 3.25% for Class A and by dividing the net asset value by 1.0 minus the maximum sales charge of 4.75% for Class T.
The Accompanying Notes to Financial Statements are an integral part of this statement.
14
Statement of Operations – Columbia New York Intermediate Municipal Bond Fund
Year ended October 31, 2011
| Net investment income | |
| Income: | |
| Dividends | | $ | 2,392 | | |
| Interest | | | 12,002,846 | | |
| Total income | | | 12,005,238 | | |
| Expenses: | |
| Investment management fees | | | 1,257,586 | | |
| Distribution fees | |
| Class B | | | 4,858 | | |
| Class C | | | 101,026 | | |
| Service fees | |
| Class A | | | 32,291 | | |
| Class B | | | 1,619 | | |
| Class C | | | 33,706 | | |
| Shareholder service fee — Class T | | | 14,884 | | |
| Transfer agent fees | |
| Class A | | | 18,050 | | |
| Class B | | | 904 | | |
| Class C | | | 19,058 | | |
| Class T | | | 14,250 | | |
| Class Z | | | 360,377 | | |
| Administration fees | | | 207,519 | | |
| Compensation of board members | | | 27,164 | | |
| Pricing and bookkeeping fees | | | 56,864 | | |
| Custodian fees | | | 14,163 | | |
| Printing and postage fees | | | 49,885 | | |
| Registration fees | | | 62,892 | | |
| Professional fees | | | 50,729 | | |
| Chief compliance officer expenses | | | 911 | | |
| Other | | | 15,356 | | |
| Total expenses | | | 2,344,092 | | |
| Fees waived or expenses reimbursed by Investment Manager and its affiliates | | | (628,205 | ) | |
| Fees waived by distributor — Class C | | | (47,097 | ) | |
| Expense reductions | | | (262 | ) | |
| Total net expenses | | | 1,668,528 | | |
| Net investment income | | | 10,336,710 | | |
| Realized and unrealized gain (loss) — net | |
| Net realized gain (loss) on: | |
| Investments | | | 334,681 | | |
| Net realized gain | | | 334,681 | | |
| Net change in unrealized appreciation (depreciation) on: | |
| Investments | | | (2,792,748 | ) | |
| Net change in unrealized depreciation | | | (2,792,748 | ) | |
| Net realized and unrealized loss | | | (2,458,067 | ) | |
| Net increase in net assets resulting from operations | | $ | 7,878,643 | | |
The Accompanying Notes to Financial Statements are an integral part of this statement.
15
Statement of Changes in Net Assets – Columbia New York Intermediate Municipal Bond Fund
| Year ended October 31, | | 2011 | | 2010 | |
| Operations | |
| Net investment income | | $ | 10,336,710 | | | $ | 11,018,512 | | |
| Net realized gain | | | 334,681 | | | | 832,245 | | |
| Net change in unrealized appreciation (depreciation) | | | (2,792,748 | ) | | | 9,266,759 | | |
| Net increase in net assets resulting from operations | | | 7,878,643 | | | | 21,117,516 | | |
| Distributions to shareholders from: | |
| Net investment income | |
| Class A | | | (422,806 | ) | | | (333,813 | ) | |
| Class B | | | (16,435 | ) | | | (28,401 | ) | |
| Class C | | | (386,449 | ) | | | (245,099 | ) | |
| Class T | | | (335,085 | ) | | | (373,466 | ) | |
| Class Z | | | (9,117,123 | ) | | | (10,027,620 | ) | |
| Total distributions to shareholders | | | (10,277,898 | ) | | | (11,008,399 | ) | |
| Decrease in net assets from share transactions | | | (28,428,745 | ) | | | (1,442,194 | ) | |
| Total increase (decrease) in net assets | | | (30,828,000 | ) | | | 8,666,923 | | |
| Net assets at beginning of year | | | 329,259,793 | | | | 320,592,870 | | |
| Net assets at end of year | | $ | 298,431,793 | | | $ | 329,259,793 | | |
| Undistributed net investment income | | $ | 168,191 | | | $ | 121,912 | | |
The Accompanying Notes to Financial Statements are an integral part of this statement.
16
Statement of Changes in Net Assets (continued) – Columbia New York Intermediate Municipal Bond Fund
| Year ended October 31, | | 2011 | | 2010 | |
| | | Shares | | Dollars ($) | | Shares | | Dollars ($) | |
| Capital stock activity | |
| Class A shares | |
| Subscriptions | | | 680,452 | | | | 8,129,296 | | | | 478,825 | | | | 5,730,066 | | |
| Distributions reinvested | | | 25,334 | | | | 301,939 | | | | 18,379 | | | | 220,696 | | |
| Redemptions | | | (428,180 | ) | | | (5,078,822 | ) | | | (218,401 | ) | | | (2,615,167 | ) | |
| Net increase | | | 277,606 | | | | 3,352,413 | | | | 278,803 | | | | 3,335,595 | | |
| Class B shares | |
| Subscriptions | | | 295 | | | | 3,482 | | | | 2,035 | | | | 24,239 | | |
| Distributions reinvested | | | 581 | | | | 6,906 | | | | 1,544 | | | | 18,501 | | |
| Redemptions | | | (46,583 | ) | | | (545,881 | ) | | | (43,448 | ) | | | (517,698 | ) | |
| Net decrease | | | (45,707 | ) | | | (535,493 | ) | | | (39,869 | ) | | | (474,958 | ) | |
| Class C shares | |
| Subscriptions | | | 462,728 | | | | 5,509,783 | | | | 623,030 | | | | 7,468,377 | | |
| Distributions reinvested | | | 16,798 | | | | 200,011 | | | | 12,866 | | | | 154,565 | | |
| Redemptions | | | (300,163 | ) | | | (3,563,549 | ) | | | (127,407 | ) | | | (1,529,777 | ) | |
| Net increase | | | 179,363 | | | | 2,146,245 | | | | 508,489 | | | | 6,093,165 | | |
| Class T shares | |
| Subscriptions | | | 4,125 | | | | 49,079 | | | | 1,076 | | | | 13,005 | | |
| Distributions reinvested | | | 16,746 | | | | 199,199 | | | | 22,853 | | | | 274,010 | | |
| Redemptions | | | (145,887 | ) | | | (1,729,797 | ) | | | (112,392 | ) | | | (1,345,005 | ) | |
| Net decrease | | | (125,016 | ) | | | (1,481,519 | ) | | | (88,463 | ) | | | (1,057,990 | ) | |
| Class Z shares | |
| Subscriptions | | | 3,697,552 | | | | 43,887,293 | | | | 4,518,249 | | | | 54,195,494 | | |
| Distributions reinvested | | | 90,984 | | | | 1,082,992 | | | | 99,006 | | | | 1,186,737 | | |
| Redemptions | | | (6,532,538 | ) | | | (76,880,676 | ) | | | (5,414,439 | ) | | | (64,720,237 | ) | |
| Net decrease | | | (2,744,002 | ) | | | (31,910,391 | ) | | | (797,184 | ) | | | (9,338,006 | ) | |
| Total net decrease | | | (2,457,756 | ) | | | (28,428,745 | ) | | | (138,224 | ) | | | (1,442,194 | ) | |
The Accompanying Notes to Financial Statements are an integral part of this statement.
17
Financial Highlights – Columbia New York Intermediate Municipal Bond Fund
The following tables are intended to help you understand the Fund's financial performance. Certain information reflects financial results for a single share of a class held for the periods shown. Per share net investment income (loss) amounts are calculated based on average shares outstanding during the period. Total returns assume reinvestment of all dividends and distributions. Total returns do not reflect payment of sales charges, if any, and are not annualized for periods of less than one year.
| | | Year ended Oct. 31, | |
| | | 2011 | | 2010 | | 2009 | | 2008 | | 2007 | |
| Class A | |
| Per share data | |
| Net asset value, beginning of period | | $ | 12.14 | | | $ | 11.76 | | | $ | 11.03 | | | $ | 11.54 | | | $ | 11.68 | | |
| Income from investment operations: | |
| Net investment income | | | 0.39 | | | | 0.38 | | | | 0.39 | | | | 0.40 | | | | 0.38 | | |
| Net realized and unrealized gain (loss) | | | (0.04 | ) | | | 0.38 | | | | 0.73 | | | | (0.51 | ) | | | (0.14 | ) | |
| Total from investment operations | | | 0.35 | | | | 0.76 | | | | 1.12 | | | | (0.11 | ) | | | 0.24 | | |
| Less distributions to shareholders from: | |
| Net investment income | | | (0.39 | ) | | | (0.38 | ) | | | (0.39 | ) | | | (0.40 | ) | | | (0.38 | ) | |
| Net realized gains | | | — | | | | — | | | | — | | | | — | | | | (0.00 | )(a) | |
| Total distributions to shareholders | | | (0.39 | ) | | | (0.38 | ) | | | (0.39 | ) | | | (0.40 | ) | | | (0.38 | ) | |
| Net asset value, end of period | | $ | 12.10 | | | $ | 12.14 | | | $ | 11.76 | | | $ | 11.03 | | | $ | 11.54 | | |
| Total return | | | 2.99 | % | | | 6.59 | % | | | 10.30 | % | | | (1.02 | %) | | | 2.12 | % | |
| Ratios to average net assets(b) | |
| Expenses prior to fees waived or expenses reimbursed | | | 0.98 | % | | | 0.93 | % | | | 0.91 | % | | | 0.93 | % | | | 1.07 | % | |
| Net expenses after fees waived or expenses reimbursed(c) | | | 0.76 | %(d) | | | 0.80 | %(d) | | | 0.78 | %(d) | | | 0.75 | %(d) | | | 1.07 | %(d) | |
| Net investment income | | | 3.30 | %(d) | | | 3.20 | %(d) | | | 3.39 | %(d) | | | 3.44 | %(d) | | | 3.30 | %(d) | |
| Supplemental data | |
| Net assets, end of period (in thousands) | | $ | 15,431 | | | $ | 12,110 | | | $ | 8,452 | | | $ | 4,200 | | | $ | 1,874 | | |
| Portfolio turnover | | | 8 | % | | | 10 | % | | | 20 | % | | | 9 | % | | | 9 | % | |
Notes to Financial Highlights
(a) Rounds to less than $0.01.
(b) In addition to the fees and expenses which the Fund bears directly, the Fund indirectly bears a pro rata share of the fees and expenses of the acquired funds in which it invests. Such indirect expenses are not included in the reported expense ratios.
(c) The Investment Manager and certain of its affiliates agreed to waive/reimburse certain fees and expenses, if applicable.
(d) The benefits derived from expense reductions had an impact of less than 0.01%.
The Accompanying Notes to Financial Statements are an integral part of this statement.
18
Financial Highlights (continued) – Columbia New York Intermediate Municipal Bond Fund
| | | Year ended Oct. 31, | |
| | | 2011 | | 2010 | | 2009 | | 2008 | | 2007 | |
| Class B | |
| Per share data | |
| Net asset value, beginning of period | | $ | 12.14 | | | $ | 11.76 | | | $ | 11.03 | | | $ | 11.54 | | | $ | 11.68 | | |
| Income from investment operations: | |
| Net investment income | | | 0.30 | | | | 0.30 | | | | 0.31 | | | | 0.32 | | | | 0.30 | | |
| Net realized and unrealized gain (loss) | | | (0.04 | ) | | | 0.37 | | | | 0.73 | | | | (0.51 | ) | | | (0.14 | ) | |
| Total from investment operations | | | 0.26 | | | | 0.67 | | | | 1.04 | | | | (0.19 | ) | | | 0.16 | | |
| Less distributions to shareholders from: | |
| Net investment income | | | (0.30 | ) | | | (0.29 | ) | | | (0.31 | ) | | | (0.32 | ) | | | (0.30 | ) | |
| Net realized gains | | | — | | | | — | | | | — | | | | — | | | | (0.00 | )(a) | |
| Total distributions to shareholders | | | (0.30 | ) | | | (0.29 | ) | | | (0.31 | ) | | | (0.32 | ) | | | (0.30 | ) | |
| Net asset value, end of period | | $ | 12.10 | | | $ | 12.14 | | | $ | 11.76 | | | $ | 11.03 | | | $ | 11.54 | | |
| Total return | | | 2.23 | % | | | 5.80 | % | | | 9.49 | % | | | (1.74 | %) | | | 1.36 | % | |
| Ratios to average net assets(b) | |
| Expenses prior to fees waived or expenses reimbursed | | | 1.75 | % | | | 1.68 | % | | | 1.66 | % | | | 1.68 | % | | | 1.82 | % | |
| Net expenses after fees waived or expenses reimbursed(c) | | | 1.52 | %(d) | | | 1.55 | %(d) | | | 1.53 | %(d) | | | 1.50 | %(d) | | | 1.82 | %(d) | |
| Net investment income | | | 2.55 | %(d) | | | 2.47 | %(d) | | | 2.67 | %(d) | | | 2.77 | %(d) | | | 2.55 | %(d) | |
| Supplemental data | |
| Net assets, end of period (in thousands) | | $ | 459 | | | $ | 1,016 | | | $ | 1,453 | | | $ | 1,503 | | | $ | 1,804 | | |
| Portfolio turnover | | | 8 | % | | | 10 | % | | | 20 | % | | | 9 | % | | | 9 | % | |
Notes to Financial Highlights
(a) Rounds to less than $0.01.
(b) In addition to the fees and expenses which the Fund bears directly, the Fund indirectly bears a pro rata share of the fees and expenses of the acquired funds in which it invests. Such indirect expenses are not included in the reported expense ratios.
(c) The Investment Manager and certain of its affiliates agreed to waive/reimburse certain fees and expenses, if applicable.
(d) The benefits derived from expense reductions had an impact of less than 0.01%.
The Accompanying Notes to Financial Statements are an integral part of this statement.
19
Financial Highlights (continued) – Columbia New York Intermediate Municipal Bond Fund
| | | Year ended Oct. 31, | |
| | | 2011 | | 2010 | | 2009 | | 2008 | | 2007 | |
| Class C | |
| Per share data | |
| Net asset value, beginning of period | | $ | 12.14 | | | $ | 11.76 | | | $ | 11.03 | | | $ | 11.54 | | | $ | 11.68 | | |
| Income from investment operations: | |
| Net investment income | | | 0.34 | | | | 0.33 | | | | 0.34 | | | | 0.36 | | | | 0.33 | | |
| Net realized and unrealized gain (loss) | | | (0.04 | ) | | | 0.39 | | | | 0.74 | | | | (0.51 | ) | | | (0.13 | ) | |
| Total from investment operations | | | 0.30 | | | | 0.72 | | | | 1.08 | | | | (0.15 | ) | | | 0.20 | | |
| Less distributions to shareholders from: | |
| Net investment income | | | (0.34 | ) | | | (0.34 | ) | | | (0.35 | ) | | | (0.36 | ) | | | (0.34 | ) | |
| Net realized gains | | | — | | | | — | | | | — | | | | — | | | | (0.00 | )(a) | |
| Total distributions to shareholders | | | (0.34 | ) | | | (0.34 | ) | | | (0.35 | ) | | | (0.36 | ) | | | (0.34 | ) | |
| Net asset value, end of period | | $ | 12.10 | | | $ | 12.14 | | | $ | 11.76 | | | $ | 11.03 | | | $ | 11.54 | | |
| Total return | | | 2.57 | % | | | 6.16 | % | | | 9.87 | % | | | (1.40 | %) | | | 1.71 | % | |
| Ratios to average net assets(b) | |
| Expenses prior to fees waived or expenses reimbursed | | | 1.73 | % | | | 1.67 | % | | | 1.66 | % | | | 1.68 | % | | | 1.82 | % | |
| Net expenses after fees waived or expenses reimbursed(c) | | | 1.16 | %(d) | | | 1.20 | %(d) | | | 1.18 | %(d) | | | 1.15 | %(d) | | | 1.47 | %(d) | |
| Net investment income | | | 2.89 | %(d) | | | 2.77 | %(d) | | | 2.96 | %(d) | | | 3.09 | %(d) | | | 2.89 | %(d) | |
| Supplemental data | |
| Net assets, end of period (in thousands) | | $ | 14,355 | | | $ | 12,224 | | | $ | 5,861 | | | $ | 2,649 | | | $ | 2,019 | | |
| Portfolio turnover | | | 8 | % | | | 10 | % | | | 20 | % | | | 9 | % | | | 9 | % | |
Notes to Financial Highlights
(a) Rounds to less than $0.01.
(b) In addition to the fees and expenses which the Fund bears directly, the Fund indirectly bears a pro rata share of the fees and expenses of the acquired funds in which it invests. Such indirect expenses are not included in the reported expense ratios.
(c) The Investment Manager and certain of its affiliates agreed to waive/reimburse certain fees and expenses, if applicable.
(d) The benefits derived from expense reductions had an impact of less than 0.01%.
The Accompanying Notes to Financial Statements are an integral part of this statement.
20
Financial Highlights (continued) – Columbia New York Intermediate Municipal Bond Fund
| | | Year ended Oct. 31, | |
| | | 2011 | | 2010 | | 2009 | | 2008 | | 2007 | |
| Class T | |
| Per share data | |
| Net asset value, beginning of period | | $ | 12.14 | | | $ | 11.76 | | | $ | 11.03 | | | $ | 11.54 | | | $ | 11.68 | | |
| Income from investment operations: | |
| Net investment income | | | 0.40 | | | | 0.40 | | | | 0.41 | | | | 0.42 | | | | 0.39 | | |
| Net realized and unrealized gain (loss) | | | (0.04 | ) | | | 0.38 | | | | 0.72 | | | | (0.52 | ) | | | (0.14 | ) | |
| Total from investment operations | | | 0.36 | | | | 0.78 | | | | 1.13 | | | | (0.10 | ) | | | 0.25 | | |
| Less distributions to shareholders from: | |
| Net investment income | | | (0.40 | ) | | | (0.40 | ) | | | (0.40 | ) | | | (0.41 | ) | | | (0.39 | ) | |
| Net realized gains | | | — | | | | — | | | | — | | | | — | | | | (0.00 | )(a) | |
| Total distributions to shareholders | | | (0.40 | ) | | | (0.40 | ) | | | (0.40 | ) | | | (0.41 | ) | | | (0.39 | ) | |
| Net asset value, end of period | | $ | 12.10 | | | $ | 12.14 | | | $ | 11.76 | | | $ | 11.03 | | | $ | 11.54 | | |
| Total return | | | 3.09 | % | | | 6.69 | % | | | 10.42 | % | | | (0.90 | %) | | | 2.22 | % | |
| Ratios to average net assets(b) | |
| Expenses prior to fees waived or expenses reimbursed | | | 0.89 | % | | | 0.83 | % | | | 0.81 | % | | | 0.83 | % | | | 0.97 | % | |
| Net expenses after fees waived or expenses reimbursed(c) | | | 0.67 | %(d) | | | 0.70 | %(d) | | | 0.68 | %(d) | | | 0.65 | %(d) | | | 0.97 | %(d) | |
| Net investment income | | | 3.40 | %(d) | | | 3.31 | %(d) | | | 3.52 | %(d) | | | 3.62 | %(d) | | | 3.40 | %(d) | |
| Supplemental data | |
| Net assets, end of period (in thousands) | | $ | 9,420 | | | $ | 10,969 | | | $ | 11,667 | | | $ | 11,520 | | | $ | 13,575 | | |
| Portfolio turnover | | | 8 | % | | | 10 | % | | | 20 | % | | | 9 | % | | | 9 | % | |
Notes to Financial Highlights
(a) Rounds to less than $0.01.
(b) In addition to the fees and expenses which the Fund bears directly, the Fund indirectly bears a pro rata share of the fees and expenses of the acquired funds in which it invests. Such indirect expenses are not included in the reported expense ratios.
(c) The Investment Manager and certain of its affiliates agreed to waive/reimburse certain fees and expenses, if applicable.
(d) The benefits derived from expense reductions had an impact of less than 0.01%.
The Accompanying Notes to Financial Statements are an integral part of this statement.
21
Financial Highlights (continued) – Columbia New York Intermediate Municipal Bond Fund
| | | Year ended Oct. 31, | |
| | | 2011 | | 2010 | | 2009 | | 2008 | | 2007 | |
| Class Z | |
| Per share data | |
| Net asset value, beginning of period | | $ | 12.14 | | | $ | 11.76 | | | $ | 11.03 | | | $ | 11.54 | | | $ | 11.68 | | |
| Income from investment operations: | |
| Net investment income | | | 0.42 | | | | 0.41 | | | | 0.42 | | | | 0.42 | | | | 0.41 | | |
| Net realized and unrealized gain (loss) | | | (0.04 | ) | | | 0.38 | | | | 0.73 | | | | (0.50 | ) | | | (0.14 | ) | |
| Total from investment operations | | | 0.38 | | | | 0.79 | | | | 1.15 | | | | (0.08 | ) | | | 0.27 | | |
| Less distributions to shareholders from: | |
| Net investment income | | | (0.42 | ) | | | (0.41 | ) | | | (0.42 | ) | | | (0.43 | ) | | | (0.41 | ) | |
| Net realized gains | | | — | | | | — | | | | — | | | | — | | | | (0.00 | )(a) | |
| Total distributions to shareholders | | | (0.42 | ) | | | (0.41 | ) | | | (0.42 | ) | | | (0.43 | ) | | | (0.41 | ) | |
| Net asset value, end of period | | $ | 12.10 | | | $ | 12.14 | | | $ | 11.76 | | | $ | 11.03 | | | $ | 11.54 | | |
| Total return | | | 3.24 | % | | | 6.85 | % | | | 10.58 | % | | | (0.75 | %) | | | 2.37 | % | |
| Ratios to average net assets(b) | |
| Expenses prior to fees waived or expenses reimbursed | | | 0.73 | % | | | 0.68 | % | | | 0.66 | % | | | 0.68 | % | | | 0.82 | % | |
| Net expenses after fees waived or expenses reimbursed(c) | | | 0.52 | %(d) | | | 0.55 | %(d) | | | 0.53 | %(d) | | | 0.50 | %(d) | | | 0.82 | %(d) | |
| Net investment income | | | 3.55 | %(d) | | | 3.46 | %(d) | | | 3.66 | %(d) | | | 3.73 | %(d) | | | 3.55 | %(d) | |
| Supplemental data | |
| Net assets, end of period (in thousands) | | $ | 258,766 | | | $ | 292,941 | | | $ | 293,160 | | | $ | 272,139 | | | $ | 130,411 | | |
| Portfolio turnover | | | 8 | % | | | 10 | % | | | 20 | % | | | 9 | % | | | 9 | % | |
Notes to Financial Highlights
(a) Rounds to less than $0.01.
(b) In addition to the fees and expenses which the Fund bears directly, the Fund indirectly bears a pro rata share of the fees and expenses of the acquired funds in which it invests. Such indirect expenses are not included in the reported expense ratios.
(c) The Investment Manager and certain of its affiliates agreed to waive/reimburse certain fees and expenses, if applicable.
(d) The benefits derived from expense reductions had an impact of less than 0.01%.
The Accompanying Notes to Financial Statements are an integral part of this statement.
22
Notes to Financial Statements – Columbia New York Intermediate Municipal Bond Fund
October 31, 2011
Note 1. Organization
Columbia New York Intermediate Municipal Bond Fund (the Fund), a series of Columbia Funds Series Trust I (the Trust), is a non-diversified fund. The Trust is registered under the Investment Company Act of 1940, as amended (the 1940 Act), as an open-end management investment company organized as a Massachusetts business trust.
Fund Shares
The Trust may issue an unlimited number of shares (without par value). The Fund offers Class A, Class B, Class C, Class T and Class Z shares. All share classes have identical voting, dividend and liquidation rights. Each share class has its own expense structure and sales charges, as applicable.
Class A shares are subject to a maximum front-end sales charge of 3.25% based on the initial investment amount. Class A shares purchased without an initial sales charge in accounts aggregating $1 million to $50 million at the time of purchase are subject to a contingent deferred sales charge (CDSC) if the shares are sold within 18 months of purchase, charged as follows: 1.00% CDSC if redeemed within 12 months of purchase, and 0.50% CDSC if redeemed more than 12, but less than 18, months after purchase.
Class B shares may be subject to a maximum CDSC of 3.00% based upon the holding period after purchase. Class B shares will generally convert to Class A shares eight years after purchase. The Fund no longer accepts investments by new or existing investors in the Fund's Class B shares, except in connection with the reinvestment of any dividend and/or capital gain distributions in Class B shares of the Fund and exchanges by existing Class B shareholders of certain other funds within the Columbia Family of Funds.
Class C shares are subject to a 1.00% CDSC on shares redeemed within one year of purchase.
Class T shares are subject to a maximum front-end sales charge of 4.75% based on the investment amount. Class T shares purchased without an initial sales charge in accounts aggregating $1 million to $50 million at the time of purchase are subject to a 1.00% contingent deferred sales charge (CDSC) if the shares are sold within 18 months of purchase, charged as follows: 1.00% CDSC if redeemed within 12 months of purchase, and 0.50% CDSC if redeemed more than 12, but less than 18, months after purchase.
Class Z shares are not subject to sales charges, and are only available to certain investors, as described in the Fund's prospectus.
Note 2. Summary of Significant Accounting Policies
Use of Estimates
The preparation of financial statements in accordance with U.S. generally accepted accounting principles (GAAP) requires management to make certain estimates and assumptions that affect the reported amounts of assets and liabilities, the disclosure of contingent assets and liabilities at the date of the financial statements and the reported amounts of revenue and expenses during the reporting period. Actual results could differ from those estimates.
The following is a summary of significant accounting policies consistently followed by the Fund in the preparation of its financial statements.
Security Valuation
Debt securities generally are valued by pricing services approved by the Board of Trustees (the Board) based upon market transactions for normal, institutional-size trading units of similar securities. The services may use various pricing techniques which take into account appropriate factors such as yield, quality, coupon rate, maturity, type of issue, trading characteristics and other data, as well as broker quotes. Debt securities for which quotations are readily available may also be valued based upon an over-the-counter or exchange bid quotation.
Investments in other open-end investment companies, including money market funds, are valued at net asset value.
Short-term securities purchased within 60 days to maturity are valued at amortized cost, which approximates market value. The value of short-term securities originally purchased with maturities greater than 60 days is determined based on an amortized value to par upon reaching 60 days to maturity. Short-term securities maturing in more than 60 days from the valuation date are valued at the market price or approximate market value based on current interest rates.
Investments for which market quotations are not readily available, or that have quotations which management believes
23
Columbia New York Intermediate Municipal Bond Fund, October 31, 2011
are not reliable, are valued at fair value as determined in good faith under consistently applied procedures established by and under the general supervision of the Board. If a security or class of securities (such as foreign securities) is valued at fair value, such value is likely to be different from the last quoted market price for the security. The determination of fair value often requires significant judgment. To determine fair value, management may use assumptions including but not limited to future cash flows and estimated risk premiums. Multiple inputs from various sources may be used to determine value.
Security Transactions
Security transactions are accounted for on the trade date. Cost is determined and gains (losses) are based upon the specific identification method for both financial statement and federal income tax purposes.
Income Recognition
Interest income is recorded on the accrual basis. Market premium and discount are amortized and accreted, respectively, on all debt securities, unless otherwise noted. Original issue discount is accreted to interest income over the life of the security with a corresponding increase in the cost basis, if any.
Dividend income is recorded on the ex-date.
Expenses
General expenses of the Trust are allocated to the Fund and other funds of the Trust based upon relative net assets or other expense allocation methodologies determined by the nature of the expense. Expenses directly attributable to the Fund are charged to the Fund. Expenses directly attributable to a specific class of shares are charged to that share class.
Determination of Class Net Asset Value
All income, expenses (other than class-specific expenses, which are charged to that share class, as shown in the Statement of Operations) and realized and unrealized gains (losses) are allocated to each class of the Fund on a daily basis for purposes of determining the net asset value of each class. Income and expenses are allocated to each class based on the settled shares method, while realized and unrealized gains (losses) are allocated based on the relative net assets of each class.
Federal Income Tax Status
The Fund intends to qualify each year as a regulated investment company under Subchapter M of the Internal Revenue Code, as amended, and will distribute substantially all of its tax exempt income (including net short-term capital gains), if any, for its tax year, and as such will not be subject to federal income taxes. In addition, the Fund intends to distribute in each calendar year substantially all of its net investment income, capital gains and certain other amounts, if any, such that the Fund should not be subject to federal excise tax. Therefore, no federal income or excise tax provision is recorded.
Distributions to Shareholders
Distributions from net investment income are declared daily and paid monthly. Net realized capital gains, if any, are distributed at least annually. Income distributions and capital gain distributions are determined in accordance with federal income tax regulations which may differ from GAAP.
Guarantees and Indemnifications
Under the Trust's organizational documents and, in some cases, by contract, its officers and trustees are indemnified against certain liabilities arising out of the performance of their duties to the Trust or its funds. In addition, certain of the Fund's contracts with its service providers contain general indemnification clauses. The Fund's maximum exposure under these arrangements is unknown since the amount of any future claims that may be made against the Fund cannot be determined, and the Fund has no historical basis for predicting the likelihood of any such claims.
Recent Accounting Pronouncement
Fair Value Measurements and Disclosures
In May 2011, the Financial Accounting and Standards Board issued ASU No. 2011-04 modifying Topic 820, Fair Value Measurements and Disclosures. At the same time, the International Accounting Standards Board issued International Financial Reporting Standard 13, Fair Value Measurement. The objective of the FASB and IASB is convergence of their guidance on fair value measurements and disclosures.
24
Columbia New York Intermediate Municipal Bond Fund, October 31, 2011
Specifically, ASU No. 2011-04 requires reporting entities to disclose i) the amounts of any transfers between Level 1 and Level 2, and the reasons for the transfers, ii) for Level 3 fair value measurements, a) quantitative information about significant unobservable inputs used, b) a description of the valuation processes used by the reporting entity and c) a narrative description of the sensitivity of the fair value measurement to changes in unobservable inputs if a change in those inputs might result in a significantly higher or lower fair value measurement. The effective date of ASU No. 2011-04 is for interim and annual periods beginning after December 15, 2011. At this time, management is evaluating the implications of this guidance and the impact it will have on the financial statement amounts and footnote disclosures, if any.
Note 3. Fees and Compensation Paid to Affiliates
Investment Management Fees
Under an Investment Management Services Agreement (IMSA), Columbia Management Investment Advisers, LLC (the Investment Manager), a wholly-owned subsidiary of Ameriprise Financial, Inc. (Ameriprise Financial), determines which securities will be purchased, held or sold. Effective March 1, 2011, the management fee is an annual fee that is equal to a percentage of the Fund's average daily net assets that declines from 0.40% to 0.27% as the Fund's net assets increase. Prior to March 1, 2011, the management fee was equal to a percentage of the Fund's average daily net assets that declined from 0.48% to 0.35% as the Fund's net assets increased. The effective management fee rate for the year ended October 31, 2011 was 0.43% of the Fund's average daily net assets.
Administration Fees
Under an Administrative Services Agreement, the Investment Manager serves as the Fund Administrator. Effective March 1, 2011, the Fund pays the Fund Administrator an annual fee for administration and accounting services equal to a percentage of the Fund's average daily net assets that declines from 0.07% to 0.04% as the Fund's net assets increase. Prior to March 1, 2011, the administration fee was equal to the annual rate of 0.067% of the Fund's average daily net assets. The effective administration fee rate for the year ended October 31, 2011 was 0.07% of the Fund's average daily net assets.
Pricing and Bookkeeping Fees
Prior to May 16, 2011, the Fund had entered into a Financial Reporting Services Agreement (the Financial Reporting Services Agreement) with State Street Bank and Trust Company (State Street) and the Investment Manager pursuant to which State Street provided financial reporting services to the Fund. The Fund also entered into an Accounting Services Agreement (collectively with the Financial Reporting Services Agreement, the State Street Agreements) with State Street and the Investment Manager pursuant to which State Street provided accounting services to the Fund. Under the State Street Agreements, the Fund paid State Street an annual fee of $38,000 paid monthly plus an additional monthly fee based on an annualized percentage rate of average daily net assets of the Fund for the month. The aggregate fee did not exceed $140,000 per year (exclusive of out-of-pocket expenses and charges). The Fund also reimbursed State Street for certain out-of-pocket expenses and charges. Effective May 16, 2011, these services are now provided under the Administrative Services Agreement discussed above.
Compensation of Board Members
Board members are compensated for their services to the Fund as disclosed in the Statement of Operations. The Trust's eligible Trustees may participate in a Deferred Compensation Plan (the Plan) which may be terminated at any time. Obligation of the Plan will be paid solely out of the Fund's assets.
Compensation of Chief Compliance Officer
The Board has appointed a Chief Compliance Officer to the Fund in accordance with federal securities regulations. The Fund, along with other affiliated funds, pays its pro-rata share of the expenses associated with the Chief Compliance Officer. The Fund's expenses for the Chief Compliance Officer will not exceed $15,000 per year.
Transfer Agent Fees
Under a Transfer and Dividend Disbursing Agent Agreement, Columbia Management Investment Services Corp. (the Transfer Agent), an affiliate of the Investment Manager and a wholly-owned subsidiary of Ameriprise Financial, is responsible for providing transfer agency services to the Fund. The Transfer Agent has contracted with Boston Financial Data Services (BFDS) to serve as sub-transfer agent.
25
Columbia New York Intermediate Municipal Bond Fund, October 31, 2011
The Transfer Agent receives monthly account-based service fees based on the number of open accounts and is reimbursed by the Fund for the fees and expenses the Transfer Agent pays to financial intermediaries that maintain omnibus accounts with the Fund that is a percentage of the average aggregate value of the Fund's shares maintained in each such omnibus account (other than omnibus accounts for which American Enterprise Investment Services Inc. is the broker of record or accounts where the beneficial shareholder is a customer of Ameriprise Financial Services, Inc., which are paid a per account fee). The Transfer Agent pays the fees of BFDS for services as sub-transfer agent and is not entitled to reimbursement for such fees from the Fund (with the exception of out-of-pocket fees).
The Transfer Agent also receives compensation from fees for various shareholder services and reimbursements for certain out-of -pocket expenses.
For the year ended October 31, 2011, the Fund's effective transfer agent fee rates as a percentage of average daily net assets of each class were as follows:
| Class A | | | 0.14 | % | |
| Class B | | | 0.14 | | |
| Class C | | | 0.14 | | |
| Class T | | | 0.14 | | |
| Class Z | | | 0.14 | | |
An annual minimum account balance fee of $20 may apply to certain accounts with a value below the Fund's initial minimum investment requirements to reduce the impact of small accounts on transfer agent fees. These minimum account balance fees are recorded as part of expense reductions in the Statement of Operations. For the year ended October 31, 2011, these minimum account balance fees reduced total expenses by $260.
Distribution and Service Fees
The Fund has an agreement with Columbia Management Investment Distributors, Inc. (the Distributor), an affiliate of the Investment Manager and a wholly-owned subsidiary of Ameriprise Financial, for distribution and shareholder services. Pursuant to Rule 12b-1 under the 1940 Act, the Board has approved, and the Fund has adopted, distribution and shareholder service plans (the Plans) which set the distribution and service fees for the Fund. These fees are calculated daily and are intended to compensate the Distributor and/or eligible selling and/or servicing agents for selling shares of the Fund and providing services to investors.
The Plans require the payment of a monthly service fee to the Distributor at the maximum annual rate of 0.25% of the average daily net assets attributable to Class A, Class B and Class C shares of the Fund. The Plans also require the payment of a monthly distribution fee to the Distributor at the maximum annual rate of 0.75% of the average daily net assets attributable to Class B and Class C shares only.
The Distributor has voluntarily agreed to waive a portion of the distribution fee for Class C shares so that the combined distribution and service fee does not exceed 0.65% annually of the average daily net assets attributable to Class C shares. This arrangement may be modified or terminated by the Distributor at any time.
Shareholder Services Fees
The Fund has adopted a shareholder services plan that permits it to pay for certain services provided to Class T shareholders by their selling and/or servicing agents. The Fund may pay shareholder servicing fees up to an aggregate annual rate of 0.40% of the Fund's average daily net assets attributable to Class T shares (comprised of up to 0.20% for shareholder liaison services and up to 0.20% for administrative support services). These fees are currently limited to an aggregate annual rate of not more than 0.15% of the Fund's average daily net assets attributable to Class T shares. In addition, the servicing fee for Class T shares will be waived by selling and/or servicing agents to the extent necessary to prevent the net investment income for the Class T shares from falling below 0.00% in a daily basis. The shareholder services fee for the year ended October 31, 2011 was 0.15% of the Fund's average daily net assets attributable to Class T shares.
Sales Charges
Sales charges, including front-end charges and CDSCs, received by the Distributor for distributing Fund shares were $33,089 for Class A, $623 for Class B, $1,414 for Class C and $19 for Class T shares for the year ended October 31, 2011.
26
Columbia New York Intermediate Municipal Bond Fund, October 31, 2011
Expenses Waived/Reimbursed by the Investment Manager and its Affiliates
Effective March 1, 2011, the Investment Manager and certain of its affiliates have contractually agreed to waive fees and/or reimburse expenses (excluding certain fees and expenses described below), through February 29, 2012, unless sooner terminated at the sole discretion of the Board, so that the Fund's net operating expenses, after giving effect to fees waived/expenses reimbursed and any balance credits and/or overdraft charges from the Fund's custodian, do not exceed the following annual rates as a percentage of the class' average daily net assets:
| Class A | | | 0.75 | % | |
| Class B | | | 1.50 | | |
| Class C | | | 1.50 | | |
| Class T | | | 0.65 | | |
| Class Z | | | 0.50 | | |
Under the agreement, the following fees and expenses are excluded from the waiver/reimbursement commitment, and therefore will be paid by the Fund, if applicable: taxes (including foreign transaction taxes), expenses associated with investments in affiliated and non-affiliated pooled investment vehicles (including mutual funds and exchange traded funds), transaction costs and brokerage commissions, costs related to any securities lending program, dividend expenses associated with securities sold short, inverse floater program fees and expenses, transaction charges and interest on borrowed money, interest, extraordinary expenses and any other expenses the exclusion of which is specifically approved by the Fund's Board. This agreement may be modified or amended only with approval from all parties. Class C distribution fees waived by the Distributor, as discussed above, are in addition to the waiver/reimbursement commitment under the agreement.
Prior to March 1, 2011, the Investment Manager voluntarily agreed to reimburse a portion of the Fund's expenses (excluding certain expenses, such as distribution and services fees, brokerage commissions, interest, taxes and extraordinary expenses, but including custodian charges relating to overdrafts, if any) so that the Fund's ordinary net operating expenses, after giving effect to fees waived/expenses reimbursed and any balance credits and/or overdraft charges from the Fund's custodian, did not exceed 0.55% of the Fund's average daily net assets on an annualized basis.
Note 4. Federal Tax Information
The timing and character of income and capital gain distributions are determined in accordance with income tax regulations, which may differ from GAAP because of temporary or permanent book to tax differences.
For the year ended October 31, 2011, permanent differences are primarily due to differing treatments for market discount accretion/premium amortization on debt securities. In the Statement of Assets and Liabilities the following reclassifications were made among the components of the Fund's net assets due to permanent differences:
| Undistributed net investment income | | $ | (12,533 | ) | |
| Accumulated net realized loss | | | 3,421 | | |
| Paid-in capital | | | 9,112 | | |
Net investment income and net realized gains (losses), as disclosed in the Statement of Operations, and net assets were not affected by this reclassification.
The tax character of distributions paid during the years indicated was as follows:
| Year ended October 31, | | 2011 | | 2010 | |
| Tax-Exempt Income | | $ | 10,277,898 | | | $ | 11,008,399 | | |
Short-term capital gain distributions, if any, are considered ordinary income distributions for tax purposes.
At October 31, 2011, the components of distributable earnings on a tax basis were as follows:
| Undistributed tax-exempt income | | $ | 967,195 | | |
| Undistributed long-term gain | | | — | | |
| Unrealized appreciation | | | 17,776,063 | | |
27
Columbia New York Intermediate Municipal Bond Fund, October 31, 2011
At October 31, 2011, the cost of investments for federal income tax purposes was $277,348,432 and the aggregate gross unrealized appreciation and depreciation based on that cost was:
| Unrealized appreciation | | $ | 17,830,261 | | |
| Unrealized depreciation | | $ | (54,198 | ) | |
| Net unrealized appreciation | | $ | 17,776,063 | | |
The following capital loss carryforward, determined at October 31, 2011, may be available to reduce taxable income arising from future net realized gains on investments, if any, to the extent permitted by the Internal Revenue Code:
| Year of Expiration | | Amount | |
| 2017 | | $ | 1,006,068 | | |
On December 22, 2010, the Regulated Investment Company Modernization Act of 2010 (the Act) was enacted, which changed various technical rules governing the tax treatment of regulated investment companies. The changes are generally effective for taxable years beginning after the date of enactment. Under the Act, the Fund will be permitted to carry forward capital losses incurred in taxable years beginning after the date of enactment for an unlimited period. However, any losses incurred during those future taxable years will be required to be utilized prior to the losses incurred in pre-enactment taxable years, which carry an expiration date. As a result of this ordering rule, pre-enactment capital loss carryforwards may be more likely to expire unused.
For the year ended October 31, 2011, $338,101 of capital loss carryforward was utilized.
Management of the Fund has concluded that there are no significant uncertain tax positions that would require recognition in the financial statements. However, management's conclusion may be subject to review and adjustment at a later date based on factors including, but not limited to, new tax laws, regulations, and administrative interpretations (including relevant court decisions). Generally, the Fund's federal tax returns for the prior three fiscal years remain subject to examination by the Internal Revenue Service.
Note 5. Portfolio Information
The cost of purchases and proceeds from sales of securities, excluding short-term obligations, aggregated to $24,061,749 and $61,007,964, respectively, for the year ended October 31, 2011.
Note 6. Lending of Portfolio Securities
Effective May 16, 2011, the Fund has entered into a Master Securities Lending Agreement (the Agreement) with JPMorgan Chase Bank, N.A. (JPMorgan). The Agreement, which replaces the previous security lending arrangement with State Street, authorizes JPMorgan as lending agent to lend securities to authorized borrowers in order to generate additional income on behalf of the Fund. Pursuant to the Agreement, the securities loaned are secured by cash or U.S. government securities equal to at least 100% of the market value of the loaned securities. Any additional collateral required to maintain those levels due to market fluctuations of the loaned securities is delivered the following business day. Cash collateral received is invested by the lending agent on behalf of the Fund into authorized investments pursuant to the Agreement. The investments made with the cash collateral are listed in the Portfolio of Investments. The values of such investments and any uninvested cash collateral are disclosed in the Statement of Assets and Liabilities along with the related obligation to return the collateral upon the return of the securities loaned. For the year ended October 31, 2011, the Fund did not participate in securities lending activity.
Risks of delay in recovery of securities or even loss of rights in the securities may occur should the borrower of the securities fail financially. Risks may also arise to the extent that the value of the securities loaned increases above the value of the collateral received. JPMorgan will indemnify the Fund from losses resulting from a borrower's failure to return a loaned security when due. Such indemnification does not extend to losses associated with declines in the value of cash collateral investments. The Investment Manager is not responsible for any losses incurred by the Fund in connection with the securities lending program. Loans are subject to termination by the Fund or the borrower at any time, and are, therefore, not considered to be illiquid investments.
Pursuant to the Agreement, the Fund receives income for lending its securities either in the form of fees or by earning interest on invested cash collateral, net of negotiated rebates
28
Columbia New York Intermediate Municipal Bond Fund, October 31, 2011
paid to borrowers and fees paid to the lending agent for services provided and any other securities lending expenses. The Fund continues to earn and accrue interest and dividends on the securities loaned.
Prior to May 16, 2011, the Fund participated in a securities lending arrangement with State Street. Each security on loan was collateralized in an amount at least equal to the market value of the securities loaned plus accrued income from the investment of collateral. The income generated by the investment of the collateral, net of any fees remitted to State Street as the lending agent and borrower rebates, was paid to the Fund.
Note 7. Custody Credits
Prior to May 16, 2011, the Fund had an agreement with its custodian bank under which custody fees may have been reduced by balance credits. These credits are recorded as part of expense reductions on the Statement of Operations. The Fund could have invested a portion of the assets utilized in connection with the expense offset arrangement in an income-producing asset if they had not entered into such an agreement. For the period November 1, 2010 through May 16, 2011, these credits reduced total expenses by $2.
Note 8. Shareholder Concentration
At October 31, 2011, one shareholder account owned 76.8% of the outstanding shares of the Fund. Subscription and redemption activity of this account may have a significant effect on the operations of the Fund.
Note 9. Line of Credit
The Fund has entered into a revolving credit facility with a syndicate of banks led by JPMorgan Chase Bank, N.A. (the Administrative Agent), whereby the Fund may borrow for the temporary funding of shareholder redemptions or for other temporary or emergency purposes. The credit facility became effective on May 16, 2011, replacing a prior credit facility. The credit facility agreement which is a collective agreement between the Fund and certain other funds managed by the Investment Manager, severally and not jointly, permits collective borrowings up to $500,000,000.
Interest is charged to each participating fund based on its borrowings at a rate equal to the sum of the federal funds rate plus (i) 1.25% per annum plus (ii) if one-month LIBOR exceeds the federal funds rate, the amount of such excess. Each borrowing under the credit facility matures no later than 60 days after the date of borrowing. The Fund also pays a commitment fee equal to its pro rata share of the amount of the credit facility at a rate of 0.10% per annum.
For the period March 28, 2011 through May 15, 2011, the Fund and certain other funds managed by the Investment Manager participated in a $225,000,000 committed, unsecured revolving credit facility provided by State Street. Prior to March 28, 2011, the collective borrowing amount of the credit facility was $280,000,000. Interest was charged to each fund based on its borrowings at a rate equal to the greater of the (i) federal funds rate plus 1.25% per annum or (ii) the overnight LIBOR rate plus 1.25% per annum. The Fund also paid a commitment fee equal to its pro rata share of the amount of the credit facility at a rate of 0.125% per annum.
The Fund had no borrowings during the year ended October 31, 2011.
Effective December 13, 2011, the Fund extended its revolving credit facility with the Administrative Agent. The credit facility agreement, as amended, permits collective borrowings up to $500 million. Effective December 13, 2011, interest is charged to each participating fund based on its borrowings at a rate equal to the higher of (i) the overnight federal funds rate plus 1.00% or (i) the one-month LIBOR rate plus 1.00%. Each borrowing under the credit facility matures no later than 60 days after the date of borrowing. The Fund also pays a commitment fee equal to its pro rata share of the amount of the credit facility at a rate of 0.08% per annum.
Note 10. Significant Risks
Non-Diversification Risk
A non-diversified fund is permitted to invest a greater percentage of its total assets in fewer companies than a diversified fund. The Fund may, therefore, have a greater risk of loss from a few issuers than a similar fund that invests more broadly.
Geographic Concentration Risk
Because state-specific tax-exempt funds invest primarily in the municipal securities issued by the state and political sub-divisions of the state, the Fund will be particularly affected by political and economic conditions and
29
Columbia New York Intermediate Municipal Bond Fund, October 31, 2011
developments in the state in which it invests. The Fund may, therefore, have a greater risk than that of a municipal bond fund which is more geographically diversified. The value of the municipal securities owned by the Fund also may be adversely affected by future changes in federal or state income tax laws.
Tax Development Risk
The Fund purchases municipal securities whose interest, in the opinion of bond counsel, is free from federal income tax. There is no assurance that the Internal Revenue Service (IRS) will agree with this opinion. In the event the IRS determines that an issuer does not comply with relevant tax requirements, interest payments from a security could become federally taxable, possibly retroactively to the date the security was issued. As a shareholder of the Fund, you may be required to file an amended tax return as a result.
Note 11. Subsequent Events
Management has evaluated the events and transactions that have occurred through the date the financial statements were issued. Other than as noted in Note 9 above, there were no items requiring adjustment of the financial statements or additional disclosure.
Note 12. Information Regarding Pending and Settled Legal Proceedings
In June 2004, an action captioned John E. Gallus et al. v. American Express Financial Corp. and American Express Financial Advisors Inc. was filed in the United States District Court for the District of Arizona. The plaintiffs allege that they are investors in several American Express Company mutual funds (branded as Columbia) and they purport to bring the action derivatively on behalf of those funds under the Investment Company Act of 1940. The plaintiffs allege that fees allegedly paid to the defendants by the funds for investment advisory and administrative services are excessive. The plaintiffs seek remedies including restitution and rescission of investment advisory and distribution agreements. The plaintiffs voluntarily agreed to transfer this case to the United States District Court for the District of Minnesota (the District Court). In response to defendants' motion to dismiss the complaint, the District Court dismissed one of plaintiffs' four claims and granted plaintiffs limited discovery. Defendants moved for summary judgment in April 2007. Summary judgment was granted in the defendants' favor on July 9, 2007. The plaintiffs filed a notice of appeal with the Eighth Circuit Court of Appeals (the Eighth Circuit) on August 8, 2007. On April 8, 2009, the Eighth Circuit reversed summary judgment and remanded to the District Court for further proceedings. On August 6, 2009, defendants filed a writ of certiorari with the U.S. Supreme Court (the Supreme Court), asking the Supreme Court to stay the District Court proceedings while the Supreme Court considers and rules in a case captioned Jones v. Harris Associates, which involves issues of law similar to those presented in the Gallus case. On March 30, 2010, the Supreme Court issued its ruling in Jones v. Harris Associates, and on April 5, 2010, the Supreme Court vacated the Eighth Circuit's decision in the Gallus case and remanded the case to the Eighth Circuit for further consideration in light of the Supreme Court's decision in Jones v. Harris Associates. On June 4, 2010, the Eighth Circuit remanded the Gallus case to the District Court for further consideration in light of the Supreme Court's decision in Jones v. Harris Associates. On December 9, 2010, the District Court reinstated its July 9, 2007 summary judgment order in favor of the defendants. On January 10, 2011, plaintiffs filed a notice of appeal with the Eighth Circuit. In response to the plaintiffs' opening appellate brief filed on March 18, 2011, the defendants filed a response brief on May 4, 2011 with the Eighth Circuit. The plaintiffs filed a reply brief on May 26, 2011 and oral arguments took place on November 17, 2011.
In December 2005, without admitting or denying the allegations, American Express Financial Corporation (AEFC, which is now known as Ameriprise Financial, Inc. (Ameriprise Financial)), entered into settlement agreements with the Securities and Exchange Commission (SEC) and Minnesota Department of Commerce (MDOC) related to market timing activities. As a result, AEFC was censured and ordered to cease and desist from committing or causing any violations of certain provisions of the Investment Advisers Act of 1940, the Investment Company Act of 1940, and various Minnesota laws. AEFC agreed to pay disgorgement of $10 million and civil money penalties of $7 million. AEFC also agreed to retain an independent distribution consultant to assist in developing a plan for distribution of all disgorgement and civil penalties ordered by the SEC in accordance with various undertakings detailed at www.sec.gov/litigation/admin/ia-2451.pdf. Ameriprise
30
Columbia New York Intermediate Municipal Bond Fund, October 31, 2011
Financial and its affiliates have cooperated with the SEC and the MDOC in these legal proceedings, and have made regular reports to the funds' Boards of Trustees.
Ameriprise Financial and certain of its affiliates have historically been involved in a number of legal, arbitration and regulatory proceedings, including routine litigation, class actions, and governmental actions, concerning matters arising in connection with the conduct of their business activities. Ameriprise Financial believes that the Funds are not currently the subject of, and that neither Ameriprise Financial nor any of its affiliates are the subject of, any pending legal, arbitration or regulatory proceedings that are likely to have a material adverse effect on the Funds or the ability of Ameriprise Financial or its affiliates to perform under their contracts with the Funds. Ameriprise Financial is required to make 10-Q, 10-K and, as necessary, 8-K filings with the Securities and Exchange Commission on legal and regulatory matters that relate to Ameriprise Financial and its affiliates. Copies of these filings may be obtained by accessing the SEC website at www.sec.gov.
There can be no assurance that these matters, or the adverse publicity associated with them, will not result in increased fund redemptions, reduced sale of fund shares or other adverse consequences to the Funds. Further, although we believe proceedings are not likely to have a material adverse effect on the Funds or the ability of Ameriprise Financial or its affiliates to perform under their contracts with the Funds, these proceedings are subject to uncertainties and, as such, we are unable to estimate the possible loss or range of loss that may result. An adverse outcome in one or more of these proceedings could result in adverse judgments, settlements, fines, penalties or other relief that could have a material adverse effect on the consolidated financial condition or results of operations of Ameriprise Financial.
31
Report of Independent Registered Public Accounting Firm
To the Trustees of Columbia Funds Series Trust I and the Shareholders of Columbia New York Intermediate Municipal Bond Fund
In our opinion, the accompanying statement of assets and liabilities, including the investment portfolio, and the related statements of operations and of changes in net assets and the financial highlights present fairly, in all material respects, the financial position of Columbia New York Intermediate Municipal Bond Fund (the "Fund") (a series of Columbia Funds Series Trust I) at October 31, 2011, and the results of its operations for the year then ended, the changes in its net assets for each of the two years in the period then ended and the financial highlights for each of the periods indicated, in conformity with accounting principles generally accepted in the United States of America. These financial statements and financial highlights (hereafter referred to as "financial statements") are the responsibility of the Fund's management. Our responsibility is to express an opinion on these financial statements based on our audits. We conducted our audits of these financial statements in accordance with the standards of the Public Company Accounting Oversight Board (United States). Those standards require that we plan and perform the audit to obtain reasonable assurance about whether the financial statements are free of material misstatement. An audit includes examining, on a test basis, evidence supporting the amounts and disclosures in the financial statements, assessing the accounting principles used and significant estimates made by management, and evaluating the overall financial statement presentation. We believe that our audits, which included confirmation of securities at October 31, 2011 by correspondence with the custodian and brokers, provide a reasonable basis for our opinion.
PricewaterhouseCoopers LLP
Minneapolis, Minnesota
December 22, 2011
32
Federal Income Tax Information (Unaudited) – Columbia New York Intermediate Municipal Bond Fund
For the fiscal year ended October 31, 2011, 100.0% of the distributions from net investment income of the Fund qualifies as exempt interest dividends for federal income tax purposes. A portion of the income may be subject to federal alternative minimum tax.
The Fund will notify shareholders in January 2012 of amounts for use in preparing 2011 income tax returns.
33
Fund Governance
The Trustees serve terms of indefinite duration. The names, addresses and birth years of the Trustees and Officers of the Funds in Columbia Funds Series Trust I, the year each was first elected or appointed to office, their principal business occupations during at least the last five years, the number of Funds overseen by each Trustee and other directorships they hold are shown below. Each officer listed below serves as an officer of each Fund in Columbia Funds Series Trust I.
Independent Trustees
Name, Address and Year of Birth,
Position with Funds, Year First
Elected or Appointed to Office | | Principal Occupation(s) During Past Five Years, Number of Funds in Columbia
Funds Complex Overseen by Trustee, Other Directorships Held
| |
| Rodman L. Drake (Born 1943) | |
|
c/o Columbia Management
Investment Advisers, LLC
225 Franklin Street
Boston, MA 02110
Trustee (since 1994) and Chairman of the Board (since 2009) | | Independent consultant since 2010; Co-Founder of Baringo Capital LLC (private equity) from 1997 to 2008; CEO of Crystal River Capital, Inc. (real estate investment trust) from 2003 to 2010; Oversees 43; Jackson Hewitt Tax Service Inc. (tax preparation services from 2004 to 2011); Celgene Corporation (global biotechnology company); Student Loan Corporation (student loan provider from 2008 to 2010); Celgene Corporation (global biotechnology company); The Helios Funds and Brookfield Funds (closed-end funds); Crystal River Capital, Inc. from 2005 to 2010; Parson Brinckerhoff from 1995 to 2008; and Apex Silver Mines Ltd. from 2007 to 2009 | |
|
| Douglas A. Hacker (Born 1955) | |
|
c/o Columbia Management
Investment Advisers, LLC
225 Franklin Street
Boston, MA 02110
Trustee (since 1996) | | Independent business executive since May 2006; Executive Vice President—Strategy of United Airlines from December 2002 to May 2006; President of UAL Loyalty Services (airline marketing company) from September 2001 to December 2002; Executive Vice President and Chief Financial Officer of United Airlines from July 1999 to September 2001. Oversees 43; Nash Finch Company (food distributor); Aircastle Limited (aircraft leasing); and SeaCube Container Leasing Ltd (container leasing) | |
|
| Janet Langford Kelly (Born 1957) | |
|
c/o Columbia Management
Investment Advisers, LLC
225 Franklin Street
Boston, MA 02110
Trustee (since 1996) | | Senior Vice President, General Counsel and Corporate Secretary, ConocoPhillips (integrated energy company) since September 2007; Deputy General Counsel—Corporate Legal Services, ConocoPhillips from August 2006 to August 2007; Partner, Zelle, Hofmann, Voelbel, Mason & Gette LLP (law firm) from March 2005 to July 2006; Adjunct Professor of Law, Northwestern University, from September 2004 to June 2006; Director, UAL Corporation (airline) from February 2006 to July 2006; Oversees 43; None | |
|
| Nancy T. Lukitsh (Born 1956) | |
|
c/o Columbia Management
Investment Advisers, LLC
225 Franklin Street
Boston, MA 02110
Trustee (since 2011) | | Senior Vice President, Partner and Director, Marketing of Wellington Management Company, LLP (investment adviser) from 1997 to 2010; Chair, Wellington Management Investment Portfolios (commingled non-U.S. investment pools) from 2007 to 2010; Director, Wellington Trust Company, NA and other Wellington affiliates from 1997 to 2010. Oversees 43; None | |
|
34
Fund Governance (continued)
Independent Trustees (continued)
Name, Address and Year of Birth,
Position with Funds, Year First
Elected or Appointed to Office | | Principal Occupation(s) During Past Five Years, Number of Funds in Columbia
Funds Complex Overseen by Trustee, Other Directorships Held
| |
| William E. Mayer (Born 1940) | |
|
c/o Columbia Management
Investment Advisers, LLC
225 Franklin Street
Boston, MA 02110
Trustee (since 1994) | | Partner, Park Avenue Equity Partners (private equity) since February 1999; Dean and Professor, College of Business and Management, University of Maryland from 1992 to 1996. Oversees 43; DynaVox Inc. (speech creation); Lee Enterprises (print media); WR Hambrecht + Co. (financial service provider); BlackRock Kelso Capital Corporation (investment company) | |
|
| David M. Moffett (Born 1952) | |
|
c/o Columbia Management
Investment Advisers, LLC
225 Franklin Street
Boston, MA 02110
Trustee (since 2011) | | Retired. Chief Executive Officer, Federal Home Loan Mortgage Corporation, from 2008 to 2009; Senior Adviser, Global Financial Services Group, Carlyle Group, Inc., from 2007 to 2008; Vice Chairman and Chief Financial Officer, U.S. Bancorp, from 1993 to 2007. Oversees 43; CIT Group Inc. (commercial and consumer finance), eBay Inc. (online trading community), MBIA Corp (financial service provider), E.W. Scripps Co. (print and television media), Building Materials Holding Corp. (building materials and construction services), and University of Oklahoma Foundation. | |
|
| Charles R. Nelson (Born 1942) | |
|
c/o Columbia Management
Investment Advisers, LLC
225 Franklin Street
Boston, MA 02110
Trustee (since 1981) | | Retired Professor Emeritus, University of Washington, since 2011; Professor of Economics, University of Washington, from January 1976 to 2011; Ford and Louisa Van Voorhis Professor of Political Economy, University of Washington, from 1993 to 2011; Adjunct Professor of Statistics, University of Washington, from 1980 to 2011; Associate Editor, Journal of Money Credit and Banking from 1993 to 2008; consultant on econometric and statistical matters. Oversees 43; None | |
|
| John J. Neuhauser (Born 1943) | |
|
c/o Columbia Management
Investment Advisers, LLC
225 Franklin Street
Boston, MA 02110
Trustee (since 1984) | | President, Saint Michael's College, since August 2007; Director or Trustee of several non-profit organizations, including Fletcher Allen Health Care, Inc.; University Professor, Boston College from November 2005 to August 2007; Academic Vice President and Dean of Faculties, Boston College from August 1999 to October 2005. Oversees 43; Liberty All-Star Equity Fund and Liberty All-Star Growth Fund (closed-end funds) | |
|
| Patrick J. Simpson (Born 1944) | |
|
c/o Columbia Management
Investment Advisers, LLC
225 Franklin Street
Boston, MA 02110
Trustee (since 2000) | | Partner, Perkins Coie LLP (law firm). Oversees 43; None | |
|
| Anne-Lee Verville (Born 1945) | |
|
c/o Columbia Management
Investment Advisers, LLC
225 Franklin Street
Boston, MA 02110
Trustee (since 1998) | | Retired since 1997 (formerly General Manager–Global Education Industry from 1994 to 1997, President–Application Systems Division from 1991 to 1994, Chief Financial Officer–US Marketing & Services from 1988 to 1991, and Chief Information Officer from 1987 to 1988, IBM Corporation (computer and technology)). Oversees 43; Enesco Group, Inc. (producer of giftware and home and garden decor products) from 2001 to 2006 | |
|
35
Fund Governance (continued)
Interested Trustee
Name, Address and Year of Birth,
Position with Funds, Year First
Elected or Appointed to Office | | Principal Occupation(s) During Past Five Years, Number of Funds in Columbia
Funds Complex Overseen by Trustee, Other Directorships Held
| |
| Michael A. Jones (born 1959) | |
|
c/o Columbia Management
Investment Advisers, LLC
225 Franklin Street
Boston, MA 02110
Trustee (since 2011)
Senior Vice President (since 2011) | | President and Director, Columbia Management Investment Advisers, LLC since May 2010; President and Director, Columbia Management Investment Distributors, Inc. since May 2010; Manager, Chairman, Chief Executive Officer and President, Columbia Management Advisors, LLC from 2007 to April 2010; Chief Executive Officer, President and Director, Columbia Management Distributors, Inc. from November 2006 to April 2010; previously, co-president and senior managing director at Robeco Investment Management. Oversees 43; None | |
|
The Statement of Additional Information includes additional information about the Trustees of the Funds and is available, without charge, upon request by calling 1-800-345-6611.
Officers
| Name, Year of Birth and Address | | Principal Occupation(s) During the Past Five Years | |
| J. Kevin Connaughton (Born 1964) | |
|
225 Franklin Street
Boston, MA 02110
President (since 2009) | | Senior Vice President and General Manager–Mutual Fund Products, Columbia Management Investment Advisers, LLC since May 2010; President, Columbia Funds, since 2009, and RiverSource Funds, since May 2010 (previously Senior Vice President and Chief Financial Officer, Columbia Funds, from June 2008 to January 2009, Treasurer, Columbia Funds, from October 2003 to May 2008, and senior officer of various other affiliated funds since 2000); Managing Director, Columbia Management Advisors, LLC from December 2004 to April 2010. | |
|
| Michael G. Clarke (Born 1969) | |
|
225 Franklin Street
Boston, MA 02110
Treasurer (since 2011) and Chief
Financial Officer (since 2009) | | Vice President, Columbia Management Investment Advisers, LLC since May 2010; Managing Director of Fund Administration, Columbia Management Advisors, LLC, from September 2004 to April 2010; senior officer of Columbia Funds and affiliated funds since 2002. | |
|
| Scott R. Plummer (Born 1959) | |
|
5228 Ameriprise Financial Center
Minneapolis, MN 55474
Senior Vice President, Assistant Secretary
and Chief Legal Officer (since 2010) | | Chief Legal Officer and Assistant Secretary, Columbia Management Investment Advisers, LLC since June 2005; Vice President and Lead Chief Counsel–Asset Management, Ameriprise Financial, Inc. since May 2010 (previously Vice President and Chief Counsel–Asset Management, from 2005 to April 2010, and Vice President–Asset Management Compliance from 2004 to 2005); Vice President, Chief Counsel and Assistant Secretary, Columbia Management Investment Distributors, Inc. since 2008; Vice President, General Counsel and Secretary, Ameriprise Certificate Company since 2005; Chief Counsel, RiverSource Distributors, Inc. since 2006; Vice President, General Counsel and Secretary, RiverSource Funds, since December 2006; Senior Vice President, Secretary and Chief Legal Officer, Columbia Funds, since May 2010. | |
|
36
Fund Governance (continued)
Officers (continued)
| Name, Year of Birth and Address | | Principal Occupation(s) During the Past Five Years | |
| Linda J. Wondrack (Born 1964) | |
|
225 Franklin Street
Boston, MA 02110
Senior Vice President and Chief
Compliance Officer (since 2007) | | Vice President and Chief Compliance Officer, Columbia Management Investment Advisers, LLC since May 2010; Chief Compliance Officer, Columbia Funds, since 2007, and RiverSource Funds, since May 2010; Director (Columbia Management Group, LLC and Investment Product Group Compliance), Bank of America, from June 2005 to April 2010; Director of Corporate Compliance and Conflicts Officer of MFS Investment Management (investment management) from August 2004 to May 2005. | |
|
| William F. Truscott (Born 1960) | |
|
53600 Ameriprise Financial Center
Minneapolis, MN 55474
Senior Vice President (since 2010) | | Chairman of the Board, Columbia Management Investment Advisers, LLC since May 2010 (previously President, Chairman of the Board and Chief Investment Officer, from 2001 to April 2010); Chief Executive Officer, U.S. Asset Management & President, Annuities, Ameriprise Financial, Inc. since May 2010 (previously President–U.S. Asset Management and Chief Investment Officer from 2005 to April 2010, and Senior Vice President—Chief Investment Officer, from 2001 to 2005); Director, President and Chief Executive Officer, Ameriprise Certificate Company since 2006; Director, Columbia Management Investment Distributors, Inc. since May 2010 (previously Chairman of the Board and Chief Executive Officer from 2008 to April 2010); Chairman of the Board and Chief Executive Officer, RiverSource Distributors, Inc. since 2006. | |
|
| Colin Moore (Born 1958) | |
|
225 Franklin Street
Boston, MA 02110
Senior Vice President (since 2010) | | Director and Chief Investment Officer, Columbia Management Investment Advisers, LLC since May 2010; Manager, Managing Director and Chief Investment Officer of Columbia Management Advisors, LLC from 2007 to April 2010; Head of Equities, Columbia Management Advisors, LLC from 2002 to 2007. | |
|
| Amy Johnson (Born 1965) | |
|
5228 Ameriprise Financial Center
Minneapolis, MN 55474
Vice President (since 2010) | | Senior Vice President and Chief Operating Officer, Columbia Management Investment Advisers, LLC since May 2010 (previously Chief Administrative Officer, from 2009 until April 2010, Vice President—Asset Management and Trust Company Services, from 2006 to 2009, and Vice President—Operations and Compliance from 2004 to 2006). | |
|
| Joseph F. DiMaria (Born 1968) | |
|
225 Franklin Street
Boston, MA 02110
Vice President (since 2011) and
Chief Accounting Officer (since 2008) | | Vice President, Mutual Fund Administration, Columbia Management Investment Advisers, LLC, since May 2010; Director of Fund Administration, Columbia Management Advisors, LLC from January 2006 to April 2010; Head of Tax/Compliance and Assistant Treasurer, Columbia Management Advisors, LLC, from November 2004 to December 2005. | |
|
| Stephen T. Welsh (born 1957) | |
|
225 Franklin Street
Boston, MA 02110
Vice President (since 2006) | | President and Director, Columbia Management Investment Services Corp. since May 2010; President and Director, Columbia Management Services, Inc. from July 2004 to April 2010; Managing Director, Columbia Management Distributors, Inc. from August 2007 to April 2010. | |
|
37
Fund Governance (continued)
Officers (continued)
| Name, Year of Birth and Address | | Principal Occupation(s) During the Past Five Years | |
| Paul D. Pearson (born 1956) | |
|
5228 Ameriprise Financial Center
Minneapolis, MN 55474
Vice President and Assistant
Treasurer (since 2011) | | Vice President, Investment Accounting, Columbia Management Investment Advisers, LLC, since May 2010; Vice President, Managed Assets, Investment Accounting, Ameriprise Financial Corporation. | |
|
| Paul B. Goucher (born 1968) | |
|
5228 Ameriprise Financial Center
Minneapolis, MN 55474
Vice President and Assistant
Secretary (since 2010) | | Vice President and Chief Counsel of Ameriprise Financial since January 2010 (formerly Vice President and Group Counsel from November 2008 to January 2010); Director, Managing Director and General Counsel of J. & W. Seligman & Co. Incorporated (Seligman) from July 2008 to November 2008 and Managing Director and Associate General Counsel of Seligman from January 2005 to July 2008. | |
|
| Christopher O. Petersen (born 1970) | |
|
5228 Ameriprise Financial Center
Minneapolis, MN 55474
Vice President (since 2010) and
Secretary (since 2011) | | Vice President and Chief Counsel, Ameriprise Financial since January 2010 (formerly Vice President and Group Counsel or Counsel from April 2004 to January 2010); Assistant Secretary of RiverSource Funds since January 2007. | |
|
| Michael E. DeFao (born 1968) | |
|
5228 Ameriprise Financial Center
Minneapolis, MN 55474
Vice President and Assistant
Secretary (since 2011) | | Vice President and Chief Counsel, Ameriprise Financial since May 2010; Associate General Counsel Bank of America from June 2005 to April 2010 | |
|
38
This page intentionally left blank.
This page intentionally left blank.
Important Information About This Report
The fund mails one shareholder report to each shareholder address. If you would like more than one report, please call shareholder services at 1-800-345-6611 and additional reports will be sent to you. This report has been prepared for shareholders of Columbia New York Intermediate Municipal Bond Fund.
A description of the policies and procedures that the fund uses to determine how to vote proxies and a copy of the fund's voting records are available (i) at www.columbiamanagement.com, (ii) on the Securities and Exchange Commission's website at www.sec.gov, and (iii) without charge, upon request, by calling 1-800-368-0346. Information regarding how the fund voted proxies relating to portfolio securities during the 12-month period ended June 30 is available from the SEC's website. Information regarding how the fund voted proxies relating to portfolio securities is also available from the fund's website, www.columbiamanagement.com.
The fund files a complete schedule of portfolio holdings with the SEC for the first and third quarters of each fiscal year on Form N-Q. The fund's Form N-Q is available on the SEC's website at www.sec.gov and may be reviewed and copied at the SEC's Public Reference Room in Washington, D.C. Information on the operation of the Public Reference Room may be obtained by calling 1-800-SEC-0330.
Transfer Agent
Columbia Management Investment
Services Corp.
P.O. Box 8081
Boston, MA 02266-8081
1-800-345-6611
Distributor
Columbia Management Investment
Distributors, Inc.
225 Franklin Street
Boston, MA 02110
Investment Manager
Columbia Management Investment Advisers, LLC
225 Franklin Street
Boston, MA 02110
41

Columbia New York Intermediate Municipal Bond Fund
P. O. Box 8081
Boston, MA 02266-8081
columbiamanagement.com
This information is for use with concurrent or prior delivery of a fund prospectus. Investors should consider the investment objectives, risks, charges and expenses of a mutual fund carefully before investing. For a free prospectus, which contains this and other important information about the funds, visit columbiamanagement.com. Read the prospectus carefully before investing. The Fund is distributed by Columbia Management Investment Distributors, Inc., member FINRA, and managed by Columbia Management Investment Advisers, LLC.
© 2011 Columbia Management Investment Advisers, LLC. All rights reserved.
C-1741 C (12/11)
Item 2. Code of Ethics.
(a) The registrant has adopted a code of ethics that applies to the registrant’s principal executive officer, principal financial officer, principal accounting officer or controller, or persons performing similar functions, regardless of whether these individuals are employed by the registrant or a third party.
(b) During the period covered by this report, there were not any amendments to a provision of the code of ethics adopted in 2(a) above.
(c) During the period covered by this report, there were no waivers, including any implicit waivers, from a provision of the code of ethics described in 2(a) above that relates to one or more of the items set forth in paragraph (b) of this item’s instructions.
Item 3. Audit Committee Financial Expert.
The registrant’s Board of Trustees has determined that Douglas A. Hacker, David M. Moffett, Charles R. Nelson and Anne-Lee Verville, each of whom are members of the registrant’s Board of Trustees and Audit Committee, each qualify as an audit committee financial expert. Mr. Hacker, Mr. Moffett, Mr. Nelson and Ms. Verville are each independent trustees, as defined in paragraph (a)(2) of this item’s instructions.
Item 4. Principal Accountant Fees and Services.
Fee information below is disclosed for the eight series of the registrant whose report to stockholders are included in this annual filing. Fee information for fiscal year ended October 31, 2011 also includes fees for two series that merged during the period.
(a) Audit Fees. Aggregate Audit Fees billed by the principal accountant for professional services rendered during the fiscal years ended October 31, 2011 and October 31, 2010 are approximately as follows:
2011 | | 2010 | |
$ | 245,300 | | $ | 304,200 | |
| | | | | |
Audit Fees include amounts related to the audit of the registrant’s annual financial statements or services that are normally provided by the accountant in connection with
statutory and regulatory filings or engagements for those fiscal years. Audit fees in fiscal year 2011 also include fees for the review of and provision of consent in connection with filing Form N-1A for new share classes.
(b) Audit-Related Fees. Aggregate Audit-Related Fees billed to the registrant by the principal accountant for professional services rendered during the fiscal years ended October 31, 2011 and October 31, 2010 are approximately as follows:
2011 | | 2010 | |
$ | 100,000 | | $ | 46,000 | |
| | | | | |
Audit-Related Fees include amounts for assurance and related services by the principal accountant that are reasonably related to the performance of the audit of the registrant’s financial statements and are not reported in Audit Fees above. In both fiscal years 2011 and 2010, Audit-Related Fees consist of agreed-upon procedures performed for semi-annual shareholder reports. Fiscal year 2011 also includes Audit-Related Fees for agreed- upon procedures related to fund mergers and fund accounting and custody conversions.
During the fiscal years ended October 31, 2011 and October 31, 2010, there were no Audit-Related Fees billed by the registrant’s principal accountant to the registrant’s investment adviser (not including any sub-adviser whose role is primarily portfolio management and is subcontracted with or overseen by another investment adviser) and any entity controlling, controlled by, or under common control with the adviser that provides ongoing services to the registrant for an engagement that related directly to the operations and financial reporting of the registrant.
(c) Tax Fees. Aggregate Tax Fees billed by the principal accountant to the registrant for professional services rendered during the fiscal years ended October 31, 2011 and October 31, 2010 are approximately as follows:
2011 | | 2010 | |
$ | 83,300 | | $ | 45,300 | |
| | | | | |
Tax Fees include amounts for the review of annual tax returns, the review of required shareholder distribution calculations and typically include amounts for professional services by the principal accountant for tax compliance, tax advice and tax planning. In fiscal year 2011, Tax Fees also include agreed-upon procedures related to fund mergers and the review of final tax returns and amortization and accretion testing.
During the fiscal years ended October 31, 2011 and October 31, 2010, there were no Tax Fees billed by the registrant’s principal accountant to the registrant’s investment adviser (not including any sub-adviser whose role is primarily portfolio management and is subcontracted with or overseen by another investment adviser) and any entity controlling, controlled by, or under common control with the adviser that provides ongoing services to the registrant for an engagement that related directly to the operations and financial reporting of the registrant.
(d) All Other Fees. Aggregate All Other Fees billed by the principal accountant to the registrant for professional services rendered during the fiscal years ended October 31, 2011 and October 31, 2010 are approximately as follows:
All Other Fees include amounts for products and services provided by the principal accountant, other than the services reported in paragraphs (a) through (c) above.
Aggregate All Other Fees billed by the registrant’s principal accountant to the registrant’s investment adviser (not including any sub-adviser whose role is primarily portfolio management and is subcontracted with or overseen by another investment adviser) and any entity controlling, controlled by, or under common control with the adviser that provides ongoing services to the registrant for an engagement that related directly to the operations and financial reporting of the registrant during the fiscal years ended October 31, 2011 and October 31, 2010 are approximately as follows:
2011 | | 2010 | |
$ | 215,300 | | $ | 1,179,300 | |
| | | | | |
In both fiscal years 2011 and 2010, All Other Fees consist of fees billed for internal control examinations of the registrant’s transfer agent and investment advisor. Fiscal year 2010 also includes fees for agreed upon procedures related to the sale of the long-term asset management business and fees related to the review of revenue modeling schedules.
(e)(1) Audit Committee Pre-Approval Policies and Procedures
The registrant’s Audit Committee is required to pre-approve the engagement of the registrant’s independent accountants to provide audit and non-audit services to the registrant and non-audit services to its investment adviser (not including any sub-adviser whose role is primarily portfolio management and is subcontracted with or overseen by another investment adviser) or any entity controlling, controlled by or under common control with such investment adviser that provides ongoing services to the registrant (“Adviser Affiliates”), if the engagement relates directly to the operations and financial reporting of the registrant.
The Audit Committee has adopted a Policy for Engagement of Independent Accountants for Audit and Non-Audit Services (“Policy”). The Policy sets forth the understanding of the Audit Committee regarding the engagement of the registrant’s independent accountants to provide (i) audit and permissible audit-related, tax and other services to the registrant (collectively “Fund Services”); (ii) non-audit services to the registrant’s investment adviser (not including any sub-adviser whose role is primarily portfolio management and is subcontracted with or overseen by another investment adviser) and
Adviser Affiliates, if the engagement relates directly to the operations or financial reporting of a Fund (collectively “Fund-related Adviser Services”); and (iii) certain other audit and non-audit services to the registrant’s investment adviser (not including any sub-adviser whose role is primarily portfolio management and is subcontracted with or overseen by another investment adviser) and Adviser Affiliates. As set forth in this Fund Policy, a service will require specific pre-approval by the Audit Committee if it is to be provided by the Fund’s independent auditor; provided, however, that pre-approval of non-audit services to the Fund, the Adviser or Control Affiliates may be waived if certain de minimis requirements set forth in the SEC’s rules are met.
Under the Policy, the Audit Committee may delegate pre-approval authority to any pre-designated member or members who are Independent Trustees/Directors. The member(s) to whom such authority is delegated must report, for informational purposes only, any pre-approval decisions to the Audit Committee at its next regular meeting. The Audit Committee’s responsibilities with respect to the pre-approval of services performed by the independent accountants may not be delegated to management.
On an annual basis, at a regularly scheduled Audit Committee meeting, the Fund’s Treasurer or other Fund Officer shall submit to the Audit Committee a schedule of the types of Fund Services and Fund-related Adviser Services that are subject to specific pre-approval.
This schedule will provide a description of each type of service that is subject to specific pre-approval, along with total projected fees for each service. The pre-approval will generally cover a one-year period. The Audit Committee will review and approve the types of services and the projected fees for the next one-year period and may add to, or subtract from, the list of pre-approved services from time to time, based on subsequent determinations. This specific approval acknowledges that the Audit Committee is in agreement with the types of services that the independent accountants will be permitted to perform.
The Fund’s Treasurer or other Fund Officer shall report to the Audit Committee at each of its regular meetings regarding all Fund Services or Fund-related Adviser Services initiated since the last such report was rendered, including a general description of the services with forecasted fees for the annual period, proposed changes requiring specific pre-approval and a description of services provided by the independent auditor with actual fees during the current reporting period.
*****
(e)(2) The percentage of services described in paragraphs (b) through (d) of this Item approved pursuant to the “de minimis” exception under paragraph (c)(7)(i)(C) of Rule 2-01 of Regulation S-X during both fiscal years ended October 31, 2011 and October 31, 2010 was zero.
(f) Not applicable.
(g) The aggregate non-audit fees billed by the registrant’s accountant for services rendered to the registrant, and rendered to the registrant’s investment adviser (not including any sub-adviser whose role is primarily portfolio management and is subcontracted with or overseen by another investment adviser), and any entity controlling, controlled by, or under common control with the adviser that provides ongoing services to the registrant for the fiscal years ended October 31, 2011 and October 31, 2010 are approximately as follows:
2011 | | 2010 | |
$ | 398,600 | | $ | 1,270,600 | |
| | | | | |
(h) The registrant’s Audit Committee of the Board of Directors has considered whether the provision of non-audit services that were rendered to the registrant’s adviser (not including any sub-adviser whose role is primarily portfolio management and is subcontracted with or overseen by another investment adviser), and any entity controlling, controlled by, or under common control with the investment adviser that provides ongoing services to the registrant that were not pre-approved pursuant to paragraph (c)(7)(ii) of Rule 2-01 of Regulation S-X, is compatible with maintaining the principal accountant’s independence.
Item 5. Audit Committee of Listed Registrants.
Not applicable.
Item 6. Investments
(a) The registrant’s “Schedule I — Investments in securities of unaffiliated issuers” (as set forth in 17 CFR 210.12-12) is included in Item 1 of this Form N-CSR.
(b) Not applicable.
Item 7. Disclosure of Proxy Voting Policies and Procedures for Closed-End Management Investment Companies.
Not applicable.
Item 8. Portfolio Managers of Closed-End Management Investment Companies.
Not applicable.
Item 9. Purchases of Equity Securities by Closed-End Management Investment Company and Affiliated Purchasers.
Not applicable.
Item 10. Submission of Matters to a Vote of Security Holders.
There were no material changes to the procedures by which shareholders may recommend nominees to the registrant’s board of directors.
Item 11. Controls and Procedures.
(a) The registrant’s principal executive officer and principal financial officers, based on their evaluation of the registrant’s disclosure controls and procedures as of a date within 90 days of the filing of this report, have concluded that such controls and procedures are adequately designed to ensure that material information required to be disclosed by the registrant in Form N-CSR is accumulated and communicated to the registrant’s management, including the principal executive officer and principal financial officer, or persons performing similar functions, as appropriate to allow timely decisions regarding required disclosure.
(b) There was no change in the registrant’s internal control over financial reporting that occurred during the registrant’s second fiscal quarter of the period covered by this report that has materially affected, or is reasonably likely to materially affect, the registrant’s internal control over financial reporting.
Item 12. Exhibits.
(a)(1) Code of ethics required to be disclosed under Item 2 of Form N-CSR attached hereto as Exhibit 99.CODE ETH.
(a)(2) Certifications pursuant to Rule 30a-2(a) under the Investment Company Act of 1940 (17 CFR 270.30a-2(a)) attached hereto as Exhibit 99.CERT.
(a)(3) Not applicable.
(b) Certification pursuant to Rule 30a-2(b) under the Investment Company Act of 1940 (17 CFR 270.30a-2(b)) attached hereto as Exhibit 99.906CERT.
SIGNATURES
Pursuant to the requirements of the Securities Exchange Act of 1934 and the Investment Company Act of 1940, the registrant has duly caused this report to be signed on its behalf by the undersigned, thereunto duly authorized.
(registrant) | | Columbia Funds Series Trust I | |
| | | |
| | | |
By (Signature and Title) | | /s/ J. Kevin Connaughton | |
| | J. Kevin Connaughton, President | |
| | | |
| | | |
Date | | December 22, 2011 | |
| | | | | |
Pursuant to the requirements of the Securities Exchange Act of 1934 and the Investment Company Act of 1940, this report has been signed below by the following persons on behalf of the registrant and in the capacities and on the dates indicated.
By (Signature and Title) | | / s/ J. Kevin Connaughton | |
| | J. Kevin Connaughton, President | |
| | | |
| | | |
Date | | December 22, 2011 | |
| | | |
| | | |
By (Signature and Title) | | /s/ Michael G. Clarke | |
| | Michael G. Clarke, Chief Financial Officer | |
| | | |
| | | |
Date | | December 22, 2011 | |
| | | | | |