UNITED STATES
SECURITIES AND EXCHANGE COMMISSION
Washington, D.C. 20549
FORM N-CSR
CERTIFIED SHAREHOLDER REPORT OF REGISTERED
MANAGEMENT INVESTMENT COMPANIES
Investment Company Act file number | 811-04367 |
|
Columbia Funds Series Trust I |
(Exact name of registrant as specified in charter) |
|
225 Franklin Street, Boston, Massachusetts | | 02110 |
(Address of principal executive offices) | | (Zip code) |
|
Scott R. Plummer
5228 Ameriprise Financial Center
Minneapolis, MN 55474 |
(Name and address of agent for service) |
|
Registrant’s telephone number, including area code: | 1-612-671-1947 | |
|
Date of fiscal year end: | November 30 | |
|
Date of reporting period: | November 30, 2011 | |
| | | | | | | | |
Form N-CSR is to be used by management investment companies to file reports with the Commission not later than 10 days after the transmission to stockholders of any report that is required to be transmitted to stockholders under Rule 30e-1 under the Investment Company Act of 1940 (17 CFR 270.30e-1). The Commission may use the information provided on Form N-CSR in its regulatory, disclosure review, inspection, and policymaking roles.
A registrant is required to disclose the information specified by Form N-CSR, and the Commission will make this information public. A registrant is not required to respond to the collection of information contained in Form N-CSR unless the Form displays a currently valid Office of Management and Budget (“OMB”) control number. Please direct comments concerning the accuracy of the information collection burden estimate and any suggestions for reducing the burden to Secretary, Securities and Exchange Commission, 450 Fifth Street, NW, Washington, DC 20549-0609. The OMB has reviewed this collection of information under the clearance requirements of 44 U.S.C. § 3507.
Item 1. Reports to Stockholders.

Columbia Tax-Exempt Fund
Annual Report for the Period Ended November 30, 2011
Not FDIC insured • No bank guarantee • May lose value
Table of Contents
| Fund Profile | | | 1 | | |
|
| Performance Information | | | 2 | | |
|
| Understanding Your Expenses | | | 3 | | |
|
| Portfolio Manager's Report | | | 4 | | |
|
| Portfolio of Investments | | | 6 | | |
|
Statement of Assets and
Liabilities | | | 40 | | |
|
| Statement of Operations | | | 42 | | |
|
Statement of Changes in
Net Assets | | | 43 | | |
|
| Financial Highlights | | | 45 | | |
|
| Notes to Financial Statements | | | 49 | | |
|
Report of Independent Registered
Public Accounting Firm | | | 61 | | |
|
| Federal Income Tax Information | | | 62 | | |
|
| Fund Governance | | | 63 | | |
|
Important Information About
This Report | | | 69 | | |
|
The views expressed in this report reflect the current views of the respective parties. These views are not guarantees of future performance and involve certain risks, uncertainties and assumptions that are difficult to predict, so actual outcomes and results may differ significantly from the views expressed. These views are subject to change at any time based upon economic, market or other conditions and the respective parties disclaim any responsibility to update such views. These views may not be relied on as investment advice and, because investment decisions for a Columbia Fund are based on numerous factors, may not be relied on as an indication of trading intent on behalf of any particular Columbia Fund. References to specific securities should not be construed as a recommendation or investment advice.
President's Message

Dear Shareholders,
Economic momentum slowed in the third quarter of 2011, raising the odds of recession and making the U.S. economy more susceptible to financial shocks. The unemployment rate remained stalled as growing uncertainty continued to weigh on prospective employers. Monthly indicators for the manufacturing and service sectors also showed signs of slowing. Equity and high-yield bond markets fell sharply as investor confidence was shaken by Europe's lingering debt crisis, a heated debate in Washington over fiscal deficits (which eventually led to a downgrade of U.S. government debt) and tepid economic growth. The U.S. stock market experienced its worst quarter in two years during the third quarter of 2011, with volatility and selling pressure reminiscent of the market selloff in 2008, as macro-economic concerns continued to mount.
During its September meeting, the Federal Reserve Board announced that it was prepared to purchase longer term securities and sell shorter term securities in an effort to keep long-term interest rates down. Their hope is that lower long-term borrowing rates will stimulate business investment and hiring. However, the question remains as to whether monetary policy alone will be enough to resuscitate growth in the current environment.
Despite this challenging and volatile economic backdrop, I believe Columbia Management remains strong and steadfast. Columbia Management is the eighth largest manager of long-term mutual fund assets with $325 billion under management as of September 30, 2011. The past year has been one of considerable change for the organization as we worked diligently to align products, services and resources in the integration of Columbia Management with RiverSource Investments. The incredible line-up of talent, resources and capabilities that has resulted is highlighted by the success of our products. As of September 30, 2011, Columbia Management offers 54 funds rated 4 and 5 stars by Morningstar. Additionally, The Wall Street Journal has named two Columbia funds "Category Kings" in its "Investing in Funds: A Quarterly Analysis" issue dated October 5, 2011 in recognition for their one-year performance as of September 30, 2011.
For more information about these and other funds offered by Columbia Management, including detailed, up-to-date fund performance and portfolio information, please visit us online at columbiamanagement.com. Other information and resources available on our website include:
g timely economic analysis and market commentary
g quarterly fund commentaries
g Columbia Management Investor, a quarterly newsletter for shareholders
Thank you for your continued support of the Columbia Funds. We look forward to serving your investment needs for many years to come.
Best Regards,

J. Kevin Connaughton
President, Columbia Funds
All ratings are Class Z shares as of 9/30/2011. Out of 118 Z-share Columbia funds rated by Morningstar, 8 funds received a 5-star Overall Rating and 46 funds received a 4-star Overall Rating. The Overall Morningstar Rating for a retail mutual fund is derived from a weighted average of the performance figures associated with its 3-, 5- and 10-year (if applicable) Morningstar Rating metrics. For share classes that do not have a 3-, 5-, or 10-year actual performance history, the fund's independent Morningstar Rating metric is then compared against the retail mutual fund universe breakpoints to determine its hypothetical rating.
For each fund with at least a three-year history, Morningstar calculates a Morningstar RatingTM based on a Morningstar Risk-Adjusted Return measure that accounts for variation in a fund's monthly performance (including the effects of sales charges, loads, and redemption fees), placing more emphasis on downward variations and rewarding consistent performance. The top 10% of funds in each category receive 5 stars, the next 22.5% receive 4 stars, the next 35% receive 3 stars, the next 22.5% receive 2 stars and the bottom 10% receive 1 star. (Each share class is counted as a fraction of one fund within this scale and rated separately, which may cause slight variations in the distribution percentages.)
The Morningstar RatingTM is for Class Z shares only; other classes may have different performance characteristics and may have different ratings. © 2012 Morningstar, Inc. All Rights Reserved. The Morningstar information contained herein: (1) is proprietary to Morningstar and/or its content providers; (2) may not be copied or distributed; and (3) is not warranted to be accurate, complete or timely. Neither Morningstar nor its content providers are responsible for any damages or losses arising from any use of this information.
The Wall Street Journal "Category Kings" methodology: Top-performing funds in each category ranked by one-year total returns (changes in net asset values and reinvested distributions) for the period ended September 30, 2011.
Investors should consider the investment objectives, risks, charges and expenses of a mutual fund carefully before investing. For a free prospectus, which contains this and other important information about the funds, visit www.columbiamanagement.com. The prospectus should be read carefully before investing.
Columbia Funds are distributed by Columbia Management Investment Distributors, Inc., member FINRA, and managed by Columbia Management Investment Advisers, LLC.
© 2012 Columbia Management Investment Advisers, LLC. All rights reserved.
Fund Profile – Columbia Tax-Exempt Fund
Summary
g For the 12-month period that ended November 30, 2011, the fund's Class A shares returned 7.00%, without sales charge.
g The fund outperformed its peer group, the Lipper General Municipal Debt Funds Classification,1 and its benchmark, the Barclays Capital Municipal Bond Index.2
g Maturity allocation, issue selection and credit quality positioning helped push the fund ahead of the index and peer group.
Portfolio Management
Kimberly Campbell has managed the fund since 2002 and has been associated with the advisor since May 2010. Prior to joining the advisor, Ms. Campbell was associated with the fund's previous advisor or its predecessors since 1995.
1Lipper Inc., a widely respected data provider in the industry, calculates an average total return (assuming reinvestment of distributions) for mutual funds with investment objectives similar to those of the fund. Lipper makes no adjustment for the effect of sales loads.
2The Barclays Capital Municipal Bond Index is considered representative of the broad market for investment-grade, tax-exempt bonds with maturity of at least one year.
Indices are not available for investment, are not professionally managed and do not reflect sales charges, fees, brokerage commissions, taxes or other expenses of investing. Securities in the fund may not match those in an index.
Performance data quoted represents past performance and current performance may be lower or higher. Past performance is no guarantee of future results. The investment return and principal value will fluctuate so that shares, when redeemed, may be worth more or less than the original cost. Please visit www.columbiamanagement.com for daily and most recent month-end performance updates.
Summary
1-year return as of 11/30/11
| | | | +7.00% | |
|
|  | | | Class A shares
(without sales charge) | |
|
| | | | +6.53% | |
|
|  | | | Barclays Capital Municipal
Bond Index | |
|
| | | | +6.01% | |
|
|  | | | Lipper General Municipal
Debt Funds Classification | |
|
1
Performance Information – Columbia Tax-Exempt Fund
Performance data quoted represents past performance and current performance may be lower or higher. Past performance is no guarantee of future results. The investment return and principal value will fluctuate so that shares, when redeemed, may be worth more or less than the original cost. Please visit www.columbiamanagement.com for daily and most recent month-end performance updates.
Performance of a $10,000 investment 12/01/01 – 11/30/11
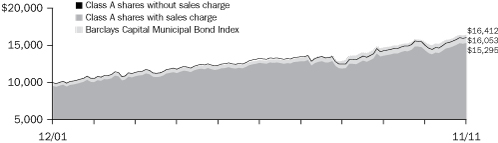
The chart above shows the change in value of a hypothetical $10,000 investment in Class A shares of Columbia Tax-Exempt Fund during the stated time period, and does not reflect the deduction of taxes that a shareholder may pay on fund distributions or on the redemption of fund shares.
Performance of a $10,000 investment 12/01/01 – 11/30/11 ($)
| Sales charge | | without | | with | |
| Class A | | | 16,053 | | | | 15,295 | | |
| Class B | | | 14,886 | | | | 14,886 | | |
| Class C | | | 15,118 | | | | 15,118 | | |
| Class Z | | | 16,244 | | | | n/a | | |
Average annual total return as of 11/30/11 (%)
| Share class | | A | | B | | C | | Z | |
| Inception | | 11/21/78 | | 05/05/92 | | 08/01/97 | | 09/16/05 | |
| Sales charge | | without | | with | | without | | with | | without | | with | | without | |
| 1-year | | | 7.00 | | | | 1.96 | | | | 6.12 | | | | 1.12 | | | | 6.36 | | | | 5.36 | | | | 7.16 | | |
| 5-year | | | 3.91 | | | | 2.91 | | | | 3.12 | | | | 2.78 | | | | 3.29 | | | | 3.29 | | | | 4.11 | | |
| 10-year | | | 4.85 | | | | 4.34 | | | | 4.06 | | | | 4.06 | | | | 4.22 | | | | 4.22 | | | | 4.97 | | |
The "with sales charge" returns include the maximum initial sales charge of 4.75% for Class A shares, the applicable contingent deferred sales charge of 5.00% in the first year, declining to 1.00% in the sixth year and eliminated thereafter for Class B shares and 1.00% for Class C shares for the first year only. The "without sales charge" returns do not include the effect of sales charges. If they had, returns would be lower.
Performance results reflect any fee waivers or reimbursements of fund expenses by the Investment Manager and/or any of its affiliates. Absent these fee waivers or expense reimbursement arrangements, performance results would have been lower.
All results shown assume reinvestment of distributions. Class Z shares are sold at net asset value with no distribution and service (Rule 12b-1) fees. Class Z shares have limited eligibility and the investment minimum requirements may vary. Please see the fund's prospectuses for details. Performance for different share classes will vary based on differences in sales charges and fees associated with each class.
The tables do not reflect the deduction of taxes a shareholder may pay on fund distributions or on the redemption of fund shares.
The returns shown for the Fund's Class Z shares include the returns of the Fund's Class A shares for periods prior to September 16, 2005, the date on which the Fund's Class Z shares were first offered. The returns shown have been adjusted to reflect the fact that Class Z shares are sold without a sales charge. The returns shown have not been adjusted to reflect any differences in expenses, such as distribution and service (Rule 12b-1) fees between Class Z and Class A shares of the fund.
2
Understanding Your Expenses – Columbia Tax-Exempt Fund
As a shareholder, you incur two types of costs. There are transaction costs, which generally include sales charges on purchases and may include redemption fees. There are also ongoing costs, which generally include management fees, distribution and service (Rule 12b-1) fees, and other fund expenses. The following information is intended to help you understand your ongoing costs (in dollars) of investing in the Fund and to compare these costs with the ongoing costs of investing in other mutual funds.
Analyzing your fund's expenses
To illustrate these ongoing costs, we provided examples and calculated the expenses paid by investors in each share class of the Fund during the period. The information in the table is based on an initial investment of $1,000 at the beginning of the period indicated and held for the entire period. Expense information is calculated two ways and each method provides you with different information. The amount listed in the "Actual" column is calculated using the Fund's actual operating expenses and total return for the period. You may use the Actual information, together with the amount invested, to estimate the expenses that you paid over the period. Simply divide your account value by $1,000 (for example, an $8,600 account value divided by $1,000 = 8.6), then multiply the results by the expenses paid during the period under the Actual column. The amount listed in the "Hypothetical" column assumes a 5% annual rate of return before expenses (which is not the Fund's actual return) and then applies the Fund's actual expense ratio for the period to the hypothetical return. You should not use the hypothetical account values and expenses to estimate either your actual account balance at the end of the period or the expenses you paid during the period. See the "Compare with other funds" information with details on using the hypothetical data.
Compare with other funds
Since all mutual funds are required to include the same hypothetical calculations about expenses in shareholder reports, you can use this information to compare the ongoing cost of investing in the Fund with other funds. To do so, compare the hypothetical example with the 5% hypothetical examples that appear in the shareholder reports of other funds. As you compare hypothetical examples of other funds, it is important to note that hypothetical examples are meant to highlight the ongoing costs of investing in a fund only and do not reflect any transaction costs, such as sales charges, or redemption or exchange fees. Therefore, the hypothetical calculations are useful in comparing ongoing costs only, and will not help you determine the relative total costs of owning different funds. If transaction costs were included in these calculations, your costs would have been higher.
06/01/11 – 11/30/11
| | | Account value at the
beginning of the period ($) | | Account value at the
end of the period ($) | | Expenses paid
during the period ($) | | Fund's annualized
expense ratio (%) | |
| | | Actual | | Hypothetical | | Actual | | Hypothetical | | Actual | | Hypothetical | | Actual | |
| Class A | | | 1,000.00 | | | | 1,000.00 | | | | 1,049.70 | | | | 1,021.36 | | | | 3.80 | | | | 3.75 | | | | 0.74 | | |
| Class B | | | 1,000.00 | | | | 1,000.00 | | | | 1,044.90 | | | | 1,017.60 | | | | 7.64 | | | | 7.54 | | | | 1.49 | | |
| Class C | | | 1,000.00 | | | | 1,000.00 | | | | 1,046.50 | | | | 1,018.30 | | | | 6.93 | | | | 6.83 | | | | 1.35 | | |
| Class Z | | | 1,000.00 | | | | 1,000.00 | | | | 1,050.20 | | | | 1,022.36 | | | | 2.78 | | | | 2.74 | | | | 0.54 | | |
Expenses paid during the period are equal to the annualized expense ratio for each class as indicated above, multiplied by the average account value over the period and then multiplied by the number of days in the Fund's most recent fiscal half year and divided by 365.
Expenses do not include fees and expenses incurred indirectly by the Fund from the underlying funds in which the Fund may invest (also referred to as "acquired funds"), including affiliated and non-affiliated pooled investments vehicles (including mutual funds and exchange traded funds).
Had Columbia Management Investment Advisers, LLC and/or any of its affiliates not waived/reimbursed a portion of fees and expenses, account value at the end of the period would have been reduced.
3
Portfolio Manager's Report – Columbia Tax-Exempt Fund
Performance data quoted represents past performance and current performance may be lower or higher. Past performance is no guarantee of future results. The investment return and principal value will fluctuate so that shares, when redeemed, may be worth more or less than the original cost. Please visit www.columbiamanagement.com for daily and most recent month-end performance updates.
Net asset value per share
as of 11/30/11 ($)
| Class A | | | 13.43 | | |
| Class B | | | 13.42 | | |
| Class C | | | 13.43 | | |
| Class Z | | | 13.43 | | |
Distributions declared per share
12/01/10 – 11/30/11 ($)
| Class A | | | 0.59 | | |
| Class B | | | 0.49 | | |
| Class C | | | 0.51 | | |
| Class Z | | | 0.61 | | |
A portion of the fund's income may be subject to the alternative minimum tax. The fund may at times purchase tax-exempt securities at a discount. Some, or all, of this discount may be included in the fund's ordinary income and is taxable when distributed.
30-day SEC yields
as of 11/30/11 (%)
| Class A | | | 2.94 | | |
| Class B | | | 2.16 | | |
| Class C | | | 2.55 | | |
| Class Z | | | 3.90 | | |
The 30-day SEC yields reflect the fund's earning power, net of expenses, expressed as an annualized percentage of the public offering price per share at the end of the period. Had the Investment Manager and/or any of its affiliates not waived fees or reimbursed a portion of expenses, the 30-day SEC yields would have been lower.
Taxable Equivalent SEC yields
as of 11/30/11 (%)
| Class A | | | 4.52 | | |
| Class B | | | 3.32 | | |
| Class C | | | 3.92 | | |
| Class Z | | | 6.00 | | |
Taxable-equivalent SEC yields are calculated assuming a federal tax rate of 35.0%. This tax rate does not reflect the phase out of exemptions or the reduction of the otherwise allowable deductions that occur when adjusted gross income exceeds certain levels. Your taxable-equivalent yield may be different depending on your tax bracket.
For the 12-month period that ended November 30, 2011, the fund's Class A shares returned 7.00% without sales charge. The fund outperformed the 6.53% return of its benchmark, the Barclays Capital Municipal Bond Index, and the 6.01% average return of its peer group, the Lipper General Municipal Debt Funds Classification. Favorable maturity allocation, issue selection and credit quality positioning helped drive the fund ahead of the index and peer group.
Strong year for municipal bonds, despite weak start
In late 2010, municipal bond issuers faced continued budgetary challenges and uncertainty regarding the extension of the Bush-era tax cuts and Build America Bonds taxable municipal bond program. New issuance surged leading up to year end, but investor demand slowed amid predictions of massive municipal defaults. Selling pressure mounted as many investors decided to take profits, pushing muni bond yields significantly higher early in 2011 and causing municipal bond prices to fall. Yields stabilized, then declined, in the second quarter, as low bond prices and a lack of defaults rekindled investor interest. In July 2011, concern mounted over the European debt crisis and the U.S. government's inability to address its budget deficit. Standard & Poor's downgraded its rating on U.S. Treasuries in August 2011, but investors still flocked to the sector, which offered a safe haven in a time of uncertainty. Municipal bond yields followed Treasury yields lower. Yields declined the most on longer-maturity securities, which benefited from the Federal Reserve Board's announcement that it planned to keep short-term interest rates near zero until 2013 and from the launch of "Operation Twist," a program involving the sale of short-term Treasuries and purchase of longer-term issues. Yields reached a 12-month low in October 2011. Supply remained tight, down more than 30% for the first 11 months of 2011 compared to the same period in 2010. For the 12-month reporting period, longer-maturity bonds outperformed shorter-maturity issues, and lower-quality (A and BBB rated3) bonds beat higher quality securities.
Gains from overweights in long maturity and lower quality bonds
The fund benefited from having more exposure than the benchmark to 15- to 30-year muni bonds. An overweight in bonds rated A and lower (including BBB securities and non-rated issues), which offered added income potential, further aided performance.
Certain sector allocations also contributed positively to performance: a significant overweight in hospital bonds, which produced some of the strongest returns in the benchmark, and overweights and strong issue selection in escrowed bonds (A bond becomes escrowed when an issuer comes to market with a new—usually lower-rate—bond and invests the proceeds in short-term government securities that are placed into an escrow account for the purpose of paying the original bonds at their maturity.), industrial development revenue and housing sectors. An overweight in electric revenue bond sector also boosted returns. The fund picked up added ground from its non-callable (or non-redeemable) bonds, which were more sensitive to declining interest rates than the non-callable bonds in the benchmark. Although issue
3The credit quality ratings represent those of Moody's Investors Service, Inc. ("Moody's"), Standard & Poor's Corporation ("S&P") or Fitch Ratings ("Fitch") credit ratings. The ratings represent their opinions as to the quality of the securities they rate. Ratings are relative and subjective and are not absolute standards of quality. The security's credit quality does not eliminate risk.
4
Portfolio Manager's Report (continued) – Columbia Tax-Exempt Fund
selection within the state general obligation and transportation sectors was strong relative to the benchmark, the fund's underweight in these sectors detracted from returns. Allocations to higher-quality (AAA and AA) sectors modestly detracted from performance relative to the benchmark, but were partially offset by above-average returns from the fund's investments in these segments.
Expectations for the coming year
Given the extent of the sovereign debt problems in Europe and their impact on other countries, we think U.S. economic growth will remain slow. Muted growth typically means benign inflation—a plus for bondholders. However, uncertainties around the presidential race, potential tax hikes and unemployment continue to weigh on investors. We believe that municipal bonds have the potential to offer reasonable returns in 2012, but with yields currently at low levels, those returns are unlikely to match those of 2011. Because we believe that the Fed is unlikely to raise short term interest rates for quite some time, our expectation is for inflation to stay relatively low. We believe that short-term yields will remain low, while longer intermediate-term yields could fall further. With that in mind, we plan to keep an overweight in longer-intermediate maturity (15- and 25-year) bonds which have slightly more sensitivity to declining interest rates than the benchmark. To balance that strategy, we also will likely maintain an overweight in lower quality bonds (rated A and lower) because these bonds are generally less sensitive to interest-rate shifts, and the added income they offer typically acts as a cushion against rising rates. We plan to maintain an overweight in the hospital sector and look to diversify within the sector by state and issue selection. We will continue to invest prudently, stressing diversification, issue selection, independent credit analysis and maturity allocation consistent with our strategic outlook.
Portfolio characteristics and holdings are subject to change and may not be representative of current characteristics and holdings. The outlook for the fund may differ from that presented for other Columbia Funds.
Tax-exempt investing offers current tax-exempt income, but it also involves certain risks. The value of the fund will be affected by interest rate changes and the creditworthiness of issues held in the fund. When interest rates go up, bond prices generally drop and vice versa.
Interest income from certain tax-exempt bonds may be subject to certain state and local taxes and, if applicable, the alternative minimum tax. Capital gains are not exempt from income taxes.
Investments in high-yield bonds (sometimes referred to as "junk" bonds) offer the potential for high current income and attractive total return but involve certain risks. Changes in economic conditions or other circumstances may adversely affect a high-yield bond issuer's ability to make principal and interest payments.
Quality breakdown
as of 11/30/11 (%)
| AAA | | | 14.2 | | |
| AA | | | 28.2 | | |
| A | | | 31.8 | | |
| BBB | | | 16.7 | | |
| BB | | | 1.3 | | |
| B | | | 0.6 | | |
| CCC | | | 0.1 | | |
| CC | | | 0.3 | | |
| Non-Rated | | | 6.8 | | |
Maturity breakdown
as of 11/30/11 (%)
| 0-1 year | | | 1.0 | | |
| 1-3 years | | | 2.6 | | |
| 3-5 years | | | 3.6 | | |
| 5-7 years | | | 5.3 | | |
| 7-10 years | | | 12.2 | | |
| 10-15 years | | | 17.6 | | |
| 15-20 years | | | 19.1 | | |
| 20-25 years | | | 14.5 | | |
| 25 years and over | | | 20.6 | | |
| Net Cash & Equivalents | | | 3.5 | | |
Ratings shown in the quality breakdown are assigned to individual bonds by taking the lower of the ratings available from one of the following nationally recognized rating agencies: Standard & Poor's or Moody's Investor Services. If a security is rated by only one of the two agencies, that rating is used. If a security is not rated by either of the two agencies, it is designated as Non-Rated. Ratings are relative and subjective and are not absolute standards of quality. The credit quality of the fund's investments does not remove market risk.
The fund is actively managed and the composition of its portfolio will change over time. Information provided is calculated as a percentage of net assets.
5
Portfolio of Investments – Columbia Tax-Exempt Fund
November 30, 2011
(Percentages represent value of investments compared to net assets)
Issue
Description | | Coupon
Rate | | Principal
Amount | | Value | |
| Municipal Bonds 95.6% | |
| Alabama 0.3% | |
County of Jefferson
Refunding Revenue Bonds
Series 1997A (FGIC) | |
| 02/01/22 | | | 5.625 | % | | $ | 570,000 | | | $ | 330,799 | | |
Revenue Bonds
Series 2004A | |
| 01/01/19 | | | 5.250 | % | | | 2,790,000 | | | | 2,618,527 | | |
| 01/01/23 | | | 5.250 | % | | | 7,500,000 | | | | 6,659,775 | | |
Selma Industrial Development Board
Revenue Bonds
Gulf Opportunity Zone-International Paper
Series 2010 | |
| 05/01/34 | | | 5.800 | % | | | 4,900,000 | | | | 5,000,058 | | |
| Total | | | 14,609,159 | | |
| Alaska 0.7% | |
Alaska Energy Authority
Refunding Revenue Bonds
Bradley Lake
3rd Series 1999 (AGM) | |
| 07/01/14 | | | 6.000 | % | | | 2,000,000 | | | | 2,217,720 | | |
| 4th Series 2000 (AGM) | |
| 07/01/20 | | | 6.000 | % | | | 4,145,000 | | | | 5,043,180 | | |
| 07/01/21 | | | 6.000 | % | | | 2,395,000 | | | | 2,922,642 | | |
City of Koyukuk
Revenue Bonds
Tanana Chiefs Conference Health Care
Series 2011 | |
| 10/01/32 | | | 7.500 | % | | | 18,330,000 | | | | 18,467,292 | | |
| 10/01/41 | | | 7.750 | % | | | 4,350,000 | | | | 4,409,030 | | |
| Total | | | 33,059,864 | | |
| Arizona 1.5% | |
Arizona Health Facilities Authority
Revenue Bonds
Banner Health
Series 2008D | |
| 01/01/32 | | | 5.375 | % | | | 7,800,000 | | | | 8,125,806 | | |
Arizona Transportation Board
Revenue Bonds
Maricopa County Regional Area Road Fund
Series 2007 | |
| 07/01/25 | | | 5.000 | % | | | 1,500,000 | | | | 1,643,910 | | |
Arizona Water Infrastructure Finance Authority
Revenue Bonds
Water Quality
Series 2008A | |
| 10/01/22 | | | 5.000 | % | | | 1,500,000 | | | | 1,732,515 | | |
City of Tucson
Refunding Revenue Bonds
Series 2002 (NPFGC/FGIC) | |
| 07/01/13 | | | 5.500 | % | | | 2,380,000 | | | | 2,495,549 | | |
Revenue Bonds
Series 2002 (NPFGC/FGIC) | |
| 07/01/14 | | | 5.500 | % | | | 1,500,000 | | | | 1,572,360 | | |
Unlimited General Obligation Bonds
Series 1984G (NPFGC/FGIC) | |
| 07/01/14 | | | 7.625 | % | | | 3,140,000 | | | | 3,645,069 | | |
Issue
Description | | Coupon
Rate | | Principal
Amount | | Value | |
| Municipal Bonds (continued) | |
| Arizona (cont.) | |
Glendale Industrial Development Authority
Revenue Bonds
Midwestern University
Series 2010 | |
| 05/15/35 | | | 5.000 | % | | $ | 13,750,000 | | | $ | 13,749,725 | | |
Maricopa County Industrial Development Authority
Revenue Bonds
Catholic Healthcare West
Series 2004A | |
| 07/01/26 | | | 5.500 | % | | | 5,000,000 | | | | 5,182,350 | | |
Maricopa County Pollution Control Corp.
Refunding Revenue Bonds
Southern California Edison Co.
Series 2000B | |
| 06/01/35 | | | 5.000 | % | | | 9,775,000 | | | | 10,215,461 | | |
Pima County Industrial Development Authority
Revenue Bonds
GNMA Mortgage-Backed Securities
Series 1989 Escrowed to Maturity AMT(a) | |
| 09/01/21 | | | 8.200 | % | | | 11,280,000 | | | | 15,372,497 | | |
Salt Verde Financial Corp.
Revenue Bonds
Senior Series 2007 | |
| 12/01/32 | | | 5.000 | % | | | 5,400,000 | | | | 5,034,312 | | |
| Total | | | 68,769,554 | | |
| California 12.6% | |
ABAG Finance Authority for Nonprofit Corps.
Refunding Revenue Bonds
Episcopal Senior Community
Series 2011 | |
| 07/01/26 | | | 6.125 | % | | | 3,420,000 | | | | 3,528,551 | | |
| 07/01/41 | | | 6.125 | % | | | 7,015,000 | | | | 7,017,034 | | |
Revenue Bonds
San Diego Hospital Association
Series 2003C | |
| 03/01/20 | | | 5.375 | % | | | 1,320,000 | | | | 1,368,827 | | |
Sharp Healthcare
Series 2009 | |
| 08/01/39 | | | 6.250 | % | | | 4,000,000 | | | | 4,291,240 | | |
Agua Caliente Band of Cahuilla Indians
Revenue Bonds
Series 2003(b)(c) | |
| 07/01/18 | | | 6.000 | % | | | 2,000,000 | | | | 1,898,480 | | |
Alvord Unified School District
Unlimited General Obligation Refunding Bonds
Series 2002A (NPFGC) | |
| 02/01/19 | | | 5.900 | % | | | 1,975,000 | | | | 2,273,008 | | |
Cabazon Band Mission Indians(b)(c)(d)
Revenue Bonds
Series 2004 | |
| 10/01/11 | | | 7.358 | % | | | 400,000 | | | | 232,000 | | |
| 10/01/15 | | | 8.375 | % | | | 1,740,000 | | | | 1,222,507 | | |
| 10/01/19 | | | 8.750 | % | | | 8,670,000 | | | | 5,674,775 | | |
| Series 2010 | |
| 10/01/20 | | | 8.375 | % | | | 1,415,000 | | | | 1,413,415 | | |
The Accompanying Notes to Financial Statements are an integral part of this statement.
6
Columbia Tax-Exempt Fund
November 30, 2011
(Percentages represent value of investments compared to net assets)
Issue
Description | | Coupon
Rate | | Principal
Amount | | Value | |
| Municipal Bonds (continued) | |
| California (cont.) | |
California Educational Facilities Authority
Revenue Bonds
Loyola Marymount University
Series 2001A (NPFGC)(e) | |
| 10/01/17 | | | 0.000 | % | | $ | 2,525,000 | | | $ | 2,029,317 | | |
California Health Facilities Financing Authority
Prerefunded 10/01/18 Revenue Bonds
Providence Health
Series 2008 | |
| 10/01/38 | | | 6.500 | % | | | 110,000 | | | | 144,169 | | |
Revenue Bonds
Kaiser Permanente
Series 2006A | |
| 04/01/39 | | | 5.250 | % | | | 4,500,000 | | | | 4,511,745 | | |
Providence Health & Services
Series 2008C | |
| 10/01/28 | | | 6.250 | % | | | 2,000,000 | | | | 2,267,980 | | |
Unrefunded Revenue Bonds
Providence Health
Series 2008 | |
| 10/01/38 | | | 6.500 | % | | | 7,890,000 | | | | 8,903,155 | | |
California Housing Finance Agency(a)
Revenue Bonds
Home Mortgage
Series 2006H (FGIC) AMT | |
| 08/01/30 | | | 5.750 | % | | | 4,355,000 | | | | 4,349,818 | | |
| Series 2006K AMT | |
| 02/01/42 | | | 5.500 | % | | | 6,735,000 | | | | 6,704,086 | | |
California Municipal Finance Authority
Revenue Bonds
American Heritage Education Foundation Project
Series 2006A | |
| 06/01/36 | | | 5.250 | % | | | 1,750,000 | | | | 1,402,188 | | |
Biola University
Series 2008 | |
| 10/01/34 | | | 5.875 | % | | | 4,000,000 | | | | 4,135,120 | | |
California State Department of Veterans Affairs
Revenue Bonds
Series 2007A AMT(a) | |
| 12/01/22 | | | 4.850 | % | | | 1,700,000 | | | | 1,752,802 | | |
California State Public Works Board
Revenue Bonds
Various Capital Projects
Subordinated Series 2009I-1 | |
| 11/01/29 | | | 6.125 | % | | | 6,000,000 | | | | 6,530,700 | | |
California Statewide Communities Development Authority
Revenue Bonds
Aspire Public Schools
Series 2010 | |
| 07/01/30 | | | 6.000 | % | | | 5,000,000 | | | | 5,013,950 | | |
Irvine LLC-UCI East Campus
Series 2008 | |
| 05/15/32 | | | 5.750 | % | | | 5,500,000 | | | | 5,511,550 | | |
John Muir Health
Series 2006A | |
| 08/15/32 | | | 5.000 | % | | | 1,000,000 | | | | 993,550 | | |
Kaiser Permanente
Series 2006B | |
| 03/01/45 | | | 5.250 | % | | | 13,000,000 | | | | 13,038,220 | | |
Issue
Description | | Coupon
Rate | | Principal
Amount | | Value | |
| Municipal Bonds (continued) | |
| California (cont.) | |
Thomas Jefferson School of Law
Series 2008A | |
| 10/01/26 | | | 7.000 | % | | $ | 10,235,000 | | | $ | 10,578,077 | | |
California Statewide Communities Development Authority(b)
Revenue Bonds
Thomas Jefferson School of Law
Series 2008A | |
| 10/01/38 | | | 7.250 | % | | | 4,350,000 | | | | 4,404,158 | | |
Castaic Lake Water Agency
Certificate of Participation
Capital Appreciation-Water System Improvement Project
Series 1999 (AMBAC)(e) | |
| 08/01/24 | | | 0.000 | % | | | 9,445,000 | | | | 4,883,348 | | |
City of Pomona
Refunding Revenue Bonds
Mortgage-Backed Securities
Series 1990A (GNMA/FNMA) | |
| 05/01/23 | | | 7.600 | % | | | 7,900,000 | | | | 10,488,435 | | |
City of San Jose
Revenue Bonds
Series 2001A (NPFGC/FGIC) | |
| 03/01/31 | | | 5.000 | % | | | 4,855,000 | | | | 4,863,933 | | |
City of San Jose(a)
Revenue Bonds
Series 2007A (AMBAC) AMT | |
| 03/01/15 | | | 5.000 | % | | | 3,000,000 | | | | 3,218,490 | | |
| 03/01/16 | | | 5.000 | % | | | 3,000,000 | | | | 3,251,490 | | |
City of Vernon
Revenue Bonds
Series 2009A | |
| 08/01/21 | | | 5.125 | % | | | 2,500,000 | | | | 2,485,700 | | |
County of Sacramento Airport System
Revenue Bonds
Senior Series 2009B | |
| 07/01/39 | | | 5.750 | % | | | 4,000,000 | | | | 4,219,160 | | |
Foothill-Eastern Transportation Corridor Agency
Refunding Revenue Bonds
Series 1999 | |
| 01/15/40 | | | 5.750 | % | | | 4,100,000 | | | | 3,794,140 | | |
Foothill-Eastern Transportation Corridor Agency(e)
Revenue Bonds
Capital Appreciation-Senior Lien
Series 1995A Escrowed to Maturity | |
| 01/01/18 | | | 0.000 | % | | | 10,000,000 | | | | 9,048,300 | | |
Fremont Union High School District
Unlimited General Obligation Bonds
Election of 2008
Series 2008 | |
| 08/01/30 | | | 4.750 | % | | | 3,925,000 | | | | 4,019,396 | | |
Huntington Beach Community Facilities District
Special Tax Bonds
Grand Coast Resort No. 2000-1
Series 2001 | |
| 09/01/31 | | | 6.450 | % | | | 1,850,000 | | | | 1,856,124 | | |
Kaweah Delta Health Care District
Refunding Revenue Bonds
Series 2006 | |
| 06/01/34 | | | 4.500 | % | | | 7,500,000 | | | | 6,375,225 | | |
The Accompanying Notes to Financial Statements are an integral part of this statement.
7
Columbia Tax-Exempt Fund
November 30, 2011
(Percentages represent value of investments compared to net assets)
Issue
Description | | Coupon
Rate | | Principal
Amount | | Value | |
| Municipal Bonds (continued) | |
| California (cont.) | |
Lakeside Union School District San Diego County
Unlimited General Obligation Bonds
Series 2009 | |
| 08/01/33 | | | 5.000 | % | | $ | 5,000,000 | | | $ | 5,317,000 | | |
Lammersville School District Community Facilities District
No. 2002
Special Tax Bonds
Mountain House
Series 2006 | |
| 09/01/35 | | | 5.125 | % | | | 875,000 | | | | 753,926 | | |
Los Angeles County Schools Regionalized Business
Services Corp.
Certificate of Participation
Capital Appreciation-Pooled Financing
Series 1999A (AMBAC)(e) | |
| 08/01/22 | | | 0.000 | % | | | 2,180,000 | | | | 1,132,641 | | |
Los Angeles Department of Water & Power
Revenue Bonds
Series 2003A (NPFGC/FGIC) | |
| 07/01/43 | | | 5.000 | % | | | 6,750,000 | | | | 6,758,977 | | |
Los Angeles Unified School District
Unlimited General Obligation Bonds
Series 2009I | |
| 07/01/29 | | | 5.000 | % | | | 4,800,000 | | | | 5,085,456 | | |
May Farms Community Facilities District
Special Tax Bonds
Series 1991-90-2 Escrowed to Maturity | |
| 10/01/21 | | | 8.750 | % | | | 6,165,000 | | | | 9,657,226 | | |
Norwalk-La Mirada Unified School District
Unlimited General Obligation Bonds
Capital Appreciation
Series 2005B (NPFGC/FGIC)(e) | |
| 08/01/23 | | | 0.000 | % | | | 9,790,000 | | | | 5,238,531 | | |
Orange Unified School District Community Facilities
District No. 2005-2
Special Tax Bonds
Del Rio School Facilities
Series 2007 | |
| 09/01/37 | | | 5.000 | % | | | 1,000,000 | | | | 789,580 | | |
Palmdale Community Redevelopment Agency
Revenue Bonds
Series 1986D Escrowed to Maturity (FHA) AMT(a) | |
| 04/01/16 | | | 8.000 | % | | | 7,000,000 | | | | 8,959,020 | | |
San Diego Public Facilities Financing Authority Sewer
Revenue Bonds
Senior Series 2009A | |
| 05/15/34 | | | 5.250 | % | | | 4,500,000 | | | | 4,776,120 | | |
San Diego Public Facilities Financing Authority Sewer
Revenue Bonds
Senior Series 2009A | |
| 05/15/39 | | | 5.250 | % | | | 17,000,000 | | | | 17,921,060 | | |
San Diego Unified School District
Unlimited General Obligation Bonds
Election of 1998
Series 2002D (FGIC) | |
| 07/01/27 | | | 5.000 | % | | | 8,000,000 | | | | 8,206,560 | | |
Issue
Description | | Coupon
Rate | | Principal
Amount | | Value | |
| Municipal Bonds (continued) | |
| California (cont.) | |
San Francisco City & County Public Utilities Commission
Water
Revenue Bonds
Series 2006A (AGM) | |
| 11/01/31 | | | 4.500 | % | | $ | 17,800,000 | | | $ | 17,799,466 | | |
San Francisco City & County Redevelopment Agency
Tax Allocation Bonds
Mission Bay South Redevelopment
Series 2009D | |
| 08/01/31 | | | 6.500 | % | | | 500,000 | | | | 508,075 | | |
| 08/01/39 | | | 6.625 | % | | | 1,500,000 | | | | 1,533,135 | | |
San Joaquin Hills Transportation Corridor Agency
Revenue Bonds
Senior Lien
Series 1993 | |
| 01/01/33 | | | 5.000 | % | | | 1,500,000 | | | | 1,167,255 | | |
San Joaquin Hills Transportation Corridor Agency(e)
Refunding Revenue Bonds
Capital Appreciation
Series 1997A (NPFGC) | |
| 01/15/12 | | | 0.000 | % | | | 2,500,000 | | | | 2,484,843 | | |
| 01/15/14 | | | 0.000 | % | | | 14,450,000 | | | | 12,713,977 | | |
San Juan Unified School District
Unlimited General Obligation Bonds
Capital Appreciation
Series 2001 (AGM)(e) | |
| 08/01/18 | | | 0.000 | % | | | 1,785,000 | | | | 1,400,279 | | |
Simi Valley School Financing Authority
Refunding Revenue Bonds
Simi Valley Unified School District
Series 2007 (AGM) | |
| 08/01/23 | | | 5.000 | % | | | 1,500,000 | | | | 1,672,935 | | |
State of California
Unlimited General Obligation Bonds
Series 2002 (AMBAC) | |
| 04/01/17 | | | 6.000 | % | | | 2,500,000 | | | | 2,975,900 | | |
| Series 2003 | |
| 02/01/21 | | | 5.000 | % | | | 4,625,000 | | | | 4,883,954 | | |
| Series 2006 | |
| 10/01/36 | | | 4.500 | % | | | 4,015,000 | | | | 3,852,352 | | |
Various Purpose
Series 2003 | |
| 11/01/22 | | | 5.000 | % | | | 5,000,000 | | | | 5,278,100 | | |
| 11/01/24 | | | 5.125 | % | | | 8,000,000 | | | | 8,497,920 | | |
| Series 2005 | |
| 03/01/32 | | | 5.000 | % | | | 1,500,000 | | | | 1,516,485 | | |
| 06/01/35 | | | 4.750 | % | | | 2,500,000 | | | | 2,417,500 | | |
| 08/01/35 | | | 5.000 | % | | | 10,000,000 | | | | 10,015,900 | | |
| Series 2007 | |
| 12/01/32 | | | 5.000 | % | | | 8,000,000 | | | | 8,120,080 | | |
| 06/01/37 | | | 5.000 | % | | | 13,145,000 | | | | 13,151,178 | | |
| 11/01/37 | | | 5.000 | % | | | 18,000,000 | | | | 18,008,460 | | |
| 12/01/37 | | | 5.000 | % | | | 10,200,000 | | | | 10,205,202 | | |
| Series 2008 | |
| 03/01/27 | | | 5.500 | % | | | 1,000,000 | | | | 1,085,070 | | |
| 03/01/38 | | | 5.250 | % | | | 8,250,000 | | | | 8,389,920 | | |
The Accompanying Notes to Financial Statements are an integral part of this statement.
8
Columbia Tax-Exempt Fund
November 30, 2011
(Percentages represent value of investments compared to net assets)
Issue
Description | | Coupon
Rate | | Principal
Amount | | Value | |
| Municipal Bonds (continued) | |
| California (cont.) | |
| Series 2009 | |
| 04/01/31 | | | 5.750 | % | | $ | 32,500,000 | | | $ | 35,736,350 | | |
| 04/01/35 | | | 6.000 | % | | | 15,000,000 | | | | 16,608,750 | | |
| 04/01/38 | | | 6.000 | % | | | 22,500,000 | | | | 24,868,350 | | |
| 11/01/39 | | | 5.500 | % | | | 15,520,000 | | | | 16,196,982 | | |
| Series 2010 | |
| 03/01/30 | | | 5.250 | % | | | 3,000,000 | | | | 3,159,810 | | |
| 03/01/33 | | | 6.000 | % | | | 5,000,000 | | | | 5,603,350 | | |
| 03/01/40 | | | 5.500 | % | | | 17,200,000 | | | | 17,963,508 | | |
| Series 2011 | |
| 09/01/30 | | | 5.250 | % | | | 8,750,000 | | | | 9,284,100 | | |
Unlimited General Obligation Refunding Bonds
Series 2007 | |
| 08/01/30 | | | 4.500 | % | | | 34,950,000 | | | | 34,729,815 | | |
Various Purpose
Series 2008 | |
| 04/01/38 | | | 5.000 | % | | | 1,015,000 | | | | 1,015,477 | | |
Unrefunded Unlimited General Obligation Bonds
Series 2004 | |
| 04/01/29 | | | 5.300 | % | | | 6,000 | | | | 6,178 | | |
Turlock Irrigation District
Certificate of Participation
Series 2003A (NPFGC) | |
| 01/01/33 | | | 5.000 | % | | | 4,450,000 | | | | 4,392,729 | | |
University of California
Revenue Bonds
General Series 2009Q | |
| 05/15/34 | | | 5.000 | % | | | 5,750,000 | | | | 5,958,380 | | |
Walnut Energy Center Authority
Revenue Bonds
Series 2004A (AMBAC) | |
| 01/01/29 | | | 5.000 | % | | | 9,365,000 | | | | 9,453,125 | | |
West Contra Costa Unified School District
Unlimited General Obligation Refunding Bonds
Series 2001B (NPFGC) | |
| 08/01/24 | | | 6.000 | % | | | 2,320,000 | | | | 2,625,474 | | |
Yuba City Unified School District
Unlimited General Obligation Bonds
Capital Appreciation
Series 2000 (NPFGC/FGIC)(e) | |
| 09/01/18 | | | 0.000 | % | | | 1,160,000 | | | | 859,316 | | |
| Total | | | 570,429,940 | | |
| Colorado 1.7% | |
Baptist Road Rural Transportation Authority
Revenue Bonds
Series 2007 | |
| 12/01/17 | | | 4.800 | % | | | 875,000 | | | | 764,312 | | |
| 12/01/22 | | | 4.950 | % | | | 1,855,000 | | | | 1,394,849 | | |
| 12/01/26 | | | 5.000 | % | | | 1,860,000 | | | | 1,273,895 | | |
City & County of Denver
Unlimited General Obligation Bonds
Justice System Facilities & Zoo
Series 2005 | |
| 08/01/25 | | | 5.000 | % | | | 1,000,000 | | | | 1,101,130 | | |
City & County of Denver(a)
Refunding Revenue Bonds
United Air Lines Project
Series 2007A AMT | |
| 10/01/32 | | | 5.250 | % | | | 5,000,000 | | | | 4,191,550 | | |
Issue
Description | | Coupon
Rate | | Principal
Amount | | Value | |
| Municipal Bonds (continued) | |
| Colorado (cont.) | |
City of Westminster
Revenue Bonds
Post Project
Series 2007D (AGM) | |
| 12/01/23 | | | 5.000 | % | | $ | 1,240,000 | | | $ | 1,366,430 | | |
Colorado Educational & Cultural Facilities Authority
Refunding Revenue Bonds
Student Housing-Campus Village Apartment
Series 2008 | |
| 06/01/33 | | | 5.500 | % | | | 2,000,000 | | | | 2,024,300 | | |
| 06/01/38 | | | 5.500 | % | | | 6,000,000 | | | | 6,032,760 | | |
Colorado Health Facilities Authority
Refunding Revenue Bonds
Valley View Hospital Association
Series 2008 | |
| 05/15/28 | | | 5.500 | % | | | 5,745,000 | | | | 5,791,362 | | |
Revenue Bonds
Evangelical Lutheran
Series 2005 | |
| 06/01/23 | | | 5.250 | % | | | 1,200,000 | | | | 1,235,088 | | |
| Series 2009A | |
| 06/01/38 | | | 6.125 | % | | | 3,250,000 | | | | 3,273,530 | | |
Unrefunded Revenue Bonds
Series 2000 | |
| 12/01/25 | | | 6.900 | % | | | 680,000 | | | | 687,834 | | |
Colorado Health Facilities Authority(d)
Prerefunded 12/01/11 Revenue Bonds
American Housing Foundation I, Inc. Project
Series 2003 | |
| 12/01/31 | | | 8.500 | % | | | 855,000 | | | | 855,180 | | |
Colorado State Board of Governors
Revenue Bonds
Series 2008A (AGM) | |
| 03/01/27 | | | 5.000 | % | | | 1,250,000 | | | | 1,329,850 | | |
County of El Paso
Revenue Bonds
Series 1988A (GNMA) AMT(a) | |
| 03/25/19 | | | 8.375 | % | | | 32,314 | | | | 32,893 | | |
E-470 Public Highway Authority
Revenue Bonds
Series 2010C | |
| 09/01/26 | | | 5.375 | % | | | 5,000,000 | | | | 4,917,100 | | |
E-470 Public Highway Authority(e)
Revenue Bonds
Capital Appreciation
Senior Series 1997B (NPFGC) | |
| 09/01/22 | | | 0.000 | % | | | 6,515,000 | | | | 3,425,066 | | |
| Senior Series 2000B (NPFGC) | |
| 09/01/18 | | | 0.000 | % | | | 18,600,000 | | | | 13,024,464 | | |
North Range Metropolitan District No. 1
Prerefunded 12/15/11 Limited General Obligation
Bonds
Series 2001 | |
| 12/15/31 | | | 7.250 | % | | | 11,640,000 | | | | 11,786,315 | | |
North Range Metropolitan District No. 2
Limited Tax General Obligation Bonds
Series 2007 | |
| 12/15/27 | | | 5.500 | % | | | 2,765,000 | | | | 2,491,984 | | |
| 12/15/37 | | | 5.500 | % | | | 3,100,000 | | | | 2,631,063 | | |
The Accompanying Notes to Financial Statements are an integral part of this statement.
9
Columbia Tax-Exempt Fund
November 30, 2011
(Percentages represent value of investments compared to net assets)
Issue
Description | | Coupon
Rate | | Principal
Amount | | Value | |
| Municipal Bonds (continued) | |
| Colorado (cont.) | |
Platte River Power Authority
Revenue Bonds
Series 2009HH | |
| 06/01/24 | | | 5.000 | % | | $ | 1,000,000 | | | $ | 1,139,600 | | |
Regional Transportation District
Refunding Revenue Bonds
Series 2007A | |
| 11/01/24 | | | 5.250 | % | | | 1,000,000 | | | | 1,236,460 | | |
University of Colorado Hospital Authority
Refunding Revenue Bonds
Series 2009A | |
| 11/15/29 | | | 6.000 | % | | | 5,000,000 | | | | 5,379,200 | | |
University of Colorado
Revenue Bonds
Series 2006A (AMBAC) | |
| 06/01/23 | | | 5.000 | % | | | 1,000,000 | | | | 1,084,570 | | |
| Total | | | 78,470,785 | | |
| Connecticut 0.2% | |
Harbor Point Infrastructure Improvement District
Tax Allocation Bonds
Harbor Point Project
Series 2010A | |
| 04/01/39 | | | 7.875 | % | | | 8,000,000 | | | | 8,416,240 | | |
Mashantucket Western Pequot Tribe
Revenue Bonds
Subordinated Series 2007A(b)(c)(g) | |
| 09/01/34 | | | 5.750 | % | | | 4,000,000 | | | | 1,462,720 | | |
| Total | | | 9,878,960 | | |
| Delaware 0.1% | |
Delaware State Economic Development Authority
Refunding Revenue Bonds
Gas Facilities-Delmarva Power
Series 2010 | |
| 02/01/31 | | | 5.400 | % | | | 5,000,000 | | | | 5,272,000 | | |
| District of Columbia 0.1% | |
District of Columbia
Refunding Revenue Bonds
2nd Series 2009B | |
| 12/01/23 | | | 5.000 | % | | | 2,000,000 | | | | 2,322,220 | | |
Metropolitan Washington Airports Authority
Refunding Revenue Bonds
Series 2007A (AMBAC) AMT(a) | |
| 10/01/22 | | | 4.750 | % | | | 4,250,000 | | | | 4,491,953 | | |
| Total | | | 6,814,173 | | |
| Florida 3.0% | |
Brevard County Health Facilities Authority
Revenue Bonds
Health First, Inc. Project
Series 2005 | |
| 04/01/24 | | | 5.000 | % | | | 1,800,000 | | | | 1,821,402 | | |
| 04/01/34 | | | 5.000 | % | | | 16,250,000 | | | | 15,614,950 | | |
Brevard County Housing Finance Authority
Revenue Bonds
Series 1985 (FGIC/MGIC)(e) | |
| 04/01/17 | | | 0.000 | % | | | 375,000 | | | | 221,130 | | |
Issue
Description | | Coupon
Rate | | Principal
Amount | | Value | |
| Municipal Bonds (continued) | |
| Florida (cont.) | |
Broward County Housing Finance Authority
Revenue Bonds
Chaves Lake Apartments Project
Series 2000A AMT(a)(d) | |
| 07/01/40 | | | 7.500 | % | | $ | 7,900,000 | | | $ | 7,905,451 | | |
Capital Trust Agency
Revenue Bonds
Atlantic Housing Foundation
Subordinated Series 2008B(d) | |
| 07/15/32 | | | 7.000 | % | | | 1,895,000 | | | | 757,261 | | |
City of Ocala
Revenue Bonds
Series 2007A (NPFGC) | |
| 10/01/24 | | | 5.000 | % | | | 2,985,000 | | | | 3,194,457 | | |
County of Broward Airport System
Revenue Bonds
Series 2001J-I (AMBAC) AMT(a) | |
| 10/01/26 | | | 5.250 | % | | | 2,000,000 | | | | 2,007,160 | | |
County of Escambia
Revenue Bonds
Series 2003A AMT(a) | |
| 11/01/27 | | | 5.750 | % | | | 2,750,000 | | | | 2,761,220 | | |
County of Miami-Dade Aviation
Revenue Bonds
Miami International Airport
Series 2010A | |
| 10/01/35 | | | 5.375 | % | | | 11,000,000 | | | | 11,354,420 | | |
County of Polk
Improvement Refunding Revenue Bonds
Series 2006 (NPFGC) | |
| 12/01/20 | | | 5.000 | % | | | 1,040,000 | | | | 1,118,634 | | |
County of Seminole Water & Sewer
Revenue Bonds
Series 1992 Escrowed to Maturity (NPFGC) | |
| 10/01/19 | | | 6.000 | % | | | 1,030,000 | | | | 1,249,699 | | |
Unrefunded Revenue Bonds
Series 1992 (NPFGC) | |
| 10/01/19 | | | 6.000 | % | | | 470,000 | | | | 515,778 | | |
County of St. Johns
Revenue Bonds
Series 2006 (AMBAC) | |
| 10/01/26 | | | 5.000 | % | | | 1,000,000 | | | | 1,053,410 | | |
Double Branch Community Development District
Special Assessment Bonds
Series 2002A | |
| 05/01/34 | | | 6.700 | % | | | 1,270,000 | | | | 1,297,381 | | |
Florida State Board of Education
Unlimited General Obligation Bonds
Capital Outlay 2008
Series 2009B | |
| 06/01/26 | | | 5.000 | % | | | 5,525,000 | | | | 6,271,538 | | |
| 06/01/27 | | | 5.000 | % | | | 5,800,000 | | | | 6,539,500 | | |
Unlimited General Obligation Refunding Bonds
Capital Outlay
Series 2004B | |
| 06/01/24 | | | 5.000 | % | | | 5,500,000 | | | | 5,952,430 | | |
The Accompanying Notes to Financial Statements are an integral part of this statement.
10
Columbia Tax-Exempt Fund
November 30, 2011
(Percentages represent value of investments compared to net assets)
Issue
Description | | Coupon
Rate | | Principal
Amount | | Value | |
| Municipal Bonds (continued) | |
| Florida (cont.) | |
Highlands County Health Facilities Authority
Prerefunded 11/15/12 Revenue Bonds
Adventist Health
Series 2002B | |
| 11/15/23 | | | 5.250 | % | | $ | 10,300,000 | | | $ | 10,789,044 | | |
Prerefunded 11/15/16 Revenue Bonds
Adventist Health
Series 2006C | |
| 11/15/36 | | | 5.250 | % | | | 215,000 | | | | 256,426 | | |
| Series 2006G | |
| 11/15/21 | | | 5.125 | % | | | 70,000 | | | | 83,068 | | |
| 11/15/32 | | | 5.125 | % | | | 465,000 | | | | 551,811 | | |
Hillsborough County Industrial Development Authority
Refunding Revenue Bonds
Tampa General Hospital Project
Series 2003A | |
| 10/01/18 | | | 5.000 | % | | | 825,000 | | | | 851,945 | | |
Jacksonville Health Facilities Authority
Revenue Bonds
Brooks Health System
Series 2007 | |
| 11/01/38 | | | 5.250 | % | | | 5,000,000 | | | | 4,838,850 | | |
Marion County Hospital District
Improvement Refunding Revenue Bonds
Munroe Regional Health System
Series 2007 | |
| 10/01/29 | | | 5.000 | % | | | 1,000,000 | | | | 975,730 | | |
Mid-Bay Bridge Authority
Revenue Bonds
Series 1991A Escrowed to Maturity | |
| 10/01/22 | | | 6.875 | % | | | 2,000,000 | | | | 2,685,780 | | |
| Series 2011A | |
| 10/01/40 | | | 7.250 | % | | | 7,000,000 | | | | 7,293,650 | | |
Orange County School Board
Certificate of Participation
Series 2005B (AMBAC) | |
| 08/01/25 | | | 5.000 | % | | | 2,440,000 | | | | 2,524,058 | | |
Sarasota County Health Facilities Authority
Refunding Revenue Bonds
Village on the Isle Project
Series 2007 | |
| 01/01/14 | | | 5.000 | % | | | 945,000 | | | | 956,302 | | |
Sarasota County Public Hospital Board
Refunding Revenue Bonds
Sarasota Memorial Hospital
Series 1998B (NPFGC) | |
| 07/01/28 | | | 5.500 | % | | | 6,980,000 | | | | 7,476,138 | | |
Seminole Indian Tribe of Florida
Revenue Bonds
Series 2007A(b)(c) | |
| 10/01/27 | | | 5.250 | % | | | 9,750,000 | | | | 8,905,943 | | |
South Florida Water Management District
Certificate of Participation
Series 2006 (AMBAC) | |
| 10/01/26 | | | 5.000 | % | | | 1,400,000 | | | | 1,464,694 | | |
State of Florida
Revenue Bonds
Series 2007A (AMBAC) | |
| 07/01/18 | | | 5.000 | % | | | 2,000,000 | | | | 2,327,140 | | |
Issue
Description | | Coupon
Rate | | Principal
Amount | | Value | |
| Municipal Bonds (continued) | |
| Florida (cont.) | |
Unlimited General Obligation Bonds
Jacksonville Transportation Authority
Series 1985 Escrowed to Maturity | |
| 01/01/15 | | | 9.200 | % | | $ | 1,595,000 | | | $ | 1,804,743 | | |
Unrefunded Unlimited General Obligation Bonds
Series 1985 | |
| 06/01/14 | | | 9.125 | % | | | 675,000 | | | | 732,301 | | |
Tampa Sports Authority
Sales Tax Revenue Bonds
Tampa Bay Arena Project
Series 1995 (NPFGC) | |
| 10/01/25 | | | 5.750 | % | | | 2,500,000 | | | | 2,613,600 | | |
Tolomato Community Development District
Special Assessment Bonds
Series 2007 | |
| 05/01/17 | | | 6.375 | % | | | 885,000 | | | | 548,682 | | |
| 05/01/27 | | | 6.550 | % | | | 3,500,000 | | | | 1,993,705 | | |
Village Center Community Development District
Refunding Revenue Bonds
Series 1998A (NPFGC) | |
| 11/01/12 | | | 5.500 | % | | | 750,000 | | | | 771,210 | | |
Waterset North Community Development District
Special Assessment Bonds
Series 2007A | |
| 05/01/39 | | | 6.600 | % | | | 2,945,000 | | | | 1,683,156 | | |
Westchester Community Development District No. 1
Special Assessment Bonds
Community Infrastructure
Series 2003 | |
| 05/01/23 | | | 6.000 | % | | | 1,985,000 | | | | 1,888,549 | | |
| Total | | | 133,652,346 | | |
| Georgia 2.9% | |
Barnesville-Lamar County Industrial Development Authority
Revenue Bonds
Gordon College Properties
Series 2004A | |
| 08/01/25 | | | 5.000 | % | | | 1,250,000 | | | | 1,272,400 | | |
Cartersville Development Authority
Refunding Revenue Bonds
Anheuser-Busch Project
Series 2002 AMT(a) | |
| 02/01/32 | | | 5.950 | % | | | 1,250,000 | | | | 1,252,750 | | |
Chatham County Hospital Authority
Revenue Bonds
Improvement-Memorial Health University
Series 2004A | |
| 01/01/34 | | | 5.500 | % | | | 2,500,000 | | | | 2,078,900 | | |
City of Atlanta
Revenue Bonds
Series 1999A (NPFGC/FGIC) | |
| 11/01/22 | | | 5.500 | % | | | 5,475,000 | | | | 6,349,248 | | |
| Series 2004 (AGM) | |
| 11/01/25 | | | 5.750 | % | | | 1,000,000 | | | | 1,188,910 | | |
County of Fulton Water & Sewerage
Revenue Bonds
Series 1992 Escrowed to Maturity | |
| 01/01/14 | | | 6.375 | % | | | 9,045,000 | | | | 9,602,443 | | |
The Accompanying Notes to Financial Statements are an integral part of this statement.
11
Columbia Tax-Exempt Fund
November 30, 2011
(Percentages represent value of investments compared to net assets)
Issue
Description | | Coupon
Rate | | Principal
Amount | | Value | |
| Municipal Bonds (continued) | |
| Georgia (cont.) | |
DeKalb County Hospital Authority
Revenue Bonds
DeKalb Medical Center, Inc. Project
Series 2010 | |
| 09/01/40 | | | 6.125 | % | | $ | 6,250,000 | | | $ | 6,335,875 | | |
Fulton County Development Authority
Revenue Bonds
Georgia Tech Athletic Association
Series 2001 (AMBAC) | |
| 10/01/12 | | | 5.500 | % | | | 2,385,000 | | | | 2,421,133 | | |
| 10/01/32 | | | 5.125 | % | | | 1,270,000 | | | | 1,261,072 | | |
Georgia Tech Foundation Funding
Series 2002A | |
| 11/01/13 | | | 5.250 | % | | | 1,105,000 | | | | 1,126,846 | | |
Gainesville & Hall County Hospital Authority
Revenue Bonds
Northeast Georgia Healthcare
Series 2010A | |
| 02/15/45 | | | 5.500 | % | | | 32,500,000 | | | | 32,710,275 | | |
Georgia Housing & Finance Authority
Revenue Bonds
Single Family Mortgage
Subordinated Series 1999A-2 AMT(a) | |
| 06/01/29 | | | 5.200 | % | | | 1,615,000 | | | | 1,615,210 | | |
Georgia State Road & Tollway Authority
Refunding Revenue Bonds
Series 2011A | |
| 03/01/18 | | | 5.000 | % | | | 15,695,000 | | | | 19,046,196 | | |
| Series 2011B | |
| 10/01/16 | | | 5.000 | % | | | 2,000,000 | | | | 2,366,860 | | |
Henry County Water & Sewerage Authority
Revenue Bonds
Series 1997 (AMBAC) | |
| 02/01/20 | | | 6.150 | % | | | 5,390,000 | | | | 6,726,073 | | |
Metropolitan Atlanta Rapid Transit Authority
Refunding Revenue Bonds
Rental-Mortgage
Series 1992N | |
| 07/01/18 | | | 6.250 | % | | | 450,000 | | | | 519,727 | | |
| Series 1992P (AMBAC) | |
| 07/01/20 | | | 6.250 | % | | | 6,000,000 | | | | 7,079,580 | | |
| Series 2007A (AMBAC/FGIC) | |
| 07/01/26 | | | 5.250 | % | | | 1,000,000 | | | | 1,150,260 | | |
Municipal Electric Authority of Georgia
Refunding Revenue Bonds
Series 1991V (NPFGC) | |
| 01/01/18 | | | 6.600 | % | | | 420,000 | | | | 473,357 | | |
Revenue Bonds
Series 1991V Escrowed to Maturity (NPFGC) | |
| 01/01/18 | | | 6.600 | % | | | 3,600,000 | | | | 4,295,520 | | |
Unrefunded Revenue Bonds
Series 1991V (NPFGC) | |
| 01/01/18 | | | 6.600 | % | | | 17,280,000 | | | | 19,893,946 | | |
Rockdale County Development Authority
Revenue Bonds
Visy Paper Project
Series 2007A AMT(a) | |
| 01/01/34 | | | 6.125 | % | | | 3,000,000 | | | | 2,955,210 | | |
Issue
Description | | Coupon
Rate | | Principal
Amount | | Value | |
| Municipal Bonds (continued) | |
| Georgia (cont.) | |
Upper Oconee Basin Water Authority
Refunding Revenue Bonds
Series 2005 (NPFGC) | |
| 07/01/24 | | | 5.000 | % | | $ | 1,000,000 | | | $ | 1,087,770 | | |
| Total | | | 132,809,561 | | |
| Guam —% | |
Territory of Guam
Revenue Bonds
Section 30
Series 2009A(c) | |
| 12/01/34 | | | 5.750 | % | | | 2,000,000 | | | | 2,028,140 | | |
| Hawaii 0.7% | |
Hawaii Pacific Health
Revenue Bonds
Series 2010A | |
| 07/01/40 | | | 5.500 | % | | | 6,500,000 | | | | 6,471,790 | | |
| Series 2010B | |
| 07/01/30 | | | 5.625 | % | | | 1,220,000 | | | | 1,250,390 | | |
| 07/01/40 | | | 5.750 | % | | | 1,630,000 | | | | 1,654,157 | | |
Hawaii State Department of Budget & Finance
Revenue Bonds
15 Craigside Project
Series 2009A | |
| 11/15/29 | | | 8.750 | % | | | 1,000,000 | | | | 1,134,320 | | |
| 11/15/44 | | | 9.000 | % | | | 3,000,000 | | | | 3,420,150 | | |
Hawaiian Electric Co. Subsidiary
Series 2009 | |
| 07/01/39 | | | 6.500 | % | | | 5,250,000 | | | | 5,669,632 | | |
Hawaii State Department of Budget & Finance(a)
Refunding Revenue Bonds
Electric Co. & Subsidiary Project
Series 2003B (XLCA) AMT | |
| 12/01/22 | | | 5.000 | % | | | 12,500,000 | | | | 12,468,625 | | |
| Total | | | 32,069,064 | | |
| Idaho 0.4% | |
Idaho Health Facilities Authority
Revenue Bonds
Trinity Health Group
Series 2008B | |
| 12/01/23 | | | 6.000 | % | | | 1,000,000 | | | | 1,157,440 | | |
| 12/01/33 | | | 6.250 | % | | | 6,000,000 | | | | 6,658,920 | | |
Idaho Health Facilities Authority(h)
Refunding Revenue Bonds
IHC Hospitals, Inc.
Series 1992 Escrowed to Maturity | |
| 02/15/21 | | | 6.650 | % | | | 6,000,000 | | | | 8,151,000 | | |
| Total | | | 15,967,360 | | |
| Illinois 8.1% | |
Chicago Board of Education
Certificate of Participation
Lease Certificates
Series 1992A (NPFGC) | |
| 01/01/15 | | | 6.250 | % | | | 12,900,000 | | | | 13,661,616 | | |
| 01/01/16 | | | 6.000 | % | | | 5,000,000 | | | | 5,715,350 | | |
| 01/01/20 | | | 6.000 | % | | | 8,000,000 | | | | 9,102,960 | | |
Unlimited General Obligation Refunding Bonds
Series 2005A (AMBAC) | |
| 12/01/22 | | | 5.500 | % | | | 4,750,000 | | | | 5,418,753 | | |
The Accompanying Notes to Financial Statements are an integral part of this statement.
12
Columbia Tax-Exempt Fund
November 30, 2011
(Percentages represent value of investments compared to net assets)
Issue
Description | | Coupon
Rate | | Principal
Amount | | Value | |
| Municipal Bonds (continued) | |
| Illinois (cont.) | |
Chicago Board of Education(e)
Unlimited General Obligation Bonds
Capital Appreciation-School Reform
Series 1998B-1 (NPFGC/FGIC) | |
| 12/01/21 | | | 0.000 | % | | $ | 8,000,000 | | | $ | 5,294,240 | | |
| 12/01/22 | | | 0.000 | % | | | 25,200,000 | | | | 15,656,256 | | |
City of Chicago Wastewater Transmission
Refunding Revenue Bonds
Capital Appreciation
Series 1998A (NPFGC)(e) | |
| 01/01/20 | | | 0.000 | % | | | 7,275,000 | | | | 5,252,186 | | |
City of Chicago
Limited General Obligation Refunding Bonds
Emergency Telephone System
Series 1999 (NPFGC/FGIC) | |
| 01/01/23 | | | 5.500 | % | | | 9,750,000 | | | | 10,683,952 | | |
Revenue Bonds
Asphalt Operating Services-Recovery Zone Facility
Series 2010 | |
| 12/01/18 | | | 6.125 | % | | | 5,070,000 | | | | 5,219,717 | | |
City of Chicago(e)
Unlimited General Obligation Refunding Bonds
Capital Appreciation
Series 2009C | |
| 01/01/23 | | | 0.000 | % | | | 4,900,000 | | | | 2,797,606 | | |
| 01/01/25 | | | 0.000 | % | | | 2,000,000 | | | | 987,040 | | |
| 01/01/27 | | | 0.000 | % | | | 3,000,000 | | | | 1,262,550 | | |
Cook County High School District No. 209 Proviso
Township
Limited General Obligation Bonds
Capital Appreciation
Series 2004 (AGM) | |
| 12/01/15 | | | 5.000 | % | | | 1,750,000 | | | | 1,917,265 | | |
Cook County School District No. 102 La Grange
Unlimited General Obligation Bonds
Capital Appreciation
Series 2001 (NPFGC/FGIC)(e) | |
| 12/01/20 | | | 0.000 | % | | | 3,065,000 | | | | 2,131,033 | | |
County of Champaign
Unlimited General Obligation Bonds
Public Safety Sales Tax
Series 1999 (NPFGC/FGIC) | |
| 01/01/20 | | | 8.250 | % | | | 1,015,000 | | | | 1,402,984 | | |
| 01/01/23 | | | 8.250 | % | | | 1,420,000 | | | | 2,048,350 | | |
County of Du Page
Unlimited General Obligation Refunding Bonds
Jail Project
Series 1993 | |
| 01/01/21 | | | 5.600 | % | | | 2,565,000 | | | | 2,998,485 | | |
DeKalb County Community Unit School District No. 424
Genoa-Kingston
Unlimited General Obligation Bonds
Capital Appreciation
Series 2001 (AMBAC)(e) | |
| 01/01/21 | | | 0.000 | % | | | 2,675,000 | | | | 1,763,280 | | |
Illinois Finance Authority
Refunding Revenue Bonds
Commonwealth Edison Co.
Series 1994 (AMBAC/TCRS) | |
| 01/15/14 | | | 5.850 | % | | | 4,500,000 | | | | 4,852,125 | | |
Issue
Description | | Coupon
Rate | | Principal
Amount | | Value | |
| Municipal Bonds (continued) | |
| Illinois (cont.) | |
Swedish Covenant
Series 2010A | |
| 08/15/38 | | | 6.000 | % | | $ | 12,505,000 | | | $ | 12,665,189 | | |
Uno Charter School
Series 2011A | |
| 10/01/41 | | | 7.125 | % | | | 3,000,000 | | | | 3,015,990 | | |
Revenue Bonds
CHF-Normal LLC-Illinois State University
Series 2011 | |
| 04/01/43 | | | 7.000 | % | | | 5,550,000 | | | | 5,828,388 | | |
Hoosier Care Project
Series 1999A | |
| 06/01/34 | | | 7.125 | % | | | 2,135,000 | | | | 1,964,905 | | |
Northwestern Memorial Hospital
Series 2009A | |
| 08/15/30 | | | 5.750 | % | | | 2,000,000 | | | | 2,163,880 | | |
| Series 2009B | |
| 08/15/30 | | | 5.750 | % | | | 10,000,000 | | | | 10,765,400 | | |
Riverside Health System
Series 2009 | |
| 11/15/35 | | | 6.250 | % | | | 8,200,000 | | | | 8,651,246 | | |
Rush University Medical Center
Series 2009C | |
| 11/01/39 | | | 6.625 | % | | | 8,000,000 | | | | 8,531,760 | | |
Sherman Health System
Series 2007A | |
| 08/01/37 | | | 5.500 | % | | | 19,550,000 | | | | 18,422,356 | | |
Silver Cross & Medical Centers
Series 2009 | |
| 08/15/38 | | | 6.875 | % | | | 39,300,000 | | | | 41,219,805 | | |
South Suburban
Series 1992 Escrowed to Maturity | |
| 02/15/18 | | | 7.000 | % | | | 2,505,000 | | | | 2,978,144 | | |
Illinois Finance Authority(d)(g)
Revenue Bonds
Sedgebrook, Inc. Facility
Series 2007A | |
| 11/15/11 | | | 5.500 | % | | | 1,000,000 | | | | 10 | | |
Illinois Finance Authority(e)
Subordinated Revenue Bonds
Regency
Series 1990-RMK Escrowed to Maturity | |
| 04/15/20 | | | 0.000 | % | | | 68,000,000 | | | | 55,303,720 | | |
Illinois Sports Facilities Authority
Revenue Bonds
State Tax Supported-Capital Appreciation
Series 2001 (AMBAC)(e) | |
| 06/15/18 | | | 0.000 | % | | | 4,000,000 | | | | 3,064,760 | | |
Lake County School District No. 56 Gurnee
Unlimited General Obligation Bonds
Series 1997 (NPFGC/FGIC) | |
| 01/01/17 | | | 9.000 | % | | | 8,840,000 | | | | 11,667,297 | | |
Metropolitan Pier & Exposition Authority
Refunding Revenue Bonds
McCormick
Series 2010B-2 | |
| 06/15/50 | | | 5.000 | % | | | 6,625,000 | | | | 6,352,183 | | |
The Accompanying Notes to Financial Statements are an integral part of this statement.
13
Columbia Tax-Exempt Fund
November 30, 2011
(Percentages represent value of investments compared to net assets)
Issue
Description | | Coupon
Rate | | Principal
Amount | | Value | |
| Municipal Bonds (continued) | |
| Illinois (cont.) | |
Metropolitan Pier & Exposition Authority(e)
Revenue Bonds
Capital Appreciation-McCormick Place Expansion
Series 1993A (NPFGC/FGIC) | |
| 06/15/16 | | | 0.000 | % | | $ | 3,750,000 | | | $ | 3,274,763 | | |
Metropolitan Water Reclamation District of Greater
Chicago
Limited General Obligation Refunding Bonds
Series 2007C | |
| 12/01/33 | | | 5.250 | % | | | 13,210,000 | | | | 15,461,644 | | |
Railsplitter Tobacco Settlement Authority
Revenue Bonds
Series 2010 | |
| 06/01/28 | | | 6.000 | % | | | 15,000,000 | | | | 15,787,350 | | |
Regional Transportation Authority
Revenue Bonds
Series 1994C (NPFGC/FGIC) | |
| 06/01/20 | | | 7.750 | % | | | 5,000,000 | | | | 6,177,250 | | |
| Series 2002A (NPFGC) | |
| 07/01/31 | | | 6.000 | % | | | 5,400,000 | | | | 6,446,844 | | |
State of Illinois
Revenue Bonds
1st Series 2002 (NPFGC/FGIC) | |
| 06/15/23 | | | 6.000 | % | | | 4,000,000 | | | | 4,957,360 | | |
| Series 2005 (AGM) | |
| 06/15/28 | | | 5.000 | % | | | 2,000,000 | | | | 2,075,440 | | |
Unlimited General Obligation Bonds
1st Series 2001 (NPFGC/FGIC) | |
| 11/01/26 | | | 6.000 | % | | | 3,000,000 | | | | 3,428,640 | | |
| Series 2004A | |
| 03/01/34 | | | 5.000 | % | | | 3,000,000 | | | | 2,971,950 | | |
| Series 2006 | |
| 01/01/31 | | | 5.500 | % | | | 7,985,000 | | | | 8,522,949 | | |
Village of Glendale Heights
Refunding Revenue Bonds
Glendale Heights Project
Series 1985B Escrowed to Maturity | |
| 12/01/15 | | | 7.100 | % | | | 770,000 | | | | 871,247 | | |
Will County Community Unit School
District No. 365-Valley View
Unlimited General Obligation Bonds
Series 1997B Escrowed to Maturity (AGM)(e) | |
| 11/01/16 | | | 0.000 | % | | | 3,165,000 | | | | 2,933,639 | | |
Will-Kankakee Regional Development Authority
Prerefunded 12/15/11 Revenue Bonds
Flanders Corp./PrecisionAire
Series 1997 AMT(a)(d) | |
| 12/15/17 | | | 6.500 | % | | | 1,495,000 | | | | 1,498,439 | | |
| Total | | | 365,168,296 | | |
| Indiana 2.0% | |
County of Jasper
Refunding Revenue Bonds
Various-Northern Indiana Public Services
Series 1994C (NPFGC) | |
| 04/01/19 | | | 5.850 | % | | | 3,000,000 | | | | 3,456,900 | | |
| Series 2003-RMKT (AMBAC) | |
| 07/01/17 | | | 5.700 | % | | | 2,000,000 | | | | 2,265,320 | | |
Issue
Description | | Coupon
Rate | | Principal
Amount | | Value | |
| Municipal Bonds (continued) | |
| Indiana (cont.) | |
Crown Point Multi School Building Corp.
Revenue Bonds
First Mortgage
Series 2000 (NPFGC)(e) | |
| 01/15/19 | | | 0.000 | % | | $ | 8,165,000 | | | $ | 6,289,336 | | |
Indiana Finance Authority
Refunding Revenue Bonds
Series 2007A (NPFGC/FGIC) | |
| 06/01/29 | | | 4.500 | % | | | 10,000,000 | | | | 10,125,100 | | |
Sisters of St. Francis Health
Series 2008 | |
| 11/01/32 | | | 5.375 | % | | | 4,000,000 | | | | 4,150,560 | | |
Revenue Bonds
1st Lien-CWA Authority
Series 2011A | |
| 10/01/31 | | | 5.250 | % | | | 8,335,000 | | | | 9,012,802 | | |
BHI Senior Living
Series 2011 | |
| 11/15/31 | | | 5.500 | % | | | 1,175,000 | | | | 1,155,413 | | |
| 11/15/41 | | | 5.750 | % | | | 5,655,000 | | | | 5,606,933 | | |
Parkview Health System
Series 2009A | |
| 05/01/31 | | | 5.750 | % | | | 6,500,000 | | | | 6,811,090 | | |
State Revolving Fund Program
Series 2006A | |
| 02/01/25 | | | 5.000 | % | | | 8,000,000 | | | | 8,651,040 | | |
Indiana Health & Educational Facilities Financing Authority
Refunding Revenue Bonds
Clarian Health Obligation Group
Series 2006B | |
| 02/15/33 | | | 5.000 | % | | | 6,950,000 | | | | 6,913,512 | | |
Revenue Bonds
Clarian Health Obligation Group
Series 2006A | |
| 02/15/36 | | | 5.000 | % | | | 4,375,000 | | | | 4,320,225 | | |
Indiana Health Facility Financing Authority
Revenue Bonds
Hoosier Care Project
Series 1999A | |
| 06/01/34 | | | 7.125 | % | | | 11,045,000 | | | | 10,165,045 | | |
Indiana State Office Building Commission
Revenue Bonds
Womens Prison
Series 1995B (AMBAC) | |
| 07/01/16 | | | 6.250 | % | | | 8,000,000 | | | | 8,971,120 | | |
Indianapolis Airport Authority
Revenue Bonds
Special Facilities-United Air Lines Project
Series 1995A AMT(a)(d)(g) | |
| 11/15/31 | | | 0.000 | % | | | 1,341,041 | | | | 6,692 | | |
Purdue University
Revenue Bonds
Student Fees
Series 2009X | |
| 07/01/23 | | | 5.250 | % | | | 1,000,000 | | | | 1,176,470 | | |
The Accompanying Notes to Financial Statements are an integral part of this statement.
14
Columbia Tax-Exempt Fund
November 30, 2011
(Percentages represent value of investments compared to net assets)
Issue
Description | | Coupon
Rate | | Principal
Amount | | Value | |
| Municipal Bonds (continued) | |
| Indiana (cont.) | |
Vigo County Hospital Authority
Revenue Bonds
Union Hospital, Inc.
Series 2007(b) | |
| 09/01/37 | | | 5.700 | % | | $ | 3,950,000 | | | $ | 3,373,063 | | |
| Total | | | 92,450,621 | | |
| Iowa 0.7% | |
City of Ames
Revenue Bonds
Mary Greely Medical Center
Series 2011 | |
| 06/15/36 | | | 5.250 | % | | | 6,000,000 | | | | 5,999,820 | | |
City of Marion
Refunding Revenue Bonds
1st Mortgage
Series 2003 | |
| 01/01/29 | | | 8.000 | % | | | 178,000 | | | | 171,069 | | |
Iowa Finance Authority
Refunding Revenue Bonds
Correctional Facility Program
Series 2002 (NPFGC) | |
| 06/15/13 | | | 5.375 | % | | | 6,000,000 | | | | 6,444,660 | | |
Revenue Bonds
Care Initiatives Project
Series 1998B | |
| 07/01/28 | | | 5.750 | % | | | 4,500,000 | | | | 3,793,140 | | |
Iowa Student Loan Liquidity Corp.(a)
Senior Revenue Bonds
Series 2011A-2 AMT | |
| 12/01/26 | | | 5.600 | % | | | 8,000,000 | | | | 8,036,480 | | |
| 12/01/27 | | | 5.700 | % | | | 5,000,000 | | | | 4,979,250 | | |
| Total | | | 29,424,419 | | |
| Kansas 0.7% | |
Wichita Airport Authority
Special Revenue Bonds
Cessna Citation Service Center
Series 2002A AMT(a) | |
| 06/15/32 | | | 6.250 | % | | | 5,000,000 | | | | 4,933,300 | | |
Wyandotte County-Kansas City Unified Government
Revenue Bonds
Capital Appreciation Sales Tax Subordinated Lien
Series 2010(e) | |
| 06/01/21 | | | 0.000 | % | | | 41,525,000 | | | | 24,727,722 | | |
| Total | | | 29,661,022 | | |
| Kentucky 1.8% | |
County of Ohio
Refunding Revenue Bonds
Big Rivers Electric Corp. Project
Series 2010A | |
| 07/15/31 | | | 6.000 | % | | | 24,870,000 | | | | 25,483,045 | | |
Kentucky Economic Development Finance Authority
Refunding Revenue Bonds
Owensboro Medical Health
Series 2010B | |
| 03/01/40 | | | 6.375 | % | | | 5,800,000 | | | | 6,068,888 | | |
Issue
Description | | Coupon
Rate | | Principal
Amount | | Value | |
| Municipal Bonds (continued) | |
| Kentucky (cont.) | |
Revenue Bonds
Kings Daughters Medical
Series 2010 | |
| 02/01/40 | | | 5.000 | % | | $ | 3,300,000 | | | $ | 3,280,035 | | |
Louisville Arena
Subordinated Series 2008A-1 (AGM) | |
| 12/01/33 | | | 6.000 | % | | | 3,200,000 | | | | 3,397,664 | | |
| 12/01/38 | | | 6.000 | % | | | 2,850,000 | | | | 3,001,706 | | |
Owensboro Medical Health System
Series 2010A | |
| 03/01/45 | | | 6.500 | % | | | 14,550,000 | | | | 15,325,806 | | |
Louisville/Jefferson County Metropolitan Government
Revenue Bonds
Jewish Hospital St. Mary's Healthcare
Series 2008 | |
| 02/01/27 | | | 5.750 | % | | | 24,000,000 | | | | 24,648,960 | | |
| Total | | | 81,206,104 | | |
| Louisiana 3.0% | |
Calcasieu Parish Industrial Development Board, Inc.
Revenue Bonds
Conoco, Inc. Project
Series 1996 AMT(a) | |
| 12/01/26 | | | 5.750 | % | | | 2,500,000 | | | | 2,502,125 | | |
City of New Orleans
Unlimited General Obligation Refunding Bonds
Capital Appreciation
Series 1991 (AMBAC)(e) | |
| 09/01/12 | | | 0.000 | % | | | 6,250,000 | | | | 6,161,688 | | |
East Baton Rouge Mortgage Finance Authority
Refunding Revenue Bonds
Series 1993B (GNMA/FNMA) | |
| 10/01/25 | | | 5.400 | % | | | 295,000 | | | | 295,268 | | |
Jefferson Sales Tax District
Refunding Revenue Bonds
Series 2009B | |
| 12/01/22 | | | 4.500 | % | | | 1,000,000 | | | | 1,092,400 | | |
Revenue Bonds
Series 2007B (AMBAC) | |
| 12/01/20 | | | 5.250 | % | | | 1,000,000 | | | | 1,131,210 | | |
Lafayette Consolidated Government
Refunding Revenue Bonds
Series 2006C (AMBAC) | |
| 05/01/21 | | | 5.000 | % | | | 1,000,000 | | | | 1,096,370 | | |
Louisiana Housing Finance Agency
Revenue Bonds
Homeownership Program
Series 2008A (GNMA/FNMA/FHLMC) | |
| 12/01/23 | | | 4.875 | % | | | 740,000 | | | | 781,788 | | |
Louisiana Local Government Environmental Facilities &
Community Development Authority
Revenue Bonds
Westlake Chemical Corp.
Series 2010A-2 | |
| 11/01/35 | | | 6.500 | % | | | 6,250,000 | | | | 6,522,187 | | |
The Accompanying Notes to Financial Statements are an integral part of this statement.
15
Columbia Tax-Exempt Fund
November 30, 2011
(Percentages represent value of investments compared to net assets)
Issue
Description | | Coupon
Rate | | Principal
Amount | | Value | |
| Municipal Bonds (continued) | |
| Louisiana (cont.) | |
Louisiana Public Facilities Authority
Refunding Revenue Bonds
Southern Baptist Hospital, Inc. Project
Series 1986 Escrowed to Maturity | |
| 05/15/12 | | | 8.000 | % | | $ | 1,025,000 | | | $ | 1,059,614 | | |
Tulane University Project
Series 2007A-1 (NPFGC) | |
| 02/15/26 | | | 5.000 | % | | | 1,000,000 | | | | 1,050,380 | | |
Revenue Bonds
Hurricane Recovery Program
Series 2007 (AMBAC) | |
| 06/01/20 | | | 5.000 | % | | | 1,000,000 | | | | 1,079,110 | | |
Louisiana State Citizens Property Insurance Corp.
Revenue Bonds
Series 2006B (AMBAC) | |
| 06/01/16 | | | 5.000 | % | | | 9,500,000 | | | | 10,166,140 | | |
| Series 2009C-4 | |
| 06/01/24 | | | 6.125 | % | | | 1,000,000 | | | | 1,031,820 | | |
New Orleans Aviation Board
Revenue Bonds
Consolidated Rental Car
Series 2009A | |
| 01/01/30 | | | 6.250 | % | | | 5,250,000 | | | | 5,538,015 | | |
| 01/01/40 | | | 6.500 | % | | | 20,400,000 | | | | 21,448,356 | | |
Parish of St. John the Baptist
Revenue Bonds
Marathon Oil Corp.
Series 2007A | |
| 06/01/37 | | | 5.125 | % | | | 18,600,000 | | | | 18,224,094 | | |
Port New Orleans Board of Commissioners
Revenue Bonds
Series 2002 (NPFGC/FGIC) AMT(a) | |
| 04/01/32 | | | 5.000 | % | | | 1,250,000 | | | | 1,185,688 | | |
St. Tammany Parish Wide School District No. 12
Unlimited General Obligation Bonds
Series 2008 | |
| 03/01/23 | | | 4.500 | % | | | 1,000,000 | | | | 1,081,280 | | |
Tobacco Settlement Financing Corp.
Asset-Backed Revenue Bonds
Series 2001B | |
| 05/15/30 | | | 5.500 | % | | | 22,765,000 | | | | 22,787,310 | | |
| 05/15/39 | | | 5.875 | % | | | 31,270,000 | | | | 31,271,563 | | |
| Total | | | 135,506,406 | | |
| Maine 0.1% | |
Maine State Housing Authority
Revenue Bonds
Series 2003A-2 AMT(a) | |
| 11/15/32 | | | 5.000 | % | | | 3,000,000 | | | | 2,999,940 | | |
| Maryland 0.7% | |
City of Brunswick
Special Tax Bonds
Brunswick Crossing Special Taxing
Series 2006 | |
| 07/01/36 | | | 5.500 | % | | | 6,817,000 | | | | 5,296,059 | | |
Issue
Description | | Coupon
Rate | | Principal
Amount | | Value | |
| Municipal Bonds (continued) | |
| Maryland (cont.) | |
County of Baltimore
Revenue Bonds
Oak Crest Village, Inc. Facility
Series 2007A | |
| 01/01/37 | | | 5.000 | % | | $ | 5,000,000 | | | $ | 4,681,100 | | |
Maryland Economic Development Corp.
Refunding Revenue Bonds
CNX Marine Terminals, Inc.
Series 2010 | |
| 09/01/25 | | | 5.750 | % | | | 4,000,000 | | | | 4,073,080 | | |
Revenue Bonds
Collegiate Housing-Salisbury
Series 1999A | |
| 06/01/30 | | | 6.000 | % | | | 3,000,000 | | | | 3,000,000 | | |
University of Maryland College Park Projects
Series 2008 | |
| 06/01/33 | | | 5.750 | % | | | 1,600,000 | | | | 1,653,376 | | |
Maryland Health & Higher Educational Facilities Authority
Revenue Bonds
Anne Arundel Health System
Series 2009A | |
| 07/01/39 | | | 6.750 | % | | | 5,000,000 | | | | 5,627,100 | | |
Carroll County General Hospital
Series 2002 | |
| 07/01/37 | | | 6.000 | % | | | 2,250,000 | | | | 2,261,048 | | |
University of Maryland Medical System
Series 2005 (AMBAC) | |
| 07/01/28 | | | 5.250 | % | | | 3,000,000 | | | | 3,186,570 | | |
Washington County Hospital
Series 2008 | |
| 01/01/33 | | | 5.750 | % | | | 3,495,000 | | | | 3,525,092 | | |
Morgan State University
Revenue Bonds
Series 2003A (NPFGC/FGIC) | |
| 07/01/32 | | | 5.000 | % | | | 450,000 | | | | 455,040 | | |
| Total | | | 33,758,465 | | |
| Massachusetts 5.6% | |
Boston Industrial Development Financing Authority
Revenue Bonds
Crosstown Center Project
Senior Series 2002 AMT(a)(d) | |
| 09/01/35 | | | 6.500 | % | | | 2,845,000 | | | | 2,028,456 | | |
Boston Water & Sewer Commission
Revenue Bonds
Senior Series 2004A | |
| 11/01/22 | | | 5.000 | % | | | 5,435,000 | | | | 5,996,001 | | |
City of Newton
Limited General Obligation Bonds
State Qualified School
Series 2009A | |
| 04/01/25 | | | 4.125 | % | | | 2,295,000 | | | | 2,447,434 | | |
Commonwealth of Massachusetts
Limited General Obligation Refunding Bonds
Series 2004B | |
| 08/01/28 | | | 5.250 | % | | | 3,000,000 | | | | 3,620,460 | | |
Refunding Revenue Bonds
Series 2005 (NPFGC/FGIC) | |
| 01/01/27 | | | 5.500 | % | | | 4,500,000 | | | | 5,121,585 | | |
| 01/01/28 | | | 5.500 | % | | | 7,500,000 | | | | 8,425,200 | | |
The Accompanying Notes to Financial Statements are an integral part of this statement.
16
Columbia Tax-Exempt Fund
November 30, 2011
(Percentages represent value of investments compared to net assets)
Issue
Description | | Coupon
Rate | | Principal
Amount | | Value | |
| Municipal Bonds (continued) | |
| Massachusetts (cont.) | |
Martha's Vineyard Land Bank
Revenue Bonds
Series 2002 (AMBAC) | |
| 05/01/32 | | | 5.000 | % | | $ | 3,000,000 | | | $ | 3,077,430 | | |
Massachusetts Bay Transportation Authority
Refunding Revenue Bonds
General Transportation System
Series 1994C (AGM) | |
| 03/01/19 | | | 7.000 | % | | | 2,500,000 | | | | 3,020,200 | | |
Revenue Bonds
Senior Series 2005B (NPFGC) | |
| 07/01/26 | | | 5.500 | % | | | 1,500,000 | | | | 1,861,800 | | |
| 07/01/29 | | | 5.500 | % | | | 2,000,000 | | | | 2,453,500 | | |
| Series 2005A | |
| 07/01/24 | | | 5.000 | % | | | 1,000,000 | | | | 1,206,600 | | |
Massachusetts Department of Transportation(e)
Revenue Bonds
Capital Appreciation
Senior Series 1997C (NPFGC) | |
| 01/01/18 | | | 0.000 | % | | | 4,700,000 | | | | 3,895,172 | | |
| 01/01/20 | | | 0.000 | % | | | 17,000,000 | | | | 12,719,230 | | |
Massachusetts Development Finance Agency
Refunding Revenue Bonds
Simons Rock College of Bard
Series 2007 | |
| 08/01/36 | | | 4.700 | % | | | 500,000 | | | | 479,385 | | |
Revenue Bonds
Adventcare Project
Series 2007A | |
| 10/15/28 | | | 6.650 | % | | | 5,000,000 | | | | 4,790,600 | | |
Boston Biomedical Research
Series 1999 | |
| 02/01/19 | | | 5.650 | % | | | 1,105,000 | | | | 1,104,889 | | |
Boston College
Series 2009Q-2 | |
| 07/01/29 | | | 5.000 | % | | | 1,455,000 | | | | 1,583,084 | | |
Boston University
Series 1999P | |
| 05/15/59 | | | 6.000 | % | | | 2,325,000 | | | | 2,593,491 | | |
Devens Electric System
Series 2001 | |
| 12/01/30 | | | 6.000 | % | | | 1,000,000 | | | | 1,016,320 | | |
Groves-Lincoln
Series 2009A | |
| 06/01/39 | | | 7.750 | % | | | 2,250,000 | | | | 2,254,410 | | |
Linden Ponds, Inc. Facility
Series 2011A-1 | |
| 11/15/13 | | | 6.250 | % | | | 837,195 | | | | 816,357 | | |
| Series 2011A-2 | |
| 11/15/46 | | | 5.500 | % | | | 41,404 | | | | 24,943 | | |
Massachusetts Development Finance Agency(d)
Revenue Bonds
Linden Ponds, Inc. Facility
Series 2011B | |
| 11/15/56 | | | 0.000 | % | | | 205,938 | | | | 993 | | |
Issue
Description | | Coupon
Rate | | Principal
Amount | | Value | |
| Municipal Bonds (continued) | |
| Massachusetts (cont.) | |
Massachusetts Educational Financing Authority(a)
Revenue Bonds
Issue I
Series 2010B AMT | |
| 01/01/31 | | | 5.700 | % | | $ | 8,220,000 | | | $ | 8,368,618 | | |
| Series 2008H (AGM) AMT | |
| 01/01/30 | | | 6.350 | % | | | 8,470,000 | | | | 9,013,012 | | |
Massachusetts Health & Educational Facilities Authority
Prerefunded 07/15/12 Revenue Bonds
Harvard University
Series 2002F | |
| 07/15/37 | | | 5.125 | % | | | 885,000 | | | | 911,904 | | |
Revenue Bonds
Berklee College of Music
Series 2007A | |
| 10/01/21 | | | 5.000 | % | | | 1,500,000 | | | | 1,625,595 | | |
Boston College
Series 2008M-2 | |
| 06/01/35 | | | 5.500 | % | | | 19,500,000 | | | | 23,296,065 | | |
Caregroup
Series 1998B-2 (NPFGC) | |
| 02/01/28 | | | 5.375 | % | | | 1,380,000 | | | | 1,414,445 | | |
| Series 2008E-1 | |
| 07/01/33 | | | 5.125 | % | | | 1,000,000 | | | | 1,004,670 | | |
Fisher College
Series 2007A | |
| 04/01/37 | | | 5.125 | % | | | 500,000 | | | | 434,585 | | |
Harvard University
Series 1991N | |
| 04/01/20 | | | 6.250 | % | | | 2,000,000 | | | | 2,666,820 | | |
Massachusetts Institute of Technology
Series 2002K | |
| 07/01/22 | | | 5.500 | % | | | 8,000,000 | | | | 10,414,880 | | |
| Series 2004M | |
| 07/01/25 | | | 5.250 | % | | | 500,000 | | | | 628,265 | | |
| Series 2009O | |
| 07/01/26 | | | 5.000 | % | | | 11,500,000 | | | | 12,908,865 | | |
Milford Regional Medical
Series 2007E | |
| 07/15/22 | | | 5.000 | % | | | 1,250,000 | | | | 1,252,237 | | |
| 07/15/32 | | | 5.000 | % | | | 4,720,000 | | | | 4,180,693 | | |
| 07/15/37 | | | 5.000 | % | | | 500,000 | | | | 429,135 | | |
Partners Healthcare
Series 2010J-1 | |
| 07/01/34 | | | 5.000 | % | | | 9,900,000 | | | | 10,189,080 | | |
Springfield College
Series 2010 | |
| 10/15/40 | | | 5.625 | % | | | 4,500,000 | | | | 4,371,525 | | |
Tufts University
Series 2009M | |
| 02/15/28 | | | 5.500 | % | | | 1,000,000 | | | | 1,213,780 | | |
Unrefunded Revenue Bonds
Harvard University
Series 2002 | |
| 07/15/37 | | | 5.125 | % | | | 3,915,000 | | | | 3,999,172 | | |
South Shore
Series 1999F | |
| 07/01/29 | | | 5.750 | % | | | 1,845,000 | | | | 1,845,443 | | |
The Accompanying Notes to Financial Statements are an integral part of this statement.
17
Columbia Tax-Exempt Fund
November 30, 2011
(Percentages represent value of investments compared to net assets)
Issue
Description | | Coupon
Rate | | Principal
Amount | | Value | |
| Municipal Bonds (continued) | |
| Massachusetts (cont.) | |
Massachusetts Housing Finance Agency
Revenue Bonds
Single Family
Series 2008-139 | |
| 12/01/28 | | | 5.125 | % | | $ | 1,000,000 | | | $ | 1,040,330 | | |
Massachusetts Housing Finance Agency(a)
Revenue Bonds
Rental Housing
Series 2004A (AGM) AMT | |
| 07/01/25 | | | 5.250 | % | | | 10,000,000 | | | | 10,053,900 | | |
| Series 1999A (AMBAC) AMT | |
| 07/01/30 | | | 5.500 | % | | | 190,000 | | | | 190,350 | | |
| Series 2007D AMT | |
| 06/01/40 | | | 4.850 | % | | | 750,000 | | | | 731,895 | | |
Single Family
Series 2006-122 AMT | |
| 12/01/31 | | | 4.850 | % | | | 5,140,000 | | | | 5,043,214 | | |
Massachusetts School Building Authority
Revenue Bonds
Series 2005A (AGM) | |
| 08/15/23 | | | 5.000 | % | | | 6,000,000 | | | | 6,686,760 | | |
Massachusetts State College Building Authority
Refunding Revenue Bonds
Senior Series 1994A | |
| 05/01/14 | | | 7.500 | % | | | 3,500,000 | | | | 3,799,355 | | |
Massachusetts State College Building Authority(e)
Revenue Bonds
Capital Appreciation
Senior Series 1999A Escrowed to Maturity (NPFGC) | |
| 05/01/19 | | | 0.000 | % | | | 7,710,000 | | | | 6,587,038 | | |
Massachusetts State Water Pollution Abatement
Revenue Bonds
MWRA Program
Subordinated Series 1999A | |
| 08/01/17 | | | 6.000 | % | | | 10,000,000 | | | | 12,431,200 | | |
Unrefunded Revenue Bonds
Pool Program
Series 2004-10 | |
| 08/01/34 | | | 5.000 | % | | | 145,000 | | | | 149,594 | | |
Massachusetts Water Resources Authority
Refunding Revenue Bonds
Series 2005A (NPFGC) | |
| 08/01/24 | | | 5.250 | % | | | 3,000,000 | | | | 3,365,160 | | |
Revenue Bonds
Series 1992A Escrowed to Maturity | |
| 07/15/19 | | | 6.500 | % | | | 3,500,000 | | | | 4,259,080 | | |
| Series 1992A Escrowed to Maturity (FGIC) | |
| 07/15/19 | | | 6.500 | % | | | 7,000,000 | | | | 8,518,160 | | |
| Series 2002J (AGM) | |
| 08/01/21 | | | 5.500 | % | | | 5,000,000 | | | | 6,291,950 | | |
| Series 2004D (NPFGC) | |
| 08/01/27 | | | 4.750 | % | | | 10,000,000 | | | | 10,212,000 | | |
| Series 2006A (AMBAC) | |
| 08/01/24 | | | 5.000 | % | | | 2,170,000 | | | | 2,440,946 | | |
Issue
Description | | Coupon
Rate | | Principal
Amount | | Value | |
| Municipal Bonds (continued) | |
| Massachusetts (cont.) | |
Town of Braintree
Limited General Obligation Bonds
Municipal Purpose Loan
Series 2009 | |
| 05/15/27 | | | 5.000 | % | | $ | 2,000,000 | | | $ | 2,244,200 | | |
| Total | | | 254,751,461 | | |
| Michigan 1.7% | |
Capital Region Airport Authority
Refunding Revenue Bonds
Series 2002B (NPFGC) AMT(a) | |
| 07/01/21 | | | 5.250 | % | | | 2,000,000 | | | | 2,014,500 | | |
City of Detroit Water Supply System
Revenue Bonds
Senior Lien
Series 2003A (NPFGC) | |
| 07/01/34 | | | 5.000 | % | | | 1,375,000 | | | | 1,347,582 | | |
| Series 2005A (NPFGC/FGIC) | |
| 07/01/27 | | | 5.000 | % | | | 1,290,000 | | | | 1,291,200 | | |
Detroit City School District
Unlimited General Obligation Refunding Bonds
School Building & Site Improvement
Series 2005A (AGM) (Qualified School Bond Loan Fund) | |
| 05/01/17 | | | 5.000 | % | | | 2,500,000 | | | | 2,676,500 | | |
| 05/01/30 | | | 5.250 | % | | | 10,000,000 | | | | 10,023,000 | | |
Goodrich Area School District
Unrefunded Unlimited General Obligation Bonds
Series 2003B (Qualified School Bond Loan Fund) | |
| 05/01/27 | | | 5.000 | % | | | 495,000 | | | | 504,316 | | |
Grand Traverse Academy
Refunding Revenue Bonds
Series 2007 | |
| 11/01/17 | | | 5.000 | % | | | 390,000 | | | | 376,428 | | |
| 11/01/22 | | | 5.000 | % | | | 750,000 | | | | 658,148 | | |
| 11/01/32 | | | 4.750 | % | | | 1,170,000 | | | | 852,439 | | |
Howell Public Schools
Unlimited General Obligation Bonds
School Building & Site
Series 2003 (Qualified School Bond Loan Fund) | |
| 05/01/29 | | | 5.000 | % | | | 3,855,000 | | | | 3,935,994 | | |
Kalamazoo Public Schools
Unlimited General Obligation Refunding Bonds
Building & Site
Series 2006 (AGM) | |
| 05/01/24 | | | 5.000 | % | | | 1,285,000 | | | | 1,387,119 | | |
Michigan Higher Education Facilities Authority
Prerefunded 12/01/17 Limited Obligation Revenue
Bonds
Kalamazoo College Project
Series 2007 | |
| 12/01/33 | | | 5.000 | % | | | 250,000 | | | | 254,930 | | |
Michigan Higher Education Student Loan Authority(a)
Revenue Bonds
Series 2006 XVII-Q (AMBAC) AMT | |
| 03/01/26 | | | 4.950 | % | | | 200,000 | | | | 195,782 | | |
| 03/01/31 | | | 5.000 | % | | | 5,850,000 | | | | 5,625,711 | | |
The Accompanying Notes to Financial Statements are an integral part of this statement.
18
Columbia Tax-Exempt Fund
November 30, 2011
(Percentages represent value of investments compared to net assets)
Issue
Description | | Coupon
Rate | | Principal
Amount | | Value | |
| Municipal Bonds (continued) | |
| Michigan (cont.) | |
Michigan Municipal Bond Authority
Revenue Bonds
Drinking Water State Revolving Fund
Series 2004 | |
| 10/01/22 | | | 5.000 | % | | $ | 3,850,000 | | | $ | 4,198,001 | | |
School District City of Detroit
Series 2005 (AGM) | |
| 06/01/19 | | | 5.000 | % | | | 3,500,000 | | | | 3,636,640 | | |
Michigan Strategic Fund
Refunding Revenue Bonds
Collateral Detroit Fund-Pollution
Series 1991BB (AMBAC) | |
| 05/01/21 | | | 7.000 | % | | | 2,505,000 | | | | 3,168,048 | | |
Michigan Sugar Co.-Caro Project
Series 1998B | |
| 11/01/25 | | | 6.450 | % | | | 3,500,000 | | | | 2,987,250 | | |
NSF International Project
Series 2004 | |
| 08/01/26 | | | 5.250 | % | | | 600,000 | | | | 603,282 | | |
Michigan Strategic Fund(a)
Revenue Bonds
Republic Services
Series 2001 AMT | |
| 04/01/14 | | | 4.250 | % | | | 1,885,000 | | | | 1,919,759 | | |
Michigan Strategic Fund(a)(d)
Refunding Revenue Bonds
Michigan Sugar Co.-Carollton
Series 1998C AMT | |
| 11/01/25 | | | 6.550 | % | | | 4,250,000 | | | | 3,703,747 | | |
Paw Paw Public Schools
Unlimited General Obligation Refunding Bonds
Series 1998 (NPFGC/FGIC) (Qualified School Board
Loan Fund) | |
| 05/01/25 | | | 5.000 | % | | | 1,020,000 | | | | 1,206,752 | | |
Roseville Community Schools
Unlimited General Obligation Refunding Bonds
School Building & Site
Series 2006 (AGM) (Qualified School Bond Loan Fund) | |
| 05/01/23 | | | 5.000 | % | | | 3,100,000 | | | | 3,292,293 | | |
St. Johns Public Schools
Unlimited General Obligation Refunding Bonds
Series 1998 (NPFGC/FGIC) (Qualified School Bond Loan
Fund) | |
| 05/01/25 | | | 5.100 | % | | | 1,790,000 | | | | 2,122,027 | | |
State of Michigan
Refunding Revenue Bonds
Series 2005 (AGM) | |
| 05/15/22 | | | 5.250 | % | | | 2,000,000 | | | | 2,416,740 | | |
| Series 2006 (AGM) | |
| 05/15/24 | | | 5.000 | % | | | 2,000,000 | | | | 2,150,860 | | |
State of Michigan(e)
Certificate of Participation
Series 2000 Escrowed to Maturity (AMBAC) | |
| 06/01/21 | | | 0.000 | % | | | 6,000,000 | | | | 4,641,420 | | |
Issue
Description | | Coupon
Rate | | Principal
Amount | | Value | |
| Municipal Bonds (continued) | |
| Michigan (cont.) | |
Troy School District
Unlimited General Obligation Bonds
School Building & Site
Series 2006 (NPFGC) (Qualified School Board Loan
Fund) | |
| 05/01/24 | | | 5.000 | % | | $ | 5,000,000 | | | $ | 5,294,000 | | |
Wayne County Airport Authority
Revenue Bonds
Detroit Metropolitan Airport
Series 2005 (NPFGC) AMT(a) | |
| 12/01/19 | | | 4.750 | % | | | 3,750,000 | | | | 3,886,200 | | |
Williamston Community School District
Unlimited General Obligation Bonds
Series 1996 (NPFGC) (Qualified School Bond Loan
Fund) | |
| 05/01/25 | | | 5.500 | % | | | 1,000,000 | | | | 1,190,500 | | |
| Total | | | 77,561,168 | | |
| Minnesota 3.4% | |
City of Minneapolis
Revenue Bonds
Fairview Health Services
Series 2008A | |
| 11/15/32 | | | 6.750 | % | | | 7,500,000 | | | | 8,304,900 | | |
City of Roseville
Revenue Bonds
Care Institute, Inc. Project
Series 1993(d) | |
| 11/01/23 | | | 7.750 | % | | | 3,275,000 | | | | 2,937,741 | | |
City of St. Louis Park
Refunding Revenue Bonds
Park Nicollet Health Services
Series 2009 | |
| 07/01/39 | | | 5.750 | % | | | 16,825,000 | | | | 17,102,949 | | |
Revenue Bonds
Park Nicollet Health Services
Series 2008C | |
| 07/01/23 | | | 5.500 | % | | | 22,775,000 | | | | 24,192,971 | | |
| 07/01/30 | | | 5.750 | % | | | 3,200,000 | | | | 3,296,928 | | |
County of Meeker
Revenue Bonds
Memorial Hospital Project
Series 2007 | |
| 11/01/37 | | | 5.750 | % | | | 1,750,000 | | | | 1,697,203 | | |
Hibbing Economic Development Authority
Revenue Bonds
Public Project-Hibbing Lease Obligation
Series 1997 | |
| 02/01/12 | | | 6.400 | % | | | 140,000 | | | | 140,197 | | |
Minneapolis & St Paul Housing & Redevelopment Authority
Revenue Bonds
Health Partners Obligation Group Project
Series 2003 | |
| 12/01/17 | | | 6.000 | % | | | 1,650,000 | | | | 1,764,230 | | |
Perham Hospital District
Revenue Bonds
Perham Memorial Hospital & Home
Series 2010 | |
| 03/01/35 | | | 6.350 | % | | | 4,000,000 | | | | 4,214,560 | | |
| 03/01/40 | | | 6.500 | % | | | 2,800,000 | | | | 2,960,636 | | |
The Accompanying Notes to Financial Statements are an integral part of this statement.
19
Columbia Tax-Exempt Fund
November 30, 2011
(Percentages represent value of investments compared to net assets)
Issue
Description | | Coupon
Rate | | Principal
Amount | | Value | |
| Municipal Bonds (continued) | |
| Minnesota (cont.) | |
Southern Minnesota Municipal Power Agency(e)
Revenue Bonds
Capital Appreciation
Series 1994A (NPFGC) | |
| 01/01/22 | | | 0.000 | % | | $ | 27,500,000 | | | $ | 18,793,775 | | |
| 01/01/23 | | | 0.000 | % | | | 26,500,000 | | | | 17,045,860 | | |
| 01/01/25 | | | 0.000 | % | | | 17,500,000 | | | | 9,875,775 | | |
St. Paul Housing & Redevelopment Authority
Revenue Bonds
HealthPartners Obligation Group Project
Series 2006 | |
| 05/15/36 | | | 5.250 | % | | | 4,550,000 | | | | 4,445,759 | | |
Healtheast Project
Series 2005 | |
| 11/15/25 | | | 6.000 | % | | | 3,500,000 | | | | 3,524,325 | | |
| 11/15/30 | | | 6.000 | % | | | 10,000,000 | | | | 10,017,100 | | |
| 11/15/35 | | | 6.000 | % | | | 11,500,000 | | | | 11,284,835 | | |
St. Paul Port Authority
Revenue Bonds
Office Building at Cedar Street
Series 2003-12 | |
| 12/01/23 | | | 5.000 | % | | | 2,540,000 | | | | 2,710,078 | | |
Tobacco Securitization Authority
Refunding Revenue Bonds
Tobacco Settlement
Series 2011B | |
| 03/01/31 | | | 5.250 | % | | | 5,600,000 | | | | 5,657,064 | | |
University of Minnesota
Series 1996A Escrowed to Maturity
Revenue Bonds | |
| 07/01/21 | | | 5.500 | % | | | 1,000,000 | | | | 1,188,100 | | |
Western Minnesota Municipal Power Agency
Revenue Bonds
Series 1983 Escrowed to Maturity (NPFGC) | |
| 01/01/16 | | | 9.750 | % | | | 1,000,000 | | | | 1,296,590 | | |
| Total | | | 152,451,576 | | |
| Mississippi 0.5% | |
County of Lowndes
Refunding Revenue Bonds
Weyerhaeuser Co. Project
Series 1992A | |
| 04/01/22 | | | 6.800 | % | | | 2,470,000 | | | | 2,623,832 | | |
Harrison County Wastewater Management District
Refunding Revenue Bonds
Wastewater Treatment Facility
Series 1986 Escrowed to Maturity | |
| 02/01/15 | | | 5.000 | % | | | 4,250,000 | | | | 4,697,482 | | |
Medical Center Educational Building Corp.
Refunding Revenue Bonds
University of Mississippi Medical Center
Series 1998B (AMBAC) | |
| 12/01/23 | | | 5.500 | % | | | 5,300,000 | | | | 6,074,171 | | |
Mississippi Business Finance Corp.
Revenue Bonds
Series 2009A | |
| 05/01/24 | | | 4.700 | % | | | 6,640,000 | | | | 6,839,333 | | |
Issue
Description | | Coupon
Rate | | Principal
Amount | | Value | |
| Municipal Bonds (continued) | |
| Mississippi (cont.) | |
Rankin County Five Lakes Utility District
Series 1994(d) | |
| 07/15/37 | | | 7.000 | % | | $ | 465,000 | | | $ | 413,696 | | |
| Total | | | 20,648,514 | | |
| Missouri 1.2% | |
City of Manchester
Refunding Tax Allocation Bonds
Highway 141/Manchester Road Project
Series 2010 | |
| 11/01/25 | | | 6.000 | % | | | 3,000,000 | | | | 3,060,960 | | |
| 11/01/39 | | | 6.875 | % | | | 1,500,000 | | | | 1,535,220 | | |
City of St Louis Airport
Refunding Revenue Bonds
Lambert International Airport
Series 2007A (AGM) | |
| 07/01/23 | | | 5.000 | % | | | 1,000,000 | | | | 1,048,050 | | |
County of Boone
Revenue Bonds
Boone Hospital Center
Series 2008 | |
| 08/01/28 | | | 5.750 | % | | | 500,000 | | | | 520,720 | | |
Kansas City Metropolitan Community Colleges Building
Corp.
Refunding Revenue Bonds
Junior College Improvement and Leasehold
Series 2006 (NPFGC/FGIC) | |
| 07/01/17 | | | 5.000 | % | | | 1,000,000 | | | | 1,137,170 | | |
Kirkwood Industrial Development Authority
Revenue Bonds
Aberdeen Heights
Series 2010A | |
| 05/15/39 | | | 8.250 | % | | | 12,000,000 | | | | 12,456,840 | | |
Metropolitan St. Louis Sewer District
Revenue Bonds
Series 2004A (NPFGC) | |
| 05/01/24 | | | 5.000 | % | | | 2,800,000 | | | | 3,011,148 | | |
Missouri Development Finance Board
Revenue Bonds
Procter & Gamble Paper Products
Series 1999 AMT(a) | |
| 03/15/29 | | | 5.200 | % | | | 6,385,000 | | | | 7,014,816 | | |
Missouri Joint Municipal Electric Utility Commission
Revenue Bonds
Plum Point Project
Series 2006 (NPFGC) | |
| 01/01/20 | | | 5.000 | % | | | 1,500,000 | | | | 1,585,515 | | |
Missouri State Health & Educational Facilities Authority
Refunding Revenue Bonds
Lester E. Cox Medical Center
Series 1993I (NPFGC) | |
| 06/01/15 | | | 5.250 | % | | | 2,085,000 | | | | 2,163,062 | | |
Revenue Bonds
Lutheran Senior Services
Series 2011 | |
| 02/01/31 | | | 5.750 | % | | | 1,730,000 | | | | 1,727,855 | | |
| 02/01/41 | | | 6.000 | % | | | 2,600,000 | | | | 2,605,200 | | |
Senior Living Facilities-Lutheran
Series 2010 | |
| 02/01/42 | | | 5.500 | % | | | 2,000,000 | | | | 1,869,060 | | |
The Accompanying Notes to Financial Statements are an integral part of this statement.
20
Columbia Tax-Exempt Fund
November 30, 2011
(Percentages represent value of investments compared to net assets)
Issue
Description | | Coupon
Rate | | Principal
Amount | | Value | |
| Municipal Bonds (continued) | |
| Missouri (cont.) | |
St. Louis Area Housing Finance Corp.
Wellington Arms III Project
Series 1979 | |
| 01/01/21 | | | 7.375 | % | | $ | 1,221,784 | | | $ | 1,227,026 | | |
St. Louis County Industrial Development Authority
Revenue Bonds
St. Andrews Residence for Seniors
Series 2007A | |
| 12/01/41 | | | 6.375 | % | | | 7,000,000 | | | | 6,551,160 | | |
St. Louis Industrial Development Authority
Refunding Revenue Bonds
Anheuser-Busch Co. Project
Series 1991 | |
| 05/01/16 | | | 6.650 | % | | | 2,650,000 | | | | 3,098,301 | | |
St. Louis Industrial Development Authority(e)
Revenue Bonds
Convention Center Hotel
Series 2000 (AMBAC) | |
| 07/15/18 | | | 0.000 | % | | | 2,000,000 | | | | 1,336,400 | | |
University of Missouri
Revenue Bonds
System Facilities
Series 2006A | |
| 11/01/26 | | | 5.000 | % | | | 1,000,000 | | | | 1,097,320 | | |
| Total | | | 53,045,823 | | |
| Nebraska 0.5% | |
Douglas County Hospital Authority No. 2
Revenue Bonds
Health Facilities-Immanuel Obligation Group
Series 2010 | |
| 01/01/40 | | | 5.625 | % | | | 875,000 | | | | 900,410 | | |
Madison County Hospital Authority No. 1
Revenue Bonds
Faith Regional Health Services Project
Series 2008A-1 | |
| 07/01/33 | | | 6.000 | % | | | 11,500,000 | | | | 12,605,495 | | |
Nebraska Elementary & Secondary School Finance Authority
Revenue Bonds
Boys Town Project
Series 2008 | |
| 09/01/28 | | | 4.750 | % | | | 6,800,000 | | | | 7,082,472 | | |
Omaha Public Power District
Revenue Bonds
Series 1986A Escrowed to Maturity | |
| 02/01/15 | | | 6.000 | % | | | 1,370,000 | | | | 1,516,522 | | |
| Series 1992B Escrowed to Maturity | |
| 02/01/17 | | | 6.200 | % | | | 1,600,000 | | | | 1,847,344 | | |
| Total | | | 23,952,243 | | |
| Nevada 1.4% | |
City of Henderson
Special Assessment Bonds
Series 2006T-18 | |
| 09/01/35 | | | 5.300 | % | | | 10,675,000 | | | | 5,587,402 | | |
City of Sparks
Senior Sales Tax Anticipation Revenue Bonds
Series 2008A(b) | |
| 06/15/28 | | | 6.750 | % | | | 2,000,000 | | | | 1,675,120 | | |
Issue
Description | | Coupon
Rate | | Principal
Amount | | Value | |
| Municipal Bonds (continued) | |
| Nevada (cont.) | |
Clark County Water Reclamation District
Limited General Obligation Bonds
Series 2009A | |
| 07/01/34 | | | 5.250 | % | | $ | 12,000,000 | | | $ | 12,706,920 | | |
County of Clark
Revenue Bonds
Las Vegas-McCarran International Airport
Series 2010A | |
| 07/01/34 | | | 5.125 | % | | | 18,750,000 | | | | 19,128,375 | | |
County of Clark(a)
Revenue Bonds
Southwest Gas Corp. Project
Series 2005A (AMBAC) AMT | |
| 10/01/35 | | | 4.850 | % | | | 5,000,000 | | | | 4,516,200 | | |
Director of the State of Nevada Department of Business & Industry(a)(b)
Revenue Bonds
Republic Services, Inc.
Series 2003 AMT | |
| 12/01/26 | | | 5.625 | % | | | 2,000,000 | | | | 2,217,980 | | |
Director of the State of Nevada Department of Business & Industry(g)
Revenue Bonds
Las Vegas Monorail Project 2nd Tier
Series 2000 | |
| 01/01/30 | | | 7.375 | % | | | 1,650,000 | | | | 2,310 | | |
Director of the State of Nevada Department of Business & Industry(g)(h)
Revenue Bonds
Las Vegas Monorail Project 2nd Tier
Series 2000 | |
| 01/01/40 | | | 7.375 | % | | | 3,750,000 | | | | 5,250 | | |
Las Vegas Valley Water District
Limited General Obligation Bonds
Water Improvement
Series 2006A (AGM) | |
| 06/01/24 | | | 5.000 | % | | | 4,095,000 | | | | 4,338,529 | | |
Truckee Meadows Water Authority
Refunding Revenue Bonds
Series 2006 (AGM) | |
| 07/01/32 | | | 4.750 | % | | | 13,050,000 | | | | 13,097,502 | | |
| Total | | | 63,275,588 | | |
| New Hampshire 0.3% | |
New Hampshire Business Finance Authority
Revenue Bonds
Public Service Co. of New Hampshire Project
Series 2006B (NPFGC) AMT(a) | |
| 05/01/21 | | | 4.750 | % | | | 4,500,000 | | | | 4,581,630 | | |
New Hampshire Health & Education Facilities Authority
Revenue Bonds
Dartmouth-Hitchcock
Series 2009 | |
| 08/01/38 | | | 6.000 | % | | | 8,000,000 | | | | 8,657,280 | | |
| Total | | | 13,238,910 | | |
| New Jersey 3.8% | |
Middlesex County Improvement Authority(d)(g)
Revenue Bonds
Heldrich Center Hotel
Series 2005C | |
| 01/01/37 | | | 8.750 | % | | | 1,500,000 | | | | 150,330 | | |
The Accompanying Notes to Financial Statements are an integral part of this statement.
21
Columbia Tax-Exempt Fund
November 30, 2011
(Percentages represent value of investments compared to net assets)
Issue
Description | | Coupon
Rate | | Principal
Amount | | Value | |
| Municipal Bonds (continued) | |
| New Jersey (cont.) | |
Middlesex County Improvement Authority(g)
Subordinated Revenue Bonds
Heldrich Center Hotel
Series 2005B | |
| 01/01/37 | | | 6.250 | % | | $ | 4,000,000 | | | $ | 358,000 | | |
New Jersey Economic Development Authority
Refunding Revenue Bonds
School Facilities Construction
Series 2005N-1 (AGM) | |
| 09/01/25 | | | 5.500 | % | | | 23,990,000 | | | | 27,656,392 | | |
| Series 2005N-1 (NPFGC/FGIC) | |
| 09/01/27 | | | 5.500 | % | | | 5,000,000 | | | | 5,705,850 | | |
Seeing Eye, Inc. Project
Series 2005 (AMBAC) | |
| 12/01/24 | | | 5.000 | % | | | 1,000,000 | | | | 1,016,980 | | |
Revenue Bonds
MSU Student Housing Project-Provident
Series 2010 | |
| 06/01/31 | | | 5.750 | % | | | 4,350,000 | | | | 4,461,664 | | |
MSU Student Housing Project-Provident
Series 2010 | |
| 06/01/42 | | | 5.875 | % | | | 13,000,000 | | | | 13,239,200 | | |
New Jersey Economic Development Authority(a)
Refunding Revenue Bonds
Series 2006B AMT | |
| 01/01/37 | | | 6.875 | % | | | 7,000,000 | | | | 6,365,660 | | |
Revenue Bonds
Continental Airlines, Inc. Project
Series 1999 AMT | |
| 09/15/19 | | | 6.250 | % | | | 1,300,000 | | | | 1,271,231 | | |
| 09/15/23 | | | 6.400 | % | | | 4,000,000 | | | | 3,956,880 | | |
| 09/15/29 | | | 6.250 | % | | | 2,000,000 | | | | 1,885,240 | | |
New Jersey-American Water Co., Inc.
Series 1997B (NPFGC/FGIC) AMT | |
| 05/01/32 | | | 5.375 | % | | | 8,000,000 | | | | 8,014,560 | | |
United Water, Inc.
Series 1996C (AMBAC) AMT | |
| 11/01/25 | | | 4.875 | % | | | 7,000,000 | | | | 7,216,370 | | |
New Jersey Educational Facilities Authority
Refunding Revenue Bonds
Stevens Institute of Technology
Series 2007A | |
| 07/01/22 | | | 5.250 | % | | | 1,250,000 | | | | 1,330,700 | | |
Revenue Bonds
Princeton University
Series 2007E | |
| 07/01/28 | | | 5.000 | % | | | 1,250,000 | | | | 1,365,563 | | |
William Paterson University
Series 2008C | |
| 07/01/24 | | | 5.000 | % | | | 1,000,000 | | | | 1,086,910 | | |
New Jersey Environmental Infrastructure Trust
Prerefunded 09/01/16 Revenue Bonds
Environmental
Series 2007A | |
| 09/01/22 | | | 5.000 | % | | | 10,000 | | | | 11,753 | | |
Unrefunded Revenue Bonds
Environmental
Series 2007A | |
| 09/01/22 | | | 5.000 | % | | | 1,220,000 | | | | 1,392,984 | | |
Issue
Description | | Coupon
Rate | | Principal
Amount | | Value | |
| Municipal Bonds (continued) | |
| New Jersey (cont.) | |
New Jersey Health Care Facilities Financing Authority
Revenue Bonds
Meridian Health Systems Obligation Group
Series 1999 (AGM) | |
| 07/01/24 | | | 5.375 | % | | $ | 2,255,000 | | | $ | 2,257,638 | | |
St. Josephs Healthcare Systems
Series 2008 | |
| 07/01/38 | | | 6.625 | % | | | 4,000,000 | | | | 4,007,080 | | |
Virtua Health
Series 2009 | |
| 07/01/33 | | | 5.750 | % | | | 750,000 | | | | 791,895 | | |
Unrefunded Revenue Bonds
Atlantic City Medical
Series 2002 | |
| 07/01/25 | | | 5.750 | % | | | 1,110,000 | | | | 1,121,322 | | |
New Jersey Housing & Mortgage Finance Agency
Revenue Bonds
Series 2000E-1 (AGM) | |
| 05/01/25 | | | 5.750 | % | | | 200,000 | | | | 200,210 | | |
New Jersey Housing & Mortgage Finance Agency(a)
Revenue Bonds
Series 2000A-1 (AGM) AMT | |
| 11/01/31 | | | 6.350 | % | | | 1,500,000 | | | | 1,501,620 | | |
New Jersey State Turnpike Authority
Refunding Revenue Bonds
Series 2005A (AGM) | |
| 01/01/30 | | | 5.250 | % | | | 2,000,000 | | | | 2,311,160 | | |
Revenue Bonds
Series 1991C (NPFGC) Escrowed to Maturity | |
| 01/01/16 | | | 6.500 | % | | | 11,000,000 | | | | 12,154,780 | | |
| Series 2004C-2 (AMBAC) | |
| 01/01/25 | | | 5.500 | % | | | 2,500,000 | | | | 2,960,525 | | |
Unrefunded Revenue Bonds
Series 1991C (AGM) | |
| 01/01/16 | | | 6.500 | % | | | 1,415,000 | | | | 1,686,935 | | |
New Jersey Transportation Trust Fund Authority
Revenue Bonds
Series 1999A | |
| 06/15/18 | | | 5.750 | % | | | 5,000,000 | | | | 5,912,400 | | |
| 06/15/20 | | | 5.750 | % | | | 4,150,000 | | | | 4,874,590 | | |
| Series 2006A | |
| 12/15/23 | | | 5.500 | % | | | 3,000,000 | | | | 3,503,010 | | |
| Series 2011B | |
| 06/15/31 | | | 5.500 | % | | | 7,250,000 | | | | 7,854,070 | | |
Tobacco Settlement Financing Corp.
Prerefunded 06/01/12 Asset-Backed Revenue Bonds
Series 2002 | |
| 06/01/37 | | | 6.000 | % | | | 12,770,000 | | | | 13,138,414 | | |
Revenue Bonds
Series 2007-1A | |
| 06/01/26 | | | 4.625 | % | | | 5,055,000 | | | | 4,055,172 | | |
Union County Utilities Authority
Refunding Revenue Bonds
Covanta Union
Series 2011 AMT(a) | |
| 12/01/31 | | | 5.250 | % | | | 15,000,000 | | | | 15,411,150 | | |
The Accompanying Notes to Financial Statements are an integral part of this statement.
22
Columbia Tax-Exempt Fund
November 30, 2011
(Percentages represent value of investments compared to net assets)
Issue
Description | | Coupon
Rate | | Principal
Amount | | Value | |
| Municipal Bonds (continued) | |
| New Jersey (cont.) | |
University of Medicine & Dentistry of New Jersey
Revenue Bonds
Series 2002A (AMBAC) | |
| 12/01/12 | | | 5.250 | % | | $ | 1,705,000 | | | $ | 1,764,198 | | |
| Total | | | 171,992,436 | | |
| New Mexico 0.4% | |
New Mexico Hospital Equipment Loan Council
Revenue Bonds
Presbyterian Healthcare
Series 2009 | |
| 08/01/39 | | | 5.000 | % | | | 6,500,000 | | | | 6,619,730 | | |
Presbyterian Healthcare Services
Series 2008A | |
| 08/01/32 | | | 6.375 | % | | | 8,650,000 | | | | 9,654,006 | | |
| Total | | | 16,273,736 | | |
| New York 9.1% | |
Albany Industrial Development Agency
Revenue Bonds
St. Peters Hospital Project
Series 2008A | |
| 11/15/27 | | | 5.250 | % | | | 3,830,000 | | | | 3,785,074 | | |
Brooklyn Arena Local Development Corp.
Revenue Bonds
Barclays Center Project
Series 2009 | |
| 07/15/30 | | | 6.000 | % | | | 6,500,000 | | | | 6,733,870 | | |
City of New York
Prerefunded 06/01/13 Unlimited General Obligation Bonds
Series 2003J | |
| 06/01/28 | | | 5.250 | % | | | 6,235,000 | | | | 6,690,841 | | |
Unlimited General Obligation Bonds
Series 2002E (NPFGC) | |
| 08/01/15 | | | 5.625 | % | | | 2,000,000 | | | | 2,064,640 | | |
| Series 2005M | |
| 04/01/22 | | | 5.000 | % | | | 2,000,000 | | | | 2,201,020 | | |
Housing Development Corp.
Revenue Bonds
Capital Funding Program-New York City Housing Authority Program
Series 2005A (NPFGC/FGIC) | |
| 07/01/25 | | | 5.000 | % | | | 300,000 | | | | 314,724 | | |
| Series 2005F-1 | |
| 11/01/25 | | | 4.650 | % | | | 5,000,000 | | | | 5,115,950 | | |
Hudson Yards Infrastructure Corp.
Revenue Bonds
Series 2011A | |
| 10/26/2011 | |
| 02/15/47 | | | 5.750 | % | | | 15,500,000 | | | | 16,395,125 | | |
Long Island Power Authority
Revenue Bonds
Series 2008A | |
| 05/01/33 | | | 6.000 | % | | | 2,725,000 | | | | 3,056,932 | | |
Metropolitan Transportation Authority
Refunding Revenue Bonds
Series 2002A | |
| 11/15/32 | | | 5.750 | % | | | 5,855,000 | | | | 6,063,145 | | |
Revenue Bonds
Series 2002A (AGM) | |
| 11/15/26 | | | 5.500 | % | | | 2,000,000 | | | | 2,070,860 | | |
Issue
Description | | Coupon
Rate | | Principal
Amount | | Value | |
| Municipal Bonds (continued) | |
| New York (cont.) | |
| Series 2007A (AGM) | |
| 11/15/33 | | | 5.000 | % | | $ | 12,000,000 | | | $ | 12,418,080 | | |
| Series 2007B | |
| 11/15/24 | | | 5.000 | % | | | 6,820,000 | | | | 7,329,318 | | |
| Series 2009B | |
| 11/15/34 | | | 5.000 | % | | | 1,000,000 | | | | 1,050,860 | | |
New York City Industrial Development Agency
Revenue Bonds
Pilot-Yankee Stadium-Payment
Series 2006I (FGIC) | |
| 03/01/46 | | | 5.000 | % | | | 2,000,000 | | | | 1,893,440 | | |
Queens Baseball Stadium Pilot
Series 2006 (AMBAC) | |
| 01/01/24 | | | 5.000 | % | | | 3,000,000 | | | | 2,994,480 | | |
New York City Industrial Development Agency(a)(g)
Revenue Bonds
American Airlines-JFK International Airport
Series 2005 AMT | |
| 08/01/25 | | | 7.625 | % | | | 1,000,000 | | | | 859,980 | | |
Terminal One Group Association Project
Series 2005 AMT | | | | | | | | | | | | | |
| 01/01/21 | | | 5.500 | % | | | 6,940,000 | | | | 7,299,214 | | |
| 01/01/24 | | | 5.500 | % | | | 5,500,000 | | | | 5,680,180 | | |
New York City Municipal Water Finance Authority
Revenue Bonds
Series 2005C (NPFGC) | |
| 06/15/27 | | | 5.000 | % | | | 8,000,000 | | | | 8,725,680 | | |
New York City Transitional Finance Authority Building Aid
Revenue Bonds
Fiscal 2009
Series 2009S-4 | |
| 01/15/25 | | | 5.125 | % | | | 2,000,000 | | | | 2,220,480 | | |
New York City Transitional Finance Authority
Prerefunded 02/01/13 Revenue Bonds
Future Tax Secured
Series 2003 | |
| 02/01/31 | | | 5.000 | % | | | 105,000 | | | | 110,731 | | |
Unrefunded Revenue Bonds
Future Tax Secured
Series 2003 | |
| 02/01/31 | | | 5.000 | % | | | 3,895,000 | | | | 4,012,629 | | |
New York Local Government Assistance Corp.
Refunding Revenue Bonds
Series 1993E (AMBAC/TCRS) | |
| 04/01/16 | | | 5.250 | % | | | 10,000,000 | | | | 11,510,200 | | |
| Series 1993E (NPFGC) | |
| 04/01/21 | | | 5.000 | % | | | 3,655,000 | | | | 4,366,592 | | |
New York Mortgage Agency(a)
Revenue Bonds
Series 2002-101 AMT | |
| 04/01/32 | | | 5.400 | % | | | 11,800,000 | | | | 11,802,832 | | |
| Series 2007-140 AMT | |
| 10/01/21 | | | 4.600 | % | | | 3,625,000 | | | | 3,690,250 | | |
New York State Dormitory Authority
Refunding Revenue Bonds
Education
Series 2005B (AMBAC) | |
| 03/15/27 | | | 5.500 | % | | | 11,240,000 | | | | 14,029,768 | | |
| 03/15/29 | | | 5.500 | % | | | 2,030,000 | | | | 2,531,552 | | |
| 03/15/30 | | | 5.500 | % | | | 6,040,000 | | | | 7,537,920 | | |
The Accompanying Notes to Financial Statements are an integral part of this statement.
23
Columbia Tax-Exempt Fund
November 30, 2011
(Percentages represent value of investments compared to net assets)
Issue
Description | | Coupon
Rate | | Principal
Amount | | Value | |
| Municipal Bonds (continued) | |
| New York (cont.) | |
Revenue Bonds
Consolidated City University System
2nd General Series 1993A | |
| 07/01/18 | | | 5.750 | % | | $ | 5,500,000 | | | $ | 6,341,885 | | |
Consolidated City University Systems 2nd Generation
Series 1993A | |
| 07/01/20 | | | 6.000 | % | | | 13,350,000 | | | | 15,976,079 | | |
Consolidated University 2nd Generation
Series 1993A (AGM) | |
| 07/01/20 | | | 6.000 | % | | | 6,140,000 | | | | 7,372,052 | | |
Education
Series 2005F | |
| 03/15/23 | | | 5.000 | % | | | 4,935,000 | | | | 5,449,375 | | |
Independent School District-Educational Housing Services
Series 2005 (AMBAC) | |
| 07/01/30 | | | 5.250 | % | | | 3,000,000 | | | | 3,093,630 | | |
Mount Sinai School of Medicine
Series 2009 | |
| 07/01/39 | | | 5.125 | % | | | 15,000,000 | | | | 15,239,550 | | |
New York University
Series 2008A | |
| 07/01/29 | | | 5.000 | % | | | 3,845,000 | | | | 4,105,729 | | |
New York University Hospital Center
Series 2007B | |
| 07/01/24 | | | 5.250 | % | | | 420,000 | | | | 436,544 | | |
North Shore Long Island Jewish
Series 2009A | |
| 05/01/37 | | | 5.500 | % | | | 6,250,000 | | | | 6,433,625 | | |
Orange Regional Medical Center
Series 2008 | |
| 12/01/29 | | | 6.125 | % | | | 2,250,000 | | | | 2,251,508 | | |
State University
Series 1993A (FGIC) | |
| 05/15/17 | | | 5.875 | % | | | 28,240,000 | | | | 32,846,509 | | |
State University Educational Facilities
Series 1993A | |
| 05/15/13 | | | 5.500 | % | | | 24,530,000 | | | | 25,420,439 | | |
Upstate Community-State Supported
Series 2005B (NPFGC/FGIC) | |
| 07/01/23 | | | 5.500 | % | | | 2,000,000 | | | | 2,432,600 | | |
New York State Energy Research & Development Authority
Revenue Bonds
Series 1993(h) | |
| 04/01/20 | | | 11.210 | % | | | 13,000,000 | | | | 13,113,620 | | |
New York State Environmental Facilities Corp.
Revenue Bonds
Revolving Funds New York City Municipal Water
Series 2008A | |
| 06/15/28 | | | 5.000 | % | | | 1,000,000 | | | | 1,084,030 | | |
Revolving Funds New York City Municipal Water Project
Series 2002B | |
| 06/15/31 | | | 5.000 | % | | | 9,000,000 | | | | 9,071,190 | | |
| Series 2002K | |
| 06/15/28 | | | 5.000 | % | | | 9,000,000 | | | | 9,176,760 | | |
New York State Housing Finance Agency
Refunding Revenue Bonds
State University Construction
Series 1986A Escrowed to Maturity | |
| 05/01/13 | | | 6.500 | % | | | 2,670,000 | | | | 2,806,731 | | |
Issue
Description | | Coupon
Rate | | Principal
Amount | | Value | |
| Municipal Bonds (continued) | |
| New York (cont.) | |
New York State Thruway Authority
Revenue Bonds
Series 2005G (AGM) | |
| 01/01/24 | | | 5.000 | % | | $ | 4,000,000 | | | $ | 4,285,440 | | |
Port Authority of New York & New Jersey
Revenue Bonds
Consolidated 144th
Series 2006 | |
| 10/01/28 | | | 5.000 | % | | | 1,000,000 | | | | 1,070,770 | | |
JFK International Air Terminal
Series 2010 | |
| 12/01/36 | | | 6.000 | % | | | 7,000,000 | | | | 7,302,960 | | |
Port Authority of New York & New Jersey(a)
Revenue Bonds
5th Installment-Special Project
Series 1996-4 AMT | |
| 10/01/19 | | | 6.750 | % | | | 7,000,000 | | | | 6,503,280 | | |
Consolidated 146th
Series 2006 (AGM) AMT | |
| 12/01/23 | | | 4.500 | % | | | 7,500,000 | | | | 7,718,175 | | |
JFK International Air Terminal 4 Special Project
Series 1997 (NPFGC) AMT | |
| 12/01/22 | | | 5.750 | % | | | 6,500,000 | | | | 6,430,710 | | |
Suffolk County Industrial Development Agency
Revenue Bonds
Gurwin Jewish-Phase II
Series 2004 | |
| 05/01/39 | | | 6.700 | % | | | 870,000 | | | | 869,069 | | |
Suffolk County Industrial Development Agency(a)
Revenue Bonds
Nissequogue Cogen Partners Facility
Series 1998 AMT | |
| 01/01/23 | | | 5.500 | % | | | 7,800,000 | | | | 7,552,584 | | |
Tobacco Settlement Financing Corp.
Asset-Backed Revenue Bonds
Series 2003A-1 | |
| 06/01/19 | | | 5.500 | % | | | 5,000,000 | | | | 5,314,600 | | |
Triborough Bridge & Tunnel Authority
Refunding Revenue Bonds
Series 2002 (NFPGC) | |
| 11/15/20 | | | 5.500 | % | | | 6,800,000 | | | | 8,284,848 | | |
Revenue Bonds
General Purpose
Series 1992Y Escrowed to Maturity | |
| 01/01/21 | | | 6.125 | % | | | 7,000,000 | | | | 9,163,840 | | |
| 01/01/21 | | | 6.125 | % | | | 11,000,000 | | | | 14,400,320 | | |
Ulster County Industrial Development Agency
Revenue Bonds
Series 2007A | |
| 09/15/37 | | | 6.000 | % | | | 2,000,000 | | | | 1,391,420 | | |
| 09/15/42 | | | 6.000 | % | | | 7,000,000 | | | | 4,742,360 | | |
| Total | | | 412,238,599 | | |
| North Carolina 1.3% | |
City of Charlotte
Revenue Bonds
Water & Sewer
Series 2008 | |
| 07/01/26 | | | 5.000 | % | | | 8,450,000 | | | | 9,436,960 | | |
The Accompanying Notes to Financial Statements are an integral part of this statement.
24
Columbia Tax-Exempt Fund
November 30, 2011
(Percentages represent value of investments compared to net assets)
Issue
Description | | Coupon
Rate | | Principal
Amount | | Value | |
| Municipal Bonds (continued) | |
| North Carolina (cont.) | |
City of High Point
Revenue Bonds
Series 2008 (AGM) | |
| 11/01/28 | | | 5.000 | % | | $ | 350,000 | | | $ | 375,995 | | |
Durham Housing Authority
Revenue Bonds
Series 2005 AMT(a)(b)(d) | |
| 02/01/38 | | | 5.650 | % | | | 3,208,912 | | | | 2,851,985 | | |
North Carolina Eastern Municipal Power Agency
Prerefunded 01/01/22 Revenue Bonds
Series 1987A | |
| 01/01/24 | | | 4.500 | % | | | 1,750,000 | | | | 2,108,767 | | |
| Series 1988A | |
| 01/01/26 | | | 6.000 | % | | | 1,940,000 | | | | 2,488,069 | | |
Refunding Revenue Bonds
Series 1991A Escrowed to Maturity | |
| 01/01/21 | | | 5.000 | % | | | 8,735,000 | | | | 10,763,442 | | |
Revenue Bonds
Series 1986A Escrowed to Maturity | |
| 01/01/17 | | | 5.000 | % | | | 3,870,000 | | | | 4,555,764 | | |
| Series 2009A | |
| 01/01/26 | | | 5.500 | % | | | 300,000 | | | | 331,215 | | |
| Series 2009B | |
| 01/01/26 | | | 5.000 | % | | | 7,000,000 | | | | 7,450,170 | | |
Unrefunded Revenue Bonds
Series 1991A | |
| 01/01/18 | | | 6.500 | % | | | 2,185,000 | | | | 2,671,403 | | |
North Carolina Housing Finance Agency(a)
Revenue Bonds
Homeownership
Series 2000A-8 AMT | |
| 07/01/28 | | | 6.400 | % | | | 45,000 | | | | 45,293 | | |
| Series 2006A-26 AMT | |
| 01/01/38 | | | 5.500 | % | | | 1,645,000 | | | | 1,697,344 | | |
North Carolina Medical Care Commission
Refunding Revenue Bonds
1st Mortgage-Givens Estates
Series 2007 | |
| 07/01/33 | | | 5.000 | % | | | 5,000,000 | | | | 4,728,350 | | |
Revenue Bonds
1st Mortgage Deerfield
Series 2008A | |
| 11/01/33 | | | 6.000 | % | | | 4,060,000 | | | | 4,135,597 | | |
1st Mortgage-Presbyterian Homes
Series 2006 | |
| 10/01/31 | | | 5.500 | % | | | 2,500,000 | | | | 2,350,425 | | |
Health Care Housing Arc Projects
Series 2004A | |
| 10/01/34 | | | 5.800 | % | | | 1,400,000 | | | | 1,403,682 | | |
North Carolina Medical Care Commission(e)
Refunding Revenue Bonds
Capital Appreciation-Wilson Memorial Hospital
Series 1997 (AMBAC) | |
| 11/01/14 | | | 0.000 | % | | | 1,380,000 | | | | 1,264,011 | | |
State of North Carolina
Revenue Bonds
Annual Appropriation
Series 2009A | |
| 05/01/27 | | | 5.000 | % | | | 305,000 | | | | 336,546 | | |
| Total | | | 58,995,018 | | |
Issue
Description | | Coupon
Rate | | Principal
Amount | | Value | |
| Municipal Bonds (continued) | |
| North Dakota 0.3% | |
County of McLean
Revenue Bonds
Great River Energy
Series 2010B | |
| 07/01/40 | | | 5.150 | % | | $ | 7,900,000 | | | $ | 8,137,237 | | |
County of Ward
Revenue Bonds
Trinity Obligated Group
Series 2006 | |
| 07/01/29 | | | 5.125 | % | | | 4,490,000 | | | | 4,229,176 | | |
| Total | | | 12,366,413 | | |
| Ohio 2.4% | |
Adams County/Ohio Valley Local School District
Unlimited General Obligation Bonds
Adams and Highland Counties
Series 1995 (NPFGC) | |
| 12/01/15 | | | 7.000 | % | | | 2,160,000 | | | | 2,362,198 | | |
Akron University
Revenue Bonds
Series 2003A (AMBAC) | |
| 01/01/22 | | | 5.000 | % | | | 1,000,000 | | | | 1,021,300 | | |
Buckeye Tobacco Settlement Financing Authority
Asset-Backed Revenue Bonds
Senior Turbo Series 2007A-2 | |
| 06/01/24 | | | 5.125 | % | | | 17,500,000 | | | | 13,221,775 | | |
City of Cleveland
Refunding Revenue Bonds
1st Mortgage
Series 1993G (NPFGC) | |
| 01/01/21 | | | 5.500 | % | | | 4,015,000 | | | | 4,857,749 | | |
Revenue Bonds
Series 2007P | |
| 01/01/24 | | | 5.000 | % | | | 2,000,000 | | | | 2,198,760 | | |
| Series 2008B-1 (NPFGC) | |
| 11/15/28 | | | 5.000 | % | | | 500,000 | | | | 525,300 | | |
City of Columbus Sewerage
Revenue Bonds
Series 2008A | |
| 06/01/31 | | | 4.750 | % | | | 10,000,000 | | | | 10,380,500 | | |
Systems
Series 2008A | |
| 06/01/27 | | | 5.000 | % | | | 4,000,000 | | | | 4,342,600 | | |
City of Columbus
Unlimited General Obligation Bonds
Various Purpose
Series 2006A | |
| 12/15/21 | | | 5.000 | % | | | 1,435,000 | | | | 1,617,991 | | |
City of Lakewood Water System
Revenue Bonds
Series 1995 (AMBAC) | |
| 07/01/20 | | | 5.850 | % | | | 1,690,000 | | | | 2,059,586 | | |
Cleveland State University
Revenue Bonds
Series 2003A (NPFGC) | |
| 06/01/15 | | | 5.000 | % | | | 1,000,000 | | | | 1,047,550 | | |
| Series 2004 (NPFGC/FGIC) | |
| 06/01/24 | | | 5.250 | % | | | 500,000 | | | | 536,055 | | |
The Accompanying Notes to Financial Statements are an integral part of this statement.
25
Columbia Tax-Exempt Fund
November 30, 2011
(Percentages represent value of investments compared to net assets)
Issue
Description | | Coupon
Rate | | Principal
Amount | | Value | |
| Municipal Bonds (continued) | |
| Ohio (cont.) | |
County of Hamilton
Refunding Revenue Bonds
Series 2006A (AMBAC) | |
| 12/01/26 | | | 5.000 | % | | $ | 1,000,000 | | | $ | 1,044,930 | | |
Revenue Bonds
Improvement-Greater Cincinnati Metropolitan
Series 2007A | |
| 12/01/25 | | | 5.000 | % | | | 3,425,000 | | | | 3,724,756 | | |
Metropolitan Sewer District Improvement
Series 2006A (NPFGC) | |
| 12/01/26 | | | 5.000 | % | | | 1,000,000 | | | | 1,073,990 | | |
County of Montgomery
Unlimited General Obligation Improvement Refunding
Bonds
Various Purpose
Series 2005 (NPFGC) | |
| 12/01/24 | | | 5.000 | % | | | 2,600,000 | | | | 2,745,574 | | |
Hickory Chase Community Authority
Revenue Bonds
Hickory Chase Project
Series 2008(d) | |
| 12/01/27 | | | 6.750 | % | | | 6,165,000 | | | | 4,004,599 | | |
Kings Local School District
Unlimited General Obligation Bonds
Series 1995 (NPFGC/FGIC) | |
| 12/01/16 | | | 7.500 | % | | | 1,880,000 | | | | 2,277,413 | | |
Ohio Higher Educational Facility Commission
Revenue Bonds
Denison University 2007 Project
Series 2007 | |
| 11/01/23 | | | 5.000 | % | | | 4,000,000 | | | | 4,403,960 | | |
University of Dayton Project
Series 2009 | |
| 12/01/24 | | | 5.500 | % | | | 3,000,000 | | | | 3,329,670 | | |
Ohio Higher Educational Facility Commission
Revenue Bonds
University Hospital Health Systems
Series 2009A | |
| 01/15/39 | | | 6.750 | % | | | 7,700,000 | | | | 8,017,086 | | |
Ohio Housing Finance Agency
Revenue Bonds
Mortgage-Backed Securities Program
Series 2008F (GNMA/FNMA/FHLMC) | |
| 09/01/28 | | | 5.250 | % | | | 675,000 | | | | 706,442 | | |
Ohio Municipal Electric Generation Agency
Refunding Revenue Bonds
Joint Venture 5
Series 2004 (AMBAC) | |
| 02/15/24 | | | 4.750 | % | | | 7,980,000 | | | | 8,114,303 | | |
Ohio State Turnpike Commission
Refunding Revenue Bonds
Series 1998A (NPFGC/FGIC) | |
| 02/15/26 | | | 5.500 | % | | | 3,000,000 | | | | 3,603,450 | | |
Ohio State University
Revenue Bonds
Series 2005A | |
| 06/01/25 | | | 5.000 | % | | | 3,000,000 | | | | 3,251,880 | | |
Issue
Description | | Coupon
Rate | | Principal
Amount | | Value | |
| Municipal Bonds (continued) | |
| Ohio (cont.) | |
Ohio State Water Development Authority
Refunding Revenue Bonds
Drinking Water Fund
Series 2005 | |
| 12/01/21 | | | 5.250 | % | | $ | 3,890,000 | | | $ | 4,815,237 | | |
| 12/01/22 | | | 5.250 | % | | | 2,625,000 | | | | 3,297,525 | | |
Unrefunded Revenue Bonds
Loan Fund
Series 2005B | |
| 06/01/25 | | | 4.750 | % | | | 920,000 | | | | 970,710 | | |
Ohio State Water Development Authority(a)
Revenue Bonds
Sewer Facilities Anheuser-Busch Project
Series 1999 AMT | |
| 08/01/38 | | | 6.000 | % | | | 1,000,000 | | | | 1,000,720 | | |
Toledo-Lucas County Port Authority
Refunding Revenue Bonds
CSX Transportation, Inc. Project
Series 1992 | |
| 12/15/21 | | | 6.450 | % | | | 3,950,000 | | | | 4,626,003 | | |
Special Assessment Bonds
Town Square at Levi Commons
Series 2007 | |
| 11/01/36 | | | 5.400 | % | | | 2,605,000 | | | | 1,709,453 | | |
| Total | | | 106,889,065 | | |
| Oklahoma 0.2% | |
Cleveland County Justice Authority
Revenue Bonds
Detention Facilities Project
Series 2009B | |
| 03/01/29 | | | 5.750 | % | | | 5,685,000 | | | | 5,995,742 | | |
Oklahoma County Finance Authority
Revenue Bonds
Sail Associates LLC
Series 2007 AMT (Bank of the West)(a) | |
| 12/01/41 | | | 5.250 | % | | | 1,475,000 | | | | 1,493,629 | | |
| Total | | | 7,489,371 | | |
| Oregon 0.4% | |
Benton County Hospital Facilities Authority
Unrefunded Revenue Bonds
Samaritan Health
Series 1998 | |
| 10/01/28 | | | 5.125 | % | | | 655,000 | | | | 654,954 | | |
City of Salem
Limited General Obligation Bonds
Series 2009 | |
| 06/01/27 | | | 4.375 | % | | | 1,000,000 | | | | 1,048,550 | | |
Clackamas County Service District No. 1
Revenue Bonds
Series 2009A | |
| 12/01/25 | | | 4.250 | % | | | 1,690,000 | | | | 1,786,617 | | |
Cow Creek Band of Umpqua Tribe of Indians
Revenue Bonds
Series 2006C(b)(c) | |
| 10/01/26 | | | 5.625 | % | | | 3,500,000 | | | | 2,768,850 | | |
The Accompanying Notes to Financial Statements are an integral part of this statement.
26
Columbia Tax-Exempt Fund
November 30, 2011
(Percentages represent value of investments compared to net assets)
Issue
Description | | Coupon
Rate | | Principal
Amount | | Value | |
| Municipal Bonds (continued) | |
| Oregon (cont.) | |
Linn County Community School District No. 9 Lebanon
Unlimited General Obligation Refunding Bonds
Series 2005 (NPFGC/FGIC) | |
| 06/15/30 | | | 5.500 | % | | $ | 1,435,000 | | | $ | 1,764,017 | | |
Oregon Health & Science University
Revenue Bonds
Series 2009A | |
| 07/01/39 | | | 5.750 | % | | | 4,500,000 | | | | 4,888,035 | | |
Unrefunded Revenue Bonds
Series 1995A (NPFGC) | |
| 07/01/28 | | | 5.250 | % | | | 390,000 | | | | 390,308 | | |
Oregon State Facilities Authority
Revenue Bonds
Linfield College Project
Series 2005A | |
| 10/01/25 | | | 5.000 | % | | | 750,000 | | | | 773,693 | | |
Willamette University Projects
Series 2007A | |
| 10/01/27 | | | 5.000 | % | | | 1,500,000 | | | | 1,561,455 | | |
Oregon State Housing & Community Services Department
Revenue Bonds
Single Family Mortgage Program
Series 2005A | |
| 07/01/20 | | | 4.400 | % | | | 530,000 | | | | 543,213 | | |
Polk, Marion & Benton School District No. 13J
Unlimited General Obligation Bonds
Central School District
Series 2009A | |
| 06/15/29 | | | 4.375 | % | | | 1,300,000 | | | | 1,325,506 | | |
| Total | | | 17,505,198 | | |
| Pennsylvania 2.4% | |
Allegheny County Higher Education Building Authority
Revenue Bonds
Duquesne University
Series 2008 | |
| 03/01/28 | | | 5.000 | % | | | 490,000 | | | | 506,155 | | |
Berks County Municipal Authority
Revenue Bonds
Reading Hospital Medical Center Project
Series 1993 (NPFGC) | |
| 10/01/14 | | | 5.700 | % | | | 540,000 | | | | 573,626 | | |
Butler County Hospital Authority
Revenue Bonds
Butler Health Systems Project
Series 2009 | |
| 07/01/39 | | | 7.250 | % | | | 7,000,000 | | | | 7,682,780 | | |
Cambria County Industrial Development Authority
Refunding Revenue Bonds
Beverly Enterprises
Series 1987 Escrowed to Maturity | |
| 06/18/12 | | | 10.000 | % | | | 200,000 | | | | 210,592 | | |
Chester County Industrial Development Authority
RHA/Pennsylvania Nursing Home-1st Mortgage
Series 2002(d) | |
| 05/01/32 | | | 8.500 | % | | | 5,985,000 | | | | 5,632,723 | | |
Commonwealth of Pennsylvania
Unlimited General Obligation Bonds
1st Series 2010A | |
| 02/15/19 | | | 5.000 | % | | | 10,000,000 | | | | 12,114,100 | | |
Issue
Description | | Coupon
Rate | | Principal
Amount | | Value | |
| Municipal Bonds (continued) | |
| Pennsylvania (cont.) | |
Dauphin County Industrial Development Authority
Revenue Bonds
Dauphin Consolidated Water Supply
Series 1992A AMT(a) | |
| 06/01/24 | | | 6.900 | % | | $ | 3,400,000 | | | $ | 4,117,366 | | |
Delaware County Industrial Development Authority
Revenue Bonds
Philadelphia Suburban Water Facilities
Series 2001 (AMBAC) AMT(a) | |
| 10/01/31 | | | 5.350 | % | | | 3,000,000 | | | | 3,019,260 | | |
Delaware Valley Regional Financial Authority
Revenue Bonds
Series 1997C (AMBAC) | |
| 07/01/27 | | | 7.750 | % | | | 1,000,000 | | | | 1,283,780 | | |
Montgomery County Industrial Development Authority
Revenue Bonds
Acts Retirement-Life Communities
Series 1998 | |
| 11/15/28 | | | 5.250 | % | | | 7,500,000 | | | | 7,191,000 | | |
Whitemarsh Continuing Care
Series 2005 | |
| 02/01/28 | | | 6.125 | % | | | 2,000,000 | | | | 1,746,260 | | |
Northampton County General Purpose Authority
Revenue Bonds
Saint Luke's Hospital Project
Series 2008A | |
| 08/15/28 | | | 5.375 | % | | | 4,000,000 | | | | 4,011,920 | | |
Pennsylvania Convention Center Authority
Revenue Bonds
Series 1989A Escrowed to Maturity (FGIC) | |
| 09/01/19 | | | 6.000 | % | | | 14,010,000 | | | | 17,378,984 | | |
Pennsylvania Economic Development Financing Authority
Revenue Bonds
Allegheny Energy Supply Co.
Series 2009 | |
| 07/15/39 | | | 7.000 | % | | | 13,000,000 | | | | 14,043,900 | | |
Philadelphia Biosolids Facility
Series 2009 | |
| 01/01/32 | | | 6.250 | % | | | 5,325,000 | | | | 5,596,735 | | |
Pennsylvania Economic Development Financing Authority(a)
Revenue Bonds
Proctor & Gamble Paper Project
Series 2001 AMT | |
| 03/01/31 | | | 5.375 | % | | | 1,000,000 | | | | 1,109,080 | | |
Pennsylvania Higher Educational Facilities Authority
Revenue Bonds
Edinboro University
Series 2008 | |
| 07/01/28 | | | 5.750 | % | | | 3,000,000 | | | | 3,019,410 | | |
Edinboro University Foundation
Series 2010 | |
| 07/01/43 | | | 6.000 | % | | | 4,750,000 | | | | 4,723,020 | | |
Pennsylvania State University
Refunding Revenue Bonds
Series 2002 | |
| 08/15/16 | | | 5.250 | % | | | 1,000,000 | | | | 1,164,090 | | |
Revenue Bonds
Series 2005 | |
| 09/01/24 | | | 5.000 | % | | | 1,250,000 | | | | 1,381,750 | | |
The Accompanying Notes to Financial Statements are an integral part of this statement.
27
Columbia Tax-Exempt Fund
November 30, 2011
(Percentages represent value of investments compared to net assets)
Issue
Description | | Coupon
Rate | | Principal
Amount | | Value | |
| Municipal Bonds (continued) | |
| Pennsylvania (cont.) | |
Philadelphia Municipal Authority
Revenue Bonds
Lease
Series 2009 | |
| 04/01/34 | | | 6.500 | % | | $ | 2,500,000 | | | $ | 2,659,875 | | |
Philadelphia Redevelopment Authority
Revenue Bonds
Subordinated Series 1986B Escrowed to Maturity (GNMA) | |
| 06/01/17 | | | 9.000 | % | | | 450,000 | | | | 624,942 | | |
Washington County Industrial Development Authority
Revenue Bonds
Washington Jefferson College
Series 2010 | |
| 11/01/36 | | | 5.000 | % | | | 4,850,000 | | | | 4,916,348 | | |
Washington County Industrial Development Authority(d)
1st Mortgage
Central Project
Series 2003 | |
| 01/01/29 | | | 8.500 | % | | | 2,126,000 | | | | 2,116,263 | | |
Westmoreland County Municipal Authority
Revenue Bonds
Capital Appreciation
Series 1999A (NPFGC)(e) | |
| 08/15/22 | | | 0.000 | % | | | 2,000,000 | | | | 1,302,400 | | |
| Total | | | 108,126,359 | | |
| Puerto Rico 2.5% | |
Commonwealth of Puerto Rico
Unlimited General Obligation Refunding Bonds
Series 1996B (AMBAC/TCRS)(c) | |
| 07/01/15 | | | 6.500 | % | | | 2,650,000 | | | | 2,963,601 | | |
Puerto Rico Electric Power Authority(c)
Refunding Revenue Bonds
Series 2007UU (AGM) | |
| 07/01/23 | | | 5.000 | % | | | 1,000,000 | | | | 1,062,960 | | |
| Series 2007VV (NPFGC/FGIC) | |
| 07/01/34 | | | 5.250 | % | | | 10,870,000 | | | | 11,116,097 | | |
Revenue Bonds
Series 2003NN (NPFGC) | |
| 07/01/21 | | | 5.250 | % | | | 3,500,000 | | | | 3,882,165 | | |
| Series 2008WW | |
| 07/01/23 | | | 5.375 | % | | | 2,500,000 | | | | 2,672,575 | | |
| Series 2010XX | |
| 07/01/40 | | | 5.250 | % | | | 14,500,000 | | | | 14,529,145 | | |
Puerto Rico Highway & Transportation Authority(c)
Refunding Revenue Bonds
Series 1996Z (AGM) | |
| 07/01/18 | | | 6.000 | % | | | 4,640,000 | | | | 5,333,077 | | |
| Series 1996Z Escrowed to Maturity (AGM) | |
| 07/01/18 | | | 6.000 | % | | | 5,360,000 | | | | 6,643,720 | | |
| Series 2003AA (NPFGC) | |
| 07/01/20 | | | 5.500 | % | | | 180,000 | | | | 196,987 | | |
| Series 2003AA Escrowed to Maturity (NPFGC) | |
| 07/01/20 | | | 5.500 | % | | | 320,000 | | | | 406,649 | | |
Puerto Rico Highway & Transportation Authority(c)
Revenue Bonds
Series 2005K | |
| 07/01/20 | | | 5.000 | % | | | 11,130,000 | | | | 11,387,771 | | |
Issue
Description | | Coupon
Rate | | Principal
Amount | | Value | |
| Municipal Bonds (continued) | |
| Puerto Rico (cont.) | |
Puerto Rico Industrial Tourist Educational Medical &
Environmental Central Facilities Finance Authority
Revenue Bonds
Intermediate American University
Series 1998A (NPFGC)(c) | |
| 10/01/22 | | | 5.000 | % | | $ | 2,500,000 | | | $ | 2,501,450 | | |
Puerto Rico Public Buildings Authority(c)
Prerefunded 07/01/14 Revenue Bonds
Government Facilities
Series 2004I | |
| 07/01/33 | | | 5.250 | % | | | 130,000 | | | | 144,494 | | |
Refunding Revenue Bonds
Government Facilities
Series 2002F | |
| 07/01/20 | | | 5.250 | % | | | 2,000,000 | | | | 2,126,280 | | |
| Series 2007M | |
| 07/01/31 | | | 6.250 | % | | | 27,000,000 | | | | 30,348,540 | | |
Puerto Rico Public Finance Corp.(c)
Revenue Bonds
Commonwealth Appropriations
Series 1998A (AMBAC) | |
| 06/01/24 | | | 5.125 | % | | | 3,000,000 | | | | 3,530,040 | | |
Unrefunded Revenue Bonds
Commonwealth Appropriations
Series 2002E Escrowed to Maturity | |
| 08/01/26 | | | 6.000 | % | | | 2,470,000 | | | | 3,288,286 | | |
Puerto Rico Sales Tax Financing Corp.
1st Subordinated Revenue Bonds
Series 2010C(c) | |
| 08/01/41 | | | 5.250 | % | | | 10,000,000 | | | | 10,194,600 | | |
| Total | | | 112,328,437 | | |
| Rhode Island 0.1% | |
Rhode Island Student Loan Authority
Revenue Bonds
Series 2007-2 (AMBAC) AMT(a) | |
| 12/01/37 | | | 4.850 | % | | | 6,000,000 | | | | 5,118,180 | | |
| South Carolina 1.5% | |
Charleston Educational Excellence Finance Corp.
Revenue Bonds
Charleston County School District
Series 2005 | |
| 12/01/30 | | | 5.250 | % | | | 5,500,000 | | | | 5,778,960 | | |
City of Myrtle Beach
Tax Allocation Bonds
Myrtle Beach Air Force Base
Series 2006A | |
| 10/01/26 | | | 5.250 | % | | | 1,870,000 | | | | 1,523,003 | | |
City of Rock Hill
Improvement Refunding Revenue Bonds
Series 2003A (AGM) | |
| 01/01/30 | | | 5.000 | % | | | 4,000,000 | | | | 4,101,640 | | |
Coastal Carolina University
Unrefunded Revenue Bonds
Series 1999 (AMBAC) | |
| 06/01/26 | | | 5.300 | % | | | 1,810,000 | | | | 1,811,937 | | |
County of Berkeley
Unlimited General Obligation Improvement Refunding
Bonds
Series 2003 (AGM) | |
| 09/01/28 | | | 5.000 | % | | | 4,000,000 | | | | 4,182,040 | | |
The Accompanying Notes to Financial Statements are an integral part of this statement.
28
Columbia Tax-Exempt Fund
November 30, 2011
(Percentages represent value of investments compared to net assets)
Issue
Description | | Coupon
Rate | | Principal
Amount | | Value | |
| Municipal Bonds (continued) | |
| South Carolina (cont.) | |
County of Georgetown
Refunding Revenue Bonds
International Paper Co. Project
Series 2000A | |
| 03/15/14 | | | 5.950 | % | | $ | 1,000,000 | | | $ | 1,075,870 | | |
County of Richland
Revenue Bonds
International Paper
Series 2003 AMT(a) | |
| 04/01/23 | | | 6.100 | % | | | 1,000,000 | | | | 1,027,570 | | |
Grand Strand Water & Sewer Authority
Revenue Bonds
Series 2001 (AGM) | |
| 06/01/31 | | | 5.000 | % | | | 4,000,000 | | | | 4,016,760 | | |
Greenville Hospital System Board
Revenue Bonds
Series 2001 (AMBAC) | |
| 05/01/26 | | | 5.500 | % | | | 5,000,000 | | | | 5,000,350 | | |
Lexington County Health Services District, Inc.
Prerefunded 05/01/14 Revenue Bonds
Series 2004 | |
| 05/01/32 | | | 5.500 | % | | | 4,685,000 | | | | 5,232,442 | | |
Piedmont Municipal Power Agency
Refunding Revenue Bonds
Electric
Series 1991 (NPFGC/FGIC) | |
| 01/01/21 | | | 6.250 | % | | | 1,250,000 | | | | 1,547,387 | | |
Unrefunded Revenue Bonds
Series 1993 (NPFGC) | |
| 01/01/25 | | | 5.375 | % | | | 11,370,000 | | | | 13,088,348 | | |
Piedmont Municipal Power Agency(e)
Refunding Revenue Bonds
Capital Appreciation
Subordinated Series 2004A-2 (NPFGC/FGIC) | |
| 01/01/24 | | | 0.000 | % | | | 5,000,000 | | | | 2,785,300 | | |
Scago Educational Facilities Corp.
Revenue Bonds
School District No. 5 Spartanburg County
Series 2005 (AGM) | |
| 04/01/22 | | | 4.600 | % | | | 8,885,000 | | | | 9,240,400 | | |
South Carolina Jobs-Economic Development Authority
Revenue Bonds
Woodlands at Furman Project
Series 2007A | |
| 11/15/37 | | | 6.000 | % | | | 4,200,000 | | | | 1,658,958 | | |
Unrefunded Revenue Bonds
Bon Secours
Series 2002B | |
| 11/15/30 | | | 5.625 | % | | | 3,165,000 | | | | 3,163,069 | | |
South Carolina State Housing Finance & Development Authority
Revenue Bonds
Series 1999A-2 (AGM) AMT(a) | |
| 07/01/29 | | | 5.400 | % | | | 450,000 | | | | 450,131 | | |
South Carolina State Public Service Authority
Revenue Bonds
Santee Cooper
Series 2006A (NPFGC) | |
| 01/01/27 | | | 5.000 | % | | | 2,600,000 | | | | 2,771,704 | | |
| Series 2008A | |
| 01/01/28 | | | 5.375 | % | | | 250,000 | | | | 278,355 | | |
| Total | | | 68,734,224 | | |
Issue
Description | | Coupon
Rate | | Principal
Amount | | Value | |
| Municipal Bonds (continued) | |
| South Dakota 0.5% | |
Heartland Consumers Power District
Revenue Bonds
Series 1992 Escrowed to Maturity (AGM) | |
| 01/01/17 | | | 6.000 | % | | $ | 4,965,000 | | | $ | 5,363,789 | | |
Unrefunded Revenue Bonds
Series 1992 (AGM) | |
| 01/01/17 | | | 6.000 | % | | | 8,635,000 | | | | 9,870,237 | | |
State of South Dakota
Revenue Bonds
Series 1993A (AGM) | |
| 09/01/17 | | | 6.700 | % | | | 7,260,000 | | | | 8,462,038 | | |
| Total | | | 23,696,064 | | |
| Tennessee 0.1% | |
Knox County Health Educational & Housing Facilities Board
Refunding Revenue Bonds
Fort Sanders Alliance
Series 1993 (NPFGC) | |
| 01/01/15 | | | 5.250 | % | | | 5,000,000 | | | | 5,413,600 | | |
Metropolitan Government Nashville & Davidson County
Health & Educational Facilities Board
1st Mortgage-AHF Project
Series 2003(d) | |
| 01/01/29 | | | 8.500 | % | | | 488,000 | | | | 485,765 | | |
| Total | | | 5,899,365 | | |
| Texas 6.1% | |
Bexar County Health Facilities Development Corp.
Revenue Bonds
Army Retirement Residence Project
Series 2010 | |
| 07/01/45 | | | 6.200 | % | | | 7,200,000 | | | | 7,353,144 | | |
Brazos River Authority(a)
Refunding Revenue Bonds
TXU Electric
Series 2001A AMT | |
| 10/01/30 | | | 8.250 | % | | | 5,250,000 | | | | 1,363,215 | | |
TXU Energy Co. LLC Project
Series 2003A AMT | |
| 04/01/38 | | | 6.750 | % | | | 1,900,000 | | | | 1,532,635 | | |
Brazos River Authority(a)(h)
Refunding Revenue Bonds
TXU Electric Co. Project
Series 1999B AMT | |
| 09/01/34 | | | 6.750 | % | | | 12,455,000 | | | | 10,046,826 | | |
Capital Area Cultural Education Facilities Finance Corp.
Revenue Bonds
Roman Catholic Diocese
Series 2005B | |
| 04/01/45 | | | 6.125 | % | | | 13,450,000 | | | | 13,859,821 | | |
Central Texas Regional Mobility Authority
Revenue Bonds
Senior Lien
Series 2011 | |
| 01/01/41 | | | 6.000 | % | | | 8,620,000 | | | | 8,667,410 | | |
Central Texas Regional Mobility Authority(e)
Revenue Bonds
Capital Appreciation
Series 2010 | |
| 01/01/25 | | | 0.000 | % | | | 2,000,000 | | | | 928,560 | | |
The Accompanying Notes to Financial Statements are an integral part of this statement.
29
Columbia Tax-Exempt Fund
November 30, 2011
(Percentages represent value of investments compared to net assets)
Issue
Description | | Coupon
Rate | | Principal
Amount | | Value | |
| Municipal Bonds (continued) | |
| Texas (cont.) | |
City of Austin Electric Utility
Refunding Revenue Bonds
Series 2008A | |
| 11/15/35 | | | 5.250 | % | | $ | 8,000,000 | | | $ | 8,472,480 | | |
City of Dallas
Limited General Obligation Bonds
Series 2005 | |
| 02/15/25 | | | 5.000 | % | | | 820,000 | | | | 852,365 | | |
City of Houston Airport System
Refunding Revenue Bonds
Senior Lien
Series 2009A | |
| 07/01/34 | | | 5.500 | % | | | 10,500,000 | | | | 11,172,315 | | |
City of Houston Airport System(a)
Refunding Revenue Bonds
Continental-Special Facilities
Series 2011A | |
| 07/15/30 | | | 6.500 | % | | | 5,555,000 | | | | 5,468,509 | | |
Revenue Bonds
Subordinated Lien
Series 2000A (AGM) AMT | |
| 07/01/30 | | | 5.625 | % | | | 750,000 | | | | 750,330 | | |
City of Houston Utility System(e)
Refunding Revenue Bonds
Capital Appreciation
Series 1998A Escrowed to Maturity (AGM) | |
| 12/01/19 | | | 0.000 | % | | | 26,955,000 | | | | 22,582,360 | | |
Unrefunded Revenue Bonds
Capital Appreciation
Series 1998A (AGM) | |
| 12/01/19 | | | 0.000 | % | | | 9,545,000 | | | | 7,542,554 | | |
City of Houston
Revenue Bonds
Capital Appreciation-Convention
Series 2001B (AMBAC)(e) | |
| 09/01/17 | | | 0.000 | % | | | 2,000,000 | | | | 1,588,020 | | |
City of San Antonio
Revenue Bonds
Series 1997 Escrowed to Maturity | |
| 02/01/20 | | | 5.500 | % | | | 1,055,000 | | | | 1,278,576 | | |
Clifton Higher Education Finance Corp.
Revenue Bonds
Idea Public Schools
Series 2011 | |
| 08/01/41 | | | 5.750 | % | | | 2,000,000 | | | | 1,971,780 | | |
Corpus Christi Business & Job Development Corp.
Improvement Refunding Revenue Bonds
Arena Project
Series 2002 (AMBAC) | |
| 09/01/25 | | | 5.000 | % | | | 3,550,000 | | | | 3,696,970 | | |
Dallas County Flood Control District No. 1
Unlimited General Obligation Refunding Bonds
Series 2002 | |
| 04/01/32 | | | 7.250 | % | | | 7,500,000 | | | | 7,632,225 | | |
Dallas-Fort Worth International Airport Facilities
Improvement Corp.
Revenue Bonds
Series 2000A (NPFGC/FGIC) AMT(a) | |
| 11/01/30 | | | 5.750 | % | | | 3,415,000 | | | | 3,419,098 | | |
Issue
Description | | Coupon
Rate | | Principal
Amount | | Value | |
| Municipal Bonds (continued) | |
| Texas (cont.) | |
Deaf Smith County Hospital District
Limited General Obligation Bonds
Series 2010A | |
| 03/01/40 | | | 6.500 | % | | $ | 4,000,000 | | | $ | 4,086,480 | | |
Harris County Health Facilities Development Corp.
Refunding Revenue Bonds
Memorial Hermann Healthcare System
Series 2008B | |
| 12/01/35 | | | 7.250 | % | | | 8,800,000 | | | | 9,880,464 | | |
Revenue Bonds
St. Luke's Episcopal Hospital Project
Series 1991 Escrowed to Maturity | |
| 02/15/21 | | | 6.750 | % | | | 2,000,000 | | | | 2,382,600 | | |
Harris County-Houston Sports Authority(e)
Refunding Revenue Bonds
Capital Appreciation-Senior Lien
Series 2001A (NPFGC) | |
| 11/15/14 | | | 0.000 | % | | | 3,905,000 | | | | 3,216,978 | | |
| 11/15/15 | | | 0.000 | % | | | 3,975,000 | | | | 3,055,265 | | |
| 11/15/16 | | | 0.000 | % | | | 4,040,000 | | | | 2,905,487 | | |
Houston Higher Education Finance Corp.
Revenue Bonds
Cosmos Foundation, Inc.
Series 2011A | |
| 05/15/41 | | | 6.875 | % | | | 4,045,000 | | | | 4,354,968 | | |
La Vernia Higher Education Finance Corp.
Revenue Bonds
Kipp, Inc.
Series 2009A | |
| 08/15/44 | | | 6.375 | % | | | 7,500,000 | | | | 7,945,650 | | |
Matagorda County Navigation District No. 1
Refunding Revenue Bonds
Central Power & Light Co. Project
Series 2001A | |
| 11/01/29 | | | 6.300 | % | | | 2,800,000 | | | | 3,067,680 | | |
Mission Economic Development Corp
Revenue Bonds
Dallas Clean Energy McCommas
Series 2011 AMT(a) | |
| 12/01/24 | | | 6.875 | % | | | 15,000,000 | | | | 15,357,300 | | |
North East Independent School District
Unlimited General Obligation Refunding Bonds
Series 2007 (Permanent School Fund Guarantee) | |
| 02/01/31 | | | 5.250 | % | | | 10,000,000 | | | | 12,098,700 | | |
North Texas Tollway Authority
Refunding Revenue Bonds
1st Tier
Series 2009C | |
| 01/01/44 | | | 5.250 | % | | | 10,000,000 | | | | 10,111,500 | | |
| Series 2011 | |
| 01/01/38 | | | 5.000 | % | | | 5,500,000 | | | | 5,428,720 | | |
Toll 2nd Tier
Series 2008F | |
| 01/01/38 | | | 5.750 | % | | | 11,355,000 | | | | 11,742,433 | | |
Permanent University Fund
Refunding Revenue Bonds
Series 2007B | |
| 07/01/23 | | | 5.250 | % | | | 1,000,000 | | | | 1,264,180 | | |
The Accompanying Notes to Financial Statements are an integral part of this statement.
30
Columbia Tax-Exempt Fund
November 30, 2011
(Percentages represent value of investments compared to net assets)
Issue
Description | | Coupon
Rate | | Principal
Amount | | Value | |
| Municipal Bonds (continued) | |
| Texas (cont.) | |
Resolution Trust Corp.
Pass-Through Certificates
Series 1993A(b)(d) | |
| 12/01/16 | | | 8.500 | % | | $ | 6,615,223 | | | $ | 6,337,912 | | |
Sabine River Authority
Refunding Revenue Bonds
TXU Electric
Series 2001C | |
| 05/01/28 | | | 5.200 | % | | | 3,000,000 | | | | 615,090 | | |
Sam Rayburn Municipal Power Agency
Refunding Revenue Bonds
Series 2002 | |
| 10/01/16 | | | 6.000 | % | | | 5,000,000 | | | | 5,144,550 | | |
San Juan Higher Education Finance Authority
Revenue Bonds
Idea Public Schools
Series 2010A | |
| 08/15/40 | | | 6.700 | % | | | 2,700,000 | | | | 2,825,307 | | |
Tarrant County Cultural Education Facilities Finance Corp.
Revenue Bonds
Air Force Obligation Group
Series 2007 | |
| 05/15/27 | | | 5.125 | % | | | 2,000,000 | | | | 1,859,500 | | |
CC Young Memorial Home
Series 2009A | |
| 02/15/38 | | | 8.000 | % | | | 4,000,000 | | | | 4,039,880 | | |
Stayton at Museum Way
Series 2009A | |
| 11/15/44 | | | 8.250 | % | | | 12,000,000 | | | | 12,229,800 | | |
Texas City Industrial Development Corp.
Refunding Revenue Bonds
Arco Pipe Line Co. Project
Series 1990 | |
| 10/01/20 | | | 7.375 | % | | | 2,000,000 | | | | 2,566,960 | | |
Texas State Turnpike Authority(e)
Revenue Bonds
Capital Appreciation 1st Tier
Series 2002A (AMBAC) | |
| 08/15/16 | | | 0.000 | % | | | 7,000,000 | | | | 5,948,250 | | |
| 08/15/18 | | | 0.000 | % | | | 10,000,000 | | | | 7,723,000 | | |
| 08/15/19 | | | 0.000 | % | | | 10,330,000 | | | | 7,521,996 | | |
Travis County Health Facilities Development Corp.
Revenue Bonds
Querencia Barton Creek Project
Series 2005 | |
| 11/15/25 | | | 5.500 | % | | | 1,000,000 | | | | 904,010 | | |
Uptown Development Authority
Tax Allocation Bonds
Infrastructure Improvement Facilities
Series 2009 | |
| 09/01/29 | | | 5.500 | % | | | 500,000 | | | | 513,600 | | |
| Total | | | 275,307,453 | | |
| Utah 0.5% | |
City of Eagle Mountain
Special Assessment Bonds
Special Improvement District No. 2000-1
Series 2006 | |
| 02/01/21 | | | 8.250 | % | | | 2,336,000 | | | | 2,359,851 | | |
Issue
Description | | Coupon
Rate | | Principal
Amount | | Value | |
| Municipal Bonds (continued) | |
| Utah (cont.) | |
City of Provo Energy System
Revenue Bonds
Series 1980 Escrowed to Maturity | |
| 04/01/15 | | | 10.125 | % | | $ | 815,000 | | | $ | 954,014 | | |
Utah Housing Corp.
Revenue Bonds
Series 2003A-1 AMT(a) | |
| 07/01/24 | | | 5.125 | % | | | 1,040,000 | | | | 1,064,877 | | |
Utah State Building Ownership Authority
Refunding Revenue Bonds
State Facilities Master Lease Program
Series 1998C Escrowed to Maturity (AGM) | |
| 05/15/19 | | | 5.500 | % | | | 3,450,000 | | | | 4,015,800 | | |
Utah Transit Authority
Refunding Revenue Bonds
Series 2006C (AGM) | |
| 06/15/29 | | | 5.250 | % | | | 10,000,000 | | | | 11,958,200 | | |
Revenue Bonds
Series 2008A | |
| 06/15/25 | | | 5.000 | % | | | 2,000,000 | | | | 2,210,440 | | |
| Total | | | 22,563,182 | | |
| Virgin Islands 0.2% | |
Virgin Islands Public Finance Authority(a)(c)
Senior Secured Revenue Bonds
Hovensa Coker Project
Series 2002 AMT | |
| 07/01/21 | | | 6.500 | % | | | 5,000,000 | | | | 4,768,550 | | |
Hovensa Refinery
Series 2003 AMT | |
| 07/01/22 | | | 6.125 | % | | | 2,975,000 | | | | 2,725,189 | | |
| Total | | | 7,493,739 | | |
| Virginia 1.4% | |
City of Hampton
Prerefunded 01/15/13 Revenue Bonds
Series 2002 (AMBAC) | |
| 01/15/28 | | | 5.125 | % | | | 5,350,000 | | | | 5,631,892 | | |
Fairfax County Industrial Development Authority
Refunding Revenue Bonds
Inova Health Systems Project
Series 1993 | |
| 08/15/23 | | | 5.000 | % | | | 10,000,000 | | | | 11,451,000 | | |
Fairfax County Water Authority
Refunding Revenue Bonds
Subordinated Series 2005B | |
| 04/01/24 | | | 5.250 | % | | | 6,175,000 | | | | 7,797,481 | | |
Mosaic District Community Development Authority
Special Assessment Bonds
Series 2011A | |
| 03/01/26 | | | 6.625 | % | | | 2,145,000 | | | | 2,246,630 | | |
Peninsula Town Center Community Development Authority
Revenue Bonds
Series 2007 | |
| 09/01/24 | | | 6.250 | % | | | 2,363,000 | | | | 2,387,693 | | |
Richmond Metropolitan Authority
Refunding Revenue Bonds
Series 1998 (NPFGC/FGIC) | |
| 07/15/22 | | | 5.250 | % | | | 7,800,000 | | | | 8,883,654 | | |
The Accompanying Notes to Financial Statements are an integral part of this statement.
31
Columbia Tax-Exempt Fund
November 30, 2011
(Percentages represent value of investments compared to net assets)
Issue
Description | | Coupon
Rate | | Principal
Amount | | Value | |
| Municipal Bonds (continued) | |
| Virginia (cont.) | |
Tobacco Settlement Financing Corp.
Prerefunded 06/01/15 Asset-Backed Revenue Bonds
Series 2005 | |
| 06/01/26 | | | 5.500 | % | | $ | 10,200,000 | | | $ | 11,262,738 | | |
| 06/01/37 | | | 5.625 | % | | | 5,500,000 | | | | 6,375,490 | | |
Virginia College Building Authority
Revenue Bonds
Washington & Lee University
Series 2001 | |
| 01/01/21 | | | 5.375 | % | | | 5,000,000 | | | | 5,942,050 | | |
Virginia Resources Authority
Revenue Bonds
State Revolving Fund
Series 2009 | |
| 10/01/26 | | | 5.000 | % | | | 1,500,000 | | | | 1,744,440 | | |
| Total | | | 63,723,068 | | |
| Washington 2.7% | |
Clark County School District No. 37 Vancouver
Unlimited General Obligation Bonds
Series 2001C (NPFGC/FGIC)(e) | |
| 12/01/16 | | | 0.000 | % | | | 3,000,000 | | | | 2,715,180 | | |
NJB Properties
Revenue Bonds
King County Washington Project
Series 2006A | |
| 12/01/25 | | | 5.000 | % | | | 6,445,000 | | | | 6,864,763 | | |
| 12/01/26 | | | 5.000 | % | | | 7,290,000 | | | | 7,719,235 | | |
Skagit County Public Hospital District No. 1
Revenue Bonds
Skagit Valley Hospital
Series 2005 | |
| 12/01/30 | | | 5.500 | % | | | 1,235,000 | | | | 1,200,976 | | |
| Series 2007 | |
| 12/01/28 | | | 5.750 | % | | | 1,500,000 | | | | 1,506,780 | | |
| 12/01/32 | | | 5.750 | % | | | 2,000,000 | | | | 1,978,380 | | |
Snohomish County Public Utility District No. 1
Refunding Revenue Bonds
Generation System
Series 1986A Escrowed to Maturity | |
| 01/01/20 | | | 5.000 | % | | | 17,750,000 | | | | 21,707,185 | | |
Spokane Public Facilities District
Revenue Bonds
Series 2003 (NPFGC) | |
| 12/01/28 | | | 5.750 | % | | | 3,195,000 | | | | 3,297,847 | | |
State of Washington
Unlimited General Obligation Bonds
Series 2007D (AGM) | |
| 01/01/30 | | | 4.500 | % | | | 24,470,000 | | | | 25,027,182 | | |
Various Purpose
Series 2008A | |
| 07/01/27 | | | 5.000 | % | | | 9,730,000 | | | | 10,641,409 | | |
Unlimited General Obligation Refunding Bonds
Motor Vehicle Fuel
Series 2010 | |
| 07/01/19 | | | 5.000 | % | | | 5,000,000 | | | | 6,061,050 | | |
Issue
Description | | Coupon
Rate | | Principal
Amount | | Value | |
| Municipal Bonds (continued) | |
| Washington (cont.) | |
Washington Health Care Facilities Authority
Revenue Bonds
Overlake Hospital Medical Center
Series 2010 | |
| 07/01/30 | | | 5.500 | % | | $ | 3,000,000 | | | $ | 3,055,290 | | |
Swedish Health Services
Series 2009A | |
| 11/15/33 | | | 6.500 | % | | | 11,800,000 | | | | 12,363,332 | | |
Washington Higher Education Facilities Authority
Refunding Revenue Bonds
Whitworth University Project
Series 2009 | |
| 10/01/40 | | | 5.625 | % | | | 4,685,000 | | | | 4,772,235 | | |
Washington State Housing Finance Commission
Revenue Bonds
Skyline At First Hill Project
Series 2007A | |
| 01/01/27 | | | 5.625 | % | | | 2,500,000 | | | | 1,786,400 | | |
| 01/01/38 | | | 5.625 | % | | | 18,950,000 | | | | 12,250,038 | | |
| Total | | | 122,947,282 | | |
| West Virginia 0.4% | |
West Virginia Economic Development Authority
Refunding Revenue Bonds
Appalachian Power Amos
Series 2010A | |
| 12/01/38 | | | 5.375 | % | | | 3,850,000 | | | | 3,948,021 | | |
West Virginia State Building Commission
Refunding Revenue Bonds
West Virginia Regional Jail
Series 1998A (AMBAC) | |
| 07/01/21 | | | 5.375 | % | | | 3,215,000 | | | | 3,439,696 | | |
West Virginia University
Revenue Bonds
University System Projects
Series 1998A (NFPGC) | |
| 04/01/28 | | | 5.250 | % | | | 5,000,000 | | | | 5,803,000 | | |
West Virginia University(e)
Revenue Bonds
University System Projects
Series 2000A (AMBAC) | |
| 04/01/16 | | | 0.000 | % | | | 3,300,000 | | | | 2,969,703 | | |
| Total | | | 16,160,420 | | |
| Wisconsin 3.2% | |
Badger Tobacco Asset Securitization Corp.
Prerefunded 06/01/12 Asset-Backed Revenue Bonds
Series 2002 | |
| 06/01/27 | | | 6.125 | % | | | 5,090,000 | | | | 5,239,392 | | |
City of La Crosse
Refunding Revenue Bonds
Northern States Power Co. Project
Series 1996 AMT(a) | |
| 11/01/21 | | | 6.000 | % | | | 6,000,000 | | | | 6,688,080 | | |
Monroe Redevelopment Authority
Revenue Bonds
Monroe Clinic, Inc.
Series 2009 | |
| 02/15/39 | | | 5.875 | % | | | 5,000,000 | | | | 5,169,950 | | |
The Accompanying Notes to Financial Statements are an integral part of this statement.
32
Columbia Tax-Exempt Fund
November 30, 2011
(Percentages represent value of investments compared to net assets)
Issue
Description | | Coupon
Rate | | Principal
Amount | | Value | |
| Municipal Bonds (continued) | |
| Wisconsin (cont.) | |
State of Wisconsin
Revenue Bonds
Series 2009A | |
| 05/01/33 | | | 5.750 | % | | $ | 17,700,000 | | | $ | 19,527,525 | | |
Wisconsin Health & Educational Facilities Authority
Refunding Revenue Bonds
Wheaton Healthcare
Series 2006B | |
| 08/15/24 | | | 5.125 | % | | | 15,910,000 | | | | 15,666,577 | | |
| 08/15/25 | | | 5.125 | % | | | 15,500,000 | | | | 14,842,025 | | |
Revenue Bonds
Aurora Health Care, Inc.
Series 1999A | |
| 02/15/29 | | | 5.600 | % | | | 3,845,000 | | | | 3,845,846 | | |
| Series 2003 | |
| 04/15/33 | | | 6.400 | % | | | 4,250,000 | | | | 4,333,470 | | |
| Series 2010A | |
| 04/15/39 | | | 5.625 | % | | | 6,100,000 | | | | 6,162,403 | | |
Marshfield Clinic
Series 1999 | |
| 02/15/29 | | | 6.250 | % | | | 7,200,000 | | | | 7,203,024 | | |
Medical College of Wisconsin
Series 2008A | |
| 12/01/35 | | | 5.250 | % | | | 14,400,000 | | | | 14,670,144 | | |
Prohealth Care, Inc. Obligation Group
Series 2009 | |
| 02/15/32 | | | 6.625 | % | | | 1,000,000 | | | | 1,030,740 | | |
| 02/15/39 | | | 6.625 | % | | | 25,150,000 | | | | 27,122,514 | | |
Riverview Hospital Association
Series 2008 | |
| 04/01/33 | | | 5.750 | % | | | 6,000,000 | | | | 6,169,200 | | |
| 04/01/38 | | | 5.750 | % | | | 4,000,000 | | | | 4,082,560 | | |
St. John's Community, Inc.
Series 2009A | |
| 09/15/29 | | | 7.250 | % | | | 1,000,000 | | | | 1,052,190 | | |
| 09/15/39 | | | 7.625 | % | | | 1,000,000 | | | | 1,059,770 | | |
| Total | | | 143,865,410 | | |
| Wyoming 0.2% | |
County of Campbell
Revenue Bonds
Basin Electric Power Cooperative
Series 2009A | |
| 07/15/39 | | | 5.750 | % | | | 7,900,000 | | | | 8,530,973 | | |
Total Municipal Bonds
(Cost: $4,080,509,322) | | $ | 4,321,175,454 | | |
| | | Effective
Yield | | Amount
Payable at
Maturity | | Value | |
| Floating Rate Notes 1.7% | |
| Colorado 0.2% | |
Colorado Educational & Cultural Facilities Authority(h)
Revenue Bonds
Series 2007 VRDN (U.S. Bank) | |
| 06/01/37 | | | 0.120 | % | | | 1,200,000 | | | | 1,200,000 | | |
UJA Federation of Northern New Jersey
VRDN Series 2007 (JPMorgan Chase Bank) | |
| 05/01/37 | | | 0.120 | % | | | 2,950,000 | | | | 2,950,000 | | |
Issue
Description | | Effective
Yield | | Amount
Payable at
Maturity | | Value | |
| Floating Rate Notes (continued) | |
| Colorado (cont.) | |
County of Pitkin
Refunding Revenue Bonds
Aspen Skiing Co.
VRDN Series 1994B (JP Morgan Chase Bank) AMT(a)(h) | |
| 04/01/14 | | | 0.140 | % | | $ | 5,000,000 | | | $ | 5,000,000 | | |
| Total | | | 9,150,000 | | |
| Florida 0.2% | |
Jacksonville Health Facilities Authority
Revenue Bonds
Southern Baptist Hospital
VRDN Series 2003C (Wells Fargo Bank)(h) | |
| 08/15/33 | | | 0.120 | % | | | 9,000,000 | | | | 9,000,000 | | |
Orange County School Board
Certificate of Participation
Series 2008E VRDN (Wells Fargo Bank)(h) | |
| 08/01/22 | | | 0.120 | % | | | 800,000 | | | | 800,000 | | |
| Total | | | 9,800,000 | | |
| Illinois 0.6% | |
Chicago Board of Education
Unlimited General Obligation Bonds
VRDN Series 2009 (U.S. Bank)(h) | |
| 03/01/31 | | | 0.120 | % | | | 5,000,000 | | | | 5,000,000 | | |
City of Chicago
Unlimited General Obligation Bonds
Series 2003 (JPMorgan Chase Bank)(h) | |
| 01/01/34 | | | 0.120 | % | | | 21,530,000 | | | | 21,530,000 | | |
| Total | | | 26,530,000 | | |
| Iowa 0.1% | |
Iowa Finance Authority
Revenue Bonds
Wahlert High School
VRDN Series 2006 (Wells Fargo Bank)(h) | |
| 03/01/36 | | | 0.150 | % | | | 1,000,000 | | | | 1,000,000 | | |
Iowa Higher Education Loan Authority
Revenue Bonds
Des Moines University Osteopath
Series 2003 (U.S. Bank)(h) | |
| 10/01/33 | | | 0.140 | % | | | 700,000 | | | | 700,000 | | |
Iowa Higher Education Loan Authority
Revenue Bonds
Cornell College
Series 2008 VRDN (JPMorgan Chase Bank)(h)(i) | |
| 10/01/38 | | | 0.200 | % | | | 1,820,000 | | | | 1,820,000 | | |
| Total | | | 3,520,000 | | |
| Kentucky 0.1% | |
County of Christian
Revenue Bonds
Series 2007 VRDN (U.S. Bank)(h) | |
| 04/01/37 | | | 0.100 | % | | | 600,000 | | | | 600,000 | | |
County of Shelby
Revenue Bonds
VRDN Series 2004A (U.S. Bank)(h) | |
| 09/01/34 | | | 0.100 | % | | | 2,030,000 | | | | 2,030,000 | | |
Lexington-Fayette Urban County Airport Board
Revenue Bonds
VRDN Series 2009 (JP Morgan Chase Bank)(h) | |
| 07/01/38 | | | 0.100 | % | | | 2,500,000 | | | | 2,500,000 | | |
| Total | | | 5,130,000 | | |
The Accompanying Notes to Financial Statements are an integral part of this statement.
33
Columbia Tax-Exempt Fund
November 30, 2011
(Percentages represent value of investments compared to net assets)
Issue
Description | | Effective
Yield | | Amount
Payable at
Maturity | | Value | |
| Floating Rate Notes (continued) | |
| Minnesota 0.1% | |
Minneapolis & St. Paul Housing & Redevelopment Authority
Revenue Bonds
Allina Health Systems
VRDN Series 2009B-2 (JP Morgan Chase Bank)(h) | |
| 11/15/35 | | | 0.100 | % | | $ | 1,050,000 | | | $ | 1,050,000 | | |
Minnesota Higher Education Facilities Authority
Revenue Bonds
St. Olaf College
VRDN Series 2002 (Harris)(h) | |
| 10/01/20 | | | 0.150 | % | | | 6,200,000 | | | | 6,200,000 | | |
| Total | | | 7,250,000 | | |
| Missouri —% | |
Missouri Development Finance Board
Revenue Bonds
VRDN Series 2000C (U.S. Bank)(h) | |
| 12/01/20 | | | 0.140 | % | | | 1,000,000 | | | | 1,000,000 | | |
Missouri State Health & Educational Facilities Authority
Revenue Bonds
Bethesda Health Group, Inc.
Series 2009 (U.S. Bank)(h) | |
| 08/01/41 | | | 0.140 | % | | | 595,000 | | | | 595,000 | | |
| Total | | | 1,595,000 | | |
| New Hampshire 0.1% | |
New Hampshire Business Finance Authority
Revenue Bonds
Littleton Regional Hospital
VRDN Series 2007 (TD Banknorth)(h) | |
| 10/01/42 | | | 0.160 | % | | | 3,495,000 | | | | 3,495,000 | | |
| Texas 0.1% | |
Harris County Health Facilities Development Corp.
Revenue Bonds
Baylor College of Medicine
Series 2007 VRDN (Wells Fargo Bank)(h) | |
| 11/15/47 | | | 0.120 | % | | | 3,000,000 | | | | 3,000,000 | | |
| Vermont 0.1% | |
Vermont Educational & Health Buildings Financing Agency(h)
Revenue Bonds
North Country Hospital & Health
VRDN Series 2007A (TD Banknorth) | |
| 10/01/34 | | | 0.120 | % | | | 1,300,000 | | | | 1,300,000 | | |
Northeastern VT Regional Hospital
VRDN Series 2004A (Banknorth) | |
| 10/01/29 | | | 0.120 | % | | | 1,500,000 | | | | 1,500,000 | | |
| Total | | | 2,800,000 | | |
| Wisconsin 0.1% | |
Wisconsin Health & Educational Facilities Authority(h)
Revenue Bonds
Fort Healthcare, Inc.
VRDN Series 2007A (JP Morgan Chase Bank) | |
| 05/01/37 | | | 0.200 | % | | | 3,800,000 | | | | 3,800,000 | | |
Meriter Hospital, Inc.
VRDN Series 2002 (JP Morgan Chase & Co.) | |
| 12/01/32 | | | 0.200 | % | | | 2,450,000 | | | | 2,450,000 | | |
| Total | | | 6,250,000 | | |
Total Floating Rate Notes
(Cost: $78,520,000) | | $ | 78,520,000 | | |
Issue
Description | | Effective
Yield | | Amount
Payable at
Maturity | | Value | |
| Municipal Bonds Held in Trust 0.7% | |
| Massachusetts 0.4% | |
Massachusetts Health & Educational Facilities Authority
Revenue Bonds
Harvard University
Series 2009A(b)(h)(j) | |
| 11/15/36 | | | 5.550 | % | | $ | 16,000,001 | | | $ | 17,970,240 | | |
| North Carolina 0.1% | |
North Carolina Housing Finance Agency
Revenue Bonds
Series 2002R-II-175 AMT(a)(b)(h)(j) | |
| 01/01/34 | | | 5.350 | % | | | 5,250,000 | | | | 5,251,242 | | |
| Texas 0.2% | |
Texas Department of Housing & Community Affairs(a)(b)(h)(j)
Revenue Bonds
Mortgage
Series 2002A (NPFGC) AMT | |
| 03/01/34 | | | 5.550 | % | | | 5,275,000 | | | | 5,282,161 | | |
| Series 2002B (NPFGC) AMT | |
| 09/01/33 | | | 5.550 | % | | | 4,670,000 | | | | 4,676,052 | | |
| Total | | | 9,958,213 | | |
Total Municipal Bonds Held in Trust
(Cost: $32,417,631) | | $ | 33,179,695 | | |
| | | | | Shares | | Value | |
| Money Market Funds 1.5% | |
Dreyfus Tax-Exempt Cash
Management Fund, 0.010%(k), | | | | | | | 30,215,133 | | | $ | 30,215,133 | | |
JP Morgan Municipal Money
Market Fund, 0.000%(k) | | | | | | | 35,702,399 | | | | 35,702,399 | | |
Total Money Market Funds
(Cost: $65,917,532) | | | | | | | | | | $ | 65,917,532 | | |
| | | Coupon
Rate | | Principal
Amount | | Value | |
| Municipal Preferred Stocks 0.2% | |
| Maryland 0.2% | |
Munimae TE Bond Subsidiary LLC(a)(b)(d)
Series 2000B AMT | |
| 06/30/50 | | | 7.750 | % | | $ | 10,000,000 | | | $ | 8,399,700 | | |
| Series 2005C-3 AMT | |
| 11/29/49 | | | 5.500 | % | | | 1,000,000 | | | | 679,950 | | |
| Total | | | 9,079,650 | | |
Total Municipal Preferred Stocks
(Cost: $11,000,000) | | | | | | | | | | $ | 9,079,650 | | |
Total Investments
(Cost: $4,268,364,485) | | | | | | $ | 4,507,872,331 | | |
| Other Assets & Liabilities, Net | | | | | | | 12,086,453 | | |
| Total Net Assets | | $ | 4,519,958,784 | | |
The Accompanying Notes to Financial Statements are an integral part of this statement.
34
Columbia Tax-Exempt Fund
November 30, 2011
| Notes to Portfolio of Investments | |
(a) At November 30, 2011, the value of securities subject to alternative minimum tax was $388,102,097, representing 8.59% of net assets.
(b) Security exempt from registration pursuant to Rule 144A under the Securities Act of 1933. This security may be resold in transactions exempt from registration, normally to qualified institutional buyers. At November 30, 2011, the value of these securities amounted to $86,698,253 or 1.92% of net assets.
(c) Municipal obligations include debt obligations issued by or on behalf of territories, possessions, or sovereign nations within the territorial boundaries of the United States. At November 30, 2011, the value of these securities amounted to $138,181,650 or 3.06% of net assets.
(d) Identifies issues considered to be illiquid as to their marketability. The aggregate value of such securities at November 30, 2011 was $59,309,590, representing 1.31% of net assets. Information concerning such security holdings at November 30, 2011 was as follows:
| Security Description | | Acquisition
Dates | | Cost | |
Boston Industrial Development Financing Authority
Revenue Bonds
Crosstown Center Project
Senior Series 2002 AMT
6.500% 09/01/35 | | 09/20/02 | | $ | 2,810,745 | | |
Broward County Housing Finance Authority
Revenue Bonds
Chaves Lake Apartments Project
Series 2000A AMT
7.500% 07/01/40 | | 03/07/00 | | | 7,880,363 | | |
Cabazon Band Mission Indians
Revenue Bonds
Series 2004
7.358% 10/01/11 | | 05/14/10 | | | 340,476 | | |
Cabazon Band Mission Indians
Revenue Bonds
Series 2004
8.375% 10/01/15 | | 10/04/04-05/14/10 | | | 1,685,007 | | |
Cabazon Band Mission Indians
Revenue Bonds
Series 2004
8.750% 10/01/19 | | 10/04/04-05/14/10 | | | 8,359,351 | | |
Cabazon Band Mission Indians
Revenue Bonds
Series 2010
8.375% 10/01/20 | | 05/14/10 | | | 1,415,000 | | |
Capital Trust Agency
Revenue Bonds
Atlantic Housing Foundation
Subordinated Series 2008B
7.000% 07/15/32 | | 07/23/08 | | | 1,895,000 | | |
Chester County Industrial Development Authority
RHA/Pennsylvania Nursing Home-1st Mortgage
Series 2002
8.500% 05/01/32 | | 05/01/02 | | | 5,572,040 | | |
City of Roseville
Revenue Bonds
Care Institute, Inc. Project
Series 1993
7.750% 11/01/23 | | 11/01/93 | | | 3,275,000 | | |
Colorado Health Facilities Authority
Prerefunded Revenue Bonds
American Housing Foundation I, Inc. Project
Series 2003
8.500% 12/01/31 | | 02/19/03 | | | 794,883 | | |
The Accompanying Notes to Financial Statements are an integral part of this statement.
35
Columbia Tax-Exempt Fund
November 30, 2011
| Notes to Portfolio of Investments (continued) | |
| Security Description | | Acquisition
Dates | | Cost | |
Durham Housing Authority
Revenue Bonds
Series 2005 AMT
5.650% 02/01/38 | | 12/18/06 | | $ | 3,208,912 | | |
Hickory Chase Community Authority
Revenue Bonds
Hickory Chase Project
Series 2008
6.750% 12/01/27 | | 04/23/08 | | | 6,165,000 | | |
Metropolitan Government Nashville & Davidson County
Health & Educational Facilities Board
1st Mortgage-AHF Project
Series 2003
8.500% 01/01/29 | | 12/30/03 | | | 461,126 | | |
Michigan Strategic Fund Refunding
Revenue Bonds
Michigan Sugar Co.-Carollton
Series 1998C AMT
6.550% 11/01/25 | | 11/24/98 | | | 4,250,000 | | |
Middlesex County Improvement Authority
Revenue Bonds
Heldrich Center Hotel
Series 2005C
8.750% 01/01/37 | | 09/25/07 | | | 1,461,135 | | |
Munimae TE Bond Subsidiary LLC
Series 2000B AMT
7.750% 06/30/50 | | 05/30/00 | | | 10,000,000 | | |
Munimae TE Bond Subsidiary LLC
Series 2005C-3 AMT
5.500% 11/29/49 | | 11/02/05 | | | 1,000,000 | | |
Rankin County Five Lakes Utility District
Series 1994
7.000% 07/15/37 | | 10/02/07 | | | 465,000 | | |
Washington County Industrial Development Authority
1st Mortgage
Central Project
Series 2003
8.500% 01/01/29 | | 12/30/03 | | | 2,008,921 | | |
Will-Kankakee Regional Development Authority
Prerefunded Revenue Bonds
Flanders Corp./PrecisionAire
Series 1997 AMT
6.500% 12/15/17 | | 12/30/97 | | | 1,495,000 | | |
Illinois Finance Authority
Revenue Bonds
Sedgebrook, Inc. Facility
Series 2007A
0.000% 11/15/11 | | 08/17/07 | | | 713,670 | | |
Indianapolis Airport Authority
Revenue Bonds
Special Facilities-United Air Lines Project
Series 1995A AMT
0.000% 11/15/31 | | 10/17/95 | | | 1,023,695 | | |
The Accompanying Notes to Financial Statements are an integral part of this statement.
36
Columbia Tax-Exempt Fund
November 30, 2011
| Notes to Portfolio of Investments (continued) | |
| Security Description | | Acquisition
Dates | | Cost | |
Massachusetts Development Finance Agency
Revenue Bonds
Linden Ponds, Inc. Facility
Series 2011B
0.000% 11/15/56 | | 06/04/11 | | $ | 1,346 | | |
Resolution Trust Corp.
Pass-Through Certificates
Series 1993A
8.500% 12/01/16 | | 08/27/93 | | | 6,751,636 | | |
(e) Zero coupon bond.
(g) Represents securities that have defaulted on payment of interest. The Fund has stopped accruing interest on these securities. At November 30, 2011, the value of these securities amounted to $2,845,292, which represents 0.06% of net assets.
(h) Variable rate security. The interest rate shown reflects the rate as of November 30, 2011.
(i) Interest rate varies either based on a predetermined schedule or to reflect current market conditions; rate shown is the effective rate on November 30, 2011. The maturity date disclosed represents the final maturity.
(j) The Fund entered into transactions in which it transfers to trusts fixed rate municipal bonds in exchange for cash and residual interests in the trusts' assets and cash flows, which are in the form of inverse floating rate securities. The trust funds the purchases of the municipal bonds by issuing short-term floating rate notes to third parties, which are included as a Liability in the Fund's Statement of Assets and Liabilities. The Liability approximates fair value. The municipal bonds transferred to the trusts remain in the Fund's Portfolio of Investments.
(k) The rate shown is the seven-day current annualized yield at November 30, 2011.
AGM Assured Guaranty Municipal Corporation
AMBAC Ambac Assurance Corporation
AMT Alternative Minimum Tax
CHF Swiss Franc
FGIC Financial Guaranty Insurance Company
FHA Federal Housing Authority
FHLMC Federal Home Loan Mortgage Corporation
FNMA Federal National Mortgage Association
GNMA Government National Mortgage Association
MGIC Mortgage Guaranty Insurance Corporation
NPFGC National Public Finance Guarantee Corporation
TCRS Transferable Custodial Receipts
VRDN Variable Rate Demand Note
XLCA XL Capital Assurance
Generally accepted accounting principles (GAAP) require disclosure regarding the inputs and valuation techniques used to measure fair value and any changes in valuation inputs or techniques. In addition, investments shall be disclosed by major category.
The Fund categorizes its fair value measurements according to a three-level hierarchy that maximizes the use of observable inputs and minimizes the use of unobservable inputs by prioritizing that the most observable input be used when available. Observable inputs are those that market participants would use in pricing an investment based on market data obtained from sources independent of the reporting entity. Unobservable inputs are those that reflect the Fund's assumptions about the information market participants would use in pricing an investment. An investment's level within the fair value hierarchy is based on the lowest level of any input that is deemed significant to the asset or liability's fair value measurement. The input levels are not necessarily an indication of the risk or liquidity associated with investments at that level. For example, certain U.S. government securities are generally high quality and liquid, however, they are reflected as Level 2 because the inputs used to determine fair value may not always be quoted prices in an active market.
The Accompanying Notes to Financial Statements are an integral part of this statement.
37
Columbia Tax-Exempt Fund
November 30, 2011
| Fair Value Measurements (continued) | |
Fair value inputs are summarized in the three broad levels listed below:
• Level 1 — Valuations based on quoted prices for investments in active markets that the Fund has the ability to access at the measurement date (including NAV for open-end mutual funds). Valuation adjustments are not applied to Level 1 investments.
• Level 2 — Valuations based on other significant observable inputs (including quoted prices for similar securities, interest rates, prepayment speeds, credit risks, etc.).
• Level 3 — Valuations based on significant unobservable inputs (including the Fund's own assumptions and judgment in determining the fair value of investments).
Inputs that are used in determining fair value of an investment may include price information, credit data, volatility statistics, and other factors. These inputs can be either observable or unobservable. The availability of observable inputs can vary between investments, and is affected by various factors such as the type of investment, and the volume and level of activity for that investment or similar investments in the marketplace. The inputs will be considered by the Investment Manager, along with any other relevant factors in the calculation of an investment's fair value. The Fund uses prices and inputs that are current as of the measurement date, which may include periods of market dislocations. During these periods, the availability of prices and inputs may be reduced for many investments. This condition could cause an investment to be reclassified between the various levels within the hierarchy.
Investments falling into the Level 3 category are primarily supported by quoted prices from brokers and dealers participating in the market for those investments. However, these may be classified as Level 3 investments due to lack of market transparency and corroboration to support these quoted prices. Additionally, valuation models may be used as the pricing source for any remaining investments classified as Level 3. These models rely on one or more significant unobservable inputs and/or significant assumptions by the Investment Manager. Inputs used in valuations may include, but are not limited to, financial statement analysis, capital account balances, discount rates and estimated cash flows, and comparable company data.
The following table is a summary of the inputs used to value the Fund's investments as of November 30, 2011:
| | | Fair Value at November 30, 2011 | |
| Description(a) | | Level 1
Quoted Prices
in Active
Markets for
Identical Assets | | Level 2
Other
Significant
Observable
Inputs(b) | | Level 3
Significant
Unobservable
Inputs | | Total | |
| Equity Securities | |
| Municipal Preferred Stocks | | $ | — | | | $ | 9,079,650 | | | $ | — | | | $ | 9,079,650 | | |
| Total Equity Securities | | | — | | | | 9,079,650 | | | | — | | | | 9,079,650 | | |
| Bonds | |
| Municipal Bonds | | | — | | | | 4,321,175,454 | | | | — | | | | 4,321,175,454 | | |
| Municipal Bonds Held in Trust | | | — | | | | 33,179,695 | | | | — | | | | 33,179,695 | | |
| Total Bonds | | | — | | | | 4,354,355,149 | | | | — | | | | 4,354,355,149 | | |
| Short-Term Securities | |
| Floating Rate Notes | | | — | | | | 78,520,000 | | | | — | | | | 78,520,000 | | |
| Total Short-Term Securities | | | — | | | | 78,520,000 | | | | — | | | | 78,520,000 | | |
| Other | |
| Money Market Funds | | | 65,917,532 | | | | — | | | | — | | | | 65,917,532 | | |
| Total Other | | | 65,917,532 | | | | — | | | | — | | | | 65,917,532 | | |
| Total Investments | | $ | 65,917,532 | | | $ | 4,441,954,799 | | | $ | — | | | $ | 4,507,872,331 | | |
The Fund's assets assigned to the Level 2 input category are generally valued using the market approach, in which a security's value is determined through reference to prices and information from market transactions for similar or identical assets.
(a) See the Portfolio of Investments for all investment classifications not indicated in the table.
(b) There were no significant transfers between Levels 1 and 2 during the period.
The Accompanying Notes to Financial Statements are an integral part of this statement.
38
Columbia Tax-Exempt Fund
November 30, 2011
| Fair Value Measurements (continued) | |
The following table is a reconciliation of Level 3 assets for which significant unobservable inputs were used to determine fair value.
| | | Municipal Bonds | |
| Balance as of November 30, 2010 | | $ | 4,759,227 | | |
| Accrued discounts/premiums | | | — | | |
| Realized gain (loss) | | | (5,621,547 | ) | |
| Change in unrealized appreciation (depreciation)** | | | 4,573,273 | | |
| Sales | | | (3,710,953 | ) | |
| Purchases | | | — | | |
| Issuances | | | — | | |
| Settlements | | | — | | |
| Transfers into Level 3 | | | — | | |
| Transfers out of Level 3 | | | — | | |
| Balance as of November 30, 2011 | | $ | — | | |
** Change in unrealized appreciation (depreciation) relating to securities held at November 30, 2011 was $ 0.
Transfers in and/or out of Level 3 are determined based on the fair value at the beginning of the period for security positions held throughout the period.
The Accompanying Notes to Financial Statements are an integral part of this statement.
39
Statement of Assets and Liabilities – Columbia Tax-Exempt Fund
November 30, 2011
| Assets | |
| Investments, at value | | | | | |
| (identified cost $4,268,364,485) | | $ | 4,507,872,331 | | |
| Receivable for: | |
| Investments sold | | | 4,917,003 | | |
| Capital shares sold | | | 12,216,912 | | |
| Interest | | | 64,952,557 | | |
| Trustees' deferred compensation plan | | | 227,923 | | |
| Total assets | | | 4,590,186,726 | | |
| Liabilities | |
| Short-term floating rate notes outstanding | | | 21,145,000 | | |
| Payable for: | |
| Investments purchased | | | 26,545,521 | | |
| Capital shares purchased | | | 5,086,141 | | |
| Dividend distributions to shareholders | | | 15,965,227 | | |
| Investment management fees | | | 45,556 | | |
| Distribution fees | | | 22,416 | | |
| Transfer agent fees | | | 360,349 | | |
| Administration fees | | | 7,213 | | |
| Chief compliance officer expenses | | | 399 | | |
| Compensation of board members | | | 112,988 | | |
| Other expenses | | | 709,209 | | |
| Trustees' deferred compensation plan | | | 227,923 | | |
| Total liabilities | | | 70,227,942 | | |
| Net assets applicable to outstanding capital stock | | $ | 4,519,958,784 | | |
The Accompanying Notes to Financial Statements are an integral part of this statement.
40
Statement of Assets and Liabilities (continued) – Columbia Tax-Exempt Fund
November 30, 2011
| Represented by | |
| Paid-in capital | | $ | 4,381,606,194 | | |
| Undistributed net investment income | | | 10,904,960 | | |
| Accumulated net realized loss | | | (112,060,216 | ) | |
| Unrealized appreciation (depreciation) on: | |
| Investments | | | 239,507,846 | | |
| Total — representing net assets applicable to outstanding capital stock | | $ | 4,519,958,784 | | |
| Net assets applicable to outstanding shares | |
| Class A | | $ | 3,708,743,584 | | |
| Class B | | $ | 12,630,099 | | |
| Class C | | $ | 81,741,547 | | |
| Class Z | | $ | 716,843,554 | | |
| Shares outstanding | |
| Class A | | | 276,144,984 | | |
| Class B | | | 941,007 | | |
| Class C | | | 6,087,176 | | |
| Class Z | | | 53,375,092 | | |
| Net asset value per share | |
| Class A(a) | | $ | 13.43 | | |
| Class B | | $ | 13.42 | | |
| Class C | | $ | 13.43 | | |
| Class Z | | $ | 13.43 | | |
(a) The maximum offering price per share for Class A is $14.10. The offering price is calculated by dividing the net asset value by 1.0 minus the maximum sales charge of 4.75%.
The Accompanying Notes to Financial Statements are an integral part of this statement.
41
Statement of Operations – Columbia Tax-Exempt Fund
Year ended November 30, 2011
| Net investment income | |
| Income: | |
| Dividends | | $ | 34,453 | | |
| Interest | | | 167,146,343 | | |
| Total income | | | 167,180,796 | | |
| Expenses: | |
| Investment management fees | | | 12,644,779 | | |
| Distribution fees | |
| Class B | | | 75,966 | | |
| Class C | | | 424,507 | | |
| Service fees | |
| Class A | | | 4,896,170 | | |
| Class B | | | 20,268 | | |
| Class C | | | 113,222 | | |
| Transfer agent fees | |
| Class A | | | 2,566,476 | | |
| Class B | | | 10,797 | | |
| Class C | | | 62,708 | | |
| Class Z | | | 797,084 | | |
| Administration fees | | | 1,621,818 | | |
| Compensation of board members | | | 57,097 | | |
| Pricing and bookkeeping fees | | | 86,802 | | |
| Custodian fees | | | 45,349 | | |
| Printing and postage fees | | | 148,531 | | |
| Registration fees | | | 72,992 | | |
| Professional fees | | | 115,371 | | |
| Interest expense — inverse floating rate notes | | | 79,499 | | |
| Interest expense — line of credit | | | 148 | | |
| Chief compliance officer expenses | | | 2,314 | | |
| Other | | | 181,087 | | |
| Total expenses | | | 24,022,985 | | |
| Fees waived or expenses reimbursed by Investment Manager and its affiliates | | | (575,239 | ) | |
| Interest expense reimbursement by Investment Manager | | | (148 | ) | |
| Fees waived by Distributor — Class C | | | (84,839 | ) | |
| Expense reductions | | | (8,094 | ) | |
| Total net expenses | | | 23,354,665 | | |
| Net investment income | | | 143,826,131 | | |
| Realized and unrealized gain (loss) — net | |
| Net realized gain (loss) on: | |
| Investments | | | (8,172,164 | ) | |
| Futures contracts | | | (1,646,050 | ) | |
| Net realized loss | | | (9,818,214 | ) | |
| Net change in unrealized appreciation (depreciation) on: | |
| Investments | | | 106,690,130 | | |
| Net change in unrealized appreciation | | | 106,690,130 | | |
| Net realized and unrealized gain | | | 96,871,916 | | |
| Net increase in net assets resulting from operations | | $ | 240,698,047 | | |
The Accompanying Notes to Financial Statements are an integral part of this statement.
42
Statement of Changes in Net Assets – Columbia Tax-Exempt Fund
| Year ended November 30, | | 2011 | | 2010 | |
| Operations | |
| Net investment income | | $ | 143,826,131 | | | $ | 100,380,903 | | |
| Net realized gain (loss) | | | (9,818,214 | ) | | | 23,322,707 | | |
| Net change in unrealized appreciation (depreciation) | | | 106,690,130 | | | | (8,982,008 | ) | |
| Net increase in net assets resulting from operations | | | 240,698,047 | | | | 114,721,602 | | |
| Distributions to shareholders from: | |
| Net investment income | |
| Class A | | | (109,526,581 | ) | | | (59,546,856 | ) | |
| Class B | | | (376,116 | ) | | | (351,849 | ) | |
| Class C | | | (2,194,051 | ) | | | (1,387,776 | ) | |
| Class Z | | | (33,366,448 | ) | | | (38,237,268 | ) | |
| Total distributions to shareholders | | | (145,463,196 | ) | | | (99,523,749 | ) | |
| Increase (decrease) in net assets from share transactions | | | 2,281,307,620 | | | | (115,047,540 | ) | |
| Proceeds from regulatory settlements (Note 6) | | | — | | | | 19,753 | | |
| Total increase (decrease) in net assets | | | 2,376,542,471 | | | | (99,829,934 | ) | |
| Net assets at beginning of year | | | 2,143,416,313 | | | | 2,243,246,247 | | |
| Net assets at end of year | | $ | 4,519,958,784 | | | $ | 2,143,416,313 | | |
| Undistributed net investment income | | $ | 10,904,960 | | | $ | 8,356,194 | | |
The Accompanying Notes to Financial Statements are an integral part of this statement.
43
Statement of Changes in Net Assets (continued) – Columbia Tax-Exempt Fund
| Year ended November 30, | | 2011 | | 2010 | |
| | | Shares | | Dollars ($) | | Shares | | Dollars ($) | |
| Capital stock activity | |
| Class A shares | |
| Subscriptions | | | 6,323,418 | | | | 83,458,835 | | | | 3,085,001 | | | | 41,173,657 | | |
| Fund merger | | | 190,123,507 | | | | 2,497,521,878 | | | | — | | | | — | | |
| Distributions reinvested | | | 6,053,123 | | | | 79,801,662 | | | | 3,170,799 | | | | 42,260,626 | | |
| Redemptions | | | (25,833,279 | ) | | | (338,087,704 | ) | | | (11,207,263 | ) | | | (149,201,003 | ) | |
| Net increase (decrease) | | | 176,666,769 | | | | 2,322,694,671 | | | | (4,951,463 | ) | | | (65,766,720 | ) | |
| Class B shares | |
| Subscriptions | | | 24,424 | | | | 324,482 | | | | 15,355 | | | | 204,468 | | |
| Fund merger | | | 1,348,328 | | | | 17,698,627 | | | | — | | | | — | | |
| Distributions reinvested | | | 19,494 | | | | 256,930 | | | | 14,784 | | | | 196,559 | | |
| Redemptions | | | (970,488 | ) | | | (12,716,353 | ) | | | (489,987 | ) | | | (6,520,004 | ) | |
| Net increase (decrease) | | | 421,758 | | | | 5,563,686 | | | | (459,848 | ) | | | (6,118,977 | ) | |
| Class C shares | |
| Subscriptions | | | 641,064 | | | | 8,476,571 | | | | 641,984 | | | | 8,576,510 | | |
| Fund merger | | | 3,452,081 | | | | 45,338,027 | | | | — | | | | — | | |
| Distributions reinvested | | | 100,543 | | | | 1,325,678 | | | | 50,282 | | | | 670,608 | | |
| Redemptions | | | (953,671 | ) | | | (12,399,708 | ) | | | (457,045 | ) | | | (6,102,688 | ) | |
| Net increase | | | 3,240,017 | | | | 42,740,568 | | | | 235,221 | | | | 3,144,430 | | |
| Class Z shares | |
| Subscriptions | | | 4,272,588 | | | | 55,792,716 | | | | 5,904,278 | | | | 78,403,006 | | |
| Distributions reinvested | | | 632,731 | | | | 8,244,270 | | | | 666,949 | | | | 8,890,492 | | |
| Redemptions | | | (11,959,938 | ) | | | (153,728,291 | ) | | | (10,050,193 | ) | | | (133,599,771 | ) | |
| Net decrease | | | (7,054,619 | ) | | | (89,691,305 | ) | | | (3,478,966 | ) | | | (46,306,273 | ) | |
| Total net increase (decrease) | | | 173,273,925 | | | | 2,281,307,620 | | | | (8,655,056 | ) | | | (115,047,540 | ) | |
The Accompanying Notes to Financial Statements are an integral part of this statement.
44
Financial Highlights – Columbia Tax-Exempt Fund
The following tables are intended to help you understand the Fund's financial performance. Certain information reflects financial results for a single share of a class held for the periods shown. Per share net investment income (loss) amounts are calculated based on average shares outstanding during the period. Total returns assume reinvestment of all dividends and distributions. Total returns do not reflect payment of sales charges, if any, and are not annualized for periods of less than one year.
| | | Year ended Nov. 30, | |
| | | 2011 | | 2010 | | 2009 | | 2008 | | 2007 | |
| Class A | |
| Per share data | |
| Net asset value, beginning of period | | $ | 13.13 | | | $ | 13.05 | | | $ | 11.95 | | | $ | 13.52 | | | $ | 13.88 | | |
| Income from investment operations: | |
| Net investment income | | | 0.58 | | | | 0.59 | | | | 0.60 | | | | 0.59 | | | | 0.60 | | |
| Net realized and unrealized gain (loss) | | | 0.31 | | | | 0.08 | | | | 1.09 | | | | (1.57 | ) | | | (0.37 | ) | |
| Total from investment operations | | | 0.89 | | | | 0.67 | | | | 1.69 | | | | (0.98 | ) | | | 0.23 | | |
| Less distributions to shareholders from: | |
| Net investment income | | | (0.59 | ) | | | (0.59 | ) | | | (0.59 | ) | | | (0.59 | ) | | | (0.59 | ) | |
| Total distributions to shareholders | | | (0.59 | ) | | | (0.59 | ) | | | (0.59 | ) | | | (0.59 | ) | | | (0.59 | ) | |
| Proceeds from regulatory settlement | | | — | | | | 0.00 | (a) | | | — | | | | — | | | | — | | |
| Net asset value, end of period | | $ | 13.43 | | | $ | 13.13 | | | $ | 13.05 | | | $ | 11.95 | | | $ | 13.52 | | |
| Total return | | | 7.00 | % | | | 5.12 | % | | | 14.42 | % | | | (7.48 | %) | | | 1.74 | % | |
| Ratios to average net assets(b) | |
Expenses prior to fees waived or expenses reimbursed
(including interest and fee expense)(c) | | | 0.76 | % | | | 0.80 | % | | | 0.80 | % | | | 0.80 | % | | | 0.82 | % | |
Net expenses after fees waived or expenses reimbursed
(including interest and fee expense)(c)(e) | | | 0.75 | %(d) | | | 0.80 | %(d) | | | 0.80 | %(d) | | | 0.80 | %(d) | | | 0.82 | %(d) | |
Expenses prior to fees waived or expenses reimbursed
(excluding interest and fee expense) | | | 0.76 | % | | | 0.80 | % | | | 0.80 | % | | | 0.78 | % | | | 0.78 | % | |
Net expenses after fees waived or expenses reimbursed
(excluding interest and fee expense)(e) | | | 0.75 | %(d) | | | 0.80 | %(d) | | | 0.80 | %(d) | | | 0.78 | %(d) | | | 0.78 | %(d) | |
| Net investment income | | | 4.41 | %(d) | | | 4.43 | %(d) | | | 4.73 | %(d) | | | 4.56 | %(d) | | | 4.40 | %(d) | |
| Supplemental data | |
| Net assets, end of period (in thousands) | | $ | 3,708,744 | | | $ | 1,305,921 | | | $ | 1,362,545 | | | $ | 1,296,698 | | | $ | 1,533,614 | | |
| Portfolio turnover | | | 11 | % | | | 11 | % | | | 12 | % | | | 14 | % | | | 13 | % | |
| Notes to Financial Highlights | |
(a) Rounds to less than $0.01.
(b) In addition to the fees and expenses which the Fund bears directly, the Fund indirectly bears a pro rata share of the fees and expenses of the acquired funds in which it invests. Such indirect expenses are not included in the reported expense ratios.
(c) Ratios include interest and fee expense related to the Fund's participation in certain inverse floater programs, if any. Due to an equal increase in interest income from fixed rate municipal bonds held in trust, there is no impact on the Fund's net assets, net asset value per share, total return or net investment income.
(d) The benefits derived from expense reductions had an impact of less than 0.01%.
(e) The Investment Manager and certain of its affiliates agreed to waive/reimburse certain fees and expenses, if applicable.
The Accompanying Notes to Financial Statements are an integral part of this statement.
45
Financial Highlights (continued) – Columbia Tax-Exempt Fund
| | | Year ended Nov. 30, | |
| | | 2011 | | 2010 | | 2009 | | 2008 | | 2007 | |
| Class B | |
| Per share data | |
| Net asset value, beginning of period | | $ | 13.13 | | | $ | 13.05 | | | $ | 11.95 | | | $ | 13.52 | | | $ | 13.88 | | |
| Income from investment operations: | |
| Net investment income | | | 0.48 | | | | 0.49 | | | | 0.50 | | | | 0.50 | | | | 0.50 | | |
| Net realized and unrealized gain (loss) | | | 0.30 | | | | 0.08 | | | | 1.10 | | | | (1.58 | ) | | | (0.37 | ) | |
| Total from investment operations | | | 0.78 | | | | 0.57 | | | | 1.60 | | | | (1.08 | ) | | | 0.13 | | |
| Less distributions to shareholders from: | |
| Net investment income | | | (0.49 | ) | | | (0.49 | ) | | | (0.50 | ) | | | (0.49 | ) | | | (0.49 | ) | |
| Total distributions to shareholders | | | (0.49 | ) | | | (0.49 | ) | | | (0.50 | ) | | | (0.49 | ) | | | (0.49 | ) | |
| Proceeds from regulatory settlement | | | — | | | | 0.00 | (a) | | | — | | | | — | | | | — | | |
| Net asset value, end of period | | $ | 13.42 | | | $ | 13.13 | | | $ | 13.05 | | | $ | 11.95 | | | $ | 13.52 | | |
| Total return | | | 6.12 | % | | | 4.34 | % | | | 13.57 | % | | | (8.17 | %) | | | 0.98 | % | |
| Ratios to average net assets(b) | |
Expenses prior to fees waived or expenses reimbursed
(including interest and fee expense)(c) | | | 1.51 | % | | | 1.55 | % | | | 1.55 | % | | | 1.55 | % | | | 1.57 | % | |
Net expenses after fees waived or expenses reimbursed
(including interest and fee expense)(c)(e) | | | 1.50 | %(d) | | | 1.55 | %(d) | | | 1.55 | %(d) | | | 1.55 | %(d) | | | 1.57 | %(d) | |
Expenses prior to fees waived or expenses reimbursed
(excluding interest and fee expense) | | | 1.51 | % | | | 1.55 | % | | | 1.55 | % | | | 1.53 | % | | | 1.53 | % | |
Net expenses after fees waived or expenses reimbursed
(excluding interest and fee expense)(e) | | | 1.50 | %(d) | | | 1.55 | %(d) | | | 1.55 | %(d) | | | 1.53 | %(d) | | | 1.53 | %(d) | |
| Net investment income | | | 3.65 | %(d) | | | 3.69 | %(d) | | | 4.00 | %(d) | | | 3.81 | %(d) | | | 3.65 | %(d) | |
| Supplemental data | |
| Net assets, end of period (in thousands) | | $ | 12,630 | | | $ | 6,817 | | | $ | 12,775 | | | $ | 17,816 | | | $ | 27,047 | | |
| Portfolio turnover | | | 11 | % | | | 11 | % | | | 12 | % | | | 14 | % | | | 13 | % | |
| Notes to Financial Highlights | |
(a) Rounds to less than $0.01.
(b) In addition to the fees and expenses which the Fund bears directly, the Fund indirectly bears a pro rata share of the fees and expenses of the acquired funds in which it invests. Such indirect expenses are not included in the reported expense ratios.
(c) Ratios include interest and fee expense related to the Fund's participation in certain inverse floater programs, if any. Due to an equal increase in interest income from fixed rate municipal bonds held in trust, there is no impact on the Fund's net assets, net asset value per share, total return or net investment income.
(d) The benefits derived from expense reductions had an impact of less than 0.01%.
(e) The Investment Manager and certain of its affiliates agreed to waive/reimburse certain fees and expenses, if applicable.
The Accompanying Notes to Financial Statements are an integral part of this statement.
46
Financial Highlights (continued) – Columbia Tax-Exempt Fund
| | | Year ended Nov. 30, | |
| | | 2011 | | 2010 | | 2009 | | 2008 | | 2007 | |
| Class C | |
| Per share data | |
| Net asset value, beginning of period | | $ | 13.13 | | | $ | 13.05 | | | $ | 11.95 | | | $ | 13.52 | | | $ | 13.88 | | |
| Income from investment operations: | |
| Net investment income | | | 0.50 | | | | 0.51 | | | | 0.52 | | | | 0.51 | | | | 0.51 | | |
| Net realized and unrealized gain (loss) | | | 0.31 | | | | 0.08 | | | | 1.09 | | | | (1.57 | ) | | | (0.36 | ) | |
| Total from investment operations | | | 0.81 | | | | 0.59 | | | | 1.61 | | | | (1.06 | ) | | | 0.15 | | |
| Less distributions to shareholders from: | |
| Net investment income | | | (0.51 | ) | | | (0.51 | ) | | | (0.51 | ) | | | (0.51 | ) | | | (0.51 | ) | |
| Total distributions to shareholders | | | (0.51 | ) | | | (0.51 | ) | | | (0.51 | ) | | | (0.51 | ) | | | (0.51 | ) | |
| Proceeds from regulatory settlement | | | — | | | | 0.00 | (a) | | | — | | | | — | | | | — | | |
| Net asset value, end of period | | $ | 13.43 | | | $ | 13.13 | | | $ | 13.05 | | | $ | 11.95 | | | $ | 13.52 | | |
| Total return | | | 6.36 | % | | | 4.49 | % | | | 13.74 | % | | | (8.05 | %) | | | 1.13 | % | |
| Ratios to average net assets(b) | |
Expenses prior to fees waived or expenses reimbursed
(including interest and fee expense)(c) | | | 1.52 | % | | | 1.40 | % | | | 1.40 | % | | | 1.55 | % | | | 1.57 | % | |
Net expenses after fees waived or expenses reimbursed
(including interest and fee expense)(c)(e) | | | 1.36 | %(d) | | | 1.25 | %(d) | | | 1.25 | %(d) | | | 1.40 | %(d) | | | 1.42 | %(d) | |
Expenses prior to fees waived or expenses reimbursed
(excluding interest and fee expense) | | | 1.52 | % | | | 1.40 | % | | | 1.40 | % | | | 1.53 | % | | | 1.53 | % | |
Net expenses after fees waived or expenses reimbursed
(excluding interest and fee expense)(e) | | | 1.36 | %(d) | | | 1.25 | %(d) | | | 1.25 | %(d) | | | 1.38 | %(d) | | | 1.38 | %(d) | |
| Net investment income | | | 3.82 | %(d) | | | 3.83 | %(d) | | | 4.11 | %(d) | | | 3.95 | %(d) | | | 3.78 | %(d) | |
| Supplemental data | |
| Net assets, end of period (in thousands) | | $ | 81,742 | | | $ | 37,377 | | | $ | 34,079 | | | $ | 25,023 | | | $ | 22,650 | | |
| Portfolio turnover | | | 11 | % | | | 11 | % | | | 12 | % | | | 14 | % | | | 13 | % | |
| Notes to Financial Highlights | |
(a) Rounds to less than $0.01.
(b) In addition to the fees and expenses which the Fund bears directly, the Fund indirectly bears a pro rata share of the fees and expenses of the acquired funds in which it invests. Such indirect expenses are not included in the reported expense ratios.
(c) Ratios include interest and fee expense related to the Fund's participation in certain inverse floater programs, if any. Due to an equal increase in interest income from fixed rate municipal bonds held in trust, there is no impact on the Fund's net assets, net asset value per share, total return or net investment income.
(d) The benefits derived from expense reductions had an impact of less than 0.01%.
(e) The Investment Manager and certain of its affiliates agreed to waive/reimburse certain fees and expenses, if applicable.
The Accompanying Notes to Financial Statements are an integral part of this statement.
47
Financial Highlights (continued) – Columbia Tax-Exempt Fund
| | | Year ended Nov. 30, | |
| | | 2011 | | 2010 | | 2009 | | 2008 | | 2007 | |
| Class Z | |
| Per share data | |
| Net asset value, beginning of period | | $ | 13.13 | | | $ | 13.05 | | | $ | 11.95 | | | $ | 13.52 | | | $ | 13.88 | | |
| Income from investment operations: | |
| Net investment income | | | 0.61 | | | | 0.62 | | | | 0.62 | | | | 0.62 | | | | 0.62 | | |
| Net realized and unrealized gain (loss) | | | 0.30 | | | | 0.07 | | | | 1.10 | | | | (1.58 | ) | | | (0.36 | ) | |
| Total from investment operations | | | 0.91 | | | | 0.69 | | | | 1.72 | | | | (0.96 | ) | | | 0.26 | | |
| Less distributions to shareholders from: | |
| Net investment income | | | (0.61 | ) | | | (0.61 | ) | | | (0.62 | ) | | | (0.61 | ) | | | (0.62 | ) | |
| Total distributions to shareholders | | | (0.61 | ) | | | (0.61 | ) | | | (0.62 | ) | | | (0.61 | ) | | | (0.62 | ) | |
| Proceeds from regulatory settlement | | | — | | | | 0.00 | (a) | | | — | | | | — | | | | — | | |
| Net asset value, end of period | | $ | 13.43 | | | $ | 13.13 | | | $ | 13.05 | | | $ | 11.95 | | | $ | 13.52 | | |
| Total return | | | 7.16 | % | | | 5.33 | % | | | 14.64 | % | | | (7.30 | %) | | | 1.94 | % | |
| Ratios to average net assets(b) | |
Expenses prior to fees waived or expenses reimbursed
(including interest and fee expense)(c) | | | 0.59 | % | | | 0.60 | % | | | 0.60 | % | | | 0.60 | % | | | 0.62 | % | |
Net expenses after fees waived or expenses reimbursed
(including interest and fee expense)(c)(e) | | | 0.56 | %(d) | | | 0.60 | %(d) | | | 0.60 | %(d) | | | 0.60 | %(d) | | | 0.62 | %(d) | |
Expenses prior to fees waived or expenses reimbursed
(excluding interest and fee expense) | | | 0.59 | % | | | 0.60 | % | | | 0.60 | % | | | 0.58 | % | | | 0.58 | % | |
Net expenses after fees waived or expenses reimbursed
(excluding interest and fee expense)(e) | | | 0.56 | %(d) | | | 0.60 | %(d) | | | 0.60 | %(d) | | | 0.58 | %(d) | | | 0.58 | %(d) | |
| Net investment income | | | 4.68 | %(d) | | | 4.63 | %(d) | | | 4.93 | %(d) | | | 4.76 | %(d) | | | 4.59 | %(d) | |
| Supplemental data | |
| Net assets, end of period (in thousands) | | $ | 716,844 | | | $ | 793,302 | | | $ | 833,847 | | | $ | 814,018 | | | $ | 884,741 | | |
| Portfolio turnover | | | 11 | % | | | 11 | % | | | 12 | % | | | 14 | % | | | 13 | % | |
| Notes to Financial Highlights | |
(a) Rounds to less than $0.01.
(b) In addition to the fees and expenses which the Fund bears directly, the Fund indirectly bears a pro rata share of the fees and expenses of the acquired funds in which it invests. Such indirect expenses are not included in the reported expense ratios.
(c) Ratios include interest and fee expense related to the Fund's participation in certain inverse floater programs, if any. Due to an equal increase in interest income from fixed rate municipal bonds held in trust, there is no impact on the Fund's net assets, net asset value per share, total return or net investment income.
(d) The benefits derived from expense reductions had an impact of less than 0.01%.
(e) The Investment Manager and certain of its affiliates agreed to waive/reimburse certain fees and expenses, if applicable.
The Accompanying Notes to Financial Statements are an integral part of this statement.
48
Notes to Financial Statements – Columbia Tax-Exempt Fund
November 30, 2011
Note 1. Organization
Columbia Tax-Exempt Fund (the Fund), a series of Columbia Funds Series Trust I (the Trust), is a diversified fund. The Trust is registered under the Investment Company Act of 1940, as amended (the 1940 Act), as an open-end management investment company organized as a Massachusetts business trust.
Fund Shares
The Trust may issue an unlimited number of shares (without par value). The Fund offers Class A, Class B, Class C and Class Z shares. All share classes have identical voting, dividend and liquidation rights. Each share class has its own expense structure and sales charges, as applicable.
Class A shares are subject to a maximum front-end sales charge of 4.75% based on the initial investment amount. Class A shares purchased without an initial sales charge in accounts aggregating $1 million to $50 million at the time of purchase are subject to a contingent deferred sales charge (CDSC) if the shares are sold within 18 months of purchase, charged as follows: 1.00% CDSC if redeemed within 12 months of purchase, and 0.50% CDSC if redeemed more than 12, but less than 18, months after purchase.
Class B shares may be subject to a maximum CDSC of 5.00% based upon the holding period after purchase. Class B shares will generally convert to Class A shares eight years after purchase. The Fund no longer accepts investments by new or existing investors in the Fund's Class B shares, except in connection with the reinvestment of any dividend and/or capital gain distributions in Class B shares of the Fund and exchanges by existing Class B shareholders of certain other funds within the Columbia Family of Funds.
Class C shares are subject to a 1.00% CDSC on shares redeemed within one year of purchase.
Class Z shares are not subject to sales charges, and are only available to certain investors, as described in the Fund's prospectus.
Note 2. Summary of Significant Accounting Policies
Use of Estimates
The preparation of financial statements in accordance with U.S. generally accepted accounting principles (GAAP) requires management to make certain estimates and assumptions that affect the reported amounts of assets and liabilities, the disclosure of contingent assets and liabilities at the date of the financial statements and the reported amounts of revenue and expenses during the reporting period. Actual results could differ from those estimates.
The following is a summary of significant accounting policies consistently followed by the Fund in the preparation of its financial statements.
Security Valuation
Debt securities generally are valued by pricing services approved by the Board of Trustees (the Board) based upon market transactions for normal, institutional-size trading units of similar securities. The services may use various pricing techniques which take into account appropriate factors such as yield, quality, coupon rate, maturity, type of issue, trading characteristics and other data, as well as broker quotes. Debt securities for which quotations are readily available may also be valued based upon an over-the-counter or exchange bid quotation.
Investments in other open-end investment companies, including money market funds, are valued at net asset value.
Short-term securities purchased within 60 days to maturity are valued at amortized cost, which approximates market value. The value of short-term securities originally purchased with maturities greater than 60 days is determined based on an amortized value to par upon reaching 60 days to maturity. Short-term securities maturing in more than 60 days from the valuation date are valued at the market price or approximate market value based on current interest rates.
Futures and options on futures contracts are valued based upon the settlement price established each day by the board of trade or exchange on which they are traded.
Investments for which market quotations are not readily available, or that have quotations which management believes are not reliable, are valued at fair value as determined in good faith under consistently applied procedures established by and under the general supervision of the Board. If a security or class of securities (such as foreign securities) is valued at fair value, such value is likely to be different from the last quoted market price for the security. The determination of fair value often requires significant judgment. To determine fair value,
49
Columbia Tax-Exempt Fund, November 30, 2011
management may use assumptions including but not limited to future cash flows and estimated risk premiums. Multiple inputs from various sources may be used to determine value.
Derivative Instruments
The Fund invests in certain derivative instruments as detailed below to meet its investment objectives. Derivatives are instruments whose values depend on, or are derived from, in whole or in part, the value of one or more other assets, such as securities, currencies, commodities or indices. Derivative instruments may be used to maintain cash reserves while maintaining exposure to certain other assets, to offset anticipated declines in values of investments, to facilitate trading, to reduce transaction costs and to pursue higher investment returns. The Fund may also use derivative instruments to mitigate certain investment risks, such as foreign currency exchange rate risk, interest rate risk and credit risk. Derivatives may involve various risks, including the potential inability of the counterparty to fulfill its obligation under the terms of the contract, the potential for an illiquid secondary market and the potential for market movements which may expose the Fund to gains or losses in excess of the amount shown in the Statement of Assets and Liabilities.
The Fund and any counterparty are required to maintain an agreement that requires the Fund and that counterparty to monitor (on a daily basis) the net fair value of all derivatives entered into pursuant to the agreement between the Fund and such counterparty. If the net fair value of such derivatives between the Fund and that counterparty exceeds a certain threshold (as defined in the agreement), the Fund or the counterparty (as the case may be) is required to post cash and/or securities as collateral. Fair values of derivatives presented in the financial statements are not netted with the fair value of other derivatives or with any collateral amounts posted by the Fund or any counterparty.
Futures Contracts
Futures contracts represent commitments for the future purchase or sale of an asset at a specified price on a specified date. The Fund bought and sold futures contracts to produce incremental earnings, manage the duration and yield curve exposure of the Fund versus the benchmark and manage exposure to movements in interest rates. Upon entering into futures contracts, the Fund bears risks which may include interest rates, exchange rates or securities prices moving unexpectedly, in which case, the Fund may not achieve the anticipated benefits of the futures contracts and may realize a loss. Additional risks include counterparty credit risk, the possibility of an illiquid market, and that a change in the value of the contract or option may not correlate with changes in the value of the underlying asset.
Upon entering into a futures contract, the Fund pledges cash or securities with the broker in an amount sufficient to meet the initial margin requirement. Subsequent payments (variation margin) are made or received by the Fund each day. The variation margin payments are equal to the daily change in the contract value and are recorded as variation margin receivable or payable and are offset in unrealized gains or losses. The Fund recognizes a realized gain or loss when the contract is closed or expires. Futures contracts involve, to varying degrees, risk of loss in excess of the variation margin disclosed in the Statement of Assets and Liabilities.
Effects of Derivative Transactions in the Financial Statements
The following tables are intended to provide additional information about the effect of derivatives on the financial statements of the Fund including: the fair value of derivatives by risk category and the location of those fair values in the Statement of Assets and Liabilities; the impact of derivative transactions on the Fund's operations over the period including realized gains or losses and unrealized gains or losses. The derivative schedules following the Portfolio of Investments present additional information regarding derivative instruments outstanding at the end of the period, if any.
Fair Values of Derivative Instruments at
November 30, 2011
At November 30, 2011, the fund had no outstanding derivatives.
Effect of Derivative Instruments in the Statement of
Operations for the Year Ended November 30, 2011
Amount of Realized Gain (Loss) on Derivatives Recognized in Income
| Risk Exposure Category | | Futures Contracts | |
| Interest rate contracts | | $ | (1,646,050 | ) | |
50
Columbia Tax-Exempt Fund, November 30, 2011
Change in Unrealized Appreciation (Depreciation) on Derivatives Recognized in Income
| Risk Exposure Category | | Futures Contracts | |
| Interest rate contracts | | $ | — | | |
Volume of Derivative Instruments for the Year Ended
November 30, 2011
| | | Contracts Opened | |
| Futures Contracts | | | 545 | | |
Delayed Delivery Securities
The Fund may trade securities on other than normal settlement terms, including securities purchased or sold on a "when-issued" basis. This may increase the risk if the other party to the transaction fails to deliver and causes the Fund to subsequently invest at less advantageous prices. The Fund identifies within its Portfolio of Investments cash or liquid securities in an amount equal to the delayed delivery commitment.
Inverse Floater Program Transactions
The Fund may enter into transactions in which it transfers to trusts fixed rate municipal bonds in exchange for cash and residual interests in the trusts' assets and cash flows, which are in the form of inverse floating rate securities. The trusts fund the purchases of the municipal bonds by issuing short-term floating rate notes to third parties. The residual interests held by the Fund (inverse floating rate securities) include the right of the Fund (i) to cause the holders of the short-term floating rate notes to tender their notes at par, and (ii) to transfer the municipal bonds from the trusts to the Fund, thereby collapsing the trusts. Accordingly, the municipal bonds transferred to the trusts, remain in the Fund's investments in securities and the related short-term floating rate notes are reflected as Fund liabilities under the caption "Short-term floating rate notes outstanding" in the Statement of Assets and Liabilities. The liability approximates the fair value of the short-term notes. The notes issued by the trusts have interest rates that are multi-modal, which means that they can be reset to a new or different mode at the reset date (e.g., mode can be daily, weekly, monthly, or a fixed specific date) at the discretion of the holder of the inverse floating rate security. The floating rate note holders have the option to tender their notes to the trusts for redemption at par at each reset date. The income received by the inverse floating rate security holder varies inversely with the short-term rate paid to the floating rate note holders, and in most circumstances the inverse floating rate security holder bears substantially all of the underlying bond's downside investment risk and also benefits disproportionately from any potential appreciation of the underlying bond's value. The inverse floating rate security holder will be subject to greater interest rate risk than if they were to hold the underlying bond because the interest rate is dependent on both the fixed coupon rate of the underlying bond and the short-term interest rate paid on the floating rate notes. The inverse floating rate security holder is also subject to the credit risk, liquidity risk and market risk associated with the underlying bond. The bonds held by the trusts serve as collateral for the short-term floating rate notes outstanding. Contractual maturities and interest rates of the municipal bonds held in trusts at November 30, 2011 are presented in the Portfolio of Investments. Interest and fee expense related to the short-term floating rate notes, which is accrued daily, is presented in the Statement of Operations and corresponds to an equal increase in interest income from the fixed rate municipal bonds held in trust. For the year ended November 30, 2011, the average value of short-term floating rate notes outstanding was $10,652,339 and the average interest rate and fees related to these short-term floating rate notes was 0.75%.
Security Transactions
Security transactions are accounted for on the trade date. Cost is determined and gains (losses) are based upon the specific identification method for both financial statement and federal income tax purposes.
Income Recognition
Interest income is recorded on the accrual basis. Market premium and discount are amortized and accreted, respectively, on all debt securities, unless otherwise noted. Original issue discount is accreted to interest income over the life of the security with a corresponding increase in the cost basis, if any.
Expenses
General expenses of the Trust are allocated to the Fund and other funds of the Trust based upon relative net assets or other expense allocation methodologies determined by the nature of
51
Columbia Tax-Exempt Fund, November 30, 2011
the expense. Expenses directly attributable to the Fund are charged to the Fund. Expenses directly attributable to a specific class of shares are charged to that share class.
Determination of Class Net Asset Value
All income, expenses (other than class-specific expenses, which are charged to that share class, as shown in the Statement of Operations) and realized and unrealized gains (losses) are allocated to each class of the Fund on a daily basis for purposes of determining the net asset value of each class. Income and expenses are allocated to each class based on the settled shares method, while realized and unrealized gains (losses) are allocated based on the relative net assets of each class.
Federal Income Tax Status
The Fund intends to qualify each year as a regulated investment company under Subchapter M of the Internal Revenue Code, as amended, and will distribute substantially all of its tax exempt or taxable income (including net short-term capital gains), if any, for its tax year, and as such will not be subject to federal income taxes. In addition, the Fund intends to distribute in each calendar year substantially all of its net investment income, capital gains and certain other amounts, if any, such that the Fund should not be subject to federal excise tax. Therefore, no federal income or excise tax provision is recorded.
Distributions to Shareholders
Distributions from net investment income are declared daily and paid monthly. Net realized capital gains, if any, are distributed at least annually. Income distributions and capital gain distributions are determined in accordance with federal income tax regulations which may differ from GAAP.
Guarantees and Indemnifications
Under the Trust's organizational documents and, in some cases, by contract, its officers and trustees are indemnified against certain liabilities arising out of the performance of their duties to the Trust or its funds. In addition, certain of the Fund's contracts with its service providers contain general indemnification clauses. The Fund's maximum exposure under these arrangements is unknown since the amount of any future claims that may be made against the Fund cannot be determined, and the Fund has no historical basis for predicting the likelihood of any such claims.
Recent Accounting Pronouncement
Fair Value Measurements and Disclosures
In May 2011, the Financial Accounting and Standards Board issued ASU No. 2011-04 modifying Topic 820, Fair Value Measurements and Disclosures. At the same time, the International Accounting Standards Board issued International Financial Reporting Standard 13, Fair Value Measurement. The objective of the FASB and IASB is convergence of their guidance on fair value measurements and disclosures.
Specifically, ASU No. 2011-04 requires reporting entities to disclose i) the amounts of any transfers between Level 1 and Level 2, and the reasons for the transfers, ii) for Level 3 fair value measurements, a) quantitative information about significant unobservable inputs used, b) a description of the valuation processes used by the reporting entity and c) a narrative description of the sensitivity of the fair value measurement to changes in unobservable inputs if a change in those inputs might result in a significantly higher or lower fair value measurement. The effective date of ASU No. 2011-04 is for interim and annual periods beginning after December 15, 2011. At this time, management is evaluating the implications of this guidance and the impact it will have on the financial statement amounts and footnote disclosures, if any.
Note 3. Fees and Compensation Paid to Affiliates
Investment Management Fees
Under an Investment Management Services Agreement (IMSA), Columbia Management Investment Advisers, LLC (the Investment Manager), a wholly-owned subsidiary of Ameriprise Financial, Inc. (Ameriprise Financial), determines which securities will be purchased, held or sold. Effective March 1, 2011, the management fee is an annual fee that is equal to a percentage of the Fund's average daily net assets that declines from 0.41% to 0.25% as the Fund's net assets increase. Prior to March 1, 2011, the management fee was equal to a percentage of the Fund's average daily net assets that declined from 0.55% to 0.42% as the Fund's net assets increased. The effective management fee rate for the year
52
Columbia Tax-Exempt Fund, November 30, 2011
ended November 30, 2011, was 0.39% of the Fund's average daily net assets.
Administration Fees
Under an Administrative Services Agreement, the Investment Manager serves as the Fund Administrator. Effective March 1, 2011, the Fund pays the Fund Administrator an annual fee for administration and accounting services equal to a percentage of the Fund's average daily net assets that declines from 0.07% to 0.04% as the Fund's net assets increase. Prior to March 1, 2011, the Investment Manager did not receive a fee for its services under the Administration Services Agreement. The effective administration fee rate for the year ended November 30, 2011, was 0.05% of the Fund's average daily net assets.
Pricing and Bookkeeping Fees
Prior to May 16, 2011, the Fund had entered into a Financial Reporting Services Agreement (the Financial Reporting Services Agreement) with State Street Bank and Trust Company (State Street) and the Investment Manager pursuant to which State Street provided financial reporting services to the Fund. The Fund also entered into an Accounting Services Agreement (collectively with the Financial Reporting Services Agreement, the State Street Agreements) with State Street and the Investment Manager pursuant to which State Street provided accounting services to the Fund. Under the State Street Agreements, the Fund paid State Street an annual fee of $38,000 paid monthly plus an additional monthly fee based on an annualized percentage rate of average daily net assets of the Fund for the month. The aggregate fee did not exceed $140,000 per year (exclusive of out-of-pocket expenses and charges). The Fund also reimbursed State Street for certain out-of-pocket expenses and charges. Effective May 16, 2011, these services are now provided under the Administrative Services Agreement discussed above.
Compensation of Board Members
Board members are compensated for their services to the Fund as disclosed in the Statement of Operations. The Trust's eligible Trustees may participate in a Deferred Compensation Plan (the Plan) which may be terminated at any time. Obligation of the Plan will be paid solely out of the Fund's assets.
Compensation of Chief Compliance Officer
The Board has appointed a Chief Compliance Officer to the Fund in accordance with federal securities regulations. The Fund, along with other affiliated funds, pays its pro-rata share of the expenses associated with the Chief Compliance Officer. The Fund's expenses for the Chief Compliance Officer will not exceed $15,000 per year.
Transfer Agent Fees
Under a Transfer and Dividend Disbursing Agent Agreement, Columbia Management Investment Services Corp. (the Transfer Agent), an affiliate of the Investment Manager and a wholly-owned subsidiary of Ameriprise Financial, is responsible for providing transfer agency services to the Fund. The Transfer Agent has contracted with Boston Financial Data Services (BFDS) to serve as sub-transfer agent.
The Transfer Agent receives monthly account-based service fees based on the number of open accounts and is reimbursed by the Fund for the fees and expenses the Transfer Agent pays to financial intermediaries that maintain omnibus accounts with the Fund that is a percentage of the average aggregate value of the Fund's shares maintained in each such omnibus account (other than omnibus accounts for which American Enterprise Investment Services Inc. is the broker of record or accounts where the beneficial shareholder is a customer of Ameriprise Financial Services, Inc., which are paid a per account fee). The Transfer Agent pays the fees of BFDS for services as sub-transfer agent and is not entitled to reimbursement for such fees from the Fund (with the exception of out-of-pocket fees).
The Transfer Agent also receives compensation from fees for various shareholder services and reimbursements for certain out-of -pocket expenses.
For the year ended November 30, 2011, the Fund's annualized effective transfer agent fee rates as a percentage of average daily net assets of each class were as follows:
| Class A | | | 0.10 | % | |
| Class B | | | 0.11 | | |
| Class C | | | 0.11 | | |
| Class Z | | | 0.11 | | |
53
Columbia Tax-Exempt Fund, November 30, 2011
The Fund and certain other associated investment companies (together, the Guarantors), have severally, but not jointly, guaranteed the performance and observance of all the terms and conditions of a lease entered into by Seligman Data Corp. (SDC), the former transfer agent, including the payment of rent by SDC (the Guaranty). The lease and the Guaranty expire in January 2019. At November 30, 2011, the Fund's total potential future obligation over the life of the Guaranty is $816,353. The liability remaining at November 30, 2011 for non-recurring charges associated with the lease amounted to $540,414 and is included within other accrued expenses in the Statement of Assets and Liabilities. SDC is owned by six associated investment companies, including the Fund.
An annual minimum account balance fee of $20 may apply to certain accounts with a value below the Fund's initial minimum investment requirements to reduce the impact of small accounts on transfer agent fees. These minimum account balance fees are recorded as part of expense reductions in the Statement of Operations. For the year ended November 30, 2011, these minimum account balance fees reduced total expenses by $8,004.
Distribution and Service Fees
The Fund has an agreement with Columbia Management Investment Distributors, Inc. (the Distributor), an affiliate of the Investment Manager and a wholly-owned subsidiary of Ameriprise Financial, for distribution and shareholder services. Pursuant to Rule 12b-1 under the 1940 Act, the Board has approved, and the Fund has adopted, distribution and shareholder service plans (the Plans) which set the distribution and service fees for the Fund. These fees are calculated daily and are intended to compensate the Distributor and/or eligible selling and/or servicing agents for selling shares of the Fund and providing services to investors.
The Plans require the payment of a monthly service fee to the Distributor at the maximum annual rate of 0.20% of the average daily net assets attributable to Class A, Class B and Class C shares of the Fund. The Plans also require the payment of a monthly distribution fee to the Distributor at the maximum annual rate of 0.75% of the average daily net assets attributable to Class B and Class C shares only.
The Distributor has voluntarily agreed to waive a portion of the distribution fee for Class C shares so that the combined distribution and service fee does not exceed 0.80% annually of the average daily net assets attributable to Class C shares. This arrangement may be modified or terminated by the Distributor at any time.
Sales Charges
Sales charges, including front-end charges and CDSCs, received by the Distributor for distributing Fund shares were $1,010,865 for Class A, $5,332 for Class B and $6,965 for Class C shares for the year ended November 30, 2011.
Expenses Waived/Reimbursed by the Investment Manager and its Affiliates
Effective March 1, 2011, the Investment Manager and certain of its affiliates have contractually agreed to waive fees and/or reimburse expenses (excluding certain fees and expenses described below as well as any reorganization costs allocated to the Fund), through March 31, 2012, unless sooner terminated at the sole discretion of the Board, so that the Fund's net operating expenses, after giving effect to fees waived/expenses reimbursed and any balance credits and/or overdraft charges from the Fund's custodian, do not exceed the following annual rates as a percentage of the class' average daily net assets:
| Class A | | | 0.76 | % | |
| Class B | | | 1.51 | | |
| Class C | | | 1.51 | | |
| Class Z | | | 0.56 | | |
Under the agreement, the following fees and expenses are excluded from the waiver/reimbursement commitment, and therefore will be paid by the Fund, if applicable: taxes (including foreign transaction taxes), expenses associated with investments in affiliated and non-affiliated pooled investment vehicles (including mutual funds and exchange traded funds), transaction costs and brokerage commissions, costs related to any securities lending program, dividend expenses associated with securities sold short, inverse floater program fees and expenses, transaction charges and interest on borrowed money, interest, extraordinary expenses and any other expenses the exclusion of which is specifically approved by the Board. This agreement may be modified or amended only with approval from all parties. Reorganization
54
Columbia Tax-Exempt Fund, November 30, 2011
(see Note 13) costs were allocated to the Fund only to the extent they are expected to be offset by the anticipated reduction in expenses borne by the Fund's shareholders during the first year following the Reorganization.
Prior to March 1, 2011, the Investment Manager voluntarily agreed to reimburse a portion of the Fund's expenses (excluding certain expenses, such as distribution and services fees, brokerage commissions, interest, taxes and extraordinary expenses, but including custodian charges relating to overdrafts, if any) so that the Fund's ordinary net operating expenses, after giving effect to fees waived/expenses reimbursed and any balance credits and/or overdraft charges from the Fund's custodian, did not exceed 0.60% of the Fund's average daily net assets on an annualized basis.
Note 4. Federal Tax Information
The timing and character of income and capital gain distributions are determined in accordance with income tax regulations, which may differ from GAAP because of temporary or permanent book to tax differences.
For the year ended November 30, 2011, these differences are primarily due to differing treatments for futures and options contracts, market discount/premium, paydown reclassifications, post-October losses, capital loss carryforwards, non-deductible deferred trustees fees, current year income distributions payable, market discount reclassifications and non-deductible merger costs. To the extent these differences are permanent, reclassifications are made among the components of the Fund's net assets in the Statement of Assets and Liabilities. Temporary differences do not require reclassifications. In the Statement of Assets and Liabilities the following reclassifications were made:
| Undistributed Net Investment Income | | $ | 43,334 | | |
| Accumulated net Realized Gain/Loss | | | 373,053 | | |
| Paid-In Capital | | | (416,387 | ) | |
Net investment income and net realized gains (losses), as disclosed in the Statement of Operations, and net assets were not affected by this reclassification.
The tax character of distributions paid during the years indicated was as follows:
| Year ended November 30, | | 2011 | | 2010 | |
| Ordinary Income* | | $ | 180,887 | | | $ | 877,056 | | |
| Tax-Exempt Income | | | 145,282,309 | | | | 98,646,693 | | |
* Short-term capital gain distributions, if any, are considered ordinary income distributions for tax purposes.
At November 30, 2011, the components of distributable earnings on a tax basis were as follows:
| Undistributed Tax-Exempt Income | | $ | 19,891,771 | | |
| Unrealized Appreciation* | | | 249,411,366 | | |
* The differences between book-basis and tax-basis net unrealized appreciation are primarily due to market discount reclassifications.
At November 30, 2011, the cost of investments for federal income tax purposes was $4,258,460,965 and the aggregate gross unrealized appreciation and depreciation based on that cost was:
| Unrealized Appreciation | | $ | 322,981,403 | | |
| Unrealized Depreciation | | $ | (73,570,037 | ) | |
| Net Unrealized Appreciation | | $ | 249,411,366 | | |
The following capital loss carryforward, determined at November 30, 2011, may be available to reduce taxable income arising from future net realized gains on investments, if any, to the extent permitted by the Internal Revenue Code:
| Year of Expiration | | Amount | |
| 2015 | | $ | 13,239,272 | | |
| 2016 | | | 57,869,171 | | |
| 2017 | | | 1,455,576 | | |
| 2018 | | | 6,621,391 | | |
| 2019 | | | 14,381,427 | | |
| Total | | $ | 93,566,837 | | |
55
Columbia Tax-Exempt Fund, November 30, 2011
Columbia Tax-Exempt Fund acquired $77,729,834 of capital loss carryforward in connection with the RiverSource Tax-Exempt High Income Fund merger (Note 10). The yearly utilization of the acquired capital loss carryforward may be limited by the Internal Revenue Code.
Under current tax rules, certain currency and capital losses realized after October 31 may be deferred and treated as occurring on the first day of the following fiscal year. As of November 30, 2011, post-October capital losses of $333,837 attributed to security transactions were deferred to December 1, 2011.
On December 22, 2010, the Regulated Investment Company Modernization Act of 2010 (the Act) was enacted, which changed various technical rules governing the tax treatment of regulated investment companies. The changes are generally effective for taxable years beginning after the date of enactment. Under the Act, the Fund will be permitted to carry forward capital losses incurred in taxable years beginning after the date of enactment for an unlimited period. However, any losses incurred during those future taxable years will be required to be utilized prior to the losses incurred in pre-enactment taxable years, which carry an expiration date. As a result of this ordering rule, pre-enactment capital loss carryforwards may be more likely to expire unused.
Management of the Fund has concluded that there are no significant uncertain tax positions that would require recognition in the financial statements. However, management's conclusion may be subject to review and adjustment at a later date based on factors including, but not limited to, new tax laws, regulations, and administrative interpretations (including relevant court decisions). Generally, the Fund's federal tax returns for the prior three fiscal years remain subject to examination by the Internal Revenue Service.
Note 5. Portfolio Information
The cost of purchases and proceeds from sales of securities, excluding short-term obligations, aggregated to $331,562,924 and $535,872,903 respectively, for the year ended November 30, 2011.
Note 6. Regulatory Settlements
During the year ended November 30, 2010, the Fund received payments of $19,753 resulting from certain regulatory settlements with third parties in which the Fund had participated. The payments have been included in "Proceeds from regulatory settlements" in the Statement of Changes in Net Assets.
Note 7. Lending of Portfolio Securities
Effective May 16, 2011, the Fund has entered into a Master Securities Lending Agreement (the Agreement) with JPMorgan Chase Bank, N.A. (JPMorgan). The Agreement, which replaces the previous security lending arrangement with State Street, authorizes JPMorgan as lending agent to lend securities to authorized borrowers in order to generate additional income on behalf of the Fund. Pursuant to the Agreement, the securities loaned are secured by cash or U.S. government securities equal to at least 100% of the market value of the loaned securities. Any additional collateral required to maintain those levels due to market fluctuations of the loaned securities is requested to be delivered the following business day. Cash collateral received is invested by the lending agent on behalf of the Fund into authorized investments pursuant to the Agreement. The investments made with the cash collateral are listed in the Portfolio of Investments. The values of such investments and any uninvested cash collateral are disclosed in the Statement of Assets and Liabilities along with the related obligation to return the collateral upon the return of the securities loaned.
For the year ended November 30, 2011, the Fund did not participate in securities lending activity.
Risks of delay in recovery of securities or even loss of rights in the securities may occur should the borrower of the securities fail financially. Risks may also arise to the extent that the value of the securities loaned increases above the value of the collateral received. JPMorgan will indemnify the Fund from losses resulting from a borrower's failure to return a loaned security when due. Such indemnification does not extend to losses associated with declines in the value of cash collateral investments. The Investment Manager is not responsible for any losses incurred by the Fund in connection with the securities lending program. Loans are subject to termination by the Fund or the borrower at any time, and are, therefore, not considered to be illiquid investments.
Pursuant to the Agreement, the Fund receives income for lending its securities either in the form of fees or by earning interest on invested cash collateral, net of negotiated rebates
56
Columbia Tax-Exempt Fund, November 30, 2011
paid to borrowers and fees paid to the lending agent for services provided and any other securities lending expenses.
Prior to May 16, 2011, the Fund participated in a securities lending arrangement with State Street. Each security on loan was collateralized in an amount at least equal to the market value of the securities loaned plus accrued income from the investment of collateral. The income generated by the investment of the collateral, net of any fees remitted to State Street as the lending agent and borrower rebates, was paid to the Fund.
Note 8. Custody Credits
Prior to May 16, 2011, the Fund had an agreement with its custodian bank under which custody fees may have been reduced by balance credits. These credits are recorded as part of expense reductions on the Statement of Operations. The Fund could have invested a portion of the assets utilized in connection with the expense offset arrangement in an income-producing asset if they had not entered into such an agreement. For the period December 1, 2010 through May 15, 2011, these credits reduced total expenses by $90.
Note 9. Line of Credit
The Fund has entered into a revolving credit facility with a syndicate of banks led by JPMorgan Chase Bank, N.A. (the Administrative Agent), whereby the Fund may borrow for the temporary funding of shareholder redemptions or for other temporary or emergency purposes. The credit facility became effective on May 16, 2011, replacing a prior credit facility. The credit facility agreement which is a collective agreement between the Fund and certain other funds managed by the Investment Manager, severally and not jointly, permits collective borrowings up to $500 million.
Interest is charged to each participating fund based on its borrowings at a rate equal to the sum of the federal funds rate plus (i) 1.25% per annum plus (ii) if one-month LIBOR exceeds the federal funds rate, the amount of such excess. Each borrowing under the credit facility matures no later than 60 days after the date of borrowing. The Fund also pays a commitment fee equal to its pro rata share of the amount of the credit facility at a rate of 0.10% per annum.
For the period March 28, 2011 through May 15, 2011, the Fund and certain other funds managed by the Investment Manager participated in a $225 million committed, unsecured revolving credit facility provided by State Street. Prior to March 28, 2011, the collective borrowing amount of the credit facility was $280 million. Interest was charged to each fund based on its borrowings at a rate equal to the greater of the (i) federal funds rate plus 1.25% per annum or (ii) the overnight LIBOR rate plus 1.25% per annum. The Fund also paid a commitment fee equal to its pro rata share of the amount of the credit facility at a rate of 0.125% per annum.
Effective December 13, 2011, the Fund extended its revolving credit facility with the Administrative Agent. The credit facility agreement, as amended, permits collective borrowings up to $500 million. Effective December 13, 2011, interest is charged to each participating fund based on its borrowings at a rate equal to the higher of (i) the overnight federal funds rate plus 1.00% or (i) the one-month LIBOR rate plus 1.00%. Each borrowing under the credit facility matures no later than 60 days after the date of borrowing. The Fund also pays a commitment fee equal to its pro rata share of the amount of the credit facility at a rate of 0.08% per annum.
For the year ended November 30, 2011, the average daily loan balance outstanding on days when borrowing existed was $3,600,000 at a weighted average interest rate of 1.48%.
For the year ended November 30, 2011, the Investment Manager reimbursed the Fund $148 of interest expense.
Note 10. Fund Merger
At the close of business on June 3, 2011, the Fund acquired the assets and assumed the identified liabilities of Seligman National Municipal Fund, a series of Seligman Municipal Fund Series, Inc., and RiverSource Tax-Exempt High Income Fund, a series of RiverSource Tax-Exempt Income Series, Inc. The reorganization was completed after shareholders approved the plan on February 15, 2011. The purpose of the transaction was to combine three funds managed by the Investment Manager with comparable investment objectives and strategies.
The aggregate net assets of the Fund immediately before the acquisitions were $1,964,927,197 and the combined net assets immediately after the acquisitions were $4,525,485,728.
The merger was accomplished by a tax-free exchange of 71,691,627 shares of Seligman National Municipal Fund valued at $549,162,443 (including $15,000,986 of unrealized
57
Columbia Tax-Exempt Fund, November 30, 2011
appreciation ), and 480,872,682 shares of RiverSource Tax-Exempt High Income Fund valued at $2,011,396,088 (including $65,088,726 of unrealized appreciation).
In exchange for shares of Seligman National Municipal Fund and RiverSource Tax-Exempt High Income Fund, the Fund issued the following number of shares:
| | | Seligman
National
Municipal
Fund | | RiverSource
Tax-Exempt
High Income
Fund | |
| Class A | | | 39,704,790 | | | | 150,418,717 | | |
| Class B | | | N/A | | | | 1,348,328 | | |
| Class C | | | 2,130,946 | | | | 1,321,135 | | |
For financial reporting purposes, net assets received and shares issued by the Fund were recorded at fair value; however, Seligman National Municipal Fund and RiverSource Tax-Exempt High Income Fund's cost of investments was carried forward to align ongoing reporting of the Fund's realized and unrealized gains and losses with amounts distributable to shareholders for tax purposes.
The financial statements reflect the operations of the Fund for the period prior to the merger and the combined fund for the period subsequent to the merger. Because the combined investment portfolios have been managed as a single integrated portfolio since the merger was completed, it is not practicable to separate the amounts of revenue and earnings of Seligman National Municipal Fund and RiverSource Tax-Exempt High Income Fund that have been included in the combined Fund's Statement of Operations since the merger was completed.
Assuming the merger had been completed on December 1, 2010 the Fund 's pro-forma net investment income (loss), net gain (loss) on investments, net change in unrealized appreciation (depreciation) and net increase in net assets from operations for the year ended November 30, 2011 would have been approximately $206.3 million, $(18.1) million, $89.5 million and $277.7 million, respectively.
Note 11. Significant Risks
Sector Focus Risk
The Fund may focus its investments in certain sectors, subjecting it to greater risk than a fund that is less focused.
Geographic Concentration Risk
Because state-specific tax-exempt funds invest primarily in the municipal securities issued by the state and political sub-divisions of the state, the Fund will be particularly affected by political and economic conditions and developments in the state in which it invests. The Fund may, therefore, have a greater risk than that of a municipal bond fund which is more geographically diversified. The value of the municipal securities owned by the Fund also may be adversely affected by future changes in federal or state income tax laws.
High Yield Securities Risk
Investing in high-yield fixed income securities may involve greater credit risk and considerations not typically associated with investing in U.S. Government bonds and other higher quality fixed income securities. These securities are non-investment grade securities, often referred to as "junk" bonds. Economic downturns may disrupt the high yield market and impair the ability of issuers to repay principal and interest. Also, an increase in interest rates would likely have an adverse impact on the value of such obligations. Moreover, high-yield securities may be less liquid to the extent that there is no established secondary market.
Tax Development Risk
The Fund purchases municipal securities whose interest, in the opinion of bond counsel, is free from federal income tax. There is no assurance that the Internal Revenue Service (IRS) will agree with this opinion. In the event the IRS determines that the issuers do not comply with relevant tax requirements, interest payments from such issuers' securities could become federally taxable, possibly retroactively to the date the securities were issued. As a shareholder of the Fund, you may be required to file an amended tax return as a result and pay any federal income tax on the interest earned from such securities in your in your Fund account.
58
Columbia Tax-Exempt Fund, November 30, 2011
Note 12. Subsequent Events
Management has evaluated the events and transactions that have occurred through the date the financial statements were issued. Other than as noted in Note 9 above, there were no items requiring adjustment of the financial statements or additional disclosure.
Note 13. Shareholder Concentration
At November 30, 2011, one shareholder account owned 10.24% of the outstanding shares of the Fund. Subscription and redemption activity of this account may have a significant effect on the operations of the Fund.
Note 14. Information Regarding Pending and Settled Legal Proceedings
In June 2004, an action captioned John E. Gallus et al. v. American Express Financial Corp. and American Express Financial Advisors Inc. was filed in the United States District Court for the District of Arizona. The plaintiffs allege that they are investors in several American Express Company mutual funds (branded as Columbia) and they purport to bring the action derivatively on behalf of those funds under the Investment Company Act of 1940. The plaintiffs allege that fees allegedly paid to the defendants by the funds for investment advisory and administrative services are excessive. The plaintiffs seek remedies including restitution and rescission of investment advisory and distribution agreements. The plaintiffs voluntarily agreed to transfer this case to the United States District Court for the District of Minnesota (the District Court). In response to defendants' motion to dismiss the complaint, the District Court dismissed one of plaintiffs' four claims and granted plaintiffs limited discovery. Defendants moved for summary judgment in April 2007. Summary judgment was granted in the defendants' favor on July 9, 2007. The plaintiffs filed a notice of appeal with the Eighth Circuit Court of Appeals (the Eighth Circuit) on August 8, 2007. On April 8, 2009, the Eighth Circuit reversed summary judgment and remanded to the District Court for further proceedings. On August 6, 2009, defendants filed a writ of certiorari with the U.S. Supreme Court (the Supreme Court), asking the Supreme Court to stay the District Court proceedings while the Supreme Court considers and rules in a case captioned Jones v. Harris Associates, which involves issues of law similar to those presented in the Gallus case. On March 30, 2010, the Supreme Court issued its ruling in Jones v. Harris Associates, and on April 5, 2010, the Supreme Court vacated the Eighth Circuit's decision in the Gallus case and remanded the case to the Eighth Circuit for further consideration in light of the Supreme Court's decision in Jones v. Harris Associates. On June 4, 2010, the Eighth Circuit remanded the Gallus case to the District Court for further consideration in light of the Supreme Court's decision in Jones v. Harris Associates. On December 9, 2010, the District Court reinstated its July 9, 2007 summary judgment order in favor of the defendants. On January 10, 2011, plaintiffs filed a notice of appeal with the Eighth Circuit. In response to the plaintiffs' opening appellate brief filed on March 18, 2011, the defendants filed a response brief on May 4, 2011 with the Eighth Circuit. The plaintiffs filed a reply brief on May 26, 2011, and oral arguments took place on November 17, 2011.
In December 2005, without admitting or denying the allegations, American Express Financial Corporation (AEFC, which is now known as Ameriprise Financial, Inc. (Ameriprise Financial)), entered into settlement agreements with the Securities and Exchange Commission (SEC) and Minnesota Department of Commerce (MDOC) related to market timing activities. As a result, AEFC was censured and ordered to cease and desist from committing or causing any violations of certain provisions of the Investment Advisers Act of 1940, the Investment Company Act of 1940, and various Minnesota laws. AEFC agreed to pay disgorgement of $10 million and civil money penalties of $7 million. AEFC also agreed to retain an independent distribution consultant to assist in developing a plan for distribution of all disgorgement and civil penalties ordered by the SEC in accordance with various undertakings detailed at www.sec.gov/litigation/admin/ia-2451.pdf. Ameriprise Financial and its affiliates have cooperated with the SEC and the MDOC in these legal proceedings, and have made regular reports to the funds' Boards of Trustees.
Ameriprise Financial and certain of its affiliates have historically been involved in a number of legal, arbitration and regulatory proceedings, including routine litigation, class actions, and governmental actions, concerning matters arising in connection with the conduct of their business activities. Ameriprise Financial believes that the Funds are not currently the subject of, and that neither Ameriprise Financial nor any of its affiliates are the subject of, any pending legal,
59
Columbia Tax-Exempt Fund, November 30, 2011
arbitration or regulatory proceedings that are likely to have a material adverse effect on the Funds or the ability of Ameriprise Financial or its affiliates to perform under their contracts with the Funds. Ameriprise Financial is required to make 10-Q, 10-K and, as necessary, 8-K filings with the Securities and Exchange Commission on legal and regulatory matters that relate to Ameriprise Financial and its affiliates. Copies of these filings may be obtained by accessing the SEC website at www.sec.gov.
There can be no assurance that these matters, or the adverse publicity associated with them, will not result in increased fund redemptions, reduced sale of fund shares or other adverse consequences to the Funds. Further, although we believe proceedings are not likely to have a material adverse effect on the Funds or the ability of Ameriprise Financial or its affiliates to perform under their contracts with the Funds, these proceedings are subject to uncertainties and, as such, we are unable to estimate the possible loss or range of loss that may result. An adverse outcome in one or more of these proceedings could result in adverse judgments, settlements, fines, penalties or other relief that could have a material adverse effect on the consolidated financial condition or results of operations of Ameriprise Financial.
60
Report of Independent Registered Public Accounting Firm
To the Trustees of Columbia Funds Series Trust I and the Shareholders of Columbia Tax-Exempt Fund
In our opinion, the accompanying statement of assets and liabilities, including the investment portfolio, and the related statements of operations and of changes in net assets and the financial highlights present fairly, in all material respects, the financial position of Columbia Tax-Exempt Fund (the "Fund") (a series of Columbia Funds Series Trust I) at November 30, 2011, the results of its operations for the year then ended, the changes in its net assets for each of the two years in the period then ended and the financial highlights for each of the periods indicated, in conformity with accounting principles generally accepted in the United States of America. These financial statements and financial highlights (hereafter referred to as "financial statements") are the responsibility of the Fund's management. Our responsibility is to express an opinion on these financial statements based on our audits. We conducted our audits of these financial statements in accordance with the standards of the Public Company Accounting Oversight Board (United States). Those standards require that we plan and perform the audit to obtain reasonable assurance about whether the financial statements are free of material misstatement. An audit includes examining, on a test basis, evidence supporting the amounts and disclosures in the financial statements, assessing the accounting principles used and significant estimates made by management, and evaluating the overall financial statement presentation. We believe that our audits, which included confirmation of securities at November 30, 2011 by correspondence with the custodian and brokers, provide a reasonable basis for our opinion.
PricewaterhouseCoopers LLP
Minneapolis, Minnesota
January 20, 2012
61
Federal Income Tax Information (Unaudited) – Columbia Tax-Exempt Fund
For the fiscal year ended November 30, 2011, 99.88% of the distributions from net investment income of the Fund qualifies as exempt interest dividends for federal income tax purposes. A portion of the income may be subject to federal alternative minimum tax.
The Fund will notify shareholders in January 2012 of amounts for use in preparing 2011 income tax returns.
62
Fund Governance
The Trustees serve terms of indefinite duration. The names, addresses and birth years of the Trustees and Officers of the Funds in Columbia Funds Series Trust I, the year each was first elected or appointed to office, their principal business occupations during at least the last five years, the number of Funds overseen by each Trustee and other directorships they hold are shown below. Each officer listed below serves as an officer of each Fund in Columbia Funds Series Trust I.
Independent Trustees
Name, Address and Year of Birth,
Position with Funds, Year First
Elected or Appointed to Office | | Principal Occupation(s) During Past Five Years, Number of Funds in Columbia
Funds Complex Overseen by Trustee, Other Directorships Held
| |
| Rodman L. Drake (Born 1943) | |
|
c/o Columbia Management
Investment Advisers, LLC
225 Franklin Street
Boston, MA 02110
Trustee (since 1994) and Chairman of the Board (since 2009) | | Independent consultant since 2010; Co-Founder of Baringo Capital LLC (private equity) from 1997 to 2008; CEO of Crystal River Capital, Inc. (real estate investment trust) from 2003 to 2010; Oversees 43; Jackson Hewitt Tax Service Inc. (tax preparation services from 2004 to 2011); Celgene Corporation (global biotechnology company); Student Loan Corporation (student loan provider from 2008 to 2010); Celgene Corporation (global biotechnology company); The Helios Funds and Brookfield Funds (closed-end funds); Crystal River Capital, Inc. from 2005 to 2010; Parson Brinckerhoff from 1995 to 2008; and Apex Silver Mines Ltd. from 2007 to 2009 | |
|
| Douglas A. Hacker (Born 1955) | |
|
c/o Columbia Management
Investment Advisers, LLC
225 Franklin Street
Boston, MA 02110
Trustee (since 1996) | | Independent business executive since May 2006; Executive Vice President—Strategy of United Airlines from December 2002 to May 2006; President of UAL Loyalty Services (airline marketing company) from September 2001 to December 2002; Executive Vice President and Chief Financial Officer of United Airlines from July 1999 to September 2001. Oversees 43; Nash Finch Company (food distributor); Aircastle Limited (aircraft leasing); and SeaCube Container Leasing Ltd (container leasing) | |
|
| Janet Langford Kelly (Born 1957) | |
|
c/o Columbia Management
Investment Advisers, LLC
225 Franklin Street
Boston, MA 02110
Trustee (since 1996) | | Senior Vice President, General Counsel and Corporate Secretary, ConocoPhillips (integrated energy company) since September 2007; Deputy General Counsel—Corporate Legal Services, ConocoPhillips from August 2006 to August 2007; Partner, Zelle, Hofmann, Voelbel, Mason & Gette LLP (law firm) from March 2005 to July 2006; Adjunct Professor of Law, Northwestern University, from September 2004 to June 2006; Director, UAL Corporation (airline) from February 2006 to July 2006; Oversees 43; None | |
|
| Nancy T. Lukitsh (Born 1956) | |
|
c/o Columbia Management
Investment Advisers, LLC
225 Franklin Street
Boston, MA 02110
Trustee (since 2011) | | Senior Vice President, Partner and Director, Marketing of Wellington Management Company, LLP (investment adviser) from 1997 to 2010; Chair, Wellington Management Investment Portfolios (commingled non-U.S. investment pools) from 2007 to 2010; Director, Wellington Trust Company, NA and other Wellington affiliates from 1997 to 2010. Oversees 43; None | |
|
63
Fund Governance (continued)
Independent Trustees (continued)
Name, Address and Year of Birth,
Position with Funds, Year First
Elected or Appointed to Office | | Principal Occupation(s) During Past Five Years, Number of Funds in Columbia
Funds Complex Overseen by Trustee, Other Directorships Held
| |
| William E. Mayer (Born 1940) | |
|
c/o Columbia Management
Investment Advisers, LLC
225 Franklin Street
Boston, MA 02110
Trustee (since 1994) | | Partner, Park Avenue Equity Partners (private equity) since February 1999; Dean and Professor, College of Business and Management, University of Maryland from 1992 to 1996. Oversees 43; DynaVox Inc. (speech creation); Lee Enterprises (print media); WR Hambrecht + Co. (financial service provider); BlackRock Kelso Capital Corporation (investment company) | |
|
| David M. Moffett (Born 1952) | |
|
c/o Columbia Management
Investment Advisers, LLC
225 Franklin Street
Boston, MA 02110
Trustee (since 2011) | | Retired. Chief Executive Officer, Federal Home Loan Mortgage Corporation, from 2008 to 2009; Senior Adviser, Global Financial Services Group, Carlyle Group, Inc., from 2007 to 2008; Vice Chairman and Chief Financial Officer, U.S. Bancorp, from 1993 to 2007. Oversees 43; CIT Group Inc. (commercial and consumer finance), eBay Inc. (online trading community), MBIA Corp (financial service provider), E.W. Scripps Co. (print and television media), Building Materials Holding Corp. (building materials and construction services), and University of Oklahoma Foundation. | |
|
| Charles R. Nelson (Born 1942) | |
|
c/o Columbia Management
Investment Advisers, LLC
225 Franklin Street
Boston, MA 02110
Trustee (since 1981) | | Retired Professor Emeritus, University of Washington, since 2011; Professor of Economics, University of Washington, from January 1976 to 2011; Ford and Louisa Van Voorhis Professor of Political Economy, University of Washington, from 1993 to 2011; Adjunct Professor of Statistics, University of Washington, from 1980 to 2011; Associate Editor, Journal of Money Credit and Banking from 1993 to 2008; consultant on econometric and statistical matters. Oversees 43; None | |
|
| John J. Neuhauser (Born 1943) | |
|
c/o Columbia Management
Investment Advisers, LLC
225 Franklin Street
Boston, MA 02110
Trustee (since 1984) | | President, Saint Michael's College, since August 2007; Director or Trustee of several non-profit organizations, including Fletcher Allen Health Care, Inc.; University Professor, Boston College from November 2005 to August 2007; Academic Vice President and Dean of Faculties, Boston College from August 1999 to October 2005. Oversees 43; Liberty All-Star Equity Fund and Liberty All-Star Growth Fund (closed-end funds) | |
|
| Patrick J. Simpson (Born 1944) | |
|
c/o Columbia Management
Investment Advisers, LLC
225 Franklin Street
Boston, MA 02110
Trustee (since 2000) | | Partner, Perkins Coie LLP (law firm). Oversees 43; None | |
|
| Anne-Lee Verville (Born 1945) | |
|
c/o Columbia Management
Investment Advisers, LLC
225 Franklin Street
Boston, MA 02110
Trustee (since 1998) | | Retired since 1997 (formerly General Manager–Global Education Industry from 1994 to 1997, President–Application Systems Division from 1991 to 1994, Chief Financial Officer–US Marketing & Services from 1988 to 1991, and Chief Information Officer from 1987 to 1988, IBM Corporation (computer and technology)). Oversees 43; Enesco Group, Inc. (producer of giftware and home and garden decor products) from 2001 to 2006 | |
|
64
Fund Governance (continued)
Interested Trustee
Name, Address and Year of Birth,
Position with Funds, Year First
Elected or Appointed to Office | | Principal Occupation(s) During Past Five Years, Number of Funds in Columbia
Funds Complex Overseen by Trustee, Other Directorships Held
| |
| Michael A. Jones (born 1959) | |
|
c/o Columbia Management
Investment Advisers, LLC
225 Franklin Street
Boston, MA 02110
Trustee (since 2011)
Senior Vice President (since 2011) | | President and Director, Columbia Management Investment Advisers, LLC since May 2010; President and Director, Columbia Management Investment Distributors, Inc. since May 2010; Manager, Chairman, Chief Executive Officer and President, Columbia Management Advisors, LLC from 2007 to April 2010; Chief Executive Officer, President and Director, Columbia Management Distributors, Inc. from November 2006 to April 2010; previously, co-president and senior managing director at Robeco Investment Management. Oversees 43; None | |
|
The Statement of Additional Information includes additional information about the Trustees of the Funds and is available, without charge, upon request by calling 1-800-345-6611.
Officers
| Name, Year of Birth and Address | | Principal Occupation(s) During the Past Five Years | |
| J. Kevin Connaughton (Born 1964) | |
|
225 Franklin Street
Boston, MA 02110
President (since 2009) | | Senior Vice President and General Manager–Mutual Fund Products, Columbia Management Investment Advisers, LLC since May 2010; President, Columbia Funds, since 2009, and RiverSource Funds, since May 2010 (previously Senior Vice President and Chief Financial Officer, Columbia Funds, from June 2008 to January 2009, Treasurer, Columbia Funds, from October 2003 to May 2008, and senior officer of various other affiliated funds since 2000); Managing Director, Columbia Management Advisors, LLC from December 2004 to April 2010. | |
|
| Michael G. Clarke (Born 1969) | |
|
225 Franklin Street
Boston, MA 02110
Treasurer (since 2011) and Chief
Financial Officer (since 2009) | | Vice President, Columbia Management Investment Advisers, LLC since May 2010; Managing Director of Fund Administration, Columbia Management Advisors, LLC, from September 2004 to April 2010; senior officer of Columbia Funds and affiliated funds since 2002. | |
|
| Scott R. Plummer (Born 1959) | |
|
5228 Ameriprise Financial Center
Minneapolis, MN 55474
Senior Vice President, Assistant Secretary
and Chief Legal Officer (since 2010) | | Chief Legal Officer and Assistant Secretary, Columbia Management Investment Advisers, LLC since June 2005; Vice President and Lead Chief Counsel–Asset Management, Ameriprise Financial, Inc. since May 2010 (previously Vice President and Chief Counsel–Asset Management, from 2005 to April 2010, and Vice President–Asset Management Compliance from 2004 to 2005); Vice President, Chief Counsel and Assistant Secretary, Columbia Management Investment Distributors, Inc. since 2008; Vice President, General Counsel and Secretary, Ameriprise Certificate Company since 2005; Chief Counsel, RiverSource Distributors, Inc. since 2006; Vice President, General Counsel and Secretary, RiverSource Funds, since December 2006; Senior Vice President, Secretary and Chief Legal Officer, Columbia Funds, since May 2010. | |
|
65
Fund Governance (continued)
Officers (continued)
| Name, Year of Birth and Address | | Principal Occupation(s) During the Past Five Years | |
| Linda J. Wondrack (Born 1964) | |
|
225 Franklin Street
Boston, MA 02110
Senior Vice President and Chief
Compliance Officer (since 2007) | | Vice President and Chief Compliance Officer, Columbia Management Investment Advisers, LLC since May 2010; Chief Compliance Officer, Columbia Funds, since 2007, and RiverSource Funds, since May 2010; Director (Columbia Management Group, LLC and Investment Product Group Compliance), Bank of America, from June 2005 to April 2010; Director of Corporate Compliance and Conflicts Officer of MFS Investment Management (investment management) from August 2004 to May 2005. | |
|
| William F. Truscott (Born 1960) | |
|
53600 Ameriprise Financial Center
Minneapolis, MN 55474
Senior Vice President (since 2010) | | Chairman of the Board, Columbia Management Investment Advisers, LLC since May 2010 (previously President, Chairman of the Board and Chief Investment Officer, from 2001 to April 2010); Chief Executive Officer, U.S. Asset Management & President, Annuities, Ameriprise Financial, Inc. since May 2010 (previously President–U.S. Asset Management and Chief Investment Officer from 2005 to April 2010, and Senior Vice President—Chief Investment Officer, from 2001 to 2005); Director, President and Chief Executive Officer, Ameriprise Certificate Company since 2006; Director, Columbia Management Investment Distributors, Inc. since May 2010 (previously Chairman of the Board and Chief Executive Officer from 2008 to April 2010); Chairman of the Board and Chief Executive Officer, RiverSource Distributors, Inc. since 2006. | |
|
| Colin Moore (Born 1958) | |
|
225 Franklin Street
Boston, MA 02110
Senior Vice President (since 2010) | | Director and Chief Investment Officer, Columbia Management Investment Advisers, LLC since May 2010; Manager, Managing Director and Chief Investment Officer of Columbia Management Advisors, LLC from 2007 to April 2010; Head of Equities, Columbia Management Advisors, LLC from 2002 to 2007. | |
|
| Amy Johnson (Born 1965) | |
|
5228 Ameriprise Financial Center
Minneapolis, MN 55474
Vice President (since 2010) | | Senior Vice President and Chief Operating Officer, Columbia Management Investment Advisers, LLC since May 2010 (previously Chief Administrative Officer, from 2009 until April 2010, Vice President—Asset Management and Trust Company Services, from 2006 to 2009, and Vice President—Operations and Compliance from 2004 to 2006). | |
|
| Joseph F. DiMaria (Born 1968) | |
|
225 Franklin Street
Boston, MA 02110
Vice President (since 2011) and
Chief Accounting Officer (since 2008) | | Vice President, Mutual Fund Administration, Columbia Management Investment Advisers, LLC, since May 2010; Director of Fund Administration, Columbia Management Advisors, LLC from January 2006 to April 2010; Head of Tax/Compliance and Assistant Treasurer, Columbia Management Advisors, LLC, from November 2004 to December 2005. | |
|
| Stephen T. Welsh (born 1957) | |
|
225 Franklin Street
Boston, MA 02110
Vice President (since 2006) | | President and Director, Columbia Management Investment Services Corp. since May 2010; President and Director, Columbia Management Services, Inc. from July 2004 to April 2010; Managing Director, Columbia Management Distributors, Inc. from August 2007 to April 2010. | |
|
66
Fund Governance (continued)
Officers (continued)
| Name, Year of Birth and Address | | Principal Occupation(s) During the Past Five Years | |
| Paul D. Pearson (born 1956) | |
|
5228 Ameriprise Financial Center
Minneapolis, MN 55474
Vice President and Assistant
Treasurer (since 2011) | | Vice President, Investment Accounting, Columbia Management Investment Advisers, LLC, since May 2010; Vice President, Managed Assets, Investment Accounting, Ameriprise Financial Corporation. | |
|
| Paul B. Goucher (born 1968) | |
|
5228 Ameriprise Financial Center
Minneapolis, MN 55474
Vice President and Assistant
Secretary (since 2010) | | Vice President and Chief Counsel of Ameriprise Financial since January 2010 (formerly Vice President and Group Counsel from November 2008 to January 2010); Director, Managing Director and General Counsel of J. & W. Seligman & Co. Incorporated (Seligman) from July 2008 to November 2008 and Managing Director and Associate General Counsel of Seligman from January 2005 to July 2008. | |
|
| Christopher O. Petersen (born 1970) | |
|
5228 Ameriprise Financial Center
Minneapolis, MN 55474
Vice President (since 2010) and
Secretary (since 2011) | | Vice President and Chief Counsel, Ameriprise Financial since January 2010 (formerly Vice President and Group Counsel or Counsel from April 2004 to January 2010); Assistant Secretary of RiverSource Funds since January 2007. | |
|
| Michael E. DeFao (born 1968) | |
|
5228 Ameriprise Financial Center
Minneapolis, MN 55474
Vice President and Assistant
Secretary (since 2011) | | Vice President and Chief Counsel, Ameriprise Financial since May 2010; Associate General Counsel Bank of America from June 2005 to April 2010 | |
|
67
This page intentionally left blank.
68
Important Information About This Report
The fund mails one shareholder report to each shareholder address. If you would like more than one report, please call shareholder services at 1-800-345-6611 and additional reports will be sent to you. This report has been prepared for shareholders of Columbia Tax-Exempt Fund.
A description of the policies and procedures that the fund uses to determine how to vote proxies and a copy of the fund's voting records are available (i) at www.columbiamanagement.com, (ii) on the Securities and Exchange Commission's website at www.sec.gov, and (iii) without charge, upon request, by calling 1-800-368-0346. Information regarding how the fund voted proxies relating to portfolio securities during the 12-month period ended June 30 is available from the SEC's website. Information regarding how the fund voted proxies relating to portfolio securities is also available from the fund's website, www.columbiamanagement.com.
The fund files a complete schedule of portfolio holdings with the SEC for the first and third quarters of each fiscal year on Form N-Q. The fund's Form N-Q is available on the SEC's website at www.sec.gov and may be reviewed and copied at the SEC's Public Reference Room in Washington, D.C. Information on the operation of the Public Reference Room may be obtained by calling 1-800-SEC-0330.
Transfer Agent
Columbia Management Investment
Services Corp.
P.O. Box 8081
Boston, MA 02266-8081
1-800-345-6611
Distributor
Columbia Management Investment
Distributors, Inc.
225 Franklin Street
Boston, MA 02110
Investment Manager
Columbia Management Investment Advisers, LLC
225 Franklin Street
Boston, MA 02110
69

Columbia Tax-Exempt Fund
P. O. Box 8081
Boston, MA 02266-8081
columbiamanagement.com
This information is for use with concurrent or prior delivery of a fund prospectus. Investors should consider the investment objectives, risks, charges and expenses of a mutual fund carefully before investing. For a free prospectus, which contains this and other important information about the funds, visit columbiamanagement.com. Read the prospectus carefully before investing. The Fund is distributed by Columbia Management Investment Distributors, Inc., member FINRA, and managed by Columbia Management Investment Advisers, LLC.
© 2012 Columbia Management Investment Advisers, LLC. All rights reserved.
C-1051 C (1/12)
Item 2. Code of Ethics.
(a) The registrant has adopted a code of ethics that applies to the registrant’s principal executive officer, principal financial officer, principal accounting officer or controller, or persons performing similar functions, regardless of whether these individuals are employed by the registrant or a third party.
(b) During the period covered by this report, there were not any amendments to a provision of the code of ethics adopted in 2(a) above.
(c) During the period covered by this report, there were no waivers, including any implicit waivers, from a provision of the code of ethics described in 2(a) above that relates to one or more of the items set forth in paragraph (b) of this item’s instructions.
Item 3. Audit Committee Financial Expert.
The registrant’s Board of Trustees has determined that Douglas A. Hacker, David M. Moffett, Charles R. Nelson and Anne-Lee Verville, each of whom are members of the registrant’s Board of Trustees and Audit Committee, each qualify as an audit committee financial expert. Mr. Hacker, Mr. Moffett, Mr. Nelson and Ms. Verville are each independent trustees, as defined in paragraph (a)(2) of this item’s instructions.
Item 4. Principal Accountant Fees and Services.
Fee information below is disclosed for the one series of the registrant whose report to stockholders are included in this annual filing.
(a) Audit Fees. Aggregate Audit Fees billed by the principal accountant for professional services rendered during the fiscal years ended November 30, 2011 and November 30, 2010 are approximately as follows:
2011 | | 2010 | |
$ | 53,700 | | $ | 58,200 | |
| | | | | |
Audit Fees include amounts related to the audit of the registrant’s annual financial statements or services that are normally provided by the accountant in connection with statutory and regulatory filings or engagements for those fiscal years.
(b) Audit-Related Fees. Aggregate Audit-Related Fees billed to the registrant by the principal accountant for professional services rendered during the fiscal years ended November 30, 2011 and November 30, 2010 are approximately as follows:
Audit-Related Fees include amounts for assurance and related services by the principal accountant that are reasonably related to the performance of the audit of the registrant’s financial statements and are not reported in Audit Fees above. In both fiscal years 2011 and 2010, Audit-Related Fees consist of agreed-upon procedures performed for semi-annual shareholder reports. Fiscal year 2011 also includes Audit-Related Fees for agreed- upon procedures related to fund mergers and fund accounting and custody conversions.
During the fiscal years ended November 30, 2011 and November 30, 2010, there were no Audit-Related Fees billed by the registrant’s principal accountant to the registrant’s investment adviser (not including any sub-adviser whose role is primarily portfolio management and is subcontracted with or overseen by another investment adviser) and any entity controlling, controlled by, or under common control with the adviser that provides ongoing services to the registrant for an engagement that related directly to the operations and financial reporting of the registrant.
(c) Tax Fees. Aggregate Tax Fees billed by the principal accountant to the registrant for professional services rendered during the fiscal years ended November 30, 2011 and November 30, 2010 are approximately as follows:
Tax Fees include amounts for the review of annual tax returns, the review of required shareholder distribution calculations and typically include amounts for professional services by the principal accountant for tax compliance, tax advice and tax planning. In fiscal year 2011, Tax Fees also include agreed-upon procedures related to amortization and accretion testing.
During the fiscal years ended November 30, 2011 and November 30, 2010, there were no Tax Fees billed by the registrant’s principal accountant to the registrant’s investment adviser (not including any sub-adviser whose role is primarily portfolio management and is subcontracted with or overseen by another investment adviser) and any entity controlling, controlled by, or under common control with the adviser that provides ongoing services to the registrant for an engagement that related directly to the operations and financial reporting of the registrant.
(d) All Other Fees. Aggregate All Other Fees billed by the principal accountant to the registrant for professional services rendered during the fiscal years ended November 30, 2011 and November 30, 2010 are approximately as follows:
All Other Fees include amounts for products and services provided by the principal accountant, other than the services reported in paragraphs (a) through (c) above.
Aggregate All Other Fees billed by the registrant’s principal accountant to the registrant’s investment adviser (not including any sub-adviser whose role is primarily portfolio management and is subcontracted with or overseen by another investment adviser) and any entity controlling, controlled by, or under common control with the adviser that provides ongoing services to the registrant for an engagement that related directly to the operations and financial reporting of the registrant during the fiscal years ended November 30, 2011 and November 30, 2010 are approximately as follows:
2011 | | 2010 | |
$ | 485,300 | | $ | 1,048,800 | |
| | | | | |
In both fiscal years 2011 and 2010, All Other Fees consist of fees billed for internal control examinations of the registrant’s transfer agent and investment advisor. Fiscal year 2010 also includes fees related to the review of revenue modeling schedules.
(e)(1) Audit Committee Pre-Approval Policies and Procedures
The registrant’s Audit Committee is required to pre-approve the engagement of the registrant’s independent accountants to provide audit and non-audit services to the registrant and non-audit services to its investment adviser (not including any sub-adviser whose role is primarily portfolio management and is subcontracted with or overseen by another investment adviser) or any entity controlling, controlled by or under common control with such investment adviser that provides ongoing services to the registrant (“Adviser Affiliates”), if the engagement relates directly to the operations and financial reporting of the registrant.
The Audit Committee has adopted a Policy for Engagement of Independent Accountants for Audit and Non-Audit Services (“Policy”). The Policy sets forth the understanding of the Audit Committee regarding the engagement of the registrant’s independent accountants to provide (i) audit and permissible audit-related, tax and other services to the registrant (collectively “Fund Services”); (ii) non-audit services to the registrant’s investment adviser (not including any sub-adviser whose role is primarily portfolio management and is subcontracted with or overseen by another investment adviser) and Adviser Affiliates, if the engagement relates directly to the operations or financial reporting of a Fund (collectively “Fund-related Adviser Services”); and (iii) certain other audit and non-audit services to the registrant’s investment adviser (not including any sub-adviser whose role is primarily portfolio management and is subcontracted with or overseen by another investment adviser) and Adviser Affiliates. As set forth in this Fund Policy, a service will require specific pre-approval by the Audit Committee if it is to be provided by the Fund’s independent auditor; provided, however, that pre-approval of
non-audit services to the Fund, the Adviser or Control Affiliates may be waived if certain de minimis requirements set forth in the SEC’s rules are met.
Under the Policy, the Audit Committee may delegate pre-approval authority to any pre-designated member or members who are Independent Trustees/Directors. The member(s) to whom such authority is delegated must report, for informational purposes only, any pre-approval decisions to the Audit Committee at its next regular meeting. The Audit Committee’s responsibilities with respect to the pre-approval of services performed by the independent accountants may not be delegated to management.
On an annual basis, at a regularly scheduled Audit Committee meeting, the Fund’s Treasurer or other Fund Officer shall submit to the Audit Committee a schedule of the types of Fund Services and Fund-related Adviser Services that are subject to specific pre-approval.
This schedule will provide a description of each type of service that is subject to specific pre-approval, along with total projected fees for each service. The pre-approval will generally cover a one-year period. The Audit Committee will review and approve the types of services and the projected fees for the next one-year period and may add to, or subtract from, the list of pre-approved services from time to time, based on subsequent determinations. This specific approval acknowledges that the Audit Committee is in agreement with the types of services that the independent accountants will be permitted to perform.
The Fund’s Treasurer or other Fund Officer shall report to the Audit Committee at each of its regular meetings regarding all Fund Services or Fund-related Adviser Services initiated since the last such report was rendered, including a general description of the services with forecasted fees for the annual period, proposed changes requiring specific pre-approval and a description of services provided by the independent auditor with actual fees during the current reporting period.
*****
(e)(2) The percentage of services described in paragraphs (b) through (d) of this Item approved pursuant to the “de minimis” exception under paragraph (c)(7)(i)(C) of Rule 2-01 of Regulation S-X during both fiscal years ended November 30, 2011 and November 30, 2010 was zero.
(f) Not applicable.
(g) The aggregate non-audit fees billed by the registrant’s accountant for services rendered to the registrant, and rendered to the registrant’s investment adviser (not including any sub-adviser whose role is primarily portfolio management and is subcontracted with or overseen by another investment adviser), and any entity controlling, controlled by, or under common control with the adviser that provides ongoing services to the registrant for the fiscal years ended November 30, 2011 and November 30, 2010 are approximately as follows:
2011 | | 2010 | |
$ | 509,100 | | $ | 1,061,200 | |
| | | | | |
(h) The registrant’s Audit Committee of the Board of Directors has considered whether the provision of non-audit services that were rendered to the registrant’s adviser (not including any sub-adviser whose role is primarily portfolio management and is subcontracted with or overseen by another investment adviser), and any entity controlling, controlled by, or under common control with the investment adviser that provides ongoing services to the registrant that were not pre-approved pursuant to paragraph (c)(7)(ii) of Rule 2-01 of Regulation S-X, is compatible with maintaining the principal accountant’s independence.
Item 5. Audit Committee of Listed Registrants.
Not applicable.
Item 6. Investments
(a) The registrant’s “Schedule I — Investments in securities of unaffiliated issuers” (as set forth in 17 CFR 210.12-12) is included in Item 1 of this Form N-CSR.
(b) Not applicable.
Item 7. Disclosure of Proxy Voting Policies and Procedures for Closed-End Management Investment Companies.
Not applicable.
Item 8. Portfolio Managers of Closed-End Management Investment Companies.
Not applicable.
Item 9. Purchases of Equity Securities by Closed-End Management Investment Company and Affiliated Purchasers.
Not applicable.
Item 10. Submission of Matters to a Vote of Security Holders.
There were no material changes to the procedures by which shareholders may recommend nominees to the registrant’s board of directors.
Item 11. Controls and Procedures.
(a) The registrant’s principal executive officer and principal financial officers, based on their evaluation of the registrant’s disclosure controls and procedures as of a
date within 90 days of the filing of this report, have concluded that such controls and procedures are adequately designed to ensure that material information required to be disclosed by the registrant in Form N-CSR is accumulated and communicated to the registrant’s management, including the principal executive officer and principal financial officer, or persons performing similar functions, as appropriate to allow timely decisions regarding required disclosure.
(b) There was no change in the registrant’s internal control over financial reporting that occurred during the registrant’s second fiscal quarter of the period covered by this report that has materially affected, or is reasonably likely to materially affect, the registrant’s internal control over financial reporting.
Item 12. Exhibits.
(a)(1) Code of ethics required to be disclosed under Item 2 of Form N-CSR attached hereto as Exhibit 99.CODE ETH.
(a)(2) Certifications pursuant to Rule 30a-2(a) under the Investment Company Act of 1940 (17 CFR 270.30a-2(a)) attached hereto as Exhibit 99.CERT.
(a)(3) Not applicable.
(b) Certification pursuant to Rule 30a-2(b) under the Investment Company Act of 1940 (17 CFR 270.30a-2(b)) attached hereto as Exhibit 99.906CERT.
SIGNATURES
Pursuant to the requirements of the Securities Exchange Act of 1934 and the Investment Company Act of 1940, the registrant has duly caused this report to be signed on its behalf by the undersigned, thereunto duly authorized.
(registrant) | | Columbia Funds Series Trust I | |
| | |
| | |
By (Signature and Title) | | /s/ J. Kevin Connaughton | |
| J. Kevin Connaughton, President | |
| | |
| | |
Date | | January 20, 2012 | |
| | | | | |
Pursuant to the requirements of the Securities Exchange Act of 1934 and the Investment Company Act of 1940, this report has been signed below by the following persons on behalf of the registrant and in the capacities and on the dates indicated.
By (Signature and Title) | | /s/ J. Kevin Connaughton | |
| J. Kevin Connaughton, President | |
| | |
| | |
Date | | January 20, 2012 | |
| | |
| | |
By (Signature and Title) | | /s/ Michael G. Clarke | |
| Michael G. Clarke, Chief Financial Officer | |
| | |
| | |
Date | | January 20, 2012 | |
| | | | |