UNITED STATES
SECURITIES AND EXCHANGE COMMISSION
Washington, D.C. 20549
FORM N-CSR
CERTIFIED SHAREHOLDER REPORT OF REGISTERED
MANAGEMENT INVESTMENT COMPANIES
Investment Company Act file number | 811-04367 |
|
Columbia Funds Series Trust I |
(Exact name of registrant as specified in charter) |
|
225 Franklin Street, Boston, Massachusetts | | 02110 |
(Address of principal executive offices) | | (Zip code) |
|
Scott R. Plummer 5228 Ameriprise Financial Center Minneapolis, MN 55474 |
(Name and address of agent for service) |
|
Registrant’s telephone number, including area code: | 1-612-671-1947 | |
|
Date of fiscal year end: | April 30 | |
|
Date of reporting period: | April 30, 2012 | |
| | | | | | | | |
Form N-CSR is to be used by management investment companies to file reports with the Commission not later than 10 days after the transmission to stockholders of any report that is required to be transmitted to stockholders under Rule 30e-1 under the Investment Company Act of 1940 (17 CFR 270.30e-1). The Commission may use the information provided on Form N-CSR in its regulatory, disclosure review, inspection, and policymaking roles.
A registrant is required to disclose the information specified by Form N-CSR, and the Commission will make this information public. A registrant is not required to respond to the collection of information contained in Form N-CSR unless the Form displays a currently valid Office of Management and Budget (“OMB”) control number. Please direct comments concerning the accuracy of the information collection burden estimate and any suggestions for reducing the burden to Secretary, Securities and Exchange Commission, 450 Fifth Street, NW, Washington, DC 20549-0609. The OMB has reviewed this collection of information under the clearance requirements of 44 U.S.C. § 3507.
Item 1. Reports to Stockholders.

Columbia Bond Fund
Annual Report for the Period Ended April 30, 2012
Not FDIC insured • No bank guarantee • May lose value
Table of Contents
| Fund Profile | | | 1 | | |
|
| Performance Information | | | 2 | | |
|
| Understanding Your Expenses | | | 3 | | |
|
| Portfolio Managers' Report | | | 4 | | |
|
| Portfolio of Investments | | | 6 | | |
|
Statement of Assets and
Liabilities | | | 20 | | |
|
| Statement of Operations | | | 22 | | |
|
Statement of Changes in
Net Assets | | | 23 | | |
|
| Financial Highlights | | | 25 | | |
|
| Notes to Financial Statements | | | 34 | | |
|
Report of Independent Registered
Public Accounting Firm | | | 48 | | |
|
| Federal Income Tax Information | | | 49 | | |
|
| Fund Governance | | | 50 | | |
|
Important Information About
This Report | | | 57 | | |
|
The views expressed in this report reflect the current views of the respective parties. These views are not guarantees of future performance and involve certain risks, uncertainties and assumptions that are difficult to predict, so actual outcomes and results may differ significantly from the views expressed. These views are subject to change at any time based upon economic, market or other conditions and the respective parties disclaim any responsibility to update such views. These views may not be relied on as investment advice and, because investment decisions for a Columbia Fund are based on numerous factors, may not be relied on as an indication of trading intent on behalf of any particular Columbia Fund. References to specific securities should not be construed as a recommendation or investment advice.
President's Message

Dear Shareholders,
A stock market rally that commenced in the fourth quarter of 2011 continued into 2012 in the United States and around the world, as all major market regions generated double-digit returns for the three-month period ended March 31, 2012. Volatility declined sharply as European debt fears quieted somewhat and sentiment improved. Returns in developed countries were buoyed by strong results in Germany, Belgium, Austria and the Nordic markets of Denmark, Finland, Norway and Sweden. Under the cloud of its own mounting debt problem, Spain was the only eurozone country to deliver a negative return during the three-month period. Solid economic growth and accommodative monetary policy helped boost gains in emerging markets. The rally in U.S. equities was largely driven by an expansion in "multiples"—an increase in stock prices relative to their earnings. By the end of the first quarter of 2012, stocks no longer appeared as cheap as they were late in 2011. Bonds lagged stocks during the first quarter as investors responded to signs of an improved environment with a greater appetite for risk.
Concerns around the health of the global economy were centered in news headlines focusing on Washington D.C., Europe, China and the Middle East. In the United States, economic indicators remained mixed but generally indicated support for slow, sustainable economic growth. European policymakers have made progress in containing the eurozone debt crisis, though they still have not solved the issue of long-term solvency. The European Central Bank has lowered interest rates and flooded the financial system with liquidity that may provide breathing space for companies to restructure their balance sheets. These massive infusions of liquidity may whet the appetite for risk from investors around the world. However, it has delayed a true reckoning with the European financial situation, as concerns about Spain and Portugal continue to cloud the outlook. These structural challenges that persist in the developed world, and slowing growth in emerging market economies, leave the global economy in a fragile state. Domestic demand, combined with slowing inflationary trends, has also helped to shore up emerging market economies. Joblessness remains low and monetary conditions remain easy.
Despite the challenges and surprises of 2011, we see pockets of strength—and as a result, attractive opportunities—both here and abroad for 2012. We hope to help you capitalize on these opportunities with various articles in our 2012 Perspectives, which is available via the Market Insights tab at columbiamanagement.com. This publication showcases the strong research capabilities and experienced investment teams of Columbia Management and offers a diverse array of investment ideas based on our five key themes for 2012.
Other information and resources available at columbiamanagement.com include:
> detailed up-to-date fund performance and portfolio information
> economic analysis and market commentary
> quarterly fund commentaries
> Columbia Management Investor, our award-winning quarterly newsletter for shareholders
Thank you for your continued support of the Columbia Funds. We look forward to serving your investment needs for many years to come.
Best Regards,

J. Kevin Connaughton
President, Columbia Funds
Investors should consider the investment objectives, risks, charges and expenses of a mutual fund carefully before investing. For a free prospectus, which contains this and other important information about the funds, visit columbiamanagement.com. The prospectus should be read carefully before investing.
Columbia Funds are distributed by Columbia Management Investment Distributors, Inc., member FINRA, and managed by Columbia Management Investment Advisers, LLC.
© 2012 Columbia Management Investment Advisers, LLC. All rights reserved.
Fund Profile – Columbia Bond Fund
Summary
g For the 13-month period that ended April 30, 2012, the fund's Class A shares returned 8.51% without sales charge.
g The fund underperformed its benchmark, the Barclays Aggregate Bond Index1, which returned 8.91%.
g The fund's asset allocations were largely favorable, but a shorter-than-average maturity profile created a modest performance disadvantage compared to the index.
Portfolio Management
Alexander D. Powers, lead manager, has co-managed the fund since or the predecessor fund since 1997. From 1996 until joining Columbia Management Advisers, LLC (the Investment Manager) in May 2010, Mr. Powers was associated with the fund's previous investment adviser as an investment professional.
Carl Pappo has co-managed the fund or the predecessor fund since 2010. From 1993 until joining the Investment Manager in May 2010, Mr. Pappo was associated with the fund's previous investment adviser as an investment professional.
Michael Zazzarino has co-managed the fund or the predecessor fund since 2005. From 2005 until joining the Investment Manager in May 2010, Mr. Zazzarino was associated with the fund's previous investment adviser as an investment professional.
1The Barclays Aggregate Bond Index is a market value-weighted index that tracks the daily price, coupon, pay-downs, and total return performance of fixed-rate, publicly placed, dollar-denominated, and non-convertible investment grade debt issues with at least $250 million par amount outstanding and with at least one year to final maturity.
Indices are not available for investment, are not professionally managed and do not reflect sales charges, fees, brokerage commissions, taxes or other expenses of investing. Securities in the fund may not match those in an index.
Performance data quoted represents past performance and current performance may be lower or higher. Past performance is no guarantee of future results. The investment return and principal value will fluctuate so that shares, when redeemed, may be worth more or less than the original cost. Please visit www.columbiamanagement.com for daily and most recent month-end performance updates.
Summary
13-month (cumulative) return as of 04/30/12
| | +8.51% | |
|
|  | | | Class A shares
(without sales charge) | |
|
| | +8.91% | |
|
|  | | | Barclays Aggregate Bond Index | |
|
1
Performance Information – Columbia Bond Fund
Performance data quoted represents past performance and current performance may be lower or higher. Past performance is no guarantee of future results. The investment return and principal value will fluctuate so that shares, when redeemed, may be worth more or less than the original cost. Please visit www.columbiamanagement.com for daily and most recent month-end performance updates.
Performance of a $10,000 investment 05/01/02 – 04/30/12
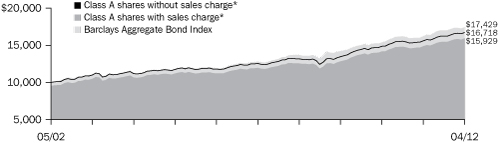
The chart above shows the change in value of a hypothetical $10,000 investment in Class A shares of Columbia Bond Fund during the stated time period, and does not reflect the deduction of taxes that a shareholder may pay on fund distributions or on the redemption of fund shares.
Performance of a $10,000 investment 05/01/02 – 04/30/12 ($)
| Sales charge | | without | | with | |
| Class A* | | | 16,718 | | | | 15,929 | | |
| Class B* | | | 15.527 | | | | 15,527 | | |
| Class C* | | | 15,583 | | | | 15,583 | | |
| Class I* | | | 17,167 | | | | n/a | | |
| Class R* | | | 16,048 | | | | n/a | | |
| Class T* | | | 16,901 | | | | 16,104 | | |
| Class W* | | | 16,735 | | | | n/a | | |
| Class Y* | | | 17,184 | | | | n/a | | |
| Class Z | | | 17,154 | | | | n/a | | |
Average annual total return as of 04/30/12 (%)
| Share class | | A* | | B* | | C* | | I* | | R* | | T* | | W* | | Y* | | Z | |
| Inception | | 3/31/08 | | 03/07/11 | | 03/31/08 | | 09/27/10 | | 11/16/11 | | 03/07/11 | | 09/27/10 | | 07/15/09 | | 01/09/86 | |
| Sales charge | | without | | with | | without | | with | | without | | with | | without | | without | | without | | with | | without | | without | | without | |
1-month
(cumulative) | | | 1.08 | | | | –3.68 | | | | 1.02 | | | | –3.98 | | | | 1.03 | | | | 0.03 | | | | 1.21 | | | | 1.06 | | | | 1.20 | | | | –3.58 | | | | 1.09 | | | | 1.11 | | | | 1.10 | | |
| 1-year | | | 7.15 | | | | 2.01 | | | | 6.34 | | | | 1.34 | | | | 6.50 | | | | 5.50 | | | | 7.46 | | | | 6.81 | | | | 7.27 | | | | 2.22 | | | | 7.03 | | | | 7.35 | | | | 7.42 | | |
| 5-year | | | 5.91 | | | | 4.88 | | | | 5.14 | | | | 4.81 | | | | 5.17 | | | | 5.17 | | | | 6.21 | | | | 5.50 | | | | 6.03 | | | | 5.00 | | | | 5.93 | | | | 6.23 | | | | 6.19 | | |
| 10-year | | | 5.27 | | | | 4.77 | | | | 4.50 | | | | 4.50 | | | | 4.54 | | | | 4.54 | | | | 5.55 | | | | 4.84 | | | | 5.39 | | | | 4.88 | | | | 5.28 | | | | 5.56 | | | | 5.54 | | |
The "with sales charge" returns include the maximum initial sales charge of 4.75% for Class A shares and the applicable contingent deferred sales charge of 1.00% for Class C shares for the first year only. The "without sales charge" returns do not include the effect of sales charges. If they had, returns would be lower.
Performance results reflect any fee waivers or reimbursements of fund expenses by the investment advisor and/or any of its affiliates. Absent these fee waivers or expense reimbursement arrangements, performance results would have been lower.
All results shown assume reinvestment of distributions. Class I, Y and Z shares are sold at net asset value with no distribution and service (Rule 12b-1) fees. Class W shares are sold at net asset value with a distribution (12b-1) fee. Class I, W, Y and Z shares have limited eligibility and the investment minimum requirements may vary. Please see the fund's prospectuses for details. Performance for different share classes will vary based on differences in sales charges and fees associated with each class.
The tables do not reflect the deduction of taxes that a shareholder may pay on fund distributions or on the redemption of fund shares.
*The returns shown for periods prior to the share class inception date (including returns since inception) include the returns of the fund's oldest share class. These returns are adjusted to reflect any higher class-related operating expenses of the newer share classes, as applicable. Please visit columbiamanagement.com/mutual-funds/appended-performance for more information.
2
Understanding Your Expenses – Columbia Bond Fund
As an investor, you incur two types of costs. There are transaction costs, which generally include sales charges on purchases and may include redemption fees. There are also ongoing costs, which generally include management fees, distribution and service (Rule 12b-1) fees, and other fund expenses. The following information is intended to help you understand your ongoing costs (in dollars) of investing in the Fund and to help you compare these costs with the ongoing costs of investing in other mutual funds.
Analyzing your fund's expenses
To illustrate these ongoing costs, we have provided examples and calculated the expenses paid by investors in each share class of the Fund during the period. The actual and hypothetical information in the table is based on an initial investment of $1,000 at the beginning of the period indicated and held for the entire period. Expense information is calculated two ways and each method provides you with different information. The amount listed in the "Actual" column is calculated using the Fund's actual operating expenses and total return for the period. You may use the Actual information, together with the amount invested, to estimate the expenses that you paid over the period. Simply divide your account value by $1,000 (for example, an $8,600 account value divided by $1,000 = 8.6), then multiply the results by the expenses paid during the period under the Actual column. The amount listed in the "Hypothetical" column assumes a 5% annual rate of return before expenses (which is not the Fund's actual return) and then applies the Fund's actual expense ratio for the period to the hypothetical return. You should not use the hypothetical account values and expenses to estimate either your actual account balance at the end of the period or the expenses you paid during the period. See "Compare with other funds" below for details on how to use the hypothetical data.
Compare with other funds
Since all mutual funds are required to include the same hypothetical calculations about expenses in shareholder reports, you can use this information to compare the ongoing cost of investing in the Fund with other funds. To do so, compare the hypothetical example with the 5% hypothetical examples that appear in the shareholder reports of other funds. As you compare hypothetical examples of other funds, it is important to note that hypothetical examples are meant to highlight the ongoing costs of investing in a fund only and do not reflect any transaction costs, such as sales charges, or redemption or exchange fees. Therefore, the hypothetical calculations are useful in comparing ongoing costs only, and will not help you determine the relative total costs of owning different funds. If transaction costs were included in these calculations, your costs would be higher.
November 1, 2011 – April 30, 2012
| | | Account value at the
beginning of the period ($) | | Account value at the
end of the period ($) | | Expenses paid
during the period ($) | | Fund's annualized
expense ratio (%) | |
| | | Actual | | Hypothetical | | Actual | | Hypothetical | | Actual | | Hypothetical | | Actual | |
| Class A | | | 1,000.00 | | | | 1,000.00 | | | | 1,030.30 | | | | 1,020.89 | | | | 4.04 | | | | 4.02 | | | | 0.80 | | |
| Class B | | | 1,000.00 | | | | 1,000.00 | | | | 1,026.50 | | | | 1,017.16 | | | | 7.81 | | | | 7.77 | | | | 1.55 | | |
| Class C | | | 1,000.00 | | | | 1,000.00 | | | | 1,026.10 | | | | 1,017.80 | | | | 7.15 | | | | 7.12 | | | | 1.42 | | |
| Class I | | | 1,000.00 | | | | 1,000.00 | | | | 1,030.70 | | | | 1,022.33 | | | | 2.57 | | | | 2.56 | | | | 0.51 | | |
| Class R | | | 1,000.00 | | | | 1,000.00 | | | | 1,028.30 | * | | | 1,019.69 | | | | 4.75 | * | | | 5.22 | | | | 1.04 | * | |
| Class T | | | 1,000.00 | | | | 1,000.00 | | | | 1,030.80 | | | | 1,021.38 | | | | 3.53 | | | | 3.52 | | | | 0.70 | | |
| Class W | | | 1,000.00 | | | | 1,000.00 | | | | 1,029.10 | | | | 1,020.93 | | | | 3.99 | | | | 3.97 | | | | 0.79 | | |
| Class Y | | | 1,000.00 | | | | 1,000.00 | | | | 1,030.70 | | | | 1,022.33 | | | | 2.57 | | | | 2.56 | | | | 0.51 | | |
| Class Z | | | 1,000.00 | | | | 1,000.00 | | | | 1,030.50 | | | | 1,022.13 | | | | 2.78 | | | | 2.77 | | | | 0.55 | | |
*For the period November 16, 2011 through April 30, 2012. Class R shares commenced operations on November 16, 2011.
Expenses paid during the period are equal to the annualized expense ratio for each class as indicated above, multiplied by the average account value over the period and then multiplied by the number of days in the Fund's most recent fiscal half year and divided by 366.
Expenses do not include fees and expenses incurred indirectly by the Fund from the underlying funds in which the Fund may invest (also referred to as "acquired funds"), including affiliated and non-affiliated pooled investments vehicles (including mutual funds and exchange traded funds).
Had Columbia Management Investment Advisers, LLC and/or certain of its affiliates not waived/reimbursed certain fees and expenses, account value at the end of the period would have been reduced.
3
Portfolio Managers' Report – Columbia Bond Fund
Performance data quoted represents past performance and current performance may be lower or higher. Past performance is no guarantee of future results. The investment return and principal value will fluctuate so that shares, when redeemed, may be worth more or less than the original cost. Please visit www.columbiamanagement.com for daily and most recent month-end performance updates.
Portfolio breakdown1
(at April 30, 2012) (%)
| Corporate Bonds & Notes | | | 25.8 | | |
Residential Mortgage-Backed
Securities—Agency | | | 35.8 | | |
Residential Mortgage-Backed
Securities—Non-Agency | | | 0.4 | | |
Commercial Mortgage-Backed
Securities—Agency | | | 2.0 | | |
Commercial Mortgage-Backed
Securities—Non-Agency | | | 15.1 | | |
Asset-Backed Securities—
Non-Agency | | | 1.9 | | |
| U.S. Treasury Obligations | | | 9.7 | | |
U.S. Government & Agency
Obligations | | | 2.3 | | |
| Foreign Government Obligations | | | 0.9 | | |
| Municipal Bonds | | | 1.1 | | |
| Common Stocks | | | 0.0 | * | |
| Preferred Debt | | | 0.5 | | |
| Treasury Note Short-Term | | | 4.1 | | |
| Other2 | | | 0.4 | | |
*Rounds to less than 0.1%.
1Percentages indicated are based upon total investments (excluding Investments of Cash Collateral Received for Securities on Loan). The Fund's portfolio composition is subject to change.
2Includes investments in money market funds.
Quality breakdown1
(at April 30, 2012) (%)
| AAA rating | | | 67.4 | | |
| AA rating | | | 4.1 | | |
| A rating | | | 11.2 | | |
| BBB rating | | | 16.3 | | |
| Non-investment grade | | | 0.8 | | |
| Not rated | | | 0.2 | | |
1Percentages indicated are based upon total fixed income securities (excluding Investments of Cash Collateral Received for Securities on Loan and money market funds).
Bond ratings apply to the underlying holdings of the Fund and not the Fund itself and are divided into categories ranging from AAA (highest) to D (lowest), and are subject to change. The ratings shown are determined by using the middle rating of Moody's, S&P, and Fitch after dropping the highest and lowest available ratings. When a rating from only two agencies is available, the lower rating is used. When a rating from only one agency is available, that rating is used. When a bond is not rated by one of these agencies, it is designated as Not rated. Credit ratings are subjective to opinions and not statements of fact.
The Board of Trustees for Columbia Bond Fund has approved the change of the fund's fiscal year end from March 31 to April 30. As a result, this report covers the 13-month period since the last annual report. The next report you receive will be for the six-month period from May 1, 2012 through October 31, 2012.
For the 13-month period that ended April 30, 2012, the fund's Class A shares returned 8.51% without sales charge. The fund's benchmark, the Barclays Aggregate Bond Index, returned 8.91% for the same period. This performance shortfall can be accounted for by the fund's relatively short maturity profile during the period. Holding longer-term securities was rewarded as interest rates declined.
A shifting economic environment
During this period, the fixed-income markets behaved largely in accordance with investors' changing views about the strength of the economic recovery. Early in the period, when investors were optimistic that the U.S. economy had turned a corner, corporate bonds and other riskier fixed-income assets tended to outperform Treasury securities. This trend reversed itself sharply in August 2011, when the European sovereign crisis erupted and financial markets experienced a global selloff. Riskier assets enjoyed a recovery in the fourth quarter of 2011, but the dual threats of unemployment at home and structural risks in Europe have kept a lid on investor optimism.
Corporate and commercial mortgage-backed overweight added performance
Against this backdrop, the fund maintained an overweight position in corporate bonds and commercial mortgage-backed securities. While this overweight, on balance, aided the portfolio, the fund elected to reduce holdings somewhat in these sectors during the summer of 2011, preferring to increase exposure to low-coupon agency mortgages when the Federal Reserve Board (the Fed) indicated a commitment to support that segment of the market. In addition, the yield advantage of corporate bonds versus Treasury securities had declined to the point where we felt that upside potential had been reduced, especially given the economic uncertainties created by the deteriorating situation in Europe. This move toward risk aversion made a positive contribution to the fund's relative performance.
Toward the end of 2011, the fund began to buy back corporates and other riskier assets, given their interim price declines, as well as an apparent improvement in European financials. The new corporate bond purchases emphasized the financial sector, which we felt came out of the market decline with a more attractive risk-reward profile than industrial bonds and other alternative sectors.
The portfolio maintained roughly this same asset allocation for the remainder of the period, with the total amount devoted to higher-risk assets not substantially different from where we began, but with a different composition. The fund's maturity profile was increased in the first quarter of 2012 after having been shorter than the index throughout the period. Given the trend toward lower rates (for example, yields on the 10-year bond dropped from 3.29% to 1.92% during the period), these short maturities hurt the fund's relative performance.
4
Portfolio Manager's Report (continued) – Columbia Bond Fund
Looking ahead
We plan to continue to monitor the fixed-income initiatives of the Fed in an effort to achieve the ideal asset mix. As the economic recovery continues to languish, we consider it increasingly likely that the central bank will initiate another round of quantitative easing—a program designed to increase the money supply at a time when the discount rate and other standard interest rate benchmarks are already close to zero. We would not be surprised to see such an effort emerge during the summer of 2012, when other forms of Fed stimulus will have reached their stated cutoff points. We also acknowledge the possibility that interest rates will go up, given the slight but measurable increase in inflation over the past year. Corporations have been reluctant to pass on higher costs to consumers during these difficult economic times, but at some point the cumulative effect of even a small amount of inflation could limit the Fed's ability to keep interest rates at historically low levels.
Portfolio characteristics and holdings are subject to change periodically and may not be representative of current characteristics and holdings. The outlook for the fund may differ from that presented for other Columbia Funds.
Investing in fixed-income securities may involve certain risks, including the credit quality of individual issuers, possible prepayments, market or economic developments and yields and share price fluctuations due to changes in interest rates. When interest rates go up, bond prices typically drop, and vice versa.
5
Portfolio of Investments – Columbia Bond Fund
April 30, 2012
(Percentages represent value of investments compared to net assets)
| Issuer | | Coupon
Rate | | Principal
Amount | | Value | |
| Corporate Bonds & Notes 26.9% | |
| Aerospace & Defense 0.3% | |
| L-3 Communications Corp. | |
| 02/15/21 | | | 4.950 | % | | $ | 2,995,000 | | | $ | 3,204,952 | | |
Raytheon Co.
Senior Unsecured | |
| 08/15/27 | | | 7.200 | % | | | 1,600,000 | | | | 2,131,821 | | |
| Total | | | 5,336,773 | | |
| Airlines —% | |
| Continental Airlines 1997-1 Class A Pass-Through Trust | |
| 04/01/15 | | | 7.461 | % | | | 158,942 | | | | 160,730 | | |
| Banking 6.0% | |
Bank of America Corp.
Senior Unsecured | |
| 01/24/22 | | | 5.700 | % | | | 9,965,000 | | | | 10,460,958 | | |
| 02/07/42 | | | 5.875 | % | | | 2,635,000 | | | | 2,604,044 | | |
Barclays Bank PLC
Senior Unsecured | |
| 09/22/16 | | | 5.000 | % | | | 4,465,000 | | | | 4,817,681 | | |
| Capital One/IV(a) | |
| 02/17/37 | | | 6.745 | % | | | 3,705,000 | | | | 3,705,000 | | |
| Capital One/V | |
| 08/15/39 | | | 10.250 | % | | | 3,960,000 | | | | 4,128,300 | | |
Citigroup, Inc.
Senior Unsecured | |
| 01/10/17 | | | 4.450 | % | | | 2,900,000 | | | | 3,029,349 | | |
| 01/30/42 | | | 5.875 | % | | | 2,765,000 | | | | 2,941,424 | | |
Comerica Bank
Subordinated Notes | |
| 08/22/17 | | | 5.200 | % | | | 1,940,000 | | | | 2,164,741 | | |
Discover Bank
Subordinated Notes | |
| 11/18/19 | | | 8.700 | % | | | 3,735,000 | | | | 4,710,974 | | |
Fifth Third Bancorp
Senior Unsecured | |
| 01/25/16 | | | 3.625 | % | | | 3,190,000 | | | | 3,383,397 | | |
HSBC Holdings PLC
Senior Unsecured | |
| 01/14/22 | | | 4.875 | % | | | 530,000 | | | | 571,555 | | |
HSBC USA, Inc.
Subordinated Notes | |
| 09/27/20 | | | 5.000 | % | | | 4,125,000 | | | | 4,177,020 | | |
ING Bank NV
Senior Unsecured(b) | |
| 03/15/16 | | | 4.000 | % | | | 2,960,000 | | | | 3,003,243 | | |
| JPMorgan Chase & Co.(a) | |
| 04/29/49 | | | 7.900 | % | | | 1,205,000 | | | | 1,320,246 | | |
| JPMorgan Chase Capital XVIII | |
| 08/17/36 | | | 6.950 | % | | | 380,000 | | | | 380,950 | | |
| JPMorgan Chase Capital XX | |
| 09/29/36 | | | 6.550 | % | | | 5,753,000 | | | | 5,774,574 | | |
| JPMorgan Chase Capital XXII | |
| 02/02/37 | | | 6.450 | % | | | 5,646,000 | | | | 5,646,000 | | |
| JPMorgan Chase Capital XXIII(a) | |
| 05/15/47 | | | 1.503 | % | | | 805,000 | | | | 595,717 | | |
KeyCorp
Senior Unsecured | |
| 03/24/21 | | | 5.100 | % | | | 5,390,000 | | | | 6,059,239 | | |
| Issuer | | Coupon
Rate | | Principal
Amount | | Value | |
| Corporate Bonds & Notes (continued) | |
| Banking (cont.) | |
Lloyds TSB Bank PLC
Bank Guaranteed(b) | |
| 01/12/15 | | | 4.375 | % | | $ | 3,890,000 | | | $ | 3,978,750 | | |
Merrill Lynch & Co., Inc.
Senior Unsecured | |
| 02/03/14 | | | 5.000 | % | | | 3,085,000 | | | | 3,185,975 | | |
| Subordinated Notes | |
| 05/02/17 | | | 5.700 | % | | | 1,465,000 | | | | 1,502,632 | | |
| National City Preferred Capital Trust I(a)(c) | |
| 12/31/49 | | | 12.000 | % | | | 1,658,000 | | | | 1,764,775 | | |
| PNC Financial Services Group, Inc.(a) | |
| 07/29/49 | | | 6.750 | % | | | 2,560,000 | | | | 2,683,315 | | |
Scotland International Finance No. 2 BV
Bank Guaranteed(b) | |
| 05/23/13 | | | 4.250 | % | | | 1,700,000 | | | | 1,699,820 | | |
| State Street Corp. | |
| 03/15/18 | | | 4.956 | % | | | 3,640,000 | | | | 3,857,097 | | |
State Street Corp.(c)
Senior Unsecured | |
| 03/07/16 | | | 2.875 | % | | | 1,785,000 | | | | 1,879,005 | | |
| USB Capital XIII Trust | |
| 12/15/39 | | | 6.625 | % | | | 2,170,000 | | | | 2,212,814 | | |
Wells Fargo & Co.
Senior Unsecured(a) | |
| 06/15/16 | | | 3.676 | % | | | 11,160,000 | | | | 11,972,928 | | |
Westpac Banking Corp.
Senior Unsecured(c) | |
| 12/09/15 | | | 3.000 | % | | | 1,100,000 | | | | 1,141,005 | | |
| Total | | | 105,352,528 | | |
| Brokerage 0.1% | |
Eaton Vance Corp.
Senior Unsecured | |
| 10/02/17 | | | 6.500 | % | | | 1,255,000 | | | | 1,435,118 | | |
| Chemicals 0.7% | |
Dow Chemical Co. (The)
Senior Unsecured | |
| 05/15/18 | | | 5.700 | % | | | 2,125,000 | | | | 2,469,883 | | |
| 05/15/19 | | | 8.550 | % | | | 2,750,000 | | | | 3,646,519 | | |
| 05/15/39 | | | 9.400 | % | | | 150,000 | | | | 234,522 | | |
Dow Chemical Co. (The)(c)
Senior Unsecured | |
| 11/15/20 | | | 4.250 | % | | | 2,335,000 | | | | 2,478,250 | | |
| Lubrizol Corp. | |
| 02/01/19 | | | 8.875 | % | | | 2,305,000 | | | | 3,155,737 | | |
| Total | | | 11,984,911 | | |
| Diversified Manufacturing 0.2% | |
| Tyco International Ltd./Finance SA | |
| 01/15/21 | | | 6.875 | % | | | 2,460,000 | | | | 3,114,901 | | |
| Electric 2.5% | |
Alabama Power Co.
Senior Unsecured | |
| 03/15/41 | | | 5.500 | % | | | 1,635,000 | | | | 2,017,320 | | |
The Accompanying Notes to Financial Statements are an integral part of this statement.
6
Columbia Bond Fund
April 30, 2012
(Percentages represent value of investments compared to net assets)
| Issuer | | Coupon
Rate | | Principal
Amount | | Value | |
| Corporate Bonds & Notes (continued) | |
| Electric (cont.) | |
Commonwealth Edison Co.
1st Mortgage | |
| 08/15/16 | | | 5.950 | % | | $ | 2,360,000 | | | $ | 2,792,864 | | |
| 09/15/17 | | | 6.150 | % | | | 1,690,000 | | | | 2,053,710 | | |
| 08/01/20 | | | 4.000 | % | | | 3,415,000 | | | | 3,763,624 | | |
| 03/15/36 | | | 5.900 | % | | | 640,000 | | | | 801,939 | | |
| Senior Unsecured | |
| 07/15/18 | | | 6.950 | % | | | 1,280,000 | | | | 1,551,045 | | |
Consolidated Edison Co. of New York, Inc.
Senior Unsecured | |
| 04/01/38 | | | 6.750 | % | | | 155,000 | | | | 215,841 | | |
Detroit Edison Co. (The)
1st Mortgage | |
| 10/01/20 | | | 3.450 | % | | | 3,860,000 | | | | 4,101,879 | | |
Dominion Resources, Inc.
Senior Unsecured | |
| 08/15/19 | | | 5.200 | % | | | 335,000 | | | | 392,077 | | |
Duke Energy Carolinas LLC
1st Mortgage | |
| 10/01/15 | | | 5.300 | % | | | 305,000 | | | | 349,115 | | |
Exelon Generation Co. LLC
Senior Unsecured | |
| 10/01/17 | | | 6.200 | % | | | 790,000 | | | | 928,268 | | |
FPL Energy National Wind LLC
Senior Secured(b) | |
| 03/10/24 | | | 5.608 | % | | | 556,010 | | | | 575,459 | | |
Georgia Power Co.
Senior Unsecured | |
| 06/01/17 | | | 5.700 | % | | | 1,015,000 | | | | 1,219,306 | | |
| 09/01/40 | | | 4.750 | % | | | 3,640,000 | | | | 3,963,887 | | |
MidAmerican Energy Holdings Co.
Senior Unsecured | |
| 10/01/12 | | | 5.875 | % | | | 1,415,000 | | | | 1,445,655 | | |
| Nevada Power Co.(c) | |
| 09/15/40 | | | 5.375 | % | | | 5,350,000 | | | | 6,279,375 | | |
Niagara Mohawk Power Corp.
Senior Unsecured(b) | |
| 08/15/19 | | | 4.881 | % | | | 1,830,000 | | | | 2,041,583 | | |
Pacific Gas & Electric Co.
Senior Unsecured | |
| 01/15/40 | | | 5.400 | % | | | 1,675,000 | | | | 1,938,878 | | |
Peco Energy Co.
1st Mortgage | |
| 03/01/18 | | | 5.350 | % | | | 1,860,000 | | | | 2,211,131 | | |
Southern California Edison Co.
1st Mortgage | |
| 01/15/16 | | | 5.000 | % | | | 2,500,000 | | | | 2,841,690 | | |
| 09/01/40 | | | 4.500 | % | | | 1,085,000 | | | | 1,172,735 | | |
Xcel Energy, Inc.
Senior Unsecured | |
| 05/15/20 | | | 4.700 | % | | | 1,715,000 | | | | 1,959,211 | | |
| Total | | | 44,616,592 | | |
| Entertainment 0.2% | |
| Time Warner, Inc. | |
| 11/15/36 | | | 6.500 | % | | | 2,780,000 | | | | 3,278,107 | | |
| Issuer | | Coupon
Rate | | Principal
Amount | | Value | |
| Corporate Bonds & Notes (continued) | |
| Food and Beverage 1.2% | |
| Anheuser-Busch InBev Worldwide, Inc. | |
| 01/15/19 | | | 7.750 | % | | $ | 1,865,000 | | | $ | 2,467,497 | | |
ConAgra Foods, Inc.
Senior Unsecured | |
| 10/01/28 | | | 7.000 | % | | | 2,775,000 | | | | 3,370,548 | | |
General Mills, Inc.
Senior Unsecured | |
| 12/15/21 | | | 3.150 | % | | | 7,280,000 | | | | 7,401,365 | | |
Kraft Foods, Inc.
Senior Unsecured | |
| 02/09/16 | | | 4.125 | % | | | 4,995,000 | | | | 5,461,628 | | |
PepsiCo, Inc.
Senior Unsecured | |
| 01/15/20 | | | 4.500 | % | | | 1,705,000 | | | | 1,945,649 | | |
| Total | | | 20,646,687 | | |
| Gas Distributors 0.5% | |
Atmos Energy Corp.
Senior Unsecured | |
| 06/15/17 | | | 6.350 | % | | | 2,415,000 | | | | 2,846,049 | | |
| 03/15/19 | | | 8.500 | % | | | 2,360,000 | | | | 3,126,306 | | |
Sempra Energy
Senior Unsecured | |
| 06/01/16 | | | 6.500 | % | | | 2,045,000 | | | | 2,433,570 | | |
| Total | | | 8,405,925 | | |
| Gas Pipelines 1.6% | |
| El Paso Pipeline Partners Operating Co. LLC | |
| 10/01/21 | | | 5.000 | % | | | 3,738,000 | | | | 3,949,003 | | |
Energy Transfer Partners LP
Senior Unsecured | |
| 02/01/42 | | | 6.500 | % | | | 2,190,000 | | | | 2,321,231 | | |
Kinder Morgan Energy Partners LP
Senior Unsecured | |
| 01/15/38 | | | 6.950 | % | | | 1,585,000 | | | | 1,869,890 | | |
| 09/01/39 | | | 6.500 | % | | | 330,000 | | | | 371,831 | | |
| NiSource Finance Corp. | |
| 09/15/17 | | | 5.250 | % | | | 685,000 | | | | 767,664 | | |
| Plains All American Pipeline LP/Finance Corp. | |
| 05/01/18 | | | 6.500 | % | | | 1,215,000 | | | | 1,473,369 | | |
| 05/01/19 | | | 8.750 | % | | | 2,410,000 | | | | 3,179,303 | | |
| 01/15/20 | | | 5.750 | % | | | 545,000 | | | | 632,496 | | |
Southern Natural Gas Co. LLC
Senior Unsecured | |
| 03/01/32 | | | 8.000 | % | | | 2,325,000 | | | | 3,001,419 | | |
| TransCanada PipeLines Ltd.(a) | |
| 05/15/67 | | | 6.350 | % | | | 7,640,000 | | | | 7,975,335 | | |
Williams Partners LP
Senior Unsecured | |
| 04/15/40 | | | 6.300 | % | | | 1,715,000 | | | | 2,037,321 | | |
| Total | | | 27,578,862 | | |
| Health Care 0.7% | |
| Express Scripts Holding Co.(b) | |
| 02/15/17 | | | 2.650 | % | | | 5,349,000 | | | | 5,445,159 | | |
| 02/15/22 | | | 3.900 | % | | | 6,350,000 | | | | 6,534,683 | | |
| Total | | | 11,979,842 | | |
The Accompanying Notes to Financial Statements are an integral part of this statement.
7
Columbia Bond Fund
April 30, 2012
(Percentages represent value of investments compared to net assets)
| Issuer | | Coupon
Rate | | Principal
Amount | | Value | |
| Corporate Bonds & Notes (continued) | |
| Healthcare Insurance 0.1% | |
UnitedHealth Group, Inc.
Senior Unsecured | |
| 02/15/18 | | | 6.000 | % | | $ | 1,935,000 | | | $ | 2,360,270 | | |
| Home Construction —% | |
| D.R. Horton, Inc. | |
| 09/15/14 | | | 5.625 | % | | | 365,000 | | | | 385,075 | | |
| Independent Energy 0.5% | |
Canadian Natural Resources Ltd.
Senior Unsecured | |
| 03/15/38 | | | 6.250 | % | | | 2,840,000 | | | | 3,544,843 | | |
Devon Energy Corp.
Senior Unsecured | |
| 01/15/19 | | | 6.300 | % | | | 1,290,000 | | | | 1,593,756 | | |
Nexen, Inc.
Senior Unsecured | |
| 03/10/35 | | | 5.875 | % | | | 1,080,000 | | | | 1,130,938 | | |
| 07/30/39 | | | 7.500 | % | | | 1,610,000 | | | | 1,972,287 | | |
| Total | | | 8,241,824 | | |
| Integrated Energy 0.4% | |
Hess Corp.
Senior Unsecured | |
| 08/15/31 | | | 7.300 | % | | | 1,966,000 | | | | 2,530,114 | | |
| 02/15/41 | | | 5.600 | % | | | 1,509,000 | | | | 1,632,198 | | |
| Shell International Finance BV | |
| 03/25/40 | | | 5.500 | % | | | 2,950,000 | | | | 3,684,432 | | |
| Total | | | 7,846,744 | | |
| Life Insurance 1.6% | |
Lincoln National Corp.
Senior Unsecured | |
| 07/01/19 | | | 8.750 | % | | | 2,870,000 | | | | 3,671,163 | | |
| Lincoln National Corp.(a) | |
| 04/20/67 | | | 6.050 | % | | | 8,302,000 | | | | 7,720,860 | | |
| MetLife Capital Trust X(b) | |
| 04/08/38 | | | 9.250 | % | | | 2,815,000 | | | | 3,434,300 | | |
| MetLife, Inc. | |
| 08/01/39 | | | 10.750 | % | | | 2,690,000 | | | | 3,739,100 | | |
Prudential Financial, Inc.
Senior Unsecured | |
| 06/15/19 | | | 7.375 | % | | | 3,040,000 | | | | 3,783,848 | | |
| Prudential Financial, Inc.(a) | |
| 06/15/38 | | | 8.875 | % | | | 5,290,000 | | | | 6,275,263 | | |
| Total | | | 28,624,534 | | |
| Media Cable 0.8% | |
| Comcast Corp. | |
| 11/15/15 | | | 5.850 | % | | | 4,250,000 | | | | 4,895,290 | | |
| 03/01/20 | | | 5.150 | % | | | 925,000 | | | | 1,079,290 | | |
| DIRECTV Holdings LLC/DIRECTV Financing Co., Inc.(b) | |
| 03/15/17 | | | 2.400 | % | | | 3,636,000 | | | | 3,644,083 | | |
| DIRECTV Holdings LLC/Financing Co., Inc. | |
| 02/15/16 | | | 3.125 | % | | | 2,445,000 | | | | 2,544,610 | | |
| Time Warner Cable, Inc. | |
| 05/01/17 | | | 5.850 | % | | | 1,905,000 | | | | 2,231,092 | | |
| Total | | | 14,394,365 | | |
| Issuer | | Coupon
Rate | | Principal
Amount | | Value | |
| Corporate Bonds & Notes (continued) | |
| Media Non-Cable 0.8% | |
NBCUniversal Media LLC
Senior Unsecured | |
| 04/01/16 | | | 2.875 | % | | $ | 7,625,000 | | | $ | 7,974,065 | | |
| News America, Inc. | |
| 12/15/35 | | | 6.400 | % | | | 2,715,000 | | | | 3,106,859 | | |
| 02/15/41 | | | 6.150 | % | | | 2,639,000 | | | | 3,028,664 | | |
| Total | | | 14,109,588 | | |
| Metals 0.6% | |
ArcelorMittal
Senior Unsecured | |
| 10/15/39 | | | 7.000 | % | | | 3,660,000 | | | | 3,568,873 | | |
| 03/01/41 | | | 6.750 | % | | | 1,125,000 | | | | 1,063,817 | | |
Nucor Corp.
Senior Unsecured | |
| 06/01/18 | | | 5.850 | % | | | 2,765,000 | | | | 3,342,979 | | |
| Vale Overseas Ltd. | |
| 11/21/36 | | | 6.875 | % | | | 2,300,000 | | | | 2,737,479 | | |
| Total | | | 10,713,148 | | |
| Non-Captive Consumer 0.1% | |
| Discover Financial Services(b) | |
| 04/27/22 | | | 5.200 | % | | | 1,275,000 | | | | 1,322,952 | | |
| Non-Captive Diversified 0.6% | |
General Electric Capital Corp.
Senior Unsecured | |
| 01/07/21 | | | 4.625 | % | | | 9,110,000 | | | | 9,881,544 | | |
| Oil Field Services 0.1% | |
Halliburton Co.
Senior Unsecured | |
| 09/15/18 | | | 5.900 | % | | | 1,280,000 | | | | 1,570,040 | | |
| Weatherford International Ltd. | |
| 03/15/38 | | | 7.000 | % | | | 885,000 | | | | 1,009,508 | | |
| Total | | | 2,579,548 | | |
| Other Industry 0.3% | |
President and Fellows of Harvard College
Senior Notes | |
| 10/15/40 | | | 4.875 | % | | | 2,690,000 | | | | 3,159,184 | | |
| President and Fellows of Harvard College(b) | |
| 01/15/39 | | | 6.500 | % | | | 1,460,000 | | | | 2,133,512 | | |
| Total | | | 5,292,696 | | |
| Pharmaceuticals 0.3% | |
Johnson & Johnson
Senior Unsecured | |
| 05/15/41 | | | 4.850 | % | | | 3,002,000 | | | | 3,542,174 | | |
| Wyeth LLC | |
| 02/15/16 | | | 5.500 | % | | | 1,500,000 | | | | 1,746,258 | | |
| Total | | | 5,288,432 | | |
| Property & Casualty 0.6% | |
CNA Financial Corp.
Senior Unsecured | |
| 12/15/14 | | | 5.850 | % | | | 975,000 | | | | 1,050,722 | | |
| 11/15/19 | | | 7.350 | % | | | 2,405,000 | | | | 2,853,148 | | |
| 08/15/21 | | | 5.750 | % | | | 780,000 | | | | 853,572 | | |
| Liberty Mutual Group, Inc.(a)(b) | |
| 06/15/58 | | | 10.750 | % | | | 780,000 | | | | 1,060,800 | | |
The Accompanying Notes to Financial Statements are an integral part of this statement.
8
Columbia Bond Fund
April 30, 2012
(Percentages represent value of investments compared to net assets)
| Issuer | | Coupon
Rate | | Principal
Amount | | Value | |
| Corporate Bonds & Notes (continued) | |
| Property & Casualty (cont.) | |
Transatlantic Holdings, Inc.
Senior Unsecured | |
| 11/30/39 | | | 8.000 | % | | $ | 3,710,000 | | | $ | 4,230,732 | | |
| Total | | | 10,048,974 | | |
| Railroads 0.8% | |
| BNSF Funding Trust I(a) | |
| 12/15/55 | | | 6.613 | % | | | 3,115,000 | | | | 3,243,494 | | |
Burlington Northern Santa Fe LLC
Senior Unsecured | |
| 08/15/30 | | | 7.950 | % | | | 1,025,000 | | | | 1,413,556 | | |
CSX Corp.
Senior Unsecured | |
| 06/01/21 | | | 4.250 | % | | | 4,585,000 | | | | 4,989,670 | | |
| 05/30/42 | | | 4.750 | % | | | 2,390,000 | | | | 2,397,832 | | |
Union Pacific Corp.
Senior Unsecured | |
| 08/15/18 | | | 5.700 | % | | | 1,140,000 | | | | 1,373,580 | | |
| Total | | | 13,418,132 | | |
| REITs 0.5% | |
| Brandywine Operating Partnership LP | |
| 05/15/15 | | | 7.500 | % | | | 2,860,000 | | | | 3,196,259 | | |
Duke Realty LP
Senior Unsecured | |
| 08/15/19 | | | 8.250 | % | | | 4,004,600 | | | | 4,994,301 | | |
Highwoods Realty LP
Senior Unsecured | |
| 03/15/17 | | | 5.850 | % | | | 810,000 | | | | 875,220 | | |
| Total | | | 9,065,780 | | |
| Restaurants 0.7% | |
McDonald's Corp.
Senior Unsecured | |
| 05/20/21 | | | 3.625 | % | | | 7,800,000 | | | | 8,576,162 | | |
| 02/01/39 | | | 5.700 | % | | | 1,375,000 | | | | 1,733,130 | | |
McDonald's Corp.(c)
Senior Unsecured | |
| 07/15/40 | | | 4.875 | % | | | 1,800,000 | | | | 2,058,451 | | |
| Total | | | 12,367,743 | | |
| Retailers 0.5% | |
Best Buy Co., Inc.
Senior Unsecured(c) | |
| 03/15/21 | | | 5.500 | % | | | 2,105,000 | | | | 1,969,347 | | |
CVS Pass-Through Trust(b)
Pass-Through Certificates | |
| 01/11/27 | | | 5.298 | % | | | 519,982 | | | | 543,310 | | |
| 07/10/31 | | | 8.353 | % | | | 2,799,046 | | | | 3,662,441 | | |
| Macy's Retail Holdings, Inc. | |
| 01/15/42 | | | 5.125 | % | | | 3,380,000 | | | | 3,413,574 | | |
| Total | | | 9,588,672 | | |
| Supermarkets 0.5% | |
| Kroger Co. (The) | |
| 10/01/15 | | | 3.900 | % | | | 5,825,000 | | | | 6,341,305 | | |
| 12/15/18 | | | 6.800 | % | | | 2,665,000 | | | | 3,299,043 | | |
| Total | | | 9,640,348 | | |
| Issuer | | Coupon
Rate | | Principal
Amount | | Value | |
| Corporate Bonds & Notes (continued) | |
| Supranational 0.2% | |
European Investment Bank
Senior Unsecured | |
| 05/30/17 | | | 5.125 | % | | $ | 2,305,000 | | | $ | 2,692,708 | | |
| Technology 0.9% | |
Corning, Inc.
Senior Unsecured | |
| 03/15/42 | | | 4.750 | % | | | 3,640,000 | | | | 3,634,409 | | |
Hewlett-Packard Co.
Senior Unsecured | |
| 06/01/21 | | | 4.300 | % | | | 1,500,000 | | | | 1,542,569 | | |
| 09/15/21 | | | 4.375 | % | | | 2,505,000 | | | | 2,598,509 | | |
| 12/09/21 | | | 4.650 | % | | | 1,995,000 | | | | 2,108,059 | | |
| 09/15/41 | | | 6.000 | % | | | 4,745,000 | | | | 5,244,800 | | |
| Total | | | 15,128,346 | | |
| Transportation Services 0.2% | |
| ERAC U.S.A. Finance LLC(b) | |
| 10/01/20 | | | 5.250 | % | | | 3,305,000 | | | | 3,648,269 | | |
| Wireless 0.1% | |
Cellco Partnership/Verizon Wireless Capital LLC
Senior Unsecured | |
| 11/15/18 | | | 8.500 | % | | | 1,800,000 | | | | 2,478,508 | | |
| Wirelines 1.7% | |
AT&T, Inc.
Senior Unsecured | |
| 06/15/16 | | | 5.625 | % | | | 1,945,000 | | | | 2,267,403 | | |
| 02/15/39 | | | 6.550 | % | | | 3,030,000 | | | | 3,755,730 | | |
CenturyLink, Inc.
Senior Unsecured | |
| 06/15/21 | | | 6.450 | % | | | 3,175,000 | | | | 3,304,457 | | |
Embarq Corp.
Senior Unsecured | |
| 06/01/36 | | | 7.995 | % | | | 2,785,000 | | | | 2,795,388 | | |
| Telecom Italia Capital SA | |
| 07/18/36 | | | 7.200 | % | | | 3,690,000 | | | | 3,380,963 | | |
| Telefonica Emisiones SAU | |
| 06/20/16 | | | 6.421 | % | | | 3,120,000 | | | | 3,211,762 | | |
| 07/03/17 | | | 6.221 | % | | | 945,000 | | | | 964,097 | | |
| 04/27/20 | | | 5.134 | % | | | 3,185,000 | | | | 2,951,912 | | |
Verizon Communications, Inc.
Senior Unsecured | |
| 04/01/16 | | | 3.000 | % | | | 5,350,000 | | | | 5,703,924 | | |
| 04/01/21 | | | 4.600 | % | | | 975,000 | | | | 1,103,908 | | |
| Total | | | 29,439,544 | | |
Total Corporate Bonds & Notes
(Cost: $431,216,041) | | $ | 472,448,720 | | |
| Residential Mortgage-Backed Securities – Agency 37.3% | |
| Federal Home Loan Mortgage Corp.(d) | |
| 12/01/40 | | | 4.000 | % | | $ | 90,866,134 | | | $ | 96,670,624 | | |
| 05/01/41-06/01/41 | | | 4.500 | % | | | 31,350,414 | | | | 34,075,819 | | |
| 03/01/21-05/01/41 | | | 5.000 | % | | | 2,749,747 | | | | 3,032,461 | | |
| 12/01/14-12/01/35 | | | 7.000 | % | | | 737,161 | | | | 861,766 | | |
| 09/01/25-10/01/29 | | | 7.500 | % | | | 66,306 | | | | 80,621 | | |
| 06/01/26 | | | 8.000 | % | | | 1,186 | | | | 1,441 | | |
| 09/01/16 | | | 9.500 | % | | | 375 | | | | 423 | | |
The Accompanying Notes to Financial Statements are an integral part of this statement.
9
Columbia Bond Fund
April 30, 2012
(Percentages represent value of investments compared to net assets)
| Issuer | | Coupon
Rate | | Principal
Amount | | Value | |
| Residential Mortgage-Backed Securities – Agency (continued) | |
| Federal National Mortgage Association(a)(d) | |
| 08/01/36 | | | 2.324 | % | | $ | 114,345 | | | $ | 115,686 | | |
| Federal National Mortgage Association(d) | |
| 12/01/40-12/01/41 | | | 4.000 | % | | | 76,927,583 | | | | 82,138,277 | | |
| 04/01/40-07/01/41 | | | 4.500 | % | | | 130,854,133 | | | | 142,739,411 | | |
| 07/01/40-09/01/40 | | | 5.000 | % | | | 71,452,602 | | | | 78,287,111 | | |
| 08/01/37-01/01/40 | | | 5.500 | % | | | 24,888,748 | | | | 27,331,844 | | |
| 07/01/38 | | | 6.000 | % | | | 16,925,607 | | | | 18,766,928 | | |
| 02/01/13 | | | 6.500 | % | | | 8,475 | | | | 8,630 | | |
| 06/01/32 | | | 7.000 | % | | | 11,870 | | | | 13,990 | | |
| 10/01/15-01/01/30 | | | 7.500 | % | | | 54,043 | | | | 62,966 | | |
| 12/01/29-05/01/30 | | | 8.000 | % | | | 228,126 | | | | 268,686 | | |
| 08/01/17 | | | 8.500 | % | | | 543 | | | | 552 | | |
| 10/01/20-12/01/20 | | | 10.000 | % | | | 137,437 | | | | 159,104 | | |
| Federal National Mortgage Association(d)(e) | |
| 05/01/42 | | | 3.500 | % | | | 55,000,000 | | | | 57,105,466 | | |
| Federal National Mortgage Association(d)(f) | |
| 02/01/41 | | | 4.000 | % | | | 21,830,648 | | | | 23,321,697 | | |
| Government National Mortgage Association(a)(d) | |
| 07/20/22 | | | 1.625 | % | | | 36,411 | | | | 37,699 | | |
| 07/20/21 | | | 2.000 | % | | | 27,888 | | | | 28,892 | | |
| 04/20/22-06/20/28 | | | 2.375 | % | | | 218,475 | | | | 226,611 | | |
| Government National Mortgage Association(d) | |
| 02/15/41 | | | 4.000 | % | | | 19,397,652 | | | | 21,029,782 | | |
| 06/15/39-03/15/41 | | | 4.500 | % | | | 43,247,634 | | | | 47,381,670 | | |
| 03/20/28 | | | 6.000 | % | | | 110,041 | | | | 124,712 | | |
| 05/15/23-12/15/31 | | | 6.500 | % | | | 148,740 | | | | 173,593 | | |
| 09/15/13-05/15/32 | | | 7.000 | % | | | 404,387 | | | | 476,571 | | |
| 04/15/26-03/15/30 | | | 7.500 | % | | | 365,336 | | | | 417,332 | | |
| 05/15/23-01/15/30 | | | 8.000 | % | | | 203,854 | | | | 235,222 | | |
| 01/15/17-12/15/17 | | | 8.500 | % | | | 367,120 | | | | 413,879 | | |
| 11/15/17-06/15/30 | | | 9.000 | % | | | 244,068 | | | | 273,622 | | |
| 11/15/17-08/15/20 | | | 9.500 | % | | | 203,118 | | | | 232,922 | | |
| 05/15/16-07/15/17 | | | 10.000 | % | | | 12,546 | | | | 12,924 | | |
| 06/15/13 | | | 11.500 | % | | | 4,787 | | | | 4,811 | | |
| Government National Mortgage Association(d)(e) | |
| 05/01/42 | | | 3.500 | % | | | 18,000,000 | | | | 18,959,062 | | |
Vendee Mortgage Trust(a)(d)(g)
CMO IO Series 1998-1 Class 2IO | |
| 03/15/28 | | | 0.412 | % | | | 4,115,639 | | | | 37,412 | | |
| CMO IO Series 1998-3 Class IO | |
| 03/15/29 | | | 0.264 | % | | | 5,383,325 | | | | 28,208 | | |
Total Residential Mortgage-Backed Securities – Agency
(Cost: $630,494,354) | | $ | 655,138,427 | | |
| Residential Mortgage-Backed Securities – Non-Agency 0.4% | |
American Mortgage Trust
Series 2093-3 Class 3A(d)(h)(i) | |
| 07/27/23 | | | 8.188 | % | | $ | 9,843 | | | $ | 5,968 | | |
BNPP Mortgage Securities LLC
CMO Series 2009-1 Class A1(b)(d) | |
| 08/27/37 | | | 6.000 | % | | | 880,427 | | | | 926,344 | | |
Credit Suisse Mortgage Capital Certificates(a)(b)(d)
CMO Series 2011-16R Class 7A3 | |
| 12/27/36 | | | 3.500 | % | | | 1,865,144 | | | | 1,837,074 | | |
| Issuer | | Coupon
Rate | | Principal
Amount | | Value | |
| Residential Mortgage-Backed Securities – Non-Agency (continued) | |
| CMO Series 2011-17R Class 2A1 | |
| 12/27/37 | | | 3.400 | % | | $ | 1,965,033 | | | $ | 2,016,616 | | |
Springleaf Mortgage Loan Trust
CMO Series 2012-1A Class A(a)(b)(d) | |
| 09/25/57 | | | 2.667 | % | | | 1,760,000 | | | | 1,760,000 | | |
Total Residential Mortgage-Backed Securities – Non-Agency
(Cost: $6,512,235) | | $ | 6,546,002 | | |
| Commercial Mortgage-Backed Securities – Agency 2.1% | |
Federal Home Loan Mortgage Corp.
Multifamily Structured Pass-Through Certificates
CMO Series K706 Class A2(d) | |
| 10/25/18 | | | 2.323 | % | | $ | 10,757,000 | | | $ | 11,011,580 | | |
| Federal National Mortgage Association(d) | |
| 12/01/12 | | | 4.680 | % | | | 1,152,752 | | | | 1,155,839 | | |
| 09/01/19 | | | 4.760 | % | | | 5,761,739 | | | | 6,541,713 | | |
| 06/01/19 | | | 4.770 | % | | | 5,875,553 | | | | 6,657,765 | | |
| 01/01/19 | | | 2.600 | % | | | 10,000,000 | | | | 10,371,102 | | |
| 02/01/19 | | | 7.785 | % | | | 1,355,187 | | | | 1,493,245 | | |
Total Commercial Mortgage-Backed Securities – Agency
(Cost: $35,345,181) | | $ | 37,231,244 | | |
| Commercial Mortgage-Backed Securities – Non-Agency 15.7% | |
Banc of America Merrill Lynch Commercial Mortgage, Inc.
Series 2005-4 Class A5A(d) | |
| 07/10/45 | | | 4.933 | % | | $ | 17,198,000 | | | $ | 18,835,043 | | |
Bear Stearns Commercial Mortgage Securities(a)(d)
Series 2004-T14 Class A4 | |
| 01/12/41 | | | 5.200 | % | | | 11,705,000 | | | | 12,375,650 | | |
Bear Stearns Commercial Mortgage Securities(d)
Series 2002-TOP8 Class A2 | |
| 08/15/38 | | | 4.830 | % | | | 2,086,044 | | | | 2,101,902 | | |
| Series 2003-T10 Class A2 | |
| 03/13/40 | | | 4.740 | % | | | 15,330,824 | | | | 15,609,676 | | |
| Series 2006-PW14 Class A4 | |
| 12/11/38 | | | 5.201 | % | | | 3,310,000 | | | | 3,720,255 | | |
| Series 2006-T24 Class A4 | |
| 10/12/41 | | | 5.537 | % | | | 7,328,000 | | | | 8,352,323 | | |
| Series 2007-PW18 Class A4 | |
| 06/11/50 | | | 5.700 | % | | | 8,455,000 | | | | 9,715,091 | | |
Citigroup/Deutsche Bank Commercial Mortgage Trust(a)(d)
Series 2007-CD5 Class A4 | |
| 11/15/44 | | | 5.886 | % | | | 4,450,000 | | | | 5,138,023 | | |
Citigroup/Deutsche Bank Commercial Mortgage Trust(d)
Series 2007-CD4 Class A4 | |
| 12/11/49 | | | 5.322 | % | | | 8,830,000 | | | | 9,795,040 | | |
Commercial Mortgage Asset Trust(a)(d)
Series 1999-C1 Class B | |
| 01/17/32 | | | 7.230 | % | | | 2,000,000 | | | | 2,118,062 | | |
| Series 1999-C2 Class C | |
| 11/17/32 | | | 7.800 | % | | | 3,556,000 | | | | 3,803,341 | | |
Credit Suisse First Boston Mortgage Securities Corp.
Series 2003-CK2 Class A4(d) | |
| 03/15/36 | | | 4.801 | % | | | 3,490,000 | | | | 3,555,668 | | |
The Accompanying Notes to Financial Statements are an integral part of this statement.
10
Columbia Bond Fund
April 30, 2012
(Percentages represent value of investments compared to net assets)
| Issuer | | Coupon
Rate | | Principal
Amount | | Value | |
| Commercial Mortgage-Backed Securities – Non-Agency (continued) | |
Credit Suisse Mortgage Capital Certificates
Series 2006-C3 Class A3(a)(d) | |
| 06/15/38 | | | 6.008 | % | | $ | 9,060,000 | | | $ | 10,303,911 | | |
GMAC Commercial Mortgage Securities, Inc.(a)(d)
CMO Series 2003-C2 Class A2 | |
| 05/10/40 | | | 5.636 | % | | | 1,060,000 | | | | 1,109,824 | | |
GMAC Commercial Mortgage Securities, Inc.(d)
Series 2003-C3 Class A4 | |
| 04/10/40 | | | 5.023 | % | | | 1,650,000 | | | | 1,723,582 | | |
GS Mortgage Securities Corp. II
Series 2005-GG4 Class A4A(d) | |
| 07/10/39 | | | 4.751 | % | | | 4,575,000 | | | | 4,971,762 | | |
Greenwich Capital Commercial Funding Corp.
Series 2005-GG3 Class A4(a)(d) | |
| 08/10/42 | | | 4.799 | % | | | 5,755,000 | | | | 6,202,900 | | |
JPMorgan Chase Commercial Mortgage Securities Corp.(a)(d)
Series 2003-CB6 Class A2 | |
| 07/12/37 | | | 5.255 | % | | | 3,875,000 | | | | 4,026,013 | | |
| Series 2003-CB7 Class A4 | |
| 01/12/38 | | | 4.879 | % | | | 3,847,697 | | | | 4,015,633 | | |
| Series 2005-LDP4 Class A4 | |
| 10/15/42 | | | 4.918 | % | | | 9,640,000 | | | | 10,457,241 | | |
| Series 2006-CB15 Class ASB | |
| 06/12/43 | | | 5.790 | % | | | 1,988,830 | | | | 2,125,841 | | |
JPMorgan Chase Commercial Mortgage Securities Corp.(d)
Series 2002-CIB4 Class A3 | |
| 05/12/34 | | | 6.162 | % | | | 72,461 | | | | 72,435 | | |
| Series 2003-C1 Class A2 | |
| 01/12/37 | | | 4.985 | % | | | 1,765,000 | | | | 1,797,693 | | |
| Series 2006-CB16 Class A4 | |
| 05/12/45 | | | 5.552 | % | | | 7,600,000 | | | | 8,554,689 | | |
| Series 2007-CB18 Class A4 | |
| 06/12/47 | | | 5.440 | % | | | 8,120,000 | | | | 9,099,548 | | |
LB-UBS Commercial Mortgage Trust(a)(d)
Series 2003-C8 Class A4 | |
| 11/15/32 | | | 5.124 | % | | | 6,865,000 | | | | 7,205,243 | | |
| Series 2004-C6 Class A6 | |
| 08/15/29 | | | 5.020 | % | | | 3,135,000 | | | | 3,356,670 | | |
LB-UBS Commercial Mortgage Trust(d)
Series 2003-C3 ClassA4 | |
| 05/15/32 | | | 4.166 | % | | | 3,525,000 | | | | 3,614,690 | | |
| Series 2005-C3 Class A5 | |
| 07/15/30 | | | 4.739 | % | | | 4,395,000 | | | | 4,801,529 | | |
| Series 2007-C2 Class A3 | |
| 02/15/40 | | | 5.430 | % | | | 8,930,000 | | | | 9,864,141 | | |
Merrill Lynch Mortgage Investors, Inc.
CMO IO Series 1998-C3 Class IO(a)(d)(g) | |
| 12/15/30 | | | 0.500 | % | | | 2,455,174 | | | | 24,662 | | |
Merrill Lynch Mortgage Trust
Series 2005-MCP1 Class A4(a)(d) | |
| 06/12/43 | | | 4.747 | % | | | 10,000,000 | | | | 10,859,140 | | |
Morgan Stanley Capital I(d)
Series 2003-IQ6 Class A4 | |
| 12/15/41 | | | 4.970 | % | | | 12,337,000 | | | | 12,969,666 | | |
| Series 2003-T11 Class A4 | |
| 06/13/41 | | | 5.150 | % | | | 16,419,517 | | | | 17,028,550 | | |
| Issuer | | Coupon
Rate | | Principal
Amount | | Value | |
| Commercial Mortgage-Backed Securities – Non-Agency (continued) | |
| Series 2004-T13 Class A4 | |
| 09/13/45 | | | 4.660 | % | | $ | 6,224,000 | | | $ | 6,524,594 | | |
Morgan Stanley Dean Witter Capital I(d)
Series 2001-TOP3 Class A4 | |
| 07/15/33 | | | 6.390 | % | | | 32,020 | | | | 32,001 | | |
| Series 2003-HQ2 Class A2 | |
| 03/12/35 | | | 4.920 | % | | | 7,000,000 | | | | 7,153,363 | | |
| Series 2003-TOP9 Class A2 | |
| 11/13/36 | | | 4.740 | % | | | 4,003,829 | | | | 4,059,810 | | |
Morgan Stanley Reremic Trust
Series 2010-GG10 Class A4A(a)(b)(d) | |
| 08/15/45 | | | 5.980 | % | | | 5,731,000 | | | | 6,468,442 | | |
Nomura Asset Securities Corp.
Series 1998-D6 Class A4(a)(d) | |
| 03/15/30 | | | 7.899 | % | | | 4,025,000 | | | | 4,198,731 | | |
WF-RBS Commercial Mortgage Trust
Series 2012-C6 Class A2(d) | |
| 04/15/45 | | | 2.191 | % | | | 6,818,000 | | | | 6,930,299 | | |
Wachovia Bank Commercial Mortgage Trust(a)(d)
Series 2004-C12 Class A3 | |
| 07/15/41 | | | 5.230 | % | | | 4,029,786 | | | | 4,046,610 | | |
| Series 2005-C22 Class A4 | |
| 12/15/44 | | | 5.443 | % | | | 6,910,000 | | | | 7,717,724 | | |
Total Commercial Mortgage-Backed Securities – Non-Agency
(Cost: $262,664,850) | | $ | 276,437,011 | | |
| Asset-Backed Securities – Non-Agency 2.0% | |
Ally Auto Receivables Trust
Series 2011-5 Class A3 | |
| 11/15/15 | | | 0.990 | % | | $ | 2,485,000 | | | $ | 2,488,393 | | |
BMW Vehicle Owner Trust
Series 2011-A Class A3 | |
| 08/25/15 | | | 0.760 | % | | | 2,390,000 | | | | 2,393,291 | | |
Bombardier Capital Mortgage Securitization Corp.
Series 1998-A Class A3 | |
| 04/15/28 | | | 6.230 | % | | | 1,200 | | | | 1,188 | | |
CNH Equipment Trust
Series 2010-C Class A3 | |
| 05/15/15 | | | 1.170 | % | | | 4,297,760 | | | | 4,312,720 | | |
| Series 2011-B Class A3 | |
| 08/15/16 | | | 0.910 | % | | | 995,000 | | | | 997,001 | | |
Citibank Credit Card Issuance Trust
Series 2008-C6 Class C6 | |
| 06/20/14 | | | 6.300 | % | | | 455,000 | | | | 458,417 | | |
Citigroup Mortgage Loan Trust, Inc.(a)
Series 2005-WF2 Class MF1 | |
| 08/25/35 | | | 5.517 | % | | | 2,800,000 | | | | 224,280 | | |
| Series 2005-WF2 Class MF2 | |
| 08/25/35 | | | 5.666 | % | | | 820,034 | | | | 14,073 | | |
Conseco Financial Corp.
Series 1996-5 Class A7(a) | |
| 07/15/27 | | | 8.250 | % | | | 149,154 | | | | 152,595 | | |
Equity One ABS, Inc.
Series 2004-3 Class AV2(a) | |
| 07/25/34 | | | 0.579 | % | | | 356,903 | | | | 244,610 | | |
The Accompanying Notes to Financial Statements are an integral part of this statement.
11
Columbia Bond Fund
April 30, 2012
(Percentages represent value of investments compared to net assets)
| Issuer | | Coupon
Rate | | Principal
Amount | | Value | |
| Asset-Backed Securities – Non-Agency (continued) | |
Franklin Auto Trust
Series 2008-A Class C(b) | |
| 05/20/16 | | | 7.160 | % | | $ | 2,812,221 | | | $ | 2,850,827 | | |
Harley-Davidson Motorcycle Trust
Series 2007-2 Class B | |
| 03/15/14 | | | 5.230 | % | | | 1,500,000 | | | | 1,502,638 | | |
Mercedes-Benz Auto Lease Trust
Series 2011-B Class A3(b) | |
| 08/15/14 | | | 1.070 | % | | | 4,000,000 | | | | 4,017,923 | | |
Nissan Auto Lease Trust
Series 2011-B Class A3 | |
| 02/16/15 | | | 0.920 | % | | | 3,000,000 | | | | 3,008,198 | | |
Nissan Auto Receivables Owner Trust
Series 2011-B Class A3 | |
| 02/16/16 | | | 0.959 | % | | | 2,145,000 | | | | 2,154,011 | | |
Porsche Innovative Lease Owner Trust
Series 2011-1 Class A3(b) | |
| 09/22/14 | | | 1.090 | % | | | 2,500,000 | | | | 2,504,136 | | |
SMART Trust
Series 2012-1USA Class A4A(b) | |
| 12/14/17 | | | 2.010 | % | | | 1,725,000 | | | | 1,723,535 | | |
Toyota Auto Receivables Owner Trust
Series 2011-B Class A3 | |
| 06/15/15 | | | 0.680 | % | | | 2,000,000 | | | | 2,000,399 | | |
Volkswagen Auto Lease Trust
Series 2011-A Class A3 | |
| 10/20/14 | | | 1.200 | % | | | 4,500,000 | | | | 4,535,572 | | |
Total Asset-Backed Securities – Non-Agency
(Cost: $39,148,596) | | $ | 35,583,807 | | |
| U.S. Treasury Obligations 10.1% | |
| U.S. Treasury | |
| 02/15/42 | | | 3.125 | % | | $ | 190,000 | | | $ | 190,535 | | |
| U.S. Treasury(c) | |
| 01/31/17 | | | 0.875 | % | | | 15,100,000 | | | | 15,180,211 | | |
| 02/28/17 | | | 0.875 | % | | | 48,980,000 | | | | 49,217,259 | | |
| 03/31/17 | | | 1.000 | % | | | 13,115,000 | | | | 13,246,150 | | |
| 02/15/22 | | | 2.000 | % | | | 14,320,000 | | | | 14,427,400 | | |
| 11/15/41 | | | 3.125 | % | | | 21,680,000 | | | | 21,747,750 | | |
| U.S. Treasury(j) | |
| STRIPS | |
| 02/15/22 | | | 0.000 | % | | | 48,715,000 | | | | 39,788,366 | | |
| 02/15/40 | | | 0.000 | % | | | 58,500,000 | | | | 23,542,155 | | |
Total U.S. Treasury Obligations
(Cost: $164,382,979) | | $ | 177,339,826 | | |
| U.S. Government & Agency Obligations 2.4% | |
| Residual Funding Corp.(j) | |
| STRIPS | |
| 10/15/20 | | | 0.000 | % | | $ | 14,620,000 | | | $ | 12,184,381 | | |
| 01/15/21 | | | 0.000 | % | | | 26,765,000 | | | | 21,997,591 | | |
| 01/15/30 | | | 0.000 | % | | | 14,000,000 | | | | 7,889,210 | | |
Total U.S. Government & Agency Obligations
(Cost: $33,478,394) | | $ | 42,071,182 | | |
| Issuer | | Coupon
Rate | | Principal
Amount | | Value | |
| Foreign Government Obligations 0.9% | |
| CANADA 0.4% | |
| Hydro Quebec | |
| 12/01/29 | | | 8.500 | % | | $ | 1,020,000 | | | $ | 1,636,835 | | |
Province of Quebec
Senior Unsecured(c) | |
| 05/14/18 | | | 4.625 | % | | | 5,190,000 | | | | 6,046,568 | | |
| Total | | | 7,683,403 | | |
| MEXICO 0.2% | |
| Pemex Project Funding Master Trust | |
| 03/01/18 | | | 5.750 | % | | | 3,000,000 | | | | 3,420,000 | | |
| QATAR 0.3% | |
Nakilat, Inc.
Senior Secured(b) | |
| 12/31/33 | | | 6.067 | % | | | 3,140,000 | | | | 3,406,900 | | |
Ras Laffan Liquefied Natural Gas Co., Ltd. III
Senior Secured(b) | |
| 09/30/16 | | | 5.832 | % | | | 1,159,093 | | | | 1,246,025 | | |
| Total | | | 4,652,925 | | |
| SOUTH KOREA —% | |
Export-Import Bank of Korea
Senior Unsecured | |
| 10/17/12 | | | 5.500 | % | | | 600,000 | | | | 610,539 | | |
Total Foreign Government Obligations
(Cost: $13,851,698) | | $ | 16,366,867 | | |
Issue
Description | | Coupon
Rate | | Principal
Amount | | Value | |
| Municipal Bonds 1.1% | |
City of Chicago Waterworks
Revenue Bonds
Build America Bonds
Series 2010 | |
| 11/01/40 | | | 6.742 | % | | $ | 865,000 | | | $ | 1,116,334 | | |
Commonwealth of Massachusetts
Revenue Bonds
Build America Bonds-Recovery
Series 2010Z | |
| 06/01/30 | | | 5.631 | % | | | 2,820,000 | | | | 3,565,975 | | |
| 06/01/40 | | | 5.731 | % | | | 3,065,000 | | | | 3,942,847 | | |
Kentucky Asset Liability Commission
Revenue Bonds
Taxable
Series 2010 | |
| 04/01/18 | | | 3.165 | % | | | 3,560,000 | | | | 3,731,058 | | |
Los Angeles Unified School District
Unlimited General Obligation Bonds
Build America Bonds
Series 2009 | |
| 07/01/34 | | | 5.750 | % | | | 2,550,000 | | | | 2,990,206 | | |
State of California
Unlimited General Obligaion Taxable Bonds
Various Purpose
Series 2009-3 | |
| 04/01/14 | | | 5.250 | % | | | 260,000 | | | | 280,540 | | |
The Accompanying Notes to Financial Statements are an integral part of this statement.
12
Columbia Bond Fund
April 30, 2012
(Percentages represent value of investments compared to net assets)
Issue
Description | | Coupon
Rate | | Principal
Amount | | Value | |
| Municipal Bonds (continued) | |
Unlimited General Obligation Bonds
Taxable
Series 2010 | |
| 11/01/15 | | | 3.950 | % | | $ | 835,000 | | | $ | 903,662 | | |
Taxable Build America Bonds
Series 2009 | |
| 04/01/39 | | | 7.550 | % | | | 2,390,000 | | | | 3,160,488 | | |
Total Municipal Bonds
(Cost: $16,228,000) | | $ | 19,691,110 | | |
| Preferred Debt 0.5% | |
| Banking 0.5% | |
Citigroup Capital XIII(a)
10/30/40 | | | 7.875 | % | | | 145,190 | | | $ | 3,866,410 | | |
U.S. Bancorp(a)
01/15/22 | | | 6.500 | % | | | 180,000 | | | | 4,870,800 | | |
| Total | | | 8,737,210 | | |
Total Preferred Debt
(Cost: $8,582,886) | | $ | 8,737,210 | | |
| Issuer | | | | Shares | | Value | |
| Common Stocks —% | |
| FINANCIALS —% | |
| Diversified Financial Services —% | |
| Leucadia National Corp. | | | | | 39 | | | $ | 969 | | |
| TOTAL FINANCIALS | | | 969 | | |
Total Common Stocks
(Cost: $—) | | $ | 969 | | |
| | | | | Shares | | Value | |
| Money Market Funds 0.4% | |
| Columbia Short-Term Cash Fund, | |
| | 0.144 | %(k)(l) | | | | | 7,416,654 | | | $ | 7,416,654 | | |
Total Money Market Funds
(Cost: $7,416,654) | | $ | 7,416,654 | | |
| Issuer | | Coupon
Rate | | Principal
Amount | | Value | |
| Treasury Note Short-Term 4.3% | |
| U.S. Treasury Bills 0.060% | | | | $ | 75,550,000 | | | $ | 75,548,674 | | |
Total Treasury Note Short-Term
(Cost: $75,548,548) | | $ | 75,548,674 | | |
| Issuer | | Effective
Yield | | Par/
Principal/
Shares | | Value | |
Investments of Cash Collateral Received for
Securities on Loan 1.3% | |
| Repurchase Agreements 1.3% | |
Mizuho Securities USA, Inc.
dated 04/30/12, matures 05/01/12,
repurchase price $5,000,033(m)
| | | 0.240 | % | | | 5,000,000 | | | $ | 5,000,000 | | |
RBS Securities, Inc.
dated 04/30/12, matures 05/01/12,
repurchase price $10,000,058(m)
| | | 0.210 | % | | | 10,000,000 | | | | 10,000,000 | | |
Societe Generale
dated 04/30/12, matures 05/01/12,
repurchase price $7,266,255(m)
| | | 0.210 | % | | | 7,266,213 | | | | 7,266,213 | | |
| Total | | | 22,266,213 | | |
Total Investments of Cash Collateral Received for Securities
on Loan
(Cost: $22,266,213) | | $ | 22,266,213 | | |
Total Investments
(Cost: $1,747,136,629) | | | | | | | | | | $ | 1,852,823,916 | | |
| Other Assets & Liabilities, Net | | | | | | | | | | | (94,176,737 | ) | |
| Net Assets | | $ | 1,758,647,179 | | |
| Investment in Derivatives | |
Futures Contracts Outstanding at April 30, 2012
| Contract Description | | Number of
Contracts
Long (Short) | | Notional
Market Value | | Expiration
Date | | Unrealized
Appreciation | | Unrealized
Depreciation | |
| U.S. Treasury Note, 5-year | | | (4 | ) | | $ | (495,188 | ) | | June 2012 | | $ | — | | | $ | (508 | ) | |
| U.S. Treasury Note, 10-year | | | 82 | | | | 10,847,063 | | | June 2012 | | | 192,411 | | | | — | | |
| U.S. Treasury Long Bond, 20-year | | | (142 | ) | | | (20,288,250 | ) | | June 2012 | | | — | | | | (311,727 | ) | |
| U.S. Treasury Ultra Bond, 30-year | | | (297 | ) | | | (46,870,313 | ) | | June 2012 | | | — | | | | (1,807,103 | ) | |
| Total | | | | | | | | $ | 192,411 | | | $ | (2,119,338 | ) | |
The Accompanying Notes to Financial Statements are an integral part of this statement.
13
Columbia Bond Fund
April 30, 2012
| Notes to Portfolio of Investments | |
(a) Variable rate security. The interest rate shown reflects the rate as of April 30, 2012.
(b) Security exempt from registration pursuant to Rule 144A under the Securities Act of 1933. This security may be resold in transactions exempt from registration, normally to qualified institutional buyers. At April 30, 2012, the value of these securities amounted to $71,486,186 or 4.06% of net assets.
(c) At April 30, 2012, security was partially or fully on loan.
(d) The maturity dates shown represent the original maturity of the underlying obligation. Actual maturity may vary based upon prepayment activity on these obligations. Unless otherwise noted, the coupon rates presented are fixed rates.
(e) Represents a security purchased on a when-issued or delayed delivery basis.
(f) At April 30, 2012, investments in securities included securities valued at $1,851,601 that were partially pledged as collateral to cover initial margin deposits on open interest rate futures contracts.
(g) Interest Only (IO) security. The actual effective yield of this security is different than the stated coupon rate.
(h) Identifies issues considered to be illiquid as to their marketability. The aggregate value of such securities at April 30, 2012 was $5,968, representing less than 0.01% of net assets. Information concerning such security holdings at April 30, 2012 was as follows:
| Security Description | | Acquisition
Dates | | Cost | |
American Mortgage Trust
Series 2093-3 Class 3A
07/27/23 8.188% | | 10/22/10-10/12/11 | | $ | 6,081 | | |
(i) Represents fair value as determined in good faith under procedures approved by the Board of Trustees. At April 30, 2012, the value of these securities amounted to $5,968, which represents less than 0.01% of net assets.
(j) Zero coupon bond.
(k) The rate shown is the seven-day current annualized yield at April 30, 2012.
(l) Investments in affiliates during the period ended April 30, 2012:
| Issuer | | Beginning
Cost | | Purchase
Cost | | Sales Cost/
Proceeds
from Sales | | Realized
Gain/Loss | | Ending
Cost | | Dividends
or Interest
Income | | Value | |
Columbia Short-Term
Cash Fund | | $ | 8,534,025 | | | $ | 54,745,664 | | | $ | (55,863,035 | ) | | $ | — | | | $ | 7,416,654 | | | $ | 1,351 | | | $ | 7,416,654 | | |
Investments in affiliates during the year ended March 31, 2012:
| Issuer | | Beginning
Cost | | Purchase
Cost | | Sales Cost/
Proceeds
from Sales | | Realized
Gain/Loss | | Ending
Cost | | Dividends
or Interest
Income | | Value | |
Columbia Short-Term
Cash Fund | | $ | — | | | $ | 876,229,321 | | | $ | (867,695,296 | ) | | $ | — | | | $ | 8,534,025 | | | $ | 85,100 | | | $ | 8,534,025 | | |
The Accompanying Notes to Financial Statements are an integral part of this statement.
14
Columbia Bond Fund
April 30, 2012
| Notes to Portfolio of Investments (continued) | |
(m) The table below represents securities received as collateral for repurchase agreements. This collateral is deposited with the Fund's custodian and, pursuant to the terms of the repurchase agreement, must have an aggregate market value greater than or equal to the repurchase price plus accrued interest at all times. The value of securities and/or cash held as collateral for repurchase agreements is monitored on a daily basis to ensure the proper level of collateral.
Mizuho Securities USA, Inc. (0.240%)
| Security Description | | Value | |
| Fannie Mae REMICS | | $ | 2,530,245 | | |
| Freddie Mac REMICS | | | 2,569,755 | | |
| Total Market Value of Collateral Securities | | $ | 5,100,000 | | |
RBS Securities, Inc. (0.210%)
| Security Description | | Value | |
| United States Treasury Note/Bond | | $ | 10,200,050 | | |
| Total Market Value of Collateral Securities | | $ | 10,200,050 | | |
Societe Generale (0.210%)
| Security Description | | Value | |
| Fannie Mae Pool | | $ | 5,050,000 | | |
| Freddie Mac Gold Pool | | | 2,361,537 | | |
| Total Market Value of Collateral Securities | | $ | 7,411,537 | | |
| Abbreviation Legend | |
CMO Collateralized Mortgage Obligation
STRIPS Separate Trading of Registered Interest and Principal Securities
Generally accepted accounting principles (GAAP) require disclosure regarding the inputs and valuation techniques used to measure fair value and any changes in valuation inputs or techniques. In addition, investments shall be disclosed by major category.
The Fund categorizes its fair value measurements according to a three-level hierarchy that maximizes the use of observable inputs and minimizes the use of unobservable inputs by prioritizing that the most observable input be used when available. Observable inputs are those that market participants would use in pricing an investment based on market data obtained from sources independent of the reporting entity. Unobservable inputs are those that reflect the Fund's assumptions about the information market participants would use in pricing an investment. An investment's level within the fair value hierarchy is based on the lowest level of any input that is deemed significant to the asset or liability's fair value measurement. The input levels are not necessarily an indication of the risk or liquidity associated with investments at that level. For example, certain U.S. government securities are generally high quality and liquid, however, they are reflected as Level 2 because the inputs used to determine fair value may not always be quoted prices in an active market.
Fair value inputs are summarized in the three broad levels listed below:
• Level 1 — Valuations based on quoted prices for investments in active markets that the Fund has the ability to access at the measurement date (including NAV for open-end mutual funds). Valuation adjustments are not applied to Level 1 investments.
• Level 2 — Valuations based on other significant observable inputs (including quoted prices for similar securities, interest rates, prepayment speeds, credit risks, etc.).
• Level 3 — Valuations based on significant unobservable inputs (including the Fund's own assumptions and judgment in determining the fair value of investments).
Inputs that are used in determining fair value of an investment may include price information, credit data, volatility statistics, and other factors. These inputs can be either observable or unobservable. The availability of observable inputs can vary between investments, and is affected by various factors such as the type of investment, and the volume and level of activity for that investment or similar investments in the marketplace. The inputs will be considered by the Investment Manager, along with any other relevant factors in the calculation of an investment's fair value. The Fund uses prices and inputs that are current as of the measurement date, which may include periods of market dislocations. During these periods, the availability of prices and inputs may be reduced for many investments. This condition could cause an investment to be reclassified between the various levels within the hierarchy.
The Accompanying Notes to Financial Statements are an integral part of this statement.
15
Columbia Bond Fund
April 30, 2012
| Fair Value Measurements (continued) | |
Investments falling into the Level 3 category are primarily supported by quoted prices from brokers and dealers participating in the market for those investments. However, these may be classified as Level 3 investments due to lack of market transparency and corroboration to support these quoted prices. Additionally, valuation models may be used as the pricing source for any remaining investments classified as Level 3. These models rely on one or more significant unobservable inputs and/or significant assumptions by the Investment Manager. Inputs used in valuations may include, but are not limited to, financial statement analysis, capital account balances, discount rates and estimated cash flows, and comparable company data.
Under the direction of the Fund's Board of Trustees (the Board), the Investment Manager's Valuation Committee (the Committee) is responsible for carrying out the valuation procedures approved by the Board. The Committee consists of voting and non-voting members from various groups within the Investment Manager's organization, including operations and accounting, trading and investments, compliance, risk management and legal.
The Committee meets at least monthly to review and approve valuation matters, which may include a description of specific valuation determinations, data regarding pricing information received from approved pricing vendors and brokers and the results of Board-approved valuation control policies and procedures (the Policies). The Policies address, among other things, instances when market quotations are readily available, including recommendation of third party pricing vendors and a determination of appropriate pricing methodologies; events that require specific valuation determinations and assessment of fair value techniques; securities with a potential for stale pricing, including those that are illiquid, restricted, or in default; and the effectiveness of third-party pricing vendors, including periodic reviews of vendors. The Committee meets more frequently, as needed, to discuss additional valuation matters, which may include the need to review back-testing results, review time-sensitive information or approve related valuation actions. The Committee reports to the Board, with members of the Committee meeting with the Board at each of its regularly scheduled meetings to discuss valuation matters and actions during the period, similar to those described earlier.
For investments categorized as Level 3, the Committee monitors information similar to that described above, which may include: (i) data specific to the issuer or comparable issuers, (ii) general market or specific sector news and (iii) quoted prices and specific or similar security transactions. The Committee considers this data and any changes from prior periods in order to assess the reasonableness of observable and unobservable inputs, any assumptions or internal models used to value those securities and changes in fair value. This data is also used to corroborate, when available, information received from approved pricing vendors and brokers. Various factors impact the frequency of monitoring this information (which may occur as often as daily). However, the Committee may determine that changes to inputs, assumptions and models are not required as a result of the monitoring procedures performed.
The Accompanying Notes to Financial Statements are an integral part of this statement.
16
Columbia Bond Fund
April 30, 2012
| Fair Value Measurements (continued) | |
The following table is a summary of the inputs used to value the Fund's investments as of April 30, 2012:
| | | Fair value at April 30, 2012 | |
| Description | | Level 1
Quoted Prices
in Active
Markets for
Identical Assets | | Level 2
Other
Significant
Observable
Inputs | | Level 3
Significant
Unobservable
Inputs | | Total | |
| Bonds | |
| Corporate Bonds & Notes | | $ | — | | | $ | 472,448,720 | | | $ | — | | | $ | 472,448,720 | | |
| Residential Mortgage-Backed Securities — Agency | | | — | | | | 655,138,427 | | | | — | | | | 655,138,427 | | |
| Residential Mortgage-Backed Securities — Non-Agency | | | — | | | | 4,523,418 | | | | 2,022,584 | | | | 6,546,002 | | |
| Commercial Mortgage-Backed Securities — Agency | | | — | | | | 37,231,244 | | | | — | | | | 37,231,244 | | |
| Commercial Mortgage-Backed Securities — Non-Agency | | | — | | | | 276,437,011 | | | | — | | | | 276,437,011 | | |
| Asset-Backed Securities — Non-Agency | | | — | | | | 35,583,807 | | | | — | | | | 35,583,807 | | |
| U.S. Treasury Obligations | | | 114,009,305 | | | | 63,330,521 | | | | — | | | | 177,339,826 | | |
| U.S. Government & Agency Obligations | | | — | | | | 42,071,182 | | | | — | | | | 42,071,182 | | |
| Foreign Government Obligations | | | — | | | | 16,366,867 | | | | — | | | | 16,366,867 | | |
| Municipal Bonds | | | — | | | | 19,691,110 | | | | — | | | | 19,691,110 | | |
| Preferred Debt | | | 8,737,210 | | | | — | | | | — | | | | 8,737,210 | | |
| Total Bonds | | | 122,746,515 | | | | 1,622,822,307 | | | | 2,022,584 | | | | 1,747,591,406 | | |
| Equity Securities | |
| Common Stocks | |
| Financials | | | 969 | | | | — | | | | — | | | | 969 | | |
| Total Equity Securities | | | 969 | | | | — | | | | — | | | | 969 | | |
| Short-Term Securities | |
| Treasury Note Short-Term | | | 75,548,674 | | | | — | | | | — | | | | 75,548,674 | | |
| Total Short-Term Securities | | | 75,548,674 | | | | — | | | | — | | | | 75,548,674 | | |
| Other | |
| Money Market Funds | | | 7,416,654 | | | | — | | | | — | | | | 7,416,654 | | |
| Investments of Cash Collateral Received for Securities on Loan | | | — | | | | 22,266,213 | | | | — | | | | 22,266,213 | | |
| Total Other | | | 7,416,654 | | | | 22,266,213 | | | | — | | | | 29,682,867 | | |
| Investments in Securities | | | 205,712,812 | | | | 1,645,088,520 | | | | 2,022,584 | | | | 1,852,823,916 | | |
| Derivatives | |
| Assets | |
| Futures Contracts | | | 192,411 | | | | — | | | | — | | | | 192,411 | | |
| Liabilities | |
| Futures Contracts | | | (2,119,338 | ) | | | — | | | | — | | | | (2,119,338 | ) | |
| Total | | $ | 203,785,885 | | | $ | 1,645,088,520 | | | $ | 2,022,584 | | | $ | 1,850,896,989 | | |
See the Portfolio of Investments for all investment classifications not indicated in the table.
The Fund's assets assigned to the Level 2 input category are generally valued using the market approach, in which a security's value is determined through reference to prices and information from market transactions for similar or identical assets.
There were no transfers of financial assets between Levels 1 and 2 during the period from April 1, 2012 to April 30, 2012.
Derivative instruments are valued at unrealized appreciation (depreciation).
The Accompanying Notes to Financial Statements are an integral part of this statement.
17
Columbia Bond Fund
April 30, 2012
| Fair Value Measurements (continued) | |
The following table is a reconciliation of Level 3 assets for which significant observable and/or unobservable inputs were used to determine fair value.
| | | Corporate
Bonds & Notes | | Residential
Mortgage-Backed
Securities—
Non-Agency | | Total | |
| Balance as of March 31, 2011 | | $ | 469,101 | | | $ | 6,571 | | | $ | 475,672 | | |
| Accrued discounts/premiums | | | — | | | | 394 | | | | 394 | | |
| Realized gain (loss) | | | — | | | | 357 | | | | 357 | | |
| Change in unrealized appreciation (depreciation)* | | | — | | | | 55,208 | | | | 55,208 | | |
| Sales | | | — | | | | (195,896 | ) | | | (195,896 | ) | |
| Purchases | | | — | | | | 2,155,950 | | | | 2,155,950 | | |
| Transfers into Level 3 | | | — | | | | — | | | | — | | |
| Transfers out of Level 3 | | | (469,101 | ) | | | — | | | | (469,101 | ) | |
| Balance as of April 30, 2012 | | $ | — | | | $ | 2,022,584 | | | $ | 2,022,584 | | |
* Change in unrealized appreciation (depreciation) relating to securities held at April 30, 2012 was $55,208, which is comprised of Residential Mortgage Backed Securities–Non Agency.
The Fund does not hold any significant investments with unobservable inputs which are categorized as Level 3.
The Fund's assets assigned to the Level 3 category are valued utilizing the valuation technique deemed the most appropriate in the circumstances. Certain Mortgage Backed Securities classified as Level 3 are valued using the market approach. To determine fair value for these securities, management considered various factors which may have included, but were not limited to, estimated cash flows of the securities, observed yields on comparable securities, and the utilization of single market quotations from broker dealers.
Financial assets were transferred from Level 3 to Level 2 as observable market inputs were utilized and management's determination that there was sufficient, reliable and observable market data to value these assets as of period end.
Transfers in and/or out of Level 3 are determined based on the fair value at the beginning of the period for security positions held throughout the period.
The Accompanying Notes to Financial Statements are an integral part of this statement.
18
Columbia Bond Fund
April 30, 2012
| Fair Value Measurements (continued) | |
The following table is a summary of the inputs used to value the Fund's investments as of March 31, 2012:
| | | Fair Value at March 31, 2012 | |
| Description | | Level 1
Quoted Prices
in Active
Markets for
Identical Assets | | Level 2
Other
Significant
Observable
Inputs | | Level 3
Significant
Unobservable
Inputs | | Total | |
| Bonds | |
| Corporate Bonds & Notes | | $ | — | | | $ | 524,346,172 | | | $ | — | | | $ | 524,346,172 | | |
| Residential Mortgage-Backed Securities — Agency | | | — | | | | 721,441,837 | | | | — | | | | 721,441,837 | | |
| Residential Mortgage-Backed Securities — Non-Agency | | | — | | | | 2,853,415 | | | | 2,059,103 | | | | 4,912,518 | | |
| Commercial Mortgage-Backed Securities — Agency | | | — | | | | 36,835,319 | | | | — | | | | 36,835,319 | | |
| Commercial Mortgage-Backed Securities — Non-Agency | | | — | | | | 311,821,438 | | | | — | | | | 311,821,438 | | |
| Asset-Backed Securities — Non-Agency | | | — | | | | 40,935,188 | | | | — | | | | 40,935,188 | | |
| U.S. Treasury Obligations | | | 100,388,158 | | | | 60,545,183 | | | | — | | | | 160,933,341 | | |
| U.S. Government & Agency Obligations | | | — | | | | 40,580,439 | | | | — | | | | 40,580,439 | | |
| Foreign Government Obligations | | | — | | | | 17,701,941 | | | | — | | | | 17,701,941 | | |
| Municipal Bonds | | | — | | | | 20,794,843 | | | | — | | | | 20,794,843 | | |
| Preferred Debt | | | 10,882,968 | | | | — | | | | — | | | | 10,882,968 | | |
| Total Bonds | | | 111,271,126 | | | | 1,777,855,775 | | | | 2,059,103 | | | | 1,891,186,004 | | |
| Equity Securities | |
| Common Stocks | |
| Financials | | | 1,018 | | | | — | | | | — | | | | 1,018 | | |
| Total Equity Securities | | | 1,018 | | | | — | | | | — | | | | 1,018 | | |
| Short-Term Securities | |
| Treasury Note Short-Term | | | 76,544,492 | | | | — | | | | — | | | | 76,544,492 | | |
| Total Short-Term Securities | | | 76,544,492 | | | | — | | | | — | | | | 76,544,492 | | |
| Other | |
| Money Market Funds | | | 8,534,025 | | | | — | | | | — | | | | 8,534,025 | | |
| Investments of Cash Collateral Received for Securities on Loan | | | — | | | | 45,604,635 | | | | — | | | | 45,604,635 | | |
| Total Other | | | 8,534,025 | | | | 45,604,635 | | | | — | | | | 54,138,660 | | |
| Investments in Securities | | | 196,350,661 | | | | 1,823,460,410 | | | | 2,059,103 | | | | 2,021,870,174 | | |
| Derivatives | |
| Assets | |
| Futures Contracts | | | 486,406 | | | | — | | | | — | | | | 486,406 | | |
| Total | | $ | 196,837,067 | | | $ | 1,823,460,410 | | | $ | 2,059,103 | | | $ | 2,022,356,580 | | |
The Fund's assets assigned to the Level 2 input category are generally valued using the market approach, in which a security's value is determined through reference to prices and information from market transactions for similar or identical assets.
There were no transfers of financial assets between Levels 1 and 2 during the period from April 1, 2011 to March 31, 2012.
Derivative instruments are valued at unrealized appreciation (depreciation).
The Accompanying Notes to Financial Statements are an integral part of this statement.
19
Statement of Assets and Liabilities – Columbia Bond Fund
| | | April 30,
2012 | | March 31,
2012 | |
| Assets | |
| Investments, at value* | |
| Unaffiliated issuers (identified cost $1,717,453,762 and $1,874,610,123) | | $ | 1,823,141,049 | | | $ | 1,967,731,514 | | |
| Affiliated issuers (identified cost $7,416,654 and $8,534,025) | | | 7,416,654 | | | | 8,534,025 | | |
| Investment of cash collateral received for securities on loan | |
| Short-term securities (identified cost $— and $5,000,000) | | | — | | | | 5,000,000 | | |
| Repurchase agreements (identified cost $22,266,213 and $40,604,635) | | | 22,266,213 | | | | 40,604,635 | | |
| Total investments (identified cost $1,747,136,629 and $1,928,748,783) | | | 1,852,823,916 | | | | 2,021,870,174 | | |
| Receivable for: | |
| Investments sold | | | 813,496 | | | | 48,030,107 | | |
| Capital shares sold | | | 2,320,814 | | | | 3,339,825 | | |
| Dividends | | | 1,318 | | | | 92,574 | | |
| Interest | | | 10,527,788 | | | | 11,080,234 | | |
| Reclaims | | | 20,919 | | | | — | | |
| Variation margin on futures contracts | | | — | | | | 612,891 | | |
| Expense reimbursement due from Investment Manager | | | 25,415 | | | | 21,272 | | |
| Prepaid expense | | | 11,026 | | | | 22,420 | | |
| Trustees' deferred compensation plan | | | 149,149 | | | | 149,149 | | |
| Other assets | | | 3,301 | | | | 6,052 | | |
| Total assets | | | 1,866,697,142 | | | | 2,085,224,698 | | |
| Liabilities | |
| Due upon return of securities on loan | | | 22,266,213 | | | | 45,604,635 | | |
| Payable for: | |
| Investments purchased | | | — | | | | 26,458,288 | | |
| Investments purchased on a delayed delivery basis | | | 75,323,381 | | | | 82,750,125 | | |
| Capital shares purchased | | | 4,963,136 | | | | 32,307,004 | | |
| Dividend distributions to shareholders | | | 4,763,636 | | | | 5,908,044 | | |
| Variation margin on futures contracts | | | 58,469 | | | | — | | |
| Investment management fees | | | 61,437 | | | | 22,402 | | |
| Distribution and service fees | | | 3,411 | | | | 1,135 | | |
| Transfer agent fees | | | 299,784 | | | | 327,248 | | |
| Administration fees | | | 9,274 | | | | 3,366 | | |
| Compensation of board members | | | 36,074 | | | | 35,294 | | |
| Chief compliance officer expenses | | | 109 | | | | 318 | | |
| Other expenses | | | 115,890 | | | | 110,978 | | |
| Trustees' deferred compensation plan | | | 149,149 | | | | 149,149 | | |
| Total liabilities | | | 108,049,963 | | | | 193,677,986 | | |
| Net assets applicable to outstanding capital stock | | $ | 1,758,647,179 | | | $ | 1,891,546,712 | | |
The Accompanying Notes to Financial Statements are an integral part of this statement.
20
Statement of Assets and Liabilities (continued) – Columbia Bond Fund
| | | April 30,
2012 | | March 31,
2012 | |
| Represented by | |
| Paid-in capital | | $ | 1,641,929,576 | | | $ | 1,791,281,864 | | |
| Excess of distributions over net investment income | | | (2,226,210 | ) | | | (2,349,268 | ) | |
| Accumulated net realized gain | | | 15,192,378 | | | | 9,012,493 | | |
| Unrealized appreciation (depreciation) on: | |
| Investments | | | 105,687,287 | | | | 93,121,391 | | |
| Futures contracts | | | (1,926,927 | ) | | | 486,406 | | |
| Swap contracts | | | (8,925 | ) | | | (6,174 | ) | |
Total — representing net assets
applicable to outstanding capital stock | | $ | 1,758,647,179 | | | $ | 1,891,546,712 | | |
| *Value of securities on loan | | $ | 76,950,738 | | | $ | 104,938,682 | | |
| Net assets applicable to outstanding shares | |
| Class A | | $ | 82,929,248 | | | $ | 82,040,686 | | |
| Class B | | $ | 2,872,025 | | | $ | 2,969,388 | | |
| Class C | | $ | 17,129,310 | | | $ | 16,871,529 | | |
| Class I | | $ | 15,545,238 | | | $ | 15,931,358 | | |
| Class R | | $ | 2,553,327 | | | $ | 2,505,809 | | |
| Class T | | $ | 15,630,078 | | | $ | 15,576,579 | | |
| Class W | | $ | 2,520 | | | $ | 2,499 | | |
| Class Y | | $ | 22,718,396 | | | $ | 22,474,313 | | |
| Class Z | | $ | 1,599,267,037 | | | $ | 1,733,174,551 | | |
| Shares outstanding | |
| Class A | | | 8,657,043 | | | | 8,640,000 | | |
| Class B | | | 299,825 | | | | 312,724 | | |
| Class C | | | 1,789,684 | | | | 1,778,310 | | |
| Class I | | | 1,621,156 | | | | 1,676,141 | | |
| Class R | | | 266,499 | | | | 263,849 | | |
| Class T | | | 1,633,767 | | | | 1,642,575 | | |
| Class W | | | 263 | | | | 263 | | |
| Class Y | | | 2,368,190 | | | | 2,363,458 | | |
| Class Z | | | 166,942,341 | | | | 182,524,744 | | |
| Net asset value per share | |
| Class A(a) | | $ | 9.58 | | | $ | 9.50 | | |
| Class B | | $ | 9.58 | | | $ | 9.50 | | |
| Class C | | $ | 9.57 | | | $ | 9.49 | | |
| Class I | | $ | 9.59 | | | $ | 9.50 | | |
| Class R | | $ | 9.58 | | | $ | 9.50 | | |
| Class T(a) | | $ | 9.57 | | | $ | 9.48 | | |
| Class W | | $ | 9.58 | | | $ | 9.50 | | |
| Class Y | | $ | 9.59 | | | $ | 9.51 | | |
| Class Z | | $ | 9.58 | | | $ | 9.50 | | |
(a) At April 30, 2012 the maximum offering price per share for Class A is $10.06 and Class T is $10.05. At March 31, 2012 the maximum offering price per share for Class A is 9.97 and Class T is 9.95. The offering price is calculated by dividing the net asset value by 1.0 minus the maximum sales charge of 4.75%.
The Accompanying Notes to Financial Statements are an integral part of this statement.
21
Statement of Operations – Columbia Bond Fund
| Year ended | | April 30,
2012(a) | | March 31,
2012(b) | |
| Net investment income | |
| Income: | | | | | |
| Dividends | | $ | 71,460 | | | $ | 436,190 | | |
| Interest | | | 5,775,712 | | | | 83,652,222 | | |
| Dividends from affiliates | | | 1,351 | | | | 85,100 | | |
| Income from securities lending — net | | | 18,267 | | | | 62,175 | | |
| Foreign taxes withheld | | | (7,319 | ) | | | (1,000 | ) | |
| Total income | | | 5,859,471 | | | | 84,234,687 | | |
| Expenses: | |
| Investment management fees | | | 674,221 | | | | 9,193,773 | | |
| Distribution fees | | | | | |
| Class B | | | 1,860 | | | | 29,481 | | |
| Class C | | | 10,718 | | | | 105,763 | | |
| Class R | | | 1,071 | | | | 2,840 | | |
| Service fees | |
| Class A | | | 17,423 | | | | 192,222 | | |
| Class B | | | 620 | | | | 9,827 | | |
| Class C | | | 3,571 | | | | 35,265 | | |
| Class W | | | 1 | | | | 7 | | |
| Shareholder service fee — Class T | | | 1,983 | | | | 24,180 | | |
| Transfer agent fees | | | | | |
| Class A | | | 13,548 | | | | 157,683 | | |
| Class B | | | 482 | | | | 8,396 | | |
| Class C | | | 2,777 | | | | 28,748 | | |
| Class R | | | 416 | | | | 1,821 | | |
| Class T | | | 2,570 | | | | 33,099 | | |
| Class W | | | — | | | | 6 | | |
| Class Y | | | 2 | | | | 32 | | |
| Class Z | | | 280,270 | | | | 4,064,075 | | |
| Administration fees | | | 101,460 | | | | 1,355,768 | | |
| Compensation of board members | | | 11,610 | | | | 28,894 | | |
| Pricing and bookkeeping fees | | | — | | | | 29,937 | | |
| Custodian fees | | | 3,566 | | | | 77,120 | | |
| Printing and postage fees | | | 10,333 | | | | 221,438 | | |
| Registration fees | | | 9,555 | | | | 333,897 | | |
| Professional fees | | | 55,248 | | | | 126,863 | | |
| Line of credit interest expense | | | — | | | | 50 | | |
| Chief compliance officer expenses | | | 104 | | | | 1,429 | | |
| Other | | | 12,666 | | | | 86,377 | | |
| Total expenses | | | 1,216,075 | | | | 16,148,991 | | |
| Fees waived or expenses reimbursed by | | | | | |
| Investment Manager and its affiliates | | | (305,850 | ) | | | (3,840,021 | ) | |
| Fees waived by Distributor — Class C | | | (2,148 | ) | | | (21,128 | ) | |
| Expense reductions | | | — | | | | (3,125 | ) | |
| Total net expenses | | | 908,077 | | | | 12,284,717 | | |
| Net investment income | | | 4,951,394 | | | | 71,949,970 | | |
| Realized and unrealized gain (loss) — net | |
| Net realized gain (loss) on: | |
| Investments | | | 5,939,664 | | | | 54,437,450 | | |
| Futures contracts | | | 178,597 | | | | (21,997,291 | ) | |
| Swap contracts | | | — | | | | (542,362 | ) | |
| Net realized gain | | | 6,118,261 | | | | 31,897,797 | | |
| Net change in unrealized appreciation (depreciation) on: | | | | | |
| Investments | | | 12,565,896 | | | | 62,172,117 | | |
| Futures contracts | | | (2,413,333 | ) | | | (373,991 | ) | |
| Swap contracts | | | (2,751 | ) | | | (17,099 | ) | |
| Net change in unrealized appreciation | | | 10,149,812 | | | | 61,781,027 | | |
| Net realized and unrealized gain | | | 16,268,073 | | | | 93,678,824 | | |
| Net increase in net assets resulting from operations | | $ | 21,219,467 | | | $ | 165,628,794 | | |
(a) For the period from April 1, 2012 to April 30, 2012. During the period, the Fund's fiscal year end was changed from March 31 to April 30.
(b) Class R shares are for the period from November 16, 2011 (commencement of operations) to March 31, 2012.
The Accompanying Notes to Financial Statements are an integral part of this statement.
22
Statement of Changes in Net Assets – Columbia Bond Fund
| Year ended | | April 30,
2012(a) | | March 31,
2012(b) | | March 31,
2011(c)(d) | |
| Operations | |
| Net investment income | | $ | 4,951,394 | | | $ | 71,949,970 | | | $ | 25,455,366 | | |
| Net realized gain | | | 6,118,261 | | | | 31,897,797 | | | | 17,533,572 | | |
Net change in unrealized
appreciation (depreciation) | | | 10,149,812 | | | | 61,781,027 | | | | (13,509,262 | ) | |
Net increase in net
assets resulting from operations | | | 21,219,467 | | | | 165,628,794 | | | | 29,479,676 | | |
| Distributions to shareholders from: | |
| Net investment income | |
| Class A | | | (196,884 | ) | | | (2,343,459 | ) | | | (582,015 | ) | |
| Class B | | | (5,193 | ) | | | (91,522 | ) | | | (6,643 | ) | |
| Class C | | | (32,112 | ) | | | (358,116 | ) | | | (69,531 | ) | |
| Class I | | | (41,633 | ) | | | (2,361,910 | ) | | | (432,741 | ) | |
| Class R | | | (5,535 | ) | | | (15,351 | ) | | | — | | |
| Class T | | | (38,608 | ) | | | (509,007 | ) | | | (27,533 | ) | |
| Class W | | | (6 | ) | | | (76 | ) | | | (38 | ) | |
| Class Y | | | (59,561 | ) | | | (714,298 | ) | | | (667,568 | ) | |
| Class Z | | | (4,387,180 | ) | | | (65,304,401 | ) | | | (25,311,264 | ) | |
| Net realized gains | |
| Class A | | | — | | | | (964,301 | ) | | | (319,407 | ) | |
| Class B | | | — | | | | (48,988 | ) | | | — | | |
| Class C | | | — | | | | (169,166 | ) | | | (47,886 | ) | |
| Class I | | | — | | | | (771,001 | ) | | | (194,191 | ) | |
| Class R | | | — | | | | (21 | ) | | | — | | |
| Class T | | | — | | | | (205,032 | ) | | | — | | |
| Class W | | | — | | | | (32 | ) | | | (34 | ) | |
| Class Y | | | — | | | | (246,748 | ) | | | (417,810 | ) | |
| Class Z | | | — | | | | (24,119,296 | ) | | | (13,371,222 | ) | |
| Total distributions to shareholders | | | (4,766,712 | ) | | | (98,222,725 | ) | | | (41,447,883 | ) | |
Increase (decrease) in net
assets from share transactions | | | (149,352,288 | ) | | | (716,438,392 | ) | | | 1,938,449,927 | | |
Total increase (decrease)
in net assets | | | (132,899,533 | ) | | | (649,032,323 | ) | | | 1,926,481,720 | | |
| Net assets at beginning of year | | | 1,891,546,712 | | | | 2,540,579,035 | | | | 614,097,315 | | |
| Net assets at end of year | | $ | 1,758,647,179 | | | $ | 1,891,546,712 | | | $ | 2,540,579,035 | | |
Undistributed (excess of distributions over) net
investment income | | $ | (2,226,210 | ) | | $ | (2,349,268 | ) | | $ | 986,530 | | |
(a) For the period from April 1, 2012 to April 30, 2012. During the period, the Fund's fiscal year end was changed from March 31 to April 30.
(b) Class R shares are for the period from November 16, 2011 (commencement of operations) to March 31, 2012.
(c) Class B and Class T shares are for the period from March 7, 2011 (commencement of operations) to March 31, 2011.
(d) Class I and Class W shares are for the period from September 27, 2010 (commencement of operations) to March 31, 2011.
The Accompanying Notes to Financial Statements are an integral part of this statement.
23
Statement of Changes in Net Assets (continued) – Columbia Bond Fund
| Year ended | | April 30, 2012(a) | | March 31, 2012(b) | | March 31, 2011(c)(d) | |
| | | Shares | | Dollars ($) | | Shares | | Dollars ($) | | Shares | | Dollars ($) | |
| Capital stock activity | |
| Class A shares | |
| Subscriptions(e) | | | 133,584 | | | | 1,275,717 | | | | 2,466,117 | | | | 23,216,229 | | | | 896,716 | | | | 8,412,184 | | |
| Fund merger | | | — | | | | — | | | | — | | | | — | | | | 6,825,239 | | | | 63,256,049 | | |
| Distributions reinvested | | | 14,755 | | | | 141,356 | | | | 227,609 | | | | 2,144,666 | | | | 79,020 | | | | 739,266 | | |
| Redemptions | | | (131,296 | ) | | | (1,252,415 | ) | | | (2,254,990 | ) | | | (21,242,500 | ) | | | (1,254,255 | ) | | | (11,731,528 | ) | |
| Net increase | | | 17,043 | | | | 164,658 | | | | 438,736 | | | | 4,118,395 | | | | 6,546,720 | | | | 60,675,971 | | |
| Class B shares | |
| Subscriptions | | | 4,453 | | | | 42,574 | | | | 62,926 | | | | 593,536 | | | | 1,557 | | | | 14,456 | | |
| Fund merger | | | — | | | | — | | | | — | | | | — | | | | 605,596 | | | | 5,612,182 | | |
| Distributions reinvested | | | 293 | | | | 2,807 | | | | 7,536 | | | | 70,890 | | | | 354 | | | | 3,268 | | |
| Redemptions(e) | | | (17,645 | ) | | | (168,627 | ) | | | (336,494 | ) | | | (3,166,438 | ) | | | (28,751 | ) | | | (266,349 | ) | |
| Net increase (decrease) | | | (12,899 | ) | | | (123,246 | ) | | | (266,032 | ) | | | (2,502,012 | ) | | | 578,756 | | | | 5,363,557 | | |
| Class C shares | |
| Subscriptions | | | 39,827 | | | | 380,533 | | | | 768,588 | | | | 7,258,303 | | | | 94,835 | | | | 891,262 | | |
| Fund merger | | | — | | | | — | | | | — | | | | — | | | | 1,214,993 | | | | 11,259,417 | | |
| Distributions reinvested | | | 2,317 | | | | 22,172 | | | | 32,857 | | | | 309,427 | | | | 8,923 | | | | 83,423 | | |
| Redemptions | | | (30,770 | ) | | | (293,025 | ) | | | (473,080 | ) | | | (4,465,131 | ) | | | (108,374 | ) | | | (1,010,438 | ) | |
| Net increase | | | 11,374 | | | | 109,680 | | | | 328,365 | | | | 3,102,599 | | | | 1,210,377 | | | | 11,223,664 | | |
| Class I shares | |
| Subscriptions | | | 14,940 | | | | 142,568 | | | | 1,248,569 | | | | 11,773,163 | | | | 39,675,596 | | | | 368,286,257 | | |
| Distributions reinvested | | | 4,341 | | | | 41,626 | | | | 330,562 | | | | 3,106,169 | | | | 68,979 | | | | 640,243 | | |
| Redemptions | | | (74,266 | ) | | | (709,779 | ) | | | (30,616,470 | ) | | | (286,505,416 | ) | | | (9,031,095 | ) | | | (83,363,670 | ) | |
| Net increase (decrease) | | | (54,985 | ) | | | (525,585 | ) | | | (29,037,339 | ) | | | (271,626,084 | ) | | | 30,713,480 | | | | 285,562,830 | | |
| Class R shares | |
| Subscriptions | | | 4,170 | | | | 39,766 | | | | 276,877 | | | | 2,622,859 | | | | — | | | | — | | |
| Distributions reinvested | | | 577 | | | | 5,529 | | | | 1,604 | | | | 15,297 | | | | — | | | | — | | |
| Redemptions | | | (2,097 | ) | | | (20,018 | ) | | | (14,632 | ) | | | (139,585 | ) | | | — | | | | — | | |
| Net increase | | | 2,650 | | | | 25,277 | | | | 263,849 | | | | 2,498,571 | | | | — | | | | — | | |
| Class T shares | |
| Subscriptions | | | 836 | | | | 7,970 | | | | 19,106 | | | | 176,296 | | | | 3,625 | | | | 33,404 | | |
| Fund merger | | | — | | | | — | | | | — | | | | — | | | | 1,776,589 | | | | 16,446,074 | | |
| Distributions reinvested | | | 2,648 | | | | 25,340 | | | | 49,402 | | | | 464,745 | | | | 1,865 | | | | 17,212 | | |
| Redemptions | | | (12,292 | ) | | | (117,231 | ) | | | (187,036 | ) | | | (1,766,964 | ) | | | (20,976 | ) | | | (193,415 | ) | |
| Net increase (decrease) | | | (8,808 | ) | | | (83,921 | ) | | | (118,528 | ) | | | (1,125,923 | ) | | | 1,761,103 | | | | 16,303,275 | | |
| Class W shares | |
| Subscriptions | | | — | | | | — | | | | — | | | | — | | | | 277 | | | | 2,650 | | |
| Distributions reinvested | | | — | | | | — | | | | — | | | | — | | | | 2 | | | | 20 | | |
| Redemptions | | | — | | | | — | | | | — | | | | — | | | | (16 | ) | | | (150 | ) | |
| Net increase | | | — | | | | — | | | | — | | | | — | | | | 263 | | | | 2,520 | | |
| Class Y shares | |
| Subscriptions | | | 6,004 | | | | 57,586 | | | | 489,177 | | | | 4,533,300 | | | | 1,013,824 | | | | 9,640,583 | | |
| Distributions reinvested | | | — | | | | — | | | | 11,928 | | | | 111,880 | | | | 77,435 | | | | 725,037 | | |
| Redemptions | | | (1,272 | ) | | | (12,186 | ) | | | (809,035 | ) | | | (7,635,396 | ) | | | (23,119 | ) | | | (217,000 | ) | |
| Net increase (decrease) | | | 4,732 | | | | 45,400 | | | | (307,930 | ) | | | (2,990,216 | ) | | | 1,068,140 | | | | 10,148,620 | | |
| Class Z shares | |
| Subscriptions | | | 3,195,246 | | | | 30,503,447 | | | | 44,115,391 | | | | 413,203,570 | | | | 29,389,647 | | | | 275,915,737 | | |
| Fund merger | | | — | | | | — | | | | — | | | | — | | | | 196,357,315 | | | | 1,819,865,791 | | |
| Distributions reinvested | | | 138,615 | | | | 1,327,936 | | | | 3,345,645 | | | | 31,523,276 | | | | 1,457,494 | | | | 13,654,791 | | |
| Redemptions | | | (18,916,264 | ) | | | (180,795,934 | ) | | | (94,463,290 | ) | | | (892,640,568 | ) | | | (60,261,713 | ) | | | (560,266,829 | ) | |
| Net increase (decrease) | | | (15,582,403 | ) | | | (148,964,551 | ) | | | (47,002,254 | ) | | | (447,913,722 | ) | | | 166,942,743 | | | | 1,549,169,490 | | |
| Total net increase (decrease) | | | (15,623,296 | ) | | | (149,352,288 | ) | | | (75,701,133 | ) | | | (716,438,392 | ) | | | 208,821,582 | | | | 1,938,449,927 | | |
(a) For the period from April 1, 2012 to April 30, 2012. During the period, the Fund's fiscal year end was changed from March 31 to April 30.
(b) Class R shares are for the period from November 16, 2011 (commencement of operations) to March 31, 2012.
(c) Class B and Class T shares are for the period from March 7, 2011 (commencement of operations) to March 31, 2011.
(d) Class I and Class W shares are for the period from September 27, 2010 (commencement of operations) to March 31, 2011.
(e) Includes conversions of Class B shares to Class A shares, if any.
The Accompanying Notes to Financial Statements are an integral part of this statement.
24
Financial Highlights – Columbia Bond Fund
The following tables are intended to help you understand the Fund's financial performance. Certain information reflects financial results for a single share of a class held for the periods shown. Per share net investment income (loss) amounts are calculated based on average shares outstanding during the period. Total returns assume reinvestment of all dividends and distributions. Total returns do not reflect payment of sales charges, if any, and are not annualized for periods of less than one year.
| | | Year ended
April 30, | | Year ended March 31, | |
| | | 2012(a) | | 2012 | | 2011 | | 2010 | | 2009 | | 2008(b) | |
| Class A | |
| Per share data | |
| Net asset value, beginning of period | | $ | 9.50 | | | $ | 9.24 | | | $ | 9.28 | | | $ | 8.79 | | | $ | 9.09 | | | $ | 9.09 | | |
| Income from investment operations: | |
| Net investment income | | | 0.02 | | | | 0.29 | | | | 0.27 | | | | 0.31 | | | | 0.35 | | | | 0.00 | (c) | |
| Net realized and unrealized gain (loss) | | | 0.08 | | | | 0.38 | | | | 0.17 | | | | 0.59 | | | | (0.26 | ) | | | 0.00 | (c) | |
| Total from investment operations | | | 0.10 | | | | 0.67 | | | | 0.44 | | | | 0.90 | | | | 0.09 | | | | 0.00 | (c) | |
| Less distributions to shareholders from: | |
| Net investment income | | | (0.02 | ) | | | (0.29 | ) | | | (0.29 | ) | | | (0.33 | ) | | | (0.38 | ) | | | 0.00 | (c) | |
| Net realized gains | | | — | | | | (0.12 | ) | | | (0.19 | ) | | | (0.08 | ) | | | (0.01 | ) | | | — | | |
| Total distributions to shareholders | | | (0.02 | ) | | | (0.41 | ) | | | (0.48 | ) | | | (0.41 | ) | | | (0.39 | ) | | | 0.00 | (c) | |
| Proceeds from regulatory settlement | | | — | | | | — | | | | — | | | | 0.00 | (c) | | | — | | | | — | | |
| Net asset value, end of period | | $ | 9.58 | | | $ | 9.50 | | | $ | 9.24 | | | $ | 9.28 | | | $ | 8.79 | | | $ | 9.09 | | |
| Total return | | | 1.08 | % | | | 7.35 | % | | | 4.83 | % | | | 10.39 | %(d) | | | 1.04 | % | | | 0.01 | % | |
| Ratios to average net assets(e) | |
Expenses prior to fees waived or expenses reimbursed
(including interest expense) | | | 1.01 | %(f) | | | 0.99 | %(g) | | | 1.09 | % | | | 1.12 | % | | | 1.13 | %(g) | | | 1.05 | %(f) | |
Net expenses after fees waived or expenses reimbursed
(including interest expense)(h) | | | 0.80 | %(f) | | | 0.80 | %(g)(i) | | | 0.80 | %(i) | | | 0.82 | %(i) | | | 0.91 | %(g)(i) | | | 0.91 | %(f)(i) | |
Expenses prior to fees waived or expenses reimbursed
(excluding interest expense) | | | 1.01 | %(f) | | | 0.99 | % | | | 1.09 | % | | | 1.12 | % | | | 1.13 | % | | | 1.05 | %(f) | |
Net expenses after fees waived or expenses reimbursed
(excluding interest expense)(h) | | | 0.80 | %(f) | | | 0.80 | %(i) | | | 0.80 | %(i) | | | 0.82 | %(i) | | | 0.91 | %(i) | | | 0.91 | %(f)(i) | |
| Net investment income | | | 2.94 | %(f) | | | 3.07 | %(i) | | | 2.97 | %(i) | | | 3.43 | %(i) | | | 3.99 | %(i) | | | 4.16 | %(f)(i) | |
| Supplemental data | |
| Net assets, end of period (in thousands) | | $ | 82,929 | | | $ | 82,041 | | | $ | 75,770 | | | $ | 15,362 | | | $ | 5,299 | | | $ | 10 | | |
| Portfolio turnover | | | 10 | %(j) | | | 136 | %(j) | | | 178 | % | | | 256 | % | | | 209 | % | | | 49 | % | |
| Notes to Financial Highlights | |
(a) For the period from April 1, 2012 to April 30, 2012. During the period, the Fund's fiscal year end was changed from March 31 to April 30.
(b) For the period from March 31, 2008 (commencement of operations) to March 31, 2008.
(c) Rounds to less than $0.01.
(d) Total return includes a reimbursement of a loss experienced by the Fund due to a compliance violation. The reimbursement had an impact of less than 0.01% on total return.
(e) In addition to the fees and expenses which the Fund bears directly, the Fund indirectly bears a pro rata share of the fees and expenses of the acquired funds in which it invests. Such indirect expenses are not included in the reported expense ratios.
(f) Annualized.
(g) Includes interest expense which rounds to less than 0.01%.
(h) The Investment Manager and certain of its affiliates agreed to waive/reimburse certain fees and expenses, if applicable.
(i) The benefits derived from expense reductions had an impact of less than 0.01%.
(j) Includes mortgage dollar rolls. If mortgage dollar roll transactions were excluded, the portfolio turnover would not have changed.
The Accompanying Notes to Financial Statements are an integral part of this statement.
25
Financial Highlights (continued) – Columbia Bond Fund
| | | Year ended
April 30, | | Year ended March 31, | |
| | | 2012(a) | | 2012 | | 2011(b) | |
| Class B | |
| Per share data | |
| Net asset value, beginning of period | | $ | 9.50 | | | $ | 9.24 | | | $ | 9.24 | | |
| Income from investment operations: | |
| Net investment income (loss) | | | 0.02 | | | | 0.22 | | | | (0.00 | )(c) | |
| Net realized and unrealized gain | | | 0.08 | | | | 0.38 | | | | 0.01 | | |
| Total from investment operations | | | 0.10 | | | | 0.60 | | | | 0.01 | | |
| Less distributions to shareholders from: | |
| Net investment income | | | (0.02 | ) | | | (0.22 | ) | | | (0.01 | ) | |
| Net realized gains | | | — | | | | (0.12 | ) | | | — | | |
| Total distributions to shareholders | | | (0.02 | ) | | | (0.34 | ) | | | (0.01 | ) | |
| Net asset value, end of period | | $ | 9.58 | | | $ | 9.50 | | | $ | 9.24 | | |
| Total return | | | 1.02 | % | | | 6.55 | % | | | 0.15 | % | |
| Ratios to average net assets(d) | |
Expenses prior to fees waived or expenses reimbursed
(including interest expense) | | | 1.76 | %(e) | | | 1.74 | %(f) | | | 1.86 | %(e) | |
Net expenses after fees waived or expenses reimbursed
(including interest expense)(g) | | | 1.55 | %(e) | | | 1.55 | %(f)(h) | | | 1.55 | %(e)(h) | |
Expenses prior to fees waived or expenses reimbursed
(excluding interest expense) | | | 1.76 | %(e) | | | 1.74 | % | | | 1.86 | %(e) | |
Net expenses after fees waived or expenses reimbursed
(excluding interest expense)(g) | | | 1.55 | %(e) | | | 1.55 | %(h) | | | 1.55 | %(e)(h) | |
| Net investment income (loss) | | | 2.18 | %(e) | | | 2.35 | %(h) | | | (0.95 | %)(e)(h) | |
| Supplemental data | |
| Net assets, end of period (in thousands) | | $ | 2,872 | | | $ | 2,969 | | | $ | 5,347 | | |
| Portfolio turnover | | | 10 | %(i) | | | 136 | %(i) | | | 178 | % | |
| Notes to Financial Highlights | |
(a) For the period from April 1, 2012 to April 30, 2012. During the period, the Fund's fiscal year end was changed from March 31 to April 30.
(b) For the period from March 7, 2011 (commencement of operations) to March 31, 2011.
(c) Rounds to less than $0.01.
(d) In addition to the fees and expenses which the Fund bears directly, the Fund indirectly bears a pro rata share of the fees and expenses of the acquired funds in which it invests. Such indirect expenses are not included in the reported expense ratios.
(e) Annualized.
(f) Includes interest expense which rounds to less than 0.01%.
(g) The Investment Manager and certain of its affiliates agreed to waive/reimburse certain fees and expenses, if applicable.
(h) The benefits derived from expense reductions had an impact of less than 0.01%.
(i) Includes mortgage dollar rolls. If mortgage dollar roll transactions were excluded, the portfolio turnover would not have changed.
The Accompanying Notes to Financial Statements are an integral part of this statement.
26
Financial Highlights (continued) – Columbia Bond Fund
| | | Year ended
April 30, | | Year ended March 31, | |
| | | 2012(a) | | 2012 | | 2011 | | 2010 | | 2009 | | 2008(b) | |
| Class C | |
| Per share data | |
| Net asset value, beginning of period | | $ | 9.49 | | | $ | 9.24 | | | $ | 9.29 | | | $ | 8.80 | | | $ | 9.09 | | | $ | 9.09 | | |
| Income from investment operations: | |
| Net investment income | | | 0.02 | | | | 0.23 | | | | 0.21 | | | | 0.25 | | | | 0.29 | | | | 0.00 | (c) | |
| Net realized and unrealized gain (loss) | | | 0.08 | | | | 0.38 | | | | 0.15 | | | | 0.58 | | | | (0.26 | ) | | | 0.00 | (c) | |
| Total from investment operations | | | 0.10 | | | | 0.61 | | | | 0.36 | | | | 0.83 | | | | 0.03 | | | | 0.00 | (c) | |
| Less distributions to shareholders from: | |
| Net investment income | | | (0.02 | ) | | | (0.24 | ) | | | (0.22 | ) | | | (0.26 | ) | | | (0.31 | ) | | | 0.00 | (c) | |
| Net realized gains | | | — | | | | (0.12 | ) | | | (0.19 | ) | | | (0.08 | ) | | | (0.01 | ) | | | — | | |
| Total distributions to shareholders | | | (0.02 | ) | | | (0.36 | ) | | | (0.41 | ) | | | (0.34 | ) | | | (0.32 | ) | | | 0.00 | (c) | |
| Proceeds from regulatory settlement | | | — | | | | — | | | | — | | | | 0.00 | (c) | | | — | | | | — | | |
| Net asset value, end of period | | $ | 9.57 | | | $ | 9.49 | | | $ | 9.24 | | | $ | 9.29 | | | $ | 8.80 | | | $ | 9.09 | | |
| Total return | | | 1.03 | % | | | 6.72 | % | | | 3.94 | % | | | 9.56 | %(d) | | | 0.44 | % | | | 0.01 | % | |
| Ratios to average net assets(e) | |
Expenses prior to fees waived or expenses reimbursed
(including interest expense) | | | 1.75 | %(f) | | | 1.74 | %(g) | | | 1.84 | % | | | 1.87 | % | | | 1.88 | %(g) | | | 1.80 | %(f) | |
Net expenses after fees waived or expenses reimbursed
(including interest expense)(h) | | | 1.40 | %(f) | | | 1.40 | %(g)(i) | | | 1.51 | %(i) | | | 1.57 | %(i) | | | 1.66 | %(g)(i) | | | 1.66 | %(f)(i) | |
Expenses prior to fees waived or expenses reimbursed
(excluding interest expense) | | | 1.75 | %(f) | | | 1.74 | % | | | 1.84 | % | | | 1.87 | % | | | 1.88 | % | | | 1.80 | %(f) | |
Net expenses after fees waived or expenses reimbursed
(excluding interest expense)(h) | | | 1.40 | %(f) | | | 1.40 | %(i) | | | 1.51 | %(i) | | | 1.57 | %(i) | | | 1.66 | %(i) | | | 1.66 | %(f)(i) | |
| Net investment income | | | 2.35 | %(f) | | | 2.46 | %(i) | | | 2.26 | %(i) | | | 2.71 | %(i) | | | 3.32 | %(i) | | | 3.41 | %(f)(i) | |
| Supplemental data | |
| Net assets, end of period (in thousands) | | $ | 17,129 | | | $ | 16,872 | | | $ | 13,398 | | | $ | 2,226 | | | $ | 1,317 | | | $ | 10 | | |
| Portfolio turnover | | | 10 | %(j) | | | 136 | %(j) | | | 178 | % | | | 256 | % | | | 209 | % | | | 49 | % | |
| Notes to Financial Highlights | |
(a) For the period from April 1, 2012 to April 30, 2012. During the period, the Fund's fiscal year end was changed from March 31 to April 30.
(b) For the period from March 31, 2008 (commencement of operations) to March 31, 2008.
(c) Rounds to less than $0.01.
(d) Total return includes a reimbursement of a loss experienced by the Fund due to a compliance violation. The reimbursement had an impact of less than 0.01% on total return.
(e) In addition to the fees and expenses which the Fund bears directly, the Fund indirectly bears a pro rata share of the fees and expenses of the acquired funds in which it invests. Such indirect expenses are not included in the reported expense ratios.
(f) Annualized.
(g) Includes interest expense which rounds to less than 0.01%.
(h) The Investment Manager and certain of its affiliates agreed to waive/reimburse certain fees and expenses, if applicable.
(i) The benefits derived from expense reductions had an impact of less than 0.01%.
(j) Includes mortgage dollar rolls. If mortgage dollar roll transactions were excluded, the portfolio turnover would not have changed.
The Accompanying Notes to Financial Statements are an integral part of this statement.
27
Financial Highlights (continued) – Columbia Bond Fund
| | | Year ended
April 30, | | Year ended March 31, | |
| | | 2012(a) | | 2012 | | 2011(b) | |
| Class I | |
| Per share data | |
| Net asset value, beginning of period | | $ | 9.50 | | | $ | 9.25 | | | $ | 9.58 | | |
| Income from investment operations: | |
| Net investment income | | | 0.03 | | | | 0.33 | | | | 0.14 | | |
| Net realized and unrealized gain (loss) | | | 0.09 | | | | 0.36 | | | | (0.18 | ) | |
| Total from investment operations | | | 0.12 | | | | 0.69 | | | | (0.04 | ) | |
| Less distributions to shareholders from: | |
| Net investment income | | | (0.03 | ) | | | (0.32 | ) | | | (0.16 | ) | |
| Net realized gains | | | — | | | | (0.12 | ) | | | (0.13 | ) | |
| Total distributions to shareholders | | | (0.03 | ) | | | (0.44 | ) | | | (0.29 | ) | |
| Net asset value, end of period | | $ | 9.59 | | | $ | 9.50 | | | $ | 9.25 | | |
| Total return | | | 1.21 | % | | | 7.55 | % | | | (0.44 | %) | |
| Ratios to average net assets(c) | |
Expenses prior to fees waived or expenses reimbursed
(including interest expense) | | | 0.56 | %(d) | | | 0.51 | %(e) | | | 0.62 | %(d) | |
Net expenses after fees waived or expenses reimbursed
(including interest expense)(f) | | | 0.51 | %(d) | | | 0.51 | %(e)(g) | | | 0.51 | %(d)(g) | |
Expenses prior to fees waived or expenses reimbursed
(excluding interest expense) | | | 0.56 | %(d) | | | 0.51 | % | | | 0.62 | %(d) | |
Net expenses after fees waived or expenses reimbursed
(excluding interest expense)(f) | | | 0.51 | %(d) | | | 0.51 | %(g) | | | 0.51 | %(d)(g) | |
| Net investment income | | | 3.22 | %(d) | | | 3.51 | %(g) | | | 2.89 | %(d)(g) | |
| Supplemental data | |
| Net assets, end of period (in thousands) | | $ | 15,545 | | | $ | 15,931 | | | $ | 284,143 | | |
| Portfolio turnover | | | 10 | %(h) | | | 136 | %(h) | | | 178 | % | |
| Notes to Financial Highlights | |
(a) For the period from April 1, 2012 to April 30, 2012. During the period, the Fund's fiscal year end was changed from March 31 to April 30.
(b) For the period from September 27, 2010 (commencement of operations) to March 31, 2011.
(c) In addition to the fees and expenses which the Fund bears directly, the Fund indirectly bears a pro rata share of the fees and expenses of the acquired funds in which it invests. Such indirect expenses are not included in the reported expense ratios.
(d) Annualized.
(e) Includes interest expense which rounds to less than 0.01%.
(f) The Investment Manager and certain of its affiliates agreed to waive/reimburse certain fees and expenses, if applicable.
(g) The benefits derived from expense reductions had an impact of less than 0.01%.
(h) Includes mortgage dollar rolls. If mortgage dollar roll transactions were excluded, the portfolio turnover would not have changed.
The Accompanying Notes to Financial Statements are an integral part of this statement.
28
Financial Highlights (continued) – Columbia Bond Fund
| | | Year ended
April 30,
2012(a) | | Year ended
March 31,
2012(b) | |
| Class R | |
| Per share data | |
| Net asset value, beginning of period | | $ | 9.50 | | | $ | 9.51 | | |
| Income from investment operations: | |
| Net investment income | | | 0.02 | | | | 0.09 | | |
| Net realized and unrealized gain | | | 0.08 | | | | 0.07 | | |
| Total from investment operations | | | 0.10 | | | | 0.16 | | |
| Less distributions to shareholders from: | |
| Net investment income | | | (0.02 | ) | | | (0.09 | ) | |
| Net realized gains | | | — | | | | (0.08 | ) | |
| Total distributions to shareholders | | | (0.02 | ) | | | (0.17 | ) | |
| Net asset value, end of period | | $ | 9.58 | | | $ | 9.50 | | |
| Total return | | | 1.06 | % | | | 1.75 | % | |
| Ratios to average net assets(c) | |
Expenses prior to fees waived or expenses reimbursed
(including interest expense) | | | 1.26 | %(d) | | | 1.40 | %(d)(e) | |
Net expenses after fees waived or expenses reimbursed
(including interest expense)(f) | | | 1.05 | %(d) | | | 1.03 | %(d)(e) | |
Expenses prior to fees waived or expenses reimbursed
(excluding interest expense) | | | 1.26 | %(d) | | | 1.40 | %(d) | |
Net expenses after fees waived or expenses reimbursed
(excluding interest expense)(f) | | | 1.05 | %(d) | | | 1.03 | %(d) | |
| Net investment income | | | 2.69 | %(d) | | | 2.69 | %(d) | |
| Supplemental data | |
| Net assets, end of period (in thousands) | | $ | 2,553 | | | $ | 2,506 | | |
| Portfolio turnover | | | 10 | %(g) | | | 136 | %(g) | |
| Notes to Financial Highlights | |
(a) For the period from April 1, 2012 to April 30, 2012. During the period, the Fund's fiscal year end was changed from March 31 to April 30.
(b) For the period from November 16, 2011 (commencement of operations) to March 31, 2012.
(c) In addition to the fees and expenses which the Fund bears directly, the Fund indirectly bears a pro rata share of the fees and expenses of the acquired funds in which it invests. Such indirect expenses are not included in the reported expense ratios.
(d) Annualized.
(e) Includes interest expense which rounds to less than 0.01%.
(f) The Investment Manager and certain of its affiliates agreed to waive/reimburse certain fees and expenses, if applicable.
(g) Includes mortgage dollar rolls. If mortgage dollar roll transactions were excluded, the portfolio turnover would not have changed.
The Accompanying Notes to Financial Statements are an integral part of this statement.
29
Financial Highlights (continued) – Columbia Bond Fund
| | | Year ended
April 30, | | Year ended March 31, | |
| | | 2012(a) | | 2012 | | 2011(b) | |
| Class T | |
| Per share data | |
| Net asset value, beginning of period | | $ | 9.48 | | | $ | 9.23 | | | $ | 9.23 | | |
| Income from investment operations: | |
| Net investment income | | | 0.02 | | | | 0.30 | | | | (0.00 | )(c) | |
| Net realized and unrealized gain | | | 0.09 | | | | 0.37 | | | | 0.02 | | |
| Total from investment operations | | | 0.11 | | | | 0.67 | | | | 0.02 | | |
| Less distributions to shareholders from: | |
| Net investment income | | | (0.02 | ) | | | (0.30 | ) | | | (0.02 | ) | |
| Net realized gains | | | — | | | | (0.12 | ) | | | — | | |
| Total distributions to shareholders | | | (0.02 | ) | | | (0.42 | ) | | | (0.02 | ) | |
| Net asset value, end of period | | $ | 9.57 | | | $ | 9.48 | | | $ | 9.23 | | |
| Total return | | | 1.20 | % | | | 7.36 | % | | | 0.21 | % | |
| Ratios to average net assets(d) | |
Expenses prior to fees waived or expenses reimbursed
(including interest expense) | | | 0.91 | %(e) | | | 0.89 | %(f) | | | 1.01 | %(e) | |
Net expenses after fees waived or expenses reimbursed
(including interest expense)(g) | | | 0.70 | %(e) | | | 0.70 | %(f)(h) | | | 0.70 | %(e)(h) | |
Expenses prior to fees waived or expenses reimbursed
(excluding interest expense) | | | 0.91 | %(e) | | | 0.89 | % | | | 1.01 | %(e) | |
Net expenses after fees waived or expenses reimbursed
(excluding interest expense)(g) | | | 0.70 | %(e) | | | 0.70 | %(h) | | | 0.70 | %(e)(h) | |
| Net investment income | | | 3.04 | %(e) | | | 3.17 | %(h) | | | (0.07 | %)(e)(h) | |
| Supplemental data | |
| Net assets, end of period (in thousands) | | $ | 15,630 | | | $ | 15,577 | | | $ | 16,251 | | |
| Portfolio turnover | | | 10 | %(i) | | | 136 | %(i) | | | 178 | % | |
| Notes to Financial Highlights | |
(a) For the period from April 1, 2012 to April 30, 2012. During the period, the Fund's fiscal year end was changed from March 31 to April 30.
(b) For the period from March 7, 2011 (commencement of operations) to March 31, 2011.
(c) Rounds to less than $0.01.
(d) In addition to the fees and expenses which the Fund bears directly, the Fund indirectly bears a pro rata share of the fees and expenses of the acquired funds in which it invests. Such indirect expenses are not included in the reported expense ratios.
(e) Annualized.
(f) Includes interest expense which rounds to less than 0.01%.
(g) The Investment Manager and certain of its affiliates agreed to waive/reimburse certain fees and expenses, if applicable.
(h) The benefits derived from expense reductions had an impact of less than 0.01%.
(i) Includes mortgage dollar rolls. If mortgage dollar roll transactions were excluded, the portfolio turnover would not have changed.
The Accompanying Notes to Financial Statements are an integral part of this statement.
30
Financial Highlights (continued) – Columbia Bond Fund
| | | Year ended
April 30, | | Year ended March 31, | |
| | | 2012(a) | | 2012 | | 2011(b) | |
| Class W | |
| Per share data | |
| Net asset value, beginning of period | | $ | 9.50 | | | $ | 9.24 | | | $ | 9.57 | | |
| Income from investment operations: | |
| Net investment income | | | 0.02 | | | | 0.29 | | | | 0.12 | | |
| Net realized and unrealized gain (loss) | | | 0.08 | | | | 0.38 | | | | (0.18 | ) | |
| Total from investment operations | | | 0.10 | | | | 0.67 | | | | (0.06 | ) | |
| Less distributions to shareholders from: | |
| Net investment income | | | (0.02 | ) | | | (0.29 | ) | | | (0.14 | ) | |
| Net realized gains | | | — | | | | (0.12 | ) | | | (0.13 | ) | |
| Total distributions to shareholders | | | (0.02 | ) | | | (0.41 | ) | | | (0.27 | ) | |
| Net asset value, end of period | | $ | 9.58 | | | $ | 9.50 | | | $ | 9.24 | | |
| Total return | | | 1.09 | % | | | 7.38 | % | | | (0.60 | %) | |
| Ratios to average net assets(c) | |
Expenses prior to fees waived or expenses reimbursed
(including interest expense) | | | 0.90 | %(d) | | | 0.95 | %(e) | | | 1.08 | %(d) | |
Net expenses after fees waived or expenses reimbursed
(including interest expense)(f) | | | 0.75 | %(d) | | | 0.79 | %(e) | | | 0.80 | %(d)(g) | |
Expenses prior to fees waived or expenses reimbursed
(excluding interest expense) | | | 0.90 | %(d) | | | 0.95 | % | | | 1.08 | %(d) | |
Net expenses after fees waived or expenses reimbursed
(excluding interest expense)(f) | | | 0.75 | %(d) | | | 0.79 | % | | | 0.80 | %(d)(g) | |
| Net investment income | | | 3.04 | %(d) | | | 3.08 | % | | | 2.63 | %(d)(g) | |
| Supplemental data | |
| Net assets, end of period (in thousands) | | $ | 3 | | | $ | 2 | | | $ | 2 | | |
| Portfolio turnover | | | 10 | %(h) | | | 136 | %(h) | | | 178 | % | |
| Notes to Financial Highlights | |
(a) For the period from April 1, 2012 to April 30, 2012. During the period, the Fund's fiscal year end was changed from March 31 to April 30.
(b) For the period from September 27, 2010 (commencement of operations) to March 31, 2011.
(c) In addition to the fees and expenses which the Fund bears directly, the Fund indirectly bears a pro rata share of the fees and expenses of the acquired funds in which it invests. Such indirect expenses are not included in the reported expense ratios.
(d) Annualized.
(e) Includes interest expense which rounds to less than 0.01%.
(f) The Investment Manager and certain of its affiliates agreed to waive/reimburse certain fees and expenses, if applicable.
(g) The benefits derived from expense reductions had an impact of less than 0.01%.
(h) Includes mortgage dollar rolls. If mortgage dollar roll transactions were excluded, the portfolio turnover would not have changed.
The Accompanying Notes to Financial Statements are an integral part of this statement.
31
Financial Highlights (continued) – Columbia Bond Fund
| | | Year ended
April 30, | | Year ended March 31, | |
| | | 2012(a) | | 2012 | | 2011 | | 2010(b) | |
| Class Y | |
| Per share data | |
| Net asset value, beginning of period | | $ | 9.51 | | | $ | 9.25 | | | $ | 9.30 | | | $ | 8.93 | | |
| Income from investment operations | |
| Net investment income | | | 0.03 | | | | 0.32 | | | | 0.30 | | | | 0.24 | | |
| Net realized and unrealized gain | | | 0.08 | | | | 0.38 | | | | 0.16 | | | | 0.38 | | |
| Total from investment operations | | | 0.11 | | | | 0.70 | | | | 0.46 | | | | 0.62 | | |
| Less distributions to shareholders from: | |
| Net investment income | | | (0.03 | ) | | | (0.32 | ) | | | (0.32 | ) | | | (0.25 | ) | |
| Net realized gains | | | — | | | | (0.12 | ) | | | (0.19 | ) | | | — | | |
| Total distributions to shareholders | | | (0.03 | ) | | | (0.44 | ) | | | (0.51 | ) | | | (0.25 | ) | |
| Net asset value, end of period | | $ | 9.59 | | | $ | 9.51 | | | $ | 9.25 | | | $ | 9.30 | | |
| Total return | | | 1.11 | % | | | 7.66 | % | | | 5.01 | % | | | 7.00 | % | |
| Ratios to average net assets(c) | |
Expenses prior to fees waived or expenses reimbursed
(including interest expense) | | | 0.56 | %(d) | | | 0.53 | %(e) | | | 0.76 | % | | | 0.81 | %(d) | |
Net Expenses after fees waived or expenses reimbursed
(including interest expense)(f) | | | 0.51 | %(d) | | | 0.51 | %(e) | | | 0.53 | %(g) | | | 0.55 | %(d)(g) | |
Expenses prior to fees waived or expenses reimbursed
(excluding interest expense) | | | 0.56 | %(d) | | | 0.53 | % | | | 0.76 | % | | | 0.81 | %(d) | |
Net Expenses after fees waived or expenses reimbursed
(excluding interest expense)(f) | | | 0.51 | %(d) | | | 0.51 | % | | | 0.53 | %(g) | | | 0.55 | %(d)(g) | |
| Net investment income | | | 3.23 | %(d) | | | 3.38 | % | | | 3.21 | %(g) | | | 3.58 | %(d)(g) | |
| Supplemental data | |
| Net assets, end of period (in thousands) | | $ | 22,718 | | | $ | 22,474 | | | $ | 24,717 | | | $ | 14,913 | | |
| Portfolio turnover | | | 10 | %(h) | | | 136 | %(h) | | | 178 | % | | | 256 | % | |
| Notes to Financial Highlights | |
(a) For the period from April 1, 2012 to April 30, 2012. During the period, the Fund's fiscal year end was changed from March 31 to April 30.
(b) For the period from July 15, 2009 (commencement of operations) to March 31, 2010.
(c) In addition to the fees and expenses which the Fund bears directly, the Fund indirectly bears a pro rata share of the fees and expenses of the acquired funds in which it invests. Such indirect expenses are not included in the reported expense ratios.
(d) Annualized.
(e) Includes interest expense which rounds to less than 0.01%.
(f) The Investment Manager and certain of its affiliates agreed to waive/reimburse certain fees and expenses, if applicable.
(g) The benefits derived from expense reductions had an impact of less than 0.01%.
(h) Includes mortgage dollar rolls. If mortgage dollar roll transactions were excluded, the portfolio turnover would not have changed.
The Accompanying Notes to Financial Statements are an integral part of this statement.
32
Financial Highlights (continued) – Columbia Bond Fund
| | | Year ended
April 30, | | Year ended March 31, | |
| | | 2012(a) | | 2012 | | 2011 | | 2010 | | 2009 | | 2008(b)(c) | |
| Class Z | |
| Per share data | |
| Net asset value, beginning of period | | $ | 9.50 | | | $ | 9.24 | | | $ | 9.29 | | | $ | 8.80 | | | $ | 9.09 | | | $ | 8.98 | | |
| Income from investment operations: | |
| Net investment income | | | 0.03 | | | | 0.31 | | | | 0.29 | | | | 0.34 | | | | 0.41 | | | | 0.40 | | |
| Net realized and unrealized gain (loss) | | | 0.07 | | | | 0.38 | | | | 0.17 | | | | 0.58 | | | | (0.28 | ) | | | 0.10 | | |
| Total from investment operations | | | 0.10 | | | | 0.69 | | | | 0.46 | | | | 0.92 | | | | 0.13 | | | | 0.50 | | |
| Less distributions to shareholders from: | |
| Net investment income | | | (0.02 | ) | | | (0.31 | ) | | | (0.32 | ) | | | (0.35 | ) | | | (0.41 | ) | | | (0.39 | ) | |
| Net realized gains | | | — | | | | (0.12 | ) | | | (0.19 | ) | | | (0.08 | ) | | | (0.01 | ) | | | — | | |
| Total distributions to shareholders | | | (0.02 | ) | | | (0.43 | ) | | | (0.51 | ) | | | (0.43 | ) | | | (0.42 | ) | | | (0.39 | ) | |
| Proceeds from regulatory settlement | | | — | | | | — | | | | — | | | | 0.00 | (d) | | | — | | | | — | | |
| Net asset value, end of period | | $ | 9.58 | | | $ | 9.50 | | | $ | 9.24 | | | $ | 9.29 | | | $ | 8.80 | | | $ | 9.09 | | |
| Total return | | | 1.10 | % | | | 7.63 | % | | | 4.98 | % | | | 10.66 | %(e) | | | 1.49 | % | | | 5.75 | % | |
| Ratios to average net assets(f) | |
Expenses prior to fees waived or expenses reimbursed
(including interest expense) | | | 0.75 | %(g) | | | 0.73 | %(h) | | | 0.84 | % | | | 0.87 | % | | | 0.88 | %(h) | | | 1.12 | % | |
Net expenses after fees waived or expenses reimbursed
(including interest expense)(i) | | | 0.55 | %(g) | | | 0.55 | %(h)(j) | | | 0.55 | %(j) | | | 0.57 | %(j) | | | 0.66 | %(h)(j) | | | 0.90 | %(j) | |
Expenses prior to fees waived or expenses reimbursed
(excluding interest expense) | | | 0.75 | %(g) | | | 0.73 | % | | | 0.84 | % | | | 0.87 | % | | | 0.88 | % | | | 1.12 | % | |
Net expenses after fees waived or expenses reimbursed
(excluding interest expense)(i) | | | 0.55 | %(g) | | | 0.55 | %(j) | | | 0.55 | %(j) | | | 0.57 | %(j) | | | 0.66 | %(j) | | | 0.90 | %(j) | |
| Net investment income | | | 3.14 | %(g) | | | 3.33 | %(j) | | | 3.21 | %(j) | | | 3.72 | %(j) | | | 4.62 | %(j) | | | 4.45 | %(j) | |
| Supplemental data | |
| Net assets, end of period (in thousands) | | $ | 1,599,267 | | | $ | 1,733,175 | | | $ | 2,120,951 | | | $ | 581,596 | | | $ | 492,874 | | | $ | 546,781 | | |
| Portfolio turnover | | | 10 | %(k) | | | 136 | %(k) | | | 178 | % | | | 256 | % | | | 209 | % | | | 49 | % | |
| Notes to Financial Highlights | |
(a) For the period from April 1, 2012 to April 30, 2012. During the period, the Fund's fiscal year end was changed from March 31 to April 30.
(b) On March 31, 2008, Shares class of Core Bond Fund, a series of Excelsior Funds, Inc., was reorganized into the Fund's Z shares. The financial information of the Fund's Class Z shares includes the financial information of Core Bond Fund's Share class.
(c) On March 31, 2008, Core Bond Fund's Institutional Shares class were exchanged for Class Z Shares of the Fund.
(d) Rounds to less than $0.01.
(e) Total return includes a reimbursement of a loss experienced by the Fund due to a compliance violation. The reimbursement had an impact of less than 0.01% on total return.
(f) In addition to the fees and expenses which the Fund bears directly, the Fund indirectly bears a pro rata share of the fees and expenses of the acquired funds in which it invests. Such indirect expenses are not included in the reported expense ratios.
(g) Annualized.
(h) Includes interest expense which rounds to less than 0.01%.
(i) The Investment Manager and certain of its affiliates agreed to waive/reimburse certain fees and expenses, if applicable.
(j) The benefits derived from expense reductions had an impact of less than 0.01%.
(k) Includes mortgage dollar rolls. If mortgage dollar roll transactions were excluded, the portfolio turnover would not have changed.
The Accompanying Notes to Financial Statements are an integral part of this statement.
33
Notes to Financial Statements – Columbia Bond Fund
April 30, 2012
Note 1. Organization
Columbia Bond Fund (the Fund), a series of Columbia Funds Series Trust I (the Trust), is a diversified fund. The Trust is registered under the Investment Company Act of 1940, as amended (the 1940 Act), as an open-end management investment company organized as a Massachusetts business trust.
Fiscal Year End Change
During the period, the Fund changed its fiscal year end from March 31 to April 30. Accordingly, this report includes activity for the period April 1, 2012 to April 30, 2012 and the year ended March 31, 2012.
Fund Shares
The Trust may issue an unlimited number of shares (without par value). The Fund offers Class A, Class B, Class C, Class I, Class R, Class T, Class W, Class Y and Class Z shares. All share classes have identical voting, dividend and liquidation rights. Each share class has its own expense structure and sales charges, as applicable.
Class A shares are subject to a maximum front-end sales charge of 4.75% based on the initial investment amount. Class A shares purchased without an initial sales charge in accounts aggregating $1 million to $50 million at the time of purchase are subject to a contingent deferred sales charge (CDSC) if the shares are sold within 18 months of purchase, charged as follows: 1.00% CDSC if redeemed within 12 months of purchase, and 0.50% CDSC if redeemed more than 12, but less than 18, months after purchase.
Class B shares may be subject to a maximum CDSC of 5.00% based upon the holding period after purchase. Class B shares will generally convert to Class A shares eight years after purchase. The Fund no longer accepts investments by new or existing investors in the Fund's Class B shares, except in connection with the reinvestment of any dividend and/or capital gain distributions in Class B shares of the Fund and exchanges by existing Class B shareholders of certain other funds within the Columbia Family of Funds.
Class C shares are subject to a 1.00% CDSC on shares redeemed within one year of purchase.
Class I shares are not subject to sales charges and are only available to the Columbia Family of Funds.
Class R shares are not subject to sales charges and are only available to qualifying institutional investors. Class R shares commenced operations on November 16, 2011.
Class T shares are subject to a maximum front-end sales charge of 4.75% based on the investment amount. Class T shares purchased without an initial sales charge in accounts aggregating $1 million to $50 million at the time of purchase are subject to a contingent deferred sales charge (CDSC) if the shares are sold within 18 months of purchase, charged as follows: 1.00% CDSC if redeemed within 12 months of purchase, and 0.50% CDSC if redeemed more than 12, but less than 18, months after purchase. Class T shares are available only to investors who received (and who have continuously held) Class T shares in connection with the merger of certain Galaxy Funds into various Columbia Funds (formerly named Liberty funds).
Class W shares are not subject to sales charges and are only available to investors purchasing through authorized investment programs managed by investment professionals, including discretionary managed account programs.
Class Y shares are not subject to sales charges and are only available to certain categories of investors which are subject to minimum initial investment requirements.
Class Z shares are not subject to sales charges, and are only available to certain investors, as described in the Fund's prospectus.
Note 2. Summary of Significant Accounting Policies
Use of Estimates
The preparation of financial statements in accordance with U.S. generally accepted accounting principles (GAAP) requires management to make certain estimates and assumptions that affect the reported amounts of assets and liabilities, the disclosure of contingent assets and liabilities at the date of the financial statements and the reported amounts of revenue and expenses during the reporting period. Actual results could differ from those estimates.
The following is a summary of significant accounting policies consistently followed by the Fund in the preparation of its financial statements.
34
Columbia Bond Fund, April 30, 2012
Security Valuation
Debt securities generally are valued by pricing services approved by the Board of Trustees (the Board) based upon market transactions for normal, institutional-size trading units of similar securities. The services may use various pricing techniques which take into account appropriate factors such as yield, quality, coupon rate, maturity, type of issue, trading characteristics and other data, as well as broker quotes. Debt securities for which quotations are readily available may also be valued based upon an over-the-counter or exchange bid quotation.
Asset and mortgage-backed securities are generally valued by pricing services, which utilize pricing models that incorporate the securities' cash flow and loan performance data. These models also take into account available market data, including trades, market quotations, and benchmark yield curves for identical or similar securities. Factors used to identify similar securities may include, but are not limited to, issuer, collateral type, vintage, prepayment speeds, collateral performance, credit ratings, credit enhancement and expected life. Asset-backed securities for which quotations are readily available may also be valued based upon an over-the-counter or exchange bid quotation.
Short-term securities purchased within 60 days to maturity are valued at amortized cost, which approximates market value. The value of short-term securities originally purchased with maturities greater than 60 days is determined based on an amortized value to par upon reaching 60 days to maturity. Short-term securities maturing in more than 60 days from the valuation date are valued at the market price or approximate market value based on current interest rates.
Investments in other open-end investment companies, including money market funds, are valued at net asset value.
Futures and options on futures contracts are valued based upon the settlement price established each day by the board of trade or exchange on which they are traded.
Swap transactions are valued through an independent pricing service or broker, or if neither is available, through an internal model based upon observable inputs.
Investments for which market quotations are not readily available, or that have quotations which management believes are not reliable, are valued at fair value as determined in good faith under consistently applied procedures established by and under the general supervision of the Board. If a security or class of securities (such as foreign securities) is valued at fair value, such value is likely to be different from the last quoted market price for the security. The determination of fair value often requires significant judgment. To determine fair value, management may use assumptions including but not limited to future cash flows and estimated risk premiums. Multiple inputs from various sources may be used to determine value.
Derivative Instruments
The Fund invests in certain derivative instruments as detailed below to meet its investment objectives. Derivatives are instruments whose values depend on, or are derived from, in whole or in part, the value of one or more other assets, such as securities, currencies, commodities or indices. Derivative instruments may be used to maintain cash reserves while maintaining exposure to certain other assets, to offset anticipated declines in values of investments, to facilitate trading, to reduce transaction costs and to pursue higher investment returns. The Fund may also use derivative instruments to mitigate certain investment risks, such as foreign currency exchange rate risk, interest rate risk and credit risk. Derivatives may involve various risks, including the potential inability of the counterparty to fulfill its obligation under the terms of the contract, the potential for an illiquid secondary market and the potential for market movements which may expose the Fund to gains or losses in excess of the amount shown in the Statement of Assets and Liabilities.
The Fund and any counterparty are required to maintain an agreement that requires the Fund and that counterparty to monitor (on a daily basis) the net fair value of all derivatives entered into pursuant to the agreement between the Fund and such counterparty. If the net fair value of such derivatives between the Fund and that counterparty exceeds a certain threshold (as defined in the agreement), the Fund or the counterparty (as the case may be) is required to post cash and/or securities as collateral. Fair values of derivatives presented in the financial statements are not netted with the fair value of other derivatives or with any collateral amounts posted by the Fund or any counterparty.
Futures Contracts
Futures contracts represent commitments for the future purchase or sale of an asset at a specified price on a specified date. The Fund bought and sold futures contracts to manage the duration and yield curve exposure of the Fund versus the
35
Columbia Bond Fund, April 30, 2012
benchmark. Upon entering into futures contracts, the Fund bears risks which may include interest rates, exchange rates or securities prices moving unexpectedly, in which case, the Fund may not achieve the anticipated benefits of the futures contracts and may realize a loss. Additional risks include counterparty credit risk, the possibility of an illiquid market, and that a change in the value of the contract or option may not correlate with changes in the value of the underlying asset.
Upon entering into a futures contract, the Fund pledges cash or securities with the broker in an amount sufficient to meet the initial margin requirement. Subsequent payments (variation margin) are made or received by the Fund each day. The variation margin payments are equal to the daily change in the contract value and are recorded as variation margin receivable or payable and are offset in unrealized gains or losses. The Fund recognizes a realized gain or loss when the contract is closed or expires. Futures contracts involve, to varying degrees, risk of loss in excess of the variation margin disclosed in the Statement of Assets and Liabilities.
Credit Default Swap Contracts
Credit default swap contracts are agreements in which one party pays fixed periodic payments to a counterparty in consideration for a guarantee from the counterparty to make a specific payment should a specified negative credit event(s) take place. The Fund entered into credit default swap contracts to increase or decrease its credit exposure to a single issuer of debt securities. Additionally, credit default swap contracts were used to hedge the Fund's exposure on a debt security that it owns or in lieu of selling such debt security.
As the purchaser of a credit default swap contract, the Fund purchases protection by paying a periodic interest rate on the notional amount to the counterparty. The interest amount is accrued daily as a component of unrealized appreciation (depreciation) and is recorded as a realized loss upon payment. If a credit event as specified in the contract occurs, the Fund may have the option either to deliver the reference obligation to the seller in exchange for a cash payment of its par amount, or to receive a net cash settlement equal to the par amount less an agreed-upon value of the reference obligation as of the date of the credit event. The difference between the value of the obligation or cash delivered and the notional amount received will be recorded as a realized gain (loss).
As the seller of a credit default swap contract, the Fund sells protection to a buyer and will generally receive a periodic interest rate on the notional amount. The interest amount is accrued daily as a component of unrealized appreciation (depreciation) and is recorded as a realized gain upon receipt of the payment. If a credit event as specified in the contract occurs, the Fund may either be required to accept the reference obligation from the buyer in exchange for a cash payment of its notional amount, or to pay the buyer a net cash settlement equal to the notional amount less an agreed-upon value of the reference obligation as of the date of the credit event. The difference between the value of the obligation or cash received and the notional amount paid will be recorded as a realized gain (loss). The maximum potential amount of undiscounted future payments the Fund could be required to make as the seller of protection under a credit default swap contract is equal to the notional amount of the reference obligation. Notional amounts of all credit default swap contracts outstanding for which the Fund is the seller of protection, if any, are disclosed in the Credit Default Swap Contracts Outstanding schedule following the Portfolio of Investments. These potential amounts may be partially offset by any recovery values of the respective reference obligations or premiums received upon entering into the agreement.
As a protection seller, the Fund bears the risk of loss from the credit events specified in the contract. Although specified events are contract specific, credit events are generally defined as bankruptcy, failure to pay, restructuring, obligation acceleration, obligation default, or repudiation/moratorium. For credit default swap contracts on credit indices, quoted market prices and resulting market values serve as an indicator of the current status of the payment/performance risk. Increasing market values, in absolute terms when compared to the notional amount of the swap, represent a deterioration of the reference entity's credit soundness and a greater likelihood or risk of default or other credit event occurring as defined under the terms of the contract. Market values for credit default swap contracts in which the Fund is the seller of protection, if any, are disclosed in the Credit Default Swap Contracts Outstanding schedule following the Portfolio of Investments.
The notional amounts and market values of credit default swap contracts are not recorded in the financial statements. Any premium paid or received by the Fund upon entering into a credit default swap contract is recorded as an asset or
36
Columbia Bond Fund, April 30, 2012
liability, respectively, and amortized daily as a component of realized gain (loss) in the Statement of Operations. Credit default swap contracts are valued daily, and the change in value is recorded as unrealized appreciation (depreciation) until the termination of the swap, at which time a realized gain (loss) is recorded.
Credit default swap contracts can involve greater risks than if a fund had invested in the reference obligation directly since, in addition to general market risks, credit default swaps are subject to counterparty credit risk, leverage risk, hedging risk, correlation risk and liquidity risk. The Fund will enter into credit default swap transactions only with counterparties that meet certain standards of creditworthiness.
Effects of Derivative Transactions in the Financial Statements
The following tables are intended to provide additional information about the effect of derivatives on the financial statements of the Fund, including: the fair value of derivatives by risk category and the location of those fair values in the Statement of Assets and Liabilities; the impact of derivative transactions on the Fund's operations over the period including realized gains or losses and unrealized gains or losses. The derivative schedules following the Portfolio of Investments present additional information regarding derivative instruments outstanding at April 30, 2012, if any.
| Fair Values of Derivative Instruments at April 30, 2012 | |
| | | Asset derivatives | | Liability derivatives | |
| Risk Exposure Category | | Statement of Assets and
Liabilities Location | | Fair Value | | Statement of Assets and
Liabilities Location | | Fair Value | |
| Interest rate contracts | | Net assets—unrealized
appreciation on futures
contracts | | $ | 192,411 | * | | Net assets—unrealized
depreciation on futures
contracts | | $ | 2,119,338 | * | |
* Includes cumulative appreciation (depreciation) of futures contracts as reported in the Futures Contracts Outstanding table following the Portfolio of Investments. Only the current day's variation margin is reported in receivables or payables in the Statement of Assets and Liabilities.
Effect of Derivative Instruments in the Statement of Operations for the Period Ended April 30, 2012
Amount of Realized Gain (Loss) on Derivatives Recognized in Income
| Risk Exposure Category | | Futures Contracts | |
| Interest rate contracts | | $ | 178,597 | | |
Change in Unrealized Appreciation (Depreciation) on Derivatives Recognized in Income
| Risk Exposure Category | | Futures Contracts | |
| Interest rate contracts | | $ | (2,413,333 | ) | |
Volume of Derivative Instruments for the Period Ended April 30, 2012
| | | Contracts
Opened | |
| Futures Contracts | | | 685 | | |
37
Columbia Bond Fund, April 30, 2012
| Fair Values of Derivative Instruments at March 31, 2012 | |
| | | Asset derivatives | |
| Risk Exposure Category | | Statement of Assets and
Liabilities Location | | Fair Value | |
| Interest rate contracts | | Net assets—unrealized
appreciation on futures
contracts | | $ | 486,406 | * | |
* Includes cumulative appreciation (depreciation) of futures contracts as reported in the Statement of Assets and Liabilities. Only the current day's variation margin is reported in receivables or payables in the Statement of Assets and Liabilities.
Effect of Derivative Instruments in the Statement of Operations for the Year Ended March 31, 2012
Amount of Realized Gain (Loss) on Derivatives Recognized in Income
| Risk Exposure Category | | Futures Contracts | | Swap Contracts | | Total | |
| Credit contracts | | $ | — | | | $ | (542,362 | ) | | $ | (542,362 | ) | |
| Interest rate contracts | | | (21,997,291 | ) | | | — | | | $ | (21,997,291 | ) | |
| Total | | $ | (21,997,291 | ) | | $ | (542,362 | ) | | $ | (22,539,653 | ) | |
Change in Unrealized Appreciation (Depreciation) on Derivatives Recognized in Income
| Risk Exposure Category | | Futures Contracts | | Swap Contracts | | Total | |
| Credit contracts | | $ | — | | | $ | (17,772 | ) | | $ | (17,772 | ) | |
| Interest rate contracts | | | (373,991 | ) | | | — | | | $ | (373,991 | ) | |
| Total | | $ | (373,991 | ) | | $ | (17,772 | ) | | $ | (391,763 | ) | |
Volume of Derivative Instruments for the Year Ended March 31, 2012
| | | Contracts
Opened | |
| Futures Contracts | | | 4,781 | | |
| | | Aggregate
Notional
Opened | |
Credit Default Swap
Contracts—Buy Protection | | $ | 120,790,000 | | |
Credit Default Swap
Contracts—Sell Protection | | $ | 21,415,000 | | |
Repurchase Agreements
The Fund may engage in repurchase agreement transactions with institutions that management has determined are creditworthy. The Fund, through the custodian, receives delivery of the underlying securities collateralizing a repurchase agreement. Management is responsible for determining that the collateral is at least equal, at all times, to the value of the repurchase obligation including interest. A repurchase agreement transaction involves certain risks in the event of default or insolvency of the counterparty. These risks include possible delays in or restrictions on a Fund's ability to dispose of the underlying securities and a possible decline in the value of the underlying securities during the period while the Fund seeks to assert its rights.
38
Columbia Bond Fund, April 30, 2012
Delayed Delivery Securities
The Fund may trade securities on other than normal settlement terms, including securities purchased or sold on a "when-issued" basis. This may increase the risk if the other party to the transaction fails to deliver and causes the Fund to subsequently invest at less advantageous prices. The Fund designates cash or liquid securities in an amount equal to the delayed delivery commitment.
Mortgage Dollar Roll Transactions
The Fund may enter into mortgage "dollar rolls" in which the Fund sells securities for delivery in the current month and simultaneously contracts with the same counterparty to repurchase similar (same type, coupon and maturity) but not identical securities on a specified future date not exceeding 120 days. During the roll period, the Fund loses the right to receive principal and interest paid on the securities sold. However, the Fund will benefit because it receives negotiated amounts in the form of reductions of the purchase price for the future purchase plus the interest earned on the cash proceeds of the securities sold until the settlement date of the forward purchase. The Fund records the incremental difference between the forward purchase and sale of each forward roll as a realized gain or loss. Unless any realized gains exceed the income, capital appreciation, and gain or loss due to mortgage prepayments that would have been realized on the securities sold as part of the mortgage dollar roll, the use of this technique will diminish the investment performance of the Fund compared to what the performance would have been without the use of mortgage dollar rolls. All cash proceeds will be invested in instruments that are permissible investments for the Fund. The Fund identifies within its Portfolio of Investments cash or liquid securities in an amount equal to the forward purchase price.
For financial reporting and tax purposes, the Fund treats "to be announced" mortgage dollar rolls as two separate transactions, one involving the purchase of a security and a separate transaction involving a sale. This treatment may exaggerate the Fund's portfolio turnover rate. The Fund does not currently enter into mortgage dollar rolls that are accounted for as financing transactions.
Mortgage dollar rolls involve certain risks. If the broker-dealer to whom the Fund sells the securities becomes insolvent, the Fund's right to purchase or repurchase the mortgage-related securities may be restricted and the instruments which the Fund is required to repurchase may be worth less than instruments which the Fund originally held. Successful use of mortgage dollar rolls may depend upon the Investment Manager's ability to predict interest rates and mortgage prepayments. For these reasons, there is no assurance that mortgage dollar rolls can be successfully employed.
Security Transactions
Security transactions are accounted for on the trade date. Cost is determined and gains (losses) are based upon the specific identification method for both financial statement and federal income tax purposes.
Income Recognition
Interest income is recorded on the accrual basis. Market premium and discount are amortized and accreted, respectively, on all debt securities, unless otherwise noted. Original issue discount is accreted to interest income over the life of the security with a corresponding increase in the cost basis, if any. For convertible securities, premiums attributable to the conversion feature are not amortized.
Expenses
General expenses of the Trust are allocated to the Fund and other funds of the Trust based upon relative net assets or other expense allocation methodologies determined by the nature of the expense. Expenses directly attributable to the Fund are charged to the Fund. Expenses directly attributable to a specific class of shares are charged to that share class.
Determination of Class Net Asset Value
All income, expenses (other than class-specific expenses, which are charged to that share class, as shown in the Statement of Operations) and realized and unrealized gains (losses) are allocated to each class of the Fund on a daily basis for purposes of determining the net asset value of each class. Income and expenses are allocated to each class based on the settled shares
39
Columbia Bond Fund, April 30, 2012
method, while realized and unrealized gains (losses) are allocated based on the relative net assets of each class.
Federal Income Tax Status
The Fund intends to qualify each year as a regulated investment company under Subchapter M of the Internal Revenue Code, as amended, and will distribute substantially all of its tax exempt or taxable income (including net short-term capital gains), if any, for its tax year, and as such will not be subject to federal income taxes. In addition, the Fund intends to distribute in each calendar year substantially all of its net investment income, capital gains and certain other amounts, if any, such that the Fund should not be subject to federal excise tax. Therefore, no federal income or excise tax provision is recorded.
Distributions to Shareholders
Distributions from net investment income are declared daily and paid monthly. Net realized capital gains, if any, are distributed at least annually. Income distributions and capital gain distributions are determined in accordance with federal income tax regulations which may differ from GAAP.
Guarantees and Indemnifications
Under the Trust's organizational documents and, in some cases, by contract, its officers and trustees are indemnified against certain liabilities arising out of the performance of their duties to the Trust or its funds. In addition, certain of the Fund's contracts with its service providers contain general indemnification clauses. The Fund's maximum exposure under these arrangements is unknown since the amount of any future claims that may be made against the Fund cannot be determined, and the Fund has no historical basis for predicting the likelihood of any such claims.
Note 3. Fees and Compensation Paid to Affiliates
Investment Management Fees
Under an Investment Management Services Agreement, Columbia Management Investment Advisers, LLC (the Investment Manager), a wholly-owned subsidiary of Ameriprise Financial, Inc. (Ameriprise Financial), determines which securities will be purchased, held or sold. The management fee is an annual fee that is equal to a percentage of the Fund's average daily net assets that declines from 0.43% to 0.30% as the Fund's net assets increase. For the period April 1, 2012 to April 30, 2012, the annualized effective management fee rate was 0.43% of the Fund's average daily net assets. For the year ended March 31, 2012, the effective management fee rate was 0.42% of the Fund's average daily net assets.
Administration Fees
Under an Administrative Services Agreement, the Investment Manager serves as the Fund Administrator. The Fund pays the Fund Administrator an annual fee for administration and accounting services equal to a percentage of the Fund's average daily net assets that declines from 0.07% to 0.04% as the Fund's net assets increase. For the period April 1, 2012 to April 30, 2012 and the year ended March 31, 2012, the annualized effective administration fee rate was 0.06% of the Fund's average daily net assets.
Pricing and Bookkeeping Fees
Prior to June 27, 2011, the Fund had entered into a Financial Reporting Services Agreement (the Financial Reporting Services Agreement) with State Street Bank and Trust Company (State Street) and the Investment Manager pursuant to which State Street provided financial reporting services to the Fund. The Fund also entered into an Accounting Services Agreement (collectively with the Financial Reporting Services Agreement, the State Street Agreements) with State Street and the Investment Manager pursuant to which State Street provided accounting services to the Fund. Under the State Street Agreements, the Fund paid State Street an annual fee of $38,000 paid monthly plus an additional monthly fee based on an annualized percentage rate of average daily net assets of the Fund for the month. The aggregate fee did not exceed $140,000 per year (exclusive of out-of-pocket expenses and charges). The Fund also reimbursed State Street for certain out-of-pocket expenses and charges. Effective June 27, 2011, these services are provided under the Administrative Services Agreement discussed above.
40
Columbia Bond Fund, April 30, 2012
Compensation of Board Members
Board members are compensated for their services to the Fund as disclosed in the Statement of Operations. The Trust's eligible Trustees may participate in a Deferred Compensation Plan (the Plan) which may be terminated at any time. Obligation of the Plan will be paid solely out of the Fund's assets.
Compensation of Chief Compliance Officer
The Board has appointed a Chief Compliance Officer to the Fund in accordance with federal securities regulations. The Fund, along with other affiliated funds, pays its pro-rata share of the expenses associated with the Chief Compliance Officer. The Fund's expenses for the Chief Compliance Officer will not exceed $15,000 per year.
Transfer Agent Fees
Under a Transfer and Dividend Disbursing Agent Agreement, Columbia Management Investment Services Corp. (the Transfer Agent), an affiliate of the Investment Manager and a wholly-owned subsidiary of Ameriprise Financial, is responsible for providing transfer agency services to the Fund. The Transfer Agent has contracted with Boston Financial Data Services (BFDS) to serve as sub-transfer agent.
The Transfer Agent receives monthly account-based service fees based on the number of open accounts and is reimbursed by the Fund for the fees and expenses the Transfer Agent pays to financial intermediaries that maintain omnibus accounts with the Fund that is a percentage of the average aggregate value of the Fund's shares maintained in each such omnibus account (other than omnibus accounts for which American Enterprise Investment Services Inc. is the broker of record or accounts where the beneficial shareholder is a customer of Ameriprise Financial Services, Inc., which are paid a per account fee). The Transfer Agent pays the fees of BFDS for services as sub-transfer agent and is not entitled to reimbursement for such fees from the Fund (with the exception of out-of-pocket fees).
The Transfer Agent also receives compensation from fees for various shareholder services and reimbursements for certain out-of-pocket expenses. Class I shares do not pay transfer agent fees.
For the period April 1, 2012 to April 30, 2012 and the year ended March 31, 2012, the Fund's annualized effective transfer agent fee rates as a percentage of average daily net assets of each class were as follows:
| | | Period ended
April 30,
2012 | | Year ended
March 31,
2012 | |
| Class A | | | 0.19 | % | | | 0.21 | % | |
| Class B | | | 0.19 | | | | 0.21 | | |
| Class C | | | 0.19 | | | | 0.20 | | |
| Class R | | | 0.19 | | | | 0.32 | | |
| Class T | | | 0.19 | | | | 0.21 | | |
| Class W | | | 0.15 | | | | 0.22 | | |
| Class Y | | | 0.00 | | | | 0.00 | | |
| Class Z | | | 0.19 | | | | 0.21 | | |
An annual minimum account balance fee of $20 may apply to certain accounts with a value below the Fund's initial minimum investment requirements to reduce the impact of small accounts on transfer agent fees. These minimum account balance fees are recorded as part of expense reductions in the Statement of Operations. For the period April 1, 2012 to April 30, 2012, no minimum account balance fees were charged to accounts. For the year ended March 31, 2012, these minimum account balance fees reduced total expenses by $3,125.
Distribution and Service Fees
The Fund has an agreement with Columbia Management Investment Distributors, Inc. (the Distributor), an affiliate of the Investment Manager and a wholly-owned subsidiary of Ameriprise Financial, for distribution and shareholder services. Pursuant to Rule 12b-1 under the 1940 Act, the Board has approved, and the Fund has adopted, distribution and shareholder service plans (the Plans) which set the distribution and service fees for the Fund. These fees are calculated daily and are intended to compensate the Distributor and/or eligible selling and/or servicing agents for selling shares of the Fund and providing services to investors.
The Plans require the payment of a monthly service fee to the Distributor at the maximum annual rate of 0.25% of the average daily net assets attributable to Class A, Class B,
41
Columbia Bond Fund, April 30, 2012
Class C and Class W shares of the Fund. The Plans also require the payment of a monthly distribution fee to the Distributor at the maximum annual rates of 0.75%, 0.75%, 0.50% and 0.25% of the average daily net assets attributable to Class B, Class C, Class R and Class W shares, respectively.
The Distributor has voluntarily agreed to waive a portion of the distribution fee for Class C shares so that the combined distribution and service fee does not exceed 0.85% annually of the average daily net assets attributable to Class C shares. This arrangement may be modified or terminated by the Distributor at any time.
The Fund may pay a distribution fee of up to 0.25% of the Fund's average daily net assets attributable to Class W shares and a service fee of up to 0.25% of the Fund's average daily net assets attributable to Class W shares, provided, however, that the aggregate fee shall not exceed 0.25% of the Fund's average daily net assets attributable to Class W shares.
Shareholder Services Fees
The Fund has adopted a shareholder services plan that permits it to pay for certain services provided to Class T shareholders by their selling and/or servicing agents. The Fund may pay shareholder servicing fees up to an aggregate annual rate of 0.40% of the Fund's average daily net assets attributable to Class T shares (comprised of up to 0.20% for shareholder liaison services and up to 0.20% for administrative support services). These fees are currently limited to an aggregate annual rate of not more than 0.15% of the Fund's average daily net assets attributable to Class T shares. In addition, the shareholder servicing fee shall be waived by the selling and/or servicing agents to the extent necessary to prevent net investment income from falling below 0.00% on a daily basis. For the period April 1, 2012 to April 30, 2012 and the year ended March 31, 2012, the annualized effective shareholder services fee rate was 0.15% of the Fund's average daily net assets.
Sales charges, including front-end charges and CDSCs, received by the Distributor for distributing Fund shares were $7,388 for Class A, $466 for Class B, and $279 for Class T shares for the period April 1, 2012 to April 30, 2012, and $60,977 for Class A, $3,874 for Class B, $699 for Class C and $97 for Class T for the year ended March 31, 2012.
Expenses Waived/Reimbursed by the Investment Manager and its Affiliates
The Investment Manager and certain of its affiliates have contractually agreed to waive fees and/or reimburse expenses (excluding certain fees and expenses described below), through July 31, 2012, unless sooner terminated at the sole discretion of the Board, so that the Fund's net operating expenses, after giving effect to fees waived/expenses reimbursed and any balance credits and/or overdraft charges from the Fund's custodian, do not exceed the following annual rates as a percentage of the class' average daily net assets:
| Class A | | | 0.80 | % | |
| Class B | | | 1.55 | | |
| Class C | | | 1.55 | | |
| Class I | | | 0.51 | | |
| Class R | | | 1.05 | | |
| Class T | | | 0.70 | | |
| Class W | | | 0.80 | | |
| Class Y | | | 0.55 | | |
| Class Z | | | 0.55 | | |
Under the agreement, the following fees and expenses are excluded from the waiver/reimbursement commitment, and therefore will be paid by the Fund, if applicable: taxes (including foreign transaction taxes), expenses associated with investments in affiliated and non-affiliated pooled investment vehicles (including mutual funds and exchange traded funds), transaction costs and brokerage commissions, costs related to any securities lending program, dividend expenses associated with securities sold short, inverse floater program fees and expenses, transaction charges and interest on borrowed money, interest, extraordinary expenses and any other expenses the exclusion of which is specifically approved by the Board. This agreement may be modified or amended only with approval from all parties. Class C distribution fees waived by the Distributor, as discussed above, are in addition to the waiver/reimbursement commitment under the agreement.
42
Columbia Bond Fund, April 30, 2012
Note 4. Federal Tax Information
The timing and character of income and capital gain distributions are determined in accordance with income tax regulations, which may differ from GAAP because of temporary or permanent book to tax differences.
For the period April 1, 2012 to April 30, 2012, these differences are primarily due to differing treatment for deferral/reversal of wash sales, deferred trustees compensation, distributions, recognition of market discount, paydown reclassifications, recognition of unrealized appreciation (depreciation) for certain derivative investments, and tax straddles. For the year ended March 31, 2012, these differences are primarily due to differing treatment for deferral/reversal of wash sales, defaulted bonds, deferred trustees compensation, distributions, recognition of market discount, paydown reclassifications, recognition of unrealized appreciation (depreciation) for certain derivative investments, and tax straddles. To the extent these differences are permanent, reclassifications are made among the components of the Fund's net assets in the Statement of Assets and Liabilities. Temporary differences do not require reclassifications. In the Statement of Assets and Liabilities the following reclassifications were made:
| | | Period ended
April 30,
2012 | | Year ended
March 31,
2012 | |
Undistributed
net investment income | | $ | (61,624 | ) | | $ | (3,587,628 | ) | |
Accumulated net realized
gain | | | 61,624 | | | | 768,816 | | |
| Paid-in capital | | | — | | | | 2,818,812 | | |
Net investment income and net realized gains (losses), as disclosed in the Statement of Operations, and net assets were not affected by this reclassification.
The tax character of distributions paid during the periods indicated was as follows:
| | | Period ended
April 30,
2012 | | Year ended
March 31,
2012 | | Year ended
March 31,
2011 | |
| Ordinary income | | $ | 4,766,712 | | | $ | 79,190,890 | | | $ | 39,613,973 | | |
Long-term
capital gains | | | — | | | | 19,031,835 | | | | 1,833,910 | | |
Short-term capital gain distributions, if any, are considered ordinary income distributions for tax purposes.
At April 30, 2012 and March 31, 2012, the components of distributable earnings on a tax basis were as follows:
| | | April 30,
2012 | | March 31,
2012 | |
Undistributed ordinary
income | | $ | 6,123,043 | | | $ | 6,399,350 | | |
Undistributed accumulated
long-term gain | | | 11,240,058 | | | | 7,933,980 | | |
| Unrealized appreciation | | | 106,382,001 | | | | 93,341,854 | | |
At April 30, 2012 and March 31, 2012, the cost of investments for federal income tax purposes, and the aggregate unrealized appreciation and depreciation based on that cost was as follows:
| | | April 30,
2012 | | March 31,
2012 | |
Aggregate unrealized
appreciation | | $ | 112,632,617 | | | $ | 100,694,853 | | |
Aggregate unrealized
depreciation | | | (6,250,616 | ) | | | (7,352,999 | ) | |
Net unrealized
appreciation | | $ | 106,382,001 | | | $ | 93,341,854 | | |
Cost of investments
for tax purposes | | $ | 1,746,441,915 | | | $ | 1,928,528,320 | | |
43
Columbia Bond Fund, April 30, 2012
On December 22, 2010, the Regulated Investment Company Modernization Act of 2010 (the Act) was enacted, which changed various technical rules governing the tax treatment of regulated investment companies. The changes are generally effective for taxable years beginning after the date of enactment. Under the Act, the Fund will be permitted to carry forward capital losses incurred in taxable years beginning after the date of enactment for an unlimited period. However, any losses incurred during those future taxable years will be required to be utilized prior to the losses incurred in pre-enactment taxable years, which carry an expiration date. As a result of this ordering rule, pre-enactment capital loss carryforwards may be more likely to expire unused.
For the year ended March 31, 2012, $3,196,862 of capital loss carryforward was utilized.
Management of the Fund has concluded that there are no significant uncertain tax positions that would require recognition in the financial statements. However, management's conclusion may be subject to review and adjustment at a later date based on factors including, but not limited to, new tax laws, regulations, and administrative interpretations (including relevant court decisions). Generally, the Fund's federal tax returns for the prior three fiscal years remain subject to examination by the Internal Revenue Service.
Note 5. Portfolio Information
For the period April 1, 2012 to April 30, 2012, the cost of purchases and proceeds from sales of securities, excluding short-term obligations, aggregated to $190,465,483 and $352,140,838, respectively, of which $188,705,504 and $270,445,606, respectively, were U.S. government securities.
For the year ended March 31, 2012, the cost of purchases and proceeds from sales of securities, excluding short-term obligations, aggregated to $2,865,784,130 and $3,582,037,234, respectively, of which $2,380,413,571 and $2,532,202,034, respectively, were U.S. government securities.
Note 6. Lending of Portfolio Securities
Effective June 27, 2011, the Fund has entered into a Master Securities Lending Agreement (the Agreement) with JPMorgan Chase Bank, N.A. (JPMorgan). The Agreement, which replaces the previous securities lending arrangement with State Street, authorizes JPMorgan as lending agent to lend securities to authorized borrowers in order to generate additional income on behalf of the Fund. Pursuant to the Agreement, the securities loaned are secured by cash or U.S. government securities equal to at least 100% of the market value of the loaned securities. Any additional collateral required to maintain those levels due to market fluctuations of the loaned securities is requested to be delivered the following business day. Cash collateral received is invested by the lending agent on behalf of the Fund into authorized investments pursuant to the Agreement. The investments made with the cash collateral are listed in the Portfolio of Investments. The values of such investments and any uninvested cash collateral are disclosed in the Statement of Assets and Liabilities along with the related obligation to return the collateral upon the return of the securities loaned.
At April 30, 2012, securities valued at $76,950,738 were on loan, secured by U.S. government securities valued at $56,107,186 and by cash collateral of $22,266,213 (which does not reflect calls for collateral made to borrowers by JPMorgan at period end) that is partially or fully invested in short-term securities or other cash equivalents.
At March 31, 2012, securities valued at $104,938,682 were on loan, secured by U.S. government securities valued at $61,422,337 and by cash collateral of $45,604,635 (which does not reflect calls for collateral made to borrowers by JPMorgan at period end) that is partially or fully invested in short-term securities or other cash equivalents.
Risks of delay in recovery of securities or even loss of rights in the securities may occur should the borrower of the securities fail financially. Risks may also arise to the extent that the value of the securities loaned increases above the value of the collateral received. JPMorgan will indemnify the Fund from losses resulting from a borrower's failure to return a loaned security when due. Such indemnification does not extend to losses associated with declines in the value of cash collateral investments. The Investment Manager is not responsible for any losses incurred by the Fund in connection with the securities lending program. Loans are subject to termination by the Fund or the borrower at any time, and are, therefore, not considered to be illiquid investments.
Pursuant to the Agreement, the Fund receives income for lending its securities either in the form of fees or by earning
44
Columbia Bond Fund, April 30, 2012
interest on invested cash collateral, net of negotiated rebates paid to borrowers and fees paid to the lending agent for services provided and any other securities lending expenses. Net income earned from securities lending for the period ended April 30, 2012 and the year ended March 31, 2012 is disclosed in the Statement of Operations. The Fund continues to earn and accrue interest and dividends on the securities loaned.
Prior to June 27, 2011, the Fund participated in a securities lending arrangement with State Street. Each security on loan was collateralized in an amount at least equal to the market value of the securities loaned plus accrued income from the investment of collateral. The income generated by the investment of the collateral, net of any fees remitted to State Street as the lending agent and borrower rebates, was paid to the Fund.
Note 7. Custody Credits
Prior to June 27, 2011, the Fund had an agreement with its custodian bank under which custody fees may have been reduced by balance credits. These credits are recorded as part of expense reductions on the Statement of Operations. The Fund could have invested a portion of the assets utilized in connection with the expense offset arrangement in an income-producing asset if they had not entered into such an agreement. Subsequent to this date, the Fund may invest its daily balance in an affiliated money market fund as detailed below. For the period April 1, 2011 through June 27, 2011, there were no custody credits.
Note 8. Affiliated Money Market Fund
Effective June 27, 2011, the Fund may invest its daily cash balances in Columbia Short-Term Cash Fund, an affiliated money market fund established for the exclusive use by the Fund and other affiliated funds. The income earned by the Fund from such investments is included as "Dividends from affiliates" in the Statement of Operations. As an investing fund, the Fund indirectly bears its proportionate share of the expenses of Columbia Short-Term Cash Fund.
Note 9. Shareholder Concentration
At April 30, 2012 one unaffiliated shareholder account owned 68.5% of the outstanding shares of the Fund and at March 31, 2012, two unaffiliated shareholder accounts owned 78.1% of the outstanding shares of the Fund. The Fund has no knowledge about whether any portion of those shares was owned beneficially by such accounts. Subscription and redemption activity by concentrated accounts may have a significant effect on the operations of the Fund.
Note 10. Line of Credit
The Fund has entered into a revolving credit facility with a syndicate of banks led by JPMorgan, whereby the Fund may borrow for the temporary funding of shareholder redemptions or for other temporary or emergency purposes. The credit facility became effective on June 27, 2011, replacing a prior credit facility. The credit facility agreement, as amended, which is a collective agreement between the Fund and certain other funds managed by the Investment Manager, severally and not jointly, permits collective borrowings up to $500 million. Pursuant to a December 13, 2011 amendment to the credit facility agreement, interest is charged to each participating fund based on its borrowings at a rate equal to the higher of (i) the overnight federal funds rate plus 1.00% or (i) the one-month LIBOR rate plus 1.00%. Each borrowing under the credit facility matures no later than 60 days after the date of borrowing. The Fund also pays a commitment fee equal to its pro rata share of the amount of the credit facility at a rate of 0.08% per annum. For the period June 27, 2011 through December 12, 2011, interest was charged to each participating fund based on its borrowings at a rate equal to the sum of the federal funds rate plus (i) 1.25% per annum plus (ii) if one-month LIBOR exceeds the federal funds rate, the amount of such excess. The Fund also paid a commitment fee equal to its pro rata share of the amount of the credit facility at a rate of 0.10% per annum.
For the period May 16, 2011 through June 26, 2011, the Fund and certain other funds managed by the Investment Manager participated in a $150 million committed, unsecured revolving credit facility provided by State Street. Prior to May 16, 2011, the collective borrowing amount of the credit facility was $225 million. Interest was charged to each fund based on its borrowings at a rate equal to the greater of the (i) federal funds rate plus 1.25% per annum or (ii) the overnight LIBOR rate plus 1.25% per annum. The Fund also paid a commitment fee equal to its pro rata share of the amount of the credit facility at a rate of 0.125% per annum.
The Fund had no borrowings during the period ended Apriil 30, 2012.
45
Columbia Bond Fund, April 30, 2012
For the year ended March 31, 2012, the average daily loan balance outstanding on days when borrowing existed was $1,300,000 at a weighted average interest rate of 1.39%.
Note 11. Fund Merger
At the close of business on March 11, 2011, the Fund acquired the assets and assumed the identified liabilities of Columbia Core Bond Fund and Columbia Short-Intermediate Bond Fund, each a Series of the Trust. The reorganization was completed after shareholders approved the plan on February 15, 2011. The purpose of the transaction was to combine funds managed by the Investment Manager with comparable investment objectives and strategies.
The aggregate net assets of the Fund immediately before the acquisition were $737,515,241 and the combined net assets immediately after the acquisition was $2,654,074,590. The merger was accomplished by a tax-free exchange of 146,676,981 shares and 41,410,121 shares of Columbia Core Bond Fund and Columbia Short-Intermediate Bond Fund valued at $1,609,982,935 and $306,576,914, respectively.
In exchange for Columbia Core Bond Fund and Columbia Short- Intermediate Bond Fund shares and net assets, the Fund issued the following number of shares:
| | | Shares | |
| Class A | | | 6,825,239 | | |
| Class B | | | 605,596 | | |
| Class C | | | 1,214,993 | | |
| Class T | | | 1,776,589 | | |
| Class Z | | | 196,357,315 | | |
For financial reporting purposes, net assets received and shares issued by the Fund were recorded at fair value; however, Columbia Core Bond Fund and Columbia Short-Intermediate Bond Fund's cost of investments was carried forward.
The financial statements reflect the operations of the Fund for the period prior to the merger and the combined fund for the period subsequent to the merger. Because the combined investment portfolios have been managed as a single integrated portfolio since the merger was completed, it is not practicable to separate the amounts of revenue and earnings of Columbia Core Bond Fund and Columbia Short-Intermediate Bond Fund that have been included in the combined Fund's Statement of Operations since the merger was completed.
Assuming the merger had been completed on April 1, 2010, the Fund's pro-forma net investment income (loss), net gain (loss) on investments, net change in unrealized appreciation (depreciation) and net increase in net assets from operations for the year ended March 31, 2011 would have been approximately $92.6 million, $55.0 million, ($21.8 million) and $125.8 million, respectively.
Note 12. Significant Risks
Asset-Backed Securities Risk
The value of asset-backed securities may be affected by, among other factors, changes in interest rates, the market's assessment of the quality of underlying assets, the creditworthiness of the servicer for the underlying assets, factors concerning the interests in and structure of the issuer or the originator of the underlying assets, or the creditworthiness or rating of the entities that provide any supporting letters of credit, surety bonds, derivative instruments, or other credit enhancement. The value of asset-backed securities also will be affected by the exhaustion, termination or expiration of any credit enhancement. Most asset-backed securities are subject to prepayment risk, which is the possibility that the underlying debt may be refinanced or prepaid prior to maturity during periods of declining or low interest rates, causing the Fund to have to reinvest the money received in securities that have lower yields. In addition, the impact of prepayments on the value of asset-backed securities may be difficult to predict and may result in greater volatility.
Mortgage-Backed Securities Risk
The value of mortgage-backed securities may be affected by, among other things, changes in interest rates, factors concerning the interests in and structure of the issuer or the originator of the mortgages, the creditworthiness of the entities that provide any supporting letters of credit, surety bonds or other credit enhancements or the quality of underlying assets or the market's assessment thereof. Mortgage-backed securities are subject to prepayment risk, which is the possibility that the underlying mortgage may be refinanced or prepaid prior to maturity during periods of declining or low interest rates, causing the Fund to have to
46
Columbia Bond Fund, April 30, 2012
reinvest the money received in securities that have lower yields. In addition, the impact of prepayments on the value of mortgage-backed securities may be difficult to predict and may result in greater volatility.
Note 13. Subsequent Events
Management has evaluated the events and transactions that have occurred through the date the financial statements were issued and noted no items requiring adjustment of the financial statements or additional disclosure.
Note 14. Information Regarding Pending and Settled Legal Proceedings
In December 2005, without admitting or denying the allegations, American Express Financial Corporation (AEFC, which is now known as Ameriprise Financial, Inc. (Ameriprise Financial)) entered into settlement agreements with the Securities and Exchange Commission (SEC) and Minnesota Department of Commerce (MDOC) related to market timing activities. As a result, AEFC was censured and ordered to cease and desist from committing or causing any violations of certain provisions of the Investment Advisers Act of 1940, the Investment Company Act of 1940, and various Minnesota laws. AEFC agreed to pay disgorgement of $10 million and civil money penalties of $7 million. AEFC also agreed to retain an independent distribution consultant to assist in developing a plan for distribution of all disgorgement and civil penalties ordered by the SEC in accordance with various undertakings detailed at www.sec.gov/litigation/admin/ia-2451.pdf. Ameriprise Financial and its affiliates have cooperated with the SEC and the MDOC in these legal proceedings, and have made regular reports to the funds' Boards of Trustees.
Ameriprise Financial and certain of its affiliates have historically been involved in a number of legal, arbitration and regulatory proceedings, including routine litigation, class actions, and governmental actions, concerning matters arising in connection with the conduct of their business activities. Ameriprise Financial believes that the Funds are not currently the subject of, and that neither Ameriprise Financial nor any of its affiliates are the subject of, any pending legal, arbitration or regulatory proceedings that are likely to have a material adverse effect on the Funds or the ability of Ameriprise Financial or its affiliates to perform under their contracts with the Funds. Ameriprise Financial is required to make 10-Q, 10-K and, as necessary, 8-K filings with the Securities and Exchange Commission on legal and regulatory matters that relate to Ameriprise Financial and its affiliates. Copies of these filings may be obtained by accessing the SEC website at www.sec.gov.
There can be no assurance that these matters, or the adverse publicity associated with them, will not result in increased fund redemptions, reduced sale of fund shares or other adverse consequences to the Funds. Further, although we believe proceedings are not likely to have a material adverse effect on the Funds or the ability of Ameriprise Financial or its affiliates to perform under their contracts with the Funds, these proceedings are subject to uncertainties and, as such, we are unable to estimate the possible loss or range of loss that may result. An adverse outcome in one or more of these proceedings could result in adverse judgments, settlements, fines, penalties or other relief that could have a material adverse effect on the consolidated financial condition or results of operations of Ameriprise Financial.
47
Report of Independent Registered Public Accounting Firm
To the Trustees of Columbia Funds Series Trust I and the Shareholders of Columbia Bond Fund
In our opinion, the accompanying statement of assets and liabilities, including the portfolio of investments, and the related statements of operations and of changes in net assets and the financial highlights present fairly, in all material respects, the financial position of Columbia Bond Fund (the "Fund") (a series of Columbia Funds Series Trust I) at April 30, 2012 and at March 31, 2012, the results of its operations, the changes in its net assets and the financial highlights for each of the periods indicated, in conformity with accounting principles generally accepted in the United States of America. These financial statements and financial highlights (hereafter referred to as "financial statements") are the responsibility of the Fund's management. Our responsibility is to express an opinion on these financial statements based on our audits. We conducted our audits of these financial statements in accordance with the standards of the Public Company Accounting Oversight Board (United States). Those standards require that we plan and perform the audit to obtain reasonable assurance about whether the financial statements are free of material misstatement. An audit includes examining, on a test basis, evidence supporting the amounts and disclosures in the financial statements, assessing the accounting principles used and significant estimates made by management, and evaluating the overall financial statement presentation. We believe that our audits, which included confirmation of securities at April 30, 2012 and at March 31, 2012 by correspondence with the custodian, transfer agent and brokers, provide a reasonable basis for our opinion.
PricewaterhouseCoopers LLP
Minneapolis, Minnesota
June 8, 2012
48
Federal Income Tax Information (Unaudited) – Columbia Bond Fund
The Fund hereby designates as a capital gain dividend with respect to the period ended April 30, 2012 and the fiscal year ended March 31, 2012, $3,471,382 and $19,036,256, respectively, or, if subsequently determined to be different, the net capital gain of such year.
The Fund will notify shareholders in January 2013 of amounts for use in preparing 2012 income tax returns.
49
Fund Governance
The Trustees serve terms of indefinite duration. The names, addresses and birth years of the Trustees and Officers of the Funds in Columbia Funds Series Trust I, the year each was first elected or appointed to office, their principal business occupations during at least the last five years, the number of Funds overseen by each Trustee and other directorships they hold are shown below. Each officer listed below serves as an officer of each Fund in Columbia Funds Series Trust I.
Independent Trustees
Name, Address and Year of Birth,
Position with Funds, Year First
Elected or Appointed to Office | | Principal Occupation(s) During Past Five Years, Number of Funds in Columbia
Funds Complex Overseen by Trustee, Other Directorships Held
| |
| Rodman L. Drake (Born 1943) | |
|
c/o Columbia Management Investment Advisers, LLC
225 Franklin Street
Boston, MA 02110
Trustee (since 1994) and
Chairman of the Board (since 2009) | | Independent consultant since 2010; Co-Founder of Baringo Capital LLC (private equity) from 1997 to 2008; CEO of Crystal River Capital, Inc. (real estate investment trust) from 2003 to 2010; Oversees 51; Jackson Hewitt Tax Service Inc. (tax preparation services from 2004 to 2011); Celgene Corporation (global biotechnology company); Student Loan Corporation (student loan provider from 2008 to 2010); Celgene Corporation (global biotechnology company); The Helios Funds and Brookfield Funds (closed-end funds); Crystal River Capital, Inc. from 2005 to 2010; Parson Brinckerhoff from 1995 to 2008; and Apex Silver Mines Ltd. from 2007 to 2009 | |
|
| Douglas A. Hacker (Born 1955) | |
|
c/o Columbia Management Investment Advisers, LLC
225 Franklin Street
Boston, MA 02110
Trustee (since 1996) | | Independent business executive since May 2006; Executive Vice President—Strategy of United Airlines from December 2002 to May 2006; President of UAL Loyalty Services (airline marketing company) from September 2001 to December 2002; Executive Vice President and Chief Financial Officer of United Airlines from July 1999 to September 2001. Oversees 51; Nash Finch Company (food distributor); Aircastle Limited (aircraft leasing); and SeaCube Container Leasing Ltd (container leasing) | |
|
| Janet Langford Kelly (Born 1957) | |
|
c/o Columbia Management Investment Advisers, LLC
225 Franklin Street
Boston, MA 02110
Trustee (since 1996) | | Senior Vice President, General Counsel and Corporate Secretary, ConocoPhillips (integrated energy company) since September 2007; Deputy General Counsel—Corporate Legal Services, ConocoPhillips from August 2006 to August 2007; Partner, Zelle, Hofmann, Voelbel, Mason & Gette LLP (law firm) from March 2005 to July 2006; Adjunct Professor of Law, Northwestern University, from September 2004 to June 2006; Director, UAL Corporation (airline) from February 2006 to July 2006; Chief Administrative Officer and Senior Vice President, Kmart Holding Corporation (consumer goods) from September 2003 to March 2004. Oversees 51; None | |
|
| Nancy T. Lukitsh (Born 1956) | |
|
c/o Columbia Management Investment Advisers, LLC
225 Franklin Street
Boston, MA 02110
Trustee (since 2011) | | Senior Vice President, Partner and Director of Marketing, Wellington Management Company, LLP (investment adviser) from 1997 to 2010; Chair, Wellington Management Investment Portfolios (commingled non-U.S. investment pools) from 2007 to 2010; Director, Wellington Trust Company, NA and other Wellington affiliates from 1997 to 2010. Oversees 51; None | |
|
| William E. Mayer (Born 1940) | |
|
c/o Columbia Management Investment Advisers, LLC
225 Franklin Street
Boston, MA 02110
Trustee (since 1994) | | Partner, Park Avenue Equity Partners (private equity) since February 1999; Dean and Professor, College of Business and Management, University of Maryland from 1992 to 1996. Oversees 51; DynaVox Inc. (speech creation); Lee Enterprises (print media); WR Hambrecht + Co. (financial service provider) from 2000 to 2012; BlackRock Kelso Capital Corporation (investment company) | |
|
50
Fund Governance (continued)
Independent Trustees (continued)
Name, Address and Year of Birth,
Position with Funds, Year First
Elected or Appointed to Office | | Principal Occupation(s) During Past Five Years, Number of Funds in Columbia
Funds Complex Overseen by Trustee, Other Directorships Held
| |
| David M. Moffett (Born 1952) | |
|
c/o Columbia Management Investment Advisers, LLC
225 Franklin Street
Boston, MA 02110
Trustee (since 2011) | | Retired. Chief Executive Officer, Federal Home Loan Mortgage Corporation, from 2008 to 2009; Senior Adviser, Global Financial Services Group, Carlyle Group, Inc., from 2007 to 2008; Vice Chairman and Chief Financial Officer, U.S. Bancorp, from 1993 to 2007. Oversees 51; CIT Group Inc. (commercial and consumer finance), eBay Inc. (online trading community), MBIA Corp (financial service provider), E.W. Scripps Co. (print and television media), Building Materials Holding Corp. (building materials and construction services), and University of Oklahoma Foundation. | |
|
| Charles R. Nelson (Born 1942) | |
|
c/o Columbia Management Investment Advisers, LLC
225 Franklin Street
Boston, MA 02110
Trustee (since 1981) | | Retired Professor Emeritus, University of Washington, since 2011; Professor of Economics, University of Washington, from January 1976 to 2011; Ford and Louisa Van Voorhis Professor of Political Economy, University of Washington, from 1993 to 2011; Adjunct Professor of Statistics, University of Washington, from 1980 to 2011; Associate Editor, Journal of Money Credit and Banking from 1993 to 2008; consultant on econometric and statistical matters. Oversees 51; None | |
|
| John J. Neuhauser (Born 1943) | |
|
c/o Columbia Management Investment Advisers, LLC
225 Franklin Street
Boston, MA 02110
Trustee (since 1984) | | President, Saint Michael's College, since August 2007; Director or Trustee of several non-profit organizations, including Fletcher Allen Health Care, Inc.; University Professor, Boston College from November 2005 to August 2007; Academic Vice President and Dean of Faculties, Boston College from August 1999 to October 2005. Oversees 51; Liberty All-Star Equity Fund and Liberty All-Star Growth Fund (closed-end funds) | |
|
| Patrick J. Simpson (Born 1944) | |
|
c/o Columbia Management Investment Advisers, LLC
225 Franklin Street
Boston, MA 02110
Trustee (since 2000) | | Partner, Perkins Coie LLP (law firm). Oversees 51; None | |
|
| Anne-Lee Verville (Born 1945) | |
|
c/o Columbia Management Investment Advisers, LLC
225 Franklin Street
Boston, MA 02110
Trustee (since 1998) | | Retired. General Manager—Global Education Industry from 1994 to 1997, President—Application Systems Division from 1991 to 1994, Chief Financial Officer—US Marketing & Services from 1988 to 1991, and Chief Information Officer from 1987 to 1988, IBM Corporation (computer and technology). Oversees 51; Enesco Group, Inc. (producer of giftware and home and garden decor products) from 2001 to 2006 | |
|
The Statement of Additional Information includes additional information about the Trustees of the Funds and is available, without charge, upon request by calling 1-800-345-6611.
51
Fund Governance (continued)
Interested Trustee
Name, address and year of birth,
Position with funds, Year first
elected or appointed to office | | Principal occupation(s) during past five years, Number of funds in Columbia Funds
Complex overseen by trustee, Other directorships held | |
| William F. Truscott (born 1960) | |
|
53600 Ameriprise Financial Center
Minneapolis, MN 55474
Senior Vice President (since 2010) | | Chairman of the Board and President, Columbia Management Investment Advisers, LLC since May 2010 and February 2012, respectively (previously President, Chairman of the Board and Chief Investment Officer, from 2001 to April 2010); Chief Executive Officer, U.S. Asset Management & President, Annuities, Ameriprise Financial, Inc. since May 2010 (previously President—U.S. Asset Management and Chief Investment Officer from 2005 to April 2010, and Senior Vice President—Chief Investment Officer, from 2001 to 2005); Director, President and Chief Executive Officer, Ameriprise Certificate Company since 2006; Director, Columbia Management Investment Distributors, Inc. since May 2010 and February 2012, respectively (previously Chairman of the Board and Chief Executive Officer from 2008 to April 2010); Chairman of the Board and Chief Executive Officer, RiverSource Distributors, Inc. since 2006. Oversees 51; Columbia Funds Board. | |
|
Officers
| Name, Year of Birth and Address | | Principal Occupation(s) During the Past Five Years | |
| J. Kevin Connaughton (Born 1964) | |
|
225 Franklin Street
Boston, MA 02110
President (since 2009) | | Senior Vice President and General Manager—Mutual Fund Products, Columbia Management Investment Advisers, LLC since May 2010; President, Columbia Funds, since 2009, and RiverSource Funds, since May 2010 (previously Senior Vice President and Chief Financial Officer, Columbia Funds, from June 2008 to January 2009, Treasurer, Columbia Funds, from October 2003 to May 2008, and senior officer of various other affiliated funds since 2000); Managing Director, Columbia Management Advisors, LLC from December 2004 to April 2010. | |
|
| Michael G. Clarke (Born 1969) | |
|
225 Franklin Street
Boston, MA 02110
Treasurer (since 2011) and Chief Financial Officer (since 2009) | | Vice President, Columbia Management Investment Advisers, LLC since May 2010; Managing Director of Fund Administration, Columbia Management Advisors, LLC, from September 2004 to April 2010; senior officer of Columbia Funds and affiliated funds since 2002. | |
|
| Scott R. Plummer (Born 1959) | |
|
5228 Ameriprise Financial Center
Minneapolis, MN 55474
Senior Vice President, Assistant Secretary and Chief Legal Officer (since 2010) | | Chief Legal Officer and Assistant Secretary, Columbia Management Investment Advisers, LLC since June 2005; Vice President and Lead Chief Counsel—Asset Management, Ameriprise Financial, Inc. since May 2010 (previously Vice President and Chief Counsel—Asset Management, from 2005 to April 2010; Vice President, Chief Counsel and Assistant Secretary, Columbia Management Investment Distributors, Inc. since 2008; Vice President, General Counsel and Secretary, Ameriprise Certificate Company since 2005; Chief Counsel, RiverSource Distributors, Inc. since 2006; Senior officer of Columbia Funds and affiliated funds, since 2006. | |
|
52
Fund Governance (continued)
Officers (continued)
| Name, Year of Birth and Address | | Principal Occupation(s) During the Past Five Years | |
| William F. Truscott (Born 1960) | |
|
53600 Ameriprise Financial Center
Minneapolis, MN 55474
Senior Vice President (since 2010) | | Chairman of the Board and President, Columbia Management Investment Advisers, LLC since May 2010 and February 2012, respectively (previously President, Chairman of the Board and Chief Investment Officer, from 2001 to April 2010); Chief Executive Officer, U.S. Asset Management & President, Annuities, Ameriprise Financial, Inc. since May 2010 (previously President—U.S. Asset Management and Chief Investment Officer from 2005 to April 2010); Director, President and Chief Executive Officer, Ameriprise Certificate Company since 2006; Director and Chief Executive Officer, Columbia Management Investment Distributors, Inc. since May 2010 and February 2012, respectively (previously Chairman of the Board and Chief Executive Officer from 2008 to April 2010); Chairman of the Board and Chief Executive Officer, RiverSource Distributors, Inc. since 2006. | |
|
| Thomas P. McGuire (Born 1972) | |
|
225 Franklin Street
Boston, MA 02110
Chief Compliance Officer (since 2012) | | Vice President—Asset Management Compliance, Columbia Management Investment Advisers, LLC since 2010; Chief Compliance Officer. Ameriprise Certificate Company, since September 2010; Compliance Executive, Bank of America, 2005-2010. | |
|
| Colin Moore (Born 1958) | |
|
225 Franklin Street
Boston, MA 02110
Senior Vice President (since 2010) | | Director and Chief Investment Officer, Columbia Management Investment Advisers, LLC since May 2010; Manager, Managing Director and Chief Investment Officer of Columbia Management Advisors, LLC from 2007 to April 2010; Head of Equities, Columbia Management Advisors, LLC from 2002 to 2007. | |
|
| Amy Johnson (Born 1965) | |
|
5228 Ameriprise Financial Center
Minneapolis, MN 55474
Vice President (since 2010) | | Senior Vice President and Chief Operating Officer, Columbia Management Investment Advisers, LLC since May 2010 (previously Chief Administrative Officer, from 2009 until April 2010, Vice President—Asset Management and Trust Company Services, from 2006 to 2009, and Vice President—Operations and Compliance from 2004 to 2006). | |
|
| Joseph F. DiMaria (Born 1968) | |
|
225 Franklin Street
Boston, MA 02110
Vice President (since 2011) and Chief Accounting Officer (since 2008) | | Vice President, Mutual Fund Administration, Columbia Management Investment Advisers, LLC, since May 2010; Director of Fund Administration, Columbia Management Advisors, LLC from January 2006 to April 2010; Head of Tax/Compliance and Assistant Treasurer, Columbia Management Advisors, LLC, from November 2004 to December 2005. | |
|
| Stephen T. Welsh (born 1957) | |
|
225 Franklin Street
Boston, MA 02110
Vice President (since 2006) | | President and Director, Columbia Management Investment Services Corp. since May 2010; President and Director, Columbia Management Services, Inc. from July 2004 to April 2010; Managing Director, Columbia Management Distributors, Inc. from August 2007 to April 2010. | |
|
| Paul D. Pearson (born 1956) | |
|
5228 Ameriprise Financial Center
Minneapolis, MN 55474
Vice President and Assistant Treasurer (since 2011) | | Vice President, Investment Accounting, Columbia Management Investment Advisers, LLC, since May 2010; Vice President, Managed Assets, Investment Accounting, Ameriprise Financial Corporation. | |
|
53
Fund Governance (continued)
Officers (continued)
| Name, Year of Birth and Address | | Principal Occupation(s) During the Past Five Years | |
| Paul B. Goucher (born 1968) | |
|
5228 Ameriprise Financial Center
Minneapolis, MN 55474
Vice President and Assistant Secretary (since 2010) | | Vice President and Chief Counsel of Ameriprise Financial since January 2010 (formerly Vice President and Group Counsel from November 2008 to January 2010); Director, Managing Director and General Counsel of J. & W. Seligman & Co. Incorporated (Seligman) from July 2008 to November 2008 and Managing Director and Associate General Counsel of Seligman from January 2005 to July 2008. | |
|
| Christopher O. Petersen (born 1970) | |
|
5228 Ameriprise Financial Center
Minneapolis, MN 55474
Vice President (since 2010) and Secretary (since 2011) | | Vice President and Chief Counsel, Ameriprise Financial since January 2010 (formerly Vice President and Group Counsel or Counsel from April 2004 to January 2010); Assistant Secretary of RiverSource Funds since January 2007; officer of Columbia Funds and affiliated funds since 2007. | |
|
| Michael E. DeFao (born 1968) | |
|
225 Franklin Street
Boston, MA 02110
Vice President and Assistant Secretary (since 2011) | | Vice President and Chief Counsel, Ameriprise Financial since May 2010; Associate General Counsel Bank of America from June 2005 to April 2010 | |
|
54
This page intentionally left blank.
55
This page intentionally left blank.
56
Important Information About This Report
The fund mails one shareholder report to each shareholder address. If you would like more than one report, please call shareholder services at 1-800-345-6611 and additional reports will be sent to you. This report has been prepared for shareholders of Columbia Bond Fund.
A description of the policies and procedures that the fund uses to determine how to vote proxies and a copy of the fund's voting records are available (i) at www.columbiamanagement.com, (ii) on the Securities and Exchange Commission's website at www.sec.gov, and (iii) without charge, upon request, by calling 1-800-368-0346. Information regarding how the fund voted proxies relating to portfolio securities during the 12-month period ended June 30 is available from the SEC's website. Information regarding how the fund voted proxies relating to portfolio securities is also available from the fund's website, www.columbiamanagement.com.
The fund files a complete schedule of portfolio holdings with the SEC for the first and third quarters of each fiscal year on Form N-Q. The fund's Form N-Q is available on the SEC's website at www.sec.gov and may be reviewed and copied at the SEC's Public Reference Room in Washington, D.C. Information on the operation of the Public Reference Room may be obtained by calling 1-800-SEC-0330.
Transfer Agent
Columbia Management Investment
Services Corp.
P.O. Box 8081
Boston, MA 02266-8081
1-800-345-6611
Distributor
Columbia Management Investment
Distributors, Inc.
225 Franklin Street
Boston, MA 02110
Investment Manager
Columbia Management Investment Advisers, LLC
225 Franklin Street
Boston, MA 02110
57

Columbia Bond Fund
P. O. Box 8081
Boston, MA 02266-8081
columbiamanagement.com
This information is for use with concurrent or prior delivery of a fund prospectus. Investors should consider the investment objectives, risks, charges and expenses of a mutual fund carefully before investing. For a free prospectus, which contains this and other important information about the funds, visit columbiamanagement.com. Read the prospectus carefully before investing. The Fund is distributed by Columbia Management Investment Distributors, Inc., member FINRA, and managed by Columbia Management Investment Advisers, LLC.
© 2012 Columbia Management Investment Advisers, LLC. All rights reserved.
C-1176 C (5/12)

Columbia Corporate Income Fund
Annual Report for the Period Ended April 30, 2012
Not FDIC insured • No bank guarantee • May lose value
Table of Contents
| Fund Profile | | | 1 | | |
|
| Performance Information | | | 2 | | |
|
| Understanding Your Expenses | | | 3 | | |
|
| Portfolio Managers' Report | | | 4 | | |
|
| Portfolio of Investments | | | 6 | | |
|
Statement of Assets and
Liabilities | | | 24 | | |
|
| Statement of Operations | | | 26 | | |
|
Statement of Changes in
Net Assets | | | 27 | | |
|
| Financial Highlights | | | 29 | | |
|
| Notes to Financial Statements | | | 35 | | |
|
Report of Independent Registered
Public Accounting Firm | | | 48 | | |
|
| Fund Governance | | | 50 | | |
|
Important Information About
This Report | | | 57 | | |
|
The views expressed in this report reflect the current views of the respective parties. These views are not guarantees of future performance and involve certain risks, uncertainties and assumptions that are difficult to predict, so actual outcomes and results may differ significantly from the views expressed. These views are subject to change at any time based upon economic, market or other conditions and the respective parties disclaim any responsibility to update such views. These views may not be relied on as investment advice and, because investment decisions for a Columbia Fund are based on numerous factors, may not be relied on as an indication of trading intent on behalf of any particular Columbia Fund. References to specific securities should not be construed as a recommendation or investment advice.
President's Message

Dear Shareholders,
A stock market rally that commenced in the fourth quarter of 2011 continued into 2012 in the United States and around the world, as all major market regions generated double-digit returns for the three-month period ended March 31, 2012. Volatility declined sharply as European debt fears quieted somewhat and sentiment improved. Returns in developed countries were buoyed by strong results in Germany, Belgium, Austria and the Nordic markets of Denmark, Finland, Norway and Sweden. Under the cloud of its own mounting debt problem, Spain was the only eurozone country to deliver a negative return during the three-month period. Solid economic growth and accommodative monetary policy helped boost gains in emerging markets. The rally in U.S. equities was largely driven by an expansion in "multiples"—an increase in stock prices relative to their earnings. By the end of the first quarter of 2012, stocks no longer appeared as cheap as they were late in 2011. Bonds lagged stocks during the first quarter as investors responded to signs of an improved environment with a greater appetite for risk.
Concerns around the health of the global economy were centered in news headlines focusing on Washington D.C., Europe, China and the Middle East. In the United States, economic indicators remained mixed but generally indicated support for slow, sustainable economic growth. European policymakers have made progress in containing the eurozone debt crisis, though they still have not solved the issue of long-term solvency. The European Central Bank has lowered interest rates and flooded the financial system with liquidity that may provide breathing space for companies to restructure their balance sheets. These massive infusions of liquidity may whet the appetite for risk from investors around the world. However, it has delayed a true reckoning with the European financial situation, as concerns about Spain and Portugal continue to cloud the outlook. These structural challenges that persist in the developed world, and slowing growth in emerging market economies, leave the global economy in a fragile state. Domestic demand, combined with slowing inflationary trends, has also helped to shore up emerging market economies. Joblessness remains low and monetary conditions remain easy.
Despite the challenges and surprises of 2011, we see pockets of strength—and as a result, attractive opportunities—both here and abroad for 2012. We hope to help you capitalize on these opportunities with various articles in our 2012 Perspectives, which is available via the Market Insights tab at columbiamanagement.com. This publication showcases the strong research capabilities and experienced investment teams of Columbia Management and offers a diverse array of investment ideas based on our five key themes for 2012.
Other information and resources available at columbiamanagement.com include:
g detailed up-to-date fund performance and portfolio information
g economic analysis and market commentary
g quarterly fund commentaries
g Columbia Management Investor, our award-winning quarterly newsletter for shareholders
Thank you for your continued support of the Columbia Funds. We look forward to serving your investment needs for many years to come.
Best Regards,

J. Kevin Connaughton
President, Columbia Funds
Investors should consider the investment objectives, risks, charges and expenses of a mutual fund carefully before investing. For a free prospectus, which contains this and other important information about the funds, visit columbiamanagement.com. The prospectus should be read carefully before investing.
Columbia Funds are distributed by Columbia Management Investment Distributors, Inc., member FINRA, and managed by Columbia Management Investment Advisers, LLC.
© 2012 Columbia Management Investment Advisers, LLC. All rights reserved.
Fund Profile – Columbia Corporate Income Fund
Summary
g For the 13-month period that ended April 30, 2012, the fund's Class A shares returned 10.30% without sales charge.
g The fund's return was slightly lower than those of its former benchmark, the Barclays Credit Bond Index2, its new benchmark, the Barclays U.S. Corporate Index,1 its former blended benchmark4 and its new blended benchmark.3
g Fees, which the fund incurs but the indexes do not, generally accounted for a modest shortfall relative to these measures.
Portfolio Management
Tom Murphy, lead manager, has co-managed the fund since 2011 and has been associated with the fund's adviser as an investment professional since 2002.
Tim Doubek has co-managed the fund since 2011 and has been associated with the fund's adviser as an investment professional since 2001.
Brian Lavin has co-managed the fund since 2010 and has been associated with the fund's adviser as an investment professional since 1994.
Effective on April 1, 2012, the Fund changed its primary benchmark from the Barclays Credit Bond Index to the Barclays U.S. Corporate Index. Effective on April 1, 2012, the Fund also changed its Blended Benchmark from a 85% weighting in the Barclays Credit Bond index and a 15% weighting in the JPMorgan Global High Index to a 85% weighting in the Barclays U.S. Corporate Index and a 15% weighting in the BofA Merrill Lynch U.S. High Yield Cash Pay Constrained Index.
1The Barclays U.S. Corporate Index is an index which measures the investment grade, fixed-rate, taxable, corporate bond market.
2The Barclays Credit Bond Index is an index of publicly issued investment grade, corporate securities and dollar-denominated SEC registered global debentures.
3A weighted custom composite of the Barclays U.S. Corporate Index (85%) and BofA Merrill Lynch U.S. High Yield Cash Pay Constrained Index (15%) established by the advisor. The BofA Merrill Lynch U.S. High Yield Cash Pay Constrained Index tracks the performance of U.S. dollar-denominated below investment grade corporate debt, currently in a coupon paying period that is publicly issued in the U.S. domestic market.
4A weighted custom composite of the Barclays Credit Bond Index (85%) and JPMorgan Global High Yield Index (15%) established by the advisor. The JPMorgan Global High Yield Index is designed to mirror the investable universe of the U.S. dollar global high yield corporate debt market including domestic and international issues.
Indices are not available for investment, are not professionally managed and do not reflect sales changes, fees, brokerage commissions, taxes or other expenses of investing. Securities in the fund may not match those in the index.
Performance data quoted represents past performance and current performance may be lower or higher. Past performance is no guarantee of future results. The investment return and principal value will fluctuate so that shares, when redeemed, may be worth more or less than the original cost. Please visit www.columbiamanagement.com for daily and most recent month-end performance updates.
Summary
13-month (cumulative) return as of 04/30/12
| | | | +10.30% | |
|
|  | | | Class A shares
(without sales charge) | |
|
| | | | +10.98% | |
|
|  | | | Barclays U.S. Corporate Index1 | |
|
| | | | +11.05% | |
|
|  | | | Barclays Credit Bond Index2
(former benchmark) | |
|
| | | | +10.38% | |
|
|  | | | Blended Benchmark3 | |
|
| | | | +10.69 | |
|
|  | | | Blended Benchmark4
(former blended benchmark) | |
|
1
Performance Information – Columbia Corporate Income Fund
Performance data quoted represents past performance and current performance may be lower or higher. Past performance is no guarantee of future results. The investment return and principal value will fluctuate so that shares, when redeemed, may be worth more or less than the original cost. Please visit www.columbiamanagement.com for daily and most recent month-end performance updates.
Performance of a $10,000 investment 05/01/02 – 04/30/12
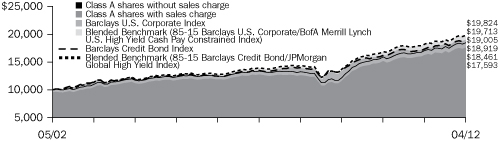
The chart above shows the change in value of a hypothetical $10,000 investment in Class A shares of Columbia Corporate Income Fund during the stated time period, and does not reflect the deduction of taxes that a shareholder may pay on fund distributions or on the redemption of fund shares.
Performance of a $10,000 investment 05/01/02 – 04/30/12 ($)
| Sales charge | | without | | with | |
| Class A | | | 18,461 | | | | 17,593 | | |
| Class B* | | | 17,132 | | | | 17,132 | | |
| Class C* | | | 17,386 | | | | 17,386 | | |
| Class I* | | | 19,017 | | | | n/a | | |
| Class W* | | | 18,531 | | | | n/a | | |
| Class Z | | | 18,983 | | | | n/a | | |
Average annual total return as of 4/30/12 (%)
| Share class | | A | | B* | | C* | | I* | | W* | | Z | |
| Inception | | 07/31/00 | | 07/15/02 | | 07/15/02 | | 09/27/10 | | 09/27/10 | | 03/05/86 | |
| Sales charge | | without | | with | | without | | with | | without | | with | | without | | without | | without | |
1-month
(cumulative) | | | 1.35 | | | | –3.48 | | | | 1.29 | | | | –3.71 | | | | 1.30 | | | | 0.30 | | | | 1.38 | | | | 1.35 | | | | 1.37 | | |
| 1-year | | | 8.31 | | | | 3.17 | | | | 7.50 | | | | 2.50 | | | | 7.66 | | | | 6.66 | | | | 8.71 | | | | 8.30 | | | | 8.57 | | |
| 5-year | | | 6.69 | | | | 5.67 | | | | 5.90 | | | | 5.58 | | | | 6.06 | | | | 6.06 | | | | 7.00 | | | | 6.70 | | | | 6.96 | | |
| 10-year | | | 6.32 | | | | 5.81 | | | | 5.53 | | | | 5.53 | | | | 5.69 | | | | 5.69 | | | | 6.64 | | | | 6.36 | | | | 6.62 | | |
The "with sales charge" returns include the maximum initial sales charge of 4.75% for Class A shares and the applicable contingent deferred sales charge of 5.00% in the first year, declining to 1.00% in the sixth year and eliminated thereafter for Class B shares and 1.00% for Class C shares for the first year only. The "without sales charge" returns do not include the effect of sales charges. If they had, returns would be lower.
Performance results reflect any fee waivers or reimbursements of fund expenses by Columbia Management Investment Advisers, LLC and/or any of its affiliates. Absent these fee waivers or expense reimbursement arrangements, performance results would have been lower.
All results shown assume the reinvestment of distributions. Class I and Class Z shares are sold at net asset value with no distribution and service (Rule 12b-1) fees. Class W shares are sold at net asset value with a distribution and service (Rule 12b-1) fee. Class I, Class W and Class Z shares have limited eligibility and the investment minimum requirements may vary. Please see the fund's prospectuses for details. Performance for different share classes will vary based on differences in sales charges and fees associated with each class.
*The returns shown for periods prior to the share class inception date (including returns since inception, which are since Fund inception) include the returns of the fund's oldest share class. These returns are adjusted to reflect any higher class-related operating expenses of the newer share classes, as applicable. Please visit columbiamanagement.com/mutual-fund/appended-performance for more information.
The tables do not reflect the deduction of taxes that a shareholder may pay on fund distributions or on the redemption of fund shares.
2
Understanding Your Expenses – Columbia Corporate Income Fund
As an investor, you incur two types of costs. There are transaction costs, which generally include sales charges on purchases and may include redemption fees. There are also ongoing costs, which generally include management fees, distribution and service (Rule 12b-1) fees, and other fund expenses. The following information is intended to help you understand your ongoing costs (in dollars) of investing in the Fund and to help you compare these costs with the ongoing costs of investing in other mutual funds.
Analyzing your fund's expenses
To illustrate these ongoing costs, we have provided examples and calculated the expenses paid by investors in each share class of the Fund during the period. The actual and hypothetical information in the table is based on an initial investment of $1,000 at the beginning of the period indicated and held for the entire period. Expense information is calculated two ways and each method provides you with different information. The amount listed in the "Actual" column is calculated using the Fund's actual operating expenses and total return for the period. You may use the Actual information, together with the amount invested, to estimate the expenses that you paid over the period. Simply divide your account value by $1,000 (for example, an $8,600 account value divided by $1,000 = 8.6), then multiply the results by the expenses paid during the period under the Actual column. The amount listed in the "Hypothetical" column assumes a 5% annual rate of return before expenses (which is not the Fund's actual return) and then applies the Fund's actual expense ratio for the period to the hypothetical return. You should not use the hypothetical account values and expenses to estimate either your actual account balance at the end of the period or the expenses you paid during the period. See "Compare with other funds" below for details on how to use the hypothetical data.
Compare with other funds
Since all mutual funds are required to include the same hypothetical calculations about expenses in shareholder reports, you can use this information to compare the ongoing cost of investing in the Fund with other funds. To do so, compare the hypothetical example with the 5% hypothetical examples that appear in the shareholder reports of other funds. As you compare hypothetical examples of other funds, it is important to note that hypothetical examples are meant to highlight the ongoing costs of investing in a fund only and do not reflect any transaction costs, such as sales charges, or redemption or exchange fees. Therefore, the hypothetical calculations are useful in comparing ongoing costs only, and will not help you determine the relative total costs of owning different funds. If transaction costs were included in these calculations, your costs would be higher.
November 1, 2011 – April 30, 2012
| | | Account value at the
beginning of the period ($) | | Account value at the
end of the period ($) | | Expenses paid
during the period ($) | | Fund's annualized
expense ratio (%) | |
| | | Actual | | Hypothetical | | Actual | | Hypothetical | | Actual | | Hypothetical | | Actual | |
| Class A | | | 1,000.00 | | | | 1,000.00 | | | | 1,038.30 | | | | 1,020.29 | | | | 4.66 | | | | 4.62 | | | | 0.92 | | |
| Class B | | | 1,000.00 | | | | 1,000.00 | | | | 1,034.50 | | | | 1,016.56 | | | | 8.45 | | | | 8.37 | | | | 1.67 | | |
| Class C | | | 1,000.00 | | | | 1,000.00 | | | | 1,035.20 | | | | 1,017.30 | | | | 7.69 | | | | 7.62 | | | | 1.52 | | |
| Class I | | | 1,000.00 | | | | 1,000.00 | | | | 1,040.30 | | | | 1,022.23 | | | | 2.69 | | | | 2.66 | | | | 0.53 | | |
| Class W | | | 1,000.00 | | | | 1,000.00 | | | | 1,038.20 | | | | 1,020.24 | | | | 4.71 | | | | 4.67 | | | | 0.93 | | |
| Class Z | | | 1,000.00 | | | | 1,000.00 | | | | 1,039.60 | | | | 1,021.53 | | | | 3.40 | | | | 3.37 | | | | 0.67 | | |
Expenses paid during the period are equal to the annualized expense ratio for each class as indicated above, multiplied by the average account value over the period and then multiplied by the number of days in the Fund's most recent six months and divided by 366.
Expenses do not include fees and expenses incurred indirectly by the Fund from the underlying funds in which the Fund may invest (also referred to as "acquired funds"), including affiliated and non-affiliated pooled investments vehicles (including mutual funds and exchange traded funds).
Had Columbia Management Investment Advisers, LLC and/or certain of its affiliates not waived/reimbursed certain fees and expenses, account value at the end of the period would have been reduced.
3
Portfolio Manager's Report – Columbia Corporate Income Fund
Performance data quoted represents past performance and current performance may be lower or higher. Past performance is no guarantee of future results. The investment return and principal value will fluctuate so that shares, when redeemed, may be worth more or less than the original cost. Please visit www.columbiamanagement.com for daily and most recent month-end performance updates.
Portfolio Breakdown1
(at April 30, 2012)
| Corporate Bonds & Notes | | | 96.4 | % | |
Residential Mortgage-Backed
Securities—Agency | | | 0.0 | * | |
| U.S. Treasury Obligations | | | 1.9 | | |
| Senior Loans | | | 0.3 | | |
| Common Stocks | | | 0.0 | * | |
| Warrants | | | 0.0 | * | |
| Other2 | | | 1.4 | | |
1 Percentages indicated are based upon total investments (excluding Investments of Cash Collateral Received for Securities on Loan). The Fund's portfolio composition is subject to change.
2 Includes investments in money market funds.
* Rounds to less than 0.01%
Quality Breakdown1
(at April 30, 2012)
| AAA rating | | | 2.0 | % | |
| AA rating | | | 2.5 | | |
| A rating | | | 18.8 | | |
| BBB rating | | | 59.1 | | |
| Non-investment grade | | | 17.6 | | |
| Not rated | | | 0.0 | * | |
1 Percentages indicated are based upon total fixed income securities (excluding Investments of Cash Collateral Received for Securities on Loan and money market funds).
* Rounds to less than 0.01%
Bond ratings apply to the underlying holdings of the Fund and not the Fund itself and are divided into categories ranging from AAA (highest) to D (lowest), and are subject to change. The ratings shown are determined by using the middle rating of Moody's, S&P, and Fitch after dropping the highest and lowest available ratings. When a rating from only two agencies is available, the lower rating is used. When a rating from only one agency is available, that rating is used. When a bond is not rated by one of these agencies, it is designated as Not rated. Credit ratings are subjective to opinions and not statements of fact.
The Board of Trustees for Columbia Corporate Income Fund has approved the change of the fund's fiscal year end from March 31 to April 30. As a result, this report covers the 13-month period since the last annual report. The next report you receive will be for the six-month period from May 1, 2012 through October 31, 2012.
Effective April 1, 2012, the fund changed its primary benchmark to the Barclays U.S. Corporate Index. Also effective April 1, 2012, the fund changed the composition of its blended benchmark to 85% Barclays U.S. Corporate Index /15% BofA Merrill Lynch U.S. High Yield Cash Pay Constrained Index. We believe the new benchmarks are more representative of the fund's investment approach.
For the 13-month period that ended April 30, 2012, the fund's Class A shares returned 10.30% without sales charge. The fund's return was generally in line with the returns of its new benchmarks, which returned 10.98% and 10.38%, respectively. The fund's performance also was consistent with the returns of its former benchmarks, the Barclays Credit Bond Index and a weighted composite of the Barclays Credit Bond Index (85%) and the JPM Global High Yield Index (15%), which returned 11.05% and 10.69%, respectively for the same period. Fees generally accounted for the small performance difference between the fund and the benchmarks.
Improving economic news
Early in the reporting period, Europe's debt problems and wrangling in Washington over the federal budget and the national debt dominated world headlines. U.S. economic news was lackluster, the housing market continued to slump and job growth was disappointing. However, the pace of both economic and job growth picked up as the period wore on. Consumer confidence improved as the labor market added approximately 1.2 million new jobs between November 2011 and April 2012, while the jobless rate fell to 8.1%. Household net worth also picked up as the equity markets rebounded. Headline inflation rose 2.7%, driven primarily by rising food and energy prices. Despite a modest slowdown in manufacturing activity late in the summer of 2011, manufacturing activity continued to expand throughout the period.
Focus on security selection aided performance
Against this improving economic backdrop, our emphasis on security selection aided performance. We targeted asset-rich domestic corporations with stable cash flows and businesses that were less sensitive to economic cycles. This relatively defensive positioning helped sustain the portfolio as investor sentiment shifted. When Europe's debt problems and U.S. fiscal problems eroded confidence early in the period, investors avoided risk. When investors perceived that Europe was taking measures to address its debt problems and the debt ceiling standoff was resolved—albeit temporarily—investors grew more comfortable with risk.
We maintained a highly diversified portfolio of both investment-grade and high-yield corporate securities, favoring the debt of non-cyclical companies in industries such as pipelines, electric utilities, telecommunications and media, food and beverages and transportation. The fund held positions in the debt of approximately 150 investment-grade corporations and 350 lower-rated corporations. As a result of this relatively
4
Portfolio Manager's Report (continued) – Columbia Corporate Income Fund
broad diversification, no single holding had a significant impact on returns, either positive or negative. Duration management also helped performance. (Duration is a measure of interest rate sensitivity.) We emphasized securities with maturities of less than 15 years, which aided performance as longer maturities underperformed during the period.
Financials underweight hampered returns, but reflects our concerns
As investors became more comfortable with risk in the second half of the period, the fund's underweight relative to the index in the financials sector held back results. We underweighted the sector because we believe U.S. financial corporations face a variety of regulatory and economic uncertainties and we were even less comfortable with companies exposed to the debt problems in Europe. Even though our judgment was not rewarded during the period, we continue to reflect these concerns in the portfolio's positioning going forward.
Looking ahead
We remain confident about the prospects for non-financial U.S. corporations and will continue to rely on bottom-up security selection to help identify companies in which we have a high degree of confidence. Non-financial U.S. companies have exceeded earnings expectations over the past year and continue to maintain strong balance sheets with high cash balances. We believe these companies have the financial flexibility to manage their businesses successfully and meet their debt obligations even if the economy weakens.
Portfolio characteristics and holdings are subject to change periodically and may not be representative of current characteristics and holdings. The outlook for the fund may differ from that presented for other Columbia Funds.
Investing in fixed-income securities may involve certain risks, including the credit quality of individual issuers, possible prepayments, market or economic developments and yields and share price fluctuations due to changes in interest rates. When interest rates go up, bond prices typically drop, and vice versa.
Investments in high-yield bonds (sometimes referred to as "junk" bonds) offer the potential for high current income and attractive total return, but involve certain risks. Changes in economic conditions or other circumstances may adversely affect a high-yield bond issuer's ability to make principal and interest payments.
5
Portfolio of Investments – Columbia Corporate Income Fund
April 30, 2012
(Percentages represent value of investments compared to net assets)
| Issuer | | Coupon
Rate | | Principal
Amount | | Value | |
| Corporate Bonds & Notes 95.6% | |
| Aerospace & Defense 1.8% | |
ADS Tactical, Inc.
Senior Secured(a) | |
| 04/01/18 | | | 11.000 | % | | $ | 1,435,000 | | | $ | 1,470,875 | | |
BE Aerospace, Inc.
Senior Unsecured | |
| 04/01/22 | | | 5.250 | % | | | 577,000 | | | | 585,655 | | |
Bombardier, Inc.
Senior Unsecured(a) | |
| 05/01/14 | | | 6.300 | % | | | 105,000 | | | | 110,250 | | |
| Huntington Ingalls Industries, Inc. | |
| 03/15/18 | | | 6.875 | % | | | 1,140,000 | | | | 1,205,550 | | |
Kratos Defense & Security Solutions, Inc.
Senior Secured | |
| 06/01/17 | | | 10.000 | % | | | 1,635,000 | | | | 1,757,625 | | |
| L-3 Communications Corp. | |
| 02/15/21 | | | 4.950 | % | | | 6,950,000 | | | | 7,437,202 | | |
Lockheed Martin Corp.
Senior Unsecured | |
| 09/15/21 | | | 3.350 | % | | | 10,190,000 | | | | 10,474,902 | | |
Northrop Grumman Corp.
Senior Unsecured | |
| 03/15/21 | | | 3.500 | % | | | 1,622,000 | | | | 1,696,924 | | |
| Oshkosh Corp. | |
| 03/01/17 | | | 8.250 | % | | | 149,000 | | | | 161,665 | | |
| 03/01/20 | | | 8.500 | % | | | 684,000 | | | | 742,140 | | |
| TransDigm, Inc. | |
| 12/15/18 | | | 7.750 | % | | | 229,000 | | | | 249,610 | | |
| Total | | | 25,892,398 | | |
| Airlines 0.1% | |
| Continental Airlines 1997-1 Class A Pass-Through Trust | |
| 04/01/15 | | | 7.461 | % | | | 790,576 | | | | 799,470 | | |
| Automotive 0.6% | |
| Allison Transmission, Inc.(a) | |
| 05/15/19 | | | 7.125 | % | | | 578,000 | | | | 604,010 | | |
Chrysler Group LLC/Co-Issuer, Inc.
Secured | |
| 06/15/21 | | | 8.250 | % | | | 534,000 | | | | 552,690 | | |
Chrysler Group LLC/Co-Issuer, Inc.(b)
Secured | |
| 06/15/19 | | | 8.000 | % | | | 783,000 | | | | 810,405 | | |
Dana Holding Corp.
Senior Unsecured | |
| 02/15/19 | | | 6.500 | % | | | 65,000 | | | | 69,550 | | |
| 02/15/21 | | | 6.750 | % | | | 941,000 | | | | 1,011,575 | | |
| Delphi Corp.(a) | |
| 05/15/21 | | | 6.125 | % | | | 89,000 | | | | 94,785 | | |
| Delphi Corp.(a)(b) | |
| 05/15/19 | | | 5.875 | % | | | 926,000 | | | | 976,930 | | |
| Lear Corp. | |
| 03/15/18 | | | 7.875 | % | | | 386,000 | | | | 418,810 | | |
| 03/15/20 | | | 8.125 | % | | | 883,000 | | | | 986,752 | | |
Schaeffler Finance BV(a)
Senior Secured | |
| 02/15/17 | | | 7.750 | % | | | 325,000 | | | | 343,948 | | |
| 02/15/19 | | | 8.500 | % | | | 416,000 | | | | 439,920 | | |
| Issuer | | Coupon
Rate | | Principal
Amount | | Value | |
| Corporate Bonds & Notes (continued) | |
| Automotive (cont.) | |
| Visteon Corp. | |
| 04/15/19 | | | 6.750 | % | | $ | 2,189,000 | | | $ | 2,254,670 | | |
| Total | | | 8,564,045 | | |
| Banking 10.2% | |
Bank of America Corp.
Senior Unsecured | |
| 05/13/21 | | | 5.000 | % | | | 28,155,000 | | | | 28,023,235 | | |
Citigroup, Inc.
Senior Unsecured(b) | |
| 01/14/22 | | | 4.500 | % | | | 22,400,000 | | | | 22,775,013 | | |
Goldman Sachs Group Inc. (The)
Senior Unsecured | |
| 01/24/22 | | | 5.750 | % | | | 14,470,000 | | | | 15,109,487 | | |
Goldman Sachs Group, Inc. (The)
Senior Unsecured | |
| 06/15/20 | | | 6.000 | % | | | 12,660,000 | | | | 13,543,250 | | |
HSBC Holdings PLC
Senior Unsecured | |
| 03/30/22 | | | 4.000 | % | | | 5,080,000 | | | | 5,160,996 | | |
HSBC USA, Inc.
Senior Unsecured | |
| 02/13/15 | | | 2.375 | % | | | 3,155,000 | | | | 3,189,500 | | |
JPMorgan Chase & Co.
Senior Unsecured | |
| 08/15/21 | | | 4.350 | % | | | 25,805,000 | | | | 27,018,454 | | |
| Lloyds Banking Group PLC(a)(c) | |
| 11/29/49 | | | 6.267 | % | | | 456,000 | | | | 291,840 | | |
Morgan Stanley
Senior Unsecured | |
| 07/28/21 | | | 5.500 | % | | | 20,490,000 | | | | 20,031,741 | | |
Synovus Financial Corp.
Senior Unsecured | |
| 02/15/19 | | | 7.875 | % | | | 444,000 | | | | 469,530 | | |
Washington Mutual Bank
Subordinated Notes(d)(e)(h) | |
| 01/15/15 | | | 5.125 | % | | | 6,350,000 | | | | 9,525 | | |
Wells Fargo & Co.
Senior Unsecured | |
| 04/01/21 | | | 4.600 | % | | | 6,750,000 | | | | 7,414,315 | | |
| Total | | | 143,036,886 | | |
| Brokerage 0.2% | |
E*Trade Financial Corp.
Senior Unsecured | |
| 12/01/15 | | | 7.875 | % | | | 695,000 | | | | 709,769 | | |
| 11/30/17 | | | 12.500 | % | | | 898,000 | | | | 1,046,170 | | |
Neuberger Berman Group LLC/Finance Corp.(a)
Senior Unsecured | |
| 03/15/20 | | | 5.625 | % | | | 274,000 | | | | 277,425 | | |
| 03/15/22 | | | 5.875 | % | | | 410,000 | | | | 416,150 | | |
| Total | | | 2,449,514 | | |
| Building Materials 0.2% | |
Building Materials Corp. of America
Senior Notes(a) | |
| 05/01/21 | | | 6.750 | % | | | 1,137,000 | | | | 1,183,901 | | |
| Gibraltar Industries, Inc. | |
| 12/01/15 | | | 8.000 | % | | | 555,000 | | | | 566,100 | | |
The Accompanying Notes to Financial Statements are an integral part of this statement.
6
Columbia Corporate Income Fund
April 30, 2012
(Percentages represent value of investments compared to net assets)
| Issuer | | Coupon
Rate | | Principal
Amount | | Value | |
| Corporate Bonds & Notes (continued) | |
| Building Materials (cont.) | |
| Interface, Inc. | |
| 12/01/18 | | | 7.625 | % | | $ | 461,000 | | | $ | 497,880 | | |
Norcraft Companies LP/Finance Corp.
Secured | |
| 12/15/15 | | | 10.500 | % | | | 480,000 | | | | 448,800 | | |
| Nortek, Inc. | |
| 12/01/18 | | | 10.000 | % | | | 45,000 | | | | 47,475 | | |
| 04/15/21 | | | 8.500 | % | | | 267,000 | | | | 263,663 | | |
| Total | | | 3,007,819 | | |
| Chemicals 1.6% | |
| CF Industries, Inc. | |
| 05/01/18 | | | 6.875 | % | | | 288,000 | | | | 334,800 | | |
| 05/01/20 | | | 7.125 | % | | | 402,000 | | | | 479,385 | | |
| Celanese U.S. Holdings LLC | |
| 06/15/21 | | | 5.875 | % | | | 62,000 | | | | 66,495 | | |
Dow Chemical Co. (The)
Senior Unsecured | |
| 11/15/20 | | | 4.250 | % | | | 10,660,000 | | | | 11,313,980 | | |
Hexion U.S. Finance Corp./Nova Scotia ULC
Senior Secured | |
| 02/01/18 | | | 8.875 | % | | | 1,103,000 | | | | 1,155,392 | | |
Hexion US Finance Corp.
Senior Unsecured(a) | |
| 04/15/20 | | | 6.625 | % | | | 1,125,000 | | | | 1,175,625 | | |
Ineos Finance PLC(a)
Senior Secured | |
| 05/15/15 | | | 9.000 | % | | | 1,036,000 | | | | 1,108,520 | | |
| 02/15/19 | | | 8.375 | % | | | 722,000 | | | | 774,345 | | |
| Ineos Finance PLC(a)(f) | |
| 05/01/20 | | | 7.500 | % | | | 359,000 | | | | 368,873 | | |
JM Huber Corp.
Senior Unsecured(a) | |
| 11/01/19 | | | 9.875 | % | | | 520,000 | | | | 546,000 | | |
| Koppers, Inc. | |
| 12/01/19 | | | 7.875 | % | | | 96,000 | | | | 103,200 | | |
| LyondellBasell Industries NV(a) | |
| 11/15/21 | | | 6.000 | % | | | 2,219,000 | | | | 2,396,520 | | |
| Senior Notes | |
| 04/15/24 | | | 5.750 | % | | | 784,000 | | | | 809,480 | | |
| MacDermid, Inc.(a) | |
| 04/15/17 | | | 9.500 | % | | | 580,000 | | | | 606,100 | | |
| Momentive Performance Materials, Inc. | |
| 06/15/14 | | | 12.500 | % | | | 302,000 | | | | 320,120 | | |
Nova Chemicals Corp.
Senior Unsecured | |
| 11/01/16 | | | 8.375 | % | | | 360,000 | | | | 399,600 | | |
| 11/01/19 | | | 8.625 | % | | | 353,000 | | | | 402,420 | | |
| Polypore International, Inc. | |
| 11/15/17 | | | 7.500 | % | | | 716,000 | | | | 751,800 | | |
| Total | | | 23,112,655 | | |
| Construction Machinery 0.6% | |
| CNH Capital LLC(a) | |
| 11/01/16 | | | 6.250 | % | | | 1,161,000 | | | | 1,237,916 | | |
| Case New Holland, Inc. | |
| 12/01/17 | | | 7.875 | % | | | 943,000 | | | | 1,098,595 | | |
| Columbus McKinnon Corp. | |
| 02/01/19 | | | 7.875 | % | | | 559,000 | | | | 592,540 | | |
| Issuer | | Coupon
Rate | | Principal
Amount | | Value | |
| Corporate Bonds & Notes (continued) | |
| Construction Machinery (cont.) | |
| Manitowoc Co., Inc. (The)(b) | |
| 02/15/18 | | | 9.500 | % | | $ | 216,000 | | | $ | 240,300 | | |
| 11/01/20 | | | 8.500 | % | | | 595,000 | | | | 660,450 | | |
Neff Rental LLC/Finance Corp.
Secured(a) | |
| 05/15/16 | | | 9.625 | % | | | 408,000 | | | | 406,980 | | |
RSC Equipment Rental, Inc./Holdings III LLC
Senior Unsecured | |
| 02/01/21 | | | 8.250 | % | | | 120,000 | | | | 129,600 | | |
| Terex Corp. | |
| 04/01/20 | | | 6.500 | % | | | 443,000 | | | | 455,183 | | |
UR Financing Escrow Corp(a)
Secured | |
| 07/15/18 | | | 5.750 | % | | | 564,000 | | | | 583,740 | | |
| Senior Unsecured | |
| 05/15/20 | | | 7.375 | % | | | 467,000 | | | | 489,182 | | |
| 04/15/22 | | | 7.625 | % | | | 1,168,000 | | | | 1,232,240 | | |
| United Rentals North America, Inc. | |
| 06/15/16 | | | 10.875 | % | | | 74,000 | | | | 83,713 | | |
| 12/15/19 | | | 9.250 | % | | | 951,000 | | | | 1,057,987 | | |
| Xerium Technologies, Inc. | |
| 06/15/18 | | | 8.875 | % | | | 235,000 | | | | 196,225 | | |
| Total | | | 8,464,651 | | |
| Consumer Cyclical Services 0.1% | |
Goodman Networks, Inc.
Senior Secured(a) | |
| 07/01/18 | | | 12.125 | % | | | 310,000 | | | | 312,325 | | |
Realogy Corp.
Senior Secured(a)(b) | |
| 01/15/20 | | | 9.000 | % | | | 448,000 | | | | 455,840 | | |
| Total | | | 768,165 | | |
| Consumer Products —% | |
Libbey Glass, Inc.
Senior Secured | |
| 02/15/15 | | | 10.000 | % | | | 450,000 | | | | 479,812 | | |
Spectrum Brands, Inc.
Senior Unsecured(a)(b) | |
| 03/15/20 | | | 6.750 | % | | | 165,000 | | | | 168,713 | | |
| Total | | | 648,525 | | |
| Diversified Manufacturing 0.2% | |
| Actuant Corp.(a) | |
| 06/15/22 | | | 5.625 | % | | | 326,000 | | | | 335,780 | | |
Amsted Industries, Inc.
Senior Notes(a) | |
| 03/15/18 | | | 8.125 | % | | | 375,000 | | | | 396,563 | | |
CPM Holdings, Inc.
Senior Secured | |
| 09/01/14 | | | 10.625 | % | | | 255,000 | | | | 275,400 | | |
Tomkins LLC/Inc.
Secured | |
| 10/01/18 | | | 9.000 | % | | | 806,000 | | | | 896,675 | | |
| WireCo WorldGroup, Inc. | |
| 05/15/17 | | | 9.500 | % | | | 513,000 | | | | 529,672 | | |
| Total | | | 2,434,090 | | |
The Accompanying Notes to Financial Statements are an integral part of this statement.
7
Columbia Corporate Income Fund
April 30, 2012
(Percentages represent value of investments compared to net assets)
| Issuer | | Coupon
Rate | | Principal
Amount | | Value | |
| Corporate Bonds & Notes (continued) | |
| Electric 13.9% | |
AES Corp. (The)
Senior Unsecured(a) | |
| 07/01/21 | | | 7.375 | % | | $ | 1,057,000 | | | $ | 1,175,913 | | |
American Electric Power Co., Inc.
Senior Unsecured | |
| 06/01/15 | | | 5.250 | % | | | 4,580,000 | | | | 5,003,719 | | |
Appalachian Power Co.
Senior Unsecured | |
| 03/30/21 | | | 4.600 | % | | | 6,290,000 | | | | 6,985,743 | | |
Arizona Public Service Co.
Senior Unsecured | |
| 08/01/16 | | | 6.250 | % | | | 4,851,000 | | | | 5,715,880 | | |
CMS Energy Corp.
Senior Unsecured | |
| 09/30/15 | | | 4.250 | % | | | 1,480,000 | | | | 1,531,800 | | |
| 12/15/15 | | | 6.875 | % | | | 10,205,000 | | | | 11,373,064 | | |
Calpine Corp.
Senior Secured(a) | |
| 02/15/21 | | | 7.500 | % | | | 1,269,000 | | | | 1,361,002 | | |
Consumers Energy Co.
1st Mortgage | |
| 02/15/14 | | | 6.000 | % | | | 3,355,000 | | | | 3,643,711 | | |
| 08/15/16 | | | 5.500 | % | | | 2,000,000 | | | | 2,307,166 | | |
DTE Energy Co.
Senior Unsecured | |
| 05/15/14 | | | 7.625 | % | | | 955,000 | | | | 1,071,457 | | |
| 06/01/16 | | | 6.350 | % | | | 14,800,000 | | | | 17,144,438 | | |
Dominion Resources, Inc.
Senior Unsecured | |
| 01/15/16 | | | 5.200 | % | | | 5,300,000 | | | | 5,990,648 | | |
| 06/15/18 | | | 6.400 | % | | | 13,380,000 | | | | 16,526,615 | | |
| 01/15/19 | | | 8.875 | % | | | 1,500,000 | | | | 2,045,919 | | |
Duke Energy Corp.
Senior Unsecured(b) | |
| 09/15/19 | | | 5.050 | % | | | 9,750,000 | | | | 11,246,410 | | |
Florida Power Corp.
1st Mortgage | |
| 06/15/18 | | | 5.650 | % | | | 7,213,000 | | | | 8,739,538 | | |
GenOn Energy, Inc.
Senior Unsecured(b) | |
| 10/15/18 | | | 9.500 | % | | | 171,000 | | | | 162,450 | | |
Indiana Michigan Power Co.
Senior Unsecured | |
| 12/01/15 | | | 5.650 | % | | | 1,500,000 | | | | 1,681,042 | | |
| 03/15/37 | | | 6.050 | % | | | 4,000,000 | | | | 4,651,072 | | |
Ipalco Enterprises, Inc.
Senior Secured(a) | |
| 04/01/16 | | | 7.250 | % | | | 330,000 | | | | 359,700 | | |
Midwest Generation LLC
Pass-Through Certificates | |
| 01/02/16 | | | 8.560 | % | | | 61,016 | | | | 59,186 | | |
| Nevada Power Co. | |
| 05/15/18 | | | 6.500 | % | | | 5,730,000 | | | | 7,056,312 | | |
| 08/01/18 | | | 6.500 | % | | | 2,136,000 | | | | 2,650,903 | | |
Oncor Electric Delivery Co. LLC
Senior Secured | |
| 09/01/13 | | | 5.950 | % | | | 4,665,000 | | | | 4,920,152 | | |
| 01/15/15 | | | 6.375 | % | | | 8,592,000 | | | | 9,652,691 | | |
| Issuer | | Coupon
Rate | | Principal
Amount | | Value | |
| Corporate Bonds & Notes (continued) | |
| Electric (cont.) | |
Oncor Electric Delivery Co. LLC(a)
Senior Secured | |
| 12/01/41 | | | 4.550 | % | | $ | 1,625,000 | | | $ | 1,487,119 | | |
PacifiCorp
1st Mortgage | |
| 01/15/19 | | | 5.500 | % | | | 3,035,000 | | | | 3,621,235 | | |
Pacific Gas & Electric Co.
Senior Unsecured | |
| 04/15/42 | | | 4.450 | % | | | 1,960,000 | | | | 1,992,934 | | |
Pacific Gas & Electric Co.(b)
Senior Unsecured | |
| 10/01/20 | | | 3.500 | % | | | 4,300,000 | | | | 4,568,879 | | |
Progress Energy, Inc.
Senior Unsecured | |
| 12/01/19 | | | 4.875 | % | | | 2,600,000 | | | | 2,966,961 | | |
| 01/15/21 | | | 4.400 | % | | | 2,855,000 | | | | 3,180,826 | | |
| 04/01/22 | | | 3.150 | % | | | 4,500,000 | | | | 4,494,100 | | |
| Sierra Pacific Power Co. | |
| 05/15/16 | | | 6.000 | % | | | 6,002,000 | | | | 7,001,099 | | |
Tampa Electric Co.
Senior Unsecured | |
| 05/15/21 | | | 5.400 | % | | | 7,741,000 | | | | 9,171,173 | | |
Toledo Edison Co. (The)
Senior Secured | |
| 05/15/37 | | | 6.150 | % | | | 5,000,000 | | | | 6,011,080 | | |
TransAlta Corp.
Senior Unsecured | |
| 01/15/15 | | | 4.750 | % | | | 6,750,000 | | | | 7,224,240 | | |
Windsor Financing LLC
Senior Unsecured(a) | |
| 07/15/17 | | | 5.881 | % | | | 1,185,262 | | | | 1,188,984 | | |
Xcel Energy, Inc.
Senior Unsecured | |
| 05/15/20 | | | 4.700 | % | | | 8,775,000 | | | | 10,024,534 | | |
| Total | | | 195,989,695 | | |
| Entertainment 0.7% | |
| AMC Entertainment, Inc. | |
| 06/01/19 | | | 8.750 | % | | | 350,000 | | | | 373,188 | | |
| Cinemark U.S.A., Inc(b) | |
| 06/15/21 | | | 7.375 | % | | | 73,000 | | | | 78,840 | | |
| Six Flags, Inc.(a)(d)(g)(h) | |
| 06/01/14 | | | 9.625 | % | | | 259,000 | | | | – | | |
| Speedway Motorsports, Inc. | |
| 06/01/16 | | | 8.750 | % | | | 400,000 | | | | 436,000 | | |
| Speedway Motorsports, Inc.(b) | |
| 02/01/19 | | | 6.750 | % | | | 269,000 | | | | 281,105 | | |
| Time Warner, Inc. | |
| 03/29/41 | | | 6.250 | % | | | 7,695,000 | | | | 8,948,546 | | |
| Vail Resorts, Inc. | |
| 05/01/19 | | | 6.500 | % | | | 67,000 | | | | 70,685 | | |
| Total | | | 10,188,364 | | |
| Environmental 1.1% | |
| Waste Management, Inc. | |
| 06/30/20 | | | 4.750 | % | | | 13,785,000 | | | | 15,577,339 | | |
The Accompanying Notes to Financial Statements are an integral part of this statement.
8
Columbia Corporate Income Fund
April 30, 2012
(Percentages represent value of investments compared to net assets)
| Issuer | | Coupon
Rate | | Principal
Amount | | Value | |
| Corporate Bonds & Notes (continued) | |
| Food and Beverage 5.2% | |
ARAMARK Holdings Corp.
Senior Unsecured PIK(a) | |
| 05/01/16 | | | 8.625 | % | | $ | 100,000 | | | $ | 102,376 | | |
ConAgra Foods, Inc.
Senior Unsecured | |
| 06/15/17 | | | 5.819 | % | | | 4,925,000 | | | | 5,664,252 | | |
| Cott Beverages, Inc. | |
| 11/15/17 | | | 8.375 | % | | | 105,000 | | | | 113,400 | | |
| 09/01/18 | | | 8.125 | % | | | 337,000 | | | | 364,802 | | |
| Diageo Capital PLC | |
| 07/15/20 | | | 4.828 | % | | | 5,000,000 | | | | 5,823,745 | | |
General Mills, Inc.
Senior Unsecured | |
| 02/15/19 | | | 5.650 | % | | | 7,357,000 | | | | 8,888,764 | | |
Heineken NV
Senior Unsecured(a) | |
| 04/01/22 | | | 3.400 | % | | | 6,495,000 | | | | 6,585,138 | | |
Kraft Foods, Inc.
Senior Unsecured | |
| 08/11/17 | | | 6.500 | % | | | 1,735,000 | | | | 2,102,570 | | |
| 08/23/18 | | | 6.125 | % | | | 14,500,000 | | | | 17,537,764 | | |
| 02/09/40 | | | 6.500 | % | | | 1,500,000 | | | | 1,881,228 | | |
| Molson Coors Brewing Co.(f) | |
| 05/01/22 | | | 3.500 | % | | | 3,645,000 | | | | 3,677,215 | | |
| Pinnacle Foods Finance LLC/Corp. | |
| 04/01/15 | | | 9.250 | % | | | 188,000 | | | | 192,700 | | |
| SABMiller Holdings, Inc.(a) | |
| 01/15/17 | | | 2.450 | % | | | 5,960,000 | | | | 6,103,666 | | |
SABMiller PLC
Senior Unsecured(a) | |
| 07/15/18 | | | 6.500 | % | | | 11,165,000 | | | | 13,608,230 | | |
| Total | | | 72,645,850 | | |
| Gaming 0.5% | |
Caesars Entertainment Operating Co., Inc.
Secured | |
| 04/15/18 | | | 12.750 | % | | | 580,000 | | | | 493,725 | | |
| Senior Secured | |
| 06/01/17 | | | 11.250 | % | | | 857,000 | | | | 946,985 | | |
Caesars Entertainment Operating Co., Inc.(a)(b)
Senior Secured | |
| 02/15/20 | | | 8.500 | % | | | 528,000 | | | | 543,840 | | |
Chester Downs & Marina LLC
Senior Secured(a)(b) | |
| 02/01/20 | | | 9.250 | % | | | 402,000 | | | | 423,105 | | |
MGM Resorts International
Senior Secured | |
| 03/15/20 | | | 9.000 | % | | | 1,176,000 | | | | 1,314,180 | | |
| MGM Resorts International(b) | |
| 03/01/18 | | | 11.375 | % | | | 573,000 | | | | 682,586 | | |
Penn National Gaming, Inc.
Senior Subordinated Notes | |
| 08/15/19 | | | 8.750 | % | | | 535,000 | | | | 596,525 | | |
ROC Finance LLC/Corp.
Secured(a) | |
| 09/01/18 | | | 12.125 | % | | | 711,000 | | | | 796,320 | | |
| Issuer | | Coupon
Rate | | Principal
Amount | | Value | |
| Corporate Bonds & Notes (continued) | |
| Gaming (cont.) | |
| Seminole Indian Tribe of Florida(a) | |
| 10/01/20 | | | 7.804 | % | | $ | 470,000 | | | $ | 459,763 | | |
| Senior Secured | |
| 10/01/20 | | | 6.535 | % | | | 251,000 | | | | 255,488 | | |
| Seneca Gaming Corp.(a) | |
| 12/01/18 | | | 8.250 | % | | | 633,000 | | | | 647,243 | | |
Tunica-Biloxi Gaming Authority
Senior Unsecured(a) | |
| 11/15/15 | | | 9.000 | % | | | 203,000 | | | | 200,970 | | |
| Total | | | 7,360,730 | | |
| Gas Pipelines 9.4% | |
Centerpoint Energy Resources Corp.
Senior Unsecured | |
| 01/15/14 | | | 5.950 | % | | | 2,100,000 | | | | 2,248,426 | | |
| 11/01/17 | | | 6.125 | % | | | 7,966,000 | | | | 9,301,357 | | |
Colorado Interstate Gas Co. LLC
Senior Unsecured | |
| 11/15/15 | | | 6.800 | % | | | 980,000 | | | | 1,127,817 | | |
| Copano Energy LLC/Finance Corp. | |
| 04/01/21 | | | 7.125 | % | | | 130,000 | | | | 137,150 | | |
El Paso Corp.
Senior Unsecured | |
| 06/01/18 | | | 7.250 | % | | | 381,000 | | | | 432,435 | | |
| 09/15/20 | | | 6.500 | % | | | 2,049,000 | | | | 2,264,145 | | |
| 01/15/32 | | | 7.750 | % | | | 348,000 | | | | 397,623 | | |
| Enterprise Products Operating LLC | |
| 03/01/15 | | | 5.000 | % | | | 1,800,000 | | | | 1,982,810 | | |
| 06/01/15 | | | 3.700 | % | | | 10,389,000 | | | | 11,129,663 | | |
| 02/15/42 | | | 5.700 | % | | | 1,500,000 | | | | 1,659,384 | | |
Gulfstream Natural Gas System LLC
Senior Unsecured(a) | |
| 06/01/16 | | | 6.950 | % | | | 5,045,000 | | | | 5,854,606 | | |
Kinder Morgan Energy Partners LP
Senior Unsecured | |
| 09/01/22 | | | 3.950 | % | | | 6,575,000 | | | | 6,621,334 | | |
| 01/15/38 | | | 6.950 | % | | | 1,320,000 | | | | 1,557,258 | | |
| 09/01/39 | | | 6.500 | % | | | 1,695,000 | | | | 1,909,858 | | |
| MarkWest Energy Partners LP/Finance Corp. | |
| 06/15/22 | | | 6.250 | % | | | 764,000 | | | | 800,290 | | |
Midcontinent Express Pipeline LLC
Senior Unsecured(a) | |
| 09/15/14 | | | 5.450 | % | | | 9,295,000 | | | | 9,479,729 | | |
| Nisource Finance Corp. | |
| 09/15/20 | | | 5.450 | % | | | 9,030,000 | | | | 10,181,993 | | |
Northwest Pipeline GP
Senior Unsecured | |
| 04/15/17 | | | 5.950 | % | | | 8,479,000 | | | | 9,910,844 | | |
| 06/15/18 | | | 6.050 | % | | | 1,085,000 | | | | 1,294,642 | | |
| Plains All American Pipeline LP/Finance Corp. | |
| 05/01/18 | | | 6.500 | % | | | 2,130,000 | | | | 2,582,942 | | |
| Senior Unsecured | |
| 06/01/22 | | | 3.650 | % | | | 6,505,000 | | | | 6,539,216 | | |
| Regency Energy Partners LP/Finance Corp. | |
| 06/01/16 | | | 9.375 | % | | | 72,000 | | | | 78,840 | | |
| 12/01/18 | | | 6.875 | % | | | 622,000 | | | | 657,765 | | |
| 07/15/21 | | | 6.500 | % | | | 812,000 | | | | 860,720 | | |
The Accompanying Notes to Financial Statements are an integral part of this statement.
9
Columbia Corporate Income Fund
April 30, 2012
(Percentages represent value of investments compared to net assets)
| Issuer | | Coupon
Rate | | Principal
Amount | | Value | |
| Corporate Bonds & Notes (continued) | |
| Gas Pipelines (cont.) | |
Rockies Express Pipeline LLC
Senior Unsecured(a) | |
| 04/15/15 | | | 3.900 | % | | $ | 12,795,000 | | | $ | 12,219,225 | | |
Southern Natural Gas Co. LLC
Senior Unsecured(a) | |
| 04/01/17 | | | 5.900 | % | | | 16,345,000 | | | | 18,645,526 | | |
Southern Star Central Corp.
Senior Unsecured | |
| 03/01/16 | | | 6.750 | % | | | 65,000 | | | | 65,650 | | |
Southern Star Central Corp.(a)
Senior Unsecured | |
| 03/01/16 | | | 6.750 | % | | | 375,000 | | | | 384,375 | | |
Transcontinental Gas Pipe Line Co. LLC
Senior Unsecured | |
| 04/15/16 | | | 6.400 | % | | | 9,158,000 | | | | 10,733,872 | | |
| 08/15/41 | | | 5.400 | % | | | 1,085,000 | | | | 1,222,172 | | |
| Total | | | 132,281,667 | | |
| Health Care 3.2% | |
American Renal Associates Holdings, Inc.
Senior Unsecured PIK | |
| 03/01/16 | | | 9.750 | % | | | 66,409 | | | | 70,145 | | |
American Renal Holdings Co., Inc.
Senior Secured | |
| 05/15/18 | | | 8.375 | % | | | 875,000 | | | | 936,250 | | |
| Biomet, Inc. | |
| 10/15/17 | | | 10.000 | % | | | 266,000 | | | | 286,947 | | |
| CHS/Community Health Systems, Inc.(a)(b) | |
| 11/15/19 | | | 8.000 | % | | | 589,000 | | | | 621,395 | | |
| 11/15/19 | | | 8.000 | % | | | 292,000 | | | | 308,790 | | |
Cardinal Health, Inc.
Senior Unsecured | |
| 12/15/20 | | | 4.625 | % | | | 5,655,000 | | | | 6,341,189 | | |
ConvaTec Healthcare E SA
Senior Unsecured(a) | |
| 12/15/18 | | | 10.500 | % | | | 1,222,000 | | | | 1,249,495 | | |
| Emdeon, Inc.(a) | |
| 12/31/19 | | | 11.000 | % | | | 525,000 | | | | 593,250 | | |
| Express Scripts Holding Co. | |
| 05/15/16 | | | 3.125 | % | | | 11,000,000 | | | | 11,472,406 | | |
| Fresenius Medical Care U.S. Finance II, Inc.(a) | |
| 07/31/19 | | | 5.625 | % | | | 192,000 | | | | 195,360 | | |
| 01/31/22 | | | 5.875 | % | | | 248,000 | | | | 252,030 | | |
| Fresenius Medical Care U.S. Finance, Inc.(a) | |
| 09/15/18 | | | 6.500 | % | | | 716,000 | | | | 766,120 | | |
| HCA, Inc. | |
| 02/15/22 | | | 7.500 | % | | | 291,000 | | | | 313,189 | | |
| Senior Secured | |
| 02/15/20 | | | 6.500 | % | | | 1,171,000 | | | | 1,252,970 | | |
| 02/15/20 | | | 7.875 | % | | | 1,441,000 | | | | 1,599,510 | | |
| 09/15/20 | | | 7.250 | % | | | 1,062,000 | | | | 1,176,165 | | |
| Hanger Orthopedic Group, Inc. | |
| 11/15/18 | | | 7.125 | % | | | 662,000 | | | | 687,652 | | |
Health Management Associates, Inc.
Senior Unsecured(a) | |
| 01/15/20 | | | 7.375 | % | | | 419,000 | | | | 436,284 | | |
| Healthsouth Corp. | |
| 02/15/20 | | | 8.125 | % | | | 340,000 | | | | 371,450 | | |
| 09/15/22 | | | 7.750 | % | | | 32,000 | | | | 34,480 | | |
| Issuer | | Coupon
Rate | | Principal
Amount | | Value | |
| Corporate Bonds & Notes (continued) | |
| Health Care (cont.) | |
Hospira, Inc.
Senior Unsecured | |
| 05/15/15 | | | 6.400 | % | | $ | 8,065,000 | | | $ | 9,036,075 | | |
| IASIS Healthcare LLC/Capital Corp. | |
| 05/15/19 | | | 8.375 | % | | | 480,000 | | | | 472,200 | | |
| Kinetic Concepts, Inc./KCI U.S.A., Inc.(a) | |
| 11/01/19 | | | 12.500 | % | | | 463,000 | | | | 425,960 | | |
| Kinetic Concepts, Inc./KCI U.S.A., Inc.(a)(b) | |
| 11/01/18 | | | 10.500 | % | | | 584,000 | | | | 602,250 | | |
| LifePoint Hospitals, Inc. | |
| 10/01/20 | | | 6.625 | % | | | 90,000 | | | | 94,725 | | |
| Multiplan, Inc.(a) | |
| 09/01/18 | | | 9.875 | % | | | 1,164,000 | | | | 1,257,120 | | |
| Omnicare, Inc. | |
| 06/01/20 | | | 7.750 | % | | | 304,000 | | | | 335,920 | | |
| PSS World Medical, Inc.(a) | |
| 03/01/22 | | | 6.375 | % | | | 100,000 | | | | 102,500 | | |
Physio-Control International, Inc.
Senior Secured(a) | |
| 01/15/19 | | | 9.875 | % | | | 505,000 | | | | 536,562 | | |
Physiotherapy Associates Holdings, Inc.
Senior Unsecured(a) | |
| 05/01/19 | | | 11.875 | % | | | 174,000 | | | | 177,915 | | |
| Radnet Management, Inc. | |
| 04/01/18 | | | 10.375 | % | | | 220,000 | | | | 218,350 | | |
Rural/Metro Corp.
Senior Unsecured(a) | |
| 07/15/19 | | | 10.125 | % | | | 245,000 | | | | 230,300 | | |
STHI Holding Corp.
Secured(a) | |
| 03/15/18 | | | 8.000 | % | | | 243,000 | | | | 258,795 | | |
Tenet Healthcare Corp.
Senior Secured | |
| 07/01/19 | | | 8.875 | % | | | 170,000 | | | | 190,613 | | |
USPl Finance Corp.
Senior Unsecured(a) | |
| 04/01/20 | | | 9.000 | % | | | 362,000 | | | | 379,195 | | |
| Vanguard Health Holding Co. II LLC/Inc. | |
| 02/01/18 | | | 8.000 | % | | | 750,000 | | | | 764,062 | | |
| Vanguard Health Holding Co. II LLC/Inc.(a) | |
| 02/01/19 | | | 7.750 | % | | | 217,000 | | | | 219,170 | | |
| Vanguard Health Holding Co. II LLC/Inc.(b) | |
| 02/01/19 | | | 7.750 | % | | | 911,000 | | | | 914,416 | | |
| Total | | | 45,181,205 | | |
| Healthcare Insurance 0.4% | |
AMERIGROUP Corp.
Senior Unsecured | |
| 11/15/19 | | | 7.500 | % | | | 298,000 | | | | 324,820 | | |
WellPoint, Inc.
Senior Unsecured | |
| 06/15/37 | | | 6.375 | % | | | 3,750,000 | | | | 4,651,481 | | |
| Total | | | 4,976,301 | | |
| Home Construction 0.1% | |
| KB Home(b) | |
| 03/15/20 | | | 8.000 | % | | | 248,000 | | | | 242,110 | | |
Meritage Homes Corp.
Senior Unsecured(a) | |
| 04/01/22 | | | 7.000 | % | | | 248,000 | | | | 251,720 | | |
The Accompanying Notes to Financial Statements are an integral part of this statement.
10
Columbia Corporate Income Fund
April 30, 2012
(Percentages represent value of investments compared to net assets)
| Issuer | | Coupon
Rate | | Principal
Amount | | Value | |
| Corporate Bonds & Notes (continued) | |
| Home Construction (cont.) | |
Shea Homes LP/Funding Corp.
Senior Secured(a) | |
| 05/15/19 | | | 8.625 | % | | | 438,000 | | | | 456,615 | | |
Taylor Morrison Communities, Inc./Monarch
Senior Unsecured(a) | |
| 04/15/20 | | | 7.750 | % | | | 534,000 | | | | 550,020 | | |
| Total | | | 1,500,465 | | |
| Independent Energy 6.5% | |
Anadarko Petroleum Corp.
Senior Unsecured | |
| 09/15/16 | | | 5.950 | % | | | 17,510,000 | | | | 20,244,081 | | |
| Antero Resources Finance Corp. | |
| 12/01/17 | | | 9.375 | % | | | 35,000 | | | | 38,238 | | |
| Antero Resources Finance Corp.(a) | |
| 08/01/19 | | | 7.250 | % | | | 120,000 | | | | 123,600 | | |
Apache Corp.
Senior Unsecured(b) | |
| 04/15/43 | | | 4.750 | % | | | 5,740,000 | | | | 6,116,154 | | |
Berry Petroleum Co.
Senior Unsecured | |
| 11/01/20 | | | 6.750 | % | | | 235,000 | | | | 248,513 | | |
Canadian Oil Sands Ltd.
Senior Unsecured(a) | |
| 04/01/42 | | | 6.000 | % | | | 4,170,000 | | | | 4,404,834 | | |
| Carrizo Oil & Gas, Inc. | |
| 10/15/18 | | | 8.625 | % | | | 1,060,000 | | | | 1,123,600 | | |
| Chaparral Energy, Inc. | |
| 10/01/20 | | | 9.875 | % | | | 97,000 | | | | 108,883 | | |
| 09/01/21 | | | 8.250 | % | | | 954,000 | | | | 1,016,010 | | |
| Chaparral Energy, Inc.(a)(f) | |
| 11/15/22 | | | 7.625 | % | | | 521,000 | | | | 522,954 | | |
| Chesapeake Energy Corp.(b) | |
| 08/15/20 | | | 6.625 | % | | | 1,150,000 | | | | 1,121,250 | | |
| 11/15/20 | | | 6.875 | % | | | 480,000 | | | | 468,000 | | |
| 02/15/21 | | | 6.125 | % | | | 984,000 | | | | 929,880 | | |
| Cimarex Energy Co. | |
| 05/01/22 | | | 5.875 | % | | | 746,000 | | | | 772,110 | | |
| Concho Resources, Inc. | |
| 10/01/17 | | | 8.625 | % | | | 444,000 | | | | 486,180 | | |
| 01/15/21 | | | 7.000 | % | | | 1,594,000 | | | | 1,733,475 | | |
| 01/15/22 | | | 6.500 | % | | | 174,000 | | | | 183,570 | | |
| Continental Resources, Inc. | |
| 10/01/19 | | | 8.250 | % | | | 240,000 | | | | 268,800 | | |
| 10/01/20 | | | 7.375 | % | | | 382,000 | | | | 425,930 | | |
| 04/01/21 | | | 7.125 | % | | | 457,000 | | | | 508,984 | | |
| Continental Resources, Inc.(a) | |
| 09/15/22 | | | 5.000 | % | | | 897,000 | | | | 910,455 | | |
Encana Corp.
Senior Unsecured | |
| 08/15/37 | | | 6.625 | % | | | 350,000 | | | | 385,091 | | |
Encana Corp.(b)
Senior Unsecured | |
| 11/15/41 | | | 5.150 | % | | | 6,495,000 | | | | 6,156,630 | | |
Everest Acquisition LLC/Finance, Inc.(a)
Senior Secured | |
| 05/01/19 | | | 6.875 | % | | | 583,000 | | | | 612,150 | | |
| Issuer | | Coupon
Rate | | Principal
Amount | | Value | |
| Corporate Bonds & Notes (continued) | |
| Independent Energy (cont.) | |
Everest Acquisition LLC/Finance, Inc.(a)(b)
Senior Unsecured | |
| 05/01/20 | | | 9.375 | % | | $ | 719,000 | | | $ | 765,735 | | |
| Goodrich Petroleum Corp. | |
| 03/15/19 | | | 8.875 | % | | | 240,000 | | | | 232,200 | | |
Hilcorp Energy I LP/Finance Co.(a)
Senior Notes | |
| 02/15/20 | | | 8.000 | % | | | 425,000 | | | | 464,312 | | |
| 04/15/21 | | | 7.625 | % | | | 278,000 | | | | 300,240 | | |
| Kodiak Oil & Gas Corp.(a) | |
| 12/01/19 | | | 8.125 | % | | | 1,480,000 | | | | 1,568,800 | | |
| Laredo Petroleum, Inc. | |
| 02/15/19 | | | 9.500 | % | | | 1,289,000 | | | | 1,440,457 | | |
| Laredo Petroleum, Inc.(a) | |
| 05/01/22 | | | 7.375 | % | | | 352,000 | | | | 362,560 | | |
| MEG Energy Corp.(a) | |
| 03/15/21 | | | 6.500 | % | | | 975,000 | | | | 1,026,187 | | |
Nexen, Inc.
Senior Unsecured | |
| 05/15/37 | | | 6.400 | % | | | 5,830,000 | | | | 6,471,393 | | |
Noble Energy, Inc.
Senior Unsecured | |
| 12/15/21 | | | 4.150 | % | | | 4,220,000 | | | | 4,415,116 | | |
| Oasis Petroleum, Inc. | |
| 02/01/19 | | | 7.250 | % | | | 653,000 | | | | 692,180 | | |
| 11/01/21 | | | 6.500 | % | | | 834,000 | | | | 850,680 | | |
QEP Resources, Inc.
Senior Unsecured | |
| 03/01/21 | | | 6.875 | % | | | 255,000 | | | | 279,862 | | |
| 10/01/22 | | | 5.375 | % | | | 636,000 | | | | 636,000 | | |
| Range Resources Corp. | |
| 05/01/18 | | | 7.250 | % | | | 8,000 | | | | 8,500 | | |
| 05/15/19 | | | 8.000 | % | | | 105,000 | | | | 115,500 | | |
| 08/01/20 | | | 6.750 | % | | | 220,000 | | | | 238,700 | | |
| 06/01/21 | | | 5.750 | % | | | 705,000 | | | | 738,487 | | |
| 08/15/22 | | | 5.000 | % | | | 128,000 | | | | 127,680 | | |
SM Energy Co.
Senior Unsecured | |
| 11/15/21 | | | 6.500 | % | | | 294,000 | | | | 310,170 | | |
| Whiting Petroleum Corp. | |
| 10/01/18 | | | 6.500 | % | | | 35,000 | | | | 37,275 | | |
| Woodside Finance Ltd.(a) | |
| 11/15/13 | | | 5.000 | % | | | 13,555,000 | | | | 14,216,023 | | |
| 05/10/21 | | | 4.600 | % | | | 7,540,000 | | | | 7,958,591 | | |
| Total | | | 92,166,020 | | |
| Integrated Energy 1.9% | |
Cenovus Energy, Inc.
Senior Unsecured | |
| 11/15/39 | | | 6.750 | % | | | 1,000,000 | | | | 1,309,332 | | |
Hess Corp.
Senior Unsecured | |
| 02/15/41 | | | 5.600 | % | | | 3,500,000 | | | | 3,785,747 | | |
Marathon Petroleum Corp.
Senior Unsecured | |
| 03/01/41 | | | 6.500 | % | | | 3,750,000 | | | | 4,118,723 | | |
Petro-Canada
Senior Unsecured | |
| 05/15/18 | | | 6.050 | % | | | 12,320,000 | | | | 14,823,239 | | |
The Accompanying Notes to Financial Statements are an integral part of this statement.
11
Columbia Corporate Income Fund
April 30, 2012
(Percentages represent value of investments compared to net assets)
| Issuer | | Coupon
Rate | | Principal
Amount | | Value | |
| Corporate Bonds & Notes (continued) | |
| Integrated Energy (cont.) | |
| Phillips 66(a) | |
| 05/01/17 | | | 2.950 | % | | $ | 2,135,000 | | | $ | 2,190,770 | | |
| Total | | | 26,227,811 | | |
| Life Insurance 2.2% | |
Hartford Financial Services Group, Inc.
Senior Unsecured | |
| 04/15/22 | | | 5.125 | % | | | 5,940,000 | | | | 5,999,614 | | |
| Prudential Covered Trust 2012-1(a) | |
| 09/30/15 | | | 2.997 | % | | | 3,150,000 | | | | 3,193,788 | | |
Prudential Financial, Inc.
Senior Unsecured | |
| 07/15/13 | | | 4.500 | % | | | 1,580,000 | | | | 1,643,416 | | |
| 01/14/15 | | | 3.875 | % | | | 5,430,000 | | | | 5,728,471 | | |
| 06/13/15 | | | 4.750 | % | | | 1,075,000 | | | | 1,166,837 | | |
| 12/01/17 | | | 6.000 | % | | | 11,165,000 | | | | 13,129,616 | | |
| Total | | | 30,861,742 | | |
| Lodging —% | |
Wyndham Worldwide Corp.
Senior Unsecured | |
| 12/01/16 | | | 6.000 | % | | | 1,000 | | | | 1,122 | | |
| 03/01/20 | | | 7.375 | % | | | 395,000 | | | | 472,204 | | |
| Total | | | 473,326 | | |
| Media Cable 4.4% | |
| CCO Holdings LLC/Capital Corp. | |
| 01/15/19 | | | 7.000 | % | | | 220,000 | | | | 235,400 | | |
| 04/30/20 | | | 8.125 | % | | | 715,000 | | | | 799,013 | | |
| 01/31/22 | | | 6.625 | % | | | 1,047,000 | | | | 1,095,424 | | |
CSC Holdings LLC
Senior Unsecured | |
| 02/15/19 | | | 8.625 | % | | | 425,000 | | | | 482,375 | | |
CSC Holdings LLC(a)
Senior Unsecured | |
| 11/15/21 | | | 6.750 | % | | | 496,000 | | | | 514,600 | | |
Cablevision Systems Corp.
Senior Unsecured(b) | |
| 04/15/20 | | | 8.000 | % | | | 290,000 | | | | 313,200 | | |
| Comcast Corp. | |
| 02/15/18 | | | 5.875 | % | | | 3,000,000 | | | | 3,563,073 | | |
| 08/15/37 | | | 6.950 | % | | | 9,525,000 | | | | 12,109,828 | | |
| DIRECTV Holdings LLC / DIRECTV Financing Co., Inc.(a) | |
| 03/15/22 | | | 3.800 | % | | | 7,950,000 | | | | 7,914,034 | | |
| DIRECTV Holdings LLC/Financing Co., Inc. | |
| 08/15/40 | | | 6.000 | % | | | 2,000,000 | | | | 2,139,726 | | |
| DISH DBS Corp. | |
| 09/01/19 | | | 7.875 | % | | | 840,000 | | | | 972,300 | | |
| 06/01/21 | | | 6.750 | % | | | 1,049,000 | | | | 1,148,655 | | |
Nara Cable Funding Ltd.
Senior Secured(a) | |
| 12/01/18 | | | 8.875 | % | | | 554,000 | | | | 504,140 | | |
Quebecor Media, Inc.
Senior Unsecured | |
| 03/15/16 | | | 7.750 | % | | | 635,000 | | | | 653,256 | | |
| Time Warner Cable, Inc. | |
| 07/01/18 | | | 6.750 | % | | | 22,818,000 | | | | 27,854,549 | | |
UPCB Finance V Ltd.
Senior Secured(a) | |
| 11/15/21 | | | 7.250 | % | | | 436,000 | | | | 455,394 | | |
| Issuer | | Coupon
Rate | | Principal
Amount | | Value | |
| Corporate Bonds & Notes (continued) | |
| Media Cable (cont.) | |
UPCB Finance VI Ltd.
Senior Secured(a) | |
| 01/15/22 | | | 6.875 | % | | $ | 616,000 | | | $ | 633,002 | | |
| Videotron Ltee(a) | |
| 07/15/22 | | | 5.000 | % | | | 286,000 | | | | 285,285 | | |
| Virgin Media Finance PLC | |
| 08/15/16 | | | 9.500 | % | | | 224,000 | | | | 250,880 | | |
| Total | | | 61,924,134 | | |
| Media Non-Cable 4.2% | |
| AMC Networks, Inc.(a) | |
| 07/15/21 | | | 7.750 | % | | | 433,000 | | | | 483,878 | | |
| British Sky Broadcasting Group PLC(a) | |
| 02/15/18 | | | 6.100 | % | | | 5,045,000 | | | | 5,954,250 | | |
Clear Channel Communications, Inc.
Senior Secured | |
| 03/01/21 | | | 9.000 | % | | | 336,000 | | | | 304,080 | | |
| Clear Channel Worldwide Holdings, Inc. | |
| 12/15/17 | | | 9.250 | % | | | 896,000 | | | | 982,240 | | |
| Clear Channel Worldwide Holdings, Inc.(a) | |
| 03/15/20 | | | 7.625 | % | | | 208,000 | | | | 202,280 | | |
| 03/15/20 | | | 7.625 | % | | | 1,614,000 | | | | 1,597,860 | | |
Hughes Satellite Systems Corp.
Senior Secured | |
| 06/15/19 | | | 6.500 | % | | | 281,000 | | | | 300,670 | | |
| Hughes Satellite Systems Corp.(b) | |
| 06/15/21 | | | 7.625 | % | | | 720,000 | | | | 780,300 | | |
| Intelsat Jackson Holdings SA | |
| 04/01/19 | | | 7.250 | % | | | 355,000 | | | | 370,088 | | |
| Intelsat Jackson Holdings SA(a) | |
| 10/15/20 | | | 7.250 | % | | | 1,504,000 | | | | 1,567,920 | | |
Intelsat Luxembourg SA
PIK | |
| 02/04/17 | | | 11.500 | % | | | 710,000 | | | | 740,175 | | |
| Lamar Media Corp.(a) | |
| 02/01/22 | | | 5.875 | % | | | 494,000 | | | | 507,585 | | |
National CineMedia LLC
Senior Unsecured | |
| 07/15/21 | | | 7.875 | % | | | 511,000 | | | | 550,602 | | |
National CineMedia LLC(a)
Senior Secured | |
| 04/15/22 | | | 6.000 | % | | | 547,000 | | | | 556,572 | | |
| News America, Inc. | |
| 02/15/41 | | | 6.150 | % | | | 9,820,000 | | | | 11,269,982 | | |
| Nielsen Finance LLC/Co. | |
| 10/15/18 | | | 7.750 | % | | | 1,237,000 | | | | 1,366,885 | | |
| Reed Elsevier Capital, Inc. | |
| 01/15/14 | | | 7.750 | % | | | 9,140,000 | | | | 10,076,713 | | |
Salem Communications Corp.
Secured | |
| 12/15/16 | | | 9.625 | % | | | 656,000 | | | | 728,160 | | |
Sinclair Television Group, Inc.
Secured(a) | |
| 11/01/17 | | | 9.250 | % | | | 737,000 | | | | 819,912 | | |
| TCM Sub LLC(a) | |
| 01/15/15 | | | 3.550 | % | | | 10,270,000 | | | | 10,886,530 | | |
| Thomson Reuters Corp. | |
| 07/15/18 | | | 6.500 | % | | | 3,000,000 | | | | 3,704,328 | | |
The Accompanying Notes to Financial Statements are an integral part of this statement.
12
Columbia Corporate Income Fund
April 30, 2012
(Percentages represent value of investments compared to net assets)
| Issuer | | Coupon
Rate | | Principal
Amount | | Value | |
| Corporate Bonds & Notes (continued) | |
| Media Non-Cable (cont.) | |
Thomson Reuters Corp.(b)
Senior Unsecured | |
| 04/15/40 | | | 5.850 | % | | $ | 1,640,000 | | | $ | 1,854,273 | | |
| Univision Communications, Inc.(a) | |
| 05/15/21 | | | 8.500 | % | | | 485,000 | | | | 477,725 | | |
| Senior Secured | |
| 05/15/19 | | | 6.875 | % | | | 526,000 | | | | 531,917 | | |
| 11/01/20 | | | 7.875 | % | | | 870,000 | | | | 906,975 | | |
| XM Satellite Radio, Inc.(a) | |
| 11/01/18 | | | 7.625 | % | | | 1,329,000 | | | | 1,445,354 | | |
| Total | | | 58,967,254 | | |
| Metals 2.3% | |
| Alpha Natural Resources, Inc.(b) | |
| 06/01/19 | | | 6.000 | % | | | 734,000 | | | | 684,455 | | |
| 06/01/21 | | | 6.250 | % | | | 50,000 | | | | 46,625 | | |
ArcelorMittal
Senior Unsecured | |
| 02/25/17 | | | 4.500 | % | | | 19,845,000 | | | | 19,916,636 | | |
| Arch Coal, Inc.(a)(b) | |
| 06/15/19 | | | 7.000 | % | | | 276,000 | | | | 247,020 | | |
| 06/15/21 | | | 7.250 | % | | | 439,000 | | | | 391,808 | | |
| CONSOL Energy, Inc. | |
| 04/01/20 | | | 8.250 | % | | | 540,000 | | | | 567,000 | | |
| 03/01/21 | | | 6.375 | % | | | 240,000 | | | | 225,600 | | |
| CONSOL Energy, Inc.(b) | |
| 04/01/17 | | | 8.000 | % | | | 215,000 | | | | 226,825 | | |
Calcipar SA
Senior Secured(a) | |
| 05/01/18 | | | 6.875 | % | | | 819,000 | | | | 839,475 | | |
| FMG Resources August 2006 Proprietary Ltd.(a) | |
| 02/01/18 | | | 6.875 | % | | | 141,000 | | | | 144,878 | | |
| 11/01/19 | | | 8.250 | % | | | 1,199,000 | | | | 1,291,922 | | |
| FMG Resources August 2006 Proprietary Ltd.(a)(b) | |
| 02/01/16 | | | 6.375 | % | | | 811,000 | | | | 827,220 | | |
| Senior Unsecured | |
| 04/01/22 | | | 6.875 | % | | | 610,000 | | | | 619,150 | | |
JMC Steel Group
Senior Notes(a) | |
| 03/15/18 | | | 8.250 | % | | | 1,021,000 | | | | 1,056,735 | | |
| Novelis, Inc. | |
| 12/15/17 | | | 8.375 | % | | | 185,000 | | | | 199,800 | | |
| 12/15/20 | | | 8.750 | % | | | 198,000 | | | | 218,295 | | |
| Peabody Energy Corp.(a) | |
| 11/15/18 | | | 6.000 | % | | | 617,000 | | | | 626,255 | | |
| Peabody Energy Corp.(a)(b) | |
| 11/15/21 | | | 6.250 | % | | | 688,000 | | | | 696,600 | | |
Rain CII Carbon LLC/Corp.
Senior Secured(a) | |
| 12/01/18 | | | 8.000 | % | | | 521,000 | | | | 552,260 | | |
| Vale Overseas Ltd. | |
| 01/23/17 | | | 6.250 | % | | | 2,500,000 | | | | 2,879,980 | | |
| Total | | | 32,258,539 | | |
| Issuer | | Coupon
Rate | | Principal
Amount | | Value | |
| Corporate Bonds & Notes (continued) | |
| Non-Captive Consumer 0.2% | |
SLM Corp.
Senior Notes | |
| 01/25/16 | | | 6.250 | % | | $ | 233,000 | | | $ | 239,990 | | |
| Senior Unsecured | |
| 03/25/20 | | | 8.000 | % | | | 1,092,000 | | | | 1,160,250 | | |
| 01/25/22 | | | 7.250 | % | | | 388,000 | | | | 391,880 | | |
Springleaf Finance Corp.
Senior Unsecured | |
| 12/15/17 | | | 6.900 | % | | | 618,000 | | | | 502,125 | | |
| Total | | | 2,294,245 | | |
| Non-Captive Diversified 3.6% | |
| Ally Financial, Inc. | |
| 02/15/17 | | | 5.500 | % | | | 181,000 | | | | 184,988 | | |
| 12/01/17 | | | 6.250 | % | | | 265,000 | | | | 278,768 | | |
| 03/15/20 | | | 8.000 | % | | | 3,505,000 | | | | 4,015,065 | | |
| 09/15/20 | | | 7.500 | % | | | 220,000 | | | | 245,300 | | |
CIT Group, Inc.
Senior Unsecured | |
| 03/15/18 | | | 5.250 | % | | | 1,561,000 | | | | 1,607,830 | | |
| CIT Group, Inc.(a) | |
| 05/02/17 | | | 7.000 | % | | | 1,076,000 | | | | 1,078,690 | | |
| Senior Unsecured | |
| 02/15/19 | | | 5.500 | % | | | 1,688,000 | | | | 1,734,420 | | |
CIT Group, Inc.(a)(b)
Senior Secured | |
| 04/01/18 | | | 6.625 | % | | | 305,000 | | | | 329,400 | | |
Ford Motor Credit Co. LLC
Senior Unsecured | |
| 04/15/15 | | | 7.000 | % | | | 140,000 | | | | 156,100 | | |
| 02/01/21 | | | 5.750 | % | | | 4,419,000 | | | | 4,972,087 | | |
General Electric Capital Corp.
Senior Unsecured | |
| 10/17/21 | | | 4.650 | % | | | 30,430,000 | | | | 33,085,474 | | |
International Lease Finance Corp.
Senior Unsecured | |
| 09/01/17 | | | 8.875 | % | | | 595,000 | | | | 672,350 | | |
| 05/15/19 | | | 6.250 | % | | | 907,000 | | | | 915,949 | | |
International Lease Finance Corp.(b)
Senior Unsecured | |
| 12/15/20 | | | 8.250 | % | | | 1,210,000 | | | | 1,355,200 | | |
| 01/15/22 | | | 8.625 | % | | | 427,000 | | | | 488,441 | | |
| Total | | | 51,120,062 | | |
| Oil Field Services 1.3% | |
Atwood Oceanics, Inc.
Senior Unsecured | |
| 02/01/20 | | | 6.500 | % | | | 1,581,000 | | | | 1,664,002 | | |
Green Field Energy Services, Inc.
Senior Secured(a) | |
| 11/15/16 | | | 13.000 | % | | | 682,000 | | | | 668,360 | | |
| Noble Holding International Ltd. | |
| 03/15/22 | | | 3.950 | % | | | 4,100,000 | | | | 4,165,055 | | |
Offshore Group Investments Ltd.
Senior Secured | |
| 08/01/15 | | | 11.500 | % | | | 1,240,000 | | | | 1,356,250 | | |
Offshore Group Investments Ltd.(a)
Senior Secured | |
| 08/01/15 | | | 11.500 | % | | | 831,000 | | | | 908,906 | | |
The Accompanying Notes to Financial Statements are an integral part of this statement.
13
Columbia Corporate Income Fund
April 30, 2012
(Percentages represent value of investments compared to net assets)
| Issuer | | Coupon
Rate | | Principal
Amount | | Value | |
| Corporate Bonds & Notes (continued) | |
| Oil Field Services (cont.) | |
| Oil States International, Inc. | |
| 06/01/19 | | | 6.500 | % | | $ | 510,000 | | | $ | 539,325 | | |
| Weatherford International Ltd. | |
| 03/15/38 | | | 7.000 | % | | | 1,520,000 | | | | 1,733,844 | | |
| 04/15/42 | | | 5.950 | % | | | 7,290,000 | | | | 7,559,774 | | |
| Total | | | 18,595,516 | | |
| Other Industry —% | |
| Interline Brands, Inc. | |
| 11/15/18 | | | 7.000 | % | | | 309,000 | | | | 327,154 | | |
| Packaging 0.5% | |
Ardagh Packaging Finance PLC/MP Holdings U.S.A., Inc.
Senior Secured(a) | |
| 10/15/20 | | | 9.125 | % | | | 4,000 | | | | 4,250 | | |
Ardagh Packaging Finance PLC(a)
Senior Secured | |
| 10/15/17 | | | 7.375 | % | | | 550,000 | | | | 595,375 | | |
| Ardagh Packaging Finance PLC(a)(b) | |
| 10/15/20 | | | 9.125 | % | | | 505,000 | | | | 546,662 | | |
Berry Plastics Corp.
Secured(b) | |
| 01/15/21 | | | 9.750 | % | | | 470,000 | | | | 513,475 | | |
| Crown Americas LLC/Capital Corp. II | |
| 05/15/17 | | | 7.625 | % | | | 220,000 | | | | 238,700 | | |
| Crown Americas LLC/Capital Corp. III | |
| 02/01/21 | | | 6.250 | % | | | 100,000 | | | | 108,750 | | |
Greif, Inc.
Senior Unsecured | |
| 02/01/17 | | | 6.750 | % | | | 166,000 | | | | 179,280 | | |
| 08/01/19 | | | 7.750 | % | | | 275,000 | | | | 310,750 | | |
| Reynolds Group Issuer, Inc./LLC(a) | |
| 04/15/19 | | | 9.000 | % | | | 1,000 | | | | 1,005 | | |
| 02/15/21 | | | 8.250 | % | | | 1,274,000 | | | | 1,223,040 | | |
| Senior Secured | |
| 10/15/16 | | | 7.750 | % | | | 243,000 | | | | 257,580 | | |
| 04/15/19 | | | 7.125 | % | | | 316,000 | | | | 330,220 | | |
| 08/15/19 | | | 7.875 | % | | | 281,000 | | | | 303,480 | | |
| 02/15/21 | | | 6.875 | % | | | 1,746,000 | | | | 1,798,380 | | |
| Senior Unsecured | |
| 08/15/19 | | | 9.875 | % | | | 407,000 | | | | 424,298 | | |
| 08/15/19 | | | 9.875 | % | | | 92,000 | | | | 95,910 | | |
| Total | | | 6,931,155 | | |
| Paper 0.1% | |
| Cascades, Inc. | |
| 12/15/17 | | | 7.750 | % | | | 240,000 | | | | 237,600 | | |
| 01/15/20 | | | 7.875 | % | | | 205,000 | | | | 200,388 | | |
| Graphic Packaging International, Inc. | |
| 06/15/17 | | | 9.500 | % | | | 450,000 | | | | 499,500 | | |
| 10/01/18 | | | 7.875 | % | | | 56,000 | | | | 62,160 | | |
| Monaco SpinCo, Inc.(a)(f) | |
| 04/30/20 | | | 6.750 | % | | | 244,000 | | | | 251,320 | | |
| Total | | | 1,250,968 | | |
| Pharmaceuticals 0.2% | |
| Endo Pharmaceuticals Holdings, Inc. | |
| 01/15/22 | | | 7.250 | % | | | 159,000 | | | | 170,528 | | |
| Grifols, Inc. | |
| 02/01/18 | | | 8.250 | % | | | 926,000 | | | | 991,977 | | |
| Issuer | | Coupon
Rate | | Principal
Amount | | Value | |
| Corporate Bonds & Notes (continued) | |
| Pharmaceuticals (cont.) | |
| Mylan, Inc.(a) | |
| 11/15/18 | | | 6.000 | % | | $ | 660,000 | | | $ | 693,000 | | |
Pharmaceutical Product Development, Inc.
Senior Unsecured(a)(b) | |
| 12/01/19 | | | 9.500 | % | | | 206,000 | | | | 225,570 | | |
| Warner Chilcott Co. LLC/Finance | |
| 09/15/18 | | | 7.750 | % | | | 213,000 | | | | 232,703 | | |
| Total | | | 2,313,778 | | |
| Property & Casualty 1.0% | |
| Berkshire Hathaway Finance Corp. | |
| 01/15/40 | | | 5.750 | % | | | 2,200,000 | | | | 2,609,677 | | |
CNA Financial Corp.
Senior Unsecured | |
| 08/15/20 | | | 5.875 | % | | | 8,000,000 | | | | 8,744,328 | | |
| Liberty Mutual Group, Inc.(a) | |
| 06/01/21 | | | 5.000 | % | | | 3,000,000 | | | | 3,033,708 | | |
| Total | | | 14,387,713 | | |
| Railroads 3.5% | |
Burlington Northern Santa Fe LLC
Senior Unsecured | |
| 09/15/41 | | | 4.950 | % | | | 8,400,000 | | | | 8,881,992 | | |
CSX Corp.
Senior Unsecured | |
| 03/15/18 | | | 6.250 | % | | | 10,360,000 | | | | 12,542,220 | | |
Canadian Pacific Railway Co.
Senior Unsecured | |
| 05/15/18 | | | 6.500 | % | | | 7,220,000 | | | | 8,581,208 | | |
Canadian Pacific Railway
Senior Unsecured | |
| 05/15/37 | | | 5.950 | % | | | 760,000 | | | | 855,511 | | |
Norfolk Southern Corp.
Senior Unsecured | |
| 04/01/18 | | | 5.750 | % | | | 2,171,000 | | | | 2,595,826 | | |
| 04/01/22 | | | 3.000 | % | | | 6,140,000 | | | | 6,183,600 | | |
Norfolk Southern Corp.(a)
Senior Unsecured | |
| 10/01/41 | | | 4.837 | % | | | 5,000,000 | | | | 5,350,585 | | |
Union Pacific Corp.
Senior Unsecured | |
| 05/01/14 | | | 5.375 | % | | | 1,685,000 | | | | 1,833,294 | | |
| 09/15/41 | | | 4.750 | % | | | 2,500,000 | | | | 2,668,095 | | |
| Total | | | 49,492,331 | | |
| Refining 0.5% | |
| Valero Energy Corp. | |
| 02/01/15 | | | 4.500 | % | | | 4,800,000 | | | | 5,157,706 | | |
| 06/15/37 | | | 6.625 | % | | | 1,070,000 | | | | 1,157,724 | | |
| Total | | | 6,315,430 | | |
| Restaurants 1.3% | |
Yum! Brands, Inc.
Senior Unsecured | |
| 09/15/19 | | | 5.300 | % | | | 13,170,000 | | | | 15,004,212 | | |
| 11/01/21 | | | 3.750 | % | | | 2,555,000 | | | | 2,683,340 | | |
| Total | | | 17,687,552 | | |
| Retailers 1.4% | |
| 99 Cents Only Stores(a) | |
| 12/15/19 | | | 11.000 | % | | | 305,000 | | | | 330,163 | | |
The Accompanying Notes to Financial Statements are an integral part of this statement.
14
Columbia Corporate Income Fund
April 30, 2012
(Percentages represent value of investments compared to net assets)
| Issuer | | Coupon
Rate | | Principal
Amount | | Value | |
| Corporate Bonds & Notes (continued) | |
| Retailers (cont.) | |
| AutoNation, Inc. | |
| 02/01/20 | | | 5.500 | % | | $ | 249,000 | | | $ | 253,980 | | |
Best Buy Co., Inc.
Senior Unsecured(b) | |
| 03/15/21 | | | 5.500 | % | | | 1,230,000 | | | | 1,150,735 | | |
| Burlington Coat Factory Warehouse Corp.(b) | |
| 02/15/19 | | | 10.000 | % | | | 832,000 | | | | 890,240 | | |
CVS Caremark Corp.
Senior Unsecured | |
| 06/01/17 | | | 5.750 | % | | | 5,440,000 | | | | 6,428,617 | | |
| J Crew Group, Inc.(b) | |
| 03/01/19 | | | 8.125 | % | | | 254,000 | | | | 262,890 | | |
Jo-Ann Stores, Inc.
Senior Unsecured(a) | |
| 03/15/19 | | | 8.125 | % | | | 689,000 | | | | 689,000 | | |
| Limited Brands, Inc. | |
| 05/01/20 | | | 7.000 | % | | | 500,000 | | | | 555,000 | | |
| 04/01/21 | | | 6.625 | % | | | 175,000 | | | | 189,000 | | |
| 02/15/22 | | | 5.625 | % | | | 641,000 | | | | 645,006 | | |
Lowe's Cos, Inc.
Senior Unsecured | |
| 04/15/42 | | | 4.650 | % | | | 4,435,000 | | | | 4,492,828 | | |
| Michaels Stores, Inc. | |
| 11/01/16 | | | 11.375 | % | | | 65,000 | | | | 69,063 | | |
QVC, Inc.(a)
Senior Secured | |
| 04/15/17 | | | 7.125 | % | | | 55,000 | | | | 58,988 | | |
| 10/01/19 | | | 7.500 | % | | | 515,000 | | | | 569,075 | | |
| 10/15/20 | | | 7.375 | % | | | 725,000 | | | | 799,312 | | |
Rite Aid Corp.
Senior Unsecured | |
| 02/15/27 | | | 7.700 | % | | | 513,000 | | | | 451,440 | | |
| Rite Aid Corp.(a)(b) | |
| 03/15/20 | | | 9.250 | % | | | 766,000 | | | | 777,490 | | |
| Rite Aid Corp.(b) | |
| 06/15/17 | | | 9.500 | % | | | 570,000 | | | | 571,425 | | |
| Senior Secured | |
| 08/15/20 | | | 8.000 | % | | | 850,000 | | | | 983,875 | | |
| Sally Holdings LLC/Capital, Inc.(a) | |
| 11/15/19 | | | 6.875 | % | | | 198,000 | | | | 211,365 | | |
| Total | | | 20,379,492 | | |
| Supermarkets 1.0% | |
Kroger Co. (The)
Senior Unsecured | |
| 04/15/42 | | | 5.000 | % | | | 6,350,000 | | | | 6,341,027 | | |
Safeway, Inc.
Senior Unsecured | |
| 12/01/21 | | | 4.750 | % | | | 7,356,000 | | | | 7,358,553 | | |
| Total | | | 13,699,580 | | |
| Technology 1.9% | |
| Alliance Data Systems Corp.(a) | |
| 04/01/20 | | | 6.375 | % | | | 283,000 | | | | 287,599 | | |
Amkor Technology, Inc.
Senior Unsecured | |
| 06/01/21 | | | 6.625 | % | | | 816,000 | | | | 836,400 | | |
Amkor Technology, Inc.(b)
Senior Unsecured | |
| 05/01/18 | | | 7.375 | % | | | 518,000 | | | | 554,260 | | |
| Issuer | | Coupon
Rate | | Principal
Amount | | Value | |
| Corporate Bonds & Notes (continued) | |
| Technology (cont.) | |
| Anixter, Inc. | |
| 05/01/19 | | | 5.625 | % | | $ | 166,000 | | | $ | 169,735 | | |
Brocade Communications Systems, Inc.
Senior Secured | |
| 01/15/18 | | | 6.625 | % | | | 382,000 | | | | 401,100 | | |
| 01/15/20 | | | 6.875 | % | | | 175,000 | | | | 191,188 | | |
| CDW LLC / Finance Corp. | |
| 04/01/19 | | | 8.500 | % | | | 931,000 | | | | 996,170 | | |
| Senior Secured | |
| 12/15/18 | | | 8.000 | % | | | 627,000 | | | | 683,430 | | |
| CDW LLC/Finance Corp.(a) | |
| 04/01/19 | | | 8.500 | % | | | 285,000 | | | | 304,594 | | |
| Cardtronics, Inc. | |
| 09/01/18 | | | 8.250 | % | | | 620,000 | | | | 685,100 | | |
| CommScope, Inc.(a)(b) | |
| 01/15/19 | | | 8.250 | % | | | 355,000 | | | | 378,963 | | |
Corning, Inc.
Senior Unsecured | |
| 03/15/42 | | | 4.750 | % | | | 4,170,000 | | | | 4,163,595 | | |
Equinix, Inc.
Senior Unsecured | |
| 07/15/21 | | | 7.000 | % | | | 377,000 | | | | 411,872 | | |
| First Data Corp. | |
| 01/15/21 | | | 12.625 | % | | | 1,219,000 | | | | 1,222,047 | | |
| PIK | |
| 09/24/15 | | | 10.550 | % | | | 401,000 | | | | 408,018 | | |
First Data Corp.(a)
Senior Secured | |
| 08/15/20 | | | 8.875 | % | | | 520,000 | | | | 565,500 | | |
First Data Corp.(a)(b)
Senior Secured | |
| 06/15/19 | | | 7.375 | % | | | 1,169,000 | | | | 1,201,147 | | |
Freescale Semiconductor, Inc.(a)
Senior Secured | |
| 04/15/18 | | | 9.250 | % | | | 1,042,000 | | | | 1,142,292 | | |
| Freescale Semiconductor, Inc.(b) | |
| 08/01/20 | | | 10.750 | % | | | 200,000 | | | | 222,000 | | |
Hewlett-Packard Co.
Senior Unsecured | |
| 09/15/17 | | | 2.600 | % | | | 10,210,000 | | | | 10,224,570 | | |
| Interactive Data Corp. | |
| 08/01/18 | | | 10.250 | % | | | 735,000 | | | | 830,550 | | |
NXP BV/Funding LLC
Senior Secured(a) | |
| 08/01/18 | | | 9.750 | % | | | 1,353,000 | | | | 1,535,655 | | |
| Total | | | 27,415,785 | | |
| Textile —% | |
Levi Strauss & Co.
Senior Unsecured(a)(f) | |
| 05/01/22 | | | 6.875 | % | | | 61,000 | | | | 62,525 | | |
| Transportation Services 0.8% | |
| Avis Budget Car Rental LLC/Finance, Inc. | |
| 01/15/19 | | | 8.250 | % | | | 189,000 | | | | 197,977 | | |
| 03/15/20 | | | 9.750 | % | | | 562,000 | | | | 618,200 | | |
| ERAC U.S.A. Finance LLC(a) | |
| 10/15/17 | | | 6.375 | % | | | 6,117,000 | | | | 7,154,820 | | |
| 10/15/37 | | | 7.000 | % | | | 2,240,000 | | | | 2,608,798 | | |
The Accompanying Notes to Financial Statements are an integral part of this statement.
15
Columbia Corporate Income Fund
April 30, 2012
(Percentages represent value of investments compared to net assets)
| Issuer | | Coupon
Rate | | Principal
Amount | | Value | |
| Corporate Bonds & Notes (continued) | |
| Transportation Services (cont.) | |
| Hertz Corp. (The) | |
| 10/15/18 | | | 7.500 | % | | $ | 780,000 | | | $ | 836,550 | | |
| 01/15/21 | | | 7.375 | % | | | 244,000 | | | | 262,300 | | |
| Total | | | 11,678,645 | | |
| Wireless 1.3% | |
CC Holdings GS V LLC/Crown Castle GS III Corp.
Senior Secured(a) | |
| 05/01/17 | | | 7.750 | % | | | 315,000 | | | | 343,350 | | |
Cricket Communications, Inc.
Senior Secured | |
| 05/15/16 | | | 7.750 | % | | | 956,000 | | | | 1,006,190 | | |
| Cricket Communications, Inc.(b) | |
| 10/15/20 | | | 7.750 | % | | | 541,000 | | | | 507,187 | | |
Crown Castle International Corp.
Senior Unsecured | |
| 01/15/15 | | | 9.000 | % | | | 310,000 | | | | 342,550 | | |
| MetroPCS Wireless, Inc. | |
| 11/15/20 | | | 6.625 | % | | | 49,000 | | | | 47,163 | | |
| MetroPCS Wireless, Inc.(b) | |
| 09/01/18 | | | 7.875 | % | | | 760,000 | | | | 780,900 | | |
| NII Capital Corp. | |
| 08/15/16 | | | 10.000 | % | | | 210,000 | | | | 235,200 | | |
| 04/01/21 | | | 7.625 | % | | | 172,000 | | | | 159,960 | | |
| Nextel Communications, Inc.(b) | |
| 08/01/15 | | | 7.375 | % | | | 117,000 | | | | 113,490 | | |
| SBA Telecommunications, Inc. | |
| 08/15/19 | | | 8.250 | % | | | 582,000 | | | | 641,655 | | |
| Sprint Capital Corp. | |
| 11/15/28 | | | 6.875 | % | | | 285,000 | | | | 213,037 | | |
Sprint Nextel Corp.
Senior Unsecured | |
| 08/15/17 | | | 8.375 | % | | | 868,000 | | | | 835,450 | | |
| Sprint Nextel Corp.(a) | |
| 11/15/18 | | | 9.000 | % | | | 2,540,000 | | | | 2,800,350 | | |
| 03/01/20 | | | 7.000 | % | | | 310,000 | | | | 316,200 | | |
Sprint Nextel Corp.(a)(b)
Senior Unsecured | |
| 03/01/17 | | | 9.125 | % | | | 7,000 | | | | 6,948 | | |
| 11/15/21 | | | 11.500 | % | | | 496,000 | | | | 528,240 | | |
United States Cellular Corp.
Senior Unsecured | |
| 12/15/33 | | | 6.700 | % | | | 8,000,000 | | | | 7,963,952 | | |
Wind Acquisition Finance SA
Senior Secured(a) | |
| 02/15/18 | | | 7.250 | % | | | 1,788,000 | | | | 1,694,130 | | |
| Total | | | 18,535,952 | | |
| Wirelines 5.4% | |
AT&T, Inc.
Senior Unsecured | |
| 02/15/39 | | | 6.550 | % | | | 3,320,000 | | | | 4,115,190 | | |
| 09/01/40 | | | 5.350 | % | | | 4,000,000 | | | | 4,371,988 | | |
| 08/15/41 | | | 5.550 | % | | | 4,530,000 | | | | 5,171,086 | | |
CenturyLink, Inc.
Senior Unsecured | |
| 03/15/22 | | | 5.800 | % | | | 3,067,000 | | | | 3,040,636 | | |
| Deutsche Telekom International Finance BV(a) | |
| 04/11/16 | | | 3.125 | % | | | 7,224,000 | | | | 7,485,538 | | |
| Issuer | | Coupon
Rate | | Principal
Amount | | Value | |
| Corporate Bonds & Notes (continued) | |
| Wirelines (cont.) | |
Embarq Corp.
Senior Unsecured | |
| 06/01/36 | | | 7.995 | % | | $ | 10,165,000 | | | $ | 10,202,915 | | |
Frontier Communications Corp.(b)
Senior Unsecured | |
| 04/15/20 | | | 8.500 | % | | | 497,000 | | | | 516,880 | | |
| 04/15/22 | | | 8.750 | % | | | 577,000 | | | | 605,850 | | |
Integra Telecom Holdings, Inc.
Senior Secured(a) | |
| 04/15/16 | | | 10.750 | % | | | 98,000 | | | | 93,345 | | |
Level 3 Communications, Inc.
Senior Unsecured | |
| 02/01/19 | | | 11.875 | % | | | 681,000 | | | | 772,935 | | |
| Level 3 Financing, Inc. | |
| 02/15/17 | | | 8.750 | % | | | 148,000 | | | | 153,920 | | |
| 02/01/18 | | | 10.000 | % | | | 229,000 | | | | 250,755 | | |
| 04/01/19 | | | 9.375 | % | | | 1,103,000 | | | | 1,202,270 | | |
Level 3 Financing, Inc.(a)
Senior Unsecured | |
| 07/01/19 | | | 8.125 | % | | | 233,000 | | | | 239,408 | | |
| PAETEC Holding Corp. | |
| 12/01/18 | | | 9.875 | % | | | 790,000 | | | | 894,675 | | |
| Senior Secured | |
| 06/30/17 | | | 8.875 | % | | | 435,000 | | | | 475,237 | | |
| Telecom Italia Capital SA | |
| 07/18/36 | | | 7.200 | % | | | 3,140,000 | | | | 2,877,025 | | |
| Telefonica Emisiones SAU | |
| 01/15/15 | | | 4.949 | % | | | 7,980,000 | | | | 8,003,605 | | |
| Tw telecom holdings, inc. | |
| 03/01/18 | | | 8.000 | % | | | 347,000 | | | | 379,965 | | |
Verizon Communications, Inc.
Senior Unsecured | |
| 04/15/18 | | | 6.100 | % | | | 11,471,000 | | | | 13,930,944 | | |
Verizon New York, Inc.
Senior Unsecured | |
| 04/01/32 | | | 7.375 | % | | | 8,445,000 | | | | 10,394,140 | | |
| Windstream Corp. | |
| 09/01/18 | | | 8.125 | % | | | 290,000 | | | | 311,750 | | |
| 10/15/20 | | | 7.750 | % | | | 700,000 | | | | 749,000 | | |
| Total | | | 76,239,057 | | |
Total Corporate Bonds & Notes
(Cost: $1,307,277,551) | | $ | 1,346,485,600 | | |
| Residential Mortgage-Backed Securities – Agency —% | |
| Government National Mortgage Association(i) | |
| 01/15/19 | | | 10.000 | % | | | 201 | | | | 230 | | |
Total Residential Mortgage-Backed Securities – Agency
(Cost: $202) | | $ | 230 | | |
The Accompanying Notes to Financial Statements are an integral part of this statement.
16
Columbia Corporate Income Fund
April 30, 2012
(Percentages represent value of investments compared to net assets)
| Issuer | | Coupon
Rate | | Principal
Amount | | Value | |
| U.S. Treasury Obligations 1.9% | |
| U.S. Treasury | |
| 02/15/22 | | | 2.000 | % | | $ | 1,435,000 | | | $ | 1,445,763 | | |
| U.S. Treasury(b) | |
| 03/31/17 | | | 1.000 | % | | | 25,255,000 | | | | 25,507,550 | | |
Total U.S. Treasury Obligations
(Cost: $26,798,644) | | $ | 26,953,313 | | |
| Borrower | | Weighted
Average
Coupon | | Principal
Amount | | Value | |
| Senior Loans 0.3% | |
| Automotive —% | |
Schaeffler AG
Tranche C2 Term Loan(c)(f)(j) | |
| 01/27/17 | | | 6.000 | % | | $ | 254,000 | | | $ | 254,815 | | |
| Brokerage 0.1% | |
Nuveen Investments, Inc.
2nd Lien Term Loan(c)(j) | |
| 02/28/19 | | | 8.250 | % | | | 579,000 | | | | 590,580 | | |
| Gaming —% | |
Caesars Octavius LLC
Tranche B Term Loan(c)(j) | |
| 04/25/17 | | | 9.250 | % | | | 237,000 | | | | 234,630 | | |
ROC Finance LLC
Tranche B Term Loan(c)(j) | |
| 08/19/17 | | | 8.500 | % | | | 158,000 | | | | 158,921 | | |
| Total | | | 393,551 | | |
| Media Non-Cable 0.1% | |
Cumulus Media Holdings, Inc.
2nd Lien Term Loan(c)(j) | |
| 03/18/19 | | | 7.500 | % | | | 1,568,000 | | | | 1,592,304 | | |
| Property & Casualty 0.1% | |
Lonestar Intermediate Super Holdings LLC(c)(f)(j)
Term Loan | |
| 09/02/19 | | | 11.000 | % | | | 275,000 | | | | 282,103 | | |
Lonestar Intermediate Super Holdings LLC(c)(j)
Term Loan | |
| 09/02/19 | | | 11.000 | % | | | 832,000 | | | | 853,491 | | |
| Total | | | 1,135,594 | | |
Total Senior Loans
(Cost: $3,794,457) | | $ | 3,966,844 | | |
| Issuer | | Shares | | Value | |
| Common Stocks —% | |
| FINANCIALS —% | |
| Thrifts & Mortgage Finance —% | |
| Washington Funding Trust LII D Escrow(g)(h)(k) | | | 1,075 | | | $ | — | | |
| WMI Holdings Corp. (b)(k) | | | 21,286 | | | | 12,399 | | |
| Total | | | 12,399 | | |
| TOTAL FINANCIALS | | | 12,399 | | |
Total Common Stocks
(Cost: $1,077,709) | | $ | 12,399 | | |
| Issuer | | Shares | | Value | |
| Warrants —% | |
| ENERGY —% | |
| Energy Equipment & Services —% | |
| Green Field Energy Services, Inc.(k) | | | 682 | | | $ | 41,602 | | |
| TOTAL ENERGY | | | 41,602 | | |
| INFORMATION TECHNOLOGY —% | |
| Communications Equipment —% | |
| CMP Susquehanna Corp.(a)(d)(h)(k) | | | 8,101 | | | | 81 | | |
| TOTAL INFORMATION TECHNOLOGY | | | 81 | | |
Total Warrants
(Cost: $26,821) | | $ | 41,683 | | |
| | | Shares | | Value | |
| Money Market Funds 1.4% | |
Columbia Short-Term Cash Fund,
0.144%(l)(m) | | | 19,869,151 | | | $ | 19,869,151 | | |
Total Money Market Funds
(Cost: $19,869,151) | | $ | 19,869,151 | | |
| Issuer | | Effective
Yield | | Par/
Principal/
Shares | | Value | |
Investments of Cash Collateral Received for Securities
on Loan 4.0% | |
| Certificates of Deposit 0.5% | |
| Banque et Caisse d'Epargne de l'Etat | |
| 06/15/12 | | | 0.430 | % | | | 998,902 | | | $ | 998,902 | | |
| Landeskreditbank Baden-Wuerttemberg – Foerderbank | |
| 05/31/12 | | | 0.190 | % | | | 2,000,000 | | | | 2,000,000 | | |
| Mizuho Corporate Bank Ltd. | |
| 06/01/12 | | | 0.370 | % | | | 2,000,000 | | | | 2,000,000 | | |
| Natixis | |
| 05/01/12 | | | 0.240 | % | | | 2,000,000 | | | | 2,000,000 | | |
| Total | | | 6,998,902 | | |
| Repurchase Agreements 3.5% | |
Citibank NA
dated 04/30/12, matures 05/01/12,
repurchase price $5,000,028(n)
| | | 0.200 | % | | $ | 5,000,000 | | | | 5,000,000 | | |
Citigroup Global Markets, Inc.
dated 04/30/12, matures 05/01/12,
repurchase price $5,000,029(n)
| | | 0.210 | % | | | 5,000,000 | | | | 5,000,000 | | |
Mizuho Securities USA, Inc.
dated 04/30/12, matures 05/01/12,
repurchase price $10,000,067(n)
| | | 0.240 | % | | | 10,000,000 | | | | 10,000,000 | | |
Natixis Financial Products, Inc.
dated 04/30/12, matures 05/01/12,
repurchase price $12,000,080(n)
| | | 0.240 | % | | | 12,000,000 | | | | 12,000,000 | | |
Pershing LLC
dated 04/30/12, matures 05/01/12,
repurchase price $4,000,037(n)
| | | 0.330 | % | | | 4,000,000 | | | | 4,000,000 | | |
The Accompanying Notes to Financial Statements are an integral part of this statement.
17
Columbia Corporate Income Fund
April 30, 2012
(Percentages represent value of investments compared to net assets)
| Issuer | | Coupon
Rate | | Principal
Amount | | Value | |
Investments of Cash Collateral Received for Securities
on Loan (continued) | |
| Repurchase Agreements (cont.) | |
Societe Generale
dated 04/30/12, matures 05/01/12,
repurchase price $12,677,952(n)
| | | 0.210 | % | | $ | 12,677,878 | | | $ | 12,677,878 | | |
| Total | | | 48,677,878 | | |
Total Investments of Cash Collateral Received for Securities
on Loan
(Cost: $55,676,780) | | $55,676,780 | |
Total Investments
(Cost: $1,414,521,315) | | | | | | $ | 1,453,006,000 | | |
| Other Assets & Liabilities, Net | | | | | | | (45,185,082 | ) | |
| Net Assets | | $ | 1,407,820,918 | | |
| Investments in Derivatives | |
At April 30, 2012, $327,300 was held in a margin deposit account as collateral to cover initial margin requirements on open futures contracts.
Futures Contracts Outstanding at April 30, 2012
| Contract Description | | Number of
Contracts
Long (Short) | | Notional
Market Value | | Expiration
Date | | Unrealized
Appreciation | | Unrealized
Depreciation | |
| U.S. Treasury Long Bond, 20-year | | | 250 | | | $ | 35,718,750 | | | June 2012 | | $ | 401,968 | | | $ | — | | |
| U.S. Treasury Note, 5-year | | | 150 | | | | 18,569,532 | | | June 2012 | | | 73,603 | | | | — | | |
| U.S. Treasury Note, 10-year | | | (710 | ) | | | (93,919,688 | ) | | June 2012 | | | — | | | | (1,165,065 | ) | |
| U.S. Treasury Ultra Bond, 30-year | | | 18 | | | | 2,840,625 | | | June 2012 | | | 50,879 | | | | — | | |
| Total | | | | | | | | $ | 526,450 | | | $ | (1,165,065 | ) | |
| Notes to Portfolio of Investments | |
(a) Security exempt from registration pursuant to Rule 144A under the Securities Act of 1933. This security may be resold in transactions exempt from registration, normally to qualified institutional buyers. At April 30, 2012, the value of these securities amounted to $245,566,510 or 17.44% of net assets.
(b) At April 30, 2012, security was partially or fully on loan.
(c) Variable rate security. The interest rate shown reflects the rate as of April 30, 2012.
(d) Identifies issues considered to be illiquid as to their marketability. The aggregate value of such securities at April 30, 2012 was $9,606, representing less than 0.01% of net assets. Information concerning such security holdings at April 30, 2012 was as follows:
| Security Description | | Acquisition
Dates | | Cost | |
| CMP Susquehanna Corp. | | 03/26/09 | | $ | 81 | | |
Six Flags, Inc.
06/01/14 9.625% | | 05/07/10 | | | — | | |
Washington Mutual Bank
Subordinated Notes
01/15/15 5.125% | | 03/10/2006–05/14/2008 | | | 5,688,448 | | |
(e) Represents securities that have defaulted on payment of interest. The Fund has stopped accruing interest on these securities. At April 30, 2012, the value of these securities amounted to $9,525, which represents less than 0.01% of net assets.
(f) Represents a security purchased on a when-issued or delayed delivery basis.
(g) Negligible market value.
The Accompanying Notes to Financial Statements are an integral part of this statement.
18
Columbia Corporate Income Fund
April 30, 2012
| Notes to Portfolio of Investments (continued) | |
(h) Represents fair value as determined in good faith under procedures approved by the Board of Trustees. At April 30, 2012, the value of these securities amounted to $9,606, which represents less than 0.01% of net assets.
(i) The maturity dates shown represent the original maturity of the underlying obligation. Actual maturity may vary based upon prepayment activity on these obligations. Unless otherwise noted, the coupon rates presented are fixed rates.
(j) Senior loans have rates of interest that float periodically based primarily on the London Interbank Offered Rate ("LIBOR") and other short-term rates. The interest rate shown reflects the weighted average coupon as of April 30, 2012. The interest rate shown for senior loans purchased on a when-issued or delayed delivery basis, if any, reflects an estimated average coupon. Remaining maturities of senior loans may be less than the stated maturities shown as a result of contractual or optional prepayments by the borrower. Such prepayments cannot be predicted with certainty.
(k) Non-income producing.
(l) The rate shown is the seven-day current annualized yield at April 30, 2012.
(m) Investments in affiliates during the period ended April 30, 2012:
| Issuer | | Beginning
Cost | | Purchase
Cost | | Sales Cost/
Proceeds
from Sales | | Realized
Gain/Loss | | Ending
Cost | | Dividends
or Interest
Income | | Value | |
Columbia Short-Term
Cash Fund | | $ | 76,372,307 | | | $ | 30,304,565 | | | $ | (86,807,721 | ) | | $ | — | | | $ | 19,869,151 | | | $ | 4,715 | | | $ | 19,869,151 | | |
Investments in affiliates during the year ended March 31, 2012:
| Issuer | | Beginning
Cost | | Purchase
Cost | | Sales Cost/
Proceeds
from Sales | | Realized
Gain/Loss | | Ending
Cost | | Dividends
or Interest
Income | | Value | |
Columbia Short-Term
Cash Fund | | $ | — | | | $ | 815,820,575 | | | $ | (739,448,268 | ) | | $ | — | | | $ | 76,372,307 | | | $ | 38,672 | | | $ | 76,372,307 | | |
(n) The table below represents securities received as collateral for repurchase agreements. This collateral is deposited with the Fund's custodian and, pursuant to the terms of the repurchase agreement, must have an aggregate market value greater than or equal to the repurchase price plus accrued interest at all times. The value of securities and/or cash held as collateral for repurchase agreements is monitored on a daily basis to ensure the proper level of collateral.
Citibank NA (0.200%)
| Security Description | | Value | |
| Fannie Mae REMICS | | $ | 2,640,148 | | |
| Freddie Mac REMICS | | | 2,271,587 | | |
| Government National Mortgage Association | | | 188,265 | | |
| Total Market Value of Collateral Securities | | $ | 5,100,000 | | |
Citigroup Global Markets, Inc. (0.210%)
| Security Description | | Value | |
| Fannie Mae REMICS | | $ | 1,832,624 | | |
| Fannie Mae-Aces | | | 344,487 | | |
| Freddie Mac REMICS | | | 1,795,352 | | |
| Government National Mortgage Association | | | 1,127,537 | | |
| Total Market Value of Collateral Securities | | $ | 5,100,000 | | |
Mizuho Securities USA, Inc. (0.240%)
| Security Description | | Value | |
| Fannie Mae REMICS | | $ | 5,060,489 | | |
| Freddie Mac REMICS | | | 5,139,511 | | |
| Total Market Value of Collateral Securities | | $ | 10,200,000 | | |
The Accompanying Notes to Financial Statements are an integral part of this statement.
19
Columbia Corporate Income Fund
April 30, 2012
| Notes to Portfolio of Investments (continued) | |
Natixis Financial Products, Inc. (0.240%)
| Security Description | | Value | |
| Fannie Mae Pool | | $ | 424,080 | | |
| Fannie Mae REMICS | | | 3,147,844 | | |
| Fannie Mae Whole Loan | | | 98,895 | | |
| Freddie Mac Gold Pool | | | 888,259 | | |
| Freddie Mac Non Gold Pool | | | 229,794 | | |
| Freddie Mac REMICS | | | 2,749,519 | | |
| Government National Mortgage Association | | | 1,959,677 | | |
| United States Treasury Note/Bond | | | 2,742,014 | | |
| Total Market Value of Collateral Securities | | $ | 12,240,082 | | |
Pershing LLC (0.330%)
| Security Description | | Value | |
| Fannie Mae Pool | | $ | 829,994 | | |
| Fannie Mae REMICS | | | 217,239 | | |
| Fannie Mae-Aces | | | 23,840 | | |
| Federal Farm Credit Bank | | | 150,688 | | |
| Federal Home Loan Banks | | | 39,404 | | |
| Federal Home Loan Mortgage Corp | | | 32,224 | | |
| Federal National Mortgage Association | | | 45,639 | | |
| Freddie Mac Coupon Strips | | | 31,482 | | |
| Freddie Mac Gold Pool | | | 320,566 | | |
| Freddie Mac Non Gold Pool | | | 120,863 | | |
| Freddie Mac Reference REMIC | | | 38,436 | | |
| Freddie Mac REMICS | | | 250,152 | | |
| Ginnie Mae I Pool | | | 412,692 | | |
| Ginnie Mae II Pool | | | 1,152,062 | | |
| Government National Mortgage Association | | | 136,896 | | |
| United States Treasury Note/Bond | | | 277,823 | | |
| Total Market Value of Collateral Securities | | $ | 4,080,000 | | |
Societe Generale (0.210%)
| Security Description | | Value | |
| Fannie Mae Pool | | $ | 8,811,093 | | |
| Freddie Mac Gold Pool | | | 4,120,342 | | |
| Total Market Value of Collateral Securities | | $ | 12,931,435 | | |
| Abbreviation Legend | |
PIK Payment-in-Kind
Generally accepted accounting principles (GAAP) require disclosure regarding the inputs and valuation techniques used to measure fair value and any changes in valuation inputs or techniques. In addition, investments shall be disclosed by major category.
The Fund categorizes its fair value measurements according to a three-level hierarchy that maximizes the use of observable inputs and minimizes the use of unobservable inputs by prioritizing that the most observable input be used when available. Observable inputs are those that market participants would use in pricing an investment based on market data obtained from sources independent of the reporting entity. Unobservable inputs are those that reflect the Fund's assumptions about the information market participants would use in pricing an investment. An investment's level within the fair value hierarchy is based on the lowest level of any input that is deemed significant to the asset or liability's fair value measurement. The input levels are not necessarily an indication of the risk or liquidity associated with investments at that level. For example, certain U.S. government securities are generally high quality and liquid, however, they are reflected as Level 2 because the inputs used to determine fair value may not always be quoted prices in an active market.
The Accompanying Notes to Financial Statements are an integral part of this statement.
20
Columbia Corporate Income Fund
April 30, 2012
| Fair Value Measurements (continued) | |
Fair value inputs are summarized in the three broad levels listed below:
• Level 1 — Valuations based on quoted prices for investments in active markets that the Fund has the ability to access at the measurement date (including NAV for open-end mutual funds). Valuation adjustments are not applied to Level 1 investments.
• Level 2 — Valuations based on other significant observable inputs (including quoted prices for similar securities, interest rates, prepayment speeds, credit risks, etc.).
• Level 3 — Valuations based on significant unobservable inputs (including the Fund's own assumptions and judgment in determining the fair value of investments).
Inputs that are used in determining fair value of an investment may include price information, credit data, volatility statistics, and other factors. These inputs can be either observable or unobservable. The availability of observable inputs can vary between investments, and is affected by various factors such as the type of investment, and the volume and level of activity for that investment or similar investments in the marketplace. The inputs will be considered by the Investment Manager, along with any other relevant factors in the calculation of an investment's fair value. The Fund uses prices and inputs that are current as of the measurement date, which may include periods of market dislocations. During these periods, the availability of prices and inputs may be reduced for many investments. This condition could cause an investment to be reclassified between the various levels within the hierarchy.
Investments falling into the Level 3 category are primarily supported by quoted prices from brokers and dealers participating in the market for those investments. However, these may be classified as Level 3 investments due to lack of market transparency and corroboration to support these quoted prices. Additionally, valuation models may be used as the pricing source for any remaining investments classified as Level 3. These models rely on one or more significant unobservable inputs and/or significant assumptions by the Investment Manager. Inputs used in valuations may include, but are not limited to, financial statement analysis, capital account balances, discount rates and estimated cash flows, and comparable company data.
Under the direction of the Fund's Board of Trustees (the Board), the Investment Manager's Valuation Committee (the Committee) is responsible for carrying out the valuation procedures approved by the Board. The Committee consists of voting and non-voting members from various groups within the Investment Manager's organization, including operations and accounting, trading and investments, compliance, risk management and legal.
The Committee meets at least monthly to review and approve valuation matters, which may include a description of specific valuation determinations, data regarding pricing information received from approved pricing vendors and brokers and the results of Board-approved valuation control policies and procedures (the Policies). The Policies address, among other things, instances when market quotations are readily available, including recommendation of third party pricing vendors and a determination of appropriate pricing methodologies; events that require specific valuation determinations and assessment of fair value techniques; securities with a potential for stale pricing, including those that are illiquid, restricted, or in default; and the effectiveness of third-party pricing vendors, including periodic reviews of vendors. The Committee meets more frequently, as needed, to discuss additional valuation matters, which may include the need to review back-testing results, review time-sensitive information or approve related valuation actions. The Committee reports to the Board, with members of the Committee meeting with the Board at each of its regularly scheduled meetings to discuss valuation matters and actions during the period, similar to those described earlier.
For investments categorized as Level 3, the Committee monitors information similar to that described above, which may include: (i) data specific to the issuer or comparable issuers, (ii) general market or specific sector news and (iii) quoted prices and specific or similar security transactions. The Committee considers this data and any changes from prior periods in order to assess the reasonableness of observable and unobservable inputs, any assumptions or internal models used to value those securities and changes in fair value. This data is also used to corroborate, when available, information received from approved pricing vendors and brokers. Various factors impact the frequency of monitoring this information (which may occur as often as daily). However, the Committee may determine that changes to inputs, assumptions and models are not required as a result of the monitoring procedures performed.
The Accompanying Notes to Financial Statements are an integral part of this statement.
21
Columbia Corporate Income Fund
April 30, 2012
| Fair Value Measurements (continued) | |
The following table is a summary of the inputs used to value the Fund's investments as of April 30, 2012:
| | | Fair value at April 30, 2012 | |
| Description | | Level 1
Quoted Prices
in Active
Markets for
Identical Assets | | Level 2
Other
Significant
Observable
Inputs | | Level 3
Significant
Unobservable
Inputs | | Total | |
| Bonds | |
| Corporate Bonds & Notes | |
| Banking | | $ | — | | | $ | 143,027,361 | | | $ | 9,525 | | | $ | 143,036,886 | | |
| Electric | | | — | | | | 195,930,509 | | | | 59,186 | | | | 195,989,695 | | |
| All Other Industries | | | — | | | | 1,007,459,019 | | | | — | | | | 1,007,459,019 | | |
| Residential Mortgage-Backed Securities — Agency | | | — | | | | 230 | | | | — | | | | 230 | | |
| U.S. Treasury Obligations | | | 26,953,313 | | | | — | | | | — | | | | 26,953,313 | | |
| Total Bonds | | | 26,953,313 | | | | 1,346,417,119 | | | | 68,711 | | | | 1,373,439,143 | | |
| Equity Securities | |
| Common Stocks | |
| Financials | | | 12,399 | | | | — | | | | — | | | | 12,399 | | |
| Warrants | |
| Energy | | | — | | | | 41,602 | | | | — | | | | 41,602 | | |
| Information Technology | | | — | | | | — | | | | 81 | | | | 81 | | |
| Total Equity Securities | | | 12,399 | | | | 41,602 | | | | 81 | | | | 54,082 | | |
| Other | |
| Senior Loans | | | — | | | | 3,966,844 | | | | — | | | | 3,966,844 | | |
| Money Market Funds | | | 19,869,151 | | | | — | | | | — | | | | 19,869,151 | | |
| Investments of Cash Collateral Received for Securities on Loan | | | — | | | | 55,676,780 | | | | — | | | | 55,676,780 | | |
| Total Other | | | 19,869,151 | | | | 59,643,624 | | | | — | | | | 79,512,775 | | |
| Investments in Securities | | | 46,834,863 | | | | 1,406,102,345 | | | | 68,792 | | | | 1,453,006,000 | | |
| Derivatives | |
| Assets | |
| Futures Contracts | | | 526,450 | | | | — | | | | — | | | | 526,450 | | |
| Liabilities | |
| Futures Contracts | | | (1,165,065 | ) | | | — | | | | — | | | | (1,165,065 | ) | |
| Total | | $ | 46,196,248 | | | $ | 1,406,102,345 | | | $ | 68,792 | | | $ | 1,452,367,385 | | |
See the Portfolio of Investments for all investment classifications not indicated in the table.
The Fund's assets assigned to the Level 2 input category are generally valued using the market approach, in which a security's value is determined through reference to prices and information from market transactions for similar or identical assets.
There were no transfers of financial assets between Levels 1 and 2 during the period from April 1, 2012 to April 30, 2012.
Derivative instruments are valued at unrealized appreciation (depreciation).
The following table is a reconciliation of Level 3 assets for which significant observable and/or unobservable inputs were used to determine fair value.
| | | Corporate
Bonds & Notes | | Warrants | | Preferred
Stocks | | Total | |
| Balance as of March 31, 2011 | | $ | 2,676,525 | | | $ | 81 | | | $ | 71 | | | $ | 2,676,677 | | |
| Accrued discounts/premiums | | | 126 | | | | — | | | | — | | | | 126 | | |
| Realized gain (loss) | | | 1,414 | | | | — | | | | 70,819 | | | | 72,233 | | |
| Change in unrealized appreciation (depreciation)* | | | 1,588 | | | | — | | | | — | | | | 1,588 | | |
| Sales | | | (209,090 | ) | | | — | | | | (70,890 | ) | | | (279,980 | ) | |
| Purchases | | | 266,735 | | | | — | | | | — | | | | 266,735 | | |
| Transfers into Level 3 | | | 7,938 | | | | — | | | | — | | | | 7,938 | | |
| Transfers out of Level 3 | | | (2,676,525 | ) | | | — | | | | — | | | | (2,676,525 | ) | |
| Balance as of April 30, 2012 | | $ | 68,711 | | | $ | 81 | | | $ | — | | | $ | 68,792 | | |
*Change in unrealized appreciation (depreciation) relating to securities held at April 30, 2012 was $1,588 for Corporate Bonds & Notes.
The Fund does not hold any significant investments with unobservable inputs which are categorized as Level 3.
The Accompanying Notes to Financial Statements are an integral part of this statement.
22
Columbia Corporate Income Fund
April 30, 2012
| Fair Value Measurements (continued) | |
The Fund's assets assigned to the Level 3 category are valued utilizing the valuation technique deemed the most appropriate in the circumstances. Certain Corporate Bonds and Warrants classified as Level 3 are valued using a market approach. To determine fair value for these securities, management considered various factors which may have included, but were not limited to, utilization of single market quotations from broker dealers, trades of similar securities, estimated earnings of the respective company, market multiples derived from a set of comparable companies, and the position of the security within the respective company's capital structure.
Financial assets were transferred from Level 3 to Level 2 as observable market inputs were utilized and management's determination that there was sufficient, reliable and observable market data to value these assets as of period end.
Financial Assets were transferred from Level 2 to Level 3 due to utilizing a single market quotation from a broker dealer. As a result, as of period end, management determined to fair value the security under consistently applied procedures established by and under the general supervision of the Board of Trustees
Transfers in and/or out of Level 3 are determined based on the fair value at the beginning of the period for security positions held throughout the period.
The following table is a summary of the inputs used to value the Fund's investments as of March 31, 2012:
| | | Fair Value at March 31, 2012 | |
| Description | | Level 1
Quoted Prices
in Active
Markets for
Identical Assets | | Level 2
Other
Significant
Observable
Inputs | | Level 3
Significant
Unobservable
Inputs | | Total | |
| Bonds | |
| Corporate Bonds & Notes | | | | | | | | | |
| Electric | | $ | — | | | $ | 199,399,292 | | | $ | 86,468 | | | $ | 199,485,760 | | |
| All Other Industries | | | — | | | | 1,091,049,239 | | | | — | | | | 1,091,049,239 | | |
| Residential Mortgage-Backed Securities — Agency | | | — | | | | 233 | | | | — | | | | 233 | | |
| U.S. Treasury Obligations | | $ | 38,949,276 | | | | — | | | | — | | | | 38,949,276 | | |
| Total Bonds | | | 38,949,276 | | | | 1,290,448,764 | | | | 86,468 | | | | 1,329,484,508 | | |
| Equity Securities | |
| Common Stocks | |
| Financials | | | 18,838 | | | | — | | | | — | | | | 18,838 | | |
| Warrants | |
| Energy | | | — | | | | 45,012 | | | | — | | | | 45,012 | | |
| Information Technology | | | — | | | | — | | | | 81 | | | | 81 | | |
| Total Equity Securities | | | 18,838 | | | | 45,012 | | | | 81 | | | | 63,931 | | |
| Other | |
| Senior Loans | | | — | | | | 3,939,221 | | | | — | | | | 3,939,221 | | |
| Money Market Funds | | | 76,372,307 | | | | — | | | | — | | | | 76,372,307 | | |
| Investments of Cash Collateral Received for Securities on Loan | | | — | | | | 55,349,048 | | | | — | | | | 55,349,048 | | |
| Total Other | | | 76,372,307 | | | | 59,288,269 | | | | — | | | | 135,660,576 | | |
| Investments in Securities | | | 115,340,421 | | | | 1,349,782,045 | | | | 86,549 | | | | 1,465,209,015 | | |
| Derivatives | |
| Assets | |
| Futures Contracts | | | 1,084,593 | | | | — | | | | — | | | | 1,084,593 | | |
| Liabilities | |
| Futures Contracts | | | (1,058,848 | ) | | | — | | | | — | | | | (1,058,848 | ) | |
| Total | | $ | 115,366,166 | | | $ | 1,349,782,045 | | | $ | 86,549 | | | $ | 1,465,234,760 | | |
The Fund's assets assigned to the Level 2 input category are generally valued using the market approach, in which a security's value is determined through reference to prices and information from market transactions for similar or identical assets.
There were no transfers of financial assets between Levels 1 and 2 during the period from April 1, 2011 to March 31, 2012.
Derivative instruments are valued at unrealized appreciation (depreciation).
The Accompanying Notes to Financial Statements are an integral part of this statement.
23
Statement of Assets and Liabilities – Columbia Corporate Income Fund
| | | April 30,
2012 | | March 31,
2012 | |
| Assets | |
| Investments, at value* | |
| Unaffiliated issuers (identified cost $1,338,975,384 and $1,309,823,945) | | $ | 1,377,460,069 | | | $ | 1,333,487,660 | | |
| Affiliated issuers (identified cost $19,869,151 and $76,372,307) | | | 19,869,151 | | | | 76,372,307 | | |
| Investment of cash collateral received for securities on loan | |
| Short-term securities (identified cost $6,998,902 and $5,998,747) | | | 6,998,902 | | | | 5,998,747 | | |
| Repurchase agreements (identified cost $48,677,878 and $49,350,301) | | | 48,677,878 | | | | 49,350,301 | | |
| Total investments (identified cost $1,414,521,315 and $1,441,545,300) | | | 1,453,006,000 | | | | 1,465,209,015 | | |
| Cash | | | 454 | | | | — | | |
| Margin deposits on futures contracts | | | 327,300 | | | | 362,720 | | |
| Receivable for: | |
| Investments sold | | | 797,067 | | | | 17,621,694 | | |
| Capital shares sold | | | 3,997,871 | | | | 4,854,048 | | |
| Dividends | | | 4,419 | | | | 9,747 | | |
| Interest | | | 18,513,533 | | | | 16,792,796 | | |
| Reclaims | | | 21,068 | | | | 1,584 | | |
| Expense reimbursement due from Investment Manager | | | 3,426 | | | | 190 | | |
| Prepaid expense | | | 1,221 | | | | 2,441 | | |
| Trustees' deferred compensation plan | | | 57,572 | | | | 57,572 | | |
| Other assets | | | 156,057 | | | | 286,105 | | |
| Total assets | | | 1,476,885,988 | | | | 1,505,197,912 | | |
| Liabilities | |
| Disbursements in excess of cash | | | — | | | | 60,117 | | |
| Due upon return of securities on loan | | | 55,676,780 | | | | 55,349,048 | | |
| Payable for: | |
| Investments purchased | | | 2,505,986 | | | | 51,222,531 | | |
| Investments purchased on a delayed delivery basis | | | 5,345,709 | | | | 17,312,250 | | |
| Capital shares purchased | | | 1,161,276 | | | | 1,227,074 | | |
| Dividend distributions to shareholders | | | 4,039,748 | | | | 5,196,742 | | |
| Variation margin on futures contracts | | | 42,188 | | | | 43,003 | | |
| Investment management fees | | | 49,131 | | | | 16,015 | | |
| Distribution and service fees | | | 7,290 | | | | 2,365 | | |
| Transfer agent fees | | | 112,802 | | | | 110,658 | | |
| Administration fees | | | 7,516 | | | | 2,454 | | |
| Compensation of board members | | | — | | | | 615 | | |
| Chief compliance officer expenses | | | 41 | | | | 204 | | |
| Other expenses | | | 59,031 | | | | 60,498 | | |
| Trustees' deferred compensation plan | | | 57,572 | | | | 57,572 | | |
| Total liabilities | | | 69,065,070 | | | | 130,661,146 | | |
| Net assets applicable to outstanding capital stock | | $ | 1,407,820,918 | | | $ | 1,374,536,766 | | |
The Accompanying Notes to Financial Statements are an integral part of this statement.
24
Statement of Assets and Liabilities (continued) – Columbia Corporate Income Fund
| | | April 30,
2012 | | March 31,
2012 | |
| Represented by | |
| Paid-in capital | | $ | 1,370,885,743 | | | $ | 1,352,466,579 | | |
| Excess of distributions over net investment income | | | (965,745 | ) | | | (1,130,505 | ) | |
| Accumulated net realized gain (loss) | | | 476,783 | | | | (196,883 | ) | |
| Unrealized appreciation (depreciation) on: | |
| Investments | | | 38,484,685 | | | | 23,663,715 | | |
| Futures contracts | | | (638,615 | ) | | | 25,745 | | |
| Swap contracts | | | (421,933 | ) | | | (291,885 | ) | |
Total — representing net assets
applicable to outstanding capital stock | | $ | 1,407,820,918 | | | $ | 1,374,536,766 | | |
| | *Value of securities on loan | | | $ | 79,760,873 | | | $ | 80,252,619 | | |
| Net assets applicable to outstanding shares | |
| Class A | | $ | 123,973,759 | | | $ | 119,473,207 | | |
| Class B | | $ | 3,128,662 | | | $ | 3,172,616 | | |
| Class C | | $ | 17,062,397 | | | $ | 16,074,274 | | |
| Class I | | $ | 576,448,973 | | | $ | 560,563,810 | | |
| Class W | | $ | 162,774,961 | | | $ | 159,553,200 | | |
| Class Z | | $ | 524,432,166 | | | $ | 515,699,659 | | |
| Shares outstanding | |
| Class A | | | 12,039,309 | | | | 11,726,283 | | |
| Class B | | | 303,846 | | | | 311,396 | | |
| Class C | | | 1,657,040 | | | | 1,577,731 | | |
| Class I | | | 55,969,575 | | | | 55,009,167 | | |
| Class W | | | 15,806,122 | | | | 15,658,789 | | |
| Class Z | | | 50,930,308 | | | | 50,617,674 | | |
| Net asset value per share | |
| Class A(a) | | $ | 10.30 | | | $ | 10.19 | | |
| Class B | | $ | 10.30 | | | $ | 10.19 | | |
| Class C | | $ | 10.30 | | | $ | 10.19 | | |
| Class I | | $ | 10.30 | | | $ | 10.19 | | |
| Class W | | $ | 10.30 | | | $ | 10.19 | | |
| Class Z | | $ | 10.30 | | | $ | 10.19 | | |
(a) At April 30, 2012 and March 31, 2012, the maximum offering price per share for Class A is $10.81 and $10.70, respectively. The offering price is calculated by dividing the net asset value by 1.0 minus the maximum sales charge of 4.75%.
The Accompanying Notes to Financial Statements are an integral part of this statement.
25
Statement of Operations – Columbia Corporate Income Fund
| Year Ended | | April 30,
2012(a) | | March 31,
2012 | |
| Net investment income | |
| Income: | |
| Dividends | | $ | — | | | $ | 19,735 | | |
| Interest | | | 4,970,430 | | | | 43,227,050 | | |
| Dividends from affiliates | | | 4,715 | | | | 38,672 | | |
| Income from securities lending — net | | | 12,789 | | | | 82,350 | | |
| Foreign taxes withheld | | | (15,974 | ) | | | (4,471 | ) | |
| Total income | | | 4,971,960 | | | | 43,363,336 | | |
| Expenses: | |
| Investment management fees | | | 502,876 | | | | 4,163,696 | | |
| Distribution fees | |
| Class B | | | 2,012 | | | | 29,035 | | |
| Class C | | | 10,376 | | | | 86,346 | | |
| Service fees | |
| Class A | | | 25,636 | | | | 237,757 | | |
| Class B | | | 670 | | | | 9,676 | | |
| Class C | | | 3,459 | | | | 28,819 | | |
| Class W | | | 33,987 | | | | 330,921 | | |
| Transfer agent fees | |
| Class A | | | 17,386 | | | | 174,691 | | |
| Class B | | | 454 | | | | 7,400 | | |
| Class C | | | 2,347 | | | | 21,392 | | |
| Class W | | | 23,043 | | | | 246,063 | | |
| Class Z | | | 74,629 | | | | 801,609 | | |
| Administration fees | | | 76,982 | | | | 765,092 | | |
| Compensation of board members | | | 4,062 | | | | 39,860 | | |
| Pricing and bookkeeping fees | | | — | | | | 37,889 | | |
| Custodian fees | | | 3,400 | | | | 36,363 | | |
| Printing and postage fees | | | 35,000 | | | | 105,652 | | |
| Registration fees | | | 6,901 | | | | 98,121 | | |
| Professional fees | | | 15,157 | | | | 65,114 | | |
| Line of credit interest expense | | | — | | | | 85 | | |
| Chief compliance officer expenses | | | 76 | | | | 869 | | |
| Other | | | 2,581 | | | | 33,638 | | |
| Total expenses | | | 841,034 | | | | 7,320,088 | | |
Fees waived or expenses reimbursed by
Investment Manager and its affiliates | | | (32,856 | ) | | | (395,818 | ) | |
| Fees waived by Distributor — Class C | | | (2,075 | ) | | | (17,162 | ) | |
| Expense reductions | | | — | | | | (2,626 | ) | |
| Total net expenses | | | 806,103 | | | | 6,904,482 | | |
| Net investment income | | | 4,165,857 | | | | 36,458,854 | | |
| Realized and unrealized gain (loss) — net | |
| Net realized gain (loss) on: | |
| Investments | | | 288,729 | | | | 37,986,519 | | |
| Futures contracts | | | 424,494 | | | | (7,247,227 | ) | |
| Swap contracts | | | — | | | | (47,583 | ) | |
| Net realized gain | | | 713,223 | | | | 30,691,709 | | |
| Net change in unrealized appreciation (depreciation) on: | |
| Investments | | | 14,820,970 | | | | 18,532,606 | | |
| Futures contracts | | | (664,360 | ) | | | 113,266 | | |
| Swap contracts | | | (130,048 | ) | | | 54,278 | | |
| Net change in unrealized appreciation | | | 14,026,562 | | | | 18,700,150 | | |
| Net realized and unrealized gain | | | 14,739,785 | | | | 49,391,859 | | |
| Net increase in net assets resulting from operations | | $ | 18,905,642 | | | $ | 85,850,713 | | |
(a) For the period from April 1, 2012 to April 30, 2012. During the period, the Fund's fiscal year end was changed from March 31 to April 30.
The Accompanying Notes to Financial Statements are an integral part of this statement.
26
Statement of Changes in Net Assets – Columbia Corporate Income Fund
| Year Ended | | April 30,
2012(a) | | March 31,
2012 | | March 31,
2011(b) | |
| Operations | |
| Net investment income | | $ | 4,165,857 | | | $ | 36,458,854 | | | $ | 28,029,863 | | |
| Net realized gain | | | 713,223 | | | | 30,691,709 | | | | 12,056,581 | | |
Net change in unrealized
appreciation (depreciation) | | | 14,026,562 | | | | 18,700,150 | | | | (2,011,493 | ) | |
Net increase in net
assets resulting from operations | | | 18,905,642 | | | | 85,850,713 | | | | 38,074,951 | | |
| Distributions to shareholders from: | |
| Net investment income | |
| Class A | | | (327,834 | ) | | | (3,452,265 | ) | | | (4,481,416 | ) | |
| Class B | | | (6,678 | ) | | | (113,036 | ) | | | (251,572 | ) | |
| Class C | | | (36,115 | ) | | | (347,843 | ) | | | (519,875 | ) | |
| Class I | | | (1,717,322 | ) | | | (11,800,140 | ) | | | (517,220 | ) | |
| Class W | | | (435,274 | ) | | | (4,768,151 | ) | | | (1,678,751 | ) | |
| Class Z | | | (1,517,431 | ) | | | (17,056,600 | ) | | | (21,713,307 | ) | |
| Total distributions to shareholders | | | (4,040,654 | ) | | | (37,538,035 | ) | | | (29,162,141 | ) | |
Increase (decrease) in net
assets from share transactions | | | 18,419,164 | | | | 630,027,578 | | | | 132,880,043 | | |
Total increase
in net assets | | | 33,284,152 | | | | 678,340,256 | | | | 141,792,853 | | |
| Net assets at beginning of year | | | 1,374,536,766 | | | | 696,196,510 | | | | 554,403,657 | | |
| Net assets at end of year | | $ | 1,407,820,918 | | | $ | 1,374,536,766 | | | $ | 696,196,510 | | |
Excess of distributions over net
investment income | | $ | (965,745 | ) | | $ | (1,130,505 | ) | | $ | (831,992 | ) | |
(a) For the period from April 1, 2012 to April 30, 2012. During the period, the Fund's fiscal year end was changed from March 31 to April 30.
(b) Class I and Class W are for the period from September 27, 2010 (commencement of operations) to March 31, 2011.
The Accompanying Notes to Financial Statements are an integral part of this statement.
27
Statement of Changes in Net Assets (continued) – Columbia Corporate Income Fund
| Year Ended | | April 30, 2012(a) | | March 31, 2012 | | March 31, 2011(b) | |
| | | Shares | | Dollars ($) | | Shares | | Dollars ($) | | Shares | | Dollars ($) | |
| Capital stock activity | |
| Class A shares | |
| Subscriptions(c) | | | 425,356 | | | | 4,353,357 | | | | 4,993,355 | | | | 50,074,081 | | | | 1,507,952 | | | | 14,565,372 | | |
| Distributions reinvested | | | 27,243 | | | | 280,608 | | | | 259,437 | | | | 2,600,631 | | | | 326,686 | | | | 3,163,931 | | |
| Redemptions | | | (139,573 | ) | | | (1,429,716 | ) | | | (1,957,776 | ) | | | (19,586,242 | ) | | | (2,358,254 | ) | | | (22,786,915 | ) | |
| Net increase (decrease) | | | 313,026 | | | | 3,204,249 | | | | 3,295,016 | | | | 33,088,470 | | | | (523,616 | ) | | | (5,057,612 | ) | |
| Class B shares | |
| Subscriptions | | | 4,844 | | | | 49,430 | | | | 95,809 | | | | 956,120 | | | | 51,445 | | | | 495,733 | | |
| Distributions reinvested | | | 447 | | | | 4,603 | | | | 7,177 | | | | 71,740 | | | | 17,124 | | | | 165,660 | | |
| Redemptions(c) | | | (12,841 | ) | | | (131,566 | ) | | | (238,888 | ) | | | (2,389,527 | ) | | | (311,899 | ) | | | (3,013,501 | ) | |
| Net decrease | | | (7,550 | ) | | | (77,533 | ) | | | (135,902 | ) | | | (1,361,667 | ) | | | (243,330 | ) | | | (2,352,108 | ) | |
| Class C shares | |
| Subscriptions | | | 105,652 | | | | 1,081,960 | | | | 824,119 | | | | 8,321,012 | | | | 183,718 | | | | 1,774,340 | | |
| Distributions reinvested | | | 2,720 | | | | 28,015 | | | | 23,640 | | | | 237,133 | | | | 31,891 | | | | 308,829 | | |
| Redemptions | | | (29,063 | ) | | | (297,478 | ) | | | (294,870 | ) | | | (2,959,394 | ) | | | (372,498 | ) | | | (3,606,826 | ) | |
| Net increase (decrease) | | | 79,309 | | | | 812,497 | | | | 552,889 | | | | 5,598,751 | | | | (156,889 | ) | | | (1,523,657 | ) | |
| Class I shares | |
| Subscriptions | | | 1,239,704 | | | | 12,629,402 | | | | 48,386,451 | | | | 481,594,926 | | | | 10,334,592 | | | | 100,306,262 | | |
| Distributions reinvested | | | 166,730 | | | | 1,717,322 | | | | 1,170,821 | | | | 11,797,983 | | | | 53,189 | | | | 517,152 | | |
| Redemptions | | | (446,026 | ) | | | (4,567,469 | ) | | | (4,713,510 | ) | | | (47,364,701 | ) | | | (222,376 | ) | | | (2,163,407 | ) | |
| Net increase | | | 960,408 | | | | 9,779,255 | | | | 44,843,762 | | | | 446,028,208 | | | | 10,165,405 | | | | 98,660,007 | | |
| Class W shares | |
| Subscriptions | | | 352,778 | | | | 3,611,024 | | | | 9,262,938 | | | | 92,346,292 | | | | 11,612,702 | | | | 112,516,104 | | |
| Distributions reinvested | | | 42,259 | | | | 435,264 | | | | 475,611 | | | | 4,768,058 | | | | 173,020 | | | | 1,678,648 | | |
| Redemptions | | | (247,704 | ) | | | (2,534,676 | ) | | | (4,823,917 | ) | | | (48,487,012 | ) | | | (1,041,565 | ) | | | (10,082,908 | ) | |
| Net increase | | | 147,333 | | | | 1,511,612 | | | | 4,914,632 | | | | 48,627,338 | | | | 10,744,157 | | | | 104,111,844 | | |
| Class Z shares | |
| Subscriptions | | | 880,083 | | | | 8,998,731 | | | | 19,227,560 | | | | 192,831,438 | | | | 10,893,155 | | | | 105,352,950 | | |
| Distributions reinvested | | | 36,579 | | | | 376,762 | | | | 455,062 | | | | 4,554,810 | | | | 782,503 | | | | 7,573,182 | | |
| Redemptions | | | (604,028 | ) | | | (6,186,409 | ) | | | (9,940,269 | ) | | | (99,339,770 | ) | | | (18,133,934 | ) | | | (173,884,563 | ) | |
| Net increase (decrease) | | | 312,634 | | | | 3,189,084 | | | | 9,742,353 | | | | 98,046,478 | | | | (6,458,276 | ) | | | (60,958,431 | ) | |
| Total net increase | | | 1,805,160 | | | | 18,419,164 | | | | 63,212,750 | | | | 630,027,578 | | | | 13,527,451 | | | | 132,880,043 | | |
(a) For the period from April 1, 2012 to April 30, 2012. During the period, the Fund's fiscal year end was changed from March 31 to April 30.
(b) Class I and Class W are for the period from September 27, 2010 (commencement of operations) to March 31, 2011.
(c) Includes conversions of Class B shares to Class A shares, if any.
The Accompanying Notes to Financial Statements are an integral part of this statement.
28
Financial Highlights – Columbia Corporate Income Fund
The following tables are intended to help you understand the Fund's financial performance. Certain information reflects financial results for a single share of a class held for the periods shown. Per share net investment income (loss) amounts are calculated based on average shares outstanding during the period. Total returns assume reinvestment of all dividends and distributions. Total returns do not reflect payment of sales charges, if any, and are not annualized for periods of less than one year.
| | | Year ended
April 30, | | Year ended March 31, | |
| | | 2012(a) | | 2012 | | 2011 | | 2010 | | 2009 | | 2008 | |
| Class A | |
| Per share data | |
| Net asset value, beginning of period | | $ | 10.19 | | | $ | 9.71 | | | $ | 9.53 | | | $ | 7.61 | | | $ | 9.06 | | | $ | 9.68 | | |
| Income from investment operations: | |
| Net investment income | | | 0.03 | | | | 0.35 | | | | 0.50 | | | | 0.54 | | | | 0.50 | | | | 0.51 | | |
| Net realized and unrealized gain (loss) | | | 0.11 | | | | 0.49 | | | | 0.19 | | | | 1.95 | | | | (1.45 | ) | | | (0.62 | ) | |
| Total from investment operations | | | 0.14 | | | | 0.84 | | | | 0.69 | | | | 2.49 | | | | (0.95 | ) | | | (0.11 | ) | |
| Less distributions to shareholders from: | |
| Net investment income | | | (0.03 | ) | | | (0.36 | ) | | | (0.51 | ) | | | (0.57 | ) | | | (0.50 | ) | | | (0.51 | ) | |
| Total distributions to shareholders | | | (0.03 | ) | | | (0.36 | ) | | | (0.51 | ) | | | (0.57 | ) | | | (0.50 | ) | | | (0.51 | ) | |
| Proceeds from regulatory settlement | | | — | | | | — | | | | — | | | | 0.00 | (b) | | | — | | | | — | | |
| Net asset value, end of period | | $ | 10.30 | | | $ | 10.19 | | | $ | 9.71 | | | $ | 9.53 | | | $ | 7.61 | | | $ | 9.06 | | |
| Total return | | | 1.35 | % | | | 8.83 | % | | | 7.43 | % | | | 33.42 | % | | | (10.77 | %) | | | (1.15 | %) | |
| Ratios to average net assets(c) | |
Expenses prior to fees waived or expenses reimbursed
(including interest expense) | | | 0.97 | %(d) | | | 0.98 | %(e) | | | 1.03 | % | | | 0.95 | %(e) | | | 1.03 | %(e) | | | 1.00 | %(e) | |
Net expenses after fees waived or expenses reimbursed
(including interest expense)(f) | | | 0.92 | %(d) | | | 0.93 | %(e)(g) | | | 0.96 | %(g) | | | 0.95 | %(e)(g) | | | 1.03 | %(e)(g) | | | 1.00 | %(e)(g) | |
Expenses prior to fees waived or expenses reimbursed
(excluding interest expense) | | | 0.97 | %(d) | | | 0.98 | % | | | 1.02 | % | | | 0.95 | % | | | 1.03 | % | | | 1.00 | % | |
Net expenses after fees waived or expenses reimbursed
(excluding interest expense)(f) | | | 0.92 | %(d) | | | 0.93 | %(g) | | | 0.95 | %(g) | | | 0.95 | %(g) | | | 1.03 | %(g) | | | 1.00 | %(g) | |
| Net investment income | | | 3.30 | %(d) | | | 3.54 | %(g) | | | 5.14 | %(g) | | | 6.04 | %(g) | | | 5.95 | %(g) | | | 5.41 | %(g) | |
| Supplemental data | |
| Net assets, end of period (in thousands) | | $ | 123,974 | | | $ | 119,473 | | | $ | 81,879 | | | $ | 85,361 | | | $ | 71,290 | | | $ | 108,294 | | |
| Portfolio turnover | | | 6 | % | | | 183 | % | | | 108 | % | | | 131 | % | | | 147 | % | | | 193 | % | |
| Notes to Financial Highlights | |
(a) For the period from April 1, 2012 to April 30, 2012. During the period, the Fund's fiscal year end was changed from March 31 to April 30.
(b) Rounds to less than $0.01.
(c) In addition to the fees and expenses which the Fund bears directly, the Fund indirectly bears a pro rata share of the fees and expenses of the acquired funds in which it invests. Such indirect expenses are not included in the reported expense ratios.
(d) Annualized.
(e) Includes interest expense which rounds to less than 0.01%.
(f) The Investment Manager and certain of its affiliates agreed to waive/reimburse certain fees and expenses, if applicable.
(g) The benefits derived from expense reductions had an impact of less than 0.01%.
The Accompanying Notes to Financial Statements are an integral part of this statement.
29
Financial Highlights (continued) – Columbia Corporate Income Fund
| | | Year ended
April 30, | | Year ended March 31, | |
| | | 2012(a) | | 2012 | | 2011 | | 2010 | | 2009 | | 2008 | |
| Class B | |
| Per share data | |
| Net asset value, beginning of period | | $ | 10.19 | | | $ | 9.71 | | | $ | 9.53 | | | $ | 7.61 | | | $ | 9.06 | | | $ | 9.68 | | |
| Income from investment operations: | |
| Net investment income | | | 0.02 | | | | 0.28 | | | | 0.43 | | | | 0.48 | | | | 0.43 | | | | 0.44 | | |
| Net realized and unrealized gain (loss) | | | 0.11 | | | | 0.49 | | | | 0.19 | | | | 1.95 | | | | (1.45 | ) | | | (0.62 | ) | |
| Total from investment operations | | | 0.13 | | | | 0.77 | | | | 0.62 | | | | 2.43 | | | | (1.02 | ) | | | (0.18 | ) | |
| Less distributions to shareholders from: | |
| Net investment income | | | (0.02 | ) | | | (0.29 | ) | | | (0.44 | ) | | | (0.51 | ) | | | (0.43 | ) | | | (0.44 | ) | |
| Total distributions to shareholders | | | (0.02 | ) | | | (0.29 | ) | | | (0.44 | ) | | | (0.51 | ) | | | (0.43 | ) | | | (0.44 | ) | |
| Proceeds from regulatory settlement | | | — | | | | — | | | | — | | | | 0.00 | (b) | | | — | | | | — | | |
| Net asset value, end of period | | $ | 10.30 | | | $ | 10.19 | | | $ | 9.71 | | | $ | 9.53 | | | $ | 7.61 | | | $ | 9.06 | | |
| Total return | | | 1.29 | % | | | 8.02 | % | | | 6.64 | % | | | 32.44 | % | | | (11.44 | %) | | | (1.88 | %) | |
| Ratios to average net assets(c) | |
Expenses prior to fees waived or expenses reimbursed
(including interest expense) | | | 1.72 | %(d) | | | 1.75 | %(e) | | | 1.78 | % | | | 1.70 | %(e) | | | 1.78 | %(e) | | | 1.75 | %(e) | |
Net expenses after fees waived or expenses reimbursed
(including interest expense)(f) | | | 1.67 | %(d) | | | 1.68 | %(e)(g) | | | 1.71 | %(g) | | | 1.70 | %(e)(g) | | | 1.78 | %(e)(g) | | | 1.75 | %(e)(g) | |
Expenses prior to fees waived or expenses reimbursed
(excluding interest expense) | | | 1.72 | %(d) | | | 1.75 | % | | | 1.77 | % | | | 1.70 | % | | | 1.78 | % | | | 1.75 | % | |
Net expenses after fees waived or expenses reimbursed
(excluding interest expense)(f) | | | 1.67 | %(d) | | | 1.68 | %(g) | | | 1.70 | %(g) | | | 1.70 | %(g) | | | 1.78 | %(g) | | | 1.75 | %(g) | |
| Net investment income | | | 2.55 | %(d) | | | 2.84 | %(g) | | | 4.42 | %(g) | | | 5.33 | %(g) | | | 5.17 | %(g) | | | 4.67 | %(g) | |
| Supplemental data | |
| Net assets, end of period (in thousands) | | $ | 3,129 | | | $ | 3,173 | | | $ | 4,344 | | | $ | 6,583 | | | $ | 7,705 | | | $ | 14,290 | | |
| Portfolio turnover | | | 6 | % | | | 183 | % | | | 108 | % | | | 131 | % | | | 147 | % | | | 193 | % | |
| Notes to Financial Highlights | |
(a) For the period from April 1, 2012 to April 30, 2012. During the period, the Fund's fiscal year end was changed from March 31 to April 30.
(b) Rounds to less than $0.01.
(c) In addition to the fees and expenses which the Fund bears directly, the Fund indirectly bears a pro rata share of the fees and expenses of the acquired funds in which it invests. Such indirect expenses are not included in the reported expense ratios.
(d) Annualized.
(e) Includes interest expense which rounds to less than 0.01%.
(f) The Investment Manager and certain of its affiliates agreed to waive/reimburse certain fees and expenses, if applicable.
(g) The benefits derived from expense reductions had an impact of less than 0.01%.
The Accompanying Notes to Financial Statements are an integral part of this statement.
30
Financial Highlights (continued) – Columbia Corporate Income Fund
| | | Year ended
April 30, | | Year ended March 31, | |
| | | 2012(a) | | 2012 | | 2011 | | 2010 | | 2009 | | 2008 | |
| Class C | |
| Per share data | |
| Net asset value, beginning of period | | $ | 10.19 | | | $ | 9.71 | | | $ | 9.53 | | | $ | 7.61 | | | $ | 9.06 | | | $ | 9.68 | | |
| Income from investment operations: | |
| Net investment income | | | 0.02 | | | | 0.29 | | | | 0.44 | | | | 0.49 | | | | 0.45 | | | | 0.45 | | |
| Net realized and unrealized gain (loss) | | | 0.11 | | | | 0.49 | | | | 0.20 | | | | 1.95 | | | | (1.45 | ) | | | (0.61 | ) | |
| Total from investment operations | | | 0.13 | | | | 0.78 | | | | 0.64 | | | | 2.44 | | | | (1.00 | ) | | | (0.16 | ) | |
| Less distributions to shareholders from: | |
| Net investment income | | | (0.02 | ) | | | (0.30 | ) | | | (0.46 | ) | | | (0.52 | ) | | | (0.45 | ) | | | (0.46 | ) | |
| Total distributions to shareholders | | | (0.02 | ) | | | (0.30 | ) | | | (0.46 | ) | | | (0.52 | ) | | | (0.45 | ) | | | (0.46 | ) | |
| Proceeds from regulatory settlement | | | — | | | | — | | | | — | | | | 0.00 | (b) | | | — | | | | — | | |
| Net asset value, end of period | | $ | 10.30 | | | $ | 10.19 | | | $ | 9.71 | | | $ | 9.53 | | | $ | 7.61 | | | $ | 9.06 | | |
| Total return | | | 1.30 | % | | | 8.18 | % | | | 6.79 | % | | | 32.63 | % | | | (11.31 | %) | | | (1.74 | %) | |
| Ratios to average net assets(c) | |
Expenses prior to fees waived or expenses reimbursed
(including interest expense) | | | 1.72 | %(d) | | | 1.73 | %(e) | | | 1.78 | % | | | 1.70 | %(e) | | | 1.78 | %(e) | | | 1.75 | %(e) | |
Net expenses after fees waived or expenses reimbursed
(including interest expense)(f) | | | 1.52 | %(d) | | | 1.53 | %(e)(g) | | | 1.56 | %(g) | | | 1.55 | %(e)(g) | | | 1.63 | %(e)(g) | | | 1.60 | %(e)(g) | |
Expenses prior to fees waived or expenses reimbursed
(excluding interest expense) | | | 1.72 | %(d) | | | 1.73 | % | | | 1.77 | % | | | 1.70 | % | | | 1.78 | % | | | 1.75 | % | |
Net expenses after fees waived or expenses reimbursed
(excluding interest expense)(f) | | | 1.52 | %(d) | | | 1.53 | %(g) | | | 1.55 | %(g) | | | 1.55 | %(g) | | | 1.63 | %(g) | | | 1.60 | %(g) | |
| Net investment income | | | 2.69 | %(d) | | | 2.93 | %(g) | | | 4.55 | %(g) | | | 5.45 | %(g) | | | 5.35 | %(g) | | | 4.81 | %(g) | |
| Supplemental data | |
| Net assets, end of period (in thousands) | | $ | 17,062 | | | $ | 16,074 | | | $ | 9,952 | | | $ | 11,265 | | | $ | 9,974 | | | $ | 14,510 | | |
| Portfolio turnover | | | 6 | % | | | 183 | % | | | 108 | % | | | 131 | % | | | 147 | % | | | 193 | % | |
| Notes to Financial Highlights | |
(a) For the period from April 1, 2012 to April 30, 2012. During the period, the Fund's fiscal year end was changed from March 31 to April 30.
(b) Rounds to less than $0.01.
(c) In addition to the fees and expenses which the Fund bears directly, the Fund indirectly bears a pro rata share of the fees and expenses of the acquired funds in which it invests. Such indirect expenses are not included in the reported expense ratios.
(d) Annualized.
(e) Includes interest expense which rounds to less than 0.01%.
(f) The Investment Manager and certain of its affiliates agreed to waive/reimburse certain fees and expenses, if applicable.
(g) The benefits derived from expense reductions had an impact of less than 0.01%.
The Accompanying Notes to Financial Statements are an integral part of this statement.
31
Financial Highlights (continued) – Columbia Corporate Income Fund
| | | Year ended
April 30, | | Year ended March 31, | |
| | | 2012(a) | | 2012 | | 2011(b) | |
| Class I | |
| Per share data | |
| Net asset value, beginning of period | | $ | 10.19 | | | $ | 9.71 | | | $ | 9.84 | | |
| Income from investment operations: | |
| Net investment income | | | 0.03 | | | | 0.38 | | | | 0.25 | | |
| Net realized and unrealized gain (loss) | | | 0.11 | | | | 0.50 | | | | (0.11 | ) | |
| Total from investment operations | | | 0.14 | | | | 0.88 | | | | 0.14 | | |
| Less distributions to shareholders from: | |
| Net investment income | | | (0.03 | ) | | | (0.40 | ) | | | (0.27 | ) | |
| Total distributions to shareholders | | | (0.03 | ) | | | (0.40 | ) | | | (0.27 | ) | |
| Net asset value, end of period | | $ | 10.30 | | | $ | 10.19 | | | $ | 9.71 | | |
| Total return | | | 1.38 | % | | | 9.23 | % | | | 1.50 | % | |
| Ratios to average net assets(c) | |
| Expenses prior to fees waived or expenses reimbursed (including interest expense) | | | 0.55 | %(d) | | | 0.54 | %(e) | | | 0.65 | %(d)(e) | |
| Net expenses after fees waived or expenses reimbursed (including interest expense)(f) | | | 0.55 | %(d) | | | 0.54 | %(e)(g) | | | 0.65%(d)(e)(g) | | |
| Expenses prior to fees waived or expenses reimbursed (excluding interest expense) | | | 0.55 | %(d) | | | 0.54 | % | | | 0.65 | %(d) | |
| Net expenses after fees waived or expenses reimbursed (excluding interest expense)(f) | | | 0.55 | %(d) | | | 0.54 | %(g) | | | 0.65 | %(d)(g) | |
| Net investment income | | | 3.68 | %(d) | | | 3.81 | %(g) | | | 5.15 | %(d)(g) | |
| Supplemental data | |
| Net assets, end of period (in thousands) | | $ | 576,449 | | | $ | 560,564 | | | $ | 98,729 | | |
| Portfolio turnover | | | 6 | % | | | 183 | % | | | 108 | % | |
| Notes to Financial Highlights | |
(a) For the period from April 1, 2012 to April 30, 2012. During the period, the Fund's fiscal year end was changed from March 31 to April 30.
(b) For the period from September 27, 2010 (commencement of operations) to March 31, 2011.
(c) In addition to the fees and expenses which the Fund bears directly, the Fund indirectly bears a pro rata share of the fees and expenses of the acquired funds in which it invests. Such indirect expenses are not included in the reported expense ratios.
(d) Annualized.
(e) Includes interest expense which rounds to less than 0.01%.
(f) The Investment Manager and certain of its affiliates agreed to waive/reimburse certain fees and expenses, if applicable.
(g) The benefits derived from expense reductions had an impact of less than 0.01%.
The Accompanying Notes to Financial Statements are an integral part of this statement.
32
Financial Highlights (continued) – Columbia Corporate Income Fund
| | | Year ended
April 30, | | Year ended March 31, | |
| | | 2012(a) | | 2012 | | 2011(b) | |
| Class W | |
| Per share data | |
| Net asset value, beginning of period | | $ | 10.19 | | | $ | 9.71 | | | $ | 9.84 | | |
| Income from investment operations: | |
| Net investment income | | | 0.03 | | | | 0.35 | | | | 0.23 | | |
| Net realized and unrealized gain (loss) | | | 0.11 | | | | 0.49 | | | | (0.10 | ) | |
| Total from investment operations | | | 0.14 | | | | 0.84 | | | | 0.13 | | |
| Less distributions to shareholders from: | |
| Net investment income | | | (0.03 | ) | | | (0.36 | ) | | | (0.26 | ) | |
| Total distributions to shareholders | | | (0.03 | ) | | | (0.36 | ) | | | (0.26 | ) | |
| Net asset value, end of period | | $ | 10.30 | | | $ | 10.19 | | | $ | 9.71 | | |
| Total return | | | 1.35 | % | | | 8.83 | % | | | 1.31 | % | |
| Ratios to average net assets(c) | |
| Expenses prior to fees waived or expenses reimbursed (including interest expense) | | | 0.97 | %(d) | | | 0.98 | %(e) | | | 1.06 | %(d)(e) | |
| Net expenses after fees waived or expenses reimbursed (including interest expense)(f) | | | 0.92 | %(d) | | | 0.93 | %(e)(g) | | | 0.95%(d)(e)(g) | | |
| Expenses prior to fees waived or expenses reimbursed (excluding interest expense) | | | 0.97 | %(d) | | | 0.98 | % | | | 1.06 | %(d) | |
| Net expenses after fees waived or expenses reimbursed (excluding interest expense)(f) | | | 0.92 | %(d) | | | 0.93 | %(g) | | | 0.95 | %(d)(g) | |
| Net investment income | | | 3.30 | %(d) | | | 3.50 | %(g) | | | 4.70 | %(d)(g) | |
| Supplemental data | |
| Net assets, end of period (in thousands) | | $ | 162,775 | | | $ | 159,553 | | | $ | 104,340 | | |
| Portfolio turnover | | | 6 | % | | | 183 | % | | | 108 | % | |
| Notes to Financial Highlights | |
(a) For the period from April 1, 2012 to April 30, 2012. During the period, the Fund's fiscal year end was changed from March 31 to April 30.
(b) For the period from September 27, 2010 (commencement of operations) to March 31, 2011.
(c) In addition to the fees and expenses which the Fund bears directly, the Fund indirectly bears a pro rata share of the fees and expenses of the acquired funds in which it invests. Such indirect expenses are not included in the reported expense ratios.
(d) Annualized.
(e) Includes interest expense which rounds to less than 0.01%.
(f) The Investment Manager and certain of its affiliates agreed to waive/reimburse certain fees and expenses, if applicable.
(g) The benefits derived from expense reductions had an impact of less than 0.01%.
The Accompanying Notes to Financial Statements are an integral part of this statement.
33
Financial Highlights (continued) – Columbia Corporate Income Fund
| | | Year ended
April 30, | | Year ended March 31, | |
| | | 2012(a) | | 2012 | | 2011 | | 2010 | | 2009 | | 2008 | |
| Class Z | |
| Per share data | |
| Net asset value, beginning of period | | $ | 10.19 | | | $ | 9.71 | | | $ | 9.53 | | | $ | 7.61 | | | $ | 9.06 | | | $ | 9.68 | | |
| Income from investment operations: | |
| Net investment income | | | 0.03 | | | | 0.38 | | | | 0.52 | | | | 0.56 | | | | 0.52 | | | | 0.53 | | |
| Net realized and unrealized gain (loss) | | | 0.11 | | | | 0.49 | | | | 0.20 | | | | 1.96 | | | | (1.45 | ) | | | (0.61 | ) | |
| Total from investment operations | | | 0.14 | | | | 0.87 | | | | 0.72 | | | | 2.52 | | | | (0.93 | ) | | | (0.08 | ) | |
| Less distributions to shareholders from: | |
| Net investment income | | | (0.03 | ) | | | (0.39 | ) | | | (0.54 | ) | | | (0.60 | ) | | | (0.52 | ) | | | (0.54 | ) | |
| Total distributions to shareholders | | | (0.03 | ) | | | (0.39 | ) | | | (0.54 | ) | | | (0.60 | ) | | | (0.52 | ) | | | (0.54 | ) | |
| Proceeds from regulatory settlement | | | — | | | | — | | | | — | | | | 0.00 | (b) | | | — | | | | — | | |
| Net asset value, end of period | | $ | 10.30 | | | $ | 10.19 | | | $ | 9.71 | | | $ | 9.53 | | | $ | 7.61 | | | $ | 9.06 | | |
| Total return | | | 1.37 | % | | | 9.10 | % | | | 7.70 | % | | | 33.74 | % | | | (10.55 | %) | | | (0.90 | %) | |
| Ratios to average net assets(c) | |
Expenses prior to fees waived or expenses reimbursed
(including interest expense) | | | 0.72 | %(d) | | | 0.73 | %(e) | | | 0.78 | % | | | 0.70 | %(e) | | | 0.78 | %(e) | | | 0.75 | %(e) | |
Net expenses after fees waived or expenses reimbursed
(including interest expense)(f) | | | 0.67 | %(d) | | | 0.68 | %(e)(g) | | | 0.71 | %(g) | | | 0.70 | %(e)(g) | | | 0.78 | %(e)(g) | | | 0.75 | %(e)(g) | |
Expenses prior to fees waived or expenses reimbursed
(excluding interest expense) | | | 0.72 | %(d) | | | 0.73 | % | | | 0.77 | % | | | 0.70 | % | | | 0.78 | % | | | 0.75 | % | |
Net expenses after fees waived or expenses reimbursed
(excluding interest expense)(f) | | | 0.67 | %(d) | | | 0.68 | %(g) | | | 0.70 | %(g) | | | 0.70 | %(g) | | | 0.78 | %(g) | | | 0.75 | %(g) | |
| Net investment income | | | 3.55 | %(d) | | | 3.80 | %(g) | | | 5.37 | %(g) | | | 6.29 | %(g) | | | 6.22 | %(g) | | | 5.66 | %(g) | |
| Supplemental data | |
| Net assets, end of period (in thousands) | | $ | 524,432 | | | $ | 515,700 | | | $ | 396,952 | | | $ | 451,195 | | | $ | 358,348 | | | $ | 478,519 | | |
| Portfolio turnover | | | 6 | % | | | 183 | % | | | 108 | % | | | 131 | % | | | 147 | % | | | 193 | % | |
| Notes to Financial Highlights | |
(a) For the period from April 1, 2012 to April 30, 2012. During the period, the Fund's fiscal year end was changed from March 31 to April 30.
(b) Rounds to less than $0.01.
(c) In addition to the fees and expenses which the Fund bears directly, the Fund indirectly bears a pro rata share of the fees and expenses of the acquired funds in which it invests. Such indirect expenses are not included in the reported expense ratios.
(d) Annualized.
(e) Includes interest expense which rounds to less than 0.01%.
(f) The Investment Manager and certain of its affiliates agreed to waive/reimburse certain fees and expenses, if applicable.
(g) The benefits derived from expense reductions had an impact of less than 0.01%.
The Accompanying Notes to Financial Statements are an integral part of this statement.
34
Notes to Financial Statements – Columbia Corporate Income Fund
April 30, 2012
Note 1. Organization
Columbia Corporate Income Fund (the Fund), a series of Columbia Funds Series Trust I (the Trust), is a diversified fund. The Trust is registered under the Investment Company Act of 1940, as amended (the 1940 Act), as an open-end management investment company organized as a Massachusetts business trust.
Fiscal Year End Change
During the period, the Fund changed its fiscal year end from March 31 to April 30. Accordingly, this report includes activity for the period April 1, 2012 to April 30, 2012 and the year ended March 31, 2012.
Fund Shares
The Trust may issue an unlimited number of shares (without par value). The Fund offers Class A, Class B, Class C, Class I, Class W and Class Z shares. All share classes have identical voting, dividend and liquidation rights. Each share class has its own expense structure and sales charges, as applicable.
Class A shares are subject to a maximum front-end sales charge of 4.75% based on the initial investment amount. Class A shares purchased without an initial sales charge in accounts aggregating $1 million to $50 million at the time of purchase are subject to a contingent deferred sales charge (CDSC) if the shares are sold within 18 months of purchase, charged as follows: 1.00% CDSC if redeemed within 12 months of purchase, and 0.50% CDSC if redeemed more than 12, but less than 18, months after purchase.
Class B shares may be subject to a maximum CDSC of 5.00% based upon the holding period after purchase. Class B shares will generally convert to Class A shares eight years after purchase. The Fund no longer accepts investments by new or existing investors in the Fund's Class B shares, except in connection with the reinvestment of any dividend and/or capital gain distributions in Class B shares of the Fund and exchanges by existing Class B shareholders of certain other funds within the Columbia Family of Funds.
Class C shares are subject to a 1.00% CDSC on shares redeemed within one year of purchase.
Class I shares are not subject to sales charges and are only available to the Columbia Family of Funds.
Class W shares are not subject to sales charges and are only available to investors purchasing through authorized investment programs managed by investment professionals, including discretionary managed account programs.
Class Z shares are not subject to sales charges, and are only available to certain investors, as described in the Fund's prospectus.
Note 2. Summary of Significant Accounting Policies
Use of Estimates
The preparation of financial statements in accordance with U.S. generally accepted accounting principles (GAAP) requires management to make certain estimates and assumptions that affect the reported amounts of assets and liabilities, the disclosure of contingent assets and liabilities at the date of the financial statements and the reported amounts of revenue and expenses during the reporting period. Actual results could differ from those estimates.
The following is a summary of significant accounting policies consistently followed by the Fund in the preparation of its financial statements.
Security Valuation
Debt securities generally are valued by pricing services approved by the Board of Trustees (the Board) based upon market transactions for normal, institutional-size trading units of similar securities. The services may use various pricing techniques which take into account appropriate factors such as yield, quality, coupon rate, maturity, type of issue, trading characteristics and other data, as well as broker quotes. Debt securities for which quotations are readily available may also be valued based upon an over-the-counter or exchange bid quotation.
All equity securities are valued at the close of business of the New York Stock Exchange (NYSE). Equity securities are valued at the last quoted sales price on the principal exchange or market on which they trade, except for securities traded on the NASDAQ Stock Market, which are valued at the NASDAQ official close price. Unlisted securities or listed securities for which there were no sales during the day are valued at the mean of the latest quoted bid and asked prices on such exchanges or markets.
35
Columbia Corporate Income Fund, April 30, 2012
Investments in other open-end investment companies, including money market funds, are valued at net asset value.
Short-term securities purchased within 60 days to maturity are valued at amortized cost, which approximates market value. The value of short-term securities originally purchased with maturities greater than 60 days is determined based on an amortized value to par upon reaching 60 days to maturity. Short-term securities maturing in more than 60 days from the valuation date are valued at the market price or approximate market value based on current interest rates.
Futures and options on futures contracts are valued based upon the settlement price established each day by the board of trade or exchange on which they are traded.
Swap transactions are valued through an independent pricing service or broker, or if neither is available, through an internal model based upon observable inputs.
Foreign securities are valued based on quotations from the principal market in which such securities are normally traded. If any foreign share prices are not readily available as a result of limited share activity the securities are valued at the mean of the latest quoted bid and asked prices on such exchanges or markets. Foreign currency exchange rates are generally determined at 4:00 p.m. Eastern (U.S.) time. However, many securities markets and exchanges outside the U.S. close prior to the close of the NYSE; therefore, the closing prices for securities in such markets or on such exchanges may not fully reflect events that occur after such close but before the close of the NYSE. In those situations, foreign securities will be fair valued pursuant to the policy adopted by the Board, including utilizing a third party pricing service to determine these fair values. The third party pricing service takes into account multiple factors, including, but not limited to, movements in the U.S. securities markets, certain depositary receipts, futures contracts and foreign exchange rates that have occurred subsequent to the close of the foreign exchange, to determine a good faith estimate that reasonably reflects the current market conditions as of the close of the NYSE. The fair value of a security is likely to be different from the quoted or published price, if available.
Investments for which market quotations are not readily available, or that have quotations which management believes are not reliable, are valued at fair value as determined in good faith under consistently applied procedures established by and under the general supervision of the Board. If a security or class of securities (such as foreign securities) is valued at fair value, such value is likely to be different from the last quoted market price for the security. The determination of fair value often requires significant judgment. To determine fair value, management may use assumptions including but not limited to future cash flows and estimated risk premiums. Multiple inputs from various sources may be used to determine value.
Foreign Currency Transactions and Translation
The values of all assets and liabilities denominated in foreign currencies are translated into U.S. dollars at that day's exchange rates. Net realized and unrealized gains (losses) on foreign currency transactions and translations include gains (losses) arising from the fluctuation in exchange rates between trade and settlement dates on securities transactions, gains (losses) arising from the disposition of foreign currency and currency gains (losses) between the accrual and payment dates on dividends, interest income and foreign withholding taxes.
For financial statement purposes, the Fund does not distinguish that portion of gains (losses) on investments which is due to changes in foreign exchange rates from that which is due to changes in market prices of the investments. Such fluctuations are included with the net realized and unrealized gains (losses) on investments in the Statement of Operations.
Derivative Instruments
The Fund invests in certain derivative instruments as detailed below to meet its investment objectives. Derivatives are instruments whose values depend on, or are derived from, in whole or in part, the value of one or more other assets, such as securities, currencies, commodities or indices. Derivative instruments may be used to maintain cash reserves while maintaining exposure to certain other assets, to offset anticipated declines in values of investments, to facilitate trading, to reduce transaction costs and to pursue higher investment returns. The Fund may also use derivative instruments to mitigate certain investment risks, such as foreign currency exchange rate risk, interest rate risk and credit risk. Derivatives may involve various risks, including the potential inability of the counterparty to fulfill its obligation under the terms of the contract, the potential for an
36
Columbia Corporate Income Fund, April 30, 2012
illiquid secondary market and the potential for market movements which may expose the Fund to gains or losses in excess of the amount shown in the Statement of Assets and Liabilities.
The Fund and any counterparty are required to maintain an agreement that requires the Fund and that counterparty to monitor (on a daily basis) the net fair value of all derivatives entered into pursuant to the agreement between the Fund and such counterparty. If the net fair value of such derivatives between the Fund and that counterparty exceeds a certain threshold (as defined in the agreement), the Fund or the counterparty (as the case may be) is required to post cash and/or securities as collateral. Fair values of derivatives presented in the financial statements are not netted with the fair value of other derivatives or with any collateral amounts posted by the Fund or any counterparty.
Futures Contracts
Futures contracts represent commitments for the future purchase or sale of an asset at a specified price on a specified date. The Fund bought and sold futures contracts to manage the duration and yield curve exposure of the Fund versus the benchmark and manage exposure to movements in interest rates. Upon entering into futures contracts, the Fund bears risks which may include interest rates, exchange rates or securities prices moving unexpectedly, in which case, the Fund may not achieve the anticipated benefits of the futures contracts and may realize a loss. Additional risks include counterparty credit risk, the possibility of an illiquid market, and that a change in the value of the contract or option may not correlate with changes in the value of the underlying asset.
Upon entering into a futures contract, the Fund pledges cash or securities with the broker in an amount sufficient to meet the initial margin requirement. Subsequent payments (variation margin) are made or received by the Fund each day. The variation margin payments are equal to the daily change in the contract value and are recorded as variation margin receivable or payable and are offset in unrealized gains or losses. The Fund recognizes a realized gain or loss when the contract is closed or expires. Futures contracts involve, to varying degrees, risk of loss in excess of the variation margin disclosed in the Statement of Assets and Liabilities.
Effects of Derivative Transactions in the Financial Statements
The following tables are intended to provide additional information about the effect of derivatives on the financial statements of the Fund, including: the fair value of derivatives by risk category and the location of those fair values in the Statement of Assets and Liabilities; the impact of derivative transactions on the Fund's operations over the period including realized gains or losses and unrealized gains or losses. The derivative schedules following the Portfolio of Investments present additional information regarding derivative instruments outstanding at the end of the period, if any.
Fair Values of Derivative Instruments at April 30, 2012
| | | Asset derivatives | | Liability derivatives | |
| Risk Exposure Category | | Statement of Assets
and Liabilities Location | | Fair Value | | Statement of Assets
and Liabilities Location | | Fair Value | |
| Interest rate contracts | | Net assets—unrealized appreciation
on futures contracts | | $ | 526,450 | * | | Net assets—unrealized depreciation
on futures contracts | | $ | 1,165,065 | * | |
* Includes cumulative appreciation (depreciation) of futures contracts as reported in the Futures Contracts Outstanding table following the Portfolio of Investments. Only the current day's variation margin is reported in receivables or payables in the Statement of Assets and Liabilities.
37
Columbia Corporate Income Fund, April 30, 2012
Effect of Derivative Instruments in the Statement of Operations for the Period Ended April 30, 2012
Amount of Realized Gain (Loss) on Derivatives Recognized in Income
| Risk Exposure Category | | Futures Contracts | |
| Interest rate contracts | | $ | 424,494 | | |
Change in Unrealized Appreciation (Depreciation) on Derivatives Recognized in Income
| Risk Exposure Category | | Futures Contracts | |
| Interest rate contracts | | $ | (664,360 | ) | |
Volume of Derivative Instruments for the Period Ended April 30, 2012
| | | Contracts
Opened | |
| Futures Contracts | | | 48 | | |
Fair Values of Derivative Instruments at March 31, 2012
| | | Asset derivatives | | Liability derivatives | |
| Risk Exposure Category | | Statement of Assets
and Liabilities Location | | Fair Value | | Statement of Assets
and Liabilities Location | | Fair Value | |
| Interest rate contracts | | Net assets—unrealized appreciation
on futures contracts | | $ | 1,084,593 | * | | Net assets—unrealized depreciation
on futures contracts | | $ | 1,058,848 | * | |
* Includes cumulative appreciation (depreciation) of futures contracts as reported in the Statement of Assets and Liabilities. Only the current day's variation margin is reported in receivables or payables in the Statement of Assets and Liabilities.
Effect of Derivative Instruments in the Statement of Operations for the Year Ended March 31, 2012
Amount of Realized Gain (Loss) on Derivatives Recognized in Income
| Risk Exposure Category | | Futures Contracts | | Swap Contracts | | Total | |
| Credit contracts | | $ | — | | | $ | (47,583 | ) | | $ | (47,583 | ) | |
| Interest rate contracts | | | (7,247,227 | ) | | | — | | | $ | (7,247,227 | ) | |
| Total | | $ | (7,247,227 | ) | | $ | (47,583 | ) | | $ | (7,294,810 | ) | |
Change in Unrealized Appreciation (Depreciation) on Derivatives Recognized in Income
| Risk Exposure Category | | Futures Contracts | | Swap Contracts | | Total | |
| Credit contracts | | $ | — | | | $ | 22,489 | | | $ | 22,489 | | |
| Interest rate contracts | | | 113,266 | | | | — | | | $ | 113,266 | | |
| Total | | $ | 113,266 | | | $ | 22,489 | | | $ | 135,755 | | |
38
Columbia Corporate Income Fund, April 30, 2012
Volume of Derivative Instruments for the Year Ended March 31, 2012
| | | Contracts
Opened | |
| Futures Contracts | | | 5,866 | | |
| | | Aggregate
Notional
Opened | |
Credit Default Swap
Contracts—Buy Protection | | $ | 9,500,000 | | |
Repurchase Agreements
The Fund may engage in repurchase agreement transactions with institutions that management has determined are creditworthy. The Fund, through the custodian, receives delivery of the underlying securities collateralizing a repurchase agreement. Management is responsible for determining that the collateral is at least equal, at all times, to the value of the repurchase obligation including interest. A repurchase agreement transaction involves certain risks in the event of default or insolvency of the counterparty. These risks include possible delays in or restrictions on a Fund's ability to dispose of the underlying securities and a possible decline in the value of the underlying securities during the period while the Fund seeks to assert its rights.
Delayed Delivery Securities
The Fund may trade securities on other than normal settlement terms, including securities purchased or sold on a "when-issued" basis. This may increase the risk if the other party to the transaction fails to deliver and causes the Fund to subsequently invest at less advantageous prices. The Fund designates cash or liquid securities in an amount equal to the delayed delivery commitment.
Loan Participations and Commitments
The Fund may invest in loan participations. When the Fund purchases a loan participation, the Fund typically enters into a contractual relationship with the lender or third party selling such participation (Selling Participant), but not the borrower. However, the Fund assumes the credit risk of the borrower, Selling Participant and any other persons interpositioned between the Fund and the borrower. The Fund may not directly benefit from the collateral supporting the senior loan which it has purchased from the Selling Participant.
Security Transactions
Security transactions are accounted for on the trade date. Cost is determined and gains (losses) are based upon the specific identification method for both financial statement and federal income tax purposes.
Income Recognition
Interest income is recorded on the accrual basis. Market premium and discount are amortized and accreted, respectively, on all debt securities, unless otherwise noted. Original issue discount is accreted to interest income over the life of the security with a corresponding increase in the cost basis, if any.
Corporate actions and dividend income are recorded net of any non-reclaimable tax withholdings, on the ex-dividend date or upon receipt of ex-dividend notification in the case of certain foreign securities.
Expenses
General expenses of the Trust are allocated to the Fund and other funds of the Trust based upon relative net assets or other expense allocation methodologies determined by the nature of the expense. Expenses directly attributable to the Fund are charged to the Fund. Expenses directly attributable to a specific class of shares are charged to that share class.
Determination of Class Net Asset Value
All income, expenses (other than class-specific expenses, which are charged to that share class, as shown in the Statement of Operations) and realized and unrealized gains (losses) are allocated to each class of the Fund on a daily basis for purposes of determining the net asset value of each class. Income and expenses are allocated to each class based on the settled shares method, while realized and unrealized gains (losses) are allocated based on the relative net assets of each class.
Federal Income Tax Status
The Fund intends to qualify each year as a regulated investment company under Subchapter M of the Internal
39
Columbia Corporate Income Fund, April 30, 2012
Revenue Code, as amended, and will distribute substantially all of its taxable income (including net short-term capital gains), if any, for its tax year, and as such will not be subject to federal income taxes. In addition, the Fund intends to distribute in each calendar year substantially all of its net investment income, capital gains and certain other amounts, if any, such that the Fund should not be subject to federal excise tax. Therefore, no federal income or excise tax provision is recorded.
Foreign Taxes
The Fund may be subject to foreign taxes on income, gains on investments or currency repatriation, a portion of which may be recoverable. The Fund will accrue such taxes and recoveries, as applicable, based upon its current interpretation of tax rules and regulations that exist in the markets in which it invests.
Realized gains in certain countries may be subject to foreign taxes at the Fund level, based on statutory rates. The Fund accrues for such foreign taxes on net realized and unrealized gains at the appropriate rate for each jurisdiction, as applicable.
Distributions to Shareholders
Distributions from net investment income are declared daily and paid monthly. Net realized capital gains, if any, are distributed at least annually. Income distributions and capital gain distributions are determined in accordance with federal income tax regulations which may differ from GAAP.
Guarantees and Indemnifications
Under the Trust's organizational documents and, in some cases, by contract, its officers and trustees are indemnified against certain liabilities arising out of the performance of their duties to the Trust or its funds. In addition, certain of the Fund's contracts with its service providers contain general indemnification clauses. The Fund's maximum exposure under these arrangements is unknown since the amount of any future claims that may be made against the Fund cannot be determined, and the Fund has no historical basis for predicting the likelihood of any such claims.
Note 3. Fees and Compensation Paid to Affiliates
Investment Management Fees
Under an Investment Management Services Agreement (IMSA), Columbia Management Investment Advisers, LLC (the Investment Manager), a wholly-owned subsidiary of Ameriprise Financial, Inc. (Ameriprise Financial), determines which securities will be purchased, held or sold. Effective July 1, 2011, the management fee is an annual fee that is equal to a percentage of the Fund's average daily net assets that declines from 0.43% to 0.30% as the Fund's net assets increase. Prior to July 1, 2011, the management fee was equal to a percentage of the Fund's average daily net assets that declined from 0.42% to 0.32% as the Fund's net assets increased. For the period April 1, 2012 to April 30, 2012 and the year ended March 31, 2012, the annualized effective management fee rate was 0.43% of the Fund's average daily net assets.
Administration Fees
Under an Administrative Services Agreement, the Investment Manager serves as the Fund Administrator. Effective July 1, 2011, the Fund pays the Fund Administrator an annual fee for administration and accounting services equal to a percentage of the Fund's average daily net assets that declines from 0.07% to 0.04% as the Fund's net assets increase. Prior to July 1, 2011, the administration fee was equal to a percentage of the Fund's average daily net assets that declined from 0.15% to 0.10% as the Fund's net assets increased. For the period April 1, 2012 to April 30, 2012, the annualized effective administration fee rate was 0.07% of the Fund's average daily net assets. For the year ended March 31, 2012, the effective administration fee rate was 0.08% of the Fund's average daily net assets.
Pricing and Bookkeeping Fees
Prior to June 27, 2011, the Fund had entered into a Financial Reporting Services Agreement (the Financial Reporting Services Agreement) with State Street Bank and Trust Company (State Street) and the Investment Manager pursuant to which State Street provided financial reporting services to the Fund. The Fund also entered into an Accounting Services Agreement (collectively with the Financial Reporting Services Agreement, the State Street Agreements) with State Street and the Investment Manager pursuant to which State
40
Columbia Corporate Income Fund, April 30, 2012
Street provided accounting services to the Fund. Under the State Street Agreements, the Fund paid State Street an annual fee of $38,000 paid monthly plus an additional monthly fee based on an annualized percentage rate of average daily net assets of the Fund for the month. The aggregate fee did not exceed $140,000 per year (exclusive of out-of-pocket expenses and charges). The Fund also reimbursed State Street for certain out-of-pocket expenses and charges. Effective June 27, 2011, these services are provided under the Administrative Services Agreement discussed above.
Compensation of Board Members
Board members are compensated for their services to the Fund as disclosed in the Statement of Operations. The Trust's eligible Trustees may participate in a Deferred Compensation Plan (the Plan) which may be terminated at any time. Obligation of the Plan will be paid solely out of the Fund's assets.
Compensation of Chief Compliance Officer
The Board has appointed a Chief Compliance Officer to the Fund in accordance with federal securities regulations. The Fund, along with other affiliated funds, pays its pro-rata share of the expenses associated with the Chief Compliance Officer. The Fund's expenses for the Chief Compliance Officer will not exceed $15,000 per year.
Transfer Agent Fees
Under a Transfer and Dividend Disbursing Agent Agreement, Columbia Management Investment Services Corp. (the Transfer Agent), an affiliate of the Investment Manager and a wholly-owned subsidiary of Ameriprise Financial, is responsible for providing transfer agency services to the Fund. The Transfer Agent has contracted with Boston Financial Data Services (BFDS) to serve as sub-transfer agent.
The Transfer Agent receives monthly account-based service fees based on the number of open accounts and is reimbursed by the Fund for the fees and expenses the Transfer Agent pays to financial intermediaries that maintain omnibus accounts with the Fund that is a percentage of the average aggregate value of the Fund's shares maintained in each such omnibus account (other than omnibus accounts for which American Enterprise Investment Services Inc. is the broker of record or accounts where the beneficial shareholder is a customer of Ameriprise Financial Services, Inc., which are paid a per account fee). The Transfer Agent pays the fees of BFDS for services as sub-transfer agent and is not entitled to reimbursement for such fees from the Fund (with the exception of out-of-pocket fees).
The Transfer Agent also receives compensation from fees for various shareholder services and reimbursements for certain out-of-pocket expenses. Class I shares do not pay transfer agent fees.
For the period April 1, 2012 to April 30, 2012 and the year ended March 31, 2012, the Fund's annualized effective transfer agent fee rates as a percentage of average daily net assets of each class were as follows:
| | | Period ended
April 30,
2012 | | Year ended
March 31,
2012 | |
| Class A | | | 0.17 | % | | | 0.18 | % | |
| Class B | | | 0.17 | | | | 0.19 | | |
| Class C | | | 0.17 | | | | 0.19 | | |
| Class W | | | 0.17 | | | | 0.19 | | |
| Class Z | | | 0.17 | | | | 0.18 | | |
An annual minimum account balance fee of $20 may apply to certain accounts with a value below the Fund's initial minimum investment requirements to reduce the impact of small accounts on transfer agent fees. These minimum account balance fees are recorded as part of expense reductions in the Statement of Operations. For the period April 1, 2012 to April 30, 2012, no minimum account balance fees were charged to accounts. For the year ended March 31, 2012, these minimum account balance fees reduced total expenses by $2,610.
Distribution and Service Fees
The Fund has an agreement with Columbia Management Investment Distributors, Inc. (the Distributor), an affiliate of the Investment Manager and a wholly-owned subsidiary of Ameriprise Financial, for distribution and shareholder services. Pursuant to Rule 12b-1 under the 1940 Act, the Board has approved, and the Fund has adopted, distribution and shareholder service plans (the Plans) which set the distribution and service fees for the Fund. These fees are calculated daily and are intended to compensate the
41
Columbia Corporate Income Fund, April 30, 2012
Distributor and/or eligible selling and/or servicing agents for selling shares of the Fund and providing services to investors.
The Plans require the payment of a monthly service fee to the Distributor at the maximum annual rate of 0.25% of the average daily net assets attributable to Class A, Class B, Class C and Class W shares of the Fund. The Plans also require the payment of a monthly distribution fee to the Distributor at the maximum annual rates of 0.75%, 0.75% and 0.25% of the average daily net assets attributable to Class B, Class C and Class W shares, respectively.
The Distributor has voluntarily agreed to waive a portion of the distribution fee for Class C shares so that the combined distribution and service fee does not exceed 0.85% annually of the average daily net assets attributable to Class C shares. This arrangement may be modified or terminated by the Distributor at any time.
The Fund may pay a distribution fee of up to 0.25% of the Fund's average daily net assets attributable to Class W shares and a service fee of up to 0.25% of the Fund's average daily net assets attributable to Class W shares, provided, however, that the aggregate fee shall not exceed 0.25% of the Fund's average daily net assets attributable to Class W shares.
Sales Charges
Sales charges, including front-end charges and CDSCs, received by the Distributor for distributing Fund shares were $19,406 for Class A, $707 for Class B and $10 for Class C shares for the period April 1, 2012 to April 30, 2012, and $210,649 for Class A, $2,816 for Class B and $2,321 for Class C shares for the year ended March 31, 2012.
Expenses Waived/Reimbursed by the Investment Manager and its Affiliates
Effective July 1, 2011, the Investment Manager and certain of its affiliates have contractually agreed to waive fees and/or reimburse expenses (excluding certain fees and expenses described below), through July 31, 2012, unless sooner terminated at the sole discretion of the Board, so that the Fund's net operating expenses, after giving effect to fees waived/expenses reimbursed and any balance credits and/or overdraft charges from the Fund's custodian, do not exceed the following annual rates as a percentage of the class' average daily net assets:
| Class A | | | 0.92 | % | |
| Class B | | | 1.67 | | |
| Class C | | | 1.67 | | |
| Class I | | | 0.62 | | |
| Class W | | | 0.92 | | |
| Class Z | | | 0.67 | | |
Under the agreement, the following fees and expenses are excluded from the waiver/reimbursement commitment, and therefore will be paid by the Fund, if applicable: taxes (including foreign transaction taxes), expenses associated with investments in affiliated and non-affiliated pooled investment vehicles (including mutual funds and exchange traded funds), transaction costs and brokerage commissions, costs related to any securities lending program, dividend expenses associated with securities sold short, inverse floater program fees and expenses, transaction charges and interest on borrowed money, interest, extraordinary expenses and any other expenses the exclusion of which is specifically approved by the Fund's Board. This agreement may be modified or amended only with approval from all parties. Class C distribution fees waived by the Distributor, as discussed above, are in addition to the waiver/reimbursement commitment under the agreement.
Prior to July 1, 2011, the Investment Manager voluntarily agreed to reimburse a portion of the Fund's expenses (excluding certain expenses, such as brokerage commissions, interest, taxes and extraordinary expenses, but including custodian charges relating to overdrafts, if any) so that the Fund's ordinary net operating expenses, after giving effect to fees waived/expenses reimbursed and any balance credits from the Fund's custodian, did not exceed the following annual rates as a percentage of the class' average daily net assets:
| Class A | | | 0.95 | % | |
| Class B | | | 1.70 | | |
| Class C | | | 1.70 | | |
| Class I | | | 0.65 | | |
| Class W | | | 0.95 | | |
| Class Z | | | 0.70 | | |
42
Columbia Corporate Income Fund, April 30, 2012
Note 4. Federal Tax Information
The timing and character of income and capital gain distributions are determined in accordance with income tax regulations, which may differ from GAAP because of temporary or permanent book to tax differences.
For the period April 1, 2012 to April 30, 2012, these differences are primarily due to differing treatment for capital loss carryforward, defaulted bonds, deferral/reversal of wash sales, Trustees' deferred compensation, distributions, recognition of market discount, paydown reclassification, recognition of unrealized appreciation (depreciation) for certain derivative investments, and tax straddles. For the year ended March 31, 2012, these differences are primarily due to defaulted bonds, differing treatment for deferral/reversal of wash sales, Trustees' deferred compensation, recognition of market discount and recognition of unrealized appreciation (depreciation) for certain derivative investments. To the extent these differences are permanent, reclassifications are made among the components of the Fund's net assets in the Statement of Assets and Liabilities. Temporary differences do not require reclassifications. In the Statement of Assets and Liabilities the following reclassifications were made:
| | | Period ended | | Year ended | |
| | | April 30,
2012 | | March 31,
2012 | |
Excess of distributions
over net investment
income | | $ | 39,557 | | | $ | 780,668 | | |
Accumulated net realized
gain/loss | | | (39,557 | ) | | | (829,868 | ) | |
| Paid-in capital | | | — | | | | 49,200 | | |
Net investment income and net realized gains (losses), as disclosed in the Statement of Operations, and net assets were not affected by this reclassification.
The tax character of distributions paid during the periods indicated was as follows:
| | | Period ended
April 30,
2012 | | Year ended
March 31,
2012 | | Year ended
March 31,
2011 | |
| Ordinary income | | $ | 4,040,654 | | | $ | 37,538,035 | | | $ | 29,162,141 | | |
Short-term capital gain distributions, if any, are considered ordinary income distributions for tax purposes.
At April 30, 2012 and March 31, 2012, the components of distributable earnings on a tax basis were as follows:
| | | April 30,
2012 | | March 31,
2012 | |
Undistributed ordinary
income | | $ | 3,783,504 | | | $ | 4,813,076 | | |
Undistributed
accumulated long-term
gain | | | 159,269 | | | | 159,269 | | |
| Unrealized appreciation | | $ | 38,251,054 | | | | 23,205,971 | | |
At April 30, 2012 and March 31, 2012, the cost of investments for federal income tax purposes, and the aggregate unrealized appreciation and depreciation based on that cost was as follows:
| | | April 30,
2012 | | March 31,
2012 | |
Aggregate unrealized
appreciation | | $ | 48,413,639 | | | $ | 35,133,134 | | |
Aggregate unrealized
depreciation | | | (10,162,585 | ) | | | (11,927,163 | ) | |
Net unrealized
appreciation | | | 38,251,054 | | | | 23,205,971 | | |
Cost of investments
for tax purposes | | $ | 1,414,754,946 | | | $ | 1,442,003,044 | | |
The following capital loss carryforward, determined at April 30, 2012 and March 31, 2012, may be available to reduce taxable income arising from future net realized gains on investments, if any, to the extent permitted by the Internal Revenue Code:
| Year of Expiration | | April 30,
2012
Amount | | March 31,
2012
Amount | |
| Unlimited short-term | | $ | 118,581 | | | $ | — | | |
| Unlimited long-term | | | 93,133 | | | | — | | |
| Total | | $ | 211,714 | | | $ | — | | |
43
Columbia Corporate Income Fund, April 30, 2012
On December 22, 2010, the Regulated Investment Company Modernization Act of 2010 (the Act) was enacted, which changed various technical rules governing the tax treatment of regulated investment companies. The changes are generally effective for taxable years beginning after the date of enactment. Under the Act, the Fund will be permitted to carry forward capital losses incurred in taxable years beginning after the date of enactment for an unlimited period. However, any losses incurred during those future taxable years will be required to be utilized prior to the losses incurred in pre-enactment taxable years, which carry an expiration date. As a result of this ordering rule, pre-enactment capital loss carryforwards may be more likely to expire unused.
For the year ended March 31, 2012, $29,612,869 of capital loss carryforward was utilized.
Management of the Fund has concluded that there are no significant uncertain tax positions that would require recognition in the financial statements. However, management's conclusion may be subject to review and adjustment at a later date based on factors including, but not limited to, new tax laws, regulations, and administrative interpretations (including relevant court decisions). Generally, the Fund's federal tax returns for the prior three fiscal years remain subject to examination by the Internal Revenue Service.
Note 5. Portfolio Information
For the period April 1, 2012 to April 30, 2012, the cost of purchases and proceeds from sales of securities, excluding short-term obligations, aggregated to $114,223,187 and $84,335,891, respectively, of which $32,997,515 and $59,135,608, respectively, were U.S. government securities.
For the year ended March 31, 2012, the cost of purchases and proceeds from sales of securities, excluding short-term obligations, aggregated to $2,344,123,974 and $1,747,261,985, respectively, of which $455,637,867 and $441,986,192, respectively, were U.S. government securities.
Note 6. Lending of Portfolio Securities
Effective June 27, 2011, the Fund has entered into a Master Securities Lending Agreement (the Agreement) with JPMorgan Chase Bank, N.A. (JPMorgan). The Agreement, which replaces the previous securities lending arrangement with State Street, authorizes JPMorgan as lending agent to lend securities to authorized borrowers in order to generate additional income on behalf of the Fund. Pursuant to the Agreement, the securities loaned are secured by cash or U.S. government securities equal to at least 100% of the market value of the loaned securities. Any additional collateral required to maintain those levels due to market fluctuations of the loaned securities is requested to be delivered the following business day. Cash collateral received is invested by the lending agent on behalf of the Fund into authorized investments pursuant to the Agreement. The investments made with the cash collateral are listed in the Portfolio of Investments. The values of such investments and any uninvested cash collateral are disclosed in the Statement of Assets and Liabilities along with the related obligation to return the collateral upon the return of the securities loaned.
Risks of delay in recovery of securities or even loss of rights in the securities may occur should the borrower of the securities fail financially. Risks may also arise to the extent that the value of the securities loaned increases above the value of the collateral received. JPMorgan will indemnify the Fund from losses resulting from a borrower's failure to return a loaned security when due. Such indemnification does not extend to losses associated with declines in the value of cash collateral investments. The Investment Manager is not responsible for any losses incurred by the Fund in connection with the securities lending program. Loans are subject to termination by the Fund or the borrower at any time, and are, therefore, not considered to be illiquid investments.
Pursuant to the Agreement, the Fund receives income for lending its securities either in the form of fees or by earning interest on invested cash collateral, net of negotiated rebates paid to borrowers and fees paid to the lending agent for services provided and any other securities lending expenses. Net income earned from securities lending for the period ended April 30, 2012 and the year ended March 31, 2012 is disclosed in the Statement of Operations. The Fund continues to earn and accrue interest and dividends on the securities loaned.
Prior to June 27, 2011, the Fund participated in a securities lending arrangement with State Street. Each security on loan was collateralized in an amount at least equal to the market value of the securities loaned plus accrued income from the investment of collateral. The income generated by the
44
Columbia Corporate Income Fund, April 30, 2012
investment of the collateral, net of any fees remitted to State Street as the lending agent and borrower rebates, was paid to the Fund.
At April 30, 2012, securities valued at $79,760,873 were on loan, secured by U.S. government securities valued at $25,664,491 and by cash collateral of $55,676,780 (which does not reflect calls for collateral made to borrowers by JPMorgan at period end) that is partially or fully invested in short-term securities or other cash equivalents.
At March 31, 2012, securities valued at $80,252,619 were on loan, secured by U.S. government securities valued at $27,026,445 and by cash collateral of $55,349,048 (which does not reflect calls for collateral made to borrowers by JPMorgan at period end) that is partially or fully invested in short-term securities or other cash equivalents.
Note 7. Custody Credits
Prior to June 27, 2011, the Fund had an agreement with its custodian bank under which custody fees may have been reduced by balance credits. These credits are recorded as part of expense reductions on the Statement of Operations. The Fund could have invested a portion of the assets utilized in connection with the expense offset arrangement in an income-producing asset if they had not entered into such an agreement. Subsequent to this date, the Fund may invest its daily balance in an affiliated money market fund as detailed below. For the period April 1, 2011 through June 26, 2011, these credits reduced total expenses by $16.
Note 8. Affiliated Money Market Fund
Effective June 27, 2011, the Fund may invest its daily cash balances in Columbia Short-Term Cash Fund, an affiliated money market fund established for the exclusive use by the Fund and other affiliated funds. The income earned by the Fund from such investments is included as "Dividends from affiliates" in the Statement of Operations. As an investing fund, the Fund indirectly bears its proportionate share of the expenses of Columbia Short-Term Cash Fund.
Note 9. Shareholder Concentration
At April 30, 2012 and March 31, 2012, two unaffiliated shareholder accounts owned 42.8% of the outstanding shares of the Fund. The Fund has no knowledge about whether any portion of those shares was owned beneficially by such accounts. Affiliated shareholder accounts owned 40.9% and 40.7% at April 30, 2012 and March 31, 2012, respectively, of the outstanding shares of the Fund. Subscription and redemption activity by concentrated accounts may have a significant effect on the operations of the Fund.
Note 10. Line of Credit
The Fund has entered into a revolving credit facility with a syndicate of banks led by JPMorgan Chase Bank, N.A. (the Administrative Agent), whereby the Fund may borrow for the temporary funding of shareholder redemptions or for other temporary or emergency purposes. The credit facility became effective on June 27, 2011, replacing a prior credit facility. The credit facility agreement, as amended, which is a collective agreement between the Fund and certain other funds managed by the Investment Manager, severally and not jointly, permits collective borrowings up to $500 million. Pursuant to a December 13, 2011 amendment to the credit facility agreement, interest is charged to each participating fund based on its borrowings at a rate equal to the higher of (i) the overnight federal funds rate plus 1.00% or (i) the one-month LIBOR rate plus 1.00%. Each borrowing under the credit facility matures no later than 60 days after the date of borrowing. The Fund also pays a commitment fee equal to its pro rata share of the amount of the credit facility at a rate of 0.08% per annum. For the period June 27, 2011 through December 12, 2011, interest was charged to each participating fund based on its borrowings at a rate equal to the sum of the federal funds rate plus (i) 1.25% per annum plus (ii) if one-month LIBOR exceeds the federal funds rate, the amount of such excess. The Fund also paid a commitment fee equal to its pro rata share of the amount of the credit facility at a rate of 0.10% per annum.
For the period May 16, 2011 through June 26, 2011, the Fund and certain other funds managed by the Investment Manager participated in a $150 million committed, unsecured revolving credit facility provided by State Street. Prior to May 16, 2011, the collective borrowing amount of the credit facility was $225 million. Interest was charged to each fund based on its borrowings at a rate equal to the greater of the (i) federal funds rate plus 1.25% per annum or (ii) the overnight LIBOR rate plus 1.25% per annum. The Fund also paid a commitment fee equal to its pro rata share of the amount of the credit facility at a rate of 0.125% per annum. The Fund had no borrowings during the period ended April 30, 2012.
45
Columbia Corporate Income Fund, April 30, 2012
For the year ended March 31, 2012, the average daily loan balance outstanding on days when borrowing existed was $2,200,000 at a weighted average interest rate of 1.39%.
Note 11. Significant Risks
High Yield Securities Risk
Investing in high-yield fixed income securities may involve greater credit risk and considerations not typically associated with investing in U.S. Government bonds and other higher quality fixed income securities. These securities are non-investment grade securities, often referred to as "junk" bonds. Economic downturns may disrupt the high yield market and impair the ability of issuers to repay principal and interest. Also, an increase in interest rates would likely have an adverse impact on the value of such obligations. Moreover, high-yield securities may be less liquid to the extent that there is no established secondary market.
Sector Focus Risk
The Fund may focus its investments in certain sectors, subjecting it to greater risk than a fund that invests in a wider range of industries.
Asset-Backed Securities Risk
The value of asset-backed securities may be affected by, among other factors, changes in interest rates, the market's assessment of the quality of underlying assets, the creditworthiness of the servicer for the underlying assets, factors concerning the interests in and structure of the issuer or the originator of the underlying assets, or the creditworthiness or rating of the entities that provide any supporting letters of credit, surety bonds, derivative instruments, or other credit enhancement. The value of asset-backed securities also will be affected by the exhaustion, termination or expiration of any credit enhancement. Most asset-backed securities are subject to prepayment risk, which is the possibility that the underlying debt may be refinanced or prepaid prior to maturity during periods of declining or low interest rates, causing the Fund to have to reinvest the money received in securities that have lower yields. In addition, the impact of prepayments on the value of asset-backed securities may be difficult to predict and may result in greater volatility.
Note 12. Subsequent Events
Management has evaluated the events and transactions that have occurred through the date the financial statements were issued and noted no items requiring adjustment of the financial statements or additional disclosure.
Note 13. Information Regarding Pending and Settled Legal Proceedings
In December 2005, without admitting or denying the allegations, American Express Financial Corporation (AEFC, which is now known as Ameriprise Financial, Inc. (Ameriprise Financial)) entered into settlement agreements with the Securities and Exchange Commission (SEC) and Minnesota Department of Commerce (MDOC) related to market timing activities. As a result, AEFC was censured and ordered to cease and desist from committing or causing any violations of certain provisions of the Investment Advisers Act of 1940, the Investment Company Act of 1940, and various Minnesota laws. AEFC agreed to pay disgorgement of $10 million and civil money penalties of $7 million. AEFC also agreed to retain an independent distribution consultant to assist in developing a plan for distribution of all disgorgement and civil penalties ordered by the SEC in accordance with various undertakings detailed at www.sec.gov/litigation/admin/ia-2451.pdf. Ameriprise Financial and its affiliates have cooperated with the SEC and the MDOC in these legal proceedings, and have made regular reports to the funds' Boards of Trustees.
Ameriprise Financial and certain of its affiliates have historically been involved in a number of legal, arbitration and regulatory proceedings, including routine litigation, class actions, and governmental actions, concerning matters arising in connection with the conduct of their business activities. Ameriprise Financial believes that the Funds are not currently the subject of, and that neither Ameriprise Financial nor any of its affiliates are the subject of, any pending legal, arbitration or regulatory proceedings that are likely to have a material adverse effect on the Funds or the ability of Ameriprise Financial or its affiliates to perform under their contracts with the Funds. Ameriprise Financial is required to make 10-Q, 10-K and, as necessary, 8-K filings with the Securities and Exchange Commission on legal and regulatory matters that relate to Ameriprise Financial and its affiliates.
46
Columbia Corporate Income Fund, April 30, 2012
Copies of these filings may be obtained by accessing the SEC website at www.sec.gov.
There can be no assurance that these matters, or the adverse publicity associated with them, will not result in increased fund redemptions, reduced sale of fund shares or other adverse consequences to the Funds. Further, although we believe proceedings are not likely to have a material adverse effect on the Funds or the ability of Ameriprise Financial or its affiliates to perform under their contracts with the Funds, these proceedings are subject to uncertainties and, as such, we are unable to estimate the possible loss or range of loss that may result. An adverse outcome in one or more of these proceedings could result in adverse judgments, settlements, fines, penalties or other relief that could have a material adverse effect on the consolidated financial condition or results of operations of Ameriprise Financial.
47
Report of Independent Registered Public Accounting Firm
To the Trustees of Columbia Funds Series Trust I and the Shareholders of Columbia Corporate Income Fund
In our opinion, the accompanying statement of assets and liabilities, including the portfolio of investments, and the related statements of operations and of changes in net assets and the financial highlights present fairly, in all material respects, the financial position of Columbia Corporate Income Fund (the "Fund") (a series of Columbia Funds Series Trust I) at April 30, 2012 and at March 31, 2012, the results of its operations, the changes in its net assets and the financial highlights for each of the periods indicated, in conformity with accounting principles generally accepted in the United States of America. These financial statements and financial highlights (hereafter referred to as "financial statements") are the responsibility of the Fund's management. Our responsibility is to express an opinion on these financial statements based on our audits. We conducted our audits of these financial statements in accordance with the standards of the Public Company Accounting Oversight Board (United States). Those standards require that we plan and perform the audit to obtain reasonable assurance about whether the financial statements are free of material misstatement. An audit includes examining, on a test basis, evidence supporting the amounts and disclosures in the financial statements, assessing the accounting principles used and significant estimates made by management, and evaluating the overall financial statement presentation. We believe that our audits, which included confirmation of securities at April 30, 2012 and at March 31, 2012 by correspondence with the custodian, transfer agent and brokers, provide a reasonable basis for our opinion.
PricewaterhouseCoopers LLP
Minneapolis, Minnesota
June 8, 2012
48
Federal Income Tax Information (Unaudited) – Columbia Corporate Income Fund
The Fund hereby designates as a capital gain dividend with respect to the fiscal year ended March 31, 2012, $167,232, or, if subsequently determined to be different, the net capital gain of such year.
The Fund will notify shareholders in January 2013 of amounts for use in preparing 2012 income tax returns.
49
Fund Governance
The Trustees serve terms of indefinite duration. The names, addresses and birth years of the Trustees and Officers of the Funds in Columbia Funds Series Trust I, the year each was first elected or appointed to office, their principal business occupations during at least the last five years, the number of Funds overseen by each Trustee and other directorships they hold are shown below. Each officer listed below serves as an officer of each Fund in Columbia Funds Series Trust I.
Independent Trustees
Name, Address and Year of Birth,
Position with Funds, Year First
Elected or Appointed to Office | | Principal Occupation(s) During Past Five Years, Number of Funds in Columbia
Funds Complex Overseen by Trustee, Other Directorships Held
| |
| Rodman L. Drake (Born 1943) | |
|
c/o Columbia Management Investment Advisers, LLC
225 Franklin Street
Boston, MA 02110
Trustee (since 1994) and
Chairman of the Board (since 2009) | | Independent consultant since 2010; Co-Founder of Baringo Capital LLC (private equity) from 1997 to 2008; CEO of Crystal River Capital, Inc. (real estate investment trust) from 2003 to 2010; Oversees 51; Jackson Hewitt Tax Service Inc. (tax preparation services from 2004 to 2011); Celgene Corporation (global biotechnology company); Student Loan Corporation (student loan provider from 2008 to 2010); Celgene Corporation (global biotechnology company); The Helios Funds and Brookfield Funds (closed-end funds); Crystal River Capital, Inc. from 2005 to 2010; Parson Brinckerhoff from 1995 to 2008; and Apex Silver Mines Ltd. from 2007 to 2009 | |
|
| Douglas A. Hacker (Born 1955) | |
|
c/o Columbia Management Investment Advisers, LLC
225 Franklin Street
Boston, MA 02110
Trustee (since 1996) | | Independent business executive since May 2006; Executive Vice President—Strategy of United Airlines from December 2002 to May 2006; President of UAL Loyalty Services (airline marketing company) from September 2001 to December 2002; Executive Vice President and Chief Financial Officer of United Airlines from July 1999 to September 2001. Oversees 51; Nash Finch Company (food distributor); Aircastle Limited (aircraft leasing); and SeaCube Container Leasing Ltd (container leasing) | |
|
| Janet Langford Kelly (Born 1957) | |
|
c/o Columbia Management Investment Advisers, LLC
225 Franklin Street
Boston, MA 02110
Trustee (since 1996) | | Senior Vice President, General Counsel and Corporate Secretary, ConocoPhillips (integrated energy company) since September 2007; Deputy General Counsel—Corporate Legal Services, ConocoPhillips from August 2006 to August 2007; Partner, Zelle, Hofmann, Voelbel, Mason & Gette LLP (law firm) from March 2005 to July 2006; Adjunct Professor of Law, Northwestern University, from September 2004 to June 2006; Director, UAL Corporation (airline) from February 2006 to July 2006; Chief Administrative Officer and Senior Vice President, Kmart Holding Corporation (consumer goods) from September 2003 to March 2004. Oversees 51; None | |
|
| Nancy T. Lukitsh (Born 1956) | |
|
c/o Columbia Management Investment Advisers, LLC
225 Franklin Street
Boston, MA 02110
Trustee (since 2011) | | Senior Vice President, Partner and Director of Marketing, Wellington Management Company, LLP (investment adviser) from 1997 to 2010; Chair, Wellington Management Investment Portfolios (commingled non-U.S. investment pools) from 2007 to 2010; Director, Wellington Trust Company, NA and other Wellington affiliates from 1997 to 2010. Oversees 51; None | |
|
| William E. Mayer (Born 1940) | |
|
c/o Columbia Management Investment Advisers, LLC
225 Franklin Street
Boston, MA 02110
Trustee (since 1994) | | Partner, Park Avenue Equity Partners (private equity) since February 1999; Dean and Professor, College of Business and Management, University of Maryland from 1992 to 1996. Oversees 51; DynaVox Inc. (speech creation); Lee Enterprises (print media); WR Hambrecht + Co. (financial service provider) from 2000 to 2012; BlackRock Kelso Capital Corporation (investment company) | |
|
50
Fund Governance (continued)
Independent Trustees (continued)
Name, Address and Year of Birth,
Position with Funds, Year First
Elected or Appointed to Office | | Principal Occupation(s) During Past Five Years, Number of Funds in Columbia
Funds Complex Overseen by Trustee, Other Directorships Held
| |
| David M. Moffett (Born 1952) | |
|
c/o Columbia Management Investment Advisers, LLC
225 Franklin Street
Boston, MA 02110
Trustee (since 2011) | | Retired. Chief Executive Officer, Federal Home Loan Mortgage Corporation, from 2008 to 2009; Senior Adviser, Global Financial Services Group, Carlyle Group, Inc., from 2007 to 2008; Vice Chairman and Chief Financial Officer, U.S. Bancorp, from 1993 to 2007. Oversees 51; CIT Group Inc. (commercial and consumer finance), eBay Inc. (online trading community), MBIA Corp (financial service provider), E.W. Scripps Co. (print and television media), Building Materials Holding Corp. (building materials and construction services), and University of Oklahoma Foundation. | |
|
| Charles R. Nelson (Born 1942) | |
|
c/o Columbia Management Investment Advisers, LLC
225 Franklin Street
Boston, MA 02110
Trustee (since 1981) | | Retired Professor Emeritus, University of Washington, since 2011; Professor of Economics, University of Washington, from January 1976 to 2011; Ford and Louisa Van Voorhis Professor of Political Economy, University of Washington, from 1993 to 2011; Adjunct Professor of Statistics, University of Washington, from 1980 to 2011; Associate Editor, Journal of Money Credit and Banking from 1993 to 2008; consultant on econometric and statistical matters. Oversees 51; None | |
|
| John J. Neuhauser (Born 1943) | |
|
c/o Columbia Management Investment Advisers, LLC
225 Franklin Street
Boston, MA 02110
Trustee (since 1984) | | President, Saint Michael's College, since August 2007; Director or Trustee of several non-profit organizations, including Fletcher Allen Health Care, Inc.; University Professor, Boston College from November 2005 to August 2007; Academic Vice President and Dean of Faculties, Boston College from August 1999 to October 2005. Oversees 51; Liberty All-Star Equity Fund and Liberty All-Star Growth Fund (closed-end funds) | |
|
| Patrick J. Simpson (Born 1944) | |
|
c/o Columbia Management Investment Advisers, LLC
225 Franklin Street
Boston, MA 02110
Trustee (since 2000) | | Partner, Perkins Coie LLP (law firm). Oversees 51; None | |
|
| Anne-Lee Verville (Born 1945) | |
|
c/o Columbia Management Investment Advisers, LLC
225 Franklin Street
Boston, MA 02110
Trustee (since 1998) | | Retired. General Manager—Global Education Industry from 1994 to 1997, President—Application Systems Division from 1991 to 1994, Chief Financial Officer—US Marketing & Services from 1988 to 1991, and Chief Information Officer from 1987 to 1988, IBM Corporation (computer and technology). Oversees 51; Enesco Group, Inc. (producer of giftware and home and garden decor products) from 2001 to 2006 | |
|
The Statement of Additional Information includes additional information about the Trustees of the Funds and is available, without charge, upon request by calling 1-800-345-6611.
51
Fund Governance (continued)
Interested Trustee
Name, address and year of birth,
Position with funds, Year first
elected or appointed to office | | Principal occupation(s) during past five years, Number of funds in Columbia Funds
Complex overseen by trustee, Other directorships held | |
| William F. Truscott (born 1960) | |
|
53600 Ameriprise Financial Center
Minneapolis, MN 55474
Senior Vice President (since 2010) | | Chairman of the Board and President, Columbia Management Investment Advisers, LLC since May 2010 and February 2012, respectively (previously President, Chairman of the Board and Chief Investment Officer, from 2001 to April 2010); Chief Executive Officer, U.S. Asset Management & President, Annuities, Ameriprise Financial, Inc. since May 2010 (previously President—U.S. Asset Management and Chief Investment Officer from 2005 to April 2010, and Senior Vice President—Chief Investment Officer, from 2001 to 2005); Director, President and Chief Executive Officer, Ameriprise Certificate Company since 2006; Director, Columbia Management Investment Distributors, Inc. since May 2010 and February 2012, respectively (previously Chairman of the Board and Chief Executive Officer from 2008 to April 2010); Chairman of the Board and Chief Executive Officer, RiverSource Distributors, Inc. since 2006. Oversees 51; Columbia Funds Board. | |
|
Officers
| Name, Year of Birth and Address | | Principal Occupation(s) During the Past Five Years | |
| J. Kevin Connaughton (Born 1964) | |
|
225 Franklin Street
Boston, MA 02110
President (since 2009) | | Senior Vice President and General Manager—Mutual Fund Products, Columbia Management Investment Advisers, LLC since May 2010; President, Columbia Funds, since 2009, and RiverSource Funds, since May 2010 (previously Senior Vice President and Chief Financial Officer, Columbia Funds, from June 2008 to January 2009, Treasurer, Columbia Funds, from October 2003 to May 2008, and senior officer of various other affiliated funds since 2000); Managing Director, Columbia Management Advisors, LLC from December 2004 to April 2010. | |
|
| Michael G. Clarke (Born 1969) | |
|
225 Franklin Street
Boston, MA 02110
Treasurer (since 2011) and Chief Financial Officer (since 2009) | | Vice President, Columbia Management Investment Advisers, LLC since May 2010; Managing Director of Fund Administration, Columbia Management Advisors, LLC, from September 2004 to April 2010; senior officer of Columbia Funds and affiliated funds since 2002. | |
|
| Scott R. Plummer (Born 1959) | |
|
5228 Ameriprise Financial Center
Minneapolis, MN 55474
Senior Vice President, Assistant Secretary and Chief Legal Officer (since 2010) | | Chief Legal Officer and Assistant Secretary, Columbia Management Investment Advisers, LLC since June 2005; Vice President and Lead Chief Counsel—Asset Management, Ameriprise Financial, Inc. since May 2010 (previously Vice President and Chief Counsel—Asset Management, from 2005 to April 2010; Vice President, Chief Counsel and Assistant Secretary, Columbia Management Investment Distributors, Inc. since 2008; Vice President, General Counsel and Secretary, Ameriprise Certificate Company since 2005; Chief Counsel, RiverSource Distributors, Inc. since 2006; Vice President, General Counsel and Secretary, RiverSource Funds since December 2006; Senior Vice President, Secretary and Chief Legal Officer, Columbia Funds, since May 2010. | |
|
52
Fund Governance (continued)
Officers (continued)
| Name, Year of Birth and Address | | Principal Occupation(s) During the Past Five Years | |
| William F. Truscott (Born 1960) | |
|
53600 Ameriprise Financial Center
Minneapolis, MN 55474
Senior Vice President (since 2010) | | Chairman of the Board and President, Columbia Management Investment Advisers, LLC since May 2010 and February 2012, respectively (previously President, Chairman of the Board and Chief Investment Officer, from 2001 to April 2010); Chief Executive Officer, U.S. Asset Management & President, Annuities, Ameriprise Financial, Inc. since May 2010 (previously President—U.S. Asset Management and Chief Investment Officer from 2005 to April 2010); Director, President and Chief Executive Officer, Ameriprise Certificate Company since 2006; Director and Chief Executive Officer, Columbia Management Investment Distributors, Inc. since May 2010 and February 2012, respectively (previously Chairman of the Board and Chief Executive Officer from 2008 to April 2010); Chairman of the Board and Chief Executive Officer, RiverSource Distributors, Inc. since 2006. | |
|
| Thomas P. McGuire (Born 1972) | |
|
225 Franklin Street
Boston, MA 02110
Chief Compliance Officer (since 2012) | | Vice President—Asset Management Compliance, Columbia Management Investment Advisers, LLC since 2010; Chief Compliance Officer. Ameriprise Certificate Company, since September 2010; Compliance Executive, Bank of America, 2005-2010. | |
|
| Colin Moore (Born 1958) | |
|
225 Franklin Street
Boston, MA 02110
Senior Vice President (since 2010) | | Director and Chief Investment Officer, Columbia Management Investment Advisers, LLC since May 2010; Manager, Managing Director and Chief Investment Officer of Columbia Management Advisors, LLC from 2007 to April 2010; Head of Equities, Columbia Management Advisors, LLC from 2002 to 2007. | |
|
| Amy Johnson (Born 1965) | |
|
5228 Ameriprise Financial Center
Minneapolis, MN 55474
Vice President (since 2010) | | Senior Vice President and Chief Operating Officer, Columbia Management Investment Advisers, LLC since May 2010 (previously Chief Administrative Officer, from 2009 until April 2010, Vice President—Asset Management and Trust Company Services, from 2006 to 2009, and Vice President—Operations and Compliance from 2004 to 2006). | |
|
| Joseph F. DiMaria (Born 1968) | |
|
225 Franklin Street
Boston, MA 02110
Vice President (since 2011) and Chief Accounting Officer (since 2008) | | Vice President, Mutual Fund Administration, Columbia Management Investment Advisers, LLC, since May 2010; Director of Fund Administration, Columbia Management Advisors, LLC from January 2006 to April 2010; Head of Tax/Compliance and Assistant Treasurer, Columbia Management Advisors, LLC, from November 2004 to December 2005. | |
|
| Stephen T. Welsh (born 1957) | |
|
225 Franklin Street
Boston, MA 02110
Vice President (since 2006) | | President and Director, Columbia Management Investment Services Corp. since May 2010; President and Director, Columbia Management Services, Inc. from July 2004 to April 2010; Managing Director, Columbia Management Distributors, Inc. from August 2007 to April 2010. | |
|
| Paul D. Pearson (born 1956) | |
|
5228 Ameriprise Financial Center
Minneapolis, MN 55474
Vice President and Assistant Treasurer (since 2011) | | Vice President, Investment Accounting, Columbia Management Investment Advisers, LLC, since May 2010; Vice President, Managed Assets, Investment Accounting, Ameriprise Financial Corporation. | |
|
53
Fund Governance (continued)
Officers (continued)
| Name, Year of Birth and Address | | Principal Occupation(s) During the Past Five Years | |
| Paul B. Goucher (born 1968) | |
|
5228 Ameriprise Financial Center
Minneapolis, MN 55474
Vice President and Assistant Secretary (since 2010) | | Vice President and Chief Counsel of Ameriprise Financial since January 2010 (formerly Vice President and Group Counsel from November 2008 to January 2010); Director, Managing Director and General Counsel of J. & W. Seligman & Co. Incorporated (Seligman) from July 2008 to November 2008 and Managing Director and Associate General Counsel of Seligman from January 2005 to July 2008. | |
|
| Christopher O. Petersen (born 1970) | |
|
5228 Ameriprise Financial Center
Minneapolis, MN 55474
Vice President (since 2010) and Secretary (since 2011) | | Vice President and Chief Counsel, Ameriprise Financial since January 2010 (formerly Vice President and Group Counsel or Counsel from April 2004 to January 2010); Assistant Secretary of RiverSource Funds since January 2007; officer of Columbia Funds and affiliated funds since 2007. | |
|
| Michael E. DeFao (born 1968) | |
|
225 Franklin Street
Boston, MA 02110
Vice President and Assistant Secretary (since 2011) | | Vice President and Chief Counsel, Ameriprise Financial since May 2010; Associate General Counsel Bank of America from June 2005 to April 2010 | |
|
54
This page intentionally left blank.
55
This page intentionally left blank.
56
Important Information About This Report
The fund mails one shareholder report to each shareholder address. If you would like more than one report, please call shareholder services at 1-800-345-6611 and additional reports will be sent to you. This report has been prepared for shareholders of Columbia Corporate Income Fund.
A description of the policies and procedures that the fund uses to determine how to vote proxies and a copy of the fund's voting records are available (i) at www.columbiamanagement.com, (ii) on the Securities and Exchange Commission's website at www.sec.gov, and (iii) without charge, upon request, by calling 1-800-368-0346. Information regarding how the fund voted proxies relating to portfolio securities during the 12-month period ended June 30 is available from the SEC's website. Information regarding how the fund voted proxies relating to portfolio securities is also available from the fund's website, www.columbiamanagement.com.
The fund files a complete schedule of portfolio holdings with the SEC for the first and third quarters of each fiscal year on Form N-Q. The fund's Form N-Q is available on the SEC's website at www.sec.gov and may be reviewed and copied at the SEC's Public Reference Room in Washington, D.C. Information on the operation of the Public Reference Room may be obtained by calling 1-800-SEC-0330.
Transfer Agent
Columbia Management Investment
Services Corp.
P.O. Box 8081
Boston, MA 02266-8081
1-800-345-6611
Distributor
Columbia Management Investment
Distributors, Inc.
225 Franklin Street
Boston, MA 02110
Investment Manager
Columbia Management Investment Advisers, LLC
225 Franklin Street
Boston, MA 02110
57

Columbia Corporate Income Fund
P. O. Box 8081
Boston, MA 02266-8081
columbiamanagement.com
This information is for use with concurrent or prior delivery of a fund prospectus. Investors should consider the investment objectives, risks, charges and expenses of a mutual fund carefully before investing. For a free prospectus, which contains this and other important information about the funds, visit columbiamanagement.com. Read the prospectus carefully before investing. The Fund is distributed by Columbia Management Investment Distributors, Inc., member FINRA, and managed by Columbia Management Investment Advisers, LLC.
© 2012 Columbia Management Investment Advisers, LLC. All rights reserved.
C-1181 C (5/12)

Columbia Intermediate Bond Fund
Annual Report for the Period Ended April 30, 2012
Not FDIC insured • No bank guarantee • May lose value
Table of Contents
| Fund Profile | | | 1 | | |
|
| Performance Information | | | 2 | | |
|
| Understanding Your Expenses | | | 3 | | |
|
| Portfolio Managers' Report | | | 4 | | |
|
| Portfolio of Investments | | | 6 | | |
|
Statement of Assets and
Liabilities | | | 31 | | |
|
| Statement of Operations | | | 33 | | |
|
Statement of Changes in
Net Assets | | | 34 | | |
|
| Financial Highlights | | | 36 | | |
|
| Notes to Financial Statements | | | 43 | | |
|
Report of Independent Registered
Public Accounting Firm | | | 59 | | |
|
| Fund Governance | | | 60 | | |
|
Important Information About
This Report | | | 65 | | |
|
The views expressed in this report reflect the current views of the respective parties. These views are not guarantees of future performance and involve certain risks, uncertainties and assumptions that are difficult to predict, so actual outcomes and results may differ significantly from the views expressed. These views are subject to change at any time based upon economic, market or other conditions and the respective parties disclaim any responsibility to update such views. These views may not be relied on as investment advice and, because investment decisions for a Columbia Fund are based on numerous factors, may not be relied on as an indication of trading intent on behalf of any particular Columbia Fund. References to specific securities should not be construed as a recommendation or investment advice.
President's Message

Dear Shareholders,
A stock market rally that commenced in the fourth quarter of 2011 continued into 2012 in the United States and around the world, as all major market regions generated double-digit returns for the three-month period ended March 31, 2012. Volatility declined sharply as European debt fears quieted somewhat and sentiment improved. Returns in developed countries were buoyed by strong results in Germany, Belgium, Austria and the Nordic markets of Denmark, Finland, Norway and Sweden. Under the cloud of its own mounting debt problem, Spain was the only eurozone country to deliver a negative return during the three-month period. Solid economic growth and accommodative monetary policy helped boost gains in emerging markets. The rally in U.S. equities was largely driven by an expansion in "multiples"—an increase in stock prices relative to their earnings. By the end of the first quarter of 2012, stocks no longer appeared as cheap as they were late in 2011. Bonds lagged stocks during the first quarter as investors responded to signs of an improved environment with a greater appetite for risk.
Concerns around the health of the global economy were centered in news headlines focusing on Washington D.C., Europe, China and the Middle East. In the United States, economic indicators remained mixed but generally indicated support for slow, sustainable economic growth. European policymakers have made progress in containing the eurozone debt crisis, though they still have not solved the issue of long-term solvency. The European Central Bank has lowered interest rates and flooded the financial system with liquidity that may provide breathing space for companies to restructure their balance sheets. These massive infusions of liquidity may whet the appetite for risk from investors around the world. However, it has delayed a true reckoning with the European financial situation, as concerns about Spain and Portugal continue to cloud the outlook. These structural challenges that persist in the developed world, and slowing growth in emerging market economies, leave the global economy in a fragile state. Domestic demand, combined with slowing inflationary trends, has also helped to shore up emerging market economies. Joblessness remains low and monetary conditions remain easy.
Despite the challenges and surprises of 2011, we see pockets of strength—and as a result, attractive opportunities—both here and abroad for 2012. We hope to help you capitalize on these opportunities with various articles in our 2012 Perspectives, which is available via the Market Insights tab at columbiamanagement.com. This publication showcases the strong research capabilities and experienced investment teams of Columbia Management and offers a diverse array of investment ideas based on our five key themes for 2012.
Other information and resources available at columbiamanagement.com include:
g detailed up-to-date fund performance and portfolio information
g economic analysis and market commentary
g quarterly fund commentaries
g Columbia Management Investor, our award-winning quarterly newsletter for shareholders
Thank you for your continued support of the Columbia Funds. We look forward to serving your investment needs for many years to come.
Best Regards,

J. Kevin Connaughton
President, Columbia Funds
Investors should consider the investment objectives, risks, charges and expenses of a mutual fund carefully before investing. For a free prospectus, which contains this and other important information about the funds, visit columbiamanagement.com. The prospectus should be read carefully before investing.
Columbia Funds are distributed by Columbia Management Investment Distributors, Inc., member FINRA, and managed by Columbia Management Investment Advisers, LLC.
© 2012 Columbia Management Investment Advisers, LLC. All rights reserved.
Fund Profile – Columbia Intermediate Bond Fund
Summary
g For the 13-month period that ended April 30, 2012, the fund's Class A shares returned 7.80% without sales charge.
g The fund's return was lower than the return of its benchmark, the Barclays Aggregate Bond Index1.
g The fund produced competitive results by selectively reducing risk throughout the period.
Portfolio Management
Carl W. Pappo, lead manager, has co-managed the fund since March 2005. From 1993 until joining Columbia Management Investment Advisers, LLC (the Investment Manager) in May 2010, Mr. Pappo was associated with the fund's previous investment adviser as an investment professional.
Alexander D. Powers has co-managed the fund since May 2010. From 1996 until joining the Investment Manager in May 2010, Mr. Powers was associated with the fund's previous investment adviser as an investment professional.
Brian Lavin has co-managed the fund since May 2010. From 1994 until joining the Investment Manager in May 2010, Mr. Lavin was associated with the fund's previous investment adviser as an investment professional.
Michael Zazzarino has co-managed the fund since May 2010. From 2005 until joining the Investment Manager in May 2010, Mr. Zazzarino was associated with the fund's previous investment adviser as an investment professional.
1The Barclays Aggregate Bond Index is a market value-weighted index that tracks the daily price, coupon, pay-downs and total return performance of fixed-rate, publicly placed, dollar denominated and non-convertible investment grade debt issues with a least $250 million par amount outstanding and with at least one year to final maturity.
Indices are not available for investment, are not professionally managed and do not reflect sales charges, fees, brokerage commissions, taxes or other expenses of investing. Securities in the fund may not match those in an index.
Performance data quoted represents past performance and current performance may be lower or higher. Past performance is no guarantee of future results. The investment return and principal value will fluctuate so that shares, when redeemed, may be worth more or less than the original cost. Please visit www.columbiamanagement.com for daily and most recent month-end performance updates.
Summary
13-month (cumulative) return as of 04/30/12
| | +7.80% | |
|
|  | | | Class A shares
(without sales charge) | |
|
| | +8.91% | |
|
|  | | | Barclays Aggregate Bond Index | |
|
1
Performance Information – Columbia Intermediate Bond Fund
Performance data quoted represents past performance and current performance may be lower or higher. Past performance is no guarantee of future results. The investment return and principal value will fluctuate so that shares, when redeemed, may be worth more or less than the original cost. Please visit www.columbiamanagement.com for daily and most recent month-end performance updates.
Performance of a $10,000 investment 05/01/02 – 04/30/12
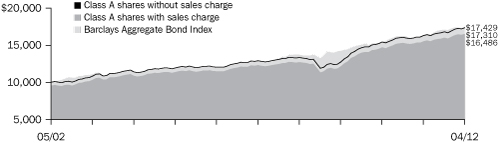
The chart above shows the change in value of a hypothetical $10,000 investment in Class A shares of Columbia Intermediate Bond Fund during the stated time period, and does not reflect the deduction of taxes that a shareholder may pay on fund distributions or on the redemption of fund shares.
Performance of a $10,000 investment 05/01/02 – 04/30/12 ($)
| Sales charge | | without | | with | |
| Class A | | | 17,310 | | | | 16,486 | | |
| Class B | | | 16,066 | | | | 16,066 | | |
| Class C | | | 16,309 | | | | 16,309 | | |
| Class I* | | | 17,782 | | | | n/a | | |
| Class R* | | | 16,883 | | | | n/a | | |
| Class W* | | | 17,396 | | | | n/a | | |
| Class Z | | | 17,746 | | | | n/a | | |
Average annual total return as of 04/30/12 (%)
| Share class | | A | | B | | C | | I* | | R* | | W* | | Z | |
| Inception | | 07/31/00 | | 02/01/02 | | 02/01/02 | | 09/27/10 | | 01/23/06 | | 09/27/10 | | 12/05/78 | |
| Sales charge | | without | | with | | without | | with | | without | | with | | without | | without | | without | | without | |
| 1-month | | | | | | | | | | | | | | | | | | | | | |
| (cumulative) | | | 0.91 | | | | –2.33 | | | | 0.85 | | | | –2.15 | | | | 0.86 | | | | –0.14 | | | | 0.94 | | | | 0.89 | | | | 0.91 | | | | 0.93 | | |
| 1-year | | | 6.47 | | | | 2.99 | | | | 5.68 | | | | 2.68 | | | | 5.85 | | | | 4.85 | | | | 6.83 | | | | 6.21 | | | | 6.47 | | | | 6.74 | | |
| 5-year | | | 6.08 | | | | 5.38 | | | | 5.30 | | | | 5.30 | | | | 5.46 | | | | 5.46 | | | | 6.39 | | | | 5.82 | | | | 6.14 | | | | 6.35 | | |
| 10-year | | | 5.64 | | | | 5.13 | | | | 4.86 | | | | 4.86 | | | | 5.01 | | | | 5.01 | | | | 5.92 | | | | 5.38 | | | | 5.69 | | | | 5.90 | | |
The "with sales charge" returns include the maximum initial sales charge of 3.25% for Class A shares and, the applicable contingent deferred sales charge of 3.00% in the first year, declining to 1.00% in the fourth year and eliminated thereafter for Class B shares and 1.00% for Class C shares for the first year only. The "without sales charge" returns do not include the effect of sales charges. If they had, returns would be lower. Prior to August 22, 2005, new purchases of Class A shares had a maximum initial sales charge of 4.75%. The 5 & 10 year average annual returns with sales charge as of September 30, 2011 include the previous sales charge of 4.75%.
Performance results reflect any fee waivers or reimbursements of fund expenses by Columbia Management Investment Advisors LLC and/or any of its affiliates. Absent these fee waivers or expense reimbursement arrangements, performance results would have been lower.
All results shown assume reinvestment of distributions. Class I and Class Z shares are sold at net asset value with no distribution and service (Rule 12b-1) fees. Class R shares are sold at net asset value with a distribution (12b-1) fee. Class W shares are sold at net asset value with a service (12b-1) fee. Class R, Class I, Class W and Class Z shares have limited eligibility and the investment minimum requirements may vary. Please see the fund's prospectuses for details. Performance for different share classes will vary based on differences in sales charges and fees associated with each class.
The tables do not reflect the deduction of taxes that a shareholder may pay on fund distributions or on the redemption of fund shares.
*The returns shown for periods prior to the share class inception date (including returns since inception) include the returns of the fund's oldest share class. These returns are adjusted to reflect any higher class-related operating expenses of the newer share classes, as applicable. Please visit columbiamanagement.com/mutual-funds/appended-performance for more information.
2
Understanding Your Expenses – Columbia Intermediate Bond Fund
As an investor, you incur two types of costs. There are transaction costs, which generally include sales charges on purchases and may include redemption fees. There are also ongoing costs, which generally include management fees, distribution and service (Rule 12b-1) fees, and other fund expenses. The following information is intended to help you understand your ongoing costs (in dollars) of investing in the Fund and to help you compare these costs with the ongoing costs of investing in other mutual funds.
Analyzing your fund's expenses
To illustrate these ongoing costs, we have provided examples and calculated the expenses paid by investors in each share class of the Fund during the period. The actual and hypothetical information in the table is based on an initial investment of $1,000 at the beginning of the period indicated and held for the entire period. Expense information is calculated two ways and each method provides you with different information. The amount listed in the "Actual" column is calculated using the Fund's actual operating expenses and total return for the period. You may use the Actual information, together with the amount invested, to estimate the expenses that you paid over the period. Simply divide your account value by $1,000 (for example, an $8,600 account value divided by $1,000 = 8.6), then multiply the results by the expenses paid during the period under the Actual column. The amount listed in the "Hypothetical" column assumes a 5% annual rate of return before expenses (which is not the Fund's actual return) and then applies the Fund's actual expense ratio for the period to the hypothetical return. You should not use the hypothetical account values and expenses to estimate either your actual account balance at the end of the period or the expenses you paid during the period. See "Compare with other funds" below for details on how to use the hypothetical data.
Compare with other funds
Since all mutual funds are required to include the same hypothetical calculations about expenses in shareholder reports, you can use this information to compare the ongoing cost of investing in the Fund with other funds. To do so, compare the hypothetical example with the 5% hypothetical examples that appear in the shareholder reports of other funds. As you compare hypothetical examples of other funds, it is important to note that hypothetical examples are meant to highlight the ongoing costs of investing in a fund only and do not reflect any transaction costs, such as sales charges, or redemption or exchange fees. Therefore, the hypothetical calculations are useful in comparing ongoing costs only, and will not help you determine the relative total costs of owning different funds. If transaction costs were included in these calculations, your costs would be higher.
November 1, 2011 – April 30, 2012
| | | Account value at the
beginning of the period ($) | | Account value at the
end of the period ($) | | Expenses paid
during the period ($) | | Fund's annualized
expense ratio (%) | |
| | | Actual | | Hypothetical | | Actual | | Hypothetical | | Actual | | Hypothetical | | Actual | |
| Class A | | | 1,000.00 | | | | 1,000.00 | | | | 1,032.60 | | | | 1,020.69 | | | | 4.25 | | | | 4.22 | | | | 0.84 | | |
| Class B | | | 1,000.00 | | | | 1,000.00 | | | | 1,028.80 | | | | 1,016.96 | | | | 8.02 | | | | 7.97 | | | | 1.59 | | |
| Class C | | | 1,000.00 | | | | 1,000.00 | | | | 1,029.50 | | | | 1,017.70 | | | | 7.27 | | | | 7.22 | | | | 1.44 | | |
| Class I | | | 1,000.00 | | | | 1,000.00 | | | | 1,034.30 | | | | 1,022.33 | | | | 2.58 | | | | 2.56 | | | | 0.51 | | |
| Class R | | | 1,000.00 | | | | 1,000.00 | | | | 1,031.30 | | | | 1,019.44 | | | | 5.51 | | | | 5.47 | | | | 1.09 | | |
| Class W | | | 1,000.00 | | | | 1,000.00 | | | | 1,032.30 | | | | 1,020.49 | | | | 4.45 | | | | 4.42 | | | | 0.88 | | |
| Class Z | | | 1,000.00 | | | | 1,000.00 | | | | 1,033.90 | | | | 1,021.93 | | | | 2.98 | | | | 2.97 | | | | 0.59 | | |
Expenses paid during the period are equal to the annualized expense ratio for each class as indicated above, multiplied by the average account value over the period and then multiplied by the number of days in the Fund's most recent six months and divided by 366.
Expenses do not include fees and expenses incurred indirectly by the Fund from the underlying funds in which the Fund may invest (also referred to as "acquired funds"), including affiliated and non-affiliated pooled investments vehicles (including mutual funds and exchange traded funds).
Had Columbia Management Investment Advisers, LLC and/or certain of its affiliates not waived/reimbursed certain fees and expenses, account value at the end of the period would have been reduced.
3
Portfolio Manager's Report – Columbia Intermediate Bond Fund
Performance data quoted represents past performance and current performance may be lower or higher. Past performance is no guarantee of future results. The investment return and principal value will fluctuate so that shares, when redeemed, may be worth more or less than the original cost. Please visit www.columbiamanagement.com for daily and most recent month-end performance updates.
Portfolio breakdown1
| (at 04/30/12) (%) | |
| Corporate Bonds & Notes | | | 40.2 | | |
| U.S. Treasury Obligations | | | 21.2 | | |
Residential Mortgage-Backed
Securities—Agency | | | 16.0 | | |
Commercial Mortgage-Backed
Securities—Non-Agency | | | 13.4 | | |
| Preferred Debt | | | 2.1 | | |
Asset-Backed
Securities—Non-Agency | | | 1.5 | | |
| Municipal Bonds | | | 1.2 | | |
| Treasury Note Short-Term | | | 1.2 | | |
Foreign Government
Obligations | | | 1.1 | | |
Residential Mortgage-Backed
Securities—Non-Agency | | | 1.1 | | |
| Other2 | | | 0.6 | | |
Asset-Backed
Securities—Agency | | | 0.3 | | |
| Senior Loans | | | 0.1 | | |
| Common Stocks | | | 0.0 | * | |
| Inflation Indexed Bonds | | | 0.0 | * | |
| Warrants | | | 0.0 | * | |
*Rounds to less than 0.1%.
1Percentages indicated are based upon total investments (excluding Investments of Cash Collateral Received for Securities on Loan). The Fund's portfolio composition is subject to change.
2Money Market Funds.
For further detail about these holdings, please refer to the section entitled "Portfolio of Investments."
Quality breakdown1
(at April 30, 2012) (%)
| AAA rating | | | 50.6 | | |
| AA rating | | | 4.0 | | |
| A rating | | | 8.6 | | |
| BBB rating | | | 26.1 | | |
| BB rating | | | 5.6 | | |
| B rating | | | 3.5 | | |
| CCC rating | | | 0.8 | | |
| CC rating | | | 0.1 | | |
| C rating | | | 0.0 | * | |
| Not rated | | | 0.7 | | |
*Rounds to less than 0.1%.
1Percentages indicated are based upon total fixed income securities (excluding Investments of Cash Collateral Received for Securities on Loan and Money Market Funds).
Bond ratings apply to the underlying holdings of the Fund and not the Fund itself and are divided into categories ranging from AAA (highest) to D (lowest), and are subject to change. The ratings shown are determined by using the middle rating of Moody's, S&P, and Fitch after dropping the highest and lowest available ratings. When a rating from only two agencies is available, the lower rating is used. When a rating from only one agency is available, that rating is used. When a bond is not rated by one of these agencies, it is designated as Not rated. Credit ratings are subjective to opinions and not statements of fact.
The Board of Trustees for Columbia Intermediate Bond Fund has approved the change of the fund's fiscal year end from March 31 to April 30. As a result, this report covers the 13-month period since the last annual report. The next report you receive will be for the six-month period from May 1, 2012 through October 31, 2012.
For the 13-month period that ended April 30, 2012, the fund's Class A shares returned 7.80% without sales charge. The fund's return was lower than the 8.91% return of its benchmark, the Barclays Aggregate Bond Index, for the same period. The benchmark's conservative profile gave it an advantage at a time of significant challenges for the global economy.
A period of economic uncertainty
Both at home and abroad, economic growth was uneven during the period. Although the U.S. economy continued to recover and the unemployment rate edged downward, overall growth remained constrained. Meanwhile, the euro zone experienced unprecedented distress emanating originally from budgetary difficulties in Greece, whose perilous finances were then replicated in Portugal, Italy and elsewhere across the continent. Domestic markets understood the risks represented by a weakened Europe and reacted with a significant correction in the summer of 2011. Although corporate bonds and other non-Treasury assets began to recover in the fourth quarter, risk avoidance was a winning investment strategy for the period as a whole, with higher-rated credits outperforming lower-rated ones. The benchmark index, one-third of which consists of Treasury securities, was therefore a good match for the prevailing environment.
Higher risk holdings constrained results
The fund's investments in high-yield bonds and commercial mortgage-backed securities accounted for the slight performance shortfall versus the benchmark, which contains no high-yield component. However, the fund took several steps during the period that helped it reduce risks and remain competitive. As the tenuous nature of the economic recovery became clear, we cut the fund's high-yield position essentially in half, from approximately 7.0% of net assets to just 4.0%. The proceeds of this reduction bolstered the Treasury component, which we raised from approximately 13.0% of net assets in the spring of 2011 to 18.0% by the end of the period. Within the fund's corporate holdings security selection in the financial sector made a positive contribution to performance, as did an underweight position in the consumer cyclical sector, which struggled alongside the uneven recovery. Investments in the utility sector were another strong contributor. The fund also benefited from selective purchases of long-term Treasury securities, which were a major beneficiary of the sluggish economy. With short-term rates stuck at essentially zero, any shift of investor assets into fixed income was directed to the long end of the yield curve, where yields declined and asset values rose.
4
Portfolio Manager's Report (continued) – Columbia Intermediate Bond Fund
Looking ahead
We continue to believe that Europe's sovereign crisis will cast a long shadow on the U.S. economy and on U.S. fixed-income markets, in particular, justifying the portfolio's current conservative orientation. The uncertainties created by the 2012 political season provide another reason to keep the fund's risk exposure limited in the near term. We will continue to monitor the economy for signs of inflation, any acceleration of which could push long-term rates higher.
Portfolio characteristics and holdings are subject to change periodically and may not be representative of current characteristics and holdings. The outlook for the fund may differ from that presented for other Columbia Funds.
Investing in fixed-income securities may involve certain risks, including the credit quality of individual issuers, possible prepayments, market or economic developments and yields and share price fluctuations due to changes in interest rates. When interest rates go up, bond prices typically drop, and vice versa.
Investments in high-yield bonds (sometimes referred to as "junk" bonds) offer the potential for high current income and attractive total return, but involve certain risks. Changes in economic conditions or other circumstances may adversely affect a high-yield bond issuer's ability to make principal and interest payments.
5
Portfolio of Investments – Columbia Intermediate Bond Fund
April 30, 2012
(Percentages represent value of investments compared to net assets)
| Issuer | | Coupon
Rate | | Principal
Amount | | Value | |
| Corporate Bonds & Notes(a) 39.6% | |
| Aerospace & Defense 0.5% | |
ADS Tactical, Inc.
Senior Secured(b)(c) | |
| 04/01/18 | | | 11.000 | % | | $ | 1,460,000 | | | $ | 1,496,500 | | |
BE Aerospace, Inc.
Senior Unsecured | |
| 04/01/22 | | | 5.250 | % | | | 520,000 | | | | 527,800 | | |
| Huntington Ingalls Industries, Inc. | |
| 03/15/18 | | | 6.875 | % | | | 585,000 | | | | 618,638 | | |
| 03/15/21 | | | 7.125 | % | | | 476,000 | | | | 503,965 | | |
Kratos Defense & Security Solutions, Inc.
Senior Secured | |
| 06/01/17 | | | 10.000 | % | | | 1,681,000 | | | | 1,807,075 | | |
| L-3 Communications Corp. | |
| 02/15/21 | | | 4.950 | % | | | 8,735,000 | | | | 9,347,332 | | |
| Oshkosh Corp. | |
| 03/01/17 | | | 8.250 | % | | | 71,000 | | | | 77,035 | | |
| 03/01/20 | | | 8.500 | % | | | 675,000 | | | | 732,375 | | |
Raytheon Co.
Senior Unsecured | |
| 08/15/27 | | | 7.200 | % | | | 2,055,000 | | | | 2,738,057 | | |
| TransDigm, Inc. | |
| 12/15/18 | | | 7.750 | % | | | 558,000 | | | | 608,220 | | |
| Total | | | | | | | | | | | 18,456,997 | | |
| Airlines 0.1% | |
| Continental Airlines 1997-1 Class A Pass-Through Trust | |
| 04/01/15 | | | 7.461 | % | | | 1,677,629 | | | | 1,696,502 | | |
| Automotive 0.7% | |
| Allison Transmission, Inc.(b) | |
| 05/15/19 | | | 7.125 | % | | | 476,000 | | | | 497,420 | | |
Chrysler Group LLC/Co-Issuer, Inc.
Secured | |
| 06/15/21 | | | 8.250 | % | | | 446,000 | | | | 461,610 | | |
Chrysler Group LLC/Co-Issuer, Inc.(c)
Secured | |
| 06/15/19 | | | 8.000 | % | | | 704,000 | | | | 728,640 | | |
Dana Holding Corp.
Senior Unsecured | |
| 02/15/19 | | | 6.500 | % | | | 125,000 | | | | 133,750 | | |
| 02/15/21 | | | 6.750 | % | | | 647,000 | | | | 695,525 | | |
| Delphi Corp.(b) | |
| 05/15/21 | | | 6.125 | % | | | 112,000 | | | | 119,280 | | |
| Delphi Corp.(b)(c) | |
| 05/15/19 | | | 5.875 | % | | | 628,000 | | | | 662,540 | | |
Ford Motor Credit Co. LLC
Senior Unsecured | |
| 02/01/21 | | | 5.750 | % | | | 2,312,000 | | | | 2,601,372 | | |
FUEL Trust
Secured(b) | |
| 06/15/16 | | | 3.984 | % | | | 16,325,000 | | | | 16,912,439 | | |
| Lear Corp. | |
| 03/15/18 | | | 7.875 | % | | | 759,000 | | | | 823,515 | | |
| 03/15/20 | | | 8.125 | % | | | 195,000 | | | | 217,912 | | |
Schaeffler Finance BV(b)
Senior Secured | |
| 02/15/17 | | | 7.750 | % | | | 271,000 | | | | 286,797 | | |
| 02/15/19 | | | 8.500 | % | | | 368,000 | | | | 389,160 | | |
| Issuer | | Coupon
Rate | | Principal
Amount | | Value | |
| Corporate Bonds & Notes(a) (continued) | |
| Automotive (cont.) | |
| Visteon Corp.$ | |
| 04/15/19 | | | 6.750 | % | | $ | 1,210,000 | | | $ | 1,246,300 | | |
| Total | | | | | | | | | | | 25,776,260 | | |
| Banking 8.2% | |
Banco de Bogota SA
Senior Unsecured(b) | |
| 01/15/17 | | | 5.000 | % | | | 230,000 | | | | 239,235 | | |
Bank of New York Mellon Corp. (The)
Senior Unsecured | |
| 05/15/19 | | | 5.450 | % | | | 2,725,000 | | | | 3,176,464 | | |
| Barclays Bank PLC(b)(d) | |
| 09/29/49 | | | 7.434 | % | | | 13,027,000 | | | | 13,027,000 | | |
| Barclays Bank PLC(d) | |
| 12/15/49 | | | 6.278 | % | | | 5,580,000 | | | | 4,491,900 | | |
| Capital One Capital III | |
| 08/15/36 | | | 7.686 | % | | | 2,505,000 | | | | 2,526,919 | | |
| Capital One/IV(d) | |
| 02/17/37 | | | 6.745 | % | | | 20,105,000 | | | | 20,105,000 | | |
| Capital One/V | |
| 08/15/39 | | | 10.250 | % | | | 10,945,000 | | | | 11,410,163 | | |
Chinatrust Commercial Bank
Subordinated Notes(b)(d) | |
| 03/29/49 | | | 5.625 | % | | | 3,570,000 | | | | 3,391,500 | | |
Citigroup, Inc.
Senior Unsecured | |
| 01/30/42 | | | 5.875 | % | | | 3,660,000 | | | | 3,893,530 | | |
Discover Bank
Subordinated Notes | |
| 11/18/19 | | | 8.700 | % | | | 8,440,000 | | | | 10,645,414 | | |
| Export Credit Bank of Turkey(b) | |
| 11/04/16 | | | 5.375 | % | | | 500,000 | | | | 507,699 | | |
Fifth Third Bank
Senior Unsecured(d) | |
| 05/17/13 | | | 0.605 | % | | | 2,435,000 | | | | 2,415,744 | | |
HBOS PLC
Subordinated Notes(b) | |
| 05/21/18 | | | 6.750 | % | | | 15,184,000 | | | | 13,952,183 | | |
HSBC Holdings PLC
Senior Unsecured | |
| 01/14/22 | | | 4.875 | % | | | 1,390,000 | | | | 1,498,983 | | |
HSBC USA, Inc.
Subordinated Notes | |
| 09/27/20 | | | 5.000 | % | | | 9,810,000 | | | | 9,933,714 | | |
| JPMorgan Chase & Co.(d) | |
| 04/29/49 | | | 7.900 | % | | | 19,269,000 | | | | 21,111,887 | | |
| JPMorgan Chase Capital XX | |
| 09/29/36 | | | 6.550 | % | | | 17,962,000 | | | | 18,029,357 | | |
| JPMorgan Chase Capital XXII | |
| 02/02/37 | | | 6.450 | % | | | 4,005,000 | | | | 4,005,000 | | |
| JPMorgan Chase Capital XXIII(d) | |
| 05/15/47 | | | 1.503 | % | | | 3,395,000 | | | | 2,512,371 | | |
| JPMorgan Chase Capital XXV | |
| 10/01/37 | | | 6.800 | % | | | 8,385,000 | | | | 8,426,925 | | |
| Lloyds Banking Group PLC(b)(d) | |
| 11/29/49 | | | 6.267 | % | | | 716,000 | | | | 458,240 | | |
| Lloyds TSB Bank PLC | |
| 03/28/17 | | | 4.200 | % | | | 6,415,000 | | | | 6,508,229 | | |
The Accompanying Notes to Financial Statements are an integral part of this statement.
6
Columbia Intermediate Bond Fund
April 30, 2012
(Percentages represent value of investments compared to net assets)
| Issuer | | Coupon
Rate | | Principal
Amount | | Value | |
| Corporate Bonds & Notes(a) (continued) | |
| Banking (cont.) | |
Merrill Lynch & Co., Inc.
Senior Unsecured | |
| 02/05/13 | | | 5.450 | % | | $ | 1,825,000 | | | $ | 1,874,941 | | |
| 04/25/13 | | | 6.150 | % | | | 1,410,000 | | | | 1,467,170 | | |
| Subordinated Notes | |
| 05/02/17 | | | 5.700 | % | | | 4,055,000 | | | | 4,159,161 | | |
| National City Preferred Capital Trust I(c)(d) | |
| 12/31/49 | | | 12.000 | % | | | 22,512,000 | | | | 23,961,773 | | |
| State Street Corp. | |
| 03/15/18 | | | 4.956 | % | | | 19,865,000 | | | | 21,049,788 | | |
| Senior Unsecured | |
| 03/07/16 | | | 2.875 | % | | | 2,390,000 | | | | 2,515,867 | | |
Synovus Financial Corp.
Senior Unsecured | |
| 02/15/19 | | | 7.875 | % | | | 373,000 | | | | 394,448 | | |
| USB Capital XIII Trust | |
| 12/15/39 | | | 6.625 | % | | | 16,595,000 | | | | 16,922,419 | | |
| Wachovia Capital Trust III(d) | |
| 03/29/49 | | | 5.570 | % | | | 3,740,000 | | | | 3,468,850 | | |
Washington Mutual Bank
Subordinated Notes(e)(f)(i) | |
| 01/15/15 | | | 5.125 | % | | | 27,379,000 | | | | 41,069 | | |
Wells Fargo & Co.
Senior Unsecured(d) | |
| 06/15/16 | | | 3.676 | % | | | 20,005,000 | | | | 21,462,224 | | |
| Wells Fargo Capital X | |
| 12/15/36 | | | 5.950 | % | | | 15,160,000 | | | | 15,227,159 | | |
| Total | | | | | | | | | | | 274,812,326 | | |
| Brokerage 0.2% | |
E*Trade Financial Corp.
Senior Unsecured | |
| 12/01/15 | | | 7.875 | % | | | 369,000 | | | | 376,841 | | |
| 11/30/17 | | | 12.500 | % | | | 948,000 | | | | 1,104,420 | | |
Eaton Vance Corp.
Senior Unsecured | |
| 10/02/17 | | | 6.500 | % | | | 2,945,000 | | | | 3,367,667 | | |
Neuberger Berman Group LLC/Finance Corp.(b)
Senior Unsecured | |
| 03/15/20 | | | 5.625 | % | | | 246,000 | | | | 249,075 | | |
| 03/15/22 | | | 5.875 | % | | | 368,000 | | | | 373,520 | | |
| Total | | | | | | | | | | | 5,471,523 | | |
| Building Materials 0.1% | |
Building Materials Corp. of America
Senior Notes(b) | |
| 05/01/21 | | | 6.750 | % | | | 1,070,000 | | | | 1,114,137 | | |
| Gibraltar Industries, Inc. | |
| 12/01/15 | | | 8.000 | % | | | 527,000 | | | | 537,540 | | |
| Interface, Inc. | |
| 12/01/18 | | | 7.625 | % | | | 430,000 | | | | 464,400 | | |
Norcraft Companies LP/Finance Corp.
Secured | |
| 12/15/15 | | | 10.500 | % | | | 465,000 | | | | 434,775 | | |
| Nortek, Inc. | |
| 12/01/18 | | | 10.000 | % | | | 63,000 | | | | 66,465 | | |
| Nortek, Inc.(c) | |
| 04/15/21 | | | 8.500 | % | | | 361,000 | | | | 356,488 | | |
| Total | | | | | | | | | | | 2,973,805 | | |
| Issuer | | Coupon
Rate | | Principal
Amount | | Value | |
| Corporate Bonds & Notes(a) (continued) | |
| Chemicals 1.2% | |
| CF Industries, Inc. | |
| 05/01/18 | | | 6.875 | % | | $ | 469,000 | | | $ | 545,212 | | |
| 05/01/20 | | | 7.125 | % | | | 63,000 | | | | 75,128 | | |
| Celanese U.S. Holdings LLC | |
| 06/15/21 | | | 5.875 | % | | | 64,000 | | | | 68,640 | | |
Dow Chemical Co. (The)
Senior Unsecured | |
| 02/15/15 | | | 5.900 | % | | | 3,730,000 | | | | 4,192,207 | | |
| 11/15/20 | | | 4.250 | % | | | 5,195,000 | | | | 5,513,708 | | |
| 05/15/39 | | | 9.400 | % | | | 125,000 | | | | 195,435 | | |
Hexion U.S. Finance Corp./Nova Scotia ULC
Senior Secured | |
| 02/01/18 | | | 8.875 | % | | | 1,060,000 | | | | 1,110,350 | | |
Hexion US Finance Corp.
Senior Unsecured(b) | |
| 04/15/20 | | | 6.625 | % | | | 1,011,000 | | | | 1,056,495 | | |
Ineos Finance PLC(b)
Senior Secured | |
| 05/15/15 | | | 9.000 | % | | | 898,000 | | | | 960,860 | | |
| 02/15/19 | | | 8.375 | % | | | 563,000 | | | | 603,817 | | |
| Ineos Finance PLC(b)(g) | |
| 05/01/20 | | | 7.500 | % | | | 346,000 | | | | 355,515 | | |
JM Huber Corp.
Senior Unsecured(b) | |
| 11/01/19 | | | 9.875 | % | | | 410,000 | | | | 430,500 | | |
| Koppers, Inc. | |
| 12/01/19 | | | 7.875 | % | | | 161,000 | | | | 173,075 | | |
| Lubrizol Corp. | |
| 02/01/19 | | | 8.875 | % | | | 2,460,000 | | | | 3,367,944 | | |
| LyondellBasell Industries NV(b) | |
| 11/15/21 | | | 6.000 | % | | | 2,212,000 | | | | 2,388,960 | | |
| Senior Notes | |
| 04/15/19 | | | 5.000 | % | | | 16,750,000 | | | | 17,294,375 | | |
| 04/15/24 | | | 5.750 | % | | | 538,000 | | | | 555,485 | | |
| MacDermid, Inc.(b) | |
| 04/15/17 | | | 9.500 | % | | | 594,000 | | | | 620,730 | | |
| Momentive Performance Materials, Inc. | |
| 06/15/14 | | | 12.500 | % | | | 432,000 | | | | 457,920 | | |
Nova Chemicals Corp.
Senior Unsecured | |
| 11/01/16 | | | 8.375 | % | | | 350,000 | | | | 388,500 | | |
| 11/01/19 | | | 8.625 | % | | | 397,000 | | | | 452,580 | | |
| Polypore International, Inc. | |
| 11/15/17 | | | 7.500 | % | | | 550,000 | | | | 577,500 | | |
| Total | | | | | | | | | | | 41,384,936 | | |
| Construction Machinery 0.2% | |
| CNH Capital LLC(b)(c) | |
| 11/01/16 | | | 6.250 | % | | | 1,319,000 | | | | 1,406,384 | | |
| Case New Holland, Inc. | |
| 12/01/17 | | | 7.875 | % | | | 914,000 | | | | 1,064,810 | | |
| Columbus McKinnon Corp. | |
| 02/01/19 | | | 7.875 | % | | | 450,000 | | | | 477,000 | | |
| Manitowoc Co., Inc. (The)(c) | |
| 11/01/20 | | | 8.500 | % | | | 645,000 | | | | 715,950 | | |
Neff Rental LLC/Finance Corp.
Secured(b) | |
| 05/15/16 | | | 9.625 | % | | | 716,000 | | | | 714,210 | | |
The Accompanying Notes to Financial Statements are an integral part of this statement.
7
Columbia Intermediate Bond Fund
April 30, 2012
(Percentages represent value of investments compared to net assets)
| Issuer | | Coupon
Rate | | Principal
Amount | | Value | |
| Corporate Bonds & Notes(a) (continued) | |
| Construction Machinery (cont.) | |
RSC Equipment Rental, Inc./Holdings III LLC
Senior Unsecured | |
| 02/01/21 | | | 8.250 | % | | $ | 275,000 | | | $ | 297,000 | | |
| Terex Corp. | |
| 04/01/20 | | | 6.500 | % | | | 403,000 | | | | 414,082 | | |
UR Financing Escrow Corp.(b)
Secured | |
| 07/15/18 | | | 5.750 | % | | | 331,000 | | | | 342,585 | | |
| Senior Unsecured | |
| 05/15/20 | | | 7.375 | % | | | 274,000 | | | | 287,015 | | |
UR Financing Escrow Corp.(b)(c)
Senior Unsecured | |
| 04/15/22 | | | 7.625 | % | | | 684,000 | | | | 721,620 | | |
| United Rentals North America, Inc. | |
| 06/15/16 | | | 10.875 | % | | | 109,000 | | | | 123,306 | | |
| 12/15/19 | | | 9.250 | % | | | 816,000 | | | | 907,800 | | |
| United Rentals North America, Inc.(c) | |
| 09/15/20 | | | 8.375 | % | | | 450,000 | | | | 473,625 | | |
| Xerium Technologies, Inc. | |
| 06/15/18 | | | 8.875 | % | | | 290,000 | | | | 242,150 | | |
| Total | | | | | | | | | | | 8,187,537 | | |
| Consumer Cyclical Services —% | |
Goodman Networks, Inc.
Senior Secured(b) | |
| 07/01/18 | | | 12.125 | % | | | 440,000 | | | | 443,300 | | |
Realogy Corp.
Senior Secured(b)(c) | |
| 01/15/20 | | | 9.000 | % | | | 384,000 | | | | 390,720 | | |
| Total | | | | | | | | | | | 834,020 | | |
| Consumer Products —% | |
| Jarden Corp. | |
| 01/15/20 | | | 7.500 | % | | | 685,000 | | | | 748,363 | | |
Libbey Glass, Inc.
Senior Secured | |
| 02/15/15 | | | 10.000 | % | | | 276,000 | | | | 294,285 | | |
Spectrum Brands, Inc.
Senior Unsecured(b)(c) | |
| 03/15/20 | | | 6.750 | % | | | 148,000 | | | | 151,330 | | |
| Total | | | | | | | | | | | 1,193,978 | | |
| Diversified Manufacturing 0.2% | |
| Actuant Corp.(b) | |
| 06/15/22 | | | 5.625 | % | | | 295,000 | | | | 303,850 | | |
CPM Holdings, Inc.
Senior Secured | |
| 09/01/14 | | | 10.625 | % | | | 569,000 | | | | 614,520 | | |
Tomkins LLC/Inc.
Secured | |
| 10/01/18 | | | 9.000 | % | | | 967,000 | | | | 1,075,787 | | |
| Tyco International Ltd./Finance SA | |
| 01/15/21 | | | 6.875 | % | | | 2,050,000 | | | | 2,595,751 | | |
| WireCo WorldGroup, Inc. | |
| 05/15/17 | | | 9.500 | % | | | 549,000 | | | | 566,843 | | |
| Total | | | | | | | | | | | 5,156,751 | | |
| Electric 3.2% | |
AES Corp. (The)
Senior Unsecured | |
| 06/01/20 | | | 8.000 | % | | | 406,000 | | | | 466,900 | | |
| Issuer | | Coupon
Rate | | Principal
Amount | | Value | |
| Corporate Bonds & Notes(a) (continued) | |
| Electric (cont.) | |
AES Corp. (The)(b)
Senior Unsecured | |
| 07/01/21 | | | 7.375 | % | | $ | 1,251,000 | | | $ | 1,391,738 | | |
Alabama Power Co.
Senior Unsecured | |
| 03/15/41 | | | 5.500 | % | | | 14,986,000 | | | | 18,490,251 | | |
CMS Energy Corp.
Senior Unsecured | |
| 09/30/15 | | | 4.250 | % | | | 3,690,000 | | | | 3,819,150 | | |
Calpine Corp.
Senior Secured(b) | |
| 02/15/21 | | | 7.500 | % | | | 1,151,000 | | | | 1,234,448 | | |
CenterPoint Energy, Inc.
Senior Unsecured | |
| 02/01/17 | | | 5.950 | % | | | 295,000 | | | | 337,256 | | |
Centrais Eletricas Brasileiras SA
Senior Unsecured(b) | |
| 10/27/21 | | | 5.750 | % | | | 690,000 | | | | 750,375 | | |
Commonwealth Edison Co.
1st Mortgage | |
| 08/15/16 | | | 5.950 | % | | | 6,020,000 | | | | 7,124,170 | | |
| 03/15/36 | | | 5.900 | % | | | 3,570,000 | | | | 4,473,314 | | |
| Senior Unsecured | |
| 07/15/18 | | | 6.950 | % | | | 5,220,000 | | | | 6,325,356 | | |
| Companhia De Eletricidade Do Estad | |
| 04/27/16 | | | 11.750 | % | | BRL | 820,000 | | | | 455,998 | | |
Consolidated Edison Co. of New York, Inc.
Senior Unsecured | |
| 04/01/38 | | | 6.750 | % | | | 4,045,000 | | | | 5,632,764 | | |
DPL, Inc.
Senior Unsecured(b) | |
| 10/15/16 | | | 6.500 | % | | | 193,000 | | | | 209,405 | | |
Exelon Generation Co. LLC
Senior Unsecured | |
| 10/01/17 | | | 6.200 | % | | | 2,790,000 | | | | 3,278,314 | | |
FPL Energy American Wind LLC
Senior Secured(b) | |
| 06/20/23 | | | 6.639 | % | | | 2,164,078 | | | | 2,234,540 | | |
FPL Energy National Wind LLC
Senior Secured(b) | |
| 03/10/24 | | | 5.608 | % | | | 798,430 | | | | 826,360 | | |
GenOn Energy, Inc.
Senior Unsecured | |
| 10/15/18 | | | 9.500 | % | | | 305,000 | | | | 289,750 | | |
Georgia Power Co.
Senior Unsecured | |
| 09/01/40 | | | 4.750 | % | | | 6,980,000 | | | | 7,601,080 | | |
Ipalco Enterprises, Inc.
Senior Secured(b) | |
| 04/01/16 | | | 7.250 | % | | | 850,000 | | | | 926,500 | | |
Midwest Generation LLC
Pass-Through Certificates | |
| 01/02/16 | | | 8.560 | % | | | 51,591 | | | | 50,043 | | |
| Nevada Power Co. | |
| 09/15/40 | | | 5.375 | % | | | 1,450,000 | | | | 1,701,887 | | |
| 05/15/41 | | | 5.450 | % | | | 13,275,000 | | | | 15,847,698 | | |
Niagara Mohawk Power Corp.
Senior Unsecured(b) | |
| 08/15/19 | | | 4.881 | % | | | 3,590,000 | | | | 4,005,072 | | |
The Accompanying Notes to Financial Statements are an integral part of this statement.
8
Columbia Intermediate Bond Fund
April 30, 2012
(Percentages represent value of investments compared to net assets)
| Issuer | | Coupon
Rate | | Principal
Amount | | Value | |
| Corporate Bonds & Notes(a) (continued) | |
| Electric (cont.) | |
Oncor Electric Delivery Co. LLC
Senior Secured | |
| 09/30/40 | | | 5.250 | % | | $ | 6,670,000 | | | $ | 6,759,638 | | |
Pacific Gas & Electric Co.
Senior Unsecured | |
| 01/15/40 | | | 5.400 | % | | | 4,030,000 | | | | 4,664,882 | | |
Southern California Edison Co.
1st Mortgage | |
| 09/01/40 | | | 4.500 | % | | | 4,020,000 | | | | 4,345,065 | | |
Tenaska Alabama II Partners LP
Senior Secured(b) | |
| 03/30/23 | | | 6.125 | % | | | 2,588,530 | | | | 2,938,758 | | |
Windsor Financing LLC
Senior Unsecured(b) | |
| 07/15/17 | | | 5.881 | % | | | 167,413 | | | | 167,939 | | |
| Total | | | | | | | | | | | 106,348,651 | | |
| Entertainment 0.1% | |
| AMC Entertainment, Inc. | |
| 06/01/19 | | | 8.750 | % | | | 630,000 | | | | 671,738 | | |
| 12/01/20 | | | 9.750 | % | | | 185,000 | | | | 180,375 | | |
| Cinemark U.S.A., Inc(c) | |
| 06/15/21 | | | 7.375 | % | | | 140,000 | | | | 151,200 | | |
| Six Flags, Inc.(b)(e)(h)(i) | |
| 06/01/14 | | | 9.625 | % | | | 458,000 | | | | — | | |
| Speedway Motorsports, Inc.(c) | |
| 02/01/19 | | | 6.750 | % | | | 76,000 | | | | 79,420 | | |
| Vail Resorts, Inc. | |
| 05/01/19 | | | 6.500 | % | | | 543,000 | | | | 572,865 | | |
| Total | | | | | | | | | | | 1,655,598 | | |
| Food and Beverage 1.8% | |
ARAMARK Holdings Corp.
Senior Unsecured PIK(b) | |
| 05/01/16 | | | 8.625 | % | | | 135,000 | | | | 138,208 | | |
| Anheuser-Busch InBev Worldwide, Inc. | |
| 01/15/19 | | | 7.750 | % | | | 2,055,000 | | | | 2,718,878 | | |
Coca-Cola Co. (The)
Senior Unsecured | |
| 09/01/21 | | | 3.300 | % | | | 9,984,000 | | | | 10,606,153 | | |
ConAgra Foods, Inc.
Senior Unsecured | |
| 10/01/28 | | | 7.000 | % | | | 7,045,000 | | | | 8,556,941 | | |
General Mills, Inc.
Senior Unsecured | |
| 12/15/21 | | | 3.150 | % | | | 9,115,000 | | | | 9,266,956 | | |
HJ Heinz Co.
Senior Unsecured | |
| 03/01/17 | | | 1.500 | % | | | 8,540,000 | | | | 8,515,815 | | |
| 09/12/21 | | | 3.125 | % | | | 1,240,000 | | | | 1,266,273 | | |
| 03/01/22 | | | 2.850 | % | | | 8,390,000 | | | | 8,308,072 | | |
Hershey Co. (The)
Senior Unsecured | |
| 12/01/20 | | | 4.125 | % | | | 4,315,000 | | | | 4,855,035 | | |
Kraft Foods, Inc.
Senior Unsecured | |
| 02/09/40 | | | 6.500 | % | | | 3,795,000 | | | | 4,759,506 | | |
| Pinnacle Foods Finance LLC/Corp. | |
| 04/01/15 | | | 9.250 | % | | | 146,000 | | | | 149,650 | | |
| Total | | | | | | | | | | | 59,141,487 | | |
| Issuer | | Coupon
Rate | | Principal
Amount | | Value | |
| Corporate Bonds & Notes(a) (continued) | |
| Gaming 0.2% | |
Caesars Entertainment Operating Co., Inc.
Secured | |
| 04/15/18 | | | 12.750 | % | | $ | 450,000 | | | $ | 383,063 | | |
| Senior Secured | |
| 06/01/17 | | | 11.250 | % | | | 843,000 | | | | 931,515 | | |
Caesars Entertainment Operating Co., Inc.(b)(c)
Senior Secured | |
| 02/15/20 | | | 8.500 | % | | | 431,000 | | | | 443,930 | | |
Chester Downs & Marina LLC
Senior Secured(b)(c) | |
| 02/01/20 | | | 9.250 | % | | | 329,000 | | | | 346,273 | | |
MGM Resorts International
Senior Secured | |
| 03/15/20 | | | 9.000 | % | | | 694,000 | | | | 775,545 | | |
| MGM Resorts International(c) | |
| 03/01/18 | | | 11.375 | % | | | 742,000 | | | | 883,907 | | |
Penn National Gaming, Inc.
Senior Subordinated Notes | |
| 08/15/19 | | | 8.750 | % | | | 257,000 | | | | 286,555 | | |
ROC Finance LLC/Corp.
Secured(b) | |
| 09/01/18 | | | 12.125 | % | | | 572,000 | | | | 640,640 | | |
| Seminole Indian Tribe of Florida(b) | |
| 10/01/20 | | | 7.804 | % | | | 755,000 | | | | 738,556 | | |
| Senior Secured | |
| 10/01/20 | | | 6.535 | % | | | 110,000 | | | | 111,967 | | |
| Seneca Gaming Corp.(b) | |
| 12/01/18 | | | 8.250 | % | | | 617,000 | | | | 630,882 | | |
Tunica-Biloxi Gaming Authority
Senior Unsecured(b) | |
| 11/15/15 | | | 9.000 | % | | | 382,000 | | | | 378,180 | | |
| Total | | | | | | | | | | | 6,551,013 | | |
| Gas Distributors 0.2% | |
Atmos Energy Corp.
Senior Unsecured | |
| 06/15/17 | | | 6.350 | % | | | 3,915,000 | | | | 4,613,781 | | |
Sempra Energy
Senior Unsecured | |
| 06/01/16 | | | 6.500 | % | | | 3,130,000 | | | | 3,724,731 | | |
| Total | | | | | | | | | | | 8,338,512 | | |
| Gas Pipelines 2.9% | |
| Copano Energy LLC/Finance Corp. | |
| 04/01/21 | | | 7.125 | % | | | 175,000 | | | | 184,625 | | |
El Paso Corp.
Senior Unsecured | |
| 06/01/18 | | | 7.250 | % | | | 237,000 | | | | 268,995 | | |
| 09/15/20 | | | 6.500 | % | | | 1,845,000 | | | | 2,038,725 | | |
| 01/15/32 | | | 7.750 | % | | | 413,000 | | | | 471,892 | | |
| El Paso Pipeline Partners Operating Co. LLC | |
| 10/01/21 | | | 5.000 | % | | | 11,207,000 | | | | 11,839,613 | | |
| Enterprise Products Operating LLC | |
| 02/01/41 | | | 5.950 | % | | | 9,855,000 | | | | 11,258,894 | | |
| 02/15/42 | | | 5.700 | % | | | 2,565,000 | | | | 2,837,547 | | |
Kinder Morgan Energy Partners LP
Senior Unsecured | |
| 01/15/38 | | | 6.950 | % | | | 3,510,000 | | | | 4,140,891 | | |
The Accompanying Notes to Financial Statements are an integral part of this statement.
9
Columbia Intermediate Bond Fund
April 30, 2012
(Percentages represent value of investments compared to net assets)
| Issuer | | Coupon
Rate | | Principal
Amount | | Value | |
| Corporate Bonds & Notes(a) (continued) | |
| Gas Pipelines (cont.) | |
Kinder Morgan Energy Partners LP(c)
Senior Unsecured | |
| 02/15/15 | | | 5.625 | % | | $ | 2,990,000 | | | $ | 3,310,390 | | |
| 09/01/39 | | | 6.500 | % | | | 4,705,000 | | | | 5,301,406 | | |
| MarkWest Energy Partners LP/Finance Corp. | |
| 06/15/22 | | | 6.250 | % | | | 595,000 | | | | 623,262 | | |
NGPL PipeCo LLC
Senior Unsecured(b)(c) | |
| 12/15/12 | | | 6.514 | % | | | 7,385,000 | | | | 7,358,665 | | |
| NiSource Finance Corp.(c) | |
| 12/15/40 | | | 6.250 | % | | | 4,260,000 | | | | 4,880,708 | | |
| Plains All American Pipeline LP/Finance Corp. | |
| 01/15/20 | | | 5.750 | % | | | 3,465,000 | | | | 4,021,285 | | |
| 01/15/37 | | | 6.650 | % | | | 2,050,000 | | | | 2,444,785 | | |
| Regency Energy Partners LP/Finance Corp. | |
| 06/01/16 | | | 9.375 | % | | | 116,000 | | | | 127,020 | | |
| 12/01/18 | | | 6.875 | % | | | 303,000 | | | | 320,422 | | |
| 07/15/21 | | | 6.500 | % | | | 689,000 | | | | 730,340 | | |
Southern Natural Gas Co LLC./Issuing Corp.
Senior Unsecured | |
| 06/15/21 | | | 4.400 | % | | | 8,305,000 | | | | 8,731,428 | | |
Southern Natural Gas Co. LLC
Senior Unsecured | |
| 03/01/32 | | | 8.000 | % | | | 4,050,000 | | | | 5,228,279 | | |
Southern Star Central Corp.
Senior Unsecured | |
| 03/01/16 | | | 6.750 | % | | | 105,000 | | | | 106,050 | | |
| TransCanada PipeLines Ltd.(d) | |
| 05/15/67 | | | 6.350 | % | | | 15,285,000 | | | | 15,955,889 | | |
Williams Companies, Inc. (The)
Senior Unsecured | |
| 09/01/21 | | | 7.875 | % | | | 145,000 | | | | 184,282 | | |
Williams Partners LP
Senior Unsecured | |
| 04/15/40 | | | 6.300 | % | | | 5,000,000 | | | | 5,939,710 | | |
| Total | | | | | | | | | | | 98,305,103 | | |
| Health Care 1.4% | |
American Renal Associates Holdings, Inc.
Senior Unsecured PIK | |
| 03/01/16 | | | 9.750 | % | | | 88,546 | | | | 93,527 | | |
American Renal Holdings, Inc.
Senior Secured | |
| 05/15/18 | | | 8.375 | % | | | 619,000 | | | | 662,330 | | |
| Biomet, Inc. | |
| 10/15/17 | | | 10.000 | % | | | 510,000 | | | | 550,162 | | |
| CHS/Community Health Systems, Inc.(b)(c) | |
| 11/15/19 | | | 8.000 | % | | | 186,000 | | | | 196,695 | | |
| 11/15/19 | | | 8.000 | % | | | 652,000 | | | | 687,860 | | |
ConvaTec Healthcare E SA
Senior Unsecured(b) | |
| 12/15/18 | | | 10.500 | % | | | 834,000 | | | | 852,765 | | |
| Emdeon, Inc.(b) | |
| 12/31/19 | | | 11.000 | % | | | 440,000 | | | | 497,200 | | |
| Express Scripts Holding Co.(b) | |
| 02/15/17 | | | 2.650 | % | | | 13,478,000 | | | | 13,720,294 | | |
| 02/15/22 | | | 3.900 | % | | | 14,720,000 | | | | 15,148,116 | | |
| Fresenius Medical Care U.S. Finance II, Inc.(b) | |
| 07/31/19 | | | 5.625 | % | | | 165,000 | | | | 167,888 | | |
| 01/31/22 | | | 5.875 | % | | | 213,000 | | | | 216,461 | | |
| Issuer | | Coupon
Rate | | Principal
Amount | | Value | |
| Corporate Bonds & Notes(a) (continued) | |
| Health Care (cont.) | |
| Fresenius Medical Care U.S. Finance, Inc.(b) | |
| 09/15/18 | | | 6.500 | % | | $ | 427,000 | | | $ | 456,890 | | |
| 02/15/21 | | | 5.750 | % | | | 460,000 | | | | 468,050 | | |
HCA, Inc.
Senior Secured | |
| 02/15/20 | | | 6.500 | % | | | 598,000 | | | | 639,860 | | |
| 02/15/20 | | | 7.875 | % | | | 1,286,000 | | | | 1,427,460 | | |
| 09/15/20 | | | 7.250 | % | | | 804,000 | | | | 890,430 | | |
| HCA, Inc.(c) | |
| 02/15/22 | | | 7.500 | % | | | 1,334,000 | | | | 1,435,717 | | |
| Hanger Orthopedic Group, Inc. | |
| 11/15/18 | | | 7.125 | % | | | 578,000 | | | | 600,397 | | |
Health Management Associates, Inc.
Senior Unsecured(b) | |
| 01/15/20 | | | 7.375 | % | | | 345,000 | | | | 359,231 | | |
| Healthsouth Corp. | |
| 02/15/20 | | | 8.125 | % | | | 625,000 | | | | 682,812 | | |
| 09/15/22 | | | 7.750 | % | | | 45,000 | | | | 48,488 | | |
| IASIS Healthcare LLC/Capital Corp. | |
| 05/15/19 | | | 8.375 | % | | | 380,000 | | | | 373,825 | | |
| Kinetic Concepts, Inc./KCI U.S.A., Inc.(b) | |
| 11/01/19 | | | 12.500 | % | | | 378,000 | | | | 347,760 | | |
| Kinetic Concepts, Inc./KCI U.S.A., Inc.(b)(c) | |
| 11/01/18 | | | 10.500 | % | | | 457,000 | | | | 471,281 | | |
| LifePoint Hospitals, Inc. | |
| 10/01/20 | | | 6.625 | % | | | 237,000 | | | | 249,443 | | |
| Multiplan, Inc.(b) | |
| 09/01/18 | | | 9.875 | % | | | 1,001,000 | | | | 1,081,080 | | |
| Omnicare, Inc. | |
| 06/01/20 | | | 7.750 | % | | | 285,000 | | | | 314,925 | | |
| PSS World Medical, Inc.(b) | |
| 03/01/22 | | | 6.375 | % | | | 80,000 | | | | 82,000 | | |
Physio-Control International, Inc.
Senior Secured(b) | |
| 01/15/19 | | | 9.875 | % | | | 408,000 | | | | 433,500 | | |
Physiotherapy Associates Holdings, Inc.
Senior Unsecured(b) | |
| 05/01/19 | | | 11.875 | % | | | 149,000 | | | | 152,353 | | |
| Radnet Management, Inc. | |
| 04/01/18 | | | 10.375 | % | | | 165,000 | | | | 163,763 | | |
Rural/Metro Corp.
Senior Unsecured(b) | |
| 07/15/19 | | | 10.125 | % | | | 247,000 | | | | 232,180 | | |
STHI Holding Corp.
Secured(b) | |
| 03/15/18 | | | 8.000 | % | | | 517,000 | | | | 550,605 | | |
Tenet Healthcare Corp.
Senior Secured | |
| 07/01/19 | | | 8.875 | % | | | 228,000 | | | | 255,645 | | |
USPl Finance Corp.
Senior Unsecured(b) | |
| 04/01/20 | | | 9.000 | % | | | 324,000 | | | | 339,390 | | |
| Vanguard Health Holding Co. II LLC/Inc. | |
| 02/01/18 | | | 8.000 | % | | | 1,270,000 | | | | 1,293,812 | | |
| Vanguard Health Holding Co. II LLC/Inc.(b) | |
| 02/01/19 | | | 7.750 | % | | | 233,000 | | | | 235,330 | | |
| Vanguard Health Holding Co. II LLC/Inc.(c) | |
| 02/01/19 | | | 7.750 | % | | | 130,000 | | | | 130,488 | | |
| Total | | | | | | | | | | | 46,510,013 | | |
The Accompanying Notes to Financial Statements are an integral part of this statement.
10
Columbia Intermediate Bond Fund
April 30, 2012
(Percentages represent value of investments compared to net assets)
| Issuer | | Coupon
Rate | | Principal
Amount | | Value | |
| Corporate Bonds & Notes(a) (continued) | |
| Healthcare Insurance 0.1% | |
AMERIGROUP Corp.
Senior Unsecured | |
| 11/15/19 | | | 7.500 | % | | $ | 248,000 | | | $ | 270,320 | | |
UnitedHealth Group, Inc.
Senior Unsecured | |
| 02/15/18 | | | 6.000 | % | | | 2,265,000 | | | | 2,762,797 | | |
| Total | | | | | | | | | | | 3,033,117 | | |
| Home Construction —% | |
| KB Home(c) | |
| 03/15/20 | | | 8.000 | % | | | 206,000 | | | | 201,108 | | |
Meritage Homes Corp.
Senior Unsecured(b) | |
| 04/01/22 | | | 7.000 | % | | | 224,000 | | | | 227,360 | | |
Shea Homes LP/Funding Corp.
Senior Secured(b) | |
| 05/15/19 | | | 8.625 | % | | | 376,000 | | | | 391,980 | | |
Taylor Morrison Communities, Inc./Monarch
Senior Unsecured(b) | |
| 04/15/20 | | | 7.750 | % | | | 474,000 | | | | 488,220 | | |
| Total | | | | | | | | | | | 1,308,668 | | |
| Independent Energy 1.6% | |
| Anadarko Petroleum Corp.(c) | |
| 03/15/40 | | | 6.200 | % | | | 6,340,000 | | | | 7,392,966 | | |
| Senior Unsecured | |
| 09/15/17 | | | 6.375 | % | | | 7,530,000 | | | | 8,953,772 | | |
| Antero Resources Finance Corp. | |
| 12/01/17 | | | 9.375 | % | | | 26,000 | | | | 28,405 | | |
| Antero Resources Finance Corp.(b) | |
| 08/01/19 | | | 7.250 | % | | | 106,000 | | | | 109,180 | | |
Berry Petroleum Co.
Senior Unsecured | |
| 11/01/20 | | | 6.750 | % | | | 180,000 | | | | 190,350 | | |
| Carrizo Oil & Gas, Inc. | |
| 10/15/18 | | | 8.625 | % | | | 840,000 | | | | 890,400 | | |
| Chaparral Energy, Inc. | |
| 10/01/20 | | | 9.875 | % | | | 197,000 | | | | 221,133 | | |
| 09/01/21 | | | 8.250 | % | | | 603,000 | | | | 642,195 | | |
| Chaparral Energy, Inc.(b)(g) | |
| 11/15/22 | | | 7.625 | % | | | 498,000 | | | | 499,867 | | |
| Chesapeake Energy Corp.(c) | |
| 08/15/20 | | | 6.625 | % | | | 1,505,000 | | | | 1,467,375 | | |
| 11/15/20 | | | 6.875 | % | | | 395,000 | | | | 385,125 | | |
| 02/15/21 | | | 6.125 | % | | | 340,000 | | | | 321,300 | | |
| Cimarex Energy Co. | |
| 05/01/22 | | | 5.875 | % | | | 632,000 | | | | 654,120 | | |
| Concho Resources, Inc. | |
| 10/01/17 | | | 8.625 | % | | | 205,000 | | | | 224,475 | | |
| 01/15/21 | | | 7.000 | % | | | 1,573,000 | | | | 1,710,637 | | |
| 01/15/22 | | | 6.500 | % | | | 224,000 | | | | 236,320 | | |
| Continental Resources, Inc. | |
| 10/01/19 | | | 8.250 | % | | | 28,000 | | | | 31,360 | | |
| 10/01/20 | | | 7.375 | % | | | 68,000 | | | | 75,820 | | |
| 04/01/21 | | | 7.125 | % | | | 476,000 | | | | 530,145 | | |
| Continental Resources, Inc.(b) | |
| 09/15/22 | | | 5.000 | % | | | 1,070,000 | | | | 1,086,050 | | |
Devon Energy Corp.
Senior Unsecured | |
| 01/15/19 | | | 6.300 | % | | | 2,325,000 | | | | 2,872,468 | | |
| Issuer | | Coupon
Rate | | Principal
Amount | | Value | |
| Corporate Bonds & Notes(a) (continued) | |
| Independent Energy (cont.) | |
EnCana Corp.
Senior Unsecured(c) | |
| 11/15/21 | | | 3.900 | % | | $ | 2,565,000 | | | $ | 2,525,817 | | |
Everest Acquisition LLC/Finance, Inc.(b)
Senior Secured | |
| 05/01/19 | | | 6.875 | % | | | 505,000 | | | | 530,250 | | |
Everest Acquisition LLC/Finance, Inc.(b)(c)
Senior Unsecured | |
| 05/01/20 | | | 9.375 | % | | | 619,000 | | | | 659,235 | | |
| Goodrich Petroleum Corp. | |
| 03/15/19 | | | 8.875 | % | | | 360,000 | | | | 348,300 | | |
Hilcorp Energy I LP/Finance Co.(b)
Senior Notes | |
| 02/15/20 | | | 8.000 | % | | | 120,000 | | | | 131,100 | | |
| 04/15/21 | | | 7.625 | % | | | 739,000 | | | | 798,120 | | |
| Kodiak Oil & Gas Corp.(b) | |
| 12/01/19 | | | 8.125 | % | | | 1,365,000 | | | | 1,446,900 | | |
| Laredo Petroleum, Inc. | |
| 02/15/19 | | | 9.500 | % | | | 919,000 | | | | 1,026,982 | | |
| Laredo Petroleum, Inc.(b) | |
| 05/01/22 | | | 7.375 | % | | | 392,000 | | | | 403,760 | | |
| MEG Energy Corp.(b) | |
| 03/15/21 | | | 6.500 | % | | | 713,000 | | | | 750,432 | | |
Nexen, Inc.
Senior Unsecured | |
| 07/30/39 | | | 7.500 | % | | | 5,940,000 | | | | 7,276,637 | | |
| Oasis Petroleum, Inc. | |
| 02/01/19 | | | 7.250 | % | | | 522,000 | | | | 553,320 | | |
| 11/01/21 | | | 6.500 | % | | | 656,000 | | | | 669,120 | | |
QEP Resources, Inc.
Senior Unsecured | |
| 03/01/21 | | | 6.875 | % | | | 277,000 | | | | 304,008 | | |
| 10/01/22 | | | 5.375 | % | | | 548,000 | | | | 548,000 | | |
| Range Resources Corp. | |
| 05/01/18 | | | 7.250 | % | | | 7,000 | | | | 7,438 | | |
| 08/01/20 | | | 6.750 | % | | | 555,000 | | | | 602,175 | | |
| 06/01/21 | | | 5.750 | % | | | 224,000 | | | | 234,640 | | |
| 08/15/22 | | | 5.000 | % | | | 101,000 | | | | 100,748 | | |
Ras Laffan Liquefied Natural Gas Co., Ltd. II
Senior Secured(b) | |
| 09/30/20 | | | 5.298 | % | | | 2,855,320 | | | | 3,080,319 | | |
SM Energy Co.
Senior Unsecured | |
| 11/15/21 | | | 6.500 | % | | | 221,000 | | | | 233,155 | | |
| Whiting Petroleum Corp. | |
| 10/01/18 | | | 6.500 | % | | | 26,000 | | | | 27,690 | | |
| Woodside Finance Ltd.(b) | |
| 05/10/21 | | | 4.600 | % | | | 2,515,000 | | | | 2,654,623 | | |
| Total | | | | | | | | | | | 53,436,232 | | |
| Integrated Energy 0.7% | |
Hess Corp.
Senior Unsecured | |
| 08/15/31 | | | 7.300 | % | | | 3,185,000 | | | | 4,098,888 | | |
| Lukoil International Finance BV(b) | |
| 11/09/20 | | | 6.125 | % | | | 345,000 | | | | 366,146 | | |
Marathon Petroleum Corp.
Senior Unsecured | |
| 03/01/41 | | | 6.500 | % | | | 9,265,000 | | | | 10,175,990 | | |
The Accompanying Notes to Financial Statements are an integral part of this statement.
11
Columbia Intermediate Bond Fund
April 30, 2012
(Percentages represent value of investments compared to net assets)
| Issuer | | Coupon
Rate | | Principal
Amount | | Value | |
| Corporate Bonds & Notes(a) (continued) | |
| Integrated Energy (cont.) | |
| Shell International Finance BV | |
| 03/25/40 | | | 5.500 | % | | $ | 6,255,000 | | | $ | 7,812,245 | | |
| Total | | | | | | | | | | | 22,453,269 | | |
| Life Insurance 2.0% | |
| ING Groep NV(c)(d) | |
| 12/29/49 | | | 5.775 | % | | | 8,160,000 | | | | 6,976,800 | | |
| Lincoln National Corp.(d) | |
| 05/17/66 | | | 7.000 | % | | | 4,500,000 | | | | 4,365,000 | | |
| 04/20/67 | | | 6.050 | % | | | 4,210,000 | | | | 3,915,300 | | |
| MetLife Capital Trust X(b) | |
| 04/08/38 | | | 9.250 | % | | | 13,410,000 | | | | 16,360,200 | | |
| MetLife, Inc. | |
| 08/01/39 | | | 10.750 | % | | | 11,792,000 | | | | 16,390,880 | | |
Provident Companies, Inc.
Senior Unsecured | |
| 07/15/18 | | | 7.000 | % | | | 320,000 | | | | 372,018 | | |
| Prudential Financial, Inc.(d) | |
| 06/15/38 | | | 8.875 | % | | | 15,440,000 | | | | 18,315,700 | | |
| Total | | | | | | | | | | | 66,695,898 | | |
| Media Cable 1.3% | |
| CCO Holdings LLC/Capital Corp. | |
| 01/15/19 | | | 7.000 | % | | | 595,000 | | | | 636,650 | | |
| 04/30/20 | | | 8.125 | % | | | 133,000 | | | | 148,628 | | |
| 01/31/22 | | | 6.625 | % | | | 1,080,000 | | | | 1,129,950 | | |
CSC Holdings LLC
Senior Unsecured | |
| 02/15/19 | | | 8.625 | % | | | 234,000 | | | | 265,590 | | |
CSC Holdings LLC(b)
Senior Unsecured | |
| 11/15/21 | | | 6.750 | % | | | 317,000 | | | | 328,888 | | |
Cablevision Systems Corp.
Senior Unsecured(c) | |
| 04/15/20 | | | 8.000 | % | | | 475,000 | | | | 513,000 | | |
| DIRECTV Holdings LLC / DIRECTV Financing Co., Inc.(b) | |
| 03/15/17 | | | 2.400 | % | | | 7,687,000 | | | | 7,704,088 | | |
| DIRECTV Holdings LLC/Financing Co., Inc. | |
| 02/15/16 | | | 3.125 | % | | | 9,690,000 | | | | 10,084,771 | | |
| 03/01/16 | | | 3.500 | % | | | 12,020,000 | | | | 12,689,622 | | |
| 03/01/21 | | | 5.000 | % | | | 2,475,000 | | | | 2,706,529 | | |
| DISH DBS Corp. | |
| 09/01/19 | | | 7.875 | % | | | 925,000 | | | | 1,070,687 | | |
| 06/01/21 | | | 6.750 | % | | | 865,000 | | | | 947,175 | | |
Nara Cable Funding Ltd.
Senior Secured(b) | |
| 12/01/18 | | | 8.875 | % | | | 468,000 | | | | 425,880 | | |
Quebecor Media, Inc.
Senior Unsecured | |
| 03/15/16 | | | 7.750 | % | | | 573,000 | | | | 589,474 | | |
| Time Warner Cable, Inc. | |
| 05/01/17 | | | 5.850 | % | | | 2,335,000 | | | | 2,734,698 | | |
UPCB Finance V Ltd.
Senior Secured(b)(c) | |
| 11/15/21 | | | 7.250 | % | | | 332,000 | | | | 346,768 | | |
UPCB Finance VI Ltd.
Senior Secured(b) | |
| 01/15/22 | | | 6.875 | % | | | 523,000 | | | | 537,435 | | |
| Videotron Ltee(b) | |
| 07/15/22 | | | 5.000 | % | | | 202,000 | | | | 201,495 | | |
| Issuer | | Coupon
Rate | | Principal
Amount | | Value | |
| Corporate Bonds & Notes(a) (continued) | |
| Media Cable (cont.) | |
| Virgin Media Finance PLC | |
| 08/15/16 | | | 9.500 | % | | $ | 185,000 | | | $ | 207,200 | | |
| Total | | | | | | | | | | | 43,268,528 | | |
| Media Non-Cable 1.0% | |
| AMC Networks, Inc.(b) | |
| 07/15/21 | | | 7.750 | % | | | 654,000 | | | | 730,845 | | |
Clear Channel Communications, Inc.
Senior Secured | |
| 03/01/21 | | | 9.000 | % | | | 250,000 | | | | 226,250 | | |
| Clear Channel Worldwide Holdings, Inc. | |
| 12/15/17 | | | 9.250 | % | | | 729,000 | | | | 799,166 | | |
| Clear Channel Worldwide Holdings, Inc.(b) | |
| 03/15/20 | | | 7.625 | % | | | 190,000 | | | | 184,775 | | |
| Clear Channel Worldwide Holdings, Inc.(b)(c) | |
| 03/15/20 | | | 7.625 | % | | | 1,455,000 | | | | 1,440,450 | | |
Hughes Satellite Systems Corp.
Senior Secured | |
| 06/15/19 | | | 6.500 | % | | | 217,000 | | | | 232,190 | | |
| Hughes Satellite Systems Corp.(c) | |
| 06/15/21 | | | 7.625 | % | | | 1,046,000 | | | | 1,133,602 | | |
| Intelsat Jackson Holdings SA(b) | |
| 10/15/20 | | | 7.250 | % | | | 1,804,000 | | | | 1,880,670 | | |
| Intelsat Jackson Holdings SA(c) | |
| 04/01/19 | | | 7.250 | % | | | 255,000 | | | | 265,838 | | |
Intelsat Luxembourg SA
PIK | |
| 02/04/17 | | | 11.500 | % | | | 125,000 | | | | 130,313 | | |
| Lamar Media Corp.(b) | |
| 02/01/22 | | | 5.875 | % | | | 417,000 | | | | 428,468 | | |
NBCUniversal Media LLC
Senior Unsecured | |
| 04/01/16 | | | 2.875 | % | | | 3,372,000 | | | | 3,526,367 | | |
National CineMedia LLC
Senior Unsecured | |
| 07/15/21 | | | 7.875 | % | | | 410,000 | | | | 441,775 | | |
National CineMedia LLC(b)
Senior Secured | |
| 04/15/22 | | | 6.000 | % | | | 465,000 | | | | 473,137 | | |
| News America, Inc. | |
| 12/15/35 | | | 6.400 | % | | | 4,195,000 | | | | 4,800,469 | | |
| 02/15/41 | | | 6.150 | % | | | 8,406,000 | | | | 9,647,196 | | |
| Nielsen Finance LLC/Co. | |
| 10/15/18 | | | 7.750 | % | | | 1,701,000 | | | | 1,879,605 | | |
Salem Communications Corp.
Secured | |
| 12/15/16 | | | 9.625 | % | | | 413,000 | | | | 458,430 | | |
Sinclair Television Group, Inc.
Secured(b) | |
| 11/01/17 | | | 9.250 | % | | | 636,000 | | | | 707,550 | | |
| Univision Communications, Inc.(b) | |
| 05/15/21 | | | 8.500 | % | | | 438,000 | | | | 431,430 | | |
| | | Senior Secured | |
| 05/15/19 | | | 6.875 | % | | | 227,000 | | | | 229,554 | | |
| 11/01/20 | | | 7.875 | % | | | 917,000 | | | | 955,972 | | |
| XM Satellite Radio, Inc.(b) | |
| 11/01/18 | | | 7.625 | % | | | 1,133,000 | | | | 1,232,194 | | |
| Total | | | | | | | | | | | 32,236,246 | | |
The Accompanying Notes to Financial Statements are an integral part of this statement.
12
Columbia Intermediate Bond Fund
April 30, 2012
(Percentages represent value of investments compared to net assets)
| Issuer | | Coupon
Rate | | Principal
Amount | | Value | |
| Corporate Bonds & Notes(a) (continued) | |
| Metals 0.7% | |
| Alpha Natural Resources, Inc.(c) | |
| 06/01/19 | | | 6.000 | % | | $ | 701,000 | | | $ | 653,682 | | |
| 06/01/21 | | | 6.250 | % | | | 45,000 | | | | 41,963 | | |
ArcelorMittal(c)
Senior Unsecured | |
| 10/15/39 | | | 7.000 | % | | | 4,657,000 | | | | 4,541,050 | | |
| 03/01/41 | | | 6.750 | % | | | 6,994,000 | | | | 6,613,631 | | |
| Arch Coal, Inc.(b)(c) | |
| 06/15/19 | | | 7.000 | % | | | 200,000 | | | | 179,000 | | |
| 06/15/21 | | | 7.250 | % | | | 424,000 | | | | 378,420 | | |
| CONSOL Energy, Inc. | |
| 04/01/20 | | | 8.250 | % | | | 1,045,000 | | | | 1,097,250 | | |
| CONSOL Energy, Inc.(c) | |
| 04/01/17 | | | 8.000 | % | | | 110,000 | | | | 116,050 | | |
Calcipar SA
Senior Secured(b) | |
| 05/01/18 | | | 6.875 | % | | | 666,000 | | | | 682,650 | | |
| FMG Resources August 2006 Proprietary Ltd.(b) | |
| 11/01/19 | | | 8.250 | % | | | 1,251,000 | | | | 1,347,952 | | |
| FMG Resources August 2006 Proprietary Ltd.(b)(c) | |
| 02/01/16 | | | 6.375 | % | | | 245,000 | | | | 249,900 | | |
| 02/01/18 | | | 6.875 | % | | | 40,000 | | | | 41,100 | | |
| Senior Unsecured | |
| 04/01/22 | | | 6.875 | % | | | 666,000 | | | | 675,990 | | |
JMC Steel Group
Senior Notes(b) | |
| 03/15/18 | | | 8.250 | % | | | 835,000 | | | | 864,225 | | |
| Novelis, Inc. | |
| 12/15/17 | | | 8.375 | % | | | 227,000 | | | | 245,160 | | |
| 12/15/20 | | | 8.750 | % | | | 97,000 | | | | 106,943 | | |
Nucor Corp.
Senior Unsecured | |
| 06/01/18 | | | 5.850 | % | | | 4,235,000 | | | | 5,120,259 | | |
| Peabody Energy Corp.(b) | |
| 11/15/18 | | | 6.000 | % | | | 347,000 | | | | 352,205 | | |
| Peabody Energy Corp.(b)(c) | |
| 11/15/21 | | | 6.250 | % | | | 826,000 | | | | 836,325 | | |
Rain CII Carbon LLC/Corp.
Senior Secured(b) | |
| 12/01/18 | | | 8.000 | % | | | 918,000 | | | | 973,080 | | |
| Total | | | | | | | | | | | 25,116,835 | | |
| Non-Captive Consumer 0.3% | |
| Discover Financial Services(b)(e) | |
| 04/27/22 | | | 5.200 | % | | | 1,795,000 | | | | 1,862,510 | | |
| HSBC Finance Capital Trust IX(d) | |
| 11/30/35 | | | 5.911 | % | | | 7,368,000 | | | | 6,778,560 | | |
SLM Corp.
Senior Notes | |
| 01/25/16 | | | 6.250 | % | | | 459,000 | | | | 472,770 | | |
| Senior Unsecured | |
| 03/25/20 | | | 8.000 | % | | | 796,000 | | | | 845,750 | | |
| 01/25/22 | | | 7.250 | % | | | 422,000 | | | | 426,220 | | |
Springleaf Finance Corp.
Senior Unsecured | |
| 12/15/17 | | | 6.900 | % | | | 992,000 | | | | 806,000 | | |
| Total | | | | | | | | | | | 11,191,810 | | |
| Issuer | | Coupon
Rate | | Principal
Amount | | Value | |
| Corporate Bonds & Notes(a) (continued) | |
| Non-Captive Diversified 0.4% | |
| Ally Financial, Inc. | |
| 03/15/20 | | | 8.000 | % | | $ | 3,474,000 | | | $ | 3,979,554 | | |
CIT Group, Inc.
Senior Unsecured | |
| 03/15/18 | | | 5.250 | % | | | 1,366,000 | | | | 1,406,980 | | |
| CIT Group, Inc.(b) | |
| 05/02/17 | | | 7.000 | % | | | 963,000 | | | | 965,408 | | |
| Senior Unsecured | |
| 02/15/19 | | | 5.500 | % | | | 1,405,000 | | | | 1,443,637 | | |
CIT Group, Inc.(b)(c)
Senior Secured | |
| 04/01/18 | | | 6.625 | % | | | 415,000 | | | | 448,200 | | |
International Lease Finance Corp.
Senior Unsecured | |
| 09/01/17 | | | 8.875 | % | | | 175,000 | | | | 197,750 | | |
| 05/15/19 | | | 6.250 | % | | | 1,429,000 | | | | 1,443,100 | | |
International Lease Finance Corp.(c)
Senior Unsecured | |
| 12/15/20 | | | 8.250 | % | | | 1,315,000 | | | | 1,472,800 | | |
| Total | | | | | | | | | | | 11,357,429 | | |
| Oil Field Services 0.3% | |
Atwood Oceanics, Inc.
Senior Unsecured | |
| 02/01/20 | | | 6.500 | % | | | 1,416,000 | | | | 1,490,340 | | |
Green Field Energy Services, Inc.
Senior Secured(b) | |
| 11/15/16 | | | 13.000 | % | | | 634,000 | | | | 621,320 | | |
Novatek Finance Ltd.
Senior Unsecured(b) | |
| 02/03/21 | | | 6.604 | % | | | 260,000 | | | | 286,037 | | |
Offshore Group Investments Ltd.
Senior Secured | |
| 08/01/15 | | | 11.500 | % | | | 1,029,000 | | | | 1,125,469 | | |
Offshore Group Investments Ltd.(b)
Senior Secured | |
| 08/01/15 | | | 11.500 | % | | | 831,000 | | | | 908,906 | | |
| Oil States International, Inc. | |
| 06/01/19 | | | 6.500 | % | | | 348,000 | | | | 368,010 | | |
| Weatherford International Ltd. | |
| 03/15/38 | | | 7.000 | % | | | 5,415,000 | | | | 6,176,820 | | |
| Total | | | | | | | | | | | 10,976,902 | | |
| Other Industry 0.3% | |
| Interline Brands, Inc. | |
| 11/15/18 | | | 7.000 | % | | | 293,000 | | | | 310,214 | | |
President and Fellows of Harvard College
Senior Notes | |
| 10/15/40 | | | 4.875 | % | | | 5,635,000 | | | | 6,617,844 | | |
| President and Fellows of Harvard College(b) | |
| 01/15/39 | | | 6.500 | % | | | 2,885,000 | | | | 4,215,879 | | |
| Total | | | | | | | | | | | 11,143,937 | | |
| Packaging 0.2% | |
Ardagh Packaging Finance PLC/MP Holdings U.S.A., Inc.
Senior Secured(b)(c) | |
| 10/15/20 | | | 9.125 | % | | | 123,000 | | | | 130,688 | | |
The Accompanying Notes to Financial Statements are an integral part of this statement.
13
Columbia Intermediate Bond Fund
April 30, 2012
(Percentages represent value of investments compared to net assets)
| Issuer | | Coupon
Rate | | Principal
Amount | | Value | |
| Corporate Bonds & Notes(a) (continued) | |
| Packaging (cont.) | |
Ardagh Packaging Finance PLC(b)
Senior Secured | |
| 10/15/17 | | | 7.375 | % | | $ | 401,000 | | | $ | 434,082 | | |
| Ardagh Packaging Finance PLC(b)(c) | |
| 10/15/20 | | | 9.125 | % | | | 260,000 | | | | 281,450 | | |
Berry Plastics Corp.
Secured(c) | |
| 01/15/21 | | | 9.750 | % | | | 364,000 | | | | 397,670 | | |
| Crown Americas LLC/Capital Corp. III | |
| 02/01/21 | | | 6.250 | % | | | 496,000 | | | | 539,400 | | |
| Reynolds Group Issuer, Inc./LLC(b) | |
| 04/15/19 | | | 9.000 | % | | | 1,000 | | | | 1,005 | | |
| 02/15/21 | | | 8.500 | % | | | 374,000 | | | | 359,040 | | |
| Senior Secured | |
| 10/15/16 | | | 7.750 | % | | | 383,000 | | | | 405,980 | | |
| 04/15/19 | | | 7.125 | % | | | 408,000 | | | | 426,360 | | |
| 08/15/19 | | | 7.875 | % | | | 276,000 | | | | 298,080 | | |
| 02/15/21 | | | 6.875 | % | | | 1,373,000 | | | | 1,414,190 | | |
| Senior Unsecured | |
| 08/15/19 | | | 9.875 | % | | | 305,000 | | | | 317,963 | | |
| 08/15/19 | | | 9.875 | % | | | 902,000 | | | | 940,335 | | |
| Total | | | | | | | | | | | 5,946,243 | | |
| Paper —% | |
| Cascades, Inc. | |
| 12/15/17 | | | 7.750 | % | | | 185,000 | | | | 183,150 | | |
| Graphic Packaging International, Inc. | |
| 06/15/17 | | | 9.500 | % | | | 838,000 | | | | 930,180 | | |
| 10/01/18 | | | 7.875 | % | | | 132,000 | | | | 146,520 | | |
| Monaco SpinCo, Inc.(b)(g) | |
| 04/30/20 | | | 6.750 | % | | | 211,000 | | | | 217,330 | | |
| Total | | | | | | | | | | | 1,477,180 | | |
| Pharmaceuticals 0.4% | |
| Endo Pharmaceuticals Holdings, Inc. | |
| 01/15/22 | | | 7.250 | % | | | 233,000 | | | | 249,892 | | |
| Grifols, Inc. | |
| 02/01/18 | | | 8.250 | % | | | 739,000 | | | | 791,654 | | |
Johnson & Johnson
Senior Unsecured | |
| 05/15/41 | | | 4.850 | % | | | 6,490,000 | | | | 7,657,798 | | |
| Mylan, Inc.(b) | |
| 11/15/18 | | | 6.000 | % | | | 525,000 | | | | 551,250 | | |
Pharmaceutical Product Development, Inc.
Senior Unsecured(b)(c) | |
| 12/01/19 | | | 9.500 | % | | | 155,000 | | | | 169,725 | | |
| Roche Holdings, Inc.(b) | |
| 03/01/19 | | | 6.000 | % | | | 3,080,000 | | | | 3,828,067 | | |
| Warner Chilcott Co. LLC/Finance | |
| 09/15/18 | | | 7.750 | % | | | 207,000 | | | | 226,148 | | |
| Total | | | | | | | | | | | 13,474,534 | | |
| Property & Casualty 1.0% | |
CNA Financial Corp.
Senior Unsecured | |
| 12/15/14 | | | 5.850 | % | | | 1,497,000 | | | | 1,613,263 | | |
| Liberty Mutual Group, Inc.(b)(d) | |
| 06/15/58 | | | 10.750 | % | | | 8,875,000 | | | | 12,070,000 | | |
| OneBeacon US Holdings, Inc. | |
| 05/15/13 | | | 5.875 | % | | | 1,983,000 | | | | 2,052,647 | | |
| Issuer | | Coupon
Rate | | Principal
Amount | | Value | |
| Corporate Bonds & Notes(a) (continued) | |
| Property & Casualty (cont.) | |
Transatlantic Holdings, Inc.
Senior Unsecured | |
| 11/30/39 | | | 8.000 | % | | $ | 14,285,000 | | | $ | 16,290,028 | | |
| Total | | | | | | | | | | | 32,025,938 | | |
| Railroads 1.1% | |
| BNSF Funding Trust I(d) | |
| 12/15/55 | | | 6.613 | % | | | 10,291,000 | | | | 10,715,504 | | |
CSX Corp.
Senior Unsecured | |
| 06/01/21 | | | 4.250 | % | | | 6,910,000 | | | | 7,519,873 | | |
| 05/30/42 | | | 4.750 | % | | | 13,130,000 | | | | 13,173,027 | | |
Union Pacific Corp.
Senior Unsecured | |
| 08/15/18 | | | 5.700 | % | | | 3,900,000 | | | | 4,699,090 | | |
| Total | | | | | | | | | | | 36,107,494 | | |
| REITs 0.9% | |
Boston Properties LP
Senior Unsecured | |
| 05/15/21 | | | 4.125 | % | | | 13,645,000 | | | | 14,284,296 | | |
| Brandywine Operating Partnership LP | |
| 05/15/15 | | | 7.500 | % | | | 2,735,000 | | | | 3,056,562 | | |
Duke Realty LP
Senior Unsecured | |
| 02/15/15 | | | 7.375 | % | | | 2,200,000 | | | | 2,441,468 | | |
| 08/15/19 | | | 8.250 | % | | | 8,800,200 | | | | 10,975,090 | | |
| Total | | | | | | | | | | | 30,757,416 | | |
| Restaurants 0.6% | |
McDonald's Corp.
Senior Unsecured | |
| 05/20/21 | | | 3.625 | % | | | 17,176,000 | | | | 18,885,149 | | |
| Retailers 1.4% | |
| 99 Cents Only Stores(b) | |
| 12/15/19 | | | 11.000 | % | | | 245,000 | | | | 265,213 | | |
| AutoNation, Inc.(c) | |
| 02/01/20 | | | 5.500 | % | | | 210,000 | | | | 214,200 | | |
Best Buy Co., Inc.
Senior Unsecured(c) | |
| 03/15/21 | | | 5.500 | % | | | 6,950,000 | | | | 6,502,121 | | |
| Burlington Coat Factory Warehouse Corp.(c) | |
| 02/15/19 | | | 10.000 | % | | | 721,000 | | | | 771,470 | | |
CVS Pass-Through Trust
Pass-Through Certificates(b) | |
| 01/11/27 | | | 5.298 | % | | | 4,766,499 | | | | 4,980,338 | | |
| J Crew Group, Inc.(c) | |
| 03/01/19 | | | 8.125 | % | | | 227,000 | | | | 234,945 | | |
Jo-Ann Stores, Inc.
Senior Unsecured(b) | |
| 03/15/19 | | | 8.125 | % | | | 617,000 | | | | 617,000 | | |
| Limited Brands, Inc. | |
| 06/15/19 | | | 8.500 | % | | | 181,000 | | | | 214,259 | | |
| 04/01/21 | | | 6.625 | % | | | 690,000 | | | | 745,200 | | |
| 02/15/22 | | | 5.625 | % | | | 345,000 | | | | 347,156 | | |
| Macy's Retail Holdings, Inc. | |
| 07/15/14 | | | 5.750 | % | | | 13,320,000 | | | | 14,576,143 | | |
| 07/15/27 | | | 6.790 | % | | | 9,325,000 | | | | 10,095,515 | | |
| 01/15/42 | | | 5.125 | % | | | 5,325,000 | | | | 5,377,893 | | |
The Accompanying Notes to Financial Statements are an integral part of this statement.
14
Columbia Intermediate Bond Fund
April 30, 2012
(Percentages represent value of investments compared to net assets)
| Issuer | | Coupon
Rate | | Principal
Amount | | Value | |
| Corporate Bonds & Notes(a) (continued) | |
| Retailers (cont.) | |
QVC, Inc.(b)
Senior Secured | |
| 10/01/19 | | | 7.500 | % | | $ | 370,000 | | | $ | 408,850 | | |
| 10/15/20 | | | 7.375 | % | | | 167,000 | | | | 184,118 | | |
| Rite Aid Corp.(b)(c) | |
| 03/15/20 | | | 9.250 | % | | | 616,000 | | | | 625,240 | | |
| Rite Aid Corp.(c) | |
| 06/15/17 | | | 9.500 | % | | | 485,000 | | | | 486,212 | | |
| Senior Secured | |
| 08/15/20 | | | 8.000 | % | | | 665,000 | | | | 769,737 | | |
| Senior Unsecured | |
| 02/15/27 | | | 7.700 | % | | | 446,000 | | | | 392,480 | | |
| Sally Holdings LLC/Capital, Inc.(b)(c) | |
| 11/15/19 | | | 6.875 | % | | | 155,000 | | | | 165,463 | | |
| Total | | | | | | | | | | | 47,973,553 | | |
| Supermarkets 0.2% | |
| Kroger Co. (The) | |
| 12/15/18 | | | 6.800 | % | | | 5,892,000 | | | | 7,293,795 | | |
| Senior Unsecured | |
| 01/15/17 | | | 2.200 | % | | | 965,000 | | | | 985,335 | | |
| Total | | | | | | | | | | | 8,279,130 | | |
| Technology 0.5% | |
| Alliance Data Systems Corp.(b) | |
| 04/01/20 | | | 6.375 | % | | | 256,000 | | | | 260,160 | | |
Amkor Technology, Inc.(c)
Senior Unsecured | |
| 05/01/18 | | | 7.375 | % | | | 451,000 | | | | 482,570 | | |
| 06/01/21 | | | 6.625 | % | | | 730,000 | | | | 748,250 | | |
| Anixter, Inc. | |
| 05/01/19 | | | 5.625 | % | | | 143,000 | | | | 146,218 | | |
Brocade Communications Systems, Inc.
Senior Secured | |
| 01/15/18 | | | 6.625 | % | | | 515,000 | | | | 540,750 | | |
| CDW LLC/Finance Corp. | |
| 04/01/19 | | | 8.500 | % | | | 616,000 | | | | 659,120 | | |
| Senior Secured | |
| 12/15/18 | | | 8.000 | % | | | 856,000 | | | | 933,040 | | |
| CDW LLC/Finance Corp.(b) | |
| 04/01/19 | | | 8.500 | % | | | 370,000 | | | | 395,437 | | |
| Cardtronics, Inc. | |
| 09/01/18 | | | 8.250 | % | | | 575,000 | | | | 635,375 | | |
| CommScope, Inc.(b)(c) | |
| 01/15/19 | | | 8.250 | % | | | 306,000 | | | | 326,655 | | |
Equinix, Inc.
Senior Unsecured | |
| 07/15/21 | | | 7.000 | % | | | 608,000 | | | | 664,240 | | |
| First Data Corp. | |
| 01/15/21 | | | 12.625 | % | | | 769,000 | | | | 770,922 | | |
| PIK | |
| 09/24/15 | | | 10.550 | % | | | 632,000 | | | | 643,060 | | |
First Data Corp.(b)
Senior Secured | |
| 08/15/20 | | | 8.875 | % | | | 870,000 | | | | 946,125 | | |
First Data Corp.(b)(c)
Senior Secured | |
| 06/15/19 | | | 7.375 | % | | | 657,000 | | | | 675,067 | | |
Freescale Semiconductor, Inc.(b)
Senior Secured | |
| 04/15/18 | | | 9.250 | % | | | 435,000 | | | | 476,869 | | |
| Issuer | | Coupon
Rate | | Principal
Amount | | Value | |
| Corporate Bonds & Notes(a) (continued) | |
| Technology (cont.) | |
| Freescale Semiconductor, Inc.(c) | |
| 08/01/20 | | | 10.750 | % | | $ | 165,000 | | | $ | 183,150 | | |
Hewlett-Packard Co.
Senior Unsecured | |
| 12/09/21 | | | 4.650 | % | | | 3,585,000 | | | | 3,788,166 | | |
| 09/15/41 | | | 6.000 | % | | | 3,000,000 | | | | 3,315,996 | | |
| Interactive Data Corp. | |
| 08/01/18 | | | 10.250 | % | | | 679,000 | | | | 767,270 | | |
NXP BV/Funding LLC
Senior Secured(b) | |
| 08/01/18 | | | 9.750 | % | | | 1,001,000 | | | | 1,136,135 | | |
| Total | | | | | | | | | | | 18,494,575 | | |
| Textile —% | |
Levi Strauss & Co.
Senior Unsecured(b)(g) | |
| 05/01/22 | | | 6.875 | % | | | 52,000 | | | | 53,300 | | |
| Transportation Services 0.2% | |
| Avis Budget Car Rental LLC/Finance, Inc. | |
| 01/15/19 | | | 8.250 | % | | | 209,000 | | | | 218,927 | | |
| 03/15/20 | | | 9.750 | % | | | 514,000 | | | | 565,400 | | |
| ERAC U.S.A. Finance LLC(b) | |
| 10/01/20 | | | 5.250 | % | | | 4,960,000 | | | | 5,475,164 | | |
| Hertz Corp. (The) | |
| 10/15/18 | | | 7.500 | % | | | 710,000 | | | | 761,475 | | |
| 01/15/21 | | | 7.375 | % | | | 212,000 | | | | 227,900 | | |
| Total | | | | | | | | | | | 7,248,866 | | |
| Wireless 0.4% | |
Cricket Communications, Inc.
Senior Secured | |
| 05/15/16 | | | 7.750 | % | | | 731,000 | | | | 769,377 | | |
| Cricket Communications, Inc.(c) | |
| 10/15/20 | | | 7.750 | % | | | 430,000 | | | | 403,125 | | |
| MetroPCS Wireless, Inc.(c) | |
| 09/01/18 | | | 7.875 | % | | | 605,000 | | | | 621,637 | | |
| NII Capital Corp. | |
| 08/15/16 | | | 10.000 | % | | | 512,000 | | | | 573,440 | | |
| SBA Telecommunications, Inc. | |
| 08/15/19 | | | 8.250 | % | | | 557,000 | | | | 614,093 | | |
| Sprint Capital Corp. | |
| 11/15/28 | | | 6.875 | % | | | 345,000 | | | | 257,888 | | |
Sprint Nextel Corp.
Senior Unsecured | |
| 08/15/17 | | | 8.375 | % | | | 1,029,000 | | | | 990,412 | | |
| Sprint Nextel Corp.(b) | |
| 11/15/18 | | | 9.000 | % | | | 2,174,000 | | | | 2,396,835 | | |
| 03/01/20 | | | 7.000 | % | | | 279,000 | | | | 284,580 | | |
Sprint Nextel Corp.(b)(c)
Senior Unsecured | |
| 03/01/17 | | | 9.125 | % | | | 39,000 | | | | 38,708 | | |
| 11/15/21 | | | 11.500 | % | | | 374,000 | | | | 398,310 | | |
United States Cellular Corp.
Senior Unsecured | |
| 12/15/33 | | | 6.700 | % | | | 4,955,000 | | | | 4,932,673 | | |
Wind Acquisition Finance SA
Senior Secured(b) | |
| 02/15/18 | | | 7.250 | % | | | 947,000 | | | | 897,282 | | |
| Total | | | | | | | | | | | 13,178,360 | | |
The Accompanying Notes to Financial Statements are an integral part of this statement.
15
Columbia Intermediate Bond Fund
April 30, 2012
(Percentages represent value of investments compared to net assets)
| Issuer | | Coupon
Rate | | Principal
Amount | | Value | |
| Corporate Bonds & Notes(a) (continued) | |
| Wirelines 2.8% | |
AT&T, Inc.
Senior Unsecured | |
| 02/15/39 | | | 6.550 | % | | $ | 13,784,000 | | | $ | 17,085,475 | | |
CenturyLink, Inc.
Senior Unsecured | |
| 06/15/21 | | | 6.450 | % | | | 6,425,000 | | | | 6,686,973 | | |
| 03/15/42 | | | 7.650 | % | | | 175,000 | | | | 165,988 | | |
Embarq Corp.
Senior Unsecured | |
| 06/01/36 | | | 7.995 | % | | | 10,444,000 | | | | 10,482,956 | | |
Frontier Communications Corp.(c)
Senior Unsecured | |
| 04/15/20 | | | 8.500 | % | | | 597,000 | | | | 620,880 | | |
| 04/15/22 | | | 8.750 | % | | | 308,000 | | | | 323,400 | | |
Integra Telecom Holdings, Inc.
Senior Secured(b) | |
| 04/15/16 | | | 10.750 | % | | | 210,000 | | | | 200,025 | | |
Level 3 Communications, Inc.
Senior Unsecured | |
| 02/01/19 | | | 11.875 | % | | | 580,000 | | | | 658,300 | | |
| Level 3 Financing, Inc. | |
| 02/15/17 | | | 8.750 | % | | | 310,000 | | | | 322,400 | | |
| 02/01/18 | | | 10.000 | % | | | 141,000 | | | | 154,395 | | |
| 04/01/19 | | | 9.375 | % | | | 772,000 | | | | 841,480 | | |
Level 3 Financing, Inc.(b)
Senior Unsecured | |
| 07/01/19 | | | 8.125 | % | | | 534,000 | | | | 548,685 | | |
| PAETEC Holding Corp. | |
| 12/01/18 | | | 9.875 | % | | | 768,000 | | | | 869,760 | | |
| Senior Secured | |
| 06/30/17 | | | 8.875 | % | | | 757,000 | | | | 827,023 | | |
Qwest Corp.
Senior Unsecured | |
| 06/15/23 | | | 7.500 | % | | | 655,000 | | | | 660,731 | | |
| Telecom Italia Capital SA | |
| 09/30/14 | | | 4.950 | % | | | 12,653,000 | | | | 12,811,162 | | |
| 10/01/15 | | | 5.250 | % | | | 1,735,000 | | | | 1,765,362 | | |
| 07/18/36 | | | 7.200 | % | | | 17,659,000 | | | | 16,180,059 | | |
| Telefonica Emisiones SAU | |
| 06/20/16 | | | 6.421 | % | | | 4,275,000 | | | | 4,400,732 | | |
| 07/03/17 | | | 6.221 | % | | | 2,375,000 | | | | 2,422,994 | | |
| 04/27/20 | | | 5.134 | % | | | 4,360,000 | | | | 4,040,922 | | |
| 02/16/21 | | | 5.462 | % | | | 2,875,000 | | | | 2,711,160 | | |
Verizon New York, Inc.
Senior Unsecured | |
| 04/01/32 | | | 7.375 | % | | | 6,966,000 | | | | 8,573,781 | | |
| Windstream Corp. | |
| 09/01/18 | | | 8.125 | % | | | 378,000 | | | | 406,350 | | |
| 10/15/20 | | | 7.750 | % | | | 536,000 | | | | 573,520 | | |
| tw telecom holdings, inc. | |
| 03/01/18 | | | 8.000 | % | | | 466,000 | | | | 510,270 | | |
| Total | | | | | | | | | | | 94,844,783 | | |
Total Corporate Bonds & Notes
(Cost: $1,274,605,041) | | $ | 1,333,760,404 | | |
| Issuer | | Coupon
Rate | | Principal
Amount | | Value | |
| Residential Mortgage-Backed Securities – Agency 15.8% | |
| Federal Home Loan Mortgage Corp.(j) | |
| 06/01/41 | | | 4.500 | % | | $ | 13,775,315 | | | $ | 14,972,852 | | |
| 10/01/41 | | | 5.000 | % | | | 44,442,039 | | | | 48,518,812 | | |
| 11/01/26 | | | 8.500 | % | | | 112,610 | | | | 138,969 | | |
| 07/01/20 | | | 12.000 | % | | | 15,481 | | | | 17,001 | | |
| Federal National Mortgage Association(d)(j) | |
| 08/01/36 | | | 2.324 | % | | | 28,156 | | | | 28,486 | | |
| 07/01/37 | | | 5.772 | % | | | 265,221 | | | | 289,673 | | |
| 06/01/32 | | | 6.028 | % | | | 4,990 | | | | 5,293 | | |
| Federal National Mortgage Association(g)(j) | |
| 05/01/42 | | | 3.500 | % | | | 27,250,000 | | | | 28,293,163 | | |
| 05/01/42 | | | 4.000 | % | | | 10,000,000 | | | | 10,576,562 | | |
| Federal National Mortgage Association(j) | |
| 03/01/41 | | | 3.500 | % | | | 4,590,172 | | | | 4,771,537 | | |
| 09/01/40-10/01/41 | | | 4.000 | % | | | 97,097,953 | | | | 103,676,933 | | |
| 05/01/39-07/01/41 | | | 4.500 | % | | | 68,628,289 | | | | 74,884,966 | | |
| 08/01/40-05/01/41 | | | 5.000 | % | | | 69,226,759 | | | | 75,637,456 | | |
| 06/01/35-01/01/40 | | | 5.500 | % | | | 24,428,031 | | | | 26,767,879 | | |
| 01/01/14-08/01/38 | | | 6.000 | % | | | 24,922,481 | | | | 27,589,043 | | |
| 09/01/18 | | | 10.000 | % | | | 31,285 | | | | 37,107 | | |
| CMO Series 1988-4 Class Z | |
| 03/25/18 | | | 9.250 | % | | | 32,831 | | | | 37,176 | | |
| Federal National Mortgage Association(j)(k) | |
| 12/01/40 | | | 4.000 | % | | | 33,162,655 | | | | 35,427,688 | | |
| 02/01/37 | | | 6.000 | % | | | 13,449,972 | | | | 14,972,026 | | |
| Government National Mortgage Association(d)(j) | |
| 07/20/25 | | | 1.625 | % | | | 40,528 | | | | 41,961 | | |
| Government National Mortgage Association(j) | |
| 09/15/40-03/15/41 | | | 4.500 | % | | | 58,190,197 | | | | 63,803,423 | | |
| 01/15/30 | | | 7.000 | % | | | 485,460 | | | | 570,145 | | |
| 12/15/23-07/20/28 | | | 7.500 | % | | | 618,793 | | | | 728,510 | | |
| 05/15/17 | | | 8.000 | % | | | 4,193 | | | | 4,642 | | |
| 02/15/25 | | | 8.500 | % | | | 52,605 | | | | 62,403 | | |
| 06/15/16-10/15/16 | | | 9.000 | % | | | 3,041 | | | | 3,354 | | |
Total Residential Mortgage-Backed Securities – Agency
(Cost: $510,655,309) | | $ | 531,857,060 | | |
| Residential Mortgage-Backed Securities – Non-Agency 1.0% | |
American General Mortgage Loan Trust(b)(d)(j)
CMO Series 2009-1 Class A7 | |
| 09/25/48 | | | 5.750 | % | | $ | 8,182,000 | | | $ | 8,390,363 | | |
| CMO Series 2010-1A Class A1 | |
| 03/25/58 | | | 5.150 | % | | | 1,181,709 | | | | 1,196,780 | | |
American Mortgage Trust
Series 2093-3 Class 3A(e)(i)(j) | |
| 07/27/23 | | | 8.188 | % | | | 6,394 | | | | 3,877 | | |
BNPP Mortgage Securities LLC
CMO Series 2009-1 Class A1(b)(j) | |
| 08/27/37 | | | 6.000 | % | | | 2,555,086 | | | | 2,688,341 | | |
Credit Suisse Mortgage Capital Certificates(b)(d)(j)
CMO Series 2009-12R Class 30A1 | |
| 12/27/36 | | | 7.511 | % | | | 723,671 | | | | 727,549 | | |
| CMO Series 2010-11R Class A1 | |
| 06/28/47 | | | 1.239 | % | | | 2,181,426 | | | | 2,168,453 | | |
| CMO Series 2010-12R Class 13A1 | |
| 12/26/37 | | | 4.250 | % | | | 4,015,438 | | | | 4,019,922 | | |
| CMO Series 2011-16R Class 7A3 | |
| 12/27/36 | | | 3.500 | % | | | 2,875,430 | | | | 2,832,156 | | |
The Accompanying Notes to Financial Statements are an integral part of this statement.
16
Columbia Intermediate Bond Fund
April 30, 2012
(Percentages represent value of investments compared to net assets)
| Issuer | | Coupon
Rate | | Principal
Amount | | Value | |
| Residential Mortgage-Backed Securities – Non-Agency (continued) | |
| CMO Series 2011-17R Class 2A1 | |
| 12/27/37 | | | 3.400 | % | | $ | 3,029,426 | | | $ | 3,108,949 | | |
JPMorgan Alternative Loan Trust
CMO Series 2006-A4 Class A1(d)(j) | |
| 09/25/36 | | | 5.950 | % | | | 1,308,955 | | | | 1,294,477 | | |
LVII Resecuritization Trust
CMO Series 2009-3 Class A1(b)(d)(j) | |
| 11/27/37 | | | 5.605 | % | | | 379,291 | | | | 379,524 | | |
Morgan Stanley Mortgage Loan Trust
CMO Series 2007-6XS Class 2A1M(d)(j) | |
| 02/25/47 | | | 0.459 | % | | | 7,463,033 | | | | 805,455 | | |
Nomura Asset Acceptance Corp.(d)(j)
CMO Series 2007-1 Class 1A3 (AGM) | |
| 03/25/47 | | | 5.957 | % | | | 303,671 | | | | 265,567 | | |
| CMO Series 2007-1 Class 1A4 (AGM) | |
| 03/25/47 | | | 6.138 | % | | | 1,922,719 | | | | 1,681,183 | | |
Prime Mortgage Trust
CMO Series 2005-1 Class 2A1(b)(j) | |
| 09/25/34 | | | 5.000 | % | | | 201,339 | | | | 201,665 | | |
Sequoia Mortgage Trust
CMO Series 2004-6 Class B2(d)(j) | |
| 07/20/34 | | | 1.120 | % | | | 1,935,614 | | | | 549,323 | | |
Springleaf Mortgage Loan Trust
CMO Series 2012-1A Class A(b)(d)(j) | |
| 09/25/57 | | | 2.667 | % | | | 3,159,000 | | | | 3,159,000 | | |
Structured Asset Securities Corp.
CMO Series 2004-21XS Class 2A6A(d)(j) | |
| 12/25/34 | | | 4.740 | % | | | 1,290,318 | | | | 1,301,024 | | |
Wells Fargo Mortgage-Backed Securities Trust
CMO Series 2005-2 Class 1A2(j) | |
| 04/25/35 | | | 8.000 | % | | | 476,559 | | | | 478,294 | | |
Total Residential Mortgage-Backed Securities – Non-Agency
(Cost: $43,435,209) | | $ | 35,251,902 | | |
| Commercial Mortgage-Backed Securities – Non-Agency 13.2% | |
Banc of America Merrill Lynch Commercial Mortgage, Inc.(j)
Series 2005-3 Class A4 | |
| 07/10/43 | | | 4.668 | % | | $ | 15,250,000 | | | $ | 16,683,241 | | |
| Series 2005-4 Class A5A | |
| 07/10/45 | | | 4.933 | % | | | 17,323,000 | | | | 18,971,942 | | |
Bear Stearns Commercial Mortgage Securities(d)(j)
Series 2004-T14 Class A4 | |
| 01/12/41 | | | 5.200 | % | | | 6,136,000 | | | | 6,487,568 | | |
| Series 2005-T20 Class A4A | |
| 10/12/42 | | | 5.299 | % | | | 1,250,000 | | | | 1,393,757 | | |
| Series 2006-PW12 Class A4 | |
| 09/11/38 | | | 5.902 | % | | | 1,290,000 | | | | 1,469,129 | | |
| Series 2006-PW12 Class AAB | |
| 09/11/38 | | | 5.877 | % | | | 399,629 | | | | 422,671 | | |
Bear Stearns Commercial Mortgage Securities(j)
Series 2003-T10 Class A2 | |
| 03/13/40 | | | 4.740 | % | | | 621,625 | | | | 632,932 | | |
| Series 2006-PW14 Class A4 | |
| 12/11/38 | | | 5.201 | % | | | 8,025,000 | | | | 9,019,650 | | |
| Series 2007-PW18 Class A4 | |
| 06/11/50 | | | 5.700 | % | | | 16,660,000 | | | | 19,142,923 | | |
| Issuer | | Coupon
Rate | | Principal
Amount | | Value | |
| Commercial Mortgage-Backed Securities – Non-Agency (continued) | |
Citigroup/Deutsche Bank Commercial Mortgage Trust(d)(j)
Series 2005-CD1 Class A4 | |
| 07/15/44 | | | 5.400 | % | | $ | 6,055,000 | | | $ | 6,748,521 | | |
Citigroup/Deutsche Bank Commercial Mortgage Trust(j)
Series 2007-CD4 Class A4 | |
| 12/11/49 | | | 5.322 | % | | | 12,775,000 | | | | 14,171,194 | | |
Credit Suisse Mortgage Capital Certificates
Series 2006-C3 Class A3(d)(j) | |
| 06/15/38 | | | 6.008 | % | | | 27,666,000 | | | | 31,464,459 | | |
GE Capital Commercial Mortgage Corp.
Series 2003-C1 Class A4(j) | |
| 01/10/38 | | | 4.819 | % | | | 4,721,107 | | | | 4,811,913 | | |
GMAC Commercial Mortgage Securities, Inc.(d)(j)(l)
CMO IO Series 1997-C1 Class X | |
| 07/15/29 | | | 1.336 | % | | | 5,818,127 | | | | 165,334 | | |
GMAC Commercial Mortgage Securities, Inc.(j)
Series 2003-C3 Class A4 | |
| 04/10/40 | | | 5.023 | % | | | 13,020,000 | | | | 13,600,627 | | |
GS Mortgage Securities Corp. II(j)
Series 2005-GG4 Class A4A | |
| 07/10/39 | | | 4.751 | % | | | 11,338,500 | | | | 12,321,820 | | |
| Series 2006-GG8 Class A4 | |
| 11/10/39 | | | 5.560 | % | | | 10,000,000 | | | | 11,335,590 | | |
Greenwich Capital Commercial Funding Corp.(d)(j)
Series 2004-GG1 Class A7 | |
| 06/10/36 | | | 5.317 | % | | | 4,216,000 | | | | 4,485,786 | | |
| Series 2005-GG3 Class A4 | |
| 08/10/42 | | | 4.799 | % | | | 12,960,000 | | | | 13,968,651 | | |
Greenwich Capital Commercial Funding Corp.(j)
Series 2003-C2 Class A3 | |
| 01/05/36 | | | 4.533 | % | | | 151,335 | | | | 151,790 | | |
| Series 2007-GG9 Class A4 | |
| 03/10/39 | | | 5.444 | % | | | 6,000,000 | | | | 6,639,558 | | |
JPMorgan Chase Commercial Mortgage Securities Corp.(d)(j)
Series 2005-LDP4 Class A4 | |
| 10/15/42 | | | 4.918 | % | | | 13,750,000 | | | | 14,915,670 | | |
| Series 2005-LDP5 Class A4 | |
| 12/15/44 | | | 5.372 | % | | | 4,000,000 | | | | 4,473,110 | | |
| Series 2007-CB19 Class A4 | |
| 02/12/49 | | | 5.925 | % | | | 14,950,000 | | | | 17,042,447 | | |
JPMorgan Chase Commercial Mortgage Securities Corp.(d)(j)(l)
CMO IO Series 2005-LDP4 Class X2 | |
| 10/15/42 | | | 0.365 | % | | | 148,151,138 | | | | 158,522 | | |
LB-UBS Commercial Mortgage Trust(d)(j)
Series 2004-C6 Class A6 | |
| 08/15/29 | | | 5.020 | % | | | 14,958,000 | | | | 16,015,650 | | |
| Series 2007-C7 Class A3 | |
| 09/15/45 | | | 5.866 | % | | | 8,920,000 | | | | 10,236,674 | | |
LB-UBS Commercial Mortgage Trust(j)
Series 2005-C3 Class A5 | |
| 07/15/30 | | | 4.739 | % | | | 5,460,000 | | | | 5,965,039 | | |
| Series 2006-C1 Class A2 | |
| 02/15/31 | | | 5.084 | % | | | 2,847,487 | | | | 2,868,020 | | |
| Series 2007-C2 Class A3 | |
| 02/15/40 | | | 5.430 | % | | | 14,515,000 | | | | 16,033,371 | | |
Merrill Lynch Mortgage Investors, Inc.
CMO IO Series 1998-C3 Class IO(d)(j)(l) | |
| 12/15/30 | | | 0.500 | % | | | 16,057,262 | | | | 161,295 | | |
The Accompanying Notes to Financial Statements are an integral part of this statement.
17
Columbia Intermediate Bond Fund
April 30, 2012
(Percentages represent value of investments compared to net assets)
| Issuer | | Coupon
Rate | | Principal
Amount | | Value | |
| Commercial Mortgage-Backed Securities – Non-Agency (continued) | |
Merrill Lynch Mortgage Trust
Series 2005-MCP1 Class A4(d)(j) | |
| 06/12/43 | | | 4.747 | % | | $ | 6,450,000 | | | $ | 7,004,145 | | |
Morgan Stanley Capital I(d)(j)
Series 2007-IQ15 Class A4 | |
| 06/11/49 | | | 6.076 | % | | | 5,100,000 | | | | 5,737,383 | | |
Morgan Stanley Capital I(j)
Series 2003-IQ6 Class A4 | |
| 12/15/41 | | | 4.970 | % | | | 9,194,000 | | | | 9,665,487 | | |
| Series 2004-T13 Class A4 | |
| 09/13/45 | | | 4.660 | % | | | 14,680,000 | | | | 15,388,985 | | |
| Series 2006-IQ12 Class A4 | |
| 12/15/43 | | | 5.332 | % | | | 6,350,000 | | | | 7,141,940 | | |
Morgan Stanley Dean Witter Capital I(j)
Series 2002-IQ3 Class A4 | |
| 09/15/37 | | | 5.080 | % | | | 3,502,135 | | | | 3,542,875 | | |
| Series 2003-HQ2 Class A1 | |
| 03/12/35 | | | 4.180 | % | | | 2,505,098 | | | | 2,507,676 | | |
| Series 2003-HQ2 Class A2 | |
| 03/12/35 | | | 4.920 | % | | | 7,025,000 | | | | 7,178,911 | | |
Morgan Stanley Reremic Trust
Series 2010-GG10 Class A4A(b)(d)(j) | |
| 08/15/45 | | | 5.980 | % | | | 15,319,000 | | | | 17,290,188 | | |
WF-RBS Commercial Mortgage Trust
Series 2012-C6 Class A2(j) | |
| 04/15/45 | | | 2.191 | % | | | 4,000,000 | | | | 4,065,884 | | |
Wachovia Bank Commercial Mortgage Trust(b)(d)(j)
Series 2003-C7 Class A2 | |
| 10/15/35 | | | 5.077 | % | | | 11,200,000 | | | | 11,746,470 | | |
Wachovia Bank Commercial Mortgage Trust(d)(j)
Series 2004-C12 Class A4 | |
| 07/15/41 | | | 5.495 | % | | | 20,000,000 | | | | 21,496,460 | | |
| Series 2005-C17 Class A4 | |
| 03/15/42 | | | 5.083 | % | | | 9,575,000 | | | | 10,459,778 | | |
| Series 2005-C22 Class A4 | |
| 12/15/44 | | | 5.443 | % | | | 11,205,000 | | | | 12,514,775 | | |
| Series 2006-C23 Class A4 | |
| 01/15/45 | | | 5.418 | % | | | 8,680,000 | | | | 9,628,672 | | |
Wachovia Bank Commercial Mortgage Trust(j)
Series 2003-C5 Class A2 | |
| 06/15/35 | | | 3.989 | % | | | 10,386,343 | | | | 10,600,707 | | |
| Series 2005-C17 Class APB | |
| 03/15/42 | | | 5.037 | % | | | 7,698,281 | | | | 7,941,500 | | |
Total Commercial Mortgage-Backed Securities – Non-Agency
(Cost: $423,412,941) | | $ | 445,870,690 | | |
| Asset-Backed Securities – Agency 0.3% | |
Small Business Administration Participation Certificates
Series 2005-20F Class 1 | |
| 06/01/25 | | | 4.570 | % | | $ | 2,356,666 | | | $ | 2,588,503 | | |
| Series 2005-20L Class 1 | |
| 12/01/25 | | | 5.390 | % | | | 591,296 | | | | 667,716 | | |
| Series 2006-20C Class 1 | |
| 03/01/26 | | | 5.570 | % | | | 2,082,160 | | | | 2,361,946 | | |
| Series 2007-20H Class 1 | |
| 08/01/27 | | | 5.780 | % | | | 3,641,378 | | | | 4,182,464 | | |
Total Asset-Backed Securities – Agency
(Cost: $8,671,500) | | $ | 9,800,629 | | |
| Issuer | | Coupon
Rate | | Principal
Amount | | Value | |
| Asset-Backed Securities – Non-Agency 1.5% | |
Ally Auto Receivables Trust
Series 2010-1 Class A3 | |
| 05/15/14 | | | 1.450 | % | | $ | 629,783 | | | $ | 632,274 | | |
| Series 2011-4 Class A2 | |
| 03/17/14 | | | 0.650 | % | | | 1,875,750 | | | | 1,876,688 | | |
| Series 2012-1 Class A3 | |
| 02/16/16 | | | 0.930 | % | | | 1,035,000 | | | | 1,037,571 | | |
Ally Master Owner Trust
Series 2011-4 Class A2 | |
| 09/15/16 | | | 1.540 | % | | | 3,065,000 | | | | 3,079,294 | | |
BMW Vehicle Lease Trust
Series 2010-1 Class A3 | |
| 04/15/13 | | | 0.820 | % | | | 4,582,119 | | | | 4,585,801 | | |
BMW Vehicle Owner Trust
Series 2011-A Class A3 | |
| 08/25/15 | | | 0.760 | % | | | 3,426,000 | | | | 3,430,718 | | |
Bear Stearns Asset-Backed Securities Trust
Series 2006-HE9 Class 1A1(d) | |
| 11/25/36 | | | 0.289 | % | | | 328,120 | | | | 325,824 | | |
Bombardier Capital Mortgage Securitization Corp.
Series 1998-A Class A3 | |
| 04/15/28 | | | 6.230 | % | | | 47,040 | | | | 46,551 | | |
CNH Equipment Trust
Series 2011-B Class A3 | |
| 08/15/16 | | | 0.910 | % | | | 1,430,000 | | | | 1,432,876 | | |
Citibank Credit Card Issuance Trust
Series 2008-C6 Class C6 | |
| 06/20/14 | | | 6.300 | % | | | 745,000 | | | | 750,596 | | |
Citicorp Residential Mortgage Securities, Inc.
Series 2007-2 Class A3(d) | |
| 06/25/37 | | | 6.080 | % | | | 3,745,828 | | | | 3,745,592 | | |
Citigroup Mortgage Loan Trust, Inc.(d)
Series 2005-WF2 Class MF1 | |
| 08/25/35 | | | 5.517 | % | | | 3,775,000 | | | | 302,377 | | |
| Series 2005-WF2 Class MF2 | |
| 08/25/35 | | | 5.666 | % | | | 1,013,622 | | | | 17,396 | | |
Conseco Financial Corp.
Series 1997-6 Class A10 | |
| 01/15/29 | | | 6.870 | % | | | 667,898 | | | | 725,029 | | |
Contimortgage Home Equity Trust
Series 1996-4 Class A9 (NPFGC) | |
| 01/15/28 | | | 6.880 | % | | | 50,809 | | | | 50,659 | | |
Countrywide Asset-Backed Certificates(d)
Series 2007-S2 Class A3 (NPFGC) | |
| 05/25/37 | | | 5.813 | % | | | 1,343,505 | | | | 976,944 | | |
| Series 2007-S2 Class A6 (NPFGC) | |
| 05/25/37 | | | 5.779 | % | | | 725,763 | | | | 584,335 | | |
Discover Card Master Trust
Series 2009-A1 Class A1(d) | |
| 12/15/14 | | | 1.540 | % | | | 2,865,000 | | | | 2,869,576 | | |
First Alliance Mortgage Loan Trust
Series 1994-2 Class A1 (NPFGC) | |
| 07/25/25 | | | 7.625 | % | | | 395,098 | | | | 366,596 | | |
Ford Credit Auto Lease Trust
Series 2011-A Class A3 | |
| 07/15/14 | | | 1.030 | % | | | 2,890,000 | | | | 2,900,711 | | |
Ford Credit Auto Owner Trust
Series 2008-B Class A4A | |
| 03/15/13 | | | 4.950 | % | | | 308,528 | | | | 309,285 | | |
The Accompanying Notes to Financial Statements are an integral part of this statement.
18
Columbia Intermediate Bond Fund
April 30, 2012
(Percentages represent value of investments compared to net assets)
| Issuer | | Coupon
Rate | | Principal
Amount | | Value | |
| Asset-Backed Securities – Non-Agency (continued) | |
| Series 2010-A Class D | |
| 10/15/16 | | | 4.050 | % | | $ | 7,000,000 | | | $ | 7,384,153 | | |
| Series 2012-A Class A3 | |
| 08/15/16 | | | 0.840 | % | | | 975,000 | | | | 976,461 | | |
Franklin Auto Trust
Series 2008-A Class C(b) | |
| 05/20/16 | | | 7.160 | % | | | 4,643,244 | | | | 4,706,986 | | |
IMC Home Equity Loan Trust
Series 1995-3 Class A5 (AGM) | |
| 04/25/26 | | | 7.500 | % | | | 10,228 | | | | 10,225 | | |
JPMorgan Mortgage Acquisition Corp.
Series 2007-CH2 Class AV2(d) | |
| 01/25/37 | | | 0.309 | % | | | 1,218,523 | | | | 1,165,052 | | |
RAAC Series
Series 2006-RP2 Class A(b)(d) | |
| 02/25/37 | | | 0.489 | % | | | 3,040,294 | | | | 2,620,950 | | |
Renaissance Home Equity Loan Trust
Series 2005-3 Class M2(d) | |
| 11/25/35 | | | 5.355 | % | | | 4,750,000 | | | | 921,775 | | |
SACO I, Inc.
Series 2005-2 Class A(b)(d) | |
| 04/25/35 | | | 0.639 | % | | | 291,667 | | | | 127,833 | | |
SMART Trust
Series 2012-1USA Class A4A(b) | |
| 12/14/17 | | | 2.010 | % | | | 2,725,000 | | | | 2,722,686 | | |
Total Asset-Backed Securities – Non-Agency
(Cost: $59,373,587) | | $ | 50,682,814 | | |
| Inflation-Indexed Bonds(a) —% | |
Uruguay Government International Bond
Senior Unsecured | |
| 12/15/28 | | | 4.375 | % | | UYU | 28,235,150 | | | $ | 1,605,472 | | |
Total Inflation-Indexed Bonds
(Cost: $1,464,309) | | $ | 1,605,472 | | |
| U.S. Treasury Obligations 20.9% | |
| U.S. Treasury | |
| 06/30/12 | | | 0.625 | % | | $ | 74,416,000 | | | $ | 74,477,021 | | |
| 01/31/14 | | | 0.250 | % | | | 83,413,000 | | | | 83,416,253 | | |
| 04/15/15 | | | 0.375 | % | | | 1,058,000 | | | | 1,057,835 | | |
| 12/31/16 | | | 0.875 | % | | | 7,950,000 | | | | 7,997,207 | | |
| 08/15/41 | | | 3.750 | % | | | 1,810,000 | | | | 2,043,602 | | |
| 02/15/42 | | | 3.125 | % | | | 2,225,000 | | | | 2,231,257 | | |
| U.S. Treasury(c) | |
| 02/28/17 | | | 0.875 | % | | | 21,925,000 | | | | 22,031,205 | | |
| 03/31/17 | | | 1.000 | % | | | 5,460,000 | | | | 5,514,600 | | |
| 05/31/18 | | | 2.375 | % | | | 83,026,000 | | | | 89,363,209 | | |
| 11/15/21 | | | 2.000 | % | | | 1,510,000 | | | | 1,526,516 | | |
| 02/15/22 | | | 2.000 | % | | | 91,157,100 | | | | 91,840,778 | | |
| 11/15/41 | | | 3.125 | % | | | 49,982,000 | | | | 50,138,194 | | |
U.S. Treasury(c)(m)
STRIPS | |
| 11/15/18 | | | 0.000 | % | | | 133,700,000 | | | | 123,217,920 | | |
| 11/15/19 | | | 0.000 | % | | | 12,385,000 | | | | 11,020,384 | | |
| 11/15/21 | | | 0.000 | % | | | 59,301,000 | | | | 49,280,020 | | |
| Issuer | | Coupon
Rate | | Principal
Amount | | Value | |
| U.S. Treasury Obligations (continued) | |
| U.S. Treasury(g) | |
| 04/30/17 | | | 0.875 | % | | $ | 37,285,000 | | | $ | 37,401,516 | | |
U.S. Treasury(m)
STRIPS | |
| 11/15/21 | | | 0.000 | % | | | 31,540,000 | | | | 26,023,969 | | |
| 02/15/40 | | | 0.000 | % | | | 61,595,000 | | | | 24,787,676 | | |
Total U.S. Treasury Obligations
(Cost: $685,296,483) | | $ | 703,369,162 | | |
| Foreign Government Obligations(a) 1.1% | |
| ARGENTINA 0.1% | |
Argentina Boden Bonds
Senior Unsecured | |
| 10/03/15 | | | 7.000 | % | | $ | 410,000 | | | $ | 371,050 | | |
Argentina Bonar Bonds
Senior Unsecured | |
| 04/17/17 | | | 7.000 | % | | | 710,000 | | | | 577,940 | | |
Argentina Republic Government International Bond
Senior Unsecured(d) | |
| 12/15/35 | | | 4.383 | % | | | 1,500,000 | | | | 180,000 | | |
| Total | | | | | | | | | | | 1,128,990 | | |
| BRAZIL 0.1% | |
Brazilian Government International Bond
Senior Unsecured | |
| 01/22/21 | | | 4.875 | % | | | 400,000 | | | | 458,895 | | |
| 01/07/41 | | | 5.625 | % | | | 280,000 | | | | 333,200 | | |
Morgan Stanley
Senior Unsecured(b) | |
| 05/03/17 | | | 10.090 | % | | BRL | 780,000 | | | | 409,202 | | |
| Petrobras International Finance Co. | |
| 03/15/19 | | | 7.875 | % | | | 230,000 | | | | 284,361 | | |
| 01/20/20 | | | 5.750 | % | | | 500,000 | | | | 558,079 | | |
| Total | | | | | | | | | | | 2,043,737 | | |
| CHILE —% | |
Empresa Nacional del Petroleo
Senior Unsecured(b) | |
| 12/06/21 | | | 4.750 | % | | | 400,000 | | | | 413,534 | | |
| COLOMBIA 0.1% | |
Colombia Government International Bond
Senior Unsecured | |
| 07/12/21 | | | 4.375 | % | | | 290,000 | | | | 320,450 | | |
| 01/18/41 | | | 6.125 | % | | | 480,000 | | | | 604,541 | | |
Corp. Andina de Fomento
Senior Unsecured | |
| 06/04/19 | | | 8.125 | % | | | 230,000 | | | | 287,556 | | |
Empresa de Energia de Bogota SA
Senior Unsecured(b)(c) | |
| 11/10/21 | | | 6.125 | % | | | 345,000 | | | | 364,011 | | |
Empresas Publicas de Medellin ESP
Senior Unsecured(b) | |
| 02/01/21 | | | 8.375 | % | | COP | 620,000,000 | | | | 377,759 | | |
| Total | | | | | | | | | | | 1,954,317 | | |
| DOMINICAN REPUBLIC —% | |
Dominican Republic International Bond(b)
Senior Unsecured | |
| 05/06/21 | | | 7.500 | % | | | 460,000 | | | | 483,176 | | |
| 04/20/27 | | | 8.625 | % | | | 230,000 | | | | 246,100 | | |
| Total | | | | | | | | | | | 729,276 | | |
The Accompanying Notes to Financial Statements are an integral part of this statement.
19
Columbia Intermediate Bond Fund
April 30, 2012
(Percentages represent value of investments compared to net assets)
| Issuer | | Coupon
Rate | | Principal
Amount | | Value | |
| Foreign Government Obligations(a) (continued) | |
| HUNGARY —% | |
Hungary Government International Bond
Senior Unsecured(c) | |
| 03/29/21 | | | 6.375 | % | | $ | 230,000 | | | $ | 220,766 | | |
| INDONESIA 0.1% | |
Indonesia Government International Bond(b)
Senior Unsecured | |
| 05/05/21 | | | 4.875 | % | | | 460,000 | | | | 494,575 | | |
| 01/17/38 | | | 7.750 | % | | | 490,000 | | | | 663,950 | | |
Indonesia Treasury Bond
Senior Unsecured | |
| 05/15/22 | | | 7.000 | % | | IDR | 7,000,000,000 | | | | 822,853 | | |
| Majapahit Holding BV(b) | |
| 06/28/17 | | | 7.250 | % | | | 280,000 | | | | 320,523 | | |
| 08/07/19 | | | 8.000 | % | | | 230,000 | | | | 274,850 | | |
PT Perusahaan Listrik Negara
Senior Unsecured(b) | |
| 11/22/21 | | | 5.500 | % | | | 710,000 | | | | 730,988 | | |
| Total | | | | | | | | | | | 3,307,739 | | |
| KAZAKHSTAN —% | |
KazMunayGas National Co.(b)
Senior Unsecured | |
| 01/23/15 | | | 11.750 | % | | | 230,000 | | | | 278,875 | | |
| 07/02/18 | | | 9.125 | % | | | 300,000 | | | | 373,125 | | |
| Total | | | | | | | | | | | 652,000 | | |
| LITHUANIA —% | |
Lithuania Government International Bond
Senior Unsecured(b) | |
| 03/09/21 | | | 6.125 | % | | | 520,000 | | | | 563,900 | | |
| MEXICO 0.1% | |
| Mexican Bonos | |
| 06/10/21 | | | 6.500 | % | | MXN | 520,000 | | | | 409,077 | | |
| 06/03/27 | | | 7.500 | % | | MXN | 870,000 | | | | 710,209 | | |
Mexico Government International Bond
Senior Unsecured | |
| 03/15/22 | | | 3.625 | % | | | 400,000 | | | | 417,600 | | |
| Pemex Project Funding Master Trust | |
| 01/21/21 | | | 5.500 | % | | | 840,000 | | | | 934,920 | | |
| Petroleos Mexicanos | |
| 06/02/41 | | | 6.500 | % | | | 230,000 | | | | 266,800 | | |
| Petroleos Mexicanos(b) | |
| 06/02/41 | | | 6.500 | % | | | 280,000 | | | | 324,800 | | |
| Total | | | | | | | | | | | 3,063,406 | | |
| PERU —% | |
Peru Enhanced Pass-Through Finance Ltd.
Pass-Thru Certificates(b)(m) | |
| 05/31/18 | | | 0.000 | % | | | 321,679 | | | | 283,077 | | |
Peruvian Government International Bond
Senior Unsecured | |
| 07/21/25 | | | 7.350 | % | | | 200,000 | | | | 277,000 | | |
Peruvian Government International Bond(b)
Senior Unsecured | |
| 08/12/31 | | | 6.950 | % | | PEN | 560,000 | | | | 235,763 | | |
Peruvian Government International Bond(c)
Senior Unsecured | |
| 11/18/50 | | | 5.625 | % | | | 130,000 | | | | 150,475 | | |
| Total | | | | | | | | | | | 946,315 | | |
| Issuer | | Coupon
Rate | | Principal
Amount | | Value | |
| Foreign Government Obligations(a) (continued) | |
| PHILIPPINES —% | |
Philippine Government International Bond
Senior Unsecured | |
| 03/30/26 | | | 5.500 | % | | $ | 230,000 | | | $ | 263,925 | | |
Power Sector Assets & Liabilities Management Corp.
Government Guaranteed(b) | |
| 12/02/24 | | | 7.390 | % | | | 230,000 | | | | 290,968 | | |
| Total | | | | | | | | | | | 554,893 | | |
| POLAND —% | |
Poland Government International Bond
Senior Unsecured(c) | |
| 03/23/22 | | | 5.000 | % | | | 600,000 | | | | 642,000 | | |
| QATAR 0.2% | |
Nakilat, Inc.
Senior Secured(b) | |
| 12/31/33 | | | 6.067 | % | | | 4,795,000 | | | | 5,202,575 | | |
Qatar Government International Bond(b)
Senior Unsecured | |
| 01/20/22 | | | 4.500 | % | | | 230,000 | | | | 242,650 | | |
| 01/20/42 | | | 5.750 | % | | | 230,000 | | | | 255,875 | | |
| Total | | | | | | | | | | | 5,701,100 | | |
| REPUBLIC OF NAMIBIA —% | |
Namibia International Bonds
Senior Unsecured(b) | |
| 11/03/21 | | | 5.500 | % | | | 430,000 | | | | 448,275 | | |
| REPUBLIC OF THE CONGO —% | |
Republic of Congo
Senior Unsecured(d) | |
| 06/30/29 | | | 3.000 | % | | | 142,500 | | | | 110,438 | | |
| ROMANIA —% | |
Romanian Government International Bond
Senior Unsecured(b) | |
| 02/07/22 | | | 6.750 | % | | | 260,000 | | | | 272,864 | | |
| RUSSIAN FEDERATION 0.2% | |
Gazprom OAO Via Gaz Capital SA(b)
Senior Unsecured | |
| 01/23/21 | | | 5.999 | % | | | 960,000 | | | | 1,022,784 | | |
Gazprom OAO Via Gaz Capital SA(b)(c)
Senior Unsecured | |
| 11/22/16 | | | 6.212 | % | | | 230,000 | | | | 250,987 | | |
| 08/16/37 | | | 7.288 | % | | | 260,000 | | | | 299,975 | | |
Gazprom OAO Via Gazprom International SA
Senior Unsecured(b) | |
| 02/01/20 | | | 7.201 | % | | | 2,872,066 | | | | 3,158,670 | | |
Russian Foreign Bond - Eurobond
Senior Unsecured(b)(d) | |
| 03/31/30 | | | 7.500 | % | | | 780,850 | | | | 936,044 | | |
Sberbank of Russia Via SB Capital SA
Senior Unsecured | |
| 06/16/21 | | | 5.717 | % | | | 500,000 | | | | 506,250 | | |
Vnesheconombank Via VEB Finance PLC
Senior Unsecured(b) | |
| 11/22/25 | | | 6.800 | % | | | 345,000 | | | | 365,700 | | |
| Total | | | | | | | | | | | 6,540,410 | | |
The Accompanying Notes to Financial Statements are an integral part of this statement.
20
Columbia Intermediate Bond Fund
April 30, 2012
(Percentages represent value of investments compared to net assets)
| Issuer | | Coupon
Rate | | Principal
Amount | | Value | |
| Foreign Government Obligations(a) (continued) | |
| SOUTH AFRICA —% | |
South Africa Government International Bond
Senior Unsecured | |
| 01/17/24 | | | 4.665 | % | | $ | 200,000 | | | $ | 209,500 | | |
| 03/08/41 | | | 6.250 | % | | | 150,000 | | | | 180,188 | | |
| Total | | | | | | | | | | | 389,688 | | |
| SOUTH KOREA —% | |
Export-Import Bank of Korea
Senior Unsecured | |
| 09/15/21 | | | 4.375 | % | | | 230,000 | | | | 234,241 | | |
| 04/11/22 | | | 5.000 | % | | | 400,000 | | | | 429,642 | | |
| Total | | | | | | | | | | | 663,883 | | |
| TRINIDAD AND TOBAGO —% | |
Petroleum Co. of Trinidad & Tobago Ltd.
Senior Unsecured(b) | |
| 08/14/19 | | | 9.750 | % | | | 430,000 | | | | 529,358 | | |
| TURKEY 0.1% | |
| Turkey Government International Bond | |
| 03/25/22 | | | 5.125 | % | | | 290,000 | | | | 295,365 | | |
| Senior Unsecured | |
| 03/30/21 | | | 5.625 | % | | | 520,000 | | | | 556,400 | | |
| 09/26/22 | | | 6.250 | % | | | 270,000 | | | | 299,025 | | |
| 03/17/36 | | | 6.875 | % | | | 410,000 | | | | 464,325 | | |
| Total | | | | | | | | | | | 1,615,115 | | |
| UNITED ARAB EMIRATES —% | |
Abu Dhabi National Energy Co.
Senior Unsecured(b) | |
| 12/13/21 | | | 5.875 | % | | | 350,000 | | | | 378,477 | | |
| URUGUAY —% | |
Uruguay Government International Bond
Senior Unsecured | |
| 03/21/36 | | | 7.625 | % | | | 280,000 | | | | 393,260 | | |
| VENEZUELA 0.1% | |
| Petroleos de Venezuela SA | |
| 11/02/17 | | | 8.500 | % | | | 820,000 | | | | 731,850 | | |
| 02/17/22 | | | 12.750 | % | | | 290,000 | | | | 295,075 | | |
| Senior Unsecured | |
| 10/28/16 | | | 5.125 | % | | | 800,000 | | | | 652,000 | | |
Petroleos de Venezuela SA(c)
Senior Unsecured | |
| 10/28/15 | | | 5.000 | % | | | 280,000 | | | | 238,840 | | |
Venezuela Government International Bond
Senior Unsecured | |
| 05/07/23 | | | 9.000 | % | | | 1,240,000 | | | | 1,078,800 | | |
| Total | | | | | | | | | | | 2,996,565 | | |
Total Foreign Government Obligations
(Cost: $34,001,971) | | $ | 36,260,306 | | |
| Preferred Debt 2.1% | |
| Banking 2.1% | |
| Citigroup Capital XIII | |
| 10/30/40 | | | 7.88 | % | | $ | 1,153,545 | | | $ | 30,718,903 | | |
| Lloyds Banking Group PLC(b) | |
| 05/21/37 | | | 6.657 | % | | | 5,479,000 | | | | 3,670,930 | | |
| NB Capital Trust II | |
| 12/15/26 | | | 7.83 | % | | | 1,210,000 | | | | 1,216,050 | | |
| Issuer | | Coupon
Rate | | Principal
Amount | | Value | |
| Preferred Debt (continued) | |
| PNC Financial Services Group, Inc. | |
| 05/01/22 | | | 6.13 | % | | $ | 633,500 | | | $ | 15,900,850 | | |
| U.S. Bancorp | |
| 01/15/22 | | | 6.50 | % | | | 686,550 | | | | 18,578,043 | | |
| Total | | | | | | | 70,084,776 | | |
Total Preferred Debt
(Cost: $68,636,405) | | $ | 70,084,776 | | |
Issue
Description | | Coupon
Rate | | Principal
Amount | | Value | |
| Municipal Bonds 1.2% | |
City of Chicago Waterworks
Revenue Bonds
Build America Bonds
Series 2010 | |
| 11/01/40 | | | 6.742 | % | | $ | 1,655,000 | | | $ | 2,135,877 | | |
Commonwealth of Massachusetts
Revenue Bonds
Build America Bonds-Recovery
Series 2010Z | |
| 06/01/30 | | | 5.631 | % | | $ | 5,580,000 | | | $ | 7,056,077 | | |
Kentucky Asset Liability Commission
Revenue Bonds
Taxable
Series 2010 | |
| 04/01/18 | | | 3.165 | % | | | 19,395,000 | | | | 20,326,930 | | |
Los Angeles Unified School District
Unlimited General Obligation Bonds
Build America Bonds
Series 2009 | |
| 07/01/34 | | | 5.750 | % | | | 9,860,000 | | | | 11,562,132 | | |
State of California
Unlimited General Obligation Bonds
Taxable
Series 2010 | |
| 11/01/15 | | | 3.950 | % | | | 395,000 | | | | 427,481 | | |
Total Municipal Bonds
(Cost: $36,775,290) | | $ | 41,508,497 | | |
| Borrower | | Weighted
Average
Coupon | | Principal
Amount | | Value | |
| Senior Loans 0.1% | |
| Automotive —% | |
Schaeffler AG
Tranche C2 Term Loan(d)(g)(n) | |
| 01/27/17 | | | 6.000 | % | | $ | 204,000 | | | $ | 204,655 | | |
| Brokerage —% | |
Nuveen Investments, Inc.
2nd Lien Term Loan(d)(n) | |
| 02/28/19 | | | 8.250 | % | | | 522,000 | | | | 532,440 | | |
| Gaming —% | |
Caesars Octavius LLC
Tranche B Term Loan(d)(n) | |
| 04/25/17 | | | 9.250 | % | | | 323,000 | | | | 319,770 | | |
The Accompanying Notes to Financial Statements are an integral part of this statement.
21
Columbia Intermediate Bond Fund
April 30, 2012
(Percentages represent value of investments compared to net assets)
| Borrower | | Weighted
Average
Coupon | | Principal
Amount | | Value | |
| Senior Loans (continued) | |
| Gaming (cont.) | |
ROC Finance LLC
Tranche B Term Loan(d)(n) | |
| 08/19/17 | | | 8.500 | % | | $ | 149,000 | | | $ | 149,869 | | |
| Total | | | | | | | | | | | 469,639 | | |
| Media Non-Cable 0.1% | |
Cumulus Media Holdings, Inc.(d)(g)(n)
2nd Lien Term Loan | |
| 03/18/19 | | | 7.500 | % | | | 540,000 | | | | 548,370 | | |
Cumulus Media Holdings, Inc.(d)(n)
2nd Lien Term Loan | |
| 03/18/19 | | | 7.500 | % | | | 664,000 | | | | 674,292 | | |
| Total | | | | | | | | | | | 1,222,662 | | |
| Property & Casualty —% | |
Lonestar Intermediate Super Holdings LLC(d)(g)(n)
Term Loan | |
| 09/02/19 | | | 11.000 | % | | | 330,000 | | | | 338,524 | | |
Lonestar Intermediate Super Holdings LLC(d)(n)
Term Loan | |
| 09/02/19 | | | 11.000 | % | | | 667,000 | | | | 684,228 | | |
| Total | | | | | | | | | | | 1,022,752 | | |
Total Senior Loans
(Cost: $3,326,685) | | $ | 3,452,148 | | |
| Issuer | | | | Shares | | Value | |
| Common Stocks —% | |
| FINANCIALS —% | |
| Thrifts & Mortgage Finance —% | |
Washington Funding Trust LII D
Escrow(h)(i)(o) | | | | | 2,725 | | | $ | — | | |
| WMI Holdings Corp.(c)(o) | | | | | 53,957 | | | | 31,430 | | |
| Total | | | | | | | | | | | 31,430 | | |
| TOTAL FINANCIALS | | | 31,430 | | |
| INDUSTRIALS —% | |
| Airlines —% | |
| United Continental Holdings, Inc.(c)(o) | | | | | 1,493 | | | | 32,727 | | |
| TOTAL INDUSTRIALS | | | 32,727 | | |
Total Common Stocks
(Cost: $1,511,115) | | $ | 64,157 | | |
| Warrants —% | |
| ENERGY —% | |
| Energy Equipment & Services —% | |
| Green Field Energy Services, Inc.(o) | | | | | 634 | | | $ | 38,674 | | |
| TOTAL ENERGY | | | 38,674 | | |
| INFORMATION TECHNOLOGY —% | |
| Communications Equipment —% | |
| CMP Susquehanna Corp.(b)(e)(i)(o) | | | | | 17,375 | | | | 174 | | |
| TOTAL INFORMATION TECHNOLOGY | | | 174 | | |
Total Warrants
(Cost: $25,727) | | $ | 38,848 | | |
| Issuer | | Coupon
Rate | | Principal
Amount | | Value | |
| Treasury Note Short-Term 1.2% | |
| U.S. Treasury Bills | | | 0.060 | % | | $ | 38,750,000 | | | $ | 38,749,320 | | |
Total Treasury Note Short-Term
(Cost: $38,748,934) | | $ | 38,749,320 | | |
| | | | | Shares | | Value | |
| Money Market Funds 0.7% | |
| Columbia Short-Term Cash Fund, 0.144%(p)(q) | | | | | 22,151,315 | | | $ | 22,151,315 | | |
Total Money Market Funds
(Cost: $22,151,315) | | $ | 22,151,315 | | |
| Issuer | | Effective
Yield | | Par/
Principal/
Shares | | Value | |
Investments of Cash Collateral Received for Securities
on Loan 5.2% | |
| Asset-Backed Commercial Paper 0.5% | |
| Atlantic Asset Securitization LLC | |
| 05/02/12 | | | 0.270 | % | | $ | 5,999,730 | | | $ | 5,999,730 | | |
| Atlantis One | |
| 09/10/12 | | | 0.592 | % | | | 3,988,200 | | | | 3,988,200 | | |
| Kells Funding, LLC | |
| 10/12/12 | | | 0.612 | % | | | 3,987,664 | | | | 3,987,664 | | |
| LMA Americas LLC | |
| 05/02/12 | | | 0.300 | % | | | 2,299,847 | | | | 2,299,847 | | |
| Total | | | | | | | | | | | 16,275,441 | | |
| Certificates of Deposit 2.3% | |
| ABM AMRO Bank N.V. | |
| 06/21/12 | | | 0.400 | % | | | 5,993,873 | | | | 5,993,873 | | |
| Australia and New Zealand Bank Group, Ltd. | |
| 05/09/12 | | | 0.500 | % | | | 3,000,000 | | | | 3,000,000 | | |
| Banque et Caisse d'Epargne de l'Etat | |
| 06/15/12 | | | 0.430 | % | | | 4,994,511 | | | | 4,994,511 | | |
| Barclays Bank PLC | |
| 07/18/12 | | | 0.280 | % | | | 5,000,000 | | | | 5,000,000 | | |
| DZ Bank AG | |
| 07/27/12 | | | 0.320 | % | | | 5,000,000 | | | | 5,000,000 | | |
| FMS Wertmanagement Anstalt Des Oeffentlichen Rechts | |
| 05/29/12 | | | 0.280 | % | | | 5,000,000 | | | | 5,000,000 | | |
| Hong Kong Shanghai Bank Corp., Ltd. | |
| 05/21/12 | | | 0.250 | % | | | 5,000,000 | | | | 5,000,000 | | |
| Landeskreditbank Baden-Wuerttemberg - Foerderbank | |
| 05/31/12 | | | 0.190 | % | | | 5,000,000 | | | | 5,000,000 | | |
| Mizuho Corporate Bank Ltd. | |
| 08/14/12 | | | 0.400 | % | | | 4,000,000 | | | | 4,000,000 | | |
| N.V. Bank Nederlandse Gemeenten | |
| 05/10/12 | | | 0.280 | % | | | 5,000,000 | | | | 5,000,000 | | |
| Natixis | |
| 05/01/12 | | | 0.240 | % | | | 5,000,000 | | | | 5,000,000 | | |
| Norinchukin Bank | |
| 05/21/12 | | | 0.470 | % | | | 4,000,000 | | | | 4,000,000 | | |
| Pohjola Bank PLC | |
| 05/23/12 | | | 0.290 | % | | | 4,000,000 | | | | 4,000,000 | | |
| Standard Chartered Bank PLC | |
| 10/05/12 | | | 0.630 | % | | | 3,987,231 | | | | 3,987,231 | | |
| Sumitomo Mitsui Banking Corp. | |
| 06/04/12 | | | 0.375 | % | | | 5,000,000 | | | | 5,000,000 | | |
| 07/03/12 | | | 0.360 | % | | | 2,000,000 | | | | 2,000,000 | | |
The Accompanying Notes to Financial Statements are an integral part of this statement.
22
Columbia Intermediate Bond Fund
April 30, 2012
(Percentages represent value of investments compared to net assets)
| Issuer | | Effective
Yield | | Par/
Principal/
Shares | | Value | |
Investments of Cash Collateral Received for Securities
on Loan (continued) | |
| Certificates of Deposit (cont.) | |
| Svenska Handelsbanken | |
| 08/30/12 | | | 0.580 | % | | $ | 5,000,000 | | | $ | 5,000,000 | | |
| Total | | | | | | | | | | | 76,975,615 | | |
| Commercial Paper 1.2% | |
| Caisse d'Amortissement de la Dette Sociale | |
| 05/02/12 | | | 0.671 | % | | | 4,991,532 | | | | 4,991,532 | | |
| Caisse des Depots | |
| 10/05/12 | | | 0.562 | % | | | 4,985,767 | | | | 4,985,767 | | |
| DnB NOR | |
| 08/30/12 | | | 0.489 | % | | | 4,000,000 | | | | 4,000,000 | | |
| Mitsubishi UFJ Trust and Banking Corp. | |
| 05/03/12 | | | 0.430 | % | | | 4,995,760 | | | | 4,995,760 | | |
| Skandinaviska Enskilda Banken AB | |
| 06/15/12 | | | 0.330 | % | | | 4,997,250 | | | | 4,997,250 | | |
| Societe Generale | |
| 05/01/12 | | | 0.310 | % | | | 4,999,698 | | | | 4,999,698 | | |
| Suncorp Metway Ltd. | |
| 05/21/12 | | | 0.480 | % | | | 1,998,320 | | | | 1,998,320 | | |
| 06/05/12 | | | 0.460 | % | | | 4,996,103 | | | | 4,996,103 | | |
| Westpac Securities NZ Ltd. | |
| 08/27/12 | | | 0.491 | % | | | 3,991,017 | | | | 3,991,017 | | |
| Total | | | | | | | | | | | 39,955,447 | | |
| Repurchase Agreements 1.2% | |
Citigroup Global Markets, Inc.(r)
dated 04/30/12, matures 05/01/12,
repurchase price $13,000,076 | |
| | | | 0.210 | % | | | 13,000,000 | | | | 13,000,000 | | |
| repurchase price $3,000,018 | |
| | | | 0.210 | % | | | 3,000,000 | | | | 3,000,000 | | |
| Issuer | | Effective
Yield | | Par/
Principal/
Shares | | Value | |
Investments of Cash Collateral Received for Securities
on Loan (continued) | |
| Repurchase Agreements (cont.) | |
Mizuho Securities USA, Inc.
dated 04/30/12, matures 05/01/12,
repurchase price 7,400,049(r) | |
| | | | 0.240 | % | | $ | 7,400,000 | | | $ | 7,400,000 | | |
Natixis Financial Products, Inc.
dated 04/30/12, matures 05/01/12,
repurchase price $5,000,033(r) | |
| | | | 0.240 | % | | | 5,000,000 | | | | 5,000,000 | | |
Nomura Securities
dated 04/30/12, matures 05/01/12,
repurchase price $5,000,033(r) | |
| | | | 0.240 | % | | | 5,000,000 | | | | 5,000,000 | | |
Societe Generale
dated 04/30/12, matures 05/01/12,
repurchase price $8,032,113(r) | |
| | | | 0.210 | % | | | 8,032,066 | | | | 8,032,066 | | |
| Total | | | | | | | | | | | 41,432,066 | | |
Total Investments of Cash Collateral Received for
Securities on Loan
(Cost: $174,638,569) | | $ | 174,638,569 | | |
Total Investments
(Cost: $3,386,730,390) | | | | | | $ | 3,499,146,069 | | |
| Other Assets & Liabilities, Net | | | | | | | (130,366,539 | ) | |
| Net Assets | | $ | 3,368,779,530 | | |
| Investments in Derivatives | |
Futures Contracts Outstanding at April 30, 2012
| Contract Description | | Number of
Contracts
Long (Short) | | Notional
Market Value | | Expiration
Date | | Unrealized
Appreciation | | Unrealized
Depreciation | |
| U.S. Treasury Note, 2-year | | | 590 | | | $ | 130,122,659 | | | June 2012 | | $ | 183,343 | | | $ | — | | |
| U.S. Treasury Note, 5-year | | | (1,153 | ) | | | (142,737,803 | ) | | June 2012 | | | — | | | | (902,799 | ) | |
| U.S. Treasury Note, 10-year | | | (1,327 | ) | | | (175,537,219 | ) | | June 2012 | | | — | | | | (2,076,636 | ) | |
| U.S. Treasury Long Bond, 20-year | | | (260 | ) | | | (37,147,500 | ) | | June 2012 | | | — | | | | (648,424 | ) | |
| U.S. Treasury Ultra Bond, 30-year | | | (258 | ) | | | (40,715,625 | ) | | June 2012 | | | — | | | | (654,395 | ) | |
| Total | | | | | | | | $ | 183,343 | | | $ | (4,282,254 | ) | |
The Accompanying Notes to Financial Statements are an integral part of this statement.
23
Columbia Intermediate Bond Fund
April 30, 2012
Credit Default Swap Contracts Outstanding at April 30, 2012
Buy Protection
| Counterparty | | Reference Entity | | Expiration Date | | Pay Fixed
Rate | | Notional
Amount | | Market
Value | | Unamortized
Premium
(Paid)
Received | | Periodic
Payments
Receivable
(Payable) | | Unrealized
Appreciation | | Unrealized
Depreciation | |
| Barclays | | D.R. Horton, Inc. | | December 20, 2016 | | | 1.000 | % | | $ | 19,055,000 | | | $ | 654,278 | | | $ | (2,246,331 | ) | | $ | (22,231 | ) | | $ | — | | | $ | (1,614,284 | ) | |
| JPMorgan | | D.R. Horton, Inc. | | December 20, 2016 | | | 1.000 | | | | 5,220,000 | | | | 179,235 | | | | (516,766 | ) | | | (6,090 | ) | | | — | | | | (343,621 | ) | |
| Barclays | | Home Depot, Inc. | | December 20, 2016 | | | 1.000 | | | | 21,410,000 | | | | (581,334 | ) | | | 333,707 | | | | (24,978 | ) | | | — | | | | (272,605 | ) | |
| JPMorgan | | Limited Brands, Inc. | | December 20, 2016 | | | 1.000 | | | | 11,750,000 | | | | 365,575 | | | | (749,578 | ) | | | (13,708 | ) | | | — | | | | (397,711 | ) | |
| Barclays | | Toll Brothers, Inc. | | December 20, 2016 | | | 1.000 | | | | 24,000,000 | | | | 373,895 | | | | (1,345,192 | ) | | | (28,000 | ) | | | — | | | | (999,297 | ) | |
| Morgan Stanley | | Toll Brothers, Inc. | | December 20, 2016 | | | 1.000 | | | | 3,555,000 | | | | 55,383 | | | | (198,952 | ) | | | (4,147 | ) | | | — | | | | (147,716 | ) | |
| JPMorgan | | Barclays Bank, PLC | | March 20, 2017 | | | 1.000 | | | | 5,480,000 | | | | 210,590 | | | | (227,931 | ) | | | (6,393 | ) | | | — | | | | (23,734 | ) | |
| Morgan Stanley | | Barclays Bank, PLC | | March 20, 2017 | | | 1.000 | | | | 13,170,000 | | | | 506,109 | | | | (575,753 | ) | | | (15,365 | ) | | | — | | | | (85,009 | ) | |
| Citibank | | Goldman Sachs Group, Inc. | | March 20, 2017 | | | 1.000 | | | | 8,750,000 | | | | 632,705 | | | | (573,083 | ) | | | (10,208 | ) | | | 49,414 | | | | — | | |
| Morgan Stanley | | Home Depot, Inc. | | March 20, 2017 | | | 1.000 | | | | 465,000 | | | | (12,809 | ) | | | 10,814 | | | | (542 | ) | | | — | | | | (2,537 | ) | |
| Barclays | | Marriott International, Inc. | | March 20, 2017 | | | 1.000 | | | | 6,275,000 | | | | (49,242 | ) | | | 20,495 | | | | (7,321 | ) | | | — | | | | (36,068 | ) | |
| Citibank | | Marriott International, Inc. | | March 20, 2017 | | | 1.000 | | | | 4,070,000 | | | | (31,939 | ) | | | 13,293 | | | | (4,748 | ) | | | — | | | | (23,394 | ) | |
| Barclays | | Goldman Sachs | | March 20, 2017 | | | 1.000 | | | | 5,305,000 | | | | 383,600 | | | | (443,823 | ) | | | (6,189 | ) | | | — | | | | (66,412 | ) | |
Goldman Sachs
International | | Textron, Inc. | | March 20, 2017 | | | 1.000 | | | | 11,335,000 | | | | 250,211 | | | | (156,201 | ) | | | (13,224 | ) | | | 80,786 | | | | — | | |
Goldman Sachs
International | | Toll Brothers, Inc. | | March 20, 2017 | | | 1.000 | | | | 4,655,000 | | | | 87,270 | | | | (95,529 | ) | | | (5,431 | ) | | | — | | | | (13,690 | ) | |
| Total | | | | | | | | | | | | | | | | $ | 130,200 | | | $ | (4,026,078 | ) | |
| Notes to Portfolio of Investments | |
(a) Principal amounts are denominated in United States Dollars unless otherwise noted.
(b) Security exempt from registration pursuant to Rule 144A under the Securities Act of 1933. This security may be resold in transactions exempt from registration, normally to qualified institutional buyers. At April 30, 2012, the value of these securities amounted to $346,671,196 or 10.29% of net assets.
(c) At April 30, 2012, security was partially or fully on loan.
(d) Variable rate security. The interest rate shown reflects the rate as of April 30, 2012.
(e) Identifies issues considered to be illiquid as to their marketability. The aggregate value of such securities at April 30, 2012 was $1,907,630, representing 0.06% of net assets. Information concerning such security holdings at April 30, 2012 was as follows:
| Security Description | | Acquisition
Dates | | Cost | |
American Mortgage Trust
Series 2093-3 Class 3A
07/27/23 8.188% | | 04/27/95 | | $ | 6,007 | | |
| CMP Susquehanna Corp. | | 03/26/09 | | | 174 | | |
Discover Financial Services
04/27/22 5.200% | | 07/15/09-03/12/11 | | | 1,321,745 | | |
Six Flags, Inc.
06/01/14 9.625% | | 05/07/10 | | | — | | |
Washington Mutual Bank
Subordinated Notes
01/15/15 5.125% | | 09/25/07-05/14/08 | | | 24,052,072 | | |
(f) Represents securities that have defaulted on payment of interest. The Fund has stopped accruing interest on these securities. At April 30, 2012, the value of these securities amounted to $41,069, which represents less than 0.01% of net assets.
(g) Represents a security purchased on a when-issued or delayed delivery basis.
(h) Negligible market value.
(i) Represents fair value as determined in good faith under procedures approved by the Board of Trustees. At April 30, 2012, the value of these securities amounted to $45,120, which represents less than 0.01% of net assets.
(j) The maturity dates shown represent the original maturity of the underlying obligation. Actual maturity may vary based upon prepayment activity on these obligations. Unless otherwise noted, the coupon rates presented are fixed rates.
The Accompanying Notes to Financial Statements are an integral part of this statement.
24
Columbia Intermediate Bond Fund
April 30, 2012
| Notes to Portfolio of Investments (continued) | |
(k) At April 30, 2012, investments in securities included securities valued at $11,697,724 that were partially pledged as collateral to cover initial margin deposits on open interest rate futures contracts.
(l) Interest Only (IO) security. The actual effective yield of this security is different than the stated coupon rate.
(m) Zero coupon bond.
(n) Senior loans have rates of interest that float periodically based primarily on the London Interbank Offered Rate ("LIBOR") and other short-term rates. The interest rate shown reflects the weighted average coupon as of April 30, 2012. The interest rate shown for senior loans purchased on a when-issued or delayed delivery basis, if any, reflects an estimated average coupon. Remaining maturities of senior loans may be less than the stated maturities shown as a result of contractual or optional prepayments by the borrower. Such prepayments cannot be predicted with certainty.
(o) Non-income producing.
(p) The rate shown is the seven-day current annualized yield at April 30, 2012.
(q) Investments in affiliates during the period ended April 30, 2012:
| Issuer | | Beginning
Cost | | Purchase
Cost | | Sales Cost/
Proceeds
from Sales | | Realized
Gain/Loss | | Ending
Cost | | Dividends
or Interest
Income | | Value | |
Columbia Short-Term
Cash Fund | | $ | 127,703,492 | | | $ | 58,962,286 | | | $ | (164,514,463 | ) | | $ | — | | | $ | 22,151,315 | | | $ | 7,932 | | | $ | 22,151,315 | | |
Investments in affiliates during the year ended March 31, 2012:
| Issuer | | Beginning
Cost | | Purchase
Cost | | Sales Cost/
Proceeds
from Sales | | Realized
Gain/Loss | | Ending
Cost | | Dividends
or Interest
Income | | Value | |
Columbia Short-Term
Cash Fund | | $ | — | | | $ | 899,429,705 | | | $ | (771,726,213 | ) | | $ | — | | | $ | 127,703,492 | | | $ | 42,661 | | | $ | 127,703,492 | | |
(r) The table below represents securities received as collateral for repurchase agreements. This collateral is deposited with the Fund's custodian and, pursuant to the terms of the repurchase agreement, must have an aggregate market value greater than or equal to the repurchase price plus accrued interest at all times. The value of securities and/or cash held as collateral for repurchase agreements is monitored on a daily basis to ensure the proper level of collateral.
Citigroup Global Markets, Inc. (0.210%)
| Security Description | | Value | |
| Fannie Mae REMICS | | $ | 1,099,574 | | |
| Fannie Mae-Aces | | | 206,693 | | |
| Freddie Mac REMICS | | | 1,077,211 | | |
| Government National Mortgage Association | | | 676,522 | | |
| Total Market Value of Collateral Securities | | $ | 3,060,000 | | |
Citigroup Global Markets, Inc. (0.210%)
| Security Description | | Value | |
| Fannie Mae REMICS | | $ | 4,764,822 | | |
| Fannie Mae-Aces | | | 895,667 | | |
| Freddie Mac REMICS | | | 4,667,916 | | |
| Government National Mortgage Association | | | 2,931,595 | | |
| Total Market Value of Collateral Securities | | $ | 13,260,000 | | |
Mizuho Securities USA, Inc. (0.240%)
| Security Description | | Value | |
| Fannie Mae REMICS | | $ | 3,744,762 | | |
| Freddie Mac REMICS | | | 3,803,238 | | |
| Total Market Value of Collateral Securities | | $ | 7,548,000 | | |
The Accompanying Notes to Financial Statements are an integral part of this statement.
25
Columbia Intermediate Bond Fund
April 30, 2012
| Notes to Portfolio of Investments (continued) | |
Natixis Financial Products, Inc. (0.240%)
| Security Description | | Value | |
| Fannie Mae Pool | | $ | 176,700 | | |
| Fannie Mae REMICS | | | 1,311,602 | | |
| Fannie Mae Whole Loan | | | 41,206 | | |
| Freddie Mac Gold Pool | | | 370,107 | | |
| Freddie Mac Non Gold Pool | | | 95,748 | | |
| Freddie Mac REMICS | | | 1,145,633 | | |
| Government National Mortgage Association | | | 816,532 | | |
| United States Treasury Note/Bond | | | 1,142,506 | | |
| Total Market Value of Collateral Securities | | $ | 5,100,034 | | |
Nomura Securities (0.240%)
| Security Description | | Value | |
| Fannie Mae Pool | | $ | 1,020,291 | | |
| Freddie Mac Gold Pool | | | 1,171,975 | | |
| Ginnie Mae IIPool | | | 2,907,734 | | |
| Total Market Value of Collateral Securities | | $ | 5,100,000 | | |
Societe Generale (0.210%)
| Security Description | | Value | |
| Fannie Mae Pool | | $ | 5,582,266 | | |
| Freddie Mac Gold Pool | | | 2,610,442 | | |
| Total Market Value of Collateral Securities | | $ | 8,192,708 | | |
| Abbreviation Legend | |
AGM Assured Guaranty Municipal Corporation
CMO Collateralized Mortgage Obligation
NPFGC National Public Finance Guarantee Corporation
PIK Payment-in-Kind
STRIPS Separate Trading of Registered Interest and Principal Securities
BRL Brazilian Real
COP Colombian Peso
IDR Indonesian Rupiah
MXN Mexican Peso
PEN Peru Nuevos Soles
UYU Uruguay Pesos
Generally accepted accounting principles (GAAP) require disclosure regarding the inputs and valuation techniques used to measure fair value and any changes in valuation inputs or techniques. In addition, investments shall be disclosed by major category.
The Fund categorizes its fair value measurements according to a three-level hierarchy that maximizes the use of observable inputs and minimizes the use of unobservable inputs by prioritizing that the most observable input be used when available. Observable inputs are those that market participants would use in pricing an investment based on market data obtained from sources independent of the reporting entity. Unobservable inputs are those that reflect the Fund's assumptions about the information market participants would use in pricing an investment. An investment's level within the fair value hierarchy is based on the lowest level of any input that is deemed significant to the asset or liability's fair value measurement. The input levels are not necessarily an indication of the risk or liquidity associated with investments at that level. For example, certain U.S. government securities are generally high quality and liquid, however, they are reflected as Level 2 because the inputs used to determine fair value may not always be quoted prices in an active market.
The Accompanying Notes to Financial Statements are an integral part of this statement.
26
Columbia Intermediate Bond Fund
April 30, 2012
| Fair Value Measurements (continued) | |
Fair value inputs are summarized in the three broad levels listed below:
• Level 1 — Valuations based on quoted prices for investments in active markets that the Fund has the ability to access at the measurement date (including NAV for open-end mutual funds). Valuation adjustments are not applied to Level 1 investments.
• Level 2 — Valuations based on other significant observable inputs (including quoted prices for similar securities, interest rates, prepayment speeds, credit risks, etc.).
• Level 3 — Valuations based on significant unobservable inputs (including the Fund's own assumptions and judgment in determining the fair value of investments).
Inputs that are used in determining fair value of an investment may include price information, credit data, volatility statistics, and other factors. These inputs can be either observable or unobservable. The availability of observable inputs can vary between investments, and is affected by various factors such as the type of investment, and the volume and level of activity for that investment or similar investments in the marketplace. The inputs will be considered by the Investment Manager, along with any other relevant factors in the calculation of an investment's fair value. The Fund uses prices and inputs that are current as of the measurement date, which may include periods of market dislocations. During these periods, the availability of prices and inputs may be reduced for many investments. This condition could cause an investment to be reclassified between the various levels within the hierarchy.
Investments falling into the Level 3 category are primarily supported by quoted prices from brokers and dealers participating in the market for those investments. However, these may be classified as Level 3 investments due to lack of market transparency and corroboration to support these quoted prices. Additionally, valuation models may be used as the pricing source for any remaining investments classified as Level 3. These models rely on one or more significant unobservable inputs and/or significant assumptions by the Investment Manager. Inputs used in valuations may include, but are not limited to, financial statement analysis, capital account balances, discount rates and estimated cash flows, and comparable company data.
Under the direction of the Fund's Board of Trustees (the Board), the Investment Manager's Valuation Committee (the Committee) is responsible for carrying out the valuation procedures approved by the Board. The Committee consists of voting and non-voting members from various groups within the Investment Manager's organization, including operations and accounting, trading and investments, compliance, risk management and legal.
The Committee meets at least monthly to review and approve valuation matters, which may include a description of specific valuation determinations, data regarding pricing information received from approved pricing vendors and brokers and the results of Board-approved valuation control policies and procedures (the Policies). The Policies address, among other things, instances when market quotations are readily available, including recommendation of third party pricing vendors and a determination of appropriate pricing methodologies; events that require specific valuation determinations and assessment of fair value techniques; securities with a potential for stale pricing, including those that are illiquid, restricted, or in default; and the effectiveness of third-party pricing vendors, including periodic reviews of vendors. The Committee meets more frequently, as needed, to discuss additional valuation matters, which may include the need to review back-testing results, review time-sensitive information or approve related valuation actions. The Committee reports to the Board, with members of the Committee meeting with the Board at each of its regularly scheduled meetings to discuss valuation matters and actions during the period, similar to those described earlier.
For investments categorized as Level 3, the Committee monitors information similar to that described above, which may include: (i) data specific to the issuer or comparable issuers, (ii) general market or specific sector news and (iii) quoted prices and specific or similar security transactions. The Committee considers this data and any changes from prior periods in order to assess the reasonableness of observable and unobservable inputs, any assumptions or internal models used to value those securities and changes in fair value. This data is also used to corroborate, when available, information received from approved pricing vendors and brokers. Various factors impact the frequency of monitoring this information (which may occur as often as daily). However, the Committee may determine that changes to inputs, assumptions and models are not required as a result of the monitoring procedures performed.
The Accompanying Notes to Financial Statements are an integral part of this statement.
27
Columbia Intermediate Bond Fund
April 30, 2012
| Fair Value Measurements (continued) | |
The following table is a summary of the inputs used to value the Fund's investments as of April 30, 2012:
| | | Fair Value at April 30, 2012 | |
| Description | | Level 1
Quoted Prices
in Active
Markets For
Identical Assets | | Level 2
Other
Significant
Observable
Inputs | | Level 3
Significant
Unobservable
Inputs | | Total | |
| Bonds | |
| Corporate Bonds & Notes | |
| Banking | | $ | — | | | $ | 274,771,257 | | | $ | 41,069 | | | $ | 274,812,326 | | |
| Electric | | | — | | | | 106,298,608 | | | | 50,043 | | | | 106,348,651 | | |
| All Other Industries | | | — | | | | 952,599,427 | | | | — | | | | 952,599,427 | | |
| Residential Mortgage-Backed Securities — Agency | | | — | | | | 531,857,060 | | | | — | | | | 531,857,060 | | |
| Residential Mortgage-Backed Securities — Non-Agency | | | — | | | | 28,980,076 | | | | 6,271,826 | | | | 35,251,902 | | |
| Commercial Mortgage-Backed Securities — Non-Agency | | | — | | | | 445,870,690 | | | | — | | | | 445,870,690 | | |
| Asset-Backed Securities — Agency | | | — | | | | 9,800,629 | | | | — | | | | 9,800,629 | | |
| Asset-Backed Securities — Non-Agency | | | — | | | | 50,682,814 | | | | — | | | | 50,682,814 | | |
| Inflation-Indexed Bonds | | | — | | | | 1,605,472 | | | | — | | | | 1,605,472 | | |
| U.S. Treasury Obligations | | | 469,039,193 | | | | 234,329,969 | | | | — | | | | 703,369,162 | | |
| Foreign Government Obligations | | | — | | | | 35,977,229 | | | | 283,077 | | | | 36,260,306 | | |
| Preferred Debt | | | 65,197,796 | | | | 4,886,980 | | | | — | | | | 70,084,776 | | |
| Municipal Bonds | | | — | | | | 41,508,497 | | | | — | | | | 41,508,497 | | |
| Total Bonds | | | 534,236,989 | | | | 2,719,168,708 | | | | 6,646,015 | | | | 3,260,051,712 | | |
| Equity Securities | |
| Common Stocks | |
| Financials | | | 31,430 | | | | — | | | | — | | | | 31,430 | | |
| Industrials | | | 32,727 | | | | — | | | | — | | | | 32,727 | | |
| Warrants | |
| Energy | | | — | | | | 38,674 | | | | — | | | | 38,674 | | |
| Information Technology | | | — | | | | — | | | | 174 | | | | 174 | | |
| Total Equity Securities | | | 64,157 | | | | 38,674 | | | | 174 | | | | 103,005 | | |
| Short-Term Securities | |
| Treasury Note Short-Term | | | 38,749,320 | | | | — | | | | — | | | | 38,749,320 | | |
| Total Short-Term Securities | | | 38,749,320 | | | | — | | | | — | | | | 38,749,320 | | |
| Other | |
| Senior Loans | | | — | | | | 3,452,148 | | | | — | | | | 3,452,148 | | |
| Money Market Funds | | | 22,151,315 | | | | — | | | | — | | | | 22,151,315 | | |
| Investments of Cash Collateral Received for Securities on Loan | | | — | | | | 174,638,569 | | | | — | | | | 174,638,569 | | |
| Total Other | | | 22,151,315 | | | | 178,090,717 | | | | — | | | | 200,242,032 | | |
| Investments in Securities | | | 595,201,781 | | | | 2,897,298,099 | | | | 6,646,189 | | | | 3,499,146,069 | | |
| Derivatives | |
| Assets | |
| Futures Contracts | | | 183,343 | | | | — | | | | — | | | | 183,343 | | |
| Swap Contracts | | | — | | | | 130,200 | | | | — | | | | 130,200 | | |
| Liabilities | |
| Futures Contracts | | | (4,282,254 | ) | | | — | | | | — | | | | (4,282,254 | ) | |
| Swap Contracts | | | — | | | | (4,026,078 | ) | | | — | | | | (4,026,078 | ) | |
| Total | | $ | 591,102,870 | | | $ | 2,893,402,221 | | | $ | 6,646,189 | | | $ | 3,491,151,280 | | |
See the Portfolio of Investments for all investment classifications not indicated in the table.
The Fund's assets assigned to the Level 2 input category are generally valued using the market approach, in which a security's value is determined through reference to prices and information from market transactions for similar or identical assets.
There were no transfers of financial assets between Levels 1 and 2 during the period from April 1, 2012 to April 30, 2012.
Derivative instruments are valued at unrealized appreciation (depreciation).
The Accompanying Notes to Financial Statements are an integral part of this statement.
28
Columbia Intermediate Bond Fund
April 30, 2012
| Fair Value Measurements (continued) | |
The following table is a reconciliation of Level 3 assets for which significant observable and/or unobservable inputs were used to determine fair value.
| | | Corporate
Bonds &
Notes | | Residential
Mortgage-Backed
Securities —
Non-Agency | | Foreign
Government
Obligations | | Preferred
Debt | | Warrants | | Total | |
| Balance as of March 31, 2011 | | $ | 6,855,342 | | | $ | 4,240 | | | $ | — | | | $ | 152 | | | $ | 174 | | | $ | 6,859,908 | | |
| Accrued discounts/premiums | | | 107 | | | | (69 | ) | | | 2,572 | | | | — | | | | — | | | | 2,610 | | |
| Realized gain (loss) | | | 32,563 | | | | 231 | | | | — | | | | 151,898 | | | | — | | | | 184,692 | | |
| Change in unrealized appreciation (depreciation)* | | | (71,892 | ) | | | 85,426 | | | | 6,274 | | | | — | | | | — | | | | 19,808 | | |
| Sales | | | (1,943,826 | ) | | | (300,721 | ) | | | — | | | | (152,050 | ) | | | — | | | | (2,396,597 | ) | |
| Purchases | | | 174,303 | | | | 6,482,719 | | | | 274,231 | | | | — | | | | — | | | | 6,931,253 | | |
| Transfers into Level 3 | | | 34,224 | | | | — | | | | — | | | | — | | | | — | | | | 34,224 | | |
| Transfers out of Level 3 | | | (4,989,709 | ) | | | — | | | | — | | | | — | | | | — | | | | (4,989,709 | ) | |
| Balance as of April 30, 2012 | | $ | 91,112 | | | $ | 6,271,826 | | | $ | 283,077 | | | $ | — | | | $ | 174 | | | $ | 6,646,189 | | |
* Change in unrealized appreciation (depreciation) relating to securities held at April 30, 2012 was $98,246, which is comprised of Corporate Bonds & Notes of $6,546, Residential Mortgage-Backed Securities — Non-Agency of $85,426, and Foreign Government Obligations of $6,274.
The Fund does not hold any significant investments with unobservable inputs which are categorized as Level 3.
The Fund's assets assigned to the Level 3 category are valued utilizing the valuation technique deemed the most appropriate in the circumstances. Certain Corporate Bonds, Residential Backed Mortgages, Foreign Government Obligations and Warrants classified as Level 3 are valued using a market approach. To determine fair value for these securities, management considered various factors which may have included, but were not limited to, utilization of single market quotations from broker dealers, estimated cash flows, and market multiples derived from a set a of comparable companies.
Financial assets were transferred from Level 3 to Level 2 as observable market inputs were utilized and management's determination that there was sufficient, reliable and observable market data to value these assets as of period end.
Financial Assets were transferred from Level 2 to Level 3 due to utilizing a single market quotation from a broker dealer. As a result, as of period end, management determined to fair value the security under consistently applied procedures established by and under the general supervision of the Board of Trustees
Transfers in and/or out of Level 3 are determined based on the fair value at the beginning of the period for security positions held throughout the period.
The Accompanying Notes to Financial Statements are an integral part of this statement.
29
Columbia Intermediate Bond Fund
April 30, 2012
| Fair Value Measurements (continued) | |
The following table is a summary of the inputs used to value the Fund's investments as of March 31, 2012:
| | | Fair Value at March 31, 2012 | |
| Description | | Level 1
Quoted Prices
in Active
Markets For
Identical Assets | | Level 2
Other
Significant
Observable
Inputs | | Level 3
Significant
Unobservable
Inputs | | Total | |
| Bonds | |
| Corporate Bonds & Notes | |
| Electric | | $ | — | | | $ | 107,787,442 | | | $ | 73,238 | | | $ | 107,860,680 | | |
| All Other Industries | | | — | | | | 1,388,082,283 | | | | — | | | | 1,388,082,283 | | |
| Residential Mortgage-Backed Securities — Agency | | | — | | | | 537,109,903 | | | | — | | | | 537,109,903 | | |
| Residential Mortgage-Backed Securities — Non-Agency | | | — | | | | 30,427,279 | | | | 3,169,095 | | | | 33,596,374 | | |
| Commercial Mortgage-Backed Securities — Non-Agency | | | — | | | | 448,789,414 | | | | — | | | | 448,789,414 | | |
| Asset-Backed Securities — Agency | | | — | | | | 9,747,002 | | | | — | | | | 9,747,002 | | |
| Asset-Backed Securities — Non-Agency | | | — | | | | 53,669,511 | | | | — | | | | 53,669,511 | | |
| Inflation-Indexed Bonds | | | — | | | | 1,565,983 | | | | — | | | | 1,565,983 | | |
| U.S. Treasury Obligations | | | 247,022,844 | | | | 227,322,021 | | | | — | | | | 474,344,865 | | |
| Foreign Government Obligations | | | — | | | | 35,336,105 | | | | 283,077 | | | | 35,619,182 | | |
| Preferred Debt | | | 50,043,718 | | | | 2,730,760 | | | | — | | | | 52,774,478 | | |
| Municipal Bonds | | | — | | | | 40,706,985 | | | | — | | | | 40,706,985 | | |
| Total Bonds | | | 297,066,562 | | | | 2,883,274,688 | | | | 3,525,410 | | | | 3,183,866,660 | | |
| Equity Securities | |
| Common Stocks | |
| Financials | | | 47,752 | | | | — | | | | — | | | | 47,752 | | |
| Industrials | | | 32,099 | | | | — | | | | — | | | | 32,099 | | |
| Warrants | |
| Energy | | | — | | | | 41,844 | | | | — | | | | 41,844 | | |
| Information Technology | | | — | | | | — | | | | 174 | | | | 174 | | |
| Total Equity Securities | | | 79,851 | | | | 41,844 | | | | 174 | | | | 121,869 | | |
| Short-Term Securities | |
| Treasury Note Short-Term | | | 38,747,212 | | | | — | | | | — | | | | 38,747,212 | | |
| Total Short-Term Securities | | | 38,747,212 | | | | — | | | | — | | | | 38,747,212 | | |
| Other | |
| Senior Loans | | | — | | | | 3,427,410 | | | | — | | | | 3,427,410 | | |
| Money Market Funds | | | 127,703,492 | | | | — | | | | — | | | | 127,703,492 | | |
| Investments of Cash Collateral Received for Securities on Loan | | | — | | | | 161,684,695 | | | | — | | | | 161,684,695 | | |
| Total Other | | | 127,703,492 | | | | 165,112,105 | | | | — | | | | 292,815,597 | | |
| Investments in Securities | | | 463,597,117 | | | | 3,048,428,637 | | | | 3,525,584 | | | | 3,515,551,338 | | |
| Derivatives | |
| Assets | |
| Futures Contracts | | | 5,769,315 | | | | — | | | | — | | | | 5,769,315 | | |
| Swap Contracts | | | — | | | | 87,188 | | | | — | | | | 87,188 | | |
| Liabilities | |
| Futures Contracts | | | (92,157 | ) | | | — | | | | — | | | | (92,157 | ) | |
| Swap Contracts | | | — | | | | (4,047,835 | ) | | | — | | | | (4,047,835 | ) | |
| Total | | $ | 469,274,275 | | | $ | 3,044,467,990 | | | $ | 3,525,584 | | | $ | 3,517,267,849 | | |
The Fund's assets assigned to the Level 2 input category are generally valued using the market approach, in which a security's value is determined through reference to prices and information from market transactions for similar or identical assets.
There were no transfers of financial assets between Levels 1 and 2 during the period from April 1, 2011 to March 31, 2012.
Derivative instruments are valued at unrealized appreciation (depreciation).
The Fund's assets assigned to the Level 3 category are valued utilizing the valuation technique deemed the most appropriate in the circumstances. Certain Corporate Bonds, Residential Backed Mortgages, Foreign Government Obligations and Warrants classified as Level 3 are valued using a market approach. To determine fair value for these securities, management considered various factors which may have included, but were not limited to, utilization of single market quotations from broker dealers, estimated cash flows, and market multiples derived from a set a of comparable companies.
The Accompanying Notes to Financial Statements are an integral part of this statement.
30
Statement of Assets and Liabilities – Columbia Intermediate Bond Fund
| | | April 30,
2012 | | March 31,
2012 | |
| Assets | |
| Investments, at value* | |
| Unaffiliated issuers (identified cost $3,189,940,506 and $3,138,788,525) | | $ | 3,302,356,185 | | | $ | 3,226,163,151 | | |
| Affiliated issuers (identified cost $22,151,315 and $127,703,492) | | | 22,151,315 | | | | 127,703,492 | | |
| Investment of cash collateral received for securities on loan | |
| Short-term securities (identified cost $133,206,503 and $118,939,950) | | | 133,206,503 | | | | 118,939,950 | | |
| Repurchase agreements (identified cost $41,432,066 and $42,744,745) | | | 41,432,066 | | | | 42,744,745 | | |
| Total investments (identified cost $3,386,730,390 and $3,428,176,712) | | | 3,499,146,069 | | | | 3,515,551,338 | | |
| Foreign currency (identified cost $25,539 and $—) | | | 25,274 | | | | — | | |
| Unrealized appreciation on swap contracts | | | 130,200 | | | | 87,188 | | |
| Premiums paid on outstanding swap contracts | | | 7,129,139 | | | | 7,257,688 | | |
| Receivable for: | |
| Investments sold | | | 157,629,724 | | | | 23,570,083 | | |
| Capital shares sold | | | 10,159,957 | | | | 12,689,986 | | |
| Dividends | | | 7,437 | | | | 267,552 | | |
| Interest | | | 28,296,331 | | | | 26,870,159 | | |
| Reclaims | | | 36,289 | | | | 18,009 | | |
| Variation margin on futures contracts | | | — | | | | 1,967,692 | | |
| Expense reimbursement due from Investment Manager | | | 42,388 | | | | 13,363 | | |
| Prepaid expense | | | 5,247 | | | | 10,495 | | |
| Trustees' deferred compensation plan | | | 126,034 | | | | 126,034 | | |
| Other assets | | | 589,417 | | | | 1,080,598 | | |
| Total assets | | | 3,703,323,506 | | | | 3,589,510,185 | | |
| Liabilities | |
| Disbursements in excess of cash | | | 114,560 | | | | 131,007 | | |
| Due upon return of securities on loan | | | 174,638,569 | | | | 161,684,695 | | |
| Unrealized depreciation on swap contracts | | | 4,026,078 | | | | 4,047,835 | | |
| Premiums received on outstanding swap contracts | | | 378,309 | | | | 385,191 | | |
| Payable for: | |
| Investments purchased | | | 63,305,213 | | | | 19,640,686 | | |
| Investments purchased on a delayed delivery basis | | | 77,999,684 | | | | 60,726,363 | | |
| Capital shares purchased | | | 3,278,584 | | | | 5,622,643 | | |
| Dividend distributions to shareholders | | | 9,522,829 | | | | 13,101,916 | | |
| Variation margin on futures contracts | | | 296,247 | | | | — | | |
| Foreign capital gains taxes deferred | | | 3,238 | | | | 4,415 | | |
| Investment management fees | | | 114,419 | | | | 37,682 | | |
| Distribution and service fees | | | 10,260 | | | | 3,335 | | |
| Transfer agent fees | | | 536,845 | | | | 463,394 | | |
| Administration fees | | | 16,864 | | | | 5,564 | | |
| Compensation of board members | | | 41,970 | | | | 50,371 | | |
| Chief compliance officer expenses | | | 194 | | | | 470 | | |
| Other expenses | | | 134,079 | | | | 117,849 | | |
| Trustees' deferred compensation plan | | | 126,034 | | | | 126,034 | | |
| Total liabilities | | | 334,543,976 | | | | 266,149,450 | | |
| Net assets applicable to outstanding capital stock | | $ | 3,368,779,530 | | | $ | 3,323,360,735 | | |
The Accompanying Notes to Financial Statements are an integral part of this statement.
31
Statement of Assets and Liabilities (continued) – Columbia Intermediate Bond Fund
| | | April 30,
2012 | | March 31,
2012 | |
| Represented by | |
| Paid-in capital | | $ | 3,285,144,107 | | | $ | 3,261,731,410 | | |
| Excess of distributions over net investment income | | | (1,865,104 | ) | | | (2,697,029 | ) | |
| Accumulated net realized loss | | | (17,321,907 | ) | | | (23,657,868 | ) | |
| Unrealized appreciation (depreciation) on: | |
| Investments | | | 112,415,679 | | | | 87,374,626 | | |
| Foreign currency translations | | | (1,608 | ) | | | (71 | ) | |
| Futures contracts | | | (4,098,911 | ) | | | 5,677,158 | | |
| Swap contracts | | | (5,489,488 | ) | | | (5,063,076 | ) | |
| Foreign capital gains tax | | | (3,238 | ) | | | (4,415 | ) | |
| Total — representing net assets applicable to outstanding capital stock | | $ | 3,368,779,530 | | | $ | 3,323,360,735 | | |
| *Value of securities on loan | | $ | 306,074,383 | | | $ | 323,112,071 | | |
| Net assets applicable to outstanding shares | |
| Class A | | $ | 352,338,421 | | | $ | 338,577,763 | | |
| Class B | | $ | 6,080,849 | | | $ | 6,253,450 | | |
| Class C | | $ | 35,579,256 | | | $ | 35,304,397 | | |
| Class I | | $ | 90,344,969 | | | $ | 86,767,584 | | |
| Class R | | $ | 2,630,773 | | | $ | 2,786,189 | | |
| Class W | | $ | 2,574 | | | $ | 2,557 | | |
| Class Z | | $ | 2,881,802,688 | | | $ | 2,853,668,795 | | |
| Shares outstanding | |
| Class A | | | 37,528,286 | | | | 36,296,918 | | |
| Class B | | | 647,735 | | | | 670,443 | | |
| Class C | | | 3,790,026 | | | | 3,785,108 | | |
| Class I | | | 9,616,322 | | | | 9,295,599 | | |
| Class R | | | 280,217 | | | | 298,689 | | |
| Class W | | | 274 | | | | 274 | | |
| Class Z | | | 306,946,044 | | | | 305,925,199 | | |
| Net asset value per share | |
| Class A(a) | | $ | 9.39 | | | $ | 9.33 | | |
| Class B | | $ | 9.39 | | | $ | 9.33 | | |
| Class C | | $ | 9.39 | | | $ | 9.33 | | |
| Class I | | $ | 9.39 | | | $ | 9.33 | | |
| Class R | | $ | 9.39 | | | $ | 9.33 | | |
| Class W | | $ | 9.39 | | | $ | 9.33 | | |
| Class Z | | $ | 9.39 | | | $ | 9.33 | | |
(a) For the year ended April 30, 2012 and March 31, 2012, the maximum offering price per share for Class A is $9.71 and $9.64, respectively. The offering price is calculated by dividing the net asset value by 1.0 minus the maximum sales charge of 3.25%.
The Accompanying Notes to Financial Statements are an integral part of this statement.
32
Statement of Operations – Columbia Intermediate Bond Fund
| Year ended | | April 30,
2012(a) | | March 31,
2012 | |
| Net investment income | |
| Income: | | | | | |
| Dividends | | $ | 567,752 | | | $ | 2,567,258 | | |
| Interest | | | 11,244,108 | | | | 136,729,211 | | |
| Dividends from affiliates | | | 7,932 | | | | 42,661 | | |
| Income from securities lending — net | | | 65,982 | | | | 267,461 | | |
| Foreign taxes withheld | | | (10,682 | ) | | | (18,402 | ) | |
| Total income | | | 11,875,092 | | | | 139,588,189 | | |
| Expenses: | |
| Investment management fees | | | 1,175,998 | | | | 12,982,420 | | |
| Distribution fees | |
| Class B | | | 3,921 | | | | 70,947 | | |
| Class C | | | 22,503 | | | | 254,567 | | |
| Class R | | | 1,161 | | | | 13,608 | | |
| Service fees | |
| Class A | | | 72,873 | | | | 576,155 | | |
| Class B | | | 1,307 | | | | 23,649 | | |
| Class C | | | 7,501 | | | | 84,880 | | |
| Class W | | | 1 | | | | 7 | | |
| Transfer agent fees | |
| Class A | | | 56,989 | | | | 447,868 | | |
| Class B | | | 1,018 | | | | 19,723 | | |
| Class C | | | 5,854 | | | | 64,601 | | |
| Class R | | | 452 | | | | 5,163 | | |
| Class W | | | 1 | | | | 6 | | |
| Class Z | | | 474,374 | | | | 5,352,182 | | |
| Administration fees | | | 173,468 | | | | 1,928,439 | | |
| Compensation of board members | | | 6,433 | | | | 83,317 | | |
| Pricing and bookkeeping fees | | | — | | | | 44,820 | | |
| Custodian fees | | | 3,574 | | | | 108,344 | | |
| Printing and postage fees | | | 60,000 | | | | 140,346 | | |
| Registration fees | | | 9,109 | | | | 225,488 | | |
| Professional fees | | | 21,175 | | | | 122,329 | | |
| Line of credit interest expense | | | — | | | | 2,414 | | |
| Chief compliance officer expenses | | | 138 | | | | 1,794 | | |
| Other | | | 7,840 | | | | 107,637 | | |
| Total expenses | | | 2,105,690 | | | | 22,660,704 | | |
| Fees waived or expenses reimbursed by Investment Manager and its affiliates | | | (325,497 | ) | | | (3,258,873 | ) | |
| Fees waived by Distributor — Class C | | | (4,501 | ) | | | (50,856 | ) | |
| Expense reductions | | | — | | | | (4,157 | ) | |
| Total net expenses | | | 1,775,692 | | | | 19,346,818 | | |
| Net investment income | | | 10,099,400 | | | | 120,241,371 | | |
| Realized and unrealized gain (loss) — net | |
| Net realized gain (loss) on: | |
| Investments | | | 6,327,560 | | | | 105,675,977 | | |
| Foreign currency translations | | | (1,029 | ) | | | 8,484 | | |
| Forward foreign currency exchange contracts | | | — | | | | (1,988 | ) | |
| Futures contracts | | | 97,992 | | | | (79,489,991 | ) | |
| Swap contracts | | | (118,027 | ) | | | (3,431,697 | ) | |
| Net realized gain | | | 6,306,496 | | | | 22,760,785 | | |
| Net change in unrealized appreciation (depreciation) on: | |
| Investments | | | 25,041,053 | | | | 69,435,610 | | |
| Foreign currency translations | | | (1,537 | ) | | | (71 | ) | |
| Futures contracts | | | (9,776,069 | ) | | | 5,255,261 | | |
| Swap contracts | | | (426,412 | ) | | | (3,880,419 | ) | |
| Foreign capital gains tax | | | 1,177 | | | | (4,415 | ) | |
| Net change in unrealized appreciation | | | 14,838,212 | | | | 70,805,966 | | |
| Net realized and unrealized gain | | | 21,144,708 | | | | 93,566,751 | | |
| Net increase in net assets resulting from operations | | $ | 31,244,108 | | | $ | 213,808,122 | | |
(a) For the period from April 1, 2012 to April 30, 2012. During the period, the Fund's fiscal year end was changed from March 31 to April 30.
The Accompanying Notes to Financial Statements are an integral part of this statement.
33
Statement of Changes in Net Assets – Columbia Intermediate Bond Fund
| Year ended | | April 30,
2012(a) | | March 31,
2012 | | March 31,
2011(b) | |
| Operations | |
| Net investment income | | $ | 10,099,400 | | | $ | 120,241,371 | | | $ | 95,116,068 | | |
| Net realized gain | | | 6,306,496 | | | | 22,760,785 | | | | 48,078,959 | | |
| Net change in unrealized appreciation (depreciation) | | | 14,838,212 | | | | 70,805,966 | | | | (14,812,893 | ) | |
| Net increase in net assets resulting from operations | | | 31,244,108 | | | | 213,808,122 | | | | 128,382,134 | | |
| Distributions to shareholders from: | |
| Net investment income | |
| Class A | | | (918,541 | ) | | | (9,096,046 | ) | | | (7,214,879 | ) | |
| Class B | | | (12,646 | ) | | | (290,180 | ) | | | (739,759 | ) | |
| Class C | | | (77,181 | ) | | | (1,125,826 | ) | | | (1,154,247 | ) | |
| Class I | | | (257,638 | ) | | | (1,525,461 | ) | | | (372,845 | ) | |
| Class R | | | (6,719 | ) | | | (99,259 | ) | | | (83,519 | ) | |
| Class W | | | (7 | ) | | | (99 | ) | | | (53 | ) | |
| Class Z | | | (8,252,611 | ) | | | (116,584,201 | ) | | | (89,900,842 | ) | |
| Total distributions to shareholders | | | (9,525,343 | ) | | | (128,721,072 | ) | | | (99,466,144 | ) | |
| Increase in net assets from share transactions | | | 23,700,030 | | | | 123,150,447 | | | | 885,941,150 | | |
| Proceeds from regulatory settlements (Note 6) | | | — | | | | 11,319 | | | | — | | |
| Total increase in net assets | | | 45,418,795 | | | | 208,248,816 | | | | 914,857,140 | | |
| Net assets at beginning of year | | | 3,323,360,735 | | | | 3,115,111,919 | | | | 2,200,254,779 | | |
| Net assets at end of year | | $ | 3,368,779,530 | | | $ | 3,323,360,735 | | | $ | 3,115,111,919 | | |
| Undistributed (excess of distributions over) net investment income | | $ | (1,865,104 | ) | | $ | (2,697,029 | ) | | $ | 5,971,277 | | |
(a) For the period from April 1, 2012 to April 30, 2012. During the period, the Fund's fiscal year end was changed from March 31 to April 30.
(b) Class I and Class W shares are for the period from September 27, 2010 (commencement of operations) to March 31, 2011.
The Accompanying Notes to Financial Statements are an integral part of this statement.
34
Statement of Changes in Net Assets (continued) – Columbia Intermediate Bond Fund
| Year ended | | April 30, 2012(a) | | March 31, 2012 | | March 31, 2011(b) | |
| | | Shares | | Dollars ($) | | Shares | | Dollars ($) | | Shares | | Dollars ($) | |
| Capital stock activity | |
| Class A shares | |
| Subscriptions(c) | | | 1,745,137 | | | | 16,326,801 | | | | 23,121,302 | | | | 214,666,053 | | | | 8,124,359 | | | | 73,677,940 | | |
| Fund merger | | | — | | | | — | | | | — | | | | — | | | | 2,333,001 | | | | 21,232,776 | | |
| Distributions reinvested | | | 89,584 | | | | 841,192 | | | | 636,759 | | | | 5,897,075 | | | | 609,774 | | | | 5,545,462 | | |
| Redemptions | | | (603,353 | ) | | | (5,647,055 | ) | | | (9,663,911 | ) | | | (89,155,382 | ) | | | (7,117,402 | ) | | | (64,633,788 | ) | |
| Net increase | | | 1,231,368 | | | | 11,520,938 | | | | 14,094,150 | | | | 131,407,746 | | | | 3,949,732 | | | | 35,822,390 | | |
| Class B shares | |
| Subscriptions | | | 1,768 | | | | 16,590 | | | | 98,337 | | | | 907,266 | | | | 140,312 | | | | 1,277,407 | | |
| Fund merger | | | — | | | | — | | | | — | | | | — | | | | 241,230 | | | | 2,196,216 | | |
| Distributions reinvested | | | 640 | | | | 6,010 | | | | 15,333 | | | | 141,554 | | | | 52,208 | | | | 474,114 | | |
| Redemptions(c) | | | (25,116 | ) | | | (235,080 | ) | | | (1,071,713 | ) | | | (9,869,020 | ) | | | (2,322,802 | ) | | | (21,037,558 | ) | |
| Net decrease | | | (22,708 | ) | | | (212,480 | ) | | | (958,043 | ) | | | (8,820,200 | ) | | | (1,889,052 | ) | | | (17,089,821 | ) | |
| Class C shares | |
| Subscriptions | | | 49,820 | | | | 465,861 | | | | 914,956 | | | | 8,454,939 | | | | 954,928 | | | | 8,668,767 | | |
| Fund merger | | | — | | | | — | | | | — | | | | — | | | | 356,235 | | | | 3,242,350 | | |
| Distributions reinvested | | | 5,605 | | | | 52,629 | | | | 78,454 | | | | 726,118 | | | | 78,335 | | | | 712,366 | | |
| Redemptions | | | (50,507 | ) | | | (472,645 | ) | | | (942,027 | ) | | | (8,687,693 | ) | | | (1,090,068 | ) | | | (9,890,301 | ) | |
| Net increase | | | 4,918 | | | | 45,845 | | | | 51,383 | | | | 493,364 | | | | 299,430 | | | | 2,733,182 | | |
| Class I shares | |
| Subscriptions | | | 1,165,598 | | | | 10,914,001 | | | | 10,154,533 | | | | 94,207,434 | | | | 3,357,119 | | | | 30,325,418 | | |
| Distributions reinvested | | | 27,431 | | | | 257,579 | | | | 164,759 | | | | 1,528,305 | | | | 41,047 | | | | 372,817 | | |
| Redemptions | | | (872,306 | ) | | | (8,173,506 | ) | | | (3,983,758 | ) | | | (36,745,418 | ) | | | (438,101 | ) | | | (3,986,516 | ) | |
| Net increase | | | 320,723 | | | | 2,998,074 | | | | 6,335,534 | | | | 58,990,321 | | | | 2,960,065 | | | | 26,711,719 | | |
| Class R shares | |
| Subscriptions | | | 8,710 | | | | 81,391 | | | | 78,685 | | | | 728,518 | | | | 226,396 | | | | 2,049,043 | | |
| Distributions reinvested | | | 616 | | | | 5,786 | | | | 9,352 | | | | 86,529 | | | | 7,427 | | | | 67,565 | | |
| Redemptions | | | (27,798 | ) | | | (260,208 | ) | | | (116,517 | ) | | | (1,072,472 | ) | | | (95,997 | ) | | | (871,883 | ) | |
| Net increase (decrease) | | | (18,472 | ) | | | (173,031 | ) | | | (28,480 | ) | | | (257,425 | ) | | | 137,826 | | | | 1,244,725 | | |
| Class W shares | |
| Subscriptions | | | — | | | | — | | | | — | | | | — | | | | 287 | | | | 2,650 | | |
| Distributions reinvested | | | — | | | | — | | | | — | | | | — | | | | 3 | | | | 27 | | |
| Redemptions | | | — | | | | — | | | | — | | | | — | | | | (16 | ) | | | (150 | ) | |
| Net increase | | | — | | | | — | | | | — | | | | — | | | | 274 | | | | 2,527 | | |
| Class Z shares | |
| Subscriptions | | | 4,027,193 | | | | 37,645,731 | | | | 49,598,701 | | | | 459,454,750 | | | | 43,106,433 | | | | 391,038,496 | | |
| Fund merger | | | — | | | | — | | | | — | | | | — | | | | 109,206,406 | | | | 993,835,287 | | |
| Distributions reinvested | | | 393,889 | | | | 3,698,618 | | | | 5,265,549 | | | | 48,720,712 | | | | 4,554,507 | | | | 41,422,559 | | |
| Redemptions | | | (3,400,237 | ) | | | (31,823,665 | ) | | | (61,321,400 | ) | | | (566,838,821 | ) | | | (64,976,377 | ) | | | (589,779,914 | ) | |
| Net increase (decrease) | | | 1,020,845 | | | | 9,520,684 | | | | (6,457,150 | ) | | | (58,663,359 | ) | | | 91,890,969 | | | | 836,516,428 | | |
| Total net increase | | | 2,536,674 | | | | 23,700,030 | | | | 13,037,394 | | | | 123,150,447 | | | | 97,349,244 | | | | 885,941,150 | | |
(a) For the period from April 1, 2012 to April 30, 2012. During the period, the Fund's fiscal year end was changed from March 31 to April 30.
(b) Class I and Class W shares are for the period from September 27, 2010 (commencement of operations) to March 31, 2011.
(c) Includes conversions of Class B shares to Class A shares, if any.
The Accompanying Notes to Financial Statements are an integral part of this statement.
35
Financial Highlights – Columbia Intermediate Bond Fund
The following tables are intended to help you understand the Fund's financial performance. Certain information reflects financial results for a single share of a class held for the periods shown. Per share net investment income (loss) amounts are calculated based on average shares outstanding during the period. Total returns assume reinvestment of all dividends and distributions. Total returns do not reflect payment of sales charges, if any, and are not annualized for periods of less than one year.
| | | Year ended
April 30, | | March 31, | |
| | | 2012(a) | | 2012 | | 2011 | | 2010 | | 2009 | | 2008 | |
| Class A | |
| Per share data | |
| Net asset value, beginning of period | | $ | 9.33 | | | $ | 9.08 | | | $ | 8.95 | | | $ | 7.72 | | | $ | 8.71 | | | $ | 8.84 | | |
| Income from investment operations: | |
| Net investment income | | | 0.03 | | | | 0.33 | | | | 0.36 | | | | 0.43 | | | | 0.43 | | | | 0.43 | | |
| Net realized and unrealized gain (loss) | | | 0.05 | | | | 0.28 | | | | 0.15 | | | | 1.26 | | | | (0.97 | ) | | | (0.13 | ) | |
| Total from investment operations | | | 0.08 | | | | 0.61 | | | | 0.51 | | | | 1.69 | | | | (0.54 | ) | | | 0.30 | | |
| Less distributions to shareholders from: | |
| Net investment income | | | (0.02 | ) | | | (0.36 | ) | | | (0.38 | ) | | | (0.46 | ) | | | (0.43 | ) | | | (0.43 | ) | |
| Net realized gains | | | — | | | | — | | | | — | | | | — | | | | (0.02 | ) | | | — | | |
| Total distributions to shareholders | | | (0.02 | ) | | | (0.36 | ) | | | (0.38 | ) | | | (0.46 | ) | | | (0.45 | ) | | | (0.43 | ) | |
| Proceeds from regulatory settlement | | | — | | | | 0.00 | (b) | | | — | | | | 0.00 | (b) | | | — | | | | — | | |
| Net asset value, end of period | | $ | 9.39 | | | $ | 9.33 | | | $ | 9.08 | | | $ | 8.95 | | | $ | 7.72 | | | $ | 8.71 | | |
| Total return | | | 0.91 | % | | | 6.82 | % | | | 5.80 | % | | | 22.31 | % | | | (6.34 | %) | | | 3.48 | % | |
| Ratios to average net assets(c) | |
Expenses prior to fees waived or expenses reimbursed
(including interest expense) | | | 0.96 | %(d) | | | 0.95 | %(e) | | | 0.97 | %(e) | | | 1.00 | %(e) | | | 0.99 | %(e) | | | 0.98 | % | |
Net expenses after fees waived or expenses reimbursed
(including interest expense)(f) | | | 0.84 | %(d) | | | 0.84 | %(e)(g) | | | 0.92 | %(e)(g) | | | 0.90 | %(e)(g) | | | 0.89 | %(e)(g) | | | 0.88 | %(g) | |
Expenses prior to fees waived or expenses reimbursed
(excluding interest expense) | | | 0.96 | %(d) | | | 0.95 | % | | | 0.97 | % | | | 1.00 | % | | | 0.99 | % | | | 0.98 | % | |
Net expenses after fees waived or expenses reimbursed
(excluding interest expense)(f) | | | 0.84 | %(d) | | | 0.84 | %(g) | | | 0.92 | %(g) | | | 0.90 | %(g) | | | 0.89 | %(g) | | | 0.88 | %(g) | |
| Net investment income | | | 3.35 | %(d) | | | 3.62 | %(g) | | | 4.02 | %(g) | | | 5.01 | %(g) | | | 5.33 | %(g) | | | 4.88 | %(g) | |
| Supplemental data | |
| Net assets, end of period (in thousands) | | $ | 352,338 | | | $ | 338,578 | | | $ | 201,506 | | | $ | 163,333 | | | $ | 153,435 | | | $ | 207,215 | | |
| Portfolio turnover | | | 10 | %(h) | | | 170 | %(h) | | | 177 | % | | | 160 | % | | | 137 | % | | | 266 | % | |
Notes to Financial Highlights
(a) For the period from April 1, 2012 to April 30, 2012. During the period, the Fund's fiscal year end was changed from March 31 to April 30.
(b) Rounds to less than $0.01.
(c) In addition to the fees and expenses which the Fund bears directly, the Fund indirectly bears a pro rata share of the fees and expenses of the acquired funds in which it invests. Such indirect expenses are not included in the reported expense ratios.
(d) Annualized.
(e) Includes interest expense which rounds to less than 0.01%.
(f) The Investment Manager and certain of its affiliates agreed to waive/reimburse certain fees and expenses, if applicable.
(g) The benefits derived from expense reductions had an impact of less than 0.01%.
(h) Includes mortgage dollar rolls. If mortgage dollar roll transactions were excluded, the portfolio turnover would have been 9% and 157% for the year ended April 30, 2012 and March 31, 2012, respectively.
The Accompanying Notes to Financial Statements are an integral part of this statement.
36
Financial Highlights (continued) – Columbia Intermediate Bond Fund
| | | Year ended
April 30, | | March 31, | |
| | | 2012(a) | | 2012 | | 2011 | | 2010 | | 2009 | | 2008 | |
| Class B | |
| Per share data | |
| Net asset value, beginning of period | | $ | 9.33 | | | $ | 9.08 | | | $ | 8.95 | | | $ | 7.72 | | | $ | 8.71 | | | $ | 8.84 | | |
| Income from investment operations: | |
| Net investment income | | | 0.02 | | | | 0.27 | | | | 0.30 | | | | 0.37 | | | | 0.37 | | | | 0.36 | | |
| Net realized and unrealized gain (loss) | | | 0.06 | | | | 0.27 | | | | 0.15 | | | | 1.26 | | | | (0.97 | ) | | | (0.12 | ) | |
| Total from investment operations | | | 0.08 | | | | 0.54 | | | | 0.45 | | | | 1.63 | | | | (0.60 | ) | | | 0.24 | | |
| Less distributions to shareholders from: | |
| Net investment income | | | (0.02 | ) | | | (0.29 | ) | | | (0.32 | ) | | | (0.40 | ) | | | (0.37 | ) | | | (0.37 | ) | |
| Net realized gains | | | — | | | | — | | | | — | | | | — | | | | (0.02 | ) | | | — | | |
| Total distributions to shareholders | | | (0.02 | ) | | | (0.29 | ) | | | (0.32 | ) | | | (0.40 | ) | | | (0.39 | ) | | | (0.37 | ) | |
| Proceeds from regulatory settlement | | | — | | | | 0.00 | (b) | | | — | | | | 0.00 | (b) | | | — | | | | — | | |
| Net asset value, end of period | | $ | 9.39 | | | $ | 9.33 | | | $ | 9.08 | | | $ | 8.95 | | | $ | 7.72 | | | $ | 8.71 | | |
| Total return | | | 0.85 | % | | | 6.01 | % | | | 5.03 | % | | | 21.41 | % | | | (7.04 | %) | | | 2.72 | % | |
| Ratios to average net assets(c) | |
Expenses prior to fees waived or expenses reimbursed
(including interest expense) | | | 1.71 | %(d) | | | 1.72 | %(e) | | | 1.68 | %(e) | | | 1.65 | %(e) | | | 1.64 | %(e) | | | 1.63 | % | |
Net expenses after fees waived or expenses reimbursed
(including interest expense)(f) | | | 1.59 | %(d) | | | 1.59 | %(e)(g) | | | 1.67 | %(e)(g) | | | 1.65 | %(e)(g) | | | 1.64 | %(e)(g) | | | 1.63 | %(g) | |
Expenses prior to fees waived or expenses reimbursed
(excluding interest expense) | | | 1.71 | %(d) | | | 1.72 | % | | | 1.68 | % | | | 1.65 | % | | | 1.64 | % | | | 1.63 | % | |
Net expenses after fees waived or expenses reimbursed
(excluding interest expense)(f) | | | 1.59 | %(d) | | | 1.59 | %(g) | | | 1.67 | %(g) | | | 1.65 | %(g) | | | 1.64 | %(g) | | | 1.63 | %(g) | |
| Net investment income | | | 2.59 | %(d) | | | 2.93 | %(g) | | | 3.32 | %(g) | | | 4.29 | %(g) | | | 4.59 | %(g) | | | 4.14 | %(g) | |
| Supplemental data | |
| Net assets, end of period (in thousands) | | $ | 6,081 | | | $ | 6,253 | | | $ | 14,779 | | | $ | 31,476 | | | $ | 37,247 | | | $ | 56,087 | | |
| Portfolio turnover | | | 10 | %(h) | | | 170 | %(h) | | | 177 | % | | | 160 | % | | | 137 | % | | | 266 | % | |
Notes to Financial Highlights
(a) For the period from April 1, 2012 to April 30, 2012. During the period, the Fund's fiscal year end was changed from March 31 to April 30.
(b) Rounds to less than $0.01.
(c) In addition to the fees and expenses which the Fund bears directly, the Fund indirectly bears a pro rata share of the fees and expenses of the acquired funds in which it invests. Such indirect expenses are not included in the reported expense ratios.
(d) Annualized.
(e) Includes interest expense which rounds to less than 0.01%.
(f) The Investment Manager and certain of its affiliates agreed to waive/reimburse certain fees and expenses, if applicable.
(g) The benefits derived from expense reductions had an impact of less than 0.01%.
(h) Includes mortgage dollar rolls. If mortgage dollar roll transactions were excluded, the portfolio turnover would have been 9% and 157% for the year ended April 30, 2012 and March 31, 2012, respectively.
The Accompanying Notes to Financial Statements are an integral part of this statement.
37
Financial Highlights (continued) – Columbia Intermediate Bond Fund
| | | Year ended
April 30, | | March 31, | |
| | | 2012(a) | | 2012 | | 2011 | | 2010 | | 2009 | | 2008 | |
| Class C | |
| Per share data | |
| Net asset value, beginning of period | | $ | 9.33 | | | $ | 9.08 | | | $ | 8.95 | | | $ | 7.72 | | | $ | 8.71 | | | $ | 8.84 | | |
| Income from investment operations: | |
| Net investment income | | | 0.02 | | | | 0.28 | | | | 0.31 | | | | 0.38 | | | | 0.39 | | | | 0.37 | | |
| Net realized and unrealized gain (loss) | | | 0.06 | | | | 0.28 | | | | 0.15 | | | | 1.26 | | | | (0.98 | ) | | | (0.12 | ) | |
| Total from investment operations | | | 0.08 | | | | 0.56 | | | | 0.46 | | | | 1.64 | | | | (0.59 | ) | | | 0.25 | | |
| Less distributions to shareholders from: | |
| Net investment income | | | (0.02 | ) | | | (0.31 | ) | | | (0.33 | ) | | | (0.41 | ) | | | (0.38 | ) | | | (0.38 | ) | |
| Net realized gains | | | — | | | | — | | | | — | | | | — | | | | (0.02 | ) | | | — | | |
| Total distributions to shareholders | | | (0.02 | ) | | | (0.31 | ) | | | (0.33 | ) | | | (0.41 | ) | | | (0.40 | ) | | | (0.38 | ) | |
| Proceeds from regulatory settlement | | | — | | | | 0.00 | (b) | | | — | | | | 0.00 | (b) | | | — | | | | — | | |
| Net asset value, end of period | | $ | 9.39 | | | $ | 9.33 | | | $ | 9.08 | | | $ | 8.95 | | | $ | 7.72 | | | $ | 8.71 | | |
| Total return | | | 0.86 | % | | | 6.20 | % | | | 5.17 | % | | | 21.59 | % | | | (6.91 | %) | | | 2.87 | % | |
| Ratios to average net assets(c) | |
Expenses prior to fees waived or expenses reimbursed
(including interest expense) | | | 1.71 | %(d) | | | 1.70 | %(e) | | | 1.68 | %(e) | | | 1.65 | %(e) | | | 1.64 | %(e) | | | 1.63 | % | |
Net expenses after fees waived or expenses reimbursed
(including interest expense)(f) | | | 1.44 | %(d) | | | 1.44 | %(e)(g) | | | 1.52 | %(e)(g) | | | 1.50 | %(e)(g) | | | 1.49 | %(e)(g) | | | 1.48 | %(g) | |
Expenses prior to fees waived or expenses reimbursed
(excluding interest expense) | | | 1.71 | %(d) | | | 1.70 | % | | | 1.68 | % | | | 1.65 | % | | | 1.64 | % | | | 1.63 | % | |
Net expenses after fees waived or expenses reimbursed
(excluding interest expense)(f) | | | 1.44 | %(d) | | | 1.44 | %(g) | | | 1.52 | %(g) | | | 1.50 | %(g) | | | 1.49 | %(g) | | | 1.48 | %(g) | |
| Net investment income | | | 2.75 | %(d) | | | 3.04 | %(g) | | | 3.42 | %(g) | | | 4.43 | %(g) | | | 4.74 | %(g) | | | 4.28 | %(g) | |
| Supplemental data | |
| Net assets, end of period (in thousands) | | $ | 35,579 | | | $ | 35,304 | | | $ | 33,885 | | | $ | 30,731 | | | $ | 31,372 | | | $ | 37,164 | | |
| Portfolio turnover | | | 10 | %(h) | | | 170 | %(h) | | | 177 | % | | | 160 | % | | | 137 | % | | | 266 | % | |
Notes to Financial Highlights
(a) For the period from April 1, 2012 to April 30, 2012. During the period, the Fund's fiscal year end was changed from March 31 to April 30.
(b) Rounds to less than $0.01.
(c) In addition to the fees and expenses which the Fund bears directly, the Fund indirectly bears a pro rata share of the fees and expenses of the acquired funds in which it invests. Such indirect expenses are not included in the reported expense ratios.
(d) Annualized.
(e) Includes interest expense which rounds to less than 0.01%.
(f) The Investment Manager and certain of its affiliates agreed to waive/reimburse certain fees and expenses, if applicable.
(g) The benefits derived from expense reductions had an impact of less than 0.01%.
(h) Includes mortgage dollar rolls. If mortgage dollar roll transactions were excluded, the portfolio turnover would have been 9% and 157% for the year ended April 30, 2012 and March 31, 2012, respectively.
The Accompanying Notes to Financial Statements are an integral part of this statement.
38
Financial Highlights (continued) – Columbia Intermediate Bond Fund
| | | Year ended
April 30, | | Year ended March 31, | |
| | | 2012(a) | | 2012 | | 2011(b) | |
| Class I | |
| Per share data | |
| Net asset value, beginning of period | | $ | 9.33 | | | $ | 9.08 | | | $ | 9.21 | | |
| Income from investment operations: | |
| Net investment income | | | 0.03 | | | | 0.37 | | | | 0.19 | | |
| Net realized and unrealized gain (loss) | | | 0.06 | | | | 0.27 | | | | (0.11 | ) | |
| Total from investment operations | | | 0.09 | | | | 0.64 | | | | 0.08 | | |
| Less distributions to shareholders from: | |
| Net investment income | | | (0.03 | ) | | | (0.39 | ) | | | (0.21 | ) | |
| Total distributions to shareholders | | | (0.03 | ) | | | (0.39 | ) | | | (0.21 | ) | |
| Proceeds from regulatory settlement | | | — | | | | 0.00 | (c) | | | — | | |
| Net asset value, end of period | | $ | 9.39 | | | $ | 9.33 | | | $ | 9.08 | | |
| Total return | | | 0.94 | % | | | 7.17 | % | | | 0.87 | % | |
| Ratios to average net assets(d) | |
| Expenses prior to fees waived or expenses reimbursed (including interest expense) | | | 0.52 | %(e) | | | 0.51 | %(f) | | | 0.53 | %(e)(f) | |
| Net expenses after fees waived or expenses reimbursed (including interest expense)(g) | | | 0.52 | %(e) | | | 0.51 | %(f)(h) | | | 0.52 | %(e)(f)(h) | |
| Expenses prior to fees waived or expenses reimbursed (excluding interest expense) | | | 0.52 | %(e) | | | 0.51 | % | | | 0.53 | %(e) | |
| Net expenses after fees waived or expenses reimbursed (excluding interest expense)(g) | | | 0.52 | %(e) | | | 0.51 | %(h) | | | 0.52 | %(e)(h) | |
| Net investment income | | | 3.68 | %(e) | | | 4.01 | %(h) | | | 4.05 | %(e)(h) | |
| Supplemental data | |
| Net assets, end of period (in thousands) | | $ | 90,345 | | | $ | 86,768 | | | $ | 26,866 | | |
| Portfolio turnover | | | 10 | %(i) | | | 170 | %(i) | | | 177 | % | |
Notes to Financial Highlights
(a) For the period from April 1, 2012 to April 30, 2012. During the period, the Fund's fiscal year end was changed from March 31 to April 30.
(b) For the period from September 27, 2010 (commencement of operations) to March 31, 2011.
(c) Rounds to less than $0.01.
(d) In addition to the fees and expenses which the Fund bears directly, the Fund indirectly bears a pro rata share of the fees and expenses of the acquired funds in which it invests. Such indirect expenses are not included in the reported expense ratios.
(e) Annualized.
(f) Includes interest expense which rounds to less than 0.01%.
(g) The Investment Manager and certain of its affiliates agreed to waive/reimburse certain fees and expenses, if applicable.
(h) The benefits derived from expense reductions had an impact of less than 0.01%.
(i) Includes mortgage dollar rolls. If mortgage dollar roll transactions were excluded, the portfolio turnover would have been 9% and 157% for the year ended April 30, 2012 and March 31, 2012, respectively.
The Accompanying Notes to Financial Statements are an integral part of this statement.
39
Financial Highlights (continued) – Columbia Intermediate Bond Fund
| | | Year ended
April 30, | | March 31, | |
| | | 2012(a) | | 2012 | | 2011 | | 2010 | | 2009 | | 2008 | |
| Class R | |
| Per share data | |
| Net asset value, beginning of period | | $ | 9.33 | | | $ | 9.08 | | | $ | 8.95 | | | $ | 7.72 | | | $ | 8.71 | | | $ | 8.84 | | |
| Income from investment operations: | |
| Net investment income | | | 0.02 | | | | 0.31 | | | | 0.34 | | | | 0.41 | | | | 0.41 | | | | 0.40 | | |
| Net realized and unrealized gain (loss) | | | 0.06 | | | | 0.28 | | | | 0.15 | | | | 1.26 | | | | (0.97 | ) | | | (0.12 | ) | |
| Total from investment operations | | | 0.08 | | | | 0.59 | | | | 0.49 | | | | 1.67 | | | | (0.56 | ) | | | 0.28 | | |
| Less distributions to shareholders from: | |
| Net investment income | | | (0.02 | ) | | | (0.34 | ) | | | (0.36 | ) | | | (0.44 | ) | | | (0.41 | ) | | | (0.41 | ) | |
| Net realized gains | | | — | | | | — | | | | — | | | | — | | | | (0.02 | ) | | | — | | |
| Total distributions to shareholders | | | (0.02 | ) | | | (0.34 | ) | | | (0.36 | ) | | | (0.44 | ) | | | (0.43 | ) | | | (0.41 | ) | |
| Proceeds from regulatory settlement | | | — | | | | 0.00 | (b) | | | — | | | | 0.00 | (b) | | | — | | | | — | | |
| Net asset value, end of period | | $ | 9.39 | | | $ | 9.33 | | | $ | 9.08 | | | $ | 8.95 | | | $ | 7.72 | | | $ | 8.71 | | |
| Total return | | | 0.89 | % | | | 6.55 | % | | | 5.54 | % | | | 22.01 | % | | | (6.58 | %) | | | 3.24 | % | |
| Ratios to average net assets(c) | |
Expenses prior to fees waived or expenses reimbursed
(including interest expense) | | | 1.21 | %(d) | | | 1.20 | %(e) | | | 1.18 | %(e) | | | 1.15 | %(e) | | | 1.14 | %(e) | | | 1.13 | % | |
Net expenses after fees waived or expenses reimbursed
(including interest expense)(f) | | | 1.09 | %(d) | | | 1.09 | %(e)(g) | | | 1.17 | %(e)(g) | | | 1.15 | %(e)(g) | | | 1.14 | %(e)(g) | | | 1.13 | %(g) | |
Expenses prior to fees waived or expenses reimbursed
(excluding interest expense) | | | 1.21 | %(d) | | | 1.20 | % | | | 1.18 | % | | | 1.15 | % | | | 1.14 | % | | | 1.13 | % | |
Net expenses after fees waived or expenses reimbursed
(excluding interest expense)(f) | | | 1.09 | %(d) | | | 1.09 | %(g) | | | 1.17 | %(g) | | | 1.15 | %(g) | | | 1.14 | %(g) | | | 1.13 | %(g) | |
| Net investment income | | | 3.08 | %(d) | | | 3.39 | %(g) | | | 3.75 | %(g) | | | 4.78 | %(g) | | | 5.11 | %(g) | | | 4.60 | %(g) | |
| Supplemental data | |
| Net assets, end of period (in thousands) | | $ | 2,631 | | | $ | 2,786 | | | $ | 2,969 | | | $ | 1,694 | | | $ | 1,819 | | | $ | 1,606 | | |
| Portfolio turnover | | | 10 | %(h) | | | 170 | %(h) | | | 177 | % | | | 160 | % | | | 137 | % | | | 266 | % | |
Notes to Financial Highlights
(a) For the period from April 1, 2012 to April 30, 2012. During the period, the Fund's fiscal year end was changed from March 31 to April 30.
(b) Rounds to less than $0.01.
(c) In addition to the fees and expenses which the Fund bears directly, the Fund indirectly bears a pro rata share of the fees and expenses of the acquired funds in which it invests. Such indirect expenses are not included in the reported expense ratios.
(d) Annualized.
(e) Includes interest expense which rounds to less than 0.01%.
(f) The Investment Manager and certain of its affiliates agreed to waive/reimburse certain fees and expenses, if applicable.
(g) The benefits derived from expense reductions had an impact of less than 0.01%.
(h) Includes mortgage dollar rolls. If mortgage dollar roll transactions were excluded, the portfolio turnover would have been 9% and 157% for the year ended April 30, 2012 and March 31, 2012, respectively.
The Accompanying Notes to Financial Statements are an integral part of this statement.
40
Financial Highlights (continued) – Columbia Intermediate Bond Fund
| | | Year ended
April 30, | | Year ended March 31, | |
| | | 2012(a) | | 2012 | | 2011(b) | |
| Class W | |
| Per share data | |
| Net asset value, beginning of period | | $ | 9.33 | | | $ | 9.08 | | | $ | 9.21 | | |
| Income from investment operations: | |
| Net investment income | | | 0.03 | | | | 0.34 | | | | 0.17 | | |
| Net realized and unrealized gain (loss) | | | 0.05 | | | | 0.27 | | | | (0.11 | ) | |
| Total from investment operations | | | 0.08 | | | | 0.61 | | | | 0.06 | | |
| Less distributions to shareholders from: | |
| Net investment income | | | (0.02 | ) | | | (0.36 | ) | | | (0.19 | ) | |
| Total distributions to shareholders | | | (0.02 | ) | | | (0.36 | ) | | | (0.19 | ) | |
| Proceeds from regulatory settlement | | | — | | | | 0.00 | (c) | | | — | | |
| Net asset value, end of period | | $ | 9.39 | | | $ | 9.33 | | | $ | 9.08 | | |
| Total return | | | 0.91 | % | | | 6.84 | % | | | 0.69 | % | |
| Ratios to average net assets(d) | |
| Expenses prior to fees waived or expenses reimbursed (including interest expense) | | | 0.94 | %(e) | | | 0.94 | %(f) | | | 0.89 | %(e)(f) | |
| Net expenses after fees waived or expenses reimbursed (including interest expense)(g) | | | 0.82 | %(e) | | | 0.83 | %(f)(h) | | | 0.87 | %(e)(f)(h) | |
| Expenses prior to fees waived or expenses reimbursed (excluding interest expense) | | | 0.94 | %(e) | | | 0.94 | % | | | 0.89 | %(e) | |
| Net expenses after fees waived or expenses reimbursed (excluding interest expense)(g) | | | 0.82 | %(e) | | | 0.83 | %(h) | | | 0.87 | %(e)(h) | |
| Net investment income | | | 3.38 | %(e) | | | 3.64 | %(h) | | | 3.62 | %(e)(h) | |
| Supplemental data | |
| Net assets, end of period (in thousands) | | $ | 3 | | | $ | 3 | | | $ | 2 | | |
| Portfolio turnover | | | 10 | %(i) | | | 170 | %(i) | | | 177 | % | |
Notes to Financial Highlights
(a) For the period from April 1, 2012 to April 30, 2012. During the period, the Fund's fiscal year end was changed from March 31 to April 30.
(b) For the period from September 27, 2010 (commencement of operations) to March 31, 2011.
(c) Rounds to less than $0.01.
(d) In addition to the fees and expenses which the Fund bears directly, the Fund indirectly bears a pro rata share of the fees and expenses of the acquired funds in which it invests. Such indirect expenses are not included in the reported expense ratios.
(e) Annualized.
(f) Includes interest expense which rounds to less than 0.01%.
(g) The Investment Manager and certain of its affiliates agreed to waive/reimburse certain fees and expenses, if applicable.
(h) The benefits derived from expense reductions had an impact of less than 0.01%.
(i) Includes mortgage dollar rolls. If mortgage dollar roll transactions were excluded, the portfolio turnover would have been 9% and 157% for the year ended April 30, 2012 and March 31, 2012, respectively.
The Accompanying Notes to Financial Statements are an integral part of this statement.
41
Financial Highlights (continued) – Columbia Intermediate Bond Fund
| | | Year ended
April 30, | | March 31, | |
| | | 2012(a) | | 2012 | | 2011 | | 2010 | | 2009 | | 2008 | |
| Class Z | |
| Per share data | |
| Net asset value, beginning of period | | $ | 9.33 | | | $ | 9.08 | | | $ | 8.95 | | | $ | 7.72 | | | $ | 8.71 | | | $ | 8.84 | | |
| Income from investment operations: | |
| Net investment income | | | 0.03 | | | | 0.36 | | | | 0.39 | | | | 0.45 | | | | 0.45 | | | | 0.45 | | |
| Net realized and unrealized gain (loss) | | | 0.06 | | | | 0.27 | | | | 0.15 | | | | 1.26 | | | | (0.97 | ) | | | (0.13 | ) | |
| Total from investment operations | | | 0.09 | | | | 0.63 | | | | 0.54 | | | | 1.71 | | | | (0.52 | ) | | | 0.32 | | |
| Less distributions to shareholders from: | |
| Net investment income | | | (0.03 | ) | | | (0.38 | ) | | | (0.41 | ) | | | (0.48 | ) | | | (0.45 | ) | | | (0.45 | ) | |
| Net realized gains | | | — | | | | — | | | | — | | | | — | | | | (0.02 | ) | | | — | | |
| Total distributions to shareholders | | | (0.03 | ) | | | (0.38 | ) | | | (0.41 | ) | | | (0.48 | ) | | | (0.47 | ) | | | (0.45 | ) | |
| Proceeds from regulatory settlement | | | — | | | | 0.00 | (b) | | | — | | | | 0.00 | (b) | | | — | | | | — | | |
| Net asset value, end of period | | $ | 9.39 | | | $ | 9.33 | | | $ | 9.08 | | | $ | 8.95 | | | $ | 7.72 | | | $ | 8.71 | | |
| Total return | | | 0.93 | % | | | 7.08 | % | | | 6.07 | % | | | 22.62 | % | | | (6.11 | %) | | | 3.74 | % | |
| Ratios to average net assets(c) | |
Expenses prior to fees waived or expenses reimbursed
(including interest expense) | | | 0.71 | %(d) | | | 0.70 | %(e) | | | 0.68 | %(e) | | | 0.65 | %(e) | | | 0.64 | %(e) | | | 0.63 | % | |
Net expenses after fees waived or expenses reimbursed
(including interest expense)(f) | | | 0.59 | %(d) | | | 0.59 | %(e)(g) | | | 0.67 | %(e)(g) | | | 0.65 | %(e)(g) | | | 0.64 | %(e)(g) | | | 0.63 | %(g) | |
Expenses prior to fees waived or expenses reimbursed
(excluding interest expense) | | | 0.71 | %(d) | | | 0.70 | % | | | 0.68 | % | | | 0.65 | % | | | 0.64 | % | | | 0.63 | % | |
Net expenses after fees waived or expenses reimbursed
(excluding interest expense)(f) | | | 0.59 | %(d) | | | 0.59 | %(g) | | | 0.67 | %(g) | | | 0.65 | %(g) | | | 0.64 | %(g) | | | 0.63 | %(g) | |
| Net investment income | | | 3.60 | %(d) | | | 3.89 | %(g) | | | 4.28 | %(g) | | | 5.26 | %(g) | | | 5.58 | %(g) | | | 5.13 | %(g) | |
| Supplemental data | |
| Net assets, end of period (in thousands) | | $ | 2,881,803 | | | $ | 2,853,669 | | | $ | 2,835,104 | | | $ | 1,973,020 | | | $ | 1,710,920 | | | $ | 2,259,863 | | |
| Portfolio turnover | | | 10 | %(h) | | | 170 | %(h) | | | 177 | % | | | 160 | % | | | 137 | % | | | 266 | % | |
Notes to Financial Highlights
(a) For the period from April 1, 2012 to April 30, 2012. During the period, the Fund's fiscal year end was changed from March 31 to April 30.
(b) Rounds to less than $0.01.
(c) In addition to the fees and expenses which the Fund bears directly, the Fund indirectly bears a pro rata share of the fees and expenses of the acquired funds in which it invests. Such indirect expenses are not included in the reported expense ratios.
(d) Annualized.
(e) Includes interest expense which rounds to less than 0.01%.
(f) The Investment Manager and certain of its affiliates agreed to waive/reimburse certain fees and expenses, if applicable.
(g) The benefits derived from expense reductions had an impact of less than 0.01%.
(h) Includes mortgage dollar rolls. If mortgage dollar roll transactions were excluded, the portfolio turnover would have been 9% and 157% for the year ended April 30, 2012 and March 31, 2012, respectively.
The Accompanying Notes to Financial Statements are an integral part of this statement.
42
Notes to Financial Statements – Columbia Intermediate Bond Fund
April 30, 2012
Note 1. Organization
Columbia Intermediate Bond Fund (the Fund), a series of Columbia Funds Series Trust I (the Trust), is a diversified fund. The Trust is registered under the Investment Company Act of 1940, as amended (the 1940 Act), as an open-end management investment company organized as a Massachusetts business trust.
Fiscal Year End Change
During the period, the Fund changed its fiscal year end from March 31 to April 30. Accordingly, this report includes activity for the period April 1, 2012 to April 30, 2012 and the year ended March 31, 2012.
Fund Shares
The Trust may issue an unlimited number of shares (without par value). The Fund offers Class A, Class B, Class C, Class I, Class R, Class W and Class Z shares. All share classes have identical voting, dividend and liquidation rights. Each share class has its own expense structure and sales charges, as applicable.
Class A shares are subject to a maximum front-end sales charge of 3.25% based on the initial investment amount. Class A shares purchased without an initial sales charge in accounts aggregating $1 million to $50 million at the time of purchase are subject to a contingent deferred sales charge (CDSC) if the shares are sold within 18 months of purchase, charged as follows: 1.00% CDSC if redeemed within 12 months of purchase, and 0.50% CDSC if redeemed more than 12, but less than 18, months after purchase.
Class B shares may be subject to a maximum CDSC of 3.00% based upon the holding period after purchase. Class B shares will generally convert to Class A shares eight years after purchase. The Fund no longer accepts investments by new or existing investors in the Fund's Class B shares, except in connection with the reinvestment of any dividend and/or capital gain distributions in Class B shares of the Fund and exchanges by existing Class B shareholders of certain other funds within the Columbia Family of Funds.
Class C shares are subject to a 1.00% CDSC on shares redeemed within one year of purchase.
Class I shares are not subject to sales charges and are only available to the Columbia Family of Funds.
Class R shares are not subject to sales charges and are only available to qualifying institutional investors.
Class W shares are not subject to sales charges and are only available to investors purchasing through authorized investment programs managed by investment professionals, including discretionary managed account programs.
Class Z shares are not subject to sales charges, and are only available to certain investors, as described in the Fund's prospectus.
Note 2. Summary of Significant Accounting Policies
Use of Estimates
The preparation of financial statements in accordance with U.S. generally accepted accounting principles (GAAP) requires management to make certain estimates and assumptions that affect the reported amounts of assets and liabilities, the disclosure of contingent assets and liabilities at the date of the financial statements and the reported amounts of revenue and expenses during the reporting period. Actual results could differ from those estimates.
The following is a summary of significant accounting policies consistently followed by the Fund in the preparation of its financial statements.
Security Valuation
Debt securities generally are valued by pricing services approved by the Board of Trustees (the Board) based upon market transactions for normal, institutional-size trading units of similar securities. The services may use various pricing techniques which take into account appropriate factors such as yield, quality, coupon rate, maturity, type of issue, trading characteristics and other data, as well as broker quotes. Debt securities for which quotations are readily available may also be valued based upon an over-the-counter or exchange bid quotation.
Asset and mortgage-backed securities are generally valued by pricing services, which utilize pricing models that incorporate the securities' cash flow and loan performance data. These
43
Columbia Intermediate Bond Fund, April 30, 2012
models also take into account available market data, including trades, market quotations, and benchmark yield curves for identical or similar securities. Factors used to identify similar securities may include, but are not limited to, issuer, collateral type, vintage, prepayment speeds, collateral performance, credit ratings, credit enhancement and expected life. Asset-backed securities for which quotations are readily available may also be valued based upon an over-the-counter or exchange bid quotation.
All equity securities are valued at the close of business of the New York Stock Exchange (NYSE). Equity securities are valued at the last quoted sales price on the principal exchange or market on which they trade, except for securities traded on the NASDAQ Stock Market, which are valued at the NASDAQ official close price. Unlisted securities or listed securities for which there were no sales during the day are valued at the mean of the latest quoted bid and asked prices on such exchanges or markets.
Investments in other open-end investment companies, including money market funds, are valued at net asset value.
Short-term securities purchased within 60 days to maturity are valued at amortized cost, which approximates market value. The value of short-term securities originally purchased with maturities greater than 60 days is determined based on an amortized value to par upon reaching 60 days to maturity. Short-term securities maturing in more than 60 days from the valuation date are valued at the market price or approximate market value based on current interest rates.
Futures and options on futures contracts are valued based upon the settlement price established each day by the board of trade or exchange on which they are traded.
Swap transactions are valued through an independent pricing service or broker, or if neither is available, through an internal model based upon observable inputs.
Foreign securities are valued based on quotations from the principal market in which such securities are normally traded. If any foreign share prices are not readily available as a result of limited share activity the securities are valued at the mean of the latest quoted bid and asked prices on such exchanges or markets. Foreign currency exchange rates are generally determined at 4:00 p.m. Eastern (U.S.) time. However, many securities markets and exchanges outside the U.S. close prior to the close of the NYSE; therefore, the closing prices for securities in such markets or on such exchanges may not fully reflect events that occur after such close but before the close of the NYSE. In those situations, foreign securities will be fair valued pursuant to the policy adopted by the Board, including utilizing a third party pricing service to determine these fair values. The third party pricing service takes into account multiple factors, including, but not limited to, movements in the U.S. securities markets, certain depositary receipts, futures contracts and foreign exchange rates that have occurred subsequent to the close of the foreign exchange, to determine a good faith estimate that reasonably reflects the current market conditions as of the close of the NYSE. The fair value of a security is likely to be different from the quoted or published price, if available.
Investments for which market quotations are not readily available, or that have quotations which management believes are not reliable, are valued at fair value as determined in good faith under consistently applied procedures established by and under the general supervision of the Board. If a security or class of securities (such as foreign securities) is valued at fair value, such value is likely to be different from the last quoted market price for the security. The determination of fair value often requires significant judgment. To determine fair value, management may use assumptions including but not limited to future cash flows and estimated risk premiums. Multiple inputs from various sources may be used to determine value.
Foreign Currency Transactions and Translation
The values of all assets and liabilities denominated in foreign currencies are translated into U.S. dollars at that day's exchange rates. Net realized and unrealized gains (losses) on foreign currency transactions and translations include gains (losses) arising from the fluctuation in exchange rates between trade and settlement dates on securities transactions, gains (losses) arising from the disposition of foreign currency and currency gains (losses) between the accrual and payment dates on dividends, interest income and foreign withholding taxes.
For financial statement purposes, the Fund does not distinguish that portion of gains (losses) on investments which is due to changes in foreign exchange rates from that which is due to changes in market prices of the investments. Such fluctuations are included with the net realized and
44
Columbia Intermediate Bond Fund, April 30, 2012
unrealized gains (losses) on investments in the Statement of Operations.
Derivative Instruments
The Fund invests in certain derivative instruments as detailed below to meet its investment objectives. Derivatives are instruments whose values depend on, or are derived from, in whole or in part, the value of one or more other assets, such as securities, currencies, commodities or indices. Derivative instruments may be used to maintain cash reserves while maintaining exposure to certain other assets, to offset anticipated declines in values of investments, to facilitate trading, to reduce transaction costs and to pursue higher investment returns. The Fund may also use derivative instruments to mitigate certain investment risks, such as foreign currency exchange rate risk, interest rate risk and credit risk. Derivatives may involve various risks, including the potential inability of the counterparty to fulfill its obligation under the terms of the contract, the potential for an illiquid secondary market and the potential for market movements which may expose the Fund to gains or losses in excess of the amount shown in the Statement of Assets and Liabilities.
The Fund and any counterparty are required to maintain an agreement that requires the Fund and that counterparty to monitor (on a daily basis) the net fair value of all derivatives entered into pursuant to the agreement between the Fund and such counterparty. If the net fair value of such derivatives between the Fund and that counterparty exceeds a certain threshold (as defined in the agreement), the Fund or the counterparty (as the case may be) is required to post cash and/or securities as collateral. Fair values of derivatives presented in the financial statements are not netted with the fair value of other derivatives or with any collateral amounts posted by the Fund or any counterparty.
Futures Contracts
Futures contracts represent commitments for the future purchase or sale of an asset at a specified price on a specified date. The Fund bought and sold futures contracts to manage the duration and yield curve exposure of the Fund versus the benchmark and manage exposure to movements in interest rates. Upon entering into futures contracts, the Fund bears risks which may include interest rates, exchange rates or securities prices moving unexpectedly, in which case, the Fund may not achieve the anticipated benefits of the futures contracts and may realize a loss. Additional risks include counterparty credit risk, the possibility of an illiquid market, and that a change in the value of the contract or option may not correlate with changes in the value of the underlying asset.
Upon entering into a futures contract, the Fund pledges cash or securities with the broker in an amount sufficient to meet the initial margin requirement. Subsequent payments (variation margin) are made or received by the Fund each day. The variation margin payments are equal to the daily change in the contract value and are recorded as variation margin receivable or payable and are offset in unrealized gains or losses. The Fund recognizes a realized gain or loss when the contract is closed or expires. Futures contracts involve, to varying degrees, risk of loss in excess of the variation margin disclosed in the Statement of Assets and Liabilities.
Credit Default Swap Contracts
Credit default swap contracts are agreements in which one party pays fixed periodic payments to a counterparty in consideration for a guarantee from the counterparty to make a specific payment should a specified negative credit event(s) take place. The Fund entered into credit default swap contracts as a protection buyer to reduce overall credit exposure.
As the purchaser of a credit default swap contract, the Fund purchases protection by paying a periodic interest rate on the notional amount to the counterparty. The interest amount is accrued daily as a component of unrealized appreciation (depreciation) and is recorded as a realized loss upon payment. If a credit event as specified in the contract occurs, the Fund may have the option either to deliver the reference obligation to the seller in exchange for a cash payment of its par amount, or to receive a net cash settlement equal to the par amount less an agreed-upon value of the reference obligation as of the date of the credit event. The difference between the value of the obligation or cash delivered and the notional amount received will be recorded as a realized gain (loss).
As the seller of a credit default swap contract, the Fund sells protection to a buyer and will generally receive a periodic interest rate on the notional amount. The interest amount is
45
Columbia Intermediate Bond Fund, April 30, 2012
accrued daily as a component of unrealized appreciation (depreciation) and is recorded as a realized gain upon receipt of the payment. If a credit event as specified in the contract occurs, the Fund may either be required to accept the reference obligation from the buyer in exchange for a cash payment of its notional amount, or to pay the buyer a net cash settlement equal to the notional amount less an agreed-upon value of the reference obligation as of the date of the credit event. The difference between the value of the obligation or cash received and the notional amount paid will be recorded as a realized gain (loss). The maximum potential amount of undiscounted future payments the Fund could be required to make as the seller of protection under a credit default swap contract is equal to the notional amount of the reference obligation. Notional amounts of all credit default swap contracts outstanding for which the Fund is the seller of protection, if any, are disclosed in the Credit Default Swap Contracts Outstanding schedule following the Portfolio of Investments. These potential amounts may be partially offset by any recovery values of the respective reference obligations or premiums received upon entering into the agreement.
As a protection seller, the Fund bears the risk of loss from the credit events specified in the contract. Although specified events are contract specific, credit events are generally defined as bankruptcy, failure to pay, restructuring, obligation acceleration, obligation default, or repudiation/moratorium. For credit default swap contracts on credit indices, quoted market prices and resulting market values serve as an indicator of the current status of the payment/performance risk. Increasing market values, in absolute terms when compared to the notional amount of the swap, represent a deterioration of the reference entity's credit soundness and a greater likelihood or risk of default or other credit event occurring as defined under the terms of the contract. Market values for credit default swap contracts in which the Fund is the seller of protection, if any, are disclosed in the Credit Default Swap Contracts Outstanding schedule following the Portfolio of Investments.
The notional amounts and market values of credit default swap contracts are not recorded in the financial statements. Any premium paid or received by the Fund upon entering into a credit default swap contract is recorded as an asset or liability, respectively, and amortized daily as a component of realized gain (loss) in the Statement of Operations. Credit default swap contracts are valued daily, and the change in value is recorded as unrealized appreciation (depreciation) until the termination of the swap, at which time a realized gain (loss) is recorded.
Credit default swap contracts can involve greater risks than if a fund had invested in the reference obligation directly since, in addition to general market risks, credit default swaps are subject to counterparty credit risk, leverage risk, hedging risk, correlation risk and liquidity risk. The Fund will enter into credit default swap transactions only with counterparties that meet certain standards of creditworthiness.
Effects of Derivative Transactions in the Financial Statements
The following tables are intended to provide additional information about the effect of derivatives on the financial statements of the Fund, including: the fair value of derivatives by risk category and the location of those fair values in the Statement of Assets and Liabilities; the impact of derivative transactions on the Fund's operations over the period including realized gains or losses and unrealized gains or losses. The derivative schedules following the Portfolio of Investments present additional information regarding derivative instruments outstanding at April 30, 2012, if any.
46
Columbia Intermediate Bond Fund, April 30, 2012
Fair Values of Derivative Instruments at April 30, 2012
| | | Asset derivatives | | Liability derivatives | |
| Risk Exposure Category | | Statement of Assets
and Liabilities Location | | Fair Value | | Statement of Assets
and Liabilities Location | | Fair Value | |
Credit contracts
| | Unrealized appreciation on
swap contracts | | $ | 130,200 | | | Unrealized depreciation on
swap contracts | | $ | 4,026,078 | | |
Credit contracts
| | Premiums paid on outstanding
credit default swap contracts | | | 7,129,139 | | | Premiums received on outstanding
credit default swap contracts | | | 378,309 | | |
Interest rate contracts
| | Net assets—unrealized appreciation
on futures contracts | | | 183,343 | * | | Net assets—unrealized depreciation
on futures contracts | | | 4,282,254 | * | |
| Total | | | | $ | 7,442,682 | | | | | $ | 8,686,641 | | |
* Includes cumulative appreciation (depreciation) of futures contracts as reported in the Futures Contracts Outstanding table following the Portfolio of Investments. Only the current day's variation margin is reported in receivables or payables in the Statement of Assets and Liabilities.
Effect of Derivative Instruments in the Statement of Operations for the Period Ended April 30, 2012
Amount of Realized Gain (Loss) on Derivatives Recognized in Income
| Risk Exposure Category | | Futures Contracts | | Swap Contracts | | Total | |
| Credit contracts | | $ | — | | | $ | (118,027 | ) | | $ | (118,027 | ) | |
| Interest rate contracts | | | 97,992 | | | | — | | | $ | 97,992 | | |
| Total | | $ | 97,992 | | | $ | (118,027 | ) | | $ | (20,035 | ) | |
Change in Unrealized Appreciation (Depreciation) on Derivatives Recognized in Income
| Risk Exposure Category | | Futures Contracts | | Swap Contracts | | Total | |
| Credit contracts | | $ | — | | | $ | (64,769 | ) | | $ | (64,769 | ) | |
| Interest rate contracts | | | (9,776,069 | ) | | | — | | | $ | (9,776,069 | ) | |
| Total | | $ | (9,776,069 | ) | | $ | (64,769 | ) | | $ | (9,840,838 | ) | |
Volume of Derivative Instruments for the Period Ended April 30, 2012
| | | Contracts
Opened | |
| Futures Contracts | | | — | | |
| | | Aggregate
Notional
Opened | |
Credit Default Swap
Contracts—Buy Protection | | $ | — | | |
| Credit Default Swap | |
| Contracts—Sell Protection | | $ | — | | |
47
Columbia Intermediate Bond Fund, April 30, 2012
Fair Values of Derivative Instruments at March 31, 2012
| | | Asset derivatives | | Liability derivatives | |
| Risk Exposure Category | | Statement of Assets
and Liabilities Location | | Fair Value | | Statement of Assets
and Liabilities Location | | Fair Value | |
Credit contracts
| | Unrealized appreciation on
swap contracts | | $ | 87,188 | | | Unrealized depreciation on
swap contracts | | $ | 4,047,835 | | |
Credit contracts
| | Premiums paid on outstanding
credit default swap contracts | | | 7,257,688 | | | Premiums received on outstanding
credit default swap contracts | | | 385,191 | | |
Interest rate contracts
| | Net assets—unrealized appreciation
on futures contracts | | | 5,769,315 | * | | Net assets—unrealized depreciation
on futures contracts | | | 92,157 | * | |
| Total | | | | $ | 13,114,191 | | | | | $ | 4,525,183 | | |
* Includes cumulative appreciation (depreciation) of futures contracts as reported in the Statement of Assets and Liabilities. Only the current day's variation margin is reported in receivables or payables in the Statement of Assets and Liabilities.
Effect of Derivative Instruments in the Statement of Operations for the Year Ended March 31, 2012
Amount of Realized Gain (Loss) on Derivatives Recognized in Income
| Risk Exposure Category | | Forward Foreign Currency
Exchange Contracts | | Futures Contracts | | Swap Contracts | | Total | |
| Credit contracts | | $ | — | | | $ | — | | | $ | (3,431,697 | ) | | $ | (3,431,697 | ) | |
| Foreign exchange contracts | | | (1,988 | ) | | | — | | | | — | | | | (1,988 | ) | |
| Interest rate contracts | | | — | | | | (79,489,991 | ) | | | — | | | | (79,489,991 | ) | |
| Total | | $ | (1,988 | ) | | $ | (79,489,991 | ) | | $ | (3,431,697 | ) | | $ | (82,923,676 | ) | |
Change in Unrealized Appreciation (Depreciation) on Derivatives Recognized in Income
| Risk Exposure Category | | Forward Foreign Currency
Exchange Contracts | | Futures Contracts | | Swap Contracts | | Total | |
| Credit contracts | | $ | — | | | $ | — | | | $ | (3,999,882 | ) | | $ | (3,999,882 | ) | |
| Interest rate contracts | | | — | | | | 5,255,261 | | | | — | | | | 5,255,261 | | |
| Total | | $ | — | | | $ | 5,255,261 | | | $ | (3,999,882 | ) | | $ | 1,255,379 | | |
48
Columbia Intermediate Bond Fund, April 30, 2012
Volume of Derivative Instruments for the Year Ended March 31, 2012
| | | Contracts
Opened | |
| Futures Contracts | | | 30,376 | | |
| | | Aggregate
Notional
Opened | |
Credit Default Swap
Contracts—Buy Protection | | $ | 329,655,000 | | |
| Credit Default Swap | | | |
| Contracts—Sell Protection | | $ | 46,265,000 | | |
Repurchase Agreements
The Fund may engage in repurchase agreement transactions with institutions that management has determined are creditworthy. The Fund, through the custodian, receives delivery of the underlying securities collateralizing a repurchase agreement. Management is responsible for determining that the collateral is at least equal, at all times, to the value of the repurchase obligation including interest. A repurchase agreement transaction involves certain risks in the event of default or insolvency of the counterparty. These risks include possible delays in or restrictions on a Fund's ability to dispose of the underlying securities and a possible decline in the value of the underlying securities during the period while the Fund seeks to assert its rights.
Delayed Delivery Securities
The Fund may trade securities on other than normal settlement terms, including securities purchased or sold on a "when-issued" basis. This may increase the risk if the other party to the transaction fails to deliver and causes the Fund to subsequently invest at less advantageous prices. The Fund designates cash or liquid securities in an amount equal to the delayed delivery commitment.
Mortgage Dollar Roll Transactions
The Fund may enter into mortgage "dollar rolls" in which the Fund sells securities for delivery in the current month and simultaneously contracts with the same counterparty to repurchase similar (same type, coupon and maturity) but not identical securities on a specified future date not exceeding 120 days. During the roll period, the Fund loses the right to receive principal and interest paid on the securities sold. However, the Fund will benefit because it receives negotiated amounts in the form of reductions of the purchase price for the future purchase plus the interest earned on the cash proceeds of the securities sold until the settlement date of the forward purchase. The Fund records the incremental difference between the forward purchase and sale of each forward roll as a realized gain or loss. Unless any realized gains exceed the income, capital appreciation, and gain or loss due to mortgage prepayments that would have been realized on the securities sold as part of the mortgage dollar roll, the use of this technique will diminish the investment performance of the Fund compared to what the performance would have been without the use of mortgage dollar rolls. All cash proceeds will be invested in instruments that are permissible investments for the Fund. The Fund identifies within its Portfolio of Investments cash or liquid securities in an amount equal to the forward purchase price.
For financial reporting and tax purposes, the Fund treats "to be announced" mortgage dollar rolls as two separate transactions, one involving the purchase of a security and a separate transaction involving a sale. This treatment may exaggerate the Fund's portfolio turnover rate. The Fund does not currently enter into mortgage dollar rolls that are accounted for as financing transactions.
Mortgage dollar rolls involve certain risks. If the broker-dealer to whom the Fund sells the securities becomes insolvent, the Fund's right to purchase or repurchase the mortgage-related securities may be restricted and the instruments which the Fund is required to repurchase may be worth less than instruments which the Fund originally held. Successful use of mortgage dollar rolls may depend upon the Investment Manager's ability to predict interest rates and mortgage prepayments. For these reasons, there is no assurance that mortgage dollar rolls can be successfully employed.
Loan Participations and Commitments
The Fund may invest in loan participations. When the Fund purchases a loan participation, the Fund typically enters into a contractual relationship with the lender or third party selling such participation (Selling Participant), but not the borrower. However, the Fund assumes the credit risk of the borrower, Selling Participant and any other persons interpositioned
49
Columbia Intermediate Bond Fund, April 30, 2012
between the Fund and the borrower. The Fund may not directly benefit from the collateral supporting the senior loan which it has purchased from the Selling Participant.
Stripped Securities
The Fund may invest in Interest only (IO) and Principal Only (PO) stripped mortgage-backed securities. These securities are derivative multi-class mortgage securities structured so that one class receives most, if not all, of the principal from the underlying mortgage assets, while the other class receives most, if not all, of the interest and the remainder of the principal. If the underlying mortgage assets experience greater than anticipated prepayments of principal, the Fund may fail to fully recoup its initial investment in an IO security, therefore the daily interest accrual factor is adjusted each month to reflect the paydown of principal. The market value of these securities can be extremely volatile in response to changes in interest rates. Credit risk reflects the risk that the Fund may not receive all or part of its principal because the issuer or credit enhancer has defaulted on its obligation.
Security Transactions
Security transactions are accounted for on the trade date. Cost is determined and gains (losses) are based upon the specific identification method for both financial statement and federal income tax purposes.
Income Recognition
Interest income is recorded on the accrual basis. Market premium and discount are amortized and accreted, respectively, on all debt securities, unless otherwise noted. Original issue discount is accreted to interest income over the life of the security with a corresponding increase in the cost basis, if any.
Corporate actions and dividend income are recorded on the ex-dividend date.
Expenses
General expenses of the Trust are allocated to the Fund and other funds of the Trust based upon relative net assets or other expense allocation methodologies determined by the nature of the expense. Expenses directly attributable to the Fund are charged to the Fund. Expenses directly attributable to a specific class of shares are charged to that share class.
Determination of Class Net Asset Value
All income, expenses (other than class-specific expenses, which are charged to that share class, as shown in the Statement of Operations) and realized and unrealized gains (losses) are allocated to each class of the Fund on a daily basis for purposes of determining the net asset value of each class. Income and expenses are allocated to each class based on the settled shares method, while realized and unrealized gains (losses) are allocated based on the relative net assets of each class.
Federal Income Tax Status
The Fund intends to qualify each year as a regulated investment company under Subchapter M of the Internal Revenue Code, as amended, and will distribute substantially all of its tax exempt or taxable income (including net short-term capital gains), if any, for its tax year, and as such will not be subject to federal income taxes. In addition, the Fund intends to distribute in each calendar year substantially all of its net investment income, capital gains and certain other amounts, if any, such that the Fund should not be subject to federal excise tax. Therefore, no federal income or excise tax provision is recorded.
Distributions to Shareholders
Distributions from net investment income are declared daily and paid monthly. Net realized capital gains, if any, are distributed at least annually. Income distributions and capital gain distributions are determined in accordance with federal income tax regulations which may differ from GAAP.
Guarantees and Indemnifications
Under the Trust's organizational documents and, in some cases, by contract, its officers and trustees are indemnified against certain liabilities arising out of the performance of their duties to the Trust or its funds. In addition, certain of the Fund's contracts with its service providers contain general indemnification clauses. The Fund's maximum exposure under these arrangements is unknown since the amount of any future claims that may be made against the Fund cannot be determined, and the Fund has no historical basis for predicting the likelihood of any such claims.
50
Columbia Intermediate Bond Fund, April 30, 2012
Note 3. Fees and Compensation Paid to Affiliates
Investment Management Fees
Under an Investment Management Services Agreement, Columbia Management Investment Advisers, LLC (the Investment Manager), a wholly-owned subsidiary of Ameriprise Financial, Inc. (Ameriprise Financial), determines which securities will be purchased, held or sold. The management fee is an annual fee that is equal to a percentage of the Fund's average daily net assets that declines from 0.43% to 0.30% as the Fund's net assets increase. For the period April 1, 2012 to April 30, 2012, the annualized effective management fee rate was 0.41% of the Fund's average daily net assets. For the year ended March 31, 2012, the effective management fee rate was 0.42% of the Fund's average daily net assets.
Administration Fees
Under an Administrative Services Agreement, the Investment Manager serves as the Fund Administrator. The Fund pays the Fund Administrator an annual fee for administration and accounting services equal to a percentage of the Fund's average daily net assets that declines from 0.07% to 0.04% as the Fund's net assets increase. For the period April 1, 2012 to April 30, 2012 and the year ended March 31, 2012, the annualized effective administration fee rate was 0.06% of the Fund's average daily net assets.
Pricing and Bookkeeping Fees
Prior to June 27, 2011, the Fund had entered into a Financial Reporting Services Agreement (the Financial Reporting Services Agreement) with State Street Bank and Trust Company (State Street) and the Investment Manager pursuant to which State Street provided financial reporting services to the Fund. The Fund also entered into an Accounting Services Agreement (collectively with the Financial Reporting Services Agreement, the State Street Agreements) with State Street and the Investment Manager pursuant to which State Street provided accounting services to the Fund. Under the State Street Agreements, the Fund paid State Street an annual fee of $38,000 paid monthly plus an additional monthly fee based on an annualized percentage rate of average daily net assets of the Fund for the month. The aggregate fee did not exceed $140,000 per year (exclusive of out-of-pocket expenses and charges). The Fund also reimbursed State Street for certain out-of-pocket expenses and charges. Effective June 27, 2011, these services are provided under the Administrative Services Agreement discussed above.
Compensation of Board Members
Board members are compensated for their services to the Fund as disclosed in the Statement of Operations. The Trust's eligible Trustees may participate in a Deferred Compensation Plan (the Plan) which may be terminated at any time. Obligation of the Plan will be paid solely out of the Fund's assets.
Compensation of Chief Compliance Officer
The Board has appointed a Chief Compliance Officer to the Fund in accordance with federal securities regulations. The Fund, along with other affiliated funds, pays its pro-rata share of the expenses associated with the Chief Compliance Officer. The Fund's expenses for the Chief Compliance Officer will not exceed $15,000 per year.
Transfer Agent Fees
Under a Transfer and Dividend Disbursing Agent Agreement, Columbia Management Investment Services Corp. (the Transfer Agent), an affiliate of the Investment Manager and a wholly-owned subsidiary of Ameriprise Financial, is responsible for providing transfer agency services to the Fund. The Transfer Agent has contracted with Boston Financial Data Services (BFDS) to serve as sub-transfer agent.
The Transfer Agent receives monthly account-based service fees based on the number of open accounts and is reimbursed by the Fund for the fees and expenses the Transfer Agent pays to financial intermediaries that maintain omnibus accounts with the Fund that is a percentage of the average aggregate value of the Fund's shares maintained in each such omnibus account (other than omnibus accounts for which American Enterprise Investment Services Inc. is the broker of record or accounts where the beneficial shareholder is a customer of Ameriprise Financial Services, Inc., which are paid a per account fee). The Transfer Agent pays the fees of BFDS for services as sub-transfer agent and is not entitled to reimbursement for such fees from the Fund (with the exception of out-of-pocket fees).
51
Columbia Intermediate Bond Fund, April 30, 2012
The Transfer Agent also receives compensation from fees for various shareholder services and reimbursements for certain out-of-pocket expenses. Class I shares do not pay transfer agent fees.
For the period April 1, 2012 to April 30, 2012 and the year ended March 31, 2012, the Fund's annualized effective transfer agent fee rates as a percentage of average daily net assets of each class were as follows:
| | | Period ended
April 30,
2012 | | Year ended
March 31,
2012 | |
| Class A | | | 0.20 | % | | | 0.19 | % | |
| Class B | | | 0.19 | | | | 0.21 | | |
| Class C | | | 0.20 | | | | 0.19 | | |
| Class R | | | 0.19 | | | | 0.19 | | |
| Class W | | | 0.26 | | | | 0.23 | | |
| Class Z | | | 0.20 | | | | 0.19 | | |
An annual minimum account balance fee of $20 may apply to certain accounts with a value below the Fund's initial minimum investment requirements to reduce the impact of small accounts on transfer agent fees. These minimum account balance fees are recorded as part of expense reductions in the Statement of Operations. For the period April 1, 2012 to April 30, 2012, no minimum account balance fees were charged to accounts. For the year ended March 31, 2012, these minimum account balance fees reduced total expenses by $4,105.
Distribution and Service Fees
The Fund has an agreement with Columbia Management Investment Distributors, Inc. (the Distributor), an affiliate of the Investment Manager and a wholly-owned subsidiary of Ameriprise Financial, for distribution and shareholder services. Pursuant to Rule 12b-1 under the 1940 Act, the Board has approved, and the Fund has adopted, distribution and shareholder service plans (the Plans) which set the distribution and service fees for the Fund. These fees are calculated daily and are intended to compensate the Distributor and/or eligible selling and/or servicing agents for selling shares of the Fund and providing services to investors.
The Plans require the payment of a monthly service fee to the Distributor at the maximum annual rate of 0.25% of the average daily net assets attributable to Class A, Class B, Class C and Class W shares of the Fund. The Plans also require the payment of a monthly distribution fee to the Distributor at the maximum annual rates of 0.10%, 0.75%, 0.75%, 0.50% and 0.25% of the average daily net assets attributable to Class A, Class B, Class C, Class R and Class W shares, respectively.
The Fund may pay distribution and service fees up to a maximum annual rate of 0.35% of the Fund's average daily net assets attributable to Class A shares (comprised of up to 0.10% for distribution services and up to 0.25% for shareholder liaison services), but currently limit such fees to an aggregate fee of not more than 0.25% of the Fund's average daily net assets attributable to Class A shares.
The Distributor has voluntarily agreed to waive a portion of the distribution fee for Class C shares so that the combined distribution and service fee does not exceed 0.85% annually of the average daily net assets attributable to Class C shares. This arrangement may be modified or terminated by the Distributor at any time.
The Fund may pay a distribution fee of up to 0.25% of the Fund's average daily net assets attributable to Class W shares and a service fee of up to 0.25% of the Fund's average daily net assets attributable to Class W shares, provided, however, that the aggregate fee shall not exceed 0.25% of the Fund's average daily net assets attributable to Class W shares.
Sales Charges
Sales charges, including front-end charges and CDSCs, received by the Distributor for distributing Fund shares were $7,832 for Class A, $79 for Class B and $506 for Class C shares for the period April 1, 2012 to April 30, 2012, and $107,219 for Class A, $3,018 for Class B and $3,013 for Class C shares for the year ended March 31, 2012.
Expenses Waived/Reimbursed by the Investment Manager and its Affiliates
The Investment Manager and certain of its affiliates have contractually agreed to waive fees and/or reimburse expenses (excluding certain fees and expenses described below),
52
Columbia Intermediate Bond Fund, April 30, 2012
through July 31, 2012, unless sooner terminated at the sole discretion of the Board, so that the Fund's net operating expenses, after giving effect to fees waived/expenses reimbursed and any balance credits and/or overdraft charges from the Fund's custodian, do not exceed the following annual rates as a percentage of the class' average daily net assets:
| Class A | | | 0.84 | % | |
| Class B | | | 1.59 | | |
| Class C | | | 1.59 | | |
| Class I | | | 0.52 | | |
| Class R | | | 1.09 | | |
| Class W | | | 0.84 | | |
| Class Z | | | 0.59 | | |
Under the agreement, the following fees and expenses are excluded from the waiver/reimbursement commitment, and therefore will be paid by the Fund, if applicable: taxes (including foreign transaction taxes), expenses associated with investments in affiliated and non-affiliated pooled investment vehicles (including mutual funds and exchange traded funds), transaction costs and brokerage commissions, costs related to any securities lending program, dividend expenses associated with securities sold short, inverse floater program fees and expenses, transaction charges and interest on borrowed money, interest, extraordinary expenses and any other expenses the exclusion of which is specifically approved by the Board. This agreement may be modified or amended only with approval from all parties. Class C distribution fees waived by the Distributor, as discussed above, are in addition to the waiver/reimbursement commitment under the agreement.
Note 4. Federal Tax Information
The timing and character of income and capital gain distributions are determined in accordance with income tax regulations, which may differ from GAAP because of temporary or permanent book to tax differences.
For the period April 1, 2012 to April 30, 2012, these differences are primarily due to differing treatment for amortization adjustments, capital loss carryforwards, defaulted bonds, deferral/reversal of wash sales, adjustments on certain convertible preferred securities, distributions, Trustees' deferred compensation, market discount/premium, paydown reclassifications, recognition of unrealized appreciation (depreciation) for certain derivative investments, and tax straddles. For the year ended March 31, 2012, these differences are primarily due to differing treatment for amortization adjustments, capital loss carryforwards, defaulted bonds, deferral/reversal of wash sales, adjustments on certain convertible preferred securities, distributions, Trustees' deferred compensation, market discount/premium, paydown reclassifications, recognition of unrealized appreciation (depreciation) for certain derivative investments, and tax straddles. To the extent these differences are permanent, reclassifications are made among the components of the Fund's net assets in the Statement of Assets and Liabilities. Temporary differences do not require reclassifications. In the Statement of Assets and Liabilities the following reclassifications were made:
| | | Period ended
April 30,
2012 | | Year ended
March 31,
2012 | |
Excess of
distributions over
net investment income | | $ | 257,868 | | | $ | (188,605 | ) | |
Accumulated net realized
loss | | | 29,465 | | | | (183,450 | ) | |
| Paid-in capital | | $ | (287,333 | ) | | | 372,055 | | |
Net investment income and net realized gains (losses), as disclosed in the Statement of Operations, and net assets were not affected by this reclassification.
The tax character of distributions paid during the periods indicated was as follows:
| | | Period ended
April 30,
2012 | | Year ended
March 31,
2012 | | Year ended
March 31,
2011 | |
| Ordinary income | | $ | 9,525,343 | | | $ | 128,721,073 | | | $ | 99,466,144 | | |
53
Columbia Intermediate Bond Fund, April 30, 2012
Short-term capital gain distributions, if any, are considered ordinary income distributions for tax purposes.
At April 30, 2012 and March 31, 2012, the components of distributable earnings on a tax basis were as follows:
| | | April 30,
2012 | | March 31,
2012 | |
Undistributed ordinary
income | | $ | 10,647,034 | | | $ | 14,112,598 | | |
| Unrealized appreciation | | | 107,394,207 | | | | 82,156,850 | | |
At April 30, 2012 and March 31, 2012, the cost of investments for federal income tax purposes, and the aggregate unrealized appreciation and depreciation based on that cost was as follows:
| | | April 30,
2012 | | March 31,
2012 | |
Aggregate unrealized
appreciation | | $ | 158,233,240 | | | $ | 138,212,263 | | |
Aggregate unrealized
depreciation | | $ | (50,839,033 | ) | | $ | (56,055,413 | ) | |
Net unrealized
apppreciation | | $ | 107,394,207 | | | $ | 82,156,850 | | |
Cost of investments for
tax purposes | | $ | 3,391,751,862 | | | $ | 3,433,394,488 | | |
The following capital loss carryforward, determined at April 30, 2012 and March 31, 2012, may be available to reduce taxable income arising from future net realized gains on investments, if any, to the extent permitted by the Internal Revenue Code:
| Year of expiration | | April 30,
2012
Amount | | March 31,
2012
Amount | |
| 2016 | | $ | 3,389,305 | | | $ | — | | |
| 2017 | | | 3,942,436 | | | | 3,389,305 | | |
| 2018 | | | — | | | | 3,942,436 | | |
| Unlimited Short-term | | | 1,845,386 | | | | — | | |
| Unlimited Long-term | | | 1,556,584 | | | | — | | |
| Total | | $ | 10,733,711 | | | $ | 7,331,741 | | |
On December 22, 2010, the Regulated Investment Company Modernization Act of 2010 (the Act) was enacted, which changed various technical rules governing the tax treatment of regulated investment companies. The changes are generally effective for taxable years beginning after the date of enactment. Under the Act, the Fund will be permitted to carry forward capital losses incurred in taxable years beginning after the date of enactment for an unlimited period. However, any losses incurred during those future taxable years will be required to be utilized prior to the losses incurred in pre-enactment taxable years, which carry an expiration date. As a result of this ordering rule, pre-enactment capital loss carryforwards may be more likely to expire unused.
For the year ended March 31, 2012, $30,285,007 of capital loss carryforward was utilized.
Management of the Fund has concluded that there are no significant uncertain tax positions that would require recognition in the financial statements. However, management's conclusion may be subject to review and adjustment at a later date based on factors including, but not limited to, new tax laws, regulations, and administrative interpretations (including relevant court decisions). Generally, the Fund's federal tax returns for the prior three fiscal years remain subject to examination by the Internal Revenue Service.
Note 5. Portfolio Information
For the period April 1, 2012 to April 30, 2012, the cost of purchases and proceeds from sales of securities, excluding short-term obligations, aggregated to $381,874,551 and $336,008,959, respectively, of which $326,326,342 and $118,400,906, respectively, were U.S. government securities.
For the year ended March 31, 2012, the cost of purchases and proceeds from sales of securities, excluding short-term obligations, aggregated to $5,222,604,984 and $5,310,709,933, respectively, of which $3,659,136,766 and $3,618,300,680, respectively, were U.S. government securities.
Note 6. Regulatory Settlements
During the year ended March 31, 2012, the Fund received payments of $11,319 resulting from certain regulatory settlements with third parties in which the Fund had
54
Columbia Intermediate Bond Fund, April 30, 2012
participated. The payments have been included in "Proceeds from regulatory settlements" in the Statement of Changes in Net Assets.
Note 7. Lending of Portfolio Securities
Effective June 27, 2011, the Fund has entered into a Master Securities Lending Agreement (the Agreement) with JPMorgan Chase Bank, N.A. (JPMorgan). The Agreement, which replaces the previous securities lending arrangement with State Street, authorizes JPMorgan as lending agent to lend securities to authorized borrowers in order to generate additional income on behalf of the Fund. Pursuant to the Agreement, the securities loaned are secured by cash or U.S. government securities equal to at least 100% of the market value of the loaned securities. Any additional collateral required to maintain those levels due to market fluctuations of the loaned securities is requested to be delivered the following business day. Cash collateral received is invested by the lending agent on behalf of the Fund into authorized investments pursuant to the Agreement. The investments made with the cash collateral are listed in the Portfolio of Investments. The values of such investments and any uninvested cash collateral are disclosed in the Statement of Assets and Liabilities along with the related obligation to return the collateral upon the return of the securities loaned.
At April 30, 2012, securities valued at $306,074,383 were on loan, secured by U.S. government securities valued at $137,254,886 and by cash collateral of $174,638,569 (which does not reflect calls for collateral made to borrowers by JPMorgan at period end) that is partially or fully invested in short-term securities or other cash equivalents.
At March 31, 2012, securities valued at $323,112,071 were on loan, secured by U.S. government securities valued at $169,187,711 and by cash collateral of $161,684,695 (which does not reflect calls for collateral made to borrowers by JPMorgan at period end) that is partially or fully invested in short-term securities or other cash equivalents.
Risks of delay in recovery of securities or even loss of rights in the securities may occur should the borrower of the securities fail financially. Risks may also arise to the extent that the value of the securities loaned increases above the value of the collateral received. JPMorgan will indemnify the Fund from losses resulting from a borrower's failure to return a loaned security when due. Such indemnification does not extend to losses associated with declines in the value of cash collateral investments. The Investment Manager is not responsible for any losses incurred by the Fund in connection with the securities lending program. Loans are subject to termination by the Fund or the borrower at any time, and are, therefore, not considered to be illiquid investments.
Pursuant to the Agreement, the Fund receives income for lending its securities either in the form of fees or by earning interest on invested cash collateral, net of negotiated rebates paid to borrowers and fees paid to the lending agent for services provided and any other securities lending expenses. Net income earned from securities lending for the period ended April 30, 2012 and the year ended March 31, 2012 is disclosed in the Statement of Operations. The Fund continues to earn and accrue interest and dividends on the securities loaned.
Prior to June 27, 2011, the Fund participated in a securities lending arrangement with State Street. Each security on loan was collateralized in an amount at least equal to the market value of the securities loaned plus accrued income from the investment of collateral. The income generated by the investment of the collateral, net of any fees remitted to State Street as the lending agent and borrower rebates, was paid to the Fund.
Note 8. Custody Credits
Prior to June 27, 2011, the Fund had an agreement with its custodian bank under which custody fees may have been reduced by balance credits. These credits are recorded as part of expense reductions on the Statement of Operations. The Fund could have invested a portion of the assets utilized in connection with the expense offset arrangement in an income-producing asset if they had not entered into such an agreement. Subsequent to this date, the Fund may invest its daily balance in an affiliated money market fund as detailed below. For the period April 1, 2011 through June 26, 2011, these credits reduced total expenses by $52.
Note 9. Affiliated Money Market Fund
Effective June 27, 2011, the Fund may invest its daily cash balances in Columbia Short-Term Cash Fund, an affiliated money market fund established for the exclusive use by the Fund and other affiliated funds. The income earned by the Fund from such investments is included as "Dividends from
55
Columbia Intermediate Bond Fund, April 30, 2012
affiliates" in the Statement of Operations. As an investing fund, the Fund indirectly bears its proportionate share of the expenses of Columbia Short-Term Cash Fund.
Note 10. Shareholder Concentration
At April 30, 2012 one unaffiliated shareholder accounts owned 46.9% of the outstanding shares of the Fund. The Fund has no knowledge about whether any portion of those shares was owned beneficially ny such accounts. Affiliated shareholder accounts owned 21.9% of the outstanding shares of the Fund. Subscription and redemption activity by concentrated accounts may have a significant effect on the operations of the Fund.
At March 31, 2012, one unaffiliated shareholder account owned 47.4% of the outstanding shares of the Fund. The Fund has no knowledge about whether any portion of those shares was owned beneficially by such accounts. Affiliated shareholder accounts owned 21.5% of the outstanding shares of the Fund. Subscription and redemption activity by concentrated accounts may have a significant effect on the operations of the Fund.
Note 11. Line of Credit
The Fund has entered into a revolving credit facility with a syndicate of banks led by JPMorgan Chase Bank, N.A. (the Administrative Agent), whereby the Fund may borrow for the temporary funding of shareholder redemptions or for other temporary or emergency purposes. The credit facility became effective on June 27, 2011, replacing a prior credit facility. The credit facility agreement, as amended, which is a collective agreement between the Fund and certain other funds managed by the Investment Manager, severally and not jointly, permits collective borrowings up to $500 million. Pursuant to a December 13, 2011 amendment to the credit facility agreement, interest is charged to each participating fund based on its borrowings at a rate equal to the higher of (i) the overnight federal funds rate plus 1.00% or (i) the one-month LIBOR rate plus 1.00%. Each borrowing under the credit facility matures no later than 60 days after the date of borrowing. The Fund also pays a commitment fee equal to its pro rata share of the amount of the credit facility at a rate of 0.08% per annum. For the period June 27, 2011 through December 12, 2011, interest was charged to each participating fund based on its borrowings at a rate equal to the sum of the federal funds rate plus (i) 1.25% per annum plus (ii) if one-month LIBOR exceeds the federal funds rate, the amount of such excess. The Fund also paid a commitment fee equal to its pro rata share of the amount of the credit facility at a rate of 0.10% per annum.
For the period May 16, 2011 through June 26, 2011, the Fund and certain other funds managed by the Investment Manager participated in a $150 million committed, unsecured revolving credit facility provided by State Street. Prior to May 16, 2011, the collective borrowing amount of the credit facility was $225 million. Interest was charged to each fund based on its borrowings at a rate equal to the greater of the (i) federal funds rate plus 1.25% per annum or (ii) the overnight LIBOR rate plus 1.25% per annum. The Fund also paid a commitment fee equal to its pro rata share of the amount of the credit facility at a rate of 0.125% per annum.
The Fund had no borrowings during the period ended April 30, 2012.
For the year ended March 31, 2012, the average daily loan balance outstanding on days when borrowing existed was $21,033,333 at a weighted average interest rate of 1.38%.
Note 12. Fund Merger
At the close of business on March 11, 2011, the Fund acquired the assets and assumed the identified liabilities of Columbia Total Return Bond Fund, a series of Columbia Funds Series Trust. The reorganization was completed after shareholders approved the plan on February 15, 2011. The purpose of the transaction was to combine two funds managed by the Investment Manager with comparable investment objectives and strategies.
The aggregate net assets of the Fund immediately before the acquisition were $2,109,939,475 and the combined net assets immediately after the acquisition were $3,130,592,718.
The merger was accomplished by a tax-free exchange of 101,858,165 shares of Columbia Total Return Bond Fund, valued at $1,020,653,243. In exchange for the Columbia Total
56
Columbia Intermediate Bond Fund, April 30, 2012
Return Bond Fund shares and net assets, the Fund issued the following number of shares:
| | | Shares | |
| Class A | | | 2,333,001 | | |
| Class B | | | 241,230 | | |
| Class C | | | 356,235 | | |
| Class Z | | | 109,206,406 | | |
For financial reporting purposes, net assets received and shares issued by the Fund were recorded at fair value; however, Columbia Total Return Bond Fund's cost of investments was carried forward.
The financial statements reflect the operations of the Fund for the period prior to the merger and the combined fund for the period subsequent to the merger. Because the combined investment portfolios have been managed as a single integrated portfolio since the merger was completed, it is not practicable to separate the amounts of revenue and earnings of Columbia Total Return Bond Fund that have been included in the combined Fund's Statement of Operations since the merger was completed.
Assuming the merger had been completed on April 1, 2010, the Fund's pro-forma net investment income (loss), net gain (loss) on investments, net change in unrealized appreciation (depreciation) and net increase in net assets from operations for the year ended March 31, 2011 would have been approximately $142.3 million, $80.0 million, ($24.8 million) and $197.5 million, respectively.
Note 13. Significant Risks
High Yield Securities Risk
Investing in high-yield fixed income securities may involve greater credit risk and considerations not typically associated with investing in U.S. Government bonds and other higher quality fixed income securities. These securities are non-investment grade securities, often referred to as "junk" bonds. Economic downturns may disrupt the high yield market and impair the ability of issuers to repay principal and interest. Also, an increase in interest rates would likely have an adverse impact on the value of such obligations. Moreover, high-yield securities may be less liquid to the extent that there is no established secondary market.
Sector Focus Risk
The Fund may focus its investments in certain sectors, subjecting it to greater risk than a fund that invests in a wider range of industries.
Asset-Backed Securities Risk
The value of asset-backed securities may be affected by, among other factors, changes in interest rates, the market's assessment of the quality of underlying assets, the creditworthiness of the servicer for the underlying assets, factors concerning the interests in and structure of the issuer or the originator of the underlying assets, or the creditworthiness or rating of the entities that provide any supporting letters of credit, surety bonds, derivative instruments, or other credit enhancement. The value of asset-backed securities also will be affected by the exhaustion, termination or expiration of any credit enhancement. Most asset-backed securities are subject to prepayment risk, which is the possibility that the underlying debt may be refinanced or prepaid prior to maturity during periods of declining or low interest rates, causing the Fund to have to reinvest the money received in securities that have lower yields. In addition, the impact of prepayments on the value of asset-backed securities may be difficult to predict and may result in greater volatility.
Mortgage-Backed Securities Risk
The value of mortgage-backed securities may be affected by, among other things, changes in interest rates, factors concerning the interests in and structure of the issuer or the originator of the mortgages, the creditworthiness of the entities that provide any supporting letters of credit, surety bonds or other credit enhancements or the quality of underlying assets or the market's assessment thereof. Mortgage-backed securities are subject to prepayment risk, which is the possibility that the underlying mortgage may be refinanced or prepaid prior to maturity during periods of declining or low interest rates, causing the Fund to have to reinvest the money received in securities that have lower yields. In addition, the impact of prepayments on the value of mortgage-backed securities may be difficult to predict and may result in greater volatility.
57
Columbia Intermediate Bond Fund, April 30, 2012
Note 14. Subsequent Events
Management has evaluated the events and transactions that have occurred through the date the financial statements were issued. Other than as noted below, there were no items requiring adjustment of the financial statements or additional disclosure.
On May 4, 2012, a group of unaffiliated shareholders of the Fund redeemed $468,313,987, which represented approximately 14% of the Fund's net assets as of that date.
Note 15. Information Regarding Pending and Settled Legal Proceedings
In December 2005, without admitting or denying the allegations, American Express Financial Corporation (AEFC, which is now known as Ameriprise Financial, Inc. (Ameriprise Financial)) entered into settlement agreements with the Securities and Exchange Commission (SEC) and Minnesota Department of Commerce (MDOC) related to market timing activities. As a result, AEFC was censured and ordered to cease and desist from committing or causing any violations of certain provisions of the Investment Advisers Act of 1940, the Investment Company Act of 1940, and various Minnesota laws. AEFC agreed to pay disgorgement of $10 million and civil money penalties of $7 million. AEFC also agreed to retain an independent distribution consultant to assist in developing a plan for distribution of all disgorgement and civil penalties ordered by the SEC in accordance with various undertakings detailed at www.sec.gov/litigation/admin/ia-2451.pdf. Ameriprise Financial and its affiliates have cooperated with the SEC and the MDOC in these legal proceedings, and have made regular reports to the funds' Boards of Trustees.
Ameriprise Financial and certain of its affiliates have historically been involved in a number of legal, arbitration and regulatory proceedings, including routine litigation, class actions, and governmental actions, concerning matters arising in connection with the conduct of their business activities. Ameriprise Financial believes that the Funds are not currently the subject of, and that neither Ameriprise Financial nor any of its affiliates are the subject of, any pending legal, arbitration or regulatory proceedings that are likely to have a material adverse effect on the Funds or the ability of Ameriprise Financial or its affiliates to perform under their contracts with the Funds. Ameriprise Financial is required to make 10-Q, 10-K and, as necessary, 8-K filings with the Securities and Exchange Commission on legal and regulatory matters that relate to Ameriprise Financial and its affiliates. Copies of these filings may be obtained by accessing the SEC website at www.sec.gov.
There can be no assurance that these matters, or the adverse publicity associated with them, will not result in increased fund redemptions, reduced sale of fund shares or other adverse consequences to the Funds. Further, although we believe proceedings are not likely to have a material adverse effect on the Funds or the ability of Ameriprise Financial or its affiliates to perform under their contracts with the Funds, these proceedings are subject to uncertainties and, as such, we are unable to estimate the possible loss or range of loss that may result. An adverse outcome in one or more of these proceedings could result in adverse judgments, settlements, fines, penalties or other relief that could have a material adverse effect on the consolidated financial condition or results of operations of Ameriprise Financial.
58
Report of Independent Registered Public Accounting Firm
To the Trustees of Columbia Funds Series Trust I and the Shareholders of Columbia Intermediate Bond Fund
In our opinion, the accompanying statement of assets and liabilities, including the portfolio of investments, and the related statements of operations and of changes in net assets and the financial highlights present fairly, in all material respects, the financial position of Columbia Intermediate Bond Fund (the "Fund") (a series of Columbia Funds Series Trust I) at April 30, 2012 and at March 31, 2012, the results of its operations, the changes in its net assets and the financial highlights for each of the periods indicated, in conformity with accounting principles generally accepted in the United States of America. These financial statements and financial highlights (hereafter referred to as "financial statements") are the responsibility of the Fund's management. Our responsibility is to express an opinion on these financial statements based on our audits. We conducted our audits of these financial statements in accordance with the standards of the Public Company Accounting Oversight Board (United States). Those standards require that we plan and perform the audit to obtain reasonable assurance about whether the financial statements are free of material misstatement. An audit includes examining, on a test basis, evidence supporting the amounts and disclosures in the financial statements, assessing the accounting principles used and significant estimates made by management, and evaluating the overall financial statement presentation. We believe that our audits, which included confirmation of securities at April 30, 2012 and at March 31, 2012 by correspondence with the custodian, transfer agent and brokers, provide a reasonable basis for our opinion.
PricewaterhouseCoopers LLP
Minneapolis, Minnesota
June 8, 2012
59
Fund Governance
The Trustees serve terms of indefinite duration. The names, addresses and birth years of the Trustees and Officers of the Funds in Columbia Funds Series Trust I, the year each was first elected or appointed to office, their principal business occupations during at least the last five years, the number of Funds overseen by each Trustee and other directorships they hold are shown below. Each officer listed below serves as an officer of each Fund in Columbia Funds Series Trust I.
Independent Trustees
Name, Address and Year of Birth,
Position with Funds, Year First
Elected or Appointed to Office | | Principal Occupation(s) During Past Five Years, Number of Funds in Columbia
Funds Complex Overseen by Trustee, Other Directorships Held
| |
| Rodman L. Drake (Born 1943) | |
|
c/o Columbia Management Investment Advisers, LLC
225 Franklin Street
Boston, MA 02110
Trustee (since 1994) and
Chairman of the Board (since 2009) | | Independent consultant since 2010; Co-Founder of Baringo Capital LLC (private equity) from 1997 to 2008; CEO of Crystal River Capital, Inc. (real estate investment trust) from 2003 to 2010; Oversees 51; Jackson Hewitt Tax Service Inc. (tax preparation services from 2004 to 2011); Celgene Corporation (global biotechnology company); Student Loan Corporation (student loan provider from 2008 to 2010); Celgene Corporation (global biotechnology company); The Helios Funds and Brookfield Funds (closed-end funds); Crystal River Capital, Inc. from 2005 to 2010; Parson Brinckerhoff from 1995 to 2008; and Apex Silver Mines Ltd. from 2007 to 2009 | |
|
| Douglas A. Hacker (Born 1955) | |
|
c/o Columbia Management Investment Advisers, LLC
225 Franklin Street
Boston, MA 02110
Trustee (since 1996) | | Independent business executive since May 2006; Executive Vice President—Strategy of United Airlines from December 2002 to May 2006; President of UAL Loyalty Services (airline marketing company) from September 2001 to December 2002; Executive Vice President and Chief Financial Officer of United Airlines from July 1999 to September 2001. Oversees 51; Nash Finch Company (food distributor); Aircastle Limited (aircraft leasing); and SeaCube Container Leasing Ltd (container leasing) | |
|
| Janet Langford Kelly (Born 1957) | |
|
c/o Columbia Management Investment Advisers, LLC
225 Franklin Street
Boston, MA 02110
Trustee (since 1996) | | Senior Vice President, General Counsel and Corporate Secretary, ConocoPhillips (integrated energy company) since September 2007; Deputy General Counsel—Corporate Legal Services, ConocoPhillips from August 2006 to August 2007; Partner, Zelle, Hofmann, Voelbel, Mason & Gette LLP (law firm) from March 2005 to July 2006; Adjunct Professor of Law, Northwestern University, from September 2004 to June 2006; Director, UAL Corporation (airline) from February 2006 to July 2006; Chief Administrative Officer and Senior Vice President, Kmart Holding Corporation (consumer goods) from September 2003 to March 2004. Oversees 51; None | |
|
| Nancy T. Lukitsh (Born 1956) | |
|
c/o Columbia Management Investment Advisers, LLC
225 Franklin Street
Boston, MA 02110
Trustee (since 2011) | | Senior Vice President, Partner and Director of Marketing, Wellington Management Company, LLP (investment adviser) from 1997 to 2010; Chair, Wellington Management Investment Portfolios (commingled non-U.S. investment pools) from 2007 to 2010; Director, Wellington Trust Company, NA and other Wellington affiliates from 1997 to 2010. Oversees 51; None | |
|
| William E. Mayer (Born 1940) | |
|
c/o Columbia Management Investment Advisers, LLC
225 Franklin Street
Boston, MA 02110
Trustee (since 1994) | | Partner, Park Avenue Equity Partners (private equity) since February 1999; Dean and Professor, College of Business and Management, University of Maryland from 1992 to 1996. Oversees 51; DynaVox Inc. (speech creation); Lee Enterprises (print media); WR Hambrecht + Co. (financial service provider) from 2000 to 2012; BlackRock Kelso Capital Corporation (investment company) | |
|
60
Fund Governance (continued)
Independent Trustees (continued)
Name, Address and Year of Birth,
Position with Funds, Year First
Elected or Appointed to Office | | Principal Occupation(s) During Past Five Years, Number of Funds in Columbia
Funds Complex Overseen by Trustee, Other Directorships Held
| |
| David M. Moffett (Born 1952) | |
|
c/o Columbia Management Investment Advisers, LLC
225 Franklin Street
Boston, MA 02110
Trustee (since 2011) | | Retired. Chief Executive Officer, Federal Home Loan Mortgage Corporation, from 2008 to 2009; Senior Adviser, Global Financial Services Group, Carlyle Group, Inc., from 2007 to 2008; Vice Chairman and Chief Financial Officer, U.S. Bancorp, from 1993 to 2007. Oversees 51; CIT Group Inc. (commercial and consumer finance), eBay Inc. (online trading community), MBIA Corp (financial service provider), E.W. Scripps Co. (print and television media), Building Materials Holding Corp. (building materials and construction services), and University of Oklahoma Foundation. | |
|
| Charles R. Nelson (Born 1942) | |
|
c/o Columbia Management Investment Advisers, LLC
225 Franklin Street
Boston, MA 02110
Trustee (since 1981) | | Retired Professor Emeritus, University of Washington, since 2011; Professor of Economics, University of Washington, from January 1976 to 2011; Ford and Louisa Van Voorhis Professor of Political Economy, University of Washington, from 1993 to 2011; Adjunct Professor of Statistics, University of Washington, from 1980 to 2011; Associate Editor, Journal of Money Credit and Banking from 1993 to 2008; consultant on econometric and statistical matters. Oversees 51; None | |
|
| John J. Neuhauser (Born 1943) | |
|
c/o Columbia Management Investment Advisers, LLC
225 Franklin Street
Boston, MA 02110
Trustee (since 1984) | | President, Saint Michael's College, since August 2007; Director or Trustee of several non-profit organizations, including Fletcher Allen Health Care, Inc.; University Professor, Boston College from November 2005 to August 2007; Academic Vice President and Dean of Faculties, Boston College from August 1999 to October 2005. Oversees 51; Liberty All-Star Equity Fund and Liberty All-Star Growth Fund (closed-end funds) | |
|
| Patrick J. Simpson (Born 1944) | |
|
c/o Columbia Management Investment Advisers, LLC
225 Franklin Street
Boston, MA 02110
Trustee (since 2000) | | Partner, Perkins Coie LLP (law firm). Oversees 51; None | |
|
| Anne-Lee Verville (Born 1945) | |
|
c/o Columbia Management Investment Advisers, LLC
225 Franklin Street
Boston, MA 02110
Trustee (since 1998) | | Retired. General Manager—Global Education Industry from 1994 to 1997, President—Application Systems Division from 1991 to 1994, Chief Financial Officer—US Marketing & Services from 1988 to 1991, and Chief Information Officer from 1987 to 1988, IBM Corporation (computer and technology). Oversees 51; Enesco Group, Inc. (producer of giftware and home and garden decor products) from 2001 to 2006 | |
|
The Statement of Additional Information includes additional information about the Trustees of the Funds and is available, without charge, upon request by calling 1-800-345-6611.
61
Fund Governance (continued)
Interested Trustee
Name, address and year of birth,
Position with funds, Year first
elected or appointed to office | | Principal occupation(s) during past five years, Number of funds in Columbia Funds
Complex overseen by trustee, Other directorships held | |
| William F. Truscott (born 1960) | |
|
53600 Ameriprise Financial Center
Minneapolis, MN 55474
Senior Vice President (since 2010) | | Chairman of the Board and President, Columbia Management Investment Advisers, LLC since May 2010 and February 2012, respectively (previously President, Chairman of the Board and Chief Investment Officer, from 2001 to April 2010); Chief Executive Officer, U.S. Asset Management & President, Annuities, Ameriprise Financial, Inc. since May 2010 (previously President—U.S. Asset Management and Chief Investment Officer from 2005 to April 2010, and Senior Vice President—Chief Investment Officer, from 2001 to 2005); Director, President and Chief Executive Officer, Ameriprise Certificate Company since 2006; Director, Columbia Management Investment Distributors, Inc. since May 2010 and February 2012, respectively (previously Chairman of the Board and Chief Executive Officer from 2008 to April 2010); Chairman of the Board and Chief Executive Officer, RiverSource Distributors, Inc. since 2006. Oversees 51; Columbia Funds Board. | |
|
Officers
| Name, Year of Birth and Address | | Principal Occupation(s) During the Past Five Years | |
| J. Kevin Connaughton (Born 1964) | |
|
225 Franklin Street
Boston, MA 02110
President (since 2009) | | Senior Vice President and General Manager—Mutual Fund Products, Columbia Management Investment Advisers, LLC since May 2010; President, Columbia Funds, since 2009, and RiverSource Funds, since May 2010 (previously Senior Vice President and Chief Financial Officer, Columbia Funds, from June 2008 to January 2009, Treasurer, Columbia Funds, from October 2003 to May 2008, and senior officer of various other affiliated funds since 2000); Managing Director, Columbia Management Advisors, LLC from December 2004 to April 2010. | |
|
| Michael G. Clarke (Born 1969) | |
|
225 Franklin Street
Boston, MA 02110
Treasurer (since 2011) and Chief Financial Officer (since 2009) | | Vice President, Columbia Management Investment Advisers, LLC since May 2010; Managing Director of Fund Administration, Columbia Management Advisors, LLC, from September 2004 to April 2010; senior officer of Columbia Funds and affiliated funds since 2002. | |
|
| Scott R. Plummer (Born 1959) | |
|
5228 Ameriprise Financial Center
Minneapolis, MN 55474
Senior Vice President, Assistant Secretary and Chief Legal Officer (since 2010) | | Chief Legal Officer and Assistant Secretary, Columbia Management Investment Advisers, LLC since June 2005; Vice President and Lead Chief Counsel—Asset Management, Ameriprise Financial, Inc. since May 2010 (previously Vice President and Chief Counsel—Asset Management, from 2005 to April 2010; Vice President, Chief Counsel and Assistant Secretary, Columbia Management Investment Distributors, Inc. since 2008; Vice President, General Counsel and Secretary, Ameriprise Certificate Company since 2005; Chief Counsel, RiverSource Distributors, Inc. since 2006; Vice President, General Counsel and Secretary, RiverSource Funds since December 2006; Senior Vice President, Secretary and Chief Legal Officer, Columbia Funds, since May 2010. | |
|
62
Fund Governance (continued)
Officers (continued)
| Name, Year of Birth and Address | | Principal Occupation(s) During the Past Five Years | |
| William F. Truscott (Born 1960) | |
|
53600 Ameriprise Financial Center
Minneapolis, MN 55474
Senior Vice President (since 2010) | | Chairman of the Board and President, Columbia Management Investment Advisers, LLC since May 2010 and February 2012, respectively (previously President, Chairman of the Board and Chief Investment Officer, from 2001 to April 2010); Chief Executive Officer, U.S. Asset Management & President, Annuities, Ameriprise Financial, Inc. since May 2010 (previously President—U.S. Asset Management and Chief Investment Officer from 2005 to April 2010); Director, President and Chief Executive Officer, Ameriprise Certificate Company since 2006; Director and Chief Executive Officer, Columbia Management Investment Distributors, Inc. since May 2010 and February 2012, respectively (previously Chairman of the Board and Chief Executive Officer from 2008 to April 2010); Chairman of the Board and Chief Executive Officer, RiverSource Distributors, Inc. since 2006. | |
|
| Thomas P. McGuire (Born 1972) | |
|
225 Franklin Street
Boston, MA 02110
Chief Compliance Officer (since 2012) | | Vice President—Asset Management Compliance, Columbia Management Investment Advisers, LLC since 2010; Chief Compliance Officer. Ameriprise Certificate Company, since September 2010; Compliance Executive, Bank of America, 2005-2010. | |
|
| Colin Moore (Born 1958) | |
|
225 Franklin Street
Boston, MA 02110
Senior Vice President (since 2010) | | Director and Chief Investment Officer, Columbia Management Investment Advisers, LLC since May 2010; Manager, Managing Director and Chief Investment Officer of Columbia Management Advisors, LLC from 2007 to April 2010; Head of Equities, Columbia Management Advisors, LLC from 2002 to 2007. | |
|
| Amy Johnson (Born 1965) | |
|
5228 Ameriprise Financial Center
Minneapolis, MN 55474
Vice President (since 2010) | | Senior Vice President and Chief Operating Officer, Columbia Management Investment Advisers, LLC since May 2010 (previously Chief Administrative Officer, from 2009 until April 2010, Vice President—Asset Management and Trust Company Services, from 2006 to 2009, and Vice President—Operations and Compliance from 2004 to 2006). | |
|
| Joseph F. DiMaria (Born 1968) | |
|
225 Franklin Street
Boston, MA 02110
Vice President (since 2011) and Chief Accounting Officer (since 2008) | | Vice President, Mutual Fund Administration, Columbia Management Investment Advisers, LLC, since May 2010; Director of Fund Administration, Columbia Management Advisors, LLC from January 2006 to April 2010; Head of Tax/Compliance and Assistant Treasurer, Columbia Management Advisors, LLC, from November 2004 to December 2005. | |
|
| Stephen T. Welsh (born 1957) | |
|
225 Franklin Street
Boston, MA 02110
Vice President (since 2006) | | President and Director, Columbia Management Investment Services Corp. since May 2010; President and Director, Columbia Management Services, Inc. from July 2004 to April 2010; Managing Director, Columbia Management Distributors, Inc. from August 2007 to April 2010. | |
|
| Paul D. Pearson (born 1956) | |
|
5228 Ameriprise Financial Center
Minneapolis, MN 55474
Vice President and Assistant Treasurer (since 2011) | | Vice President, Investment Accounting, Columbia Management Investment Advisers, LLC, since May 2010; Vice President, Managed Assets, Investment Accounting, Ameriprise Financial Corporation. | |
|
63
Fund Governance (continued)
Officers (continued)
| Name, Year of Birth and Address | | Principal Occupation(s) During the Past Five Years | |
| Paul B. Goucher (born 1968) | |
|
5228 Ameriprise Financial Center
Minneapolis, MN 55474
Vice President and Assistant Secretary (since 2010) | | Vice President and Chief Counsel of Ameriprise Financial since January 2010 (formerly Vice President and Group Counsel from November 2008 to January 2010); Director, Managing Director and General Counsel of J. & W. Seligman & Co. Incorporated (Seligman) from July 2008 to November 2008 and Managing Director and Associate General Counsel of Seligman from January 2005 to July 2008. | |
|
| Christopher O. Petersen (born 1970) | |
|
5228 Ameriprise Financial Center
Minneapolis, MN 55474
Vice President (since 2010) and Secretary (since 2011) | | Vice President and Chief Counsel, Ameriprise Financial since January 2010 (formerly Vice President and Group Counsel or Counsel from April 2004 to January 2010); Assistant Secretary of RiverSource Funds since January 2007; officer of Columbia Funds and affiliated funds since 2007. | |
|
| Michael E. DeFao (born 1968) | |
|
225 Franklin Street
Boston, MA 02110
Vice President and Assistant Secretary (since 2011) | | Vice President and Chief Counsel, Ameriprise Financial since May 2010; Associate General Counsel Bank of America from June 2005 to April 2010 | |
|
64
Important Information About This Report
The fund mails one shareholder report to each shareholder address. If you would like more than one report, please call shareholder services at 1-800-345-6611 and additional reports will be sent to you. This report has been prepared for shareholders of Columbia Intermediate Bond Fund.
A description of the policies and procedures that the fund uses to determine how to vote proxies and a copy of the fund's voting records are available (i) at www.columbiamanagement.com, (ii) on the Securities and Exchange Commission's website at www.sec.gov, and (iii) without charge, upon request, by calling 1-800-368-0346. Information regarding how the fund voted proxies relating to portfolio securities during the 12-month period ended June 30 is available from the SEC's website. Information regarding how the fund voted proxies relating to portfolio securities is also available from the fund's website, www.columbiamanagement.com.
The fund files a complete schedule of portfolio holdings with the SEC for the first and third quarters of each fiscal year on Form N-Q. The fund's Form N-Q is available on the SEC's website at www.sec.gov and may be reviewed and copied at the SEC's Public Reference Room in Washington, D.C. Information on the operation of the Public Reference Room may be obtained by calling 1-800-SEC-0330.
Transfer Agent
Columbia Management Investment
Services Corp.
P.O. Box 8081
Boston, MA 02266-8081
1-800-345-6611
Distributor
Columbia Management Investment
Distributors, Inc.
225 Franklin Street
Boston, MA 02110
Investment Manager
Columbia Management Investment Advisers, LLC
225 Franklin Street
Boston, MA 02110
65

Columbia Intermediate Bond Fund
P. O. Box 8081
Boston, MA 02266-8081
columbiamanagement.com
This information is for use with concurrent or prior delivery of a fund prospectus. Investors should consider the investment objectives, risks, charges and expenses of a mutual fund carefully before investing. For a free prospectus, which contains this and other important information about the funds, visit columbiamanagement.com. Read the prospectus carefully before investing. The Fund is distributed by Columbia Management Investment Distributors, Inc., member FINRA, and managed by Columbia Management Investment Advisers, LLC.
© 2012 Columbia Management Investment Advisers, LLC. All rights reserved.
C-1186 C (5/12)

Columbia U.S. Treasury Index Fund
Annual Report for the Period Ended April 30, 2012
Not FDIC insured • No bank guarantee • May lose value
Table of Contents
| Fund Profile | | | 1 | | |
|
| Performance Information | | | 2 | | |
|
| Understanding Your Expenses | | | 3 | | |
|
| Portfolio Managers' Report | | | 4 | | |
|
| Portfolio of Investments | | | 6 | | |
|
Statement of Assets and
Liabilities | | | 9 | | |
|
| Statement of Operations | | | 11 | | |
|
Statement of Changes in
Net Assets | | | 12 | | |
|
| Financial Highlights | | | 14 | | |
|
| Notes to Financial Statements | | | 19 | | |
|
Report of Independent Registered
Public Accounting Firm | | | 26 | | |
|
| Federal Income Tax Information | | | 27 | | |
|
| Fund Governance | | | 28 | | |
|
Important Information About
This Report | | | 33 | | |
|
The views expressed in this report reflect the current views of the respective parties. These views are not guarantees of future performance and involve certain risks, uncertainties and assumptions that are difficult to predict, so actual outcomes and results may differ significantly from the views expressed. These views are subject to change at any time based upon economic, market or other conditions and the respective parties disclaim any responsibility to update such views. These views may not be relied on as investment advice and, because investment decisions for a Columbia Fund are based on numerous factors, may not be relied on as an indication of trading intent on behalf of any particular Columbia Fund. References to specific securities should not be construed as a recommendation or investment advice.
President's Message

Dear Shareholders,
A stock market rally that commenced in the fourth quarter of 2011 continued into 2012 in the United States and around the world, as all major market regions generated double-digit returns for the three-month period ended March 31, 2012. Volatility declined sharply as European debt fears quieted somewhat and sentiment improved. Returns in developed countries were buoyed by strong results in Germany, Belgium, Austria and the Nordic markets of Denmark, Finland, Norway and Sweden. Under the cloud of its own mounting debt problem, Spain was the only eurozone country to deliver a negative return during the three-month period. Solid economic growth and accommodative monetary policy helped boost gains in emerging markets. The rally in U.S. equities was largely driven by an expansion in "multiples"—an increase in stock prices relative to their earnings. By the end of the first quarter of 2012, stocks no longer appeared as cheap as they were late in 2011. Bonds lagged stocks during the first quarter as investors responded to signs of an improved environment with a greater appetite for risk.
Concerns around the health of the global economy were centered in news headlines focusing on Washington D.C., Europe, China and the Middle East. In the United States, economic indicators remained mixed but generally indicated support for slow, sustainable economic growth. European policymakers have made progress in containing the eurozone debt crisis, though they still have not solved the issue of long-term solvency. The European Central Bank has lowered interest rates and flooded the financial system with liquidity that may provide breathing space for companies to restructure their balance sheets. These massive infusions of liquidity may whet the appetite for risk from investors around the world. However, it has delayed a true reckoning with the European financial situation, as concerns about Spain and Portugal continue to cloud the outlook. These structural challenges that persist in the developed world, and slowing growth in emerging market economies, leave the global economy in a fragile state. Domestic demand, combined with slowing inflationary trends, has also helped to shore up emerging market economies. Joblessness remains low and monetary conditions remain easy.
Despite the challenges and surprises of 2011, we see pockets of strength—and as a result, attractive opportunities—both here and abroad for 2012. We hope to help you capitalize on these opportunities with various articles in our 2012 Perspectives, which is available via the Market Insights tab at columbiamanagement.com. This publication showcases the strong research capabilities and experienced investment teams of Columbia Management and offers a diverse array of investment ideas based on our five key themes for 2012.
Other information and resources available at columbiamanagement.com include:
g detailed up-to-date fund performance and portfolio information
g economic analysis and market commentary
g quarterly fund commentaries
g Columbia Management Investor, our award-winning quarterly newsletter for shareholders
Thank you for your continued support of the Columbia Funds. We look forward to serving your investment needs for many years to come.
Best Regards,

J. Kevin Connaughton
President, Columbia Funds
Investors should consider the investment objectives, risks, charges and expenses of a mutual fund carefully before investing. For a free prospectus, which contains this and other important information about the funds, visit columbiamanagement.com. The prospectus should be read carefully before investing.
Columbia Funds are distributed by Columbia Management Investment Distributors, Inc., member FINRA, and managed by Columbia Management Investment Advisers, LLC.
© 2012 Columbia Management Investment Advisers, LLC. All rights reserved.
Fund Profile – Columbia U.S. Treasury Index Fund
Summary
g For the 13-month period that ended April 30, 3012, the fund's class A shares returned 9.52% without sales charge.
g The fund underperformed its benchmark, the Citigroup Bond U.S. Treasury Index1, which posted a total return of 9.97% for the same period.
g Fees largely were responsible for the small performance difference between the benchmark and the fund.
Portfolio Management
William Finan has co-managed the fund since May 2010. From 2009 until joining Columbia Management Investment Advisers, LLC (the Investment Manager) in May 2010, Mr. Finan was associated with the fund's previous investment adviser as an investment professional.
Orhan Imer has co-managed the fund since May 2010. From 2009 until joining the Investment Manager in May 2010, Mr. Imer was associated with the fund's previous investment adviser as an investment professional.
1The Citigroup Bond U.S. Treasury Index is composed of all U.S. Treasury notes and bonds with remaining maturities of at least one year and outstanding principal of at least $25 million that are included in the Citigroup Broad Investment-Grade Bond Index. Securities in the Citigroup Bond U.S. Treasury Index are weighted by market value, that is, the price per bond or note multiplied by the number of bonds or notes outstanding.
Indices are not available for investment, are not professionally managed and do not reflect sales charges, fees, brokerage commissions, taxes or other expenses of investing. Securities in the fund may not match those in an index.
Performance data quoted represents past performance and current performance may be lower or higher. Past performance is no guarantee of future results. The investment return and principal value will fluctuate so that shares, when redeemed, may be worth more or less than the original cost. Please visit www.columbiamanagement.com for daily and most recent month-end performance updates.
Summary
13-month (cumulative) return as of 04/30/12
| | +9.52% | |
|
 | | Class A shares
(without sales charge) | |
|
| | +9.97% | |
|
 | | Citigroup Bond U.S.
Treasury Index | |
|
1
Performance Information – Columbia U.S. Treasury Index Fund
Performance data quoted represents past performance and current performance may be lower or higher. Past performance is no guarantee of future results. The investment return and principal value will fluctuate so that shares, when redeemed, may be worth more or less than the original cost. Please visit www.columbiamanagement.com for daily and most recent month-end performance updates.
Performance of a $10,000 investment 05/01/02 – 04/30/12
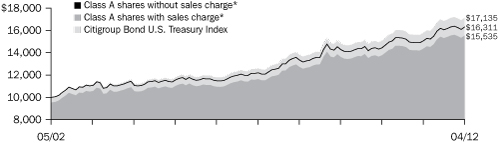
The chart above shows the change in value of a hypothetical $10,000 investment in Class A shares of Columbia U.S. Treasury Index Fund during the stated time period, and does not reflect the deduction of taxes that a shareholder may pay on fund distributions or on the redemption of fund shares.
Performance of a $10,000 investment 05/01/02 – 04/30/12 ($)
| Sales charge: | | without | | with | |
| Class A* | | | 16,311 | | | | 15,535 | | |
| Class B* | | | 15,140 | | | | 15,140 | | |
| Class C* | | | 15,364 | | | | 15,364 | | |
| Class I* | | | 16,713 | | | | n/a | | |
| Class Z | | | 16,714 | | | | n/a | | |
Average annual total return as of 04/30/12(%)
| Share class | | A* | | B* | | C* | | I* | | Z | |
| Inception | | 11/25/02 | | 11/25/02 | | 11/25/02 | | 9/27/10 | | 06/04/91 | |
| Sales charge | | without | | with | | without | | with | | without | | with | | without | | without | |
| 1-month (cumulative) | | | 1.40 | | | | –3.43 | | | | 1.34 | | | | –3.66 | | | | 1.35 | | | | 0.35 | | | | 1.42 | | | | 1.42 | | |
| 1-year | | | 8.28 | | | | 3.10 | | | | 7.47 | | | | 2.47 | | | | 7.63 | | | | 6.63 | | | | 8.55 | | | | 8.55 | | |
| 5-year | | | 5.99 | | | | 4.95 | | | | 5.20 | | | | 4.87 | | | | 5.35 | | | | 5.35 | | | | 6.25 | | | | 6.25 | | |
| 10-year | | | 5.01 | | | | 4.50 | | | | 4.23 | | | | 4.23 | | | | 4.39 | | | | 4.39 | | | | 5.27 | | | | 5.27 | | |
The "with sales charge" returns include the maximum initial sales charge of 4.75% for Class A shares and the applicable contingent deferred sales charge of 5.00% in the first year, declining to 1.00% in the sixth year and eliminated thereafter for Class B shares and 1.00% for Class C shares for the first year only. The "without sales charge" returns do not include the effect of sales charges. If they had, returns would be lower.
Performance results reflect any fee waivers or reimbursements of fund expenses by the investment advisor and/or any of its affiliates. Absent these fee waivers or expense reimbursement arrangements, performance results would have been lower.
All results shown assume reinvestment of distributions. Class I and Class Z shares are sold at net asset value with no distribution and service (Rule 12b-1) fees. Class I and Class Z shares have limited eligibility and the investment minimum requirements may vary. Please see the fund's prospectuses for details. Performance for different share classes will vary based on differences in sales charges and fees associated with each class.
*The returns shown for periods prior to the share class inception date (including returns since inception) include the returns of the fund's oldest share class. These returns are adjusted to reflect any higher class-related operating expenses of the newer share classes, as applicable. Please visit columbiamanagement.com/mutual-funds/appended-performance for more information.
The tables do not reflect the deduction of taxes that a shareholder may pay on fund distributions or on the redemption of fund shares
2
Understanding Your Expenses – Columbia U.S. Treasury Index Fund
As an investor, you incur two types of costs. There are transaction costs, which generally include sales charges on purchases and may include redemption fees. There are also ongoing costs, which generally include management fees, distribution and service (Rule 12b-1) fees, and other fund expenses. The following information is intended to help you understand your ongoing costs (in dollars) of investing in the Fund and to help you compare these costs with the ongoing costs of investing in other mutual funds.
Analyzing your fund's expenses
To illustrate these ongoing costs, we have provided examples and calculated the expenses paid by investors in each share class of the Fund during the period. The actual and hypothetical information in the table is based on an initial investment of $1,000 at the beginning of the period indicated and held for the entire period. Expense information is calculated two ways and each method provides you with different information. The amount listed in the "Actual" column is calculated using the Fund's actual operating expenses and total return for the period. You may use the Actual information, together with the amount invested, to estimate the expenses that you paid over the period. Simply divide your account value by $1,000 (for example, an $8,600 account value divided by $1,000 = 8.6), then multiply the results by the expenses paid during the period under the Actual column. The amount listed in the "Hypothetical" column assumes a 5% annual rate of return before expenses (which is not the Fund's actual return) and then applies the Fund's actual expense ratio for the period to the hypothetical return. You should not use the hypothetical account values and expenses to estimate either your actual account balance at the end of the period or the expenses you paid during the period. See "Compare with other funds" below for details on how to use the hypothetical data.
Compare with other funds
Since all mutual funds are required to include the same hypothetical calculations about expenses in shareholder reports, you can use this information to compare the ongoing cost of investing in the Fund with other funds. To do so, compare the hypothetical example with the 5% hypothetical examples that appear in the shareholder reports of other funds. As you compare hypothetical examples of other funds, it is important to note that hypothetical examples are meant to highlight the ongoing costs of investing in a fund only and do not reflect any transaction costs, such as sales charges, or redemption or exchange fees. Therefore, the hypothetical calculations are useful in comparing ongoing costs only, and will not help you determine the relative total costs of owning different funds. If transaction costs were included in these calculations, your costs would be higher.
November 1, 2011—April 30, 2012
| | | Account value at the
beginning of the period ($) | | Account value at the
end of the period ($) | | Expenses paid
during the period ($) | | Fund's annualized
expense ratio (%) | |
| | | Actual | | Hypothetical | | Actual | | Hypothetical | | Actual | | Hypothetical | | Actual | |
| Class A | | | 1,000.00 | | | | 1,000.00 | | | | 1,015.90 | | | | 1,022.63 | | | | 2.26 | | | | 2.26 | | | | 0.45 | | |
| Class B | | | 1,000.00 | | | | 1,000.00 | | | | 1,013.00 | | | | 1,018.90 | | | | 6.01 | | | | 6.02 | | | | 1.20 | | |
| Class C | | | 1,000.00 | | | | 1,000.00 | | | | 1,013.70 | | | | 1,019.64 | | | | 5.26 | | | | 5.27 | | | | 1.05 | | |
| Class I | | | 1,000.00 | | | | 1,000.00 | | | | 1,018.00 | | | | 1,023.87 | | | | 1.00 | | | | 1.01 | | | | 0.20 | | |
| Class Z | | | 1,000.00 | | | | 1,000.00 | | | | 1,018.00 | | | | 1,023.87 | | | | 1.00 | | | | 1.01 | | | | 0.20 | | |
Expenses paid during the period are equal to the annualized expense ratio for each class as indicated above, multiplied by the average account value over the period and then multiplied by the number of days in the Fund's most recent fiscal half year and divided by 366.
Expenses do not include fees and expenses incurred indirectly by the Fund from the underlying funds in which the Fund may invest (also referred to as "acquired funds"), including affiliated and non-affiliated pooled investments vehicles (including mutual funds and exchange traded funds).
Had Columbia Management Investment Advisers, LLC and/or certain of its affiliates not waived/reimbursed certain fees and expenses, account value at the end of the period would have been reduced.
3
Portfolio Manager's Report – Columbia U.S. Treasury Index Fund
Performance data quoted represents past performance and current performance may be lower or higher. Past performance is no guarantee of future results. The investment return and principal value will fluctuate so that shares, when redeemed, may be worth more or less than the original cost. Please visit www.columbiamanagement.com for daily and most recent month-end performance updates.
Portfolio breakdown1
at April 30, 2012 (%)
| U.S. Treasury Obligations | | | 99.6 | | |
| Other2 | | | 0.4 | | |
1Percentages indicated are based upon total investments (excluding Investments of Cash Collateral Received for Securities on Loan). The Fund's portfolio composition is subject to change.
2Includes investments in Money Market Funds.
Quality breakdown3
at April 30, 2012 (%)
3Percentages indicated are based upon total fixed income securities (excluding Money Market Funds).
Bond ratings apply to the underlying holdings of the Fund and not the Fund itself and are divided into categories ranging from AAA (highest) to D (lowest), and are subject to change. The ratings shown are determined by using the middle rating of Moody's, S&P, and Fitch after dropping the highest and lowest available ratings. When a rating from only two agencies is available, the lower rating is used. When a rating from only one agency is available, that rating is used. When a bond is not rated by one of these agencies, it is designated as Not rated. Credit ratings are subjective to opinions and not statements of fact.
The Board of Trustees for Columbia U.S. Treasury Index Fund has approved the change of the fund's fiscal year end from March 31 to April 30. As a result, this report covers the 13-month period since the last annual report. The next report you receive will be for the six-month period from May 1, 2012 through October 31, 2012.
For the 13-month period that ended April 30, 2012, the fund's Class A shares returned 9.52% without sales charge. The fund's benchmark, the Citigroup Bond U.S. Treasury Index, posted a total return of 9.97% over the same period. The fund incurs expenses while the index does not, and fees generally accounted for the difference between the fund's return and that of the index.
Treasuries rallied on Europe's woes and Fed policy
Treasury securities staged a healthy rally over most of the 13 months, primarily as risk-averse investors looked for the safest haven for their money. In the early weeks of the period, the investment environment was quiet, with interest rates showing little change as the market awaited the next monetary policy announcement by the U.S. Federal Reserve Board (the Fed). In June 2011, the Fed initiated a second round of quantitative easing (QE2), a program in which it purchases government securities in the open market in an effort to inject added financial liquidity into the economy. At the same time that QE2 helped move Treasury rates lower and prices higher, Treasuries received added and even more powerful support when global investors grew more risk-averse with the flare-up of sovereign debt problems in several European countries, most notably Greece. As European debt problems continued over the remaining months of the period and intensified late in the period, Treasury demand grew. Treasuries are regarded in global markets as the world's safest asset class. Even though domestic economic growth was slow, the United States was viewed as the furthest along in recovery among major economies. Not even the August 2011 downgrade of the credit rating for U.S. Treasuries by the Standard & Poor's credit rating service caused much of a blip in the dominant trend. Treasuries retained the reputation as the safest place for money in a time of uncertainty.
As interest rates declined and Treasury prices rallied, the strongest performance came from securities with maturities between five and 10 years. For example, the yield of the 10-year Treasury note fell from 3.43% to 2.16% from March 31, 2011 through March 31, 2012, hitting a low of 1.67% in October 2011. Over the same period, the yield on the 30-year bond declined from 4.50% to 3.27%.
Throughout the period, the fund's performance tracked that of the index. The fund's duration—which is a measure of price sensitivity to changes in interest rates—stayed in line with that of the index. The fund did not own any non-Treasury securities or derivatives.
Looking Ahead
We believe U.S. Treasury rates are likely to move even lower, giving further support to prices. Within the capital markets, the expectation is growing that the Fed will likely announce an additional round of quantitative easing, especially in light of continuing evidence of weak economic growth and little inflation. At the same time, the sovereign
4
Portfolio Manager's Report (continued) – Columbia U.S. Treasury Index Fund
debt problems in Europe appear to be deteriorating, while political turmoil on the continent increases. Worsening conditions in the European economy would cause further problems for the U.S. economy and give added impetus to arguments for more easing of monetary policy. U.S. Fed Chairman Ben Bernanke has signaled he wants to see interest rates move even lower to give more traction to the economic recovery.
Portfolio holdings and characteristics are subject to change periodically and may not be representative of current holdings and characteristics. The outlook for the fund may differ from that presented for other Columbia Funds.
The value of the fund may be affected by interest rate changes and the creditworthiness of issuers held in the fund. When interest rates go up, bond prices typically drop, and vice versa.
The fund is subject to indexing risk. Your investment in the fund will typically decline in value when its index declines. Since the fund is designed to track its index before fees and expenses, the fund cannot purchase other securities that may help offset declines in its index. In addition, because the fund may not hold all the issues included in its index, may not always be fully invested and bears advisory, administrative and other expenses and transaction costs in trading securities, the fund's performance may fail to match the performance of its index, after taking expenses into account. Security prices in a market, sector or industry may fall, reducing the value of your investment. Fund shares are not guaranteed or backed by the U.S. government or any agency.
5
Portfolio of Investments – Columbia U.S. Treasury Index Fund
April 30, 2012
(Percentages represent value of investments compared to net assets)
| Issuer | | Coupon
Rate | | Principal
Amount | | Value | |
| U.S. Treasury Obligations 99.2% | |
| U.S. Treasury | |
| 04/30/13 | | | 0.625 | % | | $ | 7,815,000 | | | $ | 7,847,362 | | |
| 07/31/13 | | | 0.375 | % | | | 1,695,000 | | | | 1,697,980 | | |
| 08/31/13 | | | 3.125 | % | | | 4,820,000 | | | | 5,004,514 | | |
| 10/15/13 | | | 0.500 | % | | | 5,545,000 | | | | 5,565,578 | | |
| 10/31/13 | | | 0.250 | % | | | 3,890,000 | | | | 3,890,607 | | |
| 11/15/13 | | | 0.500 | % | | | 12,495,000 | | | | 12,543,809 | | |
| 11/30/13 | | | 0.250 | % | | | 3,265,000 | | | | 3,265,127 | | |
| 12/31/13 | | | 0.125 | % | | | 1,290,000 | | | | 1,287,330 | | |
| 01/31/14 | | | 0.250 | % | | | 4,485,000 | | | | 4,485,175 | | |
| 02/28/14 | | | 1.875 | % | | | 13,500,000 | | | | 13,896,036 | | |
| 03/31/14 | | | 0.250 | % | | | 2,945,000 | | | | 2,944,540 | | |
| 04/30/14 | | | 1.875 | % | | | 4,650,000 | | | | 4,797,131 | | |
| 05/15/14 | | | 1.000 | % | | | 3,250,000 | | | | 3,296,719 | | |
| 06/30/14 | | | 2.625 | % | | | 6,935,000 | | | | 7,285,543 | | |
| 09/15/14 | | | 0.250 | % | | | 3,275,000 | | | | 3,269,884 | | |
| 09/30/14 | | | 2.375 | % | | | 4,350,000 | | | | 4,566,141 | | |
| 10/31/14 | | | 2.375 | % | | | 12,495,000 | | | | 13,124,636 | | |
| 01/31/15 | | | 2.250 | % | | | 2,455,000 | | | | 2,580,627 | | |
| 02/15/15 | | | 4.000 | % | | | 7,455,000 | | | | 8,201,081 | | |
| 02/15/15 | | | 11.250 | % | | | 5,400,000 | | | | 7,024,639 | | |
| 04/15/15 | | | 0.375 | % | | | 1,955,000 | | | | 1,954,695 | | |
| 05/31/15 | | | 2.125 | % | | | 9,100,000 | | | | 9,574,911 | | |
| 01/31/16 | | | 2.000 | % | | | 10,210,000 | | | | 10,757,991 | | |
| 05/15/16 | | | 7.250 | % | | | 4,790,000 | | | | 6,053,736 | | |
| 07/31/16 | | | 1.500 | % | | | 4,090,000 | | | | 4,233,150 | | |
| 08/31/16 | | | 1.000 | % | | | 3,180,000 | | | | 3,224,717 | | |
| 09/30/16 | | | 1.000 | % | | | 2,800,000 | | | | 2,837,845 | | |
| 10/31/16 | | | 1.000 | % | | | 2,305,000 | | | | 2,335,253 | | |
| 11/15/16 | | | 7.500 | % | | | 5,800,000 | | | | 7,552,690 | | |
| 11/30/16 | | | 0.875 | % | | | 2,030,000 | | | | 2,043,956 | | |
| 12/31/16 | | | 0.875 | % | | | 5,370,000 | | | | 5,401,887 | | |
| 12/31/16 | | | 3.250 | % | | | 2,275,000 | | | | 2,534,491 | | |
| 01/31/17 | | | 0.875 | % | | | 2,990,000 | | | | 3,005,883 | | |
| 03/31/17 | | | 1.000 | % | | | 2,455,000 | | | | 2,479,550 | | |
| 04/30/17 | | | 3.125 | % | | | 9,740,000 | | | | 10,832,711 | | |
| 08/31/17 | | | 1.875 | % | | | 5,420,000 | | | | 5,689,732 | | |
| 10/31/17 | | | 1.875 | % | | | 9,585,000 | | | | 10,054,512 | | |
| 09/30/18 | | | 1.375 | % | | | 2,100,000 | | | | 2,126,250 | | |
| 03/31/19 | | | 1.500 | % | | | 2,045,000 | | | | 2,072,800 | | |
| 02/15/20 | | | 3.625 | % | | | 2,470,000 | | | | 2,860,761 | | |
| 05/15/20 | | | 3.500 | % | | | 5,155,000 | | | | 5,923,822 | | |
| 05/15/21 | | | 3.125 | % | | | 2,035,000 | | | | 2,268,549 | | |
| 08/15/21 | | | 2.125 | % | | | 5,210,000 | | | | 5,343,506 | | |
| 11/15/21 | | | 2.000 | % | | | 4,300,000 | | | | 4,347,033 | | |
| 02/15/22 | | | 2.000 | % | | | 4,630,000 | | | | 4,664,725 | | |
| 08/15/22 | | | 7.250 | % | | | 2,265,000 | | | | 3,399,625 | | |
| 02/15/26 | | | 6.000 | % | | | 3,080,000 | | | | 4,381,780 | | |
| 08/15/27 | | | 6.375 | % | | | 420,000 | | | | 626,128 | | |
| 08/15/28 | | | 5.500 | % | | | 1,535,000 | | | | 2,129,093 | | |
| 02/15/37 | | | 4.750 | % | | | 1,665,000 | | | | 2,194,678 | | |
| Issuer | | Coupon
Rate | | Principal
Amount | | Value | |
| U.S. Treasury Obligations (continued) | |
| 05/15/37 | | | 5.000 | % | | $ | 1,045,000 | | | $ | 1,426,425 | | |
| 02/15/39 | | | 3.500 | % | | | 4,790,000 | | | | 5,200,144 | | |
| 08/15/39 | | | 4.500 | % | | | 2,575,000 | | | | 3,289,964 | | |
| 02/15/40 | | | 4.625 | % | | | 5,145,000 | | | | 6,702,165 | | |
| 11/15/40 | | | 4.250 | % | | | 1,840,000 | | | | 2,260,900 | | |
| 05/15/41 | | | 4.375 | % | | | 1,810,000 | | | | 2,270,136 | | |
| 08/15/41 | | | 3.750 | % | | | 2,995,000 | | | | 3,381,541 | | |
| 11/15/41 | | | 3.125 | % | | | 3,120,000 | | | | 3,129,750 | | |
| 02/15/42 | | | 3.125 | % | | | 3,085,000 | | | | 3,093,675 | | |
| U.S. Treasury(a) | |
| 05/31/13 | | | 0.500 | % | | | 7,450,000 | | | | 7,473,281 | | |
| 07/15/13 | | | 1.000 | % | | | 11,695,000 | | | | 11,802,360 | | |
| 08/15/13 | | | 4.250 | % | | | 2,700,000 | | | | 2,839,431 | | |
| 03/31/14 | | | 1.750 | % | | | 2,600,000 | | | | 2,673,835 | | |
| 06/15/14 | | | 0.750 | % | | | 975,000 | | | | 984,522 | | |
| 08/15/14 | | | 0.500 | % | | | 3,150,000 | | | | 3,163,781 | | |
| 11/15/14 | | | 0.375 | % | | | 1,235,000 | | | | 1,236,158 | | |
| 12/15/14 | | | 0.250 | % | | | 7,855,000 | | | | 7,835,363 | | |
| 02/15/15 | | | 0.250 | % | | | 5,595,000 | | | | 5,576,206 | | |
| 10/31/15 | | | 1.250 | % | | | 7,245,000 | | | | 7,432,348 | | |
| 11/30/15 | | | 1.375 | % | | | 11,825,000 | | | | 12,183,439 | | |
| 02/28/17 | | | 0.875 | % | | | 2,485,000 | | | | 2,497,037 | | |
| 02/15/18 | | | 3.500 | % | | | 8,565,000 | | | | 9,758,079 | | |
| 02/28/18 | | | 2.750 | % | | | 3,360,000 | | | | 3,690,225 | | |
| 05/15/18 | | | 3.875 | % | | | 5,410,000 | | | | 6,302,650 | | |
| 12/31/18 | | | 1.375 | % | | | 3,275,000 | | | | 3,306,469 | | |
| 02/28/19 | | | 1.375 | % | | | 3,540,000 | | | | 3,564,338 | | |
| 08/15/19 | | | 3.625 | % | | | 5,475,000 | | | | 6,337,740 | | |
| 11/15/19 | | | 3.375 | % | | | 7,910,000 | | | | 9,014,932 | | |
| 08/15/20 | | | 2.625 | % | | | 4,790,000 | | | | 5,170,206 | | |
| 02/15/21 | | | 3.625 | % | | | 7,260,000 | | | | 8,407,987 | | |
| 08/15/29 | | | 6.125 | % | | | 3,375,000 | | | | 5,021,366 | | |
| 05/15/38 | | | 4.500 | % | | | 2,295,000 | | | | 2,928,278 | | |
| 05/15/40 | | | 4.375 | % | | | 2,630,000 | | | | 3,296,952 | | |
| 02/15/41 | | | 4.750 | % | | | 3,355,000 | | | | 4,458,480 | | |
Total U.S. Treasury Obligations
(Cost: $396,344,117) | | $ | 417,191,082 | | |
| | | | | Shares | | Value | |
| Money Market Funds 0.4% | |
| Columbia Short-Term Cash Fund, 0.144%(b)(c) | | | | | 1,575,652 | | | | 1,575,652 | | |
Total Money Market Funds
(Cost: $1,575,652) | | | | | | $ | 1,575,652 | | |
Total Investments
(Cost: $397,919,769) | | | | | | $ | 418,766,734 | | |
| Other Assets & Liabilities, Net | | | | | | | 1,609,251 | | |
| Net Assets | | $ | 420,375,985 | | |
| Notes to Portfolio of Investments | |
(a) At April 30, 2012, security was partially or fully on loan.
(b) The rate shown is the seven-day current annualized yield at April 30, 2012.
(c) Investment in affiliates during the period ended April 30, 2012:
| Issuer | | Beginning
Cost | | Purchase
Cost | | Sales Cost/
Proceeds
from Sales | | Realized
Gain/Loss | | Ending
Cost | | Dividends
or Interest
Income | | Value | |
Columbia Short-Term
Cash Fund | | $ | 1,681,722 | | | $ | 9,074,292 | | | $ | (9,180,362 | ) | | $ | — | | | $ | 1,575,652 | | | $ | 139 | | | $ | 1,575,652 | | |
The Accompanying Notes to Financial Statements are an integral part of this statement.
6
Columbia U.S. Treasury Index Fund
April 30, 2012
| Notes to Portfolio of Investments (continued) | |
Investment in affiliates during the year ended March 31, 2012:
| Issuer | | Beginning
Cost | | Purchase
Cost | | Sales Cost/
Proceeds
from Sales | | Realized
Gain/Loss | | Ending
Cost | | Dividends
or Interest
Income | | Value | |
Columbia Short-Term
Cash Fund | | $ | — | | | $ | 77,330,222 | | | $ | (75,648,500 | ) | | $ | — | | | $ | 1,681,722 | | | $ | 1,394 | | | $ | 1,681,722 | | |
| Fair Value Measurements | |
Generally accepted accounting principles (GAAP) require disclosure regarding the inputs and valuation techniques used to measure fair value and any changes in valuation inputs or techniques. In addition, investments shall be disclosed by major category.
The Fund categorizes its fair value measurements according to a three-level hierarchy that maximizes the use of observable inputs and minimizes the use of unobservable inputs by prioritizing that the most observable input be used when available. Observable inputs are those that market participants would use in pricing an investment based on market data obtained from sources independent of the reporting entity. Unobservable inputs are those that reflect the Fund's assumptions about the information market participants would use in pricing an investment. An investment's level within the fair value hierarchy is based on the lowest level of any input that is deemed significant to the asset or liability's fair value measurement. The input levels are not necessarily an indication of the risk or liquidity associated with investments at that level. For example, certain U.S. government securities are generally high quality and liquid, however, they are reflected as Level 2 because the inputs used to determine fair value may not always be quoted prices in an active market.
Fair value inputs are summarized in the three broad levels listed below:
• Level 1 — Valuations based on quoted prices for investments in active markets that the Fund has the ability to access at the measurement date (including NAV for open-end mutual funds). Valuation adjustments are not applied to Level 1 investments.
• Level 2 — Valuations based on other significant observable inputs (including quoted prices for similar securities, interest rates, prepayment speeds, credit risks, etc.).
• Level 3 — Valuations based on significant unobservable inputs (including the Fund's own assumptions and judgment in determining the fair value of investments).
Inputs that are used in determining fair value of an investment may include price information, credit data, volatility statistics, and other factors. These inputs can be either observable or unobservable. The availability of observable inputs can vary between investments, and is affected by various factors such as the type of investment, and the volume and level of activity for that investment or similar investments in the marketplace. The inputs will be considered by the Investment Manager, along with any other relevant factors in the calculation of an investment's fair value. The Fund uses prices and inputs that are current as of the measurement date, which may include periods of market dislocations. During these periods, the availability of prices and inputs may be reduced for many investments. This condition could cause an investment to be reclassified between the various levels within the hierarchy.
Investments falling into the Level 3 category are primarily supported by quoted prices from brokers and dealers participating in the market for those investments. However, these may be classified as Level 3 investments due to lack of market transparency and corroboration to support these quoted prices. Additionally, valuation models may be used as the pricing source for any remaining investments classified as Level 3. These models rely on one or more significant unobservable inputs and/or significant assumptions by the Investment Manager. Inputs used in valuations may include, but are not limited to, financial statement analysis, capital account balances, discount rates and estimated cash flows, and comparable company data.
Under the direction of the Fund's Board of Trustees (the Board), the Investment Manager's Valuation Committee (the Committee) is responsible for carrying out the valuation procedures approved by the Board. The Committee consists of voting and non-voting members from various groups within the Investment Manager's organization, including operations and accounting, trading and investments, compliance, risk management and legal.
The Committee meets at least monthly to review and approve valuation matters, which may include a description of specific valuation determinations, data regarding pricing information received from approved pricing vendors and brokers and the results of Board-approved valuation control policies and procedures (the Policies). The Policies address, among other things, instances when market quotations are readily available, including recommendation of third party pricing vendors and a determination of appropriate pricing methodologies; events that require specific valuation determinations and assessment of fair value techniques; securities with a potential for stale pricing, including those that are illiquid, restricted, or in default; and the effectiveness of third-party pricing vendors, including periodic reviews of vendors. The Committee meets more frequently, as needed, to discuss additional valuation matters, which may include the need to review back-testing results, review time-sensitive information or approve related valuation actions. The Committee reports to the Board, with members of the Committee meeting with the Board at each of its regularly scheduled meetings to discuss valuation matters and actions during the period, similar to those described earlier.
The Accompanying Notes to Financial Statements are an integral part of this statement.
7
Columbia U.S. Treasury Index Fund
April 30, 2012
| Fair Value Measurements (continued) | |
For investments categorized as Level 3, the Committee monitors information similar to that described above, which may include: (i) data specific to the issuer or comparable issuers, (ii) general market or specific sector news and (iii) quoted prices and specific or similar security transactions. The Committee considers this data and any changes from prior periods in order to assess the reasonableness of observable and unobservable inputs, any assumptions or internal models used to value those securities and changes in fair value. This data is also used to corroborate, when available, information received from approved pricing vendors and brokers. Various factors impact the frequency of monitoring this information (which may occur as often as daily). However, the Committee may determine that changes to inputs, assumptions and models are not required as a result of the monitoring procedures performed.
The following table is a summary of the inputs used to value the Fund's investments as of April 30, 2012:
| | | Fair Value at April 30, 2012 | |
| Description | | Level 1
Quoted Prices
in Active
Markets for
Identical Assets | | Level 2
Other
Significant
Observable
Inputs | | Level 3
Significant
Unobservable
Inputs | | Total | |
| Bonds | |
| U.S. Treasury Obligations | | $ | 417,191,082 | | | $ | — | | | $ | — | | | $ | 417,191,082 | | |
| Total Bonds | | | 417,191,082 | | | | — | | | | — | | | | 417,191,082 | | |
| Other | |
| Money Market Funds | | | 1,575,652 | | | | — | | | | — | | | | 1,575,652 | | |
| Total Other | | | 1,575,652 | | | | — | | | | — | | | | 1,575,652 | | |
| Total | | $ | 418,766,734 | | | $ | — | | | $ | — | | | $ | 418,766,734 | | |
See the Portfolio of Investments for all investment classifications not indicated in the table.
The Fund's assets assigned to the Level 2 input category are generally valued using the market approach, in which a security's value is determined through reference to prices and information from market transactions for similar or identical assets.
There were no significant transfers between Levels 1 and 2 during the period from April 1, 2012 to April 30, 2012.
The following table is a summary of the inputs used to value the Fund's investments as of March 31, 2012:
| | | Fair Value at March 31, 2012 | |
| Description | | Level 1
Quoted Prices
in Active
Markets for
Identical Assets | | Level 2
Other
Significant
Observable
Inputs | | Level 3
Significant
Unobservable
Inputs | | Total | |
| Bonds | |
| U.S. Treasury Obligations | | $ | 408,203,529 | | | $ | — | | | $ | — | | | $ | 408,203,529 | | |
| Total Bonds | | | 408,203,529 | | | | — | | | | — | | | | 408,203,529 | | |
| Other | |
| Money Market Funds | | | 1,681,722 | | | | — | | | | — | | | | 1,681,722 | | |
| Investments of Cash Collateral Received for Securities on Loan | | | — | | | | 5,928,711 | | | | — | | | | 5,928,711 | | |
| Total Other | | | 1,681,722 | | | | 5,928,711 | | | | — | | | | 7,610,433 | | |
| Total | | $ | 409,885,251 | | | $ | 5,928,711 | | | $ | — | | | $ | 415,813,962 | | |
The Fund's assets assigned to the Level 2 input category are generally valued using the market approach, in which a security's value is determined through reference to prices and information from market transactions for similar or identical assets.
There were no significant transfers between Levels 1 and 2 during the period from April 1, 2011 to March 31, 2012.
The Accompanying Notes to Financial Statements are an integral part of this statement.
8
Statement of Assets and Liabilities – Columbia U.S. Treasury Index Fund
| | | April 30,
2012 | | March 31,
2012 | |
| Assets | |
| Investments, at value* | |
| Unaffiliated issuers (identified cost $396,344,117 and $392,351,725) | | $ | 417,191,082 | | | $ | 408,203,529 | | |
| Affiliated issuers (identified cost $1,575,652 and $1,681,722) | | | 1,575,652 | | | | 1,681,722 | | |
| Investment of cash collateral received for securities on loan | |
| Repurchase agreements (identified cost $0 and $5,928,711) | | | — | | | | 5,928,711 | | |
| Total investments (identified cost $397,919,769 and $399,962,158) | | | 418,766,734 | | | | 415,813,962 | | |
| Receivable for: | |
| Investments sold | | | 22,189,439 | | | | 13,116,438 | | |
| Capital shares sold | | | 938,094 | | | | 943,305 | | |
| Dividends | | | 133 | | | | 129 | | |
| Interest | | | 2,430,522 | | | | 2,420,787 | | |
| Expense reimbursement due from Investment Manager | | | 7,081 | | | | 2,278 | | |
| Trustees' deferred compensation plan | | | 29,218 | | | | 29,218 | | |
| Total assets | | | 444,361,221 | | | | 432,326,117 | | |
| Liabilities | |
| Disbursements in excess of cash | | | 63 | | | | — | | |
| Due upon return of securities on loan | | | — | | | | 5,928,711 | | |
| Payable for: | |
| Investments purchased | | | 23,110,632 | | | | 14,601,495 | | |
| Capital shares purchased | | | 333,303 | | | | 171,289 | | |
| Dividend distributions to shareholders | | | 495,060 | | | | 509,689 | | |
| Investment management fees | | | 3,436 | | | | 1,122 | | |
| Distribution and service fees | | | 1,938 | | | | 670 | | |
| Administration fees | | | 10,307 | | | | 3,365 | | |
| Compensation of board members | | | 1,130 | | | | 3,333 | | |
| Other expenses | | | 149 | | | | 268 | | |
| Trustees' deferred compensation plan | | | 29,218 | | | | 29,218 | | |
| Total liabilities | | | 23,985,236 | | | | 21,249,160 | | |
| Net assets applicable to outstanding capital stock | | $ | 420,375,985 | | | $ | 411,076,957 | | |
The Accompanying Notes to Financial Statements are an integral part of this statement.
9
Statement of Assets and Liabilities (continued) – Columbia U.S. Treasury Index Fund
| | | April 30,
2012 | | March 31,
2012 | |
| Represented by | |
| Paid-in capital | | $ | 392,739,317 | | | $ | 388,763,645 | | |
| Excess of distributions over net investment income | | | (202,847 | ) | | | (263,057 | ) | |
| Accumulated net realized gain | | | 6,992,550 | | | | 6,724,565 | | |
| Unrealized appreciation (depreciation) on: | |
| Investments | | | 20,846,965 | | | | 15,851,804 | | |
Total — representing net assets
applicable to outstanding capital stock | | $ | 420,375,985 | | | $ | 411,076,957 | | |
| *Value of securities on loan | | $ | 89,555,342 | | | $ | 110,164,251 | | |
| Net assets applicable to outstanding shares | |
| Class A | | $ | 42,700,328 | | | $ | 43,818,276 | | |
| Class B | | $ | 3,102,348 | | | $ | 3,143,287 | | |
| Class C | | $ | 11,628,096 | | | $ | 12,172,373 | | |
| Class I | | $ | 91,092,421 | | | $ | 84,898,972 | | |
| Class Z | | $ | 271,852,792 | | | $ | 267,044,049 | | |
| Shares outstanding | |
| Class A | | | 3,637,795 | | | | 3,780,762 | | |
| Class B | | | 264,333 | | | | 271,243 | | |
| Class C | | | 990,777 | | | | 1,050,392 | | |
| Class I | | | 7,761,129 | | | | 7,326,044 | | |
| Class Z | | | 23,160,641 | | | | 23,042,383 | | |
| Net asset value per share | |
| Class A(a) | | $ | 11.74 | | | $ | 11.59 | | |
| Class B | | $ | 11.74 | | | $ | 11.59 | | |
| Class C | | $ | 11.74 | | | $ | 11.59 | | |
| Class I | | $ | 11.74 | | | $ | 11.59 | | |
| Class Z | | $ | 11.74 | | | $ | 11.59 | | |
(a) At April 30, 2012 and March 31, 2012, the maximum offering price per share for Class A is $12.33 and 12.17. The offering price is calculated by dividing the net asset value by 1.0 minus the maximum sales charge of 4.75%.
The Accompanying Notes to Financial Statements are an integral part of this statement.
10
Statement of Operations – Columbia U.S. Treasury Index Fund
| Year ended | | April 30,
2012(a) | | March 31,
2012 | |
| Net investment income | |
| Income: | |
| Interest | | $ | 611,613 | | | $ | 8,527,577 | | |
| Dividends from affiliates | | | 139 | | | | 1,394 | | |
| Income from securities lending — net | | | 5,963 | | | | 106,613 | | |
| Total income | | | 617,715 | | | | 8,635,584 | | |
| Expenses: | |
| Investment management fees | | | 35,300 | | | | 429,804 | | |
| Distribution fees | |
| Class B | | | 1,989 | | | | 27,017 | | |
| Class C | | | 7,470 | | | | 95,403 | | |
| Service fees | |
| Class A | | | 9,200 | | | | 113,178 | | |
| Class B | | | 663 | | | | 9,006 | | |
| Class C | | | 2,490 | | | | 31,847 | | |
| Administration fees | | | 105,899 | | | | 1,289,412 | | |
| Compensation of board members | | | 2,300 | | | | 34,256 | | |
| Line of credit interest expense | | | — | | | | 58 | | |
| Other | | | 68 | | | | 2,693 | | |
| Total expenses | | | 165,379 | | | | 2,032,674 | | |
Fees waived or expenses reimbursed by
Investment Manager and its affiliates | | | (72,774 | ) | | | (897,060 | ) | |
| Fees waived by Distributor — Class C | | | (1,494 | ) | | | (18,969 | ) | |
| Expense reductions | | | — | | | | (2,020 | ) | |
| Total net expenses | | | 91,111 | | | | 1,114,625 | | |
| Net investment income | | | 526,604 | | | | 7,520,959 | | |
| Realized and unrealized gain (loss) — net | |
| Net realized gain (loss) on: | |
| Investments | | | 296,821 | | | | 12,955,198 | | |
| Net realized gain | | | 296,821 | | | | 12,955,198 | | |
| Net change in unrealized appreciation (depreciation) on: | |
| Investments | | | 4,995,161 | | | | 11,951,598 | | |
| Net change in unrealized appreciation | | | 4,995,161 | | | | 11,951,598 | | |
| Net realized and unrealized gain | | | 5,291,982 | | | | 24,906,796 | | |
| Net increase in net assets resulting from operations | | $ | 5,818,586 | | | $ | 32,427,755 | | |
(a) For the period from April 1, 2012 to April 30, 2012. During the period, the Fund's fiscal year end was changed from March 31 to April 30.
The Accompanying Notes to Financial Statements are an integral part of this statement.
11
Statement of Changes in Net Assets – Columbia U.S. Treasury Index Fund
| Year ended | | April 30,
2012(a) | | March 31,
2012 | | March 31,
2011(b) | |
| Operations | |
| Net investment income | | $ | 526,604 | | | $ | 7,520,959 | | | $ | 8,346,452 | | |
| Net realized gain | | | 296,821 | | | | 12,955,198 | | | | 10,420,614 | | |
Net change in unrealized
appreciation (depreciation) | | | 4,995,161 | | | | 11,951,598 | | | | (3,380,514 | ) | |
Net increase in net
assets resulting from operations | | | 5,818,586 | | | | 32,427,755 | | | | 15,386,552 | | |
| Distributions to shareholders from: | |
| Net investment income | |
| Class A | | | (44,630 | ) | | | (732,513 | ) | | | (1,091,659 | ) | |
| Class B | | | (1,300 | ) | | | (31,622 | ) | | | (82,966 | ) | |
| Class C | | | (6,348 | ) | | | (130,624 | ) | | | (312,898 | ) | |
| Class I | | | (109,660 | ) | | | (2,202,940 | ) | | | (916,235 | ) | |
| Class Z | | | (333,292 | ) | | | (4,701,750 | ) | | | (7,417,445 | ) | |
| Net realized gains | |
| Class A | | | — | | | | (573,811 | ) | | | (1,058,188 | ) | |
| Class B | | | — | | | | (40,465 | ) | | | (115,280 | ) | |
| Class C | | | — | | | | (148,817 | ) | | | (399,889 | ) | |
| Class I | | | — | | | | (1,627,318 | ) | | | (55 | ) | |
| Class Z | | | — | | | | (2,779,164 | ) | | | (6,977,073 | ) | |
| Total distributions to shareholders | | | (495,230 | ) | | | (12,969,024 | ) | | | (18,371,688 | ) | |
Increase (decrease) in net
assets from share transactions | | | 3,975,672 | | | | (31,467,168 | ) | | | 51,609,392 | | |
Total increase (decrease)
in net assets | | | 9,299,028 | | | | (12,008,437 | ) | | | 48,624,256 | | |
| Net assets at beginning of year | | | 411,076,957 | | | | 423,085,394 | | | | 374,461,138 | | |
| Net assets at end of year | | $ | 420,375,985 | | | $ | 411,076,957 | | | $ | 423,085,394 | | |
Excess of distributions over net
investment income | | $ | (202,847 | ) | | $ | (263,057 | ) | | $ | (764,567 | ) | |
(a) For the period from April 1, 2012 to April 30, 2012. During the period, the Fund's fiscal year end was changed from March 31 to April 30.
(b) Class I shares are for the period from September 27, 2010 (commencement of operations) to March 31, 2011
The Accompanying Notes to Financial Statements are an integral part of this statement.
12
Statement of Changes in Net Assets (continued) – Columbia U.S. Treasury Index Fund
| Year ended | | April 30, 2012(a) | | March 31, 2012 | | March 31, 2011(b) | |
| | | Shares | | Dollars ($) | | Shares | | Dollars ($) | | Shares | | Dollars ($) | |
| Capital stock activity | |
| Class A shares | |
| Subscriptions(c) | | | 300,992 | | | | 3,516,633 | | | | 3,930,358 | | | | 46,162,728 | | | | 2,069,013 | | | | 23,492,987 | | |
| Distributions reinvested | | | 3,065 | | | | 35,984 | | | | 75,102 | | | | 871,731 | | | | 124,582 | | | | 1,412,024 | | |
| Redemptions | | | (447,024 | ) | | | (5,222,021 | ) | | | (4,009,044 | ) | | | (46,709,099 | ) | | | (2,647,070 | ) | | | (30,099,461 | ) | |
| Net decrease | | | (142,967 | ) | | | (1,669,404 | ) | | | (3,584 | ) | | | 325,360 | | | | (453,475 | ) | | | (5,194,450 | ) | |
| Class B shares | |
| Subscriptions | | | 35 | | | | 409 | | | | 18,713 | | | | 219,770 | | | | 37,879 | | | | 433,067 | | |
| Distributions reinvested | | | 68 | | | | 792 | | | | 3,831 | | | | 44,359 | | | | 11,772 | | | | 133,337 | | |
| Redemptions(c) | | | (7,013 | ) | | | (82,020 | ) | | | (118,754 | ) | | | (1,362,518 | ) | | | (204,886 | ) | | | (2,315,670 | ) | |
| Net decrease | | | (6,910 | ) | | | (80,819 | ) | | | (96,210 | ) | | | (1,098,389 | ) | | | (155,235 | ) | | | (1,749,266 | ) | |
| Class C shares | |
| Subscriptions | | | 5,945 | | | | 69,697 | | | | 277,863 | | | | 3,216,400 | | | | 165,289 | | | | 1,884,048 | | |
| Distributions reinvested | | | 484 | | | | 5,681 | | | | 20,792 | | | | 241,002 | | | | 48,066 | | | | 544,129 | | |
| Redemptions | | | (66,044 | ) | | | (767,304 | ) | | | (439,808 | ) | | | (5,048,096 | ) | | | (782,293 | ) | | | (8,852,655 | ) | |
| Net decrease | | | (59,615 | ) | | | (691,926 | ) | | | (141,153 | ) | | | (1,590,694 | ) | | | (568,938 | ) | | | (6,424,478 | ) | |
| Class I shares | |
| Subscriptions | | | 718,717 | | | | 8,364,941 | | | | 10,307,754 | | | | 120,616,255 | | | | 11,553,981 | | | | 128,323,763 | | |
| Distributions reinvested | | | 9,339 | | | | 109,641 | | | | 329,188 | | | | 3,814,763 | | | | 82,788 | | | | 916,222 | | |
| Redemptions | | | (292,971 | ) | | | (3,433,000 | ) | | | (14,469,590 | ) | | | (167,594,515 | ) | | | (478,077 | ) | | | (5,278,910 | ) | |
| Net increase (decrease) | | | 435,085 | | | | 5,041,582 | | | | (3,832,648 | ) | | | (43,163,497 | ) | | | 11,158,692 | | | | 123,961,075 | | |
| Class Z shares | |
| Subscriptions | | | 430,975 | | | | 5,028,910 | | | | 6,001,317 | | | | 69,964,138 | | | | 5,771,599 | | | | 65,893,139 | | |
| Distributions reinvested | | | 14,425 | | | | 169,347 | | | | 351,848 | | | | 4,073,813 | | | | 674,373 | | | | 7,642,007 | | |
| Redemptions | | | (327,142 | ) | | | (3,822,018 | ) | | | (5,168,081 | ) | | | (59,977,899 | ) | | | (11,757,882 | ) | | | (132,518,635 | ) | |
| Net increase (decrease) | | | 118,258 | | | | 1,376,239 | | | | 1,185,084 | | | | 14,060,052 | | | | (5,311,910 | ) | | | (58,983,489 | ) | |
| Total net increase (decrease) | | | 343,851 | | | | 3,975,672 | | | | (2,888,511 | ) | | | (31,467,168 | ) | | | 4,669,134 | | | | 51,609,392 | | |
(a) For the period from April 1, 2012 to April 30, 2012. During the period, the Fund's fiscal year end was changed from March 31 to April 30.
(b) Class I shares are for the period from September 27, 2010 (commencement of operations) to March 31, 2011.
(c) Includes conversions of Class B shares to Class A shares, if any.
The Accompanying Notes to Financial Statements are an integral part of this statement.
13
Financial Highlights – Columbia U.S. Treasury Index Fund
The following tables are intended to help you understand the Fund's financial performance. Certain information reflects financial results for a single share of a class held for the periods shown. Per share net investment income (loss) amounts are calculated based on average shares outstanding during the period. Total returns assume reinvestment of all dividends and distributions. Total returns do not reflect payments of sales charges, if any, and are not annualized for periods of less than one year.
| | | Year ended
April 30, | | Year ended March 31, | |
| | | 2012(a) | | 2012 | | 2011 | | 2010 | | 2009 | | 2008 | |
| Class A | |
| Per share data | |
| Net asset value, beginning of period | | $ | 11.59 | | | $ | 11.03 | | | $ | 11.12 | | | $ | 11.64 | | | $ | 11.27 | | | $ | 10.53 | | |
| Income from investment operations: | |
| Net investment income | | | 0.01 | | | | 0.18 | | | | 0.23 | | | | 0.27 | | | | 0.33 | | | | 0.43 | | |
| Net realized and unrealized gain (loss) | | | 0.15 | | | | 0.70 | | | | 0.22 | | | | (0.45 | ) | | | 0.45 | | | | 0.78 | | |
| Total from investment operations | | | 0.16 | | | | 0.88 | | | | 0.45 | | | | (0.18 | ) | | | 0.78 | | | | 1.21 | | |
| Less distributions to shareholders from: | |
| Net investment income | | | (0.01 | ) | | | (0.19 | ) | | | (0.27 | ) | | | (0.34 | ) | | | (0.41 | ) | | | (0.47 | ) | |
| Net realized gains | | | — | | | | (0.13 | ) | | | (0.27 | ) | | | (0.00 | )(b) | | | — | | | | — | | |
| Total distributions to shareholders | | | (0.01 | ) | | | (0.32 | ) | | | (0.54 | ) | | | (0.34 | ) | | | (0.41 | ) | | | (0.47 | ) | |
| Net asset value, end of period | | $ | 11.74 | | | $ | 11.59 | | | $ | 11.03 | | | $ | 11.12 | | | $ | 11.64 | | | $ | 11.27 | | |
| Total return | | | 1.40 | % | | | 8.01 | % | | | 4.04 | % | | | (1.53 | %) | | | 7.13 | % | | | 11.77 | %(c) | |
| Ratios to average net assets(d) | |
Expenses prior to fees waived or expenses reimbursed
(including interest expense) | | | 0.66 | %(e) | | | 0.66 | %(f) | | | 0.66 | %(f) | | | 0.66 | %(f) | | | 0.66 | %(f) | | | 0.66 | %(f) | |
Net expenses after fees waived or expenses reimbursed
(including interest expense)(g) | | | 0.45 | %(e) | | | 0.45 | %(f)(h) | | | 0.45 | %(f) | | | 0.48 | %(f) | | | 0.55 | %(f)(h) | | | 0.57 | %(f)(h) | |
Expenses prior to fees waived or expenses reimbursed
(excluding interest expense) | | | 0.66 | %(e) | | | 0.66 | % | | | 0.66 | % | | | 0.66 | % | | | 0.66 | % | | | 0.66 | % | |
Net expenses after fees waived or expenses reimbursed
(excluding interest expense)(g) | | | 0.45 | %(e) | | | 0.45 | %(h) | | | 0.45 | % | | | 0.48 | % | | | 0.55 | %(h) | | | 0.57 | %(h) | |
| Net investment income | | | 1.30 | %(e) | | | 1.55 | %(h) | | | 2.04 | % | | | 2.44 | % | | | 2.91 | %(h) | | | 3.94 | %(h) | |
| Supplemental data | |
| Net assets, end of period (in thousands) | | $ | 42,700 | | | $ | 43,818 | | | $ | 41,739 | | | $ | 47,105 | | | $ | 79,114 | | | $ | 17,817 | | |
| Portfolio turnover | | | 7 | % | | | 106 | % | | | 142 | % | | | 118 | % | | | 126 | % | | | 47 | % | |
| Notes to Financial Highlights | |
(a) For the period from April 1, 2012 to April 30, 2012. During the period, the Fund's fiscal year end was changed from March 31 to April 30.
(b) Rounds to less than $0.01.
(c) During the year ended March 31, 2008, the Investment Manager reimbursed the Fund for a loss on a trading error. Had the Fund not received this reimbursement, total return would have been lower by less than 0.01%.
(d) In addition to the fees and expenses which the Fund bears directly, the Fund indirectly bears a pro rata share of the fees and expenses of the acquired funds in which it invests. Such indirect expenses are not included in the reported expense ratios.
(e) Annualized.
(f) Includes interest expense which rounds to less than 0.01%.
(g) The Investment Manager and certain of its affiliates agreed to waive/reimburse certain fees and expenses, if applicable.
(h) The benefits derived from expense reductions had an impact of less than 0.01%.
The Accompanying Notes to Financial Statements are an integral part of this statement.
14
Financial Highlights (continued) – Columbia U.S. Treasury Index Fund
| | | Year ended
April 30, | | Year ended March 31, | |
| | | 2012(a) | | 2012 | | 2011 | | 2010 | | 2009 | | 2008 | |
| Class B | |
| Per share data | |
| Net asset value, beginning of period | | $ | 11.59 | | | $ | 11.03 | | | $ | 11.12 | | | $ | 11.64 | | | $ | 11.27 | | | $ | 10.53 | | |
| Income from investment operations: | |
| Net investment income | | | 0.01 | | | | 0.10 | | | | 0.15 | | | | 0.19 | | | | 0.25 | | | | 0.35 | | |
| Net realized and unrealized gain (loss) | | | 0.14 | | | | 0.69 | | | | 0.22 | | | | (0.45 | ) | | | 0.45 | | | | 0.78 | | |
| Total from investment operations | | | 0.15 | | | | 0.79 | | | | 0.37 | | | | (0.26 | ) | | | 0.70 | | | | 1.13 | | |
| Less distributions to shareholders from: | |
| Net investment income | | | (0.00 | )(b) | | | (0.10 | ) | | | (0.19 | ) | | | (0.26 | ) | | | (0.33 | ) | | | (0.39 | ) | |
| Net realized gains | | | — | | | | (0.13 | ) | | | (0.27 | ) | | | (0.00 | )(b) | | | — | | | | — | | |
| Total distributions to shareholders | | | (0.00 | )(b) | | | (0.23 | ) | | | (0.46 | ) | | | (0.26 | ) | | | (0.33 | ) | | | (0.39 | ) | |
| Net asset value, end of period | | $ | 11.74 | | | $ | 11.59 | | | $ | 11.03 | | | $ | 11.12 | | | $ | 11.64 | | | $ | 11.27 | | |
| Total return | | | 1.34 | % | | | 7.21 | % | | | 3.27 | % | | | (2.26 | %) | | | 6.32 | % | | | 10.95 | %(c) | |
| Ratios to average net assets(d) | |
Expenses prior to fees waived or expenses reimbursed
(including interest expense) | | | 1.41 | %(e) | | | 1.41 | %(f) | | | 1.41 | %(f) | | | 1.41 | %(f) | | | 1.41 | %(f) | | | 1.41 | %(f) | |
Net expenses after fees waived or expenses reimbursed
(including interest expense)(g) | | | 1.20 | %(e) | | | 1.20 | %(f)(h) | | | 1.20 | %(f) | | | 1.23 | %(f) | | | 1.30 | %(f)(h) | | | 1.32 | %(f)(h) | |
Expenses prior to fees waived or expenses reimbursed
(excluding interest expense) | | | 1.41 | %(e) | | | 1.41 | % | | | 1.41 | % | | | 1.41 | % | | | 1.41 | % | | | 1.41 | % | |
Net expenses after fees waived or expenses reimbursed
(excluding interest expense)(g) | | | 1.20 | %(e) | | | 1.20 | %(h) | | | 1.20 | % | | | 1.23 | % | | | 1.30 | %(h) | | | 1.32 | %(h) | |
| Net investment income | | | 0.55 | %(e) | | | 0.83 | %(h) | | | 1.29 | % | | | 1.69 | % | | | 2.19 | %(h) | | | 3.25 | %(h) | |
| Supplemental data | |
| Net assets, end of period (in thousands) | | $ | 3,102 | | | $ | 3,143 | | | $ | 4,053 | | | $ | 5,810 | | | $ | 10,179 | | | $ | 3,610 | | |
| Portfolio turnover | | | 7 | % | | | 106 | % | | | 142 | % | | | 118 | % | | | 126 | % | | | 47 | % | |
| Notes to Financial Highlights | |
(a) For the period from April 1, 2012 to April 30, 2012. During the period, the Fund's fiscal year end was changed from March 31 to April 30.
(b) Rounds to less than $0.01.
(c) During the year ended March 31, 2008, the Investment Manager reimbursed the Fund for a loss on a trading error. Had the Fund not received this reimbursement, total return would have been lower by less than 0.01%.
(d) In addition to the fees and expenses which the Fund bears directly, the Fund indirectly bears a pro rata share of the fees and expenses of the acquired funds in which it invests. Such indirect expenses are not included in the reported expense ratios.
(e) Annualized.
(f) Includes interest expense which rounds to less than 0.01%.
(g) The Investment Manager and certain of its affiliates agreed to waive/reimburse certain fees and expenses, if applicable.
(h) The benefits derived from expense reductions had an impact of less than 0.01%.
The Accompanying Notes to Financial Statements are an integral part of this statement.
15
Financial Highlights (continued) – Columbia U.S. Treasury Index Fund
| | | Year ended
April 30, | | Year ended March 31, | |
| | | 2012(a) | | 2012 | | 2011 | | 2010 | | 2009 | | 2008 | |
| Class C | |
| Per share data | |
| Net asset value, beginning of period | | $ | 11.59 | | | $ | 11.03 | | | $ | 11.12 | | | $ | 11.64 | | | $ | 11.27 | | | $ | 10.53 | | |
| Income from investment operations: | |
| Net investment income | | | 0.01 | | | | 0.11 | | | | 0.16 | | | | 0.21 | | | | 0.26 | | | | 0.36 | | |
| Net realized and unrealized gain (loss) | | | 0.15 | | | | 0.70 | | | | 0.23 | | | | (0.46 | ) | | | 0.45 | | | | 0.78 | | |
| Total from investment operations | | | 0.16 | | | | 0.81 | | | | 0.39 | | | | (0.25 | ) | | | 0.71 | | | | 1.14 | | |
| Less distributions to shareholders from: | |
| Net investment income | | | (0.01 | ) | | | (0.12 | ) | | | (0.21 | ) | | | (0.27 | ) | | | (0.34 | ) | | | (0.40 | ) | |
| Net realized gains | | | — | | | | (0.13 | ) | | | (0.27 | ) | | | (0.00 | )(b) | | | — | | | | — | | |
| Total distributions to shareholders | | | (0.01 | ) | | | (0.25 | ) | | | (0.48 | ) | | | (0.27 | ) | | | (0.34 | ) | | | (0.40 | ) | |
| Net asset value, end of period | | $ | 11.74 | | | $ | 11.59 | | | $ | 11.03 | | | $ | 11.12 | | | $ | 11.64 | | | $ | 11.27 | | |
| Total return | | | 1.35 | % | | | 7.37 | % | | | 3.42 | % | | | (2.12 | %) | | | 6.48 | % | | | 11.09 | %(c) | |
| Ratios to average net assets(d) | |
Expenses prior to fees waived or expenses reimbursed
(including interest expense) | | | 1.41 | %(e) | | | 1.41 | %(f) | | | 1.41 | %(f) | | | 1.41 | %(f) | | | 1.41 | %(f) | | | 1.41 | %(f) | |
Net expenses after fees waived or expenses reimbursed
(including interest expense)(g) | | | 1.05 | %(e) | | | 1.05 | %(f)(h) | | | 1.05 | %(f) | | | 1.08 | %(f) | | | 1.15 | %(f)(h) | | | 1.17 | %(f)(h) | |
Expenses prior to fees waived or expenses reimbursed
(excluding interest expense) | | | 1.41 | %(e) | | | 1.41 | % | | | 1.41 | % | | | 1.41 | % | | | 1.41 | % | | | 1.41 | % | |
Net expenses after fees waived or expenses reimbursed
(excluding interest expense)(g) | | | 1.05 | %(e) | | | 1.05 | %(h) | | | 1.05 | % | | | 1.08 | % | | | 1.15 | %(h) | | | 1.17 | %(h) | |
| Net investment income | | | 0.70 | %(e) | | | 0.98 | %(h) | | | 1.44 | % | | | 1.83 | % | | | 2.28 | %(h) | | | 3.30 | %(h) | |
| Supplemental data | |
| Net assets, end of period (in thousands) | | $ | 11,628 | | | $ | 12,172 | | | $ | 13,142 | | | $ | 19,568 | | | $ | 32,440 | | | $ | 6,702 | | |
| Portfolio turnover | | | 7 | % | | | 106 | % | | | 142 | % | | | 118 | % | | | 126 | % | | | 47 | % | |
| Notes to Financial Highlights | |
(a) For the period from April 1, 2012 to April 30, 2012. During the period, the Fund's fiscal year end was changed from March 31 to April 30.
(b) Rounds to less than $0.01.
(c) During the year ended March 31, 2008, the Investment Manager reimbursed the Fund for a loss on a trading error. Had the Fund not received this reimbursement, total return would have been lower by less than 0.01%.
(d) In addition to the fees and expenses which the Fund bears directly, the Fund indirectly bears a pro rata share of the fees and expenses of the acquired funds in which it invests. Such indirect expenses are not included in the reported expense ratios.
(e) Annualized.
(f) Includes interest expense which rounds to less than 0.01%.
(g) The Investment Manager and certain of its affiliates agreed to waive/reimburse certain fees and expenses, if applicable.
(h) The benefits derived from expense reductions had an impact of less than 0.01%.
The Accompanying Notes to Financial Statements are an integral part of this statement.
16
Financial Highlights (continued) – Columbia U.S. Treasury Index Fund
| | | Year ended
April 30, | | Year ended March 31, | |
| | | 2012(a) | | 2012 | | 2011(b) | |
| Class I | |
| Per share data | |
| Net asset value, beginning of period | | $ | 11.59 | | | $ | 11.03 | | | $ | 11.76 | | |
| Income from investment operations: | |
| Net investment income | | | 0.02 | | | | 0.21 | | | | 0.11 | | |
| Net realized and unrealized gain (loss) | | | 0.14 | | | | 0.70 | | | | (0.43 | ) | |
| Total from investment operations | | | 0.16 | | | | 0.91 | | | | (0.32 | ) | |
| Less distributions to shareholders from: | |
| Net investment income | | | (0.01 | ) | | | (0.22 | ) | | | (0.15 | ) | |
| Net realized gains | | | — | | | | (0.13 | ) | | | (0.26 | ) | |
| Total distributions to shareholders | | | (0.01 | ) | | | (0.35 | ) | | | (0.41 | ) | |
| Net asset value, end of period | | $ | 11.74 | | | $ | 11.59 | | | $ | 11.03 | | |
| Total return | | | 1.42 | % | | | 8.29 | % | | | (2.78 | %) | |
| Ratios to average net assets(c) | |
| Expenses prior to fees waived or expenses reimbursed (including interest expense) | | | 0.41 | %(d) | | | 0.41 | %(e) | | | 0.41 | %(d)(e) | |
| Net expenses after fees waived or expenses reimbursed (including interest expense)(f) | | | 0.20 | %(d) | | | 0.20 | %(e) | | | 0.20 | %(d)(e) | |
| Expenses prior to fees waived or expenses reimbursed (excluding interest expense) | | | 0.41 | %(d) | | | 0.41 | % | | | 0.41 | %(d) | |
| Net expenses after fees waived or expenses reimbursed (excluding interest expense)(f) | | | 0.20 | %(d) | | | 0.20 | % | | | 0.20 | %(d) | |
| Net investment income | | | 1.55 | %(d) | | | 1.81 | % | | | 1.96 | %(d) | |
| Supplemental data | |
| Net assets, end of period (in thousands) | | $ | 91,092 | | | $ | 84,899 | | | $ | 123,074 | | |
| Portfolio turnover | | | 7 | % | | | 106 | % | | | 142 | % | |
| Notes to Financial Highlights | |
(a) For the period from April 1, 2012 to April 30, 2012. During the period the Fund's fiscal year end changed from March 31 to April 30.
(b) For the period from September 27, 2010 (commencement of operations) to March 31, 2011.
(c) In addition to the fees and expenses which the Fund bears directly, the Fund indirectly bears a pro rata share of the fees and expenses of the acquired funds in which it invests. Such indirect expenses are not included in the reported expense ratios.
(d) Annualized.
(e) Includes interest expense which rounds to less than 0.01%.
(f) The Investment Manager and certain of its affiliates agreed to waive/reimburse certain fees and expenses, if applicable.
The Accompanying Notes to Financial Statements are an integral part of this statement.
17
Financial Highlights (continued) – Columbia U.S. Treasury Index Fund
| | | Year ended
April 30, | | Year ended March 31, | |
| | | 2012(a) | | 2012 | | 2011 | | 2010 | | 2009 | | 2008 | |
| Class Z | |
| Per share data | |
| Net asset value, beginning of period | | $ | 11.59 | | | $ | 11.03 | | | $ | 11.11 | | | $ | 11.64 | | | $ | 11.27 | | | $ | 10.53 | | |
| Income from investment operations: | |
| Net investment income | | | 0.02 | | | | 0.21 | | | | 0.26 | | | | 0.30 | | | | 0.37 | | | | 0.46 | | |
| Net realized and unrealized gain (loss) | | | 0.14 | | | | 0.70 | | | | 0.23 | | | | (0.46 | ) | | | 0.44 | | | | 0.77 | | |
| Total from investment operations | | | 0.16 | | | | 0.91 | | | | 0.49 | | | | (0.16 | ) | | | 0.81 | | | | 1.23 | | |
| Less distributions to shareholders from: | |
| Net investment income | | | (0.01 | ) | | | (0.22 | ) | | | (0.30 | ) | | | (0.37 | ) | | | (0.44 | ) | | | (0.49 | ) | |
| Net realized gains | | | — | | | | (0.13 | ) | | | (0.27 | ) | | | (0.00 | )(b) | | | — | | | | — | | |
| Total distributions to shareholders | | | (0.01 | ) | | | (0.35 | ) | | | (0.57 | ) | | | (0.37 | ) | | | (0.44 | ) | | | (0.49 | ) | |
| Net asset value, end of period | | $ | 11.74 | | | $ | 11.59 | | | $ | 11.03 | | | $ | 11.11 | | | $ | 11.64 | | | $ | 11.27 | | |
| Total return | | | 1.42 | % | | | 8.28 | % | | | 4.40 | % | | | (1.38 | %) | | | 7.40 | % | | | 12.04 | %(c) | |
| Ratios to average net assets(d) | |
Expenses prior to fees waived or expenses reimbursed
(including interest expense) | | | 0.41 | %(e) | | | 0.41 | %(f) | | | 0.41 | %(f) | | | 0.41 | %(f) | | | 0.41 | %(f) | | | 0.42 | %(f) | |
Net expenses after fees waived or expenses reimbursed
(including interest expense)(g) | | | 0.20 | %(e) | | | 0.20 | %(f)(h) | | | 0.20 | %(f) | | | 0.23 | %(f) | | | 0.30 | %(f)(h) | | | 0.33 | %(f)(h) | |
Expenses prior to fees waived or expenses reimbursed
(excluding interest expense) | | | 0.41 | %(e) | | | 0.41 | % | | | 0.41 | % | | | 0.41 | % | | | 0.41 | % | | | 0.42 | % | |
Net expenses after fees waived or expenses reimbursed
(excluding interest expense)(g) | | | 0.20 | %(e) | | | 0.20 | %(h) | | | 0.20 | % | | | 0.23 | % | | | 0.30 | %(h) | | | 0.33 | %(h) | |
| Net investment income | | | 1.55 | %(e) | | | 1.82 | %(h) | | | 2.29 | % | | | 2.64 | % | | | 3.31 | %(h) | | | 4.24 | %(h) | |
| Supplemental data | |
| Net assets, end of period (in thousands) | | $ | 271,853 | | | $ | 267,044 | | | $ | 241,078 | | | $ | 301,978 | | | $ | 294,640 | | | $ | 284,271 | | |
| Portfolio turnover | | | 7 | % | | | 106 | % | | | 142 | % | | | 118 | % | | | 126 | % | | | 47 | % | |
| Notes to Financial Highlights | |
(a) For the period from April 1, 2012 to April 30, 2012. During the period, the Fund's fiscal year end was changed from March 31 to April 30.
(b) Rounds to less than $0.01.
(c) During the year ended March 31, 2008, the Investment Manager reimbursed the Fund for a loss on a trading error. Had the Fund not received this reimbursement, total return would have been lower by less than 0.01%.
(d) In addition to the fees and expenses which the Fund bears directly, the Fund indirectly bears a pro rata share of the fees and expenses of the acquired funds in which it invests. Such indirect expenses are not included in the reported expense ratios.
(e) Annualized.
(f) Includes interest expense which rounds to less than 0.01%.
(g) The Investment Manager and certain of its affiliates agreed to waive/reimburse certain fees and expenses, if applicable.
(h) The benefits derived from expense reductions had an impact of less than 0.01%.
The Accompanying Notes to Financial Statements are an integral part of this statement.
18
Notes to Financial Statements – Columbia U.S. Treasury Index Fund
April 30, 2012
Note 1. Organization
Columbia U.S. Treasury Index Fund (the Fund), a series of Columbia Funds Series Trust I (the Trust), is a diversified fund. The Trust is registered under the Investment Company Act of 1940, as amended (the 1940 Act), as an open-end management investment company organized as a Massachusetts business trust.
Fiscal Year End Change
During the period, the Fund changed its fiscal year end from March 31 to April 30. Accordingly, this report includes activity for the period April 1, 2012 to April 30, 2012 and the year ended March 31, 2012.
Fund Shares
The Trust may issue an unlimited number of shares (without par value). The Fund offers Class A, Class B, Class C, Class I and Class Z shares. All share classes have identical voting, dividend and liquidation rights. Each share class has its own expense structure and sales charges, as applicable.
Class A shares are subject to a maximum front-end sales charge of 4.75% based on the initial investment amount. Class A shares purchased without an initial sales charge in accounts aggregating $1 million to $50 million at the time of purchase are subject to a contingent deferred sales charge (CDSC) if the shares are sold within 18 months of purchase, charged as follows: 1.00% CDSC if redeemed within 12 months of purchase, and 0.50% CDSC if redeemed more than 12, but less than 18, months after purchase.
Class B shares may be subject to a maximum CDSC of 5.00% based upon the holding period after purchase. Class B shares will generally convert to Class A shares eight years after purchase. The Fund no longer accepts investments by new or existing investors in the Fund's Class B shares, except in connection with the reinvestment of any dividend and/or capital gain distributions in Class B shares of the Fund and exchanges by existing Class B shareholders of certain other funds within the Columbia Family of Funds.
Class C shares are subject to a 1.00% CDSC on shares redeemed within one year of purchase.
Class I shares are not subject to sales charges and are only available to the Columbia Family of Funds.
Class Z shares are not subject to sales charges, and are only available to certain investors, as described in the Fund's prospectus.
Note 2. Summary of Significant Accounting Policies
Use of Estimates
The preparation of financial statements in accordance with U.S. generally accepted accounting principles (GAAP) requires management to make certain estimates and assumptions that affect the reported amounts of assets and liabilities, the disclosure of contingent assets and liabilities at the date of the financial statements and the reported amounts of revenue and expenses during the reporting period. Actual results could differ from those estimates.
The following is a summary of significant accounting policies consistently followed by the Fund in the preparation of its financial statements.
Security Valuation
Debt securities generally are valued by pricing services approved by the Board of Trustees (the Board) based upon market transactions for normal, institutional-size trading units of similar securities. The services may use various pricing techniques which take into account appropriate factors such as yield, quality, coupon rate, maturity, type of issue, trading characteristics and other data, as well as broker quotes. Debt securities for which quotations are readily available may also be valued based upon an over-the-counter or exchange bid quotation.
Investments in other open-end investment companies, including money market funds, are valued at net asset value.
Short-term securities purchased within 60 days to maturity are valued at amortized cost, which approximates market value. The value of short-term securities originally purchased with maturities greater than 60 days is determined based on an amortized value to par upon reaching 60 days to maturity. Short-term securities maturing in more than 60 days from the valuation date are valued at the market price or approximate market value based on current interest rates.
Investments for which market quotations are not readily available, or that have quotations which management believes
19
Columbia U.S. Treasury Index Fund, April 30, 2012
are not reliable, are valued at fair value as determined in good faith under consistently applied procedures established by and under the general supervision of the Board. If a security or class of securities (such as foreign securities) is valued at fair value, such value is likely to be different from the last quoted market price for the security. The determination of fair value often requires significant judgment. To determine fair value, management may use assumptions including but not limited to future cash flows and estimated risk premiums. Multiple inputs from various sources may be used to determine value.
Repurchase Agreements
The Fund may engage in repurchase agreement transactions with institutions that management has determined are creditworthy. The Fund, through the custodian, receives delivery of the underlying securities collateralizing a repurchase agreement. Management is responsible for determining that the collateral is at least equal, at all times, to the value of the repurchase obligation including interest. A repurchase agreement transaction involves certain risks in the event of default or insolvency of the counterparty. These risks include possible delays in or restrictions on a Fund's ability to dispose of the underlying securities and a possible decline in the value of the underlying securities during the period while the Fund seeks to assert its rights.
Security Transactions
Security transactions are accounted for on the trade date. Cost is determined and gains (losses) are based upon the specific identification method for both financial statement and federal income tax purposes.
Income Recognition
Interest income is recorded on the accrual basis. Market premium and discount are amortized and accreted, respectively, on all debt securities, unless otherwise noted. Original issue discount is accreted to interest income over the life of the security with a corresponding increase in the cost basis, if any.
Corporate actions and dividend income are recorded on the ex-dividend date.
Expenses
General expenses of the Trust are allocated to the Fund and other funds of the Trust based upon relative net assets or other expense allocation methodologies determined by the nature of the expense. Expenses directly attributable to the Fund are charged to the Fund. Expenses directly attributable to a specific class of shares are charged to that share class.
Determination of Class Net Asset Value
All income, expenses (other than class-specific expenses, which are charged to that share class, as shown in the Statement of Operations) and realized and unrealized gains (losses) are allocated to each class of the Fund on a daily basis for purposes of determining the net asset value of each class. Income and expenses are allocated to each class based on the settled shares method, while realized and unrealized gains (losses) are allocated based on the relative net assets of each class.
Federal Income Tax Status
The Fund intends to qualify each year as a regulated investment company under Subchapter M of the Internal Revenue Code, as amended, and will distribute substantially all of its tax exempt or taxable income (including net short-term capital gains), if any, for its tax year, and as such will not be subject to federal income taxes. In addition, the Fund intends to distribute in each calendar year substantially all of its net investment income, capital gains and certain other amounts, if any, such that the Fund should not be subject to federal excise tax. Therefore, no federal income or excise tax provision is recorded.
Distributions to Shareholders
Distributions from net investment income are declared daily and paid monthly. Net realized capital gains, if any, are distributed at least annually. Income distributions and capital gain distributions are determined in accordance with federal income tax regulations which may differ from GAAP.
Guarantees and Indemnifications
Under the Trust's organizational documents and, in some cases, by contract, its officers and trustees are indemnified against certain liabilities arising out of the performance of their duties to the Trust or its funds. In addition, certain of the
20
Columbia U.S. Treasury Index Fund, April 30, 2012
Fund's contracts with its service providers contain general indemnification clauses. The Fund's maximum exposure under these arrangements is unknown since the amount of any future claims that may be made against the Fund cannot be determined, and the Fund has no historical basis for predicting the likelihood of any such claims.
Note 3. Fees and Compensation Paid to Affiliates
Investment Management Fees
Under an Investment Management Services Agreement (IMSA), Columbia Management Investment Advisers, LLC (the Investment Manager), a wholly-owned subsidiary of Ameriprise Financial, Inc. (Ameriprise Financial), determines which securities will be purchased, held or sold. The management fee is an annual fee that is equal to 0.10% of the Fund's average daily net assets.
Administration Fees
Under an Administrative Services Agreement, the Investment Manager serves as the Fund Administrator. The Fund pays the Fund Administrator an annual fee for administration and accounting services equal to 0.30% of the Fund's average daily net assets.
The Investment Manager, from the administration fee it receives from the Fund, pays all operating expenses of the Fund, with the exception of brokerage fees and commissions, interest, fees and expenses of Trustees who are not officers, directors or employees of the Investment Manager or its affiliates, distribution (Rule 12b-1) and/or shareholder servicing fees and any extraordinary non-recurring expenses that may arise, including litigation.
Compensation of Board Members
Board members are compensated for their services to the Fund as disclosed in the Statement of Operations. The Trust's eligible Trustees may participate in a Deferred Compensation Plan (the Plan) which may be terminated at any time. Obligation of the Plan will be paid solely out of the Fund's assets.
Compensation of Chief Compliance Officer
The Board has appointed a Chief Compliance Officer to the Fund in accordance with federal securities regulations. The Fund, along with other affiliated funds, pays its pro-rata share of the expenses associated with the Chief Compliance Officer. The Fund's expenses for the Chief Compliance Officer will not exceed $15,000 per year.
Distribution and Service Fees
The Fund has an agreement with Columbia Management Investment Distributors, Inc. (the Distributor), an affiliate of the Investment Manager and a wholly-owned subsidiary of Ameriprise Financial, for distribution and shareholder services. Pursuant to Rule 12b-1 under the 1940 Act, the Board has approved, and the Fund has adopted, distribution and shareholder service plans (the Plans) which set the distribution and service fees for the Fund. These fees are calculated daily and are intended to compensate the Distributor and/or eligible selling and/or servicing agents for selling shares of the Fund and providing services to investors.
The Plans require the payment of a monthly service fee to the Distributor at the maximum annual rate of 0.25% of the average daily net assets attributable to Class A, Class B and Class C shares of the Fund. The Plans also require the payment of a monthly distribution fee to the Distributor at the maximum annual rate of 0.75% of the average daily net assets attributable to Class B and Class C shares, only.
The Distributor has voluntarily agreed to waive a portion of the distribution fee for Class C shares so that the combined distribution and service fee does not exceed 0.85% annually of the average daily net assets attributable to Class C shares. This arrangement may be modified or terminated by the Distributor at any time.
Sales Charges
Sales charges, including front-end charges and CDSCs, received by the Distributor for distributing Fund shares were $310 for Class A, $1,099 for Class B and $390 for Class C for the period April 1, 2012 to April 30, 2012 and $43,610 for Class A, $4,420 for Class B and $454 for Class C shares for the year ended March 31, 2012.
Minimum Account Balance Fee
An annual minimum account balance fee of $20 may apply to certain accounts with a value below the Fund's initial minimum investment requirements to reduce the impact of small accounts on transfer agent fees. These minimum
21
Columbia U.S. Treasury Index Fund, April 30, 2012
account balance fees are recorded as part of expense reductions in the Statement of Operations. For the period April 1, 2012 to April 30, 2012, no minimum account balance fees were charged to accounts. For the year ended March 31, 2012, these minimum account balance fees reduced total expenses by $2,020.
Expenses Waived/Reimbursed by the Investment Manager and its Affiliates
The Investment Manager and certain of its affiliates have contractually agreed to waive fees and/or reimburse expenses (excluding certain fees and expenses described below), through July 31, 2012, unless sooner terminated at the sole discretion of the Board, so that the Fund's net operating expenses, after giving effect to fees waived/expenses reimbursed and any balance credits and/or overdraft charges from the Fund's custodian, do not exceed the following annual rates as a percentage of the class' average daily net assets:
| Class A | | | 0.45 | % | |
| Class B | | | 1.20 | | |
| Class C | | | 1.20 | | |
| Class I | | | 0.20 | | |
| Class Z | | | 0.20 | | |
Under the agreement, the following fees and expenses are excluded from the waiver/reimbursement commitment, and therefore will be paid by the Fund, if applicable: taxes (including foreign transaction taxes), expenses associated with investments in affiliated and non-affiliated pooled investment vehicles (including mutual funds and exchange traded funds), transaction costs and brokerage commissions, costs related to any securities lending program, dividend expenses associated with securities sold short, inverse floater program fees and expenses, transaction charges and interest on borrowed money, interest, extraordinary expenses and any other expenses the exclusion of which is specifically approved by the Board. This agreement may be modified or amended only with approval from all parties. Class C distribution fees waived by the Distributor, as discussed above, are in addition to the waiver/reimbursement commitment under the agreement.
Note 4. Federal Tax Information
The timing and character of income and capital gain distributions are determined in accordance with income tax regulations, which may differ from GAAP because of temporary or permanent book to tax differences.
For the period April 1, 2012 to April 30, 2012, these differences are primarily due to differing treatment for deferral/reversal of wash sales, trustees' deferred compensation, distributions, and market discount/premium. For the year ended March 31, 2012, these differences are primarily due to differing treatment for deferral/reversal of wash sales, trustees' deferred compensation, distributions, and market discount/premium. To the extent these differences are permanent, reclassifications are made among the components of the Fund's net assets in the Statement of Assets and Liabilities. Temporary differences do not require reclassifications. In the Statement of Assets and Liabilities the following reclassifications were made:
| | | Period ended
April 30,
2012 | | Year ended
March 31,
2012 | |
| Excess of distributions over | |
| net investment income | | $ | 28,836 | | | $ | 780,000 | | |
Accumulated net realized
gain | | | (28,836 | ) | | | (844,431 | ) | |
| Paid-in capital | | | — | | | | 64,431 | | |
Net investment income and net realized gains (losses), as disclosed in the Statement of Operations, and net assets were not affected by this reclassification.
The tax character of distributions paid during the periods indicated was as follows:
| | | Period ended
April 30,
2012 | | Year ended
March 31,
2012 | | Year ended
March 31,
2011 | |
| Ordinary income | | $ | 495,230 | | | $ | 12,047,239 | | | $ | 12,349,475 | | |
Long-term
capital gains | | | — | | | | 921,785 | | | | 6,022,213 | | |
Short-term capital gain distributions, if any, are considered ordinary income distributions for tax purposes.
22
Columbia U.S. Treasury Index Fund, April 30, 2012
At April 30, 2012 and March 31, 2012, the components of distributable earnings on a tax basis were as follows:
| | | April 30,
2012 | | March 31,
2012 | |
| Undistributed ordinary income | | $ | 3,088,095 | | | $ | 3,037,260 | | |
Undistributed accumulated
long-term gain | | | 4,712,704 | | | | 4,433,943 | | |
| Unrealized appreciation | | | 20,360,149 | | | | 15,381,570 | | |
At April 30, 2012 and March 31, 2012, the cost of investments for federal income tax purposes, and the aggregate unrealized appreciation and depreciation based on that cost was as follows:
| | | April 30,
2012 | | March 31,
2012 | |
Aggregate unrealized
appreciation | | $20,434,624 | | $16,156,376 | |
Aggregate unrealized
depreciation | | | (74,475 | ) | | | (774,806 | ) | |
Net unrealized
appreciation/depreciation | | 20,360,149 | | 15,381,570 | |
Cost of investments for
tax purposes | | $ | 398,406,585 | | | $ | 400,432,392 | | |
Management of the Fund has concluded that there are no significant uncertain tax positions that would require recognition in the financial statements. However, management's conclusion may be subject to review and adjustment at a later date based on factors including, but not limited to, new tax laws, regulations, and administrative interpretations (including relevant court decisions). Generally, the Fund's federal tax returns for the prior three fiscal years remain subject to examination by the Internal Revenue Service.
Note 5. Portfolio Information
For the period April 1, 2012 to April 30, 2012, the cost of purchases and proceeds from sales of securities, excluding short-term obligations, aggregated to $32,299,833 and $28,407,536, respectively, of which $32,299,833 and $28,407,536, respectively, were U.S. government securities.
For the year ended March 31, 2012, the cost of purchases and proceeds from sales of securities, excluding short-term obligations, aggregated to $453,094,566 and $487,333,426, respectively, of which $438,547,479 and $474,216,989, respectively, were U.S. government securities.
Note 6. Lending of Portfolio Securities
Effective July 25, 2011, the Fund has entered into a Master Securities Lending Agreement (the Agreement) with JPMorgan Chase Bank, N.A. (JPMorgan). The Agreement, which replaces the previous securities lending arrangement with State Street, authorizes JPMorgan as lending agent to lend securities to authorized borrowers in order to generate additional income on behalf of the Fund. Pursuant to the Agreement, the securities loaned are secured by cash or U.S. government securities equal to at least 100% of the market value of the loaned securities. Any additional collateral required to maintain those levels due to market fluctuations of the loaned securities is requested to be delivered the following business day. Cash collateral received is invested by the lending agent on behalf of the Fund into authorized investments pursuant to the Agreement. The investments made with the cash collateral are listed in the Portfolio of Investments. The values of such investments and any uninvested cash collateral are disclosed in the Statement of Assets and Liabilities along with the related obligation to return the collateral upon the return of the securities loaned.
At April 30, 2012, securities valued at $89,555,342 were on loan, secured by U.S. government securities valued at $91,092,795.
At March 31, 2012, securities valued at $110,164,251 were on loan, secured by U.S. government securities valued at $106,848,915 and by cash collateral of $5,928,711 (which does not reflect calls for collateral made to borrowers by JPMorgan at period end) that is partially or fully invested in short-term securities or other cash equivalents.
Risks of delay in recovery of securities or even loss of rights in the securities may occur should the borrower of the securities fail financially. Risks may also arise to the extent that the value of the securities loaned increases above the value of the collateral received. JPMorgan will indemnify the Fund from losses resulting from a borrower's failure to return a loaned security when due. Such indemnification does not
23
Columbia U.S. Treasury Index Fund, April 30, 2012
extend to losses associated with declines in the value of cash collateral investments. The Investment Manager is not responsible for any losses incurred by the Fund in connection with the securities lending program. Loans are subject to termination by the Fund or the borrower at any time, and are, therefore, not considered to be illiquid investments.
Pursuant to the Agreement, the Fund receives income for lending its securities either in the form of fees or by earning interest on invested cash collateral, net of negotiated rebates paid to borrowers and fees paid to the lending agent for services provided and any other securities lending expenses. Net income earned from securities lending for the period ended April 30, 2012 and the year ended March 31, 2012 is disclosed in the Statement of Operations. The Fund continues to earn and accrue interest and dividends on the securities loaned.
Prior to July 25, 2011, the Fund participated in a securities lending arrangement with State Street. Each security on loan was collateralized in an amount at least equal to the market value of the securities loaned plus accrued income from the investment of collateral. The income generated by the investment of the collateral, net of any fees remitted to State Street as the lending agent and borrower rebates, was paid to the Fund.
Note 7. Affiliated Money Market Fund
The Fund may invest its daily cash balances in Columbia Short-Term Cash Fund, an affiliated money market fund established for the exclusive use by the Fund and other affiliated funds. The income earned by the Fund from such investments is included as "Dividends from affiliates" in the Statement of Operations. As an investing fund, the Fund indirectly bears its proportionate share of the expenses of Columbia Short-Term Cash Fund.
Note 8. Shareholder Concentration
At April 30, 2012 and March 31, 2012, one unaffiliated shareholder account owned 32.0% of the outstanding shares of the Fund. The Fund has no knowledge about whether any portion of those shares was owned beneficially by such accounts. Affiliated shareholder accounts owned 31.0% of the outstanding shares of the Fund. Subscription and redemption activity by concentrated accounts may have a significant effect on the operations of the Fund.
Note 9. Line of Credit
The Fund has entered into a revolving credit facility with a syndicate of banks led by JPMorgan whereby the Fund may borrow for the temporary funding of shareholder redemptions or for other temporary or emergency purposes. The credit facility became effective on July 25, 2011, replacing a prior credit facility. The credit facility agreement, as amended, which is a collective agreement between the Fund and certain other funds managed by the Investment Manager, severally and not jointly, permits collective borrowings up to $500 million. Pursuant to a December 13, 2011 amendment to the credit facility agreement, interest is charged to each participating fund based on its borrowings at a rate equal to the higher of (i) the overnight federal funds rate plus 1.00% or (i) the one-month LIBOR rate plus 1.00%. Each borrowing under the credit facility matures no later than 60 days after the date of borrowing. The Fund also pays a commitment fee equal to its pro rata share of the amount of the credit facility at a rate of 0.08% per annum. For the period July 25, 2011 through December 13, 2011, interest was charged to each participating fund based on its borrowings at a rate equal to the sum of the federal funds rate plus (i) 1.25% per annum plus (ii) if one-month LIBOR exceeds the federal funds rate, the amount of such excess. The Fund also paid a commitment fee equal to its pro rata share of the amount of the credit facility at a rate of 0.10% per annum.
For the period June 27, 2011 through July 24, 2011, the Fund and certain other funds managed by the Investment Manager participated in a $100 million committed, unsecured revolving credit facility provided by State Street. For the period May 16, 2011 through June 26, 2011, the collective borrowing amount of the credit facility was $150 million committed, unsecured revolving credit facility provided by State Street. Prior to May 16, 2011, the collective borrowing amount of the credit facility was $225 million. Interest was charged to each fund based on its borrowings at a rate equal to the greater of the (i) federal funds rate plus 1.25% per annum or (ii) the overnight LIBOR rate plus 1.25% per annum. The Fund also paid a commitment fee equal to its pro rata share of the amount of the credit facility at a rate of 0.125% per annum.
The Fund had no borrowings during the period ended April 30, 2012. For the year ended March 31, 2012, the average daily loan balance outstanding on days when borrowing existed was $1,500,000 at a weighted average interest rate of 1.38%.
24
Columbia U.S. Treasury Index Fund, April 30, 2012
Note 10. Subsequent Events
Management has evaluated the events and transactions that have occurred through the date the financial statements were issued and noted no items requiring adjustment of the financial statements or additional disclosure.
Note 11. Information Regarding Pending and Settled Legal Proceedings
In December 2005, without admitting or denying the allegations, American Express Financial Corporation (AEFC, which is now known as Ameriprise Financial, Inc. (Ameriprise Financial)) entered into settlement agreements with the Securities and Exchange Commission (SEC) and Minnesota Department of Commerce (MDOC) related to market timing activities. As a result, AEFC was censured and ordered to cease and desist from committing or causing any violations of certain provisions of the Investment Advisers Act of 1940, the Investment Company Act of 1940, and various Minnesota laws. AEFC agreed to pay disgorgement of $10 million and civil money penalties of $7 million. AEFC also agreed to retain an independent distribution consultant to assist in developing a plan for distribution of all disgorgement and civil penalties ordered by the SEC in accordance with various undertakings detailed at www.sec.gov/litigation/admin/ia-2451.pdf. Ameriprise Financial and its affiliates have cooperated with the SEC and the MDOC in these legal proceedings, and have made regular reports to the funds' Boards of Trustees.
Ameriprise Financial and certain of its affiliates have historically been involved in a number of legal, arbitration and regulatory proceedings, including routine litigation, class actions, and governmental actions, concerning matters arising in connection with the conduct of their business activities. Ameriprise Financial believes that the Funds are not currently the subject of, and that neither Ameriprise Financial nor any of its affiliates are the subject of, any pending legal, arbitration or regulatory proceedings that are likely to have a material adverse effect on the Funds or the ability of Ameriprise Financial or its affiliates to perform under their contracts with the Funds. Ameriprise Financial is required to make 10-Q, 10-K and, as necessary, 8-K filings with the Securities and Exchange Commission on legal and regulatory matters that relate to Ameriprise Financial and its affiliates. Copies of these filings may be obtained by accessing the SEC website at www.sec.gov.
There can be no assurance that these matters, or the adverse publicity associated with them, will not result in increased fund redemptions, reduced sale of fund shares or other adverse consequences to the Funds. Further, although we believe proceedings are not likely to have a material adverse effect on the Funds or the ability of Ameriprise Financial or its affiliates to perform under their contracts with the Funds, these proceedings are subject to uncertainties and, as such, we are unable to estimate the possible loss or range of loss that may result. An adverse outcome in one or more of these proceedings could result in adverse judgments, settlements, fines, penalties or other relief that could have a material adverse effect on the consolidated financial condition or results of operations of Ameriprise Financial.
25
Report of Independent Registered Public Accounting Firm
To the Trustees of Columbia Funds Series Trust I and the Shareholders of Columbia U.S. Treasury Index Fund
In our opinion, the accompanying statement of assets and liabilities, including the portfolio of investments, and the related statements of operations and of changes in net assets and the financial highlights present fairly, in all material respects, the financial position of Columbia U.S. Treasury Index Fund (the "Fund") (a series of Columbia Funds Series Trust) at April 30, 2012 and at March 31, 2012, the results of its operations, the changes in its net assets and the financial highlights for each of the periods indicated, in conformity with accounting principles generally accepted in the United States of America. These financial statements and financial highlights (hereafter referred to as "financial statements") are the responsibility of the Fund's management. Our responsibility is to express an opinion on these financial statements based on our audits. We conducted our audits of these financial statements in accordance with the standards of the Public Company Accounting Oversight Board (United States). Those standards require that we plan and perform the audit to obtain reasonable assurance about whether the financial statements are free of material misstatement. An audit includes examining, on a test basis, evidence supporting the amounts and disclosures in the financial statements, assessing the accounting principles used and significant estimates made by management, and evaluating the overall financial statement presentation. We believe that our audits, which included confirmation of securities at April 30, 2012 and at March 31, 2012 by correspondence with the custodian, transfer agent and brokers, provide a reasonable basis for our opinion.
PricewaterhouseCoopers LLP
Minneapolis, Minnesota
June 8, 2012
26
Federal Income Tax Information (Unaudited) – Columbia U.S. Treasury Index Fund
The Fund hereby designates as a capital gain dividend with respect to the period ended April 30, 2012 and the fiscal year ended March 31, 2012, $292,699 and $4,759,335, respectively, or, if subsequently determined to be different, the net capital gain of such year.
The Fund will notify shareholders in January 2013 of amounts for use in preparing 2012 income tax returns.
27
Fund Governance
The Trustees serve terms of indefinite duration. The names, addresses and birth years of the Trustees and Officers of the Funds in Columbia Funds Series Trust I, the year each was first elected or appointed to office, their principal business occupations during at least the last five years, the number of Funds overseen by each Trustee and other directorships they hold are shown below. Each officer listed below serves as an officer of each Fund in Columbia Funds Series Trust I.
Independent Trustees
Name, Address and Year of Birth,
Position with Funds, Year First
Elected or Appointed to Office | | Principal Occupation(s) During Past Five Years, Number of Funds in Columbia
Funds Complex Overseen by Trustee, Other Directorships Held
| |
| Rodman L. Drake (Born 1943) | |
|
c/o Columbia Management Investment Advisers, LLC
225 Franklin Street
Boston, MA 02110
Trustee (since 1994) and
Chairman of the Board (since 2009) | | Independent consultant since 2010; Co-Founder of Baringo Capital LLC (private equity) from 1997 to 2008; CEO of Crystal River Capital, Inc. (real estate investment trust) from 2003 to 2010; Oversees 51; Jackson Hewitt Tax Service Inc. (tax preparation services from 2004 to 2011); Celgene Corporation (global biotechnology company); Student Loan Corporation (student loan provider from 2008 to 2010); Celgene Corporation (global biotechnology company); The Helios Funds and Brookfield Funds (closed-end funds); Crystal River Capital, Inc. from 2005 to 2010; Parson Brinckerhoff from 1995 to 2008; and Apex Silver Mines Ltd. from 2007 to 2009 | |
|
| Douglas A. Hacker (Born 1955) | |
|
c/o Columbia Management Investment Advisers, LLC
225 Franklin Street
Boston, MA 02110
Trustee (since 1996) | | Independent business executive since May 2006; Executive Vice President—Strategy of United Airlines from December 2002 to May 2006; President of UAL Loyalty Services (airline marketing company) from September 2001 to December 2002; Executive Vice President and Chief Financial Officer of United Airlines from July 1999 to September 2001. Oversees 51; Nash Finch Company (food distributor); Aircastle Limited (aircraft leasing); and SeaCube Container Leasing Ltd (container leasing) | |
|
| Janet Langford Kelly (Born 1957) | |
|
c/o Columbia Management Investment Advisers, LLC
225 Franklin Street
Boston, MA 02110
Trustee (since 1996) | | Senior Vice President, General Counsel and Corporate Secretary, ConocoPhillips (integrated energy company) since September 2007; Deputy General Counsel—Corporate Legal Services, ConocoPhillips from August 2006 to August 2007; Partner, Zelle, Hofmann, Voelbel, Mason & Gette LLP (law firm) from March 2005 to July 2006; Adjunct Professor of Law, Northwestern University, from September 2004 to June 2006; Director, UAL Corporation (airline) from February 2006 to July 2006; Chief Administrative Officer and Senior Vice President, Kmart Holding Corporation (consumer goods) from September 2003 to March 2004. Oversees 51; None | |
|
| Nancy T. Lukitsh (Born 1956) | |
|
c/o Columbia Management Investment Advisers, LLC
225 Franklin Street
Boston, MA 02110
Trustee (since 2011) | | Senior Vice President, Partner and Director of Marketing, Wellington Management Company, LLP (investment adviser) from 1997 to 2010; Chair, Wellington Management Investment Portfolios (commingled non-U.S. investment pools) from 2007 to 2010; Director, Wellington Trust Company, NA and other Wellington affiliates from 1997 to 2010. Oversees 51; None | |
|
| William E. Mayer (Born 1940) | |
|
c/o Columbia Management Investment Advisers, LLC
225 Franklin Street
Boston, MA 02110
Trustee (since 1994) | | Partner, Park Avenue Equity Partners (private equity) since February 1999; Dean and Professor, College of Business and Management, University of Maryland from 1992 to 1996. Oversees 51; DynaVox Inc. (speech creation); Lee Enterprises (print media); WR Hambrecht + Co. (financial service provider) from 2000 to 2012; BlackRock Kelso Capital Corporation (investment company) | |
|
28
Fund Governance (continued)
Independent Trustees (continued)
Name, Address and Year of Birth,
Position with Funds, Year First
Elected or Appointed to Office | | Principal Occupation(s) During Past Five Years, Number of Funds in Columbia
Funds Complex Overseen by Trustee, Other Directorships Held
| |
| David M. Moffett (Born 1952) | |
|
c/o Columbia Management Investment Advisers, LLC
225 Franklin Street
Boston, MA 02110
Trustee (since 2011) | | Retired. Chief Executive Officer, Federal Home Loan Mortgage Corporation, from 2008 to 2009; Senior Adviser, Global Financial Services Group, Carlyle Group, Inc., from 2007 to 2008; Vice Chairman and Chief Financial Officer, U.S. Bancorp, from 1993 to 2007. Oversees 51; CIT Group Inc. (commercial and consumer finance), eBay Inc. (online trading community), MBIA Corp (financial service provider), E.W. Scripps Co. (print and television media), Building Materials Holding Corp. (building materials and construction services), and University of Oklahoma Foundation. | |
|
| Charles R. Nelson (Born 1942) | |
|
c/o Columbia Management Investment Advisers, LLC
225 Franklin Street
Boston, MA 02110
Trustee (since 1981) | | Retired Professor Emeritus, University of Washington, since 2011; Professor of Economics, University of Washington, from January 1976 to 2011; Ford and Louisa Van Voorhis Professor of Political Economy, University of Washington, from 1993 to 2011; Adjunct Professor of Statistics, University of Washington, from 1980 to 2011; Associate Editor, Journal of Money Credit and Banking from 1993 to 2008; consultant on econometric and statistical matters. Oversees 51; None | |
|
| John J. Neuhauser (Born 1943) | |
|
c/o Columbia Management Investment Advisers, LLC
225 Franklin Street
Boston, MA 02110
Trustee (since 1984) | | President, Saint Michael's College, since August 2007; Director or Trustee of several non-profit organizations, including Fletcher Allen Health Care, Inc.; University Professor, Boston College from November 2005 to August 2007; Academic Vice President and Dean of Faculties, Boston College from August 1999 to October 2005. Oversees 51; Liberty All-Star Equity Fund and Liberty All-Star Growth Fund (closed-end funds) | |
|
| Patrick J. Simpson (Born 1944) | |
|
c/o Columbia Management Investment Advisers, LLC
225 Franklin Street
Boston, MA 02110
Trustee (since 2000) | | Partner, Perkins Coie LLP (law firm). Oversees 51; None | |
|
| Anne-Lee Verville (Born 1945) | |
|
c/o Columbia Management Investment Advisers, LLC
225 Franklin Street
Boston, MA 02110
Trustee (since 1998) | | Retired. General Manager—Global Education Industry from 1994 to 1997, President—Application Systems Division from 1991 to 1994, Chief Financial Officer—US Marketing & Services from 1988 to 1991, and Chief Information Officer from 1987 to 1988, IBM Corporation (computer and technology). Oversees 51; Enesco Group, Inc. (producer of giftware and home and garden decor products) from 2001 to 2006 | |
|
The Statement of Additional Information includes additional information about the Trustees of the Funds and is available, without charge, upon request by calling 1-800-345-6611.
29
Fund Governance (continued)
Interested Trustee
Name, address and year of birth,
Position with funds, Year first
elected or appointed to office | | Principal occupation(s) during past five years, Number of funds in Columbia Funds
Complex overseen by trustee, Other directorships held | |
| William F. Truscott (born 1960) | |
|
53600 Ameriprise Financial Center
Minneapolis, MN 55474
Senior Vice President (since 2010) | | Chairman of the Board and President, Columbia Management Investment Advisers, LLC since May 2010 and February 2012, respectively (previously President, Chairman of the Board and Chief Investment Officer, from 2001 to April 2010); Chief Executive Officer, U.S. Asset Management & President, Annuities, Ameriprise Financial, Inc. since May 2010 (previously President—U.S. Asset Management and Chief Investment Officer from 2005 to April 2010, and Senior Vice President—Chief Investment Officer, from 2001 to 2005); Director, President and Chief Executive Officer, Ameriprise Certificate Company since 2006; Director, Columbia Management Investment Distributors, Inc. since May 2010 and February 2012, respectively (previously Chairman of the Board and Chief Executive Officer from 2008 to April 2010); Chairman of the Board and Chief Executive Officer, RiverSource Distributors, Inc. since 2006. Oversees 51; Columbia Funds Board. | |
|
Officers
| Name, Year of Birth and Address | | Principal Occupation(s) During the Past Five Years | |
| J. Kevin Connaughton (Born 1964) | |
|
225 Franklin Street
Boston, MA 02110
President (since 2009) | | Senior Vice President and General Manager—Mutual Fund Products, Columbia Management Investment Advisers, LLC since May 2010; President, Columbia Funds, since 2009, and RiverSource Funds, since May 2010 (previously Senior Vice President and Chief Financial Officer, Columbia Funds, from June 2008 to January 2009, Treasurer, Columbia Funds, from October 2003 to May 2008, and senior officer of various other affiliated funds since 2000); Managing Director, Columbia Management Advisors, LLC from December 2004 to April 2010. | |
|
| Michael G. Clarke (Born 1969) | |
|
225 Franklin Street
Boston, MA 02110
Treasurer (since 2011) and Chief Financial Officer (since 2009) | | Vice President, Columbia Management Investment Advisers, LLC since May 2010; Managing Director of Fund Administration, Columbia Management Advisors, LLC, from September 2004 to April 2010; senior officer of Columbia Funds and affiliated funds since 2002. | |
|
| Scott R. Plummer (Born 1959) | |
|
5228 Ameriprise Financial Center
Minneapolis, MN 55474
Senior Vice President, Assistant Secretary and Chief Legal Officer (since 2010) | | Chief Legal Officer and Assistant Secretary, Columbia Management Investment Advisers, LLC since June 2005; Vice President and Lead Chief Counsel—Asset Management, Ameriprise Financial, Inc. since May 2010 (previously Vice President and Chief Counsel—Asset Management, from 2005 to April 2010; Vice President, Chief Counsel and Assistant Secretary, Columbia Management Investment Distributors, Inc. since 2008; Vice President, General Counsel and Secretary, Ameriprise Certificate Company since 2005; Chief Counsel, RiverSource Distributors, Inc. since 2006; Senior officer of Columbia Funds and affiliated funds, since 2006. | |
|
30
Fund Governance (continued)
Officers (continued)
| Name, Year of Birth and Address | | Principal Occupation(s) During the Past Five Years | |
| William F. Truscott (Born 1960) | |
|
53600 Ameriprise Financial Center
Minneapolis, MN 55474
Senior Vice President (since 2010) | | Chairman of the Board and President, Columbia Management Investment Advisers, LLC since May 2010 and February 2012, respectively (previously President, Chairman of the Board and Chief Investment Officer, from 2001 to April 2010); Chief Executive Officer, U.S. Asset Management & President, Annuities, Ameriprise Financial, Inc. since May 2010 (previously President—U.S. Asset Management and Chief Investment Officer from 2005 to April 2010); Director, President and Chief Executive Officer, Ameriprise Certificate Company since 2006; Director and Chief Executive Officer, Columbia Management Investment Distributors, Inc. since May 2010 and February 2012, respectively (previously Chairman of the Board and Chief Executive Officer from 2008 to April 2010); Chairman of the Board and Chief Executive Officer, RiverSource Distributors, Inc. since 2006. | |
|
| Thomas P. McGuire (Born 1972) | |
|
225 Franklin Street
Boston, MA 02110
Chief Compliance Officer (since 2012) | | Vice President—Asset Management Compliance, Columbia Management Investment Advisers, LLC since 2010; Chief Compliance Officer. Ameriprise Certificate Company, since September 2010; Compliance Executive, Bank of America, 2005-2010. | |
|
| Colin Moore (Born 1958) | |
|
225 Franklin Street
Boston, MA 02110
Senior Vice President (since 2010) | | Director and Chief Investment Officer, Columbia Management Investment Advisers, LLC since May 2010; Manager, Managing Director and Chief Investment Officer of Columbia Management Advisors, LLC from 2007 to April 2010; Head of Equities, Columbia Management Advisors, LLC from 2002 to 2007. | |
|
| Amy Johnson (Born 1965) | |
|
5228 Ameriprise Financial Center
Minneapolis, MN 55474
Vice President (since 2010) | | Senior Vice President and Chief Operating Officer, Columbia Management Investment Advisers, LLC since May 2010 (previously Chief Administrative Officer, from 2009 until April 2010, Vice President—Asset Management and Trust Company Services, from 2006 to 2009, and Vice President—Operations and Compliance from 2004 to 2006). | |
|
| Joseph F. DiMaria (Born 1968) | |
|
225 Franklin Street
Boston, MA 02110
Vice President (since 2011) and Chief Accounting Officer (since 2008) | | Vice President, Mutual Fund Administration, Columbia Management Investment Advisers, LLC, since May 2010; Director of Fund Administration, Columbia Management Advisors, LLC from January 2006 to April 2010; Head of Tax/Compliance and Assistant Treasurer, Columbia Management Advisors, LLC, from November 2004 to December 2005. | |
|
| Stephen T. Welsh (born 1957) | |
|
225 Franklin Street
Boston, MA 02110
Vice President (since 2006) | | President and Director, Columbia Management Investment Services Corp. since May 2010; President and Director, Columbia Management Services, Inc. from July 2004 to April 2010; Managing Director, Columbia Management Distributors, Inc. from August 2007 to April 2010. | |
|
| Paul D. Pearson (born 1956) | |
|
5228 Ameriprise Financial Center
Minneapolis, MN 55474
Vice President and Assistant Treasurer (since 2011) | | Vice President, Investment Accounting, Columbia Management Investment Advisers, LLC, since May 2010; Vice President, Managed Assets, Investment Accounting, Ameriprise Financial Corporation. | |
|
31
Fund Governance (continued)
Officers (continued)
| Name, Year of Birth and Address | | Principal Occupation(s) During the Past Five Years | |
| Paul B. Goucher (born 1968) | |
|
5228 Ameriprise Financial Center
Minneapolis, MN 55474
Vice President and Assistant Secretary (since 2010) | | Vice President and Chief Counsel of Ameriprise Financial since January 2010 (formerly Vice President and Group Counsel from November 2008 to January 2010); Director, Managing Director and General Counsel of J. & W. Seligman & Co. Incorporated (Seligman) from July 2008 to November 2008 and Managing Director and Associate General Counsel of Seligman from January 2005 to July 2008. | |
|
| Christopher O. Petersen (born 1970) | |
|
5228 Ameriprise Financial Center
Minneapolis, MN 55474
Vice President (since 2010) and Secretary (since 2011) | | Vice President and Chief Counsel, Ameriprise Financial since January 2010 (formerly Vice President and Group Counsel or Counsel from April 2004 to January 2010); Assistant Secretary of RiverSource Funds since January 2007; officer of Columbia Funds and affiliated funds since 2007. | |
|
| Michael E. DeFao (born 1968) | |
|
225 Franklin Street
Boston, MA 02110
Vice President and Assistant Secretary (since 2011) | | Vice President and Chief Counsel, Ameriprise Financial since May 2010; Associate General Counsel Bank of America from June 2005 to April 2010 | |
|
32
Important Information About This Report
The fund mails one shareholder report to each shareholder address. If you would like more than one report, please call shareholder services at 1-800-345-6611 and additional reports will be sent to you. This report has been prepared for shareholders of Columbia U.S. Treasury Index Fund.
A description of the policies and procedures that the fund uses to determine how to vote proxies and a copy of the fund's voting records are available (i) at www.columbiamanagement.com, (ii) on the Securities and Exchange Commission's website at www.sec.gov, and (iii) without charge, upon request, by calling 1-800-368-0346. Information regarding how the fund voted proxies relating to portfolio securities during the 12-month period ended June 30 is available from the SEC's website. Information regarding how the fund voted proxies relating to portfolio securities is also available from the fund's website, www.columbiamanagement.com.
The fund files a complete schedule of portfolio holdings with the SEC for the first and third quarters of each fiscal year on Form N-Q. The fund's Form N-Q is available on the SEC's website at www.sec.gov and may be reviewed and copied at the SEC's Public Reference Room in Washington, D.C. Information on the operation of the Public Reference Room may be obtained by calling 1-800-SEC-0330.
Transfer Agent
Columbia Management Investment
Services Corp.
P.O. Box 8081
Boston, MA 02266-8081
1-800-345-6611
Distributor
Columbia Management Investment
Distributors, Inc.
225 Franklin Street
Boston, MA 02110
Investment Manager
Columbia Management Investment Advisers, LLC
225 Franklin Street
Boston, MA 02110
33

Columbia U.S. Treasury Index Fund
P. O. Box 8081
Boston, MA 02266-8081
columbiamanagement.com
This information is for use with concurrent or prior delivery of a fund prospectus. Investors should consider the investment objectives, risks, charges and expenses of a mutual fund carefully before investing. For a free prospectus, which contains this and other important information about the funds, visit columbiamanagement.com. Read the prospectus carefully before investing. The Fund is distributed by Columbia Management Investment Distributors, Inc., member FINRA, and managed by Columbia Management Investment Advisers, LLC.
© 2012 Columbia Management Investment Advisers, LLC. All rights reserved.
C-1196 C (5/12)
Item 2. Code of Ethics.
(a) The registrant has adopted a code of ethics that applies to the registrant’s principal executive officer, principal financial officer, principal accounting officer or controller, or persons performing similar functions, regardless of whether these individuals are employed by the registrant or a third party.
(b) During the period covered by this report, there were not any amendments to a provision of the code of ethics adopted in 2(a) above.
(c) During the period covered by this report, there were no waivers, including any implicit waivers, from a provision of the code of ethics described in 2(a) above that relates to one or more of the items set forth in paragraph (b) of this item’s instructions.
Item 3. Audit Committee Financial Expert.
The registrant’s Board of Trustees has determined that Douglas A. Hacker, David M. Moffett and Anne-Lee Verville, each of whom are members of the registrant’s Board of Trustees and Audit Committee, each qualify as an audit committee financial expert. Mr. Hacker, Mr. Moffett and Ms. Verville are each independent trustees, as defined in paragraph (a)(2) of this item’s instructions.
Item 4. Principal Accountant Fees and Services.
Fee information below is disclosed for the four series of the registrant whose reports to stockholders are included in this annual filing. The series changed its fiscal year end from March 31 to April 30, effective April 30, 2012. The fees presented for 2012 represent the one month period ended April 30, 2012 and the fiscal year ended March 31, 2012. The fees presented for 2011 represent the fiscal year ended March 31, 2011.
(a) Audit Fees. Aggregate Audit Fees billed by the principal accountant for professional services rendered during the one month period ended April 30, 2012 and the fiscal years ended March 31, 2012 and March 31, 2011 are approximately as follows:
April 30, 2012 | | March 31, 2012 | | March 31, 2011 | |
$ | 30,500 | | $ | 135,100 | | $ | 120,600 | |
| | | | | | | | |
Audit Fees include amounts related to the audit of the registrant’s annual financial statements or services that are normally provided by the accountant in connection with statutory and regulatory filings or engagements for those fiscal years. Fiscal year 2011 also includes audit fees for the review and provision of consent in connection with filing Form N-1A for new share classes.
(b) Audit-Related Fees. Aggregate Audit-Related Fees billed to the registrant by the principal accountant for professional services rendered during the one month period ended April 30, 2012 and the fiscal years ended March 31, 2012 and March 31, 2011 are approximately as follows:
April 30, 2012 | | March 31, 2012 | | March 31, 2011 | |
$ | 0 | | $ | 36,600 | | $ | 27,700 | |
| | | | | | | | |
Audit-Related Fees include amounts for assurance and related services by the principal accountant that are reasonably related to the performance of the audit of the registrant’s financial statements and are not reported in Audit Fees above. In both fiscal years 2012 and 2011, Audit-Related Fees consist of agreed-upon procedures performed for semi-annual shareholder reports and agreed-upon procedures related to fund mergers. Fiscal year 2012 also includes Audit-Related Fees for agreed-upon procedures for fund accounting and custody conversions.
During the one month period ended April 30, 2012 and the fiscal years ended March 31, 2012 and March 31, 2011, there were no Audit-Related Fees billed by the registrant’s principal accountant to the registrant’s investment adviser (not including any sub-adviser whose role is primarily portfolio management and is subcontracted with or overseen by another investment adviser) and any entity controlling, controlled by, or under common control with the adviser that provides ongoing services to the registrant for an engagement that related directly to the operations and financial reporting of the registrant.
(c) Tax Fees. Aggregate Tax Fees billed by the principal accountant to the registrant for professional services rendered during the one month period ended April 30, 2012 and the fiscal years ended March 31, 2012 and March 31, 2011 are approximately as follows:
April 30, 2012 | | March 31, 2012 | | March 31, 2011 | |
$ | 0 | | $ | 29,800 | | $ | 21,800 | |
| | | | | | | | |
Tax Fees include amounts for the review of annual tax returns, the review of required shareholder distribution calculations and typically include amounts for professional services by the principal accountant for tax compliance, tax advice and tax planning.
During the one month period ended April 30, 2012 and the fiscal years ended March 31, 2012 and March 31, 2011, there were no Tax Fees billed by the registrant’s principal accountant to the registrant’s investment adviser (not including any sub-adviser whose role is primarily portfolio management and is subcontracted with or overseen by another
investment adviser) and any entity controlling, controlled by, or under common control with the adviser that provides ongoing services to the registrant for an engagement that related directly to the operations and financial reporting of the registrant.
(d) All Other Fees. Aggregate All Other Fees billed by the principal accountant to the registrant for professional services rendered during the one month period ended April 30, 2012 and the fiscal years ended March 31, 2012 and March 31, 2011 are approximately as follows:
April 30, 2012 | | March 31, 2012 | | March 31, 2011 | |
$ | 0 | | $ | 0 | | $ | 0 | |
| | | | | | | | |
All Other Fees include amounts for products and services provided by the principal accountant, other than the services reported in paragraphs (a) through (c) above.
Aggregate All Other Fees billed by the registrant’s principal accountant to the registrant’s investment adviser (not including any sub-adviser whose role is primarily portfolio management and is subcontracted with or overseen by another investment adviser) and any entity controlling, controlled by, or under common control with the adviser that provides ongoing services to the registrant for an engagement that related directly to the operations and financial reporting of the registrant during the one month period ended April 30, 2012 and the fiscal years ended March 31, 2012 and March 31, 2011 are approximately as follows:
April 30, 2012 | | March 31, 2012 | | March 31, 2011 | |
$ | 0 | | $ | 395,800 | | $ | 495,300 | |
| | | | | | | | |
In both fiscal years 2012 and 2011, All Other Fees consist of fees billed for internal control examinations of the registrant’s transfer agent and investment advisor.
(e)(1) Audit Committee Pre-Approval Policies and Procedures
The registrant’s Audit Committee is required to pre-approve the engagement of the registrant’s independent accountants to provide audit and non-audit services to the registrant and non-audit services to its investment adviser (not including any sub-adviser whose role is primarily portfolio management and is subcontracted with or overseen by another investment adviser) or any entity controlling, controlled by or under common control with such investment adviser that provides ongoing services to the registrant (“Adviser Affiliates”), if the engagement relates directly to the operations and financial reporting of the registrant.
The Audit Committee has adopted a Policy for Engagement of Independent Accountants for Audit and Non-Audit Services (“Policy”). The Policy sets forth the understanding of the Audit Committee regarding the engagement of the registrant’s independent accountants to provide (i) audit and permissible audit-related, tax and other services to the registrant (collectively “Fund Services”); (ii) non-audit services to the registrant’s
investment adviser (not including any sub-adviser whose role is primarily portfolio management and is subcontracted with or overseen by another investment adviser) and Adviser Affiliates, if the engagement relates directly to the operations or financial reporting of a Fund (collectively “Fund-related Adviser Services”); and (iii) certain other audit and non-audit services to the registrant’s investment adviser (not including any sub-adviser whose role is primarily portfolio management and is subcontracted with or overseen by another investment adviser) and Adviser Affiliates. As set forth in this Fund Policy, a service will require specific pre-approval by the Audit Committee if it is to be provided by the Fund’s independent auditor; provided, however, that pre-approval of non-audit services to the Fund, the Adviser or Control Affiliates may be waived if certain de minimis requirements set forth in the SEC’s rules are met.
Under the Policy, the Audit Committee may delegate pre-approval authority to any pre-designated member or members who are Independent Trustees/Directors. The member(s) to whom such authority is delegated must report, for informational purposes only, any pre-approval decisions to the Audit Committee at its next regular meeting. The Audit Committee’s responsibilities with respect to the pre-approval of services performed by the independent accountants may not be delegated to management.
On an annual basis, at a regularly scheduled Audit Committee meeting, the Fund’s Treasurer or other Fund Officer shall submit to the Audit Committee a schedule of the types of Fund Services and Fund-related Adviser Services that are subject to specific pre-approval.
This schedule will provide a description of each type of service that is subject to specific pre-approval, along with total projected fees for each service. The pre-approval will generally cover a one-year period. The Audit Committee will review and approve the types of services and the projected fees for the next one-year period and may add to, or subtract from, the list of pre-approved services from time to time, based on subsequent determinations. This specific approval acknowledges that the Audit Committee is in agreement with the types of services that the independent accountants will be permitted to perform.
The Fund’s Treasurer or other Fund Officer shall report to the Audit Committee at each of its regular meetings regarding all Fund Services or Fund-related Adviser Services initiated since the last such report was rendered, including a general description of the services with forecasted fees for the annual period, proposed changes requiring specific pre-approval and a description of services provided by the independent auditor with actual fees during the current reporting period.
*****
(e)(2) The percentage of services described in paragraphs (b) through (d) of this Item approved pursuant to the “de minimis” exception under paragraph (c)(7)(i)(C) of Rule 2-01 of Regulation S-X during the one month period ended April 30, 2012 and the fiscal years ended March 31, 2012 and March 31, 2011 was zero.
(f) Not applicable.
(g) The aggregate non-audit fees billed by the registrant’s accountant for services rendered to the registrant, and rendered to the registrant’s investment adviser (not including any sub-adviser whose role is primarily portfolio management and is subcontracted with or overseen by another investment adviser), and any entity controlling, controlled by, or under common control with the adviser that provides ongoing services to the registrant for the one month period ended April 30, 2012 and the fiscal years ended March 31, 2012 and March 31, 2011 are approximately as follows:
April 30, 2012 | | March 31, 2012 | | March 31, 2011 | |
$ | 0 | | $ | 462,200 | | $ | 544,800 | |
| | | | | | | | |
(h) The registrant’s Audit Committee of the Board of Directors has considered whether the provision of non-audit services that were rendered to the registrant’s adviser (not including any sub-adviser whose role is primarily portfolio management and is subcontracted with or overseen by another investment adviser), and any entity controlling, controlled by, or under common control with the investment adviser that provides ongoing services to the registrant that were not pre-approved pursuant to paragraph (c)(7)(ii) of Rule 2-01 of Regulation S-X, is compatible with maintaining the principal accountant’s independence.
Item 5. Audit Committee of Listed Registrants.
Not applicable.
Item 6. Investments
(a) The registrant’s “Schedule I — Investments in securities of unaffiliated issuers” (as set forth in 17 CFR 210.12-12) is included in Item 1 of this Form N-CSR.
(b) Not applicable.
Item 7. Disclosure of Proxy Voting Policies and Procedures for Closed-End Management Investment Companies.
Not applicable.
Item 8. Portfolio Managers of Closed-End Management Investment Companies.
Not applicable.
Item 9. Purchases of Equity Securities by Closed-End Management Investment Company and Affiliated Purchasers.
Not applicable.
Item 10. Submission of Matters to a Vote of Security Holders.
There were no material changes to the procedures by which shareholders may recommend nominees to the registrant’s board of directors.
Item 11. Controls and Procedures.
(a) The registrant’s principal executive officer and principal financial officers, based on their evaluation of the registrant’s disclosure controls and procedures as of a date within 90 days of the filing of this report, have concluded that such controls and procedures are adequately designed to ensure that material information required to be disclosed by the registrant in Form N-CSR is accumulated and communicated to the registrant’s management, including the principal executive officer and principal financial officer, or persons performing similar functions, as appropriate to allow timely decisions regarding required disclosure.
(b) There was no change in the registrant’s internal control over financial reporting that occurred during the registrant’s second fiscal quarter of the period covered by this report that has materially affected, or is reasonably likely to materially affect, the registrant’s internal control over financial reporting.
Item 12. Exhibits.
(a)(1) Code of ethics required to be disclosed under Item 2 of Form N-CSR attached hereto as Exhibit 99.CODE ETH.
(a)(2) Certifications pursuant to Rule 30a-2(a) under the Investment Company Act of 1940 (17 CFR 270.30a-2(a)) attached hereto as Exhibit 99.CERT.
(a)(3) Not applicable.
(b) Certification pursuant to Rule 30a-2(b) under the Investment Company Act of 1940 (17 CFR 270.30a-2(b)) attached hereto as Exhibit 99.906CERT.
SIGNATURES
Pursuant to the requirements of the Securities Exchange Act of 1934 and the Investment Company Act of 1940, the registrant has duly caused this report to be signed on its behalf by the undersigned, thereunto duly authorized.
(registrant) | | Columbia Funds Series Trust I | |
| | |
| | |
By (Signature and Title) | | /s/ J. Kevin Connaughton | |
| J. Kevin Connaughton, President and Principal Executive Officer | |
| | |
| | |
Date | | June 8, 2012 | |
| | | | | |
Pursuant to the requirements of the Securities Exchange Act of 1934 and the Investment Company Act of 1940, this report has been signed below by the following persons on behalf of the registrant and in the capacities and on the dates indicated.
By (Signature and Title) | | /s/ J. Kevin Connaughton | |
| J. Kevin Connaughton, President and Principal Executive Officer | |
| | |
| | |
Date | | June 8, 2012 | |
| | |
| | |
By (Signature and Title) | | /s/ Michael G. Clarke | |
| Michael G. Clarke, Treasurer and Chief Financial Officer | |
| | |
| | |
Date | | June 8, 2012 | |
| | | | | |